
Form 10-K MCBC Holdings, Inc. For: Jun 30
UNITED STATES
SECURITIES AND EXCHANGE COMMISSION
Washington, D.C. 20549
FORM 10-K
☑ANNUAL REPORT PURSUANT TO SECTION 13 OR 15(d) OF THE SECURITIES EXCHANGE ACT OF 1934
For the fiscal year ended: June 30, 2018
OR
☐TRANSITION REPORT PURSUANT TO SECTION 13 OR 15(d) OF THE SECURITIES EXCHANGE ACT OF 1934
For the transition period from to

MCBC HOLDINGS, INC.
(Exact name of registrant as specified in its charter)
|
Delaware |
001-37502 |
06-1571747 |
|
(State or Other Jurisdiction |
(Commission |
(I.R.S. Employer |
|
of Incorporation or Organization) |
File Number) |
Identification No.) |
100 Cherokee Cove Drive, Vonore, TN 37885
(Address of Principal Executive Office) (Zip Code)
(423) 884-2221
(Registrant’s telephone number, including area code)
Securities registered pursuant to Section 12(b) of the Act:
|
Title of each class |
|
Name of each exchange on which registered |
|
Common Stock, par value $0.01 per share |
|
NASDAQ Global Select Market |
Securities registered pursuant to Section 12(g) of the Act:
None
(Title of Class)
Indicate by check mark if the registrant is a well-known seasoned issuer, as defined in Rule 405 of the Securities Act.
☐ Yes ☑ No
Indicate by check mark if the registrant is not required to file reports pursuant to Section 13 or Section 15(d) of the Act.
☐ Yes ☑ No
Indicate by check mark whether the registrant (1) has filed all reports required to be filed by Section 13 or 15(d) of the Securities Exchange Act of 1934 during the preceding 12 months (or for such shorter period that the registrant was required to file such reports), and (2) has been subject to such filing requirements for the past 90 days.
☑ Yes ☐ No
Indicate by check mark whether the registrant has submitted electronically and posted on its corporate website, if any, every Interactive Data File required to be submitted and posted pursuant to Rule 405 of Regulation S-T (§229.405 of this chapter) during the preceding 12 months (or for such shorter period that the registrant was required to submit and post such files).
☑ Yes ☐ No
Indicate by check mark if disclosure of delinquent filers pursuant to Item 405 of Regulation S-K (§229.405 of this chapter) is not contained herein, and will not be contained, to the best of registrant’s knowledge, in definitive proxy or information statements incorporated by reference in Part III of this Form 10-K or any amendment to this Form 10-K.
☑
Indicate by check mark whether the registrant is a large accelerated filer, an accelerated filer, a non-accelerated filer, a smaller reporting company, or an emerging growth company. See the definitions of “large accelerated filer,” “accelerated filer,” “smaller reporting company,” and “emerging growth company” in Rule 12b-2 of the Exchange Act.
|
Large accelerated filer |
☐ |
|
Accelerated filer |
☑ |
|
|
|
|
|
|
|
Non-accelerated filer |
☐ (Do not check if a smaller reporting company) |
|
Smaller reporting company |
☐ |
|
|
|
|
|
|
|
Emerging growth company |
☑ |
|
|
|
|
|
|
|
|
|
If an emerging growth company, indicate by check mark if the registrant has elected not to use the extended transition period for complying with any new or revised financial accounting standards provided pursuant to Section 13(a) of the Exchange Act. ☑
|
|
|
|
|
|
Indicate by check mark whether the registrant is a shell company (as defined in Rule 12b-2 of the Act).
☐ Yes ☑ No
The aggregate market value of the outstanding common stock, other than shares held by persons who may be deemed affiliates of the registrant, as of the last business day of the registrant’s most recently completed second fiscal quarter, which ended December 31, 2017 and based on the closing sale price as reported on the NASDAQ Global Select Market system, was approximately $402,500,000. As of September 5, 2018, there were 18,726,260 shares of the Registrant’s common stock, par value $0.01 per share, issued and outstanding.
DOCUMENTS INCORPORATED BY REFERENCE
Portions of the proxy statement for the 2018 annual meeting of stockholders, which will be filed no later than 120 days after the close of the registrant’s fiscal year ended June 30, 2018, are incorporated by reference into Part III of this report.
MCBC HOLDINGS, INC.
ANNUAL REPORT ON FORM 10-K
FOR THE YEAR ENDED JUNE 30, 2018
ii
CAUTIONARY NOTE REGARDING FORWARD-LOOKING STATEMENTS
This Annual Report on Form 10-K contains forward-looking statements within the meaning of the Private Securities Litigation Reform Act of 1995. All statements contained in this Form 10-K that do not relate to matters of historical fact should be considered forward-looking statements, including but not limited to statements regarding our expected market share, business strategy, dealer network, anticipated financial results, and liquidity. We use words such as “could,” “may,” “might,” “will,” “expect,” “likely,” “believe,” “continue,” “anticipate,” “estimate,” “intend,” “plan,” “project,” and other similar expressions to identify some forward-looking statements, but not all forward-looking statements include these words. All of our forward- looking statements involve estimates and uncertainties that could cause actual results to differ materially from those expressed in the forward-looking statements. Accordingly, any such statements are qualified in their entirety by reference to the information described under the caption “Risk Factors” and elsewhere in this Form 10-K.
The forward-looking statements contained in this Form 10-K are based on assumptions that we have made in light of our industry experience and our perceptions of historical trends, current conditions, expected future developments, and other factors we believe are appropriate under the circumstances. You should understand that these statements are not guarantees of performance or results. They involve risks, uncertainties (many of which are beyond our control), and assumptions. Although we believe that these forward-looking statements are based on reasonable assumptions, you should be aware that many important factors could affect our actual operating and financial performance and cause our performance to differ materially from the performance anticipated in the forward-looking statements. We believe these important factors include, but are not limited to, those described under “Risk Factors” and “Management’s Discussion and Analysis of Financial Condition and Results of Operations” in this Form 10-K and our other filings with the Securities and Exchange Commission (“SEC”). Should one or more of these risks or uncertainties materialize, or should any of these assumptions prove incorrect, our actual operating and financial performance may vary in material respects from the performance projected in these forward-looking statements. In addition, new important factors that could cause our business not to develop as we expect may emerge from time to time.
Further, any forward-looking statement speaks only as of the date on which it is made, and except as required by law, we undertake no obligation to update any forward-looking statement contained in this Form 10-K to reflect events or circumstances after the date on which it is made or to reflect the occurrence of anticipated or unanticipated events or circumstances. The forward-looking statements contained herein should not be relied upon as representing our views as of any date subsequent to the filing date of this Form 10-K.
Our fiscal year begins on July 1 and ends on June 30 with the interim quarterly reporting periods consisting of thirteen weeks. Therefore, the quarter end will not always coincide with the date of the end of the calendar month. We refer to our fiscal years based on the calendar-year in which they end. Accordingly, references to fiscal 2018, fiscal 2017 and fiscal 2016 represent our financial results for the fiscal years ended June 30, 2018, June 30, 2017 and June 30, 2016, respectively. For ease of reference, we identify our fiscal years in this Form 10-K by reference to the period from July 1 to June 30 of the year in which the fiscal year ends. For example, “fiscal 2018” refers to our fiscal year ended June 30, 2018.
Unless the context otherwise requires, the term “MasterCraft” refers to MasterCraft Boat Company, LLC and our MasterCraft-branded products; the term “NauticStar” refers to Nautic Star, LLC and our NauticStar-branded products; and the terms the “Company”, “we”, and “us” in this form 10-K refer to MCBC Holdings, Inc and its consolidated subsidiaries.
1
We are a world-renowned innovator, designer, manufacturer, and marketer of premium performance sport boats and outboard boats, with a leading market position in the U.S., a strong international presence, and dealers in 46 countries around the world. Our boats are used for water skiing, wakeboarding, wake surfing, and fishing, as well as general recreational boating. We believe that MasterCraft is the most recognized brand name in the performance sport boat category. In October 2017, we acquired Nautic Star, LLC (“NauticStar”), a leading manufacturer and distributor of high-quality outboard bay boats, deck boats and offshore center console boats. NauticStar’s product portfolio provides diversification into the outboard category, the largest powerboat industry category in terms of retail units, according to the National Marine Manufacturers Association (“NMMA”).
We are committed to delivering an extraordinary boating experience to our customers. From pioneering innovations that improve enjoyment on the water to offering products that promote rapid development of skills, our mission is to help our customers generate memories that will last a lifetime. We utilize a comprehensive product development process in order to build the most relevant and exciting products for our customers, year after year. We believe that our commitment to quality is unsurpassed, and we engage in operational excellence to deploy flexible and effective production systems that ensure we design and build the highest quality boats in the market.
All of our boats, from hull to upholstery, are hand-crafted by our skilled workforce at our corporate headquarters near Knoxville, Tennessee, and our facility in Amory, Mississippi. In recent years, we have made significant investments in improving design, engineering, manufacturing, and operational processes as we strive to be the most efficient boat manufacturer in the industry. MasterCraft is the only boat manufacturer to achieve compliance with all three of the International Standard for Organization (“ISO”) 9001 (Quality Management Systems), 14001 (Environmental Management Systems), and 18001 (International Occupational Health and Safety Management System) standards. MasterCraft’s industry-leading operations result in world-class quality, which enables us to offer a best-in-class five-year factory warranty and results in MasterCraft boats typically maintaining higher aftermarket resale value than our competitors’ boats.
We sell our boats through an extensive network of independent dealers in North America and internationally. Our MasterCraft boats are the exclusive performance sport boats offered by the majority of our dealers. Our acquisition of NauticStar has allowed us to expand our dealer network. We devote significant time and resources to find, develop, and improve the performance of our dealers. We continuously cultivate and strengthen our dealer relationships with marketing, training, and service programs designed to increase our dealers’ sales and profitability. We believe the strength of our dealer network and our proactive efforts to help our dealers improve their businesses give us a distinct competitive advantage in our industry.
Our History
MasterCraft was founded in 1968 when we built our first custom hull ski boat in a two-stall horse barn on a farm in Maryville, Tennessee. Dissatisfied with the large wakes and pull of other ski boats, we designed a hull that had the smallest wake in the industry: smooth and low at slalom and jump speeds yet well-defined at trick speeds. Our roots in performance water ski boats were reinforced as we evolved over the next 50 years to produce leading performance-oriented boats in the wakeboarding and wake surfing categories. Today, we continue to produce the industry’s premier competitive water ski, wakeboarding, and wake surfing performance boats that also address our customers’ needs for versatility, flexibility, fun, and functionality.
2
NauticStar was founded in 2002 and is located in Amory, Mississippi. We acquired NauticStar on October 2, 2017. With more than 15 years of boat manufacturing experience—including a 200,000 square-foot manufacturing facility—NauticStar has a reputation for reliability, quality and consistency, with a loyal network of dealers and customers including professional and sport fishermen, and recreational and pleasure boating enthusiasts.
Our Market Opportunity
During 2017, retail sales of new powerboats in the U.S. totaled $9.6 billion. Of the powerboat categories tracked by the NMMA, our MasterCraft brand corresponds most directly to the inboard ski/wakeboard category, which we refer to as the performance sport boat category. The category that most directly corresponds to our NauticStar brand is the outboard category. We believe our addressable market also includes similar and adjacent powerboat categories identified by the NMMA, including sterndrive boats, inboard cruiser boats and jet boats.
We believe we are well-positioned to benefit from several trends underway in our addressable market, including:
|
· |
performance sport boats are taking greater share of the overall fiberglass powerboat category; |
|
· |
outboard boats are taking a greater share of the overall powerboat category; |
|
· |
inventory of two to five-year-old pre-owned boats has become limited, driving consumers to purchase new boats; |
|
· |
ease-of-use and performance innovations have accelerated product cycles driving consumer demand for new products; and |
|
· |
higher consumer confidence influenced by improving macroeconomic conditions, including increased home values, greater workforce participation and lower corporate and individual federal income tax rates, has helped to drive increased consumer demand for powerboats. |
As the recovery in the general economy and overall boating industry from the economic downturn that commenced in 2008 has continued, the performance sport boat and outboard categories have experienced a robust recovery. According to the NMMA, new unit sales of performance sport boats in the U.S. increased at a compound annual growth rate (“CAGR”) of 10.7% from 2014 to 2017 while new unit sales of all outboard boats grew at a CAGR of 6.9% in the U.S. over the same period. Total new unit sales of powerboats in the U.S. increased at a CAGR of 6.3% from 2014 to 2017. We believe the performance sport boat and outboard boat categories have grown at a faster rate than the rest of the powerboat industry due to increased innovation in the features, designs, and layouts of performance sport boats and outboard propulsion boats. These innovations have improved the performance, functionality, and versatility of these boats as compared with other recreational boats, particularly boats in the sterndrive category, which have not experienced the same degree of innovation. We believe inboard boats are superior to sterndrive boats for tow sports such as water skiing, wakeboarding, and wake surfing for several reasons, including (i) the larger and more propulsive wakes that only inboard engine configurations can enable, (ii) enhanced rider safety as a result of the location of the inboard propeller underneath the boat instead of protruding from the stern, as is generally the case with boats in the sterndrive category, and (iii) relatively more passenger and storage space due to the location of the inboard engine housing. We believe outboard boats are superior to sterndrive boats for recreational boating uses such as fishing and family boating for several reasons, including (i) relatively more passenger and storage space due to the location of the outboard engine housing, (ii) engine noise is significantly reduced in an outboard engines compared to a sterndrive engine, (iii) outboard engines are easier to access and maintain compared to a sterndrive engine, and (iv) outboard engines perform better and have greater durability in saltwater conditions.
The expanding popularity of boating has also contributed to the strong recovery in volumes. We believe we are well-positioned to benefit from the increased popularity of recreational boating and the resulting larger prospective customer base.
3
Our Strengths
Iconic MasterCraft Brand Synonymous with Quality, Innovation, and Performance. We believe the MasterCraft brand is well-known among boating enthusiasts for high performance, premier quality, and relentless innovation. We believe that the market recognizes MasterCraft as a premier brand in the powerboat industry due to the overall superior value proposition that our boats deliver to our customers. The MasterCraft brand is built on a carefully crafted set of defining principles, including Legacy, Power, Precision and Progression. We work tirelessly every day to maintain our iconic brand reputation relative to our competition. The rigorous attention to detail with which we design and manufacture our products results in high quality boats that command significant resale premiums to comparable competitor boats.
Leading Market Share Position in Performance Sport Boat and Outboard Categories. Over the last decade, we have consistently held a leading market share position in the U.S. among manufacturers of premium performance sport boats based on unit volume. According to the Statistical Surveys, Inc. (“SSI”), our performance sport boat U.S. market share in December of 2017 was 21.7%. Per SSI, our U.S. market share for deck boats in the 15’ – 30’ segment, sold by our NauticStar brand, was 13.4%. We believe our sales have grown as dealers and customers continue to recognize the superior quality, performance, styling, and value of our recently released boats and that we are just starting to realize the market share benefits of the many recent new product offerings and product enhancement initiatives that our management team has implemented during the past several years.
Industry-Leading Product Design and Innovation. We believe that our innovation in the design of new boat models and new features has been a key to our success, helping us maintain our market share, command higher price points, and generally broaden the appeal of our products among recreational and fishing boaters. As a result of the features we have introduced, we believe that our boats are used for an increasingly wide range of activities. Our commitment to consistently developing new boat models and introducing new features is reflected in several notable recent achievements, including NMMA Innovation Awards for our MasterCraft ProStar water skiing boat, Gen 2 integrated surf system, X23 performance tow boat, and the DockStar Handling System. Our entire MasterCraft product portfolio has been renewed in the past five years, giving us the newest overall product offering in the performance sport boat category. Since acquiring NauticStar, we have introduced one new model, with future plans to introduce several new models over the coming years.
Highly Efficient Product Development and Manufacturing. We believe that a key to our success has been our renewed focus on operational improvements and world-class business processes. We believe our new product development capabilities are industry-leading and enable us to consistently create unique high-performance hull shapes and product features in shorter design iterations and at lower development costs than our competitors. These capabilities enable us to precisely design custom hulls and performance features that enhance each boat’s unique performance characteristics and increase our speed to market with exciting new products. Our acquisition of NauticStar allows us to leverage this internal product development and manufacturing expertise to capitalize on operational improvement opportunities at our Amory, Mississippi facility.
Strong Dealer Network. We have worked extensively with our dealers to develop what we believe is one of the strongest dealer networks in the performance sport boat and outboard categories. We target our distribution to the market segments’ highest performing dealers. We have established operating processes focused on optimizing dealers’ financial performance and service, and with a track record of balancing wholesale inventory and retail sales we are better able to manage dealer inventory, allowing for more transparent sales estimates and strong dealer relationships. We believe our warranty programs are more transparent than those of our competitors and provide consumers with greater peace of mind. Transparent and thorough warranty programs encourage customers to continue to visit our dealers for servicing, creating additional opportunities for boat trade-ins and purchases of accessories, thereby improving our dealers’ sales rates and financial health. These actions have strengthened our existing dealer network and are driving increased interest from new potential dealers who want to join the MasterCraft and NauticStar platforms.
4
Differentiated Sales and Marketing Capabilities. We believe our marketing efforts support each of our brand promises by focusing on superior value proposition and differentiating the performance and features of our boats. Our marketing efforts are conducted using an array of strategies, which include digital advertising, social media engagement, advertisements in endemic media and the sponsorship of boating and water sport events. To highlight our MasterCraft performance credibility and generate additional brand excitement, we sponsor a number of nationally ranked athletes. We believe our superior sales and marketing capabilities effectively communicate our performance, styling, quality, authenticity, and lifestyle, resulting in increased overall customer engagement.
Highly Experienced Executive Team. We have a highly seasoned and effective executive team. With an average of close to 30 years of boating industry experience, our management team has proven its ability to develop and integrate new product lines, enhance operations, strengthen our distribution network, and recruit industry talent. Senior management additions over the past few years have driven improvements to our manufacturing, quality, and product development systems and processes, which have collectively accelerated performance improvements as unit volumes have increased. Our President and Chief Executive Officer, Terry McNew, has 31 years of boating industry experience. He joined MasterCraft in August 2012 after serving as Executive Vice President of Brunswick Corporation’s recreational boat group, where he was in charge of manufacturing, product development, and engineering and quality systems. His leadership has helped us implement dramatic process improvements contributing to superior results. Tim Oxley, our Chief Financial Officer, has spent 28 years in the boating industry, including 12 years with MasterCraft, following 16 years with Brunswick Corporation where he served as Chief Financial Officer of several operating divisions. Tim Schiek, President of NauticStar since October 2017, is a 28-year marine industry veteran, having spent more than 20 years with Brunswick Corporation, serving in a variety of leadership roles. He has successfully run multiple well-known marine brands and brings key financial operational and dealer relationship experience to his role.
Our Strategy
We intend to continue to capitalize on the ongoing recovery in the broader boating industry including the performance sport boat and outboard categories through the following strategies:
Continue to Develop New and Innovative Products. As a leading innovator, designer, manufacturer, and marketer of premium performance sport boats, and high-quality bay, deck and center console outboard boats, we strive to design new and inventive products that appeal to a broad customer base. Since fiscal 2013, we have successfully launched a number of new products and features with best-in-class quality leading to increased sales and significant margin expansion. Furthermore, our unique new product development process enables us to renew our product portfolio with innovative offerings at a rate that we believe will be difficult for our competitors to match without significant additional capital investments. Our process involves each department in collaborative full “team” product launches that enable us to release several new models per year, per brand, while maintaining superior quality and controlling costs. Our entire MasterCraft product portfolio has been renewed in the past five years, and we have already released one new model at NauticStar since our acquisition in October 2017. We intend to continue releasing new products and features multiple times during the year, which we believe enhances our reputation as a cutting-edge boat manufacturer and will drive consumer interest in our products.
Capture Additional Share from Adjacent Boating Categories. Our NauticStar brand provides us with direct access to the outboard category, the largest category of the powerboat industry with $6.2 billion sales in 2017, per the NMMA, and provides diversification from our existing MasterCraft product portfolio. The addition of NauticStar, combined with our culture of innovation, enhances our ability to introduce new products with increased versatility, functionality, and performance to a more expansive customer base that values boats for competitive and recreational fishing, and general recreational boating purposes. Ultimately, the versatile boating experience delivered by our MasterCraft and NauticStar
5
boats allows us to attract customers from other boating categories, most notably from the sterndrive category. We intend to further enhance the performance, comfort, and versatility of our products to target additional customers seeking high performance water sport, fishing and general recreational activity.
Continuous Operational Improvement to Drive Margin Expansion. We continue to implement a number of initiatives to reduce our cost base and to improve the efficiency of our manufacturing process. These process improvements have lowered re-work, warranty claims, material waste, and inventory levels, reducing our costs, and have driven improved on-time delivery rates. Since acquiring NauticStar in October 2017, we have worked to revamp NauticStar’s manufacturing and product development processes, which should lead to operational efficiencies and drive margin expansion going forward. Additionally, we have fostered a culture of operational improvement within our highly engaged workforce, at both MasterCraft and NauticStar. These processes are now ingrained in our culture, leading to a Company-wide focus on driving further margin expansion through continuous improvement. We believe these important process improvements and culture of operational excellence provide us with a strong operational foundation and margin improvement opportunities in the future.
Effectively Manage Dealer Inventory and Further Strengthen Our Dealer Network. Our goal is to achieve and maintain a leading market share in each of the markets in which we operate. We view our MasterCraft and NauticStar dealers as our partners and product champions. Therefore, we devote significant time and resources to finding high quality dealers and developing and improving their performance over time. We actively manage dealer inventory levels, as demonstrated by healthy and consistent inventory retail turns and balanced wholesale and retail unit sales, which leads to better margins and improved financial health for our dealers. Additionally, our warranty programs for our products and predictable new product development cycles across our portfolio ensure that our dealers have high quality, compelling, and relevant products to sell to their customers. We believe the quality and trust in our dealer relationships are more beneficial to our long-term success than the quantity of dealers. We continue to leverage that dealer base while proactively developing strategies that will strengthen our overall network. For example, we intend to strengthen our current footprint by selectively recruiting market-leading dealers. We believe our targeted initiatives to enhance and grow our dealer network will increase unit sales in the future.
Increase Our Sales in International Markets. We currently have an extensive international distribution network with 45 international dealers in 76 locations around the world. We believe MasterCraft is the most well-known brand in the performance sport boat category globally, and that NauticStar has the potential for global growth. Based on our brand recognition, innovative product offerings, and distribution strengths, we believe we are well positioned to leverage our reputation and capture additional international sales. We believe that we will increase our international sales by promoting our new products in developed markets where we have a well-established dealer base and in international markets where rising consumer incomes are expected to increase demand for recreational products, such as Australia, Europe, Israel, Dubai, and Brazil. We are also developing new product offerings that will specifically target certain product demand from our international consumers and that we believe will drive further sales growth in international markets. Net sales outside of North America represented 7.5% of net sales volume in fiscal 2018.
Our Products
We design, manufacture, and sell premium recreational performance sport boats and outboard boats that we believe deliver superior performance for water skiing, wakeboarding, wake surfing, and fishing, as well as general recreational boating. In addition, we offer various accessories, including trailers and aftermarket parts. We market our boats under two brands: MasterCraft and NauticStar.
Our MasterCraft-branded portfolio of Star Series, XSeries, XTSeries and NXT boats are designed for the highest levels of performance, styling, and enjoyment for both recreational and competitive use. The Star Series and XSeries are geared
6
towards the consumer seeking the most premium and highest performance boating experience that we offer, and generally command a price premium over our competitors’ boats at retail prices ranging from approximately $60,000 to $200,000. The MasterCraft XT line was introduced in July 2016 as a multi-sport, category-defying crossover, with retail prices ranging from approximately $80,000 to $135,000. Unveiled in January 2014, the MasterCraft NXT line introduced the quality, performance, styling, and innovation of the MasterCraft brand to the entry-level consumer, with retail prices ranging from approximately $50,000 to $75,000. We have strategically designed and priced the MasterCraft NXT line to target the fast-growing entry-level customer group that is distinct from our traditional customer base, while maintaining our core MasterCraft brand attributes at profit margins comparable to our other offerings.
Our NauticStar-branded portfolio of Nautic Bay Boats, Sport Deck Boats, Offshore Boats and Legacy Series boats are designed for a variety of uses, including recreational and competitive sport fishing in freshwater lakes or saltwater, and general recreational enjoyment. The Nautic Bay Boats and Offshore Boats are geared towards the consumer seeking unmatched quality and features for fishability and family friendly comfort. The Sport Deck Boat line caters to consumers seeking the drive and ride of a V-hull, large capacity, and the styling and efficiency of a runabout. The Legacy Series line is geared towards the consumer seeking the most premium and highest performance boating experience that NauticStar offers. NauticStar’s retail prices range from approximately $20,000 to $160,000.
Our Dealer Network
We rely on an extensive network of independent dealers to sell our products in North America and internationally. For both MasterCraft and NauticStar, we target our distribution to the market segment’s highest performing dealers. The majority of our MasterCraft dealers are exclusive to our MasterCraft product lines within the performance sport boat category, highlighting the commitment of our key dealers to MasterCraft boats. We establish performance criteria that our dealers must meet as part of their dealer agreements to ensure the continued quality of our dealer network. As members of our network, dealers in North America may qualify for floor plan financing programs, rebates, seasonal discounts, promotional co-op payments, and other allowances.
We consistently review our distribution network to identify opportunities to expand our geographic footprint and improve our coverage of the market. We constantly monitor the health and strength of our dealers by analyzing each dealer’s retail sales and inventory frequently, and have established processes to identify underperforming dealers in order to assist them in improving their performance or to allow us to switch to a more effective dealer. These processes also allow us to better manage dealer inventory levels and product turns and contribute to a healthier dealer network that is better able to stock and sell our products. We believe our outstanding dealer network and our proactive approach to dealer management allow us to distribute our products more efficiently than our competitors and will help us capitalize on growth opportunities as our industry volumes continue to increase.
For fiscal 2018 our combined MasterCraft and NauticStar top ten dealers accounted for approximately 33% of our gross sales and none of our dealers accounted for more than 6% of our total sales volume.
North America. In North America, through our MasterCraft brand, we had a total of 95 dealers across 158 locations as of June 30, 2018. Through our NauticStar brand, in North America we had a total of 81 dealers across 95 locations as of June 30, 2018. We do not have a significant concentration of sales among our dealers.
Outside of North America. As of June 30, 2018, through our MasterCraft brand, we had a total of 45 international dealers in 76 locations and through our NauticStar brand we had one international dealer with a single location. We are present in Europe, Australia, Africa, Asia, including Hong Kong and the Middle East. We generated 6.6%, 9.1% and 8.6% of our unit sales outside of North America in fiscal 2018, 2017, and 2016, respectively.
7
Dealer Management
We have developed a system of financial incentives for our dealers based on achievement of key benchmarks. In addition, we provide our dealers with comprehensive sales training and a complete set of technology-based tools designed to help dealers maximize performance. Our dealer incentive program has been refined through years of experience with some of the key elements including performance incentives, discounts paid for achieving volume and purchase scheduling targets, and cash discounts to encourage balanced demand throughout the year. In addition, at MasterCraft, we pay incentives for attending our annual dealer meeting, an event featuring a robust program of dealer training seminars that focus on areas such as sales growth, inventory management, and retail strategy, in addition to product-oriented information. This incentive payment is based on participation by all salespeople from a dealership, not solely the principals.
Beyond our incentive programs, we have developed a proprietary web- based management tool that is used by our dealers on a day-to-day basis to improve their own businesses as well as enhance communication with our factory and sales management teams. Our proprietary DealerLink online business-to-business application efficiently executes many critical functions, including warranty registrations, warranty claims, boat ordering and tracking, parts ordering, technical support, and inventory reporting. This system facilitates communication between our sales team and the dealer network and allows our manufacturing department to review customer demand in real time.
Sales Cycles and Floor Plan Financing
We manage our annual sales plan through distinct buying periods. Our rebates are tiered so that dealers have a financial incentive to take the stocking risk for boats purchased prior to the traditional retail selling season (April - June). These incentives, accompanied by floor plan subsidies for up to nine months from the date of invoice, drive “level loading” of production. During this first part of the model year, many of the dealers’ orders are standard configurations for their showrooms. In the second part of the model year, more boats are customized by retail customers. Many of these custom orders are placed during boat shows, which occur from January through early April across North America.
We offer our dealers the opportunity to purchase boats with cash or through floor plan financing programs with third-party floor plan financing providers. We incentivize our dealers to purchase in cash by offering them a cash discount. The floor plan financing programs allow dealers to establish lines of credit with third-party lenders to purchase inventory. Upon purchase of a boat, dealers draw on the floor plan facility and the lenders pay the invoice price of the boat directly to us typically within 5 business days. Consistent with industry practice, we offer various manufacturer-sponsored floor plan interest programs under which we agree to reimburse our dealers for certain floor plan interest costs incurred for up to nine months from the date of invoice. In some cases, cash discounts are offered as an alternative to floor plan subsidies during the “off-season” for retail sales (July - March). These programs encourage dealers to rapidly replenish inventories during the spring and summer retail season, maintain sufficient inventories during the non-peak season, and balance wholesale purchases throughout the year.
Pursuant to the terms of the floor plan financing, if a dealer defaults on the terms of its credit line, we agree to repurchase new inventory repossessed from dealerships. Our obligation to repurchase such repossessed products for the unpaid balance of our original invoice price for the boat is subject to reduction or limitation based on the age and condition of the boat at the time of repurchase, and in certain cases, by an aggregate cap on repurchase obligations associated with a particular floor plan financing program. We have not incurred any losses from a finance company mandated repurchase since the recession. There were no boats repurchased during the fiscal years ended June 30, 2018, 2017 or 2016.
8
Marketing and Sales
Marketing
We believe that our differentiated marketing capabilities and our multi-channel, content-driven marketing strategies align with our strategic focus on product innovation, performance, and quality to attract aspiring and enthusiast consumers to our brands and products. These sales and marketing efforts allow us to more effectively launch and support our products, help drive actionable sales leads for our dealers, and reinforce our MasterCraft and NauticStar brand and lifestyle attributes.
Our over 50-year history of manufacturing and design leadership has made MasterCraft one of the most well-known and iconic brands in the boating industry. We believe the MasterCraft brand is widely recognized even among non- enthusiasts. Our NauticStar brand is relatively young compared to MasterCraft, but has quickly established itself as a strong brand dedicated to innovation, style and quality. We are focused on enhancing the power of our brands through a multifaceted marketing strategy. Our addressable market is targeted through a variety of specialized means, ranging from event sponsorships to far-reaching strategic alliances.
We have created a unified print and digital advertising strategy that is refreshed each year, featuring the unique attributes of each of our products while maintaining focus on the MasterCraft and NauticStar brands. We maintain a meaningful presence for our product lines in several endemic water sports and boating publications. Given the prevalence of our products in the markets these publications target, we also benefit from significant unpaid impressions in these industry publications, as our boats frequently appear in feature stories and advertisements for other products. In addition to these traditional marketing channels, in the last several years we have created an active and highly successful digital advertising and social media platform, including the use of Facebook, Twitter, Instagram, YouTube, and Vimeo to deliver content to our target audience, increase awareness of our brands, foster loyalty, and build a community of MasterCraft and NauticStar enthusiasts. In addition, we benefit from numerous user-generated videos and photos that are uploaded to these websites. An important component of this strategy has been our investment in our own mastercraft.com and nauticstarboats.com websites. The sites are designed to allow significant interaction between us and our customer base through marketing content delivery, message boards, news and event postings, and product updates and specifications. Our popular “Design-a-Boat” functionality allows consumers to design a boat and request a dealer quote. The custom-designed product can be transmitted directly to our closest independent dealer as well as our in-house concierge who follows up directly with our dealer leads on behalf of MasterCraft or NauticStar.
Our leading position in the performance sport boat category is further supported by our sponsorship of some of the most recognizable and successful athletes in water sports, as well as a number of highly visible competitions and events around the world. Our activities in this area serve to deepen the penetration of our brands within the professional and enthusiast community, while also supporting the growth of the sports. The events which we sponsor and in which we and our dealers participate feature the most popular figures in wakeboarding and water skiing, drawing large audiences of enthusiasts to a variety of sites around the country. Furthermore, we sponsor top ranked professional wakeboarding athletes, water ski jumpers, and water skiers. In addition to the advertising generated by the athletes’ success in their sports, we also leverage our sponsorship of these athletes by having them attend boat shows and dealer events and appear in creative media events, in which they garner public relations interest, build our MasterCraft brand, and in many cases help sell our products directly to consumers.
Sales
Our sales organization’s primary role is to manage our network of existing dealers and work with them to increase sales of our products, as well as identifying and recruiting new and replacement dealers that we believe will provide enhanced sales and customer service for our end consumers. We employ proactive processes to monitor the health and performance
9
of our dealers, and to help them improve their businesses and their sales of MasterCraft and NauticStar products. Our strategy is to improve the individual market shares of each of our dealers in their respective markets, and to add new dealers in new markets or replace dealers in existing markets where we believe we can achieve improved market share and customer service. We utilize regular performance reviews to drive improvement in underperforming dealers and to determine how to transition to new dealers when necessary. In addition, we employ a number of tools to assist our dealers in improving their performance, including product, sales, and service training, marketing materials and content, and direct interaction with prospective customers such as our factory concierge service. We encourage and expect our sales representatives to serve as advisors to our dealers, and believe this proactive sales approach leads to better dealer relationships and higher sales of our products.
Manufacturing
All of our MasterCraft boats are designed, manufactured, and lake-tested in our Vonore, Tennessee facility. All of our NauticStar boats are designed and manufactured in our Amory, Mississippi facility. We believe MasterCraft is the only boat manufacturer to achieve compliance with all three of the ISO 9001 (Quality Management Systems), 14001 (Environmental Management Systems), and 18001 (International Occupational Health and Safety Management System) standards. The rigorous attention to detail with which we design and manufacture our MasterCraft products results in boats of high quality, which allows us to offer a “stem-to-stern” five-year warranty that comprehensively covers more parts of our boats than warranties offered by any of our competitors. In recognition of our operational excellence, we were named a 2015 IndustryWeek Best Plant in North America Recipient—the only boat manufacturer to receive that honor.
Our boats are built through a continuous flow manufacturing process that encompasses fabrication, assembly, quality management, and testing. We manufacture certain components and subassemblies for our boats, such as upholstery, and procure other components from third-party vendors and install them on the boat. We have several exclusive supplier partnerships for critical purchased components, such as aluminum billet, towers, and engine packages. For MasterCraft, we also build custom trailers that match the exact size and color of our boats.
Research and Development, Product Development and Engineering
We are strategically and financially committed to innovation, as reflected in our dedicated product development and engineering groups and evidenced by our track record of new product introduction. At MasterCraft, our product development and engineering group comprises 24 professionals. At NauticStar, our product development and engineering group comprises 7 professionals. These individuals bring to our product development efforts significant expertise across core disciplines, including boat design, computer-aided design, naval engineering, electrical engineering, and mechanical engineering. They are responsible for execution of all facets of our new product strategy, starting with design and development of new boat models and innovative features, engineering these designs for manufacturing, and integrating new boats and innovations into production without disruption, at high quality, on time and on budget. Our product development and engineering functions work closely with our Strategic Portfolio Management Team which includes senior leadership from Sales, Marketing and Finance, all working together to develop our long-term product and innovation strategies.
We take a disciplined approach to the management of our product development strategy. We have structured processes to obtain voices of the customer, dealer, and management to guide our long-term product lifecycle and portfolio planning. In addition, extensive testing and coordination with our manufacturing group are important elements of our product development process, which we believe enable us to leverage the lessons from past launches and minimize the risk associated with the release of new products. We have developed a strategy to launch several new models a year, which will allow us to renew our product portfolio with innovative offerings at a rate that we believe will be difficult for our competitors to match without significant additional capital investments. In addition to our new product strategy, we manage
10
a separate innovation development process which allows us to design innovative new features for our boats in a disciplined manner and to launch these innovations in a more rapid time frame and with higher quality. These enhanced processes have reduced the time to market for our new product pipeline. Our product development expense for fiscal 2018, 2017 and 2016 was $4.9 million, $3.6 million, and $3.5 million, respectively.
Suppliers
We purchase a wide variety of raw materials from our supplier base, including resins, fiberglass, hydrocarbon feedstocks, and steel, as well as product parts and components such as engines and electronic controls, through a sales order process. We maintain long-term contracts with preferred suppliers and informal arrangements with other suppliers. We have not experienced any material shortages in any of our raw materials, product parts, or components. Temporary shortages, when they do occur, usually involve manufacturers of these products adjusting model mix, introducing new product lines, or limiting production in response to an industry-wide reduction in boat demand.
We are focused on developing our supply chain to enable cost improvement, world-class quality, and continuous product innovation. We have engaged our top suppliers in collaborative preferred supplier relationships and have developed processes including annual cost reduction targets, regular reliability projects, and extensive product testing requirements to ensure that our suppliers produce at low cost and to the highest levels of quality expected of the MasterCraft and NauticStar brands. These collaborative efforts begin at the design stage, with our key suppliers integrated into design and development planning well in advance of launch, which allows us to control costs and to leverage the expertise of our suppliers in developing product innovations. We believe these collaborative relationships with our most important suppliers have contributed to our significant improvements in product quality, innovation, and profitability.
The most significant components used in manufacturing our boats, based on cost, are engine packages. For our MasterCraft brand, Ilmor Engineering, Inc. (“Ilmor”) is our exclusive engine supplier, and for our NauticStar brand, Yamaha Motor Corporation (“Yamaha”) is out largest engine supplier. We maintain a strong and long-standing relationships with both Ilmor and Yamaha. As of June 30, 2018, Ilmor is our largest overall supplier. In addition to performance sport boat engines, Ilmor’s affiliates produce engines used in a number of leading racing boats and race cars. Ilmor maintains a full-time customer service and warranty staff located at our MasterCraft office, resulting in extremely efficient management of all engine-related matters, mitigating potential warranty risk. We work closely with Ilmor to remain at the forefront of engine design, performance, and manufacturing. Engine packages are the most expensive single item input in the MasterCraft boat-building process and we believe our long-term relationship with Ilmor is a key competitive advantage.
Transportation
We utilize third party logistics and transportation services at MasterCraft and NauticStar along with a fleet of leased tractor trailers at NauticStar, to deliver our boats to our dealer network. A select few dealers near our manufacturing facilities have elected to manage transportation and arrange for boats to be picked up directly from our manufacturing facilities. Following delivery to port, international shipments are transferred to a third-party logistics provider who schedules them for shipment via ocean freight to their destination country.
Information Technology
Over the last several years, we have made a significant investment in information technology. Our information technology strategy is to fully integrate IT into our business processes and planning initiatives, including not only our internal information management and communications processes but also our marketing and dealer management efforts. Our IT team has been integral to our marketing efforts through website functionality such as the “Build-a-Boat” and “Factory Tour” features, helping us to develop stronger engagement between us and our end consumers. In addition, our IT
11
infrastructure is an essential component of our dealer management initiatives, allowing for efficient and timely communications with our dealers and a transparent and effective system for dealer orders and production planning. We will continue to invest in our IT infrastructure in order to continue to leverage technology in support of our product development, manufacturing, and marketing strategies.
Insurance and Product Warranties
We purchase insurance to cover standard risks in our industry, including policies that cover general product liability, workers’ compensation, auto liability, and other casualty and property risks. Our insurance rates are based on our safety record as well as trends in the insurance industry. We also maintain workers’ compensation insurance and auto insurance policies that are retrospective in that the cost per year will vary depending on the frequency and severity of claims in the policy year.
We face an inherent risk of exposure to product liability claims in the event that, among other things, the use of our products results in injury. With respect to product liability coverage, we carry customary insurance coverage. Our coverage involves self-insured retentions with primary and excess liability coverage above the retention amount. We have the ability to refer claims to our suppliers and their insurers to pay the costs associated with any claims arising from such suppliers’ products. Our insurance covers such claims that are not adequately covered by a supplier’s insurance and provides for excess secondary coverage above the limits provided by our suppliers.
We provide product warranties for all of our models at MasterCraft and NauticStar. The high quality and durability of our products allow us to offer a comprehensive warranty that covers more parts of our boats, which we believe is superior when compared to the warranties offered by our competitors. During the warranty period, we reimburse dealers and authorized service facilities for all or a portion of the cost of repair or replacement performed on the products. Some materials, components or parts of the boat that are not covered by our product warranties are separately warranted by their manufacturers or suppliers. These other warranties include warranties covering engines, among other components.
Intellectual Property
We rely on a combination of patent, trademark, and copyright protection, trade secret laws, confidentiality procedures, and contractual provisions to protect our rights in our brand, products, and proprietary technology. We also protect our vessel designs through design registrations. This is an important part of our business and we intend to continue protecting our intellectual property. We currently hold 21 U.S. patents and 2 foreign patents, including utility and design patents for our transom surf seating, our DockStar handling system, and our Gen 2 surf system technology. Provided that we comply with all statutory maintenance requirements, our patents are expected to expire between 2021 and 2036. We also hold 14 pending U.S. patent applications and 3 pending foreign patent applications. We also own in excess of 90 registered trademarks in various countries around the world, most notably the MasterCraft and NauticStar names and logos, the Star Series, XSeries, XTSeries, and NXT MasterCraft product family names, the NauticStar product family names, and we own several applications for additional registrations. Such trademarks may endure in perpetuity on a country-by-country basis provided that we comply with all statutory maintenance requirements, including continued use of each trademark in each such country. In addition, we own 38 registered U.S. copyrights. Finally, we have registered 29 vessel hull designs with the U.S. Copyright Office, the most recent of which will remain in force through 2024.
From time to time, we are involved in intellectual property litigation, either accusing third parties of infringing our intellectual property rights, or defending against third-party claims that we are infringing the intellectual property of others. We are not currently involved in any outstanding intellectual property litigation that we believe, individually or in the aggregate, will have a material adverse effect on our business, financial condition, or results of operations. However, we
12
cannot predict the outcome of any pending or future litigation, and an unfavorable outcome could have an adverse impact on our business, financial condition, or results of operations.
Competition
The powerboat industry, including the performance sport boat and outboard categories, are highly fragmented, resulting in intense competition for customers and dealers. Competition affects our ability to succeed in both the market segments we currently serve and new market segments that we may enter in the future. We compete with several large manufacturers that may have greater financial, marketing, and other resources than we do. We also compete with a wide variety of small privately held independent manufacturers. Competition in our industry is based primarily on brand name, price, innovative features, design, and product performance. Please see Item 1A, “Risk Factors” — Risks Related to Our Business — Our industry is characterized by intense competition, which affects our sales and profits.
Seasonality
Our operating results are subject to annual and seasonal fluctuations resulting from a variety of factors, including:
|
· |
seasonal variations in retail demand for boats, with a significant majority of sales occurring during peak boating season, which we attempt to manage by providing incentive programs and floor plan subsidies to encourage dealer purchases throughout the year, which may include offering off-season retail promotions to our dealers in seasonally slow months, during and ahead of boat shows, to encourage retail demand; |
|
· |
product mix, which is driven by boat model mix and higher option order rates; while sales of all our boats generate comparable margins, sales of larger boats and boats with optional content produce higher absolute profits; |
|
· |
inclement weather, which can affect production at our manufacturing facilities as well as consumer demand; |
|
· |
competition from other recreational boat manufacturers; |
|
· |
general economic conditions; and |
|
· |
foreign currency exchange rates. |
Environmental, Safety, and Regulatory Matters
Our operations are subject to extensive and frequently changing federal, state, local, and foreign laws and regulations, including those concerning product safety, environmental protection, and occupational health and safety. We believe that our operations and products are in compliance with these regulatory requirements. Historically, the cost of achieving and maintaining compliance with applicable laws and regulations has not been material. However, we cannot assure you that future costs and expenses required for us to comply with such laws and regulations, including any new or modified regulatory requirements, or to address newly discovered environmental conditions, will not have a material adverse effect on our business, financial condition, operating results, or cash flow.
We have not been notified of and are otherwise currently not aware of any contamination at our current or former facilities for which we could be liable under environmental laws or regulations and we currently are not undertaking any remediation
13
or investigation activities in connection with any contamination. However, future spills or accidents or the discovery of currently unknown conditions or non-compliances may give rise to investigation and remediation obligations or related liabilities and damage claims, which may have a material adverse effect on our business, financial condition, operating results, or cash flow.
The regulatory programs that impact our business include the following:
Hazardous Substance and Waste Regulations
Certain materials used in our manufacturing, including the resins used in production of our boats, are toxic, flammable, corrosive, or reactive and are classified by the federal and state governments as “hazardous materials.” Control of these substances is regulated by the Environmental Protection Agency (EPA) and state pollution control agencies under the federal Resource Conservation and Recovery Act, and related state programs. Storage of these materials must be maintained in appropriately labelled and monitored containers, and disposal of wastes requires completion of detailed waste manifests and recordkeeping requirements. Any failure by us to properly store or dispose of our hazardous materials could result in liability, including fines, penalties, or obligations to investigate and remediate any contamination originating from our operations.
OSHA
The Occupational Safety and Health Administration (OSHA) Act imposes standards of conduct for and regulates workplace safety, including limits on the amount of emissions to which an employee may be exposed without the need for respiratory protection or upgraded plant ventilation. Our facilities are regularly inspected by OSHA and by state and local inspection agencies and departments. We believe that our facilities comply in all material aspects with these regulations. We have made a considerable investment in safety awareness programs and provide ongoing safety training for all of our employees. We have implemented a program that requires frequent safety inspections of our facilities by managers and an internal safety committee. The safety committee, which is led by a dedicated Health and Safety professional, prepares a monthly action plan based on its findings.
Clean Air Act
The Clean Air Act (the “CAA”) and corresponding state rules regulate emissions of air pollutants. Because our manufacturing operations involve molding and coating of fiberglass materials, which involves the emission of certain volatile organic compounds, hazardous air pollutants, and particulate matter, we are required to maintain and comply with a CAA operating permit (or “Title V” permit). Our Title V Permit requires us to monitor our emissions and periodically certify that our emissions are within specified limits. To date, we have not had material difficulty complying with those limits.
In addition to the regulation of our manufacturing operations, the EPA has adopted regulations stipulating that many marine propulsion engines meet an air emission standard that requires fitting a catalytic converter to the engine. The engines used in our products, all of which are manufactured by third parties, are warrantied by the manufacturers to be in compliance with the EPA’s emission standards. The additional cost of complying with these regulations has increased our cost to purchase the engines and, accordingly, has increased the cost to manufacture our products.
If we are not able to pass these additional costs along to our customers, it may have a negative impact on our business and financial condition.
14
Boat Safety Standards
Powerboats sold in the U.S. must be manufactured to meet the standards of certification required by the U.S. Coast Guard. In addition, boats manufactured for sale in the European Community must be certified to meet the European Community’s imported manufactured products standards. These certifications specify standards for the design and construction of powerboats. We believe that all our boats meet these standards. In addition, safety of recreational boats is subject to federal regulation under the Boat Safety Act of 1971, which requires boat manufacturers to recall products for replacement of parts or components that have demonstrated defects affecting safety. In the past, we have instituted recalls for defective component parts produced by us or certain of our third-party suppliers. None of these recalls has had a material adverse effect on our Company.
Employees
We believe we maintain excellent relations with our employees, treating them as business partners and focusing on building their careers. We have approximately 882 employees as of June 30, 2018, 569 of whom work at our MasterCraft facilities in Tennessee, and 313 of whom work at our NauticStar facility in Mississippi. None of our employees are represented by a labor union, and since MasterCraft’s founding in 1968, we have never experienced a labor-related work stoppage.
Other Information
We were incorporated under the laws of the State of Delaware under the name MCBC Holdings, Inc. on January 28, 2000. In July 2015, we completed an initial public offering of our common stock. We maintain a website with the address www.mastercraft.com. We are not including the information contained in our website as part of, or incorporating it by reference into, this Annual Report on Form 10-K. We make available, free of charge through our website, our annual reports on Form 10-K, quarterly reports on Form 10-Q, current reports on Form 8-K, and amendments to these reports as soon as reasonably practicable after we electronically file these materials with, or otherwise furnish them to, the SEC.
RISK FACTORS
Investing in our common stock involves a high degree of risk. You should carefully consider the following risk factors, as well as other information in this Form 10-K, before deciding whether to invest in shares of our common stock. The occurrence of any of the events described below could harm our business, financial condition, results of operations, and growth prospects. In such an event, the trading price of our common stock may decline and you may lose all or part of your investment.
Risks Related to Our Business
General economic conditions, particularly in the U.S., affect our industry, demand for our products and our business, and results of operations.
Demand for premium sport boat and outboard boat brands has been significantly influenced by weak economic conditions, low consumer confidence, high unemployment, and increased market volatility worldwide, especially in the U.S. In times of economic uncertainty and contraction, consumers tend to have less discretionary income and tend to defer or avoid expenditures for discretionary items, such as our products. Sales of our products are highly sensitive to personal discretionary spending levels. Our business is cyclical in nature and its success is impacted by economic conditions, the overall level of consumer confidence and discretionary income levels. Any substantial deterioration in general economic conditions that diminishes consumer confidence or discretionary income may reduce our sales and materially adversely
15
affect our business, financial condition and results of operations. We cannot predict the duration or strength of an economic recovery, either in the U.S. or in the specific markets where we sell our products. Corporate restructurings, layoffs, declines in the value of investments and residential real estate, higher gas prices, higher interest rates, and increases in federal and state taxation may each materially adversely affect our business, financial condition, and results of operations.
Consumers often finance purchases of our products. Although consumer credit markets have improved, consumer credit market conditions continue to influence demand, especially for boats, and may continue to do so. There continue to be fewer lenders, tighter underwriting and loan approval criteria, and greater down payment requirements than in the past. If credit conditions worsen, and adversely affect the ability of consumers to finance potential purchases at acceptable terms and interest rates, it could result in a decrease in the sales of our products.
Our annual and quarterly financial results are subject to significant fluctuations depending on various factors, many of which are beyond our control.
Our sales and operating results can vary significantly from quarter to quarter and year to year depending on various factors, many of which are beyond our control. These factors include, but are not limited to:
|
· |
seasonal consumer demand for our products; |
|
· |
discretionary spending habits; |
|
· |
changes in pricing in, or the availability of supply in, the used powerboat market; |
|
· |
failure to maintain a premium brand image; |
|
· |
disruption in the operation of our manufacturing facilities; |
|
· |
variations in the timing and volume of our sales; |
|
· |
the timing of our expenditures in anticipation of future sales; |
|
· |
sales promotions by us and our competitors; |
|
· |
changes in competitive and economic conditions generally; |
|
· |
consumer preferences and competition for consumers’ leisure time; |
|
· |
impact of unfavorable weather conditions; |
|
· |
changes in the cost or availability of our labor; and |
|
· |
increased fuel prices. |
Due to these and other factors, our results of operations may decline quickly and significantly in response to changes in order patterns or rapid decreases in demand for our products. We anticipate that fluctuations in operating results will continue in the future.
Unfavorable weather conditions may have a material adverse effect on our business, financial condition, and results of operations, especially during the peak boating season.
Adverse weather conditions in any year in any particular geographic region may adversely affect sales in that region, especially during the peak boating season. Sales of our products are generally stronger just before and during spring and summer, which represent the peak boating months in most of our markets, and favorable weather during these months generally has a positive effect on consumer demand. Conversely, unseasonably cool weather, excessive rainfall, reduced rainfall levels, or drought conditions during these periods may close area boating locations or render boating dangerous or inconvenient, thereby generally reducing consumer demand for our products. Our annual results would be materially and
16
adversely affected if our net sales were to fall below expected seasonal levels during these periods. We may also experience more pronounced seasonal fluctuation in net sales in the future as we continue to expand our businesses. Additionally, to the extent that unfavorable weather conditions are exacerbated by global climate change or otherwise, our sales may be affected to a greater degree than we have previously experienced. There can be no assurance that weather conditions will not have a material effect on the sales of any of our products.
We depend on our network of independent dealers, face increasing competition for dealers, and have little control over their activities.
Substantially all of our sales are derived from our network of independent dealers. Our Mastercraft brand has agreements with dealers in its network that typically provide for one-year terms, although some agreements have a term of up to three years, while our NauticStar brand typically does not enter into dealer agreements with its dealers. For fiscal 2018, our top ten dealers accounted for 33% of our total gross sales. The loss of a significant number of these dealers could have a material adverse effect on our financial condition and results of operations. The number of dealers supporting our products and the quality of their marketing and servicing efforts are essential to our ability to generate sales. Competition for dealers among performance sport boat manufacturers continues to increase based on the quality, price, value, and availability of the manufacturers’ products, the manufacturers’ attention to customer service, and the marketing support that the manufacturer provides to the dealers. We face intense competition from other premium performance sport and outboard boat manufacturers in attracting and retaining dealers (some of whom also sell products from other premium performance sport and outboard boat manufacturers), affecting our ability to attract or retain relationships with qualified and successful dealers. Although our management believes that the quality of our products in the premium performance sport and outboard boat industries should permit us to maintain our relationships with our dealers and our market share position, there can be no assurance that we will be able to maintain or improve our relationships with our dealers or our market share position. In addition, independent dealers in the powerboat industry have experienced significant consolidation in recent years, which could result in the loss of one or more of our dealers in the future if the surviving entity in any such consolidation purchases similar products from a competitor. A substantial deterioration in the number of dealers or quality of our network of dealers would have a material adverse effect on our business, financial condition, and results of operations.
Our success depends, in part, upon the financial health of our dealers and their continued access to financing.
Because we sell nearly all of our products through dealers, their financial health is critical to our success. Our business, financial condition, and results of operations may be adversely affected if the financial health of the dealers that sell our products suffers. Their financial health may suffer for a variety of reasons, including a downturn in general economic conditions, rising interest rates, higher rents, increased labor costs and taxes, compliance with regulations, and personal financial issues.
In addition, our dealers require adequate liquidity to finance their operations, including purchases of our products. Dealers are subject to numerous risks and uncertainties that could unfavorably affect their liquidity positions, including, among other things, continued access to adequate financing sources on a timely basis on reasonable terms. These sources of financing are vital to our ability to sell products through our distribution network. Access to floor plan financing generally facilitates our dealers’ ability to purchase boats from us, and their financed purchases reduce our working capital requirements. If floor plan financing were not available to our dealers, our sales and our working capital levels would be adversely affected. The availability and terms of financing offered by our dealers’ floor plan financing providers will continue to be influenced by:
|
· |
their ability to access certain capital markets and to fund their operations in a cost-effective manner; |
17
|
· |
the performance of their overall credit portfolios; |
|
· |
their willingness to accept the risks associated with lending to dealers; and |
|
· |
the overall creditworthiness of those dealers. |
We may be required to repurchase inventory of certain dealers.
Many of our dealers have floor plan financing arrangements with third-party finance companies that enable the dealers to purchase our products. In connection with these agreements, we may have an obligation to repurchase our products from a finance company under certain circumstances, and we may not have any control over the timing or amount of any repurchase obligation nor have access to capital on terms acceptable to us to satisfy any repurchase obligation. This obligation is triggered if a dealer defaults on its debt obligations to a finance company, the finance company repossesses the boat and the boat is returned to us. Our obligation to repurchase a repossessed boat for the unpaid balance of our original invoice price for the boat is subject to reduction or limitation based on the age and condition of the boat at the time of repurchase, and in certain cases, by an aggregate cap on repurchase obligations associated with a particular floor plan financing program. We have not incurred any losses from a finance company mandated repurchase since the recession. No boats were repurchased during the fiscal years ended June 30, 2018, 2017 or 2016. In addition, applicable laws regulating dealer relations may also require us to repurchase our products from our dealers under certain circumstances, and we may not have any control over the timing or amount of any repurchase obligation nor have access to capital on terms acceptable to us to satisfy any repurchase obligation. If we were obligated to repurchase a significant number of units under any repurchase agreement or under applicable dealer laws, our business, operating results, and financial condition could be adversely affected.
If we fail to manage our manufacturing levels while still addressing the seasonal retail pattern for our products, our business and margins may suffer.
The seasonality of retail demand for our products, together with our goal of balancing production throughout the year, requires us to manage our manufacturing and allocate our products to our dealer network to address anticipated retail demand. Our dealers must manage seasonal changes in consumer demand and inventory. If our dealers reduce their inventories in response to weakness in retail demand, we could be required to reduce our production, resulting in lower rates of absorption of fixed costs in our manufacturing and, therefore, lower margins. As a result, we must balance the economies of level production with the seasonal retail sales pattern experienced by our dealers. Failure to adjust manufacturing levels adequately may have a material adverse effect on our financial condition and results of operations.
We have a large fixed cost base that will affect our profitability if our sales decrease.
The fixed cost levels of operating a powerboat manufacturer can put pressure on profit margins when sales and production decline. Our profitability depends, in part, on our ability to spread fixed costs over a sufficiently large number of products sold and shipped, and if we make a decision to reduce our rate of production, gross or net margins could be negatively affected. Consequently, decreased demand or the need to reduce production can lower our ability to absorb fixed costs and materially impact our financial condition or results of operations.
Our industry is characterized by intense competition, which affects our sales and profits.
The premium performance sport boat and outboard boat categories and the powerboat industry as a whole are highly competitive for consumers and dealers. We also compete against consumer demand for used boats. Competition affects our ability to succeed in both the markets we currently serve and new markets that we may enter in the future. Competition is based primarily on brand name, price, product selection, and product performance. We compete with several large
18
manufacturers that may have greater financial, marketing, and other resources than we do and who are represented by dealers in the markets in which we now operate and into which we plan to expand. We also compete with a variety of small, independent manufacturers. We cannot assure you that we will not face greater competition from existing large or small manufacturers or that we will be able to compete successfully with new competitors. Our failure to compete effectively with our current and future competitors would adversely affect our business, financial condition, and results of operations.
Our sales may be adversely impacted by increased consumer preference for used boats or the supply of new boats by competitors in excess of demand.
During the economic downturn that commenced in 2008, we observed a shift in consumer demand toward purchasing more used boats, primarily because prices for used boats are typically lower than retail prices for new boats. If this were to occur again, it could have the effect of reducing demand among retail purchasers for our new boats. Also, while we have taken steps designed to balance production volumes for our boats with demand, our competitors could choose to reduce the price of their products, which could have the effect of reducing demand for our new boats. Reduced demand for new boats could lead to reduced sales by us, which could adversely affect our business, results of operations, and financial condition.
Our sales and profitability depend, in part, on the successful introduction of new products.
Market acceptance of our products depends on our technological innovation and our ability to implement technology in our boats. Our sales and profitability may be adversely affected by difficulties or delays in product development, such as an inability to develop viable or innovative new products. Our failure to introduce new technologies and product offerings that consumers desire could adversely affect our business, financial condition, and results of operations. Also, we have been able to achieve higher margins in part as a result of the introduction of new features or enhancements to our existing boat models. If we fail to introduce new features or those we introduce fail to gain market acceptance, our margins may suffer.
In addition, some of our direct competitors and indirect competitors may have significantly more resources to develop and patent new technologies. It is possible that our competitors will develop and patent equivalent or superior technologies and other products that compete with ours. They may assert these patents against us and we may be required to license these patents on unfavorable terms or cease using the technology covered by these patents, either of which would harm our competitive position and may materially adversely affect our business.
We also cannot be certain that our products or features have not infringed or will not infringe the proprietary rights of others. Any such infringement could cause third parties, including our competitors, to bring claims against us, resulting in significant costs and potential damages.
Our international markets require significant management attention, expose us to difficulties presented by international economic, political, legal, and business factors, and may not be successful or produce desired levels of sales and profitability.
We currently sell our products throughout the world. International markets have been, and will continue to be, a focus for sales growth. We believe many opportunities exist in the international markets, and over time we intend for international sales to comprise a larger percentage of our total revenue. Several factors, including weakened international economic conditions, could adversely affect such growth and there can be no assurance that we will be able to sustain our current international sales levels in the future. The expansion of our existing international operations and entry into additional international markets require significant management attention. Some of the countries in which we market, and in which
19
our distributors or licensee(s) sell our products, are subject to political, economic, or social instability. Our international operations expose us and our representatives, agents, and distributors to risks inherent in operating in foreign jurisdictions. These risks include, but are not limited to:
|
· |
increased costs of customizing products for foreign countries; |
|
· |
unfamiliarity with local demographics, consumer preferences, and discretionary spending patterns; |
|
· |
difficulties in attracting customers due to a reduced level of customer familiarity with our brand; |
|
· |
competition with new, unfamiliar competitors; |
|
· |
the imposition of additional foreign governmental controls or regulations, including rules relating to environmental, health, and safety matters and regulations, and other laws applicable to publicly-traded companies, such as the Foreign Corrupt Practices Act, or the FCPA; |
|
· |
new or enhanced trade restrictions and restrictions on the activities of foreign agents, representatives, and distributors; |
|
· |
the imposition of increases in costly and lengthy import and export licensing and other compliance requirements, customs duties and tariffs, license obligations, and other non-tariff barriers to trade; |
|
· |
the relative strength of the U.S. dollar compared to local currency, making our products less price-competitive relative to products manufactured outside of the U.S.; |
|
· |
the relative strength of the U.S. dollar compared to local currency, making our products less price-competitive relative to products manufactured outside of the U.S.; |
|
· |
laws and business practices favoring local companies; |
|
· |
longer payment cycles and difficulties in enforcing agreements and collecting receivables through certain foreign legal systems; |
|
· |
difficulties in enforcing or defending intellectual property rights; and |
|
· |
insurrection or war that may disrupt or limit our relationships with our foreign customers. |
Our international operations may not produce desired levels of total sales, or one or more of the foregoing factors may harm our business, financial condition, or results of operations.
Our results after the acquisition of NauticStar may suffer if we do not effectively manage our expanded operations following the acquisition.
The size of our business has increased significantly as a result of our acquisition of NauticStar in October 2017. Our future success depends, in part, upon our ability to manage this expanded business, which will pose substantial challenges for management, including challenges related to the management and monitoring of additional operations and
20
associated increased costs and complexity. There can be no assurances we will be successful or that we will realize the expected benefits currently anticipated from the acquisition of NauticStar.
We have and will continue to incur significant acquisition-related integration costs and transaction expenses in connection with the acquisition of NauticStar and the related financing transactions.
We are currently implementing a plan to integrate the operations of NauticStar. In connection with that plan, we anticipate that we may incur certain non-recurring charges. However, we cannot currently identify the timing, nature and amount of all such charges. Further, we have incurred significant transaction costs relating to negotiating and completing the acquisition of NauticStar. These integration costs and transaction expenses will be charged as an expense in the period incurred. The significant transaction costs and integration costs could materially affect our results of operations in the period in which such charges are recorded. Although we believe that the elimination of duplicative costs, as well as the realization of other efficiencies related to the integration of the business, will offset incremental transaction and integration costs over time, this net benefit may not be achieved in the near term, or at all.
The NauticStar business may underperform relative to our expectations.
We may not be able to maintain the levels of revenue, earnings or operating efficiency as a combined business that we and NauticStar have previously achieved or might achieve separately. The business and financial performance of NauticStar are subject to certain risks and uncertainties, including the risk of the loss of, or changes to, its relationships with its dealers and suppliers, increased product liability and warranty claims, and negative publicity or other events that could diminish the value of the NauticStar brand, which in turn could also adversely affect the MasterCraft brand. If we are unable to achieve the same growth, revenues and profitability that NauticStar has achieved in the past, our business, financial condition or results of operations could be adversely affected.
Rising concern regarding international tariffs could materially and adversely affect our business and results of operations.
The current political landscape has introduced significant uncertainty with respect to future trade regulations and existing international trade agreements, as shown by the recent U.S.-initiated renegotiation of the North America Free Trade Agreement, and Brexit in Europe. This uncertainty includes the possibility of imposing tariffs or penalties on products manufactured outside the U.S., including the recent announcement of the U.S. government’s institution of tariffs on a range of products from China, and the potential for increased trade barriers between the UK and the European Union. The institution of global trade tariffs carries the risk of negatively affecting global economic conditions, which could have a negative impact on our business and results of operations.
The unaudited pro forma financial information we filed on Form 8-K/A on November 2, 2017 may not be indicative of our future results with NauticStar.
The unaudited pro forma financial information we filed onForm 8-K/A on November 2, 2017 may not reflect what our results of operations, financial position and cash flows would have been after giving effect to the acquisition of NauticStar and the related financing during the periods presented or be indicative of what our results of operations, financial position and cash flows may be in the future. The unaudited pro forma financial information has been derived from our historical financial statements and the historical financial statements of NauticStar, as well as adjustments and assumptions made regarding the combined entity following the transaction. While we believe these assumptions and adjustments are reasonable, they are preliminary in nature and difficult to make with accuracy. Moreover, the unaudited pro forma financial statements do not reflect all costs that may be incurred by the combined company in connection with the transaction. The
21
assumptions used and adjustments made in preparing the unaudited pro forma financial information may prove to be inaccurate.
Fluctuations in foreign currency exchange rates could result in declines in our reported sales and net earnings.
The changing relationships of primarily the U.S. dollar to the Canadian dollar, the Australian dollar, the Euro, the British pound sterling, the Japanese yen, and certain other foreign currencies have from time to time had a negative impact on our results of operations. Fluctuations in the value of the U.S. dollar relative to these foreign currencies can adversely affect the price of our products in foreign markets and the costs we incur to import certain components for our products. In addition, we will often attempt to offset these higher prices with increased discounts, which can lead to reduced net sales per unit.
We compete with a variety of other activities for consumers’ scarce leisure time.
Our boats are used for recreational and sport purposes, and demand for our boats may be adversely affected by competition from other activities that occupy consumers’ leisure time and by changes in consumer lifestyle, usage pattern, or taste. Similarly, an overall decrease in consumer leisure time may reduce consumers’ willingness to purchase and enjoy our products.
Our success depends upon the continued strength of our brands and the value of our brands, and sales of our products could be diminished if we, the athletes who use our products, or the sports and activities in which our products are used are associated with negative publicity.
We believe that our brands are a significant contributor to the success of our business and that maintaining and enhancing our brands is important to expanding our consumer and dealer base. Failure to continue to protect our brands may adversely affect our business, financial condition, and results of operations.
Negative publicity, including that resulting from severe injuries or death occurring in the sports and activities in which our products are used, could negatively affect our reputation and result in restrictions, recalls, or bans on the use of our products. Further, actions taken by athletes associated with our products that harm the reputations of those athletes could also harm our brand image and adversely affect our financial condition. If the popularity of the sports and activities for which we design, manufacture, and sell products were to decrease as a result of these risks or any negative publicity, sales of our products could decrease, which could have an adverse effect on our net sales, profitability, and operating results. In addition, if we become exposed to additional claims and litigation relating to the use of our products, our reputation may be adversely affected by such claims, whether or not successful, including by generating potential negative publicity about our products, which could adversely impact our business and financial condition.
We may not be able to execute our manufacturing strategy successfully, which could cause the profitability of our products to suffer.
Our manufacturing strategy is designed to improve product quality and increase productivity, while reducing costs and increasing flexibility to respond to ongoing changes in the marketplace. To implement this strategy, we must be successful in our continuous improvement efforts, which depend on the involvement of management, production employees, and suppliers. Any inability to achieve these objectives could adversely impact the profitability of our products and our ability to deliver desirable products to our consumers.
22
Our ability to meet our manufacturing workforce needs is crucial to our results of operations and future sales and profitability.
We rely on the existence of an available hourly workforce to manufacture our boats. We cannot assure you that we will be able to attract and retain qualified employees to meet current or future manufacturing needs at a reasonable cost, or at all. Although none of our employees are currently covered by collective bargaining agreements, we cannot assure you that our employees will not elect to be represented by labor unions in the future, which could increase our labor costs. Additionally, competition for qualified employees could require us to pay higher wages to attract a sufficient number of employees. Significant increases in manufacturing workforce costs could materially adversely affect our business, financial condition, or results of operations.
We rely on third-party suppliers and, in particular, a single supplier of the engine packages used in the manufacturing of our boats.
We depend on third-party suppliers to provide components and raw materials essential to the construction of our boats. While we believe that our relationships with our current suppliers are sufficient to provide the materials necessary to meet present production demand, we cannot assure you that these relationships will continue or that the quantity or quality of materials available from these suppliers will be sufficient to meet our future needs, irrespective of whether we successfully implement our growth strategy. As production increases, our need for raw materials and supplies will increase. Our suppliers must be prepared to ramp up operations and, in many cases, hire additional workers and/or expand capacity in order to fulfill the orders placed by us and other customers. Operational and financial difficulties that our suppliers may face in the future could adversely affect their ability to supply us with the parts and components we need, which could significantly disrupt our operations.
The availability and cost of engines used in the manufacture of our boats are especially critical. For fiscal 2018, we purchased all of the inboard engine packages for our MasterCraft brand boats from Ilmor. We also maintain a strong and long-standing relationship with our primary supplier of NauticStar engine packages, Yamaha. While we believe that our relationships with Ilmor and Yamaha are sufficient to provide the materials necessary to meet present production demand, there can be no assurance that these relationships will continue or that the quantity or quality of the engines provided will be sufficient to meet our future needs, irrespective of whether we successfully implement our growth strategy. If we are required to replace these suppliers, it could cause a decrease in products available for sale or an increase in the cost of goods sold, either of which could adversely affect our business, financial condition, and results of operations. In addition to the risk of interruption of our engine supply, Ilmor or Yamaha could potentially exert significant bargaining power over price, quality, warranty claims, or other terms relating to the inboard engines we use. We are required to purchase a minimum volume of engines from Ilmor annually or pay a penalty to Ilmor in order to maintain our exclusivity. While these minimums are significantly below our current volumes, there can be no assurance that we will continue to meet these minimums in the future.
Termination or interruption of informal supply arrangements could have a material adverse effect on our business or results of operations.
We have informal supply arrangements with some of our suppliers, including the sole supplier of our gas and ballast tanks. In the event of a termination of a supply arrangement, there can be no assurance that alternate supply arrangements will be made on satisfactory terms. If we need to enter into supply arrangements on unsatisfactory terms, or if there are any delays to our supply arrangements, it could adversely affect our business and operating results.
23
We depend upon key personnel and we may not be able to retain them or attract, assimilate, and retain highly qualified employees in the future.
Our future success will depend in significant part upon the continued service of our senior management team and our continuing ability to attract, assimilate, and retain highly qualified and skilled managerial, product development, manufacturing, marketing, and other personnel. The loss of the services of any members of our senior management or other key personnel or the inability to hire or retain qualified personnel in the future could adversely affect our business, financial condition, and results of operations.
We may attempt to grow our business through acquisitions or strategic alliances and new partnerships, which we may not be successful in completing or integrating.
We may in the future explore acquisitions and strategic alliances that will enable us to acquire complementary skills and capabilities, offer new products, expand our consumer base, enter new product categories or geographic markets, and obtain other competitive advantages. We cannot assure you, however, that we will identify acquisition candidates or strategic partners that are suitable to our business, obtain financing on satisfactory terms, complete acquisitions or strategic alliances, or successfully integrate acquired operations into our existing operations. Once integrated, acquired operations may not achieve anticipated levels of sales or profitability, or otherwise perform as expected. Acquisitions also involve special risks, including risks associated with unanticipated challenges, liabilities and contingencies, and diversion of management attention and resources from our existing operations. Similarly, our partnership with leading franchises from other industries to market our products or with third-party technology providers to introduce new technology to the market may not achieve anticipated levels of consumer enthusiasm and acceptance, or achieve anticipated levels of sales or profitability, or otherwise perform as expected.
Our intellectual property rights may be inadequate to protect our business.
We attempt to protect our intellectual property through a combination of patent, trademark, copyright, protected design, and trade secret laws. We hold patents, trademarks, copyrights, and design rights relating to various aspects of our products and believe that proprietary technical know-how is important to our business. Proprietary rights relating to our products are protected from unauthorized use by third parties only to the extent that they are covered by valid and enforceable patents, trademarks, or copyrights, to the extent they are protected designs, or to the extent they are maintained in confidence as trade secrets.
We cannot be certain that we will be issued any patents from any pending or future patent applications owned by or licensed to us, or that the claims allowed under any issued patents will be sufficiently broad to protect our technology. Further, the patents we own could be challenged, invalidated, or circumvented by others. Further, we cannot assure you that competitors will not infringe our patents, or that we will have adequate resources to enforce our patents.
We also rely on unpatented proprietary technology. It is possible that others will independently develop the same or similar technology or otherwise obtain access to our unpatented technology. To protect our trade secrets and other proprietary information, we require employees, consultants, advisors, and collaborators to enter into confidentiality agreements. We cannot assure you that these agreements will provide meaningful protection for our trade secrets, know-how, or other proprietary information in the event of any unauthorized use, misappropriation, or disclosure of such trade secrets, know-how, or other proprietary information. If we are unable to maintain the proprietary nature of our technologies, we could be materially adversely affected.
Further, we have attempted to protect certain of our vessel hull designs by seeking to register those designs with the United States Copyright Office. We cannot assure you that our applications will be approved. If approved, protection of the vessel
24
design lasts ten years. However, our protected vessel hull designs could be challenged, invalidated, or circumvented by others. Further, we cannot assure you that competitors will not infringe our designs, or that we will have adequate resources to enforce our rights.
We rely on our trademarks, trade names, and brand names to distinguish our products from the products of our competitors, and have registered or applied to register many of these trademarks. We cannot assure you that our trademark applications will be approved. Third parties may also oppose our trademark applications, or otherwise challenge our use of the trademarks. In the event that our trademarks are successfully challenged, we could be forced to rebrand our products, which could result in loss of brand recognition, and could require us to devote resources to advertising and marketing new brands. Further, we cannot assure you that competitors will not infringe our trademarks, or that we will have adequate resources to enforce our trademarks.
If third parties claim that we infringe upon their intellectual property rights, our financial condition could be adversely affected.
We face the risk of claims that we have infringed third parties’ intellectual property rights. Any claims of patent or other intellectual property infringement, even those without merit, could be expensive and time consuming to defend, cause us to cease making, licensing, or using products that incorporate the challenged intellectual property, require us to redesign, reengineer, or rebrand our products, if feasible, divert management’s attention and resources, or require us to enter into royalty or licensing agreements in order to obtain the right to use a third party’s intellectual property. Any royalty or licensing agreements, if required, may not be available to us on acceptable terms or at all. A successful claim of infringement against us could result in our being required to pay significant damages, enter into costly license or royalty agreements, or stop the sale of certain products, any of which could have a negative impact on our business, financial condition, and results of operations. While we are not currently involved in any outstanding intellectual property litigation that we believe, individually or in the aggregate, will have a material adverse effect on our business, financial condition, or results of operations, we cannot predict the outcome of any pending litigation and an unfavorable outcome could have an adverse impact on our business, financial condition, or results of operations.
Product liability, warranty, personal injury, property damage, and recall claims may materially affect our financial condition and damage our reputation.
We are engaged in a business that exposes us to claims for product liability and warranty claims in the event our products actually or allegedly fail to perform as expected, or the use of our products results, or is alleged to result, in property damage, personal injury, or death. We have in the past incurred such liabilities and may in the future be exposed to liability for such claims. Although we maintain product and general liability insurance of the types and in the amounts that we believe are customary for the industry, we are not fully insured against all such potential claims. We may experience legal claims in excess of our insurance coverage or claims that are not covered by insurance, either of which could adversely affect our business, financial condition, and results of operations. Adverse determination of material product liability and warranty claims made against us could have a material adverse effect on our financial condition and harm our reputation. In addition, if any of our products are, or are alleged to be, defective, we may be required to participate in a recall of that product if the defect or alleged defect relates to safety. These and other claims we may face could be costly to us and require substantial management attention.
Significant product repair and/or replacement due to product warranty claims or product recalls could have a material adverse impact on our results of operations.
We provide a limited warranty for our products. We may provide additional warranties related to certain promotional programs, as well as warranties in certain geographical markets as determined by local regulations and market conditions.
25
Although we employ quality control procedures, sometimes a product is distributed that needs repair or replacement. Our standard warranties require us or our dealers to repair or replace defective products during such warranty periods at no cost to the consumer. Historically, product recalls have been administered through our dealers and distributors. The repair and replacement costs we could incur in connection with a recall could adversely affect our business. In addition, product recalls could harm our reputation and cause us to lose customers, particularly if recalls cause consumers to question the safety or reliability of our products.
The nature of our business exposes us to workers’ compensation claims and other workplace liabilities.
Certain materials we use require our employees to handle potentially hazardous or toxic substances. While our employees who handle these and other potentially hazardous or toxic materials receive specialized training and wear protective clothing, there is still a risk that they, or others, may be exposed to these substances. Exposure to these substances could result in significant injury to our employees and damage to our property or the property of others, including natural resource damage. Our personnel are also at risk for other workplace- related injuries, including slips and falls. We have in the past been, and may in the future be, subject to fines, penalties, and other liabilities in connection with any such injury or damage. Although we currently maintain what we believe to be suitable and adequate insurance in excess of our self- insured amounts, we may be unable to maintain such insurance on acceptable terms or such insurance may not provide adequate protection against potential liabilities.
We may be subject to information technology system failures, network disruptions, and breaches in data security.
We use many information technology systems and their underlying infrastructure to operate our business. The size and complexity of our computer systems make them potentially vulnerable to breakdown, malicious intrusion, and random attack. Likewise, data privacy breaches by employees or others with permitted access to our systems may pose a risk that sensitive data may be exposed to unauthorized persons or to the public. While we have invested in protection of data and information technology, there can be no assurance that our efforts will prevent breakdowns or breaches in our systems that could adversely affect our business.
An increase in energy costs may materially adversely affect our business, financial condition, and results of operations.
Higher energy costs result in increases in operating expenses at our manufacturing facility and in the expense of shipping products to our dealers. In addition, increases in energy costs may adversely affect the pricing and availability of petroleum-based raw materials, such as resins and foams that are used in our products. Also, higher fuel prices may have an adverse effect on demand for our boats, as they increase the cost of ownership and operation.
We are subject to U.S. and other anti-corruption laws, trade controls, economic sanctions, and similar laws and regulations, including those in the jurisdictions where we operate. Our failure to comply with these laws and regulations could subject us to civil, criminal, and administrative penalties and harm our reputation.
Doing business on a worldwide basis requires us to comply with the laws and regulations of various foreign jurisdictions. These laws and regulations place restrictions on our operations, trade practices, partners, and investment decisions. In particular, our operations are subject to U.S. and foreign anti-corruption and trade control laws and regulations, such as the FCPA, export controls, and economic sanctions programs, including those administered by the U.S. Treasury Department’s Office of Foreign Assets Control, or OFAC. As a result of doing business in foreign countries and with foreign partners, we are exposed to a heightened risk of violating anti-corruption and trade control laws and sanctions regulations.
26
The FCPA prohibits us from providing anything of value to foreign officials for the purpose of obtaining or retaining business or securing any improper business advantage. It also requires us to keep books and records that accurately and fairly reflect our transactions.
Economic sanctions programs restrict our business dealings with certain sanctioned countries, persons, and entities. In addition, because we act through dealers and distributors, we face the risk that our dealers, distributors, or consumers might further distribute our products to a sanctioned person or entity, or an ultimate end-user in a sanctioned country, which might subject us to an investigation concerning compliance with OFAC or other sanctions regulations.
Violations of anti-corruption and trade control laws and sanctions regulations are punishable by civil penalties, including fines, denial of export privileges, injunctions, asset seizures, debarment from government contracts, and revocations or restrictions of licenses, as well as criminal fines and imprisonment. We cannot assure you that all of our local, strategic, or joint partners will comply with these laws and regulations, in which case we could be held liable for actions taken inside or outside of the U.S., even though our partners may not be subject to these laws. Such a violation could materially and adversely affect our reputation, business, results of operations and financial condition. Our continued international expansion, including in developing countries, and our development of new partnerships and joint venture relationships worldwide increase the risk of FCPA or OFAC violations in the future.
If we are unable to comply with environmental and other regulatory requirements, our business may be exposed to material liability and/or fines.
Our operations are subject to extensive and frequently changing federal, state, local, and foreign laws and regulations, including those concerning product safety, environmental protection, and occupational health and safety. Some of these laws and regulations require us to obtain permits, and limit our ability to discharge hazardous materials into the environment. If we fail to comply with these requirements, we may be subject to civil or criminal enforcement actions that could result in the assessment of fines and penalties, obligations to conduct remedial or corrective actions, or, in extreme circumstances, revocation of our permits or injunctions preventing some or all of our operations. In addition, the components of our boats must meet certain regulatory standards, including stringent air emission standards for boat engines. Failure to meet these standards could result in an inability to sell our boats in key markets, which would adversely affect our business. Moreover, compliance with these regulatory requirements could increase the cost of our products, which in turn, may reduce consumer demand.
While we believe that we are in material compliance with applicable federal, state, local, and foreign regulatory requirements, and hold all licenses and permits required thereunder, we cannot assure you that we will, at all times, be able to continue to comply with applicable regulatory requirements. Compliance with increasingly stringent regulatory and permit requirements may, in the future, cause us to incur substantial capital costs and increase our cost of operations, or may limit our operations, all of which could have a material adverse effect on our business or financial condition.
As with most boat construction businesses, our manufacturing processes involve the use, handling, storage, and contracting for recycling or disposal of hazardous substances and wastes. The failure to manage or dispose of such hazardous substances and wastes properly could expose us to material liability or fines, including liability for personal injury or property damage due to exposure to hazardous substances, damages to natural resources, or for the investigation and remediation of environmental conditions. Under environmental laws, we may be liable for remediation of contamination at sites where our hazardous wastes have been disposed or at our current or former facilities, regardless of whether such facilities are owned or leased or whether the environmental conditions were created by us, a prior owner or tenant, or a third-party. While we do not believe that we are presently subject to any such liabilities, we cannot assure you that environmental conditions relating to our prior, existing, or future sites or operations or those of predecessor companies will not have a material adverse effect on our business or financial condition.
27
Natural disasters, environmental disasters, the effects of climate change, or other disruptions at our manufacturing facilities or in other regions of the United States could adversely affect our business, financial condition, and results of operations.
We rely on the continuous operation of our manufacturing facilities in Vonore, Tennessee and Armory, Mississippi for the production of our products. Any natural disaster or other serious disruption to our facility due to fire, snow, flood, earthquake, or any other unforeseen circumstance could adversely affect our business, financial condition, and results of operations. Changes in climate could adversely affect our operations by limiting or increasing the costs associated with equipment or fuel supplies. In addition, adverse weather conditions, such as increased frequency and/or severity of storms, or floods could impair our ability to operate by damaging our facilities and equipment or restricting product delivery to customers. The occurrence of any disruption at our manufacturing facilities, even for a short period of time, may have an adverse effect on our productivity and profitability, during and after the period of the disruption. These disruptions may also cause personal injury and loss of life, severe damage to or destruction of property and equipment, and environmental damage. Although we maintain property, casualty, and business interruption insurance of the types and in the amounts that we believe are customary for the industry, we are not fully insured against all potential natural disasters or other disruptions to our manufacturing facilities.
In addition, we have dealers and third-party suppliers located in regions of the United States that have been and may be exposed to damaging storms, such as hurricanes and tornados, floods and environmental disasters. Although preventative measures may help to mitigate damage, the damage and disruption resulting from natural and environmental disasters may be significant. Such disasters can disrupt our dealers, suppliers, or customers, which can interrupt our operational processes and our sales and profits.
Increases in income tax rates or changes in income tax laws or enforcement could have a material adverse impact on our financial results.
Changes in domestic and international tax legislation could expose us to additional tax liability. Although we monitor changes in tax laws and work to mitigate the impact of proposed changes, such changes may negatively impact our financial results. In addition, any increase in individual income tax rates, such as those implemented in the U.S. at the beginning of 2013, would negatively affect our potential consumers’ discretionary income and could decrease the demand for our products.
Our credit facilities contain covenants which may limit our operating flexibility; failure to comply with covenants may result in our lenders restricting or terminating our ability to borrow under such credit facilities.
In the past, we have relied upon our existing credit facilities to provide us with adequate liquidity to operate our business. The availability of borrowing amounts under our credit facilities is dependent upon compliance with the debt covenants set forth in our credit agreement. Violation of those covenants, whether as a result of operating losses or otherwise, could result in our lenders restricting or terminating our borrowing ability under our credit facilities. If our lenders reduce or terminate our access to amounts under our credit facilities, we may not have sufficient capital to fund our working capital and other needs, and we may need to secure additional capital or financing to fund our operations or to repay outstanding debt under our credit facilities. We cannot assure you that we will be successful in ensuring the availability of amounts under our credit facilities or in raising additional capital, or that any amount, if raised, will be sufficient to meet our cash needs or will be on terms as favorable as those which have been available to us historically. If we are not able to maintain our ability to borrow under our credit facilities, or to raise additional capital when needed, our business and operations will be materially and adversely affected.
28
Risks Relating to Ownership of our Common Stock
You may be diluted by future issuances of common stock in connection with our incentive plans, acquisitions, or otherwise; future sales of such shares in the public market, or the expectations that such sales may occur, could lower our stock price.
Our amended and restated certificate of incorporation authorizes us to issue shares of common stock and options, rights, warrants, and appreciation rights relating to common stock for the consideration and on the terms and conditions established by our board of directors in its sole discretion, whether in connection with acquisitions or otherwise.
We have reserved shares for issuance under the Amended and Restated MCBC Holdings, Inc. 2015 Incentive Award Plan in an amount equal to 1,675,427 shares. Any common stock that we issue, including under our 2015 Incentive Award Plan or other equity incentive plans that we may adopt in the future, would dilute the percentage ownership of holders of our common stock.
Our common stock price may be volatile or may decline regardless of our operating performance
It is possible that an active trading market for our common stock will not be sustained, which could make it difficult for you to sell your shares of common stock at an attractive price or at all.
Volatility in the market price of our common stock may prevent you from being able to sell your shares at or above the price you paid for them. Many factors, which are outside our control, may cause the market price of our common stock to fluctuate significantly, including those described elsewhere in this “Risk Factors” section and this Form 10-K, as well as the following:
|
· |
our operating and financial performance and prospects; |
|
· |
our quarterly or annual earnings or those of other companies in our industry compared to market expectations; |
|
· |
conditions that impact demand for our services; |
|
· |
future announcements concerning our business or our competitors’ businesses; |
|
· |
the public’s reaction to our press releases, other public announcements, and filings with the SEC; |
|
· |
coverage by or changes in financial estimates by securities analysts or failure to meet their expectations; |
|
· |
market and industry perception of our success, or lack thereof, in pursuing our growth strategy; |
|
· |
strategic actions by us or our competitors, such as acquisitions or restructurings; |
|
· |
changes in laws or regulations that adversely affect our industry or us; |
|
· |
changes in accounting standards, policies, guidance, interpretations, or principles; |
|
· |
changes in senior management or key personnel; |
|
· |
issuances, exchanges or sales, or expected issuances, exchanges or sales of our capital stock; |
|
· |
changes in our dividend policy; |
|
· |
adverse resolution of new or pending litigation against us; and |
29
|
· |
changes in general market, economic, and political conditions in the U.S. and global economies or financial markets, including those resulting from natural disasters, terrorist attacks, acts of war, and responses to such events. |
As a result, volatility in the market price of our common stock may prevent investors from being able to sell their common stock at or above the price they paid for it or at all. These broad market and industry factors may materially reduce the market price of our common stock, regardless of our operating performance. In addition, price volatility may be greater if the public float and trading volume of our common stock is low. As a result, you may suffer a loss on your investment.
We do not intend to pay dividends on our common stock for the foreseeable future.
While we have paid dividends in the past, we presently have no intention to pay dividends on our common stock at any time in the foreseeable future. Any decision to declare and pay dividends in the future will be made at the discretion of our board of directors and will depend on, among other things, our results of operations, financial condition, cash requirements, contractual restrictions, and other factors that our board of directors may deem relevant. Certain of our debt instruments contain covenants that restrict the ability of our subsidiaries to pay dividends to us. In addition, we will be permitted under the terms of our debt instruments to incur additional indebtedness, which may restrict or prevent us from paying dividends on our common stock. Furthermore, our ability to declare and pay dividends may be limited by instruments governing future outstanding indebtedness we may incur.
Delaware law and certain provisions in our amended and restated certificate of incorporation may prevent efforts by our stockholders to change the direction or management of our Company.
We are a Delaware corporation, and the anti-takeover provisions of Delaware law impose various impediments to the ability of a third party to acquire control of us, even if a change of control would be beneficial to our existing stockholders. In addition, our amended and restated certificate of incorporation and our amended and restated by-laws contain provisions that may make the acquisition of our company more difficult without the approval of our board of directors, including, but not limited to, the following:
|
· |
our board of directors is classified into three classes, each of which serves for a staggered three-year term; |
|
· |
only our board of directors may call special meetings of our stockholders; |
|
· |
our stockholders have only limited rights to amend our by-laws; and |
|
· |
we require advance notice and duration of ownership requirements for stockholder proposals. |
These provisions could discourage, delay, or prevent a transaction involving a change in control of our company. These provisions could also discourage proxy contests and make it more difficult for you and other stockholders to elect directors of your choosing and cause us to take other corporate actions you desire. In addition, because our board of directors is responsible for appointing the members of our management team, these provisions could in turn affect any attempt by our stockholders to replace current members of our management team.
For as long as we are an emerging growth company, we will not be required to comply with certain reporting requirements, including those relating to accounting standards and disclosure about our executive compensation, that apply to other public companies.
We are an “emerging growth company,” as defined in Section 2(a) of the Securities Act, as modified by the JOBS Act. As such, we are eligible to take advantage of certain exemptions from various reporting requirements that are applicable to other public companies that are not “emerging growth companies,” including, but not limited to, (i) not being required to
30
comply with the auditor attestation requirements of Section 404(b) of the Sarbanes-Oxley Act, (ii) reduced disclosure obligations regarding executive compensation in our periodic reports and proxy statements, and (iii) exemptions from the requirements of holding a non-binding advisory vote on executive compensation and of stockholder approval of any golden parachute payments not previously approved. We have elected to adopt these reduced disclosure requirements. We cannot predict if investors will find our common stock less attractive as a result of our taking advantage of these exemptions and as a result, there may be a less active trading market for our common stock and our stock price may be more volatile.
We could remain an “emerging growth company” for up to five years or until the earliest of (a) the last day of the first fiscal year in which our annual gross revenues exceed $1.07 billion, (b) the date that we become a “large accelerated filer” as defined in Rule 12b-2 under the Securities Exchange Act of 1934, as amended (the “Exchange Act”), which would occur if the market value of our common stock that is held by non-affiliates exceeds $700 million as of the last business day of our most recently completed fiscal quarter, and (c) the date on which we have issued more than $1.07 billion in non-convertible debt securities during the preceding three-year period.
The obligations associated with being a public company require significant resources and management attention, which may divert us from our business operations.
As a result of our initial public offering, we are subject to the reporting requirements of the Exchange Act and the Sarbanes-Oxley Act. The Exchange Act requires that we file annual, quarterly, and current reports with respect to our business and financial condition. The Sarbanes-Oxley Act requires, among other things, that we establish and maintain effective internal controls and procedures for financial reporting. As a result, we have and will continue to incur significant legal, accounting, and other expenses that we did not previously incur.
In addition, the need to establish the corporate infrastructure demanded of a public company may divert management’s attention from implementing our business strategy, which could prevent us from improving our business, results of operations, and financial condition. We have made, and will continue to make, changes to our internal controls, including information technology controls, and procedures for financial reporting and accounting systems to meet our reporting obligations as a public company. However, the measures we take may not be sufficient to satisfy our obligations as a public company. If we do not continue to develop and implement the right processes and tools to manage our changing enterprise and maintain our culture, our ability to compete successfully and achieve our business objectives could be impaired, which could negatively impact our business, financial condition, and results of operations. In addition, we cannot predict or estimate the amount of additional costs we may incur to comply with these requirements. We anticipate that these costs will be material to our general and administrative expenses.
Furthermore, as a public company, we have and will continue to incur additional legal, accounting, and other expenses that have not been reflected in our historical financial statements. In addition, rules implemented by the SEC and NASDAQ have imposed various requirements on public companies, including establishment and maintenance of effective disclosure and financial controls and changes in corporate governance practices. Our management and other personnel will need to devote a substantial amount of time to these compliance initiatives. These rules and regulations result in our incurring legal and financial compliance costs and will make some activities more time-consuming and costly. For example, we expect these rules and regulations to make it more difficult and more expensive for us to maintain director and officer liability insurance, and we may be required to accept reduced policy limits and coverage or incur substantially higher costs to maintain the same or similar coverage. As a result, it may be more difficult for us to attract and retain qualified people to serve on our board of directors, on our board committees, or as executive officers.
31
Our failure to achieve and maintain effective internal control over financial reporting in accordance with Section 404 of the Sarbanes-Oxley Act as a public company could have a material adverse effect on our business and share price.
Prior to the completion of our initial public offering, we had not operated as a public company and were not required to independently comply with Section 404(a) of the Sarbanes-Oxley Act. Section 404(a) of the Sarbanes-Oxley Act requires annual management assessments of the effectiveness of our internal control over financial reporting, starting with the second annual report that we file with the SEC. We were required to meet these standards in the course of preparing our financial statements as of and for the year ended June 30, 2017, and our management is required to report on the effectiveness of our internal control over financial reporting for such year. Additionally, once we are no longer an emerging growth company, as defined by the JOBS Act, our independent registered public accounting firm will be required pursuant to Section 404(b) of the Sarbanes-Oxley Act to attest to the effectiveness of our internal control over financial reporting on an annual basis. The rules governing the standards that must be met for our management to assess our internal control over financial reporting are complex and require significant documentation, testing, and possible remediation.
Internal control over financial reporting is a process designed to provide reasonable assurance regarding the reliability of financial reporting and the preparation of financial statements in accordance with generally accepted accounting principles. We are currently in the process of reviewing, documenting, and testing our internal control over financial reporting. We may encounter problems or delays in implementing any changes necessary to make a favorable assessment of our internal control over financial reporting. In addition, we may encounter problems or delays in completing the implementation of any requested improvements and receiving a favorable attestation in connection with the attestation to be provided by our independent registered public accounting firm after we cease to be an emerging growth company. If we cannot favorably assess the effectiveness of our internal control over financial reporting, or if our independent registered public accounting firm is unable to provide an unqualified attestation report on our internal controls after we cease to be an emerging growth company, investors could lose confidence in our financial information and the price of our common stock could decline.
Additionally, the existence of any material weakness or significant deficiency may require management to devote significant time and incur significant expense to remediate any such material weaknesses or significant deficiencies and management may not be able to remediate any such material weaknesses or significant deficiencies in a timely manner. The existence of any material weakness in our internal control over financial reporting could also result in errors in our financial statements that could require us to restate our financial statements, cause us to fail to meet our reporting obligations, and cause stockholders to lose confidence in our reported financial information, all of which could materially and adversely affect our business and share price.
If securities analysts do not publish research or reports about our company, or if they issue unfavorable commentary about us or our industry or downgrade our common stock, the price of our common stock could decline.
The trading market for our common stock will depend in part on the research and reports that third-party securities analysts publish about our company and our industry. We may be unable or slow to attract research coverage and if one or more analysts cease coverage of our company, we could lose visibility in the market. In addition, one or more of these analysts could downgrade our common stock or issue other negative commentary about our company or our industry. As a result of one or more of these factors, the trading price of our common stock could decline.
ITEM 1B.UNRESOLVED STAFF COMMENTS.
None.
32
All our MasterCraft boats are designed, manufactured, and lake-tested at our 252,000-square-foot manufacturing facility located on approximately 60 acres of lakefront land we own in Vonore, Tennessee. All our NauticStar boats are designed and manufactured in our more than 200,000-square-foot manufacturing facility located on 17 acres of land we own in Amory, Mississippi. In addition, we lease a 60,000 square-foot facility in Vonore where we manufacture our trailers, and a 3,000 square-foot warehouse facility in West Yorkshire, England for warehousing of aftermarket parts.
None.
ITEM 4.MINE SAFETY DISCLOSURES.
Not applicable.
33
ITEM 5.MARKET FOR REGISTRANT’S COMMON EQUITY AND RELATED STOCKHOLDER MATTERS AND ISSUER PURCHASES OF EQUITY SECURITIES.
Market Information
Our common stock has been publicly traded on the NASDAQ Global Market under the symbol “MCFT” since July 17, 2015. Prior to that time, there was no public market for our common stock. The following table sets forth, for the periods indicated, the high and low sales prices of our common stock as reported by the NASDAQ Global Market:
|
|
|
|
|
|
|
|
|
|
|
|
|
High |
|
|
Low |
|
|
Fiscal 2017 |
|
|
|
|
|
|
|
|
First quarter |
|
$ |
12.88 |
|
$ |
10.44 |
|
|
Second quarter |
|
|
14.71 |
|
|
10.84 |
|
|
Third quarter |
|
|
17.51 |
|
|
13.67 |
|
|
Fourth quarter |
|
|
20.00 |
|
|
15.58 |
|
|
|
|
|
|
|
|
|
|
|
Fiscal 2018 |
|
|
|
|
|
|
|
|
First quarter |
|
$ |
20.87 |
|
$ |
16.82 |
|
|
Second quarter |
|
|
23.99 |
|
|
20.13 |
|
|
Third quarter |
|
|
28.62 |
|
|
20.44 |
|
|
Fourth quarter |
|
|
31.26 |
|
|
23.76 |
|
On September 4, 2018, the last reported sale price on the NASDAQ Global Market of our common stock was $27.92 per share. As of September 5, 2018, we had 29 holders of record of our common stock. The actual number of stockholders is greater than this number of record holders, and includes stockholders who are beneficial owners, but whose shares are held in street name by brokers and other nominees. This number of holders of record also does not include stockholders whose shares may be held in trust by other entities.
Dividend Policy
On May 26, 2016, we declared a special dividend of $4.30 per share which was paid on June 10, 2016. No dividends were declared or paid during the fiscal years ended June 30, 2018 or June 30, 2017. We presently intend to retain our earnings, if any, to finance the development and growth of our business and operations and do not anticipate declaring or paying cash dividends on our common stock in the foreseeable future. Any future determination as to the declaration and payment of dividends, if any, will be at the discretion of our board of directors and will depend on then-existing conditions, including our operating results, financial condition, contractual restrictions, capital requirements, business prospects, and other factors our board of directors may deem relevant. In addition, our $145 million senior secured credit facility under a third amended and restated credit and guaranty agreement with Fifth Third Bank (the “Third Amended Credit Agreement”) contains restrictions that restrict our ability to pay cash dividends. See Item 1A “Risk Factors” — Risks Relating to Ownership of Our Common Stock — We do not intend to pay dividends on our common stock for the foreseeable future.
34
Stock Performance Graph
This performance graph shall not be deemed “soliciting material” or to be “filed” with the SEC for purposes of Section 18 of the Exchange Act of 1934, or otherwise subject to the liabilities under that section, and shall not be deemed to be incorporated by reference into any filing of ours under the Securities Act or the Exchange Act.
The following stock performance graph illustrates the cumulative total shareholder return on our common stock for the period from July 17, 2015 (the first day of trading for our common stock) to June 30, 2018, as compared to the Russell 2000 Index and the Dow Jones US Recreational Products Index.
The comparison assumes (i) a hypothetical investment of $100 in our common stock and the two above mentioned indices on July 17, 2015 and (ii) the full reinvestment of all dividends. The comparisons in the graph and table are required by the SEC and are not intended to be indicative of possible future performance of our common stock.
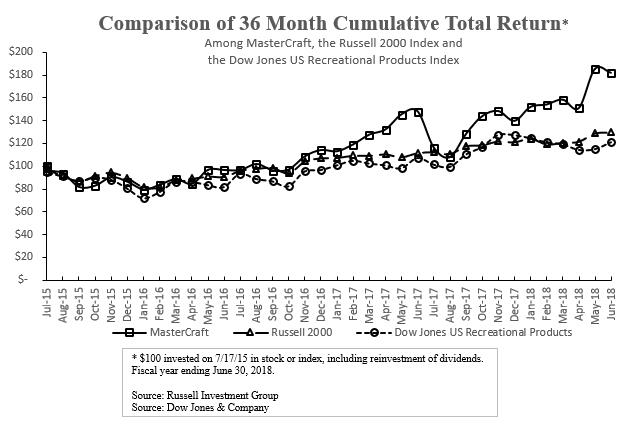
Securities Authorized for Issuance Under Equity Compensation Plans
For information regarding securities authorized for issuance under our equity compensation plans, see Note 13: Stock-Based Compensation in Item 8 and Item 12: Security Ownership of Certain Beneficial Owners and Management and Related Stockholder Matters.
ITEM 6.SELECTED FINANCIAL DATA.
The selected historical consolidated financial data and other data of MCBC Holdings, Inc. set forth below should be read together with “Management’s Discussion and Analysis of Financial Condition and Results of Operations” and our consolidated financial statements and related notes, each of which is included elsewhere in this Form 10-K.
35
We derived the consolidated statement of operations for the fiscal years ended June 30, 2018, June 30, 2017 and June 30, 2016 and our consolidated balance sheet data as of June 30, 2018 and 2017 from our audited consolidated financial statements and related notes included elsewhere in this Form 10-K. We derived the consolidated statement of operations for the fiscal years ended June 30, 2015 and June 30, 2014 and our consolidated balance sheet data as of June 30, 2016, June 30, 2015 and June 30, 2014 from audited consolidated financial statements, which are not included in this Form 10-K. Our historical results are not necessarily indicative of the results that may be expected in the future.
|
|
|
Fiscal Year Ended |
|
|||||||||||||
|
|
|
June 30, |
|
June 30, |
|
June 30, |
|
June 30, |
|
June 30, |
|
|||||
|
|
|
2018 |
|
2017 |
|
2016 |
|
2015 |
|
2014 |
|
|||||
|
|
|
(Dollars in thousands, except for shares and per share amounts) |
|
|||||||||||||
|
Consolidated statement of operations: |
|
|
|
|
|
|
|
|
|
|
|
|
|
|
|
|
|
Net sales |
|
$ |
332,725 |
|
$ |
228,634 |
|
$ |
221,600 |
|
$ |
214,386 |
|
$ |
177,587 |
|
|
Cost of sales |
|
|
242,361 |
|
|
165,158 |
|
|
160,521 |
|
|
163,220 |
|
|
139,975 |
|
|
Gross profit |
|
|
90,364 |
|
|
63,476 |
|
|
61,079 |
|
|
51,166 |
|
|
37,612 |
|
|
Operating expenses: |
|
|
|
|
|
|
|
|
|
|
|
|
|
|
|
|
|
Selling and marketing |
|
|
13,011 |
|
|
9,380 |
|
|
9,685 |
|
|
8,552 |
|
|
8,837 |
|
|
General and administrative |
|
|
19,773 |
|
|
20,474 |
|
|
29,162 |
|
|
18,472 |
|
|
9,960 |
|
|
Amortization of intangible assets |
|
|
1,597 |
|
|
107 |
|
|
221 |
|
|
222 |
|
|
221 |
|
|
Total selling, general and administrative expenses |
|
|
34,381 |
|
|
29,961 |
|
|
39,068 |
|
|
27,246 |
|
|
19,018 |
|
|
Operating income |
|
|
55,983 |
|
|
33,515 |
|
|
22,011 |
|
|
23,920 |
|
|
18,594 |
|
|
Other expense (income): |
|
|
|
|
|
|
|
|
|
|
|
|
|
|
|
|
|
Interest expense, including related party amounts |
|
|
3,474 |
|
|
2,222 |
|
|
1,280 |
|
|
5,171 |
|
|
7,555 |
|
|
Change in common stock warrant fair value |
|
|
— |
|
|
— |
|
|
3,425 |
|
|
6,621 |
|
|
2,526 |
|
|
Other income |
|
|
— |
|
|
— |
|
|
(1,212) |
|
|
— |
|
|
— |
|
|
Income before income tax expense (benefit) |
|
|
52,509 |
|
|
31,293 |
|
|
18,518 |
|
|
12,128 |
|
|
8,513 |
|
|
Income tax expense (benefit) |
|
|
12,856 |
|
|
11,723 |
|
|
8,308 |
|
|
6,594 |
|
|
(11,414) |
|
|
Net income |
|
$ |
39,653 |
|
$ |
19,570 |
|
$ |
10,210 |
|
$ |
5,534 |
|
$ |
19,927 |
|
|
Weighted average shares used for computation of: |
|
|
|
|
|
|
|
|
|
|
|
|
|
|
|
|
|
Basic(1) |
|
|
18,619,793 |
|
|
18,592,885 |
|
|
17,849,319 |
|
|
11,139,000 |
|
|
11,139,000 |
|
|
Diluted(1) |
|
|
18,714,531 |
|
|
18,620,708 |
|
|
18,257,007 |
|
|
11,862,699 |
|
|
11,182,264 |
|
|
Net income per common share: |
|
|
|
|
|
|
|
|
|
|
|
|
|
|
|
|
|
Basic |
|
$ |
2.13 |
|
$ |
1.05 |
|
$ |
0.57 |
|
$ |
0.50 |
|
$ |
1.79 |
|
|
Diluted |
|
|
2.12 |
|
|
1.05 |
|
|
0.56 |
|
|
0.47 |
|
|
1.78 |
|
|
Consolidated balance sheet data: |
|
|
|
|
|
|
|
|
|
|
|
|
|
|
|
|
|
Total assets |
|
$ |
176,924 |
|
$ |
83,321 |
|
$ |
82,533 |
|
$ |
89,676 |
|
$ |
96,142 |
|
|
Total liabilities |
|
|
124,402 |
|
|
71,560 |
|
|
90,912 |
|
|
131,929 |
|
|
99,929 |
|
|
Current portion of long-term debt |
|
|
5,069 |
|
|
3,687 |
|
|
7,885 |
|
|
18,275 |
|
|
8,621 |
|
|
Long-term debt |
|
|
70,087 |
|
|
30,790 |
|
|
44,342 |
|
|
60,487 |
|
|
57,359 |
|
|
Total debt |
|
|
75,156 |
|
|
34,477 |
|
|
52,227 |
|
|
78,762 |
|
|
65,980 |
|
|
Total stockholders’ equity (deficit) |
|
|
52,522 |
|
|
11,761 |
|
|
(8,379) |
|
|
(42,253) |
|
|
(3,787) |
|
|
Additional financial and other data (unaudited): |
|
|
|
|
|
|
|
|
|
|
|
|
|
|
|
|
|
Unit volume: |
|
|
|
|
|
|
|
|
|
|
|
|
|
|
|
|
|
MasterCraft |
|
|
3,068 |
|
|
2,790 |
|
|
2,742 |
|
|
2,547 |
|
|
2,135 |
|
|
NauticStar |
|
|
1,687 |
|
|
— |
|
|
— |
|
|
— |
|
|
— |
|
|
Hydra-Sports |
|
|
— |
|
|
— |
|
|
— |
|
|
45 |
|
|
50 |
|
|
MasterCraft sales |
|
$ |
266,319 |
|
$ |
228,634 |
|
$ |
221,600 |
|
$ |
199,907 |
|
$ |
163,631 |
|
|
NauticStar sales |
|
|
66,406 |
|
|
— |
|
|
— |
|
|
— |
|
|
— |
|
|
Hydra-Sports sales |
|
|
— |
|
|
— |
|
|
— |
|
|
14,479 |
|
|
13,956 |
|
|
Consolidated sales |
|
$ |
332,725 |
|
$ |
228,634 |
|
$ |
221,600 |
|
$ |
214,386 |
|
$ |
177,587 |
|
|
Per Unit: |
|
|
|
|
|
|
|
|
|
|
|
|
|
|
|
|
|
MasterCraft sales |
|
$ |
87 |
|
$ |
82 |
|
$ |
81 |
|
$ |
78 |
|
$ |
77 |
|
|
NauticStar sales |
|
|
39 |
|
|
— |
|
|
— |
|
|
— |
|
|
— |
|
|
Hydra-Sports sales |
|
|
— |
|
|
— |
|
|
— |
|
|
322 |
|
|
279 |
|
|
Consolidated sales |
|
$ |
70 |
|
$ |
82 |
|
$ |
81 |
|
$ |
83 |
|
$ |
81 |
|
|
Gross margin |
|
|
27.2 |
% |
|
27.8 |
% |
|
27.6 |
% |
|
23.9 |
% |
|
21.2 |
% |
|
Adjusted EBITDA(2) |
|
$ |
64,028 |
|
$ |
43,476 |
|
$ |
41,227 |
|
$ |
31,540 |
|
$ |
18,403 |
|
|
Adjusted Net Income (2) |
|
$ |
39,382 |
|
$ |
24,335 |
|
$ |
23,362 |
|
$ |
14,778 |
|
$ |
5,361 |
|
|
Adjusted EBITDA margin(2) |
|
|
19.2 |
% |
|
19.0 |
% |
|
18.6 |
% |
|
15.8 |
% |
|
11.2 |
% |
|
(1) |
The weighted average shares used for computation of basic and diluted earnings per common share gives effect to the 11.139-for-1stock split consummated on July 22, 2015 in connection with the Company’s initial public offering and excludes the 6,071,429 shares sold for periods prior to fiscal year ended June 30, 2016. |
|
(2) |
Adjusted EBITDA, Adjusted Net Income and Adjusted EBITDA margin are non-GAAP financial measures. We define Adjusted EBITDA margin as Adjusted EBITDA expressed as a percentage of MasterCraft and NauticStar sales. For definitions of Adjusted EBITDA, Adjusted Net Income and a reconciliation of each to net income, see “Item 7 Management’s Discussion and Analysis of Financial Condition and Results of Operations.” |
36
ITEM 7.MANAGEMENT'S DISCUSSION AND ANALYSIS OF FINANCIAL CONDITION AND RESULTS OF OPERATIONS.
The following discussion and analysis should be read together with the sections entitled “Risk Factors,” “Selected Financial Data,” and the financial statements and the accompanying notes included elsewhere in this Form 10-K. In addition, the statements in this discussion and analysis regarding industry outlook, our expectations regarding the performance of our business, anticipated financial results, liquidity and the other non-historical statements are forward-looking statements. These forward-looking statements are subject to numerous risks and uncertainties, including, but not limited to, the successful integration of Nautic Star, LLC into our business and the risks and uncertainties described in “Cautionary Note Regarding Forward-Looking Statements” and in “Risk Factors” above. Our actual results may differ materially from those contained in or implied by any forward-looking statements.
Overview
We are a world-renowned innovator, designer, manufacturer, and marketer of premium performance sport boats and outboard boats, with a leading market position in the U.S., a strong international presence, and dealers in 46 countries around the world. Our boats are used for water skiing, wakeboarding, wake surfing, and fishing, as well as general recreational boating. We operate in two reportable segments: MasterCraft and NauticStar. We believe that MasterCraft is the most recognized brand name in the performance sport boat category. In October 2017, we acquired NauticStar, a leading manufacturer and distributor of high-quality outboard bay boats, deck boats and offshore center console boats. NauticStar’s product portfolio provides diversification into the outboard category, the largest powerboat industry category in terms of retail units.
We sell our boats through an extensive network of independent dealers in North America and internationally. Through our MasterCraft segment, we partner with 95 North American dealers with 158 locations and 45 international dealers with 76 locations throughout the world. Through our NauticStar segment, we partner with 81 North American dealers with 95 locations and 1 international dealer with a single location. In fiscal 2018, 92.5% of our net sales were generated from North America and 7.5% of our net sales were generated from outside of North America.
Outlook
Our sales are impacted by general economic conditions, which affect the demand for our products, the demand for optional features, the availability of credit for our dealers and retail consumers, and overall consumer confidence. While the performance sport boat and outboard categories have grown in recent years, new unit sales remain significantly below historical peaks. While there is no guarantee that our market will continue to grow, we believe that increased consumer demand, limited used boat inventory, and the superior quality, performance, styling, and value proposition of our recently released boats present a long runway for future growth. Our revamped manufacturing and product development processes have led to operational efficiencies which we expect will continue to drive margin expansion.
Recent Transactions
Acquisition of Nautic Star, LLC
On October 2, 2017, we completed the acquisition of NauticStar. The aggregate purchase price was $80.5 million, including customary adjustments for the amount of working capital in the acquired business at the closing date. A portion of the purchase price was deposited into an escrow account in order to secure certain post-closing obligations of the former members of NauticStar.
37
Third Amended and Restated Credit Agreement
On October 2, 2017, we entered into a Third Amended Credit Agreement with Fifth Third Bank, as the agent and letter of credit issuer, and the lenders party thereto. The Third Amended Credit Agreement replaced and paid off our Second Amended and Restated Credit Agreement, dated May 27, 2016 (the “Prior Credit Agreement”). The Third Amended Credit Agreement provides us with a $145 million senior secured credit facility, consisting of a $115 million term loan (the “Third Term Loan”) and a $30 million revolving credit facility (the “Revolving Credit Facility”). A portion of the proceeds from the Third Term Loan was used to fund our acquisition of NauticStar. On October 17, 2017, December 1, 2017, February 28, 2018, April 30, 2018 and May 31, 2018, we made voluntary payments on the Third Term Loan of $10.0 million, $7.0 million, $8.0 million, $5.0 million and $5.0 million, respectively, out of excess cash.
Seasonality and Other Factors That Affect Our Business
Our operating results are subject to annual and seasonal fluctuations resulting from a variety of factors, including:
|
· |
seasonal variations in retail demand for boats, with a significant majority of sales occurring during peak boating season, which we attempt to manage by providing incentive programs and floor plan subsidies to encourage dealer purchases throughout the year, which may include offering off-season retail promotions to our dealers in seasonally slow months, during and ahead of boat shows, to encourage retail demand; |
|
· |
product mix, which is driven by boat model mix and higher option order rates; while product mix does not significantly affect margins, sales of larger boats and boats with optional content produce higher absolute profits; |
|
· |
inclement weather, which can affect production at our manufacturing facilities as well as consumer demand; |
|
· |
competition from other recreational boat manufacturers; |
|
· |
general economic conditions; and |
|
· |
foreign currency exchange rates. |
Key Performance Measures
From time to time we use certain key performance measures in evaluating our business and results of operations and we may refer to one or more of these key performance measures in this “Management’s Discussion and Analysis of Financial Condition and Results of Operations.” These key performance measures include:
|
· |
Unit volume — We define unit volume as the number of our boats sold to our dealers during a period. |
|
· |
Net sales per unit — We define net sales per unit as net sales divided by unit volume. |
|
· |
Gross margin — We define gross margin as gross profit divided by net sales, expressed as a percentage. |
|
· |
Adjusted EBITDA — We define Adjusted EBITDA as earnings before interest expense, income taxes, depreciation, and amortization, as further adjusted to eliminate certain non-cash charges and unusual items that we do not consider to be indicative of our ongoing operations. For a reconciliation of Adjusted EBITDA to net income, see “Non-GAAP Measures” below. |
|
· |
Adjusted Net Income — We define Adjusted Net Income as net income excluding income taxes adjusted to eliminate certain non-cash charges and unusual items that we do not consider to be indicative of our ongoing operations and an adjustment for income tax expense at a normalized annual effective tax rate. For a reconciliation of Adjusted Net Income, see “Non-GAAP Measures” below. |
38
Components of Results of Operations
Net Sales
We generate sales from the sale of boats, trailers, and accessories to our dealers. The substantial majority of our net sales are derived from the sale of boats, including optional features included at the time of the initial wholesale purchase of the boat. Net sales consist of the following:
|
· |
Gross sales, which are derived from: |
|
· |
Boat sales — sales of boats to our dealer network. In addition, nearly all of our boat sales include optional feature upgrades, which increase the average selling price of our boats; and |
|
· |
Trailers, parts and accessories, and other revenues — sales of boat trailers, replacement and aftermarket boat parts and accessories, and transportation charges to our dealer network. |
|
· |
Net of: |
|
· |
Dealer programs and flooring subsidies — incentives, including rebates and subsidized flooring, we provide to our dealers to drive volume and level dealer purchases throughout the year. If a dealer meets certain volume levels over the course of the year during certain defined periods, the dealer will be entitled to a specified rebate. These rebates change annually and include volume and exclusivity incentives. Dealers who participate in our floor plan financing program may be entitled to have their flooring costs subsidized by us to promote dealer orders in the off-season. |
Cost of Sales
Our cost of sales includes all of the costs to manufacture our products, including raw materials, components, supplies, direct labor, and factory overhead. For components and accessories manufactured by third-party vendors, our costs are the amounts invoiced to us by the vendors. Cost of sales includes shipping and handling costs, depreciation expense related to manufacturing equipment and facilities, and warranty costs associated with the repair or replacement of our boats under warranty.
Operating Expenses
Our operating expenses include selling and marketing costs, general and administrative costs, impairment losses and amortization costs. These items include personnel and related expenses, non-manufacturing overhead, and various other operating expenses. Further, selling and marketing expenditures include the cost of advertising and marketing materials. General and administrative expenses include, among other things, salaries, benefits, and other personnel related expenses for employees engaged in product development, engineering, finance, information technology, human resources, and executive management. Other costs include outside legal and accounting fees, investor relations, risk management (insurance), and other administrative costs.
Other Expense
Other expense includes interest expense, including related party amounts, legal settlements and change in common stock warrant fair value. Interest expense, consists of interest charged under our credit facilities, deferred financing fees, and debt issuance costs written off in connection with the pay down of amounts owed on our credit facilities.
Income Tax Expense
Our accounting for income tax expense reflects management’s assessment of future tax assets and liabilities based on assumptions and estimates for timing, likelihood of realization, and tax laws existing at the time of evaluation. We record a valuation allowance, when appropriate, to reduce deferred tax assets to an amount that is more likely than not to be realized.
39
Results of Operations
The consolidated statement of operations presented below should be read together with “Selected Consolidated Financial Data,” and our consolidated financial statements and related notes included elsewhere in this Form 10-K.
We derived the consolidated statement of operations for the fiscal years ended June 30, 2018, 2017 and 2016 and our consolidated balance sheets data as of June 30, 2018 and 2017 from our audited consolidated financial statements and related notes included elsewhere in this Form 10-K. Our historical results are not necessarily indicative of the results that may be expected in the future.
|
|
|
For the Years Ended June 30, |
|
|||||||
|
|
|
2018 |
|
2017 |
|
2016 |
|
|||
|
|
|
(Dollars in thousands) |
|
|||||||
|
Consolidated statement of operations: |
|
|
|
|
|
|
|
|
|
|
|
|
|
|
|
|
|
|
|
|
|
|
|
Net sales |
|
$ |
332,725 |
|
$ |
228,634 |
|
$ |
221,600 |
|
|
Cost of sales |
|
|
242,361 |
|
|
165,158 |
|
|
160,521 |
|
|
Gross profit |
|
|
90,364 |
|
|
63,476 |
|
|
61,079 |
|
|
Operating expenses: |
|
|
|
|
|
|
|
|
|
|
|
Selling and marketing |
|
|
13,011 |
|
|
9,380 |
|
|
9,685 |
|
|
General and administrative |
|
|
19,773 |
|
|
20,474 |
|
|
29,162 |
|
|
Amortization of intangible assets |
|
|
1,597 |
|
|
107 |
|
|
221 |
|
|
Total operating expenses |
|
|
34,381 |
|
|
29,961 |
|
|
39,068 |
|
|
Operating income |
|
|
55,983 |
|
|
33,515 |
|
|
22,011 |
|
|
Other expense: |
|
|
|
|
|
|
|
|
|
|
|
Interest expense |
|
|
3,474 |
|
|
2,222 |
|
|
1,280 |
|
|
Change in common stock warrant fair value |
|
|
— |
|
|
— |
|
|
3,425 |
|
|
Other income |
|
|
— |
|
|
— |
|
|
(1,212) |
|
|
Income before income tax expense |
|
|
52,509 |
|
|
31,293 |
|
|
18,518 |
|
|
Income tax expense |
|
|
12,856 |
|
|
11,723 |
|
|
8,308 |
|
|
Net income |
|
$ |
39,653 |
|
$ |
19,570 |
|
$ |
10,210 |
|
|
Additional financial and other data: |
|
|
|
|
|
|
|
|
|
|
|
Unit volume: |
|
|
|
|
|
|
|
|
|
|
|
MasterCraft |
|
|
3,068 |
|
|
2,790 |
|
|
2,742 |
|
|
NauticStar |
|
|
1,687 |
|
|
— |
|
|
— |
|
|
MasterCraft sales |
|
$ |
266,319 |
|
$ |
228,634 |
|
$ |
221,600 |
|
|
NauticStar sales |
|
|
66,406 |
|
|
— |
|
|
— |
|
|
Consolidated sales |
|
$ |
332,725 |
|
$ |
228,634 |
|
$ |
221,600 |
|
|
Per Unit: |
|
|
|
|
|
|
|
|
|
|
|
MasterCraft sales |
|
$ |
87 |
|
$ |
82 |
|
$ |
81 |
|
|
NauticStar sales |
|
|
39 |
|
|
— |
|
|
— |
|
|
Consolidated sales |
|
$ |
70 |
|
$ |
82 |
|
$ |
81 |
|
|
Gross margin |
|
|
27.2 |
% |
|
27.8 |
% |
|
27.6 |
% |
Fiscal 2018 Compared to Fiscal 2017
Net Sales. Our net sales for fiscal 2018 were $332.7 million, reflecting an increase of $104.1 million, or 45.5%, compared to $228.6 million for fiscal 2017. An increase of 16.5%, or $37.7 million, was attributable to MasterCraft, primarily due to an increase in unit sales volume, reduced retail rebate activity, favorable product mix and price increases. The inclusion of NauticStar increased net sales by 29.0%, or $66.4 million.
Cost of Sales. Our cost of sales increased $77.2 million, or 46.7%, to $242.4 million for fiscal 2018 compared to $165.2 million for fiscal 2017. An increase of 13.9%, or $23.1 million, was attributable to MasterCraft, primarily due to an increase in MasterCraft unit volume of 10.0%, which includes a favorable product mix and higher material costs, partially offset by lower warranty costs. The inclusion of NauticStar increased cost of sales by 32.8%, or $54.1 million.
40
Gross Profit. For fiscal 2018, our gross profit increased $26.9 million, or 42.4%, to $90.4 million compared to $63.5 million for fiscal 2017. The increase was primarily due to an increase in MasterCraft unit sales volume, price increases, lower warranty costs and reduced retail rebate activity, partially offset by higher material costs. The inclusion of NauticStar contributed $12.3 million to gross profit. Gross margin decreased to 27.2% for fiscal 2018 compared to 27.8% for fiscal 2017. The decrease in gross margin was primarily due to the dilutive effect from the inclusion of NauticStar’s gross margin.
Operating Expenses. Selling and marketing expense increased $3.6 million, or 38.7%, to $13.0 million for fiscal 2018 compared to $9.4 million for fiscal 2017. This increase resulted mainly from the inclusion of NauticStar, which increased selling and marketing expenses by $1.9 million, an increase in dealer training costs, an increase in dealer meeting costs, an increase in compensation costs and increased promotion activities related to the introduction of the redesigned 2018 MasterCraft XStar. General and administrative expense decreased by $0.7 million, or 3.4%, to $19.8 million for fiscal 2018 compared to $20.5 million for fiscal 2017. This decrease resulted mainly from a decrease of $5.9 million in patent litigation costs, which was settled during the fourth quarter of fiscal 2017. This decrease was partially offset by the inclusion of NauticStar, which increased general and administrative expenses by $2.2 million, an increase of $1.7 million for acquisition-related legal and advisory fees, and $0.6 million related to new brand startup costs. Operating expenses, as a percentage of net sales, decreased by 2.8 percentage points to 10.3% for fiscal 2018 compared to 13.1% for fiscal 2017. This favorable impact resulted from leverage experienced through significant net sales increases compared to the net increases in operating expenses.
Other Expense. Interest expense increased $1.3 million or 56.3%, to $3.5 million for fiscal 2018 compared to $2.2 million for fiscal 2017. The increase is due to increased borrowings under the Third Term Loan compared to the principal balance owed under the term loan component of the Prior Credit Agreement during fiscal 2017.
Income Tax Expense. Our results for fiscal 2018 reflect the impact of the enactment of the Tax Reform Act, which was signed into law on December 22, 2017. The Tax Reform Act reduced federal corporate income tax rates and changed numerous other provisions. As we have a June 30 fiscal year-end, the lower corporate federal income tax rate will be phased in, resulting in a U.S. federal statutory tax rate of 28.1% for our fiscal year ending June 30, 2018, and 21% for subsequent fiscal years. We have revalued our deferred tax assets and liabilities to the reduced rates based on the period in which those assets and liabilities are expected to reverse. The incorporation of the changes resulting from the Tax Reform Act in our tax related accounts during fiscal 2018 resulted in a decrease to our year to date effective tax rate due to the revaluation of our deferred tax accounts. The fiscal year ended June 30, 2018 included a year-to-date benefit of $647 to reflect federal deferred taxes at the lower blended effective tax rate.
Our income tax expense was $12.9 million for fiscal 2018, reflecting a reported effective tax rate of 24.5%. Our income tax expense was $11.7 million for fiscal 2017, reflecting a reported effective tax rate of 37.5%. Our effective tax rate for fiscal 2018 was lower than the 28.1% statutory rate primarily due to the impact of the Tax Reform Act, and a permanent benefit associated with the domestic production activities deduction, which was partially offset by the inclusion of the state tax rate in the overall effective rate.
Fiscal 2017 Compared to Fiscal 2016
Net Sales. Our net sales for fiscal 2017 were $228.6 million, reflecting an increase of $7.0 million, or 3.2%, compared to $221.6 million for fiscal 2016. The increase was due to an increase in unit volume of 48 units, or 1.8% and an increase in our net sales per unit of 1.4%. This increase was due to price increases, as well as increased sales of higher content option packages.
Cost of Sales. Our cost of sales increased $4.7 million, or 2.9%, to $165.2 million for fiscal 2017 compared to $160.5 million for fiscal 2016. The increase in cost of sales resulted primarily from a 1.8% increase in total unit volume and an increase in our cost of sales per unit of 1.1% due primarily to increased sales of higher content option packages, partially offset by lower warranty costs.
Gross Profit. For fiscal 2017, our gross profit increased $2.4 million, or 3.9%, to $63.5 million compared to $61.1 million for fiscal 2016. Gross margin increased to 27.8% for fiscal 2017 compared to 27.6% for fiscal 2016. The increase in gross
41
profit margin and gross margin resulted primarily from price increases and sales of higher content option packages as well as lower warranty costs, partially offset by rebates associated with increased retail demand from our winter sales program.
Operating Expenses. Selling and marketing expense decreased $0.3 million, or 3.1%, to $9.4 million for fiscal 2017 compared to $9.7 million for fiscal 2016. This decrease resulted mainly from reduced spending on the marketing events. General and administrative expense decreased by $8.7 million, or 29.8%, to $20.5 million for fiscal 2017 compared to $29.2 million for fiscal 2016. This decrease resulted mainly from $13.0 million in reduced stock-based compensation cost partially offset by an increase of $4.3 million in legal and advisory fees related to our litigation with Malibu Boats, which includes a $2.5 million charge to settle the Malibu patent case. Operating expenses, as a percentage of net sales, decreased by 4.5 percentage points to 13.1% for fiscal 2017 compared to 17.6% for fiscal 2016. This decrease was the result of the decrease in general and administrative expenses and selling and marketing expenses described above.
Other Expense (income). Interest expense increased $0.9 million or 73.6%, to $2.2 million for fiscal 2017 compared to $1.3 million for fiscal 2016. The increase is due to interest expense incurred on the Prior Credit Agreement entered into in May 2016, partially offset by the write-off of deferred financing costs related to the debt extinguishment during fiscal 2016. There was no change in common stock warrant fair value for the fiscal 2017, as all warrants were exercised during fiscal 2016. We recognized a gain during fiscal 2016 upon settlement of a litigation matter of $1.2 million.
Income Tax Expense. Our income tax expense was $11.7 million for fiscal 2017, reflecting a reported effective tax rate of 37.5%, which differs from the statutory federal income tax rate of 35% primarily due to the inclusion of the state tax rate in the overall effective rate. Our income tax expense was $8.3 million for fiscal 2016, reflecting a reported effective tax rate of 44.9%, which also differs from the statutory federal income tax rate of 35% primarily due to permanent differences relating to the change in fair value of the common stock warrant.
Non-GAAP Measures
We define EBITDA as earnings before interest expense, income taxes, depreciation and amortization. We define Adjusted EBITDA as EBITDA further adjusted to eliminate certain non-cash charges and other items that we do not consider to be indicative of our ongoing operations, including change in common stock warrant fair value, fees and expenses related to the our initial public offering, fees and expenses associated with our follow-on offering, transaction expenses associated with the acquisition of NauticStar, acquisition related inventory step up adjustment, our stock-based compensation, out-of-period adjustment to correct an immaterial error related to our warranty reserve and new brand startup costs. We define Adjusted Net Income as net income adjusted to eliminate certain non-cash charges and other items that we do not consider to be indicative of our ongoing operations, including change in common stock warrant fair value, fees and expenses related to our initial public offering, fees and expenses associated with our follow-on offering, transaction expenses associated with the acquisition of NauticStar, acquisition related inventory step up adjustment, our stock-based compensation, out-of-period adjustment to correct of an immaterial error related to our warranty reserve, new brand startup costs and an adjustment for income tax expense at a normalized annual effective tax rate. We define Adjusted EBITDA margin as Adjusted EBITDA expressed as a percentage of net sales. Adjusted EBITDA, Adjusted Net Income and Adjusted EBITDA margin are not measures of net income or operating income as determined under accounting principles generally accepted in the United States, which we refer to as GAAP. Adjusted EBITDA and Adjusted Net Income are not measures of performance in accordance with GAAP and should not be considered as an alternative to net income or operating cash flows determined in accordance with GAAP. Additionally, Adjusted EBITDA is not intended to be a measure of cash flow for management’s discretionary use. We believe that the inclusion of EBITDA, Adjusted EBITDA, Adjusted EBITDA margin and Adjusted Net Income is appropriate to provide additional information to investors because securities analysts, noteholders and other investors use these non GAAP financial measures to assess our operating performance across periods on a consistent basis and to evaluate the relative risk of an investment in our securities. We use Adjusted Net Income to facilitate a comparison of our operating performance on a consistent basis from period to period that, when viewed in combination with our results prepared in accordance with GAAP, provides a more complete understanding of factors and trends affecting our business than GAAP alone measures. We believe Adjusted Net Income assists our board of directors, management and investors in comparing our net income on a consistent basis from period to period because it removes non-cash items and items not indicative of our ongoing operations. Adjusted EBITDA and Adjusted Net Income have limitations as an analytical tool and
42
should not be considered in isolation or as a substitute for analysis of our results as reported under GAAP. Some of these limitations are:
|
· |
Although depreciation and amortization are non-cash charges, the assets being depreciated and amortized will often have to be replaced in the future and Adjusted EBITDA does not reflect any cash requirements for such replacements; |
|
· |
Adjusted EBITDA does not reflect our cash expenditures, or future requirements for capital expenditures or contractual commitments; |
|
· |
Adjusted EBITDA does not reflect changes in, or cash requirements for, our working capital needs; |
|
· |
Adjusted EBITDA does not reflect our tax expense or any cash requirements to pay income taxes; |
|
· |
Adjusted EBITDA does not reflect interest expense, or the cash requirements necessary to service interest payments on our indebtedness; and |
|
· |
Adjusted Net Income and Adjusted EBITDA do not reflect the impact of earnings or charges resulting from matters we do not consider to be indicative of our ongoing operations, but may nonetheless have a material impact on our results of operations. |
In addition, because not all companies use identical calculations, our presentation of Adjusted EBITDA and Adjusted Net Income may not be comparable to similarly titled measures of other companies, including companies in our industry.
The following table sets forth a reconciliation of net income as determined in accordance with U.S. GAAP to Adjusted EBITDA for the periods indicated (unaudited):
|
|
June 30, |
|
June 30, |
|
June 30, |
|
|||
|
|
2018 |
|
2017 |
|
2016 |
|
|||
|
|
(Dollars in thousands) |
|
|||||||
|
Net income |
$ |
39,653 |
|
$ |
19,570 |
|
$ |
10,210 |
|
|
Income tax expense |
|
12,856 |
|
|
11,723 |
|
|
8,308 |
|
|
Interest expense |
|
3,474 |
|
|
2,222 |
|
|
1,280 |
|
|
Depreciation and amortization |
|
5,086 |
|
|
3,231 |
|
|
3,444 |
|
|
EBITDA |
|
61,069 |
|
|
36,746 |
|
|
23,242 |
|
|
Change in common stock warrant fair value(a) |
|
— |
|
|
— |
|
|
3,425 |
|
|
Transaction expense(b) |
|
1,744 |
|
|
71 |
|
|
479 |
|
|
Inventory step-up adjustment – acquisition related(c) |
|
501 |
|
|
— |
|
|
— |
|
|
Litigation charge(d) |
|
— |
|
|
5,948 |
|
|
1,606 |
|
|
Litigation settlement(e) |
|
— |
|
|
— |
|
|
(1,212) |
|
|
Warranty adjustment(f) |
|
(1,033) |
|
|
— |
|
|
— |
|
|
New brand and product development costs(g) |
|
561 |
|
|
— |
|
|
— |
|
|
Stock-based compensation |
|
1,186 |
|
|
711 |
|
|
13,687 |
|
|
Adjusted EBITDA |
|
64,028 |
|
|
43,476 |
|
|
41,227 |
|
|
Adjusted EBITDA Margin(h) |
|
19.2 |
% |
|
19.0 |
% |
|
18.6 |
% |
|
|
|
|
|
|
|
|
|
|
|
|
(a) |
Represents non-cash expense related to increases in the fair market value of our common stock warrant. |
|
(b) |
Represents fees, expenses and integration costs associated with our acquisition of NauticStar in the current period and our secondary offerings, follow-on offering and payment of a special cash dividend in June 2016 in prior periods. |
|
(c) |
Represents post-acquisition adjustment to cost of goods sold for the fair value step up of inventory acquired all of which was sold during the second quarter of fiscal 2018. |
43
|
(d) |
Represents legal and advisory fees for our litigation with Malibu Boats, LLC for fiscal 2017 and fiscal 2016, which includes settling the Malibu patent case in fiscal 2017. |
|
(e) |
Represents receipt of a one-time payment to settle certain litigation matters. |
|
(f) |
Represents an out-of-period adjustment to correct an immaterial error related to our warranty accrual calculation identified during the fiscal year ended June 30, 2018. See Note 3 to our audited consolidated financial statements included elsewhere in this Form 10-K for more information. |
|
(g) |
Represents startup costs associated with a completely new boat brand in a segment of the market neither MasterCraft nor NauticStar serves. |
|
(h) |
We define Adjusted EBITDA margin as Adjusted EBITDA expressed as a percentage of net sales. |
The following table sets forth a reconciliation of net income as determined in accordance with U.S. GAAP to Adjusted Net Income for the periods indicated (unaudited):
|
|
|
Fiscal Years Ended |
||||||||
|
|
|
2018 |
|
2017 |
|
2016 |
|
|||
|
|
|
(Dollars in thousands, except for shares and per share amounts) |
|
|||||||
|
Net income |
|
$ |
39,653 |
|
$ |
19,570 |
|
$ |
10,210 |
|
|
Income tax expense |
|
|
12,856 |
|
|
11,723 |
|
|
8,308 |
|
|
Change in common stock warrant fair value(a) |
|
|
— |
|
|
— |
|
|
3,425 |
|
|
Transaction expense(b) |
|
|
1,744 |
|
|
71 |
|
|
479 |
|
|
Inventory step-up adjustment – acquisition related(c) |
|
|
501 |
|
|
— |
|
|
— |
|
|
Litigation charge(d) |
|
|
— |
|
|
5,948 |
|
|
1,606 |
|
|
Litigation settlement(e) |
|
|
— |
|
|
— |
|
|
(1,212) |
|
|
Warranty adjustment(f) |
|
|
(1,033) |
|
|
— |
|
|
— |
|
|
New brand and product development costs(g) |
|
|
561 |
|
|
— |
|
|
— |
|
|
Stock-based compensation |
|
|
1,186 |
|
|
711 |
|
|
13,687 |
|
|
Adjusted Net Income before income taxes(h) |
|
|
55,468 |
|
|
38,023 |
|
|
36,503 |
|
|
Adjusted income tax expense(i) |
|
|
16,086 |
|
|
13,688 |
|
|
13,141 |
|
|
Adjusted Net Income |
|
$ |
39,382 |
|
$ |
24,335 |
|
$ |
23,362 |
|
|
|
|
|
|
|
|
|
|
|
|
|
|
Pro-forma Adjusted Net Income per common share |
|
|
|
|
|
|
|
|
|
|
|
Basic |
|
|
2.11 |
|
|
1.31 |
|
|
1.28 |
|
|
Diluted |
|
|
2.09 |
|
|
1.30 |
|
|
1.24 |
|
|
Pro-forma weighted average shares used for the computation of: |
|
|
|
|
|
|
|
|
|
|
|
Basic Adjusted Net Income per share(j) |
|
|
18,625,769 |
|
|
18,597,357 |
|
|
18,283,755 |
|
|
Diluted Adjusted Net Income per share(j) |
|
|
18,800,236 |
|
|
18,711,089 |
|
|
18,772,373 |
|
|
(a) |
Represents non-cash expense related to increases in the fair market value of our common stock warrant. |
|
(b) |
Represents fees, expenses and integration costs associated with our acquisition of NauticStar in the current period and our secondary offerings, follow-on offering and payment of a special cash dividend in June 2016 in prior periods. |
|
(c) |
Represents post-acquisition adjustment to cost of goods sold for the fair value step up of inventory acquired all of which was sold during the second quarter of fiscal 2018. |
44
|
(d) |
Represents legal and advisory fees for our litigation with Malibu Boats, LLC for fiscal 2017 and fiscal 2016, which includes settling the Malibu patent case in fiscal 2017. |
|
(e) |
Represents receipt of a one-time payment to settle certain litigation matters. |
|
(f) |
Represents an out-of-period adjustment to correct an immaterial error related to our warranty accrual calculation identified during the fiscal year ended June 30, 2018. See Note 3 to our audited consolidated financial statements included elsewhere in this Form 10-K for more information. |
|
(g) |
Represents startup costs associated with a completely new boat brand in a segment of the market neither MasterCraft nor NauticStar serves. |
|
(h) |
Prior periods presented exclude amortization charges for acquired intangible assets incurred during the fourth quarter and year ended fiscal 2018 period of $0.5 million and $1.5 million, respectively. |
|
(i) |
Reflects income tax expense at an estimated annual effective income tax rate of 29% for all current-year periods presented and 36% for all prior-year periods presented. We expect our estimated annual effective income tax rate to be reduced to about 24% for fiscal 2019. |
|
(j) |
The weighted average shares used for computation of pro-forma basic and diluted earnings per common share gives effect to the 42,233 shares of restricted stock awards, the 67,134 performance stock units granted under the 2015 Incentive Award Plan during the fiscal year ended June 30, 2018 and 58,706 shares for the dilutive effect of stock options. The average of the prior quarters is used for computation of the fiscal year ended periods. |
The following table shows the reconciliation of net income per diluted share to Adjusted Net Income per diluted pro-forma weighted average share for the periods presented:
|
|
|
Fiscal Years Ended |
|
|||||||
|
|
|
2018 |
|
2017 |
|
2016 |
|
|||
|
Net income per diluted share |
|
|
2.12 |
|
|
1.05 |
|
|
0.56 |
|
|
Impact of adjustments: |
|
|
|
|
|
|
|
|
|
|
|
Income tax expense |
|
|
0.69 |
|
|
0.63 |
|
|
0.46 |
|
|
Change in common stock warrant fair value(a) |
|
|
— |
|
|
— |
|
|
0.19 |
|
|
Transaction expense(b) |
|
|
0.09 |
|
|
— |
|
|
0.03 |
|
|
Inventory step-up adjustment – acquisition related(c) |
|
|
0.03 |
|
|
— |
|
|
— |
|
|
Litigation charge(d) |
|
|
— |
|
|
0.32 |
|
|
0.09 |
|
|
Litigation settlement(e) |
|
|
— |
|
|
— |
|
|
(0.07) |
|
|
Warranty adjustment(f) |
|
|
(0.06) |
|
|
— |
|
|
— |
|
|
New brand and product development costs(g) |
|
|
0.03 |
|
|
— |
|
|
— |
|
|
Stock-based compensation |
|
|
0.06 |
|
|
0.04 |
|
|
0.75 |
|
|
Adjusted Net Income per diluted share before income taxes(h) |
|
|
2.96 |
|
|
2.04 |
|
|
2.01 |
|
|
Impact of adjusted income tax expense on net income per diluted share before income taxes(i) |
|
|
(0.86) |
|
|
(0.73) |
|
|
(0.72) |
|
|
Impact of increased share count(j) |
|
|
(0.01) |
|
|
(0.01) |
|
|
(0.05) |
|
|
Adjusted Net Income per diluted pro-forma weighted average share |
|
|
2.09 |
|
|
1.30 |
|
|
1.24 |
|
|
(a) |
Represents non-cash expense related to increases in the fair market value of our common stock warrant. |
|
(b) |
Represents fees, expenses and integration costs associated with our acquisition of NauticStar in the current period and our secondary offerings, follow-on offering and payment of a special cash dividend in June 2016 in prior periods. |
45
|
(c) |
Represents post-acquisition adjustment to cost of goods sold for the fair value step up of inventory acquired all of which was sold during the second quarter of fiscal 2018. |
|
(d) |
Represents legal and advisory fees for our litigation with Malibu Boats, LLC for fiscal 2017 and fiscal 2016, which includes settling the Malibu patent case in fiscal 2017. |
|
(e) |
Represents receipt of a one-time payment to settle certain litigation matters. |
|
(f) |
Represents an out-of-period adjustment to correct an immaterial error related to our warranty accrual calculation identified during the fiscal year ended June 30, 2018. See Note 3 to our audited consolidated financial statements included elsewhere in this Form 10-K for more information. |
|
(g) |
Represents startup costs associated with a completely new boat brand in a segment of the market neither MasterCraft nor NauticStar serves. |
|
(h) |
Prior periods presented exclude amortization charges for acquired intangible assets incurred during the fourth quarter and year ended fiscal 2018 period of $0.5 million and $1.5 million, respectively. |
|
(i) |
Reflects income tax expense at an estimated annual effective income tax rate of 29% for all current-year periods presented and 36% for all prior-year periods presented. We expect our estimated annual effective income tax rate to be reduced to about 24% for fiscal 2019. |
|
(j) |
Reflects impact of increased share counts giving effect to the exchange of all restricted stock awards, the vesting of all performance stock units and for the dilutive effect of stock options included in outstanding shares. |
Liquidity and Capital Resources
Our primary liquidity and capital resource needs are to finance working capital, fund capital expenditures, and service our debt. Our principal source of funds is cash generated from operating activities. As of June 30, 2018, we had borrowing availability of $30.0 million under our Revolving Credit Facility. We believe our cash from operations, along with the ability to borrow on our Revolving Credit Facility, will be sufficient to provide for our working capital, capital expenditures, and debt service needs for at least the next 12 months. The following table summarizes the cash flows from operating, investing, and financing activities:
|
|
|
Fiscal Year Ended |
|
|||||||
|
|
|
2018 |
|
2017 |
|
2016 |
|
|||
|
|
|
(Dollars in thousands) |
|
|||||||
|
Total cash provided by (used in): |
|
|
|
|
|
|
|
|
|
|
|
Operating activities |
|
$ |
49,397 |
|
$ |
26,232 |
|
$ |
30,747 |
|
|
Investing activities |
|
|
(85,720) |
|
|
(4,135) |
|
|
(3,817) |
|
|
Financing activities |
|
|
40,194 |
|
|
(18,132) |
|
|
(28,024) |
|
|
Net increase (decrease) in cash |
|
$ |
3,871 |
|
$ |
3,965 |
|
$ |
(1,094) |
|
Operating Activities
Our net cash provided by operating activities increased by $23.2 million, or 88.3%, for fiscal 2018 compared to fiscal 2017, to $49.4 million from $26.2 million. This increase was primarily due to an increase in operating income of $22.5 million of which $15.8 million was attributable to our MasterCraft segment. Our MasterCraft segment operating income grew from an increase in unit sales volume, price increases, lower warranty costs and reduced retail rebate activity, partially offset by higher material costs. The inclusion of NauticStar increased our operating income by $6.6 million. These
46
increases were partially offset by an increase in cash paid for taxes and an increase in cash payments for interest related to an increase in our term loan balance when compared to the principal balance owed on our term loan during the fiscal year ended June 30, 2017.
Our net cash provided by operating activities decreased by $4.5 million, or 14.7%, for fiscal 2017 compared to fiscal 2016, to $26.2 million from $30.7 million. This decrease was primarily due to a decrease in cash generated from changes in operating assets and liabilities of $3.1 million, an increase in cash payments for interest of $1.6 million and payments of $5.9 million for legal and advisory fees related to our litigation with Malibu Boats, which includes a $2.5 million payment to settle the Malibu patent case, partially offset by higher net income, adjusted for non-cash items, which was driven by our improved operating performance as described above and a decrease in cash payments for income taxes of $3.1 million.
Investing Activities
Net cash used in investing activities increased $81.6 million for fiscal 2018 compared to fiscal 2017. This increase was primarily due to the acquisition of NauticStar in October 2017, for cash consideration of $80.5 million, net of cash on hand. Remaining capital outlays consisted of purchases for manufacturing infrastructure and expansion activities, molds, and equipment.
Net cash used in investing activities increased $0.3 million, or 8.3%, for fiscal 2017 compared to fiscal 2016. This increase was due to increased capital expenditures driven by increased spending on product development and higher facilities and information technology spending.
Financing Activities
Net financing activities was a source of cash for the fiscal year ended June 30, 2018 of $40.2 million and a use of cash of $18.1 million for the fiscal year ended June 30, 2017. Cash provided by financing activities for the fiscal year ended June 30, 2018 increased $58.3 million primarily from proceeds from issuance of long term debt of $80.8 million, which was partially offset by deferred financing costs of $1.2 million and payments on our term loan facility of $39.3 million, which was an increase of $21.3 million over the fiscal year ended June 30, 2017, during which payments on the Prior Credit Agreement, including repayment of the revolving facility thereunder, were $18.0 million.
Net cash used in financing activities decreased by $9.9 million, or 35.3%, in fiscal 2017 compared to fiscal 2016. This decrease was due primarily to payments during fiscal 2017 of $14.9 million and $3.1 million on our term loan facility and our revolving credit facility under the Prior Credit Agreement, respectively, compared to the net cash used in financing activities of $28.0 million during fiscal 2016 which included proceeds obtained from our initial public offering, net of expenses, which were used to payoff existing debt, a payment of $79.9 million for a special dividend, and the repurchase and retirement of $4.5 million in common stock.
Senior Secured Credit Facility.
In December 2013, we entered into a credit and guaranty agreement (the “Senior Secured Credit Facility”) with Fifth Third Bank. The Senior Secured Credit Facility provided, among other things, provided an initial term loan facility of $25 million and a revolving credit facility of $10 million. In November 2014, we entered into a first amendment to the Senior Secured Credit Facility to, among other things, increase the term loan facility to $50 million, repay all amounts outstanding under our Senior Secured PIK Notes due 2014 and extend the maturity date to November 26, 2019. In March 2015, we entered into an amended and restated credit and guaranty agreement (the “Amended Credit Agreement”) with Fifth Third Bank. The Amended Credit Agreement amended and restated the Senior Secured Credit Facility to, among other things, increase the term loan facility to $75 million and increase the commitments under the revolving credit facility to $30 million. In
47
July 2015, we repaid all outstanding borrowings under our term loan facility and our revolving credit facility with the proceeds from our initial public offering and the term loan facility was canceled.
In May 2016, we entered into a Second Amended and Restated Credit and Guaranty Agreement with Fifth Third Bank. The Prior Credit Agreement replaced our Amended Credit Agreement from March 2015 and provided us with an $80 million senior secured credit facility, consisting of a $50 million term loan and a $30 million revolving credit facility. We used the proceeds from the term loan, cash on hand and our revolving credit facility to pay a $79.9 million cash dividend to common stockholders in June 2016.
In October 2017, we entered into a Third Amended Credit Agreement with Fifth Third Bank. The Third Amended Credit Agreement replaced and paid off our Prior Credit Agreement, from May 2016 and provides us with a $145 million senior secured credit facility, consisting of a $115 million Third Term Loan and a $30 million Revolving Credit Facility. A portion of the proceeds from the Third Credit Agreement were used for our acquisition of NauticStar. During the fiscal year ended June 30 ,2018, we made voluntary payments on the Third Term Loan of $35.0 million, out of excess cash.
As of June 30, 2018, the current net revolving line of credit availability was $30.0 million, we were in compliance with all financial covenants and no event of default had occurred.
Off-Balance Sheet Arrangements
As of June 30, 2018, we did not have any off-balance sheet financings.
Contractual Obligations
As of June 30, 2018, our continuing contractual obligations were as follows:
|
|
|
Payments Due by Period |
|
|||||||||||||
|
|
|
|
|
|
Less than |
|
|
|
|
|
|
|
More than |
|
||
|
|
|
Total |
|
1 year |
|
1-3 years |
|
3-5 years |
|
5 years |
|
|||||
|
|
|
(Dollars in thousands) |
|
|||||||||||||
|
Long-Term Debt Obligations(1) |
|
$ |
76,656 |
|
$ |
5,475 |
|
$ |
21,403 |
|
$ |
49,778 |
|
$ |
— |
|
|
Interest on Long-Term Debt Obligations(2) |
|
$ |
13,719 |
|
$ |
3,281 |
|
$ |
8,308 |
|
$ |
2,130 |
|
$ |
— |
|
|
Operating Lease Obligations |
|
$ |
1,857 |
|
$ |
591 |
|
$ |
1,137 |
|
$ |
129 |
|
$ |
— |
|
|
Purchase Obligations(3) |
|
$ |
12,847 |
|
$ |
2,300 |
|
$ |
7,712 |
|
$ |
2,835 |
|
$ |
— |
|
|
Total Contractual Obligations |
|
$ |
105,079 |
|
$ |
11,647 |
|
$ |
38,560 |
|
$ |
54,872 |
|
$ |
— |
|
|
(1) |
Consists of obligations under our Third Term Loan due October 2022. |
|
(2) |
For purposes of this table, future interest payments are calculated based on the assumption that (a) all debt outstanding as of June 30, 2018 remains outstanding until maturity, (b) the per annum rate of interest applicable to the indebtedness as of June 30, 2018 remains constant until maturity, (c) any accrued and unpaid interest prior to June 30, 2018 is excluded and (d) the unused line commitment fee, if applicable, is included at a constant rate per annum against the amount of the unused line as of June 30, 2018 through maturity. Actual borrowing levels and interest costs may differ. |
|
(3) |
Consists of minimum purchase amounts under various agreements. |
Our dealers have arrangements with certain finance companies to provide secured floor plan financing for the purchase of our products. These arrangements indirectly provide liquidity to us by financing dealer purchases of our products, thereby
48
minimizing the use of our working capital in the form of accounts receivable. A majority of our sales are financed under similar arrangements, pursuant to which we receive payment within a few days of shipment of the product. We have agreed to repurchase products repossessed by the finance companies if a dealer defaults on its debt obligations to a finance company and the boat is returned to us, subject to certain limitations. Our financial exposure under these agreements is limited to the difference between the amounts unpaid by the dealer with respect to the repossessed product plus costs of repossession and the amount received on the resale of the repossessed product. We have not incurred any losses from a finance company mandated repurchase since the recession. No boats were repurchased during the fiscal years ended June 30, 2018, June 30, 2017 or June 30, 2016. An adverse change in retail sales, however, could require us to repurchase repossessed units upon an event of default by any of our dealers, subject in some cases to an annual limitation. See Note 14 to our audited consolidated financial statements included elsewhere in this Form 10-K for more information related to our obligations under our floor plan financing agreements.
Emerging Growth Company
We are an emerging growth company, as defined in the JOBS Act. For as long as we are an emerging growth company, we may take advantage of certain exemptions from various reporting requirements that are applicable to other public companies that are not emerging growth companies, including, but not limited to, not being required to comply with the auditor attestation requirements of Section 404(b) of the Sarbanes-Oxley Act, reduced disclosure obligations regarding executive compensation in our periodic reports and proxy statements, and exemptions from the requirements of holding stockholder advisory “say-on-pay” votes on executive compensation and stockholder advisory votes on golden parachute compensation.
The JOBS Act also provides that an emerging growth company can utilize the extended transition period provided in Section 7(a)(2)(B) of the Securities Act for complying with new or revised accounting standards. Pursuant to Section 107 of the JOBS Act, we have irrevocably chosen to opt out of such extended transition period and, as a result, we will comply with new or revised accounting standards on the relevant dates on which adoption of such standards is required for companies that are not “emerging growth companies.”
We will continue to be an emerging growth company until the earliest to occur of (i) the last day of fiscal year during which we had total annual gross revenues of at least $1.07 billion, (ii) June 30, 2021, which is the last day of our fiscal year following the fifth anniversary of the date of completion of our initial public offering, (iii) the date on which we have, during the previous three-year period, issued more than $1.07 billion in non-convertible debt, or (iv) the date on which we are deemed to be a “large accelerated filer,” as defined under the Exchange Act.
Inflation
The market prices of certain materials and components used in manufacturing our products, especially resins that are made with hydrocarbon feedstocks, copper, aluminum, and stainless steel, can be volatile. Historically, however, inflation has not had a material effect on our results of operations. Significant increases in inflation, particularly those related to wages and increases in the cost of raw materials, could have an adverse impact on our business, financial condition, and results of operations.
New boat buyers often finance their purchases. Inflation typically results in higher interest rates that could translate into an increased cost of boat ownership. Should inflation and increased interest rates occur, prospective consumers may choose to forego or delay their purchases or buy a less expensive boat in the event credit is not available to finance their boat purchases.
49
Critical Accounting Policies
A “critical accounting policy” is one which is both important to the understanding of our financial condition and results of operations and requires management’s most difficult, subjective, or complex judgments, often of the need to make estimates about the effect of matters that are inherently uncertain. Actual results could differ from those estimates and cause our reported net income (loss) to vary significantly from period to period.
We believe that of our significant accounting policies, which are described in full in Note 3 to our audited consolidated financial statements appearing elsewhere in this Form 10-K, and the policies listed below involve the greatest degree of judgment and complexity. Accordingly, we believe these are the most critical to understand in order to evaluate fully our financial condition and results of operations.
Goodwill, Impairment, and Other Indefinite-lived Intangible Assets
We test goodwill for impairment by first assessing qualitative factors to determine if it is more likely than not that the fair value of a reporting unit is less than its carrying amount as a basis for determining whether it is necessary to perform the two-step goodwill impairment test or when events or circumstances allow for a quantitative assessment.
In circumstances where we determine that it is more likely than not that the fair value of a reporting unit is less than its carrying amount, goodwill is tested for impairment at the reporting unit level (operating segment or one level below an operating segment) on an annual basis in the fourth quarter, and between annual tests if an event occurs or circumstances change that would more likely than not reduce the fair value of a reporting unit below its carrying value. These events or circumstances could include a significant change in the business climate, legal factors, operating performance indicators, competition, or sale or disposition of a significant portion of a reporting unit. Application of the goodwill impairment test requires judgment, including the identification of reporting units, assignment of assets and liabilities to reporting units, assignment of goodwill to reporting units, and determination of the fair value of each reporting unit. The fair value of each reporting unit is estimated using the income approach, on a discounted cash flow methodology in the two-step goodwill impairment test. This analysis requires estimation of future cash flows, which is dependent on internal forecasts, estimation of the long-term rate of growth for our business, estimation of the useful life over which cash flows will occur, and determination of our weighted-average cost of capital. The estimates used to calculate the fair value of a reporting unit change from year to year based on operating results and market conditions. Changes in these estimates and assumptions could materially affect the determination of fair value and goodwill impairment for each reporting unit. Based on the analysis performed, there was no impairment through June 30, 2018 and 2017. The carrying value of our goodwill was $65.8 million and $29.6 million as of June 30, 2018 and 2017, respectively.
We perform a qualitative assessment to determine whether further impairment testing of indefinite-lived intangible assets is necessary, similar in approach to goodwill impairment testing. These qualitative factors include macroeconomics, adverse changes in legal and regulatory environment, loss of key customer or vendor, change in key management, and adverse changes in business climate. In periods in which a new reporting segment is added, which occurred during our fiscal 2018 year due to the acquisition of NauticStar, we performed a quantitative assessment of goodwill and other indefinite-lived intangible assets. We recorded no impairment related to our indefinite-lived intangible asset through 2018 and 2017, as a result of the qualitative assessment. We performed a qualitative assessment of goodwill and other indefinite-lived intangible assets for the year ended June 30, 2017 to determine if it was more likely than not that the fair value of a reporting unit was less than its carrying amount. Based on the Company’s quantitative assessment for June 30, 2018 and qualitative assessments for June 30, 2017, it was determined that there was no impairment charge related to its intangible assets during the years ended June 30, 2018, or 2017.
50
Impairment of Other Long-Lived Assets
We periodically evaluate long-lived assets held for use and held for sale, including intangible assets with finite lives which consist of a dealer network, developed technologies, software, and order backlog, whenever events or changes in circumstances indicate that the carrying amount of those assets may not be recoverable. Assets are grouped and evaluated for impairment at the lowest level of which there are identifiable cash flows, which is generally at the reporting unit level. Reporting units are reviewed for impairment using factors including, but not limited to, our future operating plans and projected cash flows. We recognize impairment if the sum of the undiscounted future cash flows does not exceed the carrying value of the assets. For impaired assets, we recognize a loss equal to the difference between the net book value of the asset and its estimated fair value. Fair value is based on discounted future cash flows of the asset using a discount rate commensurate with the risk. We did not identify any impairment indicators of such long-lived assets through 2018 and 2017.
Income Taxes
We are subject to income taxes in the United States of America and the United Kingdom. Our effective tax rates differ from the statutory rates, primarily due to changes in the valuation allowance and non-deductible expenses, as further described in the notes to our consolidated financial statements included in this Form 10-K. Our effective tax rate was 24.5%, 37.5% and 44.9% in the fiscal years ended 2018, 2017 and 2016, respectively.
Significant judgment is required in evaluating our uncertain tax positions and determining our provision for income taxes. Although we believe our reserves are reasonable, we cannot assure you that the final tax outcome of these matters will not be different from that which is reflected in our historical income tax provisions and accruals. We adjust these reserves in light of changing facts and circumstances, such as the closing of a tax audit or the refinement of an estimate. To the extent that the final tax outcome of these matters is different than the amounts recorded, such differences will impact the provision for income taxes in the period in which such determination is made. The provision for income taxes includes the impact of reserve provisions and changes to reserves that are considered appropriate, as well as the related net interest.
Significant judgment is also required in determining any valuation allowance recorded against deferred tax assets. In assessing the need for a valuation allowance, we consider all available evidence, including past operating results, estimates of future taxable income, and the feasibility of tax planning strategies. In the event that we change our determination as to the amount of deferred tax assets that can be realized, we will adjust our valuation allowance with a corresponding impact to the provision for income taxes in the period in which such determination is made.
Realization of our deferred tax assets is dependent on generating sufficient taxable income in future periods. If future events cause us to conclude that it is not more likely than not that we will be able to recover the value of our deferred tax assets, we are required to establish a valuation allowance on deferred tax assets at that time.
Revenue Recognition
We generally manufacture products based on specific orders from dealers and ship completed products only after collectability has been assured. Typically, this involves receiving credit approval from third-party financial institutions or those participating in floor plan financing programs. In some cases, boats are shipped “cash in advance” where third-party credit is unavailable. Revenue associated with sales to dealers is primarily recorded when all of the following conditions have been met:
|
· |
an order for a product has been received; |
51
|
· |
a common carrier signs the delivery ticket accepting responsibility for the product or a company leased truck has delivered the product to a customer (applicable to NauticStar only); and |
|
· |
the product is removed from our property for delivery. |
If these conditions are generally met, then title passes. Our shipping terms specify that title and risk of loss transfer to the dealer when the boat leaves our facility.
Dealers generally have no rights to return unsold boats. From time to time, however, we may accept returns in limited circumstances and at our discretion under our warranty policy, which generally limits returns to instances of manufacturing defects. We estimate the costs that may be incurred under our basic limited warranty and record a liability in the amount of such costs at the time the product revenue is recognized. We may also be obligated, in the event of default by a dealer, to accept returns of unsold boats under our repurchase commitment to floor plan financing providers, which are able to obtain such boats through foreclosure. We accrue estimated losses when a loss, due to the default of one of our dealers, is determined to be probable and the amount of the loss is reasonably estimable. Refer to Note 9 to our audited consolidated financial statements included elsewhere in this Form 10-K for more information related to our repurchase commitment obligations.
Revenue from boat part sales is recorded as the product is shipped from our location, which is free on board shipping point.
Rebates, Promotions, Floor Plan Financing, and Incentives
We provide for various structured dealer rebate and sales promotions incentives, which are most often recognized as a reduction in net sales at the time of sale to the dealer. Dealer rebate and sales promotions incentives are based on actual wholesale rebate and applicable sales promotion expenses at the time of sale to the dealer. Examples of such programs include seasonal discounts, volume commitment rebates and other allowances.
Rebates may apply to boats already in dealer inventory. These “retail rebates” on boats in the dealer’s inventory are recorded when the rebate is communicated to the dealer. Retail rebates are estimated based on current programs and historical achievement and/or usage rates. Actual results may differ from these estimates if market conditions dictate the need to enhance or reduce sales promotion and incentive programs or if dealer achievement or other items vary from historical trends.
Product Warranties
We provide a limited warranty for our products. Our standard warranties require us or our dealers to repair or replace defective products during the warranty period at no cost to the consumer. We estimate the costs that may be incurred under our basic limited warranty and record as a liability the amount of such costs at the time the product revenue is recognized. Factors that affect our warranty liability include the number of units sold, historical and anticipated rates of warranty claims, and cost per claim. We periodically assess the adequacy of the recorded warranty liabilities and adjust the amounts as necessary. We utilize historical trends and analytical tools to assist in determining the appropriate warranty liability.
Repurchase Agreements
In connection with our dealers’ wholesale floor plan financing of boats, we have entered into repurchase agreements with various lending institutions. The repurchase commitment is on an individual unit basis with a term from the date it is financed by the lending institution through payment date by the dealer, generally not exceeding two and a half years. Such agreements are customary in the industry and our exposure to loss under such agreements is limited by the resale value of
52
the inventory which is required to be repurchased. We had no repurchase events during the fiscal years ended June 30, 2018, June 30, 2017 or June 30, 2016.
ITEM 7A.QUANTITATIVE AND QUALITATIVE DISCLOSURES ABOUT MARKET RISK.
Market risk represents the risk of changes in the value of market risk sensitive instruments caused by fluctuations in foreign exchange rates, interest rates, and commodity prices. Changes in these factors could cause fluctuations in the results of our operations and cash flows. In the ordinary course of business, we are primarily exposed to interest rate risks.
Borrowings under the Third Term Loan and Revolving Credit Facility under our Third Credit Agreement are subject to changing interest rates. Although changes in interest rates do not impact our results of operations, the changes could affect the fair value of our debt and related interest payments.
On July 22, 2015, the Company repaid all outstanding borrowings under its $75 million term loan facility and its outstanding borrowings under its $30 million revolving line of credit with the proceeds received from the IPO. The Company carried no outstanding borrowings from July 22, 2015 through May 26, 2016, which is when we entered into the Prior Credit Agreement, which replaced our Amended and Restated Credit Agreement, dated March 13, 2015. The Prior Credit Agreement provided the Company with an $80 million senior secured credit facility, consisting of a $50 million term loan and a $30 million revolving credit facility.
On October 2, 2017, the Company entered into the Third Credit Agreement, which replaced and the Prior Credit Agreement. The Third Amended Credit Agreement provides the Company with a $145 million Senior Secured Credit Facility, consisting of a $115 million Third Term Loan and a $30 million Revolving Credit Facility. Accordingly, the Company had outstanding borrowings at all times during the fiscal year ended June 30, 2018.
A hypothetical 1% increase or decrease in interest rates would have resulted in a $0.7 million change to our interest expense for fiscal 2018.
ITEM 8.FINANCIAL STATEMENTS AND SUPPLEMENTARY DATA.
The financial statements and supplementary financial information required to be filed under this Item 8 are presented in Part IV, Item 15 of this Form 10-K and are incorporated herein by reference.
ITEM 9.CHANGES IN AND DISAGREEMENTS WITH ACCOUNTANTS ON ACCOUNTING AND FINANCIAL DISCLOSURE.
None.
ITEM 9A.CONTROLS AND PROCEDURES
Evaluation of Disclosure Controls and Procedures
We maintain disclosure controls and procedures (as defined in Rule 13a-15(e) of the Exchange Act) that are designed to ensure that information required to be disclosed by us in the reports that we file or submit under the Exchange Act is recorded, processed, summarized and reported within the time periods specified in the SEC's rules and forms, and that such information is accumulated and communicated to our management, including our chief executive officer and chief financial officer, as appropriate, to allow timely decisions regarding required disclosures. Any controls and procedures, no matter how well designed and operated, can provide only reasonable assurance of achieving the desired control objectives.
53
As of the end of the period covered by this Form 10-K Annual Report, we carried out an evaluation under the supervision and with the participation of our management, including our chief executive officer and chief financial officer, of the effectiveness of our disclosure controls and procedures. Based upon this evaluation, our chief executive officer and chief financial officer have concluded that our disclosure controls and procedures were effective at a reasonable assurance level as of June 30, 2018.
Management’s Report on Internal Control over Financial Reporting
Our management is responsible for establishing and maintaining adequate internal control over financial reporting as defined in Rule 13a-15(f) under the Exchange Act. Internal control over financial reporting is a process to provide reasonable assurance regarding the reliability of our financial reporting for external purposes in accordance with accounting principles generally accepted in the United States. Because of its inherent limitations, internal control over financial reporting may not prevent or detect misstatements. Projections of any evaluation of effectiveness to future periods are subject to the risk that controls may become inadequate because of changes in conditions, or that the degree of compliance with the policies or procedures may deteriorate.
Our management, including our chief executive officer and chief financial officer, assessed the effectiveness of our internal control over financial reporting as of June 30, 2018. In making this assessment, we used the criteria set forth by the Committee of Sponsoring Organizations of the Treadway Commission ("COSO") in Internal Control-Integrated Framework (2013). Based on such assessment our management has concluded that, as of June 30, 2018, our internal control over financial reporting is effective based on those criteria.
Under guidelines established by the SEC, companies are allowed to exclude an acquired business from management’s report on internal control over financial reporting for the first year subsequent to the acquisition while integrating the acquired operations. Accordingly, management has excluded NauticStar from its annual report on internal control over financial reporting as of June 30, 2018. NauticStar represents 49.7% of the Company’s consolidated total assets as of June 30, 2018. See Note 4 to our audited consolidated financial statements included elsewhere in this Form 10-K.
This annual report does not include an attestation report from our registered public accounting firm regarding internal control over financial reporting. Management's report was not subject to attestation by our registered public accounting firm pursuant to rules of the SEC that permit emerging growth companies, which we are, to provide only management's report in this annual report.
Changes in Internal Control Over Financial Reporting
There have been no changes in our internal control over financial reporting, as defined in Exchange Act Rule 13a-15(f), during the quarter ended June 30, 2018 that have materially affected, or are reasonably likely to materially affect, our internal control over financial reporting.
None.
ITEM 10.DIRECTORS, EXECUTIVE OFFICERS AND CORPORATE GOVERNANCE.
The information required by this Item 10 will be included in the Proxy Statement and is incorporated herein by reference.
54
ITEM 11.EXECUTIVE COMPENSATION
The information required by this Item 11 will be included in the Proxy Statement and is incorporated herein by reference.
ITEM 12.SECURITY OWNERSHIP OF CERTAIN BENEFICIAL OWNERS AND MANAGEMENT AND RELATED STOCKHOLDER MATTERS
The information required by this Item 12 will be included in the Proxy Statement and is incorporated herein by reference.
ITEM 13.CERTAIN RELATIONSHIPS AND RELATED PARTY TRANSACTIONS, AND DIRECTOR INDEPENDENCE
The information required by this Item 13 will be included in the Proxy Statement and is incorporated herein by reference.
ITEM 14.PRINCIPAL ACCOUNTANT FEES AND SERVICES.
The information required by this Item 14 will be included in the Proxy Statement and is incorporated herein by reference.
55
ITEM 15.EXHIBITS, FINANCIAL STATEMENT SCHEDULES.
|
a. |
Documents included in this report: |
|
|
|
|
|
|
|
1. Financial Statements |
|
|
|
|
|
|
|
F-1 |
|
|
|
F-2 |
|
|
|
F-3 |
|
|
|
F-4 |
|
|
|
F-5 |
|
|
|
F-6 |
|
|
|
|
|
|
|
1. Financial Statement Schedules |
|
|
|
|
|
|
|
Financial statement schedules have been omitted because they are either not required, not applicable or the information required to be presented is included in our financial statements and related notes. |
|
|
|
|
|
|
|
2. Exhibits |
|
|
|
|
|
|
|
The following documents are filed as a part of this annual report on Form 10-K or are incorporated by reference to previous filings, if so indicated: |
|
Not Applicable.
56
57
| 10.16 |
8-K |
001-37502 |
10.1 |
2/19/16 |
|
|
| 10.17 |
8-K |
001-37502 |
10.1 |
5/27/16 |
|
|
| 10.18 |
10-K |
001-37502 |
10.20 |
9/9/16 |
|
|
|
10.19† |
Form of Performance Stock Unit Award Agreement under 2015 Incentive Award Plan |
8-K |
001-37502 |
10.1 |
8/26/16 |
|
| 10.20 |
8-K |
001-37502 |
10.1 |
10/2/17 |
|
|
| 21.1 |
|
|
|
|
* |
|
| 23.1 |
Consent of BDO USA, LLP, independent registered public accounting firm |
|
|
|
|
* |
| 31.1 |
Rule 13a-14(a)/15d-14(a) Certification of Principal Executive Officer |
|
|
|
|
* |
| 31.2 |
Rule 13a-14(a)/15d-14(a) Certification of Principal Financial Officer |
|
|
|
|
* |
| 32.1 |
|
|
|
|
** |
|
| 32.2 |
|
|
|
|
** |
|
|
101.INS |
XBRL Instance Document |
|
|
|
|
* |
|
101.SCH |
XBRL Taxonomy Extension Schema Document |
|
|
|
|
* |
|
101.CAL |
XBRL Taxonomy Extension Calculation Linkbase Document |
|
|
|
|
* |
|
101.DEF |
XBRL Taxonomy Extension Definition Linkbase Document |
|
|
|
|
* |
|
101.LAB |
XBRL Taxonomy Extension Label Linkbase Document |
|
|
|
|
* |
|
101.PRE |
XBRL Taxonomy Extension Presentation Linkbase Document |
|
|
|
|
* |
†Indicates management contract or compensatory plan.
*Filed herewith.
**Furnished herewith.
58
SIGNATURES
Pursuant to the requirements of Section 13 or 15(d) of the Securities Exchange Act of 1934, the registrant has duly caused this report to be signed on its behalf by the undersigned, thereunto duly authorized.
|
Date: September 7, 2018 |
MCBC HOLDINGS, INC. |
|
|
|
|
|
|
|
|
|
By: |
/s/ TERRY MCNEW |
|
|
|
|
President and Chief Executive Officer |
|
Pursuant to the requirements of the Securities Exchange Act of 1934, this report has been signed below by the following persons on behalf of the registrant and in the capacities and on the dates indicated.
|
Signature |
|
Title |
|
Date |
|
|
|
|
|
|
|
/s/ TERRY MCNEW |
|
President and Chief Executive Officer (Principal Executive Officer) and Director |
|
|
|
Terry McNew |
|
|
|
September 7, 2018 |
|
|
|
|
|
|
|
/s/ TIMOTHY M. OXLEY |
|
Chief Financial Officer (Principal Financial and Accounting Officer), Treasurer and Secretary |
|
|
|
Timothy M. Oxley |
|
|
|
September 7, 2018 |
|
|
|
|
|
|
|
/s/ FREDERICK A. BRIGHTBILL |
|
Director |
|
|
|
Frederick A. Brightbill |
|
|
|
September 7, 2018 |
|
|
|
|
|
|
|
/s/ W. PATRICK BATTLE |
|
Director |
|
|
|
W. Patrick Battle |
|
|
|
September 7, 2018 |
|
|
|
|
|
|
|
/s/ DONALD C. CAMPION |
|
Director |
|
|
|
Donald C. Campion |
|
|
|
September 7, 2018 |
|
|
|
|
|
|
|
/s/ TJ CHUNG |
|
Director |
|
|
|
TJ Chung |
|
|
|
September 7, 2018 |
|
|
|
|
|
|
|
/s/ ROCH LAMBERT |
|
Director |
|
|
|
Roch Lambert |
|
|
|
September 7, 2018 |
|
|
|
|
|
|
|
/s/ PETER G. LEEMPUTTE |
|
Director |
|
|
|
Peter G. Leemputte |
|
|
|
September 7, 2018 |
59
REPORT OF INDEPENDENT REGISTERED PUBLIC ACCOUNTING FIRM
Board of Directors and Stockholders
MCBC Holdings, Inc.
Vonore, Tennessee
Opinion on the Consolidated Financial Statements
We have audited the accompanying consolidated balance sheets of MCBC Holdings, Inc. (the “Company”) and subsidiaries as of June 30, 2018 and 2017, the related consolidated statements of operations, stockholders’ equity (deficit), and cash flows for each of the three years in the period ended June 30, 2018, and the related notes (collectively referred to as the “consolidated financial statements”). In our opinion, the consolidated financial statements present fairly, in all material respects, the financial position of the Company and subsidiaries at June 30, 2018 and 2017, and the results of their operations and their cash flows for each of the three years in the period ended June 30, 2018, in conformity with accounting principles generally accepted in the United States of America.
Basis for Opinion
These consolidated financial statements are the responsibility of the Company’s management. Our responsibility is to express an opinion on the Company’s consolidated financial statements based on our audits. We are a public accounting firm registered with the PCAOB and are required to be independent with respect to the Company in accordance with the U.S. federal securities laws and the applicable rules and regulations of the Securities and Exchange Commission and the PCAOB.
We conducted our audits in accordance with the standards of the PCAOB. Those standards require that we plan and perform the audit to obtain reasonable assurance about whether the consolidated financial statements are free of material misstatement, whether due to error or fraud. The Company is not required to, nor were we engaged to perform, an audit of its internal control over financial reporting. As part of our audits we are required to obtain an understanding of internal control over financial reporting but not for the purpose of expressing an opinion on the effectiveness of the Company’s internal control over financial reporting. Accordingly, we express no such opinion.
Our audits included performing procedures to assess the risks of material misstatement of the consolidated financial statements, whether due to error or fraud, and performing procedures that respond to those risks. Such procedures included examining, on a test basis, evidence regarding the amounts and disclosures in the consolidated financial statements. Our audits also included evaluating the accounting principles used and significant estimates made by management, as well as evaluating the overall presentation of the consolidated financial statements. We believe that our audits provide a reasonable basis for our opinion.
/s/ BDO USA, LLP
We have served as the Company’s auditor since 2015.
Memphis, Tennessee
September 7, 2018
F-1
MCBC HOLDINGS, INC. AND SUBSIDIARIES
(Dollar amounts in thousands, except share and per share data)
|
|
|
2018 |
|
2017 |
|
||
|
|
|
|
|
|
|
|
|
|
ASSETS |
|
|
|
|
|
|
|
|
CURRENT ASSETS: |
|
|
|
|
|
|
|
|
Cash and cash equivalents |
|
$ |
7,909 |
|
$ |
4,038 |
|
|
Accounts receivable — net of allowances of $51 and $82, respectively |
|
|
5,515 |
|
|
3,500 |
|
|
Inventories — net (Note 5) |
|
|
20,467 |
|
|
11,676 |
|
|
Prepaid expenses and other current assets (Note 6) |
|
|
3,295 |
|
|
2,438 |
|
|
Total current assets |
|
|
37,186 |
|
|
21,652 |
|
|
Property, plant and equipment — net (Note 7) |
|
|
22,265 |
|
|
14,827 |
|
|
Intangible assets — net (Note 8) |
|
|
51,046 |
|
|
16,643 |
|
|
Goodwill (Note 8) |
|
|
65,792 |
|
|
29,593 |
|
|
Deferred debt issuance costs — net |
|
|
383 |
|
|
481 |
|
|
Other |
|
|
252 |
|
|
125 |
|
|
Total assets |
|
$ |
176,924 |
|
$ |
83,321 |
|
|
LIABILITIES AND STOCKHOLDERS' EQUITY |
|
|
|
|
|
|
|
|
CURRENT LIABILITIES: |
|
|
|
|
|
|
|
|
Accounts payable |
|
$ |
17,266 |
|
$ |
11,008 |
|
|
Income tax payable |
|
|
705 |
|
|
780 |
|
|
Accrued expenses and other current liabilities (Note 9) |
|
|
27,866 |
|
|
21,410 |
|
|
Current portion of long term debt, net of unamortized debt issuance costs (Note 11) |
|
|
5,069 |
|
|
3,687 |
|
|
Total current liabilities |
|
|
50,906 |
|
|
36,885 |
|
|
Long term debt, net of unamortized debt issuance costs (Note 11) |
|
|
70,087 |
|
|
30,790 |
|
|
Deferred income taxes (Note 12) |
|
|
1,427 |
|
|
953 |
|
|
Unrecognized tax positions (Note 12) |
|
|
1,982 |
|
|
2,932 |
|
|
Total liabilities |
|
|
124,402 |
|
|
71,560 |
|
|
COMMITMENTS AND CONTINGENCIES (Note 14) |
|
|
|
|
|
|
|
|
STOCKHOLDERS' EQUITY: |
|
|
|
|
|
|
|
|
Common stock, $.01 par value per share — authorized, 100,000,000 shares; issued and outstanding, 18,682,338 shares at June 30, 2018 and 18,637,445 shares at June 30, 2017 |
|
|
187 |
|
|
186 |
|
|
Additional paid-in capital |
|
|
114,052 |
|
|
112,945 |
|
|
Accumulated deficit |
|
|
(61,717) |
|
|
(101,370) |
|
|
Total stockholders' equity |
|
|
52,522 |
|
|
11,761 |
|
|
Total liabilities and stockholders' equity |
|
$ |
176,924 |
|
$ |
83,321 |
|
The notes form an integral part of the consolidated financial statements.
F-2
MCBC HOLDINGS, INC. AND SUBSIDIARIES
CONSOLIDATED STATEMENTS OF OPERATIONS
(Dollar amounts in thousands, except share and per share data)
|
|
|
For the Years Ended June 30, |
|
|||||||
|
|
|
2018 |
|
2017 |
|
2016 |
|
|||
|
|
|
|
|
|
|
|
|
|
|
|
|
NET SALES |
|
$ |
332,725 |
|
$ |
228,634 |
|
$ |
221,600 |
|
|
COST OF SALES |
|
|
242,361 |
|
|
165,158 |
|
|
160,521 |
|
|
GROSS PROFIT |
|
|
90,364 |
|
|
63,476 |
|
|
61,079 |
|
|
OPERATING EXPENSES: |
|
|
|
|
|
|
|
|
|
|
|
Selling and marketing |
|
|
13,011 |
|
|
9,380 |
|
|
9,685 |
|
|
General and administrative |
|
|
19,773 |
|
|
20,474 |
|
|
29,162 |
|
|
Amortization of intangible assets |
|
|
1,597 |
|
|
107 |
|
|
221 |
|
|
Total operating expenses |
|
|
34,381 |
|
|
29,961 |
|
|
39,068 |
|
|
OPERATING INCOME |
|
|
55,983 |
|
|
33,515 |
|
|
22,011 |
|
|
OTHER EXPENSE: |
|
|
|
|
|
|
|
|
|
|
|
Interest expense |
|
|
3,474 |
|
|
2,222 |
|
|
1,280 |
|
|
Change in common stock warrant fair value |
|
|
— |
|
|
— |
|
|
3,425 |
|
|
Other income |
|
|
— |
|
|
— |
|
|
(1,212) |
|
|
INCOME BEFORE INCOME TAX EXPENSE |
|
|
52,509 |
|
|
31,293 |
|
|
18,518 |
|
|
INCOME TAX EXPENSE |
|
|
12,856 |
|
|
11,723 |
|
|
8,308 |
|
|
NET INCOME |
|
$ |
39,653 |
|
$ |
19,570 |
|
$ |
10,210 |
|
|
|
|
|
|
|
|
|
|
|
|
|
|
EARNINGS PER COMMON SHARE: |
|
|
|
|
|
|
|
|
|
|
|
Basic |
|
$ |
2.13 |
|
$ |
1.05 |
|
$ |
0.57 |
|
|
Diluted |
|
$ |
2.12 |
|
$ |
1.05 |
|
$ |
0.56 |
|
|
WEIGHTED AVERAGE SHARES USED FOR COMPUTATION OF: |
|
|
|
|
|
|
|
|
|
|
|
Basic earnings per share |
|
|
18,619,793 |
|
|
18,592,885 |
|
|
17,849,319 |
|
|
Diluted earnings per share |
|
|
18,714,531 |
|
|
18,620,708 |
|
|
18,257,007 |
|
The notes form an integral part of the consolidated financial statements.
F-3
MCBC HOLDINGS, INC. AND SUBSIDIARIES
CONSOLIDATED STATEMENTS OF STOCKHOLDERS’ EQUITY (DEFICIT)
(Dollar amounts in thousands, except share and per share data)
|
|
|
|
|
|
|
|
Additional |
|
|
|
|
|
|
|
|
|
|
|
Common Stock |
|
Paid-in |
|
Accumulated |
|
|
|
|
|||||
|
|
|
Shares |
|
Amount |
|
Capital |
|
Deficit |
|
Total |
|
||||
|
Balance at July 1, 2015 |
|
11,139,000 |
|
$ |
111 |
|
$ |
8,841 |
|
$ |
(51,205) |
|
$ |
(42,253) |
|
|
Sale of common stock in IPO, net of $9,309 in underwriter discounts, commissions and offering expenses |
|
6,071,429 |
|
|
61 |
|
|
81,701 |
|
|
— |
|
|
81,762 |
|
|
Issuance of shares of common stock warrants and options |
|
864,946 |
|
|
9 |
|
|
12,653 |
|
|
— |
|
|
12,662 |
|
|
Repurchase and retirement of common stock |
|
(378,417) |
|
|
(4) |
|
|
(4,322) |
|
|
— |
|
|
(4,326) |
|
|
Equity-based compensation, net of withholding taxes on equity awards |
|
894,850 |
|
|
9 |
|
|
13,502 |
|
|
— |
|
|
13,511 |
|
|
Dividends declared |
|
|
|
|
|
|
|
|
|
|
(79,945) |
|
|
(79,945) |
|
|
Net income |
|
— |
|
|
— |
|
|
— |
|
|
10,210 |
|
|
10,210 |
|
|
Balance at July 1, 2016 |
|
18,591,808 |
|
$ |
186 |
|
$ |
112,375 |
|
$ |
(120,940) |
|
$ |
(8,379) |
|
|
Equity-based compensation activity |
|
45,637 |
|
|
— |
|
|
1,019 |
|
|
— |
|
|
1,019 |
|
|
Offering costs |
|
— |
|
|
— |
|
|
(449) |
|
|
— |
|
|
(449) |
|
|
Net income |
|
— |
|
|
— |
|
|
— |
|
|
19,570 |
|
|
19,570 |
|
|
Balance at June 30, 2017 |
|
18,637,445 |
|
$ |
186 |
|
$ |
112,945 |
|
$ |
(101,370) |
|
$ |
11,761 |
|
|
Equity-based compensation activity (Note 13) |
|
44,893 |
|
|
1 |
|
|
1,107 |
|
|
— |
|
|
1,108 |
|
|
Net income |
|
— |
|
|
— |
|
|
— |
|
|
39,653 |
|
|
39,653 |
|
|
Balance at June 30, 2018 |
|
18,682,338 |
|
$ |
187 |
|
$ |
114,052 |
|
$ |
(61,717) |
|
$ |
52,522 |
|
The notes form an integral part of the consolidated financial statements.
F-4
MCBC HOLDINGS, INC. AND SUBSIDIARIES
CONSOLIDATED STATEMENTS OF CASH FLOWS
(Dollars amounts in thousands, except share and per share data)
|
|
|
For the Years Ended June 30, |
|
|||||||
|
|
|
2018 |
|
2017 |
|
2016 |
|
|||
|
CASH FLOWS FROM OPERATING ACTIVITIES: |
|
|
|
|
|
|
|
|
|
|
|
Net income |
|
$ |
39,653 |
|
$ |
19,570 |
|
$ |
10,210 |
|
|
Adjustments to reconcile net income to net cash provided by operating activities: |
|
|
|
|
|
|
|
|
|
|
|
Depreciation and amortization |
|
|
5,086 |
|
|
3,231 |
|
|
3,444 |
|
|
Inventory obsolescence reserve |
|
|
281 |
|
|
399 |
|
|
359 |
|
|
Amortization of deferred issuance costs |
|
|
496 |
|
|
361 |
|
|
109 |
|
|
Stock-based compensation |
|
|
1,186 |
|
|
711 |
|
|
13,687 |
|
|
Loss on extinguishment of debt |
|
|
— |
|
|
— |
|
|
716 |
|
|
Change in common stock warrant fair value |
|
|
— |
|
|
— |
|
|
3,425 |
|
|
Change in interest rate cap fair value |
|
|
(435) |
|
|
— |
|
|
— |
|
|
Unrecognized tax benefits |
|
|
(1,199) |
|
|
743 |
|
|
1,670 |
|
|
Deferred income taxes |
|
|
557 |
|
|
4,454 |
|
|
(3,923) |
|
|
Net provision of doubtful accounts |
|
|
(31) |
|
|
17 |
|
|
(27) |
|
|
Loss on disposal of fixed assets |
|
|
— |
|
|
10 |
|
|
1 |
|
|
|
|
|
|
|
|
|
|
|
|
|
|
Changes in operating assets and liabilities: |
|
|
|
|
|
|
|
|
|
|
|
Accounts receivable |
|
|
(211) |
|
|
(551) |
|
|
(286) |
|
|
Inventories |
|
|
(2,754) |
|
|
1,193 |
|
|
(2,086) |
|
|
Prepaid expenses and other current assets |
|
|
(763) |
|
|
(658) |
|
|
3,348 |
|
|
Income tax receivable |
|
|
— |
|
|
5 |
|
|
(5) |
|
|
Other assets |
|
|
39 |
|
|
45 |
|
|
(45) |
|
|
Accounts payable |
|
|
2,847 |
|
|
(2,104) |
|
|
(1,697) |
|
|
Income tax payable |
|
|
(75) |
|
|
(328) |
|
|
884 |
|
|
Accrued expenses and other current liabilities |
|
|
4,720 |
|
|
(866) |
|
|
963 |
|
|
Net cash provided by operating activities |
|
|
49,397 |
|
|
26,232 |
|
|
30,747 |
|
|
|
|
|
|
|
|
|
|
|
|
|
|
CASH FLOWS FROM INVESTING ACTIVITIES: |
|
|
|
|
|
|
|
|
|
|
|
Disposal of assets |
|
|
96 |
|
|
— |
|
|
— |
|
|
Payment for acquisition, net of cash acquired |
|
|
(80,511) |
|
|
— |
|
|
— |
|
|
Purchases of property and equipment |
|
|
(5,305) |
|
|
(4,135) |
|
|
(3,817) |
|
|
Net cash used in investing activities |
|
|
(85,720) |
|
|
(4,135) |
|
|
(3,817) |
|
|
|
|
|
|
|
|
|
|
|
|
|
|
CASH FLOWS FROM FINANCING ACTIVITIES: |
|
|
|
|
|
|
|
|
|
|
|
Proceeds from issuance of common stock |
|
|
— |
|
|
— |
|
|
91,071 |
|
|
Proceeds from issuance of long-term debt |
|
|
80,832 |
|
|
— |
|
|
50,000 |
|
|
Payments of costs directly associated with offerings |
|
|
— |
|
|
(449) |
|
|
(7,202) |
|
|
Cash paid for withholding taxes on vested stock |
|
|
(78) |
|
|
(4) |
|
|
— |
|
|
Excess tax benefits |
|
|
— |
|
|
312 |
|
|
— |
|
|
Principal payments on long-term debt |
|
|
(39,320) |
|
|
(14,865) |
|
|
(71,250) |
|
|
Proceeds from revolving line of credit |
|
|
— |
|
|
— |
|
|
9,208 |
|
|
Payments on revolving line of credit |
|
|
— |
|
|
(3,126) |
|
|
(14,271) |
|
|
Repurchase and retirement of common stock |
|
|
— |
|
|
— |
|
|
(4,502) |
|
|
Payments of debt discount |
|
|
— |
|
|
— |
|
|
(923) |
|
|
Payments of deferred issuance costs |
|
|
(1,240) |
|
|
— |
|
|
(300) |
|
|
Dividends paid |
|
|
— |
|
|
— |
|
|
(79,945) |
|
|
Proceeds from exercise of common stock warrant |
|
|
— |
|
|
— |
|
|
90 |
|
|
Net cash provided by (used in) financing activities |
|
|
40,194 |
|
|
(18,132) |
|
|
(28,024) |
|
|
NET CHANGE IN CASH AND CASH EQUIVALENTS |
|
|
3,871 |
|
|
3,965 |
|
|
(1,094) |
|
|
|
|
|
|
|
|
|
|
|
|
|
|
CASH AND CASH EQUIVALENTS — BEGINNING OF PERIOD |
|
|
4,038 |
|
|
73 |
|
|
1,167 |
|
|
CASH AND CASH EQUIVALENTS — END OF PERIOD |
|
$ |
7,909 |
|
$ |
4,038 |
|
$ |
73 |
|
|
SUPPLEMENTAL DISCLOSURES OF CASH FLOW INFORMATION: |
|
|
|
|
|
|
|
|
|
|
|
Cash payments for interest |
|
$ |
2,976 |
|
$ |
2,006 |
|
$ |
397 |
|
|
Cash payments for income taxes |
|
$ |
13,549 |
|
$ |
6,541 |
|
|
9,635 |
|
|
SIGNIFICANT NON-CASH INVESTING AND FINANCING ACTIVITIES: |
|
|
|
|
|
|
|
|
|
|
|
Capital expenditures in accounts payable and accrued expenses |
|
|
733 |
|
|
— |
|
|
— |
|
|
Payment of costs directly associated with the issuance of common stock |
|
|
— |
|
|
— |
|
|
2,107 |
|
|
Issuance of shares of common stock warrants |
|
$ |
— |
|
$ |
— |
|
$ |
12,572 |
|
The notes form an integral part of the consolidated financial statements.
F-5
MCBC HOLDINGS, INC. AND SUBSIDIARIES
NOTES TO CONSOLIDATED FINANCIAL STATEMENTS
(Dollars in thousands, except per share data and per unit data)
1.ORGANIZATION AND NATURE OF BUSINESS
MCBC Holdings, Inc. (the “Company”) was formed on January 28, 2000, as a Delaware holding company and operates primarily through its wholly owned subsidiaries, MasterCraft Boat Company, LLC; Nautic Star, LLC; NS Transport, LLC; Navigator Marine, LLC; MasterCraft Services, Inc.; MasterCraft Parts, Ltd.; and MasterCraft International Sales Administration, Inc. The Company and its subsidiaries collectively are referred to herein as the “Company”.
On October 2, 2017, the Company acquired all of the outstanding membership interests and other equity securities of Nautic Star, LLC, a Mississippi limited liability company and its subsidiaries (collectively, “NauticStar”). As a result of the acquisition, the Company consolidates the financial results of NauticStar (see Note 4). Since that date, the Company reports its results of operations under two reportable segments: MasterCraft and NauticStar (see Note 17).
The Company is a designer and manufacturer of premium inboard tournament ski boats and luxury performance V-drive runabouts under the MasterCraft brand and outboard salt water fishing and general recreational boats under the NauticStar brand. The Company also leases a parts warehouse in the United Kingdom to expedite service, primarily to MasterCraft dealers and customers in Europe.
2.BASIS OF PRESENTATION
The accompanying financial statements are prepared in accordance with accounting principles generally accepted in the United States of America (“U.S. GAAP”). The consolidated financial statements include the accounts of the Company and its wholly owned subsidiaries.
3.SIGNIFICANT ACCOUNTING POLICIES
Principles of Consolidation — The consolidated financial statements include the accounts of the Company and its wholly owned subsidiaries. All significant intercompany accounts and transactions have been eliminated in consolidation.
Immaterial Correction of Error — During the fourth quarter of fiscal 2018, the Company recorded an out of period adjustment that effected the Consolidated Statement of Operations for the year ended June 30, 2018. The adjustment related to improperly projecting warranty claims based on part sales rather than part costs. The impact of this adjustment resulted in an increase net income of $1,033 for the fiscal year ended June 30, 2018, with a corresponding decrease in accrued expenses and other current liabilities on the consolidated balance sheet as of June 30, 2018.
Management evaluated the effect of the adjustment on the Company’s financial statements under the provision of ASC 250: Accounting Changes and Error Corrections and Staff Accounting Bulletin No. 108: Considering the Effects of Prior Year Misstatements When Quantifying Misstatements in Current Year Financial Statements and concluded that it was immaterial to the current year and prior years’ annual and quarterly financial statements.
Use of Estimates — The preparation of the Company’s consolidated financial statements in conformity with U.S. GAAP requires management to make estimates and assumptions that affect the reported amounts of assets, liabilities, sales, and
F-6
MCBC HOLDINGS, INC. AND SUBSIDIARIES
NOTES TO CONSOLIDATED FINANCIAL STATEMENTS - (Continued)
(Dollars in thousands, except per share data and per unit data)
expenses and related disclosures. The Company bases these estimates on historical results and various other assumptions believed to be reasonable. The Company’s most significant financial statement estimates include allowances for bad debts, warranty liability, inventory allowance for obsolescence, self-insurance liability, fair value of stock-based compensation, inventory repurchase contingent obligation, uncertain tax positions, impairment of long-lived assets and intangibles subject to amortization, impairment of goodwill and indefinite-lived intangibles, and potential litigation claims and settlements. Actual results could differ from those estimates.
Revenue Recognition — The Company’s revenue is derived primarily from the sale of boats, marine parts, and accessories. Revenue is recognized in accordance with the terms of the sale, primarily upon shipment to customers, once the sales price is fixed or determinable and collectability is reasonably assured. The Company offers discounts and sales incentives that include retail promotions, rebates, and floor plan reimbursement costs that are recorded as reductions of revenues in net sales in the consolidated statements of operations. The estimated liability and reduction in revenue for sales incentives is recorded at the later of when the program has been communicated to the customer or at the time of sale.
Dealers generally have no rights to return unsold boats. Occasionally, the Company may accept returns in limited circumstances and at the Company’s discretion under its warranty policy (Note 9). The Company may be obligated, in the event of default by a dealer, to accept returns of unsold boats under its repurchase commitment to floor financing providers, who are able to obtain such boats through foreclosure. The Company accrues estimated losses when a loss, due to the default of one of its dealers, is determined to be probable and the amount of the loss is reasonably estimable.
Dealer Incentives
The Company provides for various structured dealer rebate and sales promotions incentives, which are recognized as a reduction in net sales, at the time of sale to the dealer. Dealer rebate and sales promotions incentives are based on actual wholesale rebate and applicable sales promotion expenses at the time of sale to the dealer. Examples of such programs include seasonal discounts, volume commitment rebates and other allowances. Dealer rebate and sales promotion incentives recorded during the years ended June 30, 2018, 2017, and 2016, were $6,361, $5,660 and $6,701, respectively.
Rebates may apply to boats already in dealer inventory. These “retail rebates” on boats in the dealer’s inventory are recorded when the rebate is communicated to the dealer. Retail rebates are estimated based on current programs and historical achievement and/or usage rates. Actual results may differ from these estimates if market conditions dictate the need to enhance or reduce sales promotion and incentive programs or if dealer achievement or other items vary from historical trends. Retail rebates recorded during the years ended June 30, 2018, 2017, and 2016, were $1,932, $5,484 and $3,628, respectively.
Accrued rebates are included in accrued expenses and other current liabilities in the accompanying consolidated balance sheets.
F-7
MCBC HOLDINGS, INC. AND SUBSIDIARIES
NOTES TO CONSOLIDATED FINANCIAL STATEMENTS - (Continued)
(Dollars in thousands, except per share data and per unit data)
Floor Plan Reimbursement Costs
The Company participates in various programs whereby it agrees to reimburse its dealers for certain floor plan interest costs incurred by such dealers for limited periods of time, ranging up to nine months. Such costs are included as a reduction in net sales in the consolidated statements of operations and totaled $5,143, $3,705 and $3,472 for the years ended June 30, 2018, 2017, and 2016, respectively.
Shipping and Handling Costs — The Company includes shipping and handling costs billed to customers in net sales in the consolidated statements of operations. The Company includes costs incurred to transport product to customers and internal handling costs, which relate to activities to prepare goods for shipment, in cost of sales. For the years ended June 30, 2018, 2017, and 2016, shipping and handling costs billed to customers totaled $4,774, $4,124 and $4,043, respectively, and shipping and handling costs included in cost of sales totaled $5,526, $3,584 and $3,952, respectively.
Accounts Receivable — Accounts receivable represents amounts billed to customers under credit terms customary in its industry. The Company normally does not charge interest on its accounts receivable. The Company determines its allowance for doubtful accounts by considering a number of factors, including the length of time trade accounts receivable are past due, the Company’s previous loss history, the customer’s current ability to pay its obligation to the Company, and the condition of the general economy and the industry as a whole. The Company writes-off accounts receivable when they become uncollectible, and payments subsequently received on such receivables are credited to bad debt recovery.
Cash and Cash Equivalents — The Company considers all highly-liquid investments with an original maturity of three months or less to be cash and cash equivalents. The Company’s cash deposits are in financial institutions located in Tennessee, Mississippi and Ohio and may at times exceed federally insured amounts. The Company had no cash equivalents at June 30, 2018 and 2017.
Concentrations of Credit and Business Risk — Financial instruments that potentially subject the Company to concentrations of credit risk primarily consist of trade receivables. Credit risk on trade receivables is mitigated as a result of the Company’s use of trade letters of credit, dealer floor plan financing arrangements, and the geographically diversified nature of the Company’s customer base.
The Company is dependent on third-party equipment manufacturers, distributors, and dealers for certain parts and materials utilized in the manufacturing process. In 2018, 2017, and 2016 the Company purchased all engines for its MasterCraft boats under a supply agreement with one vendor. Total purchases to this vendor were $34,734, $31,075 and $31,232 for 2018, 2017, and 2016, respectively. Total accounts payable to this vendor were $3,227 and $2,291 as of June 30, 2018 and 2017 respectively. In 2018, the Company purchased engines for its NauticStar boats under a supply agreement with one vendor. Total purchases to this vendor were $19,668 for 2018. Total accounts payable to this vendor were $1,261 as of June 30, 2018. The Company is dependent on the ability of its suppliers to provide products on a timely basis and on favorable pricing terms. The loss of certain principal suppliers or a significant reduction in product availability from principal suppliers could have a material adverse effect on the Company. Business risk insurance is in place to mitigate the business risk associated with sole suppliers for sudden disruptions such as those caused by natural disasters.
F-8
MCBC HOLDINGS, INC. AND SUBSIDIARIES
NOTES TO CONSOLIDATED FINANCIAL STATEMENTS - (Continued)
(Dollars in thousands, except per share data and per unit data)
Inventories — Inventories are valued at the lower of cost or market and are shown net of an inventory allowance in the balance sheet. Inventory cost includes material, labor, and manufacturing overhead and is determined based on the first-in, first-out (FIFO) method. Provisions are made as necessary to reduce inventory amounts to their net realizable value or to provide for obsolete products.
Property, Plant, and Equipment — Property, plant, and equipment are recorded at historical cost less accumulated depreciation, and depreciated on a straight-line basis over the estimated useful lives. Repairs and maintenance are charged to operations as incurred, and expenditures for additions and improvements that increase the asset’s useful life are capitalized.
Ranges of asset lives used for depreciation purposes are:
|
Buildings and improvements |
|
7 |
- |
40 |
years |
|
|
Machinery and equipment |
|
3 |
- |
7 |
years |
|
|
Furniture and fixtures |
|
3 |
- |
7 |
years |
|
Goodwill and Other Intangible Assets — The Company does not amortize goodwill and other purchased intangible assets with indefinite lives. All of the Company’s goodwill and intangible assets relate to either our MasterCraft or NauticStar reporting unit (see Note 17). The Company’s intangible assets with finite lives consist of dealer networks, and are carried at their estimated fair values at the time of acquisition, less accumulated amortization. Amortization is recognized on a straight-line basis over the estimated useful lives of the respective assets (see Note 8). Intangible assets that are subject to amortization are evaluated for impairment using a process similar to that used to evaluate long-lived assets described below.
Impairment of Goodwill and Other Indefinite-Lived Intangible Assets — As the acquisition of NauticStar added a new reporting unit, the Company performed a quantitative assessment of goodwill for the year ended June 30, 2018 to determine if it was more likely than not that the fair value of a reporting unit was less than its carrying amount. The Company performed a qualitative assessment of other indefinite-lived intangible assets for the year ended June 30, 2018 to determine if it was more likely than not that the fair value of a reporting unit was less than its carrying amount. The Company performed a qualitative assessment of goodwill and other indefinite-lived intangible assets for the years ended June 30, 2017 and 2016 to determine if it was more likely than not that the fair value of a reporting unit was less than its carrying amount. Based on the Company’s quantitative assessment of goodwill as of June 30, 2018 and qualitative assessments for the years ended June 30, 2018, 2017, and 2016, it was determined that there was no impairment related to its intangible assets during the years ended June 30, 2018, 2017, and 2016. These assets are reviewed for impairment at least annually and whenever events or changes in circumstances indicate that the carrying value may not be recoverable.
Impairment of Long-Lived Assets Other Than Indefinite-Lived Assets — The Company assesses the potential for impairment of its long- lived assets if facts and circumstances, such as declines in sales, earnings, or cash flows or adverse changes in the business climate, suggest that they may be impaired. The Company performs its review by comparing the book value of the assets to the estimated future undiscounted cash flows associated with the assets. If any impairment in the carrying value of its long-lived assets is indicated, the assets would be adjusted to an estimate of fair value. The
F-9
MCBC HOLDINGS, INC. AND SUBSIDIARIES
NOTES TO CONSOLIDATED FINANCIAL STATEMENTS - (Continued)
(Dollars in thousands, except per share data and per unit data)
Company did not evaluate its long-lived assets for impairment as of June 30, 2018 and 2017 as no triggering event occurred.
Income Taxes — Income tax expense is the total of the current year income tax due or refundable and the change in deferred tax assets and liabilities. The Company records its global tax provision based on the respective tax rules and regulations for the jurisdictions in which it operates. Deferred tax assets and liabilities are the expected future tax amounts for the temporary differences between carrying amounts and tax bases of assets and liabilities, computed using enacted tax rates.
Valuation allowances are recorded to reduce deferred tax assets when it is more likely than not that a tax benefit will not be realized. Significant judgment is required in evaluating the need for and magnitude of appropriate valuation allowances against deferred tax assets. The realization of these assets is dependent on generating future taxable income.
A tax position is recognized as a benefit only if it is “more likely than not” that the tax position would be sustained in a tax examination, with a tax examination being presumed to occur. The amount recognized is the largest amount of tax benefit that is greater than 50% likely of being realized on examination. For tax positions not meeting the “more likely than not” test, no tax benefit is recorded.
The Company recognizes interest and/or penalties related to income tax matters in income tax expense.
In determining the amount of current and deferred tax the Company takes into account the impact of uncertain tax positions and whether additional taxes, interest and penalties may be due. The Company believes that its accruals for tax liabilities are adequate for all open tax years based on its assessment of many factors, including interpretations of tax law and prior experience. This assessment relies on estimates and assumptions and may involve a series of judgments about future events. New information may become available that causes the Company to change its judgment regarding the adequacy of existing tax liabilities; such changes to tax liabilities will have an impact on tax expense in the period that such a determination is made. The income tax effects of the differences we identify are classified as long-term deferred tax assets and liabilities in our Consolidated Balance Sheets as of June 30, 2018 and June 30, 2017, following the adoption of ASU 2015-17, Income Taxes during the year ended June 30, 2016.
Product Warranties — The Company offers warranties on the sale of certain products for a period of up to five years for its MasterCraft branded products and up to one year for its NauticStar branded products and records an accrual for estimated future claims. Such accruals are based upon historical experience and management’s estimates of the level of future claims, and are subject to adjustment as actual claims are determined or as changes in the obligations become reasonably estimable. Such costs are included in cost of sales in the consolidated statements of operations.
Research and Development — Research and development expenditures are expensed as incurred. The amount charged against the years ended June 30, 2018, 2017, and 2016 was $4,933, $3,550 and $3,508, respectively, and is included in operating expenses in the consolidated statements of operations.
F-10
MCBC HOLDINGS, INC. AND SUBSIDIARIES
NOTES TO CONSOLIDATED FINANCIAL STATEMENTS - (Continued)
(Dollars in thousands, except per share data and per unit data)
Self-Insurance — The Company is self-insured for certain losses relating to product liability claims and employee medical claims. The Company has purchased stop-loss coverage in order to limit its exposure to any significant levels under these plans. Losses are accrued based upon the Company’s estimates of the aggregate liability for self-insured claims incurred using certain actuarial assumptions followed in the insurance industry and the Company’s historical experience.
Deferred Financing Costs — Certain costs incurred to obtain financing are capitalized and amortized over the term of the related debt using the effective interest method. For the years ended June 30, 2018, 2017, and 2016 the Company incurred deferred financing costs of $1,240, —, and $300, respectively. For the year ended June 30, 2017 the Company did not incur any deferred financing costs. For the years ended June 30, 2018, 2017, and 2016 the Company recorded amortization of $496, $361 and $85, respectively.
Stock-Based Compensation — Compensation cost is recognized for stock options issued to employees, based on the fair value of these awards at the date of grant. The Black-Scholes model is utilized to estimate the fair value of stock options. Compensation cost is recognized over the required service period, generally defined as the vesting period. For awards with graded vesting, compensation cost is recognized on a straight-line basis over the requisite service period for the entire award.
Advertising — Advertising costs are expensed as incurred. The amount charged against operations during the years ended June 30, 2018, 2017, and 2016, was $6,787, $5,201 and $5,725, respectively, and is included in selling and marketing expenses in the consolidated statements of operations.
Fair Value Measurements — The Company measures its “financial” assets and liabilities and certain “non-financial” assets and liabilities at fair value and utilizes the established framework for measuring fair value and disclosing information about fair value measurements. Fair value is the price received to transfer an asset or paid to transfer a liability in an orderly transaction between market participants at the measurement date. Measuring fair value involves a hierarchy of valuation inputs used to measure fair value. This hierarchy prioritizes the inputs into three broad levels as follows: Level 1 inputs are quoted prices (unadjusted) in active markets for identical assets or liabilities; Level 2 inputs are quoted prices for similar assets and liabilities in active markets or inputs that are observable for the asset or liability, either directly or indirectly; and, Level 3 inputs are unobservable inputs in which little or no market data exists, therefore requiring a company to develop its own valuation assumptions.
Fair Value of Financial Instruments — The carrying amounts of the Company’s financial instruments, consisting of cash and cash equivalents, accounts receivable, accounts payable and other liabilities, approximate their estimated fair values due to the relative short-term nature of the amounts. The carrying amount of debt approximates fair value due to variable interest rates at customary terms and rates the Company could obtain in current financing.
Repurchase Commitments — In connection with its dealers’ wholesale floor-plan financing of boats, the Company has entered into repurchase agreements with various lending institutions. The repurchase commitment is on an individual unit basis with a term from the date it is financed by the lending institution through the payment date by the dealer, generally not exceeding two and a half years. The Company accrues estimated losses for obligations to repurchase inventory repossessed from dealerships by financial institutions when it is probable that a loss has been incurred and the amount of
F-11
MCBC HOLDINGS, INC. AND SUBSIDIARIES
NOTES TO CONSOLIDATED FINANCIAL STATEMENTS - (Continued)
(Dollars in thousands, except per share data and per unit data)
loss is reasonably estimable. The Company has applied these provisions to its floor plan repurchase agreements as disclosed in Notes 9 and 14.
Earnings Per Common Share — Basic earnings per common share reflects reported earnings divided by the weighted average number of common shares outstanding. Diluted earnings per common share include the effect of dilutive stock options and warrant and the respective tax benefits, unless inclusion would not be dilutive.
Operating Leases — The Company leases warehouse space and equipment under operating lease arrangements. Lease agreements may include rent holidays, rent escalation clauses, and tenant improvement allowances. The Company recognizes scheduled rent increases on a straight-line basis over the lease term beginning with the date the Company takes possession of the leased space.
Segment Information — Operating segments are identified as components of an enterprise about which discrete financial information is available for evaluation by the chief operating decision maker in making decisions on how to allocate resources and assess performance. The Company views its operations in two operating segments based on product brand consisting of the MasterCraft brand and the NauticStar brand.
New Accounting Pronouncements Issued But Not Yet Adopted
In June 2018, the Financial Accounting Standards Board (the “FASB”) issued ASU 2018-07, Compensation—Stock Compensation (Topic 718): Improvements to Nonemployee Share-Based Payment Accounting. This guidance provides clarity and reduces complexity when applying the guidance in Topic 718, Compensation—Stock Compensation to the term or condition of share-based payments to nonemployees. ASU 2018-07 is effective for annual reporting periods, and interim periods therein, beginning after December 15, 2018. The Company is currently evaluating the effect that the adoption of this new guidance is expected to have on our financial position or results of operations and related disclosures. This guidance will be adopted for our fiscal year beginning July 1, 2019.
In May 2017, the FASB issued ASU 2017-09, Compensation—Stock Compensation (Topic 718): Scope of Modification Accounting. This guidance provides clarity and reduces complexity when applying the guidance in Topic 718, Compensation—Stock Compensation to a change to the term or condition of a share-based payment. ASU 2017-09 is effective for annual reporting periods, and interim periods therein, beginning after December 15, 2017. This guidance will not have a material impact on our financial position or results of operations and related disclosures and was adopted for our fiscal year beginning July 1, 2018.
In January 2017, the FASB issued ASU 2017-01, Business Combinations (Topic 805): Clarifying the Definition of a Business. The guidance clarifies the definition of a business that provides a two-step analysis in the determination of whether an acquisition or derecognition is a business or an asset. The update removes the evaluation of whether a market participant could replace any missing elements and provides a framework to assist entities in evaluating whether both an input and a substantive process are present. This guidance is effective for annual reporting periods beginning after December 15, 2017, including interim periods within those annual reporting periods and early adoption is permitted for transactions that meet specified criteria. This guidance is to be applied on a prospective basis for transactions that occur
F-12
MCBC HOLDINGS, INC. AND SUBSIDIARIES
NOTES TO CONSOLIDATED FINANCIAL STATEMENTS - (Continued)
(Dollars in thousands, except per share data and per unit data)
after the effective date. This guidance will not have a material impact on our financial position or results of operations and related disclosures and was adopted for our fiscal year beginning July 1, 2018.
In January 2017, the FASB issued ASU 2017-04, Intangibles—Goodwill and Other (Topic 350): Simplifying the Test for Goodwill Impairment. This guidance eliminates Step 2 from the goodwill impairment test. Instead, an entity should recognize an impairment charge for the amount by which the carrying value exceeds the reporting unit’s fair value, not to exceed the total amount of goodwill allocated to that reporting unit. ASU 2017-04 is effective for annual reporting periods, and interim periods therein, beginning after December 15, 2019. The Company is currently evaluating the effect that the adoption of this new guidance is expected to have on our financial position or results of operations and related disclosures.
In May 2014, the FASB and International Accounting Standards Board jointly issued ASU 2014-09, Revenue from Contracts with Customers (Topic 606), which includes new principles-based accounting guidance for revenue recognition that will supersede virtually all existing revenue guidance. The core principle of this guidance is that an entity should recognize revenue to depict the transfer of promised goods or services to customers in an amount that reflects the consideration to which the entity expects to be entitled in exchange for those goods and services. To achieve the core principle, the guidance establishes the following five steps: 1) identify the contract(s) with a customer, 2) identify the performance obligation in the contract, 3) determine the transaction price, 4) allocate the transaction price to the performance obligations in the contract, and 5) recognize revenue when (or as) the entity satisfies a performance obligation. The guidance also details the accounting treatment for costs to obtain or fulfill a contract. Lastly, disclosure requirements have been enhanced to provide sufficient information to enable users of financial statements to understand the nature, amount, timing, and uncertainty of revenue and cash flows arising from contracts with customers. ASU 2014-09, as amended, became effective for the Company on July 1, 2018.
The Company will use the modified retrospective approach in applying the new standard. Based on the Company’s assessment, it will continue to recognize revenue at the point in time at which control transfers to its customers (either upon shipment or upon delivery, depending on the contract terms). As such, the timing of revenue recognition will be largely consistent for the majority of the Company’s performance obligations. However, the Company expects an impact from the new standard for dealers who are offered retail promotions which are currently recorded at the later of when the program has been communicated to the dealer or at the time of sale. Under the new standard, the Company will recognize an estimate of these retail promotions as variable consideration at the time of sale to a dealer. As a result, the Company will have a change in the timing of recording retail promotions and rebates. Although we are still finalizing the impact to retained earnings as of June 30, 2018, we expect the total range of adjustment, after the effect of taxes, to be a decrease to retained earnings of $2.5 million to $3.5 million. The Company is still assessing potential impacts the new standard will have on its disclosures.
In August 2016, the FASB issued ASU 2016-15, Classification of Certain Cash Receipts and Cash Payments. ASU 2016-15 addresses how certain cash receipts and cash payments are presented and classified in the statement of cash flows under Topic 230, Statement of Cash Flow, and other Topics. ASU 2016-15 is effective for annual reporting periods, and interim periods therein, beginning after December 15, 2017. This guidance will not have a material impact on our financial position or results of operations and related disclosures and was adopted for our fiscal year beginning July 1, 2018.
F-13
MCBC HOLDINGS, INC. AND SUBSIDIARIES
NOTES TO CONSOLIDATED FINANCIAL STATEMENTS - (Continued)
(Dollars in thousands, except per share data and per unit data)
In February 2016, the FASB issued ASU 2016-02, Leases (Topic 842). This guidance establishes a right-of-use (“ROU”) model that requires a lessee to record a ROU asset and a lease liability on the balance sheet for all leases with terms longer than 12 months. Leases will be classified as either finance or operating, with classification affecting the pattern of expense recognition in the income statement. The new standard is effective for fiscal years beginning after December 15, 2018, including interim periods within those fiscal years. A modified retrospective transition approach is required for lessees for capital and operating leases existing at, or entered into after, the beginning of the earliest comparative period presented in the financial statements, with certain practical expedients available. The Company is currently evaluating the impact this new guidance is expected to have on its financial position or results of operations and related disclosures.
New Accounting Pronouncements Issued And Adopted
In March 2016, the FASB issued ASU 2016-09, Compensation – Stock Compensation (Topic 718): Improvements to Employee Share-Based Payment Accounting. This guidance identifies areas for simplification involving several aspects of accounting for share-based payment transactions, including the income tax consequences, classification of awards as either equity or liabilities, an option to recognize gross stock compensation expense with actual forfeitures recognized as they occur, as well as certain classifications on the statement of cash flows. This ASU is effective for annual reporting periods beginning after December 15, 2016, and interim periods within those annual periods with early adoption permitted. This guidance does not have a material impact on our financial position or results of operations and related disclosures and was adopted for our fiscal year beginning July 1, 2017.
In July 2015, the FASB issued ASU 2015-11, Simplifying the Measurement of Inventory. This ASU changes the measurement principle for inventories valued under the FIFO or weighted-average methods from the lower of cost or market to the lower of cost and net realizable value. Net realizable value is defined by the FASB as estimated selling prices in the ordinary course of business, less reasonably predictable costs of completion, disposal and transportation. This ASU is effective for annual reporting periods beginning after December 15, 2016, and interim periods within those annual periods with early adoption permitted. This guidance does not have a material impact on our financial position or results of operations and related disclosures and was adopted for our fiscal year beginning July 1, 2017.
There are no other recently issued accounting pronouncements that are expected to have a material impact on our financial position or results of operations and related disclosures.
4. ACQUISITION
On October 2, 2017, the Company completed its acquisition of NauticStar which unites two leading and complementary boat brands and adds to its product diversity. The purchase price was $80,511, including customary adjustments for the amount of working capital in the acquired business at the closing date. A portion of the purchase price was deposited into an escrow account in order to secure certain post-closing obligations of the former members of NauticStar. The Company accounted for the transaction using the acquisition method in accordance with ASC 805, Business Combinations.
The total consideration has been allocated to the assets acquired and liabilities assumed based on estimates of their fair values as of the date of acquisition. The Company has recorded the tangible and intangible assets acquired and liabilities
F-14
MCBC HOLDINGS, INC. AND SUBSIDIARIES
NOTES TO CONSOLIDATED FINANCIAL STATEMENTS - (Continued)
(Dollars in thousands, except per share data and per unit data)
assumed based on their fair values as of October 2, 2017. The measurements of fair value were based upon estimates utilizing the assistance of third party valuation specialists.
The following table summarizes the purchase price allocation based on the estimated fair values of the assets acquired and liabilities assumed of NauticStar at the acquisition date:
|
Purchase Price: |
|
|
|
|
Cash paid, net of cash acquired |
$ |
80,511 |
|
|
Recognized amounts of identifiable assets acquired and (liabilities assumed), at fair value: |
|
|
|
|
Accounts receivable |
$ |
1,773 |
|
|
Inventories |
|
6,358 |
|
|
Other current assets |
|
94 |
|
|
Indemnification asset |
|
166 |
|
|
Deferred income taxes |
|
83 |
|
|
Property, plant and equipment |
|
4,945 |
|
|
Identifiable intangible assets |
|
36,000 |
|
|
Current liabilities |
|
(4,858) |
|
|
Unrecognized tax positions |
|
(249) |
|
|
Fair value of assets acquired and liabilities assumed |
|
44,312 |
|
|
Goodwill |
|
36,199 |
|
|
|
$ |
80,511 |
|
The fair value estimates for the Company’s identifiable intangible assets acquired as part of the acquisition are as follows:
|
|
Estimates of Fair Value |
|
Estimated Useful Life (in years) |
||
|
Definite-lived intangible: |
|
|
|
|
|
|
Dealer network |
$ |
20,000 |
|
|
10 |
|
Indefinite-lived intangible: |
|
|
|
|
|
|
Trade name |
|
16,000 |
|
|
|
|
Total identifiable intangible assets |
$ |
36,000 |
|
|
|
The value allocated to inventories reflects the fair value of the acquired inventory based on the sales price of the inventory, less cost to complete and a reasonable profit margin. The value allocated to accounts receivable represents the fair value of the acquired receivables based on the expected collection of those receivables. The fair value of the identifiable intangible assets were determined based on the following approaches:
|
· |
Dealer Network - The value associated with NauticStar’s dealer network is attributed to its long standing dealer distribution network. The estimate of fair value assigned to this asset was determined using the income approach, which requires an estimate or forecast of the expected future cash flows from the dealer network through the application of the multi-period excess earnings approach. The estimated remaining useful life of dealer network is approximately ten years. |
F-15
MCBC HOLDINGS, INC. AND SUBSIDIARIES
NOTES TO CONSOLIDATED FINANCIAL STATEMENTS - (Continued)
(Dollars in thousands, except per share data and per unit data)
|
· |
Trade Name - The value attributed to NauticStar’s trade name was determined using the relief from royalty method, a variation of the income approach, which requires an estimate or forecast of the expected future cash flows. The trade name has an indefinite life. |
The fair value of the definite-lived intangible asset is being amortized using the straight-line method to amortization of intangible assets expense over the estimated useful life. Indefinite-lived intangible assets are not amortized, but instead are evaluated for potential impairment on an annual basis in accordance with the provisions of ASC Topic 350, Intangibles—Goodwill and Other. The weighted average useful life of identifiable definite-lived intangible assets acquired was 10 years. Goodwill of $36,199 arising from the acquisition consists of future growth prospects including dealer expansion into new geographic markets and capacity expansion as well as intangible assets that do not qualify for separate recognition such as an assembled workforce. The indefinite-lived intangible asset and goodwill acquired are expected to be deductible for income tax purposes.
The value allocated to property, plant and equipment reflects the fair value of the acquired property, plant and equipment using a combination of the income, cost, and market approaches, which are primarily based on significant Level 2 and Level 3 assumptions, such as estimates of absorption period, lease-up costs, market rent, operating expenses, and terminal capitalization and discount rates.
Acquisition related costs of $1,486, which were incurred by the Company during the fiscal year ended June 30, 2018, were expensed during the period, and are included in general and administrative expenses in the consolidated statement of operations.
Pro Forma Financial Information:
The following unaudited pro forma consolidated results of operations for the fiscal year ended June 30, 2018, June 30, 2017 and June 30, 2016, assumes that the acquisition of NauticStar occurred as of July 1, 2016. The unaudited pro forma financial information combines historical results of MasterCraft and NauticStar, with adjustments for depreciation and amortization attributable to preliminary fair value estimates on acquired tangible and intangible assets for the respective periods. Non-recurring pro forma adjustments associated with the fair value step up of inventory were included in the reported pro forma cost of sales and earnings. The unaudited pro forma financial information is presented for informational purposes only and is not indicative of the results of operations that would have been achieved if the acquisition had taken place at the beginning of fiscal year 2016 or the results that may occur in the future:
|
|
Fiscal Years Ended |
|||||||
|
|
2018 |
|
2017 |
|
2016 |
|||
|
Net sales |
$ |
350,794 |
|
$ |
305,505 |
|
$ |
285,321 |
|
Net income |
$ |
41,802 |
|
$ |
22,592 |
|
$ |
10,327 |
|
Basic earnings per share |
$ |
2.25 |
|
$ |
1.22 |
|
$ |
0.58 |
|
Diluted earnings per share |
$ |
2.23 |
|
$ |
1.21 |
|
$ |
0.57 |
F-16
MCBC HOLDINGS, INC. AND SUBSIDIARIES
NOTES TO CONSOLIDATED FINANCIAL STATEMENTS - (Continued)
(Dollars in thousands, except per share data and per unit data)
5.INVENTORIES
Inventories at June 30, 2018 and 2017 consisted of the following:
|
|
|
2018 |
|
2017 |
|
||
|
Raw materials and supplies |
|
$ |
9,587 |
|
$ |
7,164 |
|
|
Work in process |
|
|
2,822 |
|
|
1,772 |
|
|
Finished goods |
|
|
9,026 |
|
|
3,427 |
|
|
Obsolescence reserve |
|
|
(968) |
|
|
(687) |
|
|
Total inventories |
|
$ |
20,467 |
|
$ |
11,676 |
|
Activity in the obsolescence reserve was as follows for the years ended June 30, 2018 and 2017:
|
|
|
2018 |
|
2017 |
|
||
|
Beginning balance |
|
$ |
(687) |
|
$ |
(332) |
|
|
Additions for NauticStar acquisition |
|
|
(39) |
|
|
— |
|
|
Charged to costs and expenses |
|
|
(462) |
|
|
(399) |
|
|
Disposals |
|
|
220 |
|
|
44 |
|
|
Ending balance |
|
$ |
(968) |
|
$ |
(687) |
|
6. PREPAID EXPENSES AND OTHER CURRENT ASSETS
Prepaid expenses and other current assets at June 30, 2018 and 2017, consisted of the following:
|
|
|
2018 |
|
2017 |
|
||
|
Prepaid photo shoot |
|
$ |
273 |
|
$ |
497 |
|
|
Insurance |
|
|
974 |
|
|
765 |
|
|
Trade show deposits |
|
|
111 |
|
|
73 |
|
|
Interest rate cap |
|
|
525 |
|
|
90 |
|
|
Other |
|
|
1,412 |
|
|
1,013 |
|
|
Total prepaid expenses and other current assets |
|
$ |
3,295 |
|
$ |
2,438 |
|
F-17
MCBC HOLDINGS, INC. AND SUBSIDIARIES
NOTES TO CONSOLIDATED FINANCIAL STATEMENTS - (Continued)
(Dollars in thousands, except per share data and per unit data)
7.PROPERTY, PLANT, AND EQUIPMENT
Property, plant, and equipment — net at June 30, 2018 and 2017, consisted of the following:
|
|
|
2018 |
|
2017 |
|
||
|
Land and improvements |
|
$ |
1,725 |
|
$ |
1,125 |
|
|
Buildings and improvements |
|
|
11,960 |
|
|
8,208 |
|
|
Machinery and equipment |
|
|
22,570 |
|
|
16,189 |
|
|
Furniture and fixtures |
|
|
943 |
|
|
847 |
|
|
Construction in progress |
|
|
3,564 |
|
|
3,465 |
|
|
Total property, plant, and equipment |
|
|
40,762 |
|
|
29,834 |
|
|
Less accumulated depreciation |
|
|
(18,497) |
|
|
(15,007) |
|
|
Property, plant, and equipment — net |
|
$ |
22,265 |
|
$ |
14,827 |
|
Depreciation expense for the years ended June 30, 2018, 2017, and 2016 was $3,489, $3,124 and $3,223, respectively.
8.GOODWILL AND OTHER INTANGIBLE ASSETS
As of June 30, 2018 and 2017, details of the Company’s goodwill were as follows:
|
|
|
2018 |
|
2017 |
||
|
Goodwill attributable to MasterCraft |
|
$ |
29,593 |
|
$ |
29,593 |
|
Goodwill attributable to NauticStar |
|
|
36,199 |
|
|
— |
|
Total goodwill |
|
$ |
65,792 |
|
$ |
29,593 |
As of June 30, 2018 and 2017, details of the Company’s other intangible assets were as follows:
|
|
|
June 30, 2018 |
|
|||||||
|
|
|
Gross |
|
|
|
|
Net |
|
||
|
|
|
Carrying |
|
Accumulated |
|
Carrying |
|
|||
|
|
|
Amount |
|
Amortization |
|
Amount |
|
|||
|
Dealer network |
|
$ |
21,590 |
|
$ |
(2,544) |
|
$ |
19,046 |
|
|
Total amortizable intangible assets |
|
|
21,590 |
|
|
(2,544) |
|
|
19,046 |
|
|
Trade names |
|
|
32,000 |
|
|
— |
|
|
32,000 |
|
|
Total intangible assets |
|
$ |
53,590 |
|
$ |
(2,544) |
|
$ |
51,046 |
|
|
|
|
June 30, 2017 |
|
|||||||
|
|
|
Gross |
|
|
|
Net |
|
|||
|
|
|
Carrying |
Accumulated |
|
Carrying |
|
||||
|
|
|
Amount |
Amortization |
|
Amount |
|
||||
|
Dealer network |
|
$ |
1,590 |
|
$ |
(947) |
|
$ |
643 |
|
|
Total amortizable intangible assets |
|
|
1,590 |
|
|
(947) |
|
|
643 |
|
|
Trade names |
|
|
16,000 |
|
|
— |
|
|
16,000 |
|
|
Total intangible assets |
|
$ |
17,590 |
|
$ |
(947) |
|
$ |
16,643 |
|
F-18
MCBC HOLDINGS, INC. AND SUBSIDIARIES
NOTES TO CONSOLIDATED FINANCIAL STATEMENTS - (Continued)
(Dollars in thousands, except per share data and per unit data)
The amortizable intangible assets reflected in the table above were determined by management to have finite lives. The useful life for the MasterCraft and NauticStar dealer network intangible, which is 14 years and 10 years, respectively, was based on the average tenure of the dealer group. The trade names have been determined to have indefinite lives and are not being amortized, based on management’s expectation that trade names will generate cash flows for an indefinite period. Management expects to maintain usage of the trade names on existing products and introduce new products in the future under the trade names, thus extending their lives indefinitely.
Amortization expense for the years ended June 30, 2018, 2017, and 2016, was $1,597, $107 and $221, respectively. Estimated amortization expense for the five years subsequent to June 30, 2018, is shown in the following table:
|
Fiscal years ending June 30, |
|
|
|
|
|
2019 |
|
$ |
2,107 |
|
|
2020 |
|
|
2,107 |
|
|
2021 |
|
|
2,107 |
|
|
2022 |
|
|
2,107 |
|
|
2023 |
|
|
2,107 |
|
|
and thereafter |
|
|
8,511 |
|
|
Total |
|
$ |
19,046 |
|
9.ACCRUED EXPENSES AND OTHER CURRENT LIABILITIES
Accrued expenses and other current liabilities at June 30, 2018 and 2017, consisted of the following:
|
|
|
2018 |
|
2017 |
|
||
|
Warranty |
|
$ |
13,077 |
|
$ |
12,237 |
|
|
Self-insurance |
|
|
703 |
|
|
763 |
|
|
Compensation and related accruals |
|
|
2,995 |
|
|
1,691 |
|
|
Inventory repurchase contingent obligation |
|
|
1,274 |
|
|
1,008 |
|
|
Interest |
|
|
1,472 |
|
|
1,008 |
|
|
Dealer incentives |
|
|
4,628 |
|
|
2,755 |
|
|
Other |
|
|
3,717 |
|
|
1,948 |
|
|
Total accrued expenses and other current liabilities |
|
$ |
27,866 |
|
$ |
21,410 |
|
The following table provides a roll forward of the accrued warranty liability for the years ended June 30, 2018 and 2017:
|
|
|
2018 |
|
2017 |
|
||
|
Beginning balance |
|
$ |
12,237 |
|
$ |
11,392 |
|
|
Additions for NauticStar acquisition |
|
|
945 |
|
|
— |
|
|
Provisions |
|
|
6,523 |
|
|
4,723 |
|
|
Payments made |
|
|
(4,427) |
|
|
(3,052) |
|
|
Adjustments to preexisting warranties |
|
|
(2,201) |
|
|
(825) |
|
|
Ending balance |
|
$ |
13,077 |
|
$ |
12,237 |
|
F-19
MCBC HOLDINGS, INC. AND SUBSIDIARIES
NOTES TO CONSOLIDATED FINANCIAL STATEMENTS - (Continued)
(Dollars in thousands, except per share data and per unit data)
Activity in dealer incentives for the years ended June 30, 2018 and 2017 was as follows:
|
|
|
2018 |
|
2017 |
|
||
|
Beginning balance |
|
$ |
2,755 |
|
$ |
4,336 |
|
|
Additions for NauticStar acquisition |
|
|
57 |
|
|
— |
|
|
Provisions |
|
|
8,414 |
|
|
11,160 |
|
|
Payments made |
|
|
(6,598) |
|
|
(12,741) |
|
|
Ending balance |
|
$ |
4,628 |
|
$ |
2,755 |
|
10. FAIR VALUE MEASUREMENTS
Fair value is the exchange price that would be received for an asset or paid to transfer a liability (exit price) in the principal or most advantageous market for the asset or liability in an orderly transaction between market participants on the measurement date. There are three levels of inputs that may be used to measure fair values:
Level 1 — Quoted prices (unadjusted) for identical assets or liabilities in active markets that the entity has the ability to access as of the measurement date.
Level 2 — Significant other observable inputs other than Level 1 prices such as quoted prices for similar assets or liabilities; quoted prices in markets that are not active; or other inputs that are observable or can be corroborated by observable market data.
Level 3 — Significant unobservable inputs that reflect a company’s own assumptions about the assumptions that market participants would use in pricing an asset or liability.
When determining the fair value measurements for assets or liabilities required or permitted to be recorded at and/or marked to fair value, the Company considers the principal or most advantageous market in which it would transact and considers assumptions that market participants would use when pricing the asset or liability. When possible, the Company looks to active and observable markets to price identical assets. When identical assets are not traded in active markets, the Company looks to market observable data for similar assets.
The following summarizes the basis used to measure certain financial assets and liabilities at fair value as of June 30, 2018:
|
|
|
2018 Fair Value Measurements Using |
|
|||||||
|
|
|
Level 1 |
|
Level 2 |
|
Level 3 |
|
|||
|
Asset — interest rate cap |
|
$ |
— |
|
$ |
525 |
|
$ |
— |
|
The following summarizes the basis used to measure certain financial assets and liabilities at fair value as of June 30, 2017:
|
|
|
2017 Fair Value Measurements Using |
|
|||||||
|
|
|
Level 1 |
|
Level 2 |
|
Level 3 |
|
|||
|
Asset — interest rate cap |
|
$ |
— |
|
$ |
90 |
|
$ |
— |
|
F-20
MCBC HOLDINGS, INC. AND SUBSIDIARIES
NOTES TO CONSOLIDATED FINANCIAL STATEMENTS - (Continued)
(Dollars in thousands, except per share data and per unit data)
The interest rate cap is valued utilizing pricing models taking into account inputs such as interest rates and notional amounts. Fair value measurements for the Company’s interest rate cap are classified under Level 2 because such measurements are based on significant other observable inputs. There were no transfers of assets or liabilities between Level 1 and Level 2 during the fiscal year ended June 30, 2018.
11. LONG-TERM DEBT
Long-term debt outstanding at June 30, 2018 and 2017 is as follows:
|
|
|
2018 |
|
2017 |
|
||
|
Revolving credit facility |
|
$ |
— |
|
$ |
— |
|
|
Senior secured term loan |
|
|
76,656 |
|
|
35,135 |
|
|
Debt issuance costs on term loan |
|
|
(1,500) |
|
|
(658) |
|
|
Total debt |
|
|
75,156 |
|
|
34,477 |
|
|
Less current portion of long-term debt |
|
|
5,475 |
|
|
3,904 |
|
|
Less current portion of debt issuance costs on term loan |
|
|
(406) |
|
|
(217) |
|
|
Long-term debt — less current portion |
|
$ |
70,087 |
|
$ |
30,790 |
|
In December 2013, certain of the Company’s subsidiaries entered into a credit and guaranty agreement with Fifth Third Bank, as the agent and letter of credit issuer, SunTrust Bank as the syndication agent and the other lenders party thereto, the (“Senior Secured Credit Facility”). The Senior Secured Credit Facility provided, among other things, for (i) an initial term loan commitment of $25,000; and (ii) a revolving loan commitment of $10,000. In November 2014, the Company entered into a first amendment to the Senior Secured Credit Facility to, among other things, increase the term loan facility to $50,000, repay all amounts outstanding under our Senior Secured PIK Notes due 2014 with the additional borrowings under our Term Loan Facility and extend the maturity date to November 26, 2019. In March 2015, the Company entered into an Amended and Restated Credit and Guaranty Agreement (the “First Amended Credit Agreement”) which increased the term loan commitment from $50,000 to $75,000 and increased the revolving loan to $30,000. The Company initially borrowed $20,000 on the revolving loan and repaid $10,000 during March 2015. The Company used $44,000 of the proceeds to pay a cash dividend to common stockholders in March 2015.
In July 2015, the Company repaid all outstanding borrowings under its $75,000 term loan facility and its outstanding borrowings under its $30,000 revolving line of credit with the proceeds received from the IPO. The Company recorded a loss on debt extinguishment of $716, consisting of a charge of $676 to extinguish the debt discount and $40 in unamortized deferred financing costs incurred under its $75,000 term loan facility. In February 2016, the Company amended its Senior Secured Credit Facility to provide that the Company may repurchase shares in an aggregate amount not to exceed $20,000.
In May 2016, the Company entered into a Second Amended and Restated Credit and Guaranty Agreement with Fifth Third Bank, as the agent and letter of credit issuer, and the lenders party thereto (the “Prior Credit Agreement”). The Prior Credit Agreement replaced the Company’s First Amended Credit Agreement, dated March 13, 2015 (as amended in February 2016). The Prior Credit Agreement provided the Company with an $80,000 senior secured credit facility, consisting of a $50,000 term loan and a $30,000 revolving credit facility. The Company used the proceeds to pay a $79,945
F-21
MCBC HOLDINGS, INC. AND SUBSIDIARIES
NOTES TO CONSOLIDATED FINANCIAL STATEMENTS - (Continued)
(Dollars in thousands, except per share data and per unit data)
cash dividend to common stockholders in June 2016. The cash dividend payment per share was $4.30 based on shares outstanding as of June 6, 2016.
On October 2, 2017, the Company entered into a Third Amended and Restated Credit and Guaranty Agreement with Fifth Third Bank, as the agent and letter of credit issuer, and the lenders party thereto (the “Third Amended Credit Agreement”). The Third Amended Credit Agreement replaced and paid off the Company’s Prior Credit Agreement, dated May 27, 2016. The Third Amended Credit Agreement provides the Company with a $145,000 senior secured credit facility, consisting of a $115,000 term loan (the “Third Term Loan”) and a $30,000 revolving credit facility. A portion of the proceeds from the Third Amended Credit Agreement were used for the Company’s acquisition of NauticStar. The Third Amended Credit Agreement is collateralized by a first-priority security interest in substantially all of the Company’s assets. Obligations under the Third Amended Credit Agreement are guaranteed by the Company and each of its domestic subsidiaries.
The Third Amended Credit Agreement bears interest, at the Company’s option, at either the prime rate plus an applicable margin ranging from 0.75% to 1.75% or at an adjusted LIBOR plus an applicable margin ranging from 1.75% to 2.75%, in each case based on the Company’s senior leverage ratio. Based on the Company’s senior leverage ratio for the fiscal year ended June 30, 2018, the applicable margin for loans accruing interest at the prime rate is 1.00% and the applicable margin for loans accruing interest at LIBOR is 2.00%. In connection with the Third Amended Credit Agreement, the Company paid $1,240 of deferred financing costs. The Third Term Loan will mature and all remaining amounts outstanding thereunder will be due and payable on October 2, 2022. During the fiscal year ended June 30, 2018, the Company made voluntary payments on the Third Term Loan of $35,000 out of excess cash. As of June 30, 2018 and June 30, 2017, the Company’s unamortized deferred financing costs were $1,883 and $1,139, respectively. These costs are being amortized over the term of the Third Amended Credit Agreement.
The Company had no borrowings under the revolving credit facilities as of June 30, 2018 and June 30, 2017. As of June 30, 2018 and 2017, the Company had net availability of $30,000 and $29,750, respectively. Availability was reduced by outstanding letters of credit of $250 at June 30, 2017. As of June 30, 2018 and 2017, the effective interest rate on borrowings outstanding were 4.280% and 3.803%, respectively. As of June 30, 2018 the Company was in compliance with all of its debt covenants under its Third Amended Credit Agreement.
Long-term debt maturities for the Third Term Loan subsequent to June 30, 2018 are as follows:
|
Fiscal years ending June 30, |
|
|
|
|
2019 |
|
$ |
5,475 |
|
2020 |
|
|
5,973 |
|
2021 |
|
|
7,466 |
|
2022 |
|
|
7,964 |
|
2023 |
|
|
49,778 |
|
Total |
|
$ |
76,656 |
F-22
MCBC HOLDINGS, INC. AND SUBSIDIARIES
NOTES TO CONSOLIDATED FINANCIAL STATEMENTS - (Continued)
(Dollars in thousands, except per share data and per unit data)
12. INCOME TAXES
Earnings from continuing operations before income taxes and equity by jurisdiction were all in the U.S. except for income of $112 and a loss of $53 in 2018 and 2017, respectively.
For the years ended June 30, the components of the provision for income taxes are as follows:
|
|
|
For the Years Ended June 30, |
|
|||||||
|
|
|
2018 |
|
2017 |
|
2016 |
|
|||
|
Current income tax expense: |
|
|
|
|
|
|
|
|
|
|
|
Federal |
|
$ |
12,140 |
|
$ |
5,803 |
|
$ |
10,530 |
|
|
State |
|
|
276 |
|
|
1,584 |
|
|
2,020 |
|
|
Benefit of operating loss carryforwards |
|
|
(117) |
|
|
(118) |
|
|
(319) |
|
|
Total current tax expense |
|
|
12,299 |
|
|
7,269 |
|
|
12,231 |
|
|
Deferred tax expense (benefit): |
|
|
|
|
|
|
|
|
|
|
|
Federal |
|
|
525 |
|
|
4,154 |
|
|
(3,583) |
|
|
State |
|
|
32 |
|
|
300 |
|
|
(340) |
|
|
Total deferred tax expense (benefit) |
|
|
557 |
|
|
4,454 |
|
|
(3,923) |
|
|
Income tax expense |
|
$ |
12,856 |
|
$ |
11,723 |
|
$ |
8,308 |
|
The difference between the statutory and the effective federal tax rate for the periods below is attributable to the following:
|
|
|
For the Years Ended June, 30 |
|
||||
|
|
|
2018 |
|
2017 |
|
2016 |
|
|
Statutory income tax rate |
|
28.06 |
% |
35.00 |
% |
35.00 |
% |
|
State taxes (net of federal income tax benefit and valuation allowance) |
|
2.32 |
|
2.83 |
|
0.41 |
|
|
Change in valuation allowance |
|
— |
|
— |
|
0.06 |
|
|
Tax credits |
|
(0.44) |
|
(0.62) |
|
(2.82) |
|
|
Revalue of deferred taxes for change in federal tax rate |
|
(1.23) |
|
— |
|
— |
|
|
Uncertain tax positions |
|
(1.73) |
|
1.93 |
|
6.06 |
|
|
Permanent differences |
|
(2.41) |
|
(1.72) |
|
6.36 |
|
|
Other |
|
(0.02) |
|
0.04 |
|
(0.21) |
|
|
Effective income tax rate |
|
24.55 |
% |
37.46 |
% |
44.86 |
% |
F-23
MCBC HOLDINGS, INC. AND SUBSIDIARIES
NOTES TO CONSOLIDATED FINANCIAL STATEMENTS - (Continued)
(Dollars in thousands, except per share data and per unit data)
As of June 30, 2018 and 2017, a summary of the significant components of the Company’s deferred tax assets and liabilities was as follows:
|
|
|
2018 |
|
2017 |
|
||
|
Deferred tax assets: |
|
|
|
|
|
|
|
|
Warranty reserves |
|
$ |
2,898 |
|
$ |
4,392 |
|
|
Repurchase agreements |
|
|
247 |
|
|
362 |
|
|
Other reserves |
|
|
— |
|
|
121 |
|
|
Unrecognized tax benefits |
|
|
357 |
|
|
859 |
|
|
Stock Compensation |
|
|
467 |
|
|
336 |
|
|
State net operating loss |
|
|
130 |
|
|
130 |
|
|
Foreign net operating loss |
|
|
81 |
|
|
104 |
|
|
Valuation allowance |
|
|
(211) |
|
|
(234) |
|
|
Total deferred tax assets |
|
|
3,969 |
|
|
6,070 |
|
|
Deferred tax liabilities: |
|
|
|
|
|
|
|
|
Depreciation |
|
|
(1,262) |
|
|
(984) |
|
|
Intangible asset basis difference |
|
|
(4,009) |
|
|
(6,037) |
|
|
Other |
|
|
(125) |
|
|
(2) |
|
|
Total deferred tax liabilities |
|
|
(5,396) |
|
|
(7,023) |
|
|
Net deferred tax liabilities |
|
$ |
(1,427) |
|
$ |
(953) |
|
|
|
|
2018 |
|
2017 |
|
||
|
Noncurrent deferred tax liabilities |
|
|
(1,427) |
|
|
(953) |
|
|
Net deferred tax liabilities |
|
$ |
(1,427) |
|
$ |
(953) |
|
The Tax Cuts and Jobs Act (“Tax Reform Act”), which became effective December 22, 2017, overhauls U.S. corporate income tax law by lowering the U.S. federal corporate income tax rate from 35% to 21% (blended rate in year one for fiscal year filers), implementing a territorial tax system, imposing a one time “deemed repatriation” tax on all untaxed offshore earnings, and adding/modifying/deleting several major tax deductions significant to the Company.
The Company’s deferred tax liabilities decreased $647 from the impact of the corporate tax rate change from the Tax Reform Act.
The Company has state net operating loss (NOL) carryforwards of $3,013 that expire in varying years ranging from June 30, 2024 to June 30, 2029, and foreign NOL carryforwards of $387 that can be carried forward indefinitely. However, the Company determined that it is more likely than not that the benefit from these state and foreign NOL carryforwards will not be realized. In recognition of this risk, the Company has provided a full valuation allowance on the deferred tax assets relating to these state and foreign NOL carryforwards.
Unrecognized Tax Benefits
A reconciliation of the beginning and ending amount of unrecognized tax benefits, excluding accrued amounts for interest and penalties, is as follows:
F-24
MCBC HOLDINGS, INC. AND SUBSIDIARIES
NOTES TO CONSOLIDATED FINANCIAL STATEMENTS - (Continued)
(Dollars in thousands, except per share data and per unit data)
|
|
|
2018 |
|
2017 |
|
||
|
Balance at July 1 |
|
$ |
2,442 |
|
$ |
2,054 |
|
|
Additions based on tax positions related to the current year |
|
|
373 |
|
|
413 |
|
|
Additions for tax positions of prior years |
|
|
180 |
|
|
— |
|
|
Reductions for tax positions of prior years |
|
|
(61) |
|
|
(25) |
|
|
Settlements of tax positions from prior years |
|
|
(1,223) |
|
|
— |
|
|
Balance at June 30 |
|
$ |
1,711 |
|
$ |
2,442 |
|
Of this total, $1,308 and $910 as of June 30, 2018 and 2017, respectively represent the amount of unrecognized tax benefits that, if recognized, would favorably affect the effective income tax rate in future periods. The total amount of interest and penalties recorded in the consolidated statements of operations for the years ended June 30, 2018, and 2017 was a benefit of $288 and an expense of $355, respectively. The amounts accrued for interest and penalties at June 30, 2018 and 2017 were $271 and $490 respectively and is presented in unrecognized tax positions on the accompanying consolidated balance sheets.
In general, it is the practice and intention of the Company to reinvest the earnings of its non-U.S. subsidiaries in those operations. As of June 30, 2018, the Company has not made a provision for U.S. or additional foreign withholding taxes on investments in foreign subsidiaries that are indefinitely reinvested. Generally, such amounts become subject to U.S. taxation upon the remittance of dividends and under certain other circumstances.
The Company and its subsidiaries are subject to U.S. federal income tax, as well as various other income state taxes and foreign income taxes. The Company is no longer subject to examination by taxing authorities for years before June 30, 2015. The Company expects the total amount of unrecognized benefits to increase by approximately $506 in the next twelve months. The Company records unrecognized tax benefits as liabilities in accordance with ASC 740 and adjust these liabilities when its judgment changes as a result of the evaluation of new information not previously available. Because of the complexity of some of these uncertainties, the ultimate resolution may result in a payment that is materially different from our current estimate of the unrecognized tax benefit liabilities. These differences will be reflected as increases or decreases to income tax expense in the period in which new information is available.
13.STOCK-BASED COMPENSATION
During fiscal year ended June 30, 2015 the Company adopted the Amended and Restated MCBC Holdings, Inc. 2015 Incentive Award Plan (“2015 Plan”) in order to facilitate the grant of cash and equity incentives to non-employee directors, employees, and consultants of the Company and certain of its affiliates and to enable the Company and certain of its affiliates to obtain and retain the services of these individuals, which is essential to our long-term success. In July 2015, the Board amended and restated the Company's 2015 Plan which became effective just prior to the closing of the Company’s initial public offering to increase the shares available for issuance under the 2015 Plan from 1,518,958 shares to 2,458,633 shares. The Plan provides for the grant of stock options, including incentive stock options, or ISOs, and nonqualified stock options, or NSOs, restricted stock, dividend equivalents, stock payments, restricted stock units, or RSUs, restricted stock awards, or RSAs, deferred stock, deferred stock units, performance awards, stock appreciation rights, or SARs, performance stock units, or PSUs, and cash awards. As of June 30, 2018, there were 1,675,427 shares available for issuance under the 2015 Plan.
F-25
MCBC HOLDINGS, INC. AND SUBSIDIARIES
NOTES TO CONSOLIDATED FINANCIAL STATEMENTS - (Continued)
(Dollars in thousands, except per share data and per unit data)
Restricted Stock Awards
In May 2015, the Company granted to certain employees 841,585 shares of restricted stock under the 2015 Plan. For accounting purposes, the vesting conditions were not probable at the time of the grant. Upon completion of the IPO in July 2015, the vesting conditions had been met at which time the restricted shares had a per share fair value of $15.00, which was the initial public offering price. The award included performance conditions that were based on either an initial public offering or a change in control and until consummation of the event it was not considered probable for accounting purposes. In July 2015, the Company granted 47,146 shares of restricted stock under the 2015 Plan to certain non-employee directors at a per share fair value of $15.66, which was the closing price of the stock on July 24, 2015. For these restricted stock awards, the Company recognized stock-based compensation through the vesting date on a straight-line basis over 181 days from the Company’s initial public offering date. In April 2016, the Company granted 6,140 shares of restricted stock under the 2015 Plan to certain non-employee directors at a per share fair value of $13.41, which was the closing price of the stock on April 2, 2016. For these restricted stock awards, the Company recognized stock-based compensation through the vesting date of June 30, 2016.
Beginning in fiscal year 2017, all RSAs granted to non-employees vest over the remainder of that fiscal year, and all RSAs granted to employees vest in three equal annual installments. Additionally, all RSAs have been granted under the 2015 Plan at a per share fair value equal to the market value of the Company’s common stock on the grant date.
The Company had the following restricted stock award activity during fiscal 2018: July 2017, certain employees were granted 23,932 RSAs; July 2017, certain non-employee directors were granted 17,064 RSAs; November 2017, certain employees were granted 5,759 RSAs; and, June 2018, certain employees were granted 896 RSAs.
The Company had the following restricted stock award activity during fiscal 2017: August 2016, certain employees were granted 28,391 RSAs; August 2016, certain non-employee directors were granted 10,770 RSAs; December 2016, two new non-employee directors were granted 5,572 RSAs; January 2017, a new non-employee director was granted 1,968 RSAs; and, May 2017 a new non-employee director was granted 430 RSAs.
During the fiscal years ended June 30, 2018, 2017 and 2016, the Company recognized $616, $321, and $13,444, respectively, in stock-based compensation from RSAs.
F-26
MCBC HOLDINGS, INC. AND SUBSIDIARIES
NOTES TO CONSOLIDATED FINANCIAL STATEMENTS - (Continued)
(Dollars in thousands, except per share data and per unit data)
A summary of restricted stock award activity for the years ended June 30, 2018, 2017 and 2016, is as follows:
|
|
|
Number of Restricted Stock Awards Outstanding |
|
|
Weighted Average Grant Date Fair Value |
|
Total Non-vested Restricted Stock Awards at June 30, 2015 |
|
— |
|
$ |
— |
|
Granted |
|
894,850 |
|
|
15.02 |
|
Vested |
|
(894,850) |
|
|
15.02 |
|
Forfeited |
|
— |
|
|
— |
|
Total Non-vested Restricted Stock Awards at June 30, 2016 |
|
— |
|
$ |
— |
|
Granted |
|
47,131 |
|
|
12.22 |
|
Vested |
|
(18,740) |
|
|
18.94 |
|
Forfeited |
|
(1,974) |
|
|
19.55 |
|
Total Non-vested Restricted Stock Awards at June 30, 2017 |
|
26,417 |
|
$ |
12.22 |
|
Granted |
|
47,651 |
|
|
19.88 |
|
Vested |
|
(25,870) |
|
|
16.79 |
|
Forfeited |
|
(4,888) |
|
|
15.89 |
|
Total Non-vested Restricted Stock Awards at June 30, 2018 |
|
43,310 |
|
$ |
17.28 |
Performance Stock Units
In August 2016, the Company began to grant performance stock units (“PSUs”) under its 2015 Plan to certain employees. The value is based on long-term market performance targets using a Monte Carlo Simulation model, which considers the likelihood of all possible outcomes and determines the number of shares expected to vest under each simulation and the expected stock price at that level. The awards will be earned based upon the Company’s obtainment of certain performance criteria over a three-year period. The performance period for the awards commence on July 1 of the fiscal year in which they were granted and continue for a three-year period, ending on June 30 of the applicable year. Following the determination of the Company’s achievement with respect to the performance criteria, the amount of shares awarded will be subject to adjustment based upon the application of a total shareholder return (“TSR”) modifier. The probability of achieving the performance criteria is assessed quarterly, and compensation expense is recognized ratably over the performance period in accordance with ASC 718, Compensation—Stock Compensation.
The Company had the following PSU activity during fiscal 2018: July 2017, certain employees were granted 23,929 PSUs; and November 2017, certain employees were granted 2,487 PSUs.
The Company had the following PSU activity during fiscal 2017: August 2016, certain employees were granted 42,586 PSUs.
The Company recognized $355 and $150 in stock-based compensation expense from these PSUs during the fiscal year ended June 30, 2018 and June 30, 2017, respectively.
A summary of performance stock award activity for the years ending June 30, 2018, 2017 and 2016, is as follows:
|
|
|
Number of Performance Stock Units Outstanding |
|
|
Weighted Average Grant Date Fair Value |
F-27
MCBC HOLDINGS, INC. AND SUBSIDIARIES
NOTES TO CONSOLIDATED FINANCIAL STATEMENTS - (Continued)
(Dollars in thousands, except per share data and per unit data)
|
Total Non-vested Performance Stock Units at June 30, 2016 |
|
— |
|
$ |
— |
|
Granted |
|
42,586 |
|
|
11.85 |
|
Vested |
|
— |
|
|
— |
|
Forfeited |
|
(1,974) |
|
|
11.85 |
|
Total Non-vested Performance Stock Units at June 30, 2017 |
|
40,612 |
|
$ |
11.85 |
|
Granted |
|
26,416 |
|
|
19.62 |
|
Vested |
|
— |
|
|
— |
|
Forfeited |
|
(7,700) |
|
|
14.42 |
|
Total Non-vested Performance Stock Units at June 30, 2018 |
|
59,328 |
|
$ |
14.98 |
Nonqualified Stock Options
In July 2015, the Company granted 137,786 NSOs to certain employees at an option price equal to the $15.00 per share of the Company’s common stock, which was the initial public offering price, which vest in 25% increments annually on each of the first four anniversaries of the grant date. During the fiscal year ended June 30, 2018 and 2017, the Company recognized $215 and $240, respectively, from these NSOs in stock-based compensation.
The Company estimated the grant date fair value of stock options using the Black-Scholes pricing model assuming a risk-free interest rate of 1.93%, an expected term of 6.25 years, no dividend yield and a volatility rate of 56.7%. The Company determined that it did not have sufficient information on which to base a reasonable and supportable estimate of expected volatility of its share price, because of limited or no active stock transactions with third parties. Therefore, the Company has selected to use the calculated value method. Under this method, the Company used comparable public companies to estimate expected volatility. The Company used historical data to estimate option exercise and post-vesting termination behavior. The risk-free interest rate for the expected term of the option is based on the U.S. Treasury yield curve in effect at the time of the grant.
A summary of option activity for the years ending June 30, 2018, 2017 and 2016 is as follows:
|
|
|
|
|
|
|
|
Weighted |
|
|
|
|
|
|
|
|
|
Weighted |
|
Average |
|
|
|
|
|
|
|
|
|
|
Average |
|
Remaining |
|
Aggregate |
|
||
|
|
|
|
|
Exercise |
|
Contractual |
|
Intrinsic |
|
||
|
|
|
Shares |
|
Price |
|
Term (Yrs.) |
|
Value |
|
||
|
Outstanding at June 30, 2015 |
|
86,985 |
|
$ |
4.03 |
|
4.7 |
|
$ |
833 |
|
|
Granted |
|
137,786 |
|
$ |
15.00 |
|
10.0 |
|
$ |
— |
|
|
Exercised |
|
(86,985) |
|
$ |
4.03 |
|
— |
|
$ |
— |
|
|
Forfeited or expired |
|
(15,146) |
|
$ |
15.00 |
|
— |
|
$ |
— |
|
|
Outstanding at June 30, 2016 |
|
122,640 |
|
$ |
10.70 |
|
9.1 |
|
$ |
43 |
|
|
Granted |
|
— |
|
$ |
— |
|
— |
|
$ |
— |
|
|
Exercised |
|
(1,578) |
|
$ |
10.70 |
|
— |
|
$ |
— |
|
|
Forfeited or expired |
|
(4,734) |
|
$ |
10.70 |
|
— |
|
$ |
— |
|
|
Outstanding at June 30, 2017 |
|
116,328 |
|
$ |
10.70 |
|
8.1 |
|
$ |
1,030 |
|
|
Granted |
|
— |
|
$ |
— |
|
— |
|
$ |
— |
|
|
Exercised |
|
(10,905) |
|
$ |
10.70 |
|
— |
|
$ |
— |
|
|
Forfeited or expired |
|
(12,298) |
|
$ |
10.70 |
|
— |
|
$ |
— |
|
|
Outstanding at June 30, 2018 |
|
93,125 |
|
$ |
10.70 |
|
7.1 |
|
$ |
1,700 |
|
|
|
|
|
|
|
|
|
|
|
|
|
|
|
Fully vested and exercisable at June 30, 2016 |
|
— |
|
$ |
— |
|
— |
|
$ |
— |
|
F-28
MCBC HOLDINGS, INC. AND SUBSIDIARIES
NOTES TO CONSOLIDATED FINANCIAL STATEMENTS - (Continued)
(Dollars in thousands, except per share data and per unit data)
|
Fully vested and exercisable at June 30, 2017 |
|
29,084 |
|
$ |
10.70 |
|
8.1 |
|
$ |
257 |
|
|
Fully vested and exercisable at June 30, 2018 |
|
41,111 |
|
$ |
10.70 |
|
7.1 |
|
$ |
750 |
|
Pursuant to the terms of the 2015 Plan, the exercise price of options were reduced by $4.30, the amount of the special cash dividend paid on June 10, 2016, from an exercise price of $15.00 to an exercise price of $10.70. The other terms of the options remain unchanged.
14. COMMITMENTS AND CONTINGENCIES
The Company leases equipment and warehouse space under operating lease agreements expiring through 2024. Rental expense was $666, $603, and $468 during the years ended June 30, 2018, 2017, and 2016, respectively. Future minimum rental payments under all non-cancelable operating leases with remaining lease terms in excess of one year at June 30, 2018, are as follows:
|
Fiscal years ending June 30, |
|
|
|
|
|
2019 |
|
$ |
598 |
|
|
2020 |
|
|
414 |
|
|
2021 |
|
|
396 |
|
|
2022 |
|
|
352 |
|
|
2023 |
|
|
137 |
|
|
and thereafter |
|
|
1 |
|
|
Total |
|
$ |
1,898 |
|
Under certain conditions, the Company is obligated to repurchase new inventory repossessed from dealerships by financial institutions that provide credit to boat dealerships. Under the terms of these repurchase agreements, the Company is obligated to repurchase inventory repossessed by these financial institutions for a period ranging from 18 months to 30 months from the date of the original sale of the products to the respective dealers. Repossession of products by the financial institutions normally occurs when a dealer goes out of business or defaults with a lender. The maximum obligation of the Company under such floor plan agreements aggregated approximately $129,492 and $94,046 as of June 30, 2018 and 2017, respectively. No units were repurchased for the fiscal year ended 2018. The Company recorded a liability of $1,265 and $1,008 as of June 30, 2018 and 2017, respectively, after giving effect to proceeds anticipated to be received from the resale of those products to alternative dealers, and taking into consideration the credit quality of the dealers.
The Company is engaged in an exclusive contract with Ilmor Marine to provide engines for its MasterCraft boats. This contract makes Ilmor Marine the only supplier to MasterCraft for in-board engines and expires June 30, 2023. The Company is obligated to purchase a minimum number of engines during each model year and penalties can be assessed if the Company does not meet the purchase requirements. The Company did not incur any penalties related to engine purchase shortfalls for the years ended June 30, 2018 and 2017. Estimated purchases under the agreement range from approximately $26,000 to $30,000 for each of the upcoming years ending June 30, 2019 through 2023.
The Company is engaged in an exclusive contract with Yamaha Motors to provide engines for its NauticStar boats. This contract makes Yamaha Motors the only supplier to NauticStar for out-board engines and expires June 30, 2023. The Company is obligated to purchase a minimum number of engines during each model year and penalties can be assessed if the Company does not meet the purchase requirements. The Company did not incur any penalties related to engine purchase shortfalls for the year ended June 30, 2018. Estimated purchases under the agreement range from approximately $23,000 to $26,000 for each of the upcoming years ending June 30, 2019 and 2020.
F-29
MCBC HOLDINGS, INC. AND SUBSIDIARIES
NOTES TO CONSOLIDATED FINANCIAL STATEMENTS - (Continued)
(Dollars in thousands, except per share data and per unit data)
Future minimum purchase commitments under supply and other agreements are as follows:
|
Fiscal years ending June 30, |
|
|
|
|
|
2019 |
|
$ |
2,300 |
|
|
2020 |
|
|
3,112 |
|
|
2021 |
|
|
2,300 |
|
|
2022 |
|
|
2,300 |
|
|
2023 |
|
|
2,835 |
|
|
and thereafter |
|
|
— |
|
|
Total |
|
$ |
12,847 |
|
The Company is involved in certain claims and legal actions arising in the ordinary course of business. In the opinion of management, the ultimate disposition of these matters is not expected to have a material adverse effect on the Company’s financial condition or results of operations.
15. COMMON STOCK
As of June 30, 2018, the Company has authorized 100,000,000 shares of common stock, par value of $0.01 per share. Holders of common stock are each entitled to one vote for each share held of record on all matters submitted to a vote of stockholders. Holders are entitled to receive dividends when and if declared by the board of directors. In the event of liquidation, dissolution, or winding up, holders of common stock are entitled to receive a pro rata share of remaining assets available for distribution.
Initial Public Offering — On July 22, 2015, the Company completed the initial public offering of its common stock, in which it issued and sold 6,071,429 shares of common stock (exclusive of 910,714 shares of common stock sold by certain entities associated with Wayzata Investment Partners (collectively, the “Selling Stockholders”) pursuant to the exercise of an over-allotment option granted to the underwriters in connection with the offering) at a public offering price of $15.00 per share after giving effect to the 11.139-for-1 stock split consummated on July 22, 2015. The aggregate net proceeds received by the Company from the initial public offering were $81,762 after deducting $6,375 for underwriting discounts and commissions and $2,934 for offering expenses paid by the Company of which $827 were paid during the year ended June 30, 2016. On May 26, 2016, the Company declared a special dividend of $4.30 per share which was paid on June 10, 2016.
Follow-on Offering — In September 2016, the Company completed a follow-on offering of 4,600,000 shares of its common stock held by the Selling Stockholders at a public offering price of $10.25 per share. This included 600,000 shares sold by the Selling Stockholders pursuant to the over-allotment option granted to the underwriters, which was exercised concurrently with the closing of the follow-on offering. The Company received no proceeds from the follow-on offering. The Company paid $254 for offering expenses incurred during September 2016, which are reflected as a reduction to paid-in capital.
Secondary Offerings — In December 2016, the Company completed two secondary offerings for a total of 2,995,000 shares of its common stock held by the Selling Stockholders. The public offering price for the first offering consisting of 1,495,000 shares was $13.35 per share which included 195,000 shares sold by the Selling Stockholders pursuant to the over-allotment option granted to the underwriter, which was exercised concurrently with the closing of the secondary
F-30
MCBC HOLDINGS, INC. AND SUBSIDIARIES
NOTES TO CONSOLIDATED FINANCIAL STATEMENTS - (Continued)
(Dollars in thousands, except per share data and per unit data)
offering. The public offering price for the second offering consisting of 1,500,000 shares was $13.45 per share. The Company received no proceeds from the secondary offerings and the Selling Stockholders had divested all outstanding shares of the Company’s common stock acquired in connection with the Company’s initial public offering. The Company incurred $181 for offering expenses during December 2016, which are reflected as a reduction to paid-in capital.
16. EARNINGS PER SHARE
The factors used in the earnings per share computation are as follows:
|
|
|
|
2018 |
|
2017 |
|
2016 |
|
|||
|
Net income |
|
|
$ |
39,653 |
|
$ |
19,570 |
|
$ |
10,210 |
|
|
Weighted average common shares — basic |
|
|
|
18,619,793 |
|
|
18,592,885 |
|
|
17,849,319 |
|
|
Dilutive effect of assumed exercises of stock options |
|
|
|
38,835 |
|
|
4,488 |
|
|
50,775 |
|
|
Dilutive effect of assumed restricted share awards\units |
|
|
|
55,904 |
|
|
23,335 |
|
|
268,853 |
|
|
Dilutive effect of assumed exercises of common stock warrant |
|
|
|
— |
|
|
— |
|
|
88,060 |
|
|
Weighted average outstanding shares — diluted |
|
|
|
18,714,531 |
|
|
18,620,708 |
|
|
18,257,007 |
|
|
Basic earnings per share |
|
|
$ |
2.13 |
|
$ |
1.05 |
|
$ |
0.57 |
|
|
Diluted earnings per share |
|
|
$ |
2.12 |
|
$ |
1.05 |
|
$ |
0.56 |
|
There were no anti-dilutive options excluded from the dilutive shares outstanding for the year ended June 30, 2018. For the year ended June 30 2017 and June 30, 2016, stock options for 91,980 and 124,020 shares of common stock, respectively, were not considered in computing diluted earnings per share because they were anti-dilutive.
17. SEGMENT INFORMATION
The Company designs, manufactures, and markets recreational sport boats and has two operating and reportable segments: MasterCraft and NauticStar. The Company’s segments are defined by management’s reporting structure, product brands, and distribution channels. The MasterCraft product brand consists of recreational performance boats primarily used for water skiing, wakeboarding, wake surfing, and general recreational boating. The Company distributes the MasterCraft product brand through its dealer network. The NauticStar product brand consists of recreational boats primarily used for salt water fishing, and general recreational boating. The Company distributes the NauticStar product brand through its dealer network. The Company’s chief operating decision maker (“CODM”) regularly reviews the operating performance of each product brand including measures of performance based on income from operations. The Company considers each of the product brands to be an operating segment and has further concluded that presenting disaggregated information of these two operating segments provides meaningful information as certain economic characteristics are dissimilar as well as the characteristics of the customer base served.
Sales outside of North America accounted for 7.5%, 9.1%, and 8.6% of net sales of the MasterCraft segment for the years ended the years ended June 30, 2018, 2017, and 2016, respectively. The Company has no significant assets, concentration of sales to individual dealers or countries outside of North America during the years ended June 30, 2018 and 2017.
Management evaluates performance based on business segment operating income. The Company files a consolidated income tax return and does not allocate income taxes and other corporate level expenses including interest to operating
F-31
MCBC HOLDINGS, INC. AND SUBSIDIARIES
NOTES TO CONSOLIDATED FINANCIAL STATEMENTS - (Continued)
(Dollars in thousands, except per share data and per unit data)
segments. All corporate costs are allocated to MasterCraft. All amounts in the accompanying consolidated statements of operations for the years ended June 30, 2017 and 2016 pertain exclusively to the MasterCraft segment.
The following tables present financial information for the Company’s reportable segments for the year ended June 30, 2018, and the Company’s financial position at June 30, 2018 and June 30, 2017, respectively.
|
|
|
MasterCraft |
|
NauticStar |
|
Consolidated |
|
|||
|
Net sales |
|
$ |
266,319 |
|
$ |
66,406 |
|
$ |
332,725 |
|
|
Cost of sales |
|
|
188,218 |
|
|
54,143 |
|
|
242,361 |
|
|
Operating income |
|
|
49,363 |
|
|
6,620 |
|
|
55,983 |
|
|
Depreciation and amortization |
|
|
3,283 |
|
|
1,803 |
|
|
5,086 |
|
|
|
|
|
As of June 30, 2018 |
|
|
As of June 30, 2017 |
|
Assets |
|
|
|
|
|
|
|
MasterCraft |
|
$ |
89,058 |
|
$ |
83,321 |
|
NauticStar |
|
|
87,866 |
|
|
— |
|
Total Assets(a) |
|
$ |
176,924 |
|
$ |
83,321 |
|
(a) |
Total assets as of June 30, 2018 includes goodwill of $29,593 and $36,199 related to MasterCraft and NauticStar, respectively. Total assets as of June 30, 2017 includes goodwill of $29,593 related to MasterCraft. |
18. QUARTERLY FINANCIAL REPORTING (UNAUDITED)
The following table sets forth summary quarterly financial information for the years ended June 30, 2018 and 2017.
|
|
|
|
June 30 |
|
|
April 1 |
|
|
December 31 |
|
|
October 1 |
|
|
|
|
|
2018 |
|
|
2018 |
|
|
2017 |
|
|
2017 |
|
|
|
|
|
|
|
|
|
|
|
|
|
|
|
|
|
Net sales |
|
$ |
95,430 |
|
$ |
93,811 |
|
$ |
78,435 |
|
$ |
65,049 |
|
|
Gross profit |
|
|
27,885 |
|
|
24,382 |
|
|
19,934 |
|
|
18,163 |
|
|
Operating income |
|
|
18,938 |
|
|
15,199 |
|
|
10,782 |
|
|
11,064 |
|
|
Net income |
|
$ |
13,144 |
|
$ |
11,454 |
|
$ |
8,009 |
|
$ |
7,046 |
|
|
Basic earnings per common share |
|
$ |
0.71 |
|
$ |
0.62 |
|
$ |
0.43 |
|
$ |
0.38 |
|
|
Diluted earnings per common share |
|
$ |
0.70 |
|
$ |
0.61 |
|
$ |
0.43 |
|
$ |
0.38 |
|
|
Weighted average shares used for computation of: |
|
|
|
|
|
|
|
|
|
|
|
|
|
|
Basic earnings per common share |
|
|
18,619,834 |
|
|
18,622,083 |
|
|
18,619,834 |
|
|
18,615,100 |
|
|
Diluted earnings per common share |
|
|
18,702,352 |
|
|
18,728,424 |
|
|
18,702,352 |
|
|
18,686,626 |
|
F-32
MCBC HOLDINGS, INC. AND SUBSIDIARIES
NOTES TO CONSOLIDATED FINANCIAL STATEMENTS - (Continued)
(Dollars in thousands, except per share data and per unit data)
|
|
|
|
June 30 |
|
|
April 2 |
|
|
January 1 |
|
|
October 2 |
|
|
|
|
|
2017 |
|
|
2017 |
|
|
2017 |
|
|
2016 |
|
|
|
|
|
|
|
|
|
|
|
|
|
|
|
|
|
Net sales |
|
$ |
58,325 |
|
$ |
58,486 |
|
$ |
51,134 |
|
$ |
60,689 |
|
|
Gross profit |
|
|
16,456 |
|
|
14,925 |
|
|
14,286 |
|
|
17,809 |
|
|
Operating income |
|
|
10,559 |
|
|
4,282 |
|
|
7,039 |
|
|
11,635 |
|
|
Net income |
|
$ |
6,315 |
|
$ |
2,241 |
|
$ |
4,031 |
|
$ |
6,983 |
|
|
Basic earnings per common share |
|
$ |
0.34 |
|
$ |
0.12 |
|
$ |
0.22 |
|
$ |
0.38 |
|
|
Diluted earnings per common share |
|
$ |
0.34 |
|
$ |
0.12 |
|
$ |
0.22 |
|
$ |
0.38 |
|
|
Weighted average shares used for computation of: |
|
|
|
|
|
|
|
|
|
|
|
|
|
|
Basic earnings per common share |
|
|
18,593,501 |
|
|
18,593,296 |
|
|
18,592,936 |
|
|
18,591,808 |
|
|
Diluted earnings per common share |
|
|
18,659,246 |
|
|
18,625,904 |
|
|
18,605,078 |
|
|
18,592,603 |
|
F-33
Exhibit 10.12
October 5, 2017
Dear Tim,
I am very pleased you have decided to join the MasterCraft Team. We all look forward to working with you.
The complete terms of our offer are as follows:
|
Job Title: |
|
President, NauticStar |
|
|
|
|
|
Salary/Bonus: |
|
Your base annual salary will be $290,000. You will be eligible for the management bonus plan for FY 2018. Our FY runs July through June. You will have the potential to receive a bonus of up to 50% of your base salary based on the Company's financial performance and on achievement of agreed upon KPO's (to be determined). |
|
|
|
|
|
LTIP: |
|
You are eligible to be covered by the Company's Long Term Incentive Plan. This plan will allow you to earn up to 50% of your base salary in stock based compensation. The Compensation Committee will provide you with specific grant information at the end of each fiscal year. |
|
|
|
|
|
Benefits: |
|
You are eligible to be covered by the Company's health, medical, life, and pension programs after the applicable waiting periods. You are eligible for one week of paid vacation in 2017 and four weeks in 2018. You are eligible for all other benefits as described in the enclosed Benefits Summary. |
Once again, we are very pleased to be making you this offer and are glad you decided to bring your professional skills to our company at this very critical time in our history.
Please confirm acceptance of this offer by signing a copy and returning it to me. The other is for your own records.
|
Sincerely, |
|
|
/s/ Terry McNew |
|
|
Terry McNew |
|
|
President & CEO |
|
|
Agreed: |
/s/ Tim Schiek |
|
Date: |
10/9/17 |
|
|
Tim Schiek |
|
|
3:02 PM Eastern |
|
100 Cherokee Cove Drive Vonore, Tennessee 37885 423.884.2221 |

Exhibit 21.1
|
Legal Name |
|
State of Incorporation |
|
|
|
|
|
MasterCraft Boat Company, LLC |
|
Delaware |
|
|
|
|
|
MasterCraft Services, Inc. |
|
Tennessee |
|
|
|
|
|
MCBC Hydra Boats, LLC |
|
Tennessee |
|
|
|
|
|
MasterCraft Parts Limited |
|
The United Kingdom |
|
|
|
|
|
MasterCraft International Sales Administration, Inc. |
|
Delaware |
|
|
|
|
|
Nautic Star, LLC |
|
Mississippi |
|
|
|
|
|
NS Transport, LLC |
|
Mississippi |
|
|
|
|
|
Navigator Marine, LLC |
|
Mississippi |
Exhibit 23.1
CONSENT OF INDEPENDENT REGISTERED PUBLIC ACCOUNTING FIRM
MCBC Holdings, Inc. and subsidiaries
Vonore, Tennessee
We hereby consent to the incorporation by reference in the Registration Statements on Form S-3 (No. 333-212812) and Form S-8 (No. 333-205825) of MCBC Holdings, Inc. of our report dated September 7, 2018, relating to the consolidated financial statements which appear in this Annual Report on Form 10-K.
/s/ BDO USA, LLP
Memphis, Tennessee
September 7, 2018
Exhibit 31.1
CERTIFICATIONS
I, Terry McNew, certify that:
|
1. I have reviewed this Annual Report on Form 10-K of MCBC Holdings, Inc.; |
|
2. Based on my knowledge, this report does not contain any untrue statement of a material fact or omit to state a material fact necessary to make the statements made, in light of the circumstances under which such statements were made, not misleading with respect to the period covered by this report; |
|
3. Based on my knowledge, the financial statements, and other financial information included in this report, fairly present in all material respects the financial condition, results of operations and cash flows of the registrant as of, and for, the periods presented in this report; |
|
4. The registrant’s other certifying officer and I are responsible for establishing and maintaining disclosure controls and procedures (as defined in Exchange Act Rules 13a-15(e) and 15d-15(e)) and internal control over financial reporting (as defined in Exchange Act Rules 13a-15(f) and 15d-15(f)) for the registrant and have: |
|
a) Designed such disclosure controls and procedures, or caused such disclosure controls and procedures to be designed under our supervision, to ensure that material information relating to the registrant, including its consolidated subsidiaries, is made known to us by others within those entities, particularly during the period in which this report is being prepared; |
|
b) Designed such internal control over financial reporting, or caused such internal control over financial reporting to be designed under our supervision, to provide reasonable assurance regarding the reliability of financial reporting and the preparation of financial statements for external purposes in accordance with generally accepted accounting principles; |
|
c) Evaluated the effectiveness of the registrant’s disclosure controls and procedures and presented in this report our conclusions about the effectiveness of the disclosure controls and procedures, as of the end of the period covered by this report based on such evaluation; and |
|
d) Disclosed in this report any change in the registrant’s internal control over financial reporting that occurred during the registrant’s most recent fiscal quarter (the registrant’s fourth fiscal quarter in the case of an annual report) that has materially affected, or is reasonably likely to materially affect, the registrant’s internal control over financial reporting; and |
|
5. The registrant’s other certifying officer and I have disclosed, based on our most recent evaluation of internal control over financial reporting, to the registrant’s auditors and the audit committee of the registrant’s board of directors (or persons performing the equivalent functions): |
|
a) All significant deficiencies and material weaknesses in the design or operation of internal control over financial reporting which are reasonably likely to adversely affect the registrant’s ability to record, process, summarize and report financial information; and |
|
b) Any fraud, whether or not material, that involves management or other employees who have a significant role in the registrant’s internal control over financial reporting. |
|
|
|
|
|
|
|
Date: September 7, 2018 |
|
|
|
/s/ Terry McNew |
|
|
|
|
|
Terry McNew |
|
|
|
|
|
President and Chief Executive Officer (Principal Executive Officer) |
Exhibit 31.2
CERTIFICATIONS
I, Timothy M. Oxley, certify that:
|
1. I have reviewed this Annual Report on Form 10-K of MCBC Holdings, Inc.; |
|
2. Based on my knowledge, this report does not contain any untrue statement of a material fact or omit to state a material fact necessary to make the statements made, in light of the circumstances under which such statements were made, not misleading with respect to the period covered by this report; |
|
3. Based on my knowledge, the financial statements, and other financial information included in this report, fairly present in all material respects the financial condition, results of operations and cash flows of the registrant as of, and for, the periods presented in this report; |
|
4. The registrant’s other certifying officer and I are responsible for establishing and maintaining disclosure controls and procedures (as defined in Exchange Act Rules 13a-15(e) and 15d-15(e)) and internal control over financial reporting (as defined in Exchange Act Rules 13a-15(f) and 15d-15(f)) for the registrant and have: |
|
a) Designed such disclosure controls and procedures, or caused such disclosure controls and procedures to be designed under our supervision, to ensure that material information relating to the registrant, including its consolidated subsidiaries, is made known to us by others within those entities, particularly during the period in which this report is being prepared; |
|
b) Designed such internal control over financial reporting, or caused such internal control over financial reporting to be designed under our supervision, to provide reasonable assurance regarding the reliability of financial reporting and the preparation of financial statements for external purposes in accordance with generally accepted accounting principles; |
|
c) Evaluated the effectiveness of the registrant’s disclosure controls and procedures and presented in this report our conclusions about the effectiveness of the disclosure controls and procedures, as of the end of the period covered by this report based on such evaluation; and |
|
d) Disclosed in this report any change in the registrant’s internal control over financial reporting that occurred during the registrant’s most recent fiscal quarter (the registrant’s fourth fiscal quarter in the case of an annual report) that has materially affected, or is reasonably likely to materially affect, the registrant’s internal control over financial reporting; and |
|
5. The registrant’s other certifying officer and I have disclosed, based on our most recent evaluation of internal control over financial reporting, to the registrant’s auditors and the audit committee of the registrant’s board of directors (or persons performing the equivalent functions): |
|
a) All significant deficiencies and material weaknesses in the design or operation of internal control over financial reporting which are reasonably likely to adversely affect the registrant’s ability to record, process, summarize and report financial information; and |
|
b) Any fraud, whether or not material, that involves management or other employees who have a significant role in the registrant’s internal control over financial reporting. |
|
|
|
|
|
|
|
Date: September 7, 2018 |
|
|
|
/s/ Timothy M. Oxley |
|
|
|
|
|
Timothy M. Oxley |
|
|
|
|
|
Chief Financial Officer, Treasurer and Secretary (Principal Financial and Accounting Officer) |
Exhibit 32.1
CERTIFICATION PURSUANT TO
18 U.S.C. SECTION 1350,
AS ADOPTED PURSUANT TO
SECTION 906 OF THE SARBANES-OXLEY ACT OF 2002
I, Terry McNew, Chief Executive Officer of MCBC Holdings, Inc. (the “Company”), hereby certify, pursuant to 18 U.S.C. §1350, as adopted pursuant to §906 of the Sarbanes-Oxley Act of 2002, that, to the best of my knowledge:
|
(1) The Annual Report on Form 10-K of the Company for the fiscal year ended June 30, 2018 (the “Report”) fully complies with the requirements of Section 13(a) or 15(d) of the Securities Exchange Act of 1934, as amended; and |
|
(2) The information contained in the Report fairly presents, in all material respects, the financial condition and results of operations of the Company. |
|
|
|
|
|
|
|
September 7, 2018 |
|
|
|
/s/ Terry McNew |
|
|
|
|
|
Terry McNew |
|
|
|
|
|
President and Chief Executive Officer (Principal Executive Officer) |
Exhibit 32.2
CERTIFICATION PURSUANT TO
18 U.S.C. SECTION 1350,
AS ADOPTED PURSUANT TO
SECTION 906 OF THE SARBANES-OXLEY ACT OF 2002
I, Timothy M. Oxley, Chief Financial Officer of MCBC Holdings, Inc. (the “Company”), hereby certify, pursuant to 18 U.S.C. §1350, as adopted pursuant to §906 of the Sarbanes-Oxley Act of 2002, that, to the best of my knowledge:
|
(1) |
The Annual Report on Form 10-K of the Company for the fiscal year ended June 30, 2018 (the “Report”) fully complies with the requirements of Section 13(a) or 15(d) of the Securities Exchange Act of 1934, as amended; and |
|
(2) |
The information contained in the Report fairly presents, in all material respects, the financial condition and results of operations of the Company. |
|
|
|
|
|
|
|
September 7, 2018 |
|
|
|
/s/ Timothy M. Oxley |
|
|
|
|
|
Timothy M. Oxley |
|
|
|
|
|
Chief Financial Officer, Treasurer and Secretary (Principal Financial and Accounting Officer) |