
Form 6-K Fly Leasing Ltd For: Sep 05
UNITED STATES
SECURITIES AND EXCHANGE COMMISSION
Washington, D.C. 20549
FORM 6-K
Report of Foreign Private Issuer
Pursuant to Rule 13a-16 or 15d-16 of the Securities
Exchange Act of 1934
Date of Report: September 5, 2018
Commission File Number: 001-33701
Fly Leasing Limited
(Exact Name of registrant as specified in its charter)
West Pier Business Campus
Dun Laoghaire
County Dublin, A96 N6T7, Ireland
(Address of principal executive office)
Indicate by check mark whether registrant files or will file annual reports under cover of Form 20-F or Form 40-F:
|
Form 20-F
|
☒ |
Form 40-F
|
☐ |
Indicate by check mark if the registrant is submitting the Form 6-K in paper as permitted by Regulation S-T Rule 101(b)(1): ☐
Indicate by check mark if the registrant is submitting the Form 6-K in paper as permitted by Regulation S-T Rule 101(b)(7): ☐
A copy of Fly Leasing Limited’s investor presentation for the Deutsche Bank Aircraft Finance & Leasing Conference held in New York on September 5, 2018, is furnished as an
exhibit hereto and incorporated by reference herein.
Investors and others should note that Fly Leasing Limited (the “Company”) announces material information to investors through the investor relations page
on its website (www.flyleasing.com/investor-relations), SEC filings, press releases, public conference calls and webcasts. The Company expects to update investor presentations and similar materials on a regular basis and will continue to post these
materials to its investor relations page on its website. The Company encourages investors, the media and others to review the information it posts from time to time on its website.
|
Exhibit
|
Title
|
|
99.1
|
Investor presentation of Fly Leasing Limited dated September 2018.
|
2
SIGNATURES
Pursuant to the requirements of the Securities Exchange Act of 1934, the Registrant has duly caused this report to be signed on its behalf by the undersigned,
thereunto duly authorized.
|
Fly Leasing Limited
|
|||||
|
(Registrant)
|
|||||
|
Date:
|
September 5, 2018
|
|
By:
|
/s/ Colm Barrington
|
|
|
Colm Barrington
Chief Executive Officer and Director
|
|||||
3
EXHIBIT INDEX
|
Exhibit
|
Title
|
|
Investor presentation of Fly Leasing Limited dated September 2018.
|
4
Exhibit 99.1
September 2018 FLY LEASING

DISCLAIMER Forward-Looking Statements:This presentation contains certain “forward-looking statements”
within the meaning of the Private Securities Litigation Reform Act of 1995. Forward-looking statements may be identified by words such as “expects,” “intends,” “anticipates,” “plans,” “believes,” “seeks,” “estimates,” “will,” or words of
similar meaning and include, but are not limited to, statements regarding the outlook for FLY’s future business, operations and financial performance, including the expected benefits of the AirAsia portfolio transactions (the “Transactions”);
whether and when the Transactions will be consummated; the amount of cash and stock consideration to be paid by FLY; the type, amount and terms of the acquisition financing to be obtained by FLY; and, the amount of any fees and expenses
incurred in connection with the Transactions. Forward-looking statements are based on management’s current expectations and assumptions, which are subject to inherent uncertainties, risks and changes in circumstances that are difficult to
predict. Actual outcomes and results may differ materially due to global political, economic, business, competitive, market, regulatory and other factors and risks, including risks relating to the satisfaction of conditions to the closing of
additional assets as contemplated in connection with the Transactions; risks relating to satisfaction of conditions to the financing of additional assets as contemplated in connection with the Transactions; risks relating to FLY’s ability to
obtain additional required financing for the Transactions on favorable terms, or at all; the risk that expected benefits of the Transactions may not be fully realized or may take longer to realize than expected; the risk that business
disruption resulting from the Transactions may be greater than expected; and the risk that FLY may be unable to achieve its portfolio growth expectations, or to reap the benefits of such growth. Further information on the factors and risks
that may affect FLY’s business is included in filings FLY makes with the Securities and Exchange Commission (the “SEC”) from time to time, including its Annual Report on Form 20-F and its Reports on Form 6-K. FLY expressly disclaims any
obligation to update or revise any of these forward-looking statements, whether because of future events, new information, a change in its views or expectations, or otherwise.Notes:All period end figures are as of June 30, 2018 except as
otherwise noted. Any 2018 year-to-date data is as of August 31, 2018.Fleet age and lease term are calculated using the weighted net book value of flight equipment held for operating lease, including maintenance rights, investment in finance
lease, and aircraft held for sale at period end.In addition to U.S. GAAP financials, this presentation includes certain non-GAAP financial measures. These non-GAAP financial measures are in addition to, not a substitute for or superior to,
measures of financial performance prepared in accordance with U.S. GAAP. We have provided a reconciliation of those measures to the most directly comparable GAAP measures in the Appendix. For further information, please refer to FLY’s
earnings press release dated August 23, 2018. Industry data per IATA.

FLY AT A GLANCE 85aircraft$3.0 billion net book valueYoung Fleet6.8 years average age Long
Leases6.2 years average lease termDiversified Lessees45 airlines in 27 countries 55 Aircraft contractedplus 20 options$2.1 billionCommitted pipelineOpportunity to acquire up to 41 A320neo family aircraft Conservative Financing6.0 years
weighted average debt maturity, rates hedgedLower Debt margin Managed by BBAMIndustry leader with 30 year track recordSignificant Insider Ownership17% owned by BBAM
shareholders
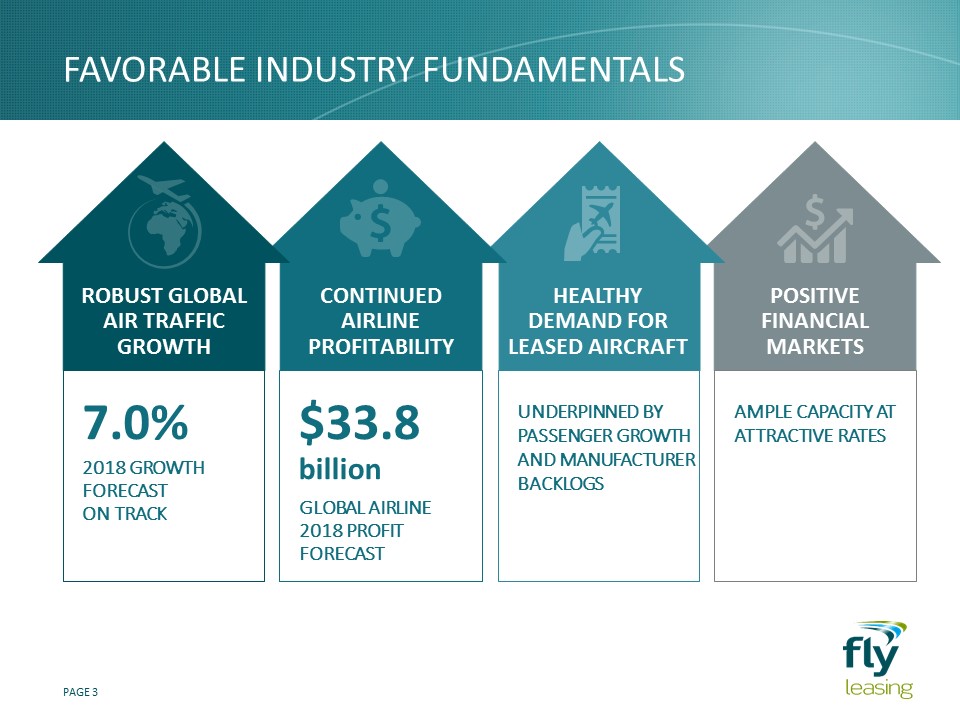
$33.8billion GLOBAL AIRLINE 2018 PROFIT FORECAST AMPLE CAPACITY AT ATTRACTIVE
RATES UNDERPINNED BY PASSENGER GROWTH AND MANUFACTURER BACKLOGS 7.0% 2018 GROWTH forecast ON TRACK Robust Global Air Traffic Growth Continued Airline Profitability Healthy Demand for LEASED Aircraft Positive Financial
Markets Favorable industry fundamentals

Strategy Driving Higher ROE and Eps Selling Older and Under-Performing Aircraft Reducing
SG&A Reducing Financing Costs Reinvesting in Newer, More Profitable Aircraft Repurchased Shares at a Discount to Book Value

Increasing financial results Adjusted ROE Full year 2018 pre-tax income guidance of $75–80 million on
target Adjusted Net Income Adjusted EPS Revised to conform to current period presentation. (1) (1) NBV per Share 10% 3.9x 3.6x 3.4x (1)

Portfolio acquisition Update 2018 Initial Portfolio TRANSFERS PURCHASE-Leasebacks21 new A320neo
family aircraft Delivering 2019 – 2021NEO Options20 new A320neo family aircraft Delivering 2019 – 2025 2019 and beyond 4 6 11 A320neos A321neos 34 A320 aircraft 7 CFM engines completed YTD22 aircraft Imminent12 aircraft and 7
engines in September

Projected gross Debt / Equity Ratio Impact on Leverage financing & leverage $574.5 million term
loan facility2-year and 5-year tranchesBlended pricing of L + 1.725% Syndicate of 18 banks INITIAL PORTFOLIO FINANCING Gross leverage temporarily at 4.7x Projected to reduce to 3.5x:Planned aircraft salesContracted debt amortization 3.5x
Proforma at September 30, 2018, assuming all Initial Portfolio assets have been acquired. (1)

2018 sales Sale strategy Aircraft sales 3 Aircraft sold YTDAverage age 12.6 yearsAverage
remaining lease term 2.5 years Economic gain of $21.3 million(1) (19% premium to NBV) Targeting to sell $150+ million of AirAsia exposure Targeting mandates by year end; transfers to follow into 2019Reduces leverage Manages lessee
concentrations Similar target for 2019 Economic gain includes gain on sale and end of lease income. Economic gain of $15.6 million in Q2 for sale of two aircraft and $5.7 million anticipated in Q3 for sale of one aircraft.

BBAM shareholders own 17% of FLY sharesLargest insider holding of any public aircraft lessorPurchased
1.3 million shares at $15.00 per share in July Alignment of interests BBAM shareholders’ increasING ownership in FLY Apr 2010 Purchased 1.0 million shares Dec 2012 Purchased 2.2 million shares Jan 2016 Purchased 0.9 million
shares Jul 2018 Purchased 1.3 million shares Recent AirAsia portfolio acquisition enabled by BBAM’s scale and reach

appendices

Capital structure & liquidity overview Represents the contractual interest rates and effect of
derivative instruments and excludes the amortization of debt discounts and debt issuance costs.Represents the ratio of total debt, less unrestricted cash and cash equivalents, divided by shareholders’ equity.

remarketing overview AIRCRAFT REMARKETING REQUIREMENTS FLY’s portfolio has a weighted average
remaining lease term of 6.2 years (# of aircraft) Last 2018 remarketing requirement is a narrowbody on lease expiring in December More than 50% of 2019 remarketing requirements have been completedMarket remains robust for remarketing
aircraft

DIVERSE GROUP OF GLOBAL LESSEES FLY Top 10 Lessees # Lessee % of
Value 1 12% 2 11% 3 9% 4 4% 5 4% 6 4% 7 4% 8 3% 9 3% 10 3% Top 10 Lessees 55% Initial Portfolio # Lessee % of Value 1 AirAsia 41% 2 Thai AirAsia 23% 3 Indonesia
AirAsia 14% 4 AirAsia India 13% 5 Philippines AirAsia 7% 6 Pakistan Int. Airlines 2% Lessees 100% Proforma Top 10 Lessees (1) # Lessee % of Value 1 AirAsia 10% 2 9% 3 8% 4 7% 5 Thai
AirAsia 6% 6 Indonesia AirAsia 3% 7 3% 8 AirAsia India 3% 9 3% 10 3% Top 10 Lessees 54% AirAsia Group Exposure 24% AirAsia Group (currently five different airlines in five countries) exposure will decline with a
disciplined disposition strategy. FLY is targeting $150 million of AirAsia Group sales annually Note: Sums may not foot due to rounding.Pro forma for FLY and Initial Portfolio on a combined basis assuming no sales. For FLY, NBV as of June
30, 2018. For Initial Portfolio, estimated purchase price allocation, excluding engines.

Adjusted net income & Adjusted roe Revised to conform to current period presentation.Percentages
have been annualized.