
Form 6-K Loma Negra Compania Indu For: Aug 10
UNITED STATES
SECURITIES AND EXCHANGE COMMISSION
Washington, D.C. 20549
SECURITIES AND EXCHANGE COMMISSION
Washington, D.C. 20549
_______________
FORM 6‑K
_______________
_______________
REPORT OF FOREIGN PRIVATE ISSUER
Pursuant to Rule 13a-16 or 15d-16 under the
Securities Exchange Act of 1934
Securities Exchange Act of 1934
For the month of August, 2018
Commission File Number: 001-38262
_______________
LOMA NEGRA COMPAÑÍA INDUSTRIAL ARGENTINA SOCIEDAD ANÓNIMA
(Exact Name of Registrant as Specified in its Charter)
(Exact Name of Registrant as Specified in its Charter)
LOMA NEGRA CORPORATION
(Translation of Registrant’s name into English)
(Translation of Registrant’s name into English)
_______________
|
Cecilia Grierson 355, 3th Floor
Zip Code 1107 – Capital Federal
Republic of Argentina
|
|
(Address of principal executive offices)
|
_______________
Indicate by check mark whether the registrant files or will file annual reports under cover Form 20-F or Form 40-F.
Form 20-F ☒ Form 40-F ☐
Form 20-F ☒ Form 40-F ☐
Indicate by check mark if the registrant is submitting the Form 6-K in paper as permitted by Regulation S-T Rule 101(b)(1): ☐
Indicate by check mark if the registrant is submitting the Form 6-K in paper as permitted by Regulation S-T Rule 101(b)(7): ☐
Table of Contents
|
Item
|
Description
|
|
|
1
|
Loma Negra Relevant Event
|

2Q18 Results Conference Call Loma Negra a member of InterCement Building sustainable partnerships L’amali-Argentina

Disclaimer and Forward Looking Statement This presentation may contain forward-looking statements within the meaning of federal securities law that are subject to risks and uncertainties. These statements are only predictions based upon our current expectations and projections about possible or assumed future results of our business, financial condition, results of operations, liquidity, plans and objectives. In some cases, you can identify forward-looking statements by terminology such as “believe,” “may,” “estimate,” “continue,” “anticipate,” “intend,” “should,” “plan,” “expect,” “predict,” “potential,” “seek,” “forecast,” or the negative of these terms or other similar expressions. The forward-looking statements are based on the information currently available to us. There are important factors that could cause our actual results, level of activity, performance or achievements to differ materially from the results, level of activity, performance or achievements expressed or implied by the forward-looking statements, including, among others things: changes in general economic, political, governmental and business conditions globally and in Argentina, changes in inflation rates, fluctuations in the exchange rate of the peso, the level of construction generally, changes in cement demand and prices, changes in raw material and energy prices, changes in business strategy and various other factors. You should not rely upon forward-looking statements as predictions of future events. Although we believe in good faith that the expectations reflected in the forward-looking statements are reasonable, we cannot guarantee that future results, levels of activity, performance and events and circumstances reflected in the forward-looking statements will be achieved or will occur. Any or all of Loma Negra’s forward-looking statements in this release may turn out to be wrong. You should consider these forward-looking statements in light of other factors discussed under the heading “Risk Factors” in the prospectus filed with the Securities and Exchange Commission on October 31, 2017 in connection with Loma Negra’s initial public offering. Therefore, readers are cautioned not to place undue reliance on these forward-looking statements.Except as required by law, we undertake no obligation to update publicly any forward-looking statements for any reason after the date of this release to conform these statements to actual results or to changes in our expectations.Note: The Company presented some figures converted from Argentine pesos to U.S. dollars for comparison purposes. The exchange rate used to convert Pesos to U.S. dollars was the reference exchange rate (Communication “A” 3500) reported by the Central Bank for U.S. dollars. The information presented in U.S. dollars is for the convenience of the reader only. Certain figures included in this report have been subject to rounding adjustments. Accordingly, figures shown as totals in certain tables may not be arithmetic aggregations of the figures presented in previous quarters.

Loma Negra delivers solid performance in core business despite challenging macro dynamics in Argentina in 2Q18… Macro slowdown in 2Q18 drove slower demand growth in Argentina; pricing environment remains healthy Argentine cement business balanced market position and profitability delivering top line growth and EBITDA margin expansion Strong revenue and EBITDA growth. EBITDA margin affected by other segments. Peso depreciation impacts bottom line Net revenues + 37.2% to Ps.4.8 billion (US$202 million) Adjusted EBITDA +26.9% to Ps.1.2 billion (US$49 million) Net majority income -35.0% to Ps.179 million (US$8 million) Strong balance sheet with cash position of Ps.1.6 billion and a healthy Net Debt to LTM Adj. EBITDA ratio of 0.83x Expansion of L´Amalí plant on schedule

… which resulted in lower industry cement demand growth which resulted in lower industry cement demand growth 36% 37% 37% 36% 40% 40% 41% 64% 63% 63% 64% 60% 60% 59% 2013 2014 2015 2016 2017 2Q17 2Q18 Bulk Bags (1) Source INDEC and BCRA (Argentina Central Bank) Market Expectations (REM) Survey as of July 2018 (2) Source INDEC: ISAC (Indicador Sintetico de la Actividad) (3) Based on AFCP 2.30 -2.60 2.40 -2.20 2.90 -0.30 1.50 2.50 3.00 3.80 3.90 3.60 2013 2014 2015 2016 2017 2018e2019e2020e 2Q17 3Q17 4Q17 1Q18 -1.8 -5.6 10.610.312.1 21.5 21.3 14.712.6 27.822.8 15.5 19.519.3 8.4 14.4 7.0 -0.1 GDP Growth1 (%) Construction Activity2 (YoY Growth, %) 0.7 1.8 -0.4 16.0 11.69.8 17.1 19.8 7.5 13.0 23.5 16.5 6.8 19.5 15.5 6.2 13.5 -4.4-3.6 -6.3 Dec'16 Jan'17 Feb'17 Mar'17 Apr'17 May'17 Jun'17 Jul'17 Aug'17 Sep'17 Oct'17 Nov'17 Dec'17 Jan'18 Feb'18 Mar'18 Apr'18 May'18 Jun'18 Jul'18 Monthly Industry Cement Sales3 (YoY Growth, %) Industry Cement Sales by Type3 (%) Jan’17 Feb’17 Mar’17 Jun’17 Jul’17 Aug’17 Sep’17 Oct’17 Nov’17 Dec’17 Jan’18 Feb’18 Mar’18 Apr’18 May’18 Jun’18

Loma Negra reports 37% YoY increase in revenues driven by solid growth in core cement and concrete segments Revenue Performance: Argentine cement: up 33% YoY. Healthy pricing environment despite relatively flat volumes - challenging macro conditions Paraguay cement: up 49% YoY. Guarani appreciation and better local pricing despite 2% volume decline on lower clinker inventories Concrete: up 80% YoY. Volumes up 24% and higher prices. Public infrastructure in Loma’s markets progressing Railroad: increased 25% YoY. Higher prices offset lower transported volumes Aggregates: up 6% YoY. Lower volumes and higher FOB sales Sales Volumes 2Q18 2Q17 % Chg. Cement, masonry & lime Argentina MM Tn 1.49 1.50 -0.6% Paraguay MM Tn 0.13 0.13 -2.4% Cement, masonry & lime total 1.61 1.62 -0.7% Argentina: Concrete MM m3 0.25 0.20 23.7% Railroad MM Tn 1.16 1.23 -6.1% Aggregates MM Tn 0.25 0.27 -7.4% Revenues (AR$ million) 2Q18 2Q17 % Chg. 3,503 2,626 33.4% 369 247 49.2% 3,872 2,873 34.8% 790 438 80.3% 485 388 24.9% 69 65 6.0% Total Net Revenues 4,757 3,467 37.2%

Gross Profit up 29% SG&A as a % of revenues fell 20 bps Argentine cement gross margin expanded 88 bps to 33.4% despite relatively flat volumes Consolidated gross profit up 29% YoY, while gross margin declined 189 bps to 28.0% mainly reflecting a weaker performance in railroad and Paraguay, as well as a faster growth in lower margin concrete business Despite new expenses as public company, SG&A as a % of sales dropped 20 bps YoY, to 7.7%, driven by top line growth and lower sales tax rate Gross Profit & Margin Selling, General & Administrative AR$ Million AR$ Million Gross Margin As a % of Sales 2Q17 2Q18 2Q17 2Q18 29.9% 28.0% 7.9% 7.7% 1,035 1,331 273 365 +29% +34% 6

EBITDA up 27% YoY, mainly driven by solid performance in core Argentine cement segment Argentine Cement segment Adjusted EBITDA up 36.6%, with margin expanding 60 bps to 28.0%. Argentine cement EBITDA represents 85% of consolidated figure Consolidated Adjusted EBITDA up 27% YoY in 2Q18 – Cement and Concrete lead growth Consolidated Adjusted EBITDA Margin down 197 bps to 24.2% as reflecting lower profitability in Railroad and Paraguay as well as strong growth in the lower margin Concrete business 2Q18 Adjusted EBITDA breakdown 85% 11% 2% 2% Cement, masonry cement and lime— Argentina Cement—Paraguay Concrete Railroad Aggregates Others US$ million 58 49 Adjusted EBITDA & Margin AR$ Million Adjusted EBITDA Margin 26.2% 24.2% 909 1,153 2Q17 2Q18 +27% 7

Positive contributors to Net Profit: Adjusted EBITDA increased 27% YoY Effective tax rate declined to 30.7% in 2Q18 from 32.2% in 2Q17, as a result of the tax reform at year-end 2017 This performance was offset by higher Total finance costs net, which rose 129.3% mainly due to foreign exchange differences Foreign exchange loss of Ps.515 million in 2Q18, compared to a Ps.130 million loss in 2Q17, mainly noncash Net Financial expense, decreased by Ps.7 million as a result of both higher cash balance and interest rates Net Profit Attributable to Owners of the Company in 2Q18 decreased 35.0% YoY in peso terms and 59.4% YoY measured in US$ Net Majority Income impacted by non-cash FX loss due to Argentine peso depreciation Net Profit Attributable to Owners AR$ Million US$ million 19 8 Finance Costs, net AR$ Million 292 671 2Q17 2Q18 276 179 2Q17 2Q18 129% -35% 8

Healthy balance sheet and debt profile US$ 38% PYG 40% Ps. 22% Other Floating 12% BADLAR 4% Libor 38% Fixed rate 46% Debt by Currency Debt by Interest Rate Cash position of Ps.1.6 billion and total debt at Ps.5.4 billion in June’18 Net Debt at Ps.3.8 billion (US$ 131 million) at June’18 Net Debt/Adj. EBITDA ratio up to 0.8x in 2Q18 from 0.3x in FY17 Operating cash flow in 1H18 declined YoY. Inventories increased in level and value Capital expenditures of Ps.1,334 million in 1H18 (52% applied to expansion of production capacity in L’Amalí plant) Cash Flow Highlights 1H18 1H17 Net cash generated by operating activities 153 558 Net cash used in investing activities (1,334) (689) Net cash (used in) generated by financing activities (790) (417) Cash and cash equivalents at the end of the period 1,618 298 (amounts expressed in millions of pesos, unless otherwise noted) 9

Looking into 2018 Cautious optimism despite the adverse macro environment in Argentina and its potential impact on industry dynamics. Given current market conditions, full year cement demand could reach similar 2017 levels Maintain focus on profitability, leveraging leading market position L’Amalí plant expansion on track for completion in 2020. Further profitability gains and higher efficiency to meet demand Healthy cash flow generation and solid balance sheet 10

Questions & Answers
Exhibit: Summary Financial Statements
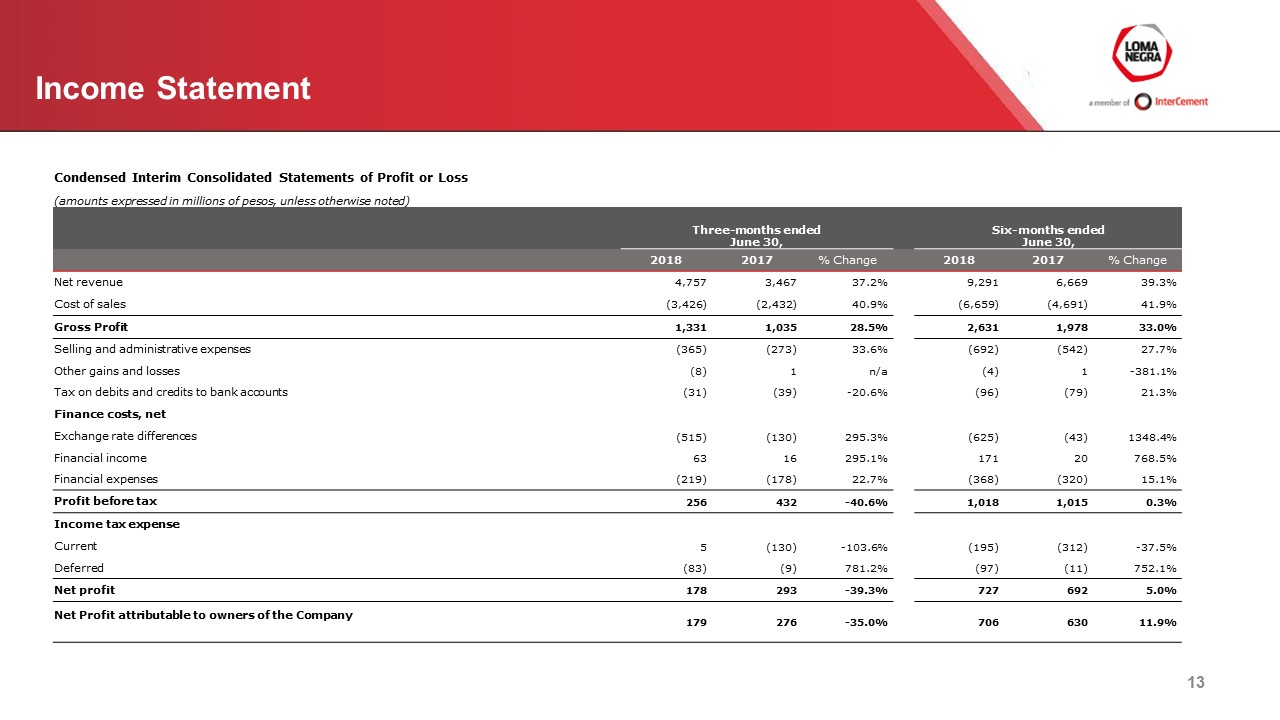
Income Statement 13 Condensed Interim Consolidated Statements of Profit or Loss (amounts expressed in millions of pesos, unless otherwise noted) Three-months ended June 30, Six-months ended June 30, 2018 2017 % Change 2018 2017 % Change Net revenue 4,757 3,467 37.2% 9,291 6,669 39.3% Cost of sales (3,426) (2,432) 40.9% (6,659) (4,691) 41.9% Gross Profit 1,331 1,035 28.5% 2,631 1,978 33.0% Selling and administrative expenses (365) (273) 33.6% (692) (542) 27.7% Other gains and losses (8) 1 n/a (4) 1 -381.1% Tax on debits and credits to bank accounts (31) (39) -20.6% (96) (79) 21.3% Finance costs, net Exchange rate differences (515) (130) 295.3% (625) (43) 1348.4% Financial income 63 16 295.1% 171 20 768.5% Financial expenses (219) (178) 22.7% (368) (320) 15.1% Profit before tax 256 432 -40.6% 1,018 1,015 0.3% Income tax expense Current 5 (130) -103.6% (195) (312) -37.5% Deferred (83) (9) 781.2% (97) (11) 752.1% Net profit 178 293 -39.3% 727 692 5.0% Net Profit attributable to owners of the Company 179 276 -35.0% 706 630 11.9%
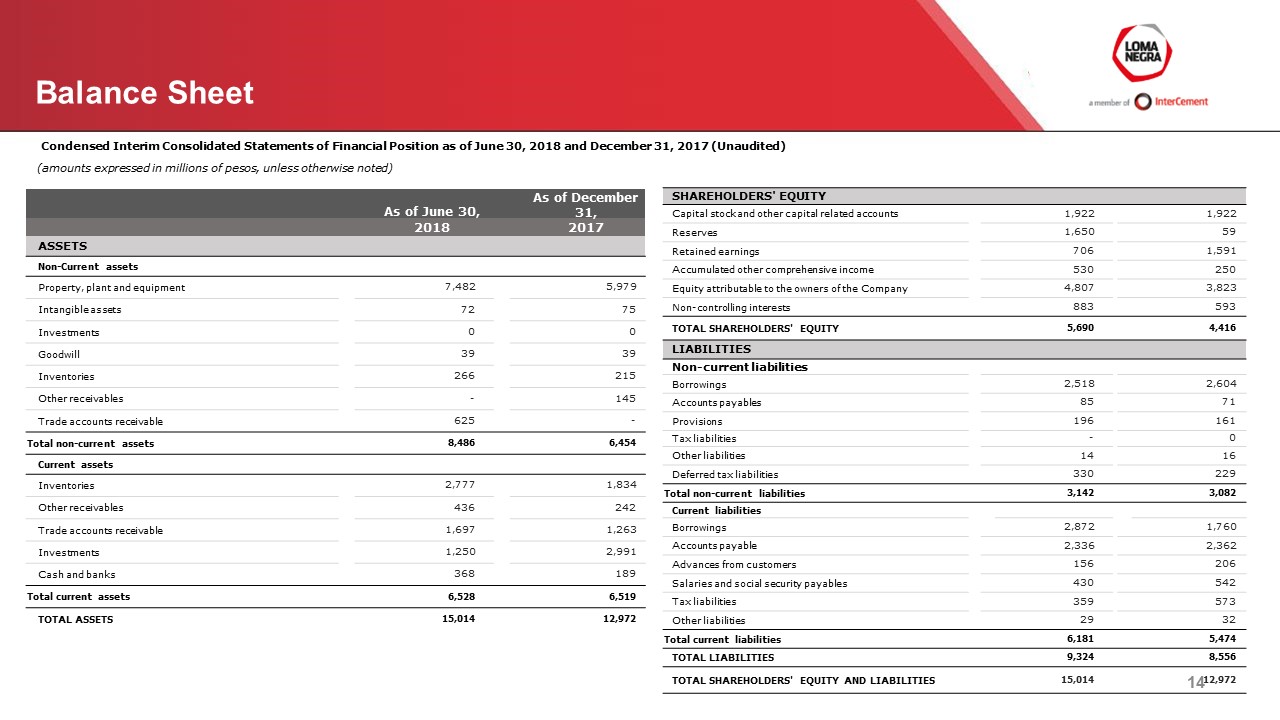
Balance Sheet Condensed Interim Consolidated Statements of Financial Position as of June 30, 2018 and December 31, 2017 (Unaudited) (amounts expressed in millions of pesos, unless otherwise noted) As of June 30, As of December 31, 2018 2017 ASSETS Non-Current assets Property, plant and equipment 7,482 5,979 Intangible assets 72 75 Investments 0 0 Goodwill 39 39 Inventories 266 215 Other receivables - 145 Trade accounts receivable 625 - Total non-current assets 8,486 6,454 Current assets Inventories 2,777 1,834 Other receivables 436 242 Trade accounts receivable 1,697 1,263 Investments 1,250 2,991 Cash and banks 368 189 Total current assets 6,528 6,519 TOTAL ASSETS 15,014 12,972 SHAREHOLDERS' EQUITY Capital stock and other capital related accounts 1,922 1,922 Reserves 1,650 59 Retained earnings 706 1,591 Accumulated other comprehensive income 530 250 Equity attributable to the owners of the Company 4,807 3,823 Non-controlling interests 883 593 TOTAL SHAREHOLDERS' EQUITY 5,690 4,416 LIABILITIES Non-current liabilities Borrowings 2,518 2,604 Accounts payables 85 71 Provisions 196 161 Tax liabilities - 0 Other liabilities 14 16 Deferred tax liabilities 330 229 Total non-current liabilities 3,142 3,082 Current liabilities Borrowings 2,872 1,760 Accounts payable 2,336 2,362 Advances from customers 156 206 Salaries and social security payables 430 542 Tax liabilities 359 573 Other liabilities 29 32 Total current liabilities 6,181 5,474 TOTAL LIABILITIES 9,324 8,556 TOTAL SHAREHOLDERS' EQUITY AND LIABILITIES 15,014 12,972 14

Statement of Cash Flows 15 Condensed Interim Consolidated Statement of Cash Flows for the Six-months and Three-months Ended June 30, 2018 and 2017 (amounts expressed in millions of pesos, unless otherwise noted) Three-months ended June 30, Six-months ended June 30, 2018 2017 2018 2017 CASH FLOWS FROM OPERATING ACTIVITIES Net profit for the period 178 293 727 692 Adjustments to reconcile net profit to net cash provided by operating activities Income tax expense 79 139 292 323 Depreciation and amortization 195 146 384 301 Provisions 28 14 35 26 Interest expense 179 141 298 263 Share of profit of associates - - - - Interest income (88) 82 - (4) Exchange rate differences 496 41 496 42 Gain on disposal of Property, plant and equipment - (5) - (5) Changes in operating assets and liabilities Inventories (492) (105) (867) (372) Other receivables (53) (47) (135) (26) Trade accounts receivable (82) (26) (363) (335) Advances from customers 10 (86) (51) (6) Accounts payable 93 52 (124) (168) Salaries and social security payables (134) (82) (115) (52) Provisions (5) (5) (10) (7) Tax liabilities 16 (2) 15 7 Other liabilities (0) (3) (3) (5) Income tax paid (351) (73) (427) (115) Net cash generated by operating activities 66 473 153 558 CASH FLOWS FROM INVESTING ACTIVITIES Proceeds from disposal of Property, plant and equipment 2 13 5 13 Payments to acquire Property, plant and equipment (408) (218) (768) (680) Payment of advances of Property, plant and equipment (53) - (548) - Payments to acquire Intangible Assets (2) (2) (3) (9) Interest collected - (27) - - Contributions to Trust (10) (13) (19) (13) Net cash used in investing activities (471) (247) (1,334) (689) CASH FLOWS FROM FINANCING ACTIVITIES Proceeds from borrowings 236 1,303 418 1,487 Interest paid (144) (111) (302) (267) Dividends paid - (442) - (442) Repayment of borrowings (727) (982) (906) (1,194) Net cash (used in) generated by financing activities (634) (232) (790) (417) Net decrease in cash and cash equivalents (1,039) (6) (1,971) (547) Cash and cash equivalents at the beginning of the year 2,294 265 3,180 803 Effects of the exchange rate differences on cash and cash equivalents in foreign currency 363 38 410 15 Cash and cash equivalents at the end of the period 1,618 298 1,618 298

Adjusted EBITDA Reconciliation & Margin 16 Adjusted EBITDA Reconciliation & Margin (amounts expressed in millions of pesos, unless otherwise noted) Three-months ended June 30, Six-months ended June 30, 2018 2017 % Chg. 2018 2017 % Chg. Adjusted EBITDA reconciliation: Net profit 178 293 -39.3% 727 692 5.0% (+) Financial interest, net 124 151 -18.1% 139 266 -47.7% (+) Income tax expense 79 139 -43.5% 292 323 -9.8% (+) Depreciation and amortization 195 145 34.0% 384 301 27.6% (+) Exchange rate differences 515 130 295.3% 625 43 1348.4% (+) Other financial expenses, net 32 11 189.1% 58 35 68.0% (+) Tax on debits and credits to bank accounts 31 39 -20.6% 96 79 21.3% Adjusted EBITDA 1,153 909 26.9% 2,319 1,738 33.4% Adjusted EBITDA Margin 24.2% 26.2% -197bps 25.0% 26.1% -110bps

IR Contact Marcos I. GradinChief Financial Officer and Investor RelationsGaston PinnelInvestor Relations [email protected]
SIGNATURES
Pursuant to the requirements of the Securities Exchange Act of 1934, the registrant has duly caused this report to be signed on its behalf by the undersigned, thereunto duly authorized.
|
|
Loma Negra Compañía Industrial Argentina Sociedad Anónima
|
||||
|
|
|
|
|
|
|
|
Date: August 10, 2018
|
|
By:
|
/s/ |
Marcos I. Gradin
|
|
|
|
|
Name:
|
Marcos I. Gradin
|
|
|
|
|
|
Title:
|
Chief Financial Officer
|
|
|