
Form 10-Q Marcus & Millichap, Inc. For: Jun 30
Table of Contents
UNITED STATES
SECURITIES AND EXCHANGE COMMISSION
Washington, DC 20549
FORM 10-Q
(Mark One)
| ☒ | QUARTERLY REPORT PURSUANT TO SECTION 13 OR 15(d) OF THE SECURITIES EXCHANGE ACT OF 1934 |
For the quarterly period ended June 30, 2018
OR
| ☐ | TRANSITION REPORT PURSUANT TO SECTION 13 OR 15(d) OF THE SECURITIES EXCHANGE ACT OF 1934 |
For the transition period from to
Commission File Number: 001-36155
MARCUS & MILLICHAP, INC.
(Exact name of registrant as specified in its Charter)
| Delaware | 35-2478370 | |
| (State or Other Jurisdiction of | (I.R.S. Employer | |
| Incorporation or Organization) | Identification No.) | |
| 23975 Park Sorrento, Suite 400 Calabasas, California |
91302 | |
| (Address of Principal Executive Offices) | (Zip Code) | |
(818) 212-2250
(Registrant’s telephone number, including area code)
Indicate by check mark whether the registrant: (1) has filed all reports required to be filed by Section 13 or 15(d) of the Securities Exchange Act of 1934 during the preceding 12 months (or for such shorter period that the registrant was required to file such reports), and (2) has been subject to such filing requirements for the past 90 days. Yes ☒ No ☐
Indicate by checkmark whether the registrant has submitted electronically and posted on its corporate Web site, if any, every Interactive Data File required to be submitted and posted pursuant to Rule 405 of Regulation S-T during the preceding 12 months (or for such shorter time period that the registrant was required to submit and post such files). Yes ☒ No ☐
Indicate by check mark whether the registrant is a large accelerated filer, an accelerated filer, a non-accelerated filer, smaller reporting company, or an emerging growth company. See definitions of “large accelerated filer,” “accelerated filer,” “smaller reporting company,” and “emerging growth company” in Rule 12b-2 of the Exchange Act.
| Large accelerated filer | ☐ | Accelerated filer | ☒ | |||
| Non-accelerated filer | ☐ (Do not check if a smaller reporting company) | Smaller reporting company | ☐ | |||
| Emerging growth company | ☒ | |||||
If an emerging growth company, indicate by check mark if the registrant has elected not to use the extended transition period for complying with any new or revised financial accounting standards provided pursuant to Section 13(a) of the Exchange Act. ☒
Indicate by check mark whether the registrant is a shell company (as defined in Rule 12b-2 of the Exchange Act). Yes ☐ No ☒
Number of shares of common stock, par value $0.0001 per share, of the registrant issued and outstanding as of August 2, 2018 was 38,621,712 shares.
Table of Contents
MARCUS & MILLICHAP, INC.
| PART I. FINANCIAL INFORMATION |
||||
| Page | ||||
| Item 1. Financial Statements |
||||
| Condensed Consolidated Balance Sheets at June 30, 2018 (Unaudited) and December 31, 2017 |
3 | |||
| 4 | ||||
| 5 | ||||
| 6 | ||||
| Notes to Condensed Consolidated Financial Statements (Unaudited) |
8 | |||
| Item 2. Management’s Discussion and Analysis of Financial Condition and Results of Operations |
25 | |||
| Item 3. Quantitative and Qualitative Disclosures About Market Risk |
38 | |||
| 39 | ||||
| PART II. OTHER INFORMATION |
||||
| 40 | ||||
| 40 | ||||
| Item 2. Unregistered Sales of Equity Securities and Use of Proceeds |
40 | |||
| 40 | ||||
| 40 | ||||
| 40 | ||||
| 41 | ||||
| EXHIBIT INDEX |
||||
2
Table of Contents
PART I. FINANCIAL INFORMATION
Item 1. Financial Statements
MARCUS & MILLICHAP, INC.
CONDENSED CONSOLIDATED BALANCE SHEETS
(dollar amounts in thousands, except per share amounts)
| June 30, 2018 (Unaudited) |
December 31, 2017 |
|||||||
| Assets |
||||||||
| Current assets: |
||||||||
| Cash and cash equivalents |
$ | 240,019 | $ | 220,786 | ||||
| Commissions receivable |
6,870 | 9,586 | ||||||
| Prepaid expenses |
7,654 | 9,661 | ||||||
| Income tax receivable |
— | 1,308 | ||||||
| Marketable securities, available-for-sale |
85,486 | 73,560 | ||||||
| Other assets, net |
4,918 | 5,529 | ||||||
|
|
|
|
|
|||||
| Total current assets |
344,947 | 320,430 | ||||||
| Prepaid rent |
14,910 | 15,392 | ||||||
| Property and equipment, net |
17,159 | 17,153 | ||||||
| Marketable securities, available-for-sale |
31,917 | 52,099 | ||||||
| Assets held in rabbi trust |
8,890 | 8,787 | ||||||
| Deferred tax assets, net |
21,371 | 22,640 | ||||||
| Goodwill and other intangible assets |
5,727 | — | ||||||
| Other assets |
29,250 | 23,163 | ||||||
|
|
|
|
|
|||||
| Total assets |
$ | 474,171 | $ | 459,664 | ||||
|
|
|
|
|
|||||
| Liabilities and stockholders’ equity |
||||||||
| Current liabilities: |
||||||||
| Accounts payable and other liabilities |
$ | 8,279 | $ | 9,202 | ||||
| Notes payable to former stockholders |
1,087 | 1,035 | ||||||
| Deferred compensation and commissions |
34,107 | 49,180 | ||||||
| Income tax payable |
217 | — | ||||||
| Accrued bonuses and other employee related expenses |
16,910 | 23,842 | ||||||
|
|
|
|
|
|||||
| Total current liabilities |
60,600 | 83,259 | ||||||
| Deferred compensation and commissions |
41,557 | 49,361 | ||||||
| Notes payable to former stockholders |
6,564 | 7,651 | ||||||
| Deferred rent and other liabilities |
6,553 | 4,505 | ||||||
|
|
|
|
|
|||||
| Total liabilities |
115,274 | 144,776 | ||||||
|
|
|
|
|
|||||
| Commitments and contingencies |
— | — | ||||||
| Stockholders’ equity: |
||||||||
| Preferred stock, $0.0001 par value: |
||||||||
| Authorized shares – 25,000,000; issued and outstanding shares – none at June 30, 2018 and December 31, 2017, respectively |
— | — | ||||||
| Common stock, $0.0001 par value: |
||||||||
| Authorized shares – 150,000,000; issued and outstanding shares – 38,621,712 and 38,374,011 at June 30, 2018 and December 31, 2017, respectively |
4 | 4 | ||||||
| Additional paid-in capital |
94,291 | 89,877 | ||||||
| Stock notes receivable from employees |
(4 | ) | (4 | ) | ||||
| Retained earnings |
264,262 | 224,071 | ||||||
| Accumulated other comprehensive income |
344 | 940 | ||||||
|
|
|
|
|
|||||
| Total stockholders’ equity |
358,897 | 314,888 | ||||||
|
|
|
|
|
|||||
| Total liabilities and stockholders’ equity |
$ | 474,171 | $ | 459,664 | ||||
|
|
|
|
|
|||||
See accompanying notes to condensed consolidated financial statements.
3
Table of Contents
MARCUS & MILLICHAP, INC.
CONDENSED CONSOLIDATED STATEMENTS OF NET AND COMPREHENSIVE INCOME
(dollar and share amounts in thousands, except per share amounts)
(Unaudited)
| Three Months Ended June 30, |
Six Months Ended June 30, |
|||||||||||||||
| 2018 | 2017 | 2018 | 2017 | |||||||||||||
| Revenues: |
||||||||||||||||
| Real estate brokerage commissions |
$ | 181,640 | $ | 162,575 | $ | 344,165 | $ | 302,712 | ||||||||
| Financing fees |
15,563 | 12,709 | 25,287 | 22,763 | ||||||||||||
| Other revenues |
2,199 | 5,087 | 4,491 | 8,108 | ||||||||||||
|
|
|
|
|
|
|
|
|
|||||||||
| Total revenues |
199,402 | 180,371 | 373,943 | 333,583 | ||||||||||||
|
|
|
|
|
|
|
|
|
|||||||||
| Operating expenses: |
||||||||||||||||
| Cost of services |
119,869 | 110,377 | 221,518 | 200,024 | ||||||||||||
| Selling, general and administrative expense |
49,080 | 43,693 | 97,133 | 86,913 | ||||||||||||
| Depreciation and amortization expense |
1,503 | 1,303 | 2,878 | 2,600 | ||||||||||||
|
|
|
|
|
|
|
|
|
|||||||||
| Total operating expenses |
170,452 | 155,373 | 321,529 | 289,537 | ||||||||||||
|
|
|
|
|
|
|
|
|
|||||||||
| Operating income |
28,950 | 24,998 | 52,414 | 44,046 | ||||||||||||
| Other income (expense), net |
1,724 | 997 | 2,933 | 1,833 | ||||||||||||
| Interest expense |
(352 | ) | (374 | ) | (712 | ) | (756 | ) | ||||||||
|
|
|
|
|
|
|
|
|
|||||||||
| Income before provision for income taxes |
30,322 | 25,621 | 54,635 | 45,123 | ||||||||||||
| Provision for income taxes |
8,155 | 10,052 | 14,457 | 17,554 | ||||||||||||
|
|
|
|
|
|
|
|
|
|||||||||
| Net income |
22,167 | 15,569 | 40,178 | 27,569 | ||||||||||||
| Other comprehensive (loss) income: |
||||||||||||||||
| Unrealized (losses) gains on marketable securities, net of tax of $(57), $111, $(221) and $176 for the three months ended June 30, 2018 and 2017 and the six months ended June 30, 2018 and 2017, respectively |
(164 | ) | 174 | (656 | ) | 221 | ||||||||||
| Foreign currency translation gain (loss), net of tax of $0 for each of the three months ended June 30, 2018 and 2017 and each of the six months ended June 30, 2018 and 2017 |
34 | (23 | ) | 73 | (25 | ) | ||||||||||
|
|
|
|
|
|
|
|
|
|||||||||
| Total other comprehensive (loss) income |
(130 | ) | 151 | (583 | ) | 196 | ||||||||||
|
|
|
|
|
|
|
|
|
|||||||||
| Comprehensive income |
$ | 22,037 | $ | 15,720 | $ | 39,595 | $ | 27,765 | ||||||||
|
|
|
|
|
|
|
|
|
|||||||||
| Earnings per share: |
||||||||||||||||
| Basic |
$ | 0.57 | $ | 0.40 | $ | 1.03 | $ | 0.71 | ||||||||
| Diluted |
$ | 0.56 | $ | 0.40 | $ | 1.02 | $ | 0.70 | ||||||||
| Weighted average common shares outstanding: |
||||||||||||||||
| Basic |
39,154 | 39,002 | 39,124 | 38,976 | ||||||||||||
| Diluted |
39,385 | 39,132 | 39,298 | 39,118 | ||||||||||||
See accompanying notes to condensed consolidated financial statements.
4
Table of Contents
MARCUS & MILLICHAP, INC.
CONDENSED CONSOLIDATED STATEMENT OF STOCKHOLDERS’ EQUITY
(dollar amounts in thousands)
(Unaudited)
| Preferred Stock |
Common Stock |
Additional Paid-In Capital |
Stock Notes Receivable From Employees |
Retained Earnings |
Accumulated Other Comprehensive Income |
Total | ||||||||||||||||||||||||||||||
| Shares | Amount | Shares | Amount | |||||||||||||||||||||||||||||||||
| Balance at December 31, 2017 |
— | $ | — | 38,374,011 | $ | 4 | $ | 89,877 | $ | (4 | ) | $ | 224,071 | $ | 940 | $ | 314,888 | |||||||||||||||||||
| Cumulative effect of a change in accounting principle |
— | — | — | — | — | — | 13 | (13 | ) | — | ||||||||||||||||||||||||||
|
|
|
|
|
|
|
|
|
|
|
|
|
|
|
|
|
|
|
|||||||||||||||||||
| Balance at January 1, 2018, as adjusted |
— | — | 38,374,011 | 4 | 89,877 | (4 | ) | 224,084 | 927 | 314,888 | ||||||||||||||||||||||||||
| Net and comprehensive income |
— | — | — | — | — | — | 40,178 | (583 | ) | 39,595 | ||||||||||||||||||||||||||
| Stock-based award activity |
||||||||||||||||||||||||||||||||||||
| Stock-based compensation |
— | — | — | — | 5,772 | — | — | — | 5,772 | |||||||||||||||||||||||||||
| Shares issued pursuant to employee stock purchase plan |
— | — | 13,028 | — | 356 | — | — | — | 356 | |||||||||||||||||||||||||||
| Issuance of common stock for vesting of restricted stock units |
— | — | 274,740 | — | — | — | — | — | — | |||||||||||||||||||||||||||
| Issuance of common stock for unvested restricted stock awards |
— | — | 12,852 | — | — | — | — | — | — | |||||||||||||||||||||||||||
| Shares withheld related to net share settlement of stock-based awards |
— | — | (52,919 | ) | — | (1,714 | ) | — | — | — | (1,714 | ) | ||||||||||||||||||||||||
|
|
|
|
|
|
|
|
|
|
|
|
|
|
|
|
|
|
|
|||||||||||||||||||
| Balance as of June 30, 2018 |
— | $ | — | 38,621,712 | $ | 4 | $ | 94,291 | $ | (4 | ) | $ | 264,262 | $ | 344 | $ | 358,897 | |||||||||||||||||||
|
|
|
|
|
|
|
|
|
|
|
|
|
|
|
|
|
|
|
|||||||||||||||||||
See accompanying notes to condensed consolidated financial statements.
5
Table of Contents
MARCUS & MILLICHAP, INC.
CONDENSED CONSOLIDATED STATEMENTS OF CASH FLOWS
(dollar amounts in thousands)
(Unaudited)
| Six Months Ended June 30, |
||||||||
| 2018 | 2017 | |||||||
| Cash flows from operating activities |
||||||||
| Net income |
$ | 40,178 | $ | 27,569 | ||||
| Adjustments to reconcile net income to net cash provided by operating activities: |
||||||||
| Depreciation and amortization expense |
2,878 | 2,600 | ||||||
| (Recovery) provision for bad debt expense |
(29 | ) | (54 | ) | ||||
| Stock-based compensation |
5,772 | 3,981 | ||||||
| Deferred taxes, net |
1,489 | 1,139 | ||||||
| Net realized (gains) losses on marketable securities, available-for-sale |
(12 | ) | (1 | ) | ||||
| Other non-cash items |
151 | 37 | ||||||
| Changes in operating assets and liabilities: |
||||||||
| Commissions receivable |
2,861 | (44 | ) | |||||
| Prepaid expenses |
2,006 | 1,144 | ||||||
| Prepaid rent |
482 | (1,803 | ) | |||||
| Asset held in rabbi trust |
— | (700 | ) | |||||
| Other assets |
(3,588 | ) | (10,625 | ) | ||||
| Accounts payable and other liabilities |
(1,525 | ) | (989 | ) | ||||
| Income tax receivable (payable) |
1,525 | 4,096 | ||||||
| Accrued bonuses and other employee related expenses |
(6,751 | ) | (7,418 | ) | ||||
| Deferred compensation and commissions |
(23,066 | ) | (19,036 | ) | ||||
| Deferred rent obligation and other liabilities |
675 | 566 | ||||||
|
|
|
|
|
|||||
| Net cash provided by operating activities |
23,046 | 462 | ||||||
| Cash flows from investing activities |
||||||||
| Acquisition, net of cash received |
(6,216 | ) | — | |||||
| Purchases of marketable securities, available-for-sale |
(57,411 | ) | (25,510 | ) | ||||
| Proceeds from sales and maturities of marketable securities, available-for-sale |
64,969 | 7,215 | ||||||
| Issuances of employee notes receivable |
(125 | ) | (344 | ) | ||||
| Payments received on employee notes receivable |
6 | 6 | ||||||
| Proceeds from sale of property and equipment |
— | 10 | ||||||
| Purchase of property and equipment |
(2,643 | ) | (3,384 | ) | ||||
|
|
|
|
|
|||||
| Net cash used in investing activities |
(1,420 | ) | (22,007 | ) | ||||
| Cash flows from financing activities |
||||||||
| Taxes paid related to net share settlement of stock-based awards |
(1,714 | ) | (1,402 | ) | ||||
| Proceeds from issuance of shares pursuant to employee stock purchase plan |
356 | 392 | ||||||
| Principal payments on notes payable to former stockholders |
(1,035 | ) | (986 | ) | ||||
|
|
|
|
|
|||||
| Net cash used in financing activities |
(2,393 | ) | (1,996 | ) | ||||
|
|
|
|
|
|||||
| Net increase (decrease) in cash and cash equivalents |
19,233 | (23,541 | ) | |||||
| Cash and cash equivalents at beginning of period |
220,786 | 187,371 | ||||||
|
|
|
|
|
|||||
| Cash and cash equivalents at end of period |
$ | 240,019 | $ | 163,830 | ||||
|
|
|
|
|
|||||
6
Table of Contents
MARCUS & MILLICHAP, INC.
CONDENSED CONSOLIDATED STATEMENTS OF CASH FLOWS (continued)
(dollar amounts in thousands)
(Unaudited)
| Six Months Ended June 30, |
||||||||
| 2018 | 2017 | |||||||
| Supplemental disclosures of cash flow information |
||||||||
| Interest paid during the period |
$ | 2,005 | $ | 1,881 | ||||
|
|
|
|
|
|||||
| Income taxes paid, net |
$ | 11,443 | $ | 12,318 | ||||
|
|
|
|
|
|||||
| Supplemental disclosures of noncash investing and financing activities |
||||||||
| Reduction of accrued bonuses and other employee related expenses in settlement of employee notes receivable |
$ | 192 | $ | 243 | ||||
|
|
|
|
|
|||||
| Change in property and equipment included in accounts payable and other liabilities |
$ | 179 | $ | (46 | ) | |||
|
|
|
|
|
|||||
See accompanying notes to condensed consolidated financial statements.
7
Table of Contents
MARCUS & MILLICHAP, INC.
NOTES TO CONDENSED CONSOLIDATED FINANCIAL STATEMENTS
| 1. | Description of Business and Basis of Presentation |
Description of Business
Marcus & Millichap, Inc., (the “Company”, “Marcus & Millichap”, or “MMI”), a Delaware corporation, is a brokerage firm specializing in commercial real estate investment sales, financing, research and advisory services. As of June 30, 2018, MMI operates 78 offices in the United States and Canada through its wholly-owned subsidiary, Marcus & Millichap Real Estate Investment Services, Inc. (“MMREIS”), which includes the operations of Marcus & Millichap Capital Corporation (“MMCC”).
Reorganization and Initial Public Offering
MMI was formed in June 2013 in preparation for Marcus & Millichap Company (“MMC”) to spin-off its majority owned subsidiary, MMREIS (“Spin-Off”). Prior to the initial public offering (“IPO”) of MMI, all of the preferred and common stockholders of MMREIS (including MMC and employees of MMREIS) contributed all of their outstanding shares to MMI, in exchange for new MMI common stock. As a result, MMREIS became a wholly-owned subsidiary of MMI. Thereafter, MMC distributed 80.0% of the shares of MMI common stock to MMC’s shareholders and exchanged the remaining portion of its shares of MMI common stock for cancellation of indebtedness of MMC. MMI completed its IPO on October 30, 2013.
Basis of Presentation
The financial information presented in the accompanying unaudited condensed consolidated financial statements, has been prepared in accordance with rules and regulations of the U.S. Securities and Exchange Commission (“SEC”) for quarterly reports on Form 10-Q and Article 10-01 of Regulation S-X. Accordingly, they do not include all of the information and footnotes required by U.S. generally accepted accounting principles (“U.S. GAAP”) for complete financial statements. In the opinion of management, the accompanying unaudited condensed consolidated financial statements and notes include all adjustments (consisting only of normal recurring adjustments) necessary for a fair presentation of the condensed consolidated financial position, results of operations and cash flows for the periods presented. These unaudited condensed consolidated financial statements should be read in conjunction with the annual audited consolidated financial statements and notes thereto for the year ended December 31, 2017 included in the Company’s Annual Report on Form 10-K filed on March 16, 2018 with the SEC. The results of the three and six months ended June 30, 2018 are not necessarily indicative of the results to be expected for the year ending December 31, 2018, or for other interim periods or future years.
Consolidation
The accompanying condensed consolidated financial statements include the accounts of the Company and its wholly-owned subsidiaries. All significant intercompany balances and transactions have been eliminated in consolidation.
Use of Estimates
The preparation of condensed consolidated financial statements in conformity with U.S. GAAP requires management to make estimates and assumptions that affect the reported amounts of assets and liabilities and the related disclosures at the date of the condensed consolidated financial statements and the reported amounts of revenues and expenses during the reporting period. Actual results could differ from those estimates.
| 2. | Accounting Policies and Recent Accounting Pronouncements |
Accounting Policies
The complete list of the Company’s accounting policies is included in the Company’s Annual Report on Form 10-K filed on March 16, 2018 with the SEC.
8
Table of Contents
MARCUS & MILLICHAP, INC.
NOTES TO CONDENSED CONSOLIDATED FINANCIAL STATEMENTS
Revenue Recognition
The Company generates real estate brokerage commissions by acting as a broker for real estate owners or investors seeking to buy or sell commercial properties. The Company generates financing fees from securing financing on purchase transactions as well as fees earned from refinancing its clients’ existing mortgage debt and other financing activities. Other revenues include fees generated from consulting and advisory services, as well as referral fees from other real estate brokers. The Company’s contracts contain one performance obligation related to its real estate brokerage, financing and consulting and advisory services offered to buyers and sellers of commercial real estate and provide that it is operating as a principal in all its revenue generating activities. The Company does not have multiple-element arrangements, variable consideration, financing components, significant noncash consideration, licenses, long-term contracts with customers or other items affecting the transaction price. Accordingly, the Company determined that the transaction price is fixed and determinable and collectability is reasonably assured. The Company recognizes revenue in principally all cases at the close of escrow for real estate brokerage, close of loan for financing and when services are provided or upon closing of the transaction for other revenues.
Mortgage Servicing Rights and Fees
Mortgage servicing rights (“MSRs”) are recorded at fair value upon acquisition of the servicing contract. The estimated net cash flows on the contracts are discounted over the estimated life of the underlying loan. The life of the underlying loan is estimated giving consideration to the prepayment provisions in the loan. The Company’s model assumes full prepayment of the loan at or near the point where the prepayment provisions have expired. The MSRs have principally similar risk characteristics.
The assumptions used to estimate the fair value of MSRs are based on internal models and are periodically compared to assumptions used by other market participants. Due to the relatively few transactions in the MSR market, we have experienced little volatility in the assumptions we use during the periods presented. Additionally, we do not expect to see much volatility in the assumptions for the foreseeable future. Management actively monitors the assumptions used and makes adjustments to those assumptions when market conditions change or other factors indicate such adjustments are warranted. We carry MSRs at the lower of the amortized cost or fair value and evaluate the carrying value for impairment quarterly. We engage a third party to assist in determining the estimated fair value of our existing MSRs quarterly.
All MSRs are amortized using the interest method over the period that servicing income is expected to be received. MSRs are included in other assets in the accompanying condensed consolidated balance sheet. See Note 5 – “Selected Balance Sheet Data” for additional information. Amortization related to the MSRs are included in depreciation and amortization expense in the accompanying condensed consolidated statements of net and comprehensive income.
We recognize mortgage servicing revenues upon the acquisition of a servicing obligation and at the time services are rendered, provided the loans are current and the debt service payments are made by the borrowers and when new servicing rights are acquired. The Company records servicing fees when earned. MSRs and related servicing fees are recorded in financing fees in the accompanying condensed consolidated statements of net and comprehensive income.
Capitalization of Internal Labor
Certain costs related to the development or purchases of internal-use software are capitalized. Internal computer software costs that are incurred in the preliminary project stage are expensed as incurred. Direct consulting costs and certain payroll and related costs that are incurred during the development stage of a project are capitalized and amortized using the straight-line method over estimated useful lives ranging from 3 to 7 years. Capitalized costs are recorded in the property and equipment, net caption and amortization is recorded in the depreciation and amortization caption in the condensed consolidated financial statements. Amortization begins for software that has been placed into production and is ready for its intended use. Post-implementation costs such as training, maintenance and support are expensed as incurred. The Company evaluates its capitalized software costs for impairment whenever events or changes in circumstances indicate that the carrying amount of such assets may not be recoverable.
Concentration of Credit Risk
Financial instruments that potentially subject the Company to a concentration of credit risk principally consist of cash and cash equivalents, due from independent contractors (included under other assets, net current and other assets non-current captions), investments in marketable securities, available-for-sale, security deposits (included under other assets, non-current caption) and commissions receivables. Cash and cash equivalents are placed with high-credit quality financial institutions and invested in high-credit quality money market funds and commercial paper. Concentrations of marketable securities, available-for-sale are limited by the approved investment policy.
To reduce its credit risk, the Company monitors the credit standing of the financial institutions that hold the Company’s cash and cash equivalents. The Company historically has not experienced any significant losses related to cash and cash equivalents.
9
Table of Contents
MARCUS & MILLICHAP, INC.
NOTES TO CONDENSED CONSOLIDATED FINANCIAL STATEMENTS
The Company derives its revenues from a broad range of real estate investors, owners, and users in the United States and Canada, none of which individually represents a significant concentration of credit risk. The Company requires collateral on a case-by-case basis. The Company maintains allowances, as needed, for estimated credit losses based on management’s assessment of the likelihood of collection. For the three and six months ended June 30, 2018 and 2017, no transaction represented 10% or more of total revenues. Further, while one transaction may represent 10% or more of commissions receivable at any reporting date, amounts due are typically collected within 10 days of settlement and, therefore, do not expose the Company to significant credit risk.
During the three and six months ended June 30, 2018 and 2017, the Company’s Canadian operations represented less than 1% of total revenues.
During the three and six months ended June 30, 2018 and 2017, no office represented 10% or more of total revenues.
Business Combinations
The Company accounts for business combinations using the acquisition method of accounting, under which the purchase price of the acquisition is allocated to the assets acquired and liabilities assumed using the fair values determined by management as of the acquisition date. The Company recognizes identifiable assets acquired and liabilities assumed (both specific and contingent) at their fair values at the acquisition date. Acquisition-related costs, such as due diligence, legal and accounting fees, are not capitalized or applied in determining the fair value of the acquired assets. The excess of the purchase price over the assets acquired, identifiable intangible assets and liabilities assumed is recognized as goodwill. During the measurement period, the Company records adjustments to the assets acquired and liabilities assumed with corresponding adjustments to goodwill in the reporting period in which the adjustment is identified. After the measurement period, which could be up to one year after the transaction date, subsequent adjustments are recorded in the Company’s consolidated statements of net and comprehensive income.
Goodwill
The Company evaluates goodwill for impairment annually in the fourth quarter. In addition to the annual impairment evaluation, the Company evaluates at least quarterly whether events or circumstances have occurred in the period subsequent to the annual impairment testing which indicate that it is more likely than not an impairment loss has occurred. The Company currently has only one reporting unit; therefore, all goodwill is allocated to that one reporting unit.
Intangible Assets
The Company’s intangible assets primarily include non-compete agreements and customer relationships that resulted from its business combinations. These intangible assets are amortized on a straight-line basis using a useful life between one and six years. The Company evaluates its intangible assets for impairment at least annually, or as events or changes in circumstances indicate the carrying value may be impaired.
Segment Reporting
The Company follows the guidance for segment reporting, which requires reporting information on operating segments in interim and annual financial statements. Substantially all of the Company’s operations involve the delivery of commercial real estate services to its customers including real estate investment sales, financing and consulting and advisory services. Management makes operating decisions, assesses performance and allocates resources based on an ongoing review of these integrated operations, which constitute the Company’s only operating segment for financial reporting purposes.
Recent Accounting Pronouncements
Adopted
In May 2014, the Financial Accounting Standards Board (“FASB”) issued Accounting Standards Update (“ASU”) 2014-09, Revenue from Contracts with Customers (“ASU 2014-09”), which supersedes virtually all of the existing revenue recognition guidance under U.S. GAAP, and requires entities to recognize revenue for the transfer to a customer of promised goods or services in an amount that reflects the consideration to which the entity expects to be entitled to receive in exchange for those goods or services. Subsequent to the issuance of ASU 2014-09, the FASB issued ASU 2015-14, Revenue from Contracts with Customers (Topic 606): Deferral of the Effective Date, ASU 2016-08, Revenue from Contacts with Customers: Principal Versus Agent Considerations, ASU 2016-10, Revenue from Contracts with Customers: Identifying Performance Obligations and Licensing, and ASU No. 2016-12, Revenue from Contracts with Customers: Narrow-Scope Improvements and Practical Expedients. The additional ASU’s clarified certain provisions of ASU 2014-09 in response to recommendations from the Transition Resources Group established by the FASB and extended the required adoption of ASU 2014-09 which is now effective for reporting periods beginning after December 15, 2017. The Company adopted the new standard on January 1, 2018 using the modified retrospective application method.
10
Table of Contents
MARCUS & MILLICHAP, INC.
NOTES TO CONDENSED CONSOLIDATED FINANCIAL STATEMENTS
The Company assessed the impact of the standard and determined that its contracts contain one performance obligation related to its real estate brokerage, financing and consulting and advisory services offered to buyers and sellers of commercial real estate and provide that it is operating as a principal in all of its revenue generating activities. The Company does not have multiple-element arrangements, variable consideration, financing components, significant noncash consideration, licenses, long-term contracts with customers or other items affecting the transaction price. The Company determined the transaction price is generally fixed and determinable and collectability is reasonably assured. Revenue was and will continue to be recognized in principally all cases at the close of escrow for real estate brokerage, close of loan for financing and when services are provided upon closing of the transaction for other revenues. Accordingly, the adoption of ASU 2014-09, as clarified, did not have an effect on the manner or timing of the recognition of the Company’s revenue.
In January 2017, the FASB issued ASU 2017-01, Business Combinations: Clarifying the Definition of a Business. ASU 2017-01 changed the definition of a business in an effort to assist entities with evaluating whether a set of transferred assets and activities is a business. ASU 2017-01 is effective for the Company on January 1, 2018.
In January 2017, the FASB issued ASU 2017-04, Intangibles—Goodwill and Other: Simplifying the Test for Goodwill Impairment. ASU 2017-04 simplifies the accounting for goodwill impairment by eliminating Step 2 from the goodwill impairment test. ASU 2017-04 is effective for the Company on January 1, 2020, with early adoption permitted. The qualitative assessment remains optional and is unchanged. The Company prospectively adopted ASU 2017-04 in the second quarter of 2018. There was no impact to the Company as the Company was not required to measure a goodwill impairment charge.
In February 2018, the FASB issued ASU No. 2018-02, Reclassification of Certain Tax Effects from Accumulated Other Comprehensive Income (“ASU 2018-02”). ASU 2018-02 is effective for reporting periods beginning after December 15, 2018 and early adoption is permitted. ASU 2018-02 permits Companies that elect to make the reclassification adjustment the option to apply the guidance retrospectively or to record the reclassification as of the beginning of the period of adoption. The Company adopted the new standard on January 1, 2018 and elected to make the reclassification adjustment pertaining to the stranded tax effects resulting from the enactment of the Tax Cuts and Jobs Act (the “Act”) from accumulated other comprehensive income to retained earnings as of the beginning of the period presented in the amount of $13,000.
Pending Adoption
In February 2016, the FASB issued ASU No. 2016-02, Leases, to increase transparency and comparability by recognizing lease assets and lease liabilities on the balance sheet and disclosing key information about leasing arrangements. The Company is still evaluating the impact of the new standard and has begun evaluating the population of all leases and related systems and internal control considerations. The Company will be required to adopt the new standard effective January 1, 2019, and the Company’s condensed consolidated balance sheets will be impacted by the recording of a lease liability and right of use asset for virtually all of its current operating leases. As of June 30, 2018, the Company has remaining contractual obligations for operating leases (autos and office) that aggregate approximately $88.3 million. Accordingly, the Company anticipates that the adoption of the new standard will have a material impact on the Company’s condensed consolidated balance sheet. The amount of which and the potential impact on the condensed consolidated statements of net and comprehensive income and condensed consolidated statements of cash flows has yet to be determined.
In June 2016, the FASB issued ASU No. 2016-13, Financial Instruments—Credit Losses (“ASU 2016-13”). ASU 2016-13 is effective for reporting periods beginning after December 15, 2019 and early adoption is permitted. For the Company, the new standard will be effective January 1, 2020. Under ASU 2016-13, the Company will be required to use an expected-loss model for its marketable securities, available-for sale, which requires that credit losses be presented as an allowance rather than as an impairment write-down. Reversals of credit losses (in situations in which the estimate of credit losses declines) is permitted in the reporting period that the change occurs. Current U.S. GAAP prohibits reflecting reversals of credit losses in current period earnings. At June 30, 2018, the Company had $117.4 million in marketable securities, available for sale which would be subject to this new standard. As of June 30, 2018, these marketable securities, available for sale have an average credit rating of AA and no impairment write-downs have been recorded. The Company is currently evaluating the impact of this new standard on its investment policy and investments.
11
Table of Contents
MARCUS & MILLICHAP, INC.
NOTES TO CONDENSED CONSOLIDATED FINANCIAL STATEMENTS
In June 2018, the FASB issued ASU No. 2018-7, Compensation-Stock Compensation (Topic 718): Improvements to Nonemployee Share-Based Payment Accounting (“ASU 2018-7”). ASU 2018-7 is effective for reporting periods beginning after December 15, 2018, including interim periods within that reporting period. Early adoption is permitted, including in interim periods, but no earlier than an entity’s adoption of ASC 606, Revenue from Contracts with Customers. For the Company, the new standard will be effective during the first quarter of 2019 with early adoption permitted and will require equity-classified share-based payment awards issued to nonemployees to be measured based on the grant date price, instead of the previous requirement to remeasure the awards through the performance completion date. All liability-classified awards that have not been settled and equity-classified awards for which a measurement date has not been established by the adoption date would be remeasured at fair value as of the adoption date with a cumulative effect adjustment to opening retained earnings in the fiscal year of adoption. The Company is currently evaluating the impact and potential implementation timing of this new standard on its consolidated financial statements.
| 3. | Acquisition |
During the second quarter, the Company completed two related acquisitions for approximately $6.2 million, net of cash received, plus contingent consideration which may be paid over the three-year or five-year period after the acquisitions based on achievement of certain EBITDA targets. The Company determined the fair value of the contingent consideration was $1.7 million using a probability-weighted, discounted cash flow estimate based on achieving EBITDA targets. See Note 9 – “Fair Value Measurements” for additional information.
The acquisitions expand the Company’s network of loan originators and provides further diversification to its loan origination platform and financing services. The operations will be merged into the Company’s existing operations.
The acquisitions were accounted for as a business combination, with the results of operations included in the Company’s consolidated results from the acquisition date through June 30, 2018, which were not material. Based on a preliminary purchase price allocation, $2.0 million, net, was allocated to mortgage servicing assets ($2.1 million) and liabilities ($0.1 million), $1.6 million was allocated to the fair values of intangible assets, $0.1 million to acquired working capital, with the remainder of $4.2 million allocated to goodwill.
Goodwill and other intangible assets consisted of the following (in thousands):
| June 30, 2018 |
December, 31 2017 |
|||||||
| Goodwill |
$ | 4,186 | $ | — | ||||
| Other intangible assets, net of amortization |
1,541 | — | ||||||
|
|
|
|
|
|||||
| Total intangible assets |
$ | 5,727 | $ | — | ||||
|
|
|
|
|
|||||
The net change in the carrying value of other intangible assets consisted of the following (in thousands):
| Six Months Ended June 30, |
||||||||
| 2018 | 2017 | |||||||
| Beginning balance |
$ | — | $ | — | ||||
| Additions from acquisition |
1,571 | — | ||||||
| Amortization |
(30 | ) | — | |||||
|
|
|
|
|
|||||
| Ending balance |
$ | 1,541 | $ | — | ||||
|
|
|
|
|
|||||
The goodwill recorded as part of the acquisitions arose from the acquired assembled workforce and commercial lending platform. The Company expects all of goodwill to be tax deductible, with the tax-deductible amount of goodwill related to the contingent consideration to be determined once the cash payments to settle the contingent consideration are made. The goodwill resulting from these acquisitions is allocated to the Company’s one reporting unit.
During the six months ended June 30, 2018, the Company adjusted the contingent consideration by an immaterial amount and did not make any cash payments related to the contingent consideration.
12
Table of Contents
MARCUS & MILLICHAP, INC.
NOTES TO CONDENSED CONSOLIDATED FINANCIAL STATEMENTS
| 4. | Property and Equipment |
Property and equipment, net consisted of the following (in thousands):
| June 30, 2018 |
December, 31 2017 |
|||||||
| Computer software and hardware equipment |
$ | 17,172 | $ | 16,247 | ||||
| Furniture, fixtures, and equipment |
22,744 | 21,695 | ||||||
| Less: accumulated depreciation and amortization |
(22,757 | ) | (20,789 | ) | ||||
|
|
|
|
|
|||||
| $ | 17,159 | $ | 17,153 | |||||
|
|
|
|
|
|||||
During the six months ended June 30, 2018 and 2017, the Company wrote off approximately $0.8 million and $1.1 million, respectively, of fully depreciated computer software and hardware and furniture, fixtures and equipment.
| 5. | Selected Balance Sheet Data |
Other Assets
Other assets consisted of the following (in thousands):
| Current | Non-Current | |||||||||||||||
| June 30, 2018 |
December 31, 2017 |
June 30, 2018 |
December 31, 2017 |
|||||||||||||
| Mortgage servicing rights, net of amortization |
$ | — | $ | — | $ | 2,121 | $ | — | ||||||||
| Due from independent contractors, net (1) (2) |
2,989 | 3,672 | 25,780 | 21,726 | ||||||||||||
| Security deposits |
— | — | 1,151 | 1,158 | ||||||||||||
| Employee notes receivable (3) |
244 | 366 | 154 | 255 | ||||||||||||
| Customer trust accounts and other |
1,685 | 1,491 | 44 | 24 | ||||||||||||
|
|
|
|
|
|
|
|
|
|||||||||
| $ | 4,918 | $ | 5,529 | $ | 29,250 | $ | 23,163 | |||||||||
|
|
|
|
|
|
|
|
|
|||||||||
| (1) | Represents amounts advanced, notes receivable and other receivables due from the Company’s investment sales and financing professionals. The notes receivable along with interest, are typically collected from future commissions and are generally due in one to five years. |
| (2) | Includes allowance for doubtful accounts related to current receivables of $409 and $494 as of June 30, 2018 and December 31, 2017, respectively. The Company recorded a provision (recovery) for bad debt expense of $77 and $(10) and wrote off $4 and $(6) of these receivables for the three months ended June 30, 2018 and 2017, respectively. The Company recorded a (recovery) provision for bad debt expense of $(29) and $(54) and wrote off $55 and $10 of these receivables for the six months ended June 30, 2018 and 2017, respectively. Any cash receipts on notes are applied first to unpaid principal balance prior to any income being recognized. |
| (3) | See Note 8 – “Related-Party Transactions” for additional information. |
The net change in the carrying value of MSRs consisted of the following (in thousands):
| Six Months Ended June 30, |
||||||||
| 2018 | 2017 | |||||||
| Beginning balance |
$ | — | $ | — | ||||
| Additions from acquisition |
2,121 | — | ||||||
| Additions |
41 | — | ||||||
| Amortization |
(41 | ) | — | |||||
|
|
|
|
|
|||||
| Ending balance |
$ | 2,121 | $ | — | ||||
|
|
|
|
|
|||||
See Note 9 – “Fair Value Measurements” for additional information about MSRs.
13
Table of Contents
MARCUS & MILLICHAP, INC.
NOTES TO CONDENSED CONSOLIDATED FINANCIAL STATEMENTS
Deferred Compensation and Commissions
Deferred compensation and commissions consisted of the following (in thousands):
| Current | Non-Current | |||||||||||||||
| June 30, 2018 |
December 31, 2017 |
June 30, 2018 |
December 31, 2017 |
|||||||||||||
| Stock appreciation rights (“SARs”) liability (1) |
$ | 1,895 | $ | 1,662 | $ | 18,931 | $ | 20,217 | ||||||||
| Commissions payable to investment sales and financing professionals |
30,707 | 46,257 | 14,917 | 21,924 | ||||||||||||
| Deferred compensation liability (1) |
1,505 | 1,261 | 7,709 | 7,220 | ||||||||||||
|
|
|
|
|
|
|
|
|
|||||||||
| $ | 34,107 | $ | 49,180 | $ | 41,557 | $ | 49,361 | |||||||||
|
|
|
|
|
|
|
|
|
|||||||||
| (1) | The SARs and deferred compensation liability become subject to payout as a result of a participant no longer being considered as a service provider. As a result of the retirement of certain participants, estimated amounts to be paid to the participants within the next twelve months has been classified as current. |
SARs Liability
Prior to the IPO, certain employees of the Company were granted SARs under a stock-based compensation program assumed by MMC. In connection with the IPO, the SARs agreements were revised, the MMC liability of $20.0 million for the SARs was frozen as of March 31, 2013, and was transferred to MMI through a capital distribution. The SARs liability will be settled with each participant in ten annual installments in January of each year upon retirement or termination from service, or in full upon consummation of a change in control of the Company.
Under the revised agreements, MMI is required to accrue interest on the outstanding balance beginning on January 1, 2014 at a rate based on the 10-year treasury note plus 2%. The rate resets annually. The rates at January 1, 2018 and 2017 were 4.409% and 4.446%, respectively. MMI recorded interest expense related to this liability of $224,000 and $233,000, for the three months ended June 30, 2018 and 2017, respectively, and $449,000 and $466,000 for the six months ended June 30, 2018 and 2017, respectively.
Estimated payouts within the next twelve months for participants that have separated from service have been classified as current. During the six months ended June 30, 2018, the Company made total payments (consisting of accumulated interest) of $1.5 million classified as an operating cash flow in the deferred compensation and commissions caption in the accompanying condensed consolidated statement of cash flows.
Commissions Payable
Certain investment sales professionals have the ability to earn additional commissions after meeting certain annual revenue thresholds. These commissions are recognized as cost of services in the period in which they are earned as they relate to specific transactions closed. The Company has the ability to defer payment of certain commissions, at its election, for up to three years. Commissions payable that are not expected to be paid within twelve months are classified as long-term.
Deferred Compensation Liability
A select group of management is eligible to participate in the Marcus & Millichap Deferred Compensation Plan (the “Deferred Compensation Plan”). The plan is a non-qualified deferred compensation plan that is intended to comply with Section 409A of the Internal Revenue Code and permits the participant to defer compensation up to limits as determined by the plan. Amounts are paid out generally when the participant is no longer a service provider; however, an in-service payout election is available to participants. Participants may elect to receive payouts as a lump sum or quarterly over a two to fifteen-year period. The Company elected to fund the Deferred Compensation Plan through company owned variable life insurance policies. The Deferred Compensation Plan is managed by a third-party institutional fund manager, and the deferred compensation and investment earnings are held as a Company asset in a rabbi trust, which is recorded in assets held in rabbi trust in the accompanying condensed consolidated balance sheets. The assets in the trust are restricted unless the Company becomes insolvent, in which case the trust assets are subject to the claims of MMI’s creditors. The Company may also, in its sole and absolute discretion, elect to withdraw at any time a portion of the trust assets by an amount by which the fair market value of the trust assets exceeds 110% of the aggregate deferred compensation liability represented by the participants’ accounts. Estimated payouts within the next twelve months for participants that have separated from service have been classified as current. During the six months ended June 30, 2018, the Company made total payments to participants of $387,000.
14
Table of Contents
MARCUS & MILLICHAP, INC.
NOTES TO CONDENSED CONSOLIDATED FINANCIAL STATEMENTS
The net change in the carrying value of the assets held in the rabbi trust and the net change in the carrying value of the deferred compensation liability, each exclusive of additional contributions, distributions and trust expenses consisted of the following (in thousands):
| Three Months Ended June 30, |
Six Months Ended June 30, |
|||||||||||||||
| 2018 | 2017 | 2018 | 2017 | |||||||||||||
| Increase in the carrying value of the assets held in the rabbi trust (1) |
$ | 176 | $ | 170 | $ | 190 | $ | 369 | ||||||||
|
|
|
|
|
|
|
|
|
|||||||||
| Increase in the net carrying value of the deferred compensation obligation (2) |
$ | 188 | $ | 188 | $ | 188 | $ | 399 | ||||||||
|
|
|
|
|
|
|
|
|
|||||||||
| (1) | Recorded in other income (expense), net in the condensed consolidated statements of net and comprehensive income. |
| (2) | Recorded in selling, general and administrative expense in the condensed consolidated statements of net and comprehensive income. |
| 6. | Investments in Marketable Securities |
Amortized cost and fair value of marketable securities, available-for-sale, by type of security consisted of the following (in thousands):
| June 30, 2018 | December 31, 2017 | |||||||||||||||||||||||||||||||
| Amortized Cost |
Gross Unrealized Gains |
Gross Unrealized Losses |
Fair Value |
Amortized Cost |
Gross Unrealized Gains |
Gross Unrealized Losses |
Fair Value |
|||||||||||||||||||||||||
| Short-term investments: |
||||||||||||||||||||||||||||||||
| U.S. treasuries |
$ | 74,147 | $ | — | $ | (136 | ) | $ | 74,011 | $ | 57,712 | $ | — | $ | (88 | ) | $ | 57,624 | ||||||||||||||
| U.S. government sponsored entities |
3,510 | — | (27 | ) | 3,483 | 7,016 | — | (8 | ) | 7,008 | ||||||||||||||||||||||
| Corporate debt securities |
7,907 | — | (15 | ) | 7,892 | 8,931 | — | (3 | ) | 8,928 | ||||||||||||||||||||||
| Asset-backed securities and other |
100 | — | — | 100 | — | — | — | — | ||||||||||||||||||||||||
|
|
|
|
|
|
|
|
|
|
|
|
|
|
|
|
|
|||||||||||||||||
| $ | 85,664 | $ | — | $ | (178 | ) | $ | 85,486 | $ | 73,659 | $ | — | $ | (99 | ) | $ | 73,560 | |||||||||||||||
|
|
|
|
|
|
|
|
|
|
|
|
|
|
|
|
|
|||||||||||||||||
| Long-term investments: |
||||||||||||||||||||||||||||||||
| U.S. treasuries |
$ | 3,726 | $ | — | $ | (169 | ) | $ | 3,557 | $ | 18,111 | $ | 7 | $ | (164 | ) | $ | 17,954 | ||||||||||||||
| U.S. government sponsored entities |
1,663 | — | (73 | ) | 1,590 | 5,306 | — | (62 | ) | 5,244 | ||||||||||||||||||||||
| Corporate debt securities |
20,614 | — | (513 | ) | 20,101 | 22,505 | 268 | (54 | ) | 22,719 | ||||||||||||||||||||||
| Asset-backed securities and other |
6,721 | 5 | (57 | ) | 6,669 | 6,180 | 17 | (15 | ) | 6,182 | ||||||||||||||||||||||
|
|
|
|
|
|
|
|
|
|
|
|
|
|
|
|
|
|||||||||||||||||
| $ | 32,724 | $ | 5 | $ | (812 | ) | $ | 31,917 | $ | 52,102 | $ | 292 | $ | (295 | ) | $ | 52,099 | |||||||||||||||
|
|
|
|
|
|
|
|
|
|
|
|
|
|
|
|
|
|||||||||||||||||
The amortized cost and fair value of the Company’s investments in available-for-sale securities that have been in a continuous unrealized loss position consisted of the following (in thousands):
| June 30, 2018 | December 31, 2017 | |||||||||||||||
| Unrealized Loss |
Fair Value |
Unrealized Loss |
Fair Value |
|||||||||||||
| Less than 12 months |
$ | (721 | ) | $ | 95,835 | $ | (158 | ) | $ | 63,229 | ||||||
|
|
|
|
|
|
|
|
|
|||||||||
| 12 months or longer |
$ | (269 | ) | $ | 19,988 | $ | (236 | ) | $ | 44,961 | ||||||
|
|
|
|
|
|
|
|
|
|||||||||
Gross realized gains and gross realized losses from the sales of the Company’s available-for-sale securities consisted of the following (in thousands):
| Three Months Ended June 30, |
Six Months Ended June 30, |
|||||||||||||||
| 2018 | 2017 | 2018 | 2017 | |||||||||||||
| Gross realized gains (1) |
$ | 12 | $ | 1 | $ | 12 | $ | 1 | ||||||||
|
|
|
|
|
|
|
|
|
|||||||||
| Gross realized losses (1) |
$ | — | $ | — | $ | — | $ | — | ||||||||
|
|
|
|
|
|
|
|
|
|||||||||
| (1) | Recorded in other income (expense), net in the condensed consolidated statements of net and comprehensive income. The cost basis of securities sold were determined based on the specific identification method. |
15
Table of Contents
MARCUS & MILLICHAP, INC.
NOTES TO CONDENSED CONSOLIDATED FINANCIAL STATEMENTS
As of June 30, 2018, the Company considers the declines in market value of its marketable securities, available-for-sale to be temporary in nature and does not consider any of its investments other-than-temporarily impaired. The Company typically invests in highly-rated securities, and its investment policy generally limits the amount of credit exposure to any one issuer. The policy generally requires investments to be investment grade, with the primary objective of minimizing the potential risk of principal loss and matching long-term liabilities. When evaluating an investment for other-than-temporary impairment the Company reviews factors such as the length of time and extent to which fair value has been below its cost basis, the financial condition of the issuer and any changes thereto, changes in market interest rates and the Company’s intent to sell, or whether it is more likely than not that it will be required to sell the investment before recovery of the investment’s cost basis. The Company has no current intent to sell, and it is not more likely than not that the Company will be required to sell these investments before recovery of their amortized cost basis, which may be at maturity. The Company may sell certain of its marketable securities, available-for-sale prior to their stated maturities for strategic reasons including, but not limited to, anticipated liquidity and capital requirements, anticipated credit deterioration, duration management or when a security no longer meets the criteria of the Company’s investment policy.
Amortized cost and fair value of marketable securities, available-for-sale, by contractual maturity consisted of the following (in thousands):
| June 30, 2018 | December 31, 2017 | |||||||||||||||
| Amortized Cost |
Fair Value |
Amortized Cost |
Fair Value |
|||||||||||||
| Due in one year or less |
$ | 85,664 | $ | 85,486 | $ | 73,659 | $ | 73,560 | ||||||||
| Due after one year through five years |
11,217 | 11,087 | 30,644 | 30,517 | ||||||||||||
| Due after five years through ten years |
15,648 | 15,125 | 15,090 | 15,200 | ||||||||||||
| Due after ten years |
5,859 | 5,705 | 6,368 | 6,382 | ||||||||||||
|
|
|
|
|
|
|
|
|
|||||||||
| $ | 118,388 | $ | 117,403 | $ | 125,761 | $ | 125,659 | |||||||||
|
|
|
|
|
|
|
|
|
|||||||||
| Weighted average contractual maturity |
2.5 years | 2.6 years | ||||||||||||||
Actual maturities may differ from contractual maturities because certain borrowers have the right to prepay certain obligations with or without prepayment penalties.
| 7. | Notes Payable to Former Stockholders |
In conjunction with the Spin-Off and IPO, notes payable to certain former stockholders of MMREIS were issued in settlement of restricted stock and SARs awards that were redeemed by MMREIS upon the termination of employment by the former stockholders (“the Notes”). Such Notes had been previously assumed by MMC, and were transferred to the Company. The Notes are unsecured and bear interest at 5% with annual principal and interest installments with a final principal payment due during the second quarter of 2020. During each of the six months ended June 30, 2018 and 2017, the Company made total payments on the Notes of $1.5 million, including principal and interest.
Accrued interest included in accounts payable and other liabilities in the accompanying condensed consolidated balance sheets pertaining to the Notes consisted of the following (in thousands):
| June 30, 2018 |
December 31, 2017 |
|||||||
| Accrued interest |
$ | 78 | $ | 305 | ||||
|
|
|
|
|
|||||
Interest expense pertaining to the Notes consisted of the following (in thousands):
| Three Months Ended June 30, |
Six Months Ended June 30, |
|||||||||||||||
| 2018 | 2017 | 2018 | 2017 | |||||||||||||
| Interest expense |
$ | 102 | $ | 113 | $ | 211 | $ | 235 | ||||||||
|
|
|
|
|
|
|
|
|
|||||||||
16
Table of Contents
MARCUS & MILLICHAP, INC.
NOTES TO CONDENSED CONSOLIDATED FINANCIAL STATEMENTS
| 8. | Related-Party Transactions |
Shared and Transition Services
Prior to October 2013, the Company operated under a shared services arrangement with MMC whereby the Company was charged for actual costs specifically incurred on behalf of the Company or allocated to the Company on a pro rata basis. Beginning in October 2013, certain services are provided to the Company under a Transition Services Agreement (“TSA”) between MMC and the Company, which replaced the pre-IPO shared services arrangement. The TSA is intended to provide certain services until the Company acquires the services separately. During the three months ended June 30, 2018 and 2017, the Company incurred net costs of $55,000 and $43,000 under the TSA, respectively. During the six months ended June 30, 2018 and 2017, the Company incurred net costs of $127,000 and $125,000 under the TSA, respectively. These amounts are included in selling, general and administrative expense in the accompanying condensed consolidated statements of net and comprehensive income.
Brokerage and Financing Services with the Subsidiaries of MMC
MMC has wholly or majority owned subsidiaries that buy and sell commercial real estate properties. The Company performs certain brokerage and financing services related to transactions of the subsidiaries of MMC. For the three months ended June 30, 2018 and 2017, the Company earned real estate brokerage commissions and financing fees of $560,000 and $120,000, respectively, from transactions with subsidiaries of MMC related to these services. The Company incurred cost of services of $321,000 and $65,000, respectively, related to these revenues. For the six months ended June 30, 2018 and 2017, the Company earned real estate brokerage commissions and financing fees of $3.1 million and $323,000, respectively, from subsidiaries of MMC related to these services. The Company incurred cost of services of $1.8 million and $187,000, respectively, related to these revenues.
Operating Lease with MMC
The Company has an operating lease with MMC for a single story office building located in Palo Alto, California, which expires on May 31, 2022. Rent expense for this lease aggregated $255,000 and $253,000 for the three months ended June 30, 2018 and 2017 respectively. Rent expense for this lease aggregated $508,000 and 506,000 for the six months ended June 30, 2018 and 2017 respectively. Rent expense is included in selling, general and administrative expense in the accompanying condensed consolidated statements of net and comprehensive income.
Accounts Payable and Other Liabilities with MMC
As of June 30, 2018 and December 31, 2017, accounts payable and other liabilities with MMC totaling $105,000 and $91,000, respectively, remain unpaid and are included in accounts payable and other liabilities in the accompanying condensed consolidated balance sheets.
Other
The Company makes advances to non-executive employees from time-to-time. At June 30, 2018 and December 31, 2017, the aggregate principal amount for employee notes receivable was $398,000 and $621,000, respectively, which is included in other assets (current and non-current), in the accompanying condensed consolidated balance sheets. See Note 5 – “Selected Balance Sheet Data” for additional information.
As of June 30, 2018, George M. Marcus, the Company’s founder and Co-Chairman, beneficially owned approximately 44% of the Company’s issued and outstanding common stock, including shares owned by Phoenix Investments Holdings, LLC and the Marcus Family Foundation II.
| 9. | Fair Value Measurements |
U.S. GAAP defines the fair value of a financial instrument as the amount that would be received from the sale of an asset in an orderly transaction between market participants at the measurement date. The Company is responsible for the determination of the value of the investment carried at fair value and the supporting methodologies and assumptions. The Company uses various pricing sources to validate the values utilized.
The degree of judgment used in measuring the fair value of financial instruments is generally inversely correlated with the level of observable valuation inputs. Financial instruments with quoted prices in active markets generally have more pricing observability and less judgment is used in measuring fair value. Financial instruments for which no quoted prices are available have less observability and are measured at fair value using valuation models or other pricing techniques that require more judgment.
17
Table of Contents
MARCUS & MILLICHAP, INC.
NOTES TO CONDENSED CONSOLIDATED FINANCIAL STATEMENTS
Assets recorded at fair value are measured and classified in accordance with a fair value hierarchy consisting of the three “levels” based on the observability of inputs available in the marketplace used to measure the fair values as discussed below:
Level 1: Unadjusted quoted prices in active markets that are accessible at the measurement date for identical, unrestricted assets or liabilities;
Level 2: Quoted prices in markets that are not active, or inputs which are observable, either directly or indirectly, for substantially the full term of the asset or liability; or
Level 3: Inputs reflect management’s best estimate of what market participants would use in pricing the asset or liability at the measurement date. Consideration is given to the risk inherent in the valuation technique and the risk inherent in the inputs to the model.
Investment in marketable securities, available-for-sale and assets held in the rabbi trust are carried at fair value based on observable inputs available. All these securities are measured as Levels 1 or 2 as appropriate.
Recurring Fair Value Measurements
The Company values its investments including assets held in rabbi trust, commercial paper, money market funds and investments in marketable securities, available-for-sale at fair value on a recurring basis. Fair values were determined for each individual security in the investment portfolio.
Assets carried at fair value are categorized into one of the three categories described above and consisted of the following (in thousands):
| June 30, 2018 | December 31, 2017 | |||||||||||||||||||||||||||||||
| Fair Value | Level 1 | Level 2 | Level 3 | Fair Value | Level 1 | Level 2 | Level 3 | |||||||||||||||||||||||||
| Assets held in rabbi trust |
$ | 8,890 | $ | — | $ | 8,890 | $ | — | $ | 8,787 | $ | — | $ | 8,787 | $ | — | ||||||||||||||||
|
|
|
|
|
|
|
|
|
|
|
|
|
|
|
|
|
|||||||||||||||||
| Cash equivalents (1): |
||||||||||||||||||||||||||||||||
| Commercial paper |
$ | 14,824 | $ | — | $ | 14,824 | $ | — | $ | 11,441 | $ | — | $ | 11,441 | $ | — | ||||||||||||||||
| Money market funds |
186,412 | 186,412 | — | — | 157,788 | 157,788 | — | — | ||||||||||||||||||||||||
|
|
|
|
|
|
|
|
|
|
|
|
|
|
|
|
|
|||||||||||||||||
| $ | 201,236 | $ | 186,412 | $ | 14,824 | $ | — | $ | 169,229 | $ | 157,788 | $ | 11,441 | $ | — | |||||||||||||||||
|
|
|
|
|
|
|
|
|
|
|
|
|
|
|
|
|
|||||||||||||||||
| Marketable securities, available-for-sale: |
||||||||||||||||||||||||||||||||
| Short-term investments: |
||||||||||||||||||||||||||||||||
| U.S. treasuries |
$ | 74,011 | $ | 74,011 | $ | — | $ | — | $ | 57,624 | $ | 57,624 | $ | — | $ | — | ||||||||||||||||
| U.S. government sponsored entities |
3,483 | — | 3,483 | — | 7,008 | — | 7,008 | — | ||||||||||||||||||||||||
| Corporate debt securities |
7,892 | — | 7,892 | — | 8,928 | — | 8,928 | — | ||||||||||||||||||||||||
| Asset-backed securities and other |
100 | — | 100 | — | — | — | — | — | ||||||||||||||||||||||||
|
|
|
|
|
|
|
|
|
|
|
|
|
|
|
|
|
|||||||||||||||||
| $ | 85,486 | $ | 74,011 | $ | 11,475 | $ | — | $ | 73,560 | $ | 57,624 | $ | 15,936 | $ | — | |||||||||||||||||
|
|
|
|
|
|
|
|
|
|
|
|
|
|
|
|
|
|||||||||||||||||
| Long-term investments: |
||||||||||||||||||||||||||||||||
| U.S. treasuries |
$ | 3,557 | $ | 3,557 | $ | — | $ | — | $ | 17,954 | $ | 17,954 | $ | — | $ | — | ||||||||||||||||
| U.S. government sponsored entities |
1,590 | — | 1,590 | — | 5,244 | — | 5,244 | — | ||||||||||||||||||||||||
| Corporate debt securities |
20,101 | — | 20,101 | — | 22,719 | — | 22,719 | — | ||||||||||||||||||||||||
| Asset-backed securities and other |
6,669 | — | 6,669 | — | 6,182 | — | 6,182 | — | ||||||||||||||||||||||||
|
|
|
|
|
|
|
|
|
|
|
|
|
|
|
|
|
|||||||||||||||||
| $ | 31,917 | $ | 3,557 | $ | 28,360 | $ | — | $ | 52,099 | $ | 17,954 | $ | 34,145 | $ | — | |||||||||||||||||
|
|
|
|
|
|
|
|
|
|
|
|
|
|
|
|
|
|||||||||||||||||
| (1) | Included in cash and cash equivalents on the accompanying condensed consolidated balance sheet. |
The Company values contingent consideration from its acquisitions at fair value on a recurring basis and is a Level 3 valuation. At June 30, 2018, the fair value of the contingent consideration was $1.7 million using a probability weighted, discounted cash flow estimate based on achieving EBITDA targets.
There were no transfers in or out of Level 1 and Level 2 during the six months ended June 30, 2018.
18
Table of Contents
MARCUS & MILLICHAP, INC.
NOTES TO CONDENSED CONSOLIDATED FINANCIAL STATEMENTS
Nonrecurring Fair Value Measurements
In accordance with U.S. GAAP, from time to time, the Company measures certain assets at fair value on a nonrecurring basis. These assets include MSRs. MSRs are recorded at fair value upon initial recording and the Company has elected the amortization method for the subsequent measurement of MSRs. The Company’s MSRs do not trade in an active, open market with readily observable prices. The estimated fair value of the Company’s MSRs, which are considered Level 3, were developed using discounted cash flow models that calculate the present value of estimated future net servicing income. The model considers contractually specified servicing fees, prepayment assumptions, delinquency rates, late charges, other ancillary revenue, costs to service, and other economic factors. The Company periodically reassesses and adjusts, when necessary, the underlying inputs and assumptions used in the model to reflect observable market conditions and assumptions that a market participant would consider in valuing an MSR asset. MSRs are carried at the lower of amortized cost or fair value. The fair value of the MSRs approximated the carrying value at June 30, 2018.
| 10. | Stockholders’ Equity |
Common Stock
As of June 30, 2018 and December 31, 2017, there were 38,621,712 and 38,374,011 shares of common stock, $0.0001 par value, issued and outstanding, which includes unvested restricted stock awards issued to non-employee directors, respectively. See Note 13 – “Earnings per Share” for additional information.
Preferred Stock
The Company has 25,000,000 authorized shares of preferred stock with a par value $0.0001 per share. At June 30, 2018 and December 31, 2017, there were no preferred shares issued or outstanding.
Accumulated Other Comprehensive (Loss) Income
The components of accumulated other comprehensive income as of June 30, 2018, by component, net of income taxes consisted of the following (in thousands):
| Unrealized gains and (losses) of available-for-sale securities |
Foreign currency translation (3) |
Total | ||||||||||
| Beginning balance, December 31, 2017 |
$ | (62 | ) | $ | 1,002 | $ | 940 | |||||
| Cumulative effect of change in accounting principle (1) |
(13 | ) | — | (13 | ) | |||||||
|
|
|
|
|
|
|
|||||||
| Balance at January 1, 2018, as adjusted |
(75 | ) | 1,002 | 927 | ||||||||
|
|
|
|
|
|
|
|||||||
| Other comprehensive (loss) income before reclassifications |
(664 | ) | 73 | (591 | ) | |||||||
| Amounts reclassified from accumulated other comprehensive (loss) income (2) |
8 | — | 8 | |||||||||
|
|
|
|
|
|
|
|||||||
| Net current-period other comprehensive (loss) income |
(656 | ) | 73 | (583 | ) | |||||||
|
|
|
|
|
|
|
|||||||
| Ending balance, June 30, 2018 |
$ | (731 | ) | $ | 1,075 | $ | 344 | |||||
|
|
|
|
|
|
|
|||||||
| (1) | Relates to reclassification of stranded tax effects from accumulated other comprehensive income to retained earnings as a result of adoption of ASU 2018-02. See Note 2 – “Accounting Policies and Recent Accounting Pronouncements” for additional information. |
| (2) | Included as a component of other income (expense), net in the condensed consolidated statements of net and comprehensive income. The reclassifications were determined on a specific identification basis. |
| (3) | The Company has not provided for U.S. taxes on unremitted earnings of its foreign subsidiary as it is operating at a loss and has no earnings and profits to remit. As a result, deferred taxes were not provided related to the cumulative foreign currency translation adjustments. |
| 11. | Stock-Based Compensation Plans |
2013 Omnibus Equity Incentive Plan
The board of directors adopted the 2013 Omnibus Equity Incentive Plan (“2013 Plan”), which became effective upon the Company’s IPO. In February 2017, the board of directors amended and restated the 2013 Plan, which was approved by the shareholders in May 2017. Grants are made from time to time by the Company’s board of directors at its discretion subject to certain restrictions as to the number and value of shares that may be granted to any individual. Upon adoption of the 2013 Plan, 5,500,000 shares of common stock were initially reserved for the issuance of awards. Pursuant to the automatic increases previously provided for in the 2013 Plan, the board of directors approved share reserve increases aggregating 3,300,000. Pursuant to the amendment and restatement of the 2013 Plan referenced above, the automatic share increase provision was removed. As of June 30, 2018, there were 5,472,696 shares available for future grants under the Plan.
19
Table of Contents
MARCUS & MILLICHAP, INC.
NOTES TO CONDENSED CONSOLIDATED FINANCIAL STATEMENTS
Awards Granted and Settled
Under the 2013 Plan, the Company has issued restricted stock awards (“RSAs”) to non-employee directors and restricted stock units (“RSUs”) to employees and independent contractors. RSAs vest in equal annual installments over a one-year or three-year period from the date of grant. All RSUs vest in equal annual installments over a five-year period from the date of grant. Any unvested awards are canceled upon termination as a service provider. Awards accelerate upon death subject to approval by the compensation committee. As of June 30, 2018, there were no issued or outstanding options, SARs, performance units or performance shares awards under the 2013 Plan.
During the six months ended June 30, 2018, 274,740 shares of RSUs vested of which 274,740 shares of common stock were delivered and 52,919 shares of common stock were withheld to pay applicable required employee statutory withholding taxes based on the market value of the shares on the vesting date. The shares withheld for taxes were returned to the share reserve and are available for future issuance in accordance with provisions of the 2013 Plan.
Outstanding Awards
Activity under the 2013 Plan consisted of the following (dollars in thousands, except per share data):
| RSA Grants to Non-employee Directors |
RSU Grants to Employees |
RSU Grants to Independent Contractors |
Total | Weighted- Average Grant Date Fair Value Per Share |
||||||||||||||||
| Nonvested shares at December 31, 2017 |
30,732 | 500,859 | 450,264 | 981,855 | $ | 23.90 | ||||||||||||||
|
|
|
|
|
|
|
|
|
|
|
|||||||||||
| Granted |
||||||||||||||||||||
| February 2018 |
— | 106,419 | 20,293 | 126,712 | ||||||||||||||||
| March 2018 |
— | 15,000 | — | 15,000 | ||||||||||||||||
| May 2018 |
12,852 | 4,854 | 14,280 | 31,986 | ||||||||||||||||
|
|
|
|
|
|
|
|
|
|||||||||||||
| Total Granted |
12,852 | 126,273 | 34,573 | 173,698 | 32.90 | |||||||||||||||
| Vested |
(12,936 | ) | (138,229 | ) | (136,511 | ) | (287,676 | ) | 21.13 | |||||||||||
| Transferred |
— | — | — | — | — | |||||||||||||||
| Forfeited/canceled |
— | (1,960 | ) | (4,598 | ) | (6,558 | ) | 29.21 | ||||||||||||
|
|
|
|
|
|
|
|
|
|
|
|||||||||||
| Nonvested shares at June 30, 2018 (1) |
30,648 | 486,943 | 343,728 | 861,319 | $ | 26.60 | ||||||||||||||
|
|
|
|
|
|
|
|
|
|
|
|||||||||||
| Unrecognized stock-based compensation expense as of June 30, 2018 (2) |
$ | 708 | $ | 11,743 | $ | 9,798 | $ | 22,249 | ||||||||||||
|
|
|
|
|
|
|
|
|
|||||||||||||
| Weighted average remaining vesting period (years) as of June 30, 2018 |
1.14 | 3.38 | 2.77 | 3.04 | ||||||||||||||||
|
|
|
|
|
|
|
|
|
|||||||||||||
| (1) | Nonvested RSUs will be settled through the issuance of new shares of common stock. |
| (2) | The total unrecognized compensation expense is expected to be recognized over a weighted-average period of approximately 3.04 years. |
As of June 30, 2018, 578,618 fully vested deferred stock units (“DSUs”) remained outstanding. See “Amendments to Restricted Stock and SARs” section below and Note 13 – “Earnings per Share” for additional information. Future share settlements of DSUs by year consisted of the following:
| June 30, 2018 |
||||
| 2018 |
237,052 | |||
| 2021 |
60,373 | |||
| 2022 |
281,193 | |||
|
|
|
|||
| 578,618 | ||||
|
|
|
|||
Employee Stock Purchase Plan
In 2013, the Company adopted the 2013 Employee Stock Purchase Plan (“ESPP Plan”). The ESPP Plan qualifies under Section 423 of the IRS Code and provides for consecutive, non-overlapping 6-month offering periods. The offering periods generally start on the first trading day on or after May 15 and November 15 of each year. Qualifying employees may purchase shares of the Company stock at a 10% discount based on the lower of the market price at the beginning or end of the offering period, subject to IRS limitations. The Company determined that the ESPP Plan was a compensatory plan and is required to expense the fair value of the awards over each 6-month offering period.
20
Table of Contents
MARCUS & MILLICHAP, INC.
NOTES TO CONDENSED CONSOLIDATED FINANCIAL STATEMENTS
The ESPP Plan initially had 366,667 shares of common stock reserved and 233,867 and 246,895 shares of common stock remain available for issuance for each of the periods at June 30, 2018 and December 31, 2017, respectively. The ESPP Plan provides for annual increases in the number of shares available for issuance under the ESPP, equal to the least of (i) 366,667 shares, (ii) 1% of the outstanding shares on such date, or (iii) an amount determined by the board. Pursuant to the provisions of the ESPP Plan, the board of directors determined a share reserve increase was not required in the prior years. As of June 30, 2018, total unrecognized compensation cost related to the ESPP Plan was $55,000 and is expected to be recognized over a weighted average period of 0.38 years.
Amendments to Restricted Stock and SARs
Restricted Stock
In connection with the IPO, the Company entered into sales restriction agreements with certain of its executive officers. The sale restriction agreements provided for vesting acceleration as to all outstanding shares of restricted shares held by the executive officers and termination of certain existing Buy-Sell Agreements entered into between the Company and such executive officers prior to the IPO in exchange for the executive officers’ agreement to limit their ability to sell, transfer, hypothecate, encumber, or in any way alienate any of their shares. Such sales restrictions lapse at a rate of 20% per year for five years if the participant remains employed by the Company. In the event of death or termination of employment after reaching the age of 67, 100% of the shares of stock will be released from the resale restriction. Further, 100% of the shares of stock will be released from the resale restriction upon the consummation of a change of control of the Company. Of the original 3,689,326 shares subject to resale restriction, 732,020 shares remain subject to sales restriction at June 30, 2018.
SARs and DSUs
Prior to the IPO, certain employees were granted SARs. As of March 31, 2013, the outstanding SARs were frozen at the liability amount, and will be paid out to each participant in installments upon retirement or departure under the terms of the revised SARs agreements. To replace beneficial ownership in the SARs, the difference between the book value liability and the fair value of the awards was granted to plan participants in the form of DSUs, which were fully vested upon receipt and will be settled in actual stock at a rate of 20% per year if the participant remains employed by the Company during that period (otherwise all unsettled shares of stock upon termination from service will be settled five years from the termination date, unless otherwise agreed to by the Company). In the event of death or termination of service after reaching the age of 67, 100% of the DSUs will be settled.
Summary of Stock-Based Compensation
Components of stock-based compensation are included in selling, general and administrative expense in the condensed consolidated statements of net and comprehensive income consisted of the following (in thousands, except common stock price):
| Three Months Ended June 30, |
Six Months Ended June 30, |
|||||||||||||||
| 2018 | 2017 | 2018 | 2017 | |||||||||||||
| Employee stock purchase plan |
$ | 24 | $ | 29 | $ | 63 | $ | 75 | ||||||||
| RSAs – non-employee directors |
165 | 90 | 276 | 179 | ||||||||||||
| RSUs – employees |
1,096 | 952 | 2,049 | 1,866 | ||||||||||||
| RSUs – independent contractors (1) |
1,874 | 1,044 | 3,384 | 1,861 | ||||||||||||
|
|
|
|
|
|
|
|
|
|||||||||
| $ | 3,159 | $ | 2,115 | $ | 5,772 | $ | 3,981 | |||||||||
|
|
|
|
|
|
|
|
|
|||||||||
| Common stock price at beginning of period |
$ | 36.06 | $ | 24.58 | $ | 32.61 | $ | 26.72 | ||||||||
| Common stock price at end of period |
$ | 39.01 | $ | 26.36 | $ | 39.01 | $ | 26.36 | ||||||||
| Increase (decrease) in stock price |
$ | 2.95 | $ | 1.78 | $ | 6.40 | $ | (0.36 | ) | |||||||
| (1) | The Company grants RSUs to independent contractors (i.e. investment sales and financing professionals), who are considered non-employees under the accounting standards. Accordingly, such awards are required to be measured at fair value at the end of each reporting period until settlement. Stock-based compensation expense is therefore impacted by the changes in the Company’s common stock price during each reporting period. |
21
Table of Contents
MARCUS & MILLICHAP, INC.
NOTES TO CONDENSED CONSOLIDATED FINANCIAL STATEMENTS
| 12. | Income Taxes |
The Company’s effective tax rate for the three and six months ended June 30, 2018 was 26.9% and 26.4%, respectively, compared to 39.2% and 38.9% for the three and six months ended June 30, 2017, respectively. The Company provides for the effects of income taxes in interim financial statements based on the Company’s estimate of its annual effective tax rate for the full year, which is based on forecasted income by jurisdiction where the Company operates, adjusted for the tax effects of items that relate discretely to the period, if any.
The provision for income taxes differs from the amount computed by applying the U.S. federal statutory rate to income before provision for income taxes and consisted of the following (in thousands):
| Three Months Ended June 30, | ||||||||||||||||
| 2018 | 2017 | |||||||||||||||
| Amount | Rate | Amount | Rate | |||||||||||||
| Income tax expense at the federal statutory rate |
$ | 6,368 | 21.0 | % | $ | 8,967 | 35.0 | % | ||||||||
| State income tax expense, net of federal benefit |
1,415 | 4.7 | % | 973 | 3.8 | % | ||||||||||
| Effect of foreign operations |
(12 | ) | 0.0 | % | 25 | 0.1 | % | |||||||||
| Windfall tax benefits, net related to stock-based compensation |
(28 | ) | (0.1 | )% | — | — | ||||||||||
| Change in valuation allowance |
74 | 0.2 | % | 62 | 0.2 | % | ||||||||||
| Permanent items and other |
338 | 1.1 | % | 25 | 0.1 | % | ||||||||||
|
|
|
|
|
|
|
|
|
|||||||||
| $ | 8,155 | 26.9 | % | $ | 10,052 | 39.2 | % | |||||||||
|
|
|
|
|
|
|
|
|
|||||||||
| Six Months Ended June 30, | ||||||||||||||||
| 2018 | 2017 | |||||||||||||||
| Amount | Rate | Amount | Rate | |||||||||||||
| Income tax expense at the federal statutory rate |
$ | 11,474 | 21.0 | % | $ | 15,793 | 35.0 | % | ||||||||
| State income tax expense, net of federal benefit |
2,511 | 4.6 | % | 1,741 | 3.9 | % | ||||||||||
| Effect of foreign operations |
(20 | ) | 0.0 | % | 47 | 0.1 | % | |||||||||
| Windfall tax benefits, net related to stock-based compensation |
(245 | ) | (0.5 | )% | (156 | ) | (0.4 | )% | ||||||||
| Change in valuation allowance |
121 | 0.2 | % | 116 | 0.3 | % | ||||||||||
| Permanent items and other |
616 | 1.1 | % | 13 | — | |||||||||||
|
|
|
|
|
|
|
|
|
|||||||||
| $ | 14,457 | 26.4 | % | $ | 17,554 | 38.9 | % | |||||||||
|
|
|
|
|
|
|
|
|
|||||||||
On December 22, 2017, the Act was enacted, which significantly changed the U.S. corporate income tax laws by, among other items, reducing the U.S. corporate income tax rate to 21% from 35% starting in 2018, eliminating certain exceptions to Section 162(m) of the Internal Revenue Code and expanding the employees, companies and types of compensation covered by Section 162(m), and creating a territorial tax system with a one-time mandatory tax on previously deferred foreign earnings of U.S. subsidiaries. As a result of the Act, the Company revalued its deferred taxes, net due to the changes in the U.S. corporate statutory federal income tax rate and recorded a net charge of $11.6 million in the provision for income taxes during the fourth quarter of 2017. Although the Company’s accounting for certain income tax effects of the Act is incomplete, it was determined that the $11.6 million charge is a reasonable estimate of those effects. As of June 30, 2018, this amount continues to be our best estimate of the impact of the Act in accordance with our understanding of the Act and the related guidance available. When the IRS issues additional guidance and regulations enabling the Company to finalize certain tax positions, the Company will be able to conclude whether any further adjustments are required to be made to its deferred tax assets, net balance as of December 31, 2017. Any adjustments to this provisional amount will be reported no later than the fourth quarter of 2018, as a component of the provision for income taxes in the reporting period in which any such adjustments are determined.
22
Table of Contents
MARCUS & MILLICHAP, INC.
NOTES TO CONDENSED CONSOLIDATED FINANCIAL STATEMENTS
| 13. | Earnings per Share |
Basic and diluted earnings per share for the three and six months ended June 30, 2018 and 2017, respectively consisted of the following (in thousands, except per share data):
| Three Months Ended June 30, |
Six Months Ended June 30, |
|||||||||||||||
| 2018 | 2017 | 2018 | 2017 | |||||||||||||
| Numerator (Basic and Diluted): |
||||||||||||||||
| Net income |
$ | 22,167 | $ | 15,569 | $ | 40,178 | $ | 27,569 | ||||||||
|
|
|
|
|
|
|
|
|
|||||||||
| Denominator: |
||||||||||||||||
| Basic |
||||||||||||||||
| Weighted average common shares issued and outstanding |
38,606 | 38,100 | 38,576 | 38,075 | ||||||||||||
| Deduct: Unvested RSAs (1) |
(31 | ) | (28 | ) | (31 | ) | (29 | ) | ||||||||
| Add: Fully vested DSUs (2) |
579 | 930 | 579 | 930 | ||||||||||||
|
|
|
|
|
|
|
|
|
|||||||||
| Weighted Average Common Shares Outstanding |
39,154 | 39,002 | 39,124 | 38,976 | ||||||||||||
|
|
|
|
|
|
|
|
|
|||||||||
| Basic earnings per common share |
$ | 0.57 | $ | 0.40 | $ | 1.03 | $ | 0.71 | ||||||||
|
|
|
|
|
|
|
|
|
|||||||||
| Diluted |
||||||||||||||||
| Weighted Average Common Shares Outstanding from above |
39,154 | 39,002 | 39,124 | 38,976 | ||||||||||||
| Add: Dilutive effect of RSUs, RSAs & ESPP |
231 | 130 | 174 | 142 | ||||||||||||
|
|
|
|
|
|
|
|
|
|||||||||
| Weighted Average Common Shares Outstanding |
39,385 | 39,132 | 39,298 | 39,118 | ||||||||||||
|
|
|
|
|
|
|
|
|
|||||||||
| Diluted earnings per common share |
$ | 0.56 | $ | 0.40 | $ | 1.02 | $ | 0.70 | ||||||||
|
|
|
|
|
|
|
|
|
|||||||||
| Antidilutive shares excluded from diluted earnings per common share (3) |
55 | 317 | 242 | 324 | ||||||||||||
|
|
|
|
|
|
|
|
|
|||||||||
| (1) | RSAs were issued and outstanding to the non-employee directors and have a one-year or three-year vesting term subject to service requirements. See Note 11 – “Stock-Based Compensation Plans” for additional information. |
| (2) | Shares are included in weighted average common shares outstanding as the shares are fully vested but have not yet been delivered. See Note 11 – “Stock-Based Compensation Plans” for additional information. |
| (3) | Primarily pertaining to RSU grants to the Company’s employees and independent contractors. |
| 14. | Commitments and Contingencies |
Credit Agreement
On June 18, 2014, the Company entered into a Credit Agreement with Wells Fargo Bank, National Association (“Bank”), dated as of June 1, 2014 (the “Credit Agreement”). The Credit Agreement provides for a $60.0 million principal amount senior secured revolving credit facility that is guaranteed by all of the Company’s domestic subsidiaries (the “Credit Facility”), which, as amended, matures on June 1, 2020. The Company may borrow, repay and reborrow amounts under the Credit Facility until its maturity date, at which time all amounts outstanding under the Credit Facility must be repaid in full.
Borrowings under the Credit Agreement are available for general corporate purposes and working capital. The Credit Facility includes a $10.0 million sublimit for the issuance of standby letters of credit of which $533,000 was utilized at June 30, 2018. Borrowings under the Credit Facility will bear interest, at the Company’s option, at either the (i) Base Rate (defined as the highest of (a) the Bank’s prime rate, (b) the Federal Funds Rate plus 1.5% and (c) one-month LIBOR plus 1.5%), or (ii) at a variable rate between 0.875% and 1.125% above LIBOR, based upon the total funded debt to EBITDA ratio. In connection with executing the Credit Agreement, as amended the Company paid bank fees and other expenses, which are being amortized over the remaining term of the Credit Agreement. The Company pays a commitment fee of up to 0.1% per annum, payable quarterly, based on the amount of unutilized commitments under the Credit Facility. The amortization and commitment fee is included in interest expense in the accompanying condensed consolidated statements of net and comprehensive income and was $26,000 and $28,000 during the three months ended June 30, 2018 and 2017, respectively, and $52,000 and $55,000 during the six months ended June 30, 2018 and 2017, respectively. As of June 30, 2018 and December 31, 2017, there were no amounts outstanding under the Credit Agreement.
23
Table of Contents
MARCUS & MILLICHAP, INC.
NOTES TO CONDENSED CONSOLIDATED FINANCIAL STATEMENTS
The Credit Facility contains customary covenants, including financial and other covenant reporting requirements and events of default. Financial covenants require the Company, on a combined basis with its guarantors, to maintain (i) an EBITDAR Coverage Ratio (as defined in the Credit Agreement) of not less than 1.25:1.0 as of each quarter end and (ii) total funded debt to EBITDA not greater than 2.0:1.0 as of each quarter end both on a rolling 4-quarter basis. The Credit Facility is secured by substantially all assets of the Company, including pledges of 100% of the stock or other equity interest of each subsidiary except for the capital stock of a controlled foreign corporation (as defined in the Internal Revenue Code). As of June 30, 2018, the Company was in compliance with all financial and non-financial covenants.
Litigation
The Company is subject to various legal proceedings and claims that arise in the ordinary course of business, some of which involve claims for damages that are substantial in amount. Most of these litigation matters are covered by insurance, which contain deductibles, exclusions, claim limits and aggregate policy limits. While the ultimate liability for these legal proceeding cannot be determined, the Company reviews the need for its accrual for loss contingencies quarterly and records an accrual for litigation related losses where the likelihood of loss is both probable and estimable. The Company believes that the ultimate resolution of the legal proceedings will not have a material adverse effect on its financial condition or results of operations. The Company accrues legal fees for litigation as the legal services are provided.
Other
In connection with certain agreements with investment sales and financing professionals, the Company may agree to advance amounts to its investment sales and financing professionals upon reaching certain performance goals. Such commitments as of June 30, 2018 aggregated $1.5 million.
24
Table of Contents
Item 2. Management’s Discussion and Analysis of Financial Condition and Results of Operations
Unless the context requires otherwise, the words “Marcus & Millichap,” “we,” the “Company,” “us” and “our” refer to Marcus & Millichap, Inc., Marcus & Millichap Real Estate Investment Services, Inc. and its other consolidated subsidiaries.
Forward-Looking Statements
The following discussion contains forward-looking statements that involve risks and uncertainties. Our actual results could differ materially from those anticipated in these forward-looking statements as a result of many factors. The results of operations for the three and six months ended June 30, 2018 are not necessarily indicative of the results that may be expected for the full year ending December 31, 2018, or for any other future period. The following discussion should be read in conjunction with the unaudited condensed consolidated financial statements and the notes thereto included in Item 1 of this Form 10-Q and in conjunction with our Annual Report on Form 10-K for the year ended December 31, 2017 filed with the SEC on March 16, 2018, including the “Risk Factors” section and the consolidated financial statements and notes included therein.
Overview
We are a leading national brokerage firm specializing in commercial real estate investment sales, financing, research and advisory services. We have been the top commercial real estate investment broker in the United States based on the number of investment transactions over the last 10 years.
As of June 30, 2018, we had 1,841 investment sales and financing professionals that are primarily exclusive independent contractors operating in 78 offices who provide real estate brokerage and financing services to sellers and buyers of commercial real estate. We also offer market research, consulting and advisory services to our clients. During the three and six months ended June 30, 2018, we closed 2,357 and 4,442 investment sales, financing and other transactions with total volume of approximately $11.4 billion and $21.1 billion, respectively. During the year ended December 31, 2017, we closed 8,979 sales, financing and other transactions with total volume of approximately $42.2 billion.
We generate revenues by collecting real estate brokerage commissions upon the sale, and fees upon the financing, of commercial properties and by providing consulting and advisory services. Real estate brokerage commissions are typically based upon the value of the property, and financing fees are typically based upon the size of the loan. For the three months ended June 30, 2018, approximately 91% of our revenues were generated from real estate brokerage commissions, 8% from financing fees and 1% from other revenues, including consulting and advisory services. For the six months ended June 30, 2018, approximately 92% of our revenues were generated from real estate brokerage commissions, 7% from financing fees and 1% from other revenues, including consulting and advisory services. During the year ended December 31, 2017, approximately 90% of our revenues were generated from real estate brokerage commissions, 7% from financing fees and 3% from other revenues, including consulting and advisory services.
We divide commercial real estate into four major market segments, characterized by price:
| • | Properties priced less than $1 million; |
| • | Private client market: properties priced from $1 million up to $10 million; |
| • | Middle market: properties priced from $10 million up to $20 million; and |
| • | Larger transaction market: properties priced from $20 million and above. |
25
Table of Contents
Our strength is in serving private clients in the $1-$10 million private client market segment, which contributed approximately 65% and 69% of our real estate brokerage commissions during the three months ended June 30, 2018 and 2017, respectively, and approximately 65% and 70% of our real estate brokerage commissions during the six months ended June 30, 2018 and 2017, respectively. The following tables set forth the number of transactions, sales volume and revenues by commercial real estate market segment for real estate brokerage:
| Three Months Ended June 30, | ||||||||||||||||||||||||||||||||||||
| 2018 | 2017 | Change | ||||||||||||||||||||||||||||||||||
| Real Estate Brokerage | Number | Volume | Revenues | Number | Volume | Revenues | Number | Volume | Revenues | |||||||||||||||||||||||||||
| (in millions) | (in thousands) | (in millions) | (in thousands) | (in millions) | (in thousands) | |||||||||||||||||||||||||||||||
| <$1 million |
251 | $ | 161 | $ | 6,727 | 261 | $ | 164 | $ | 7,084 | (10 | ) | $ | (3 | ) | $ | (357 | ) | ||||||||||||||||||
| Private client market ($1 - $10 million) |
1,299 | 4,096 | 118,152 | 1,225 | 3,880 | 112,468 | 74 | 216 | 5,684 | |||||||||||||||||||||||||||
| Middle market (³$10 - $20 million) |
118 | 1,602 | 27,555 | 76 | 1,015 | 20,388 | 42 | 587 | 7,167 | |||||||||||||||||||||||||||
| Larger transaction market (³$20 million) |
84 | 3,089 | 29,206 | 62 | 2,215 | 22,635 | 22 | 874 | 6,571 | |||||||||||||||||||||||||||
|
|
|
|
|
|
|
|
|
|
|
|
|
|
|
|
|
|
|
|||||||||||||||||||
| 1,752 | $ | 8,948 | $ | 181,640 | 1,624 | $ | 7,274 | $ | 162,575 | 128 | $ | 1,674 | $ | 19,065 | ||||||||||||||||||||||
|
|
|
|
|
|
|
|
|
|
|
|
|
|
|
|
|
|
|
|||||||||||||||||||
| Six Months Ended June 30, | ||||||||||||||||||||||||||||||||||||
| 2018 | 2017 | Change | ||||||||||||||||||||||||||||||||||
| Real Estate Brokerage | Number | Volume | Revenues | Number | Volume | Revenues | Number | Volume | Revenues | |||||||||||||||||||||||||||
| (in millions) | (in thousands) | (in millions) | (in thousands) | (in millions) | (in thousands) | |||||||||||||||||||||||||||||||
| <$1 million |
496 | $ | 323 | $ | 13,595 | 503 | $ | 306 | $ | 13,078 | (7 | ) | $ | 17 | $ | 517 | ||||||||||||||||||||
| Private client market ($1 - $10 million) |
2,467 | 7,656 | 224,164 | 2,346 | 7,278 | 212,218 | 121 | 378 | 11,946 | |||||||||||||||||||||||||||
| Middle market (³$10 - $20 million) |
231 | 3,208 | 54,826 | 164 | 2,217 | 39,542 | 67 | 991 | 15,284 | |||||||||||||||||||||||||||
| Larger transaction market (³$20 million) |
143 | 5,677 | 51,580 | 100 | 3,963 | 37,874 | 43 | 1,714 | 13,706 | |||||||||||||||||||||||||||
|
|
|
|
|
|
|
|
|
|
|
|
|
|
|
|
|
|
|
|||||||||||||||||||
| 3,337 | $ | 16,864 | $ | 344,165 | 3,113 | $ | 13,764 | $ | 302,712 | 224 | $ | 3,100 | $ | 41,453 | ||||||||||||||||||||||
|
|
|
|
|
|
|
|
|
|
|
|
|
|
|
|
|
|
|
|||||||||||||||||||
We continue to increase our presence in the United States and Canada through execution of our growth strategies by targeting markets based on population, employment, level of commercial real estate sales, inventory and competitive opportunities where we believe the markets will benefit from our business model. In the second quarter, we completed a transaction to acquire Pinnacle Financial Group and a related company PFG Servicing, Inc. These acquisitions expanded our presence in the financing market in the mid-west and added commercial mortgage servicing to financing services available to our clients.
The following charts set forth the percentage of transactions by region for real estate brokerage.
| Three Months Ended June 30, |
Six Months Ended June 30, | |||||
| 2018 |
2017 |
2018 |
2017 | |||
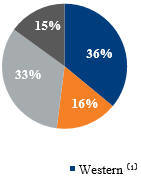
|
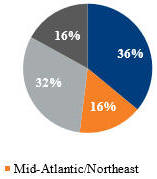
|
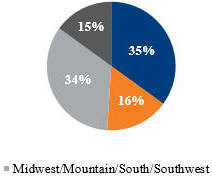
|
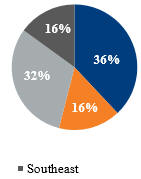
| |||
| (1) | Includes our Canadian operations, which represented less than 1% of our total revenues in each period presented. |
26
Table of Contents
Factors Affecting Our Business
Our business and our operating results, financial condition and liquidity are significantly affected by the number and size of commercial real estate investment sales and financing transactions we close in any period. The number and size of these transactions are affected by our ability to recruit and retain investment sales and financing professionals, identify and contract properties for sale and those that need financing and refinancing. We principally monitor the commercial real estate market through four factors, which generally drive our business. The factors are the economy, commercial real estate supply and demand, interest rates, availability of financing, capital markets conditions, investment sentiment and investment activity.
The Economy
Our business is dependent on economic conditions within the markets in which we operate. Changes in the economy on a global, national, regional or local basis can have a positive or a negative impact on our business. Economic indicators and projections related to job growth, unemployment, interest rates, retail spending and confidence trends can have a positive or a negative impact on our business. Overall market conditions can have an effect on investor sentiment and, ultimately, the demand for our services from investors in real estate. In the wake of tax reform at the end of last year, consumer and business confidence levels have surged to record levels. We believe this broadly held positive outlook has supported increased consumption, business investment and economic growth. Job creation through the first half of 2018 has been markedly stronger than during the same period last year, while the total number of available jobs is at record levels and the unemployment rate has been flirting with 20-year lows. Though these trends are favorable, they also raise inflation risk, causing the Federal Reserve to tighten monetary policy resulting in some risk to the longer-term growth outlook. Trade tensions are another area of risk to the generally favorable economic outlook, and although a trade war would likely have nominal direct effect on commercial real estate performance, negative economic ripples from a trade war could potentially weigh on commercial real estate space demand. Despite these risks, we remain optimistic about economic expansion through the remainder of 2018, and the benefits this momentum will bring to commercial real estate investors.
Commercial Real Estate Supply and Demand
Our business is dependent on the willingness of investors to invest in or sell commercial real estate, which is affected by factors beyond our control. These factors include the supply of commercial real estate coupled with user demand for these properties and the performance of real estate assets when compared with other investment alternatives, such as stocks and bonds. The strong pace of economic growth so far this year has reinforced demand for all types of commercial real estate space, sustaining positive real estate fundamentals. We believe these trends should remain in-place for the remainder of 2018 as the strong economy supports elevated hiring, wage growth, consumption and household formation. Although construction remains elevated for apartments, self-storage facilities, hotels and industrial properties, demand has largely kept pace on a macro level. There are, however, some pockets of oversupply risk in select major metropolitan areas. The strong performance trends and positive economic outlook are bolstering seller confidence levels, which in turn is exacerbating the expectation gap relative to prospective buyers. This gap could potentially widen further if interest rates rise substantively in the second half of the year, causing buyers to rein in their valuation models.
Capital Markets
Credit and liquidity issues in the financial markets have a direct impact on the flow of capital to the commercial real estate market. Real estate purchases are often financed with debt and, as a result, credit and liquidity impact transaction activity and prices. Changes in interest rates, as well as steady and protracted movements of interest rates in one direction, whether increases or decreases, could adversely or positively affect the operations and income potential of commercial real estate properties. These changes also influence the demand of investors for commercial real estate investments. We believe that indications from the U.S. Federal Reserve of future interest rate increases and a reduction of the Federal Reserve balance sheet could place upward pressure on interest rates. This, together with uncertainty created by trade tensions, stock market volatility and questions regarding international monetary policy remain a short-term headwind for real estate transactions. These risks could intensify if short-term interest rates rise above long-term interest rates, creating an inverted yield curve, an event commonly perceived to precede a recession, as negative media coverage could potentially erode the current economic strength. However, lenders continue to offer ample capital supply while maintaining disciplined underwriting granting the investment market strong liquidity and balanced lending resources.
27
Table of Contents
Investor Sentiment and Investment Activity
We rely on investors to buy and sell properties in order to generate commissions. Investors’ desires to engage in real estate transactions are dependent on many factors that are beyond our control. The economy, supply and demand for properly positioned properties, available credit and market events impact investor sentiment and, therefore, transaction velocity. In addition, our private clients are often motivated to buy, sell and/or refinance properties due to personal circumstances such as death, divorce, partnership breakups and estate planning. In contrast to the early part of 2017, when uncertainty weighed on investor activity, we are seeing a modest increase in both investor sentiment and activity levels. Though current transaction counts are below the peak set in 2016, they remain strong by historical standards, offering a very active and dynamic sales climate. Still-strong occupancies and rent gains, together with positive momentum from the new tax laws, economic growth, comparatively low interest rates and broad capital availability are all favoring the investment market. By the same token, we believe that the maturing cycle, combined with volatility in financial markets, inflation trends and rising interest rates are still causing some investors and lenders to apply more cautious underwriting assumptions, modestly restraining sales activity. The convergence of this array of factors should continue to support commercial real estate investor demand and, therefore, demand for our brokerage and financing services.
Operating Segments
We follow the guidance for segment reporting, which requires reporting information on operating segments in interim and annual financial statements. Substantially all of our operations involve the delivery of commercial real estate services to our customers including real estate investment sales, financing and consulting and advisory services. Management makes operating decisions, assesses performance and allocates resources based on an ongoing review of these integrated operations, which constitute only one operating segment for financial reporting purposes.
Key Financial Measures and Indicators
Revenues
Our revenues are primarily generated from our real estate investment sales business. In addition to real estate brokerage commissions, we generate revenues from financing fees and from other revenues, which are primarily comprised of consulting and advisory fees.
Our business is transaction oriented and, as such, we rely on investment sales and financing professionals to continually develop leads, identify properties to sell, market those properties and close the sale timely to generate a consistent flow of revenue. While our sales volume is impacted by seasonality factors, the timing of closings is also dependent on many market and personal factors unique to a particular client or transaction, particularly clients transacting in the $1-$10 million private client market segment. These factors can cause transactions to be accelerated or delayed beyond our control. Further, commission rates earned are generally inversely related to the value of the property sold. As a result of our expansion into the middle and larger transaction market segments, we have seen our overall commission rates fluctuate from period-to-period as a result of changes in the relative mix of the number and volume of transactions closed in the middle and larger transaction market segments as compared to the $1-$10 million private client market segment. These factors may result in period-to-period variations in our revenues that differ from historical patterns.
A small percentage of our transactions include retainer fees and/or breakage fees. Retainer fees are credited against a success-based fee paid upon the closing of a transaction or a breakage fee. Transactions that are terminated before completion will sometimes generate breakage fees, which are usually calculated as a set amount or a percentage of the fee we would have received had the transaction closed.
Real estate brokerage commissions
We earn real estate brokerage commissions by acting as a broker for commercial real estate owners seeking to sell or investors seeking to buy properties. Revenues from real estate brokerage commissions are typically recognized at the close of escrow.
Financing fees
We earn financing fees by securing financing on purchase transactions or by securing refinancing of our clients’ existing mortgage debt. To a lesser extent, we also earn mortgage servicing fees and ancillary fees associated with financing activities. We generate mortgage servicing fees through the provision of collection, remittance, recordkeeping, reporting and other related mortgage servicing functions, activities and services. We recognize financing fee revenues at the time the loan closes and we have no remaining significant obligations for performance in connection with the transaction. We recognize mortgage servicing revenues upon the acquisition of a servicing obligation and at the time services are rendered, provided the loans are current and the debt service payments are made by the borrowers and when new servicing rights are acquired.
28
Table of Contents
Other revenues
Other revenues include fees generated from consulting and advisory services performed by our investment sales professionals, as well as referral fees from other real estate brokers. Revenues from these services are recognized as they are performed and completed.
Operating Expenses
Our operating expenses consist of cost of services, selling, general and administrative expenses and depreciation and amortization. The significant components of our expenses are further described below.
Cost of services
The majority of our cost of services expense is variable commissions paid to our investment sales professionals and compensation-related costs related to our financing activities. Commission expenses are directly attributable to providing services to our clients for investment sales and financing services. Most of our investment sales and financing professionals are independent contractors and are paid commissions; however, there are some who are initially paid a salary and certain of our financing professionals are employees and, as such, costs of services also include employee-related compensation, employer taxes and benefits for those employees. The commission rates we pay to our investment sales and financing professionals vary based on individual contracts negotiated and are generally higher for the more experienced professionals. Some of our most senior investment sales and financing professionals also have the ability to earn additional commissions after meeting certain annual revenue thresholds. These additional commissions are recognized as cost of services in the period in which they are earned. Payment of a portion of these additional commissions are generally deferred for a period of three years, at the Company’s election, and paid at the beginning of the fourth calendar year. Cost of services also includes referral fees paid to other real estate brokers where the Company is the principal service provider. Cost of services, therefore, can vary based on the commission structure of the independent contractors that closed transactions in any particular period.
Selling, general & administrative expenses
The largest expense component within selling, general and administrative expenses is personnel expenses for our management team and sales and support staff. In addition, these costs include facilities costs (excluding depreciation and amortization), staff related expenses, sales, marketing, legal, telecommunication, network, data sources and other administrative expenses. Also included in selling, general and administrative are expenses for stock-based compensation to non-employee directors, employees and independent contractors (i.e. investment sales and financing professionals) under the 2013 Omnibus Equity Incentive Plan, as amended (“2013 Plan”) and the 2013 Employee Stock Purchase Plan (“ESPP Plan”).
Depreciation and amortization expense
Depreciation expense consists of depreciation recorded on our computer software and hardware and furniture, fixture and equipment. Depreciation and amortization are provided over estimated useful lives ranging from three to seven years for owned assets or over the lesser of the asset estimated useful lives or the related lease term for leasehold improvements. Amortization expense also consists of amortization recorded on our mortgage servicing rights (“MSRs”) using the interest method over the period that servicing income is expected to be received and amortization recorded on intangible assets amortized on a straight-line basis using a useful life between one and six years.
Other Income (Expense), Net
Other income (expense), net primarily consists of interest income, net gains or losses on our deferred compensation plan assets, realized gains and losses on our marketable securities, available-for-sale, foreign currency gains and losses and other non-operating gains and losses.
Interest Expense
Interest expense primarily consists of interest expense associated with the stock appreciation rights (“SARs”) liability, notes payable to former stockholders and our credit agreement.
Provision for Income Taxes
We are subject to U.S. and Canadian federal taxes and individual state and local taxes based on the income generated in the jurisdictions in which we operate. Our effective tax rate fluctuates as a result of the change in the mix of our activities in the jurisdictions we operate due to differing tax rates in those jurisdictions. Our provision for income taxes includes the windfall tax benefits, net from shares issued in connection with our 2013 Plan and ESPP Plan.
29
Table of Contents
We record deferred taxes, net based on the tax rate expected to be in effect at the time those items are expected to be recognized for tax purposes. On December 22, 2017, the Tax Cuts and Jobs Act (the “Act”) was enacted, which reduced the U.S. federal statutory tax rate from 35% to 21% beginning in 2018.
30
Table of Contents
Operating Metrics
We regularly review a number of key metrics to evaluate our business, measure our performance, identify trends affecting our business, formulate financial projections and make strategic decisions. During the three months ended June 30, 2018 and 2017, we closed more than 2,300 and 2,100 investment sales, financing and other transactions with total volume of approximately $11.4 billion and $11.3 billion, respectively. During the six months ended June 30, 2018 and 2017, we closed more than 4,400 and 4,200 investment sales, financing and other transactions with total volume of approximately $21.1 billion and $19.8 billion, respectively. Such key metrics for real estate brokerage and financing activities are as follows:
| Three Months Ended June 30, |
Six Months Ended June 30, |
|||||||||||||||
| Real Estate Brokerage | 2018 | 2017 | 2018 | 2017 | ||||||||||||
| Average Number of Investment Sales Professionals |
1,694 | 1,627 | 1,682 | 1,628 | ||||||||||||
| Average Number of Transactions per Investment Sales Professional |
1.03 | 1.00 | 1.98 | 1.91 | ||||||||||||
| Average Commission per Transaction |
$ | 103,676 | $ | 100,108 | $ | 103,136 | $ | 97,241 | ||||||||
| Average Commission Rate |
2.03 | % | 2.24 | % | 2.04 | % | 2.20 | % | ||||||||
| Average Transaction Size (in thousands) |
$ | 5,107 | $ | 4,479 | $ | 5,054 | $ | 4,421 | ||||||||
| Total Number of Transactions |
1,752 | 1,624 | 3,337 | 3,113 | ||||||||||||
| Total Sales Volume (in millions) |
$ | 8,948 | $ | 7,274 | $ | 16,864 | $ | 13,764 | ||||||||
| Three Months Ended June 30, |
Six Months Ended June 30, |
|||||||||||||||
| Financing (1) | 2018 | 2017 | 2018 | 2017 | ||||||||||||
| Average Number of Financing Professionals |
96 | 94 | 94 | 97 | ||||||||||||
| Average Number of Transactions per Financing Professional |
4.51 | 4.34 | 8.05 | 8.24 | ||||||||||||
| Average Fee per Transaction |
$ | 35,125 | $ | 31,150 | $ | 32,519 | $ | 28,489 | ||||||||
| Average Fee Rate |
0.93 | % | 0.92 | % | 0.93 | % | 0.89 | % | ||||||||
| Average Transaction Size (in thousands) |
$ | 3,774 | $ | 3,400 | $ | 3,490 | $ | 3,199 | ||||||||
| Total Number of Transactions |
433 | 408 | 757 | 799 | ||||||||||||
| Total Sales Volume (in millions) |
$ | 1,634 | $ | 1,387 | $ | 2,642 | $ | 2,556 | ||||||||
| (1) | Operating metrics calculated excluding certain financing fees not directly associated to transactions. |
31
Table of Contents
Results of Operations
Following is a discussion of our results of operations for the three months ended June 30, 2018 and 2017. The tables included in the period comparisons below provide summaries of our results of operations. The period-to-period comparisons of financial results are not necessarily indicative of future results.
Comparison of Three Months Ended June 30, 2018 and 2017
Below are key operating results for the three months ended June 30, 2018 compared to the three months ended June 30, 2017 (dollar and share amounts in thousands, except per share amounts):
| Three Months Ended June 30, 2018 |
Percentage of Revenue |
Three Months Ended June 30, 2017 |
Percentage of Revenue |
Change |
||||||||||||||||||||
| Dollar | Percentage | |||||||||||||||||||||||
| Revenues: |
||||||||||||||||||||||||
| Real estate brokerage commissions |
$ | 181,640 | 91.1 | % | $ | 162,575 | 90.1 | % | 19,065 | 11.7 | % | |||||||||||||
| Financing fees |
15,563 | 7.8 | 12,709 | 7.0 | 2,854 | 22.5 | ||||||||||||||||||
| Other revenues |
2,199 | 1.1 | 5,087 | 2.9 | (2,888 | ) | (56.8 | ) | ||||||||||||||||
|
|
|
|
|
|
|
|
|
|
|
|
|
|||||||||||||
| Total revenues |
199,402 | 100.0 | 180,371 | 100.0 | 19,031 | 10.6 | ||||||||||||||||||
|
|
|
|
|
|
|
|
|
|
|
|
|
|||||||||||||
| Operating expenses: |
||||||||||||||||||||||||
| Cost of services |
119,869 | 60.1 | 110,377 | 61.2 | 9,492 | 8.6 | ||||||||||||||||||
| Selling, general, and administrative expense |
49,080 | 24.6 | 43,693 | 24.2 | 5,387 | 12.3 | ||||||||||||||||||
| Depreciation and amortization expense |
1,503 | 0.8 | 1,303 | 0.7 | 200 | 15.3 | ||||||||||||||||||
|
|
|
|
|
|
|
|
|
|
|
|
|
|||||||||||||
| Total operating expenses |
170,452 | 85.5 | 155,373 | 86.1 | 15,079 | 9.7 | ||||||||||||||||||
|
|
|
|
|
|
|
|
|
|
|
|
|
|||||||||||||
| Operating income |
28,950 | 14.5 | 24,998 | 13.9 | 3,952 | 15.8 | ||||||||||||||||||
| Other income (expense), net |
1,724 | 0.9 | 997 | 0.6 | 727 | 72.9 | ||||||||||||||||||
| Interest expense |
(352 | ) | (0.2 | ) | (374 | ) | (0.3 | ) | 22 | (5.9 | ) | |||||||||||||
|
|
|
|
|
|
|
|
|
|
|
|
|
|||||||||||||
| Income before provision for income taxes |
30,322 | 15.2 | 25,621 | 14.2 | 4,701 | 18.3 | ||||||||||||||||||
| Provision for income taxes |
8,155 | 4.1 | 10,052 | 5.6 | (1,897 | ) | (18.9 | ) | ||||||||||||||||
|
|
|
|
|
|
|
|
|
|
|
|
|
|||||||||||||
| Net income |
$ | 22,167 | 11.1 | % | $ | 15,569 | 8.6 | % | $ | 6,598 | 42.4 | % | ||||||||||||
|
|
|
|
|
|
|
|
|
|
|
|
|
|||||||||||||
| Adjusted EBITDA (1) |
$ | 33,721 | 16.9 | % | $ | 28,668 | 15.9 | % | $ | 5,053 | 17.6 | % | ||||||||||||
|
|
|
|
|
|
|
|
|
|
|
|
|
|||||||||||||
| Earnings per share: |
||||||||||||||||||||||||
| Basic |
$ | 0.57 | $ | 0.40 | ||||||||||||||||||||
| Diluted |
$ | 0.56 | $ | 0.40 | ||||||||||||||||||||
| Weighted average common shares outstanding: |
||||||||||||||||||||||||
| Basic |
39,154 | 39,002 | ||||||||||||||||||||||
| Diluted |
39,385 | 39,132 | ||||||||||||||||||||||
| (1) | Adjusted EBITDA is not a measurement of our financial performance under U.S. GAAP and should not be considered as an alternative to net income, operating income or any other measures derived in accordance with U.S. GAAP. For a definition of Adjusted EBITDA and a reconciliation of Adjusted EBITDA to net income, see “Non-GAAP Financial Measure.” |
Revenues
Our total revenues were $199.4 million for the three months ended June 30, 2018 compared to $180.4 million for the same period in 2017, an increase of $19.0 million, or 10.6%. Total revenues increased primarily as a result of increases in real estate brokerage commissions and financing fees, partially offset by a decrease in other revenues.
Real estate brokerage commissions. Revenues from real estate brokerage commissions increased to $181.6 million for the three months ended June 30, 2018 from $162.6 million for the same period in 2017, an increase of $19.1 million, or 11.7%. The increase was primarily driven by the increase in the number of investment sales transactions (7.9%) and increase in average transaction size (14.0%). These factors combined to generate the increase in sales volume of 23.0%. These increases were partially offset by a decrease in average commission rates (21 basis points) due to a larger proportion of our transactions that closed in the Middle and Larger transaction market segments, which generate lower commission rates.
32
Table of Contents
Financing fees. Revenues from financing fees increased to $15.6 million for the three months ended June 30, 2018 from $12.7 million for the same period in 2017, an increase of $2.9 million, or 22.5%. The increase was primarily driven by the increase in the number of financing transactions (6.1%) and increase in average transaction size (11.0%). These factors combined to generate the increase in sales volume of 17.8%. In addition, the average fee rates increased on average by 1 basis point due to overall improved rates across all loan types.
Other revenues. Other revenues decreased to $2.2 million for the three months ended June 30, 2018 from $5.1 million for the same period in 2017, a decrease of $2.9 million, or 56.8%. The decrease was primarily driven by a large consulting and advisory fee earned in 2017 with no such fee in 2018.
Total operating expenses
Our total operating expenses were $170.5 million for the three months ended June 30, 2018 compared to $155.4 million for the same period in 2017, an increase of $15.1 million, or 9.7%. The increase was primarily due to increases in cost of services, which are variable commissions paid to the Company’s investment sales professionals and compensation related costs in connection with our financing activities, selling, general and administrative costs and to a lesser extent depreciation and amortization, as described below.
Cost of services. Cost of services increased to $119.9 million for the three months ended June 30, 2018 from $110.4 million for the same period in 2017, an increase of $9.5 million, or 8.6%. The increase was primarily due to increased commission expenses driven by the related increased revenues noted above. Cost of services as a percent of total revenues decreased to 60.1% compared to 61.2% for the same period in 2017 primarily due to a decrease in the proportion of transactions closed by our more senior investment sales professionals who are compensated generally at higher commission rates. Traditionally, cost of services as a percent of total revenues is lower during the six-month period ended June 30 as certain investment professionals may earn additional commissions later in the year after meeting annual revenue thresholds.
Selling, general and administrative expense. Selling, general and administrative expense increased to $49.1 million for the three months ended June 30, 2018 from $43.7 million for the same period in 2017, an increase of $5.4 million, or 12.3%. Increases in our selling, general and administrative expense have been driven by our growth plans and investments in technology, sales and marketing tools and marketing and expansion of our services supporting our investment sales and financing professionals. These initiatives have primarily driven (i) a $1.8 million increase in sales operations support and promotional marketing expenses to support sales activity; (ii) a $1.1 million increase in other expense categories, net, primarily driven by our expansion and growth; (iii) a $1.1 million increase in stock-based compensation driven by fluctuations in our stock price and incremental stock-based awards since the second quarter of 2017; (vi) a $0.9 million increase in compensation related costs, including salaries and related benefits and management performance compensation primarily due to changes in bonus accruals and (v) a $0.7 million increase in facilities expenses due to expansion of existing offices. These increases were partially offset by a $0.2 million decrease in legal costs and accruals.
Depreciation and amortization expense. Depreciation and amortization expense increased to $1.5 million for the three months ended June 30, 2018 from $1.3 million for the same period in 2017, an increase of $0.2 million, or 15.3%.
Other income (expense), net
Other income (expense), net increased to $1.7 million for the three months ended June 30, 2018 from $1.0 million for the same period in 2017. The increase was primarily driven by an increase in interest income on our investments in marketable securities, available-for-sale, partially offset by a decrease in the value of our deferred compensation plan assets held in the rabbi trust.
Interest expense
There were no significant changes in interest expense for the three months ended June 30, 2018 compared to the same period in 2017.
Provision for income taxes
The provision for income taxes was $8.2 million for the three months ended June 30, 2018 compared to $10.1 million in the same period in 2017, a decrease of $1.9 million, or 18.9%. The effective income tax rate for the three months ended June 30, 2018 was 26.9% compared to 39.2% for the same period in 2017. The decrease in the effective tax rate was primarily due to the decrease in the federal statutory rate from 35% to 21%. Permanent items and other increased in 2018 compared to the prior year period due to changes in tax laws under the Act, primarily relating to changes to Section 162(m) of the Internal Revenue Code and the tax rules regarding the deductibility of entertainment expenses.
33
Table of Contents
We calculate our provision for income taxes using an annual effective tax rate based on projected taxable income for the year adjusted for the effects of permanent and discrete items. Deferred taxes are adjusted for significant changes in temporary items in the period in which they occur. The future effective tax rate may vary from this estimated annual effective rate due to several factors, including but not limited to, the level of state and foreign jurisdiction activity, future changes in tax laws, the amount of future book versus income tax items that are permanent in nature and changes, if any, in a valuation allowance related to deferred tax assets.
The provisions for income taxes includes the difference in book and tax deductions associated with the settlement of shares under the Company’s 2013 Plan and certain disqualifying dispositions of shares issued under our ESPP Plan.
Comparison of Six Months Ended June 30, 2018 and 2017
Below are key operating results for the six months ended June 30, 2018 compared to the six months ended June 30, 2017 (dollar and share amounts in thousands, except per share amounts):
| Six Months Ended June 30, 2018 |
Percentage of Revenue |
Six Months Ended June 30, 2017 |
Percentage of Revenue |
Change |
||||||||||||||||||||
| Dollar | Percentage | |||||||||||||||||||||||
| Revenues: |
||||||||||||||||||||||||
| Real estate brokerage commissions |
$ | 344,165 | 92.0 | % | $ | 302,712 | 90.7 | % | $ | 41,453 | 13.7 | % | ||||||||||||
| Financing fees |
25,287 | 6.8 | 22,763 | 6.8 | 2,524 | 11.1 | ||||||||||||||||||
| Other revenues |
4,491 | 1.2 | 8,108 | 2.5 | (3,617 | ) | (44.6 | ) | ||||||||||||||||
|
|
|
|
|
|
|
|
|
|
|
|
|
|||||||||||||
| Total revenues |
373,943 | 100.0 | 333,583 | 100.0 | 40,360 | 12.1 | ||||||||||||||||||
|
|
|
|
|
|
|
|
|
|
|
|
|
|||||||||||||
| Operating expenses: |
||||||||||||||||||||||||
| Cost of services |
221,518 | 59.2 | 200,024 | 60.0 | 21,494 | 10.8 | ||||||||||||||||||
| Selling, general, and administrative expense |
97,133 | 26.0 | 86,913 | 26.1 | 10,220 | 11.8 | ||||||||||||||||||
| Depreciation and amortization expense |
2,878 | 0.8 | 2,600 | 0.7 | 278 | 10.7 | ||||||||||||||||||
|
|
|
|
|
|
|
|
|
|
|
|
|
|||||||||||||
| Total operating expenses |
321,529 | 86.0 | 289,537 | 86.8 | 31,992 | 11.1 | ||||||||||||||||||
|
|
|
|
|
|
|
|
|
|
|
|
|
|||||||||||||
| Operating income |
52,414 | 14.0 | 44,046 | 13.2 | 8,368 | 19.0 | ||||||||||||||||||
| Other income (expense), net |
2,933 | 0.8 | 1,833 | 0.5 | 1,100 | 60.0 | ||||||||||||||||||
| Interest expense |
(712 | ) | (0.2 | ) | (756 | ) | (0.2 | ) | 44 | (5.8 | ) | |||||||||||||
|
|
|
|
|
|
|
|
|
|
|
|
|
|||||||||||||
| Income before provision for income taxes |
54,635 | 14.6 | 45,123 | 13.5 | 9,512 | 21.1 | ||||||||||||||||||
| Provision for income taxes |
14,457 | 3.9 | 17,554 | 5.2 | (3,097 | ) | (17.6 | ) | ||||||||||||||||
|
|
|
|
|
|
|
|
|
|
|
|
|
|||||||||||||
| Net income |
40,178 | 10.7 | % | $ | 27,569 | 8.3 | % | $ | 12,609 | 45.7 | % | |||||||||||||
|
|
|
|
|
|
|
|
|
|
|
|
|
|||||||||||||
| Adjusted EBITDA (1) |
$ | 61,154 | 16.4 | % | $ | 51,090 | 15.3 | % | $ | 10,064 | 19.7 | % | ||||||||||||
|
|
|
|
|
|
|
|
|
|
|
|
|
|||||||||||||
| Earnings per share: |
||||||||||||||||||||||||
| Basic |
$ | 1.03 | $ | 0.71 | ||||||||||||||||||||
| Diluted |
$ | 1.02 | $ | 0.70 | ||||||||||||||||||||
| Weighted average common shares outstanding: |
||||||||||||||||||||||||
| Basic |
39,124 | 38,976 | ||||||||||||||||||||||
| Diluted |
39,298 | 39,118 | ||||||||||||||||||||||
| (1) | Adjusted EBITDA is not a measurement of our financial performance under U.S. GAAP and should not be considered as an alternative to net income, operating income or any other measures derived in accordance with U.S. GAAP. For a definition of Adjusted EBITDA and a reconciliation of Adjusted EBITDA to net income, see “Non-GAAP Financial Measure.” |
Revenues
Our total revenues were $373.9 million for the six months ended June 30, 2018 compared to $333.6 million for the same period in 2017, an increase of $40.4 million, or 12.1%. Total revenues increased primarily as a result of increases in real estate brokerage commissions and financing fees, partially offset by decrease in other revenues.
Real estate brokerage commissions. Revenues from real estate brokerage commissions increased to $344.2 million for the six months ended June 30, 2018 from $302.7 million for the same period in 2017, an increase of $41.5 million, or 13.7%. The increase was primarily driven by the increase in the number of investment sales transactions (7.2%) and increase in average transaction size (14.3%). These factors combined to generate the increase in sales volume of 22.5%. This increase was partially offset by a decrease in average commission rates (16 basis points) due to a larger proportion of our transactions that closed in the Middle and Larger transaction market segments, which generate lower commission rates.
34
Table of Contents
Financing fees. Revenues from financing fees increased to $25.3 million for the six months ended June 30, 2018 from $22.8 million for the same period in 2017, an increase of $2.5 million, or 11.1%. The increase was driven by growth in sales volume (3.4%), which was generated by an increase in average transaction size (9.1%) and an increase in average fee rates (4 basis points). These increases were partially offset by a decrease in the number of financing transactions (5.3%).
Other revenues. Other revenues decreased to $4.5 million for the six months ended June 30, 2018 from $8.1 million for the same period in 2017, a decrease of $3.6 million, or 44.6%. The decrease was primarily driven by decreases in consulting and advisory services during the six months June 30, 2018 compared to the same period in 2017.
Total operating expenses
Our total operating expenses were $321.5 million for the six months ended June 30, 2018 compared to $289.5 million for the same period in 2017, an increase of $32.0 million, or 11.1%. The increase was primarily due to increases in cost of services, which are variable commissions paid to the Company’s investment sales professionals and compensation related costs in connection with our financing activities, selling, general and administrative costs and to a lesser extent depreciation and amortization, as described below.
Cost of services. Cost of services for the six months ended June 30, 2018 increased approximately $21.5 million, or 10.8% to $221.5 million from $200.0 million for the same period in 2017. The increase was primarily due to increased commission expenses driven by the related increased revenues noted above. Cost of services as a percent of total revenues decreased to 59.2% for the six months ended June 30, 2018 compared to 60.0% for the same period in 2017 primarily due to a decrease in the proportion of transactions closed by our more senior investment sales professionals who are compensated generally at higher commissions rates. Traditionally, cost of services as a percent of total revenues is lower during the six-month period ended June 30 as certain investment professionals may earn additional commissions later in the year after meeting annual revenue thresholds.
Selling, general and administrative expense. Selling, general and administrative expense for the six months ended June 30, 2018 increased $10.2 million, or 11.8%, to $97.1 million from $86.9 million for the same period in 2017. Increases in our selling, general and administrative expense have been driven by our growth plans and investments in technology, sales and marketing tools and marketing and expansion of our services supporting our investment sales and financing professionals. These initiatives have primarily driven (i) a $3.6 million increase in sales and promotional marketing expenses to support increased sales activity; (ii) a $2.5 million increase in compensation related costs, including salaries and related benefits and management performance compensation; (iii) a $1.8 million increase in stock-based compensation expense due to fluctuations in our stock price and incremental stock-based awards since second quarter of 2017; (iv) $1.3 million increase in facilities expenses due to expansion of existing offices (v) a $1.2 million increase in other expense categories, net, primarily driven by our expansion and growth. These increases were partially offset by a $0.2 million decrease in legal costs and accruals.
Depreciation and amortization expense. Depreciation and amortization expense increased to $2.9 million for the six months ended June 30, 2018 from $2.6 million for the same period in 2017, an increase of $0.3 million, or 10.7%. The increase is primarily driven by our expansion and growth.
Other income (expense), net
Other income (expense), net increased to $2.9 million for the six months ended June 30, 2018 from $1.8 million for the same period in 2017. The increase was primarily driven by an increase in interest income on our investments in marketable securities, available-for-sale and value of our deferred compensation plan assets held in the rabbi trust.
Interest expense
There were no significant changes in interest expense for the six months ended June 30, 2018 compared to the same period in 2017.
Provision for income taxes
The provision for income taxes was $14.5 million for the six months ended June 30, 2018 compared to $17.6 million in the same period in 2017, a decrease of $3.1 million, or 17.6%. The effective income tax rate for the six months ended June 30, 2018 was 26.4% compared to 38.9% for the same period in 2017. The decrease in the effective tax rate was primarily due to the decrease in the federal statutory rate from 35% to 21%. Permanent items and other increased in 2018 compared to the prior year period due to changes in tax laws under the Act, primarily relating to changes to Section 162(m) of the Internal Revenue Code and the tax rules regarding the deductibility of entertainment expenses.
35
Table of Contents
We calculate our provision for income taxes using an annual effective tax rate based on projected taxable income for the year adjusted for the effects of permanent and discrete items. Deferred taxes are adjusted for significant changes in temporary items in the period in which they occur. The future effective tax rate may vary from this estimated annual effective rate due to several factors, including but not limited to, the level of state and foreign jurisdiction activity, future changes in tax laws, the amount of future book versus income tax items that are permanent in nature and changes, if any, in a valuation allowance related to deferred tax assets.
The provisions for income taxes includes the difference in book and tax deductions associated with the settlement of shares under our 2013 Plan and certain disqualifying dispositions of shares issued under our ESPP Plan.
Non-GAAP Financial Measure
In this quarterly report on Form 10-Q, we include a non-GAAP financial measure, adjusted earnings before interest income/expense, taxes, depreciation and amortization and stock-based compensation, or Adjusted EBITDA. We define Adjusted EBITDA as net income before (i) interest income and other, including net realized gains (losses) on marketable securities, available-for-sale and cash and cash equivalents, (ii) interest expense, (iii) provision for income taxes, (iv) depreciation and amortization, (v) stock-based compensation expense and (vi) other non-cash MSR activity. We use Adjusted EBITDA in our business operations to evaluate the performance of our business, develop budgets and measure our performance against those budgets, among other things. We also believe that analysts and investors use Adjusted EBITDA as a supplemental measure to evaluate our overall operating performance. However, Adjusted EBITDA has material limitations as an analytical tool and should not be considered in isolation, or as a substitute for analysis of our results as reported under U.S. generally accepted accounting principles (“U.S. GAAP”). We find Adjusted EBITDA as a useful tool to assist in evaluating performance because Adjusted EBITDA eliminates items related to capital structure, taxes and non-cash stock-based compensation charges. In light of the foregoing limitations, we do not rely solely on Adjusted EBITDA as a performance measure and also consider our U.S. GAAP results. Adjusted EBITDA is not a measurement of our financial performance under U.S. GAAP and should not be considered as an alternative to net income, operating income or any other measures calculated in accordance with U.S. GAAP. Because Adjusted EBITDA is not calculated in the same manner by all companies, it may not be comparable to other similarly titled measures used by other companies.
A reconciliation of the most directly comparable U.S. GAAP financial measure, net income, to Adjusted EBITDA is as follows (in thousands):
| Three Months Ended June 30, |
Six Months Ended June 30, |
|||||||||||||||
| 2018 | 2017 | 2018 | 2017 | |||||||||||||
| Net income |
$ | 22,167 | $ | 15,569 | $ | 40,178 | $ | 27,569 | ||||||||
| Adjustments: |
||||||||||||||||
| Interest income and other (1) |
(1,574 | ) | (745 | ) | (2,802 | ) | (1,370 | ) | ||||||||
| Interest expense |
352 | 374 | 712 | 756 | ||||||||||||
| Provision for income taxes (2) |
8,155 | 10,052 | 14,457 | 17,554 | ||||||||||||
| Depreciation and amortization |
1,503 | 1,303 | 2,878 | 2,600 | ||||||||||||
| Stock-based compensation |
3,159 | 2,115 | 5,772 | 3,981 | ||||||||||||
| Other non-cash mortgage servicing rights activity (3) |
(41 | ) | — | (41 | ) | — | ||||||||||
|
|
|
|
|
|
|
|
|
|||||||||
| Adjusted EBITDA(4) |
$ | 33,721 | $ | 28,668 | $ | 61,154 | $ | 51,090 | ||||||||
|
|
|
|
|
|
|
|
|
|||||||||
| (1) | Other for the three and six months ended June 30, 2018 and 2017 includes net realized gains (losses) on marketable securities, available-for-sale. |
| (2) | Provision for income taxes for the three and six months ended June 30, 2018 was calculated using a 21% U.S. federal corporate tax rate due to the enactment of the Act, which reduced the U.S. federal corporate tax rate from 35% to 21%. |
| (3) | Other non-cash mortgage servicing rights activity includes the assumption of servicing obligations following the completion of our business acquisitions in 2018. |
| (4) | The increase in Adjusted EBITDA for the three and six months ended June 30, 2018 compared to the same period in the prior year is primarily due to higher total revenues and a lower proportion of operating expenses compared to revenues. |
Liquidity and Capital Resources
Our primary sources of liquidity are cash and cash equivalents, cash flows from operations, marketable securities, available-for-sale and, if necessary, borrowings under our credit agreement. In order to enhance yield to us, we have invested a portion of our cash in money market funds and in fixed and variable income debt securities, in accordance with our investment policy approved by the board of directors. Certain of our investments in money market funds may not maintain a stable net asset value and may impose fees on redemptions and/or gate fees. Although we have historically funded our operations through operating cash flows, there can be no assurance that we can continue to meet our cash requirements entirely through our operations, cash and cash equivalents, proceeds from the sale of marketable securities, available-for-sale or availability under our credit agreement.
36
Table of Contents
Cash held in our Canadian operations aggregated $251,000 and $421,000 at June 30, 2018 and December 31, 2017, respectively.
Cash Flows
Our total cash and cash equivalents balance increased by $19.2 million to $240.0 million at June 30, 2018 compared to $220.8 million at December 31, 2017. The following table sets forth our summary cash flows for the six months ended June 30, 2018 and 2017 (in thousands):
| Six Months Ended June 30, |
||||||||
| 2018 | 2017 | |||||||
| Net cash provided by operating activities |
$ | 23,046 | $ | 462 | ||||
| Net cash used in investing activities |
(1,420 | ) | (22,007 | ) | ||||
| Net cash used in financing activities |
(2,393 | ) | (1,996 | ) | ||||
|
|
|
|
|
|||||
| Net increase (decrease) in cash and cash equivalents |
19,233 | (23,541 | ) | |||||
| Cash and cash equivalents at beginning of period |
$ | 220,786 | $ | 187,371 | ||||
| Cash and cash equivalents at end of period |
$ | 240,019 | $ | 163,830 | ||||
Operating Activities
Cash flows provided in operating activities were $23.0 million for the six months ended June 30, 2018 compared to $0.5 million for the same period in 2017. Net cash provided by operating activities is driven by our net income adjusted for non-cash items and changes in operating assets and liabilities. The $22.6 million improvement in operating cash flows for the six months ended June 30, 2018 compared to the same period in 2017 was primarily due to increases in our volume of real estate brokerage and financing activities, the reduction in our effective income tax rate, differences in timing of payments and receipts, a decrease in advances to our investment sales and financing professionals, a change in bonus accruals and a lower proportion of operating expenses compared to revenues. These improvements in operating cash flows were partially offset by a decrease in the deferral of certain discretionary and other commissions.
Investing Activities
Cash flows used in investing activities were $1.4 million for the six months ended June 30, 2018 compared to $22.0 million for the same period in 2017. The change in investing cash flows for the six months ended June 30, 2018 compared to the same period in 2017 was primarily due to $7.6 million in net purchases and proceeds of marketable securities, available-for-sale for the six months ended June 30, 2018 compared to $18.3 million for the same period in 2017. This change was partially offset by business acquisitions in 2018, which resulted in a $6.2 million use of cash for the six months ended June 30, 2018. See Note 3 – “Acquisition” of our Notes to Condensed Consolidated Financial Statements for additional information.
Financing Activities
Cash flows used in financing activities were $2.4 million for the six months ended June 30, 2018 compared to $2.0 million for the same period in 2017. The change in cash flows used in financing activities for the six months ended June 30, 2018 compared to the same period in 2017 was impacted by taxes paid related to net share settlement of stock-based awards with no such activities in 2018 due to the adoption of ASU 2018-02, Reclassification of Certain Tax Effects from Accumulated Other Comprehensive Income. See Note 11 – “Stock-Based Compensation Plans” of our Notes to Condensed Consolidated Financial Statements for additional information.
Liquidity
We believe that our existing balances of cash and cash equivalents, cash flows expected to be generated from our operations, proceeds from the sale of marketable securities, available-for-sale and borrowings available under the credit agreement will be sufficient to satisfy our operating requirements for at least the next twelve months. If we need to raise additional capital through public or private debt or equity financings, strategic relationships or other arrangements, this capital might not be available to us in a timely manner, on acceptable terms, or at all. Our failure to raise sufficient capital when needed could prevent us from, among other factors, to fund acquisitions or to otherwise finance our growth or operations. In addition, our notes payable to former stockholders and SARs liability have provisions, which could accelerate repayment of outstanding principal and accrued interest and adversely impact our liquidity.
37
Table of Contents
Contractual Obligations and Commitments
There have been no material changes in our commitments under contractual obligations, as disclosed in our Annual Report on Form 10-K for the year ended December 31, 2017.
Off Balance Sheet Arrangements
We do not have any off balance sheet arrangements.
Inflation
Our commissions and other variable costs related to revenue are primarily affected by real estate market supply and demand, which may be affected by general economic conditions including inflation. However, to date, we do not believe that general inflation has had a material impact upon our operations.
Critical Accounting Policies; Use of Estimates
We prepare our financial statements in accordance with U.S. GAAP. In applying many of these accounting principles, we make assumptions, estimates and/or judgments that affect the reported amounts of assets, liabilities, revenues and expenses in our condensed consolidated financial statements. We base our estimates and judgments on historical experience and other assumptions that we believe are reasonable under the circumstances. These assumptions, estimates and/or judgments, however, are often subjective and our actual results may change based on changing circumstances or changes in our analyses. If actual amounts are ultimately different from our estimates, the revisions are included in our results of operations for the period in which the actual amounts become known. There were no material changes in our critical accounting policies, as disclosed in in our Annual Report on Form 10-K for the year ended December 31, 2017 except for the following:
Revenue Recognition
The Company generates real estate brokerage commissions by acting as a broker for real estate owners or investors seeking to buy or sell commercial properties. The Company generates financing fees from securing financing on purchase transactions as well as fees earned from refinancing its clients’ existing mortgage debt and other financing activities. Other revenues include fees generated from consulting and advisory services, as well as referral fees from other real estate brokers. The Company’s contracts contain one performance obligation related to its real estate brokerage, financing and consulting and advisory services offered to buyers and sellers of commercial real estate and provide that it is operating as a principal in all its revenue generating activities. The Company does not have multiple-element arrangements, variable consideration, financing components, significant noncash consideration, licenses, long-term contracts with customers or other items affecting the transaction price. Accordingly, the Company determined that the transaction price is fixed and determinable and collectability is reasonably assured. The Company recognizes revenue in principally all cases at the close of escrow for real estate brokerage, close of loan for financing and when services are provided upon closing of the transaction for other revenues.
Recent Accounting Pronouncements
For information regarding recent accounting pronouncements, see Note 2 – “Accounting Policies and Recent Accounting Pronouncements” of our Notes to Condensed Consolidated Financial Statements.
Item 3. Quantitative and Qualitative Disclosures About Market Risk
We maintain a portfolio of investments in a variety of fixed and variable debt rate securities, including U.S. government and federal agency securities, corporate debt securities, asset backed securities and other. As of June 30, 2018, the fair value of investments in marketable securities, available-for-sale was $117.4 million. The primary objective of our investment activity is to maintain the safety of principal, provide for future liquidity requirements while maximizing yields without significantly increasing risk. While some investments may be securities of companies in foreign countries, all investments are denominated and payable in U.S. Dollars. We do not enter into investments for trading or speculative purposes. While our intent is not to sell these investment securities prior to their stated maturities, we may choose to sell any of the securities for strategic reasons including, but not limited to, anticipated capital requirements, anticipation of credit deterioration, duration management and when a security no longer meets the criteria of the Company’s investment policy. We do not use derivatives or similar instruments to manage our interest rate risk. We seek to invest in high quality investments. The weighted average rating (exclusive of cash and cash equivalents) was AA as of June 30, 2018. Maturities are maintained consistent with our short-, medium- and long-term liquidity objectives.
38
Table of Contents
Currently, our portfolio of investments predominantly consists of fixed interest rate debt securities; however, a portion of our investment portfolio may consist of variable interest rate debt securities. Our investments in fixed interest rate debt securities are subject to market risk. Changes in prevailing interest rates may adversely or positively impact their fair market value should interest rates generally rise or fall. Accordingly, we also may have interest rate risk with the variable rate debt securities as the income produced may decrease if interest rates fall. The following table sets forth the impact on the fair value of our investments as of June 30, 2018 from changes in interest rates based on the duration of the securities (dollars in thousands):
| Change in Interest Rates |
Approximate Change in Fair Value of Investments Increase (Decrease) |
|||
| 2% Decrease |
$ | 2,833 | ||
| 1% Decrease |
$ | 1,416 | ||
| 1% Increase |
$ | (1,415 | ) | |
| 2% Increase |
$ | (2,830 | ) | |
Due to the nature of our business and the manner in which we conduct our operations, we believe we do not face any material interest rate risk with respect to other assets and liabilities, equity price risk or other market risks. The functional currency of our Canadian operations is the Canadian dollar. We are exposed to foreign currency exchange rate risk for the settlement of transactions of the Canadian operations as well as unrealized translation adjustments. To date, realized foreign currency exchange rate gains and losses have not been material.
Item 4. Controls and Procedures
Evaluation of Disclosure Controls and Procedures
As of June 30, 2018, our management, with the participation of our Chief Executive Officer and Chief Financial Officer, evaluated the effectiveness of our disclosure controls and procedures defined in Rules 13a-15(e) and 15d-15(e) under the Exchange Act. Based upon that evaluation, our Chief Executive Officer and Chief Financial Officer concluded that, as of June 30, 2018, our disclosure controls and procedures were effective in ensuring that material information required to be disclosed by us in the reports that we file or submit under the Exchange Act is recorded, processed, summarized and reported within the time periods specified in the Securities and Exchange Commission’s rules and forms, including ensuring that such material information is accumulated by and communicated to our management, including our Chief Executive Officer and Chief Financial Officer, as appropriate to allow timely decisions regarding required disclosure.
The design of any system of control is based upon certain assumptions about the likelihood of future events, and there can be no assurance that any design will succeed in achieving its stated objectives under all future events, no matter how remote, or that the degree of compliance with the policies or procedures may not deteriorate. Because of its inherent limitations, disclosure controls and procedures may not prevent or detect all misstatements. Accordingly, even effective disclosure controls and procedures can only provide reasonable assurance of achieving their control objectives.
Changes in Internal Control over Financial Reporting
There were no changes in our internal control over financial reporting during the quarter ended June 30, 2018 that have materially affected, or are reasonably likely to materially affect, our internal control over financial reporting.
39
Table of Contents
PART II. OTHER INFORMATION
We are involved in claims and legal actions arising in the ordinary course of our business, some of which involve claims for damages that are substantial in amount. Most of these litigation matters are covered by insurance which contain deductibles, exclusions, claim limits and aggregate policy limits. Such litigation and other proceedings may include, but are not limited to, actions relating to commercial relationships, standard brokerage disputes like the alleged failure to disclose physical or environmental defects or property expenses or contracts, the alleged inadequate disclosure of matters relating to the transaction like the relationships among the parties to the transaction, potential claims or losses pertaining to the asset, vicarious liability based upon conduct of individuals or entities outside of our control, general fraud claims, conflicts of interest claims, employment law claims, including claims challenging the classification of our sales professionals as independent contractors, claims alleging violations of state consumer fraud statutes and intellectual property. While the ultimate liability for these legal proceeding cannot be determined, we review the need for our accrual for loss contingencies quarterly and record an accrual for litigation related losses where the likelihood of loss is both probable and estimable. We do not believe, based on information currently available to us, that the final outcome of these proceedings will have a material adverse effect on our consolidated financial position, results of operations or cash flows.
For information on our legal proceedings, see Note 14 – “Commitments and Contingencies” of our Notes to Condensed Consolidated Financial Statements.
There have been no material changes from the risk factors described in our Annual Report on Form 10-K for the year ended December 31, 2017 other than the new risk factor below.
Our existing goodwill and other intangible assets could become impaired, which may require us to take non-cash charges.
In the second quarter of 2018, we made certain acquisitions that resulted in the recording of intangible assets and goodwill. The goodwill recorded as part of the acquisitions arises from the acquired assembled workforce and commercial lending platform.
Under current accounting guidelines, we evaluate our goodwill and other intangible assets for potential impairment annually or more frequently if circumstances indicate impairment may have occurred. We perform the required annual goodwill impairment evaluation in the fourth quarter of each year. Any impairment of goodwill or other intangible assets would result in a non-cash charge against earnings, such charge could materially adversely affect our reported results of operations and the market price of our common stock in future periods.
Item 2. Unregistered Sales of Equity Securities and Use of Proceeds
None.
Item 3. Defaults upon Senior Securities
None.
Item 4. Mine Safety Disclosures
Not Applicable.
None.
40
Table of Contents
| Exhibit No. |
Description | |
| 10.1 | Marcus & Millichap, Inc. Deferred Compensation Plan | |
| 31.2* | Certification of Chief Financial Officer pursuant to Rule 13a-14(a) under the Exchange Act, as adopted pursuant to Section 302 of the Sarbanes-Oxley Act of 2002 | |
| 32.1** | Certifications of Chief Executive Officer and Chief Financial Officer pursuant to Rule 13a-14(b) under the Exchange Act and 18 U.S.C. Section 1350, as adopted pursuant to Section 906 of the Sarbanes-Oxley Act of 2002 | |
| 101.INS* | XBRL Instance Document | |
| 101.SCH* | XBRL Taxonomy Extension Schema Document | |
| 101.CAL* | XBRL Taxonomy Calculation Linkbase Document | |
| 101.DEF* | XBRL Taxonomy Extension Definition Document | |
| 101.LAB* | XBRL Taxonomy Label Linkbase Document | |
| 101.PRE* | XBRL Taxonomy Presentation Linkbase Document | |
| * | Filed herewith. |
| ** | Furnished, not filed. |
41
Table of Contents
Pursuant to the requirements of the Securities Exchange Act of 1934, the registrant has duly caused this report to be signed on its behalf by the undersigned thereunto duly authorized.
| Marcus & Millichap, Inc. | ||||||||
| Date: | August 9, 2018 |
By: | /s/ Hessam Nadji | |||||
| Hessam Nadji | ||||||||
| President and Chief Executive Officer | ||||||||
| (Principal Executive Officer) | ||||||||
| Date: | August 9, 2018 |
By: | /s/ Martin E. Louie | |||||
| Martin E. Louie | ||||||||
| Chief Financial Officer | ||||||||
| (Principal Financial Officer) | ||||||||
Exhibit 10.1
MARCUS & MILLICHAP, INC.
DEFERRED COMPENSATION PLAN
Restated Effective January 1, 2014
MARCUS & MILLICHAP, INC.
DEFERRED COMPENSATION PLAN
Restatement Effective January 1, 2014
The MARCUS & MILLICHAP, INC. DEFERRED COMPENSATION PLAN (the “Plan”) is amended and restated, effective January 1, 2014, by MARCUS & MILLICHAP, INC. (the “Company”), for the purpose of providing deferred compensation for a select group of management or highly compensated employees of the Employer. This Plan is intended to be an unfunded, nonqualified deferred compensation plan. Plan participants shall have the status of unsecured creditors of the Company with respect to the payment of Plan benefits.
ARTICLE I.
DEFINITIONS
Whenever used herein, the masculine pronoun shall be deemed to include the feminine, and the singular to include the plural, unless the context clearly indicates otherwise, and the following definitions shall govern the Plan:
1.1 “Account” means the book entry account established under the Plan for each Participant to which are credited the Participant’s Salary Deferral Amounts, Annual Bonus Deferral Amounts, Supplemental Bonus Deferral Amounts, any Discretionary Company Contributions and the Interest with respect thereto. Account balances shall be reduced by any distributions made to the Participant or the Participant’s Beneficiary(ies) therefrom and any charges that may be imposed on such Account(s) pursuant to the terms of the Plan.
1.2 “Annual Bonus Deferral Amount” means the amount, percentage, or a percentage over a specified amount of a Participant’s annual bonus, as provided in Section 3.2 that the Participant elects to contribute to the Plan pursuant to Article III.
1.3 “Benchmark Fund” shall mean one or more of the mutual funds or contracts selected by the Board pursuant to Section 5.3.1.
1.4 “Beneficiary” means one, some, or all (as the context shall require) of those persons, trusts or other entities designated by a Participant on a beneficiary designation form to receive the undistributed value of his or her Account following the Participant’s death.
1.5 “Benefit Distribution Election” means the election, whereby a Participant may elect an optional form of distribution pursuant to Section 6.4.2 or a planned Distribution Date pursuant to Section 6.3. Such election shall be made in such manner as may be prescribed by the Committee from time to time.
1.6 “Benefit(s)” means the total vested amount credited to a Participant’s Account and may include the supplemental death benefit payable in accordance with Section 6.11.
I.7 “Board of Directors” or “Board” means the Board of Directors of the Company.
1
1.8 “Code” means the Internal Revenue Code of 1986, as amended.
1.9 “Committee” means the Deferred Compensation Committee composed of such individuals as may be appointed by the Board which shall function as the Plan Administrator.
1.10 “Company” means Marcus & Millichap, Inc., and any successor organization thereto.
1.11 “Disability” means the Participant’s inability to engage in any substantial, gainful activity by reason of any medically determinable physical or mental impairment that can be expected to result in death or which has lasted or can be expected to last for a continuous period of not less than twelve (12) months. The permanence and degree of such impairment shall be supported by medical evidence.
1.12 “Discretionary Company Contribution” means the amount, if any, of Employer contributions made on behalf of a Participant pursuant to Article III.
1.13 “Distribution Date” means the date on which distribution of a Participant’s Benefits is made or commenced pursuant to Article VI.
1.14 “Effective Date” means January 1, 2014, the effective date of the Plan’s restatement. The original effective date of the Plan is April 1, 2000.
1.15 “Election” means the form on which a Participant elects to make salary deferrals, annual bonus deferrals and/or supplemental bonus deferrals to the Plan, pursuant to Article III, and to elect planned benefit distributions for such deferred amounts as provided in Section 6.3. Such Election shall be in a form prescribed by the Committee and may be modified from time to time.
1.16 “Eligible Employee” means a common law employee of the Employer who is a member of the select group of management and highly compensated employees as more particularly described in Article II and who has been designated by the Committee, in its sole discretion, as eligible to participate in the Plan.
1.17 “Employer” means the Company and any subsidiary thereof or related entity that has adopted this Plan.
1.18 “Entry Date” means January 1 of each year.
1.19 “Interest” means the investment return or loss determined in accordance with Article V which shall be credited to the Participants’ Accounts.
1.20 “Interest Rate” shall have the meaning as set forth in Section 5.3.
1.21 “Participant” means an Eligible Employee who has elected to participate in the Plan by executing and submitting an Election to the Committee. A Participant shall also mean an Eligible Employee for whom Discretionary Company Contributions arc made, regardless of whether such Eligible Employee has executed and submitted an Election.
2
1.22 “Plan” means the Marcus & Millichap, Inc. Deferred Compensation Plan, as it may be amended from time to time in the future.
1.23 “Plan Year” means the 12-month period beginning on January 1 and ending on December 31. Initially, the Plan Year began on April 1 and ended on March 31 of the following calendar year. Effective January 1, 2005, the Plan Year was changed to a calendar year.
1.24 “Retirement” means the Participant’s termination of employment with the Company, if such Participant has (i) attained the age of 60; or (ii) attained age 55 and has 10 Years of Service with the Company. A Participant who terminates Service with the Company and resumes Service more than 6 months after his or her original termination date, will not have his or her Service with the Company prior to his or her original termination date count for purposes of determining Retirement.
1.25 “Salary Deferral Amount” means the amount or percentage of a Participant’s salary that the Participant elects to contribute to the Plan pursuant to Article III.
1.26 “Service” means the Participants employment or service with the Company on a substantially full-time basis, whether in the capacity of an employee or as an independent contractor. A Participant’s Service shall not be deemed to have terminated merely because of a change in the capacity under which the Participant renders Service to the Company, provided there is no interruption or termination of Participant’s Service. A Participant’s Service shall terminate upon an actual termination of Service, whether by death, Disability, Retirement, or otherwise. Subject to the foregoing, the Company, in its discretion, shall determine whether Participant’s Service has terminated and the effect of such termination.
1.27 “Supplemental Bonus Deferral Amount” means the amount, percentage, or a percentage over a specified amount of a Participant’s supplemental bonus, as provided in Section 3.2.5, if any, that the Participant elects to contribute to the Plan pursuant to Article III.
1.28 “Trust” means the legal entity created by the Trust Agreement.
1.29 “Trust Agreement” means the trust agreement entered into between the Company and Wells Fargo Bank, effective April 15, 2000, and any amendments thereto.
1.30 “Trustee” means the Trustee named in the Trust Agreement and any duly appointed successor or successors thereto.
1.31 “Year of Service” means 12 consecutive months of Service.
3
ARTICLE II.
ELIGIBILITY
2. I Eligibility. Eligibility for participation in the Plan shall be limited to a select group of management or highly compensated employees of the Employer who are selected by the Committee, in its sole discretion, to participate in the Plan. Individuals who are in this select group shall be notified as to their eligibility to participate in the Plan.
2.2 Commencement of Participation. An Eligible Employee may begin participation in the Plan upon any Entry Date, subject to the execution and submission of an Election pursuant to Article III. In addition, participation of an Eligible Employee who has not otherwise commenced participation in the Plan, shall commence when a Discretionary Company Contribution is made to the Account of such Eligible Employee pursuant to the provisions of Section 3.3.
2.3 Cessation of Participation. Active participation in the Plan shall end when a Participant’s employment terminates for any reason or at such time as a Participant is notified by the Board, pursuant to Section 2.4, below, that he or she is no longer eligible to participate in the Plan. Upon termination of employment or eligibility, a Participant shall remain an inactive Participant in the Plan until all of the vested Benefits to which he or she is entitled under this Plan have been paid in full.
2.4 Cessation of Eligibility. The Board may at any time, in its sole discretion, notify any Participant that he or she is not eligible for Discretionary Company Contributions in any Plan Year.
ARTICLE III.
DEFERRALS AND CONTRIBUTIONS
3.1 Salary Deferrals.
3.1.1 An Eligible Employee may elect to reduce his or her salary by the amount or percentage set forth in a written and signed Election filed with the Committee, subject to the provisions of this Article III. The salary deferral Election must be returned to the Committee on the form due date during the open enrollment period each year, to be effective with the first pay period of the following Plan Year. The Salary Deferral Amount shall not be paid to the Participant, but shall be withheld from the Participant’s salary and an amount equal to the Salary Deferral Amount shall be credited to the Participant’s Account.
3.1.2 A salary deferral Election is only valid for one Plan Year. A Participant’s salary deferral Election shall be irrevocable throughout the Plan Year for which it was made. Participants must execute and provide to the Committee a new salary deferral Election during the open enrollment period for each subsequent Plan Year in which they wish to make salary deferrals to the Plan.
3.1.3 Each Election to make salary deferrals shall apply only to salary earned on and after the effective date of such Election.
4
3.1.4 For the purpose of determining an Eligible Employee’s Salary Deferral Amount, “salary” shall mean the base salary paid by the Employer, but shall not include any other form of compensation, whether taxable or non-taxable, including, but not limited to, bonuses, commissions, overtime, incentive payments, non-monetary awards, auto allowances and other forms of additional compensation.
3.2 Annual Bonus Deferrals and Supplemental Bonus Deferrals.
3.2.1 In addition to the salary deferral Election described above, each Eligible Employee may elect to defer an amount or a percentage (including a percentage over a specified amount) of each annual bonus or supplemental bonus payable with respect to the Plan Year with respect to which such bonus deferral Election is made, subject to the provisions of this Article III. The Annual Bonus Deferral Amount and Supplemental Bonus Deferral Amount shall not be paid to the Participant, but shall be withheld from the Participant’s annual bonus and/or supplemental bonus and an amount equal to the Annual Bonus Deferral Amount and Supplemental Bonus Deferral Amount shall be credited to the Participant’s Account.
3.2.2 An Eligible Employee’s election to defer a portion of the annual bonus and/or supplemental bonus shall be made by a written and signed Election filed with the Committee. Such Election shall be subject to the limitation provisions of Section 3.4 below. The Election must be returned to the Committee on the form due date during the open enrollment period each year (which shall be no later than June 30), to be effective for any bonus paid for performance during the current performance period/Plan Year. The annual bonus deferral and/or the supplemental bonus deferral Election shall be irrevocable for the Plan Year for which it was made.
3.2.3 A Participant’s annual bonus and/or supplemental bonus Election is only valid for one Plan Year. A Participant must execute and provide to the Committee a new annual bonus and/or supplemental bonus Election during the open enrollment period for each subsequent Plan Year in which he or she wishes to make annual bonus and/or supplemental bonus deferrals to the Plan.
3.2.4 For the purposes of determining an Eligible Employee’s Annual Bonus Deferral Amount, “annual bonus” shall mean amounts, if any, awarded under the annual bonus policy maintained by the Employer.
3.2.5 For the purposes of determining an Eligible Employee’s Supplemental Bonus Deferral Amount. “supplemental bonus’’ shall mean amounts, if any, awarded under the supplemental bonus policy maintained by the Employer.
3.3 Discretionary Company Contributions. A Participant’s Account shall be credited with Discretionary Company Contributions, in such amounts and at such times as the Company may, in its sole discretion, determine and communicate to the Participant. Discretionary Company Contributions shall be based upon the profitability of the Company, the performance of the Participant, and such other factors as the Company shall consider appropriate, in its sole discretion. The Company shall be under no obligation to continue to make Discretionary Company Contributions and may discontinue or change the amount or method of calculating the amount of such Discretionary Company Contributions at any time.
5
3.4 Limitations on Deferrals. A Participant’s Salary, Annual Bonus and/or Supplemental Bonus Deferral Amount shall be limited as follows:
3.4.1 A Participant must defer a minimum of $5,000 each Plan Year (which shall be prorated based on the number of months a Participant participates in the Plan if less than twelve (12)). This minimum deferral amount may be satisfied by Salary, Annual Bonus and/or Supplemental Bonus Deferral Amount, or a combination thereof.
3.4.2 A Participant may elect to reduce his or her salary, annual and/or supplemental bonus up to a maximum of twenty-five percent (25%).
3.4.3 The Salary, Annual Bonus and/or Supplemental Bonus Deferral Amount elected by the Participant shall be reduced by the amount(s), if any, which may be necessary:
3.4.3.1 To satisfy all applicable income and employment taxes withholding and FICA contributions;
3.4.3.2 To pay all contributions elected by the Participant pursuant to any welfare benefit plans; and
3.4.3.3 To satisfy all garnishments or other amounts required to be withheld by applicable law or court order.
3.5 No Withdrawal. Except as provided in Sections 6.7 and 6.8 below, amounts credited to a Participant’s Account may not be withdrawn by a Participant and shall be paid only in accordance with the provisions of this Plan.
ARTICLE IV.
VESTING
4.1 Vesting of Participants’ Accounts.
4.1.1 Salary, Annual Bonus and/or Supplemental Bonus Deferral Amounts and Interest thereon credited to a Participant’s Account shall always be 100% vested.
4.1.2 Except as provided in Section 4.1.3 below, a Participant shall vest in each year’s Discretionary Company Contributions and the Interest credited thereon in accordance with the following schedule, unless the Company, in its sole discretion, specifies at the time of any Discretionary Company Contribution a different vesting schedule:
6
| Years of Service From First Day Of Plan Year To Which A Discretionary Company Contribution Relates |
Percentage of Nonforfeitable Interest |
|||
| Less than 1 |
0 | % | ||
| 1 |
20 | % | ||
| 2 |
40 | % | ||
| 3 |
60 | % | ||
| 4 |
80 | % | ||
| 5 or more |
100 | % | ||
4.1.3 Notwithstanding the above, Discretionary Company Contributions credited to a Participant’s Account shall be 100% vested upon the Participant’s death, Disability or Retirement.
4.2 Years of Service for Vesting Purposes. For purposes of determining vesting in Discretionary Company Contributions made with respect to a Plan Year and Interest credited with respect thereto:
4.2.1 Only Service from and after the first day of such Plan Year shall be taken into account; and
4.2.2 A Participant who terminates Service with the Company and subsequently resumes Service more than 6 months after his or her prior termination of Service, will not have his or her Service with the Company subsequent to such resumption of Service count for purposes of determining vesting of Discretionary Company Contributions made prior to such termination of Service.
4.3 Vesting Upon Plan Termination. Notwithstanding any other provision in the Plan to the contrary, a Participant’s Account shall be 100% vested upon the termination of the Plan.
ARTICLE V.
ACCOUNTS
5.1 Accounts. A separate Account shall be established and maintained for each Participant. The Participant’s Account shall be credited with the Participant’s Salary Deferral Amount, Annual Bonus Deferral Amount, Supplemental Bonus Deferral Amount and Discretionary Company Contributions, if any, made for such Participant. The Participants’ Accounts shall be credited (debited) with the applicable Interest, as set forth in this Article V. Participants’ Accounts shall be reduced by distributions therefrom and any charges which may be imposed on the Accounts pursuant to the terms of the Plan.
5.2 Interest Credited to Accounts at Least Monthly. Each Account shall be credited (debited) monthly, or more frequently as the Committee may specify, in an amount equal to the Account balance on the first day of the prior month multiplied by the Interest Rate applicable to such Account.
7
5.3 Determination of lnterest Rate.
5.3.1 The Committee shall designate the particular funds or contracts which shall constitute the Benchmark Funds, and may, in its sole discretion, change or add to the Benchmark Funds; provided, however, that the Committee shall notify Participants of any such change prior to the effective date thereof.
5.3.2 Each Participant may select among the Benchmark Funds and specify the manner in which his or her Account shall be deemed to be invested, solely for purposes of determining the Participant’s Interest Rate. Each year’s salary, annual and/or supplemental bonus deferrals may have a separate investment election. The Committee shall establish and communicate the rules, procedures and deadlines for making and changing Benchmark Fund selections. The Company shall have no obligation to acquire investments corresponding to the Participant’s Benchmark Fund selections.
5.3.3 The Interest Rate is based on the asset unit value, net of administrative fees and investment management fees and other applicable fees or charges, of the Benchmark Fund(s) designated by the Board and other applicable fees or charges. The Interest Rate may be negative if the applicable Benchmark Fund(s) sustain a loss.
ARTICLE VI.
BENEFIT DISTRIBUTIONS AND ACCOUNT WITHDRAWALS
6.1 Benefit Amount. The value of the Participant’s Benefit shall be equal to the vested value of the Participant’s Account on the last day of the calendar quarter prior to the Distribution Date, or such other date as the Committee may specify, adjusted for any Salary, Annual Bonus and/or Supplemental Bonus Deferral Amounts or Discretionary Company Contributions or withdrawals which have been subsequently credited thereto or made therefrom prior to the Distribution Date.
6.2 Timing of Distributions. Benefits shall be paid (or installment payments shall commence) as soon as practicable after the earliest of:
6.2.1 The first day of the month following the end of the calendar quarter in which a Participant’s employment with the Employer terminates; or
6.2.2 The Distribution Date designated by the Participant in accordance with Section 6.3; or
6.2.3 As soon as administratively feasible after the date of the Participant’s death or the date that the Committee determines that a Participant is Disabled, but no later than the last day of the Plan Year in which such date occurs, or, if later, within two and one-half months of such date.
8
6.3 Planned Benefit Distributions.
6.3.1 Two-Year Advance Election. A Participant may, in connection with his or her salary, annual bonus and/or supplemental bonus Election made for a Plan Year, elect to have his or her salary and or bonus deferrals made for such Plan Year and the Interest attributable thereto, or such lesser dollar amount as may be specified in the Election, distributed in a single lump sum in the year designated by the Participant that is at least two years after the end of the Plan Year for which such deferrals are made. The date in the designated year on which the planned benefit distribution shall be made shall be determined by the Committee. Except as otherwise provided in this Article VI, the Election to take a planned benefit distribution shall apply only to the Participant’s Salary, Annual Bonus and/or Supplemental Bonus Deferral Amounts, and shall not apply to any Discretionary Company Contributions that may be made to the Plan, except to the extent the Company has specified otherwise.
6.3.2 Revocation or Amendment of Election. A Participant may revoke and/or amend the planned benefit distribution Election by filing a revocation or, an amended Election at least twelve (12) months in advance of the planned benefit distribution date specified in the prior Election. Any new planned benefit distribution date elected in an amended Election must be at least 5 years after the date specified in the prior Election. There is no limit on the number of times a Participant may amend a planned benefit distribution Election in order to provide for a different planned benefit distribution date.
6.3.3 Termination Before the Planned Distribution Date. Notwithstanding any prior Election, if the Participant terminates employment with the Employer before his elected planned benefit distribution date, distribution of the Participant’s Account shall commence as soon as administratively feasible after the first day of the month following the end of the calendar quarter in which the employment termination occurs.
6.3.4 Absence of Planned Benefit Distribution Election. If a Participant does not make an Election requesting a planned benefit distribution date in his or her initial Election, as provided in Section 6.3.1, the Participant will be deemed to have made a Benefit Distribution Election to receive such Plan Year’s Salary, Annual Bonus and/or Supplemental Bonus Deferral Amounts after his or her termination of employment, or as otherwise provided in Section 6.2, and such a deemed election shall be irrevocable.
6.4 Form of Distribution of Benefits.
6.4.1 Lump Sum Distributions. Except as provided in Section 6.4.2, below, Benefits shall be paid in a single lump sum cash distribution.
6.4.2 Optional Farm of Distributions. If one of the following requirements is met at the time of Benefit distribution, the Participant may receive an optional form of distribution as described in Section 6.4.3:
6.4.2.1 The Participant has attained age 50; or
6.4.2.2 The Participant has a minimum of 10 Years of Service with the Employer. A Participant who terminates Service with the Company and subsequently resumes Service more than 6 months after his or her original termination date, will not have his or her Service with the Company prior to his or her original termination date count for this purpose.
9
6.4.3 Optional Form of Distribution. A Participant who satisfies either of the requirements for an optional form of distribution set forth in Section 6.4.2 above, may have his or her Benefits paid in one of the following optional forms of distribution:
6.4.3.1 Lump sum cash distribution;
6.4.3.2 20 quarterly installments;
6.4.3.3 40 quarterly installments; or
6.4.3.4 60 quarterly installments.
6.4.4 Initial Election of Optional Form of Distribution. The initial election to receive an optional form of distribution must be made by filing a written Benefit Distribution Election, in the form required by the Committee, at the time of the deferral Election or upon notice from the Company that a Discretionary Company Contribution will be made to the Participant’s Account.
6.4.5 Subsequent Change to Election of Optional Form of Distribution. An election to receive an optional form of distribution may be revoked or amended by filing a new written Benefit Distribution Election, in the form required by the Committee, at least one year in advance of the Distribution Date. Any change in the form of distribution must postpone the Distribution Date by 5 years.
6.4.6 Ineligible Elections for Optional Form of Distribution. In the event a Participant elects to receive an optional form of distribution for which they do not satisfy the requirements of Section 6.4.2 as of the Distribution Date, the Participant’s form of distribution will automatically default to a single lump sum.
6.4.7 Installment Amounts. For purposes of this Section 6.4, installment distributions shall be paid in substantially equal quarterly payments under an installment methodology established by the Committee pursuant to Section 9.1.4.
6.4.8 Reemployed After Installments Begin. If a former Participant is reemployed after having begun to receive installment distributions from the Plan, then such former Participant, upon once again becoming an Eligible Employee, may begin a new period of participation in the Plan, provided, however, that the installment distributions previously commenced will continue to be paid to the Participant over the specified term.
6.5 Minimum Account Balance Necessary for Installments. Notwithstanding Section 6.4.2, if a Participant’s Account balance is $50,000 or less, the Participant’s Benefit will automatically be distributed in a single lump sum.
6.6 Distribution Following Plan Termination. Upon termination of the Plan, all Benefits shall be paid in accordance with Code section 409A and the Treasury regulations thereunder.
10
6.7 Distribution Upon Death of Participant. If a Participant dies before his or her Benefit payments have commenced, then such Participant’s Benefits shall be paid to his or her designated Beneficiary(ies) in a single lump sum cash distribution. If a Participant dies after his or her Benefit distribution has commenced, his or her remaining Benefits shall be paid to the deceased Participant’s Beneficiary(ies) in a single lump sum cash distribution.
6.8 Financial Hardship Withdrawal. An actively-employed Participant may withdraw up to one hundred percent (100%) of his or her Salary, Annual Bonus and/or Supplemental Bonus Deferral Amounts (Discretionary Company Contributions are not eligible for this hardship withdrawal) as may be required to meet a sudden unforeseeable financial emergency of the Participant. Such hardship distribution shall be subject to the following provisions:
6.8.1 The hardship withdrawal must be necessary to satisfy the unforeseeable emergency and no more may be withdrawn than is required to relieve the financial need after taking into account other resources that arc reasonably available to the Participant for this purpose.
6.8.2 The Participant must certify that the financial need cannot be relieved: (i) through reimbursement or compensation by insurance or otherwise; (ii) by reasonable liquidation of the Participant’s assets, to the extent such liquidation would not itself cause an immediate and heavy financial need; (iii) by borrowing from commercial sources on reasonable commercial terms; or (iv) by cessation of deferrals to the Plan.
6.8.3 An unforeseeable financial emergency is a severe financial hardship to Participant resulting from a sudden and unexpected illness or accident of Participant or of a dependent of Participant (as defined in section 152(a) of the Code), loss of Participant’s property due to casualty, or other similar extraordinary and unforeseeable circumstances arising as a result of events beyond the control of Participant. Neither the need to pay tuition expenses on behalf of the Participant or the Participant’s spouse or children nor the desire to purchase a home shall be considered an unforeseeable emergency.
6.8.4 The Committee, in its sole discretion, shall determine if there is an unforeseeable financial emergency, if the Participant has other resources to satisfy such emergency and the amount of the hardship withdrawal that is required to alleviate the Participant’s financial hardship.
6.8.5 Participants electing a financial hardship withdrawal will be ineligible to continue making Salary, Annual Bonus and/or Supplemental Bonus Deferral Amounts for the remainder of the Plan Year in which a financial hardship withdrawal occurs and for the entire Plan Year thereafter. Such Participants will, however, be eligible for any Discretionary Company Contributions which may be made to the Plan on their behalf.
6.9 Limitation on Distributions to “Covered Employees.” Notwithstanding any other provision of this Article VI, in the event that the Participant is a “covered employee,” as that term is defined in section 162(m)(3) of the Code, or would be a covered employee if Benefits were distributed in accordance with his or her Benefit Distribution Election, the maximum
11
amount which may be distributed from the Participant’s Account in any Plan Year shall not exceed one mill ion dollars ($1 ,000,000) less the amount of compensation paid to the Participant in such Plan Year which is not “ performance-based” (as defined in Code section 162(m)(4)(C)), which amount shall be reasonably determined by the Committee at the time of the proposed distribution. Any amount which is not distributed to the Participant in a Plan Year as a result of this limitation shall be distributed to the Participant in the next Plan Year, subject to compliance with the foregoing limitation set forth in this Section 6.9.
6.10 Limitation on Distribution to “Specified Employees.” Notwithstanding any other provision of this Article VI, in the event that the Participant is a “specified employee,” as the term is defined by the Treasury regulations under section 409A of the Code, at the time of his or her termination of employment, the Distribution Date for any distribution made pursuant to Participant’s termination of employment under Section 6.2.1 may not occur before a date that is six months from the Participant’s separation from service. In the event the Participant has elected installment payments under Section 6.4.3, any payments which would have been made during the first six months after Participant’s separation from service will be paid on the first day of the seventh month following separation from service.
6.11 Supplemental Death Benefit. This benefit was frozen as of December 31, 2004.
6.11.1 A supplement death benefit in the amount of $100,000 shall be paid to the Beneficiary-of an eligible Participant, who has satisfied the criteria set forth in Section 6.11.2.
6.11.2 To be eligible for this supplemental death benefit, a Participant must have satisfied the following criteria prior to his or her death:
6.11.2.1 The Participant is eligible to participate in the Plan (regardless of whether or not the Participant actually elected to make salary, annual bonus and/or supplemental bonus deferrals;
6.11.2.2 The Participant was an active employee with the Employer at the time of his or her death;
6.11.2.3 The Participant completed and submitted an insurance application to the Committee; and
6.11.2.4 The Company subsequently purchased an insurance policy on the life of the Participant, with a death benefit of at least $100,000, and which policy is in effect at the time of the Participant’s death.
6.11.3 Notwithstanding any provision of this Plan or any other document to the contrary, the supplemental death benefit payable pursuant to this Section 6.11 shall be paid only if an insurance policy has been issued on the Participant’s life and is in force at the time of the Participant’s death and the Company shall have no obligation with respect to the payment of the supplemental death benefit, or to maintain an insurance policy for any Participants.
6.11.4 The supplemental death benefit provided under this Article VI shall be taxable income when paid.
12
6.12 Tax Withholding. Distribution and withdrawal payments under this Article VI shall be subject to all applicable withholding requirements for state and federal income taxes and to any other federal, state or local taxes that may be applicable to such payments.
ARTICLE VII.
BENEFICIARIES
7.1 Designation of Beneficiary. The Participant shall have the right to designate on such form as may be prescribed by the Committee, one or more Beneficiaries to receive any Benefits due under the Plan which may remain unpaid on the date of the Participant’s death. The Participant shall have the right at any time to revoke such designation and to substitute one or more other Beneficiaries.
7.2 No Designated Beneficiary. If, upon the death of the Participant, there is no valid Beneficiary designation, the Beneficiary shall be the Participant’s surviving spouse. In the event there is no surviving spouse, then the Participant’s Beneficiary shall be the Participant’s estate.
ARTICLE VIII.
TRUST OBLIGATION TO PAY BENEFITS
8.1 Deferrals Transferred to the Trust. The Employer may transfer Salary Deferrals, Bonus Deferrals or Discretionary Company Contributions, if any, made by or on behalf of a Participant to the Trustee to be held pursuant to the terms of the Trust Agreement.
8.2 Source of Benefit Payments. All benefits payable to a Participant hereunder shall be paid by the Trustee to the extent of the assets held in the Trust by the Trustee, and by the Employer to the extent the assets in the Trust arc insufficient to pay a Participant’s Benefits as provided under this Plan.
8.3 Investment Discretion. The Benchmark Funds established pursuant to Section 5.3 shall be for the sole purpose of determining the Interest Rate to be used for determining the Interest credited to the Participant’s Account. Neither the Trustee nor the Committee shall have any obligation to invest the Participants’ Account in accordance with his deemed investment directions or in any other investment.
8.4 No Secured Interest. Except as otherwise provided by the Trust Agreement, the assets of the Trust, shall be subject to the claims of creditors of the Employer. Except as provided in the Trust Agreement, the Participant (or the Participant’s Beneficiary) shall be a general unsecured creditor of the Employer with respect to the payment of Benefits under this Plan.
13
ARTICLE IX.
PLAN ADMINISTRATION, AMENDMENT AND TERMINATION
9.1 Committee Powers and Responsibilities. The Committee shall have complete
control of the administration of the Plan herein set forth with all powers necessary to enable it properly to carry out its duties in that respect. Not in limitation, but in amplification of the foregoing, the Committee shall have the power and authority to:
9.1.1 Construe the Plan and Trust Agreement to determine all questions that shall arise as to interpretations of the Plan’s provisions including determination of which individuals are Eligible Employees and the determination of the amounts credited to a Participant’s Account, and the appropriate timing and method of Benefit payments;
9.1.2 Establish reasonable rules and procedures which shall be applied in a uniform and nondiscriminatory manner with respect to Elections and Benefit Distribution Elections, and all other discretionary provisions of the Plan;
9.1.3 Establish the rules and procedures by which the Plan will operate that are consistent with the terms of the Plan documents;
9.1.4 Establish the rules and procedures by which the Plan shall determine and pay installment distributions and planned benefit distributions;
9.1.5 Compile and maintain all records it determines to be necessary, appropriate or convenient in connection with the administration of the Plan;
9.1.6 Adopt amendments to the Plan document which are deemed necessary or desirable to facilitate administration of the Plan and/or to bring these documents into compliance with all applicable laws and regulations, provided that the Committee shall not have the authority to adopt any Plan amendment that will result in substantially increased costs to the Company unless such amendment is contingent upon ratification by the Board before becoming effective;
9.1.7 Employ such persons or organizations to render service or perform services with respect to the administrative responsibilities of the Committee under the Plan as the Committee determines to be necessary and appropriate, including but not limited to attorneys, accountants, and benefit, financial and administrative consultants;
9.1.8 Select, review and retain or change the Benchmark Funds which are used for determining the Interest Rate under the Plan;
9.1.9 Direct the investment of the assets of the Trust;
9.1.10 Review the performance of the Trustee with respect to the Trustee’s duties, responsibilities and obligations under the Plan and the Trust Agreement;
9.1.11 Take such other action as may be necessary or appropriate to the management and investment of the Plan assets.
9.2 Decisions of the Committee. Decisions of the Committee made in good faith upon any matter within the scope of its authority shall be final, conclusive and binding upon all persons, including Participants and their legal representatives or Beneficiaries. Any discretion granted to the Committee shall be exercised in accordance with rules and policies established by the Committee.
14
9.3 Plan Amendment. This Plan may be amended by the Company at any time in its sole discretion. Additionally, the Plan may be amended upon an action of the members of the Committee subject to the provisions in Section 9.1.1. However, no amendment may be made that alters the nature of an Election or Benefit Distribution Election or which would reduce the amount credited to a Participant’s Account on the date of such amendment.
9.4 Plan Termination. The Company reserves the right to terminate the Plan in its entirety by an action of the Board at any time upon fifteen (15) days notice to the Participants. Any amounts remaining in the Trust after all Benefits have been paid shall revert to the Company.
ARTICLE X.
MISCELLANEOUS
10.1 No Assignment. The right of any Participant, any Beneficiary or any other person to the payment of any benefits under this Plan shall not be assigned, transferred, pledged or encumbered.
10.2 No Secured Interest. The obligation of the Company to Participants under this Plan shall not be funded or otherwise secured, and shall be paid out of the general assets of the Company. Participants are general unsecured creditors of the Company with respect to the obligations hereunder and shall have no legal or equitable interest in the assets of the Company, including any assets as the Company may set aside or reserve against its obligations under this Plan.
10.3 Successors. This Plan shall be binding upon and inure to the benefit of the Employer, its successors and assigns and the Participant and his or her heirs, executors, administrators and legal representatives.
10.4 No Employment Agreement. Nothing contained herein shall be construed as conferring upon any Participant the right to continue in the employ of the Employer as an employee.
10.5 Attorneys’ Fees. If the Employer, the Participant, any Beneficiary, and/or a successor in interest to any of the foregoing, brings legal action to enforce any of the provisions of this Plan, the prevailing party in such legal action shall be reimbursed by the other party, the prevailing party’s costs of such legal action including, without limitation, reasonable fees of attorneys, accountants and similar advisors and expert witnesses.
10.6 Arbitration. Any dispute or claim relating to or arising out of this Plan shall be fully and finally resolved by binding arbitration conducted by the American Arbitration Association in Santa Clara County, California.
10.7 Governing Law. This Plan shall be construed in accordance with and governed by the Laws of the State of California to the extent not preempted by federal law.
15
10.8 Entire Agreement. This Plan constitutes the entire understanding and agreement with respect to the subject matter contained herein, and there are no agreements, understandings, restrictions, representations or warranties between or among any Participant and Employer other than those as set forth or provided for herein.
IN WITNESS WHEREOF, this Plan has been adopted by the Company effective as of the Effective Date.
| MARCUS & MILLICHAP, INC. | ||||||||
| Dated: Sept. 12, 2014 | By: |
|
||||||

16
Exhibit 31.2
Certification of Chief Financial Officer of Marcus & Millichap, Inc. pursuant to
Rule 13a-14(a) under the Exchange Act,
as adopted pursuant to Section 302 of the Sarbanes-Oxley Act of 2002
I, Martin E. Louie, certify that:
| 1. | I have reviewed this quarterly report on Form 10-Q of Marcus & Millichap, Inc.; |
| 2. | Based on my knowledge, this report does not contain any untrue statement of a material fact or omit to state a material fact necessary to make the statements made, in light of the circumstances under which such statements were made, not misleading with respect to the period covered by this report; |
| 3. | Based on my knowledge, the financial statements, and other financial information included in this report, fairly present in all material respects the financial condition, results of operations and cash flows of the registrant as of, and for, the periods presented in this report; |
| 4. | The registrant’s other certifying officer(s) and I are responsible for establishing and maintaining disclosure controls and procedures (as defined in Exchange Act Rules 13a-15(e) and 15d-15(e)) and internal control over financial reporting (as defined in Exchange Act Rules 13a-15(f) and 15d-15(f)) for the registrant and have: |
| a) | Designed such disclosure controls and procedures, or caused such disclosure controls and procedures to be designed under our supervision, to ensure that material information relating to the registrant, including its consolidated subsidiaries, is made known to us by others within those entities, particularly during the period in which this report is being prepared; |
| b) | Designed such internal control over financial reporting, or caused such internal control over financial reporting to be designed under our supervision, to provide reasonable assurance regarding the reliability of financial reporting and the preparation of financial statements for external purposes in accordance with generally accepted accounting principles; |
| c) | Evaluated the effectiveness of the registrant’s disclosure controls and procedures and presented in this report our conclusions about the effectiveness of the disclosure controls and procedures, as of the end of the period covered by this report based on such evaluation; and |
| d) | Disclosed in this report any change in the registrant’s internal control over financial reporting that occurred during the registrant’s most recent fiscal quarter (the registrant’s fourth fiscal quarter in the case of an annual report) that has materially affected, or is reasonably likely to materially affect, the registrant’s internal control over financial reporting; and |
| 5. | The registrant’s other certifying officer(s) and I have disclosed, based on our most recent evaluation of internal control over financial reporting, to the registrant’s auditors and the audit committee of the registrant’s board of directors (or persons performing the equivalent functions): |
| a) | All significant deficiencies and material weaknesses in the design or operation of internal control over financial reporting which are reasonably likely to adversely affect the registrant’s ability to record, process, summarize and report financial information; and |
| b) | Any fraud, whether or not material, that involves management or other employees who have a significant role in the registrant’s internal control over financial reporting. |
| Date: August 9, 2018 | /s/ Martin E. Louie | |||||
| Martin E. Louie | ||||||
| Chief Financial Officer |
Exhibit 32.1
Certifications of Chief Executive Officer and Chief Financial Officer of Marcus & Millichap, Inc. Pursuant to
Rule 13a-14(b) under the Exchange Act and 18 U.S.C. Section 1350, as Adopted Pursuant to
Section 906 of the Sarbanes-Oxley Act of 2002
In connection with the quarterly report of Marcus & Millichap, Inc. on Form 10-Q for the period ended June 30, 2018 as filed with the Securities and Exchange Commission on the date hereof (the “Report”), we, Hessam Nadji, President and Chief Executive Officer of the Company, and Martin E. Louie, Chief Financial Officer of the Company, certify, to the best of our knowledge, pursuant to Rule 13a-14(b) under the Securities Exchange Act of 1934 and 18 U.S.C. Section 1350, as adopted pursuant to Section 906 of the Sarbanes-Oxley Act of 2002, that:
| (1) | The Report fully complies with the requirements of Section 13(a) or 15(d) of the Securities Exchange Act of 1934; and |
| (2) | The information contained in the Report fairly presents, in all material respects, the financial condition and results of operations of the Company. |
| Date: | August 9, 2018 |
/s/ Hessam Nadji | ||||
| Hessam Nadji | ||||||
| President and Chief Executive Officer | ||||||
| (Principal Executive Officer) | ||||||
| Date: | August 9, 2018 |
/s/ Martin E. Louie | ||||
| Martin E. Louie | ||||||
| Chief Financial Officer | ||||||
| (Principal Financial Officer) | ||||||