Form 425 New PennyMac Financial Filed by: PENNYMAC FINANCIAL SERVICES, INC.
UNITED STATES
SECURITIES AND EXCHANGE COMMISSION
Washington, D.C. 20549
FORM 8-K
CURRENT REPORT
Pursuant to Section 13 or 15(d) of the Securities Exchange Act of 1934
Date of Report (Date of earliest event reported): July 30, 2018
PennyMac Financial Services, Inc.
(Exact name of registrant as specified in its charter)
|
Delaware |
|
001-35916 |
|
80-0882793 |
|
(State or other jurisdiction |
|
(Commission |
|
(IRS Employer |
|
of incorporation) |
|
File Number) |
|
Identification No.) |
|
3043 Townsgate Road, Westlake Village, California |
|
91361 |
|
(Address of principal executive offices) |
|
(Zip Code) |
(818) 224-7442
(Registrant’s telephone number, including area code)
Not Applicable
(Former name or former address, if changed since last report)
Check the appropriate box below if the Form 8-K filing is intended to simultaneously satisfy the filing obligation of the registrant under any of the following provisions:
x Written communications pursuant to Rule 425 under the Securities Act (17 CFR 230.425)
o Soliciting material pursuant to Rule 14a-12 under the Exchange Act (17 CFR 240.14a-12)
o Pre-commencement communications pursuant to Rule 14d-2(b) under the Exchange Act (17 CFR 240.14d-2(b))
o Pre-commencement communications pursuant to Rule 13e-4(c) under the Exchange Act (17 CFR 240.13e-4(c))
Indicate by check mark whether the registrant is an emerging growth company as defined in Rule 405 of the Securities Act of 1933 (§230.405 of this chapter) or Rule 12b-2 of the Securities Exchange Act of 1934 (§240.12b-2 of this chapter).
Emerging growth company o
If an emerging growth company, indicate by check mark if the registrant has elected not to use the extended transition period for complying with any new or revised financial accounting standards provided pursuant to Section 13(a) of the Exchange Act. o
Item 1.01 Entry into a Material Definitive Agreement.
Master Repurchase Agreement with Deutsche Bank AG, Cayman Islands Branch
On July 30, 2018, PennyMac Financial Services, Inc. (the “Company”), through its indirect controlled subsidiary, PennyMac Loan Services, LLC (“PLS”), executed a Temporary Increase Letter (the “DB Temporary Increase”) in connection with that certain Master Repurchase Agreement, dated as of August 21, 2017, by and among Deutsche Bank AG, Cayman Islands Branch (“Deutsche Bank”) and PLS (the “Repurchase Agreement”), pursuant to which PLS may sell to Deutsche Bank, and later repurchase, newly originated mortgage loans in an aggregate principal amount of up to $750 million. The Repurchase Agreement is set to expire on August 21, 2019, unless terminated earlier in accordance with its terms. The obligations of PLS under the Repurchase Agreement are fully guaranteed by Private National Mortgage Acceptance Company, LLC (“PNMAC”), which is the parent company of PLS and a controlled subsidiary of the Company.
Pursuant to the terms of the DB Temporary Increase, the maximum aggregate principal amount provided for thereunder was temporarily increased to $950 million. The period for the DB Temporary Increase commenced on July 30, 2018 and will expire on September 28, 2018. Upon the expiration of the DB Temporary Increase, the maximum aggregate principal amount will revert back to $750 million. All other terms and conditions of the Repurchase Agreement and the related guaranty remain the same in all material respects. The Company, through PLS, is required to pay Deutsche Bank certain administrative costs and expenses in connection with the structuring of the DB Temporary Increase.
The foregoing descriptions of the Repurchase Agreement and the related guaranty by PNMAC do not purport to be complete and are qualified in their entirety by reference to (i) the descriptions of the Repurchase Agreement and the related guaranty in the Company’s Current Report on Form 8-K as filed on August 24, 2017; (ii) the full text of the Repurchase Agreement and the related guaranty attached thereto as Exhibits 10.1 and 10.2, respectively; and (iii) any amendments to the Repurchase Agreement filed thereafter.
Mortgage Loan Participation Purchase and Sale Agreement with Bank of America, N.A.
On July 30, 2018, the Company, through PLS and PNMAC, executed a Temporary Increase Letter (the “BANA Temporary Increase”) in connection with that certain Mortgage Loan Participation Purchase and Sale Agreement, dated August 13, 2014, by and among Bank of America, N.A. (“BANA”), on the one hand, and PLS, as seller, and PNMAC, as guarantor, on the other hand (the “BANA Participation Agreement”), pursuant to which PLS may sell to BANA up to $550 million in participation certificates, each representing an undivided beneficial ownership interest in a pool of mortgage loans that have been pooled with Fannie Mae, Freddie Mac or Ginnie Mae and are pending securitization. In connection with its sale of any participation certificate, PLS also assigns to BANA a take-out commitment, which evidences PLS’ right to sell to a third-party investor the security backed by the mortgage loans underlying the related participation certificate. The BANA Participation Agreement is set to expire on July 1, 2019, unless terminated earlier in accordance with its terms. The obligations of PLS under the BANA Participation Agreement are fully guaranteed by PNMAC and the mortgage loans are serviced by PLS.
Pursuant to the terms of the BANA Temporary Increase, the aggregate transaction limit of purchase prices for participation certificates owned by BANA provided for thereunder was temporarily increased to $750 million. The period for the BANA Temporary Increase commenced on July 30, 2018 and will expire on September 15, 2018. Upon the expiration of the BANA Temporary Increase, the aggregate transaction limit of purchase prices will be revert back to $550 million. All other terms and conditions of the BANA Participation Agreement remain the same in all material respects. The Company, through PLS, is required to pay BANA certain administrative costs and expenses in connection with the structuring of the BANA Temporary Increase.
The foregoing descriptions of the BANA Participation Agreement and the related guaranty by PNMAC do not purport to be complete and are qualified in their entirety by reference to (i) the descriptions of the BANA Participation Agreement and the related guaranty in Item 5 of the Company’s Quarterly Report on Form 10-Q as filed on August 14, 2014; (ii) the full text of the BANA Participation Agreement and the related guaranty attached thereto as Exhibits 10.72 and 10.73, respectively; and (iii) the full text of any amendments to the BANA Participation Agreement filed thereafter with the SEC.
Item 2.02 Results of Operations and Financial Condition.
On August 2, 2018, the Company issued a press release announcing its financial results for the fiscal quarter ended June 30, 2018. A copy of the press release and the slide presentation used in connection with the Company’s recorded presentation of financial results were made available on August 2, 2018 and are furnished as Exhibit 99.1 and Exhibit 99.2, respectively.
The information in Item 2.02 of this Current Report on Form 8-K, including the exhibits hereto, shall not be deemed “filed” for purposes of Section 18 of the Securities Exchange Act of 1934, or otherwise subject to the liabilities of Section 18, nor shall it be deemed incorporated by reference into any disclosure document relating to the Company, except to the extent, if any, expressly set forth by specific reference in such filing.
Item 2.03 Creation of a Direct Financial Obligation or an Obligation under an Off-Balance Sheet Arrangement of a Registrant.
The information set forth under Item 1.01 of this Current Report on Form 8-K is incorporated herein by reference.
Item 8.01 Other Events.
On August 2, 2018, the Company’s board of directors declared a special, one-time cash dividend of $0.40 per share of the Company’s Class A common stock to holders of record of Class A common stock as of August 13, 2018 that is to be distributed on or about August 30, 2018.
Item 9.01 Financial Statements and Exhibits.
(d) Exhibits.
|
Exhibit No. |
|
Description |
|
|
|
|
|
99.1 |
|
|
|
99.2 |
|
Forward-Looking Statements
This Form 8-K contains forward-looking statements. The Company has identified some of these forward-looking statements with words such as “anticipates,” “believes,” “expects,” “estimates,” “is likely,” “predicts,” “projects,” “forecasts,” “objectives,” “may,” “will,” “should,” “plans” and “intends” and the negative of these words or other comparable terminology. These forward-looking statements include statements relating to status of a proposal to reorganize (the “Reorganization”) under a new holding company (“New PennyMac Financial Services, Inc.” or “New PennyMac”). In addition, the Company may from time to time make forward-looking statements in its annual report, quarterly reports and other filings with the SEC, news releases and other written and oral communications. These forward-looking statements are based on the Company’s expectations and assumptions, as of the date such statements are made, regarding its future operating performance and financial condition, including the Reorganization, the future financial and operating performance of each party to the Reorganization, strategic and competitive advantages of each such party, the leadership of each such party, and future opportunities for each such party, as well as the economy and other future events or circumstances. The Company’s expectations and assumptions include, without limitation, risks and uncertainties associated with the following: the possibility that the Reorganization will not be consummated within the anticipated time period or at all, including as the result of the failure to obtain stockholder approval of the Reorganization; the potential for disruption to the Company’s business in connection with the Reorganization; the potential that the Company does not realize all of the expected benefits of the proposed Reorganization. Various risks and uncertainties may cause actual results to differ materially from those stated, projected or implied by any forward looking statements, including, without limitation, risks and uncertainties affecting the Company that are described in its most recent Form 10-K (including in Item 1A. Risk Factors) filed with the SEC on March 9, 2018, which is available on the Company’s website at ir.pennymacfinancial.com/Docs or on the SEC’s website at www.sec.gov. The Company believes its expectations and assumptions are reasonable, but there can be no assurance that the expectations reflected herein will be achieved. Unless legally required, the Company undertakes no obligation to update any forward-looking statements made herein.
Non-solicitation
A Form S-4 relating to the shares of common stock of New PennyMac will be filed with the SEC but has not yet become effective. These securities may not be sold nor may offers to buy these securities be accepted before the time the Form S-4 becomes effective. This Form 8-K will not constitute an offer to sell or a solicitation of an offer to buy shares of common stock of New PennyMac, and will not constitute an offer, solicitation or sale in any jurisdiction in which such offer, solicitation or sale would be unlawful prior to registration or qualification under the securities laws of that jurisdiction.
Additional Information and Where to Find It
In connection with the Reorganization, New PennyMac will file the Form S-4 with the SEC, which has not yet become effective, that includes the Company’s proxy statement that also constitutes a prospectus of New PennyMac. INVESTORS AND SECURITY HOLDERS ARE URGED TO READ THE PROXY STATEMENT/PROSPECTUS, AND ANY OTHER RELEVANT DOCUMENTS WHEN THEY BECOME AVAILABLE, BECAUSE THEY CONTAIN, OR WILL CONTAIN, IMPORTANT INFORMATION ABOUT THE COMPANY, NEW PENNYMAC AND THE REORGANIZATION. A definitive proxy statement will be sent to the Company’s stockholders seeking approval of the Reorganization after the Form S-4 is declared effective. The proxy statement/prospectus and other documents relating to the Reorganization may be obtained free of charge from the SEC’s website at www.sec.gov.
Participants in Solicitation
This communication is not a solicitation of a proxy from any investor or stockholder. However, the Company, New PennyMac and certain of their directors and executive officers may be deemed to be participants in the solicitation of proxies in connection with the Reorganization under the rules of the SEC. Information regarding the Company’s directors and executive officers may be found in its definitive proxy statement relating to its 2018 Annual Meeting of Stockholders filed with the SEC on April 17, 2018 and in the proxy statement/prospectus included in the Form S-4. Information regarding New PennyMac’s directors and executive officers may be found in the proxy statement/prospectus included in the Form S-4. These documents may be obtained free of charge from the SEC’s website at www.sec.gov.
SIGNATURE
Pursuant to the requirements of the Securities Exchange Act of 1934, the registrant has duly caused this report to be signed on its behalf by the undersigned hereunto duly authorized.
|
|
PENNYMAC FINANCIAL SERVICES, INC. |
|
|
|
|
|
|
|
Dated: August 2, 2018 |
/s/ Andrew S. Chang |
|
|
Andrew S. Chang |
|
|
Senior Managing Director and Chief Financial Officer |
Filed by PennyMac Financial Services, Inc. (File No. 001-35916)
pursuant to Rule 425 under the Securities Act of 1933
and deemed filed pursuant to Rule 14a-12 of the Securities Exchange Act
Subject Company: New PennyMac Financial Services, Inc.
CIK: 0001745916

|
|
Media |
Investors |
|
|
Stephen Hagey |
Christopher Oltmann |
|
|
(805) 530-5817 |
(818) 264-4907 |
PennyMac Financial Services, Inc. Reports
Second Quarter 2018 Results and Declares Special, One-Time Dividend
Westlake Village, CA, August 2, 2018 — PennyMac Financial Services, Inc. (NYSE: PFSI) today reported net income of $68.4 million for the second quarter of 2018, on revenue of $244.3 million. Net income attributable to PFSI common stockholders was $17.8 million, or $0.70 per diluted share. Book value per share increased to $21.19, from $20.74 at March 31, 2018.
Additionally, the PFSI Board of Directors declared a special, one-time cash dividend of $0.40 per share of PFSI Class A common stock. The dividend represents cash that resulted from previous tax-related distributions from Private National Mortgage Acceptance Company, LLC (PNMAC) in excess of PFSI’s tax obligations. This dividend will be paid on August 30, 2018 to Class A common stockholders of record as of August 13, 2018. The Company anticipates that this distribution will be reported as a return of capital for tax purposes, based on the Company’s current expectations regarding its projected taxable earnings and profits for the year 2018.(1)
Also today, a registration statement is being filed by New PennyMac Financial Services, Inc.(2) for a corporate reorganization that, if completed, would simplify the Company’s corporate structure and convert all equity ownership in PFSI and PNMAC into a single class of publicly traded common stock.
(1) Holders of PFSI Class A common stock who are entitled to receive the dividend should consult with their individual tax advisors regarding the tax treatment of the dividend.
(2) Please refer to the Registration Statement on Form S-4 to be filed by New PennyMac Financial Services, Inc. (CIK# 0001745916) on August 2, 2018.
Second Quarter 2018 Highlights
· Pretax income was $74.7 million, up from $73.0 million in the prior quarter
· Second quarter results reflect continued strong Servicing segment results and a quarterly increase in earnings contribution from the Production segment driven by higher volume
· Production segment pretax income was $19.0 million, up 11 percent from the prior quarter and down 71 percent from the second quarter of 2017
· Total loan acquisitions and originations were $15.9 billion in unpaid principal balance (UPB), up 11 percent from the prior quarter and down 9 percent from the second quarter of 2017
· Correspondent government and direct lending interest rate lock commitments (IRLCs) totaled $11.9 billion in UPB, up 9 percent from the prior quarter and down 12 percent from the second quarter of 2017
· Servicing segment pretax income was $54.6 million, modestly down from $54.9 million in the prior quarter and up from a loss of $11.2 million from the second quarter of 2017
· Servicing segment pretax income excluding valuation-related changes was $35.8 million, down 1 percent from the prior quarter and up 134 percent from the second quarter of 2017(3)
· The servicing portfolio grew to $263.5 billion in UPB, up 3 percent from March 31, 2018, and 15 percent from June 30, 2018
· Investment Management segment pretax income was $1.1 million, up from $1.0 million in the prior quarter, and down from $2.5 million in the second quarter of 2017
· Net assets under management were $1.5 billion, essentially unchanged from March 31, 2018, and down 3 percent from June 30, 2017
· Repurchased approximately 236,000 shares of PFSI’s Class A common stock at a cost of $4.8 million and a weighted average cost of $20.41 per share
(3) Excludes changes in the fair value of MSRs, the ESS liability, and gains (losses) on hedging which were $42.3 million, $(1.0) million, and $(24.3) million, respectively, and a $1.8 million reversal of provision for credit losses on active loans in the second quarter of 2018.
Notable activity after quarter end
· Completed or entered into agreements to acquire bulk Ginnie Mae Mortgage Servicing Right (MSR) portfolios with UPB totaling approximately $13.9 billion
· Completed acquisitions from three sellers totaling $6.5 billion in UPB
· Also entered into agreements for acquisitions from another three sellers totaling $7.4 billion in UPB that are expected to close in the third quarter(4)
“We reported solid financial results for the second quarter in a mortgage origination market that is transitioning and remains competitive, with lenders managing capacity and production margins for the higher rate environment,” said President and CEO David Spector. “Our results reflect the strength of our balanced mortgage banking model with production volume and profits up from the prior quarter and the Servicing segment’s continued strong earnings contribution, which benefited from an increase in mortgage rates during the quarter. In the third quarter, we have deployed capital into bulk MSR acquisitions totaling $6.5 billion in UPB and entered into agreements to acquire three additional portfolios totaling $7.4 billion in UPB. We also continue to invest in growth initiatives, such as broker direct lending, non-delegated correspondent, non-portfolio consumer direct origination and jumbo mortgages, which have the potential to meaningfully contribute to our profitability as they gain traction.”
(4) These transactions are subject to continuing due diligence and customary closing conditions. There can be no assurance regarding the size of the transactions or that the transactions will be completed at all.
The following table presents the contribution of PennyMac Financial’s Production, Servicing and Investment Management segments to pretax income:
|
|
|
Quarter ended June 30, 2018 |
| |||||||||||||
|
|
|
Mortgage Banking |
|
Investment |
|
|
| |||||||||
|
|
|
Production |
|
Servicing |
|
Total |
|
Management |
|
Total |
| |||||
|
|
|
(in thousands) |
| |||||||||||||
|
Revenue |
|
|
|
|
|
|
|
|
|
|
| |||||
|
Net gains on mortgage loans held for sale at fair value |
|
$ |
33,966 |
|
$ |
26,980 |
|
$ |
60,946 |
|
$ |
— |
|
$ |
60,946 |
|
|
Loan origination fees |
|
24,428 |
|
— |
|
24,428 |
|
— |
|
24,428 |
| |||||
|
Fulfillment fees from PMT |
|
14,559 |
|
— |
|
14,559 |
|
— |
|
14,559 |
| |||||
|
Net servicing fees |
|
— |
|
113,689 |
|
113,689 |
|
— |
|
113,689 |
| |||||
|
Management fees |
|
— |
|
— |
|
— |
|
5,664 |
|
5,664 |
| |||||
|
Carried Interest from Investment Funds |
|
— |
|
— |
|
— |
|
(168 |
) |
(168 |
) | |||||
|
Net interest income (expense): |
|
— |
|
— |
|
|
|
|
|
|
| |||||
|
Interest income |
|
16,874 |
|
38,230 |
|
55,104 |
|
— |
|
55,104 |
| |||||
|
Interest expense |
|
1,025 |
|
31,576 |
|
32,601 |
|
15 |
|
32,616 |
| |||||
|
|
|
15,849 |
|
6,654 |
|
22,503 |
|
(15 |
) |
22,488 |
| |||||
|
Other |
|
536 |
|
728 |
|
1,264 |
|
1,428 |
|
2,692 |
| |||||
|
Total net revenue |
|
89,338 |
|
148,051 |
|
237,389 |
|
6,909 |
|
244,298 |
| |||||
|
Direct expenses |
|
49,484 |
|
68,160 |
|
117,644 |
|
799 |
|
118,443 |
| |||||
|
Shared services |
|
12,168 |
|
16,756 |
|
28,924 |
|
3,267 |
|
32,191 |
| |||||
|
Corporate Overhead |
|
8,668 |
|
8,567 |
|
17,235 |
|
1,731 |
|
18,966 |
| |||||
|
Expenses |
|
70,320 |
|
93,483 |
|
163,803 |
|
5,797 |
|
169,600 |
| |||||
|
Pretax income |
|
$ |
19,018 |
|
$ |
54,568 |
|
$ |
73,586 |
|
$ |
1,112 |
|
$ |
74,698 |
|
Production Segment
Production includes the correspondent acquisition of newly originated government-insured mortgage loans for PennyMac Financial’s own account, the underwriting and acquisition of loans from correspondent sellers on a non-delegated basis, fulfillment services on behalf of PennyMac Mortgage Investment Trust (NYSE: PMT) and direct lending through the consumer direct and broker direct channels.
PennyMac Financial’s loan production activity for the quarter totaled $15.9 billion in UPB, of which $10.5 billion in UPB was for its own account, and $5.4 billion in UPB was fee-based fulfillment activity for PMT. Correspondent government and direct lending IRLCs totaled $11.9 billion in UPB.
Production segment pretax income was $19.0 million, an increase of 11 percent from the prior quarter and a decrease of 71 percent from the second quarter of 2017. Production revenue totaled $89.3 million, an increase of 5 percent from the prior quarter and a decrease of 32 percent from the second quarter of 2017. The quarter-over-quarter change resulted from a $3.7 million increase in net interest income and a $2.6 million increase in fulfillment fees from PMT, partially offset by a $2.2 million decrease in net gains on mortgage loans held for sale. Net interest income in the second quarter includes $12.5 million in incentives which the Company is currently entitled to receive under one of its master repurchase agreements to finance mortgage loans that satisfy certain consumer relief characteristics, up from $10.2 million in the prior quarter.
The components of net gains on mortgage loans held for sale are detailed in the following table:
|
|
|
Quarter ended |
| |||||||
|
|
|
June 30, |
|
March 31, |
|
June 30, |
| |||
|
|
|
2018 |
|
2018 |
|
2017 |
| |||
|
|
|
(in thousands) |
| |||||||
|
Receipt of MSRs in loan sale transactions |
|
$ |
153,924 |
|
$ |
141,873 |
|
$ |
133,062 |
|
|
Mortgage servicing rights recapture payable to PennyMac Mortgage Investment Trust |
|
(936 |
) |
(1,425 |
) |
(1,506 |
) | |||
|
Provision for representations and warranties, net |
|
143 |
|
(379 |
) |
(276 |
) | |||
|
Cash investment (1) |
|
(106,946 |
) |
(63,594 |
) |
7,221 |
| |||
|
Fair value changes of pipeline, inventory and hedges |
|
14,761 |
|
(5,061 |
) |
(40,410 |
) | |||
|
Net gains on mortgage loans held for sale |
|
$ |
60,946 |
|
$ |
71,414 |
|
$ |
98,091 |
|
|
|
|
|
|
|
|
|
| |||
|
Net gains on mortgage loans held for sale by segment: |
|
|
|
|
|
|
| |||
|
Production |
|
$ |
33,966 |
|
$ |
36,198 |
|
$ |
74,706 |
|
|
Servicing |
|
$ |
26,980 |
|
$ |
35,216 |
|
$ |
23,385 |
|
(1) Net of cash hedge expense
PennyMac Financial performs fulfillment services for conventional conforming loans acquired by PMT in its correspondent production business. These services include, but are not limited to: marketing; relationship management; the approval of correspondent sellers and the ongoing monitoring of their performance; reviewing loan data, documentation and appraisals to assess loan quality and risk; pricing; hedging and activities related to the subsequent sale and securitization of loans in the secondary mortgage markets for PMT.
Fees earned from the fulfillment of correspondent loans on behalf of PMT totaled $14.6 million in the second quarter, up 22 percent from the prior quarter and down 31 percent from the second quarter of 2017. The quarter-over-quarter increase in fulfillment fee revenue was driven by higher acquisition volumes by PMT. For the second quarter, the weighted average fulfillment fee rate was 27 basis points, down from 28 basis points in the prior quarter.
Production segment expenses were $70.3 million, a 3 percent increase from the prior quarter and a 10 percent increase from the second quarter of 2017. The quarter-over-quarter increase was primarily driven by higher production volumes.
Servicing Segment
Servicing includes income from owned MSRs, subservicing and special servicing activities. Servicing segment pretax income was $54.6 million compared with $54.9 million in the prior quarter and an $11.2 million loss in the second quarter of 2017. Servicing segment revenues totaled $148.1 million, an increase of 1 percent from the prior quarter and 128 percent from the second quarter of 2017. The quarter-over-quarter increase reflects a larger servicing portfolio and higher interest income from custodial deposits, partially offset by increased realization of MSR cash flows and a decrease in revenue related to the reperformance of government-insured and guaranteed loans bought out of Ginnie Mae pools in prior periods.
Net loan servicing fees totaled $113.7 million and included $161.9 million in servicing fees reduced by $65.2 million in realization of MSR cash flows. Valuation-related gains totaled $17.0 million, which includes MSR fair value gains of $42.3 million, associated hedging losses of $24.3 million and changes in fair value of the excess servicing spread (ESS) liability resulting in a $1.0 million loss. The MSR fair value gains primarily resulted from expectations for lower prepayment activity in the future due to higher mortgage rates.
The following table presents a breakdown of net loan servicing fees:
|
|
|
Quarter ended |
| |||||||
|
|
|
June 30, |
|
March 31, |
|
June 30, |
| |||
|
|
|
2018 |
|
2018 |
|
2017 |
| |||
|
|
|
(in thousands) |
| |||||||
|
Servicing fees (1) |
|
$ |
161,942 |
|
$ |
160,673 |
|
$ |
134,192 |
|
|
Effect of MSRs: |
|
|
|
|
|
|
| |||
|
Amortization and realization of cash flows |
|
(65,227 |
) |
(61,176 |
) |
(55,482 |
) | |||
|
Change in fair value and provision for/reversal of impairment of MSRs carried at lower of amortized cost or fair value |
|
42,259 |
|
127,806 |
|
(36,927 |
) | |||
|
Change in fair value of excess servicing spread financing |
|
(996 |
) |
(6,921 |
) |
7,156 |
| |||
|
Hedging losses |
|
(24,289 |
) |
(103,593 |
) |
(2,026 |
) | |||
|
Total amortization, impairment and change in fair value of MSRs |
|
(48,253 |
) |
(43,884 |
) |
(87,279 |
) | |||
|
Net loan servicing fees |
|
$ |
113,689 |
|
$ |
116,789 |
|
$ |
46,913 |
|
(1) Includes contractually-specified servicing fees
Servicing segment revenue also included $27.0 million in net gains on mortgage loans held for sale from the securitization of reperforming government-insured and guaranteed loans, compared with $35.2 million in the prior quarter and $23.4 million in the second quarter of 2017. These loans were previously purchased out of Ginnie Mae securitizations as early buyout (EBO) loans and brought back to performing status through PennyMac Financial’s successful servicing efforts, primarily with the use of loan modifications. Net interest income totaled $6.7 million, up from net interest expense of $6.3 million in the prior quarter and $5.8 million in the second quarter of 2017. Interest income increased by $9.9 million from the prior quarter, driven by income from custodial deposits and capitalized interest resulting from an increase in modification of EBO loans during the quarter. Interest expense decreased by $3.1 million from the first quarter; interest expense was elevated in the first quarter due to the accelerated recognition of costs related to the refinancing of MSR-backed term notes.
Servicing segment expenses totaled $93.5 million, a 2 percent increase from the prior quarter and a 23 percent increase from the second quarter of 2017. The quarter-over-quarter increase was driven by servicing portfolio growth and an increase in EBO-related expenses resulting from higher volume of buyouts from Ginnie Mae securitizations.
The total servicing portfolio reached $263.5 billion in UPB at June 30, 2018, an increase of 3 percent from the prior quarter end and 15 percent from a year earlier. Servicing portfolio growth during the quarter was driven by the Company’s loan production activities. Of the total servicing portfolio, prime servicing was $262.6 billion in UPB and special servicing was $0.9 billion in UPB. PennyMac Financial subservices and conducts special servicing for $81.2 billion in UPB, an increase of 5 percent from March 31, 2018 and 21 percent from a year earlier. PennyMac Financial’s owned MSR portfolio grew to $178.3 billion in UPB, an increase of 3 percent from the prior quarter end.
The table below details PennyMac Financial’s servicing portfolio UPB:
|
|
|
June 30, |
|
March 31, |
|
June 30, |
| |||
|
|
|
2018 |
|
2018 |
|
2017 |
| |||
|
|
|
(in thousands) |
| |||||||
|
Loans serviced at period end: |
|
|
|
|
|
|
| |||
|
Prime servicing: |
|
|
|
|
|
|
| |||
|
Owned |
|
|
|
|
|
|
| |||
|
Mortgage servicing rights |
|
|
|
|
|
|
| |||
|
Originated |
|
$ |
132,307,067 |
|
$ |
125,643,312 |
|
$ |
105,296,264 |
|
|
Acquisitions |
|
45,957,173 |
|
47,843,853 |
|
51,927,645 |
| |||
|
|
|
178,264,240 |
|
173,487,165 |
|
157,223,909 |
| |||
|
Mortgage servicing liabilities |
|
1,569,602 |
|
1,766,722 |
|
1,698,588 |
| |||
|
Mortgage loans held for sale |
|
2,448,908 |
|
2,512,546 |
|
2,915,346 |
| |||
|
|
|
182,282,750 |
|
177,766,433 |
|
161,837,843 |
| |||
|
Subserviced for Advised Entities |
|
80,359,635 |
|
76,636,300 |
|
64,924,592 |
| |||
|
Total prime servicing |
|
262,642,385 |
|
254,402,733 |
|
226,762,435 |
| |||
|
Special servicing: |
|
|
|
|
|
|
| |||
|
Subserviced for Advised Entities |
|
854,994 |
|
903,138 |
|
2,201,340 |
| |||
|
Total special servicing |
|
854,994 |
|
903,138 |
|
2,201,340 |
| |||
|
Total loans serviced |
|
$ |
263,497,379 |
|
$ |
255,305,871 |
|
$ |
228,963,775 |
|
|
|
|
|
|
|
|
|
| |||
|
Mortgage loans serviced: |
|
|
|
|
|
|
| |||
|
Owned |
|
|
|
|
|
|
| |||
|
Mortgage servicing rights |
|
$ |
178,264,240 |
|
$ |
173,487,165 |
|
$ |
157,223,909 |
|
|
Mortgage servicing liabilities |
|
1,569,602 |
|
1,766,722 |
|
1,698,588 |
| |||
|
Mortgage loans held for sale |
|
2,448,908 |
|
2,512,546 |
|
2,915,346 |
| |||
|
|
|
182,282,750 |
|
177,766,433 |
|
161,837,843 |
| |||
|
Subserviced |
|
81,214,629 |
|
77,539,438 |
|
67,125,932 |
| |||
|
Total mortgage loans serviced |
|
$ |
263,497,379 |
|
$ |
255,305,871 |
|
$ |
228,963,775 |
|
Investment Management Segment
PennyMac Financial manages PMT for which it earns base management fees and may earn incentive compensation. PennyMac Financial has also managed two private Investment Funds that sold or liquidated all of their remaining assets in 2017 and the six months ended June 30, 2018. Net assets under management were $1.5 billion as of June 30, 2018, essentially unchanged from March 31, 2018, and down 3 percent from June 30, 2017.
Pretax income for the Investment Management segment was $1.1 million, compared with $1.0 million in the prior quarter and $2.5 million in the second quarter of 2017. Management fees, which include base management fees from PMT and the private Investment Funds, decreased 2 percent from the prior quarter and 6 percent from the second quarter of 2017. No incentive fee was paid by PMT during the quarter as in the prior quarter; incentive fees of $0.3 million were paid for the second quarter of 2017.
The following table presents a breakdown of management fees and carried interest:
|
|
|
Quarter ended |
| |||||||
|
|
|
June 30, |
|
March 31, |
|
June 30, |
| |||
|
|
|
(in thousands) |
| |||||||
|
Management fees: |
|
|
|
|
|
|
| |||
|
PennyMac Mortgage Investment Trust |
|
|
|
|
|
|
| |||
|
Base |
|
$ |
5,728 |
|
$ |
5,696 |
|
$ |
5,334 |
|
|
Performance incentive |
|
— |
|
— |
|
304 |
| |||
|
|
|
5,728 |
|
5,696 |
|
5,638 |
| |||
|
Investment Funds |
|
(64 |
) |
79 |
|
369 |
| |||
|
Total management fees |
|
5,664 |
|
5,775 |
|
6,007 |
| |||
|
Carried Interest |
|
(168 |
) |
(180 |
) |
241 |
| |||
|
Total management fees and Carried Interest |
|
$ |
5,496 |
|
$ |
5,595 |
|
$ |
6,248 |
|
|
|
|
|
|
|
|
|
| |||
|
Net assets of Advised Entities: |
|
|
|
|
|
|
| |||
|
PennyMac Mortgage Investment Trust |
|
$ |
1,545,487 |
|
$ |
1,542,258 |
|
$ |
1,454,832 |
|
|
Investment Funds |
|
765 |
|
2,668 |
|
144,744 |
| |||
|
|
|
$ |
1,546,252 |
|
$ |
1,544,926 |
|
$ |
1,599,576 |
|
Investment Management segment expenses totaled $5.8 million, down 2 percent from the prior quarter and up 50 percent from the second quarter of 2017.
The increase from the prior year was primarily due to a change in accounting for expenses reimbursed by PMT under the Company’s management agreement with PMT. Beginning January 1, 2018, PennyMac Financial is required to include such expense reimbursements in its net revenue and the expenses reimbursed in its expenses. Previously, PennyMac Financial accounted for such reimbursements as reductions to its expenses.
Consolidated Expenses
Total expenses for the second quarter were $169.6 million, a 3 percent increase from the prior quarter and an 18 percent increase from the second quarter of 2017. The quarter-over-quarter change was driven by higher expenses in both the Servicing and Production segments due to higher volumes of activity.
***
Executive Chairman Stanford L. Kurland concluded, “We continue to invest and pursue the buildout of our business model into new market segments, products and channels. We believe we are well-positioned to expand our growth and earnings opportunities with the investments we are making in our Production and Servicing businesses. In consumer direct lending, we are seeing success in non-portfolio and purchase-money originations, both of which are important to growing volumes. Further, our investments in the broker direct channel are beginning to deliver results and demonstrate our ability to access this previously untapped market segment. We are making technology investments across our business, such as in loan servicing where system enhancements will allow us to capture greater scale efficiencies. We also remain mindful of prudent expense management and are monitoring the deployment of our human resources and capital to ensure we continue to operate at high levels of efficiency and continue delivering attractive returns to stockholders.”
Management’s slide presentation will be available in the Investor Relations section of the Company’s website at www.ir.pennymacfinancial.com beginning at 1:10 p.m. (Pacific Daylight Time) on Thursday, August 2, 2018.
About PennyMac Financial Services, Inc.
PennyMac Financial Services, Inc. is a specialty financial services firm with a comprehensive mortgage platform and integrated business focused on the production and servicing of U.S. mortgage loans and the management of investments related to the U.S. mortgage market. PennyMac Financial Services, Inc. trades on the New York Stock Exchange under the symbol “PFSI.” Additional information about PennyMac Financial Services, Inc. is available at www.ir.pennymacfinancial.com.
This press release contains forward-looking statements within the meaning of Section 21E of the Securities Exchange Act of 1934, as amended, regarding management’s beliefs, estimates, projections and assumptions with respect to, among other things, the Company’s financial results, future operations, business plans and investment strategies, as well as industry and market conditions, all of which are subject to change. Words like “believe,” “expect,” “anticipate,” “promise,” “plan,” and other expressions or words of similar meanings, as well as future or conditional verbs such as “will,” “would,” “should,” “could,” or “may” are generally intended to identify forward-looking statements. Actual results and operations for any future period may vary materially from those projected herein and from past results discussed herein. Factors which could cause actual results to differ materially from historical results or those anticipated include, but are not limited to: the continually changing federal, state and local laws and regulations applicable to the highly regulated industry in which we operate; lawsuits or governmental actions that may result from any noncompliance with the laws and regulations applicable to our businesses; the mortgage lending and servicing-related regulations promulgated by the Consumer Financial Protection Bureau and its enforcement of these regulations; our dependence on U.S. government-sponsored entities and changes in their current roles or their guarantees or guidelines; changes to government mortgage modification programs; the licensing and operational requirements of states and other jurisdictions applicable to the Company’s businesses, to which our bank competitors are not subject; foreclosure delays and changes in foreclosure practices; certain banking regulations that may limit our business activities; our dependence on the multifamily and commercial real estate sectors for future originations of commercial mortgage loans and other commercial real estate related loans; changes in macroeconomic and U.S. real estate market conditions; difficulties inherent in growing loan production volume; difficulties inherent in adjusting the size of our operations to reflect changes in business levels; purchase opportunities for mortgage servicing rights and our success in winning bids; changes in prevailing interest rates; increases in loan delinquencies and defaults; our reliance on PennyMac Mortgage Investment Trust (NYSE: PMT) as a significant source of financing for, and revenue related to, our mortgage banking business; any required additional capital and liquidity to support business growth that may not be available on acceptable terms, if at all; our obligation to indemnify third-party purchasers or repurchase loans if loans that we originate, acquire, service or assist in the fulfillment of, fail to meet certain criteria or characteristics or under other circumstances; our obligation to indemnify PMT and the Investment Funds if its services fail to meet certain criteria or characteristics or under other circumstances; decreases in the returns on the assets that we select and manage for our clients, and our resulting management and incentive fees; the extensive amount of regulation applicable to our investment management segment; conflicts of interest in allocating our services and investment opportunities among us and our advised entities; the effect of public opinion on our reputation; our recent growth; our ability to effectively identify, manage, monitor and mitigate financial risks; our initiation of new business activities or investment strategies or expansion of existing business activities or investment strategies; our ability to detect misconduct and fraud; our ability to mitigate cybersecurity risks and cyber incidents; our exposure
to risks of loss with real estate investments resulting from adverse weather conditions and man-made or natural disasters; and our organizational structure and certain requirements in our charter documents. You should not place undue reliance on any forward- looking statement and should consider all of the uncertainties and risks described above, as well as those more fully discussed in reports and other documents filed by the Company with the Securities and Exchange Commission from time to time. The Company undertakes no obligation to publicly update or revise any forward-looking statements or any other information contained herein, and the statements made in this press release are current as of the date of this release only.
Non-solicitation
In connection with a proposed reorganization of the Company, the Company’s wholly-owned subsidiary, New PennyMac Financial Services, Inc., will be filing a registration statement on Form S-4 with the SEC, but this registration statement has not yet become effective. The securities registered under this registration statement may not be sold nor may offers to buy these securities be accepted before the time the registration statement becomes effective. This press release shall not constitute an offer to sell or a solicitation of an offer to buy these securities, and shall not constitute an offer, solicitation or sale in any jurisdiction in which such offer, solicitation or sale would be unlawful prior to registration or qualification under the securities laws of that jurisdiction.
Additional Information and Where to Find It
In connection with the proposed reorganization, New PennyMac Financial Services, Inc. (CIK# 0001745916) will be filing a registration statement on Form S-4 (the “New PennyMac Registration Statement”) that includes a proxy statement of the Company that also constitutes a prospectus of New PennyMac Financial Services, Inc. (which New PennyMac Registration Statement has not yet been declared effective). INVESTORS AND SECURITY HOLDERS ARE URGED TO READ THE PROXY STATEMENT/PROSPECTUS, AND ANY OTHER RELEVANT DOCUMENTS WHEN THEY BECOME AVAILABLE, BECAUSE THEY CONTAIN, OR WILL CONTAIN, IMPORTANT INFORMATION ABOUT THE COMPANY, NEW PENNYMAC FINANCIAL SERVICES, INC. AND THE REORGANIZATION. A definitive proxy statement will be sent to stockholders of the Company seeking approval of the reorganization after the New PennyMac Registration Statement is declared effective. The proxy statement/prospectus and other documents relating to the reorganization can be obtained free of charge from the SEC website at www.sec.gov.
Participants in Solicitation
This communication is not a solicitation of a proxy from any investor or stockholder. However, the Company, New PennyMac Financial Services, Inc. and certain of their directors and executive officers may be deemed to be participants in the solicitation of proxies in connection with the proposed reorganization under the rules of the SEC. Information regarding the Company’s directors and executive officers may be found in its definitive proxy statement relating to its 2018 Annual Meeting of Stockholders filed with the SEC on April 17, 2018 and in the proxy statement/prospectus included in the New PennyMac Registration Statement. Information regarding New PennyMac Financial Services, Inc.’s directors and executive officers may be found in the proxy statement/prospectus included in the New PennyMac Registration Statement. These documents can be obtained free of charge from the SEC.
PENNYMAC FINANCIAL SERVICES, INC.
CONSOLIDATED BALANCE SHEETS (UNAUDITED)
|
|
|
June 30, |
|
March 31, |
|
June 30, |
| |||
|
|
|
2018 |
|
2018 |
|
2017 |
| |||
|
|
|
(in thousands, except share amounts) |
| |||||||
|
ASSETS |
|
|
|
|
|
|
| |||
|
Cash |
|
$ |
189,663 |
|
$ |
137,863 |
|
$ |
75,978 |
|
|
Short-term investments at fair value |
|
98,571 |
|
105,890 |
|
145,440 |
| |||
|
Mortgage loans held for sale at fair value |
|
2,527,231 |
|
2,584,236 |
|
3,037,602 |
| |||
|
Derivative assets |
|
92,471 |
|
89,469 |
|
70,075 |
| |||
|
Servicing advances, net |
|
258,900 |
|
284,145 |
|
291,907 |
| |||
|
Carried Interest due from Investment Funds |
|
370 |
|
538 |
|
71,019 |
| |||
|
Investment in PennyMac Mortgage Investment Trust at fair value |
|
1,424 |
|
1,352 |
|
1,372 |
| |||
|
Mortgage servicing rights |
|
2,486,157 |
|
2,354,489 |
|
1,951,599 |
| |||
|
Real estate acquired in settlement of loans |
|
2,300 |
|
2,338 |
|
822 |
| |||
|
Furniture, fixtures, equipment and building improvements, net |
|
29,607 |
|
30,172 |
|
31,418 |
| |||
|
Capitalized software, net |
|
31,913 |
|
28,919 |
|
18,197 |
| |||
|
Assets purchased from PennyMac Mortgage Investment Trust under agreements to resell pledged to creditors |
|
138,582 |
|
142,938 |
|
150,000 |
| |||
|
Receivable from Investment Funds |
|
12 |
|
460 |
|
1,330 |
| |||
|
Receivable from PennyMac Mortgage Investment Trust |
|
19,661 |
|
27,356 |
|
17,725 |
| |||
|
Loans eligible for repurchase |
|
879,621 |
|
1,018,488 |
|
462,487 |
| |||
|
Other |
|
85,223 |
|
94,238 |
|
77,767 |
| |||
|
Total assets |
|
$ |
6,841,706 |
|
$ |
6,902,891 |
|
$ |
6,404,738 |
|
|
|
|
|
|
|
|
|
| |||
|
LIABILITIES |
|
|
|
|
|
|
| |||
|
Assets sold under agreements to repurchase |
|
$ |
1,825,813 |
|
$ |
1,814,282 |
|
$ |
3,021,328 |
|
|
Mortgage loan participation and sale agreements |
|
528,368 |
|
510,443 |
|
243,361 |
| |||
|
Notes payable |
|
1,140,546 |
|
1,140,022 |
|
429,692 |
| |||
|
Obligations under capital lease |
|
13,032 |
|
16,435 |
|
26,641 |
| |||
|
Excess servicing spread financing payable to PennyMac Mortgage Investment Trust at fair value |
|
229,470 |
|
236,002 |
|
261,796 |
| |||
|
Derivative liabilities |
|
4,094 |
|
4,476 |
|
16,564 |
| |||
|
Mortgage servicing liabilities at fair value |
|
10,253 |
|
12,063 |
|
18,295 |
| |||
|
Accounts payable and accrued expenses |
|
114,005 |
|
113,046 |
|
132,053 |
| |||
|
Payable to Investment Funds |
|
404 |
|
26 |
|
15,236 |
| |||
|
Payable to PennyMac Mortgage Investment Trust |
|
99,309 |
|
117,987 |
|
132,709 |
| |||
|
Payable to exchanged Private National Mortgage Acceptance Company, LLC unitholders under tax receivable agreement |
|
46,903 |
|
46,037 |
|
73,084 |
| |||
|
Income taxes payable |
|
67,357 |
|
58,956 |
|
40,672 |
| |||
|
Liability for loans eligible for repurchase |
|
879,621 |
|
1,018,488 |
|
462,487 |
| |||
|
Liability for losses under representations and warranties |
|
20,587 |
|
20,429 |
|
19,568 |
| |||
|
Total liabilities |
|
4,979,762 |
|
5,108,692 |
|
4,893,486 |
| |||
|
|
|
|
|
|
|
|
| |||
|
STOCKHOLDERS’ EQUITY |
|
|
|
|
|
|
| |||
|
Class A common stock—authorized 200,000,000 shares of $0.0001 par value; issued and outstanding, 25,008,655, 24,277,768 and 23,472,795 shares, respectively |
|
3 |
|
2 |
|
2 |
| |||
|
Class B common stock—authorized 1,000 shares of $0.0001 par value; issued and outstanding, 45, 45 and 50 shares, respectively |
|
— |
|
— |
|
— |
| |||
|
Additional paid-in capital |
|
229,941 |
|
221,495 |
|
199,146 |
| |||
|
Retained earnings |
|
299,951 |
|
282,114 |
|
185,907 |
| |||
|
Total stockholders’ equity attributable to PennyMac Financial Services, Inc. common stockholders |
|
529,895 |
|
503,611 |
|
385,055 |
| |||
|
Noncontrolling interests in Private National Mortgage Acceptance Company, LLC |
|
1,332,049 |
|
1,290,588 |
|
1,126,197 |
| |||
|
Total stockholders’ equity |
|
1,861,944 |
|
1,794,199 |
|
1,511,252 |
| |||
|
Total liabilities and stockholders’ equity |
|
$ |
6,841,706 |
|
$ |
6,902,891 |
|
$ |
6,404,738 |
|
PENNYMAC FINANCIAL SERVICES, INC.
CONSOLIDATED STATEMENTS OF INCOME (UNAUDITED)
|
|
|
Quarter ended |
| |||||||
|
|
|
June 30, |
|
March 31, |
|
June 30, |
| |||
|
|
|
2018 |
|
2018 |
|
2017 |
| |||
|
|
|
(in thousands, except earnings per share) |
| |||||||
|
Revenue |
|
|
|
|
|
|
| |||
|
Net gains on mortgage loans held for sale at fair value |
|
$ |
60,946 |
|
$ |
71,414 |
|
$ |
98,091 |
|
|
Mortgage loan origination fees |
|
24,428 |
|
24,563 |
|
30,193 |
| |||
|
Fulfillment fees from PennyMac Mortgage Investment Trust |
|
14,559 |
|
11,944 |
|
21,107 |
| |||
|
Net mortgage loan servicing fees: |
|
|
|
|
|
|
| |||
|
Mortgage loan servicing fees |
|
|
|
|
|
|
| |||
|
From non-affiliates |
|
138,871 |
|
135,483 |
|
112,348 |
| |||
|
From PennyMac Mortgage Investment Trust |
|
9,431 |
|
11,019 |
|
10,099 |
| |||
|
From Investment Funds |
|
3 |
|
— |
|
543 |
| |||
|
Ancillary and other fees |
|
13,637 |
|
14,171 |
|
11,202 |
| |||
|
|
|
161,942 |
|
160,673 |
|
134,192 |
| |||
|
Amortization, impairment and change in estimated fair value of mortgage servicing rights and excess servicing spread |
|
(48,253 |
) |
(43,884 |
) |
(87,279 |
) | |||
|
Net mortgage loan servicing fees |
|
113,689 |
|
116,789 |
|
46,913 |
| |||
|
Management fees: |
|
|
|
|
|
|
| |||
|
From PennyMac Mortgage Investment Trust |
|
5,728 |
|
5,696 |
|
5,638 |
| |||
|
From Investment Funds |
|
(64 |
) |
79 |
|
369 |
| |||
|
|
|
5,664 |
|
5,775 |
|
6,007 |
| |||
|
Carried Interest from Investment Funds |
|
(168 |
) |
(180 |
) |
241 |
| |||
|
Net interest income (expense): |
|
|
|
|
|
|
| |||
|
Interest income |
|
55,104 |
|
42,615 |
|
34,973 |
| |||
|
Interest expense |
|
32,616 |
|
36,745 |
|
36,877 |
| |||
|
|
|
22,488 |
|
5,870 |
|
(1,904 |
) | |||
|
Change in fair value of investment in and dividends received from PennyMac Mortgage Investment Trust |
|
108 |
|
182 |
|
76 |
| |||
|
Results of real estate acquired in settlement of loans |
|
13 |
|
(28 |
) |
(119 |
) | |||
|
Other |
|
2,571 |
|
1,872 |
|
1,116 |
| |||
|
Total net revenue |
|
244,298 |
|
238,201 |
|
201,721 |
| |||
|
Expenses |
|
|
|
|
|
|
| |||
|
Compensation |
|
98,540 |
|
102,013 |
|
82,967 |
| |||
|
Servicing |
|
28,490 |
|
26,299 |
|
24,702 |
| |||
|
Technology |
|
15,154 |
|
14,620 |
|
11,581 |
| |||
|
Occupancy and equipment |
|
6,507 |
|
6,377 |
|
5,965 |
| |||
|
Professional services |
|
5,587 |
|
5,738 |
|
4,523 |
| |||
|
Loan origination |
|
5,144 |
|
2,115 |
|
5,116 |
| |||
|
Marketing |
|
2,218 |
|
2,161 |
|
2,483 |
| |||
|
Other |
|
7,960 |
|
5,882 |
|
6,424 |
| |||
|
Total expenses |
|
169,600 |
|
165,205 |
|
143,761 |
| |||
|
Income before provision for income taxes |
|
74,698 |
|
72,996 |
|
57,960 |
| |||
|
Provision for (benefit from) income taxes |
|
6,293 |
|
6,070 |
|
7,214 |
| |||
|
Net income |
|
68,405 |
|
66,926 |
|
50,746 |
| |||
|
Less: Net income attributable to noncontrolling interest |
|
50,568 |
|
50,307 |
|
40,267 |
| |||
|
Net income attributable to PennyMac Financial Services, Inc. common stockholders |
|
$ |
17,837 |
|
$ |
16,619 |
|
$ |
10,479 |
|
|
|
|
|
|
|
|
|
| |||
|
Earnings per share |
|
|
|
|
|
|
| |||
|
Basic |
|
$ |
0.71 |
|
$ |
0.70 |
|
$ |
0.45 |
|
|
Diluted |
|
$ |
0.70 |
|
$ |
0.67 |
|
$ |
0.44 |
|
|
Weighted-average common shares outstanding |
|
|
|
|
|
|
| |||
|
Basic |
|
24,959 |
|
23,832 |
|
23,388 |
| |||
|
Diluted |
|
78,825 |
|
79,461 |
|
77,650 |
| |||
Filed by PennyMac Financial Services, Inc. (File No. 001-35916)
pursuant to Rule 425 under the Securities Act of 1933
and deemed filed pursuant to Rule 14a-12 of the Securities Exchange Act
Subject Company: New PennyMac Financial Services, Inc.
CIK: 0001745916
Second Quarter 2018 Earnings Report
Forward-Looking Statements 2 This presentation contains forward-looking statements within the meaning of Section 21E of the Securities Exchange Act of 1934, as amended, regarding management’s beliefs, estimates, projections and assumptions with respect to, among other things, the Company’s financial results, future operations, business plans and investment strategies, as well as industry and market conditions, all of which are subject to change. Words like “believe,” “expect,” “anticipate,” “promise,” “plan,” and other expressions or words of similar meanings, as well as future or conditional verbs such as “will,” “would,” “should,” “could,” or “may” are generally intended to identify forward-looking statements. Actual results and operations for any future period may vary materially from those projected herein and from past results discussed herein. These forward-looking statements include statements regarding the Company’s proposed corporate reorganization, the expected benefits of such reorganization and the related impact on existing stakeholders, estimates regarding future market capitalization and the anticipated financial impact of the corporate reorganization. Factors which could cause actual results to differ materially from historical results or those anticipated include, but are not limited to: the continually changing federal, state and local laws and regulations applicable to the highly regulated industry in which we operate; lawsuits or governmental actions that may result from any noncompliance with the laws and regulations applicable to our businesses; the mortgage lending and servicing-related regulations promulgated by the Consumer Financial Protection Bureau and its enforcement of these regulations; our dependence on U.S. government-sponsored entities and changes in their current roles or their guarantees or guidelines; changes to government mortgage modification programs; the licensing and operational requirements of states and other jurisdictions applicable to the Company’s businesses, to which our bank competitors are not subject; foreclosure delays and changes in foreclosure practices; certain banking regulations that may limit our business activities; changes in macroeconomic and U.S. real estate market conditions; difficulties inherent in growing loan production volume; difficulties inherent in adjusting the size of our operations to reflect changes in business levels; purchase opportunities for mortgage servicing rights and our success in winning bids; changes in prevailing interest rates; increases in loan delinquencies and defaults; our reliance on PennyMac Mortgage Investment Trust (NYSE: PMT) as a significant source of financing for, and revenue related to, our mortgage banking business; any required additional capital and liquidity to support business growth that may not be available on acceptable terms, if at all; our obligation to indemnify third-party purchasers or repurchase loans if loans that we originate, acquire, service or assist in the fulfillment of, fail to meet certain criteria or characteristics or under other circumstances; our obligation to indemnify PMT and the Investment Funds if our services fail to meet certain criteria or characteristics or under other circumstances; decreases in the returns on the assets that we select and manage for our clients, and our resulting management and incentive fees; the extensive amount of regulation applicable to our investment management segment; conflicts of interest in allocating our services and investment opportunities among us and our advised entities; the effect of public opinion on our reputation; our recent growth; our ability to effectively identify, manage, monitor and mitigate financial risks; our initiation of new business activities or expansion of existing business activities; our ability to detect misconduct and fraud; and our ability to mitigate cybersecurity risks and cyber incidents. Our exposure to risks of loss resulting from adverse weather conditions and man-made or natural disasters; and or organizational structure and certain requirements in our charter documents. You should not place undue reliance on any forward-looking statement and should consider all of the uncertainties and risks described above, as well as those more fully discussed in reports and other documents filed by the Company with the Securities and Exchange Commission from time to time. The Company undertakes no obligation to publicly update or revise any forward-looking statements or any other information contained herein, and the statements made in this presentation are current as of the date of this presentation only. Non-solicitation In connection with a proposed reorganization of the Company, the Company’s wholly-owned subsidiary, New PennyMac Financial Services, Inc., will be filing a registration statement on Form S-4 with the SEC, but this registration statement has not yet become effective. The securities registered under this registration statement may not be sold nor may offers to buy these securities be accepted before the time the registration statement becomes effective. This presentation shall not constitute an offer to sell or a solicitation of an offer to buy these securities, and shall not constitute an offer, solicitation or sale in any jurisdiction in which such offer, solicitation or sale would be unlawful prior to registration or qualification under the securities laws of that jurisdiction. Additional Information and Where to Find It In connection with the proposed reorganization, New PennyMac Financial Services, Inc. (CIK# 0001745916) will be filing a registration statement on Form S-4 (the “New PennyMac Registration Statement”) that includes a proxy statement of the Company that also constitutes a prospectus of New PennyMac Financial Services, Inc. (which New PennyMac Registration Statement has not yet been declared effective). INVESTORS AND SECURITY HOLDERS ARE URGED TO READ THE PROXY STATEMENT/PROSPECTUS, AND ANY OTHER RELEVANT DOCUMENTS WHEN THEY BECOME AVAILABLE, BECAUSE THEY CONTAIN, OR WILL CONTAIN, IMPORTANT INFORMATION ABOUT THE COMPANY, NEW PENNYMAC FINANCIAL SERVICES, INC. AND THE REORGANIZATION. A definitive proxy statement will be sent to stockholders of the Company seeking approval of the reorganization after the New PennyMac Registration Statement is declared effective. The proxy statement/prospectus and other documents relating to the reorganization can be obtained free of charge from the SEC website at www.sec.gov. Participation in Solicitation This communication is not a solicitation of a proxy from any investor or stockholder. However, the Company, New PennyMac and certain of their directors and executive officers may be deemed to be participants in the solicitation of proxies in connection with the Reorganization under the rules of the SEC. Information regarding the Company’s directors and executive officers may be found in its definitive proxy statement relating to its 2018 Annual Meeting of Stockholders filed with the SEC on April 17, 2018 and in the proxy statement/prospectus included in the Form S-4. Information regarding New PennyMac’s directors and executive officers may be found in the proxy statement/prospectus included in the Form S-4. These documents may be obtained free of charge from the SEC’s website at www.sec.gov.
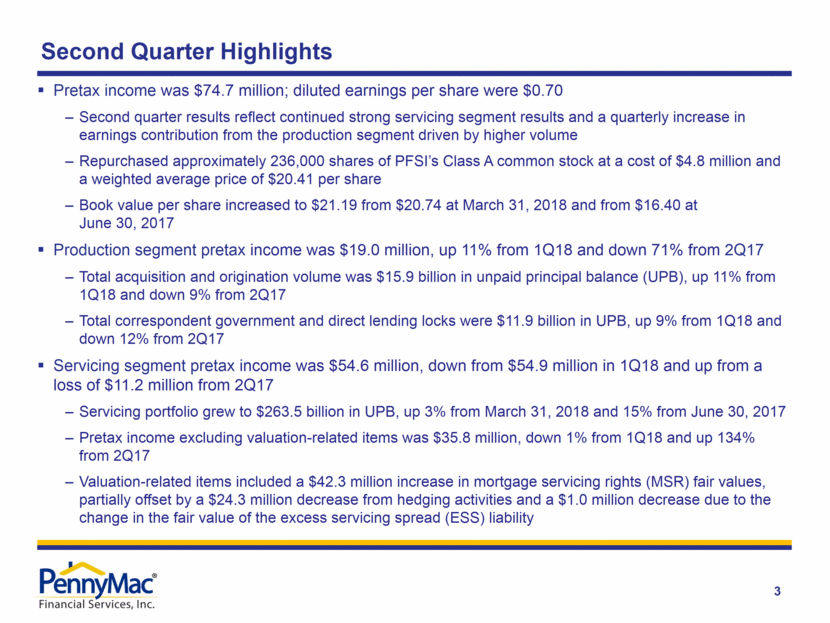
Second Quarter Highlights 3 Pretax income was $74.7 million; diluted earnings per share were $0.70 Second quarter results reflect continued strong servicing segment results and a quarterly increase in earnings contribution from the production segment driven by higher volume Repurchased approximately 236,000 shares of PFSI’s Class A common stock at a cost of $4.8 million and a weighted average price of $20.41 per share Book value per share increased to $21.19 from $20.74 at March 31, 2018 and from $16.40 at June 30, 2017 Production segment pretax income was $19.0 million, up 11% from 1Q18 and down 71% from 2Q17 Total acquisition and origination volume was $15.9 billion in unpaid principal balance (UPB), up 11% from 1Q18 and down 9% from 2Q17 Total correspondent government and direct lending locks were $11.9 billion in UPB, up 9% from 1Q18 and down 12% from 2Q17 Servicing segment pretax income was $54.6 million, down from $54.9 million in 1Q18 and up from a loss of $11.2 million from 2Q17 Servicing portfolio grew to $263.5 billion in UPB, up 3% from March 31, 2018 and 15% from June 30, 2017 Pretax income excluding valuation-related items was $35.8 million, down 1% from 1Q18 and up 134% from 2Q17 Valuation-related items included a $42.3 million increase in mortgage servicing rights (MSR) fair values, partially offset by a $24.3 million decrease from hedging activities and a $1.0 million decrease due to the change in the fair value of the excess servicing spread (ESS) liability
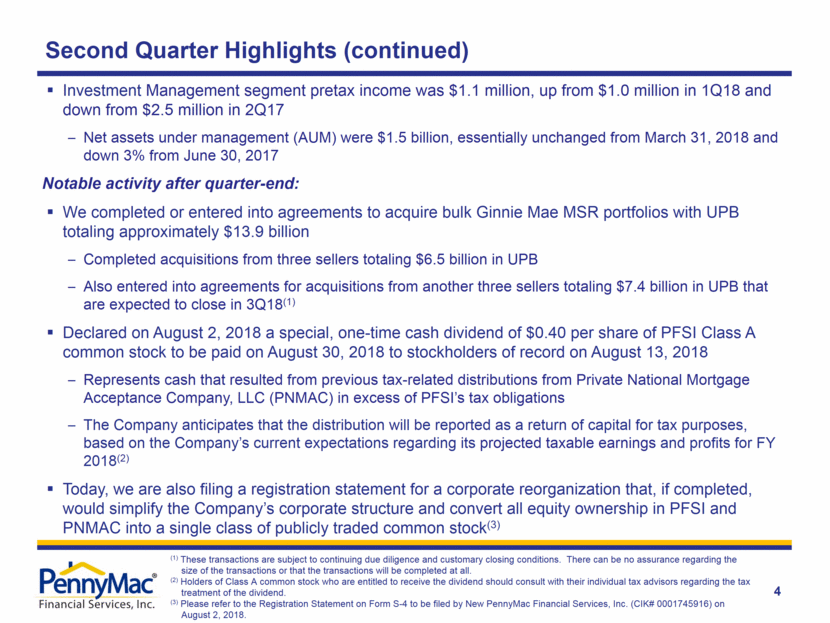
Second Quarter Highlights (continued) 4 Investment Management segment pretax income was $1.1 million, up from $1.0 million in 1Q18 and down from $2.5 million in 2Q17 Net assets under management (AUM) were $1.5 billion, essentially unchanged from March 31, 2018 and down 3% from June 30, 2017 Notable activity after quarter-end: We completed or entered into agreements to acquire bulk Ginnie Mae MSR portfolios with UPB totaling approximately $13.9 billion Completed acquisitions from three sellers totaling $6.5 billion in UPB Also entered into agreements for acquisitions from another three sellers totaling $7.4 billion in UPB that are expected to close in 3Q18(1) Declared on August 2, 2018 a special, one-time cash dividend of $0.40 per share of PFSI Class A common stock to be paid on August 30, 2018 to stockholders of record on August 13, 2018 Represents cash that resulted from previous tax-related distributions from Private National Mortgage Acceptance Company, LLC (PNMAC) in excess of PFSI’s tax obligations The Company anticipates that the distribution will be reported as a return of capital for tax purposes, based on the Company’s current expectations regarding its projected taxable earnings and profits for FY 2018(2) Today, we are also filing a registration statement for a corporate reorganization that, if completed, would simplify the Company’s corporate structure and convert all equity ownership in PFSI and PNMAC into a single class of publicly traded common stock(3) (1) These transactions are subject to continuing due diligence and customary closing conditions. There can be no assurance regarding the size of the transactions or that the transactions will be completed at all. (2) Holders of Class A common stock who are entitled to receive the dividend should consult with their individual tax advisors regarding the tax treatment of the dividend. (3) Please refer to the Registration Statement on Form S-4 to be filed by New PennyMac Financial Services, Inc. (CIK# 0001745916) on August 2, 2018.
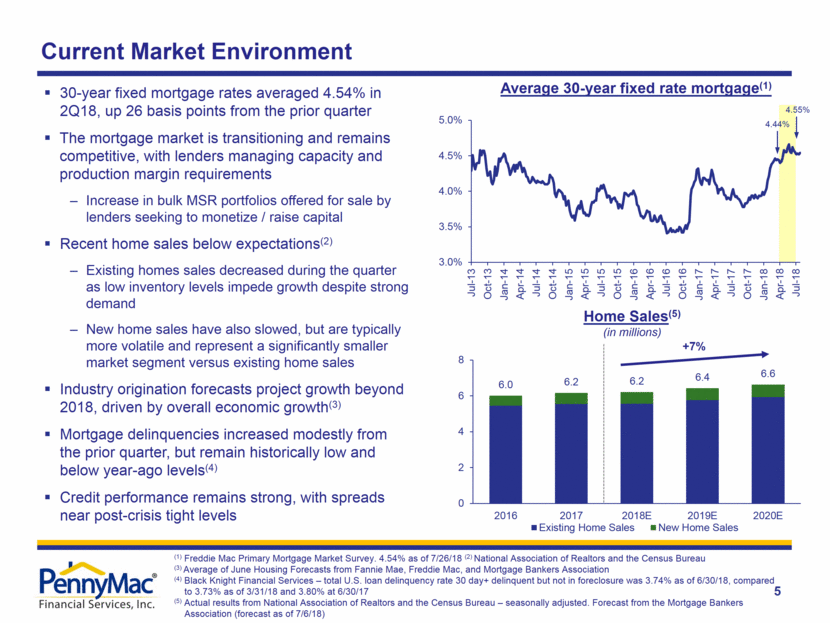
5 Average 30-year fixed rate mortgage(1) 4.55% 30-year fixed mortgage rates averaged 4.54% in 2Q18, up 26 basis points from the prior quarter The mortgage market is transitioning and remains competitive, with lenders managing capacity and production margin requirements Increase in bulk MSR portfolios offered for sale by lenders seeking to monetize / raise capital Recent home sales below expectations(2) Existing homes sales decreased during the quarter as low inventory levels impede growth despite strong demand New home sales have also slowed, but are typically more volatile and represent a significantly smaller market segment versus existing home sales Industry origination forecasts project growth beyond 2018, driven by overall economic growth(3) Mortgage delinquencies increased modestly from the prior quarter, but remain historically low and below year-ago levels(4) Credit performance remains strong, with spreads near post-crisis tight levels 4.44% +7% Home Sales(5) (in millions) Current Market Environment (1) Freddie Mac Primary Mortgage Market Survey. 4.54% as of 7/26/18 (2) National Association of Realtors and the Census Bureau (3) Average of June Housing Forecasts from Fannie Mae, Freddie Mac, and Mortgage Bankers Association (4) Black Knight Financial Services – total U.S. loan delinquency rate 30 day+ delinquent but not in foreclosure was 3.74% as of 6/30/18, compared to 3.73% as of 3/31/18 and 3.80% at 6/30/17 (5) Actual results from National Association of Realtors and the Census Bureau – seasonally adjusted. Forecast from the Mortgage Bankers Association (forecast as of 7/6/18) 3.0% 3.5% 4.0% 4.5% 5.0% Jul-13 Oct-13 Jan-14 Apr-14 Jul-14 Oct-14 Jan-15 Apr-15 Jul-15 Oct-15 Jan-16 Apr-16 Jul-16 Oct-16 Jan-17 Apr-17 Jul-17 Oct-17 Jan-18 Apr-18 Jul-18 6.0 6.2 6.2 6.4 6.6 0 2 4 6 8 2016 2017 2018E 2019E 2020E Existing Home Sales New Home Sales
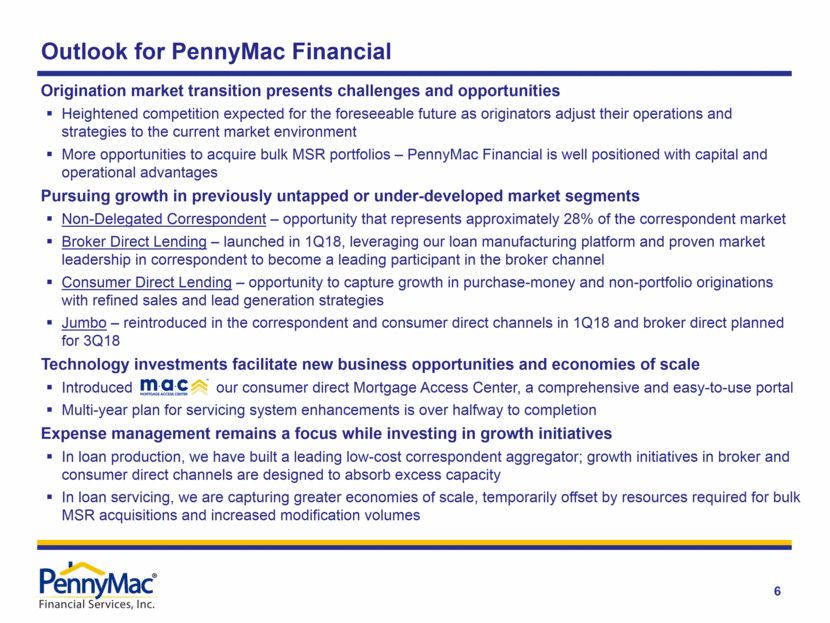
Outlook for PennyMac Financial 6 Origination market transition presents challenges and opportunities Heightened competition expected for the foreseeable future as originators adjust their operations and strategies to the current market environment More opportunities to acquire bulk MSR portfolios – PennyMac Financial is well positioned with capital and operational advantages Pursuing growth in previously untapped or under-developed market segments Non-Delegated Correspondent – opportunity that represents approximately 28% of the correspondent market Broker Direct Lending – launched in 1Q18, leveraging our loan manufacturing platform and proven market leadership in correspondent to become a leading participant in the broker channel Consumer Direct Lending – opportunity to capture growth in purchase-money and non-portfolio originations with refined sales and lead generation strategies Jumbo – reintroduced in the correspondent and consumer direct channels in 1Q18 and broker direct planned for 3Q18 Technology investments facilitate new business opportunities and economies of scale Introduced our consumer direct Mortgage Access Center, a comprehensive and easy-to-use portal Multi-year plan for servicing system enhancements is over halfway to completion Expense management remains a focus while investing in growth initiatives In loan production, we have built a leading low-cost correspondent aggregator; growth initiatives in broker and consumer direct channels are designed to absorb excess capacity In loan servicing, we are capturing greater economies of scale, temporarily offset by resources required for bulk MSR acquisitions and increased modification volumes
Correspondent Production(1) Market Share Market Share Consumer Direct Production(1) Loan Servicing(1) Market Share Investment Management AUM (billions) 7 Trends in PennyMac Financial’s Businesses (1) Source: Inside Mortgage Finance and company estimates. Inside Mortgage Finance estimates total 2Q18 origination market of $445 billion. Correspondent production share estimate is based on PFSI and PMT acquisition volume of $15.0 billion divided by $147 billion for the correspondent market (estimated to be 33% of total origination market). Consumer direct production share is based on PFSI originations of $0.9 billion divided by $249 billion for the retail market (estimated to be 56% of total origination market). Loan servicing market share is based on PFSI’s servicing UPB of $263.5 billion divided by an estimated $10.7 trillion in mortgage debt outstanding as of June 30, 2018. 0.49% 0.50% 0.60% 0.37% 0.00% 0.20% 0.40% 0.60% 0.80% 2Q16 3Q16 4Q16 1Q17 2Q17 3Q17 4Q17 1Q18 2Q18E 9.07% 10.95% 10.44% 10.15% 0% 2% 4% 6% 8% 10% 12% 2Q16 3Q16 4Q16 1Q17 2Q17 3Q17 4Q17 1Q18 2Q18E 1.70% 2.19% 2.39% 2.46% 0.0% 0.5% 1.0% 1.5% 2.0% 2.5% 2Q16 3Q16 4Q16 1Q17 2Q17 3Q17 4Q17 1Q18 2Q18E $1.56 $1.60 $1.54 $1.55 $0.0 $0.5 $1.0 $1.5 $2.0 2Q16 3Q16 4Q16 1Q17 2Q17 3Q17 4Q17 1Q18 2Q18E
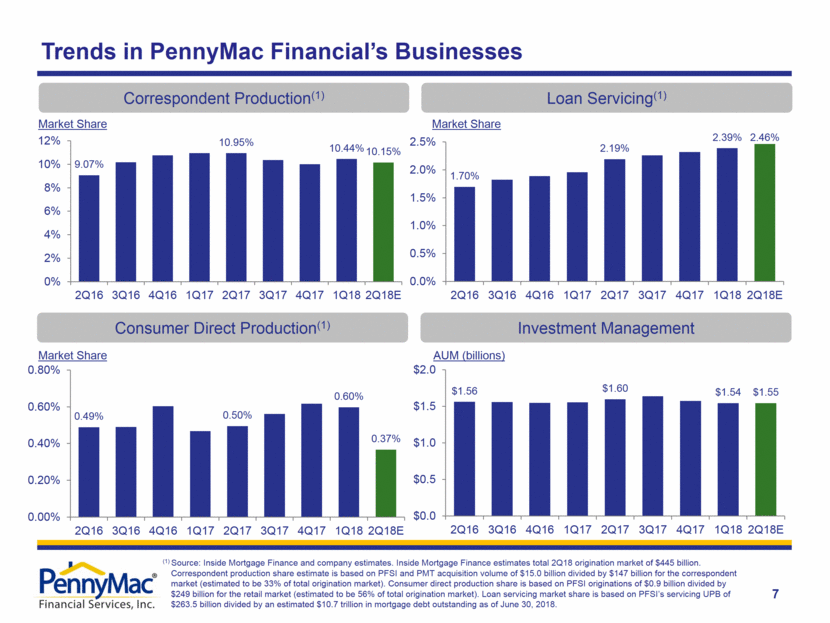
8 (UPB in billions) (1) For government-insured and guaranteed loans and jumbo loans, PFSI earns income from holding and selling or securitizing the loans (2) For conventional loans, PFSI earns a fulfillment fee from PMT rather than income from holding and selling or securitizing the loans (3) Includes locks related to PMT loan acquisitions, including conventional loans for which PFSI earns a fulfillment fee upon loan funding (4) Includes net gains on mortgage loans held for sale, loan origination fees and net interest income for government-insured correspondent loans; lock volume adjusted for expected fallout, which was 4% in 2Q18 for government-insured correspondent locks (5) Based on funding volumes of loans subject to fulfillment fee. The weighted average fulfillment fee rate reflects discretionary reductions to facilitate the successful completion of certain loan transactions Correspondent Volume and Mix Correspondent acquisitions by PMT in 2Q18 totaled $15.0 billion, up 15% Q/Q and down 8% Y/Y 64% government loans; 36% conventional loans 8% Q/Q increase in government acquisitions; down 8% Y/Y 28% Q/Q increase in conventional conforming acquisitions; down 9% Y/Y Correspondent lock volume of $16.2 billion, up 20% Q/Q and down 11% Y/Y; government locks totaled $10.1 billion, up 10% Q/Q and down 10% Y/Y Growth in acquisition volumes driven by a seasonally stronger purchase market Purchase-money loans comprised 85% of total 2Q18 acquisition volume, up from 77% in 1Q18 July correspondent acquisitions totaled $5.7 billion; locks totaled $6.6 billion The non-delegated market represents a significant growth opportunity, comprising approximately 28% of the total correspondent market Advances in our operational capabilities and workflows allow expansion of non-delegated seller relationships and growth in acquisition volume Production Segment Highlights – Correspondent Channel Government loans(1) Total Locks(3) Conventional loans for PMT(2) $10.4 $8.8 $9.5 $5.9 $4.2 $5.4 $18.2 $13.6 $16.2 $0 $4 $8 $12 $16 $20 2Q17 1Q18 2Q18 1Q18 2Q18 Revenue per fallout-adjusted government lock (bps) (4) 45 44 Weighted average fulfillment fee (bps) (5) 28 27 1Q18 2Q18 Correspondent seller relationships 615 631 Purchase-money loans, as a % of total acquisitions 77% 85% Selected Operational Metrics Key Financial Metrics
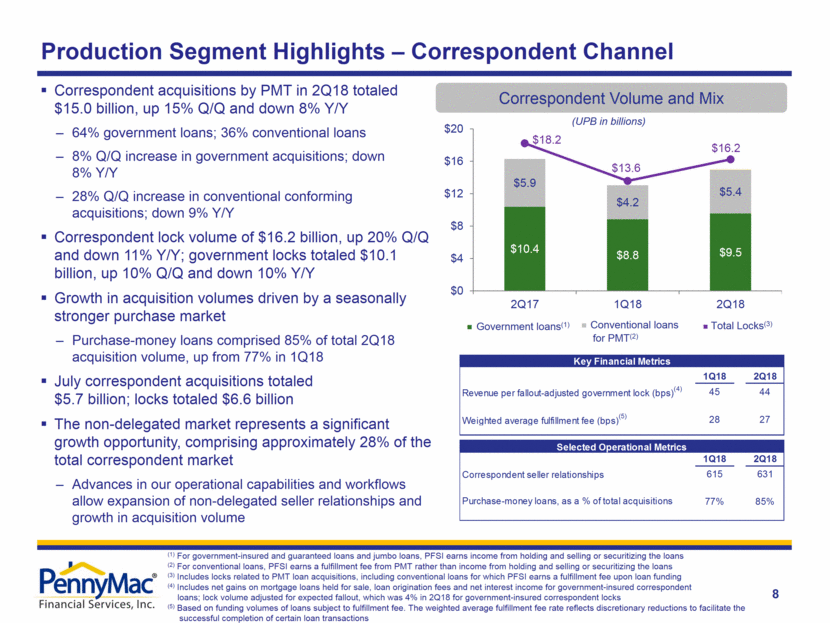
Portfolio-sourced fundings Non-portfolio fundings Committed pipeline(1) (UPB in billions) Consumer Direct Production Volume (1) Commitments to originate mortgage loans at specified terms at period end (2) Includes net gains on mortgage loans held for sale, loan origination fees and net interest income; lock volume adjusted for expected fallout, which was 33% in 2Q18 for consumer direct locks 9 Consumer direct production volume of $911 million in 2Q18, down 28% Q/Q and 28% Y/Y Growing purchase-money and non-portfolio volume Purchase volume reached $204 million; up 83% Y/Y Non-portfolio fundings accounted for 17% of 2Q18 consumer direct production; up from 8% in 2Q17 Lower origination volumes reflect the transition from predominately streamline refinance loans to more operationally intensive full-doc and purchase-money loans July consumer direct originations totaled $393 million; locks totaled $589 million $831 million committed pipeline at July 31, 2018(1) Introduced our Mortgage Access Center portal in 2Q18, which represents a significant milestone for the consumer direct channel Provides key functionality necessary to drive further non-portfolio lead generation and market share growth Capabilities currently include pre-qualification, online application, document upload and loan status Production Segment Highlights – Consumer Direct Channel $1.3 $1.3 $0.9 $0.8 $0.6 $0.8 $0.0 $0.5 $1.0 $1.5 2Q17 1Q18 2Q18 1Q18 2Q18 337 Consumer Direct Margin Revenue per fallout-adjusted consumer direct lock (bps) (2) 326

(1) Commitments to originate mortgage loans at specified terms at period end (2) Includes net gains on mortgage loans held for sale, loan origination fees and net interest income; lock volume adjusted for expected fallout, which was 31% in 2Q18 for broker direct locks (3) As of March 31, 2018 and June 30, 2018 10 Broker direct production volume of $61.8 million in 2Q18, up from $6.9 million in 1Q18 July broker direct originations totaled $25 million; locks totaled $52 million $51 million committed pipeline at July 31, 2018(1) Pace of channel development accelerating, driven by POWER portal enhancements and additions of account executives POWER portal enhancements delivering increased automation and advancing broker service levels to drive platform adoption and future growth Prime Jumbo product expected to be introduced in 3Q18 As a result of the initiatives, we anticipate further increases in monthly lock volume Production Segment Highlights – Broker Direct Channel Broker Direct Fundings (UPB in millions) $3.5 $31.9 $3.3 $29.9 $6.9 $61.8 $0 $10 $20 $30 $40 $50 $60 $70 1Q18 2Q18 Conventional loans Government loans 1Q18 2Q18 Revenue per fallout-adjusted broker direct lock (bps) (2) 30 47 Commited pipeline ($ in millions) (3) $30 $38 Approved brokers (3) 178 268 Broker Direct Metrics

(UPB in billions) Servicing portfolio totaled $263.5 billion in UPB at the end of the second quarter, up 3% from 1Q18 and 15% from 2Q17 Prepayment speeds increased modestly Q/Q, due to seasonally higher prepayment activity Remained significantly lower than 14.4% in 2Q17 After quarter end, we completed or agreed to acquire $13.9 billion in UPB of bulk MSR acquisitions(1) Bulk MSR acquisition opportunities in the market have increased and are expected to remain elevated Loan Servicing Portfolio Composition Net Portfolio Growth (UPB in billions) (1) 11 (1)These transactions are subject to continuing due diligence and customary closing conditions. There can be no assurance regarding the size of the transactions or that the transactions will be completed at all. (2) Represents PMT’s MSRs (3) Early buyouts of delinquent loans from Ginnie Mae pools during the period (4) Percent of serviced and subserviced loans that have registered on PennyMacUSA.com (5) Also includes loans servicing released in connection with recent asset sales by PMT and the Investment Funds (6) Includes consumer direct production, government correspondent acquisitions, and conventional conforming and jumbo loan acquisitions subserviced for PMT Additions from loan production(6) $15.9 (5) Servicing Segment Highlights Prime owned Prime subserviced Special $255.3 $263.5 ($7.7) At 3/31/18 Runoff At 6/30/18 $229.0 $255.3 $263.5 $0 $50 $100 $150 $200 $250 $300 2Q17 1Q18 2Q18 1Q18 2Q18 Loans serviced (in thousands) 1,279 1,328 60+ day delinquency rate 2.9% 2.6% Actual CPR - owned portfolio 11.8% 12.2% Actual CPR - sub-serviced (2) 8.2% 8.9% UPB of completed modifications ($ in millions) $542 $1,038 EBO transactions ($ in millions) (3) $631 $797 Electronic payments (% of portfolio) 86% 88% Customers registered for the website (4) 84% 86% Selected Operational Metrics
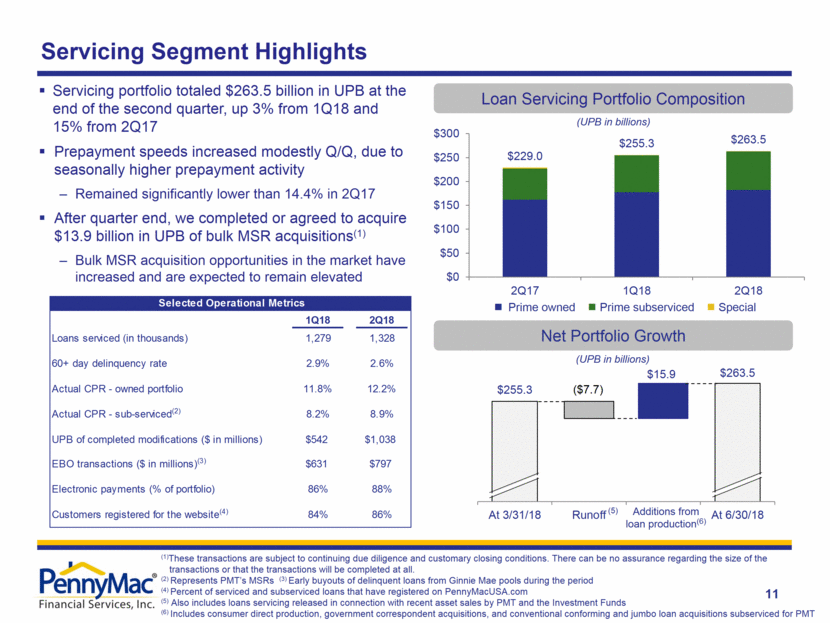
12 ($ in billions) Net assets under management were $1.5 billion, essentially unchanged from March 31, 2018 Continued progress in liquidating PMT’s distressed portfolio, with the outstanding UPB decreasing 61% Y/Y Began deliveries to Fannie Mae under a new CRT REMIC structure, which offers significant structural enhancements REMIC structure is more tax favorable Aligns more closely with Fannie Mae’s CAS structure Expected to result in broader financing options Allows a greater percentage of PMT’s production to be eligible for investment in CRT Two private Investment Funds that we managed have sold or liquidated all of their remaining assets Investment Management AUM Investment Management Segment Highlights $1.45 $1.54 $1.55 $1.60 $1.54 $1.55 $0.00 $0.60 $1.20 $1.80 2Q17 1Q18 2Q18 PMT Investment Funds
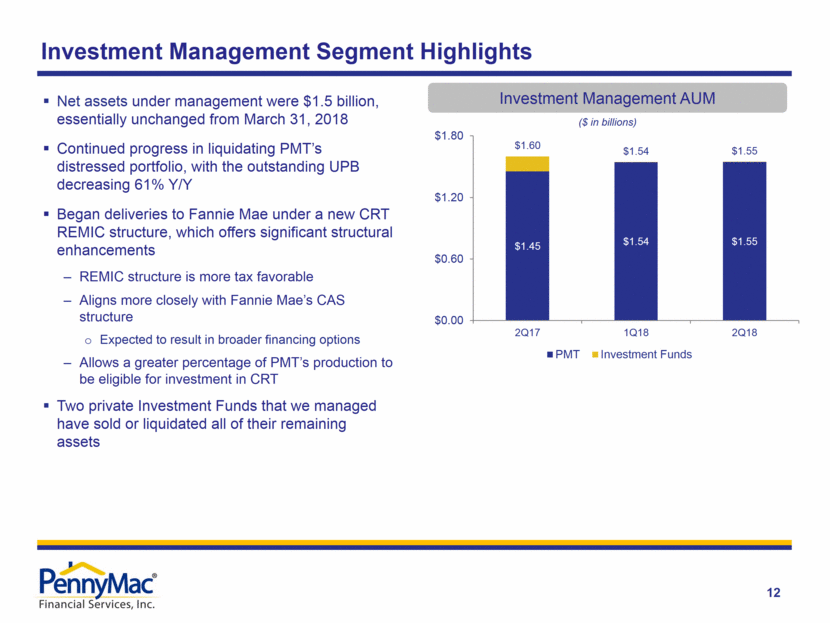
13 PFSI seeks to moderate the impact of interest rate changes on the fair value of its MSR asset through a comprehensive hedge strategy that also considers production-related income In 2Q18, MSR fair value increased primarily due to increasing mortgage rates, resulting in expectations for lower prepayment activity in the future Partially offset by associated hedging costs, and a rate-driven increase in the fair value of the ESS liability MSR Valuation Changes and Offsets ($ in millions) Hedging Approach Continues to Moderate the Volatility of PFSI’s Results ($36.9) $127.8 $42.3 $5.1 ($110.5) ($25.3) $66.7 $17.2 $19.0 2Q17 1Q18 2Q18 MSR fair value change before recognition of realization of cash flows Change in fair value of hedges and ESS liability Production pretax income
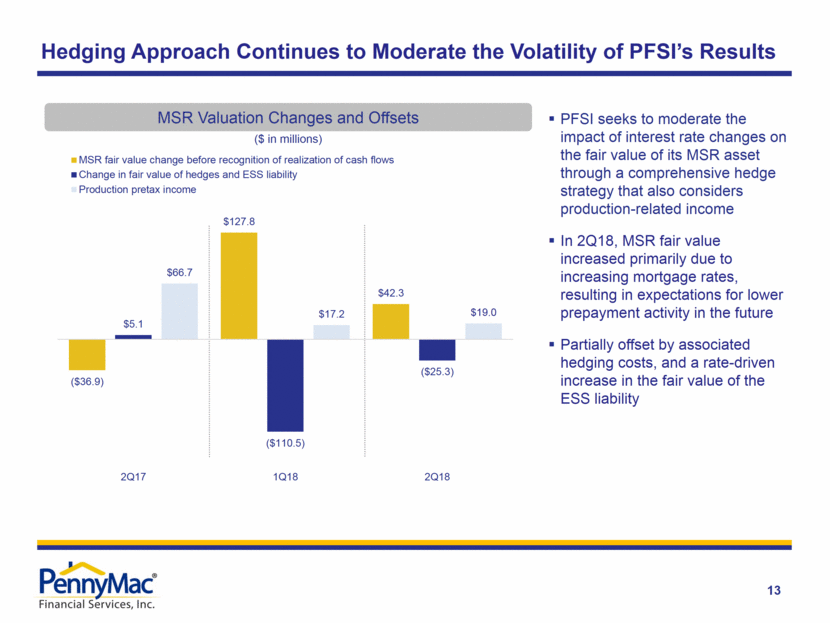
14 (1) Of average portfolio UPB, annualized (2) Comprised of net gains on mortgage loans held for sale at fair value and net interest income related to EBO loans (3) Changes in fair value do not include realization of MSR cash flows, which are included in amortization and realization of MSR cash flows above (4) Includes fair value changes and provision for impairment (5) Considered in the assessment of MSR fair value changes 2Q17 1Q18 2Q18 Pretax income excluding valuation-related changes decreased modestly from 1Q18 and increased significantly from 2Q17 Increase in operating revenue driven by portfolio growth and higher interest income from custodial deposits, partially offset by increased realization of MSR cash flows Revenue related to early buyout (EBO) loans slightly decreased from elevated levels in 1Q18; EBO transaction-related expenses increased due to higher buyout volume Servicing Profitability Excluding Valuation-Related Changes $ in millions basis points (1) $ in millions basis points (1) $ in millions basis points (1) Operating revenue 143.3 $ 26.5 174.5 $ 27.8 180.8 $ 27.7 Amortization and realization of MSR cash flows (55.5) (10.3) (61.2) (9.7) (65.2) (10.0) EBO-related revenue (2) 32.5 6.0 48.2 7.7 45.1 6.9 Servicing expenses: Operating expenses (58.8) (10.9) (76.6) (12.2) (74.4) (11.4) Credit losses and provisions for defaulted loans (20.4) (3.8) (14.3) (2.3) (15.0) (2.3) EBO transaction-related expense (6.2) (1.2) (7.6) (1.2) (11.4) (1.7) Financing expenses: Interest on ESS (4.4) (0.8) (3.9) (0.6) (3.9) (0.6) Interest to third parties (15.2) (2.8) (22.8) (3.6) (20.3) (3.1) Pretax income excluding valuation-related changes 15.3 $ 2.8 36.3 $ 5.8 35.8 $ 5.5 Valuation-related changes (3) MSR fair value (4) (36.9) 127.8 42.3 ESS liability fair value 7.2 (6.9) (1.0) Hedging derivatives losses (2.0) (103.6) (24.3) Provision for credit losses on active loans (5) 5.3 $ 1.3 $ 1.8 Servicing segment pretax income (loss) (11.2) $ 54.9 $ 54.6 $
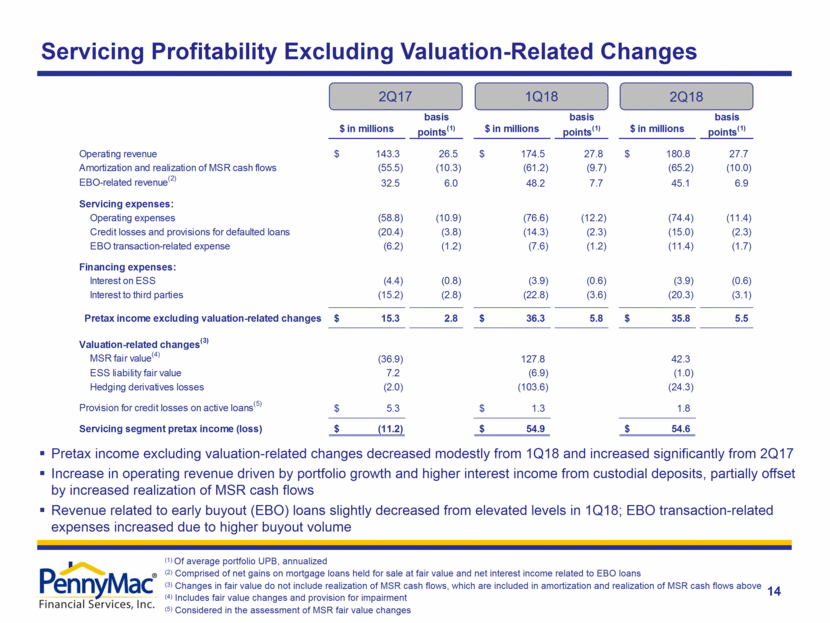
Appendix
Complex and highly regulated mortgage industry requires effective governance, compliance and operating systems Operating platform has been developed organically and is highly scalable Commitment to strong corporate governance, compliance and risk management since inception PFSI is well positioned for continued growth in this market and regulatory environment Loan Production Loan Servicing Investment Management Servicing for owned MSRs and subservicing for Advised Entities Major loan servicer for Fannie Mae, Freddie Mac and Ginnie Mae Industry-leading capabilities in special servicing Organic growth results from loan production, supplemented by MSR acquisitions and PMT investment activity External manager of PennyMac Mortgage Investment Trust (NYSE: PMT), which is focused on investing in mortgage-related assets: GSE credit risk transfers MSRs and ESS Investments in prime non-Agency MBS and ABS Distressed whole loans Synergistic partnership with PMT Correspondent aggregation of newly originated loans from third-party sellers PFSI earns gains on delegated government-insured and non-delegated loans Fulfillment fees for PMT’s delegated conventional loans Consumer direct origination of conventional and government-insured loans Broker direct origination launched in 2018 16 Overview of PennyMac Financial’s Businesses
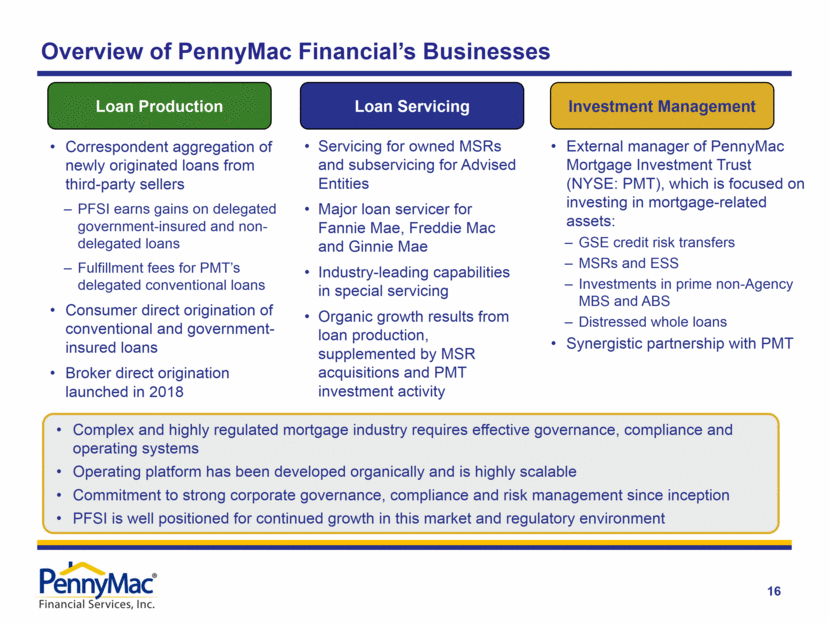
17 Industry-leading platform built organically – not through acquisitions Disciplined, sustainable growth for more than 10 years Focused on building and testing processes and systems before large transaction volumes Distinctive expertise and full range of capabilities across mortgage banking and investment management Loan production, e.g., loan fulfillment systems and operations, correspondent counterparty review and management Credit, e.g., loan program development, underwriting and quality control Capital markets, e.g., pooling and securitization, hedging/interest rate risk management Servicing, e.g., customer service, default management, investor accounting Corporate functions, e.g., enterprise risk management, internal audit, treasury, finance and accounting, legal, IT infrastructure and development Over 3,000 employees Highly experienced management team – 120 senior-most executives have, on average, 25 years of relevant industry experience Strong governance and compliance culture Led by distinguished board which includes eight independent Directors Robust management governance structure with 10 committees that oversee key risks and controls External oversight by regulators, business partners and other third parties Desired structure in place to compete effectively as a non-bank Synergistic partnership with PMT, a leading residential mortgage REIT and long-term investment vehicle Provides access to efficient capital and reduces balance sheet constraints on growth PennyMac Financial is in a Unique Position Among Mortgage Specialists
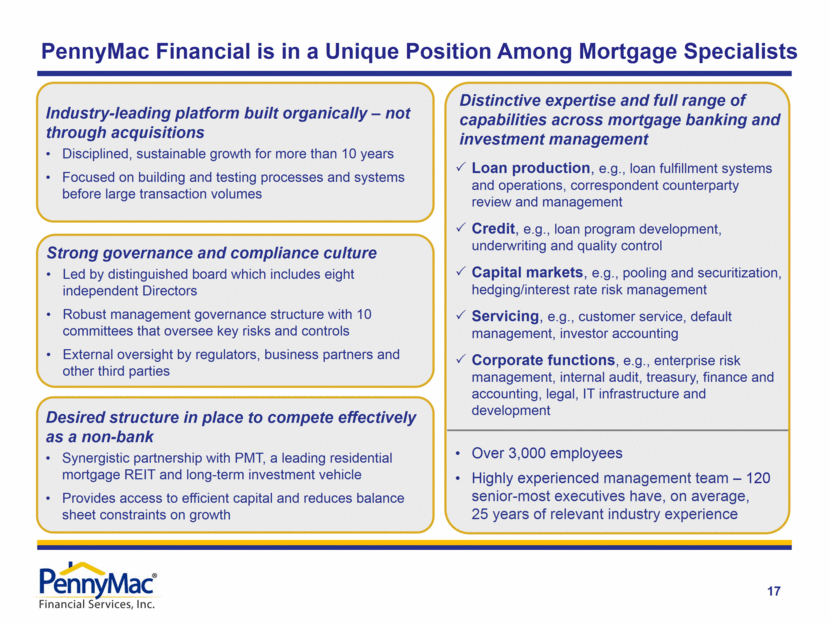
18 Why Are MSR Sales Occurring? How Do MSRs Come to Market? Large servicers may sell MSRs due to continuing operational pressures, higher regulatory capital requirements for banks (treatment under Basel III) and a re-focus on core customers/businesses Independent mortgage banks sell MSRs from time to time due to a need for capital Intermittent large bulk portfolio sales ($10+ billion in UPB) Require considerable coordination with selling institutions and Agencies Mini-bulk sales (typically $500 million to $5 billion in UPB) Flow/co-issue MSR transactions (monthly commitments, typically $20-$100 million in UPB) Alternative delivery method typically from larger independent originators Which MSR Transactions Are Attractive? GSE and Ginnie Mae servicing in which PFSI has distinctive expertise MSRs sold and operational servicing transferred to PFSI (not subserviced by a third party) Measurable representation and warranty liability for PFSI PFSI is uniquely positioned to be a successful acquirer of MSRs Proven track record of complex MSR and distressed loan transfers Operational platform that addresses the demands of the Agencies, regulators and financing partners Physical capacity in place to sustain servicing portfolio growth plans Potential co-investment opportunity for PMT in the ESS Opportunity in MSR Acquisitions
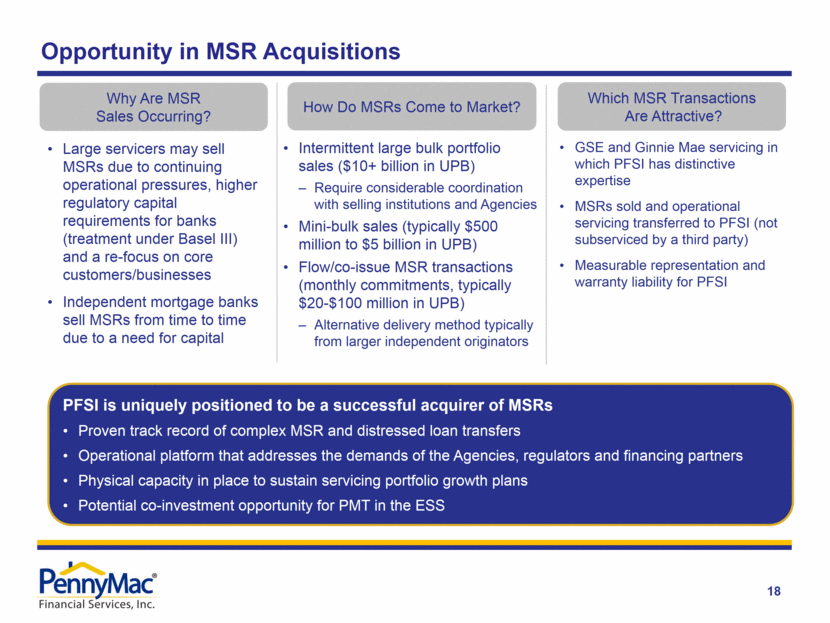
19 Excess Servicing Spread (e.g., 12.5bp) MSR Asset (e.g., 25bp servicing fee) Acquired by PFSI from Third-Party Seller(1) PMT has co-invested in Agency MSRs acquired from third-party sellers by PFSI; presently only related to certain Ginnie Mae MSRs PMT acquires the right to receive the ESS cash flows over the life of the underlying loans PFSI owns the MSRs and services the loans (1) The contractual servicer and MSR owner is PennyMac Loan Services, LLC, an indirect controlled subsidiary of PennyMac Financial Services, Inc (2) Subject and subordinate to Agency rights (under the related servicer or issuer guide) and, as applicable, to PFSI’s pledge of MSRs under a note payable; does not change the contractual servicing fee paid by the Agency to the servicer Excess Servicing Spread(2) Interest income from a portion of the contractual servicing fee Realized yield dependent on prepayment speeds and recapture Base MSR Income from a portion of the contractual servicing fee Also entitled to ancillary income Bears expenses of performing loan servicing activities Required to advance certain payments largely for delinquent loans Base MSR (e.g., 12.5bp) Acquired by PMT from PFSI(1) Example transaction: actual transaction details may vary materially PFSI’s Mortgage Servicing Rights Investments in Partnership with PMT
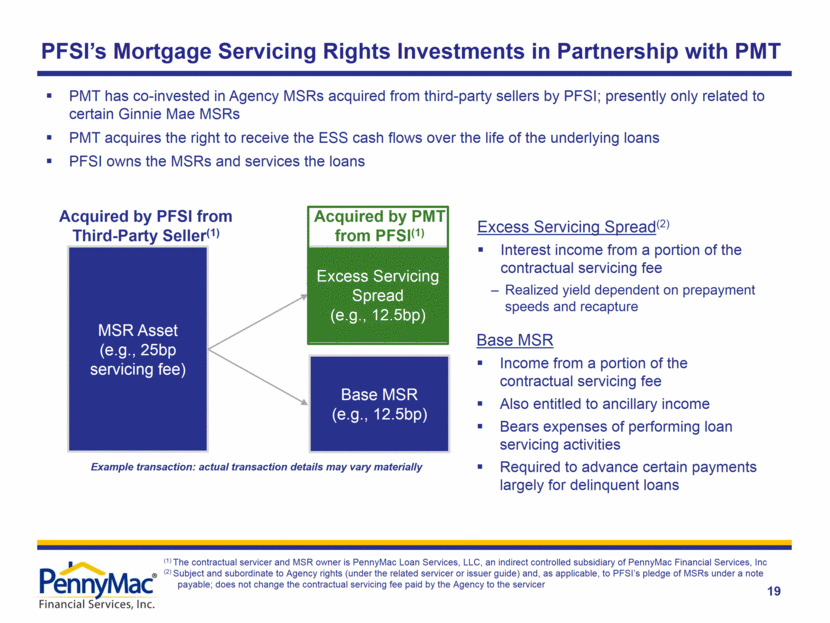
20 MSR Asset Valuation Note: Figures may not sum exactly due to rounding UPB $153,661 $24,603 $178,264 Weighted average coupon 3.84% 4.17% 3.89% Prepayment speed assumption (CPR) 8.6% 9.5% 8.7% Weighted average servicing fee rate 0.31% 0.34% 0.32% Fair value of MSR $2,149.4 $336.8 $2,486.2 As a multiple of servicing fee 4.45 4.01 4.39 Related excess servicing spread liability - $229.5 - June 30, 2018 Unaudited ($ in millions) Total Fair value subject to excess servicing spread liability Fair value not subject to excess servicing spread
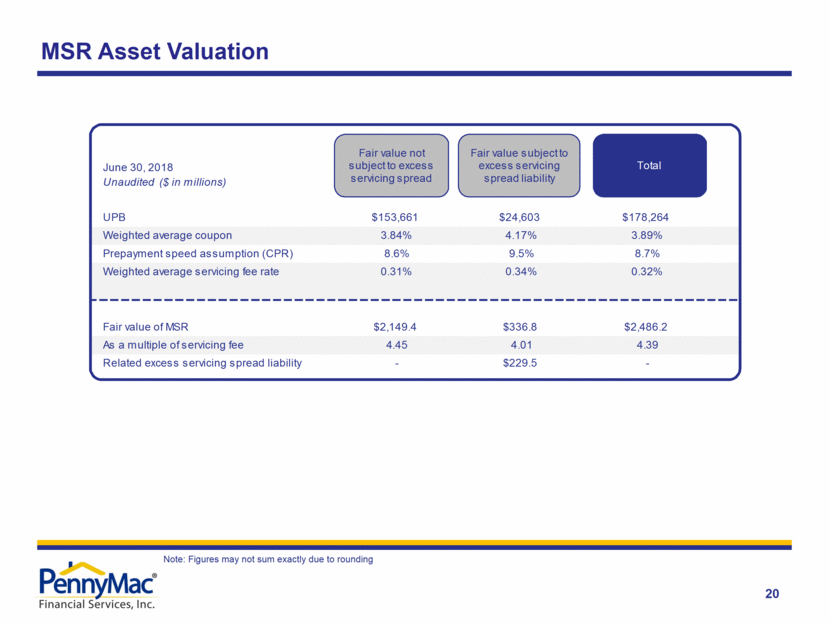
21 Note: Figures may not sum exactly due to rounding Acquisitions and Originations by Product Unaudited ($ in millions) Correspondent Acquisitions Conventional 5,918 $ 6,530 $ 5,891 $ 4,226 $ 5,396 $ Government 10,392 10,873 9,505 8,830 9,546 Jumbo - - - - 8 Total 16,310 $ 17,403 $ 15,396 $ 13,056 $ 14,951 $ Consumer Direct Originations Conventional 414 $ 513 $ 646 $ 708 $ 634 $ Government 855 1,008 996 559 277 Jumbo - - - - - Total 1,268 $ 1,522 $ 1,642 $ 1,266 $ 911 $ Broker Direct Originations Conventional - $ - $ - $ 4 $ 32 $ Government - - - 3 30 Jumbo - - - - - Total - $ - $ - $ 7 $ 62 $ Total acquisitions/originations 17,579 $ 18,925 $ 17,038 $ 14,329 $ 15,924 $ UPB of loans fulfilled for PMT 5,891 $ 5,405 $ 4,226 $ 5,918 $ 6,530 $ 1Q18 2Q17 3Q17 4Q17 2Q18
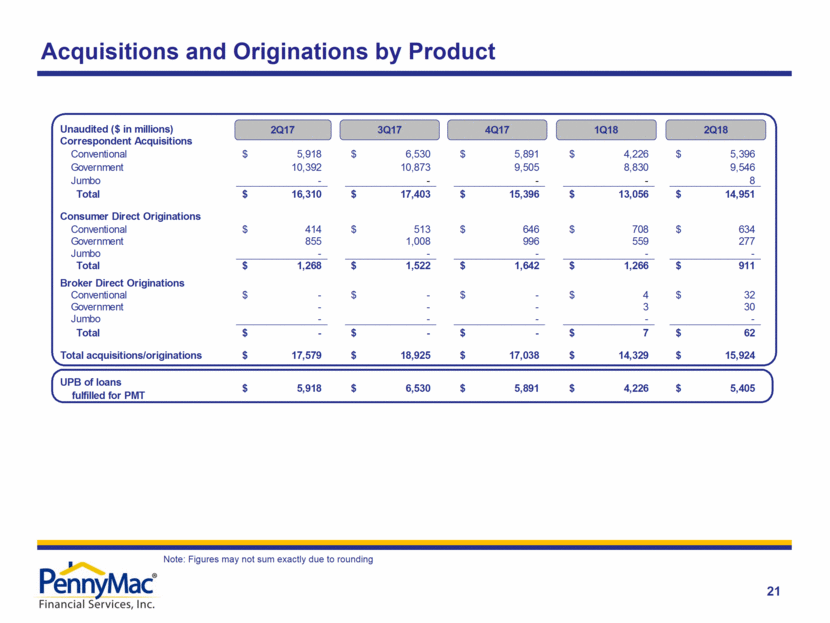
22 Note: Figures may not sum exactly due to rounding Interest Rate Locks by Product Unaudited ($ in millions) Correspondent Locks Conventional 7,022 $ 6,356 $ 6,293 $ 4,392 $ 6,091 $ Government 11,209 10,999 9,571 9,162 10,082 Jumbo - - - 13 59 Total 18,231 $ 17,356 $ 15,864 $ 13,567 $ 16,232 $ Consumer Direct Locks Conventional 805 $ 845 $ 947 $ 1,080 $ 1,018 $ Government 1,476 1,387 1,261 573 625 Jumbo - - - 8 29 Total 2,280 $ 2,232 $ 2,209 $ 1,661 $ 1,672 $ Broker Direct Locks Conventional - $ - $ - $ 15 $ 50 $ Government - - - 20 51 Jumbo - - - - - Total - $ - $ - $ 35 $ 101 $ Total locks 20,511 $ 19,588 $ 18,073 $ 15,263 $ 18,005 $ 1Q18 2Q17 3Q17 4Q17 2Q18
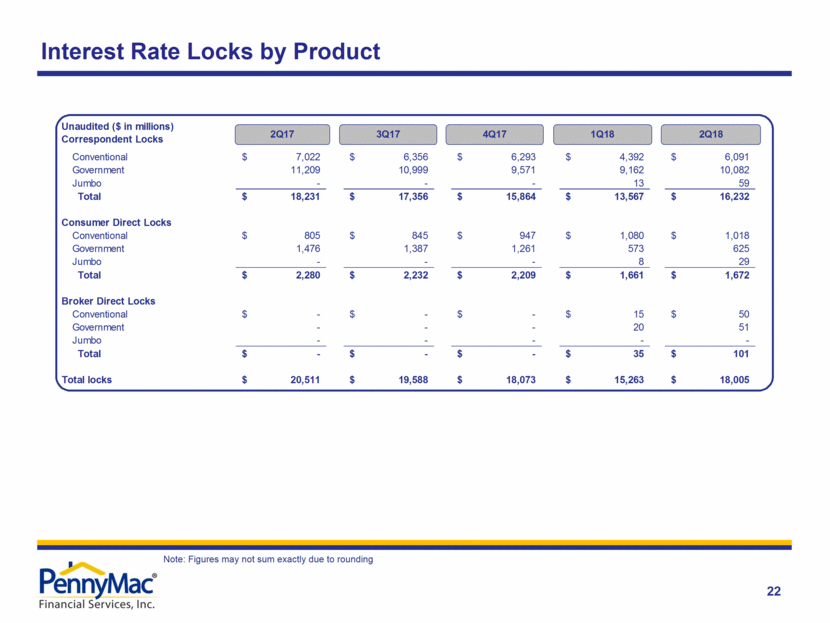
23 Correspondent Consumer Direct Credit Characteristics by Acquisition / Origination Period 2Q17 3Q17 4Q17 1Q18 2Q18 Government-insured 694 693 693 697 697 Conventional 753 749 745 744 748 Weighted Average FICO 2Q17 3Q17 4Q17 1Q18 2Q18 Government-insured 690 692 695 697 709 Conventional 740 741 738 738 736 Weighted Average FICO
