
Exelon Reports Second Quarter 2018 Results
Earnings Release Highlights
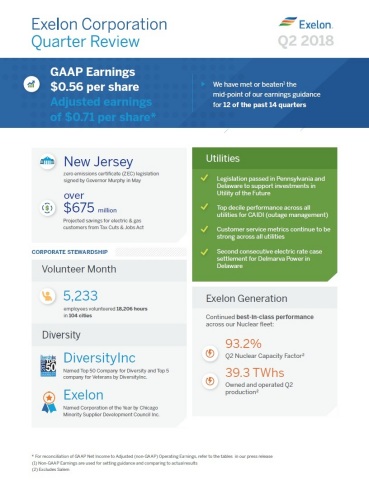
- GAAP Net Income of $0.56 per share and Adjusted (non-GAAP) Operating Earnings of $0.71 per share for the second quarter of 2018
- Reaffirming full year 2018 Adjusted Operating Earnings guidance of $2.90 to $3.20 per share
- Strong utility operations with every utility achieving top decile CAIDI performance
- Legislation passed in Pennsylvania and Delaware will support investment in the Utility of the Future
- Customer savings from the Tax Cuts & Jobs Act (TCJA) are now projected to exceed $675 million annually across Exelon's electric and gas distribution and transmission customers
- New Jersey zero emissions certificate (ZEC) legislation signed by Gov. Phil Murphy on May 23, 2018
CHICAGO--(BUSINESS WIRE)-- Exelon Corporation (NYSE: EXC) today reported its financial results for the second quarter of 2018.
This press release features multimedia. View the full release here: https://www.businesswire.com/news/home/20180802005359/en/
Exelon second-quarter highlights (Graphic: Business Wire)
“Exelon’s utility and power businesses performed well operationally and financially in the second quarter. Our strategy to accelerate investment in advanced technology and infrastructure to improve customer service gained momentum as lawmakers in Pennsylvania and Delaware passed legislation that will support our initiatives to create the utility of the future,” said Christopher M. Crane, Exelon’s President and CEO. “In May, New Jersey Gov. Phil Murphy signed legislation creating a zero emissions certificate program that will preserve the state’s emissions-free nuclear power plants and the economic and environmental benefits they provide. Our commitment to the communities we serve remains a core value, with our employees setting a new company record by volunteering more than 18,000 hours in 104 cities across the U.S. as part of National Volunteer Month.”
“Exelon again delivered solid financial results with non-GAAP operating earnings of $0.71 per share, which is above our guidance range of $0.55-$0.65 per share,” said Joseph Nigro, Exelon’s Senior Executive Vice President and CFO. “As we look ahead to the rest of the year, we are on solid footing and will continue to focus on delivering strong operational and financial results for our stakeholders. Exelon remains on track to meet our full-year guidance of $2.90-$3.20 per share and expects to earn $0.80-$0.90 per share in the third quarter.”
Second Quarter 2018
Exelon's GAAP Net Income for the second quarter of 2018 increased to $0.56 per share from $0.10 per share in the second quarter of 2017; Adjusted (non-GAAP) Operating Earnings increased to $0.71 per share in the second quarter of 2018 from $0.56 per share in the second quarter of 2017. For the reconciliations of GAAP Net Income to Adjusted (non-GAAP) Operating Earnings, refer to the tables beginning on page 7.
Adjusted (non-GAAP) Operating Earnings in the second quarter of 2018 primarily reflect higher electric distribution earnings at ComEd, regulatory rate increases at PHI, decreased nuclear outage days, increased capacity prices, the favorable impacts of the Illinois Zero Emission Standard (ZES), realized gains on nuclear decommissioning trust fund investments and tax savings related to the TCJA at Generation, partially offset by lower realized energy prices at Generation.
Operating Company Results1
ComEd
ComEd's second quarter of 2018 GAAP Net Income increased to $164 million from $118 million in the second quarter of 2017. ComEd’s Adjusted (non-GAAP) Operating Earnings increased to $164 million for the second quarter of 2018 from $141 million in the second quarter of 2017, primarily reflecting higher electric distribution earnings. Due to revenue decoupling, ComEd's distribution earnings are not affected by actual weather or customer usage patterns.
PECO
PECO’s second quarter of 2018 GAAP Net Income increased to $96 million from $88 million in the second quarter of 2017. PECO’s Adjusted (non-GAAP) Operating Earnings for the second quarter of 2018 increased to $97 million from $89 million in the second quarter of 2017, primarily due to favorable weather conditions and volumes.
Heating degree days were up 46.5 percent relative to the same period in 2017 and were 9.3 percent above normal. Total retail electric deliveries were up 1.4 percent compared with the second quarter of 2017. Natural gas deliveries (including both retail and transportation segments) in the second quarter of 2018 were up 15.7 percent compared with the same period in 2017.
BGE
BGE’s second quarter of 2018 GAAP Net Income increased to $51 million from $45 million in the second quarter of 2017. BGE’s Adjusted (non-GAAP) Operating Earnings for the second quarter of 2018 increased to $52 million from $46 million in the second quarter of 2017, primarily reflecting transmission rate increases. Due to revenue decoupling, BGE's distribution earnings are not affected by actual weather or customer usage patterns.
______________
1Exelon’s five business units include ComEd, which consists of electricity transmission and distribution operations in northern Illinois; PECO, which consists of electricity transmission and distribution operations and retail natural gas distribution operations in southeastern Pennsylvania; BGE, which consists of electricity transmission and distribution operations and retail natural gas distribution operations in central Maryland; PHI, which consists of electricity transmission and distribution operations in the District of Columbia and portions of Maryland, Delaware, and New Jersey and retail natural gas distribution operations in northern Delaware; and Generation, which consists of owned and contracted electric generating facilities and wholesale and retail customer supply of electric and natural gas products and services, including renewable energy products and risk management services.
PHI
PHI’s second quarter of 2018 GAAP Net Income increased to $84 million from $66 million in the second quarter of 2017. PHI’s Adjusted (non-GAAP) Operating Earnings for the second quarter of 2018 increased to $86 million from $63 million in the second quarter of 2017, primarily reflecting regulatory rate increases. Due to revenue decoupling, PHI's distribution earnings related to Pepco and DPL Maryland are not affected by actual weather or customer usage patterns.
Generation
Generation's second quarter of 2018 GAAP Net Income increased to $178 million from a Net loss of $235 million in the second quarter of 2017. Generation’s Adjusted (non-GAAP) Operating Earnings for the second quarter of 2018 increased to $331 million from $217 million in the second quarter of 2017, primarily reflecting decreased nuclear outage days, increased capacity prices, the favorable impacts of the Illinois ZES, realized gains on nuclear decommissioning trust fund investments and tax savings related to the TCJA, partially offset by lower realized energy prices.
The proportion of expected generation hedged as of June 30, 2018, was 97 percent to 100 percent for 2018, 71 percent to 74 percent for 2019 and 41 percent to 44 percent for 2020.
Second Quarter and Recent Highlights
-
Tax Cuts and Jobs Act Tax Savings: The Utility Registrants have
made filings with their respective regulators to begin passing back to
customers the ongoing annual tax savings resulting from the TCJA. In
total, the Utility Registrants project total annual savings of over
$675 million across their electric and gas distribution customers and
electric transmission customers. There were the following developments
related to these filings in the second quarter of 2018:
- Pursuant to a Pennsylvania Public Utility Commission (PAPUC) order issued on May 17, 2018, to all Pennsylvania utilities without an existing base rate case, PECO began passing back annual tax savings of $4 million to its natural gas distribution customers through a negative surcharge mechanism beginning July 1, 2018.
- On May 31, 2018, Pepco received an order from the Maryland Public Service Commission (MDPSC) approving a settlement agreement for its 2018 electric distribution rate case, which included the annual ongoing TCJA tax savings and provides a one-time bill credit to customers of approximately $10 million representing the TCJA tax savings from January 1, 2018, through the effective date of June 1, 2018.
- On June 27, 2018, DPL entered into a settlement agreement with parties in Delaware for its pending electric distribution rate case, which includes the annual ongoing TCJA tax savings and provides a one-time bill credit to customers of approximately $3 million representing the TCJA tax savings from February 1, 2018, through March 17, 2018, when full interim rates were put into effect.
- ComEd’s, PECO’s, BGE’s, Pepco’s, DPL’s and ACE’s electric transmission formula rate updates effective June 1, 2018, reflect the annual benefit of lower income tax rates from TCJA of $69 million, $20 million, $18 million, $13 million, $12 million and $11 million, respectively.
- New Jersey Clean Energy Legislation: On May 23, 2018, Governor Murphy of New Jersey signed new legislation, which became effective immediately, that will establish a ZEC program providing compensation for nuclear plants that demonstrate to the NJBPU that they meet certain requirements, including that they make a significant contribution to air quality in the state and that their revenues are insufficient to cover their costs and risks. Under the new legislation, the NJBPU will issue ZECs to qualifying nuclear power plants, and the electric distribution utilities in New Jersey, including ACE, will be required to purchase those ZECs and will be allowed to recover the associated costs from their retail distribution customers. The NJBPU has 180 days from the effective date to establish procedures for implementation of the ZEC program and 330 days from the effective date to determine which nuclear power plants are selected to receive ZECs under the program. The quantity of ZECs issued will be determined based on the greater of 40 percent of the total number of MWh of electricity distributed by the public electric distribution utilities in New Jersey in the prior year, or the total number of MWh of electricity generated in the prior year by the selected nuclear power plants. The ZEC price is approximately $10 per MWh during the first 3-year eligibility period. For eligibility periods following the first 3-year eligibility period, the NJBPU has discretion to reduce the ZEC price. Assuming the successful implementation of the New Jersey ZEC program and the selection of Salem as one of the qualifying facilities, the New Jersey ZEC program has the potential to mitigate the heightened risk of earlier retirement for Salem. On the same day, the Governor of New Jersey signed new legislation, which also became effective immediately, that establishes and modifies New Jersey’s clean energy and energy efficiency programs and solar and renewable energy portfolio standards.
- DPL Delaware Electric Distribution Base Rates: On June 27, 2018, DPL entered into a non- unanimous settlement agreement with the majority of the parties in the proceeding related to its pending electric distribution base rate case. The settlement agreement provides for a net decrease to annual electric distribution base rates of $7 million, which includes annual ongoing TCJA tax savings, and reflects a ROE of 9.7 percent. A decision is expected on the matter in the third quarter of 2018, with a rate refund expected to be issued in the fourth quarter of 2018 if the Delaware Public Service Commission (DPSC) approves the settlement agreement as filed.
- BGE Maryland Natural Gas Distribution Base Rates: On June 8, 2018, BGE filed an application with the MDPSC to increase its annual natural gas distribution base rates by $63 million, reflecting a requested ROE of 10.5 percent. BGE expects a decision in the first quarter of 2019 but cannot predict what increase the MDPSC will approve.
- Delaware Distribution System Investment Charge Legislation: On June 14, 2018, Governor Carney of Delaware signed new Distribution System Investment Charge (DSIC) legislation, which establishes a system improvement charge that provides a mechanism to recover infrastructure investments, allowing for gradual rate increases and limiting frequency of distribution base rate cases. DPL expects to make its first filing in Delaware in the fourth quarter of 2018, with the new charge effective in the first quarter of 2019. While this legislation is expected to support needed infrastructure investment and allow for more timely recovery of those investments, Exelon, PHI and DPL cannot predict the potential financial impact on Exelon, PHI or DPL.
- Pennsylvania Alternative Ratemaking Legislation: On June 28, 2018, Governor Wolf of Pennsylvania signed new legislation, which authorized the PAPUC to review and approve utility- proposed alternative rate designs, including options such as decoupling mechanisms, formula rates, multi-year rate plans, and performance based rates. Exelon and PECO cannot predict the outcome or the potential financial impact, if any, on Exelon or PECO.
- PJM Transmission Order: On June 15, 2016, a number of parties, including the Utility Registrants, filed a proposed settlement with FERC to resolve outstanding issues related to cost responsibility for charges to transmission customers for certain transmission facilities that operate at or above 500 kV. The settlement included provisions for monthly credits or charges related to the periods prior to January 1, 2016, that are expected to be refunded or recovered through PJM wholesale transmission rates through June 2025. On May 31, 2018, FERC issued an order approving the settlement. Pursuant to the order, similar charges for the period January 1, 2016, through June 30, 2018, will also be refunded or recovered through PJM wholesale transmission rates over the subsequent 12-month period. PJM will commence billing the refunds and charges associated with this settlement in August 2018.Pursuant to the FERC approval of the settlement in the second quarter of 2018, the Utility Registrants recorded gross payables to and receivables from PJM of $135 million and $197 million, respectively, which were offset by regulatory assets and liabilities, resulting in no earnings impact. In addition, Generation recorded a pre-tax charge and payable to PJM of $23 million in the second quarter of 2018.
- FirstEnergy Solutions: On July 9, 2018, Generation entered into an agreement to purchase FirstEnergy Solutions Corporation's retail electricity and wholesale load serving contracts and certain other related commodity contracts for an all cash purchase price of $140 million. The transaction is expected to close in the fourth quarter of 2018. The closing of the transaction is subject to certain conditions, including Generation being the winning bidder after a court-supervised Section 363 bankruptcy auction, the approval of the Purchase Agreement by the United States Bankruptcy Court for the Northern District of Ohio following the auction, and the expiration or termination of the applicable waiting period under the Hart-Scott-Rodino Antitrust Improvements Act of 1976. Either party may terminate the Purchase Agreement if the transaction has not been consummated by December 31, 2018.
- Agreement for Sale and Decommissioning of Oyster Creek: On July 31, 2018, Generation entered into an agreement with Holtec International (Holtec) and its indirect wholly owned subsidiary, Oyster Creek Environmental Protection, LLC (OCEP), for the sale and decommissioning of Oyster Creek. Generation will transfer to OCEP substantially all the assets associated with Oyster Creek, including assets held in nuclear decommissioning trust (NDT) funds valued at approximately $980 million as of June 30, 2018, along with the assumption of liability for all responsibility for the site, including full decommissioning and ongoing management of spent fuel until the spent fuel is moved offsite. In addition to the assumption of liability for the full decommissioning and ongoing management of spent fuel, other consideration to be received in the transaction is contingent on several factors, including a requirement that Generation deliver a minimum NDT fund balance at closing, subject to adjustment for specific terms that include income taxes that would be imposed on any net unrealized built-in gains and certain decommissioning activities to be performed during the pre-close period after the unit shuts down in the fall of 2018 and prior to the anticipated close of the transaction. Completion of the transaction contemplated by the sale agreement is subject to the satisfaction of several closing conditions, including approval of the license transfer from the NRC and other regulatory approvals, and the receipt of a private letter ruling from the IRS. Generation currently anticipates satisfaction of the closing conditions to occur in the second half of 2019.
- Mystic Generating Station Early Retirement: On March 29, 2018, Generation announced it had formally notified grid operator ISO-NE of its plans to early retire its Mystic Generating Station assets on June 1, 2022, absent any interim and long-term solutions for reliability and regional fuel security. On May 1, 2018, ISO-NE made a filing with FERC requesting waiver of certain tariff provisions to allow it to retain Mystic units 8 and 9 for fuel security for the 2022 - 2024 planning years. On May 16, 2018, Generation made a filing with FERC to establish cost-of-service compensation and terms and conditions of service for Mystic units 8 and 9 for the period between June 1, 2022 - May 31, 2024. On July 2, 2018, FERC issued an order denying ISO-NE's May 1, 2018, waiver request on procedural grounds but accepting ISO-NE's conclusions that retirement of Mystic units 8 and 9 could cause a violation of mandatory reliability standards as soon as 2022. Accordingly, FERC ordered ISO-NE to (i) make a filing within 60 days providing for the filing of a short-term cost-of-service agreement to address demonstrated fuel security concerns and (ii) make a filing by July 1, 2019, proposing permanent tariff revisions that would improve its market design to better address regional fuel security concerns. FERC also extended the deadline by which Generation must make a retirement decision for Mystic units 8 and 9 to January 4, 2019. On July 13, 2018, FERC issued an order accepting the cost-of-service agreement for filing, making findings on certain issues and establishing hearing procedures on an expedited schedule. Exelon and Generation cannot predict the final outcome of these proceedings or the potential financial impact, if any, on Exelon or Generation.
- Nuclear Operations: Generation’s nuclear fleet, including its owned output from the Salem Generating Station and 100 percent of the CENG units, produced 45,723 gigawatt-hours (GWhs) in the second quarter of 2018, compared with 44,065 GWhs in the second quarter of 2017. Excluding Salem, the Exelon-operated nuclear plants at ownership achieved a 93.2 percent capacity factor for the second quarter of 2018, compared with 90.9 percent for the second quarter of 2017. The number of planned refueling outage days in the second quarter of 2018 totaled 94, compared with 125 in the second quarter of 2017. There were 2 non-refueling outage days in the second quarter of 2018, compared with 12 in the second quarter of 2017.
- Fossil and Renewables Operations: The Dispatch Match rate for Generation’s gas and hydro fleet was 97.8 percent in the second quarter of 2018, compared with 99.0 percent in the second quarter of 2017. The lower performance in the quarter was primarily due to outages at gas cycle units in Massachusetts and Texas.Energy Capture for the wind and solar fleet was 95.1 percent in the second quarter of 2018, compared with 95.5 percent in the second quarter of 2017. The lower performance in the quarter was driven by equipment issues at wind farms in Texas.
-
Financing Activities:
- On May 23, 2018, ACE entered into two term loan agreements in the aggregate amount of $125 million, which expire on May 22, 2019. Pursuant to the term loan agreements, loans made thereunder bear interest at a variable rate equal to LIBOR plus 0.55 percent and all indebtedness thereunder is unsecured.
- On June 21, 2018, Pepco issued $100 million aggregate principal amount of its First Mortgage Bonds, 4.27 percent due June 15, 2048. Pepco used the proceeds to repay existing indebtedness and for general corporate purposes.
- On June 21, 2018, DPL issued $200 million in aggregate principal amount of its First Mortgage Bonds, 4.27 percent due June 15, 2048. DPL used the proceeds to repay indebtedness and for general corporate purposes.
GAAP/Adjusted (non-GAAP) Operating Earnings Reconciliation
Adjusted (non-GAAP) Operating Earnings for the second quarter of 2018 do not include the following items (after tax) that were included in reported GAAP Net Income:
|
(in millions) |
ExelonEarningsperDilutedShare |
Exelon |
ComEd |
PECO | BGE | PHI | Generation | |||||||||||||||||
|
2018 GAAP Net Income |
$ |
0.56 |
$ |
539 |
$ |
164 |
$ | 96 | $ | 51 | $ | 84 | $ | 178 | ||||||||||
|
Mark-to-Market Impact of Economic Hedging Activities (net of taxes of $23) |
(0.07 |
) |
(67 |
) |
— |
— |
— |
— |
(67 |
) |
||||||||||||||
| Unrealized Losses Related to Nuclear Decommissioning Trust (NDT) Fund Investments (net of taxes of $77) |
0.08 |
81 |
— |
— |
|
— |
— |
|
81 |
|||||||||||||||
| Merger and Integration Costs (net of taxes of $0) |
— |
1 |
— |
— |
— |
— |
1 |
|||||||||||||||||
| Long-Lived Asset Impairments (net of taxes of $11) |
0.03 |
30 |
— |
— |
— |
— |
30 |
|||||||||||||||||
| Plant Retirements and Divestitures (net of taxes of $47) |
0.14 |
127 |
— |
— |
— |
— |
127 |
|||||||||||||||||
|
Cost Management Program (net of taxes of $4, $0, $0, $0 and $4, respectively) |
0.01 | 12 | — | 1 | 1 | 1 | 9 | |||||||||||||||||
| Change in Environmental Liabilities (net of taxes of $2) |
0.01 |
5 |
— |
— |
— |
— |
5 |
|||||||||||||||||
|
Reassessment of Deferred Income Taxes (entire amount represents tax expense) |
(0.01 | ) | (8 | ) | — | — | — | 1 | 1 | |||||||||||||||
|
Noncontrolling Interests (net of taxes of $7) |
(0.04 |
) |
(34 |
) |
— |
— |
— |
— |
(34 |
) |
||||||||||||||
|
2018 Adjusted (non-GAAP) Operating Earnings |
$ |
0.71 |
$ |
686 |
$ |
164 |
$ |
97 |
$ |
52 |
$ |
86 |
$ |
331 |
||||||||||
Adjusted (non-GAAP) Operating Earnings for the second quarter of 2017 do not include the following items (after tax) that were included in reported GAAP Net Income:
|
(in millions) |
ExelonEarningsperDilutedShare |
Exelon |
ComEd |
PECO |
BGE |
PHI |
Generation |
||||||||||||||||||
|
2017 GAAP Net Income1 |
$ |
0.10 |
$ |
95 |
$ |
118 |
$ |
88 |
$ |
45 |
$ |
66 |
$ |
(235 |
) |
||||||||||
|
Mark-to-Market Impact of Economic Hedging Activities (net of taxes of $72 and $71, respectively) |
0.12 |
113 |
— |
— |
— |
— |
114 |
|
|||||||||||||||||
|
Unrealized Gains Related to NDT Fund Investments (net of taxes of $20) |
(0.05 |
) |
(45 |
) |
— |
— |
— |
— |
(45 |
) |
|||||||||||||||
|
Amortization of Commodity Contract Intangibles (net of taxes of $8) |
0.01 |
12 |
— |
— |
— |
— |
12 |
||||||||||||||||||
|
Merger and Integrations Costs (net of taxes of $9, $1 and $7, respectively) |
0.02 |
15 |
— |
— |
— |
1 |
12 |
||||||||||||||||||
|
Merger Commitments (net of taxes of $3) |
— |
— |
— |
— |
— |
(4 |
) |
— |
|||||||||||||||||
| Long-Lived Asset Impairments (net of taxes of $172 and $171, respectively) |
0.29 |
268 |
— |
— |
— |
— |
269 |
||||||||||||||||||
| Plant Retirements and Divestitures (net of taxes of $42) |
0.07 |
66 |
— |
— |
— |
— |
66 |
||||||||||||||||||
| Cost Management Program (net of taxes of $4, $1, $1 and $3, respectively) |
0.01 |
6 |
— |
1 |
1 |
— |
4 |
||||||||||||||||||
| Like-Kind Exchange Tax Position (net of taxes of $66 and $9, respectively) |
(0.03 |
) |
(26 |
) |
23 |
— |
— |
— |
— |
||||||||||||||||
|
Noncontrolling Interests (net of taxes of $5) |
0.02 |
20 |
— |
— |
— |
— |
20 |
||||||||||||||||||
|
2017 Adjusted (non-GAAP) Operating Earnings |
$ |
0.56 |
$ |
524 |
$ |
141 |
$ |
89 |
$ |
46 |
$ |
63 |
$ |
217 |
|||||||||||
|
(1) Certain immaterial prior year amounts in the Registrants' Consolidated Statements of Operations and Comprehensive Income have been recasted to reflect new accounting standards issued by the FASB and adopted as of January 1, 2018. |
Note:
Unless otherwise noted, the income tax impact of each reconciling item between GAAP Net Income and Adjusted (non-GAAP) Operating Earnings is based on the marginal statutory federal and state income tax rates for each Registrant, taking into account whether the income or expense item is taxable or deductible, respectively, in whole or in part. For all items except the unrealized gains and losses related to NDT fund investments, the marginal statutory income tax rates for 2018 and 2017 ranged from 26.0 percent to 29.0 percent and 39.0 percent to 41.0 percent, respectively. Under IRS regulations, NDT fund investment returns are taxed at different rates for investments if they are in qualified or non-qualified funds. The effective tax rates for the unrealized gains and losses related to NDT fund investments were 48.9 percent and 31.4 percent for the three months ended June 30, 2018 and 2017, respectively.
Webcast Information
Exelon will discuss second quarter 2018 earnings in a one-hour conference call scheduled for today at 9 a.m. Central Time (10 a.m. Eastern Time). The webcast and associated materials can be accessed at www.exeloncorp.com/investor-relations.
About Exelon
Exelon Corporation (NYSE: EXC) is a Fortune 100 energy company with the largest number of utility customers in the U.S. Exelon does business in 48 states, the District of Columbia and Canada and had 2017 revenue of $33.5 billion. Exelon’s six utilities deliver electricity and natural gas to approximately 10 million customers in Delaware, the District of Columbia, Illinois, Maryland, New Jersey and Pennsylvania through its Atlantic City Electric, BGE, ComEd, Delmarva Power, PECO and Pepco subsidiaries. Exelon is one of the largest competitive U.S. power generators, with more than 32,700 megawatts of nuclear, gas, wind, solar and hydroelectric generating capacity comprising one of the nation’s cleanest and lowest-cost power generation fleets. The company’s Constellation business unit provides energy products and services to approximately 2 million residential, public sector and business customers, including more than two-thirds of the Fortune 100. Follow Exelon on Twitter @Exelon.
Non-GAAP Financial Measures
In addition to net income as determined under generally accepted accounting principles in the United States (GAAP), Exelon evaluates its operating performance using the measure of Adjusted (non-GAAP) Operating Earnings because management believes it represents earnings directly related to the ongoing operations of the business. Adjusted (non-GAAP) Operating Earnings exclude certain costs, expenses, gains and losses and other specified items. This measure is intended to enhance an investor’s overall understanding of period over period operating results and provide an indication of Exelon’s baseline operating performance excluding items that are considered by management to be not directly related to the ongoing operations of the business. In addition, this measure is among the primary indicators management uses as a basis for evaluating performance, allocating resources, setting incentive compensation targets and planning and forecasting of future periods. Adjusted (non-GAAP) Operating Earnings is not a presentation defined under GAAP and may not be comparable to other companies’ presentation. The Company has provided the non-GAAP financial measure as supplemental information and in addition to the financial measures that are calculated and presented in accordance with GAAP. Adjusted (non-GAAP) Operating Earnings should not be deemed more useful than, a substitute for, or an alternative to the most comparable GAAP Net Income measures provided in this earnings release and attachments. This press release and earnings release attachments provide reconciliations of adjusted (non-GAAP) Operating Earnings to the most directly comparable financial measures calculated and presented in accordance with GAAP, are posted on Exelon’s website: www.exeloncorp.com, and have been furnished to the Securities and Exchange Commission on Form 8-K on August 2, 2018.
Cautionary Statements Regarding Forward-Looking Information
This press release contains certain forward-looking statements within the meaning of the Private Securities Litigation Reform Act of 1995 that are subject to risks and uncertainties. The factors that could cause actual results to differ materially from the forward-looking statements made by the Registrants include those factors discussed herein, as well as the items discussed in (1) the Registrants' 2017 Annual Report on Form 10-K in (a) ITEM 1A. Risk Factors, (b) ITEM 7. Management’s Discussion and Analysis of Financial Condition and Results of Operations and (c) ITEM 8. Financial Statements and Supplementary Data: Note 23, Commitments and Contingencies; (2) the Registrants' Second Quarter 2018 Quarterly Report on Form 10-Q (to be filed on August 2, 2018) in (a) Part II, Other Information, ITEM 1A. Risk Factors; (b) Part 1, Financial Information, ITEM 2. Management’s Discussion and Analysis of Financial Condition and Results of Operations and (c) Part I, Financial Information, ITEM 1. Financial Statements: Note 17, Commitments and Contingencies; and (3) other factors discussed in filings with the SEC by the Registrants. Readers are cautioned not to place undue reliance on these forward-looking statements, which apply only as of the date of this press release. None of the Registrants undertakes any obligation to publicly release any revision to its forward-looking statements to reflect events or circumstances after the date of this press release.
|
EXELON CORPORATION |
||||||||||||||||||||
|
GAAP Consolidated Statements of Operations and |
||||||||||||||||||||
|
Adjusted (non-GAAP) Operating Earnings Reconciling Adjustments |
||||||||||||||||||||
|
(unaudited) |
||||||||||||||||||||
|
(in millions, except per share data) |
||||||||||||||||||||
|
Three Months EndedJune 30, 2018 |
Three Months EndedJune 30, 2017 (a) |
|||||||||||||||||||
| GAAP (b) |
Non-GAAPAdjustments |
GAAP (b) |
Non-GAAPAdjustments |
|||||||||||||||||
| Operating revenues | $ | 8,076 | $ | 5 | (c) | $ | 7,665 | $ | 158 | (c),(e) | ||||||||||
| Operating expenses | ||||||||||||||||||||
| Purchased power and fuel | 3,315 | 76 | (c),(i) | 3,086 | (48 | ) | (c),(e) | |||||||||||||
| Operating and maintenance | 2,307 | (68 | ) | (f),(h),(i),(j),(k) | 2,945 | (524 | ) | (f),(g),(h),(i),(j) | ||||||||||||
| Depreciation and amortization | 1,088 | (152 | ) | (i) | 915 | (35 | ) | (i) | ||||||||||||
| Taxes other than income | 428 | — | 420 | — | ||||||||||||||||
| Total operating expenses | 7,138 | 7,366 | ||||||||||||||||||
| Gain on sales of assets and businesses | 4 | (1 | ) | (i) | 1 | — | ||||||||||||||
| Operating income | 942 | 300 | ||||||||||||||||||
| Other income and (deductions) | ||||||||||||||||||||
| Interest expense, net | (373 | ) | — | (436 | ) | 63 | (h),(m) | |||||||||||||
| Other, net | 44 | 158 | (d) | 177 | (66 | ) | (d),(m) | |||||||||||||
| Total other income and (deductions) | (329 | ) | (259 | ) | ||||||||||||||||
| Income before income taxes | 613 | 41 | ||||||||||||||||||
| Income taxes | 66 | 126 | (c),(d),(h),(i),(j),(k),(l) | (62 | ) | 353 | (c),(d),(e),(f),(g),(h),(i),(j),(m) | |||||||||||||
| Equity in losses of unconsolidated affiliates | (5 | ) | — | (9 | ) | — | ||||||||||||||
| Net income | 542 | 94 | ||||||||||||||||||
| Net income (loss) attributable to noncontrolling interests | 3 | 33 | (n) | (1 | ) | (20 | ) | (n) | ||||||||||||
| Net income attributable to common shareholders | $ | 539 | $ | 95 | ||||||||||||||||
| Effective tax rate(o) | 10.8 | % | (151.2 | )% | ||||||||||||||||
| Earnings per average common share | ||||||||||||||||||||
| Basic | $ | 0.56 | $ | 0.10 | ||||||||||||||||
| Diluted | $ | 0.56 | $ | 0.10 | ||||||||||||||||
| Average common shares outstanding | ||||||||||||||||||||
| Basic | 967 | 934 | ||||||||||||||||||
| Diluted | 969 | 936 | ||||||||||||||||||
| Effect of adjustments on earnings per average diluted common share recorded in accordance with GAAP: | ||||||||||||||||||||
| Mark-to-market impact of economic hedging activities (c) | $ | (0.07 | ) | $ | 0.12 | |||||||||||||||
| Unrealized gains (losses) related to NDT fund investments (d) | 0.08 | (0.05 | ) | |||||||||||||||||
|
Amortization of commodity contract intangibles (e) |
— | 0.01 | ||||||||||||||||||
| Merger and integration costs (f) | — | 0.02 | ||||||||||||||||||
| Merger commitments (g) | — | — | ||||||||||||||||||
| Long-lived asset impairments (h) | 0.03 | 0.29 | ||||||||||||||||||
| Plant retirements and divestitures (i) | 0.14 | 0.07 | ||||||||||||||||||
| Cost management program (j) | 0.01 | 0.01 | ||||||||||||||||||
| Change in environmental liabilities (k) | 0.01 | — | ||||||||||||||||||
| Reassessment of deferred income taxes (l) | (0.01 | ) | — | |||||||||||||||||
| Like-kind exchange tax position (m) | — | (0.03 | ) | |||||||||||||||||
| Noncontrolling interests (n) | (0.04 | ) | 0.02 | |||||||||||||||||
| Total adjustments | $ | 0.15 | $ | 0.46 | ||||||||||||||||
| (a) | Certain immaterial prior year amounts in the Registrants' Consolidated Statements of Operations and Comprehensive Income have been recasted to reflect new accounting standards issued by the FASB and adopted as of January 1, 2018. | |
| (b) | Results reported in accordance with accounting principles generally accepted in the United States (GAAP). | |
| (c) | Adjustment to exclude the mark-to-market impact of Exelon’s economic hedging activities, net of intercompany eliminations. | |
| (d) | Adjustment to exclude the impact of net unrealized gains and losses on Generation’s NDT fund investments for Non-Regulatory and Regulatory Agreement Units. The impacts of the Regulatory Agreement Units, including the associated income taxes, are contractually eliminated, resulting in no earnings impact. | |
| (e) | Adjustment to exclude the non-cash amortization of intangible assets, net, primarily related to commodity contracts recorded at fair value related to the ConEdison Solutions and FitzPatrick acquisitions. | |
| (f) | Adjustment to exclude certain costs associated with mergers and acquisitions, including, if and when applicable, professional fees, employee-related expenses and integration activities. In 2017, reflects costs related to the PHI and FitzPatrick acquisitions, and in 2018, reflects costs related to the PHI acquisition. | |
| (g) | Adjustment to exclude costs incurred as part of the settlement orders approving the PHI acquisition. | |
| (h) | Adjustment to exclude charges to earnings related to the impairment of the ExGen Texas Power, LLC (EGTP) assets held for sale in 2017, and in 2018 the impairment of certain wind projects at Generation. | |
| (i) | Adjustment to exclude, in 2017, primarily reflects accelerated depreciation and amortization expenses and one-time charges associated with Generation's decision to early retire the Three Mile Island nuclear facility. In 2018, primarily reflects accelerated depreciation and amortization expense associated with Generation's decision to early retire the Oyster Creek and Three Mile Island nuclear facilities and a loss associated with Generation's sale of Residential Solar Holding, LLC, partially offset by a gain associated with Generation's sale of its electrical contracting business. | |
| (j) | Adjustment to exclude severance and reorganization costs related to a cost management program. | |
| (k) | Adjustment to exclude charges to adjust the environmental reserve associated with Cotter. | |
| (l) | Adjustment to exclude an adjustment to the remeasurement of deferred income taxes as a result of the Tax Cuts and Jobs Act (TCJA). | |
| (m) | Adjustment to exclude adjustments to income tax, penalties and interest expenses in the second quarter of 2017 as a result of the finalization of the IRS tax computation related to Exelon's like-kind exchange tax position. | |
| (n) | Adjustment to exclude elimination from Generation’s results of the noncontrolling interest related to certain exclusion items, primarily related to the impact of unrealized gains and losses on NDT fund investments at CENG. | |
| (o) | The effective tax rate related to Adjusted (non-GAAP) Operating Earnings is 20.9% and 36.2% for the three months ended June 30, 2018 and June 30, 2017, respectively. | |
|
EXELON CORPORATION |
||||||||||||||||||||
|
GAAP Consolidated Statements of Operations and |
||||||||||||||||||||
|
Adjusted (non-GAAP) Operating Earnings Reconciling Adjustments |
||||||||||||||||||||
|
(unaudited) |
||||||||||||||||||||
|
(in millions, except per share data) |
||||||||||||||||||||
| Six Months Ended June 30, 2018 | Six Months Ended June 30, 2017 (a) | |||||||||||||||||||
| GAAP (b) |
Non-GAAPAdjustments |
GAAP (b) |
Non-GAAPAdjustments |
|||||||||||||||||
| Operating revenues | $ | 17,769 | $ | 102 | (c) | $ | 16,413 | $ | 116 | (c),(e) | ||||||||||
| Operating expenses | ||||||||||||||||||||
| Purchased power and fuel | 8,042 | (107 | ) | (c),(i) | 6,985 | (141 | ) | (c),(e),(i) | ||||||||||||
| Operating and maintenance | 4,691 | (104 | ) | (f),(h),(i),(j),(l) | 5,383 | (572 | ) | (f),(g),(h),(i),(j) | ||||||||||||
| Depreciation and amortization | 2,179 | (289 | ) | (i) | 1,811 | (37 | ) | (e),(i) | ||||||||||||
| Taxes other than income | 874 | — | 857 | — | ||||||||||||||||
| Total operating expenses | 15,786 | 15,036 | ||||||||||||||||||
| Gain on sales of assets and businesses | 60 | (54 | ) | (i) | 5 | (1 | ) | (i) | ||||||||||||
| Bargain purchase gain | — | — | 226 | (226 | ) |
(k) |
||||||||||||||
| Operating income | 2,043 | 1,608 | ||||||||||||||||||
| Other income and (deductions) | ||||||||||||||||||||
| Interest expense, net | (745 | ) | — | (809 | ) | 59 |
(h),(o),(m) |
|||||||||||||
| Other, net | 17 | 269 | (d) | 434 | (274 | ) | (d),(m) | |||||||||||||
| Total other income and (deductions) | (728 | ) | (375 | ) | ||||||||||||||||
| Income before income taxes | 1,315 | 1,233 | ||||||||||||||||||
| Income taxes | 125 | 274 |
(c),(d),(f),(h),(i),(j),(l),(n) |
149 | 441 | (c),(d),(e),(f),(g),(h),(i),(j),(m),(n),(o) | ||||||||||||||
| Equity in losses of unconsolidated affiliates | (11 | ) | — | (18 | ) | — | ||||||||||||||
| Net income | 1,179 | 1,066 | ||||||||||||||||||
| Net income (loss) attributable to noncontrolling interests | 54 | 57 | (p) | (20 | ) | (55 | ) | (p) | ||||||||||||
| Net income attributable to common shareholders | $ | 1,125 | $ | 1,086 | ||||||||||||||||
| Effective tax rate(q) | 9.5 | % | 12.1 | % | ||||||||||||||||
| Earnings per average common share | ||||||||||||||||||||
| Basic | $ | 1.16 | $ | 1.17 | ||||||||||||||||
| Diluted | $ | 1.16 | $ | 1.17 | ||||||||||||||||
| Average common shares outstanding | ||||||||||||||||||||
| Basic | 967 | 931 | ||||||||||||||||||
| Diluted | 968 | 932 | ||||||||||||||||||
| Effect of adjustments on earnings per average diluted common share recorded in accordance with GAAP: | ||||||||||||||||||||
| Mark-to-market impact of economic hedging activities (c) | $ | 0.13 | $ | 0.15 | ||||||||||||||||
| Unrealized gains (losses) related to NDT fund investments (d) | 0.15 | (0.15 | ) | |||||||||||||||||
| Amortization of commodity contract intangibles (e) | — | 0.02 | ||||||||||||||||||
| Merger and integration costs (f) | — | 0.04 | ||||||||||||||||||
| Merger commitments (g) | — | (0.15 | ) | |||||||||||||||||
| Long-lived asset impairments (h) | 0.03 | 0.29 | ||||||||||||||||||
| Plant retirements and divestitures (i) | 0.23 | 0.07 | ||||||||||||||||||
| Cost management program (j) | 0.02 | 0.01 | ||||||||||||||||||
| Bargain purchase gain (k) | — | (0.24 | ) | |||||||||||||||||
| Change in environmental liabilities (l) | 0.01 | — | ||||||||||||||||||
| Like-kind exchange tax position (m) | — | (0.03 | ) | |||||||||||||||||
| Reassessment of deferred income taxes (n) | (0.01 | ) | (0.02 | ) | ||||||||||||||||
| Tax settlements (o) | — | (0.01 | ) | |||||||||||||||||
| Noncontrolling interests (p) | (0.06 | ) | 0.06 | |||||||||||||||||
| Total adjustments | $ | 0.50 | $ | 0.04 | ||||||||||||||||
| (a) | Certain immaterial prior year amounts in the Registrants' Consolidated Statements of Operations and Comprehensive Income have been recasted to reflect new accounting standards issued by the FASB and adopted as of January 1, 2018. | |
| (b) | Results reported in accordance with accounting principles generally accepted in the United States (GAAP). | |
| (c) | Adjustment to exclude the mark-to-market impact of Exelon’s economic hedging activities, net of intercompany eliminations. | |
| (d) | Adjustment to exclude the impact of net unrealized gains and losses on Generation’s NDT fund investments for Non-Regulatory and Regulatory Agreement Units. The impacts of the Regulatory Agreement Units, including the associated income taxes, are contractually eliminated, resulting in no earnings impact. | |
| (e) | Adjustment to exclude the non-cash amortization of intangible assets, net, primarily related to commodity contracts recorded at fair value related to the ConEdison Solutions and FitzPatrick acquisitions. | |
| (f) | Adjustment to exclude certain costs associated with mergers and acquisitions, including, if and when applicable, professional fees, employee-related expenses and integration activities. In 2017, reflects costs related to the PHI and FitzPatrick acquisitions, offset at PHI by the anticipated recovery of previously incurred PHI acquisition costs, and in 2018, reflects costs related to the PHI acquisition. | |
| (g) | Adjustment to exclude a decrease in reserves for uncertain tax positions related to the deductibility of certain merger commitments associated with the 2012 CEG and 2016 PHI acquisitions. | |
| (h) | Adjustment to exclude charges to earnings related to the impairment of the ExGen Texas Power, LLC (EGTP) assets held for sale in 2017, and in 2018 the impairment of certain wind projects at Generation. | |
| (i) | Adjustment to exclude accelerated depreciation and amortization expenses and one-time charges associated with Generation's decision to early retire the Three Mile Island nuclear facility in 2017. In 2018, primarily reflects accelerated depreciation and amortization expenses and one-time charges associated with Generation's decision to early retire the Oyster Creek nuclear facility, as well as accelerated depreciation and amortization expenses associated with the 2017 decision to early retire the Three Mile Island nuclear facility and a loss associated with Generation's sale of Residential Solar Holding, LLC, partially offset by a gain associated with Generation's sale of its electrical contracting business. | |
| (j) | Adjustment to exclude severance and reorganization costs related to a cost management program. | |
| (k) | Adjustment to exclude the excess of the fair value of assets and liabilities acquired over the purchase price for the FitzPatrick acquisition. | |
| (l) | Adjustment to exclude charges to adjust the environmental reserve associated with Cotter. | |
| (m) | Adjustment to exclude adjustments to income tax, penalties and interest expenses in the second quarter of 2017 as a result of the finalization of the IRS tax computation related to Exelon’s like-kind exchange tax position. | |
| (n) | Adjustment to exclude the change in the District of Columbia statutory tax rate in 2017, and in 2018, an adjustment to the remeasurement of deferred income taxes as a result of the Tax Cuts and Jobs Act (TCJA). | |
| (o) | Adjustment to exclude benefits related to the favorable settlement in 2017 of certain income tax positions related to PHI's unregulated business interests. | |
| (p) | Adjustment to exclude elimination from Generation’s results of the noncontrolling interest related to certain exclusion items, primarily related to the impact of unrealized gains and losses on NDT fund investments at CENG. | |
| (q) | The effective tax rate related to Adjusted (non-GAAP) Operating Earnings is 18.7% and 35.6% for the six months ended June 30, 2018 and June 30, 2017, respectively. |
View source version on businesswire.com: https://www.businesswire.com/news/home/20180802005359/en/
Exelon Corporation
Dan Eggers, 312-394-2345
Investor Relations
or
Paul
Adams, 410-470-4167
Corporate Communications
Source: Exelon Corporation