Form 8-K BOK FINANCIAL CORP ET For: Jul 25
UNITED STATES
SECURITIES AND EXCHANGE COMMISSION
Washington, DC 20549
FORM 8-K
CURRENT REPORT
Pursuant to Section 13 or 15(d) of the Securities Exchange Act of 1934
Date of Report (Date of earliest event reported):
July 25, 2018
Commission File No. 0-19341
BOK FINANCIAL CORPORATION
(Exact name of registrant as specified in its charter)
Oklahoma | 73-1373454 | |
(State or other jurisdiction of Incorporation or Organization) | (IRS Employer Identification No.) | |
Bank of Oklahoma Tower | ||
Boston Avenue at Second Street | ||
Tulsa, Oklahoma | 74192 | |
(Address of Principal Executive Offices) | (Zip Code) | |
(918) 588-6000
(Registrant’s telephone number, including area code)
N/A
___________________________________________
(Former name or former address, if changes since last report)
Check the appropriate box below if the Form 8-K filing is intended to simultaneously satisfy the filing obligation of the registrant under any of the following provisions:
|_| Written communications pursuant to Rule 425 under the Securities Act (17 CFR 230.425).
|_| Soliciting material pursuant to Rule 14a-12 under the Exchange Act (17 CFR 240.14a-12).
|_| Pre-commencement communications pursuant to Rule 14d-2(b) under the Exchange Act (17 CFR 240.14d-2(b)).
|_| Pre-commencement communications pursuant to Rule 13e-4(c) under the Exchange Act (17 CFR 240.13e-4(c)).
Indicate by check mark whether the registrant is an emerging growth company as defined in Rule 405 of the Securities Act of 1933 (§230.405 of this chapter) or Rule 12b-2 of the Securities Exchange Act of 1934 (§240.12b-2 of this chapter).
¨ Emerging growth company
If an emerging growth company, indicate by check mark if the registrant has elected not to use the extended transition period for complying with any new or revised financial accounting standards provided pursuant to Section 13(a) of the Exchange Act. ¨
INFORMATION TO BE INCLUDED IN THE REPORT
ITEM 7.01. Regulation FD Disclosure.
On July 25, 2018, in connection with issuance of the Press Release, BOK Financial released financial information related to the three and six months ended June 30, 2018 (“Financial Information”), which includes certain historical financial information relating to BOK Financial. The Financial Information is attached as Exhibit 99(a) to this report and is incorporated herein by reference.
ITEM 9.01. Financial Statements and Exhibits.
(a) | Exhibits |
99 |
Signature
Pursuant to the requirements of the Securities Exchange Act of 1934, the registrant has duly caused this report to be signed on its behalf by the undersigned hereunto duly authorized.
BOK FINANCIAL CORPORATION
By: /s/ Steven E. Nell
Steven E. Nell
Executive Vice President
Chief Financial Officer
Date: July 25, 2018

Second Quarter 2018 Earnings Conference Call July 25, 2018 1

Legal Disclaimers FORWARD LOOKING STATEMENTS This communication contains forward-looking statements within the meaning of the Private Securities Litigation Reform Act of 1995 including, but not limited to, CoBiz Financial Inc.’s and BOK Financial Corporation’s expectations or predictions of future financial or business performance or conditions. Forward-looking statements are typically identified by words such as “believe,” “expect,” “anticipate,” “intend,” “target,” “estimate,” “continue,” “positions,” “plan,” “predict,” “project,” “forecast,” “guidance,” “goal,” “objective,” “prospects,” “possible” or “potential,” by future conditional verbs such as “assume,” “will,” “would,” “should,” “could” or “may”, or by variations of such words or by similar expressions. These forward-looking statements are subject to numerous assumptions, risks and uncertainties, which change over time. Forward-looking statements speak only as of the date they are made and we assume no duty to update forward-looking statements. Actual results may differ materially from current projections. In addition to factors previously disclosed in CoBiz Financial Inc.’s and BOK Financial Corporation’s reports filed with the SEC and those identified elsewhere in this communication, the following factors, among others, could cause actual results to differ materially from forward-looking statements or historical performance: the ability to obtain regulatory approvals and meet other closing conditions to the merger, including approval by CoBiz Financial Inc.’s shareholders on the expected terms and schedule, including the risk that regulatory approvals required for the merger are not obtained or are obtained subject to conditions that are not anticipated; delay in closing the merger; difficulties and delays in integrating CoBiz Financial Inc.’s business or fully realizing cost savings and other benefits; business disruption following the merger; changes in asset quality and credit risk; the inability to sustain revenue and earnings growth; changes in interest rates and capital markets; inflation; customer acceptance of BOK Financial Corporation’s products and services; customer borrowing, repayment, investment and deposit practices; customer disintermediation; the introduction, withdrawal, success and timing of business initiatives; competitive conditions; the inability to realize cost savings or revenues or to implement integration plans and other consequences associated with mergers, acquisitions and divestitures; economic conditions; and the impact, extent and timing of technological changes, capital management activities, and other actions of the Federal Reserve Board and legislative and regulatory actions and reforms. Annualized, pro forma, projected and estimated numbers are used for illustrative purpose only, are not forecasts and may not reflect actual results. IMPORTANT ADDITIONAL INFORMATION AND WHERE TO FIND IT In connection with the proposed merger, BOK Financial Corporation has filed with the SEC a Registration Statement on Form S-4 that will include the Proxy Statement of CoBiz Financial Inc. and a Prospectus of BOK Financial Corporation, as well as other relevant documents concerning the proposed transaction. This communication does not constitute an offer to sell or the solicitation of an offer to buy any securities or a solicitation of any vote or approval. INVESTORS AND SHAREHOLDERS ARE URGED TO READ THE REGISTRATION STATEMENT AND THE PROXY STATEMENT/PROSPECTUS REGARDING THE MERGER E AND ANY OTHER RELEVANT DOCUMENTS FILED WITH THE SEC, AS WELL AS ANY AMENDMENTS OR SUPPLEMENTS TO THOSE DOCUMENTS, BECAUSE THEY WILL CONTAIN IMPORTANT INFORMATION. A free copy of the Proxy Statement/Prospectus, as well as other filings containing information about BOK Financial Corporation and CoBiz Financial Inc., may be obtained at the SEC’s Internet site (http://www.sec.gov). You will also be able to obtain these documents, free of charge, from CoBiz Financial Inc. at ir.cobizfinancial.com or from BOK Financial Corporation by accessing BOK Financial Corporation’s website at www.bokf.com. Copies of the Proxy Statement/Prospectus can also be obtained, free of charge, by directing a request to CoBiz Financial Inc. Investor Relations at CoBiz Financial Inc. Investor Relations, 1401 Lawrence Street, Suite 1200, Denver, CO, by calling (303) 312-3412, or by sending an e-mail to [email protected] or to BOK Financial Corporation Investor Relations at Bank of Oklahoma Tower, Boston Avenue at Second Street, Tulsa, Oklahoma, by calling (918) 588-6000 or by sending an e-mail to [email protected]. CoBiz Financial Inc. and BOK Financial Corporation and certain of their respective directors and executive officers may be deemed to be participants in the solicitation of proxies from the shareholders of CoBiz Financial Inc. in respect of the transaction described in the Proxy Statement/Prospectus. Information regarding CoBiz Financial Inc.’s directors and executive officers is contained in CoBiz Financial Inc.’s Annual Report on Form 10-K for the year ended December 31, 2017 and its Proxy Statement on Schedule 14A, dated March 9, 2018, which are filed with the SEC. Information regarding BOK Financial Corporation’s directors and executive officers is contained in BOK Financial Corporation’s Annual Report on Form 10-K for the year ended December 31, 2017 and its Proxy Statement on Schedule 14A, dated March 15, 2018, which are filed with the SEC. Additional information regarding the interests of those participants and other persons who may be deemed participants in the transaction may be obtained by reading the Proxy Statement/Prospectus regarding the proposed merger when it becomes available. Free copies of this document may be obtained as described in the preceding paragraph. 2

Steven G. Bradshaw Chief Executive Officer 3

Second Quarter Summary: Net Income $114.4 $105.6 Q2 2018 Q1 2018 Q2 2017 $85.6 $88.1 Diluted EPS $1.75 $1.61 $1.35 $72.5 $1.75 $1.61 Net income before $148.5 $136.3 $136.6 $1.35 $1.31 $1.11 taxes ($M) Net income $114.4 $105.6 $88.1 attributable to BOKF shareholders ($M) 2Q17 3Q17 4Q17 1Q18 2Q18 Net income attributable to shareholders Net income per share - diluted Noteworthy items impacting Q2 profitability: • Strongest quarterly loan growth in company history • Continued net interest margin expansion • Significant growth in net interest income • Expenses relatively flat from Q1 despite revenue increase • Strong credit quality and no loan loss provision Q2 2018: New quarterly record for pre-tax, pre-provision income Regular quarterly dividend increased 11% to 50 cents per share 4

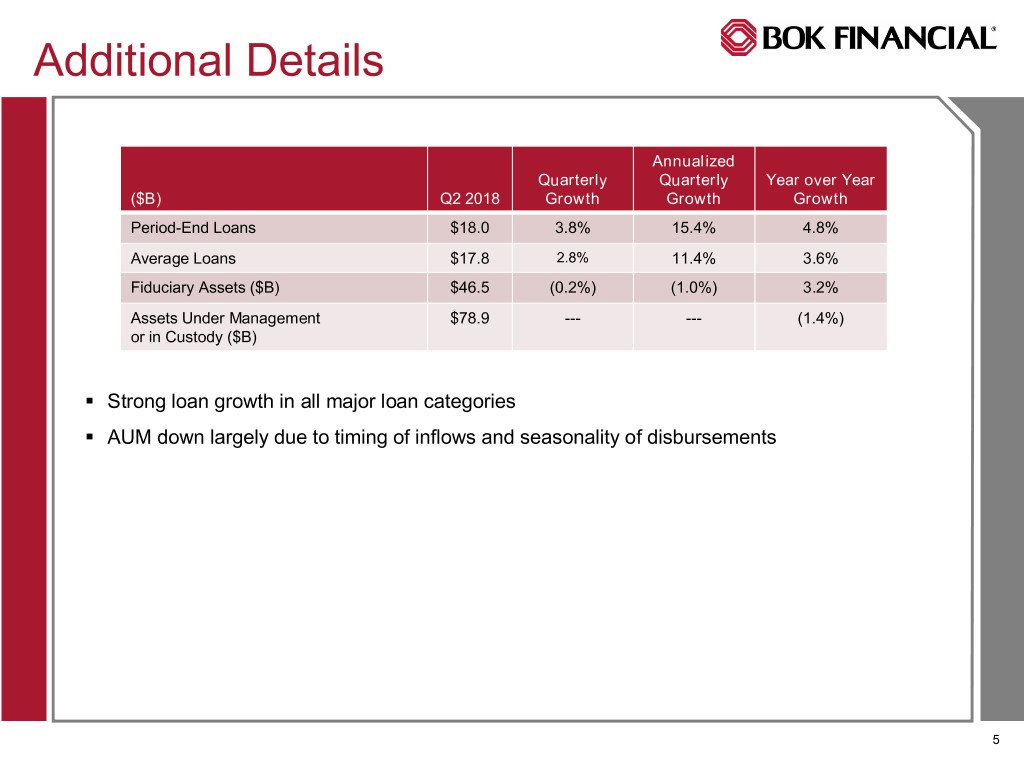
Additional Details Annualized Quarterly Quarterly Year over Year ($B) Q2 2018 Growth Growth Growth Period-End Loans $18.0 3.8% 15.4% 4.8% Average Loans $17.8 2.8% 11.4% 3.6% Fiduciary Assets ($B) $46.5 (0.2%) (1.0%) 3.2% Assets Under Management $78.9 --- --- (1.4%) or in Custody ($B) . Strong loan growth in all major loan categories . AUM down largely due to timing of inflows and seasonality of disbursements 5

Steven Nell Chief Financial Officer Financial Overview 6

Net Interest Revenue Net Interest Margin Q2 Q1 Q4 Q3 Q2 ($mil) 2018 2018 2017 2017 2017 Net Interest Revenue $238.6 $219.7 $216.9 $218.5 $205.2 Provision For Credit Losses $ -- ($5.0) ($7.0) $ -- $ -- Net Interest Revenue After Provision $238.6 $224.7 $223.9 $218.5 $205.2 Net Interest Margin 3.17% 2.99% 2.97% 3.01% 2.89% . Strong loan growth combined with margin expansion drove higher net interest revenue . Continued margin expansion due to lower deposit betas . Unwinding of FHLB/Fed trade positively impacted NIM by 4 basis points . Non-accrual interest recoveries positively impacted NIR by $5.3 million and NIM by 7 basis points . Continued benign credit environment and declines in non-accrual and potential problem loans led to zero provision in Q2 . No provision release in Q2 due to strong loan growth 7

Fees and Commissions Revenue, $mil Change: Quarterly, Quarterly, Trailing Q2 18 Sequential Year over Year 12 Months Brokerage and Trading $26.5 (13.6%) (16.6%) (6.5%) Transaction Card 21.0 (0.1%) 4.8% 3.0% Fiduciary and Asset Management 41.7 (0.3%) (0.3%) 11.4% Deposit Service Charges and Fees 27.8 2.4% (2.1%) 2.6% Mortgage Banking 26.3 1.2% (13.0%) (17.0%) Other Revenue 14.5 17.7% (3.1%) (0.4%) Total Fees and Commissions $157.9 (0.7%) (5.6%) (1.1%) . Brokerage and Trading: Down largely due to mortgage production environment – lower mortgage backed trading activity . Transaction Card: Strong year over year growth due to higher customer count and transaction volume . Fiduciary and Asset Management: Higher professional fees due to seasonal tax revenue, and higher fees on individually managed accounts, offset by lower trust fees . Mortgage Banking: Relatively steady mortgage production volume and higher gain on sale margins drive slight sequential increase in revenue 8

Expenses %Incr. %Incr. ($mil) Q2 2018 Q1 2018 Q2 2017 Seq. YOY Personnel Expense $138.9 $139.9 $143.7 (0.7%) (3.3%) Other Operating Expense $107.5 $104.5 $96.9 2.9% 10.9% Total Operating Expense $246.5 $244.4 $240.7 0.8% 2.4% Efficiency Ratio 61.68% 65.09% 63.66% . Personnel expense down in Q2 due to decrease in stock option compensation expense and lower payroll taxes . Non personnel expense up slightly due to higher professional fees and mortgage-related accruals . $1 million of merger-related expenses in Q2 . Mortgage-related cost actions in Q3 – approximately $3 million annualized expense saves ($700 million severance in Q3) 9

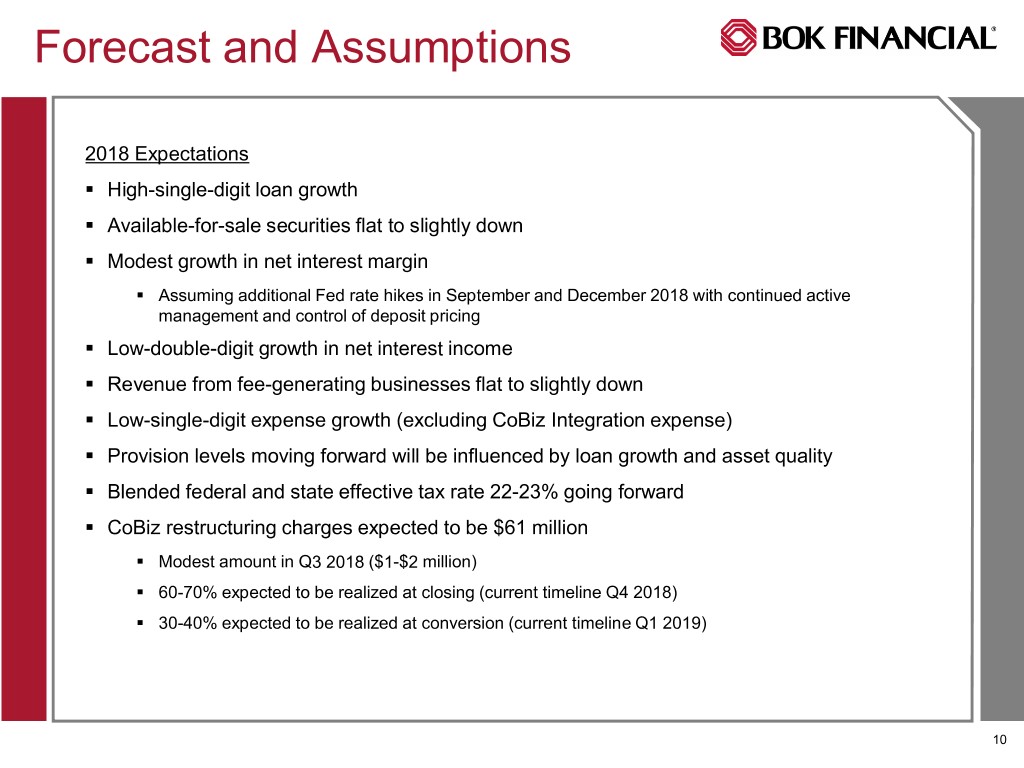
Forecast and Assumptions 2018 Expectations . High-single-digit loan growth . Available-for-sale securities flat to slightly down . Modest growth in net interest margin . Assuming additional Fed rate hikes in September and December 2018 with continued active management and control of deposit pricing . Low-double-digit growth in net interest income . Revenue from fee-generating businesses flat to slightly down . Low-single-digit expense growth (excluding CoBiz Integration expense) . Provision levels moving forward will be influenced by loan growth and asset quality . Blended federal and state effective tax rate 22-23% going forward . CoBiz restructuring charges expected to be $61 million . Modest amount in Q3 2018 ($1-$2 million) . 60-70% expected to be realized at closing (current timeline Q4 2018) . 30-40% expected to be realized at conversion (current timeline Q1 2019) 10

Stacy Kymes EVP-Corporate Banking 11

Loan Portfolio Seq. YOY Jun 30 Mar 31 Jun 30 Loan Loan ($mil) 2018 2018 2017 Growth Growth Energy $3,147.2 $2,969.6 $2,847.2 6.0% 10.5% Services 2,944.5 2,928.3 2,958.8 0.6% (0.5%) Healthcare 2,353.7 2,359.9 2,221.5 (0.3%) 6.0% Wholesale/retail 1,699.6 1,531.6 1,543.7 11.0% 10.1% Manufacturing 647.8 559.7 546.1 15.7% 18.6% Other 556.2 570.6 520.5 (2.5%) 6.9% Total C&I $11,349.0 $10,919.7 $10,638.0 3.9% 6.7% Commercial Real 3,712.2 3,506.8 3,688.6 5.9% 0.6% Estate Residential Mortgage 1,942.3 1,945.8 1,939.2 (0.2%) 0.2% Personal 1,000.2 965.6 917.9 3.6% 9.0% Total Loans $18,003.7 $17,337.9 $17,183.6 3.8% 4.8% . Exceeds $18 billion in loans outstanding for the first time in company history . Strongest dollar volume of loan growth in company history . Strong growth in energy, wholesale/retail, manufacturing, commercial real estate, and personal. 12

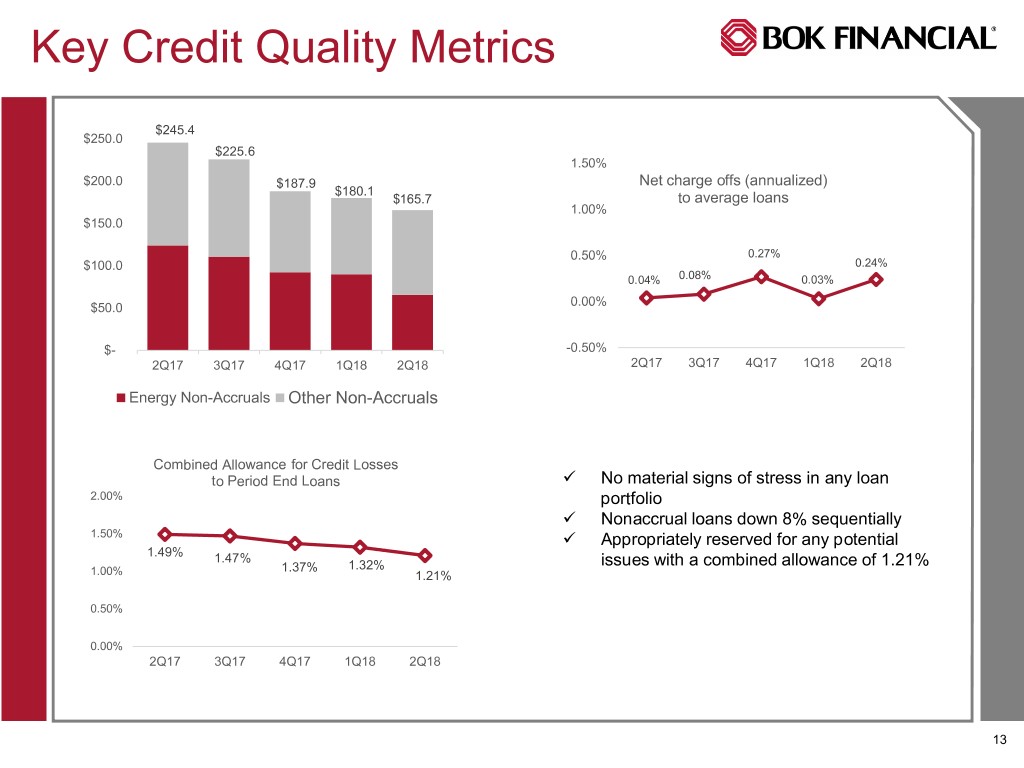
Key Credit Quality Metrics $245.4 $250.0 $225.6 1.50% $200.0 $187.9 Net charge offs (annualized) $180.1 $165.7 to average loans 1.00% $150.0 0.50% 0.27% $100.0 0.24% 0.04% 0.08% 0.03% 0.00% $50.0 $- -0.50% 2Q17 3Q17 4Q17 1Q18 2Q18 2Q17 3Q17 4Q17 1Q18 2Q18 Energy Non-Accruals Other Non-Accruals Combined Allowance for Credit Losses to Period End Loans No material signs of stress in any loan 2.00% portfolio Nonaccrual loans down 8% sequentially 1.50% Appropriately reserved for any potential 1.49% 1.47% 1.37% 1.32% issues with a combined allowance of 1.21% 1.00% 1.21% 0.50% 0.00% 2Q17 3Q17 4Q17 1Q18 2Q18 13

Steven G. Bradshaw Chief Executive Officer Closing Remarks 14

Question and Answer Session 15
