
Form 8-K International Seaways, For: Jun 18
United States
Securities and Exchange Commission
Washington, D.C. 20549
FORM 8-K
CURRENT REPORT
Pursuant to Section 13 OR 15(d) of the
Securities Exchange Act of 1934
June 18, 2018
Date of Report (Date of earliest event reported)
International Seaways, Inc.
(Exact Name of Registrant as Specified in Charter)
1-37836-1
Commission File Number
| Marshall Islands | 98-0467117 | |
| (State or other jurisdiction of incorporation or organization) | (I.R.S. Employer Identification Number) |
600 Third Avenue, 39th Floor
New York, New York 10016
(Address of Principal Executive Offices) (Zip Code)
Registrant's telephone number, including area code (212) 578-1600
Check the appropriate box below if the Form 8-K filing is intended to simultaneously satisfy the filing obligation of the registrant under any of the following provisions:
| ¨ | Written communications pursuant to Rule 425 under the Securities Act (17 CFR 230.425) |
| ¨ | Soliciting material pursuant to Rule 14a-12 under the Exchange Act (17 CFR 240.14a-12) |
| ¨ | Pre-commencement communications pursuant to Rule 14d-2(b) under the Exchange Act (17 CFR 240.14d-2(b)) |
| ¨ | Pre-commencement communications pursuant to Rule 13e-4(c) under the Exchange Act (17 CFR 240.13e-4(c)) |
Indicate by check mark whether the registrant is an emerging growth company as defined in Rule 405 of the Securities Act of 1933 (§230.405 of this chapter) or Rule 12b-2 of the Securities Exchange Act of 1934 (§240.12b-2 of this chapter).
Emerging growth company x
If an emerging growth company, indicate by check mark if the registrant has elected not to use the extended transition period for complying with any new or revised financial accounting standards provided pursuant to Section 13(a) of the Exchange Act. x
Section 7 – Regulation FD
| Item 7.01 | Regulation FD Disclosure. |
International Seaways, Inc. (“INSW” or the “Company”) will present certain information included in the attached presentation (the “Presentation”) to certain investors and analysts in connection with meetings taking place during Marine Money Week 2018, commencing with meetings on June 18, 2018. A copy of the Presentation is attached hereto as Exhibit 99.1.
The information in this Form 8-K provided under Item 7.01 and Exhibit 99.1 attached hereto is being furnished and shall not be “filed” for purposes of Section 18 of the Securities Exchange Act of 1934, as amended (the “Exchange Act”), or otherwise subject to the liability of that section, nor shall such information be deemed to be incorporated by reference into any registration statement of other document filed under the Securities Act of 1933, as amended, or the Exchange Act, except as otherwise stated in that filing.
By filing this Current Report on Form 8-K and furnishing the information contained herein, the Company makes no admission as to the materiality of any information in this report that is required to be disclosed by reason of Regulation FD.
FINANCIAL AND OPERATING DATA
INSW cautions investors and potential investors not to place undue reliance upon the information contained in the Presentation, which was not prepared for the purpose of providing the basis for an investment decision relating to any of the securities of INSW. The Presentation is limited in scope and covers a limited time period. The information in the Presentation was not audited or reviewed by independent accountants and is subject to adjustment and reconciliation. In addition, the Presentation does not necessarily contain all information required in filings pursuant to the Exchange Act, or may present such information differently from such requirements. There can be no assurance that, from the perspective of an investor or potential investor in INSW’s securities, the Presentation is complete. Results set forth in the Presentation should not be viewed as indicative of future results.
The information contained in the Presentation is summary information that is intended to be considered in the context of, and read in conjunction with, the Company's Securities and Exchange Commission (“SEC”) filings and other public announcements that the Company may make, by press release or otherwise, from time to time. The Company does not have, and expressly disclaims, any obligation to publicly update or revise the information contained in this report or any changes in our expectations or any change in events, conditions or circumstances on which any forward-looking statement is based.
Section 9 – Financial Statements and Exhibits
| Item 9.01 | Financial Statements and Exhibits. |
| (d) | Exhibits |
Pursuant to General Instruction B.2 of Form 8-K, the following exhibit is furnished with this Form 8-K.
| Exhibit No. | Description |
| 99.1 | Investor Presentation. |
SIGNATURES
Pursuant to the requirements of the Securities Exchange Act of 1934, the Registrant has duly caused this report to be signed on its behalf by the undersigned hereunto duly authorized.
| INTERNATIONAL SEAWAYS, INC. | |||
| (Registrant) | |||
| Date: June 18, 2018 | By | /s/ James D. Small III | |
|
Name: |
James D. Small III | ||
| Title: | Chief Administrative Officer, Senior Vice President, Secretary and General Counsel | ||
EXHIBIT INDEX
| Exhibit No. | Description |
| 99.1 | Investor Presentation. |
Exhibit 99.1

International Seaways, Inc. 1 International Seaways, Inc. June 2018
International Seaways, Inc. 2 Disclaimer Forward - Looking Statements During the course of this presentation, the Company (International Seaways, Inc. (INSW)) may make forward - looking statements or provide forward - looking information. All statements other than statements of historical facts should be considered forward - looking state ments. Some of these statements include words such as ‘‘outlook,’’ ‘‘believe,’’ ‘‘expect,’’ ‘‘potential,’’ ‘‘continue,’’ ‘‘may,’’ ‘‘will,’’ ‘‘should,’’ ‘‘could,’’ ‘‘seek,’’ ‘‘predict,’’ ‘‘intend,’’ ‘‘plan,’’ ‘‘estimate,’’ ‘‘anticipate,’’ ‘‘target,’’ ‘‘project,’’ ‘‘forecast,’’ ‘‘shall,’’ ‘‘contempl ate ’’ or the negative version of those words or other comparable words. Although they reflect INSW’s current expectations, these statements are not guarantees of future performance, but involve a number of risks, uncertainties, and assumptions which are difficult to predict. Some of the factor s t hat may cause actual outcomes and results to differ materially from those expressed in, or implied by, the forward - looking statements include, but are not necessarily limited to, vessel acquisitions, general economic conditions, competitive pressures, the nature of the Company’s ser vices and their price movements, and the ability to retain key employees. The Company does not undertake to update any forward - looking statement s as a result of future developments, new information or otherwise. Non - GAAP Financial Measures Included in this presentation are certain non - GAAP financial measures, including Time Charter Equivalent (“TCE”) revenue, EBITDA , Adjusted EBITDA, and total leverage ratios, designed to complement the financial information presented in accordance with generally ac cep ted accounting principles in the United States of America because management believes such measures are useful to investors. TCE revenues, w hic h represents shipping revenues less voyage expenses, is a measure to compare revenue generated from a voyage charter to revenue generated fro m a time charter. EBITDA represents net (loss)/income before interest expense, income taxes and depreciation and amortization expense. Ad justed EBITDA consists of EBITDA adjusted for the impact of certain items that we do not consider indicative of our ongoing operating perfo rma nce. Total leverage ratios are calculated as total debt divided by Adjusted EBITDA. We present non - GAAP measures when we believe that the a dditional information is useful and meaningful to investors. Non - GAAP financial measures do not have any standardized meaning and are ther efore unlikely to be comparable to similar measures presented by other companies. The presentation of non - GAAP financial measures is not intend ed to be a substitute for, and should not be considered in isolation from, the financial measures reported in accordance with GAAP. See App endix for a reconciliation of certain non - GAAP measures to the comparable GAAP measures. This presentation also contains estimates and other information concerning our industry that are based on industry publicatio ns, surveys and forecasts. This information involves a number of assumptions and limitations, and we have not independently verified the accu rac y or completeness of the information. Additional Information You should read the Company’s Annual Report on Form 10 - K for the year ended December 31, 2017, the Company’s Quarterly Report on Form 10 - Q for the quarter ended March 31, 2018, and the other documents the Company has filed with the SEC for additional information re garding the Company, its operations and the risks and uncertainties it faces. You may obtain these documents for free by visiting EDGAR o n t he SEC Web site at www.sec.gov , or from the Company’s website at www.intlseas.com.

Company Overview
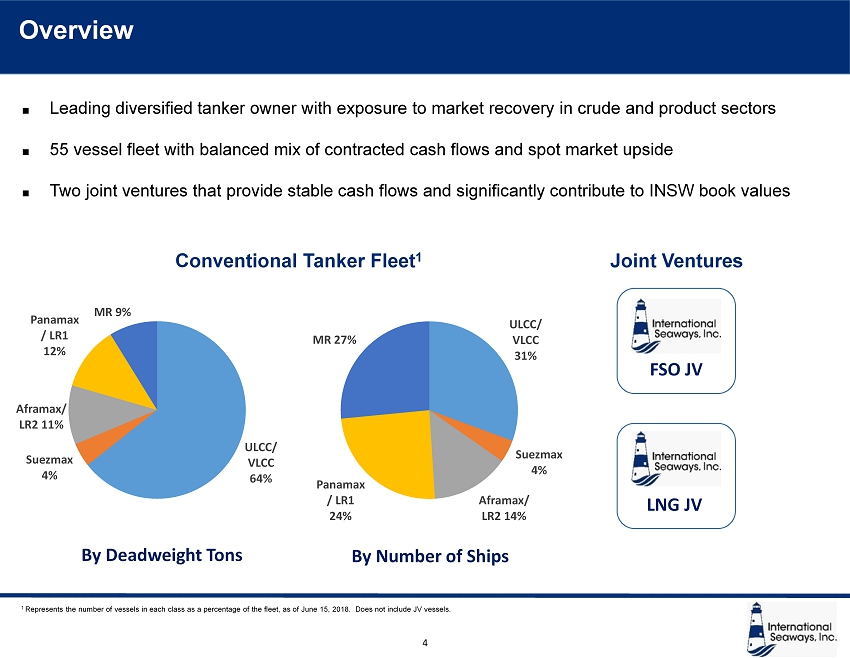
International Seaways, Inc. Overview 4 1 Represents the number of vessels in each class as a percentage of the fleet, as of June 15, 2018. Does not include JV vessel s. Leading diversified tanker owner with exposure to market recovery in crude and product sectors 55 vessel fleet with balanced mix of contracted cash flows and spot market upside Two joint ventures that provide stable cash flows and significantly contribute to INSW book values Conventional Tanker Fleet 1 Joint Ventures FSO JV LNG JV ULCC/ VLCC 64% Suezmax 4% Aframax/ LR2 11% Panamax / LR1 12% MR 9% ULCC/ VLCC 31% Suezmax 4% Aframax/ LR2 14% Panamax / LR1 24% MR 27% By Deadweight Tons By Number of Ships
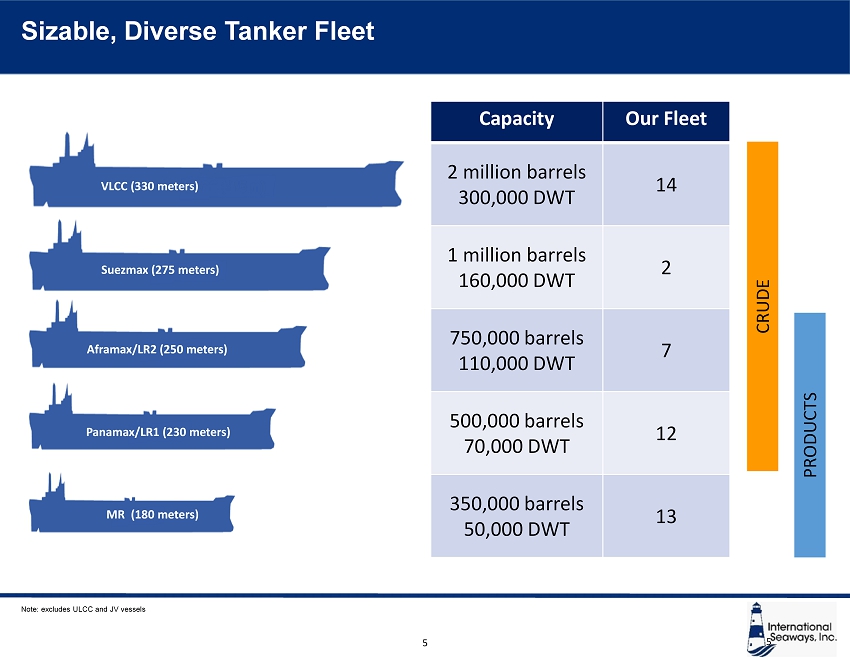
International Seaways, Inc. 5 Sizable, Diverse Tanker Fleet VLCC (330 meters) Suezmax (275 meters) Aframax/LR2 (250 meters) Panamax/LR1 (230 meters) MR (180 meters) Capacity Our Fleet 2 million barrels 300,000 DWT 14 1 million barrels 160,000 DWT 2 750,000 barrels 110,000 DWT 7 500,000 barrels 70,000 DWT 12 350,000 barrels 50,000 DWT 13 CRUDE PRODUCTS 5 Note: excludes ULCC and JV vessels

International Seaways, Inc. 6 • Optimizes cash flow in difficult market • JVs and time chartered and bareboat vessels provide stable cash flow • Substantially covers fixed costs • $14,200 Fleetwide Cash Breakeven LTM • Reduced to $10,800/day when factoring in JV contributions • Competitive OPEX and low G&A • Strengthened fleet profile and earnings power ahead of market recovery • Invested $600 million in modern vessels with average age of 2.3 years • Sold older vessels with an average age of 15.7 years Renewing and Growing Fleet Maintaining Low leverage Contract Revenues Cover Fixed Costs Upside to Product and Crude Recovery Low Cash Breakeven Strong Governance • 41% Debt to Book Capitalization • 51% Net Debt to Asset Value • Experienced management team • Independent board with shareholder representation • Ranked number one tanker company in Wells Fargo Governance report • 41 vessels in spot market provide significant operating leverage • Every $5,000 improvement in the Time Charter Equivalent daily rate (TCE) provides $74 million in incremental EBITDA and $2.54 EPS INSW Investment Highlights

International Seaways, Inc. 7 ▪ Acquired Highly - Efficient Sister Ships o Acquired 6 VLCCs from Euronav NV for $434 million in June 2018 o 300,000 DWT VLCCs constructed at Shanghai Waigaoqiao Shipbuilding Co. o 5 built in 2016 and 1 built in 2015 ▪ Strengthened Fleet Profile and Profitability o Meaningfully increased the size of INSW’s fleet – 23% on a deadweight ton basis since spinoff. o Reduced fleet age from 11.6 to 8.9 years 1 o Acquisition made at historically low asset prices o Further positions INSW to capitalize on a recovery in the tanker market ▪ Funded Acquisition While Maintaining Balance Sheet Strength o Assumed the $311 million Sinosure debt secured by the six vessels o Matures between 2027 and 2028 o Interest Rate of LIBOR plus 2.0% o Still among lowest loan to value profiles in the sector o No equity raised Renewing and Growing Fleet – Acquired 6 Modern VLCCs 1 Pro forma sale of Seaways Laura Lynn and redelivery of Seaways Kimolos

International Seaways, Inc. 8 1 Includes Chartered - in Vessels. Pro forma for sale of Seaways Laura Lynn and Redelivery of Seaways Kimolos Weighted Average Age by DWT (years) 1 Deadweight Tons (millions) 1 Type Built Acquired Price Hatteras Suezmax 2017 Q3 '17 $58.0 Montauk Suezmax 2017 Q3 '17 58.0 Raffles VLCC 2010 Q4 '17 53.0 Tybee VLCC 2015 Q2 '18 69.0 Liberty VLCC 2016 Q2 '18 73.0 Hendricks VLCC 2016 Q2 '18 73.0 Diamond Head VLCC 2016 Q2 '18 73.0 Cape Henry VLCC 2016 Q2 '18 73.0 Triton VLCC 2016 Q2 '18 73.0 Type Built Delivered Price Petromar MR 2001 Q3 '17 $8.0 Andromar MR 2004 Q4 '17 11.2 Ambermar MR 2002 Q1 '18 8.3 Atalmar MR 2004 Q1 '18 10.7 Raphael VLCC 2000 Q2 '18 19.0 Alcmar MR 2004 Q2 '18 10.5 Josefa Camejo Aframax 2001 Q2 '18 9.5 Laura Lynn ULCC 2003 Q2 '18 est 32.5 8 Total Vessels Being Sold with an Average Age of 15.7 years 9 Total Vessels Acquired with an Average Age of 2.3 years Vessel Acquisitions Vessel Name Vessel Sales Vessel Name Renewing and Growing Fleet – Strengthened Fleet Profile Jan 2017 Jun 2018 Jan 2017 Jun 2018 11.6 8.9 6.8 5.6

International Seaways, Inc. Optimizing Cash Flow – Balanced Revenue Mix 9 • Operating leverage: Every $5,000 TCE = $68 million EBITDA, $2.54 EPS 41 Tankers in Pools (including CMAs) • 17% of conventional fleet deployed on fixed charters 7 Tankers on Time and Bareboat Charter • 2 x FSO and 4 x LNG JVs provide diversification of income and stable cash flows. 6 Joint Venture Units Vessel Deployment Strategy Contracted cash flows covered overhead, debt service and drydock/CAPEX Time Charter Revenue $46 M Debt Service $44 M JV Distributions $49 M G&A $20 M DDK & CAPEX $20 M $0 $10 $20 $30 $40 $50 $60 $70 $80 $90 $100 Contracted Cash Flows - LTM 3/31/18 Overhead & Debt Service - LTM 3/31/18
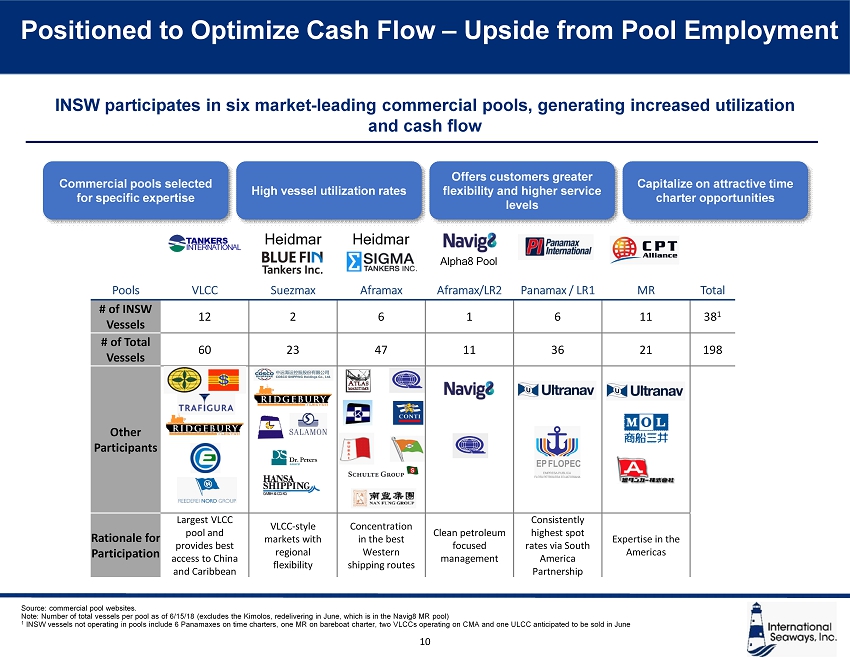
International Seaways, Inc. Positioned to Optimize Cash Flow – Upside from Pool Employment 10 Pools VLCC Suezmax Aframax Aframax/LR2 Panamax / LR1 MR Total # of INSW Vessels 12 2 6 1 6 11 38 1 # of Total Vessels 60 23 47 11 36 21 198 Other Participants Rationale for Participation Largest VLCC pool and provides best access to China and Caribbean VLCC - style markets with regional flexibility Concentration in the best Western shipping routes Clean petroleum focused management Consistently highest spot rates via South America Partnership Expertise in the Americas High vessel utilization rates Commercial pools selected for specific expertise Offers customers greater flexibility and higher service levels Capitalize on attractive time charter opportunities Source: commercial pool websites. Note: Number of total vessels per pool as of 6/15/18 (excludes the Kimolos, redelivering in June, which is in the Navig8 MR p ool ) 1 INSW vessels not operating in pools include 6 Panamaxes on time charters, one MR on bareboat charter, two VLCCs operating on CM A and one ULCC anticipated to be sold in June INSW participates in six market - leading commercial pools, generating increased utilization and cash flow Heidmar Alpha8 Pool Heidmar

International Seaways, Inc. 11 Pro v ides global di v ersific at i on w ith expande d customer base • New five - year contracts commenced in the third quarter of 2017 and are expected to generate in excess of $180 million of EBITDA over the five - year term to International Seaways based on ownership percentage – average $36 million/year • $135 million in total cash distributions to INSW since 2014 through March 31, 2018, including $41 million in 2017 • Refinanced in Q2 2018, $110 million in proceeds to INSW • Qatar Petroleum expects field life to last for decades to come • Vessels trading lives extend through 2032, ten years after the current contract • Hire rate has an OpEx escalation component • Book value as of March 31, 2018 $248 million Source of Significant Cash Contributions Specialized Assets Enhance Value of Exported Crude Assets specifically designed to process 100% of crude oil exports from Al Shaheen field in Qatar: • Field produces 270,000 – 300,000 bpd of crude with high water content • JV initially approached by field operator as the partners owned the only double hull ULCCs • Large 3 million barrel units provide the field operator with spare capacity allowing production to continue uninterrupted • FSOs have sophisticated oil/water separation plant that process oil and increases the quality of the crude • Several other bespoke features at request of field operator • Top tier technical management and safety performance through JV partner Positioned to Optimize Cash Flow – Contracted Cash from FSO JV 50% owner of a Joint Venture which owns two Floating Storage and Offloading (FSO) units with multi year contracts to process oil for export for Qatar Petroleum

International Seaways, Inc. 12 Pro v ides global di v ersific at i on w ith expande d customer base • The JV anticipates generating $5 million in cash on average for our share annually until 2023 • Thereafter, distributions expected to rise assuming debt is refinanced at or prior to 2023 maturity to approximately $15 million per year • All ships are on charter for 25 years to Qatar Liquefied Gas Company through 2032/2033 • Charterer holds two five - year options to extend • Hire rate has an OPEX escalation component • Book value as of March 31, 2018 $112 million • JV Partner is the Qatari LNG Shipping company with a strong relationship with customer Qatar Gas • Ships have five cargo tanks with membrane - type containment system allowing transportation of cargo at - 163 ƒ C • Dual main engines, twin propellers and five generator sets provide redundancy that enhances safe operation • All vessels fitted with reliquefication plants allowing the cargo quantity loaded to match the quantity discharged • Top tier technical management and safety performance through JV partner Positioned to Optimize Cash Flow – Contracted Cash from LNG JV Strong Partner in Diversified Assets Cash Contributions Through Long Term Charters 49.9% owner of a Joint Venture with Nakilat which owns four LNG carriers on long term charter for export of LNG from Qatar

International Seaways, Inc. $0 $2,000 $4,000 $6,000 $8,000 $10,000 $12,000 $14,000 $16,000 $18,000 $20,000 VLCC/ULCC Suezmax Aframax Panamax MRPO All Owned INSW Vessel Expenses (Net of One-Off Items) G&A (Excluding non-cash items) Debt Service (Excluding deferred financing costs) DDK & CAPEX $14,400 $12,800 $17,700 $12,000 $14,200 $12,400 $10,800 Effect of JV contribution Lean and Scalable Model – Low Cash Breakevens 13 INSW Daily OPEX excludes DDK deviation bunkers, insurance claims and one - off expenses. Not pro forma for Sinosure transaction. Only includes owned vessels. Three bareboat - in MR vessels have charter hire and OPEX expenses of approx. $13,470 per day. The bareboat - in Aframaxes will be broken out in Q2 Effect of JV Contribution will decrease gong forward as the expected FSO Distributions will decrease due to the new financin g t hat has been put in place. Breakevens basis Revenue Days Low TCE breakeven allows INSW to navigate low points in the tanker cycle while providing significant operating leverage in rising markets Breakeven Rates by Sector Basis LTM Q1 2018 Actuals MR
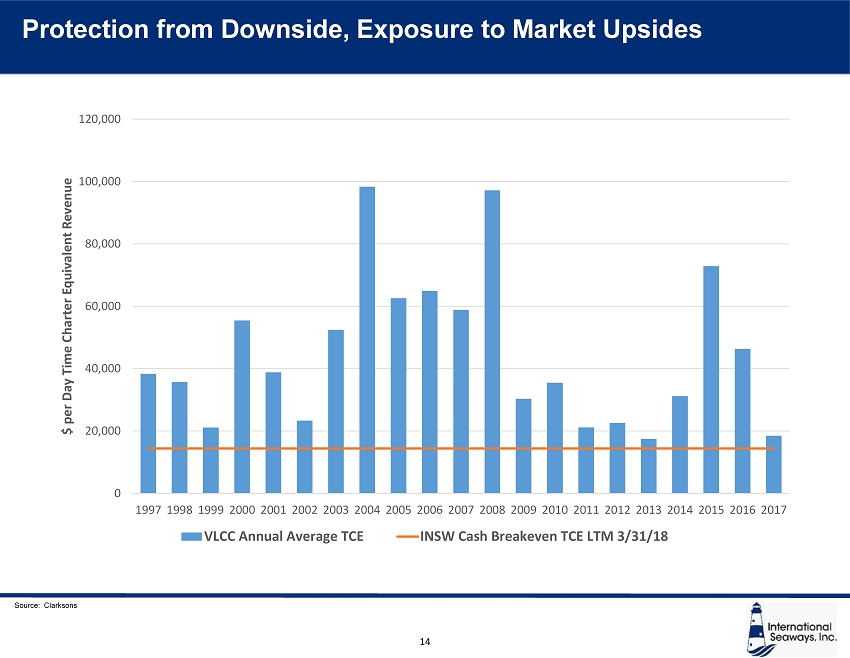
International Seaways, Inc. Source: Clarksons 0 20,000 40,000 60,000 80,000 100,000 120,000 1997 1998 1999 2000 2001 2002 2003 2004 2005 2006 2007 2008 2009 2010 2011 2012 2013 2014 2015 2016 2017 $ per Day Time Charter Equivalent Revenue VLCC Annual Average TCE INSW Cash Breakeven TCE LTM 3/31/18 14 Protection from Downside, Exposure to Market Upsides

International Seaways, Inc. Experienced INSW Management Team Lois K. Zabrocky President & CEO • Most recently served as President for OSG’S International Flag strategic business unit, International Seaways’ predecessor company • Joined OSG in 1992, previously held positions as Head of International Product Carrier & Gas Strategic Business Unit and head of the Aframax International Pool • Elected to Board of Directors on May 24, 2018 Jeffrey D. Pribor Chief Financial Officer • Joined International Seaways in 2016, as Chief Financial Officer • Prior to joining International Seaways, was Global Head of Maritime Investment Banking at Jefferies LLC and earlier CFO of General Maritime Corporation James D. Small Chief Administrative Officer & General Counsel • Joined OSG in 2015, prior to which he worked at Cleary Gottlieb Steen & Hamilton since 1996 • At Cleary, he worked in New York, London and Hong Kong focusing on corporate and financial transactions, US securities law, capital markets and corporate governance William Nugent Head of International Fleet Operations • Joined OSG in 2000 and rejoined OSG in 2006, most recently as Head of International Fleet Operations • After rejoining in 2006 , he was Vice President of New Construction and Head of the Technical Services Group Derek Solon Chief Commercial Officer • Joined OSG in 2012 as Vice President, Commercial • Prior to joining OSG, worked as a tanker broker at Poten & Partners and served as an intelligence officer in the US Navy 15

International Seaways, Inc. Strong, Transparent Corporate Governance Douglas D. Wheat Chairman of the Board • Managing Partner of Wheat Investments Timothy J. Bernlohr Director • Founder and Managing Member of TJB Management Consulting, LLC Ian T. Blackley Director • Former President, CEO and Director of OSG Randee Day Director • President and CEO of Day & Partners, LLC, Former CEO of DHT David I. Greenberg Director • Special Advisor for LRN Corporation Joseph I. Kro nsbe rg Director • Principal at Cyrus Capital Partners, L.P. Ty E. Wallach Director • Partner at Paulson & Co. Inc. Gregory A. Wright Director • Co - Founder and CFO of One Cypress Energy, LLC Lois K. Zabrocky Director • President and CEO of International Seaways 16 Majority Independent Board Rigorous Board Policies Committees Led by Independent Directors Board of Directors Industry Leading Governance Track Record Highly professional management team and board of directors guided by rigorous capital allocation principles Strong Investor Participation INSW is the top - ranked tanker company in Wells Fargo Securities Research’s Corporate Governance Rankings

Market Fundamentals
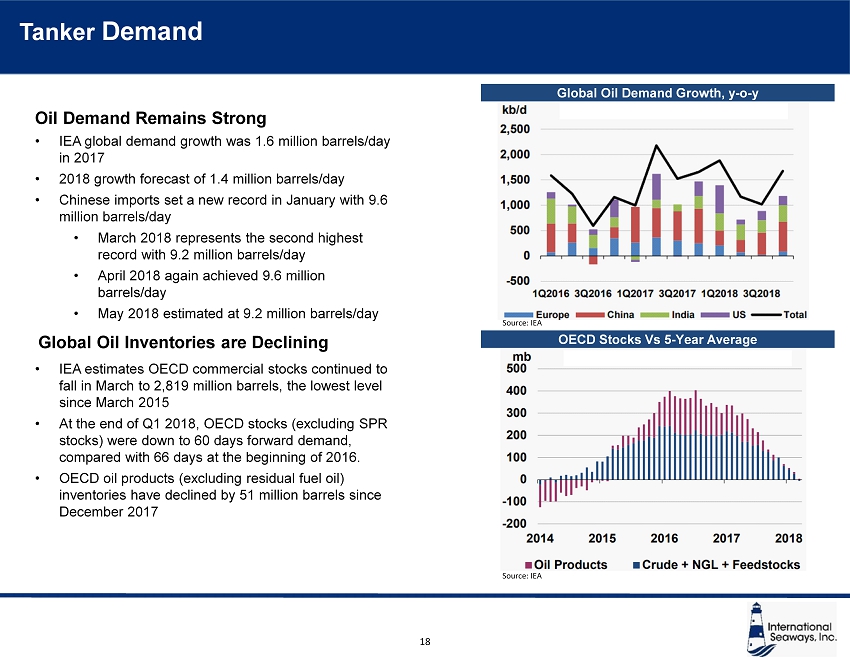
International Seaways, Inc. Tanker Demand Source: IEA Global Oil Inventories are Declining Global Oil Demand Growth, y - o - y 18 OECD Stocks Vs 5 - Year Average Source: IEA Oil Demand Remains Strong • IEA global demand growth was 1.6 million barrels/day in 2017 • 2018 growth forecast of 1.4 million barrels/day • Chinese imports set a new record in January with 9.6 million barrels/day • March 2018 represents the second highest record with 9.2 million barrels/day • April 2018 again achieved 9.6 million barrels/day • May 2018 estimated at 9.2 million barrels/day • IEA estimates OECD commercial stocks continued to fall in March to 2,819 million barrels, the lowest level since March 2015 • At the end of Q1 2018, OECD stocks (excluding SPR stocks) were down to 60 days forward demand, compared with 66 days at the beginning of 2016. • OECD oil products (excluding residual fuel oil) inventories have declined by 51 million barrels since December 2017
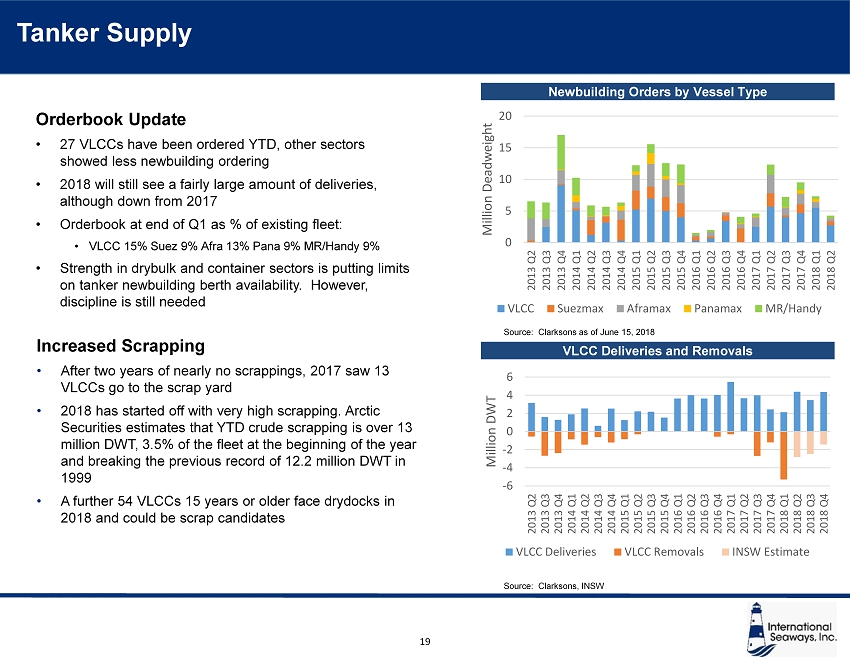
International Seaways, Inc. Newbuilding Orders by Vessel Type Tanker Supply Orderbook Update • 27 VLCCs have been ordered YTD, other sectors showed less newbuilding ordering • 2018 will still see a fairly large amount of deliveries, although down from 2017 • Orderbook at end of Q1 as % of existing fleet: • VLCC 15% Suez 9% Afra 13% Pana 9% MR/Handy 9% • Strength in drybulk and container sectors is putting limits on tanker newbuilding berth availability. However, discipline is still needed 19 Source: Clarksons as of June 15, 2018 VLCC Deliveries and Removals Source: Clarksons, INSW 0 5 10 15 20 2013 Q2 2013 Q3 2013 Q4 2014 Q1 2014 Q2 2014 Q3 2014 Q4 2015 Q1 2015 Q2 2015 Q3 2015 Q4 2016 Q1 2016 Q2 2016 Q3 2016 Q4 2017 Q1 2017 Q2 2017 Q3 2017 Q4 2018 Q1 2018 Q2 Million Deadweight VLCC Suezmax Aframax Panamax MR/Handy Increased Scrapping • After two years of nearly no scrappings, 2017 saw 13 VLCCs go to the scrap yard • 2018 has started off with very high scrapping. Arctic Securities estimates that YTD crude scrapping is over 13 million DWT, 3.5% of the fleet at the beginning of the year and breaking the previous record of 12.2 million DWT in 1999 • A further 54 VLCCs 15 years or older face drydocks in 2018 and could be scrap candidates -6 -4 -2 0 2 4 6 2013 Q2 2013 Q3 2013 Q4 2014 Q1 2014 Q2 2014 Q3 2014 Q4 2015 Q1 2015 Q2 2015 Q3 2015 Q4 2016 Q1 2016 Q2 2016 Q3 2016 Q4 2017 Q1 2017 Q2 2017 Q3 2017 Q4 2018 Q1 2018 Q2 2018 Q3 2018 Q4 Million DWT VLCC Deliveries VLCC Removals INSW Estimate

International Seaways, Inc. IMO 2020 Overview • On Jan 1, 2020, all vessels worldwide must use maximum 0.5% sulfur fuel, down from current 3.5% limit • Can be achieved by using low sulfur fuel or by installing scrubbers and continuing to use high sulfur fuel • Scrubbers are expensive. Less than 10% of the global fleet expected to go this route 1 What Are We Doing? • Seaways will likely install scrubbers on some of its modern VLCCs • Long voyages and high fuel consumptions make the scrubber economics particularly favorable on VLCCs • Principal VLCC bunker ports of Fujairah and Singapore expected to have sufficient high sulfur fuel supplies • Smaller ships have lower consumptions and trade more regionally where future HSFO supplies questionable Tanker Market Impact • Estimated 3.3 million 1 b/d high sulfur fuel consumption needs to be replaced with low sulfur fuel • Increased bunker expenses or high capex to install scrubbers… NEGATIVE for all ship types • Higher fuel costs may lead to slow steaming effectively reducing ship supply… POSITIVE for all ship types • Some of the demand can be met by further cracking…potential new trades for high sulfur fuel oil… POSITIVE for midsize crude tankers • Additional crude runs to meet balance of distillate demand… POSITIVE for large crude tankers • Excess high sulfur fuel may enter contango as short term demand is reduced, leading to storage opportunities… POSITIVE for large crude tankers • Transport of low sulfur fuel to regions lacking supplies… POSITIVE for product carriers 20 1 Source: Wells Fargo Securities LLC

Financial Overview
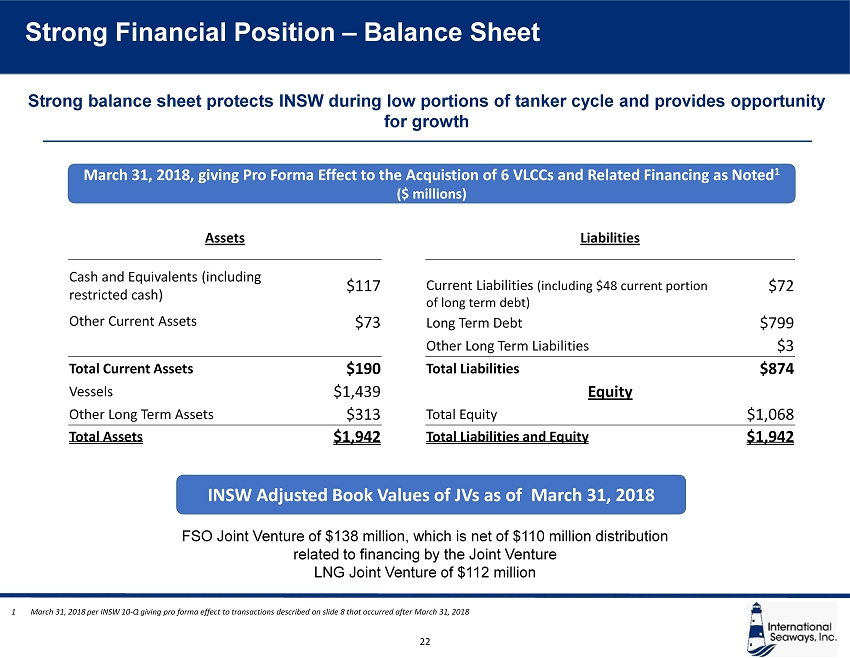
International Seaways, Inc. Strong Financial Position – Balance Sheet 22 Strong balance sheet protects INSW during low portions of tanker cycle and provides opportunity for growth 1 March 31, 2018 per INSW 10 - Q giving pro forma effect to transactions described on slide 8 that occurred after March 31, 2018 FSO Joint Venture of $138 million, which is net of $110 million distribution related to financing by the Joint Venture LNG Joint Venture of $112 million INSW Adjusted Book Values of JVs as of March 31, 2018 ($ millions) Assets Liabilities Cash and Equivalents (including restricted cash) $117 Current Liabilities (including $48 current portion of long term debt) $72 Other Current Assets $73 Long Term Debt $799 Other Long Term Liabilities $3 Total Current Assets $190 Total Liabilities $874 Vessels $1,439 Equity Other Long Term Assets $313 Total Equity $1,068 Total Assets $1,942 Total Liabilities and Equity $1,942 March 31, 2018, giving Pro Forma Effect to the Acquistion of 6 VLCCs and Related Financing as Noted 1 ($ millions)

International Seaways, Inc. INSW Debt Portfolio – Pro Forma Acquisition of 6 VLCCs 23 Debt Balance 2 Maturity Callable Rate Amortization Term Loan B $479 million 2022 At 101 after 1/1/19 LIBOR + 600bps 5% per annum Secured Sinosure $311 million 2027 / 2028 Anytime LIBOR + 200 bps 7.6% per annum Financing of Seaways Raffles $28 million 2023 Anytime LIBOR + 325 bps 12.2% per annum $50m Secured Revolver $0 2021 Anytime LIBOR + 350bps Non amortizing Senior Unsecured Notes $25 million 2023 2020 8.5% Non amortizing Junior Unsecured Step - Up Notes $30 million 2023 2020 10.75% Non amortizing Net Debt to Total Capitalization: 41% Net Loan to Asset Value: 51% 1 1 Conventional fleet and FSO JV: excludes value of LNG JV. Based on principal amount of debt outstanding 2 As of June 14, 2018 One of the Lowest Loan to Value Profiles in the Industry
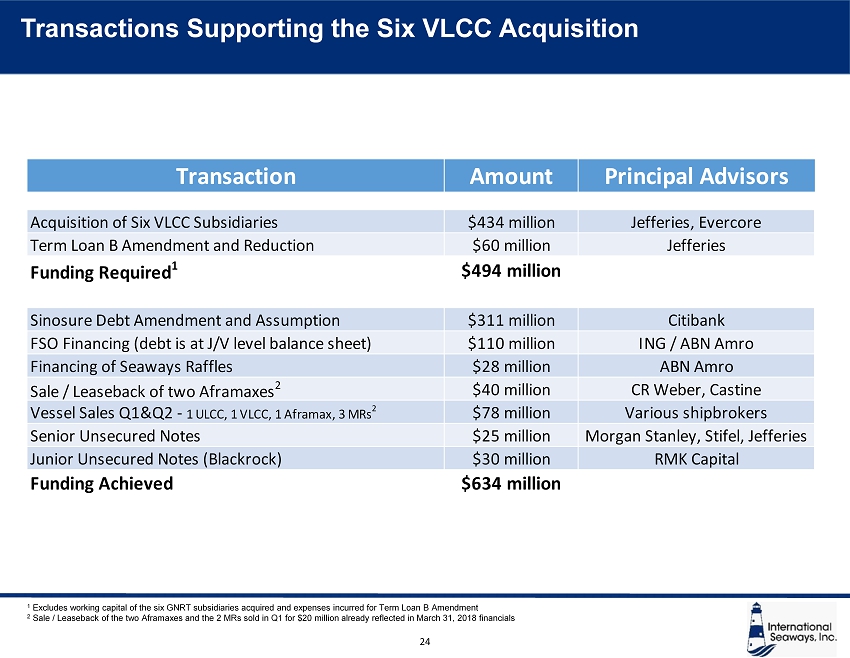
International Seaways, Inc. Transactions Supporting the Six VLCC Acquisition 24 Transaction Amount Principal Advisors Acquisition of Six VLCC Subsidiaries $434 million Jefferies, Evercore Term Loan B Amendment and Reduction $60 million Jefferies Funding Required 1 $494 million Sinosure Debt Amendment and Assumption $311 million Citibank FSO Financing (debt is at J/V level balance sheet) $110 million ING / ABN Amro Financing of Seaways Raffles $28 million ABN Amro Sale / Leaseback of two Aframaxes 2 $40 million CR Weber, Castine Vessel Sales Q1&Q2 - 1 ULCC, 1 VLCC, 1 Aframax, 3 MRs 2 $78 million Various shipbrokers Senior Unsecured Notes $25 million Morgan Stanley, Stifel, Jefferies Junior Unsecured Notes (Blackrock) $30 million RMK Capital Funding Achieved $634 million 1 Excludes working capital of the six GNRT subsidiaries acquired and expenses incurred for Term Loan B Amendment 2 Sale / Leaseback of the two Aframaxes and the 2 MRs sold in Q1 for $20 million already reflected in March 31, 2018 financials
Closing Remarks

International Seaways, Inc. 26 Strong Post - Spinoff Accomplishments Executing on Disciplined Capital Allocation Strategy • Acquired 9 modern, high specification vessels at bottom of the cycle – Grew fleet 23% on DWT basis – Reduced fleet age by close to 3 years • Opportunistically repurchased shares Maintained Strong Balance Sheet and Financial Strength • Funded fleet growth without issuing equity • 51% net loan to value • Generating substantially breakeven cash flow from operations Enhanced Position to Optimize Revenue and Capitalize on Market Recovery • 55 vessel fleet with balanced mix of contracted cash flows and spot market upside • Fixed revenue from charters and JVs provides level of predictable cash flows • Significant operating leverage to a market recovery Maintained Lean and Scalable Model • Model allows for both low cost and scalability • $5.4 million cash G&A expense for Q1 ($1,263 per operating day) • Acquisition of 6 VLCCs not expected to materially increase G&A

Q&A