
Form 8-K THOR INDUSTRIES INC For: Jun 06
|
Delaware
|
1-9235 |
93-0768752
|
| (State or Other Jurisdiction of Incorporation) | (Commission File Number) |
(IRS Employer Identification No.)
|
|
601 East Beardsley Avenue,
Elkhart, Indiana
|
46514-3305
|
|
(Address of Principal Executive Offices)
|
(Zip Code) |
|
☐
|
Written communications pursuant to Rule 425 under the Securities Act (17 CFR 230.425)
|
|
☐
|
Soliciting material pursuant to Rule 14a-12 under the Exchange Act (17 CFR 240.14a-12)
|
|
☐
|
Pre-commencement communications pursuant to Rule 14d-2(b) under the Exchange Act (17 CFR 240.14d-2(b))
|
|
☐
|
Pre-commencement communications pursuant to Rule 13e-4(c) under the Exchange Act (17 CFR 240.13e-4(c))
|
|
Exhibit Number
|
Description
|
|
|
|
Thor Industries, Inc. |
|
|
|
|
|
|
|
|
|
|
|
|
|
Date: June 6, 2018
|
By: |
/s/ Colleen Zuhl
|
|
|
|
Name: |
Colleen Zuhl
|
|
|
|
Title: |
Senior Vice President and Chief Financial Officer
|
|
Thor Announces Record Results for Third Quarter and Nine Months of Fiscal 2018
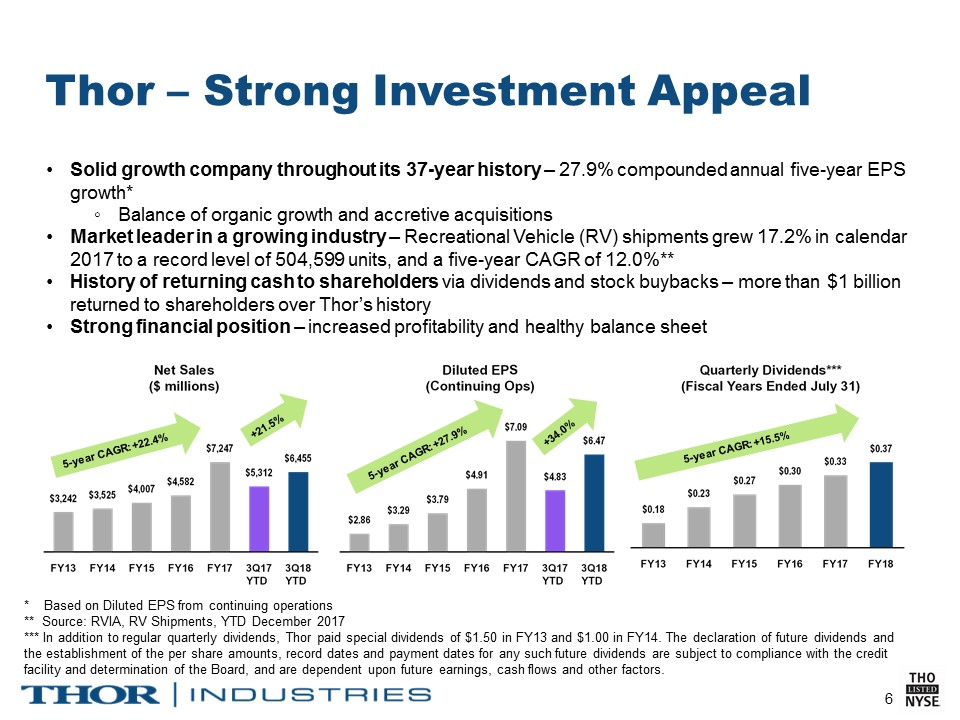
- Fiscal 2018 financial results reflect all-time records for a third quarter and first nine months in the Company’s history:
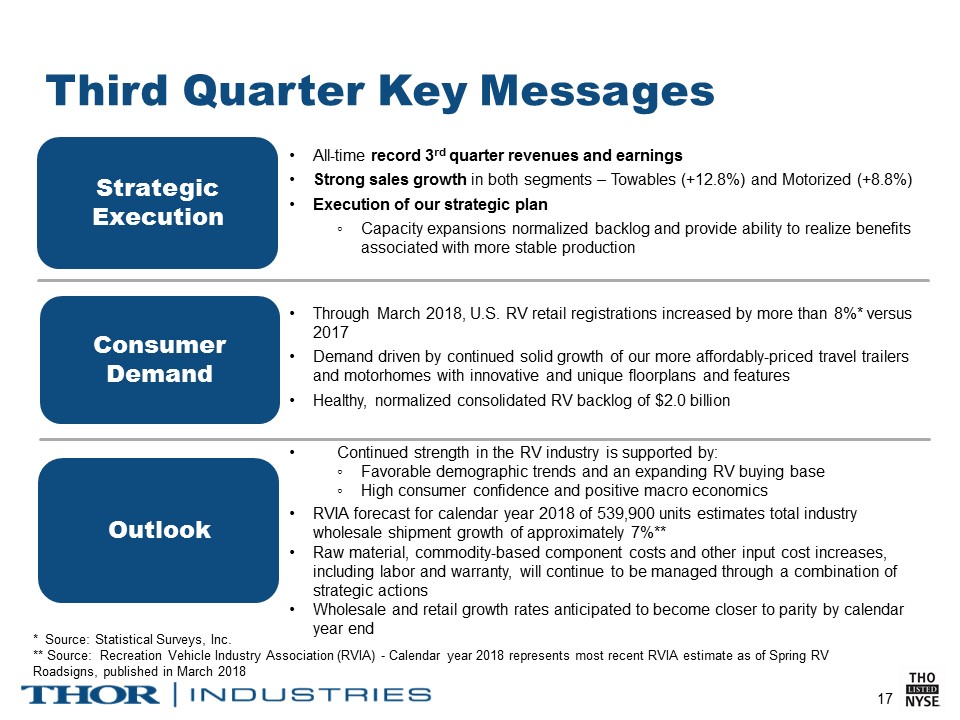
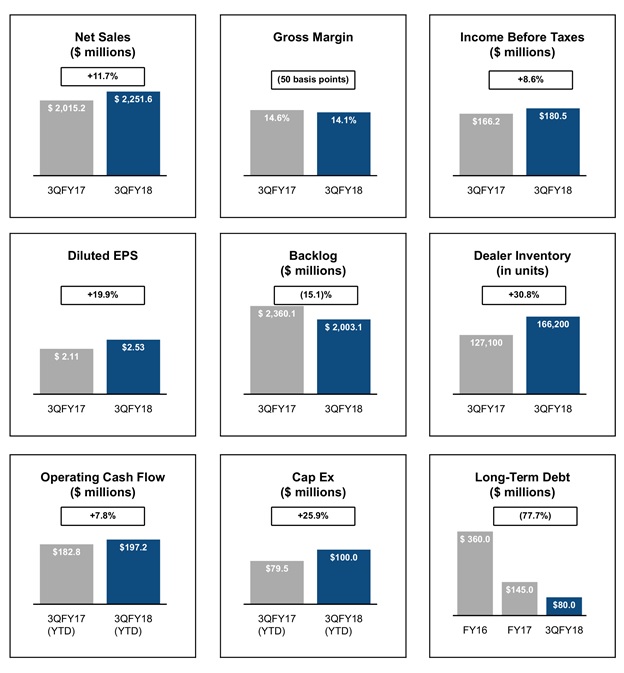
- Third quarter net sales increased 11.7% to $2.25 billion
- Third quarter income before taxes up 8.6% to $180.5 million
- Third quarter diluted EPS increased 19.9% to $2.53
- First nine month net sales increased 21.5% to $6.45 billion
- First nine month income before taxes up 33.7% to $508.7 million
- First nine month diluted EPS increased 34.0% to $6.47
- Healthy consolidated RV backlog of $2.0 billion
- Continued execution of our strategic plan, coupled with positive economic conditions and favorable RV consumer growth trends, support our long-term outlook
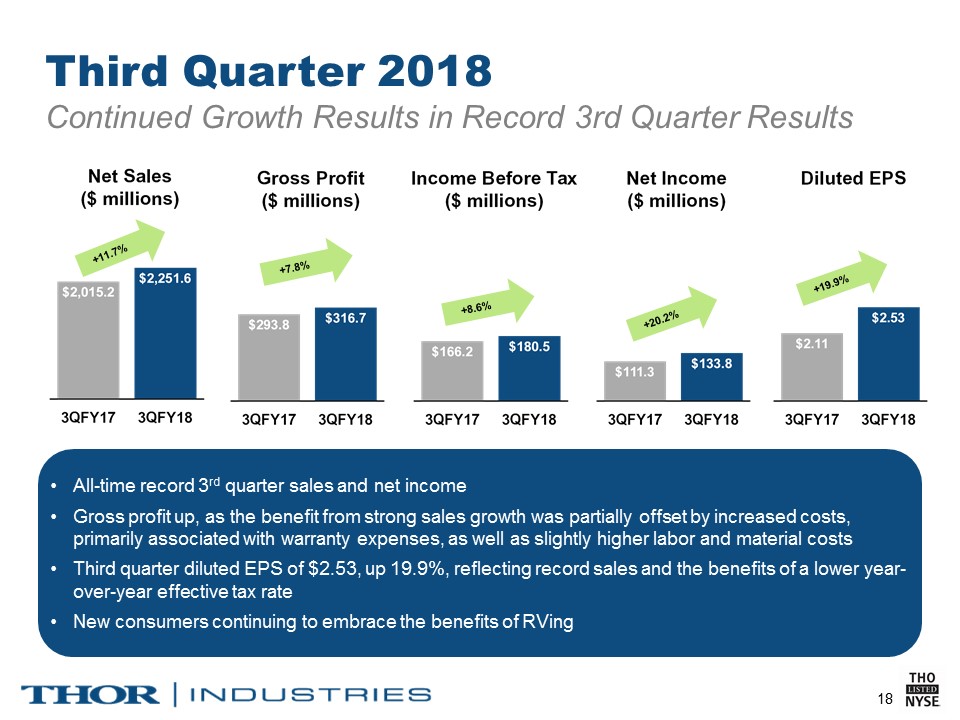
ELKHART, Ind.--(BUSINESS WIRE)--June 6, 2018--Thor Industries, Inc. (NYSE: THO) today announced record third quarter results with net sales of $2.25 billion, up 11.7%, and income before taxes of $180.5 million, an increase of 8.6%. Gross profit for the quarter ended April 30, 2018, increased by 7.8% to $316.7 million. Net income and diluted earnings per share for the third quarter of fiscal 2018 were $133.8 million and $2.53, respectively. This compares favorably to net income and diluted earnings per share in the prior-year third quarter of $111.3 million and $2.11, respectively.
Net sales increased 12.8% for the Towable segment, 8.8% for the Motorized segment and 11.7% overall. Overall gross profit margins declined to 14.1% in the quarter compared to 14.6% in the prior-year period, reflecting increased costs primarily associated with warranty expenses, including expenses associated with an extended warranty program on certain products, as well as slightly higher labor and material costs. Net income in the quarter benefited as a result of the Tax Cuts and Jobs Act enacted in December 2017, as the Company’s third quarter effective tax rate of 25.9% compared favorably to a tax rate of 33.1% in the prior year.
“Our third quarter results reflect another period of solid growth of both sales and earnings”, said Bob Martin, Thor President and CEO. "We continue to leverage the strength in industry demand to drive the year-over-year growth in both our top and bottom lines. While labor costs have moderated, we are experiencing inflationary price increases in certain raw material and commodity-based components due in large part to the headwinds created by the announcement and implementation of the steel and aluminum tariffs and other regulatory actions, as well as higher warranty costs. We will continue to manage these input factors through a combination of strategic actions and believe, over time, we will be able to offset these cost increases.
“Our consolidated backlog is currently at a healthy level and reflects normalized, on-going demand throughout our product portfolio. As anticipated, the production expansion projects completed over the past several quarters have improved product delivery times to our dealers, and we expect this trend to continue in subsequent quarters. Furthermore, our added capacity and normalized backlog will provide us with the ability to realize the benefits associated with a more stable production environment.
“Our perspectives of retail demand remain consistent with our operating plans and expectations entering the year. While unfavorable weather conditions in numerous markets contributed to a slower start to the retail selling and delivery season, we remain confident that continued positive economic conditions, combined with strong consumer demand fundamentals, will provide another year of meaningful retail growth. Evidence of a healthy retail marketplace is supported by year-to-date retail sales in warmer climate/higher volume RV states (such as Texas, California and Florida) which have experienced high-single-digit to low-double-digit growth rates through March 2018," Martin added.
Towable RVs
- Towable RV sales were $1.61 billion for the third quarter, up 12.8% from $1.43 billion in the prior-year period.
- Towable RV income before tax was $147.9 million, up 9.9% from $134.5 million in the third quarter last year. This percentage increase was driven primarily by the increase in sales, decreased Selling, General and Administrative (SG&A) expense as a percent of revenues and slightly lower amortization expense, partially offset by a lower gross margin percent.
- Towable RV backlog decreased $259.8 million, or 16.6%, to $1.30 billion, compared to $1.56 billion at the end of the third quarter of fiscal 2017, reflecting the impact of capacity additions on improving delivery times. The Company believes the current towable RV backlog represents a return to a normalized level.
Motorized RVs
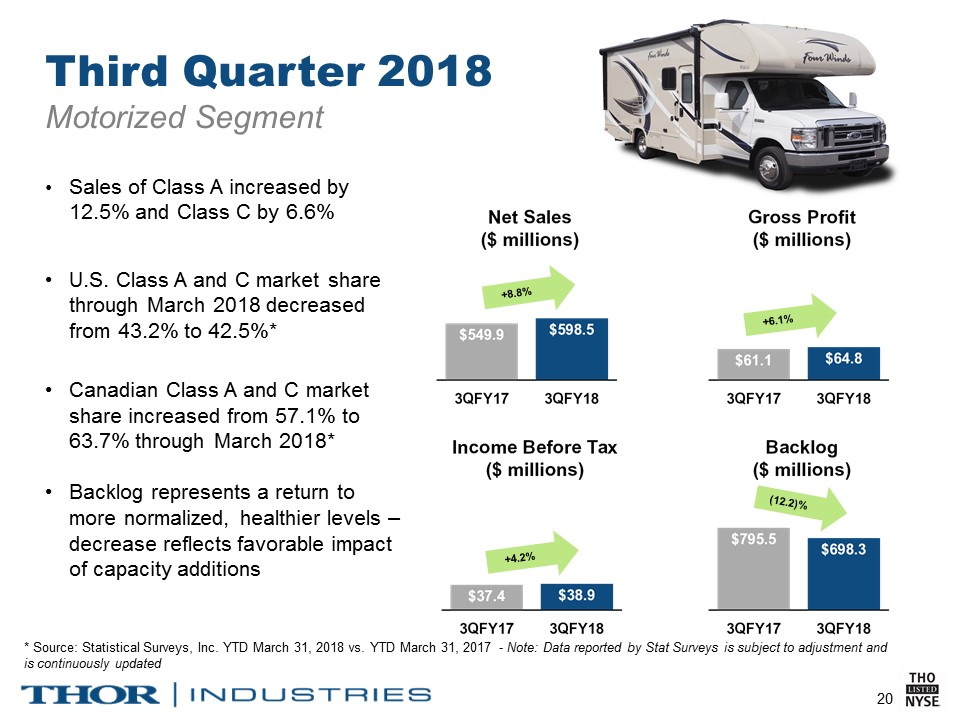
- Motorized RV sales were $598.5 million for the third quarter, up 8.8% from $549.9 million in the prior-year period.
- Motorized RV income before tax was $38.9 million, up 4.2% from $37.4 million last year, driven primarily by the growth in sales, partially offset by a lower gross margin percent.
- Motorized RV backlog decreased $97.2 million, or 12.2%, to $698.3 million from $795.5 million a year earlier, reflecting the impact of capacity additions on improving delivery times. The Company believes the current motorized RV backlog represents a return to a normalized level.
“Our balance sheet remains very healthy. As of April 30, 2018, we held $147.0 million of cash. During the first nine months of fiscal 2018, we invested over $100.0 million on various capital projects that support our existing businesses, while working capital increased $172.7 million to support our seasonal needs,” said Colleen Zuhl, Thor Senior Vice President and CFO. “We also continued to reduce the outstanding balance under our credit facility, paying down $65.0 million during the first nine months of the year to exit with $80.0 million outstanding as of April 30, 2018, compared to $145.0 million outstanding at July 31, 2017. Subsequent to April 30, 2018, we paid an additional $60.0 million on our credit facility, leaving just $20.0 million as the remaining balance.
“During the third quarter of 2018, Thor made a $46.9 million investment in a newly-created joint venture, named TH2. TH2 was formed to own, improve and sell innovative and comprehensive digital applications through a platform designed for the global RV industry. In addition to making our products more attractive to technologically savvy consumers and attracting more consumers to the RV market, we believe that TH2's functionality will support numerous revenue streams, including subscriptions, advertisements and commissions. Our investment in TH2 was funded by cash on hand at the closing, in early March 2018,” concluded Zuhl.
Outlook
“Overall, the RV industry fundamentals remain strong and are supported by high consumer confidence rates, favorable employment trends, adequate availability of credit at historically low rates and a healthy housing market," added Martin. "Dealer optimism also remains high, and their inventory is fresh. Demand continues to be driven by favorable demographic and lifestyle growth trends, including the ongoing strength of baby-boomer customers, as well as first-time and younger buyers.
"As we complete our 2018 fiscal year, we expect another record year for Thor, however, as we look to the fourth quarter specifically, we will be facing tougher year-over-year comparatives on both the top line and pre-tax earnings. Earnings will be affected by the factors previously discussed in this release and sales in the upcoming quarter will be compared to record sales in the prior year fourth quarter. In addition, we anticipate bringing wholesale and retail growth rates closer to parity by the end of the calendar year," concluded Martin.
"The longer-term outlook for Thor also remains positive," said Peter B. Orthwein, Thor Executive Chairman. "Unlike many of the expansions we have experienced over the past two decades, the current market strength has been driven largely by new consumers adopting the RV lifestyle with many consumers adopting the lifestyle at a much younger age than we've seen historically. We view such growth to be more sustainable over the long term. By successfully executing our overall strategic plan, including our capital allocation strategy, which reflects funding growth, both organically and through acquisition, increasing returns to shareholders and paying down the remaining debt, we will continue to enhance shareholder value over time."
Supplemental Earnings Release Materials
Thor announced that it has provided a comprehensive question and answer document, as well as a PowerPoint presentation, relating to its quarterly results and other topics. To view these materials, go to http://ir.thorindustries.com/.
About Thor Industries, Inc.
Thor is the sole owner of operating subsidiaries that, combined, represent the world’s largest manufacturer of recreational vehicles. For more information on the Company and its products, please go to www.thorindustries.com.
Forward Looking Statements
This release includes certain statements that are “forward looking” statements within the meaning of the U.S. Private Securities Litigation Reform Act of 1995, Section 27A of the Securities Act of 1933, as amended, and Section 21E of the Securities Exchange Act of 1934, as amended. These forward looking statements are made based on management’s current expectations and beliefs regarding future and anticipated developments and their effects upon Thor, and inherently involve uncertainties and risks. These forward looking statements are not a guarantee of future performance. We cannot assure you that actual results will not differ from our expectations. Factors which could cause materially different results include, among others, raw material and commodity price fluctuations, raw material, commodity or chassis supply restrictions, the level of warranty claims incurred, legislative, regulatory and tax law and/or policy developments including their potential impact on our dealers and their retail customers or on our suppliers, the costs of compliance with governmental regulation, legal and compliance issues including those that may arise in conjunction with recent transactions, lower consumer confidence and the level of discretionary consumer spending, interest rate fluctuations, the potential impact of interest rate fluctuations on the general economy and specifically on our dealers and consumers, restrictive lending practices, management changes, the success of new and existing products and services, consumer preferences, the pace of obtaining and producing at new production facilities, the pace of acquisitions and the successful closing and financial impact thereof, the potential loss of existing customers of acquisitions, the integration of new acquisitions, our ability to retain key management personnel of acquired companies, a shortage of necessary personnel for production, the loss or reduction of sales to key dealers, the availability of delivery personnel, asset impairment charges, cost structure changes, competition, the impact of potential losses under repurchase agreements, the potential impact of the strength of the U.S. dollar on international demand, general economic, market and political conditions, changes to investment and capital allocation strategies or other facets of our strategic plan, and the other risks and uncertainties discussed more fully in ITEM 1A of our Annual Report on Form 10-K for the year ended July 31, 2017 and Part II, Item 1A of our quarterly report on Form 10-Q for the period ended April 30, 2018.
We disclaim any obligation or undertaking to disseminate any updates or revisions to any forward looking statements contained in this release or to reflect any change in our expectations after the date hereof or any change in events, conditions or circumstances on which any statement is based, except as required by law.
| THOR INDUSTRIES, INC. | ||||||||||||||||||||||||||
| CONDENSED CONSOLIDATED STATEMENTS OF INCOME FOR THE | ||||||||||||||||||||||||||
| THREE AND NINE MONTHS ENDED APRIL 30, 2018 AND 2017 | ||||||||||||||||||||||||||
| ($000's except share and per share data) (Unaudited) | ||||||||||||||||||||||||||
| Three Months Ended April 30, | Nine Months Ended April 30, | |||||||||||||||||||||||||
| % Net | % Net | % Net | % Net | |||||||||||||||||||||||
| Sales | Sales | Sales | Sales | |||||||||||||||||||||||
| 2018 | (1) | 2017 | (1) | 2018 | (1) | 2017 | (1) | |||||||||||||||||||
|
Net sales |
$ | 2,251,570 | $ | 2,015,224 | $ | 6,454,798 | $ | 5,312,280 | ||||||||||||||||||
| Gross profit | $ | 316,745 | 14.1% | $ | 293,841 | 14.6% | $ | 920,258 | 14.3% | $ | 742,295 | 14.0% | ||||||||||||||
| Selling, general and administrative expenses | 119,449 | 5.3% | 111,122 | 5.5% | 370,800 | 5.7% | 310,401 | 5.8% | ||||||||||||||||||
| Amortization of intangible assets | 13,882 | 0.6% | 15,216 | 0.8% | 41,236 | 0.6% | 48,710 | 0.9% | ||||||||||||||||||
| Interest expense, net | 923 | —% | 2,342 | 0.1% | 2,907 | —% | 7,058 | 0.1% | ||||||||||||||||||
| Other income (expense), net | (1,966 | ) | (0.1)% | 1,070 | 0.1% | 3,366 | 0.1% | 4,270 | 0.1% | |||||||||||||||||
|
Income before income taxes |
180,525 | 8.0% | 166,231 | 8.2% | 508,681 | 7.9% | 380,396 | 7.2% | ||||||||||||||||||
| Income taxes | 46,737 | 2.1% | 54,968 | 2.7% | 166,735 | 2.6% | 125,606 | 2.4% | ||||||||||||||||||
|
Net income and comprehensive income |
$ | 133,788 | 5.9% | $ | 111,263 | 5.5% | $ | 341,946 | 5.3% | $ | 254,790 | 4.8% | ||||||||||||||
|
Earnings per common share |
||||||||||||||||||||||||||
| Basic | $ | 2.54 | $ | 2.12 | $ | 6.49 | $ | 4.85 | ||||||||||||||||||
| Diluted | $ | 2.53 | $ | 2.11 | $ | 6.47 | $ | 4.83 | ||||||||||||||||||
| Weighted-avg. common shares outstanding - basic | 52,695,365 | 52,582,134 | 52,667,016 | 52,555,792 | ||||||||||||||||||||||
| Weighted-avg. common shares outstanding - diluted | 52,853,541 | 52,773,106 | 52,844,040 | 52,739,716 | ||||||||||||||||||||||
| (1) Percentages may not add due to rounding differences | ||||||||||||||||||||||||||
| SUMMARY CONDENSED CONSOLIDATED BALANCE SHEETS ($000) (Unaudited) | |||||||||||||||||||
| April 30, 2018 | July 31, 2017 | April 30, 2018 | July 31, 2017 | ||||||||||||||||
| Cash and equivalents | $ | 147,019 | $ | 223,258 | Current liabilities | $ | 855,565 | $ | 781,046 | ||||||||||
| Accounts receivable, net | 658,232 | 484,844 | Long-term debt | 80,000 | 145,000 | ||||||||||||||
| Inventories, net | 607,185 | 460,488 | Other long-term liabilities | 65,291 | 55,345 | ||||||||||||||
| Prepaid expenses and other | 14,925 | 11,577 | Stockholders' equity | 1,865,626 | 1,576,540 | ||||||||||||||
| Total current assets | 1,427,361 | 1,180,167 | |||||||||||||||||
| Property, plant & equipment, net | 490,614 | 425,238 | |||||||||||||||||
| Goodwill | 377,693 | 377,693 | |||||||||||||||||
| Amortizable intangible assets, net | 402,230 | 443,466 | |||||||||||||||||
| Deferred income taxes and other, net | 168,584 | 131,367 | |||||||||||||||||
| Total | $ | 2,866,482 | $ | 2,557,931 | $ | 2,866,482 | $ | 2,557,931 | |||||||||||
CONTACT:
Thor Industries, Inc.
Investor Relations:
Bruce Byots, Senior Director of Investor Relations
(574) 970-7912


|
•
|
The financial results of fiscal year 2018 continue to demonstrate strong growth in both revenue and diluted EPS, resulting in third quarter and year-to-date records:
|
|
◦
|
Third quarter net sales of $2.25 billion, up 11.7% from prior year
|
|
◦
|
Third quarter income before taxes of $180.5 million, up 8.6% from prior year
|
|
◦
|
Third quarter diluted EPS of $2.53, up 19.9% from prior year
|
|
◦
|
Sales for the first nine months of $6.45 billion, up 21.5% from prior year
|
|
◦
|
Income before taxes for the first nine months of $508.7 million, up 33.7% from prior year
|
|
◦
|
Diluted EPS for the first nine months of $6.47, up 34.0% from the prior year
|
|
•
|
Gross profit margins declined in the quarter compared to the prior-year period, reflecting an increase in warranty expense, as well as slightly higher labor and material costs.
|
|
|
For further details see page 7
|
|
•
|
Healthy consolidated recreational vehicle backlog of $2.0 billion reflects normalized ongoing demand throughout our product portfolio.
|
|
|
For further details see page 8
|
|
•
|
Economic conditions remain favorable for continued industry growth for the foreseeable future.
|
|
|
For further details see page 19
|
|
•
|
Net cash provided by operating activities for the nine months ended April 30, 2018 increased by 7.8% versus the prior year.
|
|
•
|
Revolving credit facility balance, including payments made subsequent to the end of the third quarter, is currently at $20 million.
|
|
•
|
Our outlook for fiscal 2018 year anticipates another record year for Thor.
|
|
A.
|
Consolidated Financial Highlights
|
4 |
|
(including dealer inventory levels)
|
||
|
B.
|
Summary of Key Segment Data
|
5 |
|
(New Section)
|
||
|
a. Towables
|
5 | |
|
b. Motorized
|
6 | |
|
C.
|
Third Quarter Operating Results
|
7 |
|
D.
|
Current Hot Topics
|
9 |
|
a. Dealer Inventory Levels
|
9 | |
|
b. Material Costs
|
10 | |
|
c. Impact from Tax Reform
|
10 | |
|
d. TH2 Joint Venture
|
11 | |
|
E.
|
Drivers of Demand
|
11 |
|
a. Key Consumer Trends
|
11 | |
|
b. Younger Buyers Entering the Marketplace
|
12 | |
|
c. Used RV Market
|
12 | |
|
F.
|
Current Market Conditions
|
13 |
|
a. U.S. Market
|
13 | |
|
b. Canadian Market
|
13 | |
|
c. Labor Conditions
|
14 | |
|
d. Competitive Environment
|
14 | |
|
e. Credit Conditions – Wholesale & Retail
|
15 | |
|
f. Consolidation of Dealer Base
|
15 | |
|
g. Interest Rates
|
15 | |
|
G.
|
Balance Sheet and Cash Flow
|
15 |
|
(including list of expansion projects)
|
||
|
H.
|
Key Economic Indicators
|
19 |
|
I.
|
Outlook
|
20 |
|
|
Three Months
|
Three Months
|
|
|||||||||
|
Ended
|
Ended
|
%
|
||||||||||
|
April 30, 2018
|
April 30, 2017 |
Change
|
||||||||||
|
NET SALES:
|
||||||||||||
|
Towables
|
||||||||||||
|
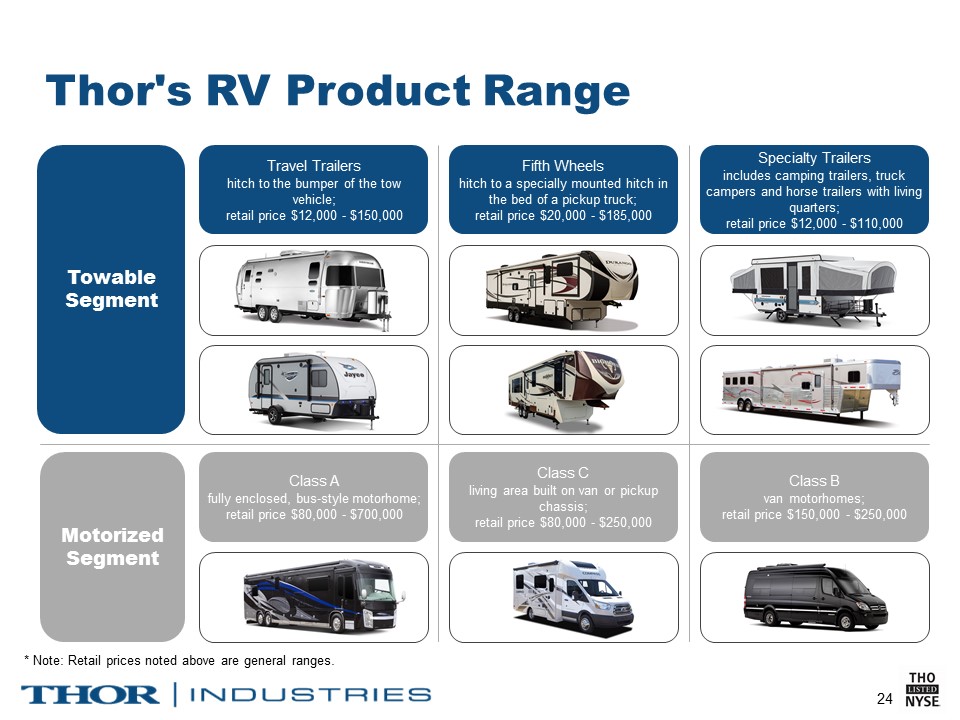
Travel Trailers and Other
|
$
|
978,906
|
$
|
859,572
|
13.9
|
%
|
||||||
|
Fifth Wheels
|
629,308
|
566,620
|
11.1
|
%
|
||||||||
|
Total Towables
|
$
|
1,608,214
|
$
|
1,426,192
|
12.8
|
%
|
||||||
|
Three Months
|
Three Months
|
|
||||||||||
|
Ended
|
Ended |
%
|
||||||||||
|
April 30, 2018
|
April 30, 2017 |
Change
|
||||||||||
|
# OF UNITS:
|
||||||||||||
|
Towables
|
||||||||||||
|
Travel Trailers and Other
|
50,164
|
45,439
|
10.4
|
%
|
||||||||
|
Fifth Wheels
|
14,502
|
13,042
|
11.2
|
%
|
||||||||
|
Total Towables
|
64,666
|
58,481
|
10.6
|
%
|
||||||||
|
As of
|
As of
|
%
|
||||||||||
|
ORDER BACKLOG:
|
April 30, 2018
|
April 30, 2017
|
Change
|
|||||||||
|
Towables
|
$
|
1,304,836
|
$
|
1,564,609
|
(16.6
|
)%
|
||||||
|
MARKET SHARE SUMMARY (a)
|
Calendar Quarter Ended March 31,
|
|||||||||||
| 2018 | 2017 | |||||||||||
|
U.S. Market
|
46.5
|
% |
48.1
|
% | ||||||||
|
Canadian Market
|
54.3
|
% |
57.3
|
% | ||||||||
|
Combined North American Market
|
47.0
|
% |
48.7
|
% | ||||||||
|
(a) Source: Statistical Surveys, Inc. YTD March 31, 2018 vs. YTD March 31, 2017. Data is based on official state records and is subject to adjustment and is continuously updated.
|
||||||||||||
| Three Months | Three Months | |||||||||||
|
Ended
|
Ended
|
%
|
||||||||||
|
April 30, 2018
|
April 30, 2017
|
Change
|
||||||||||
|
NET SALES:
|
||||||||||||
|
Motorized
|
||||||||||||
|
Class A
|
$
|
273,095
|
$
|
242,770
|
12.5
|
%
|
||||||
|
Class C
|
301,303
|
282,703
|
6.6
|
%
|
||||||||
|
Class B
|
24,061
|
24,410
|
(1.4
|
)%
|
||||||||
|
Total Motorized
|
$
|
598,459
|
$
|
549,883
|
8.8
|
%
|
||||||
| Three Months | Three Months | |||||||||||
|
Ended
|
Ended
|
%
|
||||||||||
|
April 30, 2018
|
April 30, 2017
|
Change
|
||||||||||
|
# OF UNITS:
|
||||||||||||
|
Motorized
|
||||||||||||
|
Class A
|
2,471
|
2,151
|
14.9
|
%
|
||||||||
|
Class C
|
4,669
|
4,584
|
1.9
|
%
|
||||||||
|
Class B
|
176
|
192
|
(8.3
|
)%
|
||||||||
|
Total Motorized
|
7,316
|
6,927
|
5.6
|
%
|
||||||||
|
As of
|
As of
|
%
|
||||||||||
|
ORDER BACKLOG:
|
April 30, 2018
|
April 30, 2017
|
Change
|
|||||||||
|
Motorized
|
$
|
698,313
|
$
|
795,515
|
(12.2
|
)%
|
||||||
|
MARKET SHARE SUMMARY (a)
|
Calendar Quarter Ended March 31,
|
|||||||||||
|
2018
|
2017
|
|||||||||||
|
U.S. Market
|
39.8
|
% |
41.5
|
% | ||||||||
|
Canadian Market
|
56.2
|
% |
52.8
|
% | ||||||||
|
Combined North American Market
|
40.5
|
% |
42.0
|
% | ||||||||
|
(a) Source: Statistical Surveys, Inc. YTD March 31, 2018 vs. YTD March 31, 2017. Data is based on official state records and is subject to adjustment and is continuously updated.
|
||||||||||||
|
1.
|
Thor reported consolidated sales growth of 11.7% for the third quarter of 2018 versus the prior year. What factors drove this strong performance?
|
|
A.
|
Management’s execution of its strategic plan positioned Thor to achieve a record third quarter top-line performance. Thor’s third quarter revenue growth is primarily the result of the Company's timely fulfillment of dealer orders aided by recent capacity additions, production scheduling optimization and efficiency process enhancements, which allowed many of our subsidiaries to increase output from existing facilities and deliver product to our dealers on a more timely basis.
|
|
2.
|
Your third quarter revenue growth rate is lower than what was reported in prior quarters. What are the key drivers of this lower growth rate?
|
|
A.
|
Three factors influenced our growth rate over last year. First, last year's third quarter was the highest third quarter revenue ever reported by Thor. This year's 11.7% growth over last year's record performance represents strong incremental growth. Second, capacity additions over the past year allowed for higher unit production and, in turn, strong sales growth during the first two quarters. Third, our quarterly revenue growth rate cadence during the fiscal year is largely based on the timing of our dealer orders. In order to strategically position themselves for the 2018 calendar year selling season, our dealers placed higher levels of orders during the first and second quarters of fiscal 2018.
|
|
3.
|
Your third quarter gross margin decreased by 50 basis points on a year-over-year basis. What were the main factors causing this result and why was this quarter's margin performance different than the margin improvements achieved in the first and second quarters?
|
|
A.
|
As previously stated, we anticipated tougher year-over-year comparatives during the second half of the fiscal year as the significant operating efficiencies and process improvements achieved at Jayco began to materialize in the third quarter of 2017. During the quarter, we did experience an increase in warranty costs, which was due in part to providing extended coverage on certain products since the prior-year period, as well as higher claim activity incurred during the quarter. In addition, while labor costs have moderated, we are experiencing inflationary price increases in certain raw material and commodity based components due in large part to the headwinds created by the announcement and implementation of the steel and aluminum tariffs and other regulatory actions.
|
|
4.
|
Thor’s gross margin for the third quarter was 14.1% compared to 13.7% for the second quarter. What drove the increase?
|
|
A.
|
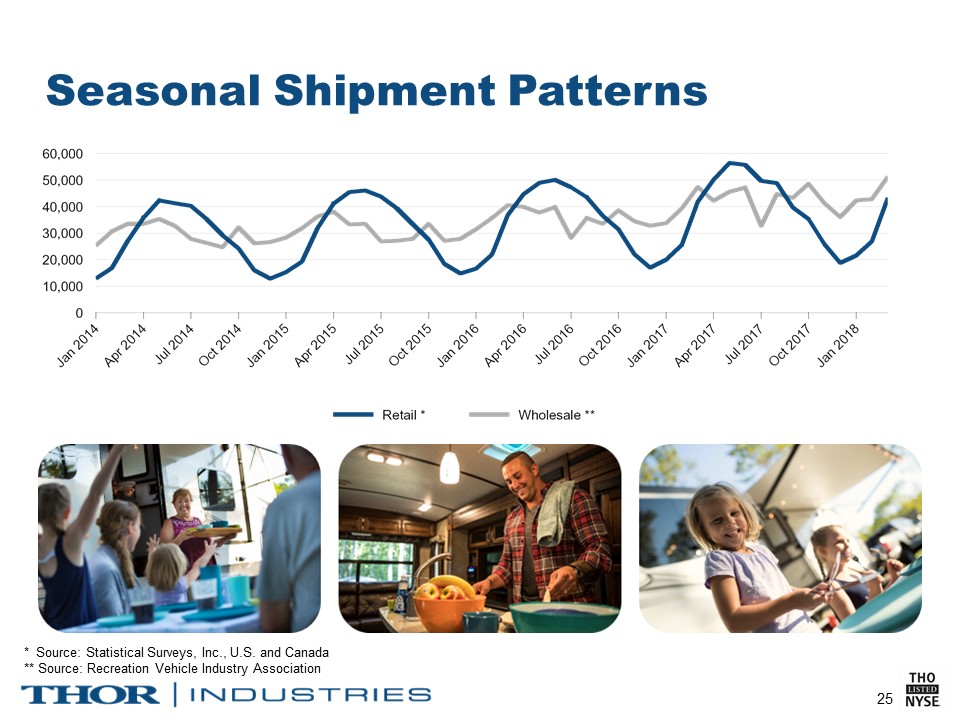
In general, our business does not lend itself to meaningful sequential analysis because of varying seasonal demand and production. While the recent strong demand for our products has translated into more steady production throughout the year, some seasonality remains. Consistent with the historic performance of our Company and the industry, our third quarter versus second quarter comparisons reflect higher production and sales volumes, which tend to favorably impact overhead absorption.
|
|
5.
|
On a percentage of sales basis, Thor’s Selling, General and Administrative (SG&A) expenses were modestly down on a year-over-year basis at approximately 5.3%. What drove this result?
|
|
A.
|
Our recent historical trend of SG&A expenses reflects a general range of 5.5% to 6.0% of net sales. The costs included in SG&A are primarily variable in nature and fluctuate with the level of sales and income before income taxes. In addition, during the third quarter of fiscal 2018, the Company recorded a decrease in deferred compensation expense, which relates to the equal and offsetting increase in "other income/(expense)" reflecting changes in our deferred compensation plan assets due to market fluctuations and investment income.
|
|
6.
|
Thor reported income before income taxes growth of 8.6% on sales growth of 11.7% for the third quarter of fiscal 2018. What drove this performance?
|
|
A.
|
Thor’s earnings performance was principally driven by a lower gross margin percent, partially offset by slightly lower SG&A, as a percent of sales, and a decrease in interest and amortization expenses.
|
|
7.
|
Thor reported net income growth of 20.2% compared to income before income taxes growth of 8.6%. What drove this performance?
|
|
A.
|
While our income before income taxes was up 8.6% from the prior year, our net income increased 20.2% as a result of our significantly lower third quarter effective tax rate of 25.9%, compared to our effective tax rate of 33.1% for the third quarter of fiscal 2017. The lower effective tax rate is a direct result of the recently enacted Tax Act. See “Current Hot Topics” section below for further discussion regarding the impact of the Tax Act.
|
|
8.
|
What are the key factors affecting current backlog levels? Are you seeing any material cancellations to orders placed earlier in the year?
|
|
A.
|
Our backlog of $2.0 billion is a reflection of current industry demand, driven in large part by new consumers adopting the RV lifestyle, as well as the positive reception from both dealers and consumers of the products we have introduced over the past year. The current backlog also reflects the improvements we have achieved in the time frame in which we deliver dealer orders. We have not experienced any material cancellations to orders placed earlier in the fiscal year by our dealers.
|
|
1.
|
Dealer inventories of Thor products are up 30.8% from last year’s third quarter. What is driving the growth in dealer inventories and are you concerned about the level of inventory held by dealers?
|
|
A.
|
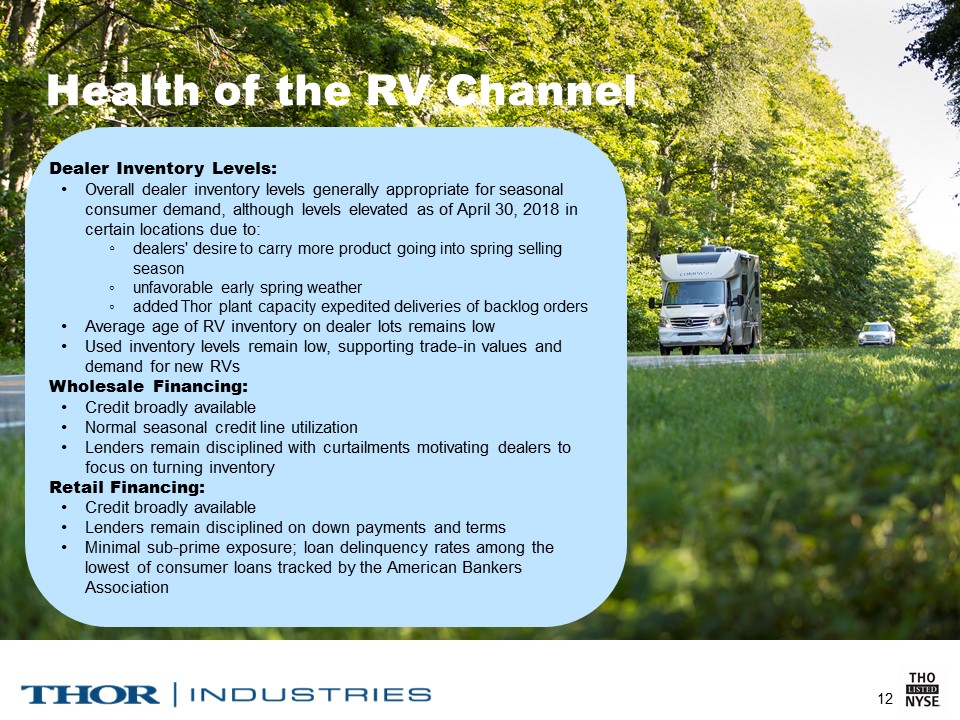
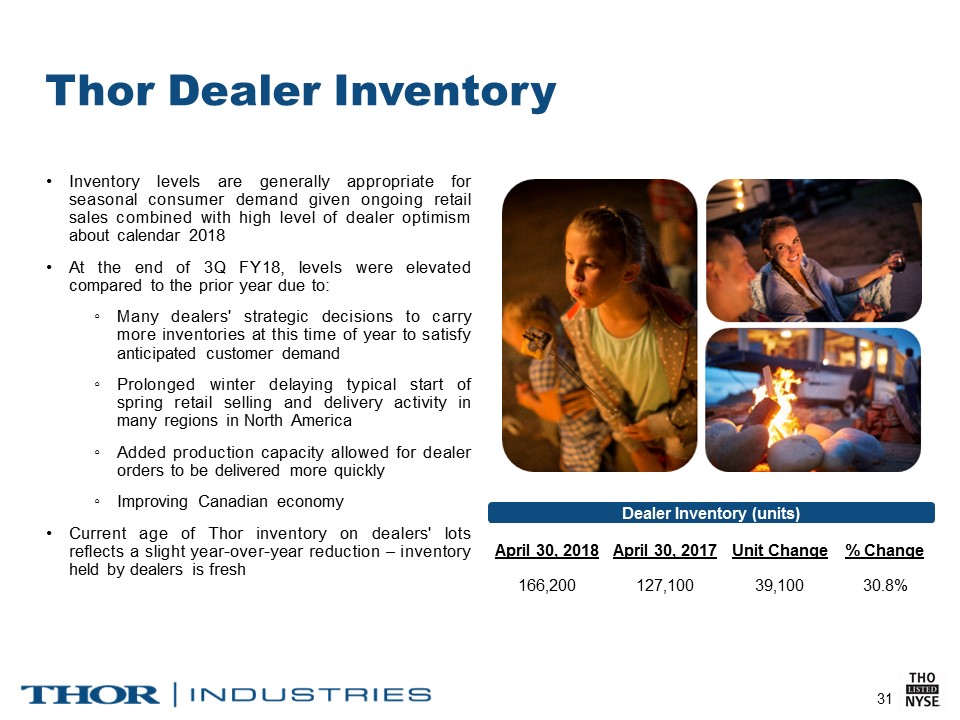
Given the ongoing retail demand for our products by dealers and consumers, as well as the high level of dealer optimism regarding the 2018 season, we believe dealer inventory levels are generally appropriate for seasonal consumer demand. However, dealer inventory levels at the end of our third quarter were elevated compared to the prior year in certain locations due to the convergence of a number of factors: (1) many dealers' strategic decisions to carry more inventory at this time of the year in order to ensure adequate levels of product on hand at the start of the Spring selling season to satisfy customer demand, (2) the prolonged Winter delaying the typical start to the spring retail selling and delivery activity for many regions of the North American market and (3) our added production capacity allowing for dealer orders to be produced and delivered more quickly in the current fiscal year. Also affecting the dealer inventory level at April 30, 2018, were our Canadian dealers, who as a result of an improving economy, are becoming more optimistic and increasing their inventory levels to reflect a recovering RV market.
|
|
2.
|
Have you experienced recent increases in commodity or raw material prices as a result of the steel and aluminum tariffs or other causes?
|
|
A.
|
We are experiencing inflationary price increases in certain raw material and commodity-based components due in large part to the headwinds created by the announcement and implementation of the steel and aluminum tariffs and other regulatory actions. We continue to work closely with our supply partners to minimize any potential price increases. We have also taken steps to address incremental costs through a combination of product decontenting, material sourcing strategies and strategic product price increases, as well as implementing efficiency improvements throughout our production processes. Historically, we have generally been able to offset net cost increases over time.
|
|
3.
|
How did the new tax reform legislation affect your results in the third quarter, fiscal 2018? What do you estimate the impact will be for the remainder of fiscal 2018 and full-year fiscal 2019?
|
|
A.
|
The Tax Act was signed into law in December 2017, and includes numerous changes to tax law impacting business, the most significant being a permanent reduction in the federal corporate income tax rate from 35.0% to 21.0%. The rate reduction took effect on January 1, 2018. As the Company’s 2018 fiscal year ends on July 31, 2018, the Company’s estimated federal corporate income tax rate for fiscal 2018 will be prorated to a blended 26.9% rate (based on the number of days in the fiscal year to which the two different rates apply). In addition, certain other provisions of the Tax Act, such as the repeal of the domestic production activities (Code Section 199) deduction and limitations on the deductibility of executive compensation, will not be effective for the Company during fiscal 2018, but will become effective starting in fiscal 2019.
|
|
4.
|
What was the strategic rationale for making the investment in the TH2 joint venture? How much did you invest in TH2? Also, what impact will the joint venture have on Thor’s earnings in 2018?
|
|
A.
|
As a leader in the recreational vehicle industry, we are constantly evaluating ways to improve the overall RV experience for the end consumer. Through this global joint venture, we believe we can offer a variety of products and services focused on enhancing the enjoyment, safety, connectivity and convenience of RV ownership and use through a digital platform that is designed for the global RV industry. As the breadth of our consumer base continues to widen, including the growth in younger consumers entering the market, we must provide them with innovative solutions to not only capture their interest, but to retain them as life-long customers. In addition to making our products more attractive to technologically savvy consumers and attracting more consumers to the RV market, we believe that TH2's functionality will provide numerous revenue streams, including subscriptions, advertisements and commissions.
|
|
1.
|
What trends are you seeing with regard to new consumers entering the RV and camping markets that support continued growth in the sector?
|
|
A.
|
There are many positive consumer trends that bode well for the long-term future of the RV industry. Some specific findings of the 2018 North American Camping Report from Kampgrounds of America (KOA) include:
|
|
•
|
More than 6 million new households have started camping since 2014, with an increase of 2.6 million new camper households in 2017.
|
|
•
|
As campers age, they generally begin to camp more using RVs. Approximately 7-in-10 current RVers are Millennials or Gen Xers.
|
|
•
|
New campers are now more diverse than the overall U.S. population, with the largest growth coming from campers of Asian descent.
|
|
•
|
In 2017, 61% of campers stayed in a tent – marking a prime target market for Thor to convert tent campers to RVers.
|
|
2.
|
What other trends are influencing growth in the RV lifestyle?
|
|
A.
|
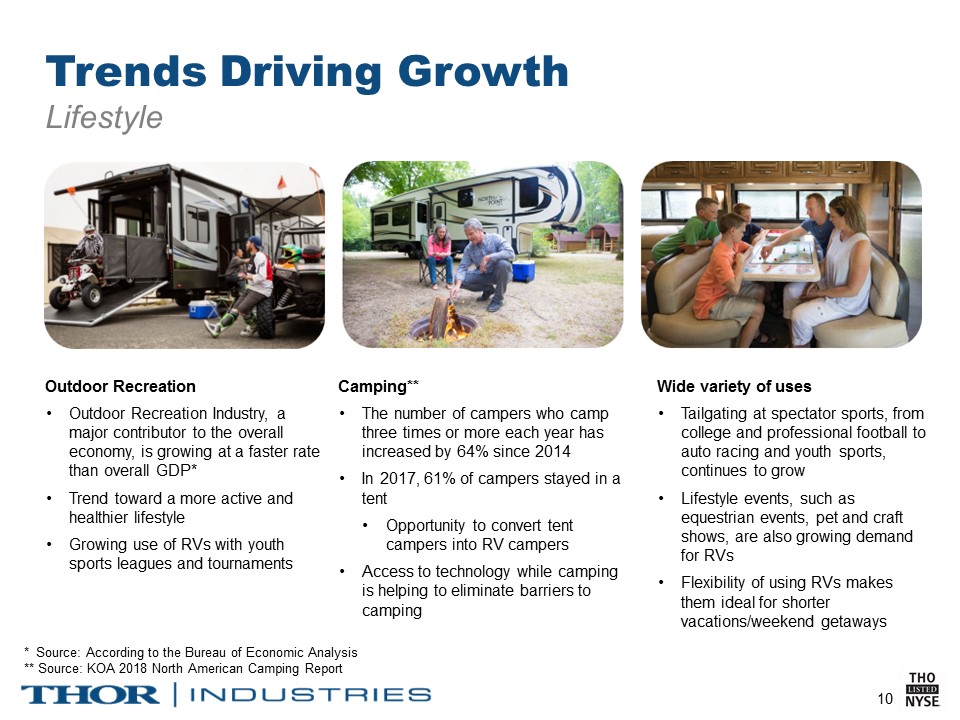
RV camping continues to be viewed as an attractive way to spend time with families and friends. Other trends driving RV growth include:
|
|
•
|
The strong correlation with the growth in recreational sports – reflecting a trend toward becoming more active and leading a healthy lifestyle, as well as a growing use of RVs with youth sports leagues and tournaments
|
|
•
|
The wide variety of RV uses, including tailgating at spectator sports, from college and professional football to auto racing and youth sports
|
|
•
|
The ability an RV provides to escape stress and relax on short notice for long weekends or other quick getaways
|
|
•
|
Key shifts in consumer travel preferences, including: the lower cost of RV vacations compared to other forms of travel, the increasing inconvenience of domestic air travel and increasing interest in more experiential vacations which often include an outdoor element
|
|
3.
|
Do you have statistical data supporting the widely-stated claim that younger buyers are entering the RV market?
|
|
A.
|
Yes – there are a number of sources that are supportive of this fact, including RVIA’s 2016 Industry Profile which references a Nielsen research study performed for Go RVingTM that found that the typical RV owner is 45 years old compared to a similar study from 2015 that indicated the typical owner was 48 years old. This study did not distinguish between owners of new versus used units, but is indicative of the reduction in the age of RV consumers. In addition, using data from Statistical Surveys, Inc., we have analyzed annual retail registrations of new RV units from 2013 through 2017 and noted that the average age of the buyer has decreased from 56 years of age in 2013 to 54 years of age in 2017. Given that over 1 million new VINs were registered during this time frame, a 2 year reduction in the average age is a meaningful age reduction over a relatively short period of time.
|
|
4.
|
How do used RVs impact the demand and pricing for new products?
|
|
A.
|
In general, used RV inventory continues to be limited, and prices remain elevated. At the same time, new products at the entry level are priced competitively and contain the features and floorplans consumers are looking for as well as a factory warranty. This combination of price and value is leading many consumers to buy new rather than used products. Robust demand for used RV inventory also enhances trade-in values. Historically, trade-in value has been one factor that supports consumers who choose to purchase new units every 3-5 years. As a result, a healthy used RV market generally has a positive impact on the overall demand for new RVs.
|
|
1.
|
How would you describe the current health of the U.S retail market?
|
|
A.
|
Now that winter has ended, current retail data suggests that the market remains strong. Our perspective of retail demand remains consistent with our operating plans and expectations entering the year. While unfavorable weather conditions in numerous markets contributed to a slower start to the retail selling and delivery season, we remain confident that continued positive economic conditions, combined with strong consumer demand fundamentals, will provide another year of meaningful retail growth. Evidence of a healthy retail marketplace is supported by year-to-date retail sales in warmer-climate/high-volume RV states (such as Texas, California and Florida), which have experienced high-single-digit to low-double-digit industry growth rates through March 2018.
|
|
2.
|
Through April of 2018, how have industry shipments to dealers performed versus the prior year? What is the current industry outlook by RVIA for industry shipments for calendar year 2018?
|
|
A.
|
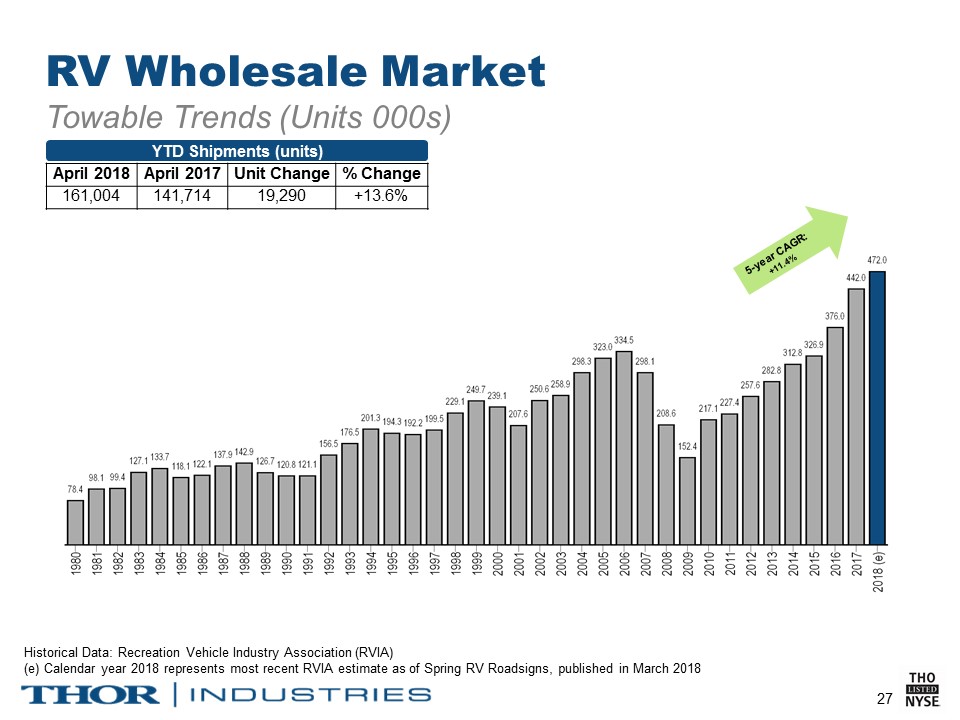
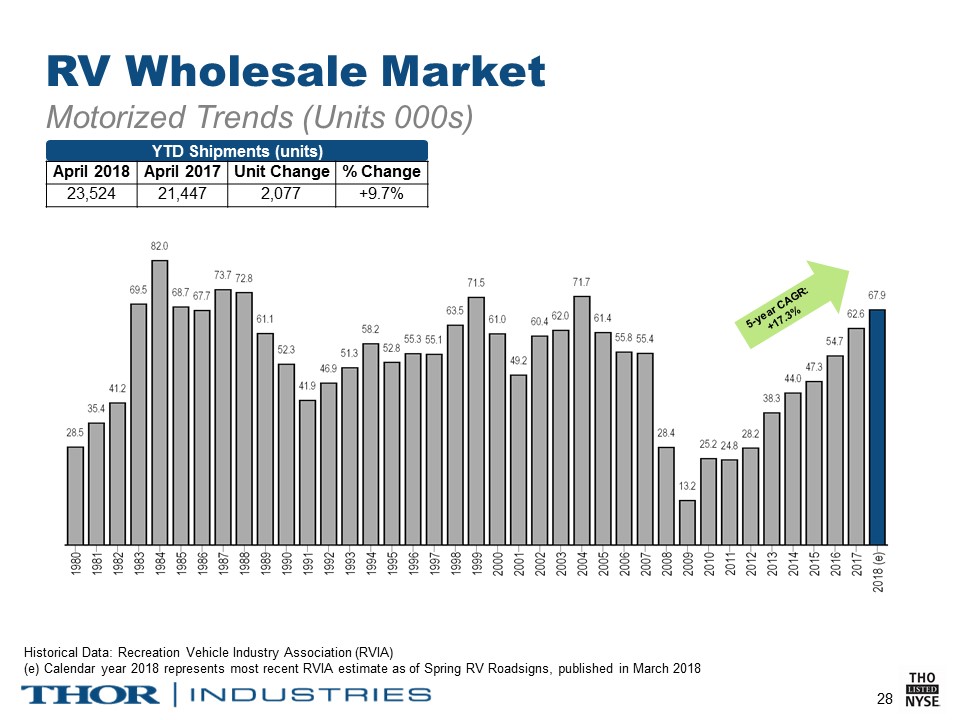
During the four months ended April 30, 2018, industry wholesale shipments to dealers continue to reflect double-digit growth. Total shipments, as reported by the RVIA, increased by 13.1%, with towable RVs up by 13.6% and motorized RVs up by 9.7%.
|
|
3.
|
What is the current state of the Canadian RV market?
|
|
A.
|
In calendar 2017, the Canadian RV industry experienced strong wholesale growth rates in sales. The Canadian Recreational Vehicle Association reported that, in 2017, shipments into Canada increased by approximately 29% over the prior year.
|
|
4.
|
What is the state of the labor market where you operate – in terms of the availability of employees to staff current and new or planned, operating facilities as well as wage inflation?
|
|
A.
|
The labor market continues to be tight in Northern Indiana, with the most acute labor tightness within the City of Elkhart. We have implemented multiple initiatives to help attract and retain the best workers and alleviate the labor force pressures. We will remain competitive when it comes to offering the right combination of wages and benefits, while at the same time managing our capacity growth with a focus on geographical areas that offer larger pools of available, quality workers. Many of our recent or announced expansions have occurred, or are planned, for areas outside of Elkhart, where the availability of labor is better. As a result of these actions, growth in consolidated labor expense has begun to moderate compared to the prior year.
|
|
5.
|
With the concentration of RV production in Northern Indiana and the continued tightness in the labor market there, have you considered establishing production in other parts of the country where labor might be more available?
|
|
A.
|
We evaluate numerous opportunities when considering capacity expansions and direct our investments to those areas that we expect will deliver the highest risk-adjusted returns. As a direct result of these evaluations, over the last two years we have completed a number of projects outside of the Northern Indiana area and we recently announced two additional major expansions that will also be outside the Northern Indiana area. Specifically, we have completed a series of expansion projects in Nampa, Idaho, for our Heartland subsidiary and recently have broken ground on an additional major expansion at our Jayco facilities in Twin Falls, Idaho. In addition, in February 2018, we announced a major expansion plan for our Airstream operations in Jackson Center, Ohio. While many of our recent expansion projects have occurred in Northern Indiana, as locations there provide the best access to our extensive base of suppliers and an experienced workforce, the majority of those expansions have been outside of the City of Elkhart where labor is the tightest. See additional expansion details under “Balance Sheet and Cash Flow”.
|
|
6.
|
Can you describe the current competitive environment?
|
|
A.
|
The RV industry remains highly competitive, as our subsidiaries and our outside competitors continue to drive the industry forward with new and better products for dealers and consumers. We are currently experiencing a slight increase in the promotional environment compared to recent periods.
|
|
7.
|
What is the nature of the current dealer and consumer credit environment?
|
|
A.
|
Both are healthy. The wholesale lending environment remains healthy, with normal seasonal credit line availability and utilization, as well as continued discipline among lenders concerning credit lines and curtailments.
|
|
8.
|
How does consolidation within the dealer base impact demand for Thor products? Do you anticipate increased pressure on margins as a result of dealer consolidation?
|
|
A.
|
Competition for dealers is inherent in our industry. Recent consolidation has not impacted this reality, nor do we expect this to significantly change. Thor’s ability to develop long-standing relationships with the most productive dealers in the market has been, and will always be, crucial to our success, with or without further consolidation.
|
|
9.
|
What is the impact of rising interest rates on retail demand for your products?
|
|
A.
|
Traditionally, we have experienced little adverse effect on retail demand from gradual, modest increases in interest rates. We remain in a historically low interest rate environment, with adequate credit availability for qualified consumers, and we expect these conditions will continue to be the case for the foreseeable future.
|
|
1.
|
What payments have you made on the debt facility in fiscal 2018? And when do you anticipate paying off the debt facility?
|
|
A.
|
We paid down the debt facility by $65.0 million during the first nine months of fiscal 2018. Our remaining debt balance was $80.0 million as of April 30, 2018, down from $145.0 million as of July 31, 2017.
|
|
2.
|
What was working capital at April 30, 2018 and April 30, 2017? What drove the change in working capital year over year?
|
|
A.
|
Working capital at April 30, 2018, was $571.8 million compared to $492.9 million at April 30, 2017. The increase of $78.9 million is primarily a result of an increase in inventory of $147.5 million, primarily due to additional production facilities and production lines added over the past year, and a $41.9 million increase in accounts receivable due to the strong increase in sales in April 2018 compared to April 2017. These increases were partially offset by an increase of $77.1 million in current liabilities, primarily accrued liabilities, and a $42.4 million decrease in cash and cash equivalents.
|
|
3.
|
Given the cash flow benefits derived from the lower tax expense, how does the Company plan to deploy these incremental funds?
|
|
A.
|
While the Tax Act is expected to increase cash flow in the future, our main priorities for the use of cash will continue to focus on the funding of our growth, both organically and through acquisition, the repayment of our remaining outstanding debt and returning value to shareholders through increasing dividends and opportunistic share repurchases. As a component of funding our growth, we anticipate making additional long-term investments in our workforce through a variety of initiatives, including enhanced employee training and development programs and other initiatives that were introduced in fiscal 2018 and will continue to be introduced in fiscal 2019 and targeted to the varying needs of our individual operating entities.
|
|
4.
|
Thor has announced a number of expansion projects over the last year. Can you provide a summary of the various expansions including when these facilities came on line or are expected to come on line?
|
|
A.
|
Capacity expansion has been, and continues to be, a key strategic focus of management. During the first nine months of fiscal 2018, we invested in numerous capital expenditure projects. Typically, a new plant may take 9 to 12 months to achieve full, consistent production rates while a new line added to an existing facility may ramp-up quicker. A summary of some of the larger production facility expansions completed during the last 12 months or anticipated to be completed in fiscal 2018 and beyond are provided below:
|
|
•
|
Heartland opened a new facility in Elkhart, IN, for its Terry, Prowler and Trail Runner travel trailers and added a second production line to its existing facility in Nampa, Idaho for Cruiser RV’s Shadow Cruiser line and Heartland’s Sundance line of travel trailers.
|
|
•
|
Jayco opened a new manufacturing facility in Middlebury, IN, for its Eagle brand travel trailers and expanded its Middlebury lamination facilities for its motorized products.
|
|
•
|
Keystone added two new production facilities in Goshen, IN, for its travel trailer brands.
|
|
•
|
Thor Motor Coach (TMC) expanded in Wakarusa, IN, with the purchase of an existing building for Class C production and made a major addition to one of its Class A plants in Elkhart, IN for a second production line for gas Class A motorhomes.
|
|
•
|
Heartland opened a new towable production facility in Middlebury, IN.
|
|
•
|
Jayco opened a new production facility in Middlebury, IN, for its Eagle brand fifth wheels.
|
|
•
|
TMC added to its Class C campus in Bristol, IN, to support its popular Quantum motorhome line.
|
|
•
|
Heartland opened a new production facility in Howe, IN, for Cruiser RV’s MPG, Radiance, Shadow Cruiser and Fun Finder laminated travel trailers.
|
|
•
|
Jayco is scheduled to open a facility in Middlebury, IN, for its Jay Flight Brand travel trailers.
|
|
•
|
Jayco is currently expanding its manufacturing footprint with a new production facility in Twin Falls, ID, to improve service to dealers in the Western US and Canada. This facility is expected to be completed in fiscal 2019.
|
|
•
|
Airstream is planning to break ground in June of 2018 on a 700,000 square foot facility, in Jackson Center, OH, that will include new production space for its iconic travel trailers as well as a state of the art training center and visitor center. The new facility is expected to be completed in fiscal 2019.
|
|
5.
|
What is Thor’s current capital expenditure estimate for fiscal 2018?
|
|
A.
|
During the first nine months of fiscal 2018, we invested over $100 million on various capital projects to support current and long-term expected growth in our businesses. We anticipate further investments of approximately $60 million during the fourth quarter of fiscal 2018 to bring the fiscal year’s total capital expenditures to approximately $160 million.
|
|
6.
|
With all your current capacity additions, do you expect the startup of production to have an adverse impact on margins?
|
|
A.
|
Generally, the startup of new or expanded towable facilities happens more quickly than the startup of motorized facilities, with lower initial costs. The startup of new facilities can temporarily increase costs as a result of training and assimilating an expanded workforce, and has, in combination with introducing new product offerings and expanding product lines, led to a short-term increase in warranty costs. Over the past few years, we have expanded a number of plants, started up a number of new plants and introduced a number of new products, and the start-up impact on our margins was generally temporary and modest. With future expansion, we would expect a similar temporary impact.
|

|
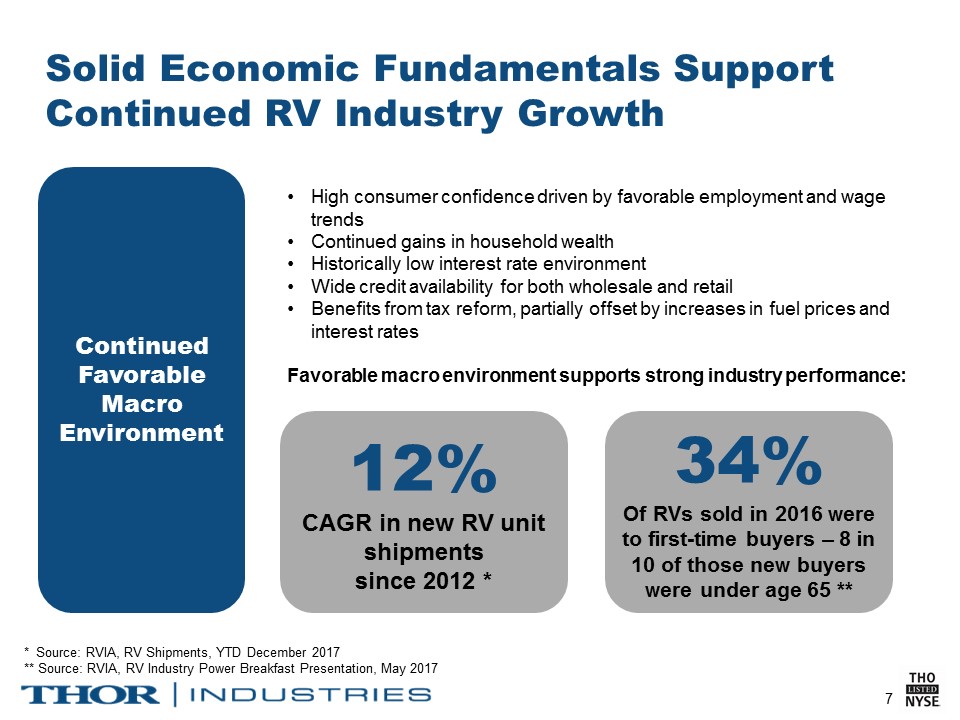
Health of North American Economy
Supports Expected Continued Market Growth
|
|
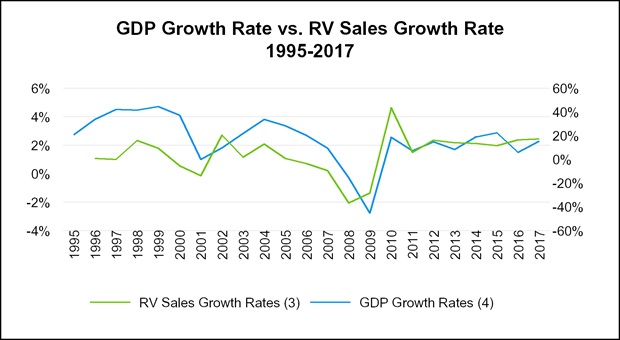
Sources: (1) Statistical Surveys, Inc.; (2) The Conference Board, Consumer Confidence Survey®; (3) Recreation Vehicle Industry Association; (4) U.S. Bureau of Economic Analysis
|
|
1.
|
What are the key factors that have been supporting the growth in the RV industry and do you anticipate this growth to continue?
|
|
A.
|
Several factors have been supporting the strong growth in the RV industry, including (1) the health of the U.S. and recently the improving Canadian economy, (2) demographic trends and lifestyle changes that are favorably contributing to RV participation and (3) the continued focus on product innovation and affordability – providing the benefits of the RV experience to a growing base of potential consumers.
|
|
•
|
A growing economy (GDP), healthy consumer confidence levels and increased discretionary consumer spending, which should continue to benefit from lower tax rates stemming from the recent enactment of the Tax Act.
|
|
•
|
Historically low interest rates with adequate credit availability, relatively stable fuel prices, favorable employment trends and a healthy housing market.
|
|
•
|
See prior page for historical correlation between RV growth and certain key economic metrics.
|
|
•
|
Increasing North American camping trends, as described earlier in this document, and further described in KOA’s 2018 annual survey report. Findings in this report reflect the growth in the number of overall campers and the frequency in which they camp, as well as a younger and more diverse group of new participants. Specifically, Millennials comprised 31% of the total population in the most recent census, yet accounted for 40% of the total campers in 2017, which increased from 38% of the total campers in 2016, and 34% in 2015.
|
|
•
|
New consumers continue to adopt the RV lifestyle. Per the Recreational Vehicle Industry Association: 34% of RVs sold in 2016 were to first-time buyers, with 80% of those new buyers under age 65. New consumers continue to adopt the RV lifestyle.
|
|
•
|
An expanding array of uses for RVs are driving incremental demand – such as outdoor recreation (an increasing contributor to overall U.S. GDP), tailgating at spectator sports and other lifestyle events.
|
|
•
|
Award winning products across the entire price spectrum, reflecting innovative and contemporary floor plans and designs, as well as improved control systems and technologies.
|
|
2.
|
What is your outlook for Thor for the remainder of fiscal year 2018?
|
|
A.
|
Solid year-over-year growth of retail registrations is expected to continue throughout both our fiscal year 2018 and calendar 2018, as we and our dealers remain optimistic about current and near-term economic conditions and new consumers entering the RV market. Through March 2018, U.S. retail registrations are up 8% over the prior year period. We are also encouraged by recent order trends related to our higher-end products, including larger diesel Class A motorhomes, fifth wheels and Airstream products. Demand for Airstream products in particular remains very robust and supports our plans to expand this facility.
|
|
3.
|
What are your strategic plans for the remainder of fiscal 2018 and beyond?
|
|
A.
|
We will remain primarily focused on driving organic growth in our current businesses through investments in prudent capacity additions, technology and product innovation. We believe our Company is well positioned to simultaneously return value to shareholders, while at the same time funding long-term global growth opportunities. Consistent with previous strategic actions taken by the Company, our investment criteria for growth opportunities will generally include a strong marketplace position, successful operations with strong management, accretive to earnings and an overall strategic fit with Thor Industries. By successfully executing our overall strategic plan, we will continue to enhance shareholder value over time.
|