Form 8-K CITIZENS FINANCIAL GROUP For: May 29
UNITED STATES
SECURITIES AND EXCHANGE COMMISSION
WASHINGTON, D.C. 20549
FORM 8-K
CURRENT REPORT
PURSUANT TO SECTION 13 OR 15(d)
OF THE SECURITIES EXCHANGE ACT OF 1934
Date of Report (Date of earliest event reported): May 29, 2018
CITIZENS FINANCIAL GROUP, INC.
(Exact name of registrant as specified in its charter)
| Delaware | 001-36636 | 05-0412693 | ||
| (State or other jurisdiction of incorporation) |
(Commission File No.) |
(IRS Employer Identification No.) | ||
| One Citizens Plaza Providence, RI |
02903 | |||
| (Address of principal executive offices) | (Zip code) | |||
Registrant’s telephone number, including area code: (401) 456-7000
Not Applicable
(Former name or former address, if changed since last report.)
Check the appropriate box below if the Form 8-K filing is intended to simultaneously satisfy the filing obligation of the registrant under any of the following provisions:
| ☐ | Written communications pursuant to Rule 425 under the Securities Act (17 CFR 230.425) |
| ☐ | Soliciting material pursuant to Rule 14a-12 under the Exchange Act (17 CFR 240.14a-12) |
| ☐ | Pre-commencement communications pursuant to Rule 14d-2(b) under the Exchange Act (17 CFR 240.14d-2(b)) |
| ☐ | Pre-commencement communications pursuant to Rule 13e-4(c) under the Exchange Act (17 CFR 240.13e-4(c)) |
Indicate by check mark whether the registrant is an emerging growth company as defined in Rule 405 under the Securities Act (17 CFR 230.405) or Rule 12b-2 under the Exchange Act (17 CFR 240.12b-2).
Emerging growth company ☐
If an emerging growth company, indicate by check mark if the registrant has elected not to use the extended transition period for complying with any new or revised financial accounting standards provided pursuant to Section 13(a) of the Exchange Act. ☐
| Item 7.01 | Regulation FD Disclosure. |
Citizens Financial Group, Inc.‘s Vice Chairman and Head of Commercial Banking, Don McCree, will present at the Deutsche Bank Global Financial Services Conference on Tuesday, May 29, 2018 at 10:10 a.m. ET. The live webcast and presentation slides will be available at http://investor.citizensbank.com under Events & Presentations. A replay of the webcast will be available for 30 days.
A copy of the presentation is attached as Exhibit 99.1. The information furnished pursuant to Item 7.01, including Exhibit 99.1, shall not be deemed “filed” for purposes of Section 18 of the Securities Exchange Act of 1934 (the “Exchange Act”) or otherwise subject to the liabilities under that Section and shall not be deemed to be incorporated by reference into any filing of the Registrant under the Securities Act of 1933 or the Exchange Act.
| Item 9.01 | Financial Statements and Exhibits. |
| Exhibit Number |
Description | |||
| (d) | Exhibit 99.1 | Citizens Financial Group, Inc. presentation dated May 29, 2018 | ||
SIGNATURES
Pursuant to the requirements of the Securities Exchange Act of 1934, the registrant has duly caused this report to be signed on its behalf by the undersigned hereunto duly authorized.
| CITIZENS FINANCIAL GROUP, INC. | ||
| By: | /s/ John F. Woods | |
| John F. Woods | ||
| Chief Financial Officer | ||
Date: May 29, 2018
Deutsche Bank Global Financial Services Conference May 29, 2018 Don McCree Vice Chairman, Head of Commercial Banking Exhibit 99.1
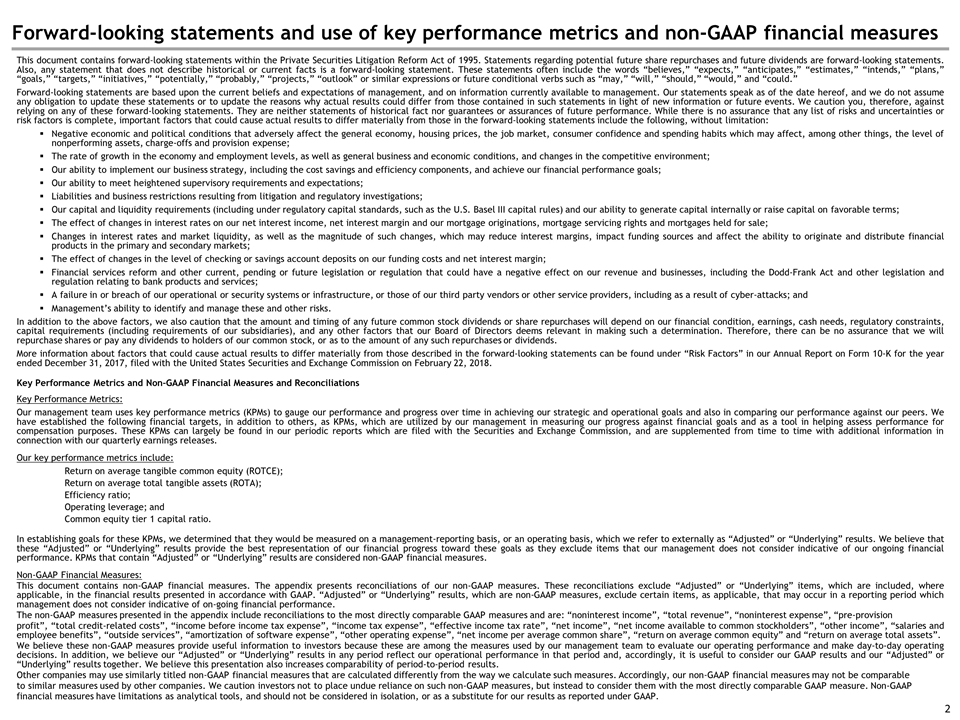
Forward-looking statements and use of key performance metrics and non-GAAP financial measures This document contains forward-looking statements within the Private Securities Litigation Reform Act of 1995. Statements regarding potential future share repurchases and future dividends are forward-looking statements. Also, any statement that does not describe historical or current facts is a forward-looking statement. These statements often include the words “believes,” “expects,” “anticipates,” “estimates,” “intends,” “plans,” “goals,” “targets,” “initiatives,” “potentially,” “probably,” “projects,” “outlook” or similar expressions or future conditional verbs such as “may,” “will,” “should,” “would,” and “could.” Forward-looking statements are based upon the current beliefs and expectations of management, and on information currently available to management. Our statements speak as of the date hereof, and we do not assume any obligation to update these statements or to update the reasons why actual results could differ from those contained in such statements in light of new information or future events. We caution you, therefore, against relying on any of these forward-looking statements. They are neither statements of historical fact nor guarantees or assurances of future performance. While there is no assurance that any list of risks and uncertainties or risk factors is complete, important factors that could cause actual results to differ materially from those in the forward-looking statements include the following, without limitation: Negative economic and political conditions that adversely affect the general economy, housing prices, the job market, consumer confidence and spending habits which may affect, among other things, the level of nonperforming assets, charge-offs and provision expense; The rate of growth in the economy and employment levels, as well as general business and economic conditions, and changes in the competitive environment; Our ability to implement our business strategy, including the cost savings and efficiency components, and achieve our financial performance goals; Our ability to meet heightened supervisory requirements and expectations; Liabilities and business restrictions resulting from litigation and regulatory investigations; Our capital and liquidity requirements (including under regulatory capital standards, such as the U.S. Basel III capital rules) and our ability to generate capital internally or raise capital on favorable terms; The effect of changes in interest rates on our net interest income, net interest margin and our mortgage originations, mortgage servicing rights and mortgages held for sale; Changes in interest rates and market liquidity, as well as the magnitude of such changes, which may reduce interest margins, impact funding sources and affect the ability to originate and distribute financial products in the primary and secondary markets; The effect of changes in the level of checking or savings account deposits on our funding costs and net interest margin; Financial services reform and other current, pending or future legislation or regulation that could have a negative effect on our revenue and businesses, including the Dodd-Frank Act and other legislation and regulation relating to bank products and services; A failure in or breach of our operational or security systems or infrastructure, or those of our third party vendors or other service providers, including as a result of cyber-attacks; and Management’s ability to identify and manage these and other risks. In addition to the above factors, we also caution that the amount and timing of any future common stock dividends or share repurchases will depend on our financial condition, earnings, cash needs, regulatory constraints, capital requirements (including requirements of our subsidiaries), and any other factors that our Board of Directors deems relevant in making such a determination. Therefore, there can be no assurance that we will repurchase shares or pay any dividends to holders of our common stock, or as to the amount of any such repurchases or dividends. More information about factors that could cause actual results to differ materially from those described in the forward-looking statements can be found under “Risk Factors” in our Annual Report on Form 10-K for the year ended December 31, 2017, filed with the United States Securities and Exchange Commission on February 22, 2018. Key Performance Metrics and Non-GAAP Financial Measures and Reconciliations Key Performance Metrics: Our management team uses key performance metrics (KPMs) to gauge our performance and progress over time in achieving our strategic and operational goals and also in comparing our performance against our peers. We have established the following financial targets, in addition to others, as KPMs, which are utilized by our management in measuring our progress against financial goals and as a tool in helping assess performance for compensation purposes. These KPMs can largely be found in our periodic reports which are filed with the Securities and Exchange Commission, and are supplemented from time to time with additional information in connection with our quarterly earnings releases. Our key performance metrics include: Return on average tangible common equity (ROTCE); Return on average total tangible assets (ROTA); Efficiency ratio; Operating leverage; and Common equity tier 1 capital ratio. In establishing goals for these KPMs, we determined that they would be measured on a management-reporting basis, or an operating basis, which we refer to externally as “Adjusted” or “Underlying” results. We believe that these “Adjusted” or “Underlying” results provide the best representation of our financial progress toward these goals as they exclude items that our management does not consider indicative of our ongoing financial performance. KPMs that contain “Adjusted” or “Underlying” results are considered non-GAAP financial measures. Non-GAAP Financial Measures: This document contains non-GAAP financial measures. The appendix presents reconciliations of our non-GAAP measures. These reconciliations exclude “Adjusted” or “Underlying” items, which are included, where applicable, in the financial results presented in accordance with GAAP. “Adjusted” or “Underlying” results, which are non-GAAP measures, exclude certain items, as applicable, that may occur in a reporting period which management does not consider indicative of on-going financial performance. The non-GAAP measures presented in the appendix include reconciliations to the most directly comparable GAAP measures and are: “noninterest income”, “total revenue”, “noninterest expense”, “pre-provision profit”, “total credit-related costs”, “income before income tax expense”, “income tax expense”, “effective income tax rate”, “net income”, “net income available to common stockholders”, “other income”, “salaries and employee benefits”, “outside services”, “amortization of software expense”, “other operating expense”, “net income per average common share”, “return on average common equity” and “return on average total assets”. We believe these non-GAAP measures provide useful information to investors because these are among the measures used by our management team to evaluate our operating performance and make day-to-day operating decisions. In addition, we believe our “Adjusted” or “Underlying” results in any period reflect our operational performance in that period and, accordingly, it is useful to consider our GAAP results and our “Adjusted” or “Underlying” results together. We believe this presentation also increases comparability of period-to-period results. Other companies may use similarly titled non-GAAP financial measures that are calculated differently from the way we calculate such measures. Accordingly, our non-GAAP financial measures may not be comparable to similar measures used by other companies. We caution investors not to place undue reliance on such non-GAAP measures, but instead to consider them with the most directly comparable GAAP measure. Non-GAAP financial measures have limitations as analytical tools, and should not be considered in isolation, or as a substitute for our results as reported under GAAP.
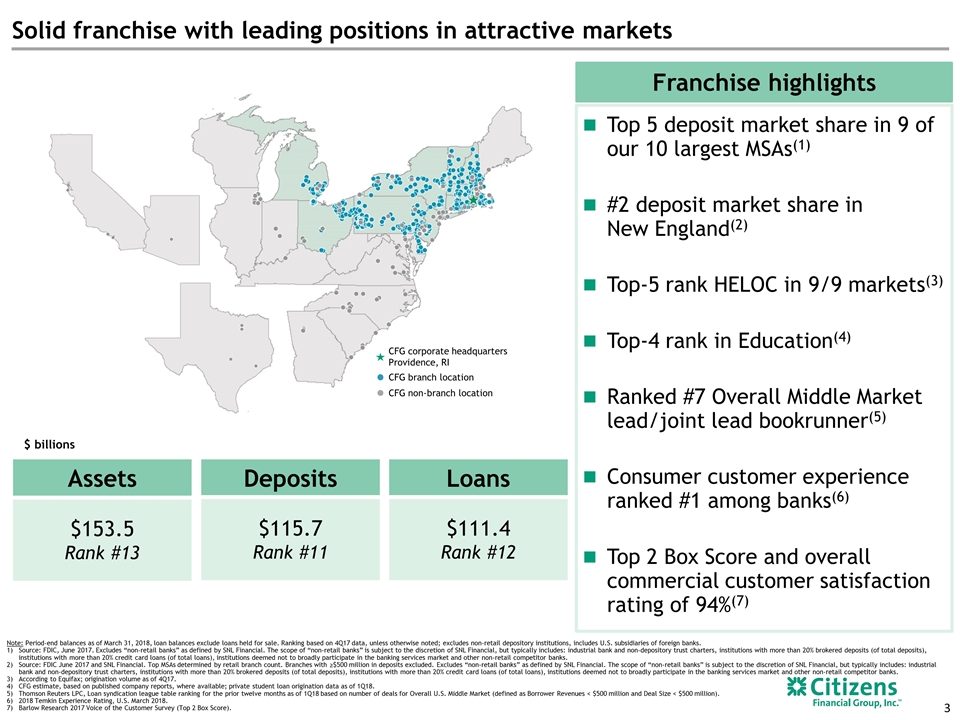
Solid franchise with leading positions in attractive markets CFG corporate headquarters Providence, RI CFG branch location CFG non-branch location Assets $153.5 Rank #13 Loans $111.4 Rank #12 Deposits $115.7 Rank #11 Top 5 deposit market share in 9 of our 10 largest MSAs(1) #2 deposit market share in New England(2) Top-5 rank HELOC in 9/9 markets(3) Top-4 rank in Education(4) Ranked #7 Overall Middle Market lead/joint lead bookrunner(5) Consumer customer experience ranked #1 among banks(6) Top 2 Box Score and overall commercial customer satisfaction rating of 94%(7) Franchise highlights $ billions Note: Period-end balances as of March 31, 2018, loan balances exclude loans held for sale. Ranking based on 4Q17 data, unless otherwise noted; excludes non-retail depository institutions, includes U.S. subsidiaries of foreign banks. Source: FDIC, June 2017. Excludes “non-retail banks” as defined by SNL Financial. The scope of “non-retail banks” is subject to the discretion of SNL Financial, but typically includes: industrial bank and non-depository trust charters, institutions with more than 20% brokered deposits (of total deposits), institutions with more than 20% credit card loans (of total loans), institutions deemed not to broadly participate in the banking services market and other non-retail competitor banks. Source: FDIC June 2017 and SNL Financial. Top MSAs determined by retail branch count. Branches with ≥$500 million in deposits excluded. Excludes “non-retail banks” as defined by SNL Financial. The scope of “non-retail banks” is subject to the discretion of SNL Financial, but typically includes: industrial bank and non-depository trust charters, institutions with more than 20% brokered deposits (of total deposits), institutions with more than 20% credit card loans (of total loans), institutions deemed not to broadly participate in the banking services market and other non-retail competitor banks. According to Equifax; origination volume as of 4Q17. CFG estimate, based on published company reports, where available; private student loan origination data as of 1Q18. Thomson Reuters LPC, Loan syndication league table ranking for the prior twelve months as of 1Q18 based on number of deals for Overall U.S. Middle Market (defined as Borrower Revenues < $500 million and Deal Size < $500 million). 2018 Temkin Experience Rating, U.S. March 2018. Barlow Research 2017 Voice of the Customer Survey (Top 2 Box Score).
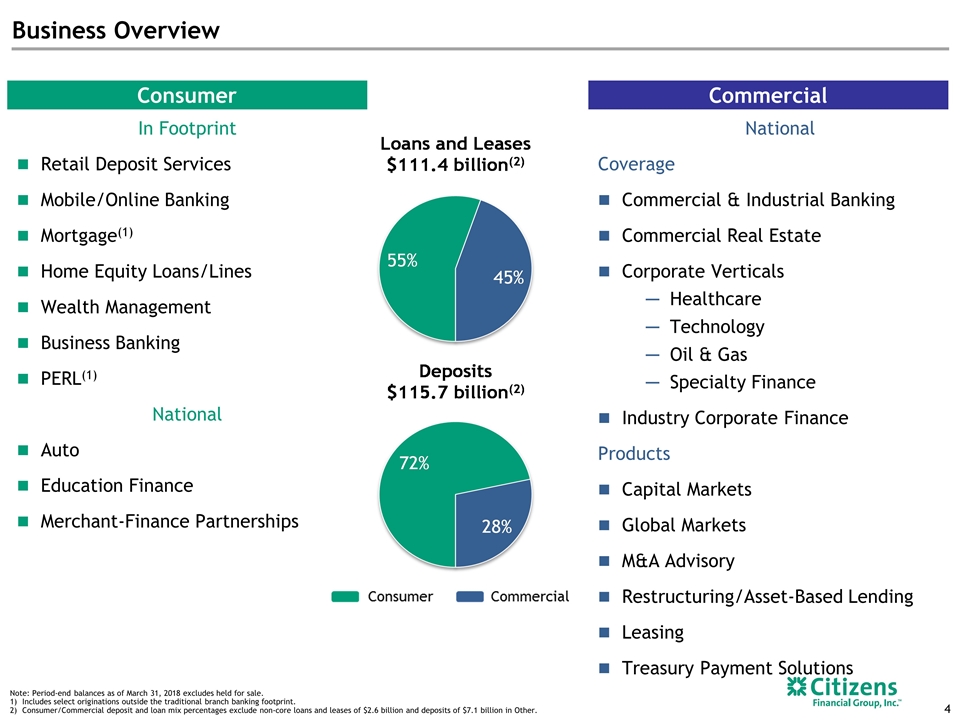
Business Overview Consumer In Footprint Retail Deposit Services Mobile/Online Banking Mortgage(1) Home Equity Loans/Lines Wealth Management Business Banking PERL(1) National Auto Education Finance Merchant-Finance Partnerships Commercial National Coverage Commercial & Industrial Banking Commercial Real Estate Corporate Verticals Healthcare Technology Oil & Gas Specialty Finance Industry Corporate Finance Products Capital Markets Global Markets M&A Advisory Restructuring/Asset-Based Lending Leasing Treasury Payment Solutions Note: Period-end balances as of March 31, 2018 excludes held for sale. Includes select originations outside the traditional branch banking footprint. Consumer/Commercial deposit and loan mix percentages exclude non-core loans and leases of $2.6 billion and deposits of $7.1 billion in Other.
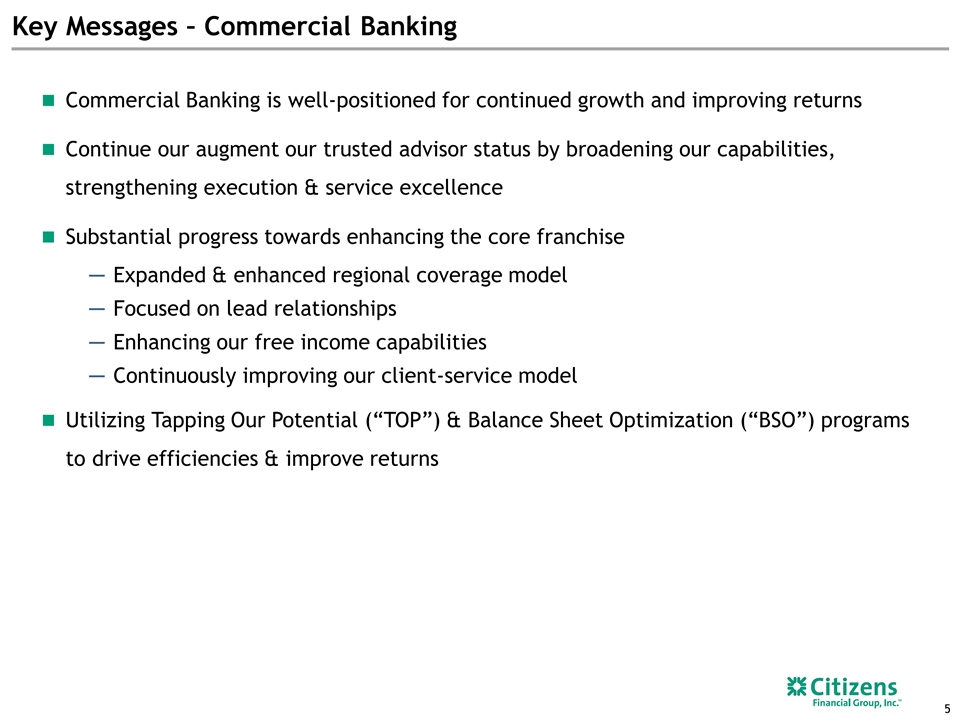
Key Messages – Commercial Banking Commercial Banking is well-positioned for continued growth and improving returns Continue our augment our trusted advisor status by broadening our capabilities, strengthening execution & service excellence Substantial progress towards enhancing the core franchise Expanded & enhanced regional coverage model Focused on lead relationships Enhancing our free income capabilities Continuously improving our client-service model Utilizing Tapping Our Potential (“TOP”) & Balance Sheet Optimization (“BSO”) programs to drive efficiencies & improve returns
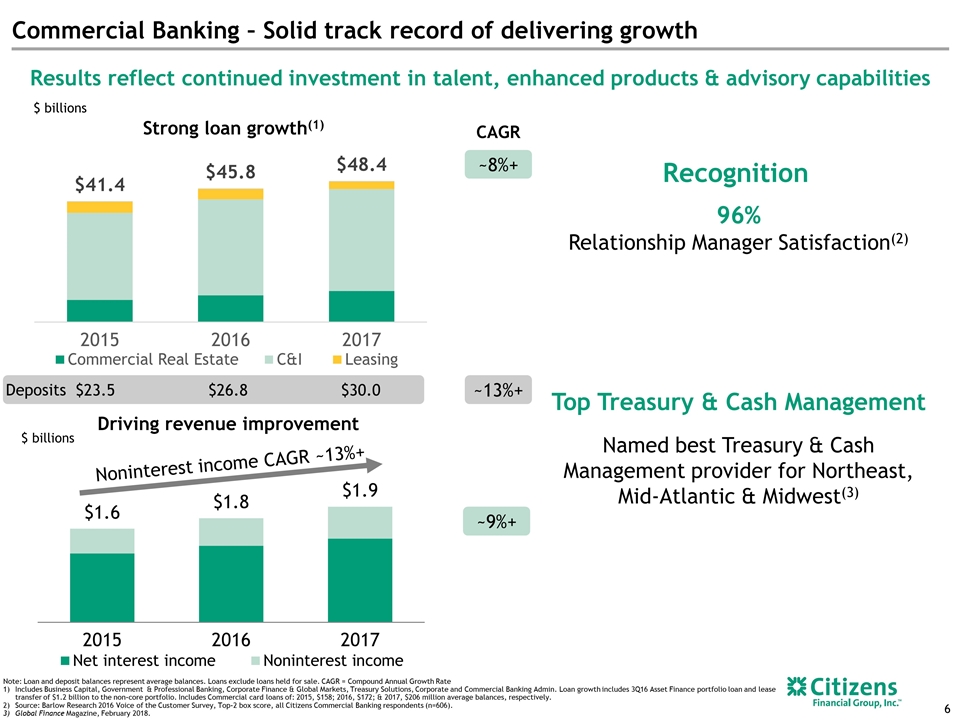
$23.5 $26.8 $30.0 Commercial Banking – Solid track record of delivering growth Note: Loan and deposit balances represent average balances. Loans exclude loans held for sale. CAGR = Compound Annual Growth Rate Includes Business Capital, Government & Professional Banking, Corporate Finance & Global Markets, Treasury Solutions, Corporate and Commercial Banking Admin. Loan growth includes 3Q16 Asset Finance portfolio loan and lease transfer of $1.2 billion to the non-core portfolio. Includes Commercial card loans of: 2015, $158; 2016, $172; & 2017, $206 million average balances, respectively. Source: Barlow Research 2016 Voice of the Customer Survey, Top-2 box score, all Citizens Commercial Banking respondents (n=606). Global Finance Magazine, February 2018. $ billions Driving revenue improvement ~10% growth ~20% growth Results reflect continued investment in talent, enhanced products & advisory capabilities ~13%+ ~8%+ ~9%+ Noninterest income CAGR ~13%+ CAGR Strong loan growth(1) 96% Relationship Manager Satisfaction(2) Top Treasury & Cash Management Named best Treasury & Cash Management provider for Northeast, Mid-Atlantic & Midwest(3) Recognition Deposits $ billions
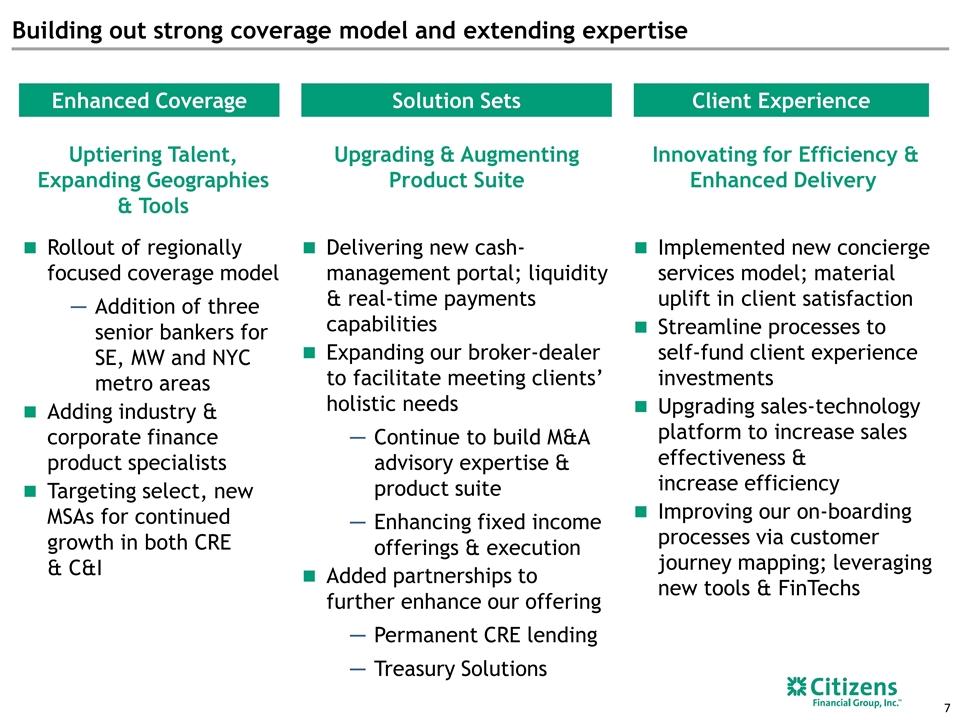
Building out strong coverage model and extending expertise Uptiering Talent, Expanding Geographies & Tools Rollout of regionally focused coverage model Addition of three senior bankers for SE, MW and NYC metro areas Adding industry & corporate finance product specialists Targeting select, new MSAs for continued growth in both CRE & C&I Enhanced Coverage Solution Sets Upgrading & Augmenting Product Suite Delivering new cash-management portal; liquidity & real-time payments capabilities Expanding our broker-dealer to facilitate meeting clients’ holistic needs Continue to build M&A advisory expertise & product suite Enhancing fixed income offerings & execution Added partnerships to further enhance our offering Permanent CRE lending Treasury Solutions Client Experience Innovating for Efficiency & Enhanced Delivery Implemented new concierge services model; material uplift in client satisfaction Streamline processes to self-fund client experience investments Upgrading sales-technology platform to increase sales effectiveness & increase efficiency Improving our on-boarding processes via customer journey mapping; leveraging new tools & FinTechs
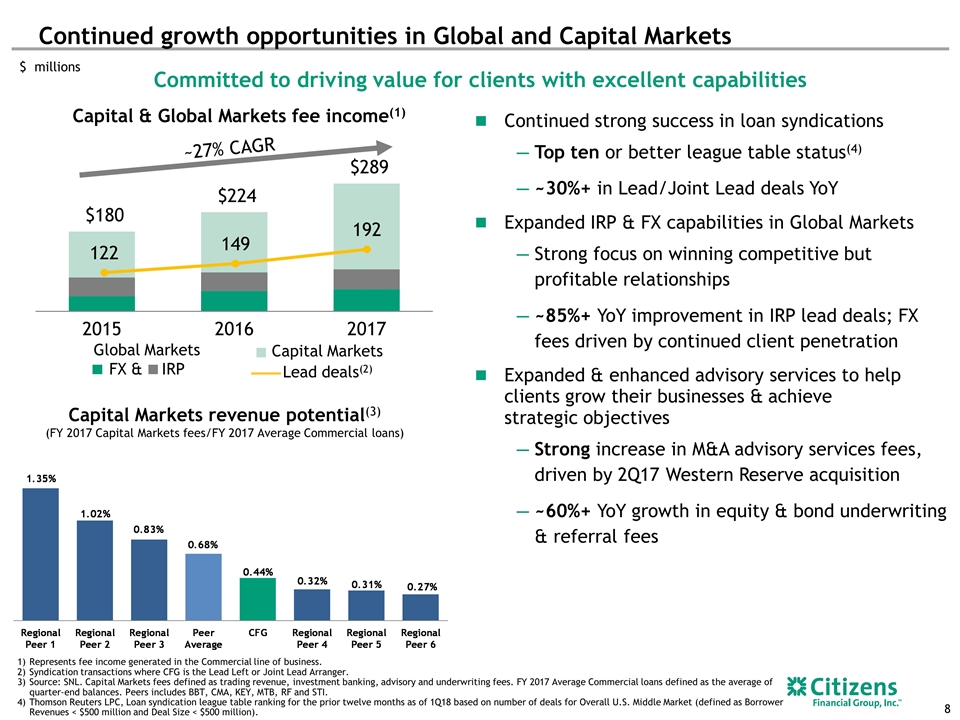
Continued strong success in loan syndications Top ten or better league table status(4) ~30%+ in Lead/Joint Lead deals YoY Expanded IRP & FX capabilities in Global Markets Strong focus on winning competitive but profitable relationships ~85%+ YoY improvement in IRP lead deals; FX fees driven by continued client penetration Expanded & enhanced advisory services to help clients grow their businesses & achieve strategic objectives Strong increase in M&A advisory services fees, driven by 2Q17 Western Reserve acquisition ~60%+ YoY growth in equity & bond underwriting & referral fees Represents fee income generated in the Commercial line of business. Syndication transactions where CFG is the Lead Left or Joint Lead Arranger. Source: SNL. Capital Markets fees defined as trading revenue, investment banking, advisory and underwriting fees. FY 2017 Average Commercial loans defined as the average of quarter-end balances. Peers includes BBT, CMA, KEY, MTB, RF and STI. Thomson Reuters LPC, Loan syndication league table ranking for the prior twelve months as of 1Q18 based on number of deals for Overall U.S. Middle Market (defined as Borrower Revenues < $500 million and Deal Size < $500 million). Continued growth opportunities in Global and Capital Markets Capital Markets revenue potential(3) (FY 2017 Capital Markets fees/FY 2017 Average Commercial loans) $ millions Lead deals(2) ~27% CAGR Global Markets FX & IRP Capital Markets Committed to driving value for clients with excellent capabilities Capital & Global Markets fee income(1)
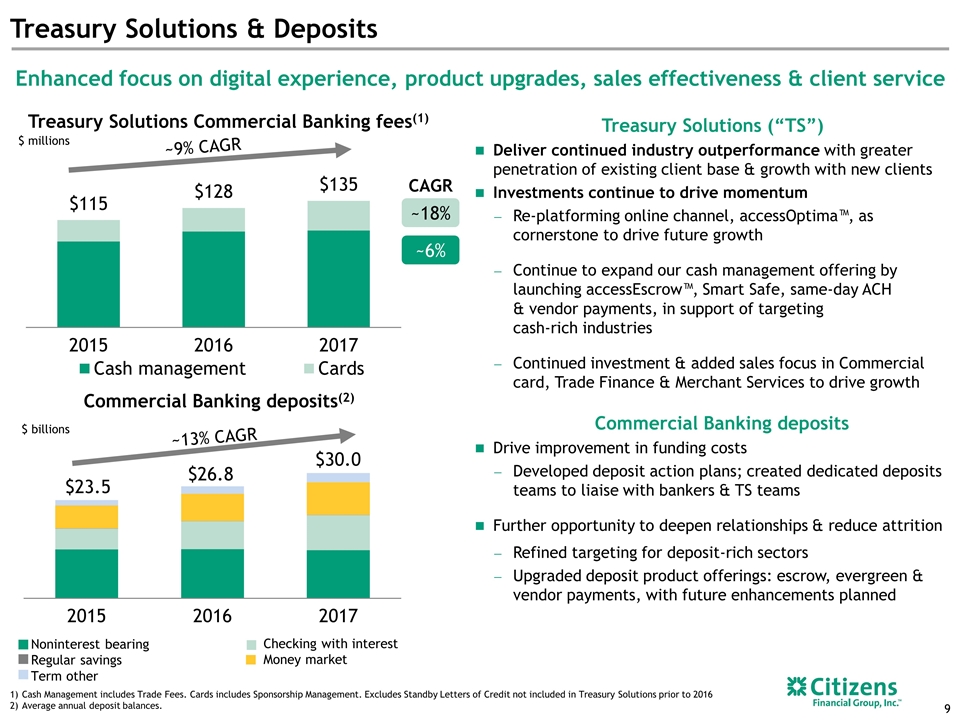
Treasury Solutions (“TS”) Deliver continued industry outperformance with greater penetration of existing client base & growth with new clients Investments continue to drive momentum Re-platforming online channel, accessOptima™, as cornerstone to drive future growth Continue to expand our cash management offering by launching accessEscrow™, Smart Safe, same-day ACH & vendor payments, in support of targeting cash-rich industries Continued investment & added sales focus in Commercial card, Trade Finance & Merchant Services to drive growth Commercial Banking deposits Drive improvement in funding costs Developed deposit action plans; created dedicated deposits teams to liaise with bankers & TS teams Further opportunity to deepen relationships & reduce attrition Refined targeting for deposit-rich sectors Upgraded deposit product offerings: escrow, evergreen & vendor payments, with future enhancements planned Treasury Solutions & Deposits Enhanced focus on digital experience, product upgrades, sales effectiveness & client service Treasury Solutions Commercial Banking fees(1) $ millions ~9% CAGR CAGR ~18% ~6% Commercial Banking deposits(2) Noninterest bearing Regular savings Term other Checking with interest Money market ~13% CAGR Cash Management includes Trade Fees. Cards includes Sponsorship Management. Excludes Standby Letters of Credit not included in Treasury Solutions prior to 2016 Average annual deposit balances. $ billions
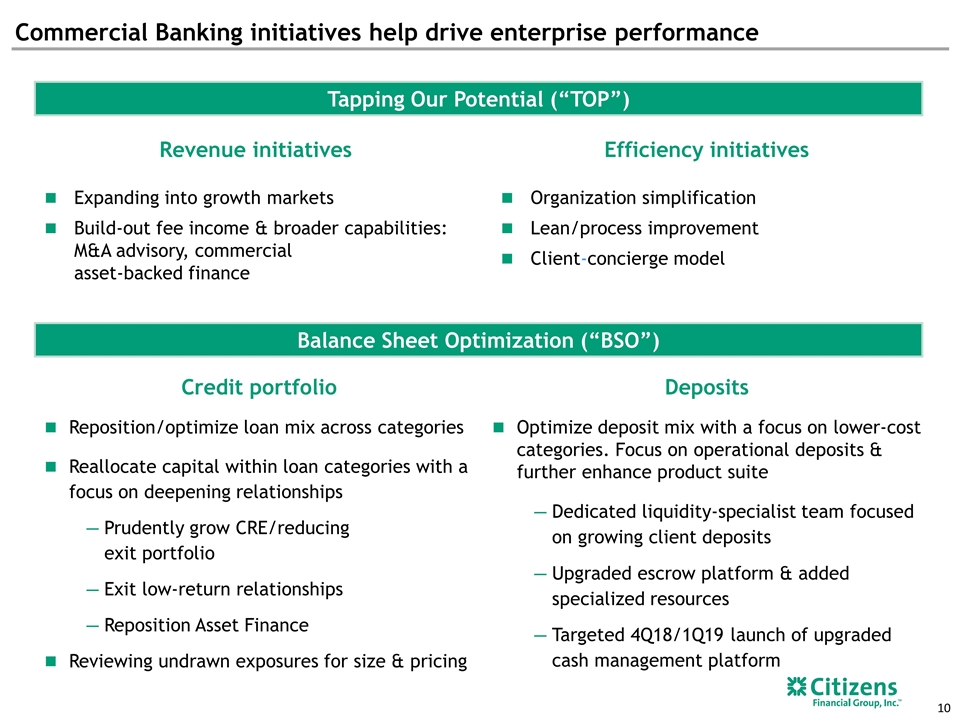
Commercial Banking initiatives help drive enterprise performance Credit portfolio Reposition/optimize loan mix across categories Reallocate capital within loan categories with a focus on deepening relationships Prudently grow CRE/reducing exit portfolio Exit low-return relationships Reposition Asset Finance Reviewing undrawn exposures for size & pricing Deposits Optimize deposit mix with a focus on lower-cost categories. Focus on operational deposits & further enhance product suite Dedicated liquidity-specialist team focused on growing client deposits Upgraded escrow platform & added specialized resources Targeted 4Q18/1Q19 launch of upgraded cash management platform Efficiency initiatives Organization simplification Lean/process improvement Client-concierge model Revenue initiatives Expanding into growth markets Build-out fee income & broader capabilities: M&A advisory, commercial asset-backed finance Tapping Our Potential (“TOP”) Balance Sheet Optimization (“BSO”)
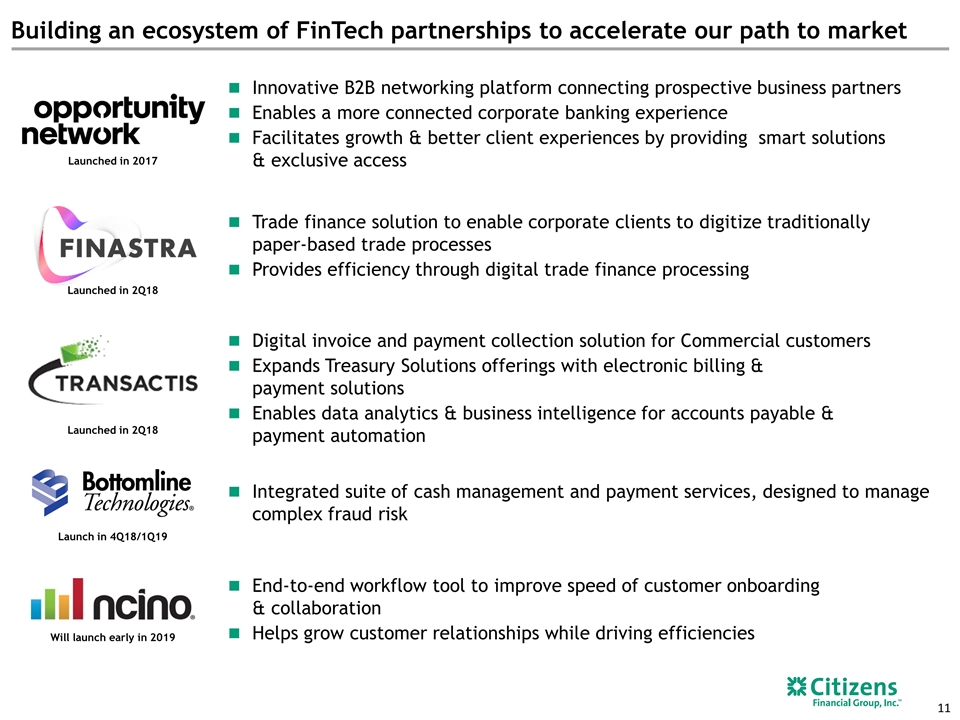
Digital invoice and payment collection solution for Commercial customers Expands Treasury Solutions offerings with electronic billing & payment solutions Enables data analytics & business intelligence for accounts payable & payment automation Launched in 2Q18 Will launch early in 2019 Building an ecosystem of FinTech partnerships to accelerate our path to market Launched in 2Q18 Launch in 4Q18/1Q19 Trade finance solution to enable corporate clients to digitize traditionally paper-based trade processes Provides efficiency through digital trade finance processing Innovative B2B networking platform connecting prospective business partners Enables a more connected corporate banking experience Facilitates growth & better client experiences by providing smart solutions & exclusive access End-to-end workflow tool to improve speed of customer onboarding & collaboration Helps grow customer relationships while driving efficiencies Integrated suite of cash management and payment services, designed to manage complex fraud risk Launched in 2017
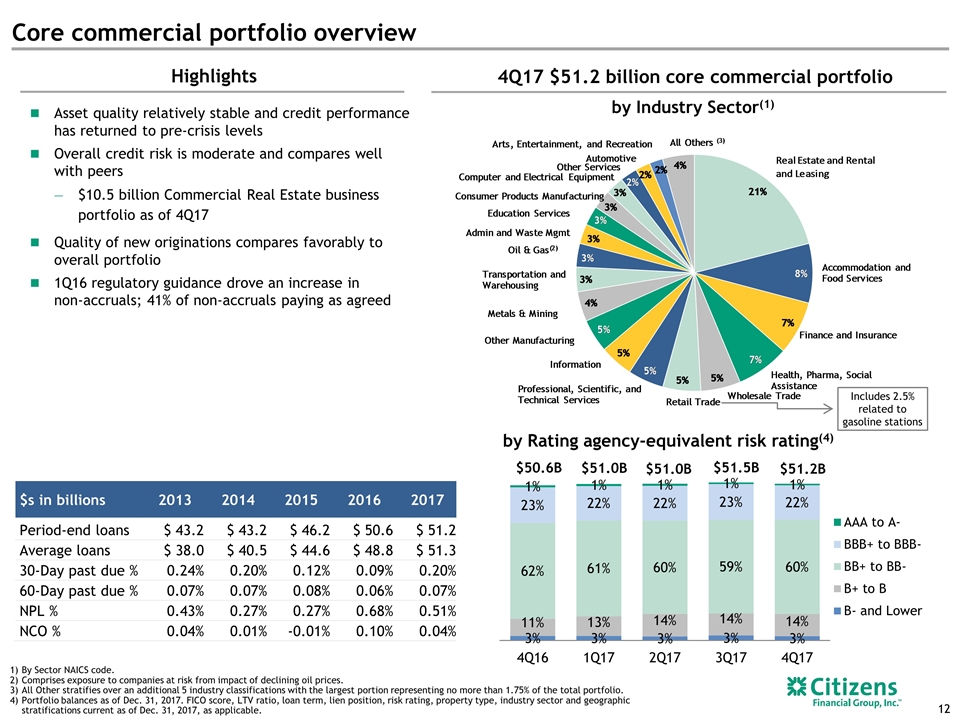
Core commercial portfolio overview by Industry Sector(1) by Rating agency-equivalent risk rating(4) $s in billions 2013 2014 2015 2016 2017 Period-end loans $ 43.2 $ 43.2 $ 46.2 $ 50.6 $ 51.2 Average loans $ 38.0 $ 40.5 $ 44.6 $ 48.8 $ 51.3 30-Day past due % 0.24% 0.20% 0.12% 0.09% 0.20% 60-Day past due % 0.07% 0.07% 0.08% 0.06% 0.07% NPL % 0.43% 0.27% 0.27% 0.68% 0.51% NCO % 0.04% 0.01% -0.01% 0.10% 0.04% By Sector NAICS code. Comprises exposure to companies at risk from impact of declining oil prices. All Other stratifies over an additional 5 industry classifications with the largest portion representing no more than 1.75% of the total portfolio. Portfolio balances as of Dec. 31, 2017. FICO score, LTV ratio, loan term, lien position, risk rating, property type, industry sector and geographic stratifications current as of Dec. 31, 2017, as applicable. Highlights 4Q17 $51.2 billion core commercial portfolio Includes 2.5% related to gasoline stations Asset quality relatively stable and credit performance has returned to pre-crisis levels Overall credit risk is moderate and compares well with peers $10.5 billion Commercial Real Estate business portfolio as of 4Q17 Quality of new originations compares favorably to overall portfolio 1Q16 regulatory guidance drove an increase in non-accruals; 41% of non-accruals paying as agreed
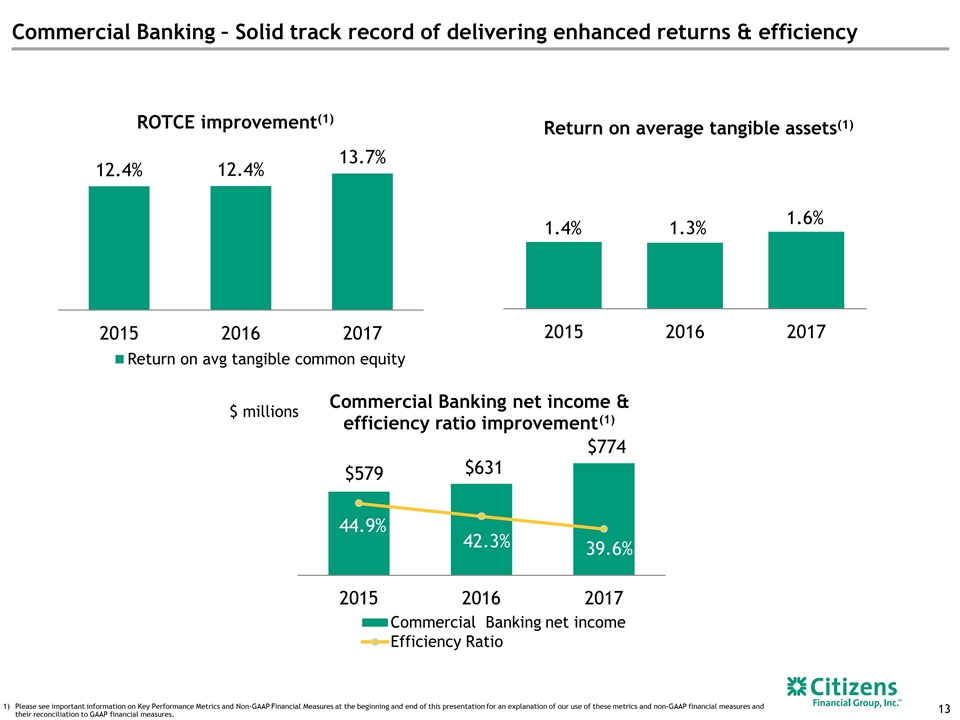
Commercial Banking – Solid track record of delivering enhanced returns & efficiency Please see important information on Key Performance Metrics and Non-GAAP Financial Measures at the beginning and end of this presentation for an explanation of our use of these metrics and non-GAAP financial measures and their reconciliation to GAAP financial measures. ~10% growth ~20% growth 1.4% 1.3% 1.6% ROTCE improvement(1) Return on average tangible assets(1) $ millions $579 $631 $774 44.9% 42.3% 39.6% 30.0% 40.0% 50.0% 60.0% 2015 2016 2017 Commercial Banking net i ncome & efficiency ratio improvement (1) Commercial Banking net income Efficiency Ratio
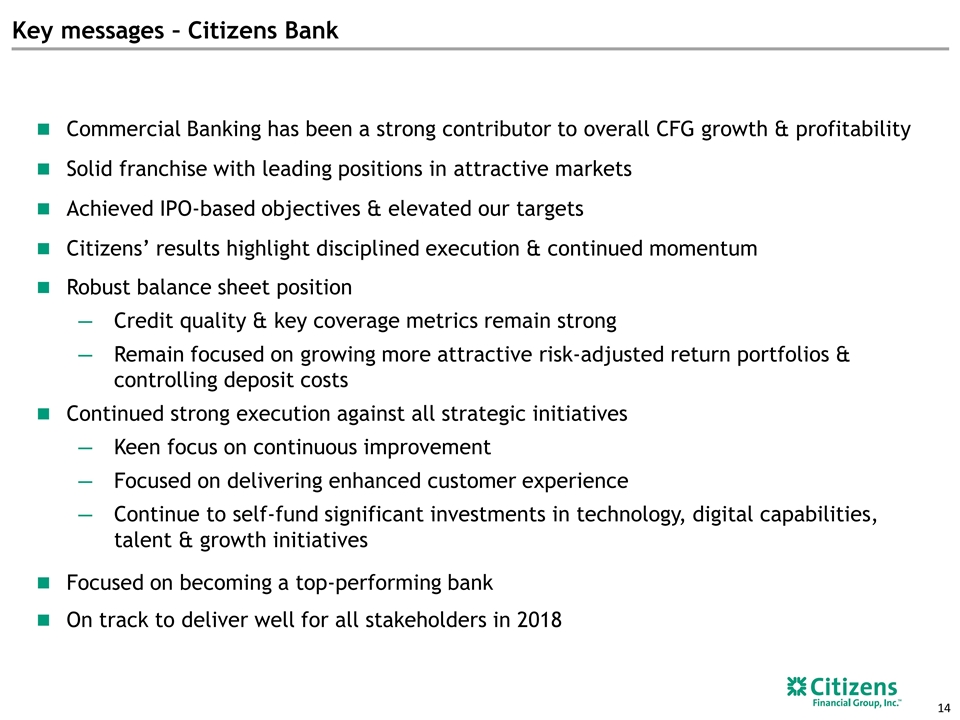
Key messages – Citizens Bank Commercial Banking has been a strong contributor to overall CFG growth & profitability Solid franchise with leading positions in attractive markets Achieved IPO-based objectives & elevated our targets Citizens’ results highlight disciplined execution & continued momentum Robust balance sheet position Credit quality & key coverage metrics remain strong Remain focused on growing more attractive risk-adjusted return portfolios & controlling deposit costs Continued strong execution against all strategic initiatives Keen focus on continuous improvement Focused on delivering enhanced customer experience Continue to self-fund significant investments in technology, digital capabilities, talent & growth initiatives Focused on becoming a top-performing bank On track to deliver well for all stakeholders in 2018
Appendix
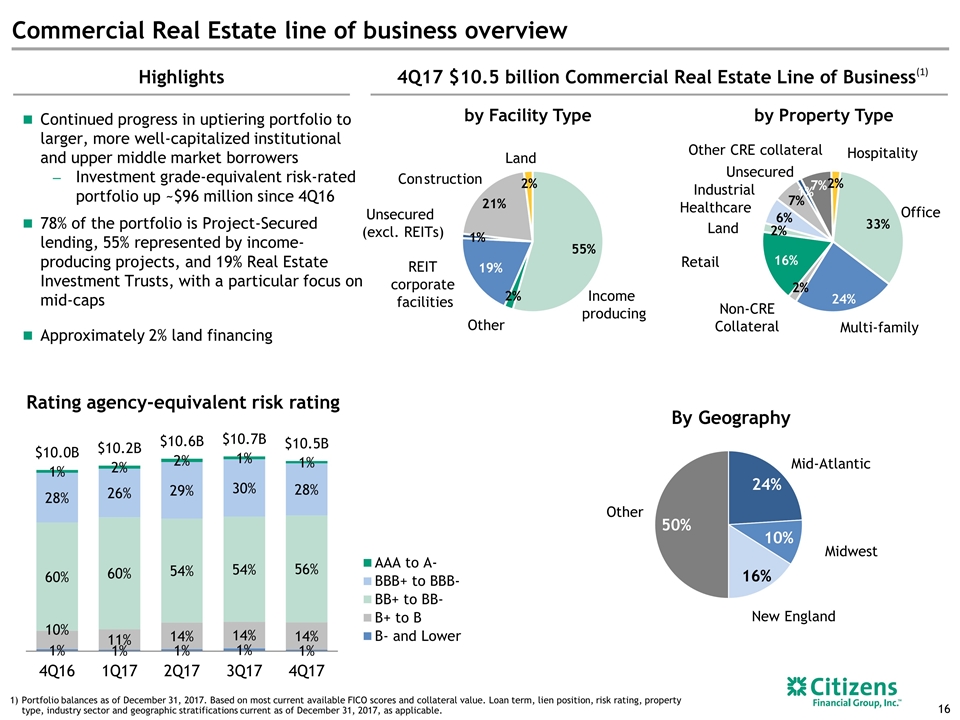
Commercial Real Estate line of business overview 4Q17 $10.5 billion Commercial Real Estate Line of Business Highlights (1) Portfolio balances as of December 31, 2017. Based on most current available FICO scores and collateral value. Loan term, lien position, risk rating, property type, industry sector and geographic stratifications current as of December 31, 2017, as applicable. Continued progress in uptiering portfolio to larger, more well-capitalized institutional and upper middle market borrowers Investment grade-equivalent risk-rated portfolio up ~$96 million since 4Q16 78% of the portfolio is Project-Secured lending, 55% represented by income-producing projects, and 19% Real Estate Investment Trusts, with a particular focus on mid-caps Approximately 2% land financing Rating agency-equivalent risk rating by Facility Type Income producing REIT corporate facilities Construction Unsecured (excl. REITs) Other Land by Property Type Office Multi-family Industrial Land Retail Non-CRE Collateral Hospitality Other CRE collateral Healthcare Unsecured By Geography Other Mid-Atlantic Midwest New England
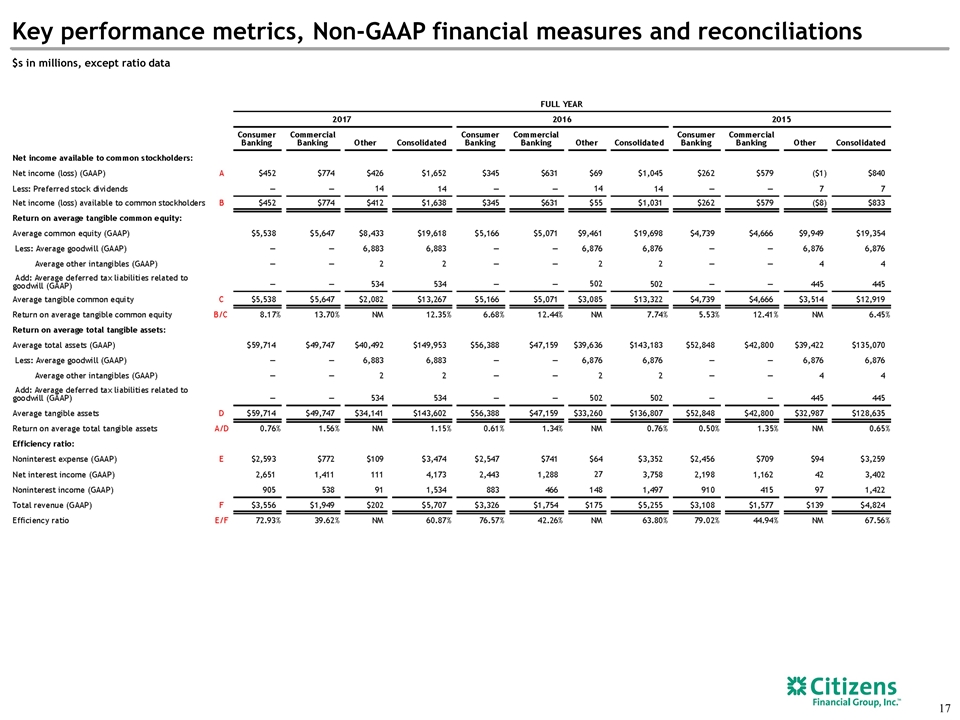
Key performance metrics, Non-GAAP financial measures and reconciliations $s in millions, except ratio data
