Form 8-K Kimbell Royalty Partners For: May 28
UNITED STATES
SECURITIES AND EXCHANGE COMMISSION
Washington, D.C. 20549
FORM 8-K
CURRENT REPORT
Pursuant to Section 13 or 15(d)
of the Securities Exchange Act of 1934
Date of Report (date of earliest event reported): May 29, 2018 (May 28, 2018)
Kimbell Royalty Partners, LP
(Exact name of registrant as specified in its charter)
|
Delaware |
|
1-38005 |
|
47-5505475 |
|
(State or other jurisdiction |
|
(Commission |
|
(I.R.S. Employer |
|
|
|
|
|
777 Taylor Street, Suite 810 |
|
76102 |
|
(Address of principal executive offices) |
|
(Zip Code) |
Registrant’s telephone number, including area code: (817) 945-9700
Check the appropriate box below if the Form 8-K filing is intended to simultaneously satisfy the filing obligation of the registrant under any of the following provisions (see General Instruction A.2):
o Written communications pursuant to Rule 425 under the Securities Act (17 CFR 230.425)
o Soliciting material pursuant to Rule 14a-12 under the Exchange Act (17 CFR 240.14a-12)
o Pre-commencement communications pursuant to Rule 14d-2(b) under the Exchange Act (17 CFR 240.14d-2(b))
o Pre-commencement communications pursuant to Rule 13e-4(c) under the Exchange Act (17 CFR 240.13e-4(c))
Indicate by check mark whether the registrant is an emerging growth company as defined in Rule 405 of the Securities Act of 1933 (§230.405 of this chapter) or Rule 12b-2 of the Securities Exchange Act of 1934 (§240.12b-2 of this chapter).
Emerging growth company x
If an emerging growth company, indicate by check mark if the registrant has elected not to use the extended transition period for complying with any new or revised financial accounting standards provided pursuant to Section 13(a) of the Exchange Act. x
Item 7.01. Regulation FD Disclosure.
On May 29, 2018, Kimbell Royalty Partners, LP (the “Partnership”), issued a news release announcing that it has entered into definitive agreements to acquire certain subsidiaries of Haymaker Minerals & Royalties, LLC and Haymaker Resources, LP, which own oil and gas mineral and royalty interests, subject to certain conditions contained in the definitive agreements. A copy of the news release is attached hereto, furnished as Exhibit 99.1 to this Current Report on Form 8-K and incorporated in this Item 7.01 by reference.
The Partnership also made available a related investor presentation. A copy of the investor presentation is attached hereto, furnished as Exhibit 99.2 to this Current Report on Form 8-K and incorporated in this Item 7.01 by reference.
The information set forth in this Item 7.01 (including Exhibits 99.1 and 99.2) shall not be deemed “filed” for purposes of Section 18 of the Securities Exchange Act of 1934, as amended, nor shall such information be deemed incorporated by reference in any filing under the Securities Act of 1933 or the Exchange Act, regardless of the general incorporation language of such filing, except as shall be expressly set forth by specific reference in such filing.
Forward-Looking Statements
Certain information contained in this Current Report and in the exhibits hereto includes forward-looking statements. These forward-looking statements involve risks and uncertainties, including certain plans, expectations, goals and statements about the benefits of the proposed acquisition and election to change to a taxable entity, the Partnership’s plans, objectives, expectations and intentions, the expected timing of completion of the acquisition, and other statements that are not historical facts. Statements that do not describe historical or current facts, including statements about beliefs and expectations, are forward-looking statements. Forward-looking statements may be identified by words such as expect, anticipate, believe, intend, estimate, plan, target, goal, or similar expressions, or future or conditional verbs such as will, may, might, should, would, could, or similar variations. Except as required by law, the Partnership undertakes no obligation and does not intend to update these forward-looking statements to reflect events or circumstances occurring after the date hereof. When considering these forward-looking statements, you should keep in mind the risk factors and other cautionary statements in the Partnership’s filings with the SEC. These include risks inherent in oil and natural gas drilling and production activities, including risks with respect to low or declining prices for oil and natural gas that could result in downward revisions to the value of proved reserves or otherwise cause operators to delay or suspend planned drilling and completion operations or reduce production levels, which would adversely impact cash flow; risks that the anticipated benefits of the election to change to a taxable entity are not realized; risks related to the Partnership’s acquisition and integration of the acquired businesses and assets; the possibility that the proposed acquisition does not close when expected or at all because any conditions to the closing are not satisfied on a timely basis or at all; the risk that the financing required to fund the acquisition is not obtained; uncertainties as to the timing of the acquisition; the possibility that the anticipated benefits of the acquisition are not realized when expected or at all; risks relating to the Partnership’s hedging activities; risks of fire, explosion, blowouts, pipe failure, casing collapse, unusual or unexpected formation pressures, environmental hazards, and other operating and production risks, which may temporarily or permanently reduce production or cause initial production or test results to not be indicative of future well performance or delay the timing of sales or completion of drilling operations; risks relating to delays in receipt of drilling permits; risks relating to unexpected adverse developments in the status of properties; risks relating to the absence or delay in receipt of government approvals or third-party consents; and other risks described in the Partnership’s Annual Report on Form 10-K and other filings with the United States Securities and Exchange Commission, available on their website at www.sec.gov. You are cautioned not to place undue reliance on these forward-looking statements, which speak only as of the date hereof.
Item 9.01. Financial Statements and Exhibits.
(d) Exhibits
|
Number |
|
Description |
|
|
|
|
|
99.1 |
|
News Release issued by Kimbell Royalty Partners, LP dated May 29, 2018 |
|
|
|
|
|
99.2 |
|
Investor Presentation published by Kimbell Royalty Partners, LP dated May 29, 2018 |
SIGNATURE
Pursuant to the requirements of the Securities Exchange Act of 1934, the Registrant has duly caused this report to be signed on its behalf by the undersigned hereunto duly authorized.
|
|
KIMBELL ROYALTY PARTNERS, LP | |
|
|
|
|
|
|
By: |
Kimbell Royalty GP, LLC, |
|
|
|
its general partner |
|
|
|
|
|
|
By: |
/s/ Matthew S. Daly |
|
|
|
Matthew S. Daly |
|
|
|
Chief Operating Officer |
Date: May 29, 2018
|
|
NEWS RELEASE |
Kimbell Royalty Partners, LP announces acquisition of mineral and royalty interests held by Haymaker Minerals & Royalties, LLC and Haymaker Resources, LP for $404 million and proposed election to change tax status
Acquisition immediately accretive to distributable cash flow, increases production by more than 50% on a per unit basis and generates estimated G&A savings of 50% per Boe on a run-rate basis
Pro forma free cash flow yield of 12% on first quarter 2018 basis
Kimbell announces proposed election to change tax status from pass-through
partnership to a taxable entity
FORT WORTH, Texas, May 29, 2018 — Kimbell Royalty Partners, LP (NYSE: KRP) (“Kimbell” or the “Company”), a leading owner of oil and gas mineral and royalty interests across 20 states, today announced that it has agreed to acquire the mineral and royalty interests held by Houston-based Haymaker Minerals & Royalties, LLC and Haymaker Resources, LP (collectively, “Haymaker”) in a transaction valued at approximately $404 million. The purchase price for the acquisition is comprised of $210 million in cash and 10 million common units of Kimbell, valued at approximately $194 million.(1) Kimbell will raise the cash portion of the purchase price through a private placement of 7.00% Series A Cumulative Convertible Preferred Units (“Series A Preferred Units”) to an affiliate of Apollo Global Management, LLC (“Apollo”) for gross proceeds of $110 million and through borrowings of $114(2) million under a new $200 million revolving credit facility. The Boards of Kimbell and Haymaker have unanimously approved the acquisition, which is expected to close in the third quarter of 2018, subject to customary closing conditions. The effective date of the acquisition is April 1, 2018.
Following the closing of the acquisition, Haymaker’s private equity sponsors, KKR & Co. L.P. (“KKR”) and Kayne Anderson Capital Advisors, L.P. (“Kayne”), along with Haymaker management, will collectively own approximately 37% of the then outstanding common units of Kimbell.
Bob Ravnaas, Chairman and CEO of Kimbell, said, “This is a transformative acquisition for our company which we expect to deliver significant value and benefits through both increased scale and significant operating leverage that will drive improved profitability. Through this combination of highly complementary minerals portfolios, Kimbell is uniquely positioned to be a major participant in the best-performing, highest-growth oil and gas basins in the Lower 48. We expect the acquisition to be immediately accretive to distributable cash flow per unit and look forward to continued successes in this new and exciting chapter for Kimbell.”
Karl Brensike, CEO of Haymaker, said, “We are extremely proud of the Haymaker team for assembling this world-class portfolio. Diversified minerals and royalties are just starting to get the recognition they deserve as a lower risk strategy to capitalize on the tremendous advancements being made in the U.S.
(1) Based on closing unit price of $19.40 on May 25, 2018.
(2) Includes revolving credit facility draw related to estimated fees and expenses of the acquisition.
oil and natural gas industry. We believe this acquisition will kick off a new phase of consolidation across the sector, as private equity looks to divest their mineral interests to longer term holders. Kimbell’s diversified asset base and access to capital through their proposed tax structure will position them to continue to make accretive acquisitions over the coming years.”
Acquisition Highlights(3)
· Pro forma free cash flow yield(4) of 12% drives accretion to distributable cash flow per unit of >20% based on first quarter 2018 results and using run-rate G&A
· Increases average daily net production per Kimbell unit for first quarter 2018 by more than 50% on pro forma basis
· Highly complementary Haymaker acreage increases Kimbell’s net royalty acres per unit by 10% on a pro forma basis
· 52% of the combined net royalty acreage is in the high growth Permian and Mid-Continent areas
· Conservatively financed with estimated pro forma net debt to EBITDA below 2.0x(5) and ample liquidity under new revolving credit facility
Creating a Leading Energy Yield Company
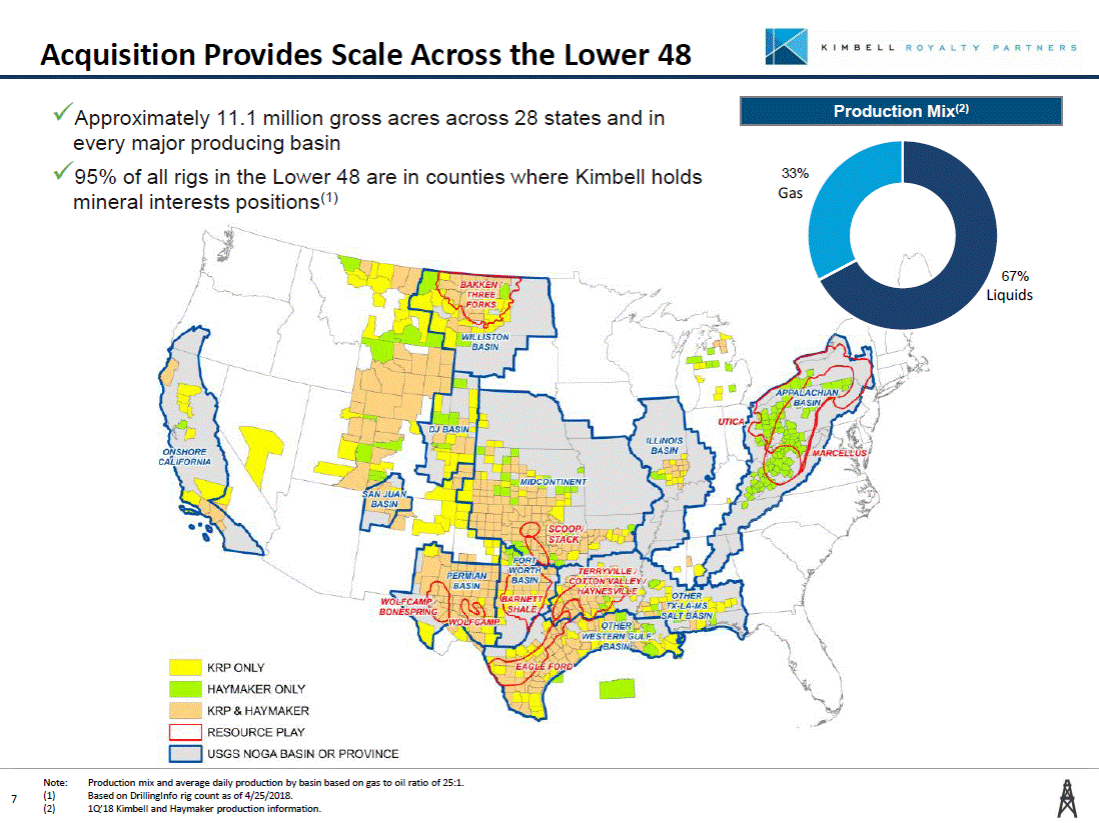
Following the closing, Kimbell will have an 11.1 million gross acre position with a total of 73 active rigs on its properties, which represents 7% of total active rigs in the U.S. In addition, 95% of all rigs in the Lower 48 are located in counties where Kimbell will hold mineral interest positions. The acquisition further solidifies Kimbell’s position in the Permian by adding mineral interests in the Midland Basin and further bolstering its Mid-Continent position, which includes the SCOOP / STACK. Going forward, Kimbell will remain a liquids-focused company with oil and NGLs accounting for approximately 67% of estimated pro forma 1Q 2018 production.
Estimated pro forma net debt / EBITDA will be below 2.0x(5) at the closing of the acquisition, with a prudent hedging program in place that will target between 30% and 40% of production on a rolling two-year basis to protect cash flows.
Kimbell’s management team, led by Kimbell CEO Bob Ravnaas, will operate the combined company following the closing.
(3) For additional information regarding the assumptions used with respect to the acquisition highlights, see the investor presentation available on Kimbell’s website.
(4) Kimbell defines free cash flow as cash flow from operating activities less capital expenditures divided by market capitalization as of May 25, 2018.
(5) As of March 31, 2018 and pro forma for the Delaware Basin asset sale.
Series A Cumulative Convertible Preferred Units
Kimbell signed a purchase agreement with Apollo for $110 million of the Series A Preferred Units. The private placement of the Series A Preferred Units will close at the same time as the closing of the acquisition.
Summary terms of the Series A Preferred Units include:
· Distributions of 7.00% per annum, paid quarterly in arrears
· Kimbell may redeem the Series A Preferred Units at any time for cash
· Beginning on the second anniversary of the closing date, Apollo may elect to convert some or all of the Series A Preferred Units if the common unit price is at a 30% premium to the issue price
· Voting rights on an as-converted basis with common units
New Revolving Credit Facility
In conjunction with the closing of the acquisition, Kimbell has received commitments for a fully-underwritten $200 million revolving credit facility with Frost Bank, Wells Fargo Bank and Credit Suisse AG. The borrowing base of Kimbell’s current revolving credit facility is $100 million which will increase to $200 million upon closing of the acquisition. At the closing, the Company will have approximately $64 million of availability under its new revolving credit facility, providing for significant liquidity.
Proposed Election to Change Tax Status
Kimbell believes that the conversion to a taxable entity will enable it to target a significantly larger investor base both domestic and international, increase its liquidity and support its continued growth and consolidation strategy. KKR and Kayne, together with Haymaker management, as well as Apollo have agreed to vote in favor of the Company’s proposed election to change to a taxable entity, with the precise structure to be determined by the Board of Directors of Kimbell. Upon consummation of the acquisition and the Series A Preferred Units offering, KKR, Kayne, Haymaker management and Apollo, together with outstanding common units that are controlled by Kimbell’s management and Board of Directors, will constitute the requisite majority of unitholders necessary to approve the tax election. The Company will file with the Securities and Exchange Commission (“SEC”) an information statement regarding the approval of the tax election and distribute that information statement to its other unitholders.
Advisors
Credit Suisse Securities (USA) LLC acted as exclusive financial advisor and sole placement agent on the Series A Preferred Units to Kimbell and Baker Botts L.L.P. acted as legal counsel to Kimbell. UBS Investment Bank acted as exclusive capital markets advisor to Kimbell in connection with the election to change to a taxable entity. RBC Richardson Barr acted as exclusive financial advisor to Haymaker, Kirkland & Ellis LLP acted as legal counsel to KKR and Haymaker and DLA Piper LLP acted as legal counsel to Kayne and Haymaker. Kirkland & Ellis LLP also represented Apollo in connection with the Series A
Preferred Units offering.
Investor and Analyst Conference Call
Kimbell will host a conference call and webcast today at 8:30 a.m. Eastern Time (7:30 a.m. Central Time) to discuss this transaction. To access the call live by phone, dial (201) 389-0869 and ask for the Kimbell Royalty Partners call at least 10 minutes prior to the start time. A webcast of the call will also be available live and for later replay on Kimbell’s website at http://www.kimbellrp.com under Events and Presentations. The company also has an investor presentation on their website with additional information about the transaction.
About Kimbell Royalty Partners
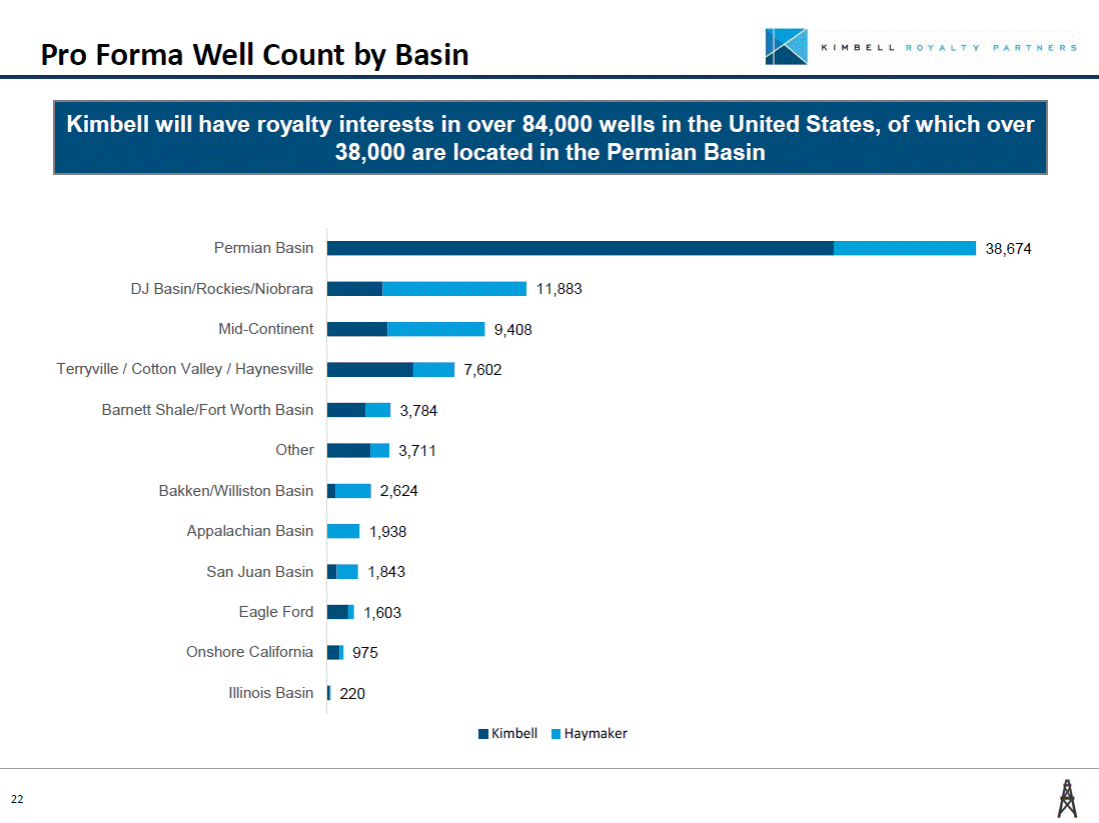
Kimbell (NYSE: KRP) is an oil and gas mineral and royalty variable rate master limited partnership based in Fort Worth, Texas. Kimbell is managed by its general partner, Kimbell Royalty GP, LLC, and owns mineral and royalty interests in approximately 5.7 million gross acres in twenty states and in nearly every major onshore basin in the continental United States, including ownership in more than 50,000 gross producing wells with over 30,000 wells in the Permian Basin. To learn more, visit http://www.kimbellrp.com.
About Haymaker Minerals & Royalties
Founded in 2013, Haymaker has invested capital on behalf of Kayne Anderson and KKR to acquire over 5 million gross mineral acres through over 700 individual transactions. Using sophisticated practices from the software, finance, and upstream E&P industries, Haymaker was able to assemble a diversified portfolio of mineral and royalty interests in over 35,000 producing wells across 26 states and over 500 counties. To learn more, visit www.haymakermineralsandroyalties.com
About Kayne Anderson
Kayne Anderson Capital Advisors, L.P., founded in 1984, is a leading alternative investment management firm focused on niche investing in upstream oil and gas companies, energy and infrastructure, specialized real estate, growth equity and both private credit and diversified liquid credit. Kayne Anderson’s investment philosophy is to pursue niches, with an emphasis on cash flow, where our knowledge and sourcing advantages enable us to deliver above average, risk-adjusted investment returns. Kayne manages over $26 billion in assets (as of 4/30/2018) for institutional investors, family offices, high net worth and retail clients and employs over 300 professionals in eight offices across the U.S. Through Kayne Anderson Energy Funds (“KAEF”), the firm has raised $7.0 billion of committed capital dedicated to energy private equity investments in primarily upstream and midstream oil and gas companies. Currently, KAEF has over 20 active portfolio companies focused on upstream and midstream oil and gas assets across North America. For more information, please visit www.kaynecapital.com.
About KKR
KKR is a leading global investment firm that manages multiple alternative asset classes, including private equity, energy, infrastructure, real estate and credit, with strategic manager partnerships that manage hedge funds. KKR aims to generate attractive investment returns for its fund investors by following a patient and disciplined investment approach, employing world-class people, and driving growth and value creation with KKR portfolio companies. KKR invests its own capital alongside the capital it manages for fund investors and provides financing solutions and investment opportunities through its capital markets business. References to KKR’s investments may include the activities of its sponsored funds. For additional information about KKR & Co. L.P. (NYSE: KKR), please visit KKR’s website at www.kkr.com and on Twitter @KKR_Co.
Forward-Looking Statements
This news release includes forward-looking statements. These forward-looking statements involve risks and uncertainties, including certain plans, expectations, goals and statements about the benefits of the proposed acquisition and election to change to a taxable entity, Kimbell’s plans, objectives, expectations and intentions, the expected timing of completion of the acquisition, and other statements that are not historical facts. Statements that do not describe historical or current facts, including statements about beliefs and expectations, are forward-looking statements. Forward-looking statements may be identified by words such as expect, anticipate, believe, intend, estimate, plan, target, goal, or similar expressions, or future or conditional verbs such as will, may, might, should, would, could, or similar variations. Except as required by law, Kimbell undertakes no obligation and does not intend to update these forward-looking statements to reflect events or circumstances occurring after this news release. When considering these forward-looking statements, you should keep in mind the risk factors and other cautionary statements in Kimbell’s filings with the SEC. These include risks inherent in oil and natural gas drilling and production activities, including risks with respect to low or declining prices for oil and natural gas that could result in downward revisions to the value of proved reserves or otherwise cause operators to delay or suspend planned drilling and completion operations or reduce production levels, which would adversely impact cash flow; risks that the anticipated benefits of the election to change to a taxable entity are not realized; risks related to Kimbell’s acquisition and integration of the acquired businesses and assets; the possibility that the proposed acquisition does not close when expected or at all because any conditions to the closing are not satisfied on a timely basis or at all; the risk that the financing required to fund the acquisition is not obtained; uncertainties as to the timing of the acquisition; the possibility that the anticipated benefits of the acquisition are not realized when expected or at all; risks relating to Kimbell’s hedging activities; risks of fire, explosion, blowouts, pipe failure, casing collapse, unusual or unexpected formation pressures, environmental hazards, and other operating and production risks, which may temporarily or permanently reduce production or cause initial production or test results to not be indicative of future well performance or delay the timing of sales or completion of drilling operations; risks relating to delays in receipt of drilling permits; risks relating to unexpected adverse developments in the status of properties; risks relating to the absence or delay in receipt of government approvals or third-party consents; and other risks described in Kimbell’s Annual Report on Form 10-K and other filings with the SEC, available at the SEC’s website at www.sec.gov. You are cautioned not to place undue reliance on these forward-looking statements, which speak only as of the date of this news release.
ACQUISITION OF HAYMAKER MINERALS & ROYALTIES, LLC AND HAYMAKER RESOURCES, LP MAY 29, 2018

Disclaimer This presentation includes forward-looking statements relating to the business, financial performance and results of Kimbell Royalty Partners, LP (“KRP”). These forward-looking statements involve risks and uncertainties, including certain plans, expectations, goals and statements about the benefits of the proposed acquisition and election to change to a taxable entity, KRP’s plans, objectives, expectations and intentions, the expected timing of completion of the acquisition, and other statements that are not historical facts. Statements that do not describe historical or current facts, including statements about beliefs and expectations, are forward-looking statements. Forward-looking statements may be identified by words such as expect, anticipate, believe, intend, estimate, plan, target, goal, or similar expressions, or future or conditional verbs such as will, may, might, should, would, could, or similar variations. Except as required by law, KRP undertakes no obligation and does not intend to update these forward-looking statements to reflect events or circumstances occurring after the date of this presentation. When considering these forward-looking statements, you should keep in mind the risk factors and other cautionary statements in KRP’s filings with the Securities and Exchange Commission (“SEC”). These include risks inherent in oil and natural gas drilling and production activities, including risks with respect to low or declining prices for oil and natural gas that could result in downward revisions to the value of proved reserves or otherwise cause operators to delay or suspend planned drilling and completion operations or reduce production levels, which would adversely impact cash flow; risks that the anticipated benefits of the election to change to a taxable entity are not realized; risks related to KRP’s acquisition and integration of the acquired businesses and assets; the possibility that the proposed acquisition does not close when expected or at all because any conditions to the closing are not satisfied on a timely basis or at all; the risk that the financing required to fund the acquisition is not obtained; uncertainties as to the timing of the acquisition; the possibility that the anticipated benefits of the acquisition are not realized when expected or at all; risks relating to KRP’s hedging activities; risks of fire, explosion, blowouts, pipe failure, casing collapse, unusual or unexpected formation pressures, environmental hazards, and other operating and production risks, which may temporarily or permanently reduce production or cause initial production or test results to not be indicative of future well performance or delay the timing of sales or completion of drilling operations; risks relating to delays in receipt of drilling permits; risks relating to unexpected adverse developments in the status of properties; risks relating to the absence or delay in receipt of government approvals or third-party consents; and other risks described in KRP’s Annual Report on Form 10-K and other filings with the SEC, available at the SEC’s website at www.sec.gov. You are cautioned not to place undue reliance on these forward-looking statements, which speak only as of the date of this presentation. This presentation includes financial measures that are not presented in accordance with U.S. generally accepted accounting principles (“GAAP”), including Adjusted EBITDA, distributable cash flow (“DCF”) and free cash flow. KRP believes Adjusted EBITDA is useful because it allows management to more effectively evaluate KRP’s operating performance and compare the result of KRP’s operations period to period without regard to KRP’s financing methods or capital structure. In addition, KRP’s management uses Adjusted EBITDA to evaluate cash flow available to pay distributions to its unitholders. KRP defines Adjusted EBITDA as net income (loss) plus interest expense, net of capitalized interest, non-cash unit-based compensation, impairment of oil and natural gas properties, income taxes and depreciation, depletion and accretion expense. KRP excludes the foregoing items from net income (loss) in arriving at Adjusted EBITDA because these amounts can vary substantially from company to company within its industry depending upon accounting methods and book values of assets, capital structures and the method by which the assets were acquired. Certain items excluded from Adjusted EBITDA are significant components in understanding and assessing a company’s financial performance, such as a company’s cost of capital and tax structure, as well as historic costs of depreciable assets, none of which are components of Adjusted EBITDA. KRP believes DCF is a useful standard to assist in evaluating its ability to make quarterly cash distributions. KRP defines distributable cash flow as Adjusted EBITDA, less interest expense, distributions related to the convertible preferred units and taxes. KRP excludes certain capital expenditures from its cash flows from operating activities in arriving at its free cash flow to provide investors a measure of its ability to generate cash. Adjusted EBITDA and DCF are not measures of net income (loss) or net cash provided by operating activities as determined by GAAP. Adjusted EBITDA and DCF should not be considered an alternative to net income, oil, natural gas and natural gas liquids revenues or any other measure of financial performance or liquidity presented in accordance with GAAP. Free cash flow is not a measure of financial performance under GAAP and should not be considered as an alternative to cash flows from operating activities as determined by GAAP. You should not consider Adjusted EBITDA, DCF or free cash flow in isolation or as a substitute for an analysis of KRP’s results as reported under GAAP. Because Adjusted EBITDA, DCF and free cash flow may be defined differently by other companies in KRP’s industry, KRP’s computations of Adjusted EBITDA, DCF and free cash flow may not be comparable to other similarly titled measures of other companies, thereby diminishing its utility.. Haymaker’s financial information for the quarter ended March 31, 2018 and any computations derived therefrom are based on internal Haymaker financials that have been provided to KRP. Such financial information has not been reviewed by Haymaker’s or KRP’s independent public accountants, and the reported numbers, when published, may differ from the numbers contained herein after such review. The convertible preferred units discussed in this presentation are being offered to institutional “accredited investors” within the meaning of Regulation D under the Securities Act of 1933, as amended. The offering of the preferred units will not be registered under the Securities Act in reliance upon one or more exemptions provided for under the Securities Act, including the exemption from registration provided by Section 4(a)(2) of the Securities Act and will not be registered or qualified under any state securities laws. The securities may only be resold or transferred if registered under the Securities Act or pursuant to an exemption from such registration under the Securities Act and in compliance with state securities laws. This presentation is for informational purposes only and shall not constitute an offer to sell or the solicitation of an offer to buy any securities pursuant to the proposed business combination or otherwise, nor shall there be any sale of securities in any jurisdiction in which the offer, solicitation or sale would be unlawful prior to the registration or qualification under the securities laws of any such jurisdiction. No offer of securities shall be made except by means of a prospectus meeting the requirements of Section 10 of the Securities Act. 2

Management Presenters Appointed Chief Executive Officer and Chairman of the Board of Directors in November 2015 Former President of Cawley Gillespie & Associates Began career as a Production Engineer for Amoco Responsible for underwriting 160+ royalty acquisitions over 20 years MSc, Petroleum Engineering from University of Texas at Austin, BSc, Chemical Engineering from University of Colorado at Boulder Bob Ravnaas Chairman, Chief Executive Officer, Co-Founder Appointed President and Chief Financial Officer in November 2015 Co-Founder of Rivercrest Royalties, LLC (predecessor entity to Kimbell Royalty Partners) Sourced, evaluated and monitored investments in energy and industrials as an associate investment professional at Crestview Partners, a New York based private equity fund with $6.0 billion under management MBA, Stanford Graduate School of Business, AB in Economics, Princeton University Davis Ravnaas President, Chief Financial Officer Appointed Chief Operating Officer in May 2017 Managed energy investments for Kleinheinz Capital Partners and Hirzel Capital Management Previously served as Vice President at Lazard Frères & Co. focusing on Mergers & Acquisitions MBA, University of Chicago Booth School of Business, BBA, University of Texas at Austin, CPA in Texas 3

Transaction Summary On May 28, 2018, Kimbell Royalty Partners, LP (“Kimbell,” “KRP” or the “Company”) entered into definitive agreements to acquire all of the mineral and royalty interests held by Haymaker Minerals & Royalties, LLC and Haymaker Resources, LP (collectively, “Haymaker”) in an approximate 50% cash / 50% equity transaction Total purchase consideration of $404 million(1) consisting of $210 million of cash and 10 million common units(2) issued to Haymaker’s sponsors - Cash component will be funded with a $100(3) million draw under a new $200 million revolving credit facility and a $110 million private placement of convertible preferred units to funds managed by affiliates of Apollo Global Management, LLC (“Apollo”) - Haymaker’s private equity sponsors, KKR & Co. L.P. (“KKR”) and Kayne Anderson Capital Advisors, L.P. (“Kayne”), along with Haymaker management, will collectively own approximately 37% of the then outstanding common units of Kimbell Acquisition is expected to close during 3Q’18, with an effective date of April 1, 2018; no KRP unitholder vote required Election to change tax status from a pass-through partnership to that of a taxable entity post-closing - KKR, Kayne, Apollo voting on an as-converted basis and management, which will represent the necessary unit majority, have entered into voting and support agreements 3/31/18 Adj. Pro Forma Sources ($ in millions) ($ in millions) Revolver draw Convertible preferred units $114 110 Cash and cash equivalents (4) Revolving credit facility 3) $7 22 – 114 $7 136 Equity to Seller 194 Total debt Convertible preferred units $22 – $136 $110 Total sources $418 $110 Partners capital 204 194 398 Uses Total capitalization Liquidity(54)) $226 $35 $643 $71 Cash to Seller (52%) Equity to Seller (48%) $210 194 Fees and expenses 14 Total Uses $418 (1) (2) (3) Based on Kimbell closing unit price of $19.40 as of May 25, 2018. Reference throughout the presentation to “common units” or “units” mean common units representing limited partner interests of KRP. Excludes $14 million of transaction and advisory fees. (4) Pro forma for $9mm sale of Permian acreage in the Delaware basin. Proceeds used to pay down revolving credit facility. Defined as cash plus undrawn portion of $200 million fully underwritten revolving credit facility. 4 (5) Sources, Uses & Pro Forma Capitalization

Highly Accretive Transaction Haymaker acquisition is transformative to Kimbell, providing pro forma 1Q’18 DCF / unit accretion of >20% on a run-rate G&A basis - DCF accretion of >15% including one-time integration expenses(1) 337 PF 1Q’18 production of 9.1 Mboe/d, a 148% total increase - 1Q’18 production per million common units increases 56% to 337 Boe/d Increased scale expected to result in a 50% reduction in run-rate cash G&A on a per unit basis to $3.22/Boe 1Q'18A Standalone 1Q'18A Pro Forma $6.40 $3.22 %) 1Q'18A Standalone 1Q'18A (Integration Costs) 1Q'18A (1) (2) (Run-rate) Source: (1) (2) Kimbell and Haymaker operational and financial data. Includes $2.35 million in one time integration G&A costs in connection with the transaction that will take place in 3Q’18 and 4Q’18. Run-rate G&A assumes $10.5 million of annual cash G&A. 5 $3.65 (50 1Q’18 Cash G&A ($/Boe) $0.42 1Q'18A 1Q'18A (1)1Q'18A (2) Standalone (Integration Costs) (Run-rate) 1Q’18 Distributable Cash Flow per Unit 217 Net Production (Boe/d) per Million Units

Significant Free Cash Flow Yield 12% Free Cash Flow Yield higher than peer group Peer group companies selected includes royalty, Permian and investment grade E&P companies 12% (6%) Permian E&P Average KRP Pro Forma Royalty Peer Average Investment Grade Average 12% (6%) Permian E&P Average KRP Pro Forma Royalty Peer Average Investment Grade Average Source: Note: Selected Peers: (1) KRP and Haymaker financial metrics and pro forma assumptions. FactSet and company filings as of 5/25/18. KRP market value applies pro forma unit count to 5/25/18 closing price. CXO and RSPP analyzed on an unaffected basis using the 1-day before the acquisition announcement market value. Royalty; BSM and VNOM. Investment Grade; APA, COP, CXO, EOG, NBL, PXD and XEC. Permian; CDEV, CPE, EGN, FANG, JAG, PE, RSPP and WPX. FCF yield calculated as (Cash Flow from Operations – Capex) / Market capitalization as of 5/25/2018 for 1Q’18 and 12/31/2017 for 2017. 6 4% (1%) 2017 FCF Yield(1) 5% (1%) 1Q’18 FCF Yield(1)

Acquisition Provides Scale Across the Lower 48 Approximately 11.1 million gross acres across 28 states and in every major producing basin 95% of all rigs in the Lower 48 are in counties where Kimbell holds mineral interests positions(1) 33% Gas 67% Liquids Note: (1) (2) Production mix and average daily production by basin based on gas to oil ratio of 25:1. Based on DrillingInfo rig count as of 4/25/2018. 1Q’18 Kimbell and Haymaker production information. 7 Production Mix(2)
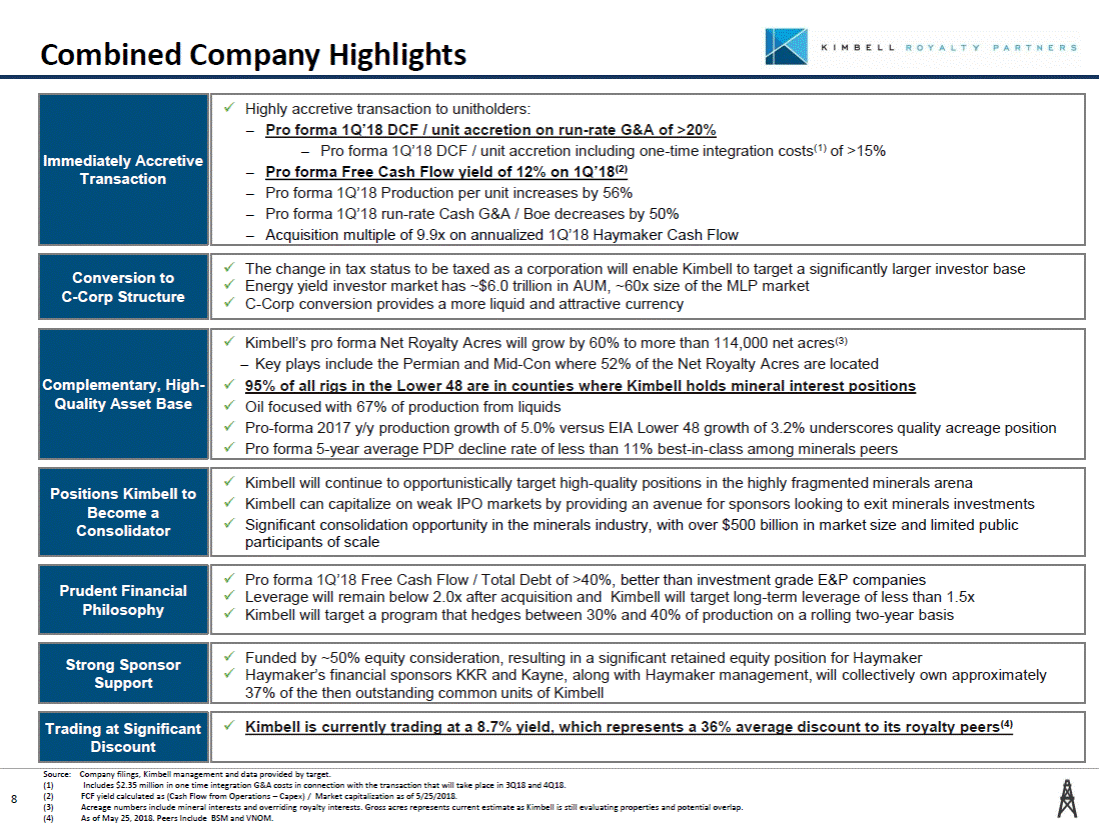
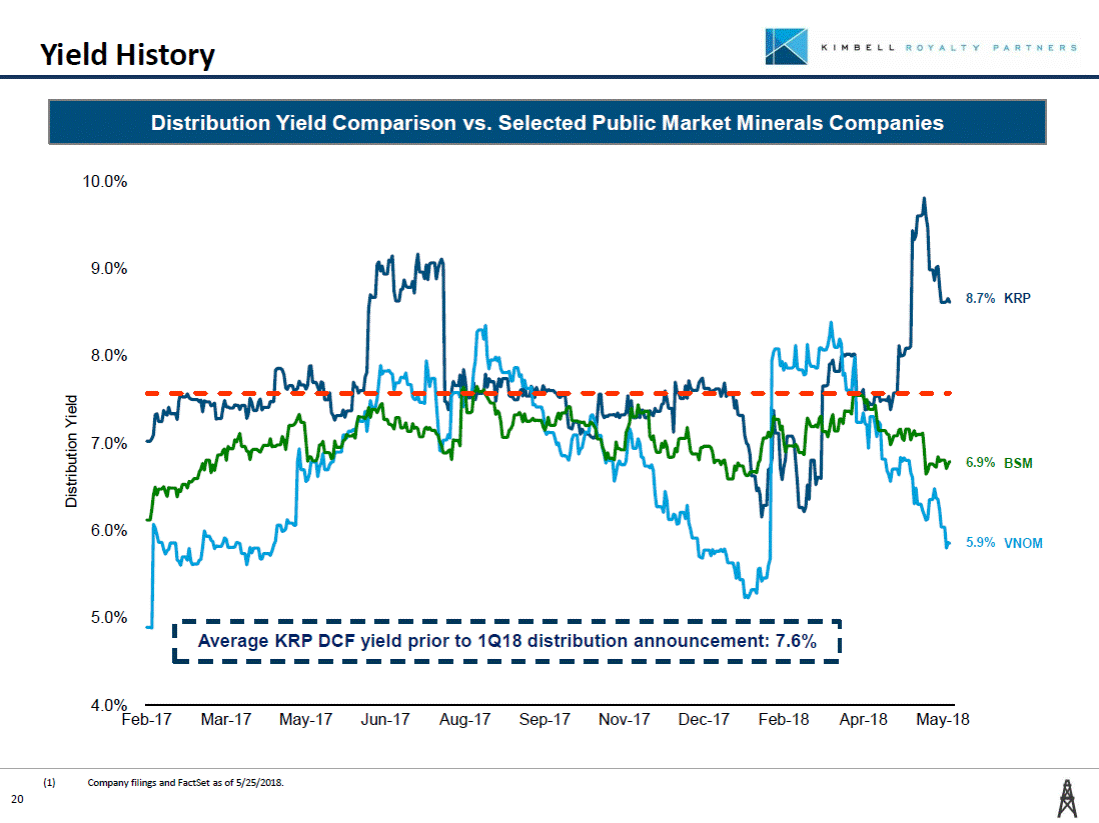
Combined Company Highlights - Pro forma 1Q’18 DCF / unit accretion including one-time integration costs of >15% - Pro forma 1Q’18 Production per unit increases by 56% Energy yield investor market has ~$6.0 trillion in AUM, ~60x size of the MLP market Significant consolidation opportunity in the minerals industry, with over $500 billion in market size and limited public Leverage will remain below 2.0x after acquisition and Kimbell will target long-term leverage of less than 1.5x Haymaker’s financial sponsors KKR and Kayne, along with Haymaker management, will collectively own approximately Source: (1) (2) (3) (4) Company filings, Kimbell management and data provided by target. Includes $2.35 million in one time integration G&A costs in connection with the transaction that will take place in 3Q18 and 4Q18. FCF yield calculated as (Cash Flow from Operations – Capex) / Market capitalization as of 5/25/2018. Acreage numbers include mineral interests and overriding royalty interests. Gross acres represents current estimate as Kimbell is still evaluating properties and potential overlap. As of May 25, 2018. Peers Include BSM and VNOM. 8 Immediately Accretive Transaction Highly accretive transaction to unitholders: - Pro f o rma 1Q ’18 DCF / unit accretion on run-rate G&A of >20% (1) - Pro forma Free Cash Flow yield o f 12% on 1Q’18 (2) - Pro forma 1Q’18 run-rate Cash G&A / Boe decreases by 50% - Acquisition multiple of 9.9x on annualized 1Q’18 Haymaker Cash Flow Conversion to C-Corp Structure The change in tax status to be taxed as a corporation will enable Kimbell to target a significantly larger investor base C-Corp conversion provides a more liquid and attractive currency Complementary, High-Quality Asset Base Kimbell’s pro forma Net Royalty Acres will grow by 60% to more than 114,000 net acres(3) - Key plays include the Permian and Mid-Con where 52% of the Net Royalty Acres are located 95% of all rigs in the Lower 48 are in counties where Kimbell holds mineral interest positions Oil focused with 67% of production from liquids Pro-forma 2017 y/y production growth of 5.0% versus EIA Lower 48 growth of 3.2% underscores quality acreage position Pro forma 5-year average PDP decline rate of less than 11% best-in-class among minerals peers Positions Kimbell to Become a Consolidator Kimbell will continue to opportunistically target high-quality positions in the highly fragmented minerals arena Kimbell can capitalize on weak IPO markets by providing an avenue for sponsors looking to exit minerals investments participants of scale Prudent Financial Philosophy Pro forma 1Q’18 Free Cash Flow / Total Debt of >40%, better than investment grade E&P companies Kimbell will target a program that hedges between 30% and 40% of production on a rolling two-year basis Strong Sponsor Support Funded by ~50% equity consideration, resulting in a significant retained equity position for Haymaker 37% of the then outstanding common units of Kimbell Trading at Significant Discount Kimbell is currently trading at a 8.7% yield, which represents a 36% average discount to its royalty peers(4)
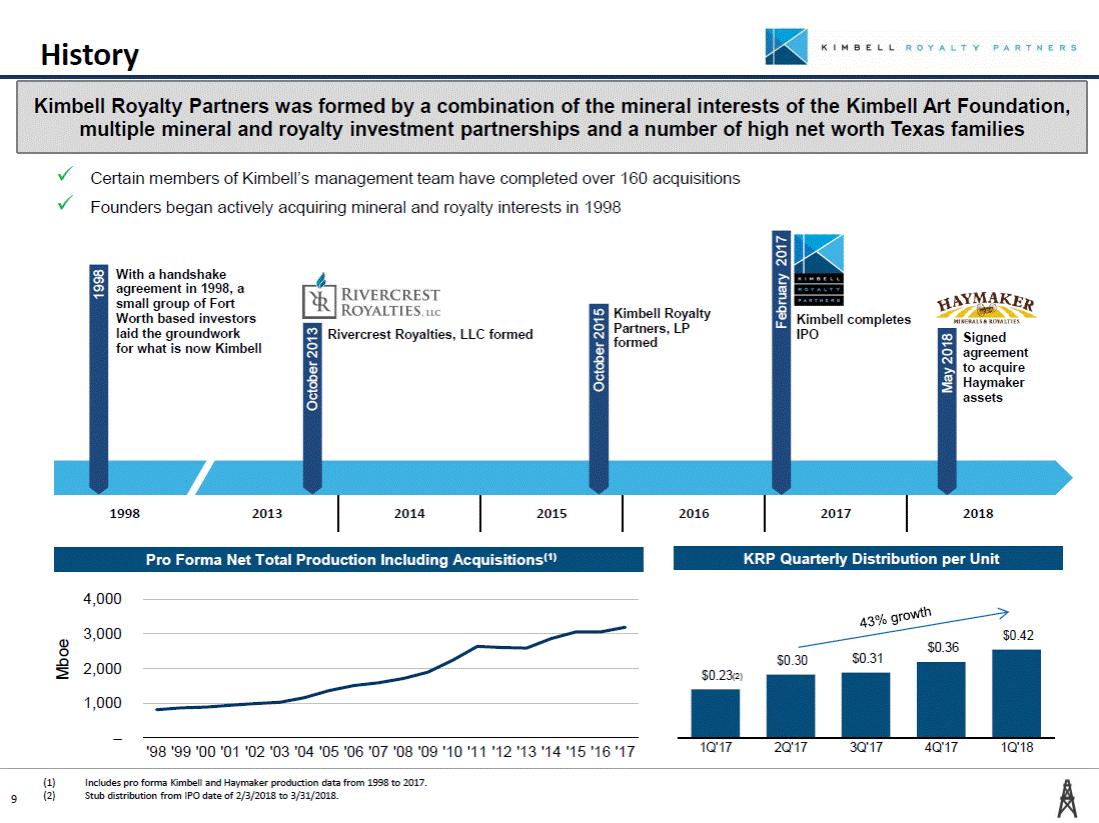
History Certain members of Kimbell’s management team have completed over 160 acquisitions Founders began actively acquiring mineral and royalty interests in 1998 With a handshake agreement in 1998, a small group of Fort Worth based investors laid the groundwork for what is now Kimbell Kimbell Royalty Partners, LP formed Kimbell completes IPO Rivercrest Royalties, LLC formed Signed agreement to acquire Haymaker assets 1998 2013 2014 2015 2016 2017 2018 4,000 3,000 $0.42 $0.36 $0.31 $0.30 2,000 1,000 – 1Q'17 2Q'17 3Q'17 4Q'17 1Q'18 '98 '99 '00 '01 '02 '03 '04 '05 '06 '07 '08 '09 '10 '11 '12 '13 '14 '15 '16 '17 (1) (2) Includes pro forma Kimbell and Haymaker production data from 1998 to 2017. Stub distribution from IPO date of 2/3/2018 to 3/31/2018. 9 Mboe 1998 October 2013 October 2015 February 2017 May 2018 $0.23(2) KRP Quarterly Distribution per Unit Pro Forma Net Total Production Including Acquisitions(1) Kimbell Royalty Partners was formed by a combination of the mineral interests of the Kimbell Art Foundation, multiple mineral and royalty investment partnerships and a number of high net worth Texas families
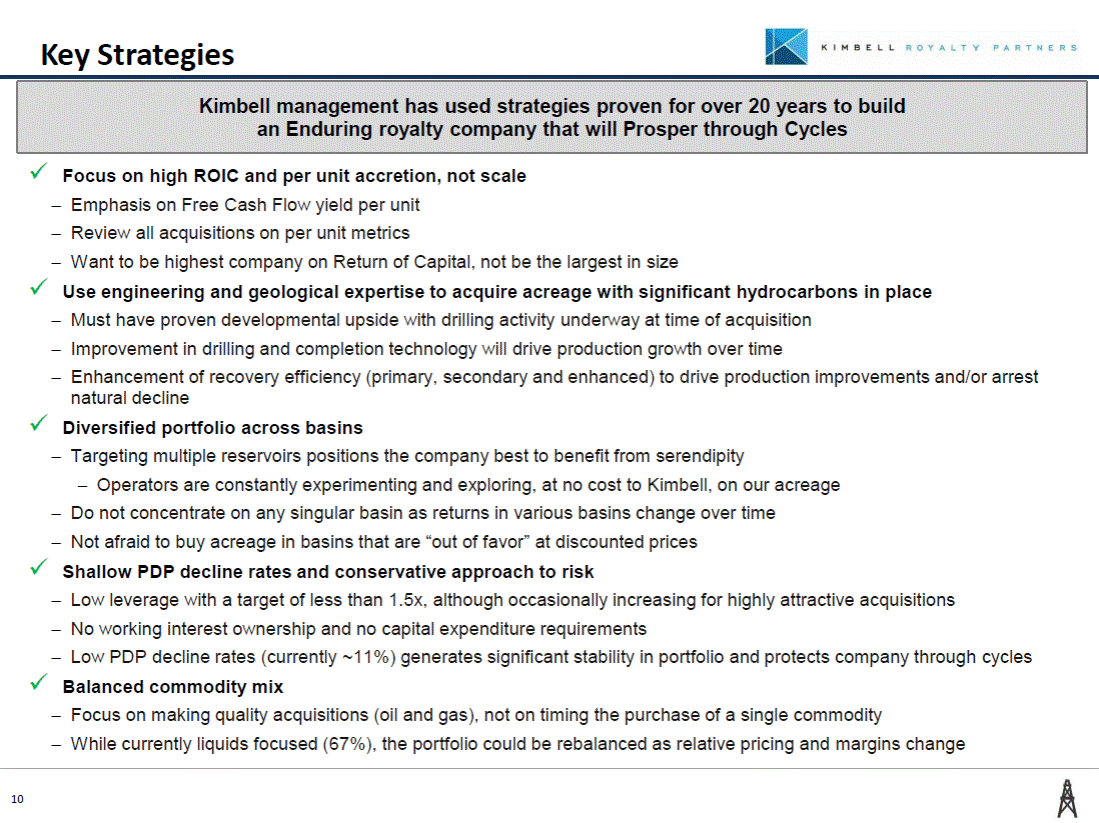
Key Strategies Focus on high ROIC and per unit accretion, not scale - Emphasis on Free Cash Flow yield per unit - Review all acquisitions on per unit metrics - Want to be highest company on Return of Capital, not be the largest in size Use engineering and geological expertise to acquire acreage with significant hydrocarbons in place - Must have proven developmental upside with drilling activity underway at time of acquisition - Improvement in drilling and completion technology will drive production growth over time - Enhancement of recovery efficiency (primary, secondary and enhanced) to drive production improvements and/or arrest natural decline Diversified portfolio across basins - Targeting multiple reservoirs positions the company best to benefit from serendipity - Operators are constantly experimenting and exploring, at no cost to Kimbell, on our acreage - Do not concentrate on any singular basin as returns in various basins change over time - Not afraid to buy acreage in basins that are “out of favor” at discounted prices Shallow PDP decline rates and conservative approach to risk - Low leverage with a target of less than 1.5x, although occasionally increasing for highly attractive acquisitions - No working interest ownership and no capital expenditure requirements - Low PDP decline rates (currently ~11%) generates significant stability in portfolio and protects company through cycles Balanced commodity mix - Focus on making quality acquisitions (oil and gas), not on timing the purchase of a single commodity - While currently liquids focused (67%), the portfolio could be rebalanced as relative pricing and margins change 10 Kimbell management has used strategies proven for over 20 years to build an Enduring royalty company that will Prosper through Cycles
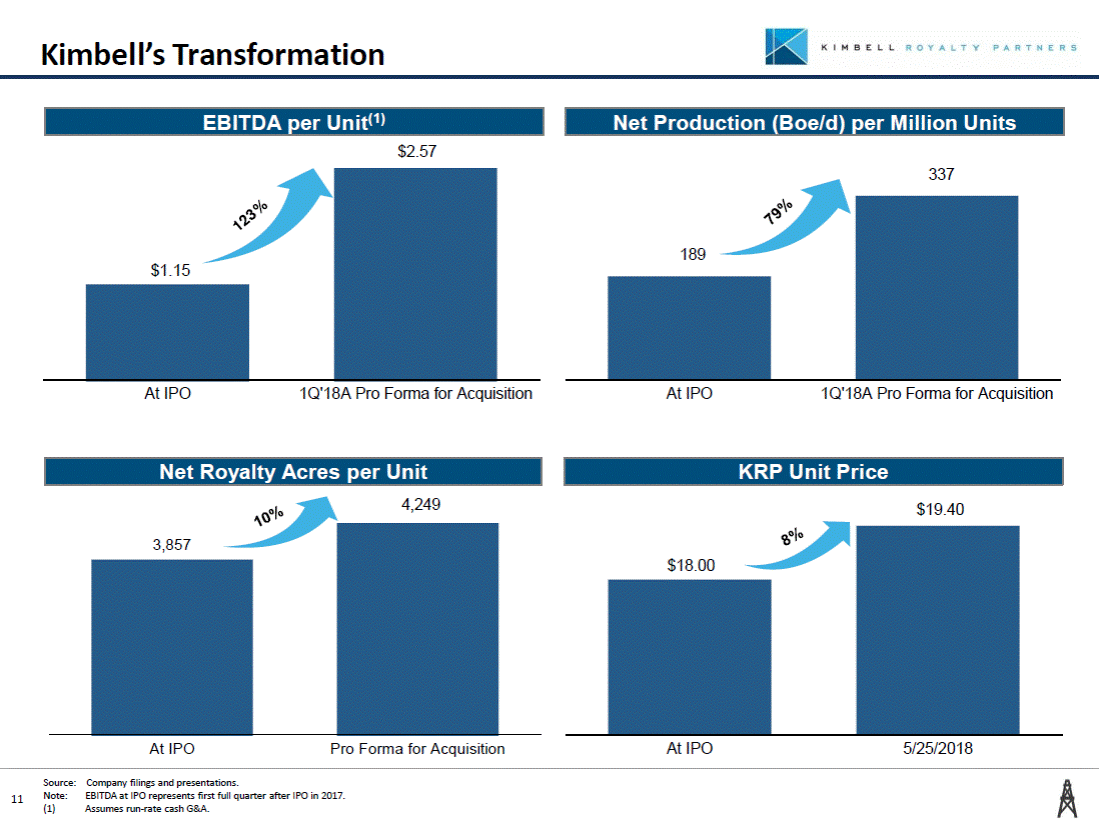
Kimbell’s Transformation $2.57 337 At IPO 1Q'18A Pro Forma for Acquisition At IPO 1Q'18A Pro Forma for Acquisition 4,249 $19.40 At IPO Pro Forma for Acquisition At IPO 5/25/2018 Source: Note: (1) Company filings and presentations. EBITDA at IPO represents first full quarter after IPO in 2017. Assumes run-rate cash G&A. 11 $18.00 3,857 Net Royalty Acres per Unit KRP Unit Price 189 $1.15 EBITDA per Unit(1) Net Production (Boe/d) per Million Units
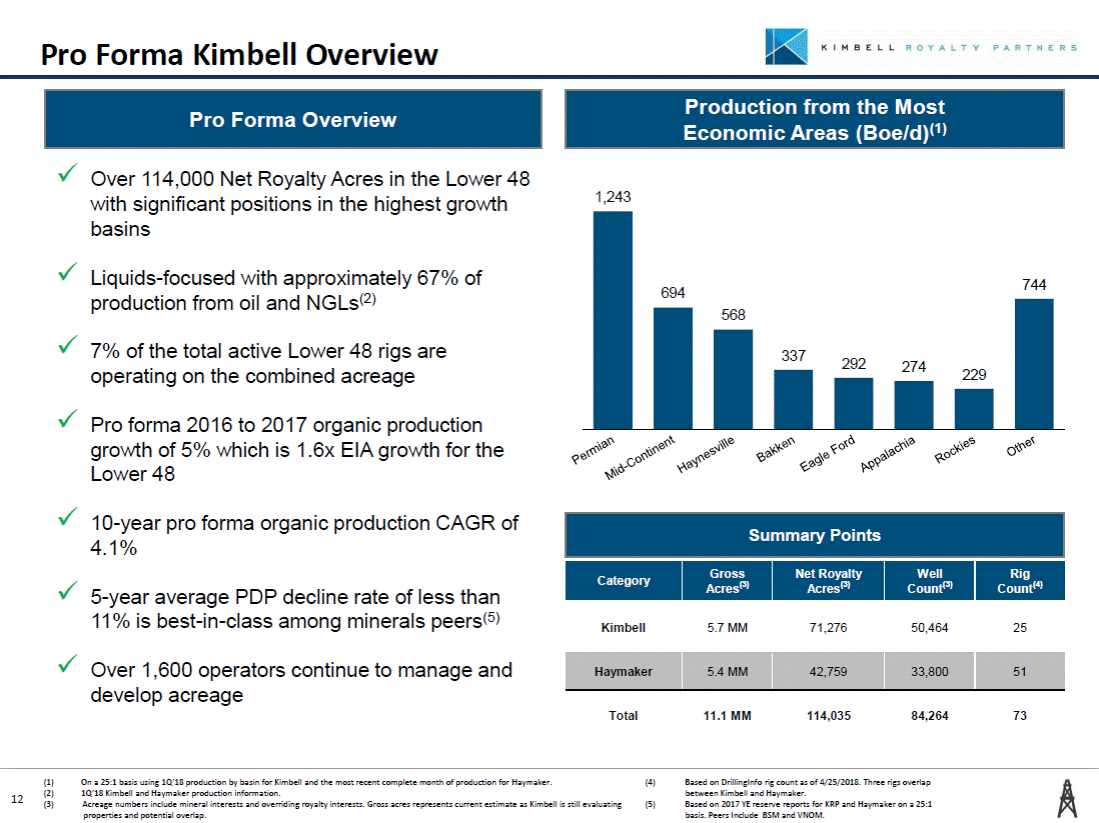
Pro Forma Kimbell Overview Economic Areas (Boe/d)(1) Over 114,000 Net Royalty Acres in the Lower 48 with significant positions in the highest growth basins 1,243 Liquids-focused with approximately 67% of production from oil and NGLs(2) 7% of the total active Lower 48 rigs are operating on the combined acreage 292 274 229 Pro forma 2016 to 2017 organic production growth of 5% which is 1.6x EIA growth for the Lower 48 10-year pro forma organic production CAGR of 4.1% 5-year average PDP decline rate of less than 11% is best-in-class among minerals peers(5) Kimbell 5.7 MM 71,276 50,464 25 Over 1,600 operators continue to manage and develop acreage Total 11.1 MM 114,035 84,264 73 (1) (2) (3) On a 25:1 basis using 1Q’18 production by basin for Kimbell and the most recent complete month of production for Haymaker. 1Q’18 Kimbell and Haymaker production information. Acreage numbers include mineral interests and overriding royalty interests. Gross acres represents current estimate as Kimbell is still evaluating properties and potential overlap. (4) Based on DrillingInfo rig count as of 4/25/2018. Three rigs overlap between Kimbell and Haymaker. Based on 2017 YE reserve reports for KRP and Haymaker on a 25:1 basis. Peers Include BSM and VNOM. 12 (5) Haymaker 5.4 MM 42,759 33,800 51 Summary Points Category Gross Acres(3) Net Royalty Acres(3) Well Count(3) Rig Count(4) 744 694 568 337 Production from the Most Pro Forma Overview
Acreage Focused in High Return Basins Kimbell has a weighted average breakeven price of $40 across its acreage position(1) 44% of production weighted towards the high growth, high margin Permian and Mid-Continent areas $80 $70 $60 $50 $40 $30 $20 $10 $0 WTI Price: $67.50 Weighted Average Breakeven Price: ~$40 Pro Forma Production(1): 1,243 694 568 337 292 274 229 Pro Forma NRAs: 20,232 38,686 5,468 5,174 3,527 8,896 564 Source: (1) (2) RS Energy Group and DrillingInfo. Breakevens per RS Energy group are shown on a 20:1 gas to oil basis by basin. Shown as Boe/d on a 25:1 basis using 1Q’18 production by basin for Kimbell and the most recent complete month of production for Haymaker. As of May 25, 2018. 13 Breakeven PV10 ($/bbl) Permian Basin DJ Basin SCOOP Powder River Basin Eagle Ford San Juan Basin STACK Marcellus Bakken Haynesville Cotton Valley Uinta Basin Utica Upper Devonian Green River Basin Rockies Appalachia Eagle Ford Bakken Haynesville Mid-Continent Permian (2) (1)

Positioned for Growth Through Acquisitions Existing Kimbell sponsors’ remaining assets have production and reserve characteristics similar to Kimbell’s existing portfolio - Sponsors’ portfolio is larger than standalone Kimbell today Ownership position incentivizes Kimbell’s Sponsors to offer Kimbell the option to acquire additional mineral and royalty assets Total Public Company Enterprise Value(2): 2% Total minerals market size(1): ~$500 billion $500 billion market with minimal amount in publicly traded royalty companies - Excludes value derived from Overriding Royalty Interests Highly fragmented private minerals market with more than $5 billion invested by sponsor-backed mineral operators Despite recent rise in commodity prices, a lack of scale proving too difficult for sponsors to monetize investments via IPOs Kimbell is uniquely positioned to capitalize on private equity need for liquidity and value enhancement Market Opportunity: 98% (1) Midpoint of market size estimate range. Based on production data from EIA and spot price as of 5/25/18. Assumes 20% of royalties are on Federal lands and there is an average royalty burden of 20%. Assumes a 10x multiple on cash flows to derive total market size. Enterprise values of KRP, BSM and VNOM as of 5/25/2018. 14 (2) Consolidation of Private Mineral Companies Sizing the Minerals Market Acquisitions from Current Sponsors

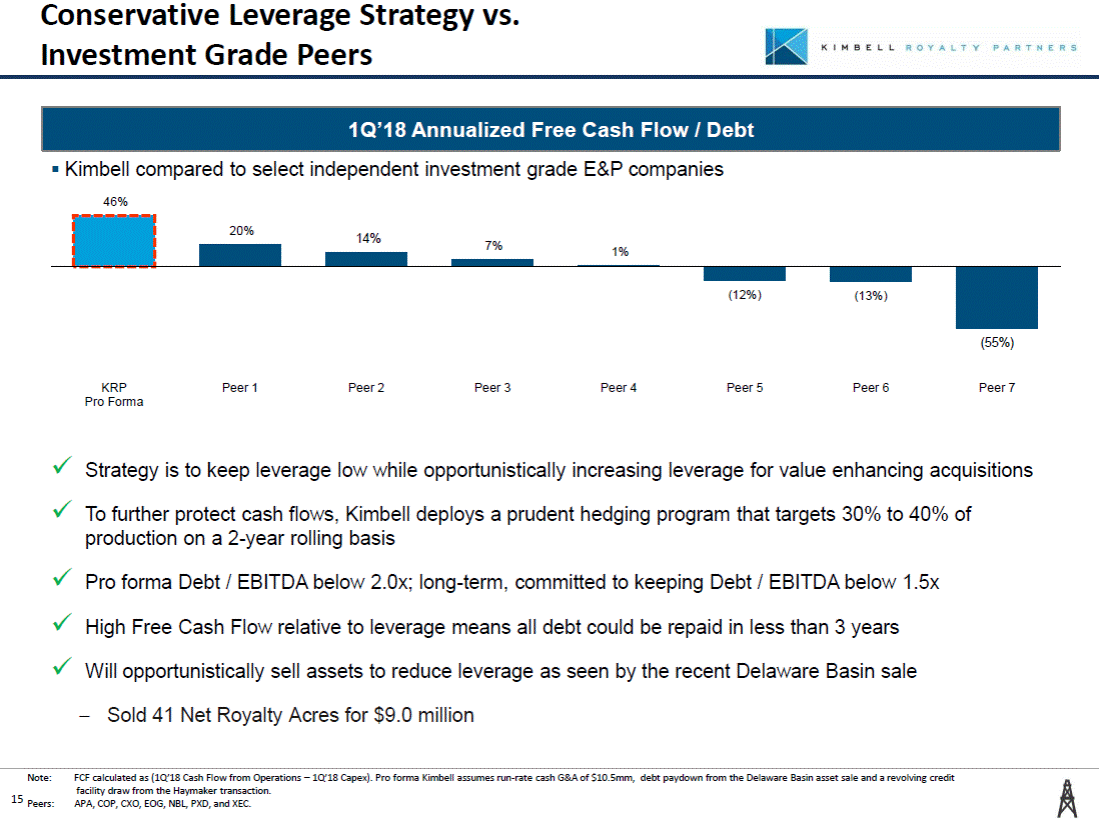
Conservative Leverage Strategy vs. Investment Grade Peers Kimbell compared to select independent investment grade E&P companies 46% 7% 1% (55%) KRP Pro Forma Peer 1 Peer 2 Peer 3 Peer 4 Peer 5 Peer 6 Peer 7 Strategy is to keep leverage low while opportunistically increasing leverage for value enhancing acquisitions To further protect cash flows, Kimbell deploys a prudent hedging program that targets 30% to 40% of production on a 2-year rolling basis Pro forma Debt / EBITDA below 2.0x; long-term, committed to keeping Debt / EBITDA below 1.5x High Free Cash Flow relative to leverage means all debt could be repaid in less than 3 years Will opportunistically sell assets to reduce leverage as seen by the recent Delaware Basin sale - Sold 41 Net Royalty Acres for $9.0 million Note: 15 Peers: FCF calculated as (1Q’18 Cash Flow from Operations – 1Q’18 Capex). Pro forma Kimbell assumes run-rate cash G&A of $10.5mm, debt paydown from the Delaware Basin asset sale and a revolving credit facility draw from the Haymaker transaction. APA, COP, CXO, EOG, NBL, PXD, and XEC. 20% 14% (12%)(13%) 1Q’18 Annualized Free Cash Flow / Debt
Sources of Cash for Transaction In conjunction with the Haymaker acquisition, Kimbell has lender commitments to increase its existing borrowing base capacity to $200 million from $100 million currently The $200 million commitment is fully underwritten between Frost Bank, the existing Administrative Agent, Wells Fargo and Credit Suisse Kimbell will draw $114 million on its revolving credit facility, leaving $64 million in undrawn capacity Pro forma liquidity will increase from $35mm to $71mm Kimbell will fund the remaining cash consideration through a private placement of $110 million of cumulative convertible preferred units to Apollo Key terms include: - - - Dividends of 7.00% per annum, paid quarterly in arrears Kimbell may redeem the Series A Preferred Units at any time for cash Optional redemption price is the greatest of a 1.2x multiple on invested capital, 13% IRR(1) or the liquidation preference at redemption Beginning on the second anniversary of the closing date, Apollo may elect to convert some or all of the Series A Preferred Units if the common unit price is at a 30% premium to the issue price Voting rights on an as-converted basis with common units - - (1) IRR increases in years 6 and 7 to 14% and 15% respectively. 16 Series A Cumulative Convertible Preferred Units Revolving Credit Facility

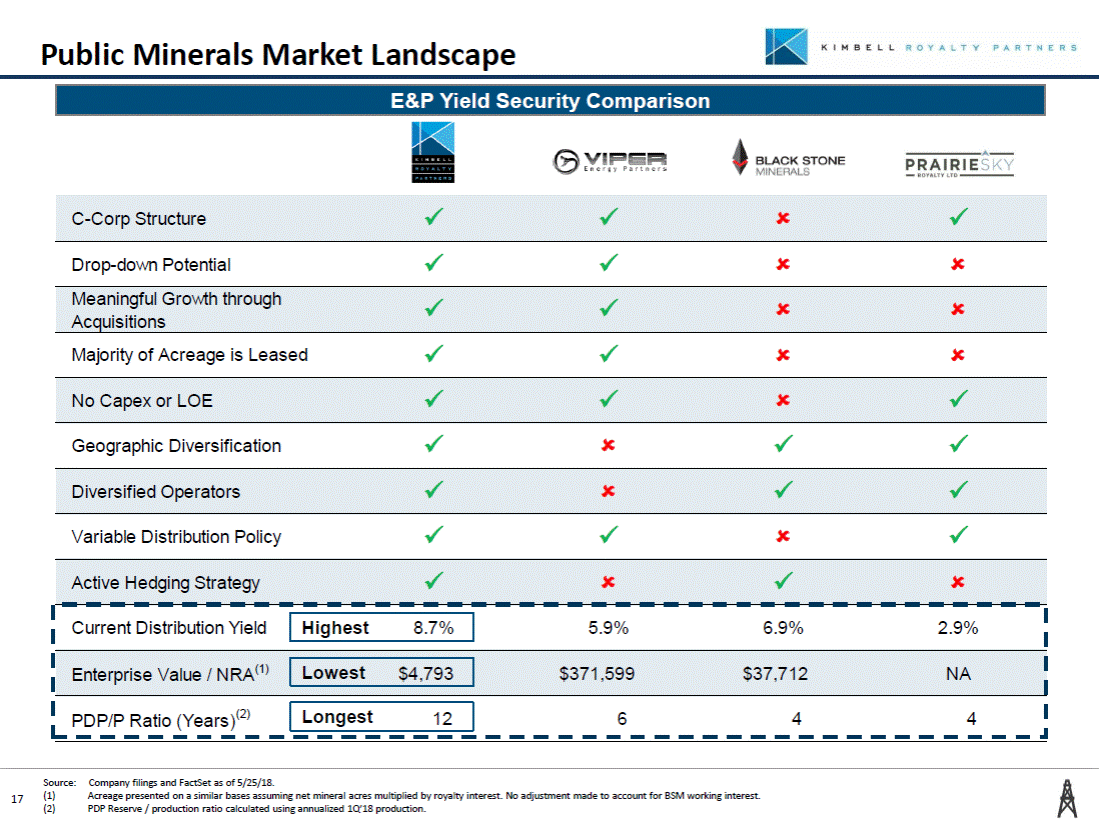
Public Minerals Market Landscape Drop-down Potential Acquisitions Majority of Acreage is Leased Geographic Diversification Variable Distribution Policy Source: (1) (2) Company filings and FactSet as of 5/25/18. Acreage presented on a similar bases assuming net mineral acres multiplied by royalty interest. No adjustment made to account for BSM working interest. PDP Reserve / production ratio calculated using annualized 1Q’18 production. 17 Active Hedging Strategy Current Distribution Yield 5.9% 6.9% 2.9% Enterprise Value / NRA(1) $371,599 $37,712 NA PDP/P Ratio (Years)(2) 6 4 4 Longest12 Lowest$4,793 Highest8.7% Diversified Operators No Capex or LOE Meaningful Growth through C-Corp Structure E&P Yield Security Comparison
Key Reasons to Own Kimbell 1 2 3 4 5 6 7 18 Trading at Significant Discount Strong Sponsor Support Prudent Financial Philosophy Positions Kimbell to Become a Consolidator Complementary, High-Quality Asset Base Upside through Conversion to C-Corp Structure Immediately Accretive Transaction

Appendix 19

Yield History 10.0% 9.0% 8.7% KRP 8.0% 7.0% 6.9% BSM 6.0% 5.9% VNOM 5.0% 4.0% Feb-17 Mar-17 May-17 Jun-17 Aug-17 Sep-17 Nov-17 Dec-17 Feb-18 Apr-18 May-18 (1) Company filings and FactSet as of 5/25/2018. 20 Distribution Yield Average KRP DCF yield prior to 1Q18 distribution announcement: 7.6% Distribution Yield Comparison vs. Selected Public Market Minerals Companies
Defining a Net Royalty Acre Kimbell calculates its Net Royalty Acres(1) as follows: Net Mineral Acres x Royalty Interest(2) - This methodology provides a clear and easily understandable view of Kimbell’s acreage position Royalty Interest Many companies use a 1/8th convention which assumes eight royalty acres for every mineral acre - This convention overstates a company’s net royalty interest in its total mineral acreage position as shown below Net Royalty Acres Net Royalty Acres (normalized to 1/8th) 912,280 (1) (2) (3) Net Royalty Acres derived from ORRIs are calculated by multiplying Gross Acres and ORRIs. Royalty Interest is inclusive of all other burdens. Acreage as of 12/31/2017. 21 114,035 Kimbell Acreage Under Both Methodologies(3) Net Royalty Acres Net Mineral Acres The calculation of a Net Royalty Acre differs across industry participants

Pro Forma Well Count by Basin Permian Basin 38,674 DJ Basin/Rockies/Niobrara Mid-Continent Terryville / Cotton Valley / Haynesville Barnett Shale/Fort Worth Basin Other Bakken/Williston Basin Appalachian Basin San Juan Basin Eagle Ford Onshore California Illinois Basin Kimbell Haymaker 22 11,883 9,408 7,602 3,784 3,711 2,624 1,938 1,843 1,603 975 220 Kimbell will have royalty interests in over 84,000 wells in the United States, of which over 38,000 are located in the Permian Basin
Pro Forma Portfolio Terryville / Cotton Valley / Haynesville 6% Terryville / Cotton Valley / Haynesville 6% Terryville / Cotton Valley / Haynesville 5% Other 26% Other 25% Other 29% Mid-Continent 30% Mid-Continent 31% 11.1 mm acres Mid-Continent 29% + = 5.7 mm acres 5.4 mm acres Bakken / Williston Basin 2% Eagle Ford 4% Bakken / Williston Basin 9% Eagle Ford 3% DJ Basin / DJ Basin / Niobrara 0% Bakken / Williston Basin 16% Niobrara Appalachia Permian Basin 10% 1% 3% Permian Basin 23% Eagle Ford 2% DJ Basin /Appalachia Permian Basin 35% Niobrara 1% 5% 25% 39% + = 54% 46% $21.2 mm $10.3 mm $10.8 mm 61% 75% Liquids Gas (1) (2) Acreage numbers as of year end 12/31/2017. Includes mineral interests and overriding royalty interests. Includes mineral interests and overriding royalty interests. Haymaker 1Q18 revenue based on Haymaker management guidance. 23 1Q18 Revenue by Product(2) Kimbell Standalone Pro Forma Acreage(1) Haymaker Standalone

Kimbell’s Standalone Profile Expansive position of ~5.7 million gross acres and ~71,300 net royalty acres with core positions in the Permian Basin and Mid-Continent, representing 52% of total net royalty acres Mineral and overriding royalty interests in more than 50,000 wells Diverse base of 700 operators continue to manage and develop Kimbell’s acreage position without any capital investment required by Kimbell Current rig count of 21 Long and successful track record of making acquisitions - Certain members of management team have completed > 160 acquisitions since 1998 NYSE Symbol KRP Market Capitalization $327 MM Total 5.7 MM 71,276 50,000 21 Debt / Adj. EBITDA (1Q18 Annualized) 0.7x (1) (2) (3) (4) As of 12/31/2017. Debt balance pro forma for $9 million pay down resulting from Permian acreage sale. Based on annualized 1Q18 distribution and unit price as of 5/25/18. Based on DrillingInfo rig count as of 4/25/2018. 24 Yield8.7%(3) Permian 2.0 MM 18,496 30,000 12 Enterprise Value$342 MM%(2) Units Outstanding16.8 MM Market Valuation – As of 5/25/18 Summary Points Category Gross Acres(1) Net Royalty Acres(1) Well Count(1) Rig Count(4) Diverse Acreage Position Kimbell Overview(1)

Haymaker Overview Vast position of ~5.4 million gross acres and ~43,000 net royalty acres 51 Rigs on Acreage(1) - Increasing operator activity in the Mid-Continent as operators pursue high-return, stacked pay drilling targets in the SCOOP/STACK Mineral and overriding royalty interests in more than 33,000 wells Diverse base of ~1,100 operators Current rig count of 51(1) Count(1) Total 5.4 MM 42,759 33,800 51 (1) (2) Based on DrillingInfo rig count as of 4/25/2018. As of 3/26/2018. 25 Mid-Continent 1.7 MM 20,306 5,782 16 Summary Points Category Gross Acres Net Royalty Acres Well Count Rig Active Hz rigs(2) County with Haymaker interests Expansive Footprint Quality Assets with Ongoing Development

Post-Acquisition Management weaknesses of individual assets in the involved with tracking cash flows and performance expectations 26 Proactive Approach Leverage specialized software and proprietary models to forecast new well development and net production to determine Apply ongoing forecasting analysis against cash flow receipts from each royalty interest to verify return on investment Weekly Review Review all assets in the portfolio as a team during weekly meetings - Allows for fresh perspective and insight Determine next steps for each investment Asset Management Ongoing Accountability Post-investment, Kimbell’s entire team is involved in managing the portfolio of royalty interests Investment Team continues to analyze asset performance and assess the strengths and portfolio Accounting & Administration is heavily monitoring assets on a monthly basis - Currently collecting cash flows on over 50,000 wells Disciplined Monitoring Immediately following an acquisition, the Kimbell Team works diligently to seek to ensure each well reaches “pay status” Detailed portfolio review - Constantly monitor operators and net production values of producing assets - Actual performance vs. expectations - Identify opportunities for revenue enhancement - Adjust software and models as the portfolio and environment evolves / changes KRP Acquisition An Active Approach to Portfolio Management

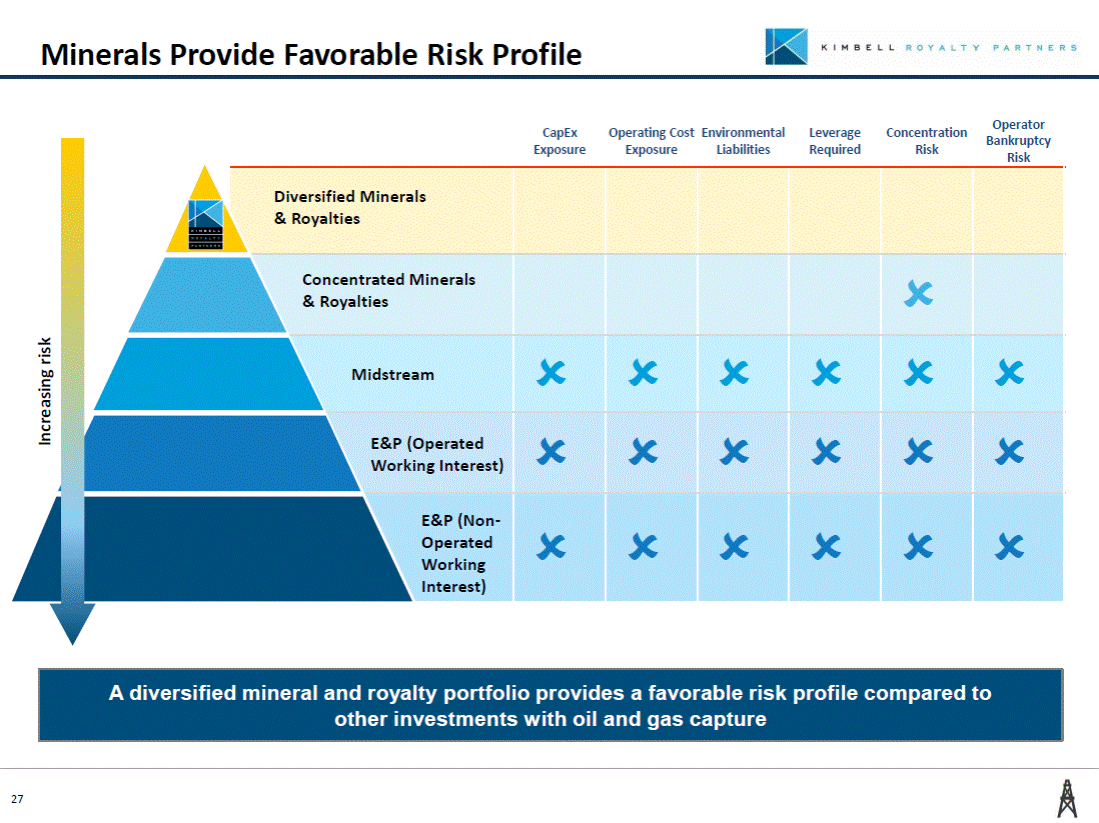
Minerals Provide Favorable Risk Profile Bankruptcy 27 Increasing risk A diversified mineral and royalty portfolio provides a favorable risk profile compared to other investments with oil and gas capture CapEx Exposure Operating Cost Exposure Environmental Liabilities Leverage Required Concentration Risk Operator Risk Diversified Minerals & Royalties Concentrated Minerals & Royalties Midstream E&P (Operated Working Interest) E&P (Non-Operated Working Interest)
Mineral Interests Generally Capital Structure Senior to All Claims in 28 Working Interest owner entitled to ~75-85% of production revenue and bears 100% of development cost and lease operating expense Equity Subordinated Debt Senior Debt Senior Secured Debt Mineral Interest owner entitled to ~15-25% of production revenue In many states, mineral and royalty interests are considered by law to be real property interests and are thus afforded additional protections under bankruptcy law

Kimbell vs. Midstream/Service MLPs 1 2 3 4 Sizeable/Diversified Asset Base Avoid Operating Expenses & Risks Equity-Like Upside Compelling Current Income investments based on a operator drilling programs (1) Acreage numbers as of 12/31/2017. Includes mineral interests and overriding royalty interests. 29 Royalties can provide significant current income for investors in KRP units Kimbell evaluates and approves new royalty minimum yield Kimbell does not purchase royalties “ahead of the drill bit”, which is a strategy that is much higher risk and doesn’t generate current income Like working interest investments, royalties fluctuate in value based on the price and volume of the underlying assets, giving the owner equity-like upside Royalties can benefit from and platform efficiencies that drive net production gains, at no cost to the royalty owner Interests in ~11.1 million gross acres(1) with ownership in over 84,000 wells including over 38,000 in the Permian Basin alone Mineral and royalty interests located in 28 states and in nearly every major onshore basin Mineral buyers can be very selective in the areas they buy assets Royalties are paid from the revenue associated with oil and gas production Not affected by lease operating expenses, capital expenditures or the balance sheets of the operators / payors Risk & Expenses Kimbell believes that mineral and royalty ownership is attractive in that it provides an attractive risk-return profile, especially when compared to ownership of midstream/service MLPs

Higher Margin, Lower Risk Illustrative Kimbell Royalty Interest(1) Illustrative Working Interest Owner(1) Revenue of $50.00 Revenue of $50.00 (1) Illustrative purposes only. Expenses and tax rates will vary by operator, locale and asset. 30 Royalties ($12.50) LOE & Prod. / Ad Val Tax ($15.65) F&D ($15.00) Operating Margin $6.85 Prod. / Ad Val Tax ($3.65) Operating Margin $46.35 Royalty companies realize a significantly higher operating margin than working interest owners. No direct operating or capital expenses.

Overview of Mineral & Royalty Interests Minerals NPRIs ORRIs Perpetual real-property interests that grant oil and natural gas ownership under a tract of land Nonparticipating royalty interests Overriding royalty interests Royalty interests that are carved out of a mineral estate Royalty interests that burden the working interests of a lease Represent the right to either explore, drill, and produce oil and natural gas or lease that right to third parties for an upfront payment (i.e. lease bonus) and a negotiated percentage of production revenues Perpetual right to receive a fixed cost-free percentage of production revenue Right to receive a fixed, cost-free percentage of production revenue (term limited to life of leasehold estate) Do not participate in upfront payments (i.e. lease bonus) Illustrative Mineral Revenue Generation 1 2 4 3 Unleased Minerals KRP Issues a Lease Leased Minerals Lease Termination Operator: 75-80% KRP: 0% 31 Revenue Share KRP: 20-25% Cost Share Operator: 100% KRP receives an upfront cash bonus payment and customarily a 20-25% royalty on production revenues In return, KRP delivers the right to explore and develop with the operator bearing 100% of costs for a specified lease term Upon termination of a lease, all future development rights revert to KRP to explore or lease again Revenue Share KRP: 100% Operator: 0% Cost Share KRP: 100% Operator: 0%

Historical Selected Financial Data of KRP March 31, 2018 Balance Sheet (in thousands) Assets: Current assets Cash and cash equivalents Oil, natural gas and NGL receivables Other current assets Total current assets Property and equipment, net Oil and natural gas properties Oil and natural gas properties (full cost method) Less: accumulated depreciation, depletion and accretion Total oil and natural gas properties Loan origination costs, net Total assets Liabilities and partners' capital: Current liabilities Accounts payable Other current liabilities Commodity derivative liabilities Total current liabilities Long-term debt Commodity derivative liabilities Total liabilities Commitments and contingencies Partners' capital Total liabilities and partners' capital $ 6,837 6,560 372 13,769 129 297,624 (74,560) 223,064 240 $ 237,202 $ 695 1,283 290 2,268 30,844 241 33,353 203,849 $ 237,202 32

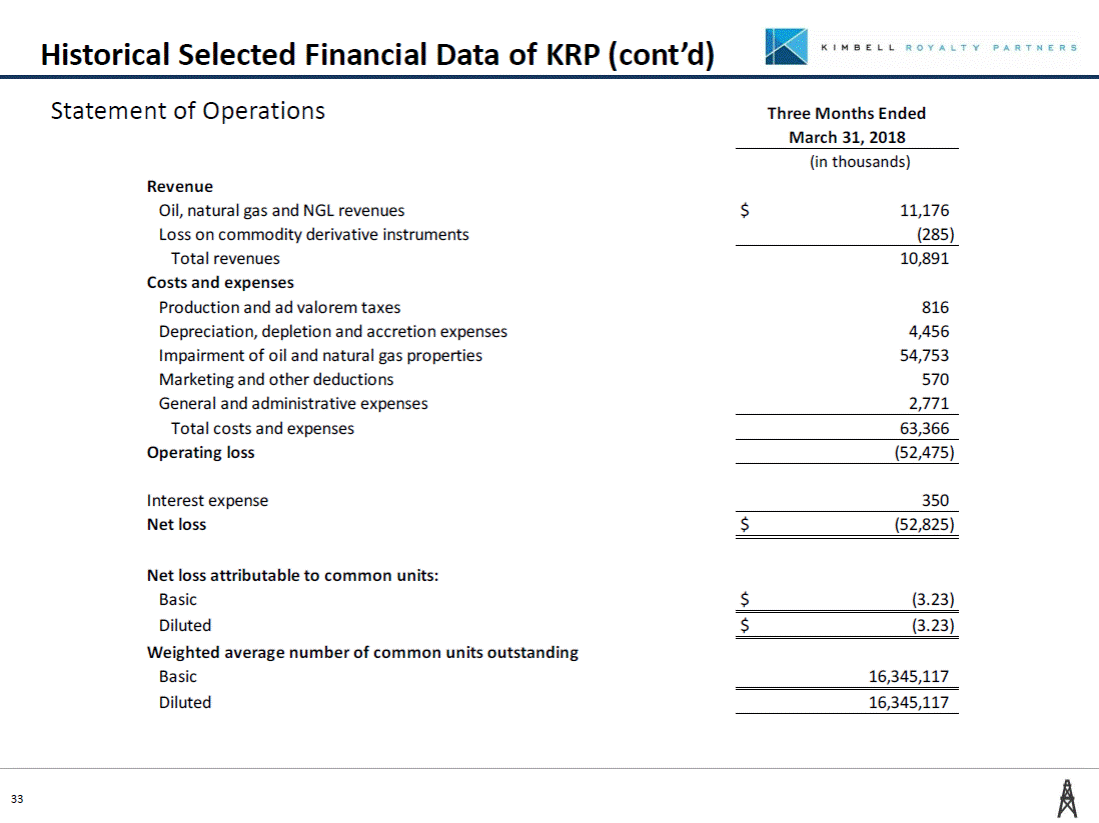
Historical Selected Financial Data of KRP (cont’d) Statement of Operations Three Months Ended March 31, 2018 (in thousands) Revenue Oil, natural gas and NGL revenues Loss on commodity derivative instruments Total revenues Costs and expenses Production and ad valorem taxes Depreciation, depletion and accretion expenses Impairment of oil and natural gas properties Marketing and other deductions General and administrative expenses Total costs and expenses Operating loss $ 11,176 (285) 10,891 816 4,456 54,753 570 2,771 63,366 (52,475) Interest expense Net loss 350 $ (52,825) Net loss attributable to common units: Basic Diluted Weighted average number of common units outstanding Basic Diluted $ (3.23) $ (3.23) 16,345,117 16,345,117 33
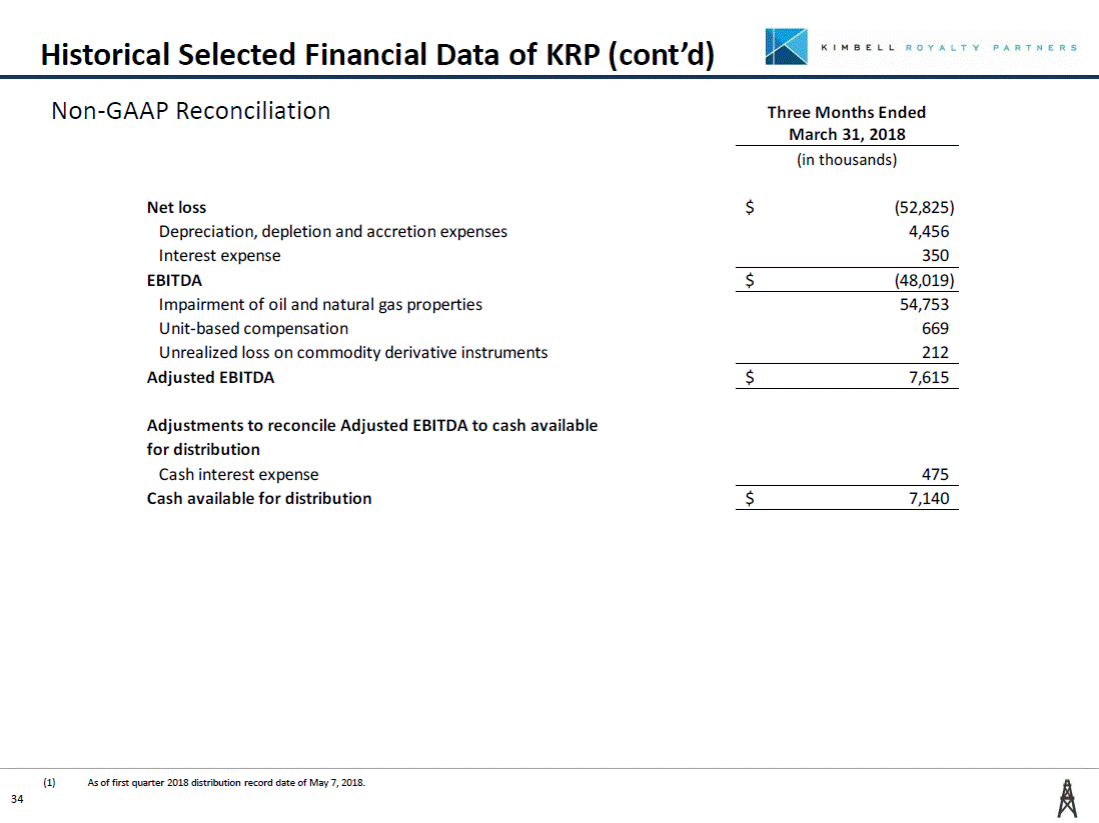
Historical Selected Financial Data of KRP (cont’d) Non-GAAP Reconciliation Three Months Ended March 31, 2018 (in thousands) Net loss Depreciation, depletion and accretion expenses Interest expense EBITDA Impairment of oil and natural gas properties Unit-based compensation Unrealized loss on commodity derivative instruments Adjusted EBITDA $ (52,825) 4,456 350 $ (48,019) 54,753 669 212 $ 7,615 Adjustments to reconcile Adjusted EBITDA to cash available for distribution Cash interest expense Cash available for distribution 475 $ 7,140 (1) As of first quarter 2018 distribution record date of May 7, 2018. 34
Historical Selected Financial Data of KRP (cont’d) Non-GAAP Reconciliation Three Months Ended March 31, 2018 (in thousands) Reconciliation of net cash provided by operating activities to Adjusted EBITDA Net cash provided by operating activities Interest expense Impairment of oil and natural gas properties Amortization of loan origination costs Unit-based compensation Unrealized loss on commodity derivative instruments Changes in operating assets and liabilities: Oil, natural gas and NGL revenues receivable Other receivables Accounts payable Other current liabilities EBITDA Add: Impairment of oil and natural gas properties Unit-based compensation Loss on commodity derivative instruments Adjusted EBITDA $ 7,294 350 (54,753) (16) (669) (212) (233) 135 (379) 464 $ (48,019) 54,753 669 212 $ 7,615 35


