
Form 6-K Loma Negra Compania Indu For: May 10
|
UNITED STATES
|
|
SECURITIES AND EXCHANGE COMMISSION
|
|
Washington, D.C. 20549
|
FORM 6-K
REPORT OF FOREIGN PRIVATE ISSUER
Pursuant to Rule 13a-16 or 15d-16 under the
Securities Exchange Act of 1934
Securities Exchange Act of 1934
For the month of May, 2018
Commission File Number: 001-38262
LOMA NEGRA COMPAÑÍA INDUSTRIAL ARGENTINA SOCIEDAD ANÓNIMA
(Exact Name of Registrant as Specified in its Charter)
(Exact Name of Registrant as Specified in its Charter)
LOMA NEGRA CORPORATION
(Translation of Registrant’s name into English)
(Translation of Registrant’s name into English)
|
Reconquista 1088, 7th Floor
Zip Code C1003ABQ – Ciudad Autónoma de Buenos Aires
Republic of Argentina
|
|
(Address of principal executive offices)
|
Indicate by check mark whether the registrant files or will file annual reports under cover Form 20-F or Form 40-F.
Form 20-F ☒Form 40-F ☐
Form 20-F ☒Form 40-F ☐
Indicate by check mark if the registrant is submitting the Form 6-K in paper as permitted by Regulation S-T Rule 101(b)(1): ☐
Indicate by check mark if the registrant is submitting the Form 6-K in paper as permitted by Regulation S-T Rule 101(b)(7): ☐
Table of Contents
|
Item
|
Description
|
|
1
|
First Quarter 2018, Earnings Call Presentation
|

1Q18 Results Conference Call

Disclaimer and Forward Looking Statement This presentation may contain forward-looking statements within the meaning of federal securities law that are subject to risks and uncertainties. These statements are only predictions based upon our current expectations and projections about possible or assumed future results of our business, financial condition, results of operations, liquidity, plans and objectives. In some cases, you can identify forward-looking statements by terminology such as “believe,” “may,” “estimate,” “continue,” “anticipate,” “intend,” “should,” “plan,” “expect,” “predict,” “potential,” “seek,” “forecast,” or the negative of these terms or other similar expressions. The forward-looking statements are based on the information currently available to us. There are important factors that could cause our actual results, level of activity, performance or achievements to differ materially from the results, level of activity, performance or achievements expressed or implied by the forward-looking statements, including, among others things: changes in general economic, political, governmental and business conditions globally and in Argentina, changes in inflation rates, fluctuations in the exchange rate of the peso, the level of construction generally, changes in cement demand and prices, changes in raw material and energy prices, changes in business strategy and various other factors. You should not rely upon forward-looking statements as predictions of future events. Although we believe in good faith that the expectations reflected in the forward-looking statements are reasonable, we cannot guarantee that future results, levels of activity, performance and events and circumstances reflected in the forward-looking statements will be achieved or will occur. Any or all of Loma Negra’s forward-looking statements in this release may turn out to be wrong. You should consider these forward-looking statements in light of other factors discussed under the heading “Risk Factors” in the prospectus filed with the Securities and Exchange Commission on October 31, 2017 in connection with Loma Negra’s initial public offering. Therefore, readers are cautioned not to place undue reliance on these forward-looking statements.Except as required by law, we undertake no obligation to update publicly any forward-looking statements for any reason after the date of this release to conform these statements to actual results or to changes in our expectations.Note: The Company presented some figures converted from Argentine pesos to U.S. dollars for comparison purposes. The exchange rate used to convert Pesos to U.S. dollars was the reference exchange rate (Communication “A” 3500) reported by the Central Bank for U.S. dollars. The information presented in U.S. dollars is for the convenience of the reader only. Certain figures included in this report have been subject to rounding adjustments. Accordingly, figures shown as totals in certain tables may not be arithmetic aggregations of the figures presented in previous quarters.

Loma Negra reports a solid start to the year deliveringstrong top and bottom line growth… Attractive market dynamics with healthy volume growth and a positive pricing environment in ArgentinaBalancing growth and profitabilityNet revenues + 41.6% to Ps.4.5 billion (US$230 million)Adjusted EBITDA +40.6% to Ps.1.2 billion (US$59 million)Net majority income +48.6% to Ps.Ps.526 million (US$ 27 million)Strong balance sheet with cash position of Ps.2,294 million and a healthy leverage ratio of 0.53xExpansion of L´Amalí plant on schedule

…driven by continued momentum in private construction and public infrastructure in Argentina Source INDEC and Market Expectations Survey as of April 2018Source INDEC Based on AFCP GDP Growth1 (%) Construction Activity2 (YoY Growth, %) Monthly Industry Cement Sales3 (YoY Growth, %) Industry Cement Sales by Type3 (%)

Solid volume and healthy pricing environment support revenue growth across our products and markets Argentine cement revenues up 41.1% YoY driven by 9.5% increase in volumes supported by healthy pricing environment Paraguay cement revenues up 23.1% YoY with prices and the Guarani appreciation more than offsetting lower volumes, compared with industry volumes drop of 8% due to a slow start to the yearConcrete revenues almost doubled YoY, with volumes up 44.8% driven by strong pick-up in public infrastructure in our markets and healthy pricingRailroad revenues up 22.9%, despite lower transported volumes of third party aggregatesAggregate volumes up 22.9% driven by strong demand while revenues up only 31.3% given significant higher share of FOB sales Sales Volumes 1Q18 1Q17 % Chg. Cement, masonry & lime Argentina MM Tn 1.58 1.45 9.5% Paraguay MM Tn 0.14 0.15 -5.2% Cement, masonry & lime total 1.72 1.59 8.1% Argentina: Concrete MM m3 0.25 0.17 44.8% Railroad MM Tn 1.17 1.23 -4.9% Aggregates MM Tn 0.29 0.23 22.9% Revenues (AR$ million) 1Q18 1Q17 % Chg. 3,400 2,409 41.1% 346 281 23.1% 3,746 2,690 39.2% 707 360 96.5% 441 358 22.9% 68 52 31.3% Total Net Revenues 4,534 3,202 41.6%

Gross Profit up 38% while SG&A as a % of revenuesdeclined 118 bps Gross Profit & Margin AR$ Million Gross profit up 38% YoY, with gross margin down 74 bps to 28.7% mainly reflecting growth in the concrete segmentGross margin in Cement segment in Argentina up 221 bps mostly due to ongoing growth in volumes and pricesSG&A as a % of sales down 118 bps YoY to 7.2% mainly driven by higher cost dilution and lower sales tax rate Selling, General & Administrative AR$ Million As a % of Sales 7.2% 8.4% +22% Gross Margin 28.7% 29.4% +38%

Robust revenue growth drove increase of 41% in Adjusted EBITDA… Adjusted EBITDA & Margin AR$ Million Adjusted EBITDA up 40.6% YoY to Ps.1,166 million in 1Q18, driven by continued growth in volumes and prices, along with ongoing cost controls, while Adjusted EBITDA Margin remained almost unchanged +41% 53 59 US$ million 25.7% 25.9% Adjusted EBITDA Margin Argentine Cement segment Adjusted EBITDA (84% of the consolidated Adjusted EBITDA in 1Q18) up 52.1% with margin up by 207 bps to 28.7%Paraguay Cement segment Adjusted EBITDA up 22.9% YoY, with margin relatively flat at 43.4%Robust growth in the Concrete segment along with lower profitability in the Railroad and Aggregates segments offset the Cement segment margin expansion Adjusted EBITDA breakdown

…with Net Majority Income up 49% Net Profit attributable to Owners AR$ Million 23 27 US$ million +49% On top of strong Adjusted EBITDA growth, bottom line profitability also benefitted from a decline in the effective tax rate to 28% in 1Q18 from 32% in 1Q17, as a result of the Income tax rate reduction in Argentina from the recent Tax ReformHowever, total finance costs net, increased by 198% mainly due to foreign exchange differences Foreign exchange loss of Ps.109 million in 1Q18, as a result of the 7.3% peso depreciation as compared to a Ps.87 million gain in 1Q17 when the peso appreciated 3.0% Financial income, up by Ps.104 million reflecting a higher cash balanceNet Profit Attributable to Owners of the Company for the quarter up 48.6% YoY, or Ps.172 million, to Ps.526 million, and 18.4% YoY in US$.
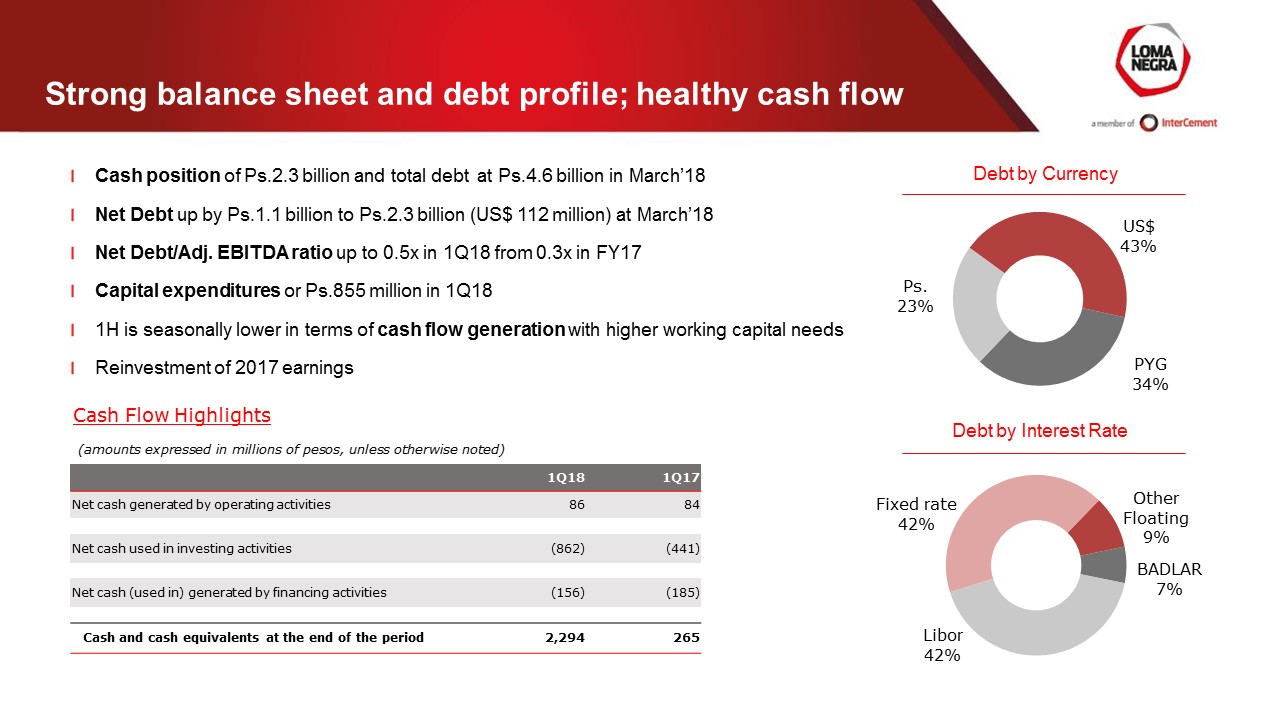
Strong balance sheet and debt profile; healthy cash flow Debt by Currency Debt by Interest Rate Cash position of Ps.2.3 billion and total debt at Ps.4.6 billion in March’18Net Debt up by Ps.1.1 billion to Ps.2.3 billion (US$ 112 million) at March’18Net Debt/Adj. EBITDA ratio up to 0.5x in 1Q18 from 0.3x in FY17Capital expenditures or Ps.855 million in 1Q181H is seasonally lower in terms of cash flow generation with higher working capital needsReinvestment of 2017 earnings Cash Flow Highlights 1Q18 1Q17 Net cash generated by operating activities 86 84 Net cash used in investing activities (862) (441) Net cash (used in) generated by financing activities (156) (185) Cash and cash equivalents at the end of the period 2,294 265

Looking into 2018 Continued sound market dynamics driving profitable growth, but slowing down from recent high recovery levelsWell positioned to continue balancing growth and profitability through leading market position and strategically located facilities with nationwide distributionAdvancing on L’Amalí plant expansion plan, completion expected by 2020Robust balance sheet and solid cash flow generation

Questions & Answers

Exhibit: Summary Financial Statements

Income Statement 13 Condensed Interim Consolidated Statements of Profit or Loss (amounts expressed in millions of pesos, unless otherwise noted) Three-months endedMarch 31, Three-months endedMarch 31, 2018 2017 % Change 2018 2017 % Change Net revenue 4,534 3,202 41.6% 4,534 3,202 41.6% Cost of sales (3,233) (2,259) 43.1% (3,233) (2,259) 43.1% Gross Profit 1,301 943 38.0% 1,301 943 38.0% Selling and administrative expenses (327) (269) 21.7% (327) (269) 21.7% Other gains and losses 4 0 1233.1% 4 0 n/a Tax on debits and credits to bank accounts (65) (40) 62.1% (65) (40) 62.1% Finance costs, net Exchange rate differences (109) 87 -225.5% (109) 87 n/a Financial income 108 4 2795.3% 108 4 2795.3% Financial expenses (150) (142) 5.5% (150) (142) 5.5% Profit before tax 762 583 30.6% 762 583 30.6% Income tax expense Current (199) (182) 9.6% (199) (182) 9.6% Deferred (13) (2) 607.4% (13) (2) 607.4% Net profit 549 399 37.4% 549 399 37.4% Net Profit attributable to owners of the Company 526 354 48.6% 526 354 48.6%

Balance Sheet Condensed Interim Consolidated Statements of Financial Position as of March 31, 2018 and December 31, 2017 (Unaudited) (amounts expressed in millions of pesos, unless otherwise noted) As of March 31, As of December 31, 2018 2017 ASSETS Non-Current assets Property, plant and equipment 6,283 5,979 Intangible assets 73 75 Investments 0 0 Goodwill 39 39 Inventories 219 215 Other receivables 615 145 Trade accounts receivable - - Total non-current assets 7,230 6,454 Current assets Inventories 2,227 1,834 Other receivables 362 242 Trade accounts receivable 1,555 1,263 Investments 2,060 2,991 Cash and banks 234 189 Total current assets 6,438 6,519 TOTAL ASSETS 13,668 12,972 SHAREHOLDERS' EQUITY Capital stock and other capital related accounts 1,922 1,922 Reserves 59 59 Retained earnings 2,117 1,591 Accumulated other comprehensive income 293 250 Equity attributable to the owners of the Company 4,391 3,823 Non-controlling interests 657 593 TOTAL SHAREHOLDERS' EQUITY 5,048 4,416 LIABILITIES Non-current liabilities Borrowings 2,618 2,604 Accounts payable 60 71 Provisions 175 161 Tax liabilities 0 0 Other liabilities 14 16 Deferred tax liabilities 243 229 Total non-current liabilities 3,110 3,082 Current liabilities Borrowings 1,941 1,760 Accounts payable 2,134 2,362 Advances from customers 146 206 Salaries and social security payables 562 542 Tax liabilities 697 573 Other liabilities 30 32 Total current liabilities 5,510 5,474 TOTAL LIABILITIES 8,620 8,556 TOTAL SHAREHOLDERS' EQUITY AND LIABILITIES 13,668 12,972

Statement of Cash Flows 15 Condensed Interim Consolidated Statements of Cash Flow for the three months ended March 31, 2018 and 2017 (Unaudited) (amounts expressed in millions of pesos, unless otherwise noted) Three-months ended March 31, 2018 2017 CASH FLOWS FROM OPERATING ACTIVITIES Net profit for the year 549 399 Adjustments to reconcile net profit to net cash provided by operating activities Income tax expense 213 184 Depreciation and amortization 189 155 Provisions 7 12 Interest 120 122 Share of profit (loss) of associates - - Investment income recognized in profit 88 (86) Exchange rate differences - 1 Gain on disposal of Property, plant and equipment - 0 Changes in operating assets and liabilities Inventories (374) (267) Other receivables (82) 21 Trade accounts receivable (281) (309) Advances from customers (60) 81 Accounts payable (216) (221) Salaries and social security payables 19 30 Provisions (5) (2) Tax liabilities (0) 8 Other liabilities (3) (2) Income tax paid (76) (42) Net cash generated by operating activities 86 84 CASH FLOWS FROM INVESTING ACTIVITIES Proceeds from disposal of Property, plant and equipment 3 - Payments to acquire Property, plant and equipment (360) (462) Payment of advances of Property, plant and equipment (495) - Payments to acquire Intangible Assets (1) (7) Interest received - 27 Contributions to F.F.F.S.F.I. (9) - Cash from business combination under common control - - Net cash used in investing activities (862) (441) CASH FLOWS FROM FINANCING ACTIVITIES Proceeds from borrowings 182 183 Interest paid (158) (157) Dividends paid - - Repayment of borrowings (180) (212) Proceeds from initial public offering, net of issuance costs - - Net cash used in financing activities (156) (185) Net decrease in cash and cash equivalents (932) (542) Cash and cash equivalents at the beginning of the year 3,180 803 Effects of the exchange rate differences on cash and cash equivalents in foreign currency 46 4 Cash and cash equivalents at the end of the period 2,294 265

Adjusted EBITDA Reconciliation & Margin 16 Adjusted EBITDA Reconciliation & Margin (amounts expressed in millions of pesos, unless otherwise noted) Three-months endedMarch 31, 2018 2017 % Chg. Adjusted EBITDA reconciliation: Net profit 549 399 37.4% (+) Financial interest, net 15 114 -86.8% (+) Income tax expense 213 184 15.7% (+) Depreciation and amortization 189 155 21.5% (+) Exchange rate differences 109 (87) n/a (+) Other financial expenses, net 26 24 11.9% (+) Tax on debits and credits to bank accounts 65 40 62.1% Adjusted EBITDA 1,166 829 40.6% Adjusted EBITDA Margin 25.7% 25.9% -18 bps

IR Contact Marcos I. GradinChief Financial Officer and Investor RelationsGaston PinnelInvestor Relations [email protected]
SIGNATURES
Pursuant to the requirements of the Securities Exchange Act of 1934, the registrant has duly caused this report to be signed on its behalf by the undersigned, thereunto duly authorized.
| Loma Negra Compañía Industrial Argentina Sociedad Anónima | |||
|
Date: May 9, 2018
|
By:
|
/s/ Marcos I. Gradin | |
| Name: | Marcos I. Gradin | ||
| Title: | Chief Financial Officer | ||