
Form 6-K Fly Leasing Ltd For: May 07
UNITED STATES
SECURITIES AND EXCHANGE COMMISSION
Washington, D.C. 20549
FORM 6-K
Report of Foreign Private Issuer
Pursuant to Rule 13a-16 or 15d-16 of the Securities
Exchange Act of 1934
Date of Report: May 7, 2018
Commission File Number: 001-33701
Fly Leasing Limited
(Exact Name of registrant as specified in its charter)
West Pier Business Campus
Dun Laoghaire
County Dublin, A96 N6T7, Ireland
(Address of principal executive office)
Indicate by check mark whether registrant files or will file annual reports under cover of Form 20-F or Form 40-F:
|
Form 20-F
|
☒
|
Form 40-F
|
☐ |
Indicate by check mark if the registrant is submitting the Form 6-K in paper as permitted by Regulation S-T Rule 101(b)(1): ☐
Indicate by check mark if the registrant is submitting the Form 6-K in paper as permitted by Regulation S-T Rule 101(b)(7): ☐
A copy of Fly Leasing Limited’s investor presentation for the Wells Fargo Securities Industrials Conference held in New York on May 8, 2018, is furnished as an exhibit hereto and incorporated by reference herein.
Investors and others should note that Fly Leasing Limited (the “Company”) announces material information to investors through the investor relations page on its website (www.flyleasing.com/investor-relations), SEC filings, press releases, public conference calls and webcasts. The Company expects to update investor presentations and similar materials on a regular basis and will continue to post these materials to its investor relations page on its website. The Company encourages investors, the media and others to review the information it posts from time to time on its website.
|
Exhibit
|
Title
|
|
99.1
|
Investor presentation of Fly Leasing Limited dated May 2018.
|
2
SIGNATURES
Pursuant to the requirements of the Securities Exchange Act of 1934, the Registrant has duly caused this report to be signed on its behalf by the undersigned, thereunto duly authorized.
|
Fly Leasing Limited
|
||||
|
(Registrant)
|
||||
|
Date:
|
May 7, 2018
|
By:
|
/s/ Colm Barrington
|
|
| Colm Barrington | ||||
|
Chief Executive Officer and Director
|
||||
3
EXHIBIT INDEX
|
Exhibit
|
Title
|
|
|
|
|
Investor presentation of Fly Leasing Limited dated May 2018.
|
4
Exhibit 99.1

May 2018 FLY LEASING

DISCLAIMER Forward-Looking Statements:This presentation contains certain “forward-looking statements” within the meaning of the Private Securities Litigation Reform Act of 1995. Forward-looking statements may be identified by words such as “expects,” “intends,” “anticipates,” “plans,” “believes,” “seeks,” “estimates,” “will,” or words of similar meaning and include, but are not limited to, statements regarding the outlook for FLY’s future business, operations and financial performance, including the expected benefits of the AirAsia portfolio transactions (the “Transactions”); whether and when the Transactions will be consummated; the amount of cash and stock consideration to be paid by FLY; the type, amount and terms of the acquisition financing to be obtained by FLY; and, the amount of any fees and expenses incurred in connection with the Transactions. Forward-looking statements are based on management’s current expectations and assumptions, which are subject to inherent uncertainties, risks and changes in circumstances that are difficult to predict. Actual outcomes and results may differ materially due to global political, economic, business, competitive, market, regulatory and other factors and risks, including risks relating to the satisfaction of conditions to the closing of the Transactions; risks relating to satisfaction of conditions to the financing of the Transactions; risks relating to FLY’s ability to obtain additional required financing for the Transactions on favorable terms, or at all; the risk that expected benefits of the Transactions may not be fully realized or may take longer to realize than expected; the risk that business disruption resulting from the Transactions may be greater than expected; and the risk that FLY may be unable to achieve its portfolio growth expectations, or to reap the benefits of such growth. Further information on the factors and risks that may affect FLY’s business is included in filings FLY makes with the Securities and Exchange Commission (the “SEC”) from time to time, including its Annual Report on Form 20-F and its Reports on Form 6-K. FLY expressly disclaims any obligation to update or revise any of these forward-looking statements, whether because of future events, new information, a change in its views or expectations, or otherwise.Notes:All period end figures are as of March 31, 2018 except as otherwise noted. Any 2018 year-to-date data is as of April 27, 2018.Fleet age and lease term are calculated using the weighted net book value of flight equipment held for operating lease, including maintenance rights, investment in finance lease, and aircraft held for sale at period end.

FLY AT A GLANCE 86aircraft$3.1 billion net book valueYoung Fleet6.5 years average age Second youngest of public peers Long Leases6.2 years average lease termDiversified Lesseesleased to 45 airlines in 28 countries 55 Aircraft contractedwith options on 20 additional aircraft$2.1 billionIdentified pipeline3.2 yearsaverage age(1)9.2 years average remaining lease term(1) Conservative Financing6.2 years weighted average debt maturity, rates hedgedLower Debt and SG&A CostsRecent financings at competitive rates Managed by BBAMIndustry leader with nearly30 year track recordSignificant Insider Ownership17% owned by BBAM management team and Onex(2) For Initial Portfolio, estimated purchase price allocation and weighting as of January 1, 2018, excluding engines. For Future Sale-leasebacks, assumes all investments made as of January 1, 2018.Proforma for closing of AirAsia Transaction.

Positive airline industry results $38.4 billion Forecast 2018 profits Attractive markets for aircraft financing AMPLE CAPACITY AT ATTRACTIVE RATES Strong demand for aircraft UNDERPINNED BY PASSENGER GROWTH Passenger traffic growth is robust 6.0% forecast in 2018, on track YTD Strong Global Air Traffic Growth Continued Airline Profitability Healthy Demand for Aircraft Positive Financial Markets Favorable industry fundamentals Source: IATA, December 2017.

Strategy Driving Higher ROE and Eps Selling Older and Under-Performing Aircraft Reducing SG&A Reducing Financing Costs Reinvesting in Newer, More Profitable Aircraft Repurchasing Shares at a Discount to Book Value

Strong pipeline of new technology aircraft driving EPS and ROE growth AirAsia Portfolio acquisition Update Q2 / Q3 2018 Initial Portfolio34 A320ceo aircraft7 CFM engines leased to AirAsia Group airlines(1)Anticipated to close in Q2/Q3 2018 Future Sale-Leasebacks21 new A320neo family aircraft will be leased to AirAsia Group airlinesDelivering 2019 – 2021NEO Options20 new A320neo family aircraft Delivering as early as 2019No obligation to exercise options One aircraft from the Initial Portfolio is on lease to a third-party airline. 2019 and beyond AirAsia shareholder approval expected this month

Significant Value in OrderbookFavorable pricing of newest-generation narrowbodies with lengthy manufacturer backlogNo pre-delivery payment requirement enhances returns and liquidity Access to the Newest Technology33% of assets are newest generationtechnology(1) COMPELLING investment ReturnsStable long-term earnings projectionsPrudently capitalized, providing solid support and rapid deleveraging Strategic rationale for acquisition Immediate Scale and identified GrowthTransforms FLY’s fleet and growth prospects Placed to identified lessees at attractive lease rates Pro forma for FLY, Initial Portfolio and Future Sale-leasebacks on a combined basis assuming no sales. For FLY, NBV as of March 31, 2018. For Initial Portfolio, estimated purchase price allocation and weighting as of January 1, 2018, excluding engines. For Future Sale-leasebacks, assumes all investments made as of January 1, 2018.

Proforma fleet overview High-quality, young portfolio expected to be acquired in Q2 / Q3Sale-leaseback NEO portfolio will provide growth at attractive prices The options offer further growth and potential lessee diversification Catalyst for FLY’s transition to newest technology equipment 33% Next Generation PORTFOLIO HIGHLIGHTS GEOGRAPHICAL SPLIT(1) ASSET TYPE(1) Pro forma for FLY, Initial Portfolio and Future Sale-leasebacks on a combined basis assuming no sales. For FLY, NBV as of March 31, 2018. For Initial Portfolio, estimated purchase price allocation and weighting as of January 1, 2018, excluding engines. For Future Sale-leasebacks, assumes all investments made as of January 1, 2018.

Proforma fleet overview (continued) Proforma Portfolio Overview(1) (Assumes No Sales) FLY Initial Portfolio Future Sale-leasebacks Proforma Size (NBV, bn) $3.1 $1.0 $1.1 $5.2 Age (yrs) 6.5 6.6 0.0 5.2 Lease Term (yrs) 6.2 6.2 12.0 7.4 % Airbus 27% 100% 100% 56% % Narrowbody 65% 100% 100% 79% Countries 28 6 TBD 29 Customers 45 6 TBD 51 +66% +19% −20% Pro forma for FLY, Initial Portfolio and Future Sale-leasebacks on a combined basis assuming no sales. For FLY, NBV as of March 31, 2018. For Initial Portfolio, estimated purchase price allocation and weighting as of January 1, 2018, excluding engines. For Future Sale-leasebacks, assumes all investments made as of January 1, 2018.
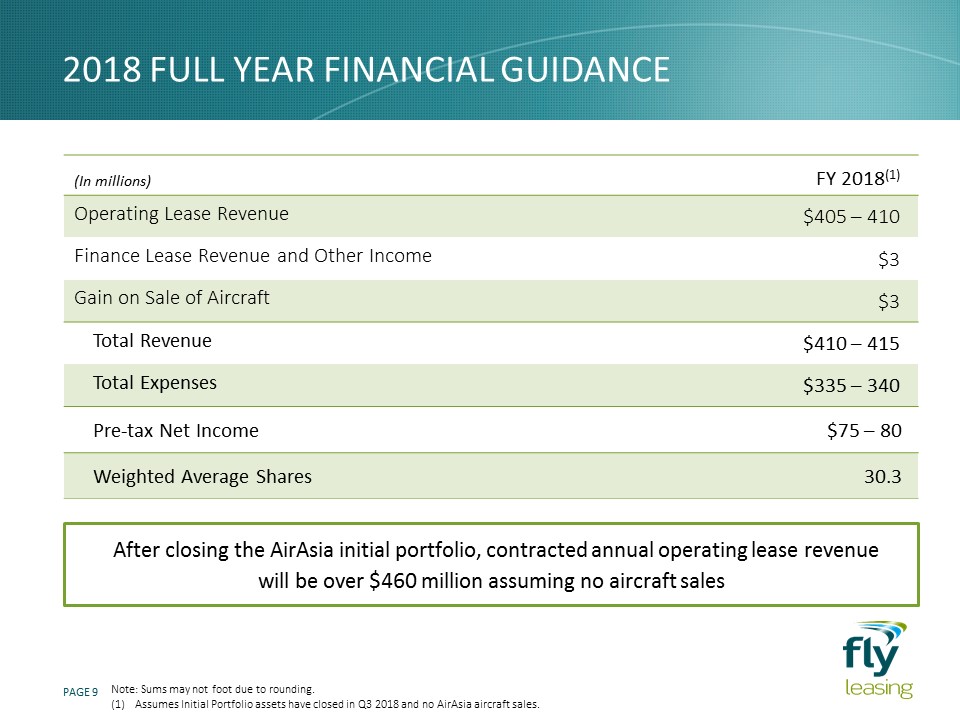
2018 full year financial guidance (In millions) FY 2018(1) Operating Lease Revenue $405 – 410 Finance Lease Revenue and Other Income $3 Gain on Sale of Aircraft $3 Total Revenue $410 – 415 Total Expenses $335 – 340 Pre-tax Net Income $75 – 80 Weighted Average Shares 30.3 Note: Sums may not foot due to rounding.Assumes Initial Portfolio assets have closed in Q3 2018 and no AirAsia aircraft sales. After closing the AirAsia initial portfolio, contracted annual operating lease revenue will be over $460 million assuming no aircraft sales

FLY’s Projected Debt / Equity Ratio Impact on Leverage Projected leverage and financing strategy Onex and BBAM’s management team will each acquire 666,667 newly-issued FLY shares for total consideration of $20 million and AAB will acquire 3,333,333 newly-issued FLY shares for a consideration of $50 million. Proforma at September 30, 2018 assuming all Initial Portfolio assets have been acquired. Initial Portfolio of 34 aircraft will be financed by:Cash and Equity$300 million of FLY’s cash$70 million of newly-issued shares at $15.00 per share(1)Secured Debt$580 million of committed financing at anticipated cost of L + 1.725% $90 million under FLY’s Aircraft Acquisition Facility at cost of L + 2.00% Initial Portfolio Financing Leverage temporarily increases to 4.9x post-acquisition – projected to reduce to 3.5x within three years due to:Significant contracted debt amortizationPlanned aircraft sales (2)

2Aircraft salesclosed in AprilSales reduce leverage, generate cash, and produce a 16% premium to net book value(1)Further sales anticipated for 2018 Aircraft acquisitions and sales 10.3 yearsAVERAGE AGE 1New aircraftacquired in Q1 Acquisitions SALES 12.0 yearLEASE TERM Premium includes gain on sale and retained end of lease income for disposed aircraft.

appendices

Capital structure & liquidity overview Represents the contractual interest rates and effect of derivative instruments and excludes the amortization of debt discounts and debt issuance costs.Represents the ratio of total debt, less unrestricted cash and cash equivalents, divided by shareholders’ equity.

DIVERSE GROUP OF GLOBAL LESSEES FLY Top 10 Lessees # Lessee % of Value 1 11% 2 10% 3 9% 4 4% 5 4% 6 4% 7 4% 8 3% 9 3% 10 3% Top 10 Lessees 55% Initial Portfolio # Lessee % of Value 1 AirAsia 43% 2 Thai AirAsia 22% 3 Indonesia AirAsia 14% 4 AirAsia India 12% 5 Philippines AirAsia 7% 6 Pakistan Int. Airlines 2% Lessees 100% Proforma Top 10 Lessees (1) # Lessee % of Value 1 AirAsia 10% 2 8% 3 8% 4 6% 5 Thai AirAsia 5% 6 Indonesia AirAsia 3% 7 3% 8 AirAsia India 3% 9 3% 10 3% Top 10 Lessees 54% AirAsia Group Exposure 24% AirAsia Group (currently five different airlines in five countries) exposure will decline with a disciplined disposition strategy. FLY is targeting ~$150 million of AirAsia Group sales annually Pro forma for FLY and Initial Portfolio on a combined basis assuming no sales. For FLY, NBV as of March 31, 2018. For Initial Portfolio, estimated purchase price allocation and weighting as of January 1, 2018, excluding engines.

AirAsia Group Overview Initial AirAsia Group Exposure AirAsia Group is the largest low-cost carrier in Asia and fourth largest airline in Asia in terms of passengers carried. The group is diversified across five countries and has access to independent capital—three of the entities are listed on local stock exchanges Years in operation: 16 yearsPopulation base: 29 millionListed on Bursa Malaysia Years in operation: 13 years Population base: 67 millionListed on the Stock Exchange of Thailand Years in operation: 13 yearsPopulation base: 247 millionListed on Indonesia Stock Exchange Years in operation: 3 years Population base: 1.2 billion Years in operation: 5 years Population base: 97 million (45% owned by AAB) (49% owned by AAB) (49% owned by AAB) (40% owned by AAB)

Asset allocation snapshot Initial Portfolio Future Sale-leasebacks Orderbook Option Opportunity FLY Asset Allocation Aircraft Types 34 A320-200 and 7 engines 21 A320neo/A321neo 20 A320neo/A321neo Base Purchase Price $1.1 billion $1.1 billion $1.1 billion Asset Age 6.7 years 0 years 0 years Average Rem’g Lease Term 6.1 years 12 years TBD Incline Asset Allocation Aircraft Types 35 A320-200 and 7 engines 21 A320/A321neo 20 A320neo/A321neo Base Purchase Price $1.1 billion $1.1 billion $1.1 billion Asset Age 6.6 years 0 years 0 years Average Rem’g Lease Term 6.0 years 12 years TBD NBB Asset Allocation Aircraft Types 5 A320-200 3 A320-200 and 10 A320neo/A321neo 10 A320neo/A321neo Base Purchase Price $0.2 billion $0.6 billion $0.5 billion Asset Age 3.6 years 0 years 0 years Average Rem’g Lease Term 8.4 years 12 years TBD Note: Incline will acquire three additional narrowbody aircraft from AAB which are not included in the above asset allocation.

2013 2014 2015 2016 2017 Aircraft Acquired 14 22 10 10 10 Average Age when Acquired (years) 2 3 2 3 2 Purchase Price (in millions) $642 $952 $615 $559 $456 Historic ACQUISITION track Record Historical Aircraft Acquisitions Ample liquidity as of March 31, 2018:$636 million in cash and unencumbered assets to invest in younger aircraft$268 million of remaining capacity in warehouse facilityCurrently raising a $580 million facility for acquisition of AirAsia initial portfolio

Historic Sales track record Historical Aircraft Sales 2013 2014 2015 2016 2017 Aircraft Sold 10 8 44 27 1 Average Age (years) 14 13 13 14 12 Total Gains (in millions) $5.4 $14.8 $29.0 $24.5 $3.9 2016 Sales: 27 aircraft, average age of 14 years Average remaining lease term of three years Principally older, less profitableGain of $24.5 million (4.5% premium to net book value)Additional $2.7 million gain on conversion to finance lease2017 Sale: One 12 year old A320-200 in Q4 2017Gain of $3.9 million (22% premium to net book value)