
Form 8-K Internap Corp For: May 03
UNITED STATES
SECURITIES AND EXCHANGE COMMISSION
WASHINGTON, D.C. 20549
FORM 8-K
CURRENT REPORT
PURSUANT TO SECTION 13 OR 15(d) OF THE
SECURITIES EXCHANGE ACT OF 1934
Date of Report (Date of earliest event reported):
May 3, 2018
Internap Corporation
(Exact Name of Registrant as Specified in Charter)
|
Delaware
(State or Other Jurisdiction
of Incorporation)
|
001-31989
(Commission File Number)
|
91-2145721
(IRS Employer
Identification Number
|
|
12120 Sunset Hills Road, Suite 330, Reston, Virginia
(Address of Principal Executive Offices)
|
20190
(Zip Code)
|
Registrant’s telephone number, including area code: (404) 302-9700
Not applicable
(Former Name or Former Address, if Changed Since Last Report)
Check the appropriate box below if the Form 8-K filing is intended to simultaneously satisfy the filing obligation of the registrant under any of the following provisions (see General Instruction A.2. below):
|
☐
|
Written communications pursuant to Rule 425 under the Securities Act (17 CFR 230.425)
|
|
☐
|
Soliciting material pursuant to Rule 14a-12 under the Securities Act (17 CFR 240.14a-12)
|
|
☐
|
Pre-commencement communications pursuant to Rule 14d-2(b) under the Securities Act (17 CFR 240.14d-2(b))
|
|
☐
|
Pre-commencement communications pursuant to Rule 13e-4(c) under the Securities Act (17 CFR 240.13e-2(c))
|
Indicate by check mark whether the registrant is an emerging growth company as defined in Rule 405 of the Securities Act of 1933 (§230.405 of this chapter) or Rule 12b-2 of the Securities Exchange Act of 1934 (§240.12b-2 of this chapter).
Emerging growth company ☐
If an emerging growth company, indicate by check mark if the registrant has elected not to use the extended transition period for complying with any new or revised financial accounting standards provided pursuant to Section 13(a) of the Exchange Act. ☐
|
Item 2.02
|
Results of Operations and Financial Condition.
|
|
On May 3, 2018, Internap Corporation (the “Company”) issued a press release announcing its financial results for the quarter ended March 31, 2018. A copy of the press release is attached hereto as Exhibit 99.1 and is incorporated herein by reference.
On May 3, 2018, the Company will host a conference call to discuss its results for the quarter ended March 31, 2018. A copy of the presentation to be used during the conference call is attached hereto as Exhibit 99.2.
Copies of the press release and the presentation were posted to the Company’s website on May 3, 2018.
The information contained herein and in the accompanying exhibits shall not be incorporated by reference into any filing of the Company, whether made before or after the date hereof, regardless of any general incorporation language in such filing, unless expressly incorporated by specific reference to this or such filing. The information in this report, including the exhibits hereto, shall be deemed to be “furnished” and therefore shall not be deemed to be “filed” for purposes of Section 18 of the Securities Exchange Act of 1934, as amended, or otherwise subject to the liabilities of that section or Sections 11 and 12(a)(2) of the Securities Act of 1933, as amended.
|
Item 7.01
|
Regulation FD Disclosure.
|
The information in Item 2.02 is incorporated by reference herein.
The information contained herein and in the accompanying exhibits shall not be incorporated by reference into any filing of the Company, whether made before or after the date hereof, regardless of any general incorporation language in such filing, unless expressly incorporated by specific reference to this or such filing. The information in this report, including the exhibits hereto, shall be deemed to be “furnished” and therefore shall not be deemed to be “filed” for purposes of Section 18 of the Securities Exchange Act of 1934, as amended, or otherwise subject to the liabilities of that section or Sections 11 and 12(a)(2) of the Securities Act of 1933, as amended.
|
Item 9.01
|
Financial Statements and Exhibits.
|
|
(d)
|
Exhibits
|
The following exhibits are furnished with this Current Report on Form 8-K:
|
Exhibit No.
|
Description
|
|
|
Press Release, dated May 3, 2018
|
||
|
Presentation, dated May 3, 2018
|
||
SIGNATURES
Pursuant to the requirements of the Securities Exchange Act of 1934, the registrant has duly caused this report to be signed on its behalf by the undersigned hereunto duly authorized.
|
INTERNAP CORPORATION
|
||
|
Date: May 3, 2018
|
By:
|
/s/ Robert Dennerlein
|
|
Robert Dennerlein
|
||
|
Chief Financial Officer
|
||
Exhibit 99.1

INAP Reports First Quarter 2018 Financial Results
| · |
Reported Revenue of $74.2 Million up 5.9% Sequentially and 2.9% Year-over-Year
|
| · |
Top-line grew from the combination of improved sales productivity and inclusion of SingleHop as of March 1, 2018
|
| · |
INAP Reorganizes into New Reporting Segments in 2018, INAP US and INAP International
|
| · |
INAP US, comprising 77% of Revenue, up 7.2% Sequentially and 2.9% YoY
|
| · |
INAP INTL, comprising 23% of Revenue, up 1.9% Sequentially and 2.7% YoY
|
| · |
GAAP Net Loss of $(14.1) Million, or GAAP Net Loss Margin of (18.9)% with Adjusted EBITDA of $25.7 Million up 5.3% Sequentially and 19.1% Year-over-Year; Adjusted EBITDA Margin of 34.6% Comparable QoQ and up 470 Basis Points YoY
|
| · |
Cash Flow from Operations was $3.5 Million, with Capital Expenditures of $6.4 Million
|
| · |
INAP Completed Repricing of Senior Secured Term Loan, Reducing Interest Rate Margin over LIBOR by 125 Basis Points to L+575, Saving over $5 Million in Run-Rate Interest Expense
|
| · |
Reaffirming 2018 Outlook for Revenue of $320-$330 Million, Adjusted EBITDA of $105-$115 Million, Capital Expenditures of $40-$45 Million
|
RESTON, VA - (May 3, 2018) Internap Corporation (NASDAQ: INAP), a leading provider of high-performance data center services, including colocation, cloud and network, today announced financial results for the first quarter of 2018.
“INAP continues to perform by improving operations and focusing on our core strengths in data center services,” stated Peter D. Aquino, President and CEO. “As we layer on value-added products, such as advanced managed services through our SingleHop acquisition, we expect our customers to benefit by the integrated solution sets we offer them in Tier 1 markets, where addressable market demand for our services allows us to capture additional share. Our new sales team now has momentum that we can build on and expand our product set across our entire platform, providing a path toward a combination of organic and acquisition growth.”
Revenue
First quarter 2018 results include SingleHop operations as of March 1, 2018, and are therefore not comparable to prior periods.
| · |
Revenue totaled $74.2 million in the first quarter of 2018, an increase of $4.2 million or 5.9% sequentially and 2.9% year over year. The sequential increase was primarily due to the SingleHop acquisition. Base line revenues remain generally flat sequentially, including the impact of announced planned closures.
|
In 2018, with the inclusion of SingleHop, INAP moved to a geographic organizational structure to better align global data center assets with management and increase sales efficiency. Beginning with first quarter 2018 reporting, INAP redefined its segment reporting into: INAP US, and INAP INTL.
| · |
INAP US revenue totaled $57.1 million in the first quarter of 2018, an increase of 7.2% sequentially and 2.9% year over year. The sequential increase was driven by SingleHop, a full quarter of INAP’s new Atlanta Data Center, and the stabilization of US revenue.
|
| · |
INAP INTL revenue totaled $17.1 million in the first quarter of 2018, an increase of 1.9% sequentially and 2.7% year over year. The sequential increase was contributed by SingleHop operations in Europe, while the year over year increase is due to both consolidation of INAP Japan, and SingleHop. Post consolidation at the end of 2017, INAP Japan contributes $2 million per quarter in revenue.
|
First Quarter 2018 Financial Summary
|
($ in thousands)
|
1Q 2018
|
4Q 2017
|
1Q 2017
|
QoQ
Growth
|
YoY
Growth
|
|||||||||||||||
|
Total Revenue
|
$
|
74,201
|
$
|
70,035
|
$
|
72,133
|
5.9
|
%
|
2.9
|
%
|
||||||||||
|
Operating Costs and Expenses
|
$
|
73,322
|
$
|
64,432
|
$
|
71,641
|
13.8
|
%
|
2.3
|
%
|
||||||||||
|
Depreciation and Amortization
|
$
|
21,077
|
$
|
17,397
|
$
|
17,745
|
21.2
|
%
|
18.8
|
%
|
||||||||||
|
Acquisition Costs
|
$
|
2,558
|
$
|
176
|
$
|
—
|
—
|
—
|
||||||||||||
|
All Other Operating Costs and Expenses
|
$
|
49,687
|
$
|
46,859
|
$
|
53,896
|
6.0
|
%
|
(7.8
|
)%
|
||||||||||
|
GAAP Net Loss Attributable to INAP Shareholders
|
$
|
(14,060
|
)
|
$
|
(6,934
|
)
|
$
|
(8,230
|
)
|
(102.8
|
)%
|
(70.8
|
)%
|
|||||||
|
GAAP Net Loss Margin
|
(18.9
|
)%
|
(9.9
|
)%
|
(11.4
|
)%
|
||||||||||||||
|
Minus Goodwill Impairment and Other Items
|
$
|
3,701
|
$
|
1,393
|
$
|
3,414
|
165.7
|
%
|
8.4
|
%
|
||||||||||
|
Normalized Net Loss2
|
$
|
(10,359
|
)
|
$
|
(5,541
|
)
|
$
|
(4,816
|
)
|
(87.0
|
)%
|
(115.1
|
)%
|
|||||||
|
Adjusted EBITDA1
|
$
|
25,665
|
$
|
24,363
|
$
|
21,554
|
5.3
|
%
|
19.1
|
%
|
||||||||||
|
Adjusted EBITDA Margin1
|
34.6
|
%
|
34.8
|
%
|
29.9
|
%
|
||||||||||||||
|
Capital Expenditures (CapEx)
|
$
|
6,359
|
$
|
12,616
|
$
|
5,989
|
(49.6
|
)%
|
6.2
|
%
|
||||||||||
|
Adjusted EBITDA less CapEx1
|
$
|
19,306
|
$
|
11,747
|
$
|
15,565
|
64.3
|
%
|
24.0
|
%
|
||||||||||
Net Loss, Normalized Net Loss, Adjusted EBITDA and Business Unit Contribution
| · |
GAAP net loss attributable to INAP shareholders was $(14.1) million, or $(0.70) per share in the first quarter of 2018, including $2.6 million of costs associated with acquisition costs, compared with $(6.9) million, or $(0.35) per share in the fourth quarter of 2017, including $0.2 million of costs associated with acquisition costs. GAAP net loss in first quarter 2017 was $(8.2) million.
|
| · |
Normalized net loss was $(10.4) million in the first quarter of 2018 compared with $(5.5) million in the fourth quarter of 2017 and $(4.8) million in the first quarter of 2017.
|
| · |
Adjusted EBITDA totaled $25.7 million in the first quarter of 2018, an increase of 5.3% compared with $24.4 million in the fourth quarter of 2017, and an increase of 19.1% compared with $21.6 million in the first quarter of 2017. Adjusted EBITDA margin was 34.6% in the first quarter of 2018, down 20 basis points compared to 34.8% in the fourth quarter, and up 470 basis points compared to 29.9% in first quarter 2017. The increases in Adjusted EBITDA were primarily driven by continued focus on cost savings in real estate and network facilities, INAP’s initiative to exit less profitable data center sites, and one month of SingleHop’s financial statements.
|
| · |
Business Unit Contribution3 - INAP US and INAP INTL business unit contribution for the first quarter 2018 is as follows:
|
INAP US, includes colocation, cloud, and network services. Cloud contains AgileCloud, Managed Hosting and Services.
| o |
INAP US business unit contribution totaled $26.5 million in the first quarter of 2018, a 15.4% increase compared to the fourth quarter of 2017 and a 32.7% increase from the first quarter of 2017. As a percent of revenue, INAP US business unit contribution margin was 46.5% in the first quarter of 2018 up 330 basis points sequentially and 1,040 basis points year-over-year. The year over year business unit contribution increase reflects continued focus on cost savings in real estate and network facilities, INAP’s initiative to exit less profitable data center sites, and one month of SingleHop’s financials.
|
INAP INTL, includes colocation, cloud, and network services. Cloud contains AgileCloud, Managed Hosting and Services, iWeb and Ubersmith.
| o |
INAP INTL business unit contribution totaled $6.0 million in the first quarter of 2018, a 5.2% decline compared with the fourth quarter of 2017 and a 21.9% decrease from the first quarter of 2017. The primary driver for the decline is due to the inclusion of INAP Japan in the fourth quarter 2017 which has a low contribution margin.
|
“We are off to a great start to the year, having worked through further operations improvement, the closing of SingleHop acquisition and repricing of our total debt,” says Robert M. Dennerlein, Chief Financial Officer. “The repricing of our debt at favorable rates creates over $5 million in annual interest savings. We also realigned our divisions along geographic reporting segments to correspond with our management reorganization to include SingleHop.”
Balance Sheet and Cash Flow Statement
| · |
Cash and cash equivalents totaled $16.2 million at March 31, 2018. Total debt was $667.2 million, net of discount and prepaid costs, at the end of the quarter, including $233.6 million in capital lease obligations. As previously reported, on April 9, 2018, INAP entered into a Fourth Amendment to Credit Agreement, which amended INAP’s Credit Agreement, dated as of April 6, 2017 to lower the interest rate margin applicable to outstanding term loans by 125 basis points.
|
| · |
Cash generated from operations for the three months ended March 31, 2018 was $3.5 million compared to $7.3 million in first quarter 2017, and $13.8 million in fourth quarter of 2017. Capital expenditures over the same periods were $6.4 million, compared to $6.0 million and $12.6 million, respectively. Adjusted EBITDA less CapEx1 was $19.3 million, compared to $15.6 million in first quarter 2017 and $11.7 million in the fourth quarter of 2017. Free cash flow4 over the same periods was $(2.8) million, compared to $1.3 million in the first quarter of 2017 and $1.2 million in the fourth quarter of 2017, respectively. Unlevered free cash flow4 was $10.2 million for the first quarter of 2017, compared to $8.6 million in first quarter 2017 and $13.0 million in fourth quarter 2017.
|
Business Outlook
INAP reiterated its outlook for 2018 which, as noted above, includes projected results of acquired SingleHop operations as of February 28, 2018. Additionally, INAP’s sales momentum is expected to contribute to organic growth, offset by select planned closures of certain data center facilities.
|
Full-Year 2018 Expected Range
|
|
|
Revenue
|
$320 million-$330 million
|
|
Adjusted EBITDA
|
$105 million-$115 million
|
|
Capital Expenditures
|
$40 million-$45 million
|
| 1 |
Adjusted EBITDA, Adjusted EBITDA margin and Adjusted EBITDA less CapEx are non-GAAP financial measures which we define in an attachment to this press release entitled “Non-GAAP (Adjusted) Financial Measures.” Reconciliations between GAAP information and non-GAAP information related to Adjusted EBITDA and Adjusted EBITDA margin are contained in the table entitled “Reconciliation of GAAP Net Loss to Adjusted EBITDA.” Adjusted EBITDA margin is Adjusted EBITDA as a percentage of revenue. A reconciliation between GAAP information and non-GAAP information related to Adjusted EBITDA less CapEx is contained in the table entitled “Reconciliation of GAAP Net Cash Flows provided by Operating Activities to Adjusted EBITDA less CapEx.”
|
| 2 |
Normalized net loss is a non-GAAP financial measure which we define in an attachment to this press release entitled “Non-GAAP (Adjusted) Financial Measures.” Reconciliations between GAAP information and non-GAAP information related to normalized net loss are contained in the table entitled “Reconciliation of Net Loss to Normalized Net Loss.”
|
| 3 |
Business unit contribution and business unit contribution margin are non-GAAP financial measures which we define in an attachment to this press release entitled “Non-GAAP (Adjusted) Financial Measures.” Reconciliations between GAAP and non-GAAP information related to business unit contribution and business unit contribution margin are contained in the table entitled “Business Unit Contribution and Business Unit Contribution Margin” in the attachment. Business unit contribution margin is business unit contribution as a percentage of revenue.
|
| 4 |
Free cash flow and unlevered free cash flow are non-GAAP financial measures which we define in the attachment to the press release entitled “Non-GAAP (Adjusted) Financial Measures.” Reconciliations between GAAP and non-GAAP information related to Free cash flow and unlevered free cash flow are contained in the table entitled “Free Cash Flow and Unlevered Free Cash Flow.”
|
Conference Call Information:
INAP’s first quarter 2018 conference call will be held today at 8:30 a.m. ET. Listeners may connect to a simultaneous webcast of the call, which will include accompanying presentation slides, on the Investor Relations section of INAP’s web site at http://ir.inap.com/events-and-presentations. The call can also be accessed by dialing 877-334-0775. International callers should dial 631-291-4567. An online archive of the webcast will be archived in the Investor Relations section of INAP’s website. An audio-only replay will be accessible from Thursday, May 3, 2018 at 11:30 a.m. ET through Tuesday, May 8, 2018 at 855-859-2056 using replay code 3674167. International callers can listen to the archived event at 404-537-3406 with the same code.
About INAP
Internap Corporation (NASDAQ: INAP) is a leading provider of high-performance data center services, including colocation, cloud and network. INAP partners with its customers, who range from the Fortune 500 to emerging start-ups, to create secure, scalable and reliable IT infrastructure solutions that meet the customer’s unique business requirements. INAP operates in 57 primarily Tier 3 data centers in 21 metropolitan markets and has 98 POPs around the world. INAP has over 1 million gross square feet under lease, with over 500,000 square feet of data center space. For more information, visit www.inap.com.
Forward-Looking Statements
This press release contains forward-looking statements. These forward-looking statements include statements related to sales, improved profitability, margin expansion, operations improvement, cost reductions, participation in strategic transactions, our expectations for 2018 revenue, Adjusted EBITDA, capital expenditures and Adjusted EBITDA less Capex. Our ability to achieve these forward-looking statements is based on certain assumptions, including our ability to execute on our business strategy, leveraging of multiple routes to market, expanded brand awareness for high-performance IT infrastructure services and customer churn levels. These assumptions may prove inaccurate in the future. Because such forward-looking statements are not guarantees of future performance or results and involve risks and uncertainties, there are important factors that could cause INAP’s actual results to differ materially from those expressed or implied in the forward-looking statements, due to a variety of important factors. Such important factors include, without limitation: our ability to execute on our business strategy to growth while reducing costs; our ability to maintain current customers and obtain new ones, whether in a cost-effective manner or at all; the robustness of the IT infrastructure services market; our ability to achieve or sustain profitability; our ability to expand margins and drive higher returns on investment; our ability to sell into new and existing data center space; the actual performance of our IT infrastructure services and improving operations; our ability to correctly forecast capital needs, demand planning and space utilization; our ability to respond successfully to technological change and the resulting competition; the geographic concentration of INAP’s data centers in certain markets and any adverse developments in local economic conditions or the demand for data center space in these markets; ability to identify any suitable strategic transactions; INAP’s ability to realize anticipated revenue, growth, synergies and cost savings from the acquisition of SingleHop; INAP’s ability to successfully integrate SingleHop’s sales, operations, technology, and products generally; the availability of services from Internet network service providers or network service providers providing network access loops and local loops on favorable terms, or at all; failure of third party suppliers to deliver their products and services on favorable terms, or at all; failures in our network operations centers, data centers, network access points or computer systems; our ability to provide or improve IT infrastructure services to our customers; our ability to protect our intellectual property; our substantial amount of indebtedness, our possibility to raise additional capital when needed, on attractive terms, or at all, our ability to service existing debt or maintain compliance with financial and other covenants contained in our credit agreement; our compliance with and changes in complex laws and regulations in the U.S. and internationally; our ability to attract and retain qualified management and other personnel; and volatility in the trading price of INAP common stock.
These risks and other important factors discussed under the caption “Risk Factors” in our most recent Annual Report on Form 10-K filed with the Securities and Exchange Commission (“SEC”), and our other reports filed with the SEC could cause actual results to differ materially from those indicated by the forward-looking statements made in this press release.
Given these risks and uncertainties, investors should not place undue reliance on forward-looking statements as a prediction of actual results. All forward-looking statements attributable to INAP or persons acting on its behalf are expressly qualified in their entirety by the foregoing forward-looking statements. All such statements speak only as of the date made, and INAP undertakes no obligation to update or revise publicly any forward-looking statements, whether as a result of new information, future events or otherwise.
###
|
Investor Contacts:
|
|
|
Richard Ramlall
|
Carolyn Capaccio/Jody Burfening
|
|
VP, IR & PR INAP
|
LHA
|
|
404-302-9982
|
212-838-3777
|
INTERNAP CORPORATION AND SUBSIDIARIES
UNAUDITED CONDENSED CONSOLIDATED STATEMENTS OF OPERATIONS
AND COMPREHENSIVE LOSS
|
(In thousands, except per share amounts)
|
Three Months Ended
March 31,
|
|||||||
|
2018
|
2017
|
|||||||
|
Revenues:
|
||||||||
|
INAP US
|
$
|
57,076
|
$
|
55,461
|
||||
|
INAP INTL
|
17,125
|
16,672
|
||||||
|
Total revenues
|
74,201
|
72,133
|
||||||
|
Operating costs and expenses:
|
||||||||
|
Costs of sales and services, exclusive of depreciation and amortization, shown below:
|
||||||||
|
INAP US
|
18,435
|
23,547
|
||||||
|
INAP INTL
|
6,602
|
5,498
|
||||||
|
Costs of customer support
|
7,387
|
7,264
|
||||||
|
Sales, general and administrative
|
19,854
|
16,564
|
||||||
|
Depreciation and amortization
|
21,077
|
17,745
|
||||||
|
Exit activities, restructuring and impairments
|
(33
|
)
|
1,023
|
|||||
|
Total operating costs and expenses
|
73,322
|
71,641
|
||||||
|
Income from operations
|
879
|
492
|
||||||
|
Non-operating expenses:
|
||||||||
|
Interest expense
|
15,027
|
8,137
|
||||||
|
(Gain) loss on foreign currency, net
|
(215
|
)
|
97
|
|||||
|
Total non-operating expenses
|
14,812
|
8,234
|
||||||
|
Loss before income taxes, non-controlling interest and equity in earnings of equity-method investment
|
(13,933
|
)
|
(7,742
|
)
|
||||
|
Provision for income taxes
|
100
|
518
|
||||||
|
Equity in earnings of equity-method investment, net of taxes
|
—
|
(30
|
)
|
|||||
|
Net loss
|
(14,033
|
)
|
(8,230
|
)
|
||||
|
Less net income attributable to non-controlling interest
|
27
|
—
|
||||||
|
Net loss attributable to INAP stockholders
|
(14,060
|
)
|
(8,230
|
)
|
||||
|
Other comprehensive income:
|
||||||||
|
Foreign currency translation adjustment
|
61
|
73
|
||||||
|
Unrealized gain on foreign currency contracts
|
—
|
85
|
||||||
|
Total other comprehensive income
|
61
|
158
|
||||||
|
Comprehensive loss
|
$
|
(13,999
|
)
|
$
|
(8,072
|
)
|
||
|
Basic and diluted net loss per share
|
$
|
(0.70
|
)
|
$
|
(0.50
|
)
|
||
|
Weighted average shares outstanding used in computing basic and diluted net loss per share
|
20,052
|
16,087
|
||||||
INTERNAP CORPORATION AND SUBSIDIARIES
UNAUDITED CONDENSED CONSOLIDATED BALANCE SHEETS
(In thousands, except par value amounts)
|
March 31, 2018
|
December 31, 2017
|
|||||||
|
ASSETS
|
||||||||
|
Current assets:
|
||||||||
|
Cash and cash equivalents
|
$
|
16,159
|
$
|
14,603
|
||||
|
Accounts receivable, net of allowance for doubtful accounts of $1,700, and $1,487, respectively
|
17,524
|
17,794
|
||||||
|
Contract Assets
|
7,131
|
|||||||
|
Prepaid expenses and other assets
|
8,690
|
8,673
|
||||||
|
Total current assets
|
49,504
|
41,070
|
||||||
|
Property and equipment, net
|
461,314
|
458,565
|
||||||
|
Intangible assets, net
|
79,185
|
25,666
|
||||||
|
Goodwill
|
118,077
|
50,209
|
||||||
|
Non-current contract assets
|
12,056
|
|||||||
|
Deposits and other assets
|
$
|
11,784
|
$
|
11,015
|
||||
|
Total assets
|
$
|
731,920
|
$
|
586,525
|
||||
|
LIABILITIES AND STOCKHOLDERS’ DEFICIT
|
||||||||
|
Current liabilities:
|
||||||||
|
Accounts payable
|
21,699
|
20,388
|
||||||
|
Accrued liabilities
|
14,279
|
15,908
|
||||||
|
Deferred revenues
|
5,871
|
4,861
|
||||||
|
Capital lease obligations
|
10,095
|
11,711
|
||||||
|
Revolving credit facility
|
16,000
|
5,000
|
||||||
|
Term loan, less discount and prepaid costs of $3,539 and $2,133, respectively
|
818
|
867
|
||||||
|
Exit activities and restructuring liability
|
3,391
|
4,152
|
||||||
|
Other current liabilities
|
4,197
|
1,707
|
||||||
|
Total current liabilities
|
76,350
|
64,594
|
||||||
|
Capital lease obligations
|
223,549
|
223,749
|
||||||
|
Term loan, less discount and prepaid costs of $11,286 and $7,655, respectively
|
416,766
|
287,845
|
||||||
|
Exit activities and restructuring liability
|
408
|
664
|
||||||
|
Deferred rent
|
1,138
|
1,310
|
||||||
|
Deferred tax liability
|
1,841
|
1,651
|
||||||
|
Other long-term liabilities
|
3,046
|
7,744
|
||||||
|
Total liabilities
|
723,098
|
587,557
|
||||||
|
Stockholders’ deficit:
|
||||||||
|
Preferred stock, $0.001 par value; 5,000 shares authorized; no shares issued or outstanding
|
—
|
—
|
||||||
|
Common stock, $0.001 par value; 30,000 shares authorized; 21,131 and 20,804 shares outstanding, respectively
|
21
|
21
|
||||||
|
Additional paid-in capital
|
1,327,985
|
1,327,084
|
||||||
|
Treasury stock, at cost, 313 and 293 shares, respectively
|
(7,429
|
)
|
(7,159
|
)
|
||||
|
Accumulated deficit
|
(1,313,598
|
)
|
(1,323,723
|
)
|
||||
|
Accumulated items of other comprehensive loss
|
(1,263
|
)
|
(1,324
|
)
|
||||
|
Total INAP stockholders’ deficit
|
5,716
|
(5,101
|
)
|
|||||
|
Non-controlling interests
|
3,106
|
4,069
|
||||||
|
Total stockholders’ deficit
|
$
|
8,822
|
$
|
(1,032
|
)
|
|||
|
Total liabilities and stockholders’ deficit
|
$
|
731,920
|
$
|
586,525
|
||||
INTERNAP CORPORATION AND SUBSIDIARIES
UNAUDITED CONDENSED CONSOLIDATED STATEMENTS OF CASH FLOWS
(In thousands)
|
Three Months Ended
March 31,
|
||||||||
|
2018
|
2017
|
|||||||
|
Cash Flows from Operating Activities:
|
||||||||
|
Net loss
|
$
|
(14,033
|
)
|
$
|
(8,230
|
)
|
||
|
Adjustments to reconcile net loss to net cash provided by operating activities:
|
||||||||
|
Depreciation and amortization
|
21,077
|
17,745
|
||||||
|
Loss on disposal of fixed asset
|
46
|
—
|
||||||
|
Amortization of debt discount and issuance costs
|
638
|
715
|
||||||
|
Stock-based compensation expense, net of capitalized amount
|
858
|
598
|
||||||
|
Equity in earnings of equity-method investment
|
2
|
(30
|
)
|
|||||
|
Provision for doubtful accounts
|
332
|
301
|
||||||
|
Non-cash change in capital lease obligations
|
(213
|
)
|
71
|
|||||
|
Non-cash change in exit activities and restructuring liability
|
372
|
980
|
||||||
|
Non-cash change in deferred rent
|
(252
|
)
|
(423
|
)
|
||||
|
Deferred taxes
|
(30
|
)
|
254
|
|||||
|
Payment of debt lender fees
|
(300
|
)
|
(2,583
|
)
|
||||
|
Other, net
|
—
|
(96
|
)
|
|||||
|
Changes in operating assets and liabilities:
|
||||||||
|
Accounts receivable
|
864
|
2,096
|
||||||
|
Prepaid expenses, deposits and other assets
|
(467
|
)
|
123
|
|||||
|
Accounts payable
|
(636
|
)
|
(2,247
|
)
|
||||
|
Accrued and other liabilities
|
(2,904
|
)
|
(180
|
)
|
||||
|
Deferred revenues
|
(138
|
)
|
(510
|
)
|
||||
|
Exit activities and restructuring liability
|
(1,389
|
)
|
(1,386
|
)
|
||||
|
Asset retirement obligation
|
(248
|
)
|
52
|
|||||
|
Other liabilities
|
(52
|
)
|
14
|
|||||
|
Net cash flows provided by operating activities
|
3,527
|
7,264
|
||||||
|
Cash Flows from Investing Activities:
|
||||||||
|
Purchases of property and equipment
|
(6,082
|
)
|
(5,789
|
)
|
||||
|
Proceeds from disposal of property and equipment
|
437
|
—
|
||||||
|
Business acquisition, net of cash acquired
|
(132,143
|
)
|
—
|
|||||
|
Acquisition of minority shares
|
(1,130
|
)
|
—
|
|||||
|
Additions to acquired and developed technology
|
(277
|
)
|
(200
|
)
|
||||
|
Net cash flows used in investing activities
|
(139,195
|
)
|
(5,989
|
)
|
||||
|
Cash Flows from Financing Activities:
|
||||||||
|
Proceeds from credit agreements
|
146,000
|
—
|
||||||
|
Proceeds from stock issuance
|
—
|
40,282
|
||||||
|
Principal payments on credit agreements
|
(1,089
|
)
|
(39,997
|
)
|
||||
|
Debt issuance costs
|
(5,676
|
)
|
—
|
|||||
|
Payments on capital lease obligations
|
(2,027
|
)
|
(2,491
|
)
|
||||
|
Proceeds from exercise of stock options
|
31
|
7
|
||||||
|
Acquisition of common stock for income tax withholdings
|
(270
|
)
|
(149
|
)
|
||||
|
Other, net
|
235
|
(157
|
)
|
|||||
|
Net cash flows provided by(used in) in financing activities
|
137,204
|
(2,505
|
)
|
|||||
|
Effect of exchange rates on cash and cash equivalents
|
20
|
15
|
||||||
|
Net increase (decrease) in cash and cash equivalents
|
1,556
|
(1,215
|
)
|
|||||
|
Cash and cash equivalents at beginning of period
|
14,603
|
10,389
|
||||||
|
Cash and cash equivalents at end of period
|
$
|
16,159
|
$
|
9,174
|
||||
|
Supplemental disclosure of cash flow information:
|
||||||||
|
Cash paid for interest
|
$
|
13,000
|
$
|
7,336
|
||||
|
Non-cash acquisition of property and equipment under capital leases
|
—
|
290
|
||||||
|
Additions to property and equipment included in accounts payable
|
2,287
|
1,247
|
||||||
INTERNAP CORPORATION
NON-GAAP FINANCIAL MEASURES
In addition to providing financial measurements based on accounting principles generally accepted in the United States of America (“GAAP”), this earnings press release includes additional financial measures that are not prepared in accordance with GAAP (“non-GAAP”), including Adjusted EBITDA, Adjusted EBITDA margin, Adjusted EBITDA less CapEx, normalized net loss, business unit contribution, business unit contribution margin, free cash flow and unlevered free cash flow. A reconciliation of non-GAAP financial measures to the most directly comparable GAAP financial measures can be found below.
We define the following non-GAAP measures as follows:
|
●
|
Adjusted EBITDA is a non-GAAP measure and is GAAP net loss attributable to INAP shareholders plus depreciation and amortization, interest expense, provision (benefit) for income taxes, other expense (income), (gain) loss on disposal of property and equipment, exit activities, restructuring and impairments, stock-based compensation, non-income tax contingency, strategic alternatives and related costs, organizational realignment costs, pre-acquisition costs and claim settlement.
|
|
|
●
|
Adjusted EBITDA margin is Adjusted EBITDA as a percentage of revenues.
|
|
|
●
|
Adjusted EBITDA less CapEx is Adjusted EBITDA less capital expenditures with Adjusted EBITDA for this non-GAAP measure defined as net cash flow provided by operating activities plus cash paid for interest, cash paid for taxes, cash paid for exit activities and restructuring, cash paid for strategic alternatives and related costs, cash paid for organizational realignment costs, payment of debt lender fees and other working capital changes less capital expenditures.
|
|
|
●
|
Normalized net loss is net loss attributable to INAP shareholders plus exit activities, restructuring and impairments, stock-based compensation, non-income tax contingency, strategic alternatives and related costs, organizational realignment costs, pre-acquisition costs, claim settlement and debt extinguishment and modification expenses.
|
|
|
●
|
Business unit contribution is business unit revenues less direct costs of sales and services, customer support, and sales and marketing, exclusive of depreciation and amortization.
|
|
|
●
|
Business unit contribution margin is business unit contribution as a percentage of business unit revenue.
|
|
|
●
|
Free cash flow is net cash flows provided by operating activities minus capital expenditures.
|
|
|
●
|
Unlevered free cash flow is free cash flow plus cash interest expense.
|
We believe that presentation of these non-GAAP financial measures provides useful information to investors regarding our results of operations.
We believe that excluding depreciation and amortization and loss (gain) on disposals of property and equipment, as well as impairments and restructuring, to calculate Adjusted EBITDA provides supplemental information and an alternative presentation that is useful to investors’ understanding of our current ongoing operating results and trends. Not only are depreciation and amortization expenses based on historical costs of assets that may have little bearing on present or future replacement costs, but also they are based on management estimates of remaining useful lives. Loss on disposals of property and equipment is also based on historical costs of assets that may have little bearing on replacement costs. Impairments and restructuring expenses primarily reflect goodwill impairments and subsequent plan adjustments in sublease income assumptions for certain properties included in our previously disclosed restructuring plans.
We believe that excluding interest expense, provision (benefit) for income taxes and other expense (income) from non-GAAP financial measures provides supplemental information and an alternative presentation useful to investors’ understanding of our core operating results and trends. Investors have indicated that they consider financial measures of our results of operations excluding interest expense, provision (benefit) for income taxes and other expense (income) as important supplemental information useful to their understanding of our historical results and estimating our future results.
INTERNAP CORPORATION
NON-GAAP FINANCIAL MEASURES (Continued)
We also believe that, in excluding the effects of interest expense, provision (benefit) for income taxes and other expense (income), our non-GAAP financial measures provide investors with transparency into what management uses to measure and forecast our results of operations, to compare on a consistent basis our results of operations for the current period to that of prior periods and to compare our results of operations on a more consistent basis against that of other companies, in making financial and operating decisions and to establish certain management compensation.
We believe that exit activities, restructuring and impairment charges, non-income tax contingency, strategic alternatives and related costs, organizational realignment costs, pre-acquisition costs, claim settlement costs and debt extinguishment and modification expense are unique costs, and consequently, we do not consider these charges as a normal component of expenses related to current and ongoing operations.
Similarly, we believe that excluding the effects of stock-based compensation from non-GAAP financial measures provides supplemental information and an alternative presentation useful to investors’ understanding of our current ongoing operating results and trends. Management believes that investors consider financial measures of our results of operations excluding stock-based compensation as important supplemental information useful to their understanding of our historical results and estimating our future results.
We also believe that, in excluding the effects of stock-based compensation, our non-GAAP financial measures provide investors with transparency into what management uses to measure and forecast our results of operations, to compare on a consistent basis our results of operations for the current period to that of prior periods and to compare our results of operations on a more consistent basis against that of other companies, in making financial and operating decisions and to establish certain management compensation.
Stock-based compensation is an important part of total compensation, especially from the perspective of employees. We believe, however, that supplementing GAAP net loss by providing normalized net loss, excluding the effect of exit activities, restructuring and impairments, stock-based compensation, non-income tax contingency, strategic alternatives and related costs, organizational realignment cost, pre-acquisition costs, claim settlement costs, and debt extinguishment and modification expenses in all periods, is useful to investors because it enables additional and more meaningful period-to-period comparisons.
Adjusted EBITDA is not a measure of financial performance calculated in accordance with GAAP, and should be viewed as a supplement to — not a substitute for — our results of operations presented on the basis of GAAP. Adjusted EBITDA does not purport to represent cash flow provided by operating activities as defined by GAAP. Our statements of cash flows present our cash flow activity in accordance with GAAP. Furthermore, Adjusted EBITDA is not necessarily comparable to similarly-titled measures reported by other companies.
We believe Adjusted EBITDA is used by and is useful to investors and other users of our financial statements in evaluating our operating performance because it provides them with an additional tool to compare business performance across companies and across periods. We believe that:
|
●
|
EBITDA is widely used by investors to measure a company’s operating performance without regard to items such as interest expense, income taxes, depreciation and amortization, which can vary substantially from company-to-company depending upon accounting methods and book value of assets, capital structure and the method by which assets were acquired; and
|
|
|
●
|
investors commonly adjust EBITDA information to eliminate the effect of disposals of property and equipment, impairments, restructuring and stock-based compensation which vary widely from company-to-company and impair comparability.
|
|
|
Our management uses Adjusted EBITDA:
|
||
|
●
|
as a measure of operating performance to assist in comparing performance from period-to-period on a consistent basis;
|
|
|
●
|
as a measure for planning and forecasting overall expectations and for evaluating actual results against such expectations; and
|
|
|
●
|
in communications with the board of directors, analysts and investors concerning our financial performance.
|
|
Our presentation of business unit contribution and business unit contribution margin excludes depreciation and amortization in order to allow investors to see the business through the eyes of management.
We also have excluded depreciation and amortization from business unit contribution and business unit contribution margin because, as noted above, they are based on estimated useful lives of tangible and intangible assets. Further, depreciation and amortization are based on historical costs incurred to build out our deployed network and the historical costs of these assets may not be indicative of current or future capital expenditures.
Free cash flow and unlevered free cash flow are used in addition to and in conjunction with results presented in accordance with GAAP. Free cash flow and unlevered free cash flow should not be relied upon to the exclusion of GAAP financial measures. Free cash flow and unlevered free cash flow reflect an additional way of viewing our liquidity that, when viewed with our GAAP results, provides a more complete understanding of factors and trends affecting our cash flows. Management strongly encourages investors to review our financial statements and publicly-filed reports in their entirety and to not rely on any single financial measure.
We use free cash flow and unlevered free cash flow, and ratios based on it, to conduct and evaluate our business because, although it is similar to cash flow from operations, we believe it is a useful measure of cash flows since capital expenditures are a necessary component of ongoing operations. In limited circumstances in which proceeds from sales of fixed assets exceed capital expenditures, free cash flow would exceed cash flow from operations. However, since we do not anticipate being a net seller of fixed assets, we expect free cash flow to be less than operating cash flows.
Free cash flow and unlevered free cash flow have limitations due to the fact that they do not represent the residual cash flow available for discretionary expenditures. For example, free cash flow does not incorporate payments made to service our debt or capital lease obligations. Therefore, we believe it is important to view free cash flow as a complement to our entire consolidated statements of cash flows.
Adjusted EBITDA less CapEx is used in addition to and in conjunction with results presented in accordance with GAAP. Adjusted EBITDA less CapEx should not be relied upon to the exclusion of GAAP financial measures. Adjusted EBITDA less CapEx reflects an additional way of viewing our liquidity that, when viewed with our GAAP results, provides a more complete understanding of factors and trends affecting our cash flows. Management strongly encourages investors to review our financial statements and publicly-filed reports in their entirety and to not rely on any single financial measure.
We use Adjusted EBITDA less CapEx, and ratios based on it, to conduct and evaluate our business because, although it is similar to cash flow from operations, we believe it is a useful measure of cash flows since capital expenditures are a necessary component of ongoing operations.
Adjusted EBITDA less CapEx has limitations due to the fact that it does not represent the residual cash flow available for discretionary expenditures. Adjusted EBITDA less CapEx does not incorporate payments made to service our debt or capital lease obligations. Therefore, we believe it is important to view Adjusted EBITDA less CapEx as a complement to our entire consolidated statements of cash flows.
Adjusted EBITDA, as presented, may not be comparable to similarly titled measures of other companies. Adjusted EBITDA is presented as we understand certain investors use it as one measure of our historical ability to service debt. Also adjusted EBITDA is used in our debt covenants.
Although we believe, for the foregoing reasons, that our presentation of non-GAAP financial measures provides useful supplemental information to investors regarding our results of operations, our non-GAAP financial measures should only be considered in addition to, and not as a substitute for, or superior to, any measure of financial performance prepared in accordance with GAAP.
INTERNAP CORPORATION
NON-GAAP (ADJUSTED) FINANCIAL MEASURES (Continued)
RECONCILIATION OF GAAP NET LOSS TO ADJUSTED EBITDA AND FORWARD LOOKING ADJUSTED EBITDA
A reconciliation of GAAP net loss attributable to INAP Shareholders to Adjusted EBITDA for each of the periods indicated is as follows (in thousands, unaudited):
|
Three Months Ended
|
||||||||||||||||||||||||
|
March 31, 2018
|
December 31, 2017
|
March 31, 2017
|
||||||||||||||||||||||
|
Reconciliation of GAAP Net Loss Attributable to INAP Shareholders to Adjusted EBITDA:
|
Amount
|
Percent
|
Amount
|
Percent
|
Amount
|
Percent
|
||||||||||||||||||
|
Total Revenue
|
$
|
74,201
|
100.0
|
%
|
$
|
70,035
|
100.0
|
%
|
$
|
72,133
|
100.0
|
%
|
||||||||||||
|
Net Loss (GAAP) attributable to INAP Shareholders
|
(14,060
|
)
|
(18.9
|
)%
|
(6,934
|
)
|
(9.9
|
)%
|
(8,230
|
)
|
(11.4
|
)%
|
||||||||||||
|
Add:
|
||||||||||||||||||||||||
|
Non-GAAP revenue
|
40
|
0.1
|
%
|
—
|
0.0
|
%
|
—
|
0.0
|
%
|
|||||||||||||||
|
Depreciation and amortization
|
21,077
|
28.4
|
%
|
17,397
|
24.8
|
%
|
17,745
|
24.6
|
%
|
|||||||||||||||
|
Interest expense
|
15,027
|
20.3
|
%
|
12,895
|
18.4
|
%
|
8,137
|
11.3
|
%
|
|||||||||||||||
|
Provision (benefit) for income taxes
|
100
|
0.1
|
%
|
(436
|
)
|
(0.6
|
)%
|
518
|
0.7
|
%
|
||||||||||||||
|
Other (income) expense
|
(215
|
)
|
(0.3
|
)%
|
40
|
0.1
|
%
|
67
|
0.1
|
%
|
||||||||||||||
|
Loss (gain) on disposal of property and equipment, net
|
46
|
0.1
|
%
|
8
|
0.0
|
%
|
(97
|
)
|
(0.1
|
)%
|
||||||||||||||
|
Exit activities, restructuring and impairments
|
(33
|
)
|
0.0
|
%
|
(148
|
)
|
(0.2
|
)%
|
1,023
|
1.4
|
%
|
|||||||||||||
|
Stock-based compensation
|
858
|
1.2
|
%
|
979
|
1.4
|
%
|
598
|
0.8
|
%
|
|||||||||||||||
|
Non-income tax contingency
|
—
|
0.0
|
%
|
—
|
0.0
|
%
|
1,500
|
2.1
|
%
|
|||||||||||||||
|
Strategic alternatives and related costs
|
27
|
0.0
|
%
|
38
|
0.1
|
%
|
6
|
0.0
|
%
|
|||||||||||||||
|
Organizational realignment costs
|
240
|
0.3
|
%
|
346
|
0.5
|
%
|
287
|
0.4
|
%
|
|||||||||||||||
|
Acquisition costs
|
2,558
|
3.4
|
%
|
176
|
0.3
|
%
|
—
|
0.0
|
%
|
|||||||||||||||
|
Adjusted EBITDA (non-GAAP)
|
$
|
25,665
|
34.6
|
%
|
$
|
24,363
|
34.8
|
%
|
$
|
21,554
|
29.9
|
%
|
||||||||||||
A reconciliation of forward-looking Adjusted EBITDA for full-year 2018 is as follows (in millions, unaudited):
|
2018 Full-Year Guidance
|
||||||||||||||||
|
Low
|
High
|
|||||||||||||||
|
Amount
|
Percent
|
Amount
|
Percent
|
|||||||||||||
|
Total Revenue
|
$
|
320
|
100.0
|
%
|
$
|
330
|
100.0
|
%
|
||||||||
|
Net Loss (GAAP)
|
$
|
(48
|
)
|
(15.0
|
)%
|
$
|
(38
|
)
|
(11.5
|
)%
|
||||||
|
Add:
|
||||||||||||||||
|
Depreciation and amortization
|
70
|
21.9
|
%
|
70
|
21.2
|
%
|
||||||||||
|
Interest expense
|
59
|
18.4
|
%
|
59
|
17.9
|
%
|
||||||||||
|
Provision for income taxes
|
1
|
0.3
|
%
|
1
|
0.3
|
%
|
||||||||||
|
Exit activities, restructuring and impairments
|
11
|
3.4
|
%
|
11
|
3.3
|
%
|
||||||||||
|
Stock-based compensation
|
12
|
3.8
|
%
|
12
|
3.6
|
%
|
||||||||||
|
Non-income tax contingency
|
1
|
0.3
|
%
|
1
|
0.3
|
%
|
||||||||||
|
Adjusted EBITDA (non-GAAP)
|
$
|
105
|
32.8
|
%
|
$
|
115
|
34.8
|
%
|
||||||||
INTERNAP CORPORATION
NON-GAAP (ADJUSTED) FINANCIAL MEASURES (Continued)
RECONCILIATION OF GAAP NET CASH FLOWS PROVIDED BY OPERATING ACTIVITIES TO
ADJUSTED EBITDA LESS CAPEX
A reconciliation of GAAP Net Cash Flows Provided by Operating Activities to Adjusted EBITDA less CapEx for each of the periods indicated is as follows (in thousands, unaudited):
|
Three Months Ended
|
||||||||||||
|
Reconciliation of GAAP Net Cash Flows provided by Operating Activities to Adjusted EBITDA less CapEx:
|
March 31, 2018
|
December 31, 2017
|
March 31, 2017
|
|||||||||
|
Net Cash Flow provided by operating activities:
|
$
|
3,527
|
$
|
13,808
|
$
|
7,264
|
||||||
|
Add :
|
||||||||||||
|
Cash paid for interest
|
13,000
|
11,793
|
7,336
|
|||||||||
|
Cash paid for income taxes
|
108
|
176
|
—
|
|||||||||
|
Cash paid for exit activities and restructuring
|
1,389
|
1,450
|
1,086
|
|||||||||
|
Cash paid for strategic alternatives and related costs
|
27
|
373
|
189
|
|||||||||
|
Cash paid for organizational realignment costs
|
240
|
282
|
267
|
|||||||||
|
Cash paid for acquisition costs
|
2,558
|
176
|
—
|
|||||||||
|
Other working capital changes
|
4,816
|
(3,695
|
)
|
5,412
|
||||||||
|
Adjusted EBITDA (non-GAAP)
|
$
|
25,665
|
$
|
24,363
|
$
|
21,554
|
||||||
|
Less:
|
||||||||||||
|
Capital Expenditures (CapEx)
|
$
|
6,359
|
$
|
12,616
|
$
|
5,989
|
||||||
|
Adjusted EBITDA less CapEx
|
$
|
19,306
|
$
|
11,747
|
$
|
15,565
|
||||||
INTERNAP CORPORATION
NON-GAAP (ADJUSTED) FINANCIAL MEASURES (Continued)
RECONCILIATION OF NET LOSS ATTRIBUTABLE TO INAP SHAREHOLDERS TO NORMALIZED NET LOSS TO INAP SHAREHOLDERS
Reconciliations of net loss attributable to INAP Shareholders, the most directly comparable GAAP measure, to normalized net loss attributable to INAP Shareholders (in thousands, unaudited):
|
Three Months Ended
|
||||||||||||
|
March 31, 2018
|
December 31, 2017
|
March 31, 2017
|
||||||||||
|
Net loss (GAAP) attributable to INAP Shareholders
|
(14,060
|
)
|
(6,934
|
)
|
(8,230
|
)
|
||||||
|
Non GAAP revenue
|
40
|
—
|
—
|
|||||||||
|
Exit activities, restructuring and impairments
|
(33
|
)
|
(148
|
)
|
1,023
|
|||||||
|
Stock-based compensation
|
858
|
979
|
598
|
|||||||||
|
Strategic alternatives, realignment, and related costs
|
267
|
385
|
293
|
|||||||||
|
Acquisition costs
|
2,558
|
176
|
—
|
|||||||||
|
Non-Income Tax Contingency
|
—
|
—
|
1,500
|
|||||||||
|
Normalized net loss (non-GAAP)
|
(10,370
|
)
|
(5,541
|
)
|
(4,816
|
)
|
||||||
INTERNAP CORPORATION
NON-GAAP (ADJUSTED) FINANCIAL MEASURES (Continued)
BUSINESS UNIT CONTRIBUTION AND BUSINESS UNIT CONTRIBUTION MARGIN
Business unit contribution and business unit contribution margin, which includes direct costs of sales and service, customer support and sales and marketing for each of the periods indicated is as follows (in thousands, unaudited):
|
Three Months Ended
|
||||||||||||
|
March 31, 2018
|
December 31, 2017
|
March 31, 2017
|
||||||||||
|
Revenues:
|
||||||||||||
|
INAP US
|
$
|
57,076
|
$
|
53,226
|
$
|
55,461
|
||||||
|
INAP INTL
|
17,125
|
16,809
|
16,672
|
|||||||||
|
Total
|
74,201
|
70,035
|
72,133
|
|||||||||
|
Direct costs of sales and services, customer support and sales and marketing:
|
||||||||||||
|
INAP US
|
30,537
|
30,230
|
35,457
|
|||||||||
|
INAP INTL
|
11,133
|
10,490
|
9,002
|
|||||||||
|
Total
|
41,670
|
40,720
|
44,459
|
|||||||||
|
Business Unit Contribution:
|
||||||||||||
|
INAP US
|
26,539
|
22,997
|
20,004
|
|||||||||
|
INAP INTL
|
5,992
|
6,319
|
7,670
|
|||||||||
|
Total
|
$
|
32,531
|
$
|
29,316
|
$
|
27,674
|
||||||
|
Business Unit Contribution Margin:
|
||||||||||||
|
INAP US
|
46.5
|
%
|
43.2
|
%
|
36.1
|
%
|
||||||
|
INAP INTL
|
35.0
|
%
|
37.6
|
%
|
46.0
|
%
|
||||||
|
Total
|
43.8
|
%
|
41.9
|
%
|
38.4
|
%
|
||||||
INTERNAP CORPORATION
NON-GAAP (ADJUSTED) FINANCIAL MEASURES (Continued)
Free cash flow and unlevered free cash flow are non-GAAP measures. Free cash flow is net cash flows provided by operating activities minus capital expenditures. Unlevered free cash flow is free cash flow plus cash interest expense (in thousands, unaudited):
|
Three Months Ended
|
||||||||||||
|
March 31, 2018
|
December 31, 2017
|
March 31, 2017
|
||||||||||
|
Net cash flows provided by operating activities
|
$
|
3,527
|
$
|
13,808
|
$
|
7,264
|
||||||
|
Capital expenditures:
|
||||||||||||
|
Maintenance capital
|
(1,796
|
)
|
(4,057
|
)
|
(790
|
)
|
||||||
|
Growth capital
|
(4,564
|
)
|
(8,559
|
)
|
(5,199
|
)
|
||||||
|
Free cash flow (non-GAAP)
|
(2,833
|
)
|
1,192
|
1,275
|
||||||||
|
Cash interest expense
|
13,000
|
11,794
|
7,336
|
|||||||||
|
Unlevered free cash flow (non-GAAP)
|
$
|
10,167
|
$
|
12,986
|
$
|
8,611
|
||||||
DATA CENTER PORTFOLIO
The following table presents an overview of the portfolio of data center properties that INAP leases as of March 31, 2018:
|
Market
|
Gross Square
Feet (SF)1
|
Supporting
Infrustructure2
|
Office &
Other
|
Data Center
Footprint SF3
|
Current Raised
Floor SF4
|
Occupied
SF
|
Occupied
SF %
|
|
|
Atlanta
|
212,898
|
64,248
|
75,344
|
73,306
|
49,462
|
33,076
|
67
|
%
|
|
Los Angeles
|
124,651
|
11,323
|
17,475
|
95,853
|
25,055
|
15,650
|
62
|
%
|
|
Dallas5
|
112,700
|
23,763
|
21,023
|
67,914
|
30,972
|
17,262
|
56
|
%
|
|
New York/New Jersey
|
116,503
|
16,405
|
28,468
|
71,630
|
48,940
|
27,166
|
56
|
%
|
|
Boston
|
116,699
|
47,779
|
11,587
|
57,333
|
51,608
|
18,321
|
36
|
%
|
|
Seattle
|
100,597
|
31,326
|
21,552
|
47,719
|
38,719
|
23,055
|
60
|
%
|
|
Montreal
|
90,065
|
29,572
|
32,933
|
27,560
|
24,090
|
23,890
|
99
|
%
|
|
Santa Clara/San Jose
|
88,882
|
23,852
|
23,667
|
41,363
|
41,038
|
21,393
|
52
|
%
|
|
Houston
|
43,913
|
7,925
|
15,599
|
20,389
|
20,389
|
9,416
|
46
|
%
|
|
Phoenix
|
23,542
|
—
|
1,892
|
21,668
|
17,601
|
17,391
|
99
|
%
|
|
Chicago
|
14,027
|
1,551
|
—
|
12,476
|
12,076
|
9,811
|
81
|
%
|
|
Other6
|
22,993
|
—
|
981
|
21,994
|
20,045
|
15,962
|
80
|
%
|
|
Total
|
1,067,470
|
257,744
|
250,521
|
559,206
|
379,996
|
232,393
|
61
|
%
|
(1) Represents total SF subject to our lease.
(2) Represents total SF for mechanical and utility rooms.
(3) Represents total SF that is currently leased or available for lease but excludes supporting infrastructure, office space, and common area.
(4) Represents data center footprint SF less unbuilt SF.
(5) 10,000 SF of raised floor completed late Q1’18.
(6) Represents Miami, Northern Virginia, Oakland/San Francisco, London, Amsterdam, Frankfurt, Hong Kong, Singapore, Sydney, Tokyo, and Osaka.
Exhibit 99.2

1st Quarter 2018 Earnings Report Peter D. AquinoPresident & Chief Executive OfficerRobert M. DennerleinChief Financial OfficerMay 3, 2018

FORWARD-LOOKING STATEMENTS This presentation contains forward-looking statements. These forward-looking statements include statements related to sales, improved profitability, margin expansion, operations improvement, cost reductions, participation in strategic transactions, and our expectations for 2018 revenue, Adjusted EBITDA, capital expenditures and Adjusted EBITDA less Capex. Our ability to achieve these forward-looking statements is based on certain assumptions, including our ability to execute on our business strategy, leveraging of multiple routes to market, expanded brand awareness for high-performance IT infrastructure services and customer churn levels. These assumptions may prove inaccurate in the future. Because such forward-looking statements are not guarantees of future performance or results and involve risks and uncertainties, there are important factors that could cause INAP’s actual results to differ materially from those expressed or implied in the forward-looking statements, due to a variety of important factors. Such important factors include, without limitation: to drive growth while reducing costs; our ability to maintain current customers and obtain new ones, whether in a cost-effective manner or at all; the robustness of the IT infrastructure services market; our ability to achieve or sustain profitability; our ability to expand margins and drive higher returns on investment; our ability to sell into new and existing data center space; the actual performance of our IT infrastructure services and improving operations; our ability to correctly forecast capital needs, demand planning and space utilization; our ability to respond successfully to technological change and the resulting competition; the geographic concentration of the company’s data centers in certain markets and any adverse developments in local economic conditions or the demand for data center space in these markets; ability to identify any suitable strategic transactions; INAP's ability to realize anticipated revenue, growth, synergies and cost savings from the acquisition of SingleHop; INAP's ability to successfully integrate SingleHop’s sales, operations, technology, and products generally; the availability of services from Internet network service providers or network service providers providing network access loops and local loops on favorable terms, or at all; failure of third party suppliers to deliver their products and services on favorable terms, or at all; failures in our network operations centers, data centers, network access points or computer systems; our ability to provide or improve IT infrastructure services to our customers; our ability to protect our intellectual property; our substantial amount of indebtedness, our possibility to raise additional capital when needed, on attractive terms, or at all, our ability to service existing debt or maintain compliance with financial and other covenants contained in our credit agreement; our compliance with and changes in complex laws and regulations in the U.S. and internationally; our ability to attract and retain qualified management and other personnel; and volatility in the trading price of INAP common stock.These risks and other important factors discussed under the caption “Risk Factors” in our most recent Annual Report on Form 10-K filed with the Securities and Exchange Commission (“SEC”), and our other reports filed with the SEC could cause actual results to differ materially from those indicated by the forward-looking statements made in this presentation. Given these risks and uncertainties, investors should not place undue reliance on forward-looking statements as a prediction of actual results. All forward-looking statements attributable to INAP or persons acting on its behalf are expressly qualified in their entirety by the foregoing forward-looking statements. All such statements speak only as of the date made, and INAP undertakes no obligation to update or revise publicly any forward-looking statements, whether as a result of new information, future events or otherwise. © 2018 Internap Corporation (INAP)

NON-GAAP MEASURES In addition to results presented in accordance with GAAP, this presentation includes non-GAAP financial measures. INAP believes these non-GAAP financial measures provide additional information that is useful to investors in helping to understand our underlying performance and trends. Non-GAAP financial measures have inherent limitations, which are not required to be uniformly applied. Readers should be aware of these limitations and should be cautious with respect to the use of such measures. To compensate for these limitations, we use non-GAAP financial measures as comparative tools, together with GAAP financial measures, to assist in the evaluation of our operating performance or financial condition. Our method of calculating these non-GAAP financial measures may differ from methods used by other companies. These non-GAAP financial measures should not be considered in isolation or as a substitute for those financial measures prepared in accordance with GAAP.As required by SEC rules, we have provided in this presentation reconciliations of the non-GAAP financial measures included in this presentation to the most directly comparable GAAP financial measures. Reconciliations of non-GAAP financial measures are also available in the attachment to our first quarter 2018 earnings press release available on our website at www.ir.inap.com. © 2018 Internap Corporation (INAP)

FIRST QUARTER 2018 HIGHLIGHTS INAP has graduated from facilities management and cost cuts in 2017 to a more aggressive focus on profitable revenue growth in 2018New salesforce, with larger Colocation deals gaining momentumAddition of SingleHop strengthens our Cloud product set – adding innovation and talentManaging P&Ls by US and INTL provides “deeper dives” and new business developmentRepricing of INAP’s total debt by 125 basis points improves cash flowRepricing enabled by improved performance, and favorable response to the SingleHop acquisition.Cash flow improvement, all else equal, yields over $5M/year in interest savingsUpside in organic growth and margin expansion initiatives in progress SingleHop integration is progressing well. Cost synergies are circled…but management is equally focused on revenue synergy projects to boost resultsNetwork backbone redesign and incremental Metro Ethernet investments will greatly improve resiliency, customer experience and product development © 2018 Internap Corporation (INAP) INAP Enters the Next Chapter: Revenue and Cash Flow Growth

© 2018 Internap Corporation (INAP) 5 INAP is in 21 Metropolitan Markets WorldwideWith 57 Data Centers and 98 POP’s INAP’S EXPANSIVE DATA CENTER AND NETWORK FOOTPRINT

CONSOLIDATED EARNINGS SUMMARY *Reconciliation to GAAP on pages 13-19 © 2018 Internap Corporation (INAP) Top Line Stabilization Continues in First Quarter 2018

INAP US BUSINESS UNIT RESULTS *Reconciliation to GAAP on pages 13-19 © 2018 Internap Corporation (INAP) INAP US Margin shows continued sequential and YoY improvement COLOCATION NETWORK INAP US Business Unit Contribution (non-GAAP)* ($mm) and % CLOUD INAP US Revenue ($mm) $55.5 $53.2 $57.1 $30.0 $30.1 $30.9 $12.4 $9.1 $10.0 $15.5 $14.0 $13.8 $20.0 $23.0 $26.5 36.1% 43.2% 46.5% 1Q’17 1Q’17 4Q’17 4Q’17 1Q’18 1Q’18

INAP INTL BUSINESS UNIT RESULTS *Reconciliation to GAAP on pages 13-19 © 2018 Internap Corporation (INAP) INAP INTL Positioned for Margin Stabilization and New Growth COLOCATION NETWORK INAP INTL Business Unit Contribution (non-GAAP)* ($mm) and % CLOUD $7.7 $6.3 $6.0 $1.3 $15 INAP INTL Revenue ($mm) $16.7 $16.8 $17.1 $1.3 $1.5 $1.5 $13.8 $12.3 $12.6 $1.5 $3.0 $3.0 46.0% 37.6% 35.0% 1INAP Japan was consolidated in 4Q’17 at a lower contribution margin 1 1Q’18 1Q’18 1Q’17 4Q’17 1Q’17 4Q’17 1

CASH FLOW AND BALANCE SHEET SUMMARY *Reconciliation to GAAP on pages 13-19© 2018 Internap Corporation (INAP) April 2018: INAP reprices credit facility, savings of 125bp
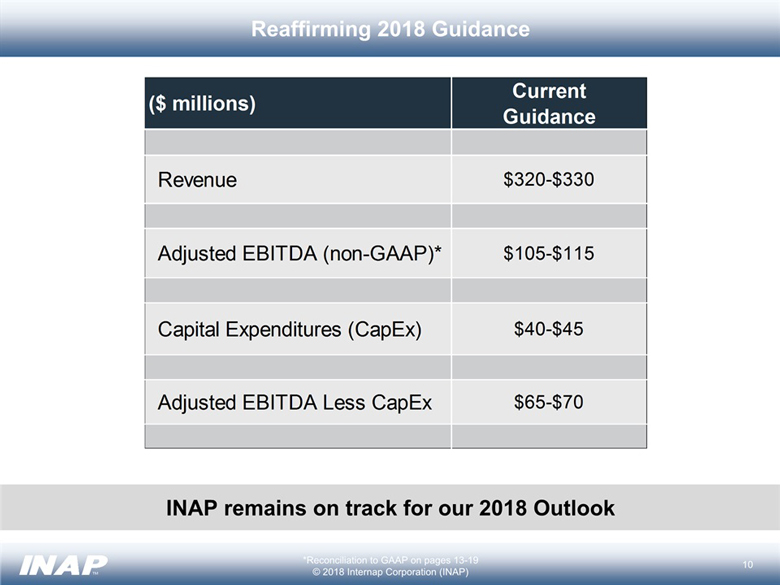
Reaffirming 2018 Guidance *Reconciliation to GAAP on pages 13-19 © 2018 Internap Corporation (INAP) INAP remains on track for our 2018 Outlook

INAP IS IN POSITION TO ACCELERATE GROWTH © 2018 Internap Corporation (INAP) Management is Executing to Gain Share in INAP’s 21 Metro Markets Management has reached the “next level” to drive revenue growthThe Sales team is in place, and bolstered by SingleHop products and talentThe new GMs are pacing through opportunities faster and scoring larger dealsCost rationalization initiatives will continue to prune non-core assets2018 synergies from integration will reduce headcount, facilities, and network overlapOpportunistic cost and capex savings will contribute to sustainable positive cash flowINAP’s global network and POP portfolio can now be leveragedRedesigned existing backbone and introducing Metro EthernetNetwork and real estate cost optimization contributes to be a work in progress INAP is differentiated from the competition, and can meet complex IT demandData center services through primarily Tier 3 facilities meets, or exceeds, the competitionINAP can now deliver innovative Cloud and Managed Hosting productsThe addressable market for customized and bundled Colo, Cloud, and High Performance IP products and services is expanding, while INAP continues to gain momentum
© 2018 Internap Corporation (INAP) APPENDIX Reconciliation of Non-GAAP Financial Measures

RECONCILIATION OF NON-GAAP FINANCIAL MEASURES Normalized Net Loss Attributable to INAP Shareholders is a non-GAAP measure. Normalized Net Loss is net loss attributable to INAP shareholders plus non-GAAP revenue, exit activities, restructuring and impairments, stock-based compensation, non-income tax contingency, strategic alternatives and related costs, one time interest expense, and organizational realignment costs. © 2018 Internap Corporation (INAP)

RECONCILIATION OF NON-GAAP FINANCIAL MEASURES Business Unit Contribution and Business Unit Contribution Margin are non-GAAP measures. Business Unit Contribution is defined as business unit revenues less direct costs of sales and services, customer support, and sales and marketing, exclusive of depreciation and amortization. Business Unit Contribution Margin is Business Unit Contribution as a percentage of business unit revenues.($ in thousands, unaudited) © 2018 Internap Corporation (INAP)

RECONCILIATION OF NON-GAAP FINANCIAL MEASURES Adjusted EBITDA and Adjusted EBITDA Margin are non-GAAP measures. Adjusted EBITDA is GAAP net loss attributable to INAP Shareholders plus non-GAAP revenue, depreciation and amortization, interest expense, provision (benefit) for income taxes, other expense (income), (gain) loss on disposal of property and equipment, exit activities, restructuring and impairments, stock-based compensation, non-income tax contingency, strategic alternatives and related costs, organizational realignment costs, and acquisition costs. Adjusted EBITDA margin is adjusted EBITDA as a percentage of revenues. © 2018 Internap Corporation (INAP) ($ in thousands, unaudited)

RECONCILIATION OF NON-GAAP FINANCIAL MEASURES Adjusted EBITDA less CapEx is a non-GAAP measure. Adjusted EBITDA less CapEx is Adjusted EBITDA less capital expenditures with Adjusted EBITDA for this non-GAAP measure defined as net cash flow provided by operating activities plus cash paid for interest, cash paid for taxes, cash paid for exit activities and restructuring, cash paid for strategic alternatives and related costs, cash paid for organizational realignment costs, payment of debt lender fees, cash paid for acquisition costs, and other working capital changes less capital expenditures. © 2018 Internap Corporation (INAP) ($ in thousands, unaudited)
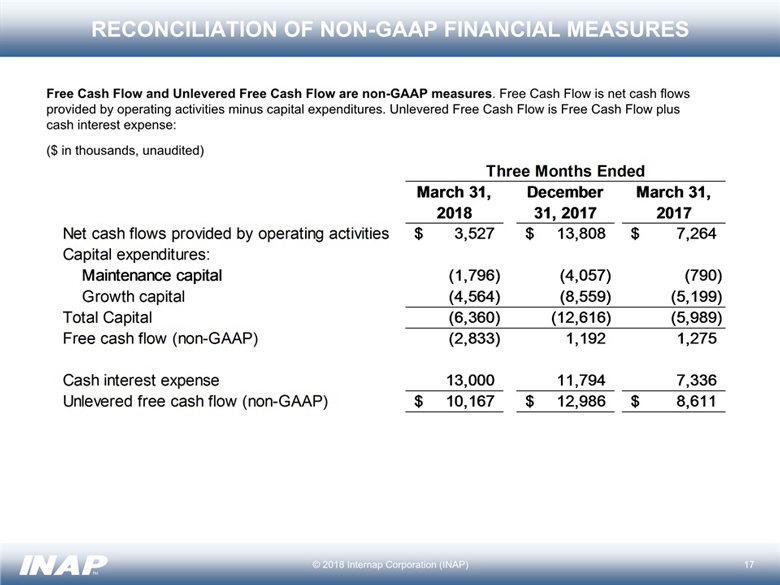
RECONCILIATION OF NON-GAAP FINANCIAL MEASURES © 2018 Internap Corporation (INAP) Free Cash Flow and Unlevered Free Cash Flow are non-GAAP measures. Free Cash Flow is net cash flows provided by operating activities minus capital expenditures. Unlevered Free Cash Flow is Free Cash Flow plus cash interest expense: ($ in thousands, unaudited)
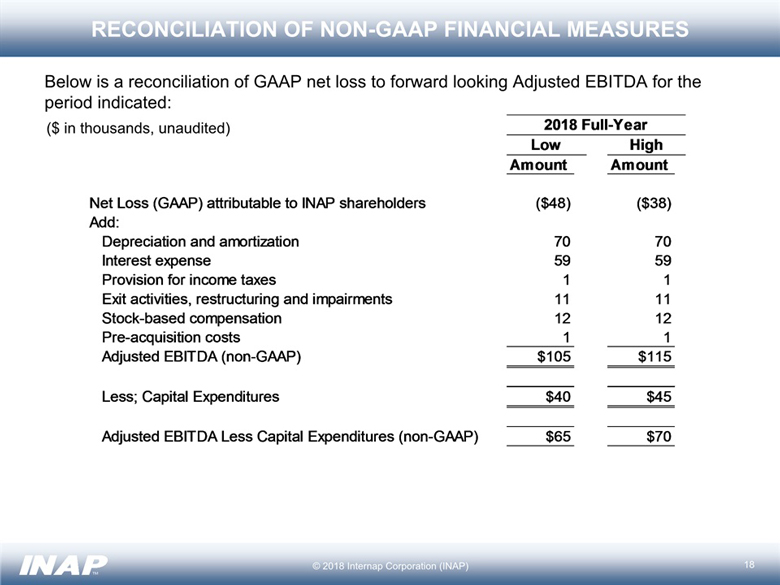
RECONCILIATION OF NON-GAAP FINANCIAL MEASURES Below is a reconciliation of GAAP net loss to forward looking Adjusted EBITDA for the period indicated: © 2018 Internap Corporation (INAP) ($ in thousands, unaudited)
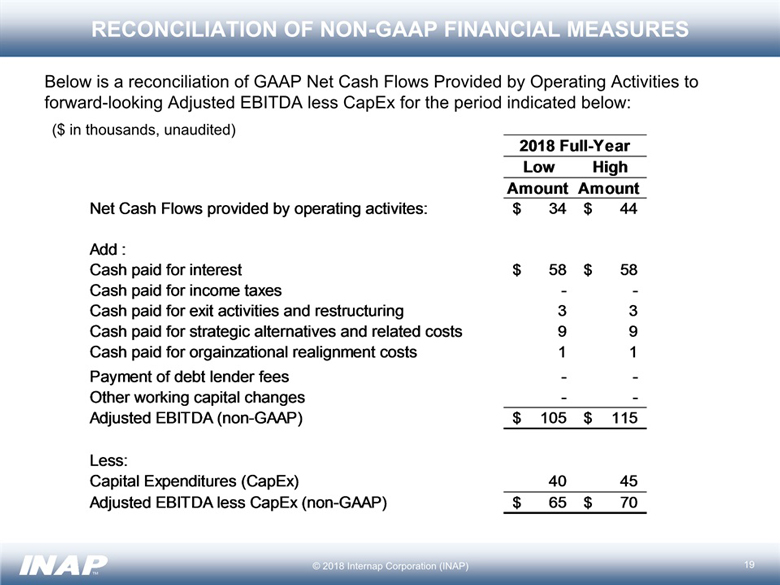
RECONCILIATION OF NON-GAAP FINANCIAL MEASURES Below is a reconciliation of GAAP Net Cash Flows Provided by Operating Activities to forward-looking Adjusted EBITDA less CapEx for the period indicated below: © 2018 Internap Corporation (INAP) ($ in thousands, unaudited)