
Form 8-K TRECORA RESOURCES For: May 01
UNITED STATES
SECURITIES AND EXCHANGE COMMISSION
Washington, D.C. 20549
FORM 8-K
CURRENT REPORT
Pursuant to Section 13 or 15(d) of
the Securities Exchange Act of 1934
Date of Report (Date of earliest event reported): May 1, 2018
Trecora
Resources
(Exact name of registrant as specified in its charter)
|
Delaware (State or other jurisdiction of incorporation) |
1-33926 (Commission File Number)
|
75-1256622 (IRS Employer Identification No.) |
1650 Hwy 6 South, Suite 190
Sugar Land, Texas 77478
(Address of principal executive offices)
(281) 980-5522
(Registrant’s Telephone Number, Including Area Code)
Not applicable
(Former name or former address, if changed since last report)
Check the appropriate box below if the Form 8-K filing is intended to simultaneously satisfy the filing obligation of the registrant under any of the following provisions:
| ¨ | Written communications pursuant to Rule 425 under the Securities Act (17 CFR 230.425) |
| ¨ | Soliciting material pursuant to Rule 14a-12 under the Exchange Act (17 CFR 240.14a-12) |
| ¨ | Pre-commencement communications pursuant to Rule 14d-2(b) under the Exchange Act (17 CFR 240.14d-2(b)) |
| ¨ | Pre-commencement communications pursuant to Rule 13e-4(c) under the Exchange Act (17 CFR 240.13e-4(c)) |
Indicate by check mark whether the registrant is an emerging growth company as defined in Rule 405 of the Securities Act of 1933 or Rule 12b-2 of the Securities Exchange Act of 1934.
| Emerging growth company | ¨ | ||
| If an emerging growth company, indicate by check mark if the registrant has elected not to use the extended transition period for complying with any new or revised financial accounting standards provided pursuant to Section 13(a) of the Exchange Act. ¨ | |||
| Item 2.02. | Results of Operations and Financial Condition |
The Company’s press release dated May 1, 2018, regarding its financial results for the quarter ended March 31, 2018, including consolidated financial statements for the quarter ended March 31, 2018, is Exhibit 99.1 of this Form 8-K.
The information in this Item 2.02, including the corresponding Exhibit 99.1 is hereby filed.
| Item 7.01. | Regulation FD Disclosure. |
The slides for the Company’s first quarter 2018 earnings presentation on May 2, 2018, are Exhibit 99.2 to this Form 8-K.
The information in this Item 7.01, including the corresponding Exhibit 99.2, is being furnished with the Commission and shall not be deemed “filed” for purposes of Section 18 of the Securities Exchange Act of 1934.
| Item 9.01. | Financial Statements and Exhibits. |
| (d) | Exhibits |
The following exhibits are being filed as part of this report:
| Exhibit No. | Description of Exhibit | |
| 99.1 | Earnings Release of the Company, dated May 1, 2018 | |
| 99.2 | Earnings Presentation of the Company, dated May 2, 2018 |
The Company’s website (www.trecora.com) contains a significant amount of information about the Company, including financial and other information for investors. The Company strongly encourages investors to visit its website from time to time, as information is updated and new information is posted.
SIGNATURE
Pursuant to the requirements of the Securities Exchange Act of 1934, the registrant has duly caused this report to be signed on its behalf by the undersigned hereunto duly authorized.
| TRECORA RESOURCES | |||
| Date: May 2, 2018 | By: | /s/ Sami Ahmad | |
| Sami Ahmad | |||
| Chief Financial Officer | |||
Trecora Resources Reports First Quarter 2018 Results
First Quarter Revenue Increased 29.2% and Prime Product Volume Up 27.1% Year-over-Year
First Quarter Net Income of $2.4 Million or $0.09 per Diluted Share
First Quarter Adjusted EBITDA of $7.2 Million Decreased 2.2% Year-over-Year Following the Impact of a Sharp Increase in Feedstock Costs
AMAK Delivered $0.2 Million Equity in Earnings in the Quarter
Conference Call at 10:00 am ET Tomorrow, May 2
SUGAR LAND, Texas, May 1, 2018 /PRNewswire/ -- Trecora Resources (NYSE: TREC), a leading provider of high purity specialty hydrocarbons and waxes, today announced financial results for the first quarter ended March 31, 2018.
"We delivered broad-based prime product volume growth at South Hampton in the quarter as demand remains strong, and we saw significant improvement in results at Trecora Chemical largely due to our efforts to improve operational execution," said Simon Upfill-Brown, President and CEO. "Particularly noteworthy, our new hydrogenation unit ramped up production through improvements in reliability and efficiency.
"We faced rising input costs in the quarter, most notably a sharp increase in natural gasoline prices, that pressured margins for prime products and by-products," Upfill-Brown continued. "We experienced some additional cost pressures related to distribution and storage costs but are implementing steps to mitigate those costs in the second quarter and beyond. Repairs to Aromax II are progressing as planned with expected start up in the third quarter.
"Following the changes to our organizational structure announced in March, we are beginning to see improvement in plant operations. I believe we are headed in the right direction," concluded Upfill-Brown. "Our focus on organizational effectiveness and improved operational processes position us well to capitalize on continued strong demand from customers. In addition, we are attempting to alleviate margin pressures at South Hampton through price and productivity initiatives."
First
Quarter 2018 Financial Results
Total revenue in the first quarter was $71.7 million, compared with $55.5 million in the first quarter of 2017, an increase of 29.2%. The increase in reported revenue was driven by a 34.4% increase in petrochemical sales volume and a 1.3% increase in the average sales price of petrochemical products compared with the first quarter of 2017. The higher average sales price was offset by a 17.4% year-over-year increase in the average per-gallon cost of petrochemical feedstock, which is the basis for the formula pricing for approximately 60% of the Company's petrochemical product sales. Since formula pricing is based upon prior month feedstock averages, sales price increases tend to lag behind higher feedstock costs resulting in lower profit margins in the period reported. The increase in feedstock costs compressed margins for the non-formula portion of prime product sales as
well. These are sales which do not have pricing formulas tied to feedstock costs. Due to competitive factors, we were unable to recover the increase in feedstock costs through price increases in the quarter.
Gross profit in the first quarter was $10.1 million, or 14.1% of total revenues, compared with $10.6 million, or 19.1% of total revenues, in the first quarter of 2017. Operating income for the first quarter was $3.6 million, compared with operating income of $4.2 million for the first quarter of 2017.
Net income for the first quarter was $2.4 million, or $0.09 per diluted share, compared with net income of $1.5 million, or $0.06 per diluted share, for the first quarter of 2017. Adjusted net income for the quarter was $2.2 million, or $0.08 per share. Reported net income in the first quarter of 2018 reflected equity in earnings of AMAK of $0.2 million or an estimated $0.01 per diluted share on an after-tax basis as compared to equity in losses of AMAK of $1.0 million or an estimated after tax impact of $(0.03) per diluted share in the year-ago period.
Adjusted EBITDA in the quarter was $7.2 million, representing a 10.0% margin, compared with Adjusted EBITDA of $7.4 million, representing a 13.3% margin for the same period a year ago.
South Hampton Resources
Petrochemical volume in the first quarter was 23.3 million gallons, compared with 17.3 million gallons in the first quarter of 2017. Prime product volume in the first quarter of 2018 was 17.7 million gallons, compared with 13.9 million gallons in the first quarter of 2017. Byproduct volume increased 64.3% year-over-year, to 5.6 million gallons. These volumes are sold at lower margins than our prime products.
International volume represented 24.9% of total petrochemical volume during the quarter, up from 22.7% sequentially and 19.6% from the first quarter of 2017.
SHR SEGMENT INFORMATION* | ||||
|
| ||||
|
| THREE MONTHS ENDED |
|
| |
|
| MARCH 31, |
|
| |
|
| 2018 | 2017 | % Change | |
Product sales | $60,285 | $44,391 | 36% | |
Processing fees | 2,028 | 1,488 | 36% | |
Net revenues | $62,313 | $45,879 | 36% | |
Operating profit before depreciation and amortization | 8,393 | 8,214 | 2% | |
Operating profit | 6,679 | 6,658 | 0% | |
Profit before taxes | 6,055 | 6,005 | 1% | |
Depreciation and amortization | 1,714 | 1,556 | 10% | |
EBITDA | 8,390 | 8,040 | 4% | |
Capital expenditures | $ 10,283 | $ 8,756 | 17% | |
|
|
|
|
| |
*Dollar amounts in thousands/rounding may apply |
|
|
| |
Trecora Chemical
TC generated revenues of $9.6 million, down 0.7% from $9.7 million in the first quarter of 2017. TC revenue included $6.4 million of wax product sales, down 1.9%. TC's own product wax revenues were a record for the quarter but total revenues were reduced due to a lack of supply of third party waxes that we distribute in Latin America. At $3.2 million, custom processing fees were up 1.8%, when compared with the first quarter of 2017. Customer demand for custom processing remains solid, and as a result of improved operations, revenues from custom processing grew 14.7% from the fourth quarter of 2017.
TC SEGMENT INFORMATION* | |||
|
| |||
|
| THREE MONTHS
|
| |
|
| MARCH 31, |
| |
|
| 2018 | 2017 | % Change |
Product sales | $6,383 | $6,508 | (2%) |
Processing fees | 3,212 | 3,155 | 2% |
Net revenues | $9,595 | $9,663 | (1%) |
Operating profit before depreciation and amortization | 390 | 745 | (48%) |
Operating loss | (914) | (271) | 237% |
Loss before taxes | (1,181) | (290) | 407% |
Depreciation and amortization | 1,304 | 1,016 | 28% |
EBITDA | 379 | 726 | (48%) |
Capital expenditures | $ 745 | $ 5,125 | (86%) |
|
|
|
|
|
*Dollar amounts in thousands/rounding may apply |
|
|
|
Al Masane Al Kobra Mining Company (AMAK)
Trecora reported equity in earnings of AMAK of approximately $0.2 million during the first quarter of 2018.
Earnings Call
Tomorrow's conference call and presentation slides will be simulcast live on the Internet, and can be accessed on the investor relations section of the Company's website at http://www.trecora.com or at http://public.viavid.com/index.php?id=129314. A replay of the call will also be available through the same link.
To participate via telephone, callers should dial in five to ten minutes prior to the 10:00 am Eastern start time; domestic callers (U.S. and Canada) should call 1-888-394-8218 or 1-323-701-0225 if calling internationally, using the conference ID 1872797. To listen to the playback, please call 1-844-512-2921 if calling within the United States or 1-412-317-6671 if calling internationally. Use pin number 1872797 for the replay.
Use of Non-GAAP Measures
The Company reports its financial results in accordance with U.S. generally accepted accounting principles ("GAAP"). We believe certain financial measures, such as EBITDA, Adjusted EBITDA, Adjusted EBITDA Margin and Adjusted Net Income, which are non-GAAP measures, provide users of our financial statements with supplemental information that may be useful in evaluating our operating performance. We believe that such non-GAAP measures, when read in conjunction with our operating results presented under U.S. GAAP, can be used to better assess our performance from period to period and relative to performance of other companies in our industry, without regard to financing methods, historical cost basis or capital structure. Such non-GAAP measures should be considered as a supplement to, and not as a substitute for, financial measures prepared in accordance with U.S.
GAAP.
These non-GAAP measures have been reconciled to the nearest GAAP measure in the tables below entitled Reconciliation of Selected GAAP Measures to Non-GAAP Measures.
Forward-Looking Statements
Statements in this press release that are not historical facts are forward looking statements as defined in the Private Securities Litigation Reform Act of 1995. Forward-looking statements are based upon our belief, as well as assumptions made by and information currently available to us. Because such statements are based upon expectations as to future economic performance and are not statements of fact, actual results may differ from those projected. These risks, as well as others, are discussed in greater detail in Trecora Resources' filings with the Securities and Exchange Commission, including Trecora Resources' Annual Report on Form 10-K for the year ended December 31, 2017, and the Company's subsequent Quarterly Reports on Form 10-Q. All forward-looking statements included in this press release are based upon information available to the Company as of the date
of this press release. The Company undertakes no obligation to publicly update or revise any forward-looking statements after the date they are made, whether as a result of new information, future events or otherwise.
About Trecora Resources (TREC)
TREC owns and operates a facility located in southeast Texas, just north of Beaumont, which specializes in high purity hydrocarbons and other petrochemical manufacturing. TREC also owns and operates a leading manufacturer of specialty polyethylene waxes and provider of custom processing services located in the heart of the Petrochemical complex in Pasadena, Texas. In addition, the Company is the original developer and a 33.4% owner of Al Masane Al Kobra Mining Co., a Saudi Arabian joint stock company.
Investor Relations Contact:
Jean Young
The Piacente Group
212-481-2050
[email protected]
TRECORA RESOURCES AND SUBSIDIARIES | ||
CONSOLIDATED BALANCE SHEETS | ||
|
| ||
|
| MARCH 31,
| DECEMBER
|
ASSETS | (thousands of dollars) | |
Current Assets |
|
|
Cash | $ 2,568 | $ 3,028 |
Trade receivables, net | 27,421 | 25,779 |
Insurance receivable | 742 | -- |
Inventories | 15,691 | 18,450 |
Prepaid expenses and other assets | 5,131 | 4,424 |
Taxes receivable | 5,481 | 5,584 |
Total current assets | 57,034 | 57,265 |
|
|
|
|
Plant, pipeline and equipment, net | 190,139 | 181,742 |
|
|
|
|
Goodwill | 21,798 | 21,798 |
Intangible assets, net | 20,343 | 20,808 |
Investment in AMAK | 45,224 | 45,125 |
Mineral properties in the United States | 588 | 588 |
|
|
|
|
TOTAL ASSETS | $ 335,126 | $ 327,326 |
|
|
|
|
LIABILITIES |
|
|
Current Liabilities |
|
|
Accounts payable | $ 14,888 | $ 18,347 |
Accrued liabilities | 4,229 | 3,961 |
Current portion of post-retirement benefit | 302 | 305 |
Current portion of long-term debt | 8,061 | 8,061 |
Current portion of other liabilities | 889 | 870 |
Total current liabilities | 28,369 | 31,544 |
|
|
|
|
Long-term debt, net of current portion | 99,031 | 91,021 |
Post-retirement benefit, net of current portion | 897 | 897 |
Other liabilities, net of current portion | 1,374 | 1,611 |
Deferred income taxes | 17,670 | 17,242 |
Total liabilities | 147,341 | 142,315 |
|
|
|
|
EQUITY |
|
|
Common stock-authorized 40 million shares of $.10 par value; issued 24.5 million in 2018 and 2017 and outstanding 24.3 million shares in 2018 and 2017 | 2,451 | 2,451 |
Additional paid-in capital | 56,422 | 56,012 |
Common stock in treasury, at cost | (184) | (196) |
Retained earnings | 128,807 | 126,455 |
Total Trecora Resources Stockholders' Equity | 187,496 | 184,722 |
Noncontrolling Interest | 289 | 289 |
Total equity | 187,785 | 185,011 |
|
|
|
|
TOTAL LIABILITIES AND EQUITY | $335,126 | $ 327,326 |
TRECORA RESOURCES AND SUBSIDIARIES | ||
CONSOLIDATED STATEMENTS OF INCOME (UNAUDITED) | ||
|
| ||
|
| THREE MONTHS
| |
|
| MARCH 31, | |
|
| 2018 | 2017 |
|
| (thousands of dollars) | |
REVENUES |
|
|
Petrochemical and Product Sales | $ 66,699 | $ 50,899 |
Processing Fees | 5,042 | 4,643 |
|
| 71,741 | 55,542 |
|
|
|
|
OPERATING COSTS AND EXPENSES |
|
|
Cost of Sales and Processing |
|
|
(including depreciation and amortization of $2,830 and $2,383, respectively) | 61,601 | 44,924 |
|
|
|
|
GROSS PROFIT | 10,140 | 10,618 |
|
|
|
|
GENERAL AND ADMINISTRATIVE EXPENSES |
|
|
General and Administrative | 6,335 | 6,221 |
Depreciation | 196 | 205 |
|
| 6,531 | 6,426 |
|
|
|
|
OPERATING INCOME | 3,609 | 4,192 |
|
|
|
|
OTHER INCOME (EXPENSE) |
|
|
Interest Income | 7 | 2 |
Interest Expense | (878) | (636) |
Equity in Earnings (Losses) of AMAK | 230 | (966) |
Miscellaneous Expense | (26) | (44) |
|
| (667) | (1,644) |
|
|
|
|
INCOME BEFORE INCOME TAXES | 2,942 | 2,548 |
|
|
|
|
INCOME TAXES | 590 | 1,061 |
|
|
|
|
NET INCOME | 2,352 | 1,487 |
|
|
|
|
NET LOSS ATTRIBUTABLE TO NONCONTROLLING INTEREST | -- | -- |
|
|
|
|
NET INCOME ATTRIBUTABLE TO TRECORA RESOURCES | $ 2,352 | $ 1,487 |
|
|
|
|
Basic Earnings per Common Share |
|
|
Net Income Attributable to Trecora Resources (dollars) | $ 0.10 | $ 0.06 |
|
|
|
|
Basic Weighted Average Number of Common Shares Outstanding | 24,343 | 24,240 |
|
|
|
|
Diluted Earnings per Common Share |
|
|
Net Income Attributable to Trecora Resources (dollars) | $ 0.09 | $ 0.06 |
|
|
|
|
Diluted Weighted Average Number of Common Shares Outstanding | 25,231 | 25,054 |
TRECORA RESOURCES AND SUBSIDIARIES | |||||||||
RECONCILIATION OF SELECTED GAAP MEASURES TO NON-GAAP MEASURES(1) | |||||||||
|
| |||||||||
Adjusted EBITDA Margin | |||||||||
(rounding may apply) | |||||||||
|
| |||||||||
|
| THREE MONTHS ENDED 3/31/18 |
| THREE MONTHS ENDED 3/31/17 | ||||||
|
| TC | SHR | CORP | TREC |
| TC | SHR | CORP | TREC |
NET INCOME (LOSS) | $(1,181) | $4,970 | $(1,437) | $2,352 |
| $(290) | $3,828 | $(2,051) | $1,487 |
Interest | 256 | 621 | 1 | 878 |
| - | 635 | 1 | 636 |
Taxes | - | 1,085 | (495) | 590 |
| - | 2,021 | (960) | 1,061 |
Depreciation and amortization | 22 | 166 | 8 | 196 |
| 21 | 167 | 16 | 204 |
Depreciation and amortization in cost of sales | 1,282 | 1,548 | - | 2,830 |
| 995 | 1,389 | - | 2,384 |
EBITDA | 379 | 8,390 | (1,923) | 6,846 |
| 726 | 8,040 | (2,994) | 5,772 |
Share based compensation | - | - | 592 | 592 |
| - | - | 633 | 633 |
Equity in losses (earnings) of AMAK | - | - | (230) | (230) |
| - | - | 966 | 966 |
|
|
|
|
|
|
|
|
|
|
|
Adjusted EBITDA | $379 | $8,390 | $(1,561) | $7,208 |
| $726 | $8,040 | $(1,395) | $7,371 |
|
|
|
|
|
|
|
|
|
|
|
Revenue | 9,595 | 62,313 | (167) | 71,741 |
| 9,663 | 45,879 |
| 55,542 |
Adjusted EBITDA Margin | 3.9% | 13.5% |
| 10.0% |
| 7.5% | 17.5% |
| 13.3% |
(adjusted EBITDA/revenue) |
|
|
|
|
|
|
|
|
|
Adjusted Net Income and Estimated EPS Impact | ||
(rounding may apply) | ||
|
| ||
|
| Three months ended
| |
|
| 2018 | 2017 |
Net Income | $ 2,352 | $ 1,487 |
|
|
|
|
Equity in losses (earnings) of AMAK | $ (230) | $ 966 |
Taxes at statutory rate of 21% and 35%, respectively | 48 | ( 338) |
Tax effected equity in losses (earnings) | (182) | 628 |
Adjusted Net Income | $ 2,170 | $ 2,115 |
Diluted weighted average number of shares | 25,231 | 25,054 |
Estimated effect on diluted EPS |
|
|
(-tax effected equity in AMAK/diluted weighted average number of shares) | $.01 | ($.03) |
(1)This press release includes non-GAAP measures. Our non-GAAP measures are not meant to be considered in isolation or as a substitute for comparable GAAP measures and should be read only in conjunction with our consolidated financial statements prepared in accordance with GAAP. |
![]()
Exhibit 99.2

Click to edit Master title style TREC Your Specialty Chemical Partner First Quarter 2018 Financial Results May 2, 2018
2 Safe Harbor Statements in this presentation that are not historical facts are forward looking statements as defined in the Private Securities Litigation Reform Act of 1995 . Forward looking statements are based upon Management's belief, as well as, assumptions made by and information currently available to Management . Because such statements are based upon expectations as to future economic performance and are not statements of fact, actual results may differ from those projected . These risks, as well as others, are discussed in greater detail in Trecora Resources' filings with the Securities and Exchange Commission, including Trecora Resources' Annual Report on Form 10 - K for the year ended December 31 , 2017 , and the Company‘s subsequent Quarterly Reports on Form 10 - Q . All forward - looking statements included in this presentation are based upon information available to the Company as of the date of this presentation . The Company undertakes no obligation to publicly update or revise any forward - looking statements after the date they are made, whether as a result of new information, future events or otherwise .

3 First Quarter 2018 Overview » South Hampton Resources: Strong prime product volume growth • Quarterly growth of 27.1% even before full start - up of major new demand projects • Margins compressed by increase in feedstock costs • Advanced Reformer start - up on track for Q3 2018 » Trecora Chemical: Continued progress – Organizational changes taking hold • Q1 revenue and product volume grew significantly from Q4 • Customer demand for custom processing remains solid • Organizational changes implemented in first quarter 2018 designed to sharpen focus on processing and operational execution » AMAK delivered $0.2 million in equity in earnings in Q1 as production levels rise following year - long modernization efforts • Initial reserve update completed » Increasing capacity as recent capital projects ramp production

4 SHR Update • Quarterly prime product volume increased 27.1% from Q1 2017 • Second Canadian oil sands customer up and running; expect volumes second half 2018 • International sales volume increased to 24.9% of petrochemical volume vs. 19.6% in 1Q17 Petrochemical Sales Volumes 1Q18 4Q17 3Q17 2Q17 1Q17 (million gallons) All Products 23.3 22.8 22.4 20.8 17.3 Prime Products 17.7 17.1 16.7 16.3 13.9 Byproducts 5.6 5.7 5.7 4.5 3.4 Deferred Sales 2.2 2.3 1.8 2.4 1.6 0.0% 5.0% 10.0% 15.0% 20.0% 25.0% 30.0% 2014 2015 2016 2017 1Q17 1Q18 International % of petrochemical volume sold
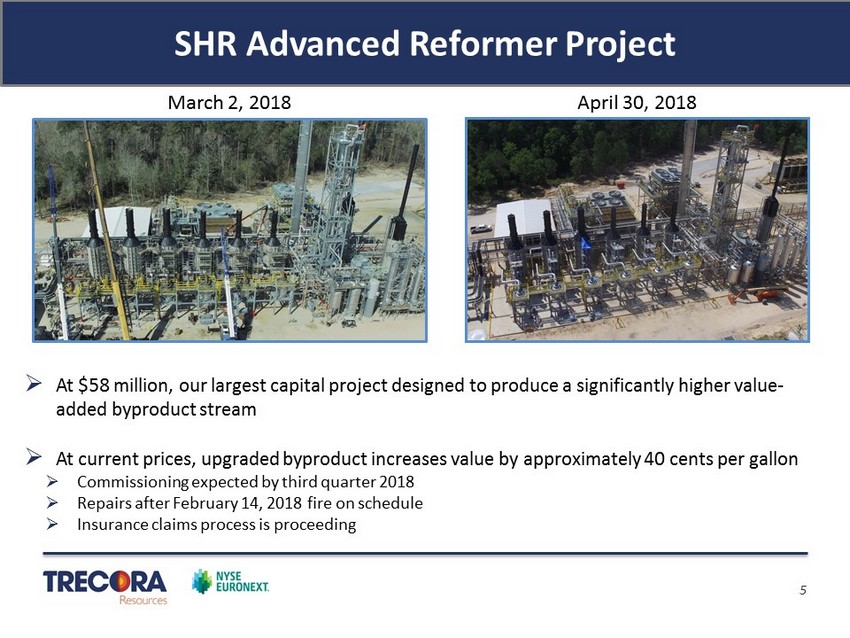
5 SHR Advanced Reformer Project » At $58 million, our largest capital project designed to produce a significantly higher value - added byproduct stream » At current prices, upgraded byproduct increases value by approximately 40 cents per gallon » Commissioning expected by third quarter 2018 » Repairs after February 14, 2018 fire on schedule » Insurance claims process is proceeding March 2, 2018 April 30, 2018

6 Trecora Chemical Update » Quarterly Revenue – down 0.7% compared to first quarter 2017 but up 19.7% relative to 4Q17 • Q1 results reflect early benefits of organizational focus on operational excellence as well as ramping production of the hydrogenation unit » Wax • Q1 sales volumes down 10.5% year over year but up 34.2% relative to 4Q17 (drop was due to distribution in Latin America) • Record quarterly revenue for own product wax • Average pricing up 9% • Demand remains high and steps taken in the quarter to improve production » Custom Processing • Q1 custom processing revenues increased 14.7% over 4Q17 • Record quarterly revenues, excluding non use fee, as the hydrogenation unit ramps production » B Plant • Record first quarter revenues of $1.25 million in Q1 • On track to contribute $4 - $6 M/year in EBITDA run - rate by end of 2018 » Hydrogenation/Distillation Units • Hydrogenation volume ramped significantly from Q4 as production challenges were addressed • On track to deliver additional $6 - $8 M/year in EBITDA run rate at end of 2018
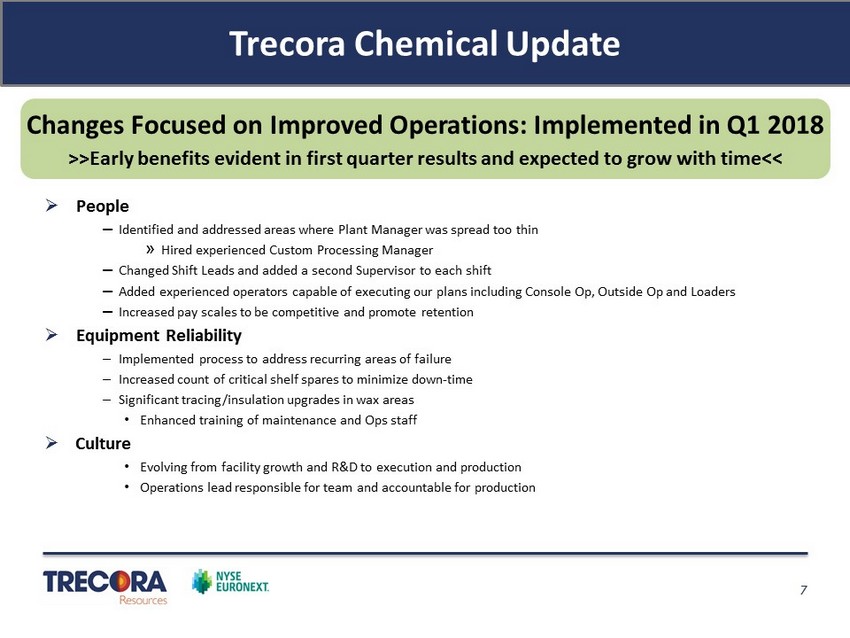
7 Trecora Chemical Update Changes Focused on Improved Operations: Implemented in Q1 2018 >>Early benefits evident in first quarter results and expected to grow with time<< » People – Identified and addressed areas where Plant Manager was spread too thin » Hired experienced Custom Processing Manager – Changed Shift Leads and added a second Supervisor to each shift – Added experienced operators capable of executing our plans including Console Op, Outside Op and Loaders – Increased pay scales to be competitive and promote retention » Equipment Reliability – Implemented process to address recurring areas of failure – Increased count of critical shelf spares to minimize down - time – Significant tracing/insulation upgrades in wax areas • Enhanced training of maintenance and Ops staff » Culture • Evolving from facility growth and R&D to execution and production • Operations lead responsible for team and accountable for production

8 AMAK Mine Developments » Operations • 10,000 dmt sold in 1Q18 (vs. 20,000 dmt during 4Q17 – sequential decline due to timing of stockpile delivery to market) • Equally split between copper concentrate and zinc concentrate • Concentrate quality, throughput rates and recoveries continued steady progress • Equity in earnings of $0.2 million in 1Q18 » Exploration • Drilling continues in Guyan and surrounding areas with a similar geological profile • Guyan gold project developing as scheduled • Procurement and Construction Starts 3Q18 • Commission Guyan Gold Project in 1H19 • Drilling continues for Al Masane copper and zinc • Reserves update in the 10 - K. 8 years for Life of Mine, with expectation to extend significantly by year - end » Precious Metal Circuit/SART • Due to limited availability of PMC (now resolved), expect additional gold and silver doré sales next quarter
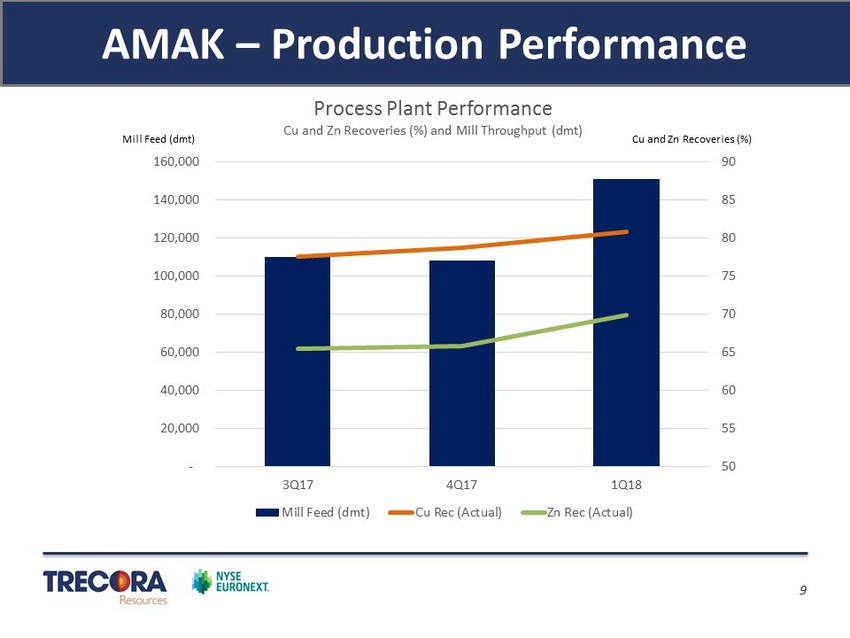
9 AMAK – Production Performance 50 55 60 65 70 75 80 85 90 - 20,000 40,000 60,000 80,000 100,000 120,000 140,000 160,000 3Q17 4Q17 1Q18 Process Plant Performance Cu and Zn Recoveries (%) and Mill Throughput ( dmt ) Mill Feed (dmt) Cu Rec (Actual) Zn Rec (Actual) Mill Feed ( dmt ) Cu and Zn Recoveries (%)
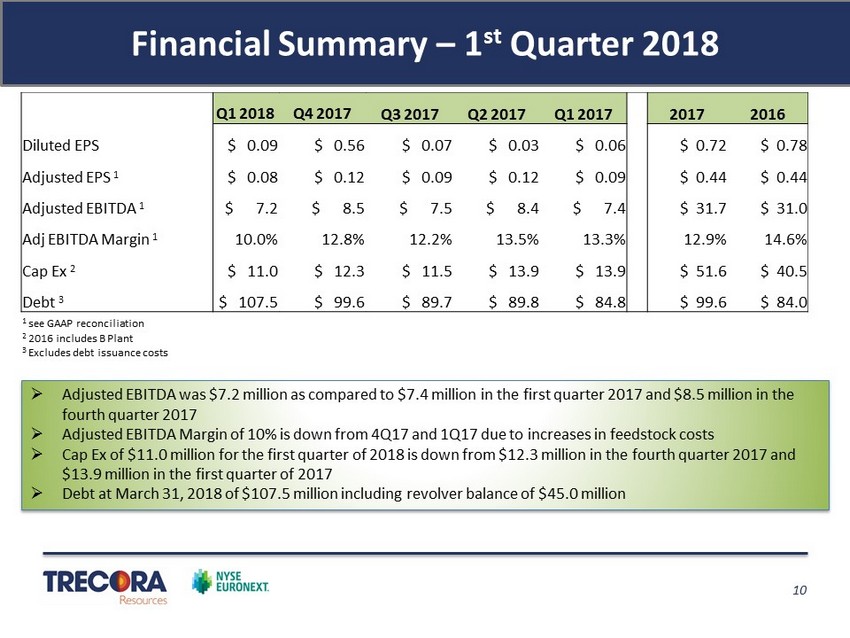
10 Financial Summary – 1 st Quarter 2018 » Adjusted EBITDA was $7.2 million as compared to $7.4 million in the first quarter 2017 and $8.5 million in the fourth quarter 2017 » Adjusted EBITDA Margin of 10% is down from 4Q17 and 1Q17 due to increases in feedstock costs » Cap Ex of $11.0 million for the first quarter of 2018 is down from $12.3 million in the fourth quarter 2017 and $13.9 million in the first quarter of 2017 » Debt at March 31, 2018 of $107.5 million including revolver balance of $45.0 million Q1 2018 Q4 2017 Q3 2017 Q2 2017 Q1 2017 2017 2016 Diluted EPS $ 0.09 $ 0.56 $ 0.07 $ 0.03 $ 0.06 $ 0.72 $ 0.78 Adjusted EPS 1 $ 0.08 $ 0.12 $ 0.09 $ 0.12 $ 0.09 $ 0.44 $ 0.44 Adjusted EBITDA 1 $ 7.2 $ 8.5 $ 7.5 $ 8.4 $ 7.4 $ 31.7 $ 31.0 Adj EBITDA Margin 1 10.0% 12.8% 12.2% 13.5% 13.3% 12.9% 14.6% Cap Ex 2 $ 11.0 $ 12.3 $ 11.5 $ 13.9 $ 13.9 $ 51.6 $ 40.5 Debt 3 $ 107.5 $ 99.6 $ 89.7 $ 89.8 $ 84.8 $ 99.6 $ 84.0 1 see GAAP reconciliation 2 2016 includes B Plant 3 Excludes debt issuance costs

11 Petrochemical Revenue & Volume Summary - 5 10 15 20 25 30 $0 $10 $20 $30 $40 $50 $60 $70 1Q15 2Q15 3Q15 4Q15 1Q16 2Q16 3Q16 4Q16 1Q17 2Q17 3Q17 4Q17 1Q18 Gallons Revenue Petrochemical Sales Revenue and Volume (in millions) Prime Byproducts Revenue

12 Petrochemical Feed Cost Summary Jan-15 Apr-15 Jul-15 Oct-15 Jan-16 Apr-16 Jul-16 Oct-16 Jan-17 Apr-17 Jul-17 Oct-17 Jan-18 Apr-18 Processed Feedstock Cost versus Market Price (per gallon) Processed Cost Market

13 Trecora Chemical: Wax Volume and Revenue (in thousands) - 2,000 4,000 6,000 8,000 10,000 12,000 $- $1,000 $2,000 $3,000 $4,000 $5,000 $6,000 $7,000 1Q15 2Q15 3Q15 4Q15 1Q16 2Q16 3Q16 4Q16 1Q17 2Q17 3Q17 4Q17 1Q18 Volume Revenue Wax Revenues($) Wax Volume (Lbs)

14 SHR and TC Custom Processing Revenue (in thousands) $- $1,000 $2,000 $3,000 $4,000 $5,000 $6,000 1Q15 2Q15 3Q15 4Q15 1Q16 2Q16 3Q16 4Q16 1Q17 2Q17 3Q17 4Q17 1Q18 SHR TC

15 Closing Remarks » Solid quarter as revenue and product volume growth from Q4 reflect focus on operational execution • Q1 Prime product volume growth of 27.1% year over year and 3.1% sequentially • Q1 revenue declined 0.7% at TC year over year but increased 19.7% versus 4Q17 • AMAK Mine operations delivered equity in earnings of $0.2 million in 1Q18 » Industry opportunities • Expanding petrochemical production capacity • Stronger demand from polyethylene manufacturers • Custom processing demand remains high • New PE plant starting up; second oil sands mine revenues expected second half of 2018 » Catalysts to drive revenue and profitability growth for the balance of 2018 • People and process changes at TC designed to sharpen focus on production and day - to - day execution • Advanced Reformer unit at SHR expected to be commissioned in Q3 – will increase byproduct value driving margins higher • Continued progress on hydrogenation/distillation unit at TC will contribute to revenue growth • AMAK contributing equity in earnings – continued operating improvements enhance the opportunity for monetization of investment in mine

16 Q&A Thank You Please visit our websites: www.trecora.com www.southhamptonr.com www.TrecChem.com www.amak.com.sa

17 Appendix RECONCILIATION OF SELECTED GAAP MEASURES TO NON - GAAP MEASURES (1) (1) This presentation includes non - GAAP measures. Our non - GAAP measures are not meant to be considered in isolation or as a substitute for comparable GAAP measures and should be read only in conjunction with our consolidated financial statements prepared in accordance with GAAP. (2) Statutory tax rate of 35% used for 1Q17, 2Q17, 3Q17, FY16 and 21% used for 4Q17, FY2017, 1Q18 3/31/18 12/31/17 9/30/17 6/30/17 3/31/17 12/31/17 12/31/16 NET INCOME $ 2,352 $ 13,972 $ 1,718 $ 832 $ 1,487 $ 18,009 $ 19,428 Bargain purchase gain - - - - - - 11,549 Equity in earnings (losses) of AMAK/Gain on equity issuance 230 900 (897) (3,298) (966) (4,261) 1,689 Taxes at statutory rate (2) (48) (189) 314 1,154 338 895 (4,633) Tax effected equity in AMAK 182 711 (583) (2,144) (628) (3,366) $8,605 Tax rate change $10,307 $10,307 Diluted weighted average number of shares 25,231 25,202 25,157 25,034 25,054 25,129 24,982 Estimated effect on diluted EPS $0.01 $0.44 ($0.02) ($0.09) ($0.03) $0.28 $0.34 Diluted EPS $0.09 $0.56 $0.07 $0.03 $0.06 $0.72 $0.78 Adjusted EPS $0.08 $0.12 $0.09 $0.12 $0.09 $0.44 $0.44 3/31/18 12/31/17 9/30/17 6/30/17 3/31/17 12/31/17 12/31/16 NET INCOME (LOSS) 2,352$ 13,972$ 1,718$ 832$ 1,487$ 18,009$ 19,428$ Interest 878 822 795 678 636 2,931 1,985 Taxes 590 (9,129) 577 332 1,061 (7,159) 10,504 Depreciation and amortization 196 217 246 205 204 872 761 Depreciation and amortization in cost of sales 2,829 2,778 2,564 2,363 2,384 10,089 9,016 EBITDA 6,846 8,660 5,900 4,410 5,772 24,742 41,694 Share based compensation 592 702 716 656 633 2,707 2,552 Bargain purchase gain - - - - - - (11,549) Gain from additional equity issuance by AMAK - - - - - - (3,168) Equity in losses of AMAK (230) (900) 897 3,298 966 4,261 1,479 Adjusted EBITDA 7,208$ 8,462$ 7,513$ 8,364$ 7,371$ 31,710$ 31,008$ Revenue 71,741 65,978 61,508 62,115 55,542 245,143 212,399 Adjusted EBITDA Margin (adjusted EBITDA/revenue) 10.0% 12.8% 12.2% 13.5% 13.3% 12.9% 14.6% Twelve months ended Twelve months ended Three months ended Three months ended