Form 8-K Dell Technologies Inc For: Apr 26
UNITED STATES
SECURITIES AND EXCHANGE COMMISSION
Washington, D.C. 20549
______________________
FORM 8-K
______________________
CURRENT REPORT
Pursuant to Section 13 or 15(d)
of the Securities Exchange Act of 1934
Date of Report (Date of earliest event reported): April 26, 2018
______________________
Dell Technologies Inc.
(Exact name of registrant as specified in its charter)
______________________
Delaware | 001-37867 | 80-0890963 | ||
(State or other jurisdiction of incorporation) | (Commission File Number) | (I.R.S. Employer Identification No.) | ||
One Dell Way Round Rock, Texas | 78682 | |
(Address of principal executive offices) | (Zip Code) | |
Registrant’s telephone number, including area code: (800) 289-3355
Not Applicable
(Former name or former address, if changed since last report)
______________________
Check the appropriate box below if the Form 8-K filing is intended to simultaneously satisfy the filing obligation of the registrant under any of the following provisions:
☐ | Written communications pursuant to Rule 425 under the Securities Act (17 CFR 230.425) |
☐ | Soliciting material pursuant to Rule 14a-12 under the Exchange Act (17 CFR 240.14a-12) |
☐ | Pre-commencement communications pursuant to Rule 14d-2(b) under the Exchange Act (17 CFR 240.14d-2(b)) |
☐ | Pre-commencement communications pursuant to Rule 13e-4(c) under the Exchange Act (17 CFR 240.13e-4(c)) |
Indicate by check mark whether the registrant is an emerging growth company as defined in Rule 405 of the Securities Act of 1933 (§230.405 of this chapter) or Rule 12b-2 of the Securities Exchange Act of 1934 (§240.12b-2 of this chapter). | ||||
Emerging growth company ¨ | ||||
If an emerging growth company, indicate by check mark if the registrant has elected not to use the extended transition period for complying with any new or revised financial accounting standards provided pursuant to Section 13(a) of the Exchange Act. ¨ | ||||
Item 7.01. Regulation FD Disclosure
Effective February 3, 2018, Dell Technologies Inc. (the “Company”) adopted the new accounting standard for revenue recognition set forth in ASC 606, “Revenue From Contracts With Customers.” The Company is furnishing this Current Report on Form 8-K to present certain of the Company's previously reported financial information on a basis consistent with the new standard. Beginning with the quarter ending May 4, 2018, the Company’s financial information will reflect adoption of the standard with prior periods adjusted accordingly.
Revenue from Contracts with Customers
In May 2014, the Financial Accounting Standards Board (the "FASB") issued amended guidance on the recognition of revenue from contracts with customers. The objective of the new standard is to establish a single comprehensive model for entities to use in accounting for revenue arising from contracts with customers and will supersede substantially all of the existing revenue recognition guidance, including industry-specific guidance. The new standard requires entities to recognize revenue when it transfers promised goods or services to customers in an amount that reflects the consideration to which the entity expects to be entitled in exchange for those goods or services. Further, the new standard requires additional disclosures to help enable users of the financial statements to better understand the nature, amount, timing, risks, and judgments related to revenue recognition and related cash flows from contracts with customers. Concurrently, the FASB issued guidance on the accounting for costs to fulfill or obtain a customer contract. The Company elected to adopt the new standards effective February 3, 2018 using the full retrospective method, which requires the Company to recast each prior period presented consistent with the new guidance.
Adoption of the new standard will have a material impact on the Company's Consolidated Financial Statements. The most significant changes are the following:
• | Software license revenue. Before adoption of the standard, the Company deferred revenue for certain software arrangements due to the absence of vendor specific objective evidence ("VSOE") of fair value for all or a portion of the deliverables. Under the new standard, the Company will no longer be required to establish VSOE of fair value in order to account for elements in an arrangement as separate units of accounting, and will be able to record revenue upon satisfaction of each performance obligation, resulting in more up-front recognition of software license revenue. |
In addition, before adoption of the standard, the Company accounted for third-party software licenses and post-contract customer support ("PCS") as a single unit of account, because it does not have VSOE of fair value for PCS in most cases. Thus, the Company presented the entire arrangement for the software license and PCS together in services revenue and cost of services revenue. Under the new standard, the Company will separate the value of the license from the value of the PCS. The license value will be recognized upon delivery and the PCS will be recognized over the related contractual term. For presentation purposes, the license revenue and cost of net revenue will be recorded in products, and the PCS revenue and cost of net revenue will be recorded in services on the Company’s Consolidated Statement of Income (Loss).
• | Variable consideration. The Company will estimate the transaction price for elements of consideration which are variable, primarily customer rebates. This consideration will then be recognized to the Consolidated Statement of Income (Loss) commensurate with the timing of the performance obligation to which it is related. |
• | Extended warranty revenue. For contracts that include both hardware and extended warranty, the new standard will result in more of the aggregate transaction price being allocated to the hardware and less to extended warranty, because the Company will no longer defer revenue based on the separately stated price of the extended warranty provided under the contract. With more of the transaction price being allocated to the hardware, more revenue under these arrangements will be recognized earlier, upon shipment of the hardware. |
• | Costs to obtain a contract. Within the scope of the new accounting standard, the FASB issued additional accounting guidance for certain costs related to a contract with a customer. In particular, the guidance relates to the incremental costs of obtaining a contract with a customer and costs incurred in fulfilling a contract with a customer. For contracts over one year, the Company will capitalize proportional sales commission costs, including bonuses associated with goal attainment, and will amortize these costs over their expected period of benefit. |
2
The impacts to the opening Consolidated Statement of Financial Position are summarized as follows:
• | Accounts receivable, net. The adoption of the new revenue standard will result in an increase to accounts receivable, net primarily due to the following two factors: |
First, the return rights provision, which represents an estimate of expected customer returns currently presented as a reduction of accounts receivable, net, will instead be presented outside of accounts receivable, net in two separate balance sheet line items. A liability will be recorded in accrued and other for the estimated value of the sales amounts to be returned to the customer, and an asset will be recorded in other current assets representing the cost of the inventory estimated to be returned.
Second, the standard provides new guidance regarding transfer of control of goods to the customer. Under these new guidelines, the Company has determined that for certain hardware contracts in the United States, transfer of control and recognition of revenue can occur earlier. This will result in an increase in accounts receivable, net and a decrease in the in-transit deferral recorded in other current assets.
• | Other assets. The adoption of the standard will result in an increase in other assets due to capitalization of the costs to obtain a contract, as well as the accounts receivable, net of impacts discussed above. |
• | Deferred revenue. The adoption of the standard will result in a decline in deferred revenue due to earlier recognition of revenue for software licenses, and less of aggregate transaction price being allocated to extended warranty. This reduction will be partially offset by an increase resulting from the change in presentation of deferred costs on third-party software offerings, which are routinely sold as an attached component of the Company's hardware offering. |
Selected Financial Information
Exhibit 99.1 to this report presents selected financial information recast on a basis consistent with the new standard.
Conference Call
The Company will conduct a conference call Thursday, April 26, 2018, at 7 a.m. CST to discuss the impact of the new standard. The conference call will be available to the public as a live, audio-only webcast on the Company's website at investors.delltechnologies.com; an archived version will be available at the same location for one year.
In accordance with General Instruction B.2 of Form 8-K, the information in this Current Report on Form 8-K, shall not be deemed to be “filed” for purposes of Section 18 of the Securities Exchange Act of 1934, as amended (the “Exchange Act”), or otherwise subject to the liability of that section, and shall not be incorporated by reference into any registration statement or other document filed under the Securities Act of 1933, as amended, or the Exchange Act, except as shall be expressly set forth by specific reference in such filing
Item 9.01 Financial Statements and Exhibits.
(d) Exhibits.
The following document is herewith furnished as an exhibit to this report:
Exhibit Number | Exhibit Description | |
3
SIGNATURES
Pursuant to the requirements of the Securities Exchange Act of 1934, the registrant has duly caused this report to be signed on its behalf by the undersigned hereunto duly authorized.
Date: April 26, 2018 | Dell Technologies Inc. | ||||
By: | /s/ Janet Bawcom | ||||
Janet Bawcom Senior Vice President and Assistant Secretary | |||||
(Duly Authorized Officer) | |||||
4

New Accounting Standard
Revenue Recognition
April 26, 2018

2
Legal note
Non-GAAP Financial Measures
This presentation includes information about non-GAAP revenue, non-GAAP gross margin, non-GAAP operating expenses, non-GAAP operating income, EBITDA and adjusted EBITDA
(collectively the “non-GAAP financial measures”), which are not measurements of financial performance prepared in accordance with US generally accepted accounting principles. We
have provided a reconciliation of the historical non-GAAP financial measures to the most directly comparable GAAP measures in the slides captioned “Supplemental Non-GAAP
Measures” in Appendix C.
Special Note on Forward Looking Statements
Statements in this presentation that relate to future results and events are forward-looking statements and are based on Dell Technologies’ current expectations. In some cases, you can
identify these statements by such forward-looking words as “anticipate,” “believe,” “could,” “estimate,” “expect,” “intend,” “confidence,” “may,” “plan,” “potential,” “should,” “will” and
“would,” or similar expressions. Actual results and events in future periods may differ materially from those expressed or implied by these forward-looking statements because of a
number of risks, uncertainties and other factors, including those discussed in Dell Technologies’ periodic reports filed with the Securities and Exchange Commission. We assume no
obligation to update our forward-looking statements.
Special Note on the Divestitures
During Fiscal 2017, we closed the Dell Services, Dell Software Group (DSG), and Enterprise Content Division (ECD) divestiture transactions. We received total cash consideration of
approximately $7.0 billion from the divestitures and recorded a gain on sale, net of tax, of approximately $1.9 billion. Accordingly, the results of operations of Dell Services, DSG and
ECD, as well as the related gains or losses on sale, have been excluded from the results of continuing operations in the periods presented.

3
Agenda
ASC 606 Overview and Impact to Dell Technologies
Recast Consolidated Financial Results
Recast Business Unit Financial Results
Appendices
4
Considerations in Financial Reporting
• Dell Technologies has adopted ASC 606, Revenue From Contracts With Customers, in the first quarter of FY’19.
• GAAP results will include substantial non-cash purchase accounting for the next several years related to the EMC
acquired businesses.
• An assessment of the tax impact of ASC 606 is still in process, and therefore, only operating income/(loss) and
selected balance sheet amounts have been included and Consolidated Statement of Financial Position, cash flows,
and net income have been excluded from this presentation.
• VMware business unit results, which reflect the operations of VMware, Inc. within Dell Technologies, are different from
VMware, Inc.’s results on a stand-alone basis.
• FY’17 includes results of the EMC acquired businesses, including VMware, as of the date of acquisition (September
7, 2016).
• FY’17 financial results are presented on a continuing operations basis and exclude the results of operations and
related gains or losses associated with the divestiture transactions.
• FY’17 was a 53-week year relative to FY’18, which was a typical 52-week year.

5
Overview of New Standard and Impact to FY’18
1 As Reported is defined as ASC 605, Revenue, and related guidance used for financial reporting prior to adoption of ASC 606, Revenue from Contracts with Customers.
Net revenue change (FY’18)
+$0.4 billion
<1% vs. As Reported1
Gross margin change (FY’18)
+$0.5 billion
+2.4% vs. As Reported1
Operating loss change (FY’18)
+$0.9 billion
+27.5% vs. As Reported1
Periods covered
• FY’18 and FY’17 recast for comparability
• EMC acquired businesses included as of the acquisition date, Sept. 7, 2016
• Impacts prior to FY’17 recorded into retained earnings
No change
• Bookings
• Customer billings
• Total operating cash flow
• Timing of revenue recognition for product hardware and services
Primary changes
Income Statement change:
• Revenue value allocation and timing
– Software License Offerings
– Third-party Software
– Extended Warranty Revenue
– Customer Rebates
• Timing of sales commissions
Balance Sheet change:
• Deferred revenue impact commensurate with earlier
revenue recognition
• Gross presentation of certain deferred costs and return
rights
6
As Reported Upfront Revenue
Recognition
Recast to Prior
Years
As Recast
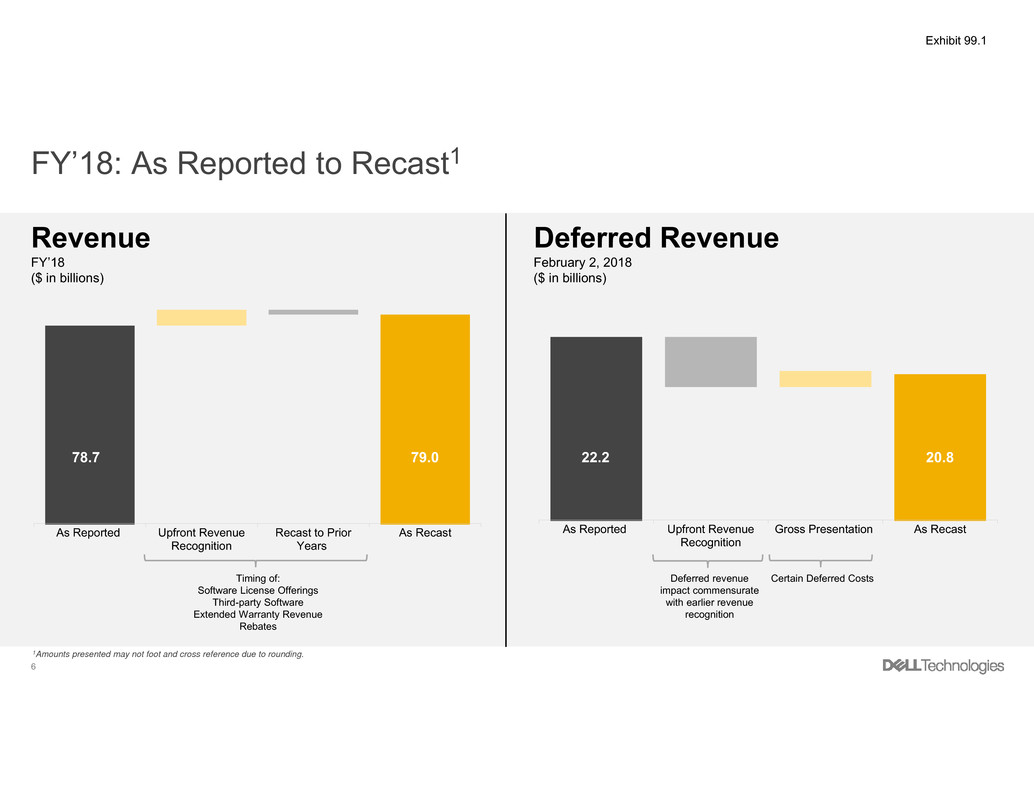
FY’18: As Reported to Recast1
Revenue
FY’18
($ in billions)
Deferred Revenue
February 2, 2018
($ in billions)
79.078.7
Timing of:
Software License Offerings
Third-party Software
Extended Warranty Revenue
Rebates
1Amounts presented may not foot and cross reference due to rounding.
As Reported Upfront Revenue
Recognition
Gross Presentation As Recast
20.822.2
Deferred revenue
impact commensurate
with earlier revenue
recognition
Certain Deferred Costs

7
Consolidated Results1,2
1 Results presented on a continuing operations basis. Historical results prior to 3Q’17 do not include EMC acquired businesses.
2 See Appendix C for reconciliation of Non-GAAP to GAAP measures.
3 Non-GAAP FY’17 revenue includes a one-time $28 million ASC 606 impact to purchase accounting associated with the going-private transaction.
Adjustments to reconcile Non-GAAP to
GAAP are unchanged in FY’18 under
ASC 606
There is no change to recognition of cost
as a result of the new standard
GAAP operating loss and Non-GAAP
operating income improved under ASC
606 due to an increase in upfront
revenue recognition and a decrease in
operating expenses due to the deferral of
commissions
Under ASC 606:
• Commissions with contracts >1 year are
capitalized and amortized typically over 3
to 7 years; on average over 36 months
• Rebates are deferred and amortized on
average over 36 months
3
Primary Changes
GAAP
$ in millions
As
Reported
As
Recast
Change
($)
As
Reported
As
Recast
Change
($)
As
Reported
As
Recast
Revenue 61,642 62,164 522 78,660 79,040 380 27.6% 27.1%
Gross margin 12,959 13,649 690 20,054 20,537 483 54.7% 50.5%
GM % of revenue 21.0% 22.0% +90 bps 25.5% 26.0% +50 bps +450 bps +400 bps
Operating loss (3,252) (2,390) 862 (3,333) (2,416) 917 (2.5%) (1.1%)
Operating loss % of revenue (5.3%) (3.8%) +140 bps (4.2%) (3.1%) +120 bps +100 bps +80 bps
FY'17 FY'18 Y/Y
Non-GAAP
$ in millions
As
Reported
As
Recast
Change
($)
As
Reported
As
Recast
Change
($)
As
Reported
As
Recast
Revenue3 62,822 63,316 494 79,929 80,309 380 27.2% 26.8%
Gross margin 16,819 17,481 662 25,185 25,668 483 49.7% 46.8%
GM % of revenue 26.8% 27.6% +80 bps 31.5% 32.0% +50 bps +470 bps +440 bps
Operating income 5,113 5,947 834 6,855 7,772 917 34.1% 30.7%
Operating income % of revenue 8.1% 9.4% +130 bps 8.6% 9.7% +110 bps +40 bps +30 bps
Adjusted EBITDA 5,941 6,775 834 8,217 9,134 917 38.3% 34.8%
Adj EBITDA % of revenue 9.5% 10.7% +120 bps 10.3% 11.4% +110 bps +80 bps +70 bps
FY'17 FY'18 Y/Y
8
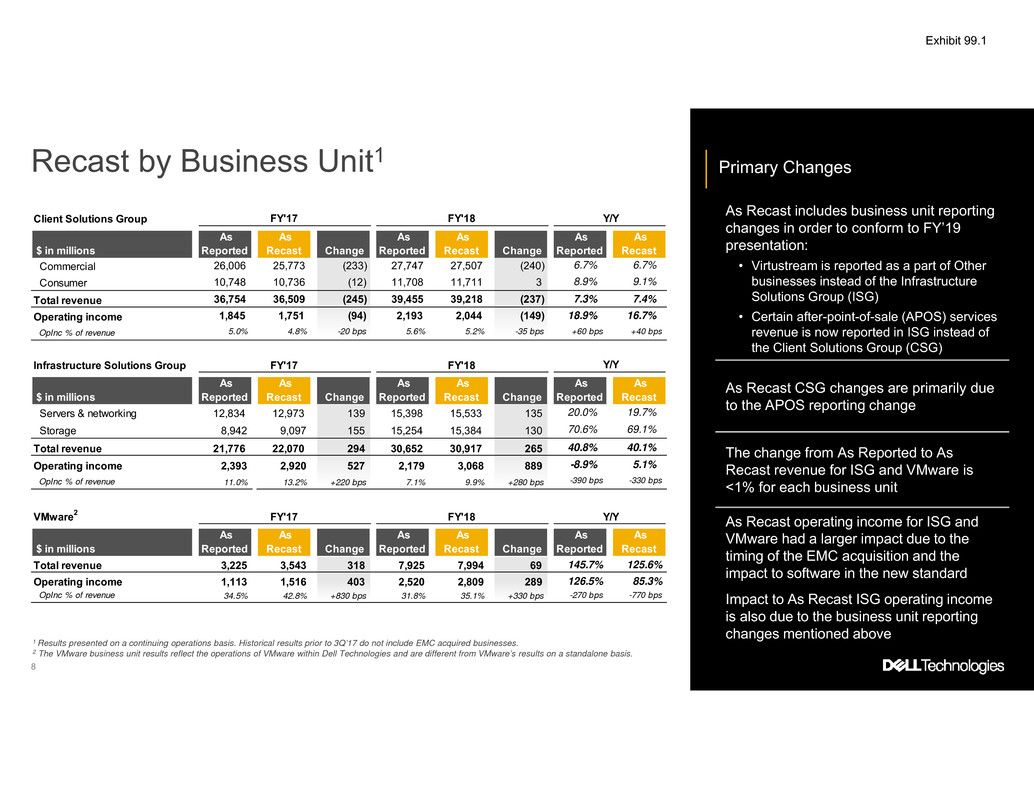
Recast by Business Unit1
1 Results presented on a continuing operations basis. Historical results prior to 3Q’17 do not include EMC acquired businesses.
2 The VMware business unit results reflect the operations of VMware within Dell Technologies and are different from VMware’s results on a standalone basis.
Primary Changes
As Recast includes business unit reporting
changes in order to conform to FY’19
presentation:
• Virtustream is reported as a part of Other
businesses instead of the Infrastructure
Solutions Group (ISG)
• Certain after-point-of-sale (APOS) services
revenue is now reported in ISG instead of
the Client Solutions Group (CSG)
As Recast CSG changes are primarily due
to the APOS reporting change
The change from As Reported to As
Recast revenue for ISG and VMware is
<1% for each business unit
As Recast operating income for ISG and
VMware had a larger impact due to the
timing of the EMC acquisition and the
impact to software in the new standard
Impact to As Recast ISG operating income
is also due to the business unit reporting
changes mentioned above
Infrastructure Solutions Group
$ in millions
As
Reported
As
Recast Change
As
Reported
As
Recast Change
As
Reported
As
Recast
Servers & networking 12,834 12,973 139 15,398 15,533 135 20.0% 19.7%
Storage 8,942 9,097 155 15,254 15,384 130 70.6% 69.1%
Total revenue 21,776 22,070 294 30,652 30,917 265 40.8% 40.1%
Operating income 2,393 2,920 527 2,179 3,068 889 -8.9% 5.1%
OpInc % of revenue 11.0% 13.2% +220 bps 7.1% 9.9% +280 bps -390 bps -330 bps
FY'17 FY'18 Y/Y
Client Solutions Group
$ in millions
As
Reported
As
Recast Change
As
Reported
As
Recast Change
As
Reported
As
Recast
Commercial 26,006 25,773 (233) 27,747 27,507 (240) 6.7% 6.7%
Consumer 10,748 10,736 (12) 11,708 11,711 3 8.9% 9.1%
Total revenue 36,754 36,509 (245) 39,455 39,218 (237) 7.3% 7.4%
Operating income 1,845 1,751 (94) 2,193 2,044 (149) 18.9% 16.7%
OpInc % of revenue 5.0% 4.8% -20 bps 5.6% 5.2% -35 bps +60 bps +40 bps
FY'17 FY'18 Y/Y
VMware2
$ in millions
As
Reported
As
Recast Change
As
Reported
As
Recast Change
As
Reported
As
Recast
Total revenue 3,225 3,543 318 7,925 7,994 69 145.7% 125.6%
Operating income 1,113 1,516 403 2,520 2,809 289 126.5% 85.3%
OpInc % of revenue 34.5% 42.8% +830 bps 31.8% 35.1% +330 bps -270 bps -770 bps
FY'17 FY'18 Y/Y

9
10
Appendix A
New Accounting Standard ASC 606 Examples

11
Example: Product and Software Solution Offering
Income Statement change
• Revenue value allocation between products
and services
• More upfront revenue and less deferred
• Less value assigned to software
maintenance
Balance Sheet change
• Deferred revenue impact commensurate
with earlier revenue recognition
No change
• Customer billings and cash flows
• Timing of revenue recognition for hardware
Year 1 Year 2 Year 3
Customer billings 3,800
Product revenue 2,600 - -
Services revenue 400 400 400
Deferred revenue 800 400 -
Example impact on revenue recognition
A solution that includes hardware, software licenses, software maintenance, and other software elements.
As Reported As Recast
Year 1 Year 2 Year 3
Customer billings 3,800
Product revenue 3,000 - -
Services revenue 266 267 267
Deferred revenue 534 267 -
Reason for change
ASC 605 included specific transaction value allocation rules for software and software-related elements. This generally resulted in a higher amount of value in the arrangement to be deferred and recognized over time
in services revenue. ASC 606 changed the specific software allocation rules and, as a result, discounts in arrangements will be allocated to product and services performance obligations based on their respective fair
values, thereby increasing product revenue and decreasing services revenue. Timing of the separate performance obligations will be recognized upon transfer of control.
12
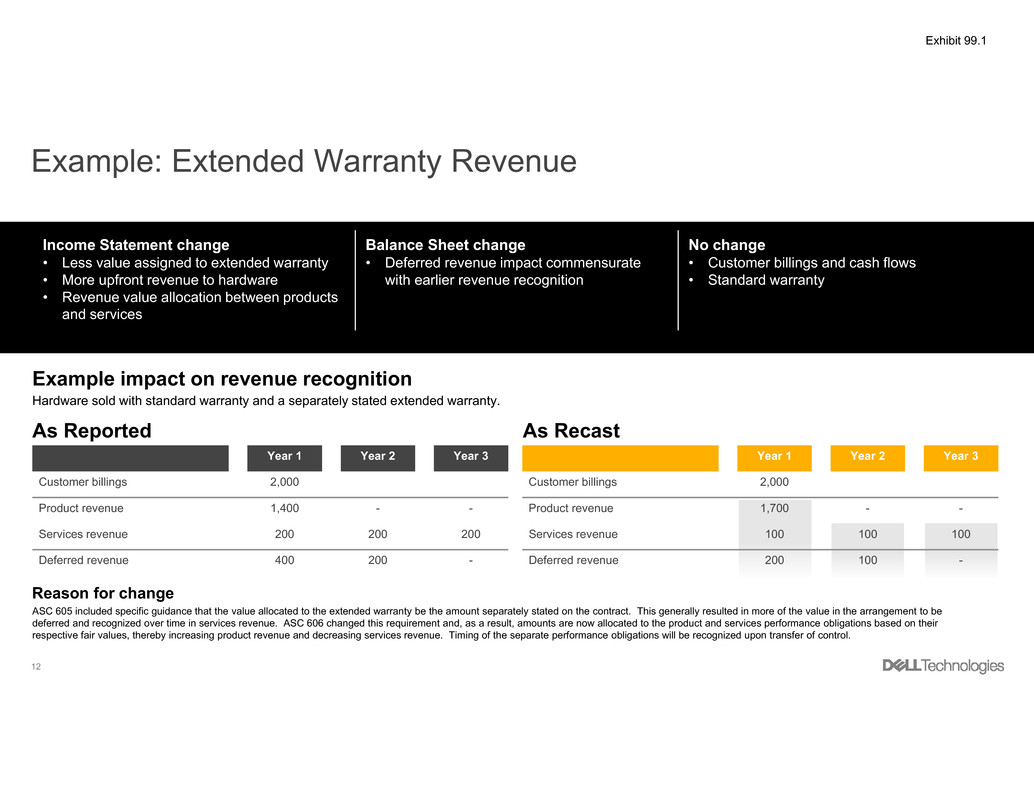
Example: Extended Warranty Revenue
Year 1 Year 2 Year 3
Customer billings 2,000
Product revenue 1,400 - -
Services revenue 200 200 200
Deferred revenue 400 200 -
Income Statement change
• Less value assigned to extended warranty
• More upfront revenue to hardware
• Revenue value allocation between products
and services
Balance Sheet change
• Deferred revenue impact commensurate
with earlier revenue recognition
No change
• Customer billings and cash flows
• Standard warranty
Hardware sold with standard warranty and a separately stated extended warranty.
As Reported As Recast
ASC 605 included specific guidance that the value allocated to the extended warranty be the amount separately stated on the contract. This generally resulted in more of the value in the arrangement to be
deferred and recognized over time in services revenue. ASC 606 changed this requirement and, as a result, amounts are now allocated to the product and services performance obligations based on their
respective fair values, thereby increasing product revenue and decreasing services revenue. Timing of the separate performance obligations will be recognized upon transfer of control.
Reason for change
Example impact on revenue recognition
Year 1 Year 2 Year 3
Customer billings 2,000
Product revenue 1,700 - -
Services revenue 100 100 100
Deferred revenue 200 100 -

13
Example: Third-Party Software
Year 1 Year 2 Year 3
Customer billings 600
Product revenue - - -
Services revenue 200 200 200
Deferred revenue 400 200 -
Income Statement change
• Revenue value allocation between products
and services
• Cost of revenue allocation between products
and services
• More upfront revenue and cost of revenue
Balance Sheet change
• Deferred revenue impact commensurate
with earlier revenue recognition
• Gross presentation of certain deferred costs
No change
• Customer billings and cash flows
• Timing of revenue recognition for software
maintenance
Third-party software sold to customer with software maintenance provided over three years.
Example impact on revenue recognition
ASC 605 includes valuation allocation and separation criteria (e.g., vendor specific evidence of fair value (VSOE)) to separate software license value from the software maintenance value. Dell generally did not
meet the separation criteria for third-party software, causing the value of the entire arrangement to be deferred and recognized over time in services revenue. ASC 606 eliminated the separation criteria and now
the value of the license will be separated from the value of the software maintenance. The license value will be recognized in product revenue and the value of the software maintenance will continue to be
recognized in services revenue. Timing of the separate performance obligations will be recognized upon transfer of control.
Reason for change
As Reported As Recast
Year 1 Year 2 Year 3
Customer billings 600
Product revenue 400 - -
Services revenue 67 67 66
Deferred revenue 133 67 -
14
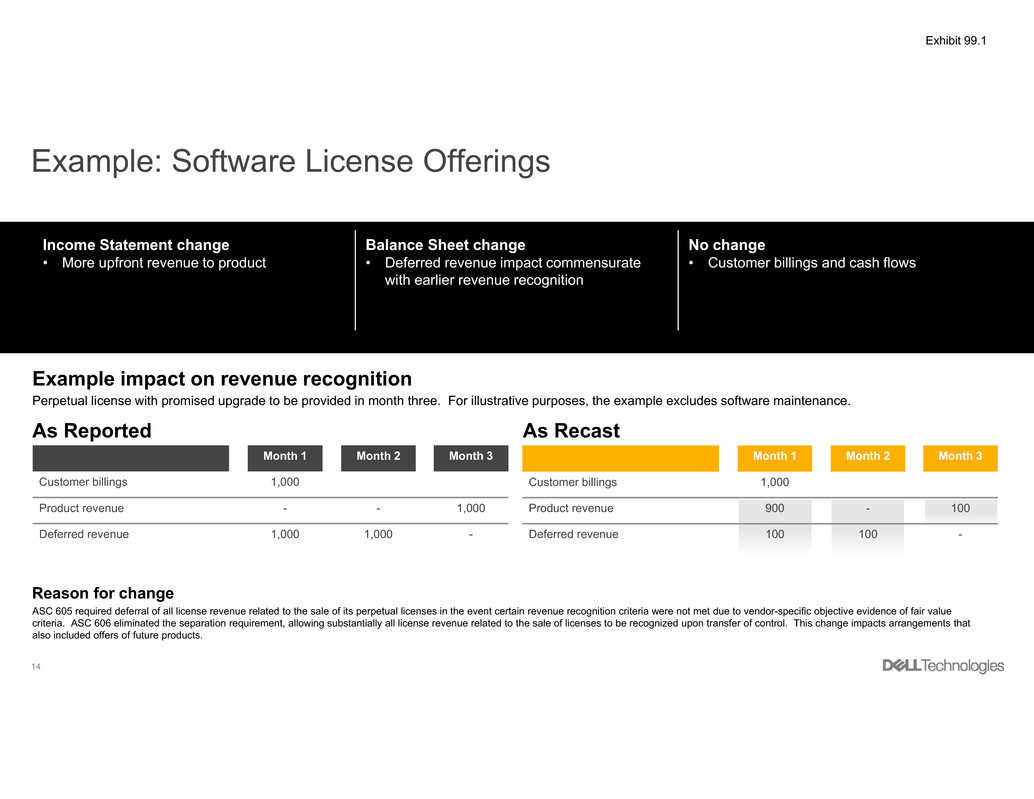
Example: Software License Offerings
Month 1 Month 2 Month 3
Customer billings 1,000
Product revenue - - 1,000
Deferred revenue 1,000 1,000 -
Perpetual license with promised upgrade to be provided in month three. For illustrative purposes, the example excludes software maintenance.
ASC 605 required deferral of all license revenue related to the sale of its perpetual licenses in the event certain revenue recognition criteria were not met due to vendor-specific objective evidence of fair value
criteria. ASC 606 eliminated the separation requirement, allowing substantially all license revenue related to the sale of licenses to be recognized upon transfer of control. This change impacts arrangements that
also included offers of future products.
Example impact on revenue recognition
Reason for change
As Reported As Recast
Month 1 Month 2 Month 3
Customer billings 1,000
Product revenue 900 - 100
Deferred revenue 100 100 -
Income Statement change
• More upfront revenue to product
Balance Sheet change
• Deferred revenue impact commensurate
with earlier revenue recognition
No change
• Customer billings and cash flows

15
Example: Term-based Software Licenses
Year 1 Year 2 Year 3
Customer billings 1,200
Product revenue 300 300 300
Services revenue 100 100 100
Deferred revenue 800 400 -
Dell-owned term-based software license sold to customer with software maintenance provided over three years.
Example impact on revenue recognition
Like third-party software, ASC 605 included valuation allocation and separation criteria (VSOE) to separate software license value from software maintenance value. Dell generally did not meet the separation
criteria for Dell-owned term-based software licenses, causing the value of the entire arrangement to be deferred and recognized over time in services revenue. With elimination of separation criteria, value of the
license will be separated from the value of the software maintenance in most cases. The license value will be recognized in product revenue and the value of the software maintenance will continue to be
recognized in services revenue. Timing of the separate performance obligations will be recognized upon transfer of control.
Reason for change
As Reported As Recast
Year 1 Year 2 Year 3
Customer billings 1,200
Product revenue 900 - -
Services revenue 100 100 100
Deferred revenue 200 100 -
Income Statement change
• Revenue value allocation between products
and services
• More upfront revenue recognized on transfer
of control of the license
Balance Sheet change
• Deferred revenue impact commensurate
with earlier revenue recognition
No change
• Customer billings and cash flows
• Timing of revenue recognition for software
maintenance arrangements

16
Appendix B
Supplemental financial results

17
Recast Income Statement Summary1,2
1 Results presented on a continuing operations basis. Historical results prior to 3Q’17 do not include EMC acquired businesses.
2 See Appendix C for reconciliation of Non-GAAP to GAAP measures.
3 Non-GAAP FY’17 revenue includes a one-time $28 million ASC 606 impact to purchase accounting associated with the going-private transaction.
GAAP
($ in millions) FY'17 1Q'18 2Q'18 3Q'18 4Q'18 FY'18 FY'17 1Q'18 2Q'18 3Q'18 4Q'18 FY'18 FY'17 1Q'18 2Q'18 3Q'18 4Q'18 FY'18
Products 48,706 12,968 14,355 14,680 16,798 58,801 51,057 13,634 15,102 15,120 17,395 61,251 2,351 666 747 440 597 2,450
Services 12,936 4,848 4,944 4,930 5,137 19,859 11,107 4,366 4,419 4,436 4,568 17,789 (1,829) (482) (525) (494) (569) (2,070)
Revenue 61,642 17,816 19,299 19,610 21,935 78,660 62,164 18,000 19,521 19,556 21,963 79,040 522 184 222 (54) 28 380
Products 42,169 11,459 12,378 12,369 14,009 50,215 43,388 11,823 12,775 12,573 14,262 51,433 1,219 364 397 204 253 1,218
Services 6,514 2,055 2,112 2,078 2,146 8,391 5,127 1,720 1,778 1,763 1,809 7,070 (1,387) (335) (334) (315) (337) (1,321)
Cost of revenue 48,683 13,514 14,490 14,447 16,155 58,606 48,515 13,543 14,553 14,336 16,071 58,503 (168) 29 63 (111) (84) (103)
Products 6,537 1,509 1,977 2,311 2,789 8,586 7,669 1,811 2,327 2,547 3,133 9,818 1,132 302 350 236 344 1,232
Services 6,422 2,793 2,832 2,852 2,991 11,468 5,980 2,646 2,641 2,673 2,759 10,719 (442) (147) (191) (179) (232) (749)
Gross margin 12,959 4,302 4,809 5,163 5,780 20,054 13,649 4,457 4,968 5,220 5,892 20,537 690 155 159 57 112 483
GM as % of revenue 21.0% 24.1% 24.9% 26.3% 26.4% 25.5% 22.0% 24.8% 25.4% 26.7% 26.8% 26.0% 0.9% 0.6% 0.5% 0.4% 0.5% 0.5%
Operating expenses 16,211 5,802 5,788 5,696 6,101 23,387 16,039 5,729 5,633 5,630 5,961 22,953 (172) (73) (155) (66) (140) (434)
Operating loss (3,252) (1,500) (979) (533) (321) (3,333) (2,390) (1,272) (665) (410) (69) (2,416) 862 228 314 123 252 917
OpInc (Loss) as % of revenue -5.3% -8.4% -5.1% -2.7% -1.5% -4.2% -3.8% -7.1% -3.4% -2.1% -0.3% -3.1% 1.4% 1.4% 1.7% 0.6% 1.1% 1.2%
Non-GAAP
($ in millions) FY'17 1Q'18 2Q'18 3Q'18 4Q'18 FY'18 FY'17 1Q'18 2Q'18 3Q'18 4Q'18 FY'18 FY'17 1Q'18 2Q'18 3Q'18 4Q'18 FY'18
Products 49,006 13,023 14,405 14,713 16,830 58,971 51,357 13,689 15,152 15,153 17,427 61,421 2,351 666 747 440 597 2,450
Services 13,816 5,148 5,229 5,192 5,389 20,958 11,959 4,666 4,704 4,698 4,820 18,888 (1,857) (482) (525) (494) (569) (2,070)
Revenue3 62,822 18,171 19,634 19,905 22,219 79,929 63,316 18,355 19,856 19,851 22,247 80,309 494 184 222 (54) 28 380
Products 39,660 10,494 11,436 11,440 13,072 46,442 40,879 10,858 11,833 11,644 13,325 47,660 1,219 364 397 204 253 1,218
Services 6,343 2,031 2,098 2,048 2,125 8,302 4,956 1,696 1,764 1,733 1,788 6,981 (1,387) (335) (334) (315) (337) (1,321)
Cost of revenue 46,003 12,525 13,534 13,488 15,197 54,744 45,835 12,554 13,597 13,377 15,113 54,641 (168) 29 63 (111) (84) (103)
Products 9,346 2,529 2,969 3,273 3,758 12,529 10,478 2,831 3,319 3,509 4,102 13,761 1,132 302 350 236 344 1,232
Services 7,473 3,117 3,131 3,144 3,264 12,656 7,003 2,970 2,940 2,965 3,032 11,907 (470) (147) (191) (179) (232) (749)
Gross margin 16,819 5,646 6,100 6,417 7,022 25,185 17,481 5,801 6,259 6,474 7,134 25,668 662 155 159 57 112 483
GM as % of revenue 26.8% 31.1% 31.1% 32.2% 31.6% 31.5% 27.6% 31.6% 31.5% 32.6% 32.1% 32.0% 0.8% 0.5% 0.5% 0.4% 0.5% 0.5%
Operating expenses 11,706 4,449 4,548 4,431 4,902 18,330 11,534 4,376 4,393 4,365 4,762 17,896 (172) (73) (155) (66) (140) (434)
Operating income 5,113 1,197 1,552 1,986 2,120 6,855 5,947 1,425 1,866 2,109 2,372 7,772 834 228 314 123 252 917
OpInc as % of revenue 8.1% 6.6% 7.9% 10.0% 9.5% 8.6% 9.4% 7.8% 9.4% 10.6% 10.7% 9.7% 1.3% 1.2% 1.5% 0.6% 1.1% 1.1%
Adjusted EBITDA 5,941 1,567 1,866 2,318 2,466 8,217 6,775 1,795 2,180 2,441 2,718 9,134 834 228 314 123 252 917
Adj EBITDA as % of revenue 9.5% 8.6% 9.5% 11.6% 11.1% 10.3% 10.7% 9.8% 11.0% 12.3% 12.2% 11.4% 1.2% 1.2% 1.5% 0.7% 1.1% 1.1%
As Reported As Recast Change
As Reported As Recast Change

18
Business Unit Revenue and Operating Income/(Loss) Summary1
1 Results presented on a continuing operations basis. Historical results prior to 3Q’17 do not include EMC acquired businesses.
2 The VMware business unit results reflect the operations of VMware within Dell Technologies and are different from VMware’s results on a standalone basis
$ in millions FY'17 1Q'18 2Q'18 3Q'18 4Q'18 FY'18 FY'17 1Q'18 2Q'18 3Q'18 4Q'18 FY'18
Revenue
CSG 36,754 9,056 9,851 9,959 10,589 39,455 36,509 9,048 9,866 9,829 10,475 39,218
ISG 21,776 6,916 7,406 7,518 8,812 30,652 22,070 6,961 7,467 7,535 8,954 30,917
VMware2 3,225 1,736 1,907 1,953 2,329 7,925 3,543 1,818 1,984 1,933 2,259 7,994
Reportable segment net revenue 61,755 17,709 19,164 19,430 21,731 78,032 62,122 17,827 19,317 19,297 21,688 78,129
Other businesses 1,026 462 472 475 492 1,901 1,153 529 543 557 566 2,195
Unallocated transactions 41 1 (2) 0 (4) (4) 41 (1) (4) (3) (7) (15)
Impact of purchase accounting (1,180) (355) (335) (295) (284) (1,269) (1,152) (355) (335) (295) (284) (1,269)
Total GAAP revenue 61,642 17,816 19,299 19,610 21,935 78,660 62,164 18,000 19,521 19,556 21,963 79,040
Operating income/(loss)
CSG 1,845 374 566 672 581 2,193 1,751 325 528 630 561 2,044
ISG 2,393 323 430 678 748 2,179 2,920 506 647 870 1,045 3,068
VMware2 1,113 486 561 639 834 2,520 1,516 611 728 634 836 2,809
Reportable segment operating income 5,351 1,183 1,557 1,988 2,163 6,892 6,187 1,442 1,903 2,134 2,442 7,921
Other businesses (39) 3 1 6 (31) (21) (42) (23) (29) (19) (54) (125)
Unallocated transactions (199) 11 (6) (8) (12) (16) (198) 6 (8) (6) (16) (24)
Impact of purchase accounting (2,294) (423) (406) (366) (351) (1,546) (2,266) (423) (406) (366) (351) (1,546)
Amortization of intangibles (3,681) (1,776) (1,740) (1,734) (1,730) (6,980) (3,681) (1,776) (1,740) (1,734) (1,730) (6,980)
Transaction related expense (1,488) (191) (138) (86) (87) (502) (1,488) (191) (138) (86) (87) (502)
Other corporate expense (902) (307) (247) (333) (273) (1,160) (902) (307) (247) (333) (273) (1,160)
Total GAAP operating loss (3,252) (1,500) (979) (533) (321) (3,332) (2,390) (1,272) (665) (410) (69) (2,416)
CSG - OpInc as % of revenue 5.0% 4.1% 5.7% 6.7% 5.5% 5.6% 4.8% 3.6% 5.4% 6.4% 5.4% 5.2%
ISG - OpInc as % of revenue 11.0% 4.7% 5.8% 9.0% 8.5% 7.1% 13.2% 7.3% 8.7% 11.5% 11.7% 9.9%
VMware 2 - OpInc as % of revenue 34.5% 28.0% 29.4% 32.7% 35.8% 31.8% 42.8% 33.6% 36.7% 32.8% 37.0% 35.1%
As Reported As Recast

19
Selected Balance Sheet Amounts1
1 The pre-tax impact to the opening Consolidated Statement of Financial Position as of January 29, 2016 is expected to be an approximately $1 billion benefit to accumulated deficit.
2 Does not include the tax impact of ASC 606.
($ in millions) 4Q'17 1Q'18 2Q'18 3Q'18 4Q'18 4Q'17 1Q'18 2Q'18 3Q'18 4Q'18 4Q'17 1Q'18 2Q'18 3Q'18 4Q'18
Selected assets
Cash and cash equivalents 9,474 9,554 9,213 11,706 13,942 9,474 9,554 9,213 11,706 13,942 - - - - -
Short-term investments 1,975 1,620 2,015 2,008 2,187 1,975 1,620 2,015 2,008 2,187 - - - - -
Accounts receivable, net 9,420 8,834 9,716 9,189 11,177 9,889 9,342 10,269 9,712 11,677 469 508 553 523 500
Short-term financing receivables, net 3,222 3,255 3,473 3,643 3,919 3,222 3,255 3,473 3,643 3,919 - - - - -
Inventories, net 2,538 2,466 2,594 2,582 2,678 2,538 2,466 2,594 2,582 2,678 - - - - -
Other current assets 4,144 4,655 5,194 5,397 5,054 4,807 5,318 5,944 6,169 5,777 663 663 750 772 723
Other non-current assets2 1,364 1,492 1,681 1,725 1,862 1,739 1,925 2,235 2,315 2,548 375 433 554 590 686
Selected liabilities - - - - -
Accounts payable 14,422 15,064 16,916 16,711 18,334 14,422 15,064 16,916 16,711 18,334 - - - - -
Accrued and other 7,119 6,376 6,798 6,901 7,661 7,406 6,659 7,128 7,211 8,026 287 283 330 310 365
Short-term deferred revenue 10,265 10,354 10,726 10,895 12,024 10,012 10,021 10,393 10,566 11,562 (253) (333) (333) (329) (462)
Long-term deferred revenue 8,431 8,330 8,878 9,161 10,223 7,803 7,656 8,094 8,299 9,210 (628) (674) (784) (862) (1,013)
As Reported As Recast Change

20
Appendix C
Supplemental Non-GAAP Measures
21
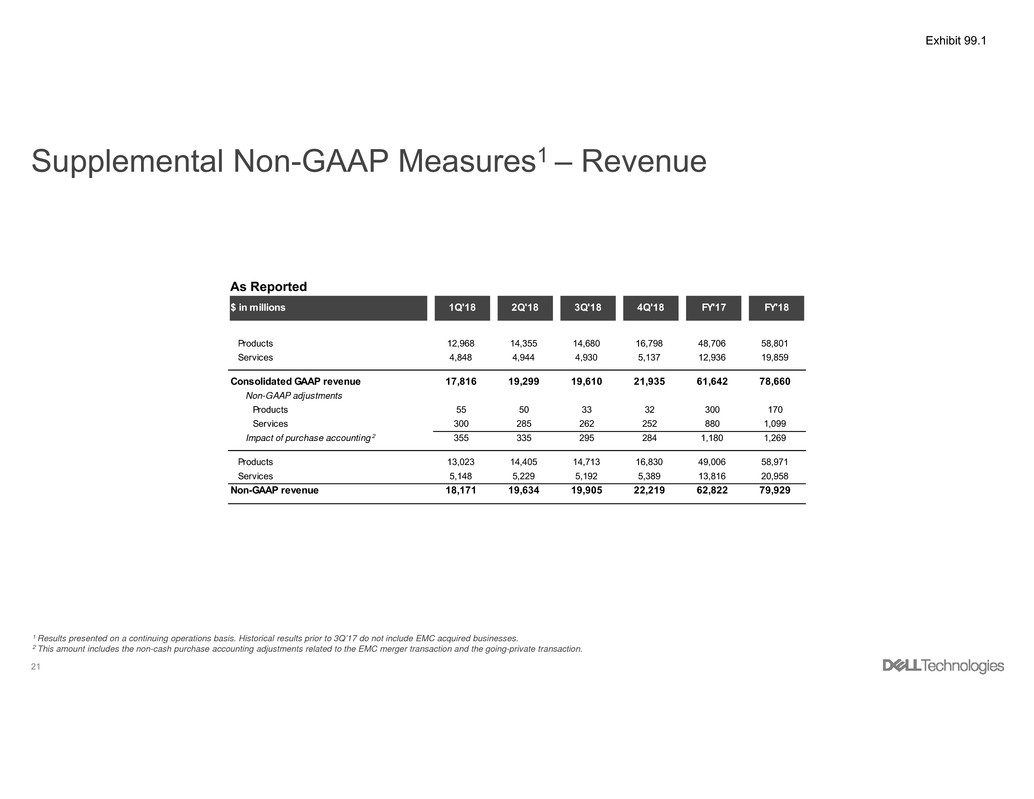
Supplemental Non-GAAP Measures1 – Revenue
1 Results presented on a continuing operations basis. Historical results prior to 3Q’17 do not include EMC acquired businesses.
2 This amount includes the non-cash purchase accounting adjustments related to the EMC merger transaction and the going-private transaction.
As Reported
$ in millions 1Q'18 2Q'18 3Q'18 4Q'18 FY'17 FY'18
Products 12,968 14,355 14,680 16,798 48,706 58,801
Services 4,848 4,944 4,930 5,137 12,936 19,859
Consolidated GAAP revenue 17,816 19,299 19,610 21,935 61,642 78,660
Non-GAAP adjustments
Products 55 50 33 32 300 170
Services 300 285 262 252 880 1,099
Impact of purchase accounting 2 355 335 295 284 1,180 1,269
Products 13,023 14,405 14,713 16,830 49,006 58,971
Services 5,148 5,229 5,192 5,389 13,816 20,958
Non-GAAP revenue 18,171 19,634 19,905 22,219 62,822 79,929

22
Supplemental Non-GAAP Measures1 – Revenue
1 Results presented on a continuing operations basis. Historical results prior to 3Q’17 do not include EMC acquired businesses.
2 This amount includes the non-cash purchase accounting adjustments related to the EMC merger transaction and the going-private transaction.
As Recast
$ in millions 1Q'18 2Q'18 3Q'18 4Q'18 FY'17 FY'18
Products 13,634 15,102 15,120 17,395 51,057 61,251
Services 4,366 4,419 4,436 4,568 11,107 17,789
Consolidated GAAP revenue 18,000 19,521 19,556 21,963 62,164 79,040
Non-GAAP adjustments
Products 55 50 33 32 300 170
Services 300 285 262 252 852 1,099
Impact of purchase accounting 2 355 335 295 284 1,152 1,269
Products 13,689 15,152 15,153 17,427 51,357 61,421
Services 4,666 4,704 4,698 4,820 11,959 18,888
Non-GAAP revenue 18,355 19,856 19,851 22,247 63,316 80,309

23
Supplemental Non-GAAP Measures1 – Gross Margin
1 Results presented on a continuing operations basis. Historical results prior to 3Q’17 do not include EMC acquired businesses.
2 This amount includes the non-cash purchase accounting adjustments related to the EMC merger transaction and the going-private transaction.
3 Consists of acquisition, integration and divestiture-related costs.
4 Consists of severance and facility action costs as well as stock-based compensation.
As Reported
$ in millions 1Q'18 2Q'18 3Q'18 4Q'18 FY'17 FY'18
Products 1,509 1,977 2,311 2,789 6,537 8,586
Services 2,793 2,832 2,852 2,991 6,422 11,468
Consolidated GAAP gross margin 4,302 4,809 5,163 5,780 12,959 20,054
Non-GAAP adjustments
Products 950 920 914 910 1,652 3,694
Services - - - - 1 -
Amortization of intangibles 950 920 914 910 1,653 3,694
Products 65 63 45 40 1,104 213
Services 300 285 262 252 903 1,099
Impact of purchase accounting 2 365 348 307 292 2,007 1,312
Products 2 6 1 2 24 11
Services 5 4 4 0 19 13
Transaction costs 3 7 10 5 2 43 24
Products 3 3 2 17 29 25
Services 19 10 26 21 128 76
Other corporate expenses 4 22 13 28 38 157 101
Total adjustments to gross margin 1,344 1,291 1,254 1,242 3,860 5,131
Products 2,529 2,969 3,273 3,758 9,346 12,529
Services 3,117 3,131 3,144 3,264 7,473 12,656
Non-GAAP gross margin 5,646 6,100 6,417 7,022 16,819 25,185
24
Supplemental Non-GAAP Measures1 – Gross Margin
1 Results presented on a continuing operations basis. Historical results prior to 3Q’17 do not include EMC acquired businesses.
2 This amount includes the non-cash purchase accounting adjustments related to the EMC merger transaction and the going-private transaction.
3 Consists of acquisition, integration and divestiture-related costs.
4 Consists of severance and facility action costs as well as stock-based compensation.
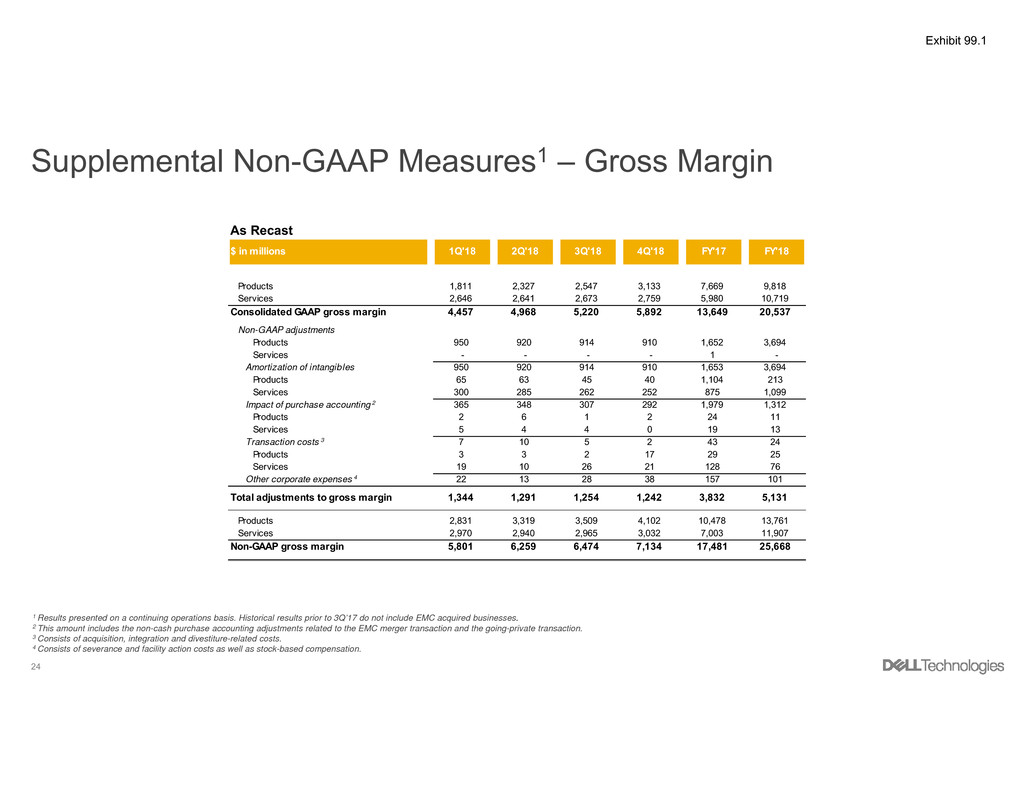
As Recast
$ in millions 1Q'18 2Q'18 3Q'18 4Q'18 FY'17 FY'18
Products 1,811 2,327 2,547 3,133 7,669 9,818
Services 2,646 2,641 2,673 2,759 5,980 10,719
Consolidated GAAP gross margin 4,457 4,968 5,220 5,892 13,649 20,537
Non-GAAP adjustments
Products 950 920 914 910 1,652 3,694
Services - - - - 1 -
Amortization of intangibles 950 920 914 910 1,653 3,694
Products 65 63 45 40 1,104 213
Services 300 285 262 252 875 1,099
Impact of purchase accounting 2 365 348 307 292 1,979 1,312
Products 2 6 1 2 24 11
Services 5 4 4 0 19 13
Transaction costs 3 7 10 5 2 43 24
Products 3 3 2 17 29 25
Services 19 10 26 21 128 76
Other corporate expenses 4 22 13 28 38 157 101
Total adjustments to gross margin 1,344 1,291 1,254 1,242 3,832 5,131
Products 2,831 3,319 3,509 4,102 10,478 13,761
Services 2,970 2,940 2,965 3,032 7,003 11,907
Non-GAAP gross margin 5,801 6,259 6,474 7,134 17,481 25,668

25
Supplemental Non-GAAP Measures1 – Operating Expenses
1 Results presented on a continuing operations basis. Historical results prior to 3Q’17 do not include EMC acquired businesses.
2 This amount includes the non-cash purchase accounting adjustments related to the EMC merger transaction and the going-private transaction.
3 Consists of acquisition, integration and divestiture-related costs.
4 Consists of severance and facility action costs as well as stock-based compensation.
As Reported
$ in millions 1Q'18 2Q'18 3Q'18 4Q'18 FY'17 FY'18
Consolidated GAAP operating expenses 5,802 5,788 5,696 6,101 16,211 23,387
Non-GAAP adjustments
Amortization of intangibles (826) (820) (820) (820) (2,028) (3,286)
Impact of purchase accounting2 (58) (58) (59) (59) (287) (234)
Transaction costs3 (184) (128) (81) (85) (1,445) (478)
Other corporate expenses4 (285) (234) (305) (235) (745) (1,059)
Total adjustments to operating expenses (1,353) (1,240) (1,265) (1,199) (4,505) (5,057)
Non-GAAP operating expenses 4,449 4,548 4,431 4,902 11,706 18,330

26
Supplemental Non-GAAP Measures1 – Operating Expenses
1 Results presented on a continuing operations basis. Historical results prior to 3Q’17 do not include EMC acquired businesses.
2 This amount includes the non-cash purchase accounting adjustments related to the EMC merger transaction and the going-private transaction.
3 Consists of acquisition, integration and divestiture-related costs.
4 Consists of severance and facility action costs as well as stock-based compensation.
As Recast
$ in millions 1Q'18 2Q'18 3Q'18 4Q'18 FY'17 FY'18
Consolidated GAAP operating expenses 5,729 5,633 5,630 5,961 16,039 22,953
Non-GAAP adjustments
Amortization of intangibles (826) (820) (820) (820) (2,028) (3,286)
Impact of purchase accounting2 (58) (58) (59) (59) (287) (234)
Transaction costs3 (184) (128) (81) (85) (1,445) (478)
Other corporate expenses4 (285) (234) (305) (235) (745) (1,059)
Total adjustments to operating expenses (1,353) (1,240) (1,265) (1,199) (4,505) (5,057)
Non-GAAP operating expenses 4,376 4,393 4,365 4,762 11,534 17,896

27
Supplemental Non-GAAP Measures1 – Operating Income / (Loss)
1 Results presented on a continuing operations basis. Historical results prior to 3Q’17 do not include EMC acquired businesses.
2 This amount includes the non-cash purchase accounting adjustments related to the EMC merger transaction and the going-private transaction.
3 Consists of acquisition, integration and divestiture-related costs.
4 Consists of severance and facility action costs as well as stock-based compensation.
$ in millions 1Q'18 2Q'18 3Q'18 4Q'18 FY'17 FY'18
Consolidated GAAP operating loss (1,500) (979) (533) (321) (3,252) (3,333)
Non-GAAP adjustments
Amortization of intangibles 1,776 1,740 1,734 1,730 3,681 6,980
Impact of purchase accounting2 423 406 366 351 2,294 1,546
Transaction costs3 191 138 86 87 1,488 502
Other corporate expenses4 307 247 333 273 902 1,160
Total adjustments to operating income 2,697 2,531 2,519 2,441 8,365 10,188
Non-GAAP operating income 1,197 1,552 1,986 2,120 5,113 6,855
As Reported

28
Supplemental Non-GAAP Measures1 – Operating Income / (Loss)
1 Results presented on a continuing operations basis. Historical results prior to 3Q’17 do not include EMC acquired businesses.
2 This amount includes the non-cash purchase accounting adjustments related to the EMC merger transaction and the going-private transaction.
3 Consists of acquisition, integration and divestiture-related costs.
4 Consists of severance and facility action costs as well as stock-based compensation.
$ in millions 1Q'18 2Q'18 3Q'18 4Q'18 FY'17 FY'18
Consolidated GAAP operating loss (1,272) (665) (410) (69) (2,390) (2,416)
Non-GAAP adjustments
Amortization of intangibles 1,776 1,740 1,734 1,730 3,681 6,980
Impact of purchase accounting2 423 406 366 351 2,266 1,546
Transaction costs3 191 138 86 87 1,488 502
Other corporate expenses4 307 247 333 273 902 1,160
Total adjustments to operating income 2,697 2,531 2,519 2,441 8,337 10,188
Non-GAAP operating income 1,425 1,866 2,109 2,372 5,947 7,772
As Recast

29
Supplemental Non-GAAP Measures1 – Adjusted EBITDA
1 Results presented on a continuing operations basis. Historical results prior to 3Q’17 do not include EMC acquired businesses.
2 This amount includes the non-cash purchase accounting adjustments related to the EMC merger transaction and the going-private transaction.
3 Consists of acquisition, integration and divestiture-related costs.
4 Consists of severance and facility action costs as well as stock-based compensation.
As Reported
$ in millions 1Q'18 2Q'18 3Q'18 4Q'18 FY'17 FY'18
Consolidated GAAP operating loss (1,500) (979) (533) (321) (3,252) (3,333)
Depreciation and amortization 2,212 2,142 2,137 2,143 4,840 8,634
EBITDA 712 1,163 1,604 1,822 1,588 5,301
Non-GAAP adjustments
Stock based compensation 201 208 221 205 392 835
Impact of purchase accounting2 357 335 298 284 1,926 1,274
Transaction costs3 191 138 86 87 1,525 502
Other corporate expenses4 106 22 109 68 510 305
Total adjustments to EBITDA 855 703 714 644 4,353 2,916
Adjusted EBITDA 1,567 1,866 2,318 2,466 5,941 8,217

30
Supplemental Non-GAAP Measures1 – Adjusted EBITDA
1 Results presented on a continuing operations basis. Historical results prior to 3Q’17 do not include EMC acquired businesses.
2 This amount includes the non-cash purchase accounting adjustments related to the EMC merger transaction and the going-private transaction.
3 Consists of acquisition, integration and divestiture-related costs.
4 Consists of severance and facility action costs as well as stock-based compensation.
As Recast
$ in millions 1Q'18 2Q'18 3Q'18 4Q'18 FY'17 FY'18
Consolidated GAAP operating loss (1,272) (665) (410) (69) (2,390) (2,416)
Depreciation and amortization 2,212 2,142 2,137 2,143 4,840 8,634
EBITDA 940 1,477 1,727 2,074 2,450 6,218
Non-GAAP adjustments
Stock based compensation 201 208 221 205 392 835
Impact of purchase accounting2 357 335 298 284 1,898 1,274
Transaction costs3 191 138 86 87 1,525 502
Other corporate expenses4 106 22 109 68 510 305
Total adjustments to EBITDA 855 703 714 644 4,325 2,916
Adjusted EBITDA 1,795 2,180 2,441 2,718 6,775 9,134
