
Form 10-K/A FAIRMOUNT SANTROL HOLDIN For: Dec 31
UNITED STATES
SECURITIES AND EXCHANGE COMMISSION
Washington, D.C. 20549
FORM 10-K/A
(Amendment No. 1)
| ☒ | ANNUAL REPORT PURSUANT TO SECTION 13 OR 15(d) OF THE SECURITIES EXCHANGE ACT OF 1934 |
For the fiscal year ended December 31, 2017
or
| ☐ | TRANSITION REPORT PURSUANT TO SECTION 13 OR 15(d) OF THE SECURITIES EXCHANGE ACT OF 1934 |
Commission File Number 001-36670
FAIRMOUNT SANTROL HOLDINGS INC.
(Exact name of registrant as specified in its charter)
| Delaware | 34-1831554 | |
| (State or Other Jurisdiction of Incorporation or Organization) |
(I.R.S. Employer Identification No.) |
8834 Mayfield Road
Chesterland, Ohio 44026
(Address of Principal Executive Offices) (Zip Code)
(800) 255-7263
(Registrant’s Telephone Number, Including Area Code)
Securities registered pursuant to Section 12(g) of the Securities Act:
| Title of each class: |
Name of each exchange on which registered: | |
| Common Stock, par value $0.01 per share | New York Stock Exchange |
Securities registered pursuant to Section 12(g) of the Securities Act: None
Indicate by check mark if the registrant is a well-known seasoned issuer, as defined in Rule 405 of the Securities Act. Yes ☒ No ☐
Indicate by check mark if the registrant is not required to file report pursuant to Section 13 or Section 15(d) of the Act. Yes ☐ No ☒
Indicate by check mark whether the registrant (1) has filed all reports required to be filed by Section 13 or 15(d) of the Securities Exchange Act of 1934 during the preceding 12 months (or for such shorter period that the registrant was required to file such reports), and (2) has been subject to such filing requirements for the past 90 days. Yes ☒ No ☐
Indicate by check mark whether the registrant has submitted electronically and posted on its corporate Web site, if any, every Interactive Data File required to be submitted and posted pursuant to Rule 405 of Regulation S-T (§232.405 of this chapter) during the preceding 12 months (or for such shorter period that the registrant was required to submit and post such files). Yes ☒ No ☐
Indicate by check mark if disclosure of delinquent filers pursuant to Item 405 of Regulation S-K (§229.405 of this chapter) is not contained herein, and will not be contained, to the best of the registrant’s knowledge, in definitive proxy or information statements incorporated by reference in Part III of this Form 10-K or any amendment to this Form 10-K. ☒
Indicate by check mark whether the registrant is a large accelerated filer, an accelerated filer, a non-accelerated filer, a smaller reporting company, or an emerging growth company. See the definitions of “large accelerated filer,” “accelerated filer,” “smaller reporting company,” and “emerging growth company” in Rule 12b-2 of the Exchange Act (Check one):
| Large accelerated filer | ☐ | Accelerated filer | ☒ | |||
| Non-accelerated filer | ☐ | Smaller reporting company | ☐ | |||
| Emerging growth company | ☐ | |||||
If an emerging growth company, indicate by check mark if the registrant has elected not to use the extended transition period for complying with any new or revised financial accounting standards provided pursuant to Section 13(a) of the Exchange Act. ☐
Indicate by check mark whether the registrant is a shell company (as defined in Rule 12b-2 of the Exchange Act). Yes ☐ No ☒
The aggregate market value of common stock held by non-affiliates of the registrant computed by reference to the last sales price, $3.90 as reported on the New York Stock Exchange, of such common stock as of the closing of trading on June 30, 2017: $580,770,641
Number of shares of Common Stock outstanding, par value $0.01 per share, as of April 2, 2018: 224,954,671
EXPLANATORY NOTE
This Amendment No. 1 to Form 10-K (this “Amendment”) amends the Annual Report on Form 10-K for the fiscal year ended December 31, 2017 (the “2017 Form 10-K”) originally filed on March 13, 2018 (the “Original Filing”) by Fairmount Santrol Holdings Inc., a Delaware corporation (the “Company”). The Company is filing this Amendment to present the information required by Part III of Form 10-K, as the Company will not file a definitive proxy statement within 120 days of the end of the Company’s fiscal year ended December 31, 2017.
This Amendment also provides additional information, concerning (i) how we assess the economic viability of our mineral reserves and (ii) average utilization rates over the past three years at each of our active facilities, as set forth herein under “Item 2 — Properties.”
Except as described above, no other changes have been made to the Original Filing. The Original Filing continues to speak as of the date of the Original Filing, and the Company has not updated the disclosures contained therein to reflect any events which occurred at a date subsequent to the date of the Original Filing.
ITEM 2. PROPERTIES
Our Reserves
We control one of the largest bases of silica sand reserves in the United States. From our reserves, we are able to produce a large selection of high-purity silica sand, lake sand, coated sand, silica gravel, and other specialty sands. According to the SEC Industry Guide 7, reserves are defined as that part of a mineral deposit which could be economically and legally extracted or produced at the time of the reserve determination. Reserves are categorized into proven (measured) reserves and probable (indicated) reserves. In accordance with SEC Industry Guide 7, our reserves are categorized as proven or probable.
We estimate that the company has approximately 893.4 million tons of proven recoverable mineral reserves as of December 31, 2017. Additional probable but not proven reserves are considered immaterial. Mineral reserve estimated quantities and characteristics at our properties are overseen by our internal geologists and engineers and validated by third party consulting company, GZA GeoEnvironmental, Inc.
The Company assesses the economic viability of our minerals reserves for each operation primarily by evaluating the following key criteria for mining feasibility: estimate of saleable quality reserves; percent recovery following processing; overburden stripping and other operational costs and annual production volumes. These factors are considered in preparation of a mine plan that ultimately estimates the tons of product to be sold per year and the estimated life of the mine. Historical mineral prices are considered in the context of market supply and demand dynamics to further assess the long term economic viability of the mineral reserve assets. The reserve estimates are updated annually based on sales, changes to reserve boundaries, new physical or chemical information on the reserve deposit or overburden, changes in the mine plan, changes in customer demand, current pricing forecasts and other business strategies.
2
Summary of Reserves
The following table provides information on each of our sand mining facilities. Included is the location and area of the facility; the type, amount, and ownership status of its reserves and whether or not they meet API standards, and the primary end markets that it serves:
| Active Mines |
Acres Owned/ Leased |
API | Proven Reserves In-Situ (Thousand Tons) |
Estimated Recovery Percentages |
Primary End Markets | |||||||||||||||||
| API White |
||||||||||||||||||||||
| Wedron, IL |
2,230 | O | API White | 223,296 | 80% | proppant, glass, foundry, specialty products | ||||||||||||||||
| 0 | L | |||||||||||||||||||||
| Maiden Rock, WI |
987 | O | API White | 24,061 | 70% | proppant, glass, foundry | ||||||||||||||||
| 576 | OM | |||||||||||||||||||||
| 377 | L | |||||||||||||||||||||
| Menomonie, WI |
2 | O | API White | 23,102 | 75% | proppant, glass, foundry, specialty products | ||||||||||||||||
| 366 | L | |||||||||||||||||||||
| Shakopee, MN |
93 | O | API White | 14,133 | 80% | proppant, glass, foundry, specialty products | ||||||||||||||||
| 115 | L | |||||||||||||||||||||
| Brewer, MO |
353 | O | API White | 31,460 | 80% | proppant, glass, foundry | ||||||||||||||||
| 0 | L | |||||||||||||||||||||
| API Brown |
||||||||||||||||||||||
| Voca, TX |
1,962 | O | API Brown | 187,013 | 50% | proppant, glass, foundry | ||||||||||||||||
| 0 | L | |||||||||||||||||||||
| Non-API |
||||||||||||||||||||||
| Chardon, OH |
591 | O | Non-API | 17,337 | 80% | glass, turf, landscaping, construction, | ||||||||||||||||
| 0 | L | filler/extender, foundry, industrial, proppant, filtration | ||||||||||||||||||||
| Beaver, OH |
91 | O | Non-API | 12,473 | 75% | turf, landscaping, industrial | ||||||||||||||||
| 216 | L | |||||||||||||||||||||
| Development Stage |
||||||||||||||||||||||
| Katemcy, TX |
848 | O | API Brown | 113,278 | 50% | potential to serve proppant, glass, foundry | ||||||||||||||||
| 0 | L | |||||||||||||||||||||
| Diamond Bluff, WI |
10 | O | API White | 44,539 | 70% | potential to serve proppant, glass, foundry | ||||||||||||||||
| 2,674 | L | |||||||||||||||||||||
| Kermit, TX |
0 | O | API Brown | 165,772 | 90% | potential to serve proppant, glass, foundry | ||||||||||||||||
| 3,250 | L | |||||||||||||||||||||
| Inactive |
||||||||||||||||||||||
| Bay City, WI |
40 | O | API White | 19,251 | 70% | proppant, glass, foundry | ||||||||||||||||
| 322 | OM | |||||||||||||||||||||
| 1,131 | L | |||||||||||||||||||||
| Harrietta, MI |
255 | O | Non-API | 11,087 | 75% | foundry, construction | ||||||||||||||||
| 86 | L | |||||||||||||||||||||
| Grand Haven, MI |
143 | O | Non-API | 6,555 | 85% | N/A | ||||||||||||||||
| 0 | L | |||||||||||||||||||||
| Total |
893,357 | |||||||||||||||||||||
Descriptions of Sand Facilities
As of December 31, 2017, we had seven active sand mining and processing operations facilities located in Illinois, Wisconsin, Minnesota, Missouri, Texas, and Ohio. We also have a processing facility located in Ontario, Canada that does not have any sand reserves but has an annual processing capacity of approximately 336,000 tons per year. We have inactive mines in Michigan, Minnesota, and Wisconsin and undeveloped mines in Texas and Wisconsin.
The mineral rights and access to mineral reserves for the majority of our facilities are secured through land that is owned. There are no underlying agreements and/or royalties associated with these properties. Where there are agreements and/or royalties associated related to our properties, we have provided more information in the facility descriptions below. We are required to pay production royalties on a per ton basis pursuant to our mineral reserve leases.
3
API White
Wedron, Illinois. Our Wedron, Illinois facility is located in Wedron, LaSalle County, Illinois and consists of owned real property. The facility, which is approximately 6 miles northeast of Ottawa, Illinois, is accessible via County Highway 21 off of State Highway 71 and State Highway 23. The site utilizes natural gas and electricity to process sand. Mining methods include mechanical removal of glacial overburden followed by drilling, blasting, and hydraulic mining. Hydraulically mined sand is pumped to the wash plant to be hydraulically sized and sent to the dry plant where it is dried and screened.
Our Wedron facility and its predecessors have operated since 1890. The washing and drying operations at our Wedron facility were upgraded in 2012, 2013, 2014, 2015 and 2016 in conjunction with significant capacity and reserve base increases. Significant railyard expansions in 2014 and 2015 facilitated greater flexibility and provided for unit train capabilities. Processed sand is shipped from the facility via truck or rail on the Burlington Northern Santa Fe (“BNSF”) and CSX Railroads via the Illinois Railnet. Our Wedron facility utilizes approximately 50,000 linear feet of rail. A portion of the sand is transferred by conveyor or trucked from our Wedron facility and is coated at our Technisand Wedron and/or Troy Grove, Illinois resin-coating facilities. The total net book value of the Wedron facility’s real property and fixed assets as of December 31, 2017 was $250.5 million.
The sand reserve mined from the open-pit mine at the Wedron facility is the St. Peter Sandstone formation. The Wedron facility produces high purity, round grain silica sand that meets the API requirements for proppant application. The Wedron facility production capacity, including the expansion project completed in April 2016, is approximately 9.0 million tons per year. The average utilization rate over the past three years was 82%. The surface deposit at the Wedron facility is a high purity, round grain sand with a minimum silica content of 99%, which meets API requirements for proppant application. The controlling attributes are iron and grain size. Iron is concentrated near the surface, where orange iron staining is evident and also increases where the bottom contact becomes concentrated in iron pyrite. Maximum average full face iron content is 0.020%. The deposit tends to exhibit a coarser grain size distribution in the top half of the deposit.
Maiden Rock, Wisconsin. Our Maiden Rock, Wisconsin facility is located in Maiden Rock, Pierce County, Wisconsin and consists of owned and leased real property. The mineral reserves at the Maiden Rock facility are secured under mineral leases that, with the exercise of renewal options, expire between 2021 and 2046. The facility is within the Village and Town of Maiden Rock along State Highway 35. The Maiden Rock facility utilizes natural gas and electricity to process sand. This is an underground mine and mining methods include drilling and blasting. The reserves are located at a depth of 230 feet. The sand is removed from the face of the tunnels with a front end loader and deposited into a container where it is combined with water to form a slurry. The slurry is pumped to the surface wash plant to be hydraulically sized and sent to the dry plant where it is dried and screened.
The Maiden Rock facility and its predecessors have operated since the 1920s. We acquired a 50% equity interest in the facility from Wisconsin Industrial Sand in 1997, and acquired the remaining equity interest in 1999. The washing and drying operations at the Maiden Rock facility were upgraded in 2012 in conjunction with a significant capacity increase. Processed sand is shipped from the Maiden Rock facility via truck or rail on the BNSF Railroad.
The Maiden Rock facility utilizes a new rail loadout facility and approximately 5,000 linear feet of rail constructed in 2012. This plant is unit train capable, utilizing the new unit train railyard at the Bay City facility. The total net book value of the Maiden Rock facility’s real property and fixed assets as of December 31, 2017 was $45.1 million.
The sand reserve mined from the underground mine at the Maiden Rock facility is the Jordan Sandstone formation. The Maiden Rock facility produces high purity, round grain silica that meets API requirements for proppant application. The mining capacity is approximately 1.3 million tons per year, and the average utilization rate over the past three years was 51%.
The underground deposit at this facility is a high purity, round grain sand with a minimum silica content of 99%, which meets API requirements for proppant application. The controlling attributes are turbidity, acid solubility, and grain size. The deposit tends to exhibit a coarser grain size distribution near the top of the deposit. Grain size distribution is maintained through control of mine horizon. Turbidity and acid solubility are controlled though the use of hydrosizers during wet processing.
Menomonie, Wisconsin. Our Menomonie, Wisconsin facility is located in Menomonie, Dunn County, Wisconsin and consists of owned and leased real property. The mineral reserves at our Menomonie facility are secured under mineral subleases that expire in 2044. We constructed the Menomonie facility in 2007 approximately two miles east of Menomonie and it is accessible via US Highway 12 / State Highway 16. The Menomonie facility utilizes natural gas and electricity to process sand. Mining methods include the mechanical removal of glacial overburden followed by drilling, blasting and mechanical mining. Mined sand is processed and shipped by truck or rail. A remote transload facility adjacent to the Union Pacific (UP) Railroad is located approximately one mile north of the site. The total net book value of the Menomonie facility’s real property and fixed assets as of December 31, 2017 was $8.8 million.
The sand reserve mined from the open-pit at the Menomonie facility is the Wonewoc Sandstone formation. The Menomonie facility produces high purity, round grain silica sand that meets the API requirements for proppant application. The mining capacity is approximately 750,000 tons per year, and the average utilization rate over the past three years was 47%. The surface deposit at the Menomonie facility is a high purity, round grain sand with a minimum silica content of 99% which meets API requirements for proppant application. The controlling attributes are turbidity, iron, and grain size. Maximum average full face iron content is 0.080%. The deposit tends to exhibit a coarser grain size distribution in top half of deposit. Turbidity is controlled though the use of attrition scrubbers during wet processing. Iron is controlled during processing through the use of magnetic separators.
4
Bay City, Wisconsin. Our Bay City, Wisconsin facility is located in Isabelle and Hartland Township, Pierce County, Wisconsin and consists of owned and leased real property. The mineral reserves at the Bay City facility are secured under mineral leases that, with the exercise of renewal terms, expire between 2045 and 2106. The Bay City facility was opened in 1919 and operated continuously until 1989. We acquired the mine through the acquisition of Wisconsin Specialty Sand and constructed the associated Hager City processing (drying) plant in 2007. This underground mine is approximately 1.5 miles northeast of Bay City on State Highway 35. The reserves are located at a depth of 230 feet. The mine utilizes electricity to process sand. Mining methods include drilling and blasting. As a result of the challenging conditions in the global oil and gas markets, these operations were idled in 2015. Although the processing facility was idled, the railyard remains active and provides unit train capabilities for the Maiden Rock facility.
Mined sand is shipped approximately five miles to the Hager City plant for further processing and eventual shipment via truck or rail on the BNSF Railroad. The Hager City plant, constructed by Wisconsin Industrial Sand Company, LLC in 2007, was expanded in 2013 and 2014 with the addition of a new rail yard containing approximately 19,000 linear feet of rail for assembling unit trains. The total net book value of the Bay City facility’s real property and fixed assets as of December 31, 2017 was $41.4 million.
The sand reserve mined from the underground mine at the Bay City facility is the Jordan Sandstone formation. The Bay City facility produces high purity, round grain silica that meets API requirements for proppant application. The mining capacity is approximately 780,000 tons per year, and the average utilization rate over the past three years was 13%. The underground deposit at the Bay City facility is a high purity, round grain sand with a minimum silica content of 99% which meets API requirements for proppant application. The controlling attributes are turbidity, acid solubility, and grain size. The deposit tends to exhibit a coarser grain size distribution near the top of the deposit. Grain size distributions are maintained through control of mine horizon. Turbidity and acid solubility are controlled though the use of hydrosizers during wet processing.
Shakopee, Minnesota. Our Shakopee, Minnesota facility is located in Shakopee, Scott County, Minnesota and consists of owned and leased real property. The mineral reserves at our mine are secured by fee ownership and a lease agreement that, with the exercise of renewal options, expires in 2030. The facility is approximately four miles south of Shakopee, Minnesota and is accessible via US Highway 169. The Shakopee facility utilizes natural gas and electricity to process sand. Mining methods include the mechanical removal of glacial overburden followed by drilling, blasting and mechanical mining. As a result of the challenging conditions in the global oil and gas markets, these operations were idled in 2015 and re-opened in 2017.
Mining occurred at the Shakopee facility for a short time in the 1980s by others until the property was reclaimed. The mine was permitted by Great Plains Sand in 2012 and acquired by us in 2013, at which time we changed the name to Shakopee Sand LLC. We upgraded the washing and drying operations at the facility following the acquisition. Processed sand is shipped from the Shakopee facility via truck or by rail on the UP. The total net book value of the Shakopee facility’s real property and fixed assets as of December 31, 2017 was $12.0 million.
The sand reserve mined from the open-pit mine at the Shakopee facility is the Jordan Sandstone formation. The deposit produces high purity, round grain silica sand which meets API requirements for proppant application. The mining capacity is approximately 718,000 tons per year, and the average utilization rate over the past three years was 21%. This surface deposit at the Shakopee facility is a high purity, round grain sand with a minimum silica content of 99% which meets API requirements for proppant application. The controlling attributes are turbidity and grain size. The deposit tends to exhibit a coarser grain size distribution in the top half of deposit. Turbidity is controlled through the use of hydrosizers and attrition scrubbers during wet processing. Fine and coarse areas are blended to meet the grain size average.
Brewer, Missouri. Our Brewer, Missouri mine is located in Brewer, Perry County, Missouri and consists of owned real property. The facility, approximately one-half mile northwest of Brewer, Missouri, is accessible via State Highway M. We acquired the inactive mine in 2013. The operation was reactivated and began production in December 2014 but was idled in 2015 due to the challenging conditions in the global oil and gas markets. In January 2017, the decision was made to return Brewer to full production due to an increase in demand for proppants. The mine resumed production in the first quarter of 2017. Mining methods include the mechanical removal of overburden followed by drilling, blasting and mechanical mining. The total net book value of the facility’s real property and fixed assets as of December 31, 2017 was $22.2 million.
The sand reserve mined from the open-pit mine at the Brewer facility is the St. Peter Sandstone formation. The deposit produces high purity, round grain silica that meets API requirements for proppant application. The mining capacity is approximately 1.3 million tons per year, and the average utilization rate over the past three years was 31%. The surface deposit at the Brewer facility is a high purity, round grain sand with a minimum silica content of 99% which meets API requirements for proppant application. The controlling attributes are turbidity and grain size. The deposit tends to exhibit a coarser grain size distribution in top half of deposit. Turbidity is controlled through the use of hydrosizers and attrition scrubbers during wet processing.
5
API Brown
Voca, Texas. Our Voca, Texas facility is located in Voca, Mason and McCulloch Counties, Texas and consists of owned real property. The facility, which is approximately 1.5 miles southeast of Voca, is accessible via County Highway 1851, south of State Highway 71. Sand mining and processing operations were developed at the facility during 2008, with the construction of existing plants completed in 2012. We acquired the operations in 2013. The Voca facility utilizes propane and electricity to process sand. Mining methods include the mechanical removal of thin overburden followed by drilling, blasting, and mechanical mining. The total net book value of the Voca facility’s real property and fixed assets as of December 31, 2017 was $92.4 million.
The sand reserve mined at our Voca property is the Hickory Sandstone Member of the Riley formation. The Voca facility produces high purity, round grain silica which meets API requirements for proppant application. The mining capacity is approximately 1.2 million tons per year, and the average utilization rate over the past three years was 59%. The surface deposit at the Voca facility is a high purity, round grain sand with a minimum silica content of 98% which meets API requirements for proppant application. The controlling attributes are turbidity and grain size. Turbidity is controlled through the use of hydrosizers and attrition scrubbers during wet processing. Grain size is controlled through the use of hydrosizers and wet screening.
Non-API
Chardon, Ohio. Our Chardon, Ohio facility is located in Geauga County, Ohio and consists of owned real property. The facility, which is approximately two miles south of Chardon, is accessible via State Route 44. The site utilizes natural gas and electricity to process sand. Mining methods include the mechanical removal of glacial overburden followed by drilling, blasting and mechanical mining.
The mine was opened in 1938 and acquired by Best Sand in 1978. We acquired the mine as a result of the merger of Wedron Silica and Best Sand in 1986. Upgrades were made to the wash plant in 2009, the fluid bed dryer in 2012 and the rotary dryer circuit in 2012. The reserve base was increased by 950,000 tons in 2014 and 1.2 million tons in 2015. The total net book value of the Chardon facility’s real property and fixed assets as of December 31, 2017 was $10.5 million.
The sand reserve mined from the open-pit mine at the Chardon facility is the Sharon Conglomerate formation. This plant produces high purity, sub-angular grain silica sand and gravel used for industrial and recreational markets. The mining capacity is approximately 1.1 million tons per year, and the average utilization rate over the past three years was 61%. The surface deposit at the Chardon facility is a high purity, sub-round grain silica sand/gravel. The deposit has a minimum silica content of 99% ideal for glass and foundry applications. The contributing attributes are iron and grain size distribution. The mine’s iron averages 0.084%.
Beaver, Ohio. Our Beaver, Ohio facility, acquired in 1994 from Schrader Sand and Gravel, is located in Jackson Township, Pike County, Ohio and consists of owned and leased real property. The mineral reserves at this facility are secured under mineral leases that, with the exercise of renewal options, expire in 2024. The facility, which is approximately six miles northeast of Beaver, Ohio, is accessible via County Road 521. The facility utilizes electricity to process sand. Mining methods include the mechanical removal of glacial overburden followed by drilling, blasting and mechanical mining. The total net book value of the Beaver facility’s real property and fixed assets as of December 31, 2017 was $1.3 million.
The sand reserve mined from the open-pit mine at the Beaver facility is the Sharon Conglomerate formation. The Beaver facility produces high purity, sub-angular grain silica sand and gravel. The mining capacity is approximately 426,000 tons per year, and the average utilization rate over the past three years was 10%. The surface deposit at the Beaver facility is a high purity, sub-angular grain silica sand/gravel. The deposit has a minimum silica content of 99% and is ideal for turf/landscaping and industrial applications. The controlling attribute is cleanliness. Cleanliness is controlled through wet processing.
Harrietta, Michigan. Our Harrietta, Michigan facility is located in Slagle Township, Wexford County, Michigan and consists of owned and leased real property. The facility, which is approximately three miles northeast of Harrietta, Michigan, is accessible via West 28th Road and State Highway 37. The facility utilizes recycled oil and electricity to process sand. Mining methods include mechanical removal of overburden and excavation of sand.
We acquired Wexford Sand from Sargent Sand in 1998. A new screen plant was installed in 2008. The processed sand is shipped from the Harrietta facility by bulk via truck or rail on the Great Lakes Central Railroad. The total net book value of the Harrietta facility’s real property and fixed assets as of December 31, 2017 was $1.2 million.
The sand reserve mined from the open-pit mine at the Harrietta facility is a glacial outwash sand deposit for proppant applications. Glacial outwash is glacial sediments deposited by melting glacial ice at the terminus of a glacier. The mining capacity is approximately 625,000 tons per year, and the average utilization rate over the past three years was 7%. This surface deposit at the Harrietta is sub-round grain sand with minimum silica content of 96% ideal for foundry applications. The controlling attributes are Acid Demand Value (ADV) and grain size distribution.
As a result of challenging conditions in end markets, this facility was closed in 2015. However, it is in the process of being re-opened and producing sand, and is scheduled for the second quarter of 2018.
6
Grand Haven, Michigan. Our Grand Haven, Michigan facility is located in Grand Haven, Ottawa County, Michigan. The mine and facility consists of owned real property that is subject to a reverter to the prior property owner in 2021. The mine and facility have been closed since 2014. The facility, which is approximately two miles south of Grand Haven, Michigan, is accessible via Lakeshore drive and US Highway 31.
The sand reserve historically mined from the open-pit mine at the facility is a dune sand deposit. This surface dune deposit is a high purity, sub-round grain sand with minimum silica (SiO2) content of 96% ideal for foundry metal casting applications. The controlling attributes are grain size and chemistry, (ADV). The mine’s ADV ranges from 30-50. ADV is controlled through floatation during wet processing. The grain size distribution averages greater than 50% plus 50 mesh. There is no net book value assigned to the Grand Haven mine or facility.
Development
Katemcy, Texas. Our Katemcy, Texas reserves are located in Katemcy, Mason County, Texas and consist of owned real property. The mine property was purchased in September 2013 and is accessed via County Road 1222 and State Highway 87. The mine has not yet been developed and the property is currently used as agricultural land. This deposit is capable of producing high purity, round grain silica sand that meets API requirements for proppant application. Plans to develop the mine property are under review. The sand reserve at this proposed open-pit mine is the Hickory Sandstone Member of the Riley formation. The total net book value of Katemcy as of December 31, 2017 is included in the net book value of the Voca facility.
The surface reserve is a high purity, round grain sand with a minimum silica content of 98% which meets API requirements for proppant application. The controlling attributes will be turbidity and grain size.
Diamond Bluff, Wisconsin. Our Diamond Bluff, Wisconsin reserves are located in Diamond Bluff and Oak Grove Townships, Pierce County, Wisconsin and consist of owned and leased real property. The mineral reserves are secured under mineral leases that expire between 2063 and 2064. The mine access property was purchased in 2014 and is undeveloped. The mine was permitted by the Diamond Bluff Township in 2012 and by the Oak Grove Township in 2014. The facility, which is located approximately one mile northwest of the unincorporated community of Diamond Bluff, is accessible off of 1005th Street via State Highway 35. The proposed underground mine site will be at a depth of 230 feet and will utilize electricity to process sand through drilling, blasting, mechanical, and hydraulic mining methods. Mined sand will be shipped approximately eight miles to the Hager City plant for further processing and eventual shipment via truck or rail on the BNSF Railroad. The total net book value of the facility’s real property and fixed assets as of December 31, 2017 is included in the net book value of the Bay City facility.
The sand reserve at this proposed underground mine is the Jordan Sandstone formation. This deposit is capable of producing high purity, round grain silica sand which meets API requirements for proppant application. This underground reserve is a high purity, round grain sand with a minimum silica content of 99% which meets API requirements for proppant application. The controlling attributes are turbidity, acid solubility, and grain size. The deposit tends to exhibit a coarser grain size distribution near the top of the deposit.
Kermit, Texas. Our Kermit, Texas reserves are located eight miles east of Kermit, Winkler County, Texas and consists of approximately 3,250 acres of leased property. The location is accessible via Highway 115 with access to the Delaware and Midland basins. The facility (currently under construction) will mine sand through the excavation method and will use natural gas and electricity to process sand. The sand will be transported by slurry to the processing plant where it will be washed, screened, and dried. The finished product will be shipped via truck. At December 31, 2017, this property is a greenfield site with construction expected to be completed and the facility expected to be in operation in the second quarter of 2018. The net book value of the location’s real property and fixed assets is $79.2 million as of December 31, 2017. The mining capacity will be approximately 3.0 million tons.
The sand reserves are an active dune deposit that is capable of producing high purity and round grain silica sand that meets API requirements for proppant application.
Coating, Resin Manufacturing, Specialty Blending, and Research and Development Facilities
We have six strategically located coating facilities in North America near our mining operations. These facilities are on a combination of leased as well as owned land and buildings. As of March 2018, two of the domestic facilities were inactive or closed. We also have three international coating facilities located in Mexico, Denmark, and China.
We have four specialty blending facilities, located in Ohio, Illinois, and Texas. These operations make custom blends of aggregates for use in industrial and commercial flooring, polymer cements, grouts and performance mortars. An additional specialty facility, Mineral Visions, located in Illinois, produces specialty colored quartz. We have a manufacturing facility in Michigan, Alpha Resins, which produces resins primarily for our own use. These properties are all on owned land and buildings. We have research and development facilities also located in Texas and Illinois. These facilities are leased.
7
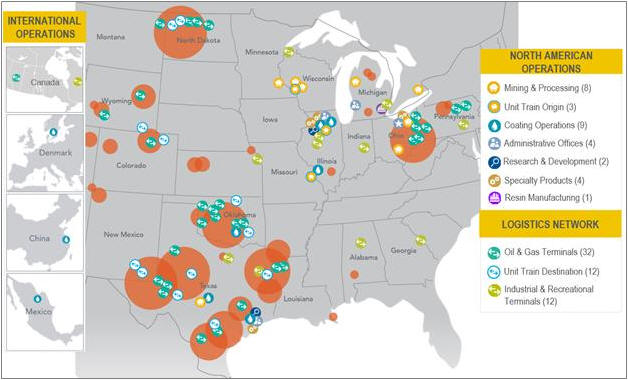
The following map reflects the location of our mining and processing, resin manufacturing, coating, specialty blending and R&D facilities and our administrative offices:
The following table reflects the segment(s) served by significant locations:
| Segment | ||||||
| Location |
Proppant Solutions |
I&R | Corporate | |||
| Chesterland, OH |
— | — | X | |||
| Ottawa, IL |
— | — | X | |||
| Sugar Land, TX |
— | — | X | |||
| Benton Harbor, MI |
— | — | X | |||
| Wedron, IL |
X | X | — | |||
| Menomonie, WI |
X | X | — | |||
| Voca, TX |
X | — | — | |||
| Brewer, MO |
X | — | — | |||
| Shakopee, MN |
X | — | — | |||
| Maiden Rock, WI |
X | — | — | |||
| Hager City, WI |
X | — | — | |||
| Harrietta, MI |
X | X | — | |||
| Chardon, OH |
— | X | — | |||
| Beaver, OH |
— | X | — | |||
| Troy Grove, IL |
X | X | — | |||
| Roff, OK |
X | — | — | |||
| Cutler, IL |
X | — | — | |||
| Fresno, TX |
— | X | — | |||
| Detroit, MI |
X | X | — | |||
| Ontario, Canada |
X | X | — | |||
| Mexico |
X | — | — | |||
| Denmark |
X | — | — | |||
| China |
X | — | — | |||
8
Product Delivery
We have established an oil and gas logistics network that we believe is highly responsive to our customers’ needs. Our terminal network includes 44 active oil and gas terminals and 12 industrial and recreational terminals. These terminals are a combination of facilities that we own or lease, as well as properties that are owned and operated by third parties. They generally consist of rail and transload operations, plus in some cases additional storage and handling facilities.
Item 10. Directors, Executive Officers and Corporate Governance
OUR EXECUTIVE OFFICERS
Executive officers are elected by and serve at the discretion of the Board of Directors (the “Board”) of Fairmount Santrol Holdings Inc. (the “Company”). The names of our current executive officers, their ages as of March 8, 2018 and their positions with the Company are set forth below, followed by certain other information about them. There are no family relationships between any of our executive officers.
| Name |
Age | Position | ||||
| Jenniffer D. Deckard |
52 | President and Chief Executive Officer | ||||
| Michael F. Biehl |
62 | Executive Vice President, Chief Financial Officer | ||||
| Gerald L. Clancey |
48 | Executive Vice President, Chief Commercial Officer | ||||
| Brian J. Richardson |
45 | Executive Vice President, Chief People Officer | ||||
| George W. Magaud |
54 | Executive Vice President, Chief Strategy & Innovation Officer | ||||
| Robert B. Larson |
46 | Executive Vice President, Engineering and Supply Chain Operations | ||||
| Daniel N. Gerber |
65 | Executive Vice President, Operations | ||||
| David J. Crandall |
51 | Executive Vice President, General Counsel and Secretary | ||||
Executive Officers of the Registrant
Jenniffer D. Deckard, age 52, has served as President, Chief Executive Officer and Director of Fairmount Santrol since 2013. Previously, Ms. Deckard served as President from January 2011 until May 2013, and Vice President of Finance and Chief Financial Officer and other previous roles in accounting and finance from 1994 until 2011. Ms. Deckard joined the Board of RPM International Inc. (NYSE: RPM) in 2015 and serves as a member of RPM’s Governance and Nominating Committee. In her local community, Ms. Deckard serves on the boards of The Cleveland Foundation and the EDWINS Foundation. She also serves on the Case Western Reserve University’s Weatherhead School of Management’s Visiting Committee and the Board of Directors for the Fairmount Santrol Foundation. Ms. Deckard received a B.S. from the University of Tulsa and an M.B.A. from Case Western Reserve University.
Michael F. Biehl, age 62, has served as Executive Vice President and Chief Financial Officer since 2016. Prior to joining Fairmount Santrol, Mr. Biehl served as Executive Vice President and Chief Financial Officer for publicly traded Chart Industries, Inc. for almost 15 years. Prior to that, he held management positions at the former Oglebay Norton Company and Ernst & Young LLP. Mr. Biehl received a B.B.A from Ohio University and M.B.A. from Northwestern University’s Kellogg School of Management. He continues to be a licensed C.P.A. in Ohio and is a member of both the OSCPA and AICPA. Locally, Mr. Biehl is actively involved at St. Joseph Academy and currently serves as Chairman of its Board of Directors.
Gerald L. Clancey, age 48, has served as Executive Vice President, Chief Commercial Officer since 2015. In this role, he has responsibility for Domestic and International Sales into the Proppant and Industrial & Recreational (I&R) channels as well as leadership for Supply Chain and Logistics. Previously, Mr. Clancey served as Executive Vice President of Supply Chain and I&R since 2011, Vice President of Sales for I&R from 2002 to 2011 and General Sales Manager for the company’s TechniSand resin-coated foundry division from 1998 to 2002. He was previously President of the Foundry Educational Foundation and served several terms on its Board of Directors. Mr. Clancey received a B.S. from Kent State University and M.B.A. from the University of Notre Dame.
Brian J. Richardson, age 45, has served as Executive Vice President, Chief People Officer since 2015. In this capacity he provides leadership for our Human Resources, Information Technology, Risk Management, Sustainable Development and Internal Communications functions. Prior to joining the company, Mr. Richardson was Sr. Vice President of Human Resources for the Global Finishes Group of The Sherwin-Williams Company. Mr. Richardson serves on the National Board of Directors of the Alzheimer’s Association, where he is a member of the Executive Committee and Chair of the Strategic Planning Committee. Locally, he serves on the Board of Directors for the United Way of Greater Cleveland, where he is a member of the Executive Committee and Chair of the Human Resources Committee. Mr. Richardson received a B.A. Finance from Baldwin-Wallace College and M.B.A. from The Ohio State University.
George W. Magaud, age 54, has served as Executive Vice President, Chief Strategy & Innovation Officer since 2015. In this role, he leads the company’s Strategic Development efforts as well as the Marketing and R&D organizations. Prior to this, he served as Executive Vice President, Strategic Development since joining the company in 2014. Previously, Mr. Magaud worked for Lafarge where he held positions in Strategy and Business Development, Marketing and Product Development, as well as Operations in Europe and in the United States. Mr. Magaud received his undergraduate degree from Yale University and a business degree from Institut d’Etudes Politiques de Paris.
9
Robert B. Larson, age 46, has served as Executive Vice President, Engineering and Supply Chain Operations since April 2016. Previously, Mr. Larson served as Senior Vice President of Engineering, Process & Technology since 2015 and Vice President of Engineering from 2011 to 2015. He served as both a Manager and then Director of Engineering from 2003 until 2011. Mr. Larson currently serves as the Chairman of the Engineering and Technology committee for The Industrial Minerals Association of North America. He holds a B.S. in Electrical Engineering from the University of Illinois and M.B.A. from the University of Michigan’s Ross School of Business.
Daniel N. Gerber, age 65, has served as Executive Vice President, Operations since 2016. Previously, Mr. Gerber served as Senior Vice President and Vice President of Operations from 2010 until 2016 and Director of Operations and Manager of Illinois Operations within the Industrial Sand Division, from 2004 until 2010. Prior to joining the company, Mr. Gerber was Vice President of Operations for Better Materials Corporation as well as the US Silica Corporation. He currently serves as the Vice Chairman of National Industrial Sand Association. Mr. Gerber received a B.S. in Mining Engineering from the University of Wisconsin-Platteville.
David J. Crandall, age 51, has served as Executive Vice President, General Counsel and Secretary since January 2017. Previously, Mr. Crandall served as Sr. Vice President, General Counsel and Secretary from January 2016 to December 2016 and Vice President, General Counsel and Secretary from January 2011 to December 2015. Prior to joining Fairmount Santrol, he was a Partner at Calfee, Halter & Griswold, L.L.P, where he practiced general corporate and merger and acquisition law. He graduated Phi Beta Kappa, Magna Cum Laude with a B.S. in Economics from Allegheny College and graduated Cum Laude from the Syracuse University College of Law.
OUR DIRECTORS
The authorized number of Directors of the Company presently is fixed at ten, with the Board divided into three Classes, each with three-year terms. Currently, two Classes, Class I and Class II, have three Directors each. The names of our Directors, their ages as of March 8, 2018 and their positions with the Company are set forth below, followed by certain other information about them:
| Name |
Age | Position | ||||
| Michael G. Fisch |
55 | Director | ||||
| Charles D. Fowler |
72 | Director | ||||
| Matthew F. LeBaron |
47 | Chairman of the Board | ||||
| Lawrence N. Schultz |
70 | Director | ||||
| Jenniffer D. Deckard |
52 | President, Chief Executive Officer and Director | ||||
| Michael C. Kearney |
69 | Director | ||||
| William P. Kelly |
68 | Director | ||||
| William E. Conway |
90 | Director | ||||
| Stephen J. Hadden |
63 | Director | ||||
| Michael E. Sand |
36 | Director | ||||
Set forth below is a brief biographical description of each of our Directors. The primary individual experience, qualifications, attributes and skills of each of our Directors that led to the Nominating and Governance Committee’s and Board’s conclusion that such Director should serve as a member of the Board are also described in the following paragraphs.
Michael G. Fisch is the President and CEO of American Securities LLC, which he co-founded in 1994. He is also a managing member, director and/or officer of numerous American Securities’ affiliates. Mr. Fisch is a Board member of Human Rights Watch where he is a Vice Chairman, Treasurer and Chairman of the Investment Committee and the Human Capital & Organizational Diversity Committee; and member of the President’s Leadership Council of Dartmouth College. Mr. Fisch holds a B.A. degree from Dartmouth College and an M.B.A. from Stanford University’s Graduate School of Business, where he has been a Distinguished Guest Lecturer since 2006. Mr. Fisch’s knowledge of general management, business operating best practices, and capital allocations makes him particularly well qualified to serve on our Board. In addition, he has proven that he is an effective leader.
Charles D. Fowler has served as a Director since 1984 and is Chairman of the Executive Committee of the Board. Mr. Fowler and the Wedron Silica management team partnered with William E. Conway in 1984 to acquire Wedron Silica and ultimately merge it with Mr. Conway’s company, Best Sand, to create Fairmount Minerals (now Fairmount Santrol). Mr. Fowler served as President and Chief Executive Officer from 1996 until his retirement in 2013. He served as the past Chairman of the Board and continues to serve on the Board of Case Western Reserve University and is on the boards of directors of Flying Horse Farms, DDC Clinic and the Greater Cleveland Water Alliance. He received a B.S. from Purdue University and completed the Executive M.B.A. program at Case Western Reserve University. Due to his experience as our former President and Chief Executive Officer, Mr. Fowler is particularly well qualified to serve on our Board. In addition, in such roles, he has proven that he is an effective leader. As one of the founders of the Company, Mr. Fowler brings to the Board an extensive understanding of the Company’s business. Mr. Fowler’s past and future service enables him to develop comprehensive knowledge of the various segments of our business and the critical internal and external challenges we face.
Matthew F. LeBaron has served as Chairman of the Board since 2010. Mr. LeBaron is a co-founder of LeBaronBrown Industries, a private investment holding company focused on investing in industrial businesses. He was previously a Managing Director at American Securities, which he joined in 1999. Mr. LeBaron serves on the board of United Distribution Group, an American Securities portfolio company, and has previously served on the boards of numerous other private and public companies. Previously, Mr. LeBaron was a
10
private equity investor at Bain Capital, Inc. and a consultant at The Boston Consulting Group. He received a B.A. from Amherst College and an M.B.A. from the Harvard Business School. As an investor with over two decades of experience, Mr. LeBaron brings to our Board the knowledge of corporate finance, corporate governance, corporate transactions, organizational development and strategic planning. Due to this experience, he is particularly well qualified to serve on our Board.
Lawrence N. Schultz has been a member of the Board of Directors since 2010, and presently serves on the Board of Directors of the Wilderness Condominium Association and Wilderness Country Club, Inc, serving as Secretary and a member of the Executive Committee, Finance Committee and Strategic Planning Committee of both. He served as an officer of Central National Bank of Cleveland, now a part of KeyBank N.A., while attending the M.B.A. and J.D. programs at Cleveland State University. He joined Calfee, Halter & Griswold LLP in 1978 after receiving his J.D. degree from Cleveland State University, and served on Calfee’s executive and management committees. He served as principal outside counsel and Secretary to Agilysys, Inc. (NASDAQ: AGYS), its Board and its Board Committees from 1999 until his retirement in 2010 and presently serves on the advisory boards of L.D. Kichler Company and Austin Powder Holding Co., Inc. Mr. Schultz received his B.A. degree from Ohio Northern University in 1970. At the time of his retirement, he served on the boards and executive committees of University Circle Inc. and The Deaconess Foundation, including as Chair of their Audit Committees, and as Chair of the Board of The Gordon Square Arts District. Mr. Schultz’s board service, legal expertise and business management experience, as well as his demonstrated successful performance as a director, qualify him to serve on our Board.
Jenniffer D. Deckard. See Ms. Deckard’s biography in “Executive Officers of the Registrant” above. Due to Ms. Deckard’s experience as our President and Chief Executive Officer, she is particularly qualified to serve on our Board. In addition, in her role as our Chief Executive Officer, she has proven that she is an effective leader. Ms. Deckard’s financial expertise and over 23 years with the Company provides our Board with intimate working knowledge of our day-to-day business, plans, strategies and initiatives.
Michael C. Kearney is the Chairman of the Board of Supervisory Directors, President and Chief Executive Officer of Frank’s International N.V. (“Frank’s International”) since September 2017. He has previously served as the Chair of its Audit Committee and a member of its Compensation Committee, and assumed the role of Chairman of the Board in January 2016. Frank’s International, a Dutch company, specializes in supplying engineered tubular services for the oil and gas industry on a global basis. Mr. Kearney formerly served as President and Chief Executive Officer of DeepFlex Inc. (“DeepFlex”) from September 2009 until June 2013, and served as DeepFlex’s Chief Financial Officer from January 2008 until September 2009. From 2004 to 2007, Mr. Kearney served as Executive Vice President and Chief Financial Officer of Tesco Corporation, a publicly held oil service company. From 1998 until 2004, Mr. Kearney served as the Chief Financial Officer and Vice President – Administration of Hydril Company, a manufacturer of products for petroleum drilling and production. Mr. Kearney has a Master of Science degree in Accountancy from the University of Houston and a Bachelor of Business Administration degree in Finance from Texas A&M University. Mr. Kearney brings to the Board extensive international business and operations experience in multiple industries, offering breadth of knowledge that benefits the Company’s diverse business units. Mr. Kearney is particularly well-qualified to serve as a Director on our Board because he brings senior management and corporate financial experience.
William P. Kelly served as Chairman and Chief Executive Officer of Unifrax Corporation from 1996 to 2006. From 2010 to 2015, he served on the Executive Council of American Securities. He is a member of The Operating Council for Kirtland Capital Partners. He is a Board member for privately held Unifrax Corporation and Smart Source Computer Rentals. He received a B.S. degree in Ceramics Engineering from Alfred University and an M.B.A. from Duquesne University. He also attended the Tuck Executive Program at Dartmouth College. We believe that, due to his experience as a chairman, chief executive officer of Unifrax as well as Board membership of Unifrax and several other private companies, he is particularly well qualified to serve on our Board. In these roles, he has proven to be an effective leader.
William E. Conway has served as Chairman of the Board (emeritus) since 2010. After he and other investors acquired Best Sand in 1978, Mr. Conway invested in Wedron Silica in 1984, along with Charles D. Fowler and the Wedron Silica management team. Best Sand and Wedron Silica then merged to form Fairmount Minerals, now known as Fairmount Santrol, in 1986. Mr. Conway served as Chairman of the Board and Chief Executive Officer of Best Sand from 1978 until 1984 and Fairmount Minerals from 1984 to 1996. From 1996 until 2010, he served as Chairman of the Board. Prior to entering the industrial minerals business in 1978, Mr. Conway held management positions with Pickands Mather & Co., Diamond Shamrock Corporation and Midland-Ross Corporation. Mr. Conway serves on the boards of directors of the Cleveland Clinic Foundation, University School and Cleveland Botanical Garden. Mr. Conway received a B.S. from Yale University and completed the Executive Program at the University of California, Berkeley. Due to his experience as our former Chairman of the Board and Chief Executive Officer, Mr. Conway is particularly well qualified to serve on our Board. In addition, in such roles, he has proven that he is an effective leader. As one of the founders of the Company, Mr. Conway brings to the Board an extensive understanding of the Company’s business. Mr. Conway’s past and future service enables him to develop comprehensive knowledge of the various segments of our business and the critical internal and external challenges we face.
11
Stephen J. Hadden has over 40 years of experience in the oil and gas industry, having served in various management roles for Texaco Inc., now Chevron Corporation, and more recently as Executive Vice President of Worldwide Exploration and Production for Devon Energy Corporation from 2004 until 2009. Mr. Hadden is currently a director of Ulterra Drilling Technologies, a leading PDC bit supplier in the U.S., and serves as a Senior Executive Advisor for Tennenbaum Capital Partners, LLC, a leading alternative investment management firm. Previously, Mr. Hadden was a director of LINN Energy from 2013 until 2017 and with Berry Petroleum Company from 2011 until its merger with LINN Energy. Mr. Hadden also served with the following entities: The Advisory Board of the Society of Petroleum Engineers, the Upstream Committee of the American Petroleum Institute, and the Western States Petroleum Association. He has a Bachelor of Science degree in Chemical Engineering from The Pennsylvania State University. Due to his significant experience in the oil and gas industry, including service on industry advisory boards, and his experience serving on public company boards and committees, Mr. Hadden is particularly well qualified to serve on our Board.
Michael E. Sand joined American Securities in 2005 and currently serves as a Principal at the firm. Previously, Mr. Sand worked at Goldman Sachs, where he focused on mergers and acquisitions and strategic advisory assignments. He is a member of the Board of Directors of MW Industries, Ulterra Drilling Technologies, Blue Bird Corporation (NASDAQ: BLBD) and GTL. He was previously a director of Delphi Midstream Partners. He received a B.S. from the University of Pennsylvania and a M.B.A. from Columbia University. Mr. Sand’s knowledge of corporate finance, funds management, corporate transactions and strategic planning makes him particularly well qualified to serve on our Board.
SECTION 16(a) BENEFICIAL OWNERSHIP REPORTING COMPLIANCE
Section 16(a) of the Exchange Act requires the Company’s officers and Directors and persons who own 10% or more of a registered class of the Company’s equity securities, to file reports of ownership and changes in ownership on Forms 3, 4 and 5 with the Commission. Officers, Directors and 10% or greater stockholders are required by SEC regulations to furnish the Company with copies of all Forms 3, 4 and 5 they file.
Based solely on the Company’s review of the copies of such forms it has received, the Company believes that all of its officers and Directors complied with all filing requirements applicable to them with respect to transactions during the fiscal year ended December 31, 2017.
INFORMATION CONCERNING THE BOARD OF DIRECTORS
Our Board has an Executive Committee, an Audit Committee, a Compensation Committee and a Nominating and Governance Committee. The Executive Committee exercises the power and authority of the Board in the period between Board meetings. The functions of each of the Audit Committee, the Compensation Committee and the Nominating and Governance Committee are governed by charters that have been adopted by our Board. Our Board also has adopted Corporate Governance Guidelines to assist it in the exercise of its responsibilities, and a Corporate Code of Business Conduct and Ethics that applies to our Directors, officers, and employees (the “Code of Ethics”).
The charters of the Audit Committee, Compensation Committee and Nominating and Governance Committee, the Corporate Governance Guidelines and the Code of Ethics are available on our website at www.fairmountsantrol.com and in print to any stockholder who requests a copy. Requests for copies should be directed to Secretary, Fairmount Santrol Holdings Inc., 8834 Mayfield Road, Chesterland, Ohio 44026. We intend to disclose any amendments to the Code of Ethics, and any waiver of the Code of Ethics granted to any Director or executive officer, on our website. As of the date of this Proxy Statement, there have been no such waivers.
Audit Committee
The Audit Committee is designed to assist the Board in fulfilling its oversight of the integrity of our financial statements, our compliance with legal and regulatory requirements, the independent auditor’s qualifications and independence, and the performance of our internal audit function and independent auditor, and producing the Audit Committee Report. The specific functions and responsibilities of our Audit Committee are set forth in the Audit Committee Charter which is available on the Company’s website.
Our Board has determined that each member of the Audit Committee is financially literate and satisfies the current independence standards of the NYSE listing standards and Section 10A(m)(3) of the Securities Exchange Act of 1934, as amended (the “Exchange Act”). Our Board has also determined that each of Messrs. Schultz, Kearney and Kelly qualifies as an “audit committee financial expert” as that term is defined in Item 407(d) of Regulation S-K of the Exchange Act. Each of Messrs. Schultz, Kearney and Kelly also satisfies the NYSE accounting and financial management expertise requirements.
12
| Item 11. | Executive Compensation |
COMPENSATION DISCUSSION AND ANALYSIS
Introduction
In this Compensation Discussion and Analysis, or CD&A, we describe our executive compensation framework, including our philosophy, objectives and design, our compensation setting process, our executive compensation program components, and the decisions made in 2017 with respect to the compensation of each of our named executive officers. The following disclosure also gives context for the data we present in the compensation tables below and the narratives that accompany the compensation tables.
The following individuals are our named executive officers for 2017, as that term is defined by the SEC.
| Name | Title | |
| Jenniffer D. Deckard | President and Chief Executive Officer | |
| Michael F. Biehl | Executive Vice President and Chief Financial Officer | |
| Gerald L. Clancey | Executive Vice President and Chief Commercial Officer | |
| George W. Magaud | Executive Vice President and Chief Strategy and Innovation Officer | |
| Brian J. Richardson | Executive Vice President and Chief People Officer |
Compensation Framework
Our executive compensation program is focused on promoting overall performance and maximizing long-term stockholder value. We expect our executive team to possess and demonstrate strong leadership and management capabilities in line with our mission and core principles. To reward and retain our leaders, including our named executive officers, we have designed a total compensation approach that rewards both short-term and long-term success, based on value creation and sustainable corporate growth for our stockholders. Overall, our executive compensation program is structured to align the financial interests of our executive officers and our stockholders by encouraging and rewarding our executive officers for performance that achieves or exceeds significant financial and operational performance goals and by holding them accountable for results. The Compensation Committee and management regularly review those programs to make sure they are meeting the business challenges to achieving our growth and value creation goals.
Philosophy
We are focused on our mission to exceed all expectations while fulfilling our economic, social, and environmental responsibilities. We rely on these core principles to unite us in our vision of sustainability: ethics, safety, leadership, total quality, environmental stewardship, empowerment, personal excellence, celebration/fun, continuous improvement, health and wellness, teamwork/shared ownership and social responsibility.
We need a highly talented team of executives who believe in our mission and principles. In structuring our executive compensation packages, our Board and our Compensation Committee consider how each component of compensation promotes retention, motivates executive performance and furthers our mission. We believe that to attract and retain high quality senior executives, we must provide them with a competitive level of compensation that rewards their outstanding contributions and commitment. We also believe that performance- and equity-based compensation play a significant role in aligning the interests of management with the long-term interests of our stockholders.
To ensure our executive compensation is an effective tool to attract, motivate and retain executive talent, our Board defined the Company’s philosophy with respect to our named executive officers’ pay position to be relative to executives with similar positions at companies within our compensation peer group. The Compensation Committee and management determined an appropriate pay philosophy for the Company:
| • | Salaries should approximate the 50th percentile; |
| • | Annual bonus opportunities, at target, should fall within the 50th to 75th percentile range; and |
| • | Target long-term incentive awards, such as stock option, RSUs and PRSUs, should fall within the 50th to 75th percentile range. |
Our Compensation Committee reaffirmed this philosophy in connection with its annual executive compensation program review in 2017. We target the general industry’s 50th and 75th percentile range based on findings that show target pay in the oil & gas industry appears to be greater than that for a general industrial company similar to our size. Accordingly, our pay philosophy positions us near the oil and gas industry’s median.
Currently, the target compensation levels for our named executive officers, except our CEO, approximates market median. Almost all of our named executive officers receive salaries within 11% of market median. Target bonus multiples are generally in the market’s top quartile, positioning our target cash compensation in the market’s second quartile (between the 50th and 75th percentiles). Target long-term equity incentive values approximate the second quartile, positioning target direct pay at approximately the 60th percentile of the market. Currently, the target compensation for our CEO is below the targeted pay position. As a result, the Compensation Committee may consider approaches to bring the compensation of our CEO in line with our philosophy in a responsible and reasonable timeframe and manner.
Objectives
Our compensation programs for our named executive officers are built to support the following objectives:
| • | attract, retain and motivate highly qualified executives to deliver the highest level of results; |
13
| • | reward high levels of achievement based performance on indicators that promote value creation and sustainable corporate growth with commensurate levels of compensation; |
| • | build stock ownership and align the interests of our executives with those of our stockholders through equity-based incentives; and |
| • | encourage our executives to fulfill our mission, model our core principles and live by our company motto of “Do good. Do well.” |
Design
Our executive compensation program has three main components: (1) base salary; (2) annual cash incentive compensation; and (3) long-term incentive awards. Each component is designed to be consistent with the Company’s compensation philosophy.
To align pay with the interests of our stockholders, we strive to create competitive compensation packages that cultivate long-term value creation without taking unnecessary risks. We believe that a combination of both short-term and long-term compensation creates an optimal pay-for-performance environment. We motivate and reward our executive officers for successfully executing our mission and for achieving annual strategic targets. The compensation program for our executives has been designed to emphasize variable pay over fixed pay and to reward long-term achievement.
We support our objectives through an executive compensation program that includes a mix of fixed and at-risk compensation, which is intended to motivate our executives to exceed our goals and reward them in a manner that is commensurate with their levels of achievement. Our short-term incentive plan is designed around clear, concise, effective and measurable performance indicators that we believe are directly linked to value creation and sustainable corporate growth. In addition, our executive compensation program includes a significant equity-based component. We believe that equity compensation offers the best vehicle to focus our executive officers on our mission and the achievement of our long-term strategic and financial objectives, and to align our executive officers with the long-term interests of our stockholders.
Role of the Compensation Committee
The Compensation Committee is responsible for overseeing all aspects of our executive compensation programs, including executive salaries, payouts under our annual bonus plan, the size and structure of equity awards, and any executive perquisites. The Compensation Committee is solely responsible for annually reviewing and determining the compensation of our CEO, and reviews and approves compensation of other executive officers.
The Compensation Committee Charter requires the Compensation Committee to oversee the Company’s compensation programs and, in consultation with the CEO, develop and recommend to the Board an appropriate compensation and benefits philosophy and strategy for the Company. The Compensation Committee Charter is available on our website at www.fairmountsantrol.com.
Role of Management in Determining Compensation
In setting compensation for 2017, our CEO and members of our human resources group, worked closely with the Compensation Consultant and the Compensation Committee. These members of management often attended meetings of the Compensation Committee to provide an analysis of market compensation data. In addition, our General Counsel typically attends meetings of the Compensation Committee to present information, record minutes and answer applicable questions. Our CEO made recommendations to the Compensation Committee regarding compensation and annual bonus goals for our executive officers (other than themselves) because of their daily involvement with our executive team. No executive officer participated directly in the final deliberations or determinations regarding his or her own compensation package.
Comparative Framework
The Compensation Committee utilizes a peer group for pay and performance benchmarking to evaluate whether executive officer pay levels are aligned with Company performance on a relative basis. The Compensation Committee has identified (i) a compensation peer group for executive officer pay benchmarking, which we refer to as our compensation peer group, and (ii) a performance peer group for payment of long-term incentive performance-based awards, which we refer to as our performance peer group. The Compensation Committee primarily identifies public companies that are of comparable size or scale (based on revenue, market capitalization, total assets, enterprise value and number of employees) and operating in the oil and gas field services or basic materials industries. The identity of the companies included in both of our peer groups is adjusted from time to time to reflect the impact of mergers, acquisitions, or other significant events to ensure the reference companies continue to meet the established criteria for comparison.
Compensation Peer Group
The Compensation Committee utilizes a peer group of companies to ensure that our executive compensation program is competitive in the market. The Compensation Committee retained Pay Governance LLC (the “compensation consultant”), an independent compensation consulting firm, to conduct a compensation benchmark study. The compensation consultant annually reviews peer group proxy data to identify the compensation paid to executives holding equivalent positions or having similar responsibilities at a group of basic materials and oil & gas field services companies with comparable sales that are considered to be our peers. The compensation consultant also compiles compensation data derived from broad-based surveys of industrial companies of similar size to us. The peer group is also used to benchmark general pay program design characteristics.
In August 2016, the Compensation Committee, with input from its compensation consultant and management, assessed our peer group. The Compensation Committee considered the changes in our capital structure and revenues resulting from the turbulent economic environment during 2015 and 2016 to identify a peer group that was indicative of our expected revenue size in the foreseeable future at the time of 2017 pay decisions.
14
This analysis resulted in a peer group with annual revenue ranging from $200 million to $1.7 billion, with median annual revenue of about $900 million (which equates to approximately 0.35x to 3.0x our 2016 revenue). The 18 companies in the peer group used for 2017 pay decisions comprised:
| Basic Energy Services, Inc. | Headwaters Incorporated | Pioneer Energy Services | ||
| CARBO Ceramics Inc. | Helix Energy Solutions Group, Inc. | RPC, Inc. | ||
| Compass Minerals International, Inc. | Key Energy Services, Inc. | TETRA Technologies, Inc. | ||
| Dril-Quip, Inc. | Minerals Technologies Inc. | U.S. Concrete, Inc. | ||
| Eagle Materials Inc. | Newpark Resources, Inc. | U.S. Silica Holdings, Inc. | ||
| Forum Energy Technologies, Inc. | Oil States International, Inc. | Summit Materials, Inc. |
For the 2017 peer group, the following companies were eliminated for the following reasons:
| • | Martin Marietta Materials, Granite Construction and Tronox were all too large, each with revenue that exceeded $2.0 billion, the upper boundary of our size-based peer screen; |
| • | C&J Energy Services was entering Chapter 11 in 2017; and |
| • | Seventy Seven Energy was acquired. |
For the 2017 peer group, the following companies were added because they fit the business criteria and had revenues less than $2.0 billion:
| • | Summit Materials, Inc. and Pioneer Energy Services. |
15
Performance Peer Group
In 2017, the Compensation Committee with input from management and our Compensation Consultant approved a broader performance peer group against which to measure our 2017-2019 LTIP performance cycle. Our performance peer group is comprised of certain peer companies included in our compensation peer group plus additional companies that are primarily engaged in the oil and gas field services or basic materials industries. Based on input from our Compensation Consultant and management, the Compensation Committee reviewed and selected additional peer group companies for inclusion in our performance peer group that are comparable to us. We believe a larger performance peer group eliminates some of the outliers in terms of extreme positive or negative performance. For the 2017-2019 performance cycle, the companies in the performance peer group consisted of:
| Archrock Partners, L.P. | Forum Energy Technologies, Inc.* | Profire Energy, Inc. | ||
| Archrock, Inc. | Gulf Island Fabrication, Inc. | Rowan Companies plc | ||
| Atwood Oceanics, Inc. | Helix Energy Solutions Group, Inc.* | RPC, Inc.* | ||
| Basic Energy Services, Inc.* | Helmerich & Payne, Inc. | SAExploration Holdings, Inc. | ||
| CARBO Ceramics Inc.* | Hi-Crush Partners LP | Steel Excel Inc. | ||
| Compass Minerals International, Inc.* | Independence Contract Drilling, Inc. | Summit Materials, Inc. | ||
| CSI Compressco LP | Key Energy Services, Inc.* | Superior Drilling Products, Inc. | ||
| Dawson Geophysical Company | Martin Marietta Materials, Inc.* | Superior Energy Services, Inc. | ||
| Diamond Offshore Drilling, Inc. | Natural Gas Services Group, Inc. | Tesco Corporation | ||
| Dril-Quip, Inc. | Oceaneering International, Inc. | TETRA Technologies, Inc. | ||
| Eco-Stim Energy Solutions, Inc. | Oil States International, Inc. | U.S. Silica Holdings, Inc. | ||
| Enservco Corporation | Parker Drilling Company | Unit Corporation | ||
| Exterran Corporation | Patterson-UTI Energy, Inc. | USA Compression Partners, LP | ||
| Forbes Energy Services Ltd. | Pioneer Energy Services Corp. | Vulcan Materials Company |
| * | Also included in our compensation peer group. |
Elements of Compensation
Our named executive officer compensation program for fiscal 2017 included three main elements:
| • | Base salary; |
| • | Annual performance-based cash incentives; and |
| • | Long-term equity-based compensation in the form of non-qualified stock options and service-and performance-based RSUs. |
Pay Mix
We use these particular elements of compensation because we believe that they provide a balanced mix of fixed compensation and at-risk compensation that produces short-term and long-term performance incentives and rewards. With this balanced portfolio, we provide the executive with a base salary while motivating the executive to focus on the business metrics that will produce a high level of performance and provide the executive with additional compensation through short- and long-term incentives.
16
Total Direct Compensation
The target compensation of our named executive officers is based on principles of our executive compensation program with rewards for performance. We have three elements of total direct compensation: base salary, annual incentives and long-term incentives, which are described below. We also provide standard health and retirement plans and limited perquisites.
| Compensation Component | Key Characteristics | Purpose | ||
| Base Salary | Fixed compensation, reviewed and adjusted annually, if and when appropriate | Compensate named executive officers fairly for the responsibility level of the position held | ||
| Annual Bonus | Variable, performance-based compensation | Motivate and reward named executive officers for achieving annual business objectives over which they have some degree of influence and control | ||
| Equity Compensation: Stock Options, RSUs and PRSUs |
Variable, performance- and service-based compensation, awarded under the Long Term Incentive Plan | Retain executives through the vesting period, reward executives for achieving performance objectives, facilitate shared ownership among the executives, and align interests of our executives with those of our stockholders | ||
| Health and Retirement Plans | Fixed compensation | Intended to attract and retain qualified executive officers and to provide benefits that promote employee health and support employees in attaining financial security; generally, the benefits provided to our named executive officers are the same as for our other employees | ||
| Perquisites and other Personal Benefits | Fixed compensation | Intended to be relatively modest in nature and to provide a business-related benefit to the Company, and to assist in attracting and retaining executive officers | ||
Base Salary
We pay annual base salaries to provide a fixed base of cash compensation to our named executive officers for their services to us during the year. The Compensation Committee believes base salaries are a necessary element of compensation in order to attract and retain highly qualified executive officers. Base salary is further influenced by internal pay equity and market benchmarks and trends.
The Compensation Committee reviews base salaries for our executive officers at least annually and may adjust them from time to time. Adjustments to salaries may be made taking into consideration the specific roles and responsibilities and individual performance of our named executive officers on a day-to-day basis during the year as well as market pay levels and trends around merit increases.
Effective January 1, 2018, the Compensation Committee approved base salary increases of 3% for all executive officers. These increases are in line with our pay philosophy and broad market trends.
Annual Bonus
Overview
The goal of our annual bonus program is to incentivize our employees and executives to achieve certain performance objectives. Our Compensation Committee works with our CEO to establish a target bonus for each of our named executive officers. Our Compensation Committee establishes the target bonus level for our CEO. The amount of that target bonus actually paid to each named executive officer in any given year is dependent upon the extent to which we achieve the performance objectives established under the annual bonus program for that year.
We hold our named executive officers accountable for our performance and for executing key strategic initiatives by tying a major portion of their compensation to the achievement of annual and multi-year performance objectives. This accountability includes setting what we believe to be “stretch” goals. The achievement of these goals requires exceptional performance, especially when the external environment changes. This tight connection between financial performance and compensation contemplates that in years when the targets are not fully achieved, our named executive officers do not receive their total targeted cash compensation including their goal-targeted incentives. When performance meets or exceeds the goals that drive shareholder value however, our compensation philosophy rewards our named executive officers accordingly.
2017 Annual Bonus Targets
The target for annual bonuses established by our Compensation Committee for our named executive officers with respect to 2017 performance for Ms. Deckard was 115% of base salary, for Messrs. Biehl and Clancey was 100% of base salary, and for Messrs. Richardson and Magaud was 75% of base salary. The target for Ms. Deckard’s annual bonus increased from 100% to 115% to better align her total cash compensation (base salary plus annual bonus) to prevailing market benchmarks.
17
2017 Annual Bonus Metrics
| Metrics and Weightings | Rationale for Selection | |
| 60% Adjusted EBITDA | EBITDA is a measure of profitability and general financial performance with a strong link to stockholder value. In addition, this measure is broadly tracked by investors and used for valuation purposes. | |
| 20% Working Capital | Working Capital focuses executives on management of capital and cash to support reinvestment in the business and our strategic actions. | |
| 20% Sustainable Development | Sustainable Development goals from 13 Company-wide teams improve both stockholder value as well as relations with our other stakeholders, such as our employees, business partners and the communities in which we do business. | |
Each year, the Compensation Committee considers the following adjustments to performance results when determining incentive payouts. Adjustments include those that: (1) encourage appropriate actions for the long-term health of the business, (2) likely will not have a material adverse effect on Company value, and (3) are fair to participants as well as stockholders. Potential adjustments include such items as asset write-offs and goodwill and asset impairment charges, unbudgeted changes in tax or accounting principles and rules, unbudgeted restructuring charges, unplanned legal settlements and claims, non-recurring extraordinary events and stock compensation expense.
Our named executive officers had a 2017 annual bonus opportunity based 60% on Adjusted EBITDA, 20% on Working Capital and 20% on Sustainable Development. We calculated EBITDA by adding depreciation and amortization to operating profit and adjusting for items set out in the previous paragraph. We calculated Working Capital by subtracting accounts payable and accrued expenses from accounts receivable and inventories and dividing by our annualized three month rolling revenues. Working capital as a percent to sales was calculated each month and the average of each month in 2017 was used to calculate the yearly average. We calculated Sustainable Development by determining the weighted average percentage of the 13 sustainable development teams’ objectives achieved during the year.
| Sustainable Development Teams | ||||
| Best Practices | Empower U | Social Responsibility | ||
| Business Innovation | Health and Wellness | Sustainable Mobility | ||
| Clean Water | QUEST for Eco-Efficiency | Sustainable Value Chain | ||
| Communications and Appreciative Inquiry | Recover, Recycle, Reuse | |||
| Environmentally Responsible Products and Processes | Safety | |||
18
2017 Annual Bonus Payment
The following table sets forth the information regarding the performance objectives established and actual performance results for 2017:
| 2017 Short-Term Incentive Plan (STIP) Goals | ||||||||||||
| Goal Metric |
Weighting | Threshold | Target | Upside Leverage |
Actual | % Payout of STIP Target | ||||||
| Adjusted EBITDA ($MM) |
60% | $51.2 | $102.4 | $133.1 | $207.6 | 442.0% | ||||||
| Working Capital (% to sales) |
20% | 14.9% | 13.4% | 11.9% | 9.6% | 353.8% | ||||||
| Sustainable Development (completion of initiatives) |
20% | 90.0% | 100.0% | 110.0% | 95.9% | 95.9% | ||||||
| Total Payout % of Target |
355.1% | |||||||||||
The following table sets forth the target award opportunities and the actual awards earned for 2017:
| 2017 Short-Term Incentive Plan (STIP) Opportunity | ||||||||
| Executive | Target | 2017 STIP Actually Earned | ||||||
| % of Salary |
Bonus Amount |
% of Target |
STIP Amount | |||||
| Jenniffer Deckard |
115% | $575,000 | 355.1% | $2,041,825(1) | ||||
| Michael Biehl |
100% | $453,200 | 355.1% | $1,609,313 | ||||
| Jerry Clancey |
100% | $353,100 | 355.1% | $1,253,858 | ||||
| George Magaud |
75% | $235,613 | 355.1% | $836,660 | ||||
| Brian Richardson |
75% | $228,369 | 355.1% | $810,938 | ||||
| (1) | The Compensation Committee has the authority to exercise discretion in approving the amount of any bonus, notwithstanding the performance criteria established for bonuses. This discretion was not exercised in 2017 for any executive officer. However, Ms. Deckard requested that the Compensation Committee reduce her 2017 bonus, and as a result of such reduction Ms. Deckard voluntarily forfeited $341,825 of her earned 2017 STIP amount of $2,041,825. Ms. Deckard’s actual 2017 STIP payout was $1,700,000. The Company, in its sole discretion, made a cash contribution in the amount of $341,825 to the Fairmount Foundation. |
2018 Annual Bonus Plan
We are making minimal changes to our 2018 STIP. The target bonus opportunities for all of the named executive officers are unchanged. The threshold payouts will be changed to 50% of target for both Adjusted EBITDA and Working Capital, and the threshold for Sustainable Development will continue to be 90%. In addition, plan maximums at 230% of target for Adjusted EBITDA and 200% of target for Working Capital had been implemented, and the plan maximum for Sustainable Development will continue to be 110%. In the aggregate, our 2018 STIP has a plan maximum payout of 200%.
Equity Compensation
We use equity incentive awards available under the Long Term Incentive Plan to retain executives and other key employees and achieve the following additional goals:
| • | to incentivize future performance (both short-term and long-term); |
| • | to align executives’ long-term interest with that of the stockholders; |
| • | to enhance our longer-term performance and profitability; and |
| • | to facilitate share ownership for our executives. |
19
Our current intention is to achieve these goals by making annual awards to our executive officers and other key employees, using a combination of stock options and stock settled service- and performance-based RSUs.
In 2017, the recommended form of grants that struck a balance between all three elements and were comprised of the following based on target grant value: 35% for non-qualified stock options, 35% for performance restricted stock units (PRSUs) and 30% for time restricted stock units (RSUs).
Stock Options
Stock option awards are intended to retain and reward executives for stock performance and achievement of specified performance goals. Stock options are granted with an exercise price of no less than the fair market value of our Common Stock as of the date of grant and have a ten-year term. The options granted before March 1, 2016 fully vest on the fifth anniversary of the grant date, but one-third of the option may accelerate in vesting each year of the period if annual/cumulative performance goals are met, based on EBITDA targets. If the performance goals are not met, then the options will fully vest at the end of the five-year period as long as the executive is an employee of the Company or has retired (i.e. voluntary termination upon attaining age 55 and providing at least 10 years of service). Due to the introduction of PRSUs (as described below), the stock options granted after March 1, 2016 will not include performance goals that result in accelerated vesting and will vest ratably over three years.
RSUs
Awards of RSUs also help us in retaining and rewarding our named executive officers. Each RSU entitles the holder to receive one share of our Common Stock upon the unit’s vesting. The RSUs granted before March 1, 2016 will fully vest on the sixth anniversary of the grant date. If certain cumulative EBITDA targets are achieved by year four or year five, then the RSUs will accelerate and fully vest upon such achievement. Due to the introduction of PRSUs (as described below), the RSUs granted after March 1, 2016 will not include performance goals that result in accelerated vesting and will vest ratably over four years as long as the executive is an employee of the Company or has retired (i.e., voluntary termination upon attaining age 55 and providing at least 10 years of service).
PRSUs
Awards of PRSUs are measured and earned on three years of performance, cliff vest after the end of the performance period, vest based on the level of achievement, and are payable in unrestricted stock after completion of the performance period. Each vested PRSU will entitle the grantee to receive one share of our Common Stock.
In selecting performance measures for the PRSUs, the Compensation Committee determined, in consultation with our Compensation Consultant, that the LTIP should provide rewards for successful, profitable growth over a three-year time horizon and that the best way to measure our success was through relative performance versus an expanded peer group of similarly situated organizations, or our performance peer group. For PRSUs granted in 2016 for the 2016-2018 performance cycle and PRSUs granted in 2017 for the 2017-2019 performance cycle, the payouts will be based on average return on invested capital (ROIC). ROIC is determined by dividing our annual operating income by our invested capital. All relative performance measures are determined by using published financial information in each peer company’s annual report that reflects results during the performance period. PRSU awards are leveraged with payouts of 0%, 100%, and 200% at threshold, target, and maximum, respectively. Threshold payouts are earned for 25th percentile performance, target at 50th percentile performance, and maximum at 75th percentile performance or greater (when compared to the performance of our peer group). Straight line interpolation will be used to determine results if actual performance falls between specified percentiles. Further, if average ROIC does not achieve at least 25th percentile performance, no awards will be earned.
The Compensation Committee chose to use ROIC as the performance metric for PRSU payout – a key metric that aligns with our commitment to stockholders to improve both capital spending and working capital management, ensuring that we continue to improve the efficiency of our asset base.
Timing of Equity Grants
Pursuant to a policy adopted by the Compensation Committee in 2015, the effective grant date for annual grants of equity-based awards to existing officers, employees and consultants will be made on March 1st of each year. Grants of equity-based awards to new hires or for promotions, retention or purposes other than annual or other broad-based Company-wide grants shall be approved at regularly scheduled meetings of the Compensation Committee, which are typically set at least nine months in advance. The grant date of new-hire, promotion or other awards shall be (i) the date the award is approved by the Compensation Committee or (ii), to the extent an award has been granted pursuant to the authority delegated to the CEO, the 10th day of the month following the month during which the recipient’s employment, promotion or recognition commenced, as applicable. All stock option awards to named executive officers are granted with an exercise price equal to the fair market value of the underlying Common Stock on the date of grant. The Compensation Committee does not grant equity compensation awards in anticipation of the release of material nonpublic information. Similarly, we do not time the release of material nonpublic information based on equity award grant dates.
Executive Change in Control Severance Plan
The Compensation Committee adopted and approved an Executive Change in Control Severance Plan, effective as of January 1, 2016 (which we refer to as the “CIC Plan”), as part of its ongoing review of our executive compensation program and to continue aligning our compensation program with market practices for a publicly held corporation. Executives selected by the Compensation Committee will be eligible to participate in the CIC Plan. The Compensation Committee adopted the CIC Plan to reflect market practice, create consistency across our compensation arrangements and formalize a severance policy for a group of our executives. Generally, the CIC Plan provides that a participant would receive a severance payment equal to two times (or three times in the case of Ms. Deckard) his or her base salary and annual bonus target plus a prorated annual bonus based on target level achievement if the Company (or its successor) terminates his or her employment without cause, or he or she terminates employment for good reason, within a two-year period following a change in control of the Company. The material terms of the CIC Plan are provided in the section titled “Other Potential Post-Employment Compensation” below.
20
Stock Ownership Guidelines for Executive Officers and Directors
We adopted stock ownership guidelines for our executive officers in September 2015. Under the stock ownership guidelines, certain executive officers are required to maintain the following minimum equity stakes:
| • | for our CEO and President, Common Stock equivalent to six times annual base salary; |
| • | for our Executive Vice Presidents and those other executive officers who are subject to the requirements of Section 16 of the Exchange Act, Common Stock equivalent to two times annual base salary. |
Participants may satisfy their ownership guidelines with Common Stock in the following categories, to the extent applicable:
| • | Shares owned directly; |
| • | Shares owned in the Company’s 401(k) program; |
| • | Shares owned indirectly (e.g., by a spouse, a trust or deferred shares); and |
| • | Time-based restricted stock, restricted stock units or phantom stock. |
Unexercised options and unearned performance shares are not counted toward meeting the guidelines.
Executives are expected to achieve targets within five years of the later of the date of the adoption of the stock ownership guidelines for executives or the date of assuming their positions. Each of our executive officers met the stock ownership guidelines as of December 31, 2017, or is within the grace period provided by the stock ownership guidelines to achieve compliance.
In May 2016, the Board established a minimum share ownership requirement to ensure that the interests of our Directors are aligned with the interests of our stockholders. Unaffiliated non-employee Directors (“Applicable Directors”), are expected to achieve targets within five years of the later of the date of the adoption of the stock ownership guidelines for Directors or the date of assuming their position. Each Applicable Director is required to own shares of Common Stock equal in value to the lesser of $375,000 or five times the annual Board cash retainer. Each of our unaffiliated non-employee Directors met the stock ownership guidelines as of December 31, 2017, or is within the grace period provided by the stock ownership guidelines to achieve compliance.
Clawback Policy
We adopted a clawback policy in 2016 that applies in the event we are required to prepare an accounting restatement under certain circumstances. Our clawback policy looks back over three years, and applies to all incentive compensation, including equity, and covers current and former officers and certain other key employees. The clawback policy requires repayment of the excess amount paid (i.e., what actually was received over that which should have been received given the restatement, as determined by the Board), and provides for Board or Compensation Committee discretion with respect to the cost and method of seeking recovery based on the facts and circumstances of any restatement.
Other Benefits; Executive Perquisites
Our named executive officers participate in various employee benefit plans that are generally available to all employees and on the same terms and conditions as with respect to other similarly situated employees. These include normal and customary programs for life insurance, health insurance, prescription drug insurance, dental insurance, short and long term disability insurance and matching gifts for charitable contributions. While these benefits are considered to be an important and appropriate employment benefit for all employees, they are not considered to be a material component of a named executive officer’s annual compensation program. Because the named executive officers receive these benefits on the same basis as other employees, these benefits are not established or determined by the Compensation Committee separately for each named executive officer as part of the named executive officer’s annual compensation package. In addition, we provide minimal perquisites to our named executive officers.
Retirement Plans
We currently maintain a retirement plan intended to provide benefits under Section 401(k) of the Internal Revenue Code (the “Code”) where employees, including our named executive officers, are allowed to contribute portions of their base compensation and bonus payments to a tax-qualified retirement account. In 2017, we also maintained a defined contribution profit sharing plan for the benefit of all of our employees as well as a separate retirement restoration plan, which provides employees with non-qualified deferred compensation benefits that restore benefits that are reduced under our 401(k) Plan due to limitations imposed under the Code. See “Additional Narrative Disclosure –Retirement Benefits” for more information.
21
Tax Considerations
The Compensation Committee’s general philosophy has historically been to qualify future compensation for tax deductibility wherever applicable and appropriate. Qualification has been sought to the extent practicable and only to the extent that it has been consistent with overall compensation objectives. As part of the 2017 Tax Cuts and Jobs Act (the “Tax Reform Act”), the ability to rely on the performance-based compensation exception under Section 162(m) was eliminated, and the limitation on deductibility generally was expanded to include all named executive officers. As a result of the Tax Reform Act, we will no longer be able to deduct any compensation paid to our named executive officers in excess of $1.0 million. The Compensation Committee will assess the impact of the amendments to Section 162(m) to determine what adjustments to our executive compensation practices, if any, it considers appropriate.
Anti-Hedging and Anti-Pledging Policy
We prohibit our Directors, executive officers and other insiders from hedging their ownership of our Common Stock, including trading in options, puts, calls, or other derivative instruments related to our Common Stock or debt. Directors, executive officers and other insiders are prohibited from purchasing our Common Stock on margin. Borrowing against our Common Stock held in a margin account or pledging our Common Stock as collateral for a loan is strongly discouraged, is subject to various limitations, and requires pre-clearance from our General Counsel. This policy helps to assure that our named executive officers and other senior officers remain subject to the risks, as well as the rewards, of stock ownership.
REPORT OF THE COMPENSATION COMMITTEE
The Compensation Committee has reviewed and discussed the Compensation Discussion and Analysis required by Item 402(b) of Regulation S-K with the Company’s management and legal counsel. Based on that review and discussion, the Compensation Committee recommended to the Board of Directors that the Compensation Discussion and Analysis be included in the Company’s Annual Report on Form 10-K.
COMPENSATION COMMITTEE
William P. Kelly, Chairman
Stephen J. Hadden
Matthew F. LeBaron
22
EXECUTIVE COMPENSATION – TABULAR DISCLOSURE
Summary Compensation Table
The following table sets forth compensation information for our named executive officers.
| Summary Compensation Table | ||||||||||||||||||||||||||||||||||||
| Name and Principal Position |
Year | Salary ($) |
Bonus ($) |
Stock Awards ($)(3)(4) |
Option Awards ($)(3)(4) |
Non-Equity Incentive Plan Compensation ($)(5) |
Nonqualified Deferred Compensation Earnings ($)(6) |
All Other |
Total ($) |
|||||||||||||||||||||||||||
| Jenniffer D. Deckard, CEO |
2017 | 500,000 | 566,695 | 384,306 | 1,700,865 | (8) | 56,561 | 18,077 | 3,226,504 | |||||||||||||||||||||||||||
| 2016 | 450,000 | 218,280 | 182,900 | 181,430 | 11,795 | 1,046,421 | ||||||||||||||||||||||||||||||
| 2015 | 450,000 | 72,406 | 192,720 | 140,845 | 32,601 | 38,857 | 927,429 | |||||||||||||||||||||||||||||
| Michael F. Biehl, CFO (1)(2) |
2017 | 453,200 | 435,302 | 261,510 | 1,610,168 | 17,202 | 2,777,382 | |||||||||||||||||||||||||||||
| 2016 | 311,667 | 200,000 | 797,138 | 421,040 | 176,610 | 3,991 | 1,910,446 | |||||||||||||||||||||||||||||
| Gerald L. Clancey, EVP |
2017 | 353,100 | 329,987 | 169,792 | 1,254,723 | 24,432 | 20,057 | 2,152,091 | ||||||||||||||||||||||||||||
| 2016 | 330,000 | 408,690 | 111,600 | 133,430 | 24,357 | 1,008,077 | ||||||||||||||||||||||||||||||
| 2015 | 316,672 | 72,406 | 192,720 | 75,345 | 13,854 | 37,015 | 708,012 | |||||||||||||||||||||||||||||
| George W. Magaud, EVP |
2017 | 314,150 | 178,534 | 120,522 | 837,337 | 14,220 | 1,464,763 | |||||||||||||||||||||||||||||
| 2016 | 305,000 | 134,640 | 111,600 | 92,930 | 9,009 | 653,179 | ||||||||||||||||||||||||||||||
| 2015 | 284,995 | 88,689 | 354,780 | 67,835 | 31,267 | 827,565 | ||||||||||||||||||||||||||||||
| Brian J. Richardson, EVP (2) |
2017 | 304,492 | 245,735 | 146,294 | 811,804 | 14,304 | 1,522,629 | |||||||||||||||||||||||||||||
| 2016 | 290,000 | 222,840 | 111,600 | 88,408 | 4,986 | 717,834 | ||||||||||||||||||||||||||||||
| (1) | The 2016 compensation figures for Mr. Biehl relate to the period from April 2016 when he commenced employment through December 31, 2016. Mr. Biehl received a one-time cash signing bonus of $200,000 and a one-time equity-based signing bonus valued at approximately $250,000, as part of his market-based compensation package. |
| (2) | Because Messrs. Biehl and Richardson first became named executive officers for the year ended December 31, 2016, the SEC does not require disclosure of their compensation prior to 2016. |
| (3) | The dollar value of RSUs and stock options set forth in these columns is equal to the fair market value as of the date of the respective grant calculated in accordance with Financial Accounting Standards Board Accounting Standards Codification Topic 718, Compensation – Stock Compensation (FASB ASC Topic 718). The options granted to our named executive officers on March 1, 2017 had a fair market value of $7.58 per share, based on Black-Scholes option pricing model for options. See Note 13 to the Consolidated Financial Statements contained in our 2017 Annual Report on Form 10-K for an explanation of the assumptions made in valuing these awards. The fair value of the RSU and PRSU awards was computed based on the $10.03 per share closing market price of our Common Stock on the NYSE on March 1, 2017 and for the performance based awards, or PRSUs, was determined based on the probable outcome, or attainment, of the performance conditions. The value of the PRSU awards at the grant date, assuming that the highest level of performance conditions will be achieved, is $609,824 for grants to Ms. Deckard, $415,242 for grants to Mr. Biehl, $268,804 for grants to Mr. Clancey, $192,576 for grants to Mr. Magaud and $232,696 for grants to Mr. Richardson. The actual value realized under these awards is dependent upon our stock price, our achievement of applicable performance targets, and the continued employment of the named executive officers. |
| (4) | Information regarding the non-qualified stock options, RSUs and PRSUs granted to our named executive officers in 2017 is set forth in the Grants of Plan-Based Awards for Fiscal 2017 table. The Grants of Plan-Based Awards for Fiscal 2017 table also sets forth the aggregate grant date fair value of the non-qualified stock options, RSUs and PRSUs granted during fiscal 2017 computed in accordance with ASC 718. Non-qualified stock options, RSUs and PRSUs are subject to risk of forfeiture. |
| (5) | Reflects amounts earned for services performed in each of 2015, 2016 and 2017 pursuant to our annual cash incentive program (referred to as our STIP), which amounts were paid during the first quarter of 2016, 2017 and 2018, respectively. This amount also includes a safety bonus payment received by each named executive officer for 2017, which is paid on a quarterly basis. Each of our named executive officers received a safety bonus payment of $1,345 in 2015, except for Mr. Magaud who received $1,035 based on office location, $1,430 in 2016, except for Mr. Biehl who received $610 in 2016 due to length of service, and $865 in 2017, except for Mr. Magaud who received $668 based on office location. |
| (6) | This column shows above-market earnings on deferred compensation. |
| (7) | All Other Compensation includes Company contributions to the 401(k) plan, executive life and disability insurance premiums and charitable matching programs, and, for Mr. Clancey, a car allowance. |
| (8) | Ms. Deckard requested that the Compensation Committee reduce her 2017 bonus, and as a result of such reduction Ms. Deckard voluntarily forfeited $341,825 of her earned 2017 STIP amount of $2,041,825. Ms. Deckard’s actual 2017 STIP payout was $1,700,000. The Company, in its sole discretion, made a cash contribution in the amount of $341,825 to the Fairmount Foundation. |
23
Grants of Plan Based Awards in Fiscal Year 2017
The following table provides information about equity and non-equity awards granted to our named executive officers in 2017.
| Grants of Plan Based Awards for Fiscal Year 2017 | ||||||||||||||||||||||||||||||||||||||||||||
| Estimated Future Payouts Under Non-Equity Incentive Plan Awards ($)(2) |
Estimated Payouts Under Equity Incentive Plan Awards (#)(3) |
All Other Option |
Exercise or Base Price of Option Awards ($/sh)(4) |
Grant Fair of Stock and ($) |
||||||||||||||||||||||||||||||||||||||||
| Name and Principal Position | Type(1) | Grant Date | Threshold | Target | Maximum | Threshold | Target | Maximum | ||||||||||||||||||||||||||||||||||||
| Jenniffer D. Deckard, CEO |
RSU | 3/1/2017 | 26,100 | $ | 261,783 | |||||||||||||||||||||||||||||||||||||||
| PRSU | 3/1/2017 | 0 | 30,400 | 60,800 | $ | 304,912 | ||||||||||||||||||||||||||||||||||||||
| Options | 3/1/2017 | 50,700 | $ | 10.03 | $ | 384,306 | ||||||||||||||||||||||||||||||||||||||
| STIP | n/a | $ | 575,000 | |||||||||||||||||||||||||||||||||||||||||
| Michael F. Biehl, CFO |
RSU | 3/1/2017 | 22,700 | $ | 227,681 | |||||||||||||||||||||||||||||||||||||||
| PRSU | 3/1/2017 | 0 | 20,700 | 41,400 | $ | 207,621 | ||||||||||||||||||||||||||||||||||||||
| Options | 3/1/2017 | 34,500 | $ | 10.03 | $ | 261,510 | ||||||||||||||||||||||||||||||||||||||
| STIP | n/a | $ | 453,200 | |||||||||||||||||||||||||||||||||||||||||
| Gerald L. Clancey, EVP |
RSU | 3/1/2017 | 19,500 | $ | 195,585 | |||||||||||||||||||||||||||||||||||||||
| PRSU | 3/1/2017 | 0 | 13,400 | 26,800 | $ | 134,402 | ||||||||||||||||||||||||||||||||||||||
| Options | 3/1/2017 | 22,400 | $ | 10.03 | $ | 169,792 | ||||||||||||||||||||||||||||||||||||||
| STIP | n/a | $ | 353,100 | |||||||||||||||||||||||||||||||||||||||||
| George W. Magaud, EVP |
RSU | 3/1/2017 | 8,200 | $ | 82,245 | |||||||||||||||||||||||||||||||||||||||
| PRSU | 3/1/2017 | 0 | 9,600 | 19,200 | $ | 96,288 | ||||||||||||||||||||||||||||||||||||||
| Options | 3/1/2017 | 15,900 | $ | 10.03 | $ | 120,522 | ||||||||||||||||||||||||||||||||||||||
| STIP | n/a | $ | 235,613 | |||||||||||||||||||||||||||||||||||||||||
| Brian J. Richardson, EVP |
RSU | 3/1/2017 | 12,900 | $ | 129,387 | |||||||||||||||||||||||||||||||||||||||
| PRSU | 3/1/2017 | 0 | 11,600 | 23,200 | $ | 116,348 | ||||||||||||||||||||||||||||||||||||||
| Options | 3/1/2017 | 19,300 | $ | 10.03 | $ | 146,294 | ||||||||||||||||||||||||||||||||||||||
| STIP | n/a | $ | 228,369 | |||||||||||||||||||||||||||||||||||||||||
| (1) | For a better understanding of this table, we have included a column identifying the type of each plan based award. Pursuant to our 2014 Long Term Incentive Plan, STIP amounts represent our non-equity incentive plan bonus opportunities for 2017, while Option (stock options) and RSU amounts represent grants made in 2017. |
| (2) | Amounts represent cash incentive bonus opportunities for 2017 under our Long Term Incentive Plan. There are no threshold or maximum amounts for such payments. Target awards for 2017 are expressed as a specified percentage of an individual’s salary. The targeted opportunity represents the targeted annual bonus based on benchmarking of the named executives’ compensation. For more information on STIP payments made in 2017, see the “Non-Equity Incentive Plan Compensation” column of the Summary Compensation Table and the general description herein. |
| (3) | Represents the number of stock options and RSUs granted during 2017 pursuant to our Long Term Incentive Plan. The stock options fully vest ratably over three years and the RSUs vest ratable over four years. The number of PRSUs earned and the vesting thereof is conditioned on the attainment of performance targets established by the Compensation Committee. The performance measures of the awards granted in 2017 are based on average ROIC over the performance period, as measured against the performance peer group. Payouts will be earned at threshold for 25th percentile performance, target for 50th percentile performance, and maximum for 75th percentile performance or greater against the performance peer group. The PRSUs will be measured and earned on three years of performance as described above, will vest based on the performance results during the three-year performance period, and, to the extent earned and vested, will be payable in shares of unrestricted Common Stock after completion of the three-year performance period. Subject to applicable terms of the award agreements (relating to accelerated vesting), the earned shares do not vest until December 2020. The Board or the Compensation Committee has the right to accelerate the vesting of any or all unvested awards at any time. |
| (4) | The amounts in this column represent the grant date fair value of 2017 equity awards of stock options and RSUs, determined in accordance with FASB ASC Topic 718. See Note 13 of our Consolidated Financial Statements contained in our Annual Report on Form 10-K for the year ended December 31, 2017. As so calculated, the options granted to our named executive officers on March 1, 2017 had a fair market value of $10.03 per share. The fair value of the RSUs granted on March 1, 2017 was computed based on the $10.03 per share closing market price of our Common Stock on the NYSE on March 1, 2017. |
24
Narrative Disclosure to Summary Compensation Table and Grants of Plan-Based Awards Table
Salary. Salaries paid to our named executive officers are set forth in the Summary Compensation Table.
Bonus. Bonuses may be paid to our named executive officers from time-to-time at the discretion of the Compensation Committee and are set forth in the “Bonus” column of the Summary Compensation Table.
Stock Awards. The amounts in the “Stock Awards” column of the “Grants of Plan-Based Awards for Fiscal 2017” table consist of RSUs and PRSUs granted under our Long Term Incentive Plan. These grants are described in further detail under the heading “Compensation Discussion and Analysis – Equity Compensation.” The amounts included in the “Stock Awards” column of the Summary Compensation Table represent the grant date fair value of grants made in accordance with ASC 718.
Option Awards. Pursuant to our Long Term Incentive Plan, we awarded non-qualified stock options to our named executive officers. The stock options granted to our named executive officers are set forth in the table “Grants of Plan-Based Awards for Fiscal 2016.” These grants are described in further detail under the heading “Compensation Discussion and Analysis – Equity Compensation –Stock Options.” The amounts included in the “Option Awards” column of the Summary Compensation Table represent the grant date fair value of grants made in accordance with ASC 718.
Non-Equity Incentive Plan Compensation. The non-equity incentive plan compensation set forth in the Summary Compensation Table reflects annual cash incentive compensation under our Long Term Incentive Plan. Annual cash incentive compensation is earned based upon the achievement of performance objectives as described under the heading “Compensation Discussion and Analysis –Annual Bonus.” Our named executive officers are eligible for a safety bonus payment. Amounts paid to our named executive officers as annual and safety bonuses are set forth in the “Non-Equity Incentive Plan Compensation” column of the Summary Compensation Table.
Retirement Plans
We currently maintain two defined benefit pension plans, but our named executive officers are not eligible to participate in such plans. Additionally, we maintain a retirement plan intended to provide benefits under Section 401(k) of the Code, which allows employees, including our named executive officers, to contribute portions of their base compensation and bonus payments to a tax-qualified retirement account, subject to IRS limits. In 2017, we provided matching contributions equal to (i) 100% of the first 3% and (ii) 50% of the next 2% of employees’ eligible compensation contributed to the 401(k) Plan. Amounts deposited in our 401(k) Plan, including matching amounts, are fully vested upon deposit.
In 2017, we also maintained a discretionary profit sharing employer contribution stock plan on behalf of all eligible employees, including our named executive officers. The Compensation Committee held discretion over the annual contribution rate, which was consistent for every eligible participant, and such amounts were subject to the limits established in the Code. In connection with the initial public offering, the Company merged the stock bonus plan with the 401(k) Plan, effective as of January 1, 2015, and all accounts transferred from the stock bonus plan to the 401(k) Plan. In connection with the merger of the plans, participants had the opportunity to allocate their stock bonus account value.
Additionally, under our supplemental executive retirement plan, certain employees, including the named executive officers, may elect to defer up to 15% of their base compensation and bonus compensation. The deferral amount under such plan is equal to the base compensation and bonus deferral elected by the employee minus salary and bonus deferrals first credited to their 401(k) Plan. The Company provides discretionary profit sharing contributions under this plan equal to the excess of the full contribution that would have been made to the 401(k) Plan, if not for the limitations under the Code, over what was actually contributed to the 401(k) plan. Any amount that would have been contributed under the 401(k) plan but could not be contributed due to limitations under the Code, is instead contributed to the supplemental executive retirement plan on the named executive officers behalf and is fully vested on deposit.
All Other Compensation. All other compensation of our named executive officers is set forth in the Summary Compensation Table and described in detail in footnote 7 of the table. These benefits are discussed in further detail under the heading “Compensation Discussion and Analysis – Other Benefits; Executive Perquisites.”
Additional Information. We have provided additional information regarding the compensation we pay to our named executive officers under the headings “Compensation Discussion and Analysis” and “Other Potential Post-Employment Compensation.”
25
Outstanding Equity Awards at Fiscal Year-End for 2017
The following table provides information on the holdings of non-qualified stock options and RSUs by the named executive officers at December 31, 2017.
| Outstanding Equity Awards at 2017 Fiscal-Year End | ||||||||||||||||||||||||||||||||
| Option Awards | Stock Awards | |||||||||||||||||||||||||||||||
| Name and Principal Position |
Grant Date(1) | Number of Securities Underlying Unexercised Options Exercisable (#) |
Number of Securities Underlying Unexercised Options Unexercisable (#)(2) |
Incentive Plan Awards: Number of Securities Underlying Unexercised Unearned |
Option ($) |
Option Expiration Date |
Number of Shares or Units of Stock That Not Vested |
Market Value of Shares of Units that Have Not Vested ($)** |
||||||||||||||||||||||||
| Jenniffer D. Deckard, CEO |
10/8/2009 | 333,812 | $ | 1.43 | 10/8/2019 | |||||||||||||||||||||||||||
| 12/7/2010 | 102,000 | $ | 3.57 | 12/7/2020 | ||||||||||||||||||||||||||||
| 12/10/2013 | 17,000 | 68,000 | $ | 10.46 | 12/10/2023 | |||||||||||||||||||||||||||
| 10/2/2014 | 11,900 | 23,800 | $ | 16.00 | 10/2/2024 | |||||||||||||||||||||||||||
| 10/9/2014 | 4,386 | $ | 10,307 | |||||||||||||||||||||||||||||
| 5/15/2015 | 44,000 | $ | 8.83 | 5/15/2025 | 8,200 | $ | 19,270 | |||||||||||||||||||||||||
| 3/1/2016 | 39,294 | 78,706 | $ | 2.04 | 3/1/2026 | 94,500 | $ | 494,235 | ||||||||||||||||||||||||
| 3/1/2017 | 50,700 | $ | 10.03 | 3/1/2027 | 56,500 | $ | 295,495 | |||||||||||||||||||||||||
| Michael F. Biehl, CFO |
5/4/2016 | 50,616 | 101,384 | $ | 3.53 | 5/4/2026 | 175,116 | $ | 915,857 | |||||||||||||||||||||||
| 3/1/2017 | 34,500 | $ | 10.03 | 3/1/2027 | 43,400 | $ | 226,982 | |||||||||||||||||||||||||
| Gerald L. Clancey, EVP |
10/8/2009 | 374,000 | $ | 1.43 | 10/8/2019 | |||||||||||||||||||||||||||
| 12/7/2010 | 255,000 | $ | 3.57 | 12/7/2020 | ||||||||||||||||||||||||||||
| 12/10/2013 | 17,000 | 68,000 | $ | 10.46 | 12/10/2023 | |||||||||||||||||||||||||||
| 10/2/2014 | 11,900 | 23,800 | $ | 16.00 | 10/2/2024 | |||||||||||||||||||||||||||
| 10/9/2014 | 4,386 | $ | 10,307 | |||||||||||||||||||||||||||||
| 5/15/2015 | 44,000 | $ | 8.83 | 8,200 | $ | 19,270 | ||||||||||||||||||||||||||
| 3/1/2016 | 23,976 | 48,024 | $ | 2.04 | 3/1/2026 | 58,500 | $ | 305,955 | ||||||||||||||||||||||||
| 3/7/2016 | 65,250 | $ | 341,258 | |||||||||||||||||||||||||||||
| 3/1/2017 | 22,400 | $ | 10.03 | 3/1/2027 | 32,900 | $ | 172,067 | |||||||||||||||||||||||||
| George W. Magaud, EVP |
2/25/2015 | 47,600 | $ | 7.17 | 2/25/2025 | 5,100 | $ | 11,985 | ||||||||||||||||||||||||
| 5/15/2015 | 33,440 | $ | 8.83 | 5/15/2025 | 6,232 | $ | 14,645 | |||||||||||||||||||||||||
| 3/1/2016 | 23,976 | 48,024 | $ | 2.04 | 3/1/2026 | 58,500 | $ | 305,955 | ||||||||||||||||||||||||
| 3/1/2017 | 15,900 | $ | 10.03 | 3/1/2027 | 17,800 | $ | 93,094 | |||||||||||||||||||||||||
| Brian J. Richardson, EVP |
6/1/2015 | 100,000 | $ | 8.95 | 6/1/2025 | 15,000 | $ | 78,450 | ||||||||||||||||||||||||
| 3/1/2016 | 23,976 | 48,024 | $ | 2.04 | 3/1/2026 | 58,500 | $ | 305,955 | ||||||||||||||||||||||||
| 3/7/2016 | 21,000 | $ | 109,830 | |||||||||||||||||||||||||||||
| 3/1/2017 | 19,300 | $ | 10.03 | 3/1/2027 | 24,500 | $ | 128,135 | |||||||||||||||||||||||||
| (1) | For a better understanding of this table, we have included an additional column showing the grant dates of stock options and RSUs. |
| (2) | 2014 Plan. |
Stock Options: The stock options granted before March 1, 2016 fully vest on the fifth anniversary of the grant date, but one-third of the option may accelerate in vesting each year of the period if annual/cumulative performance goals are met, based on EBITDA targets. If the performance goals are not met, then the options will fully vest at the end of the five-year period as long as the executive is an employee of the Company or has retired (i.e. voluntary termination upon attaining age 55 and providing at least 10 years of service). The stock options granted after March 1, 2016 will not include performance goals that result in accelerated vesting and will vest ratably over three years.
RSUs: RSUs granted before March 1, 2016 will fully vest on the sixth anniversary of the grant date. If certain cumulative EBITDA targets are achieved by year four or year five, then the RSUs will accelerate and fully vest upon such achievement. The RSUs granted after March 1, 2016 will not include performance goals that result in accelerated vesting and will vest ratably over four years as long as the executive is an employee of the Company or has retired (i.e. voluntary termination upon attaining age 55 and providing at least 10 years of service).
PRSUs: PRSUs are measured and earned on three years of performance, cliff vest after the end of the performance period, vest based on the level of achievement, and are payable in unrestricted stock after completion of the performance period.
2010 Plan. The option awards granted under the 2010 Plan and will be fully vested and exercisable on the seventh anniversary of the grant date, provided that the named executive officers continue to provide services to us through that date. However, if EBITDA for the year equals or exceeds the annual or cumulative target enumerated in the option agreement, all or a portion of the option may become exercisable prior to the seven year anniversary.
2006 Plan. All option awards granted under the 2006 Plan are fully vested.
| (3) | Market value of Common Stock reported in this column was calculated by multiplying $5.23, the closing market price of the Common Stock on December 30, 2017, the last business day of fiscal 2017, by the number of RSUs and PRSUs. |
26
Option Exercises and Stock Vested During Fiscal 2017
Our named executive officers did not affect any stock option exercises during fiscal 2017.
Nonqualified Deferred Compensation for Fiscal 2017
| Name | Executive Contributions in Last FY ($)(1) |
Registrant Contributions in Last FY ($)(2) |
Aggregate Earnings in Last FY ($)(3) |
Aggregate Withdrawals/ Distributions ($) |
Aggregate Balance at Last FYE ($) |
Annual Earnings Exceeding 120% of Applicable Fed Rate |
||||||||||||||||||
| Jenniffer D. Deckard |
7,307.31 | 0.00 | 70,484.54 | 0.00 | 518,704.03 | 56,560.74 | ||||||||||||||||||
| Michael F. Biehl |
0.00 | 0.00 | 0.00 | 0.00 | 0.00 | 0.00 | ||||||||||||||||||
| Gerald L. Clancey |
5,910.04 | 0.00 | 30,392.77 | 0.00 | 223,663.97 | 24,432.07 | ||||||||||||||||||
| George W. Magaud |
0.00 | 0.00 | 0.00 | 0.00 | 0.00 | 0.00 | ||||||||||||||||||
| Brian J. Richardson |
0.00 | 0.00 | 0.00 | 0.00 | 0.00 | 0.00 | ||||||||||||||||||
| (1) | The amounts set forth in the Executive Contributions in last FYE column for Ms. Deckard and Mr. Clancey represent the deferral of a portion of their respective base salaries earned in 2017. The base salary amounts are also included in the Salary column of the Summary Compensation Table for 2017. |
| (2) | Employer contributions deposited in 2017 were earned in the 2016 plan year. |
| (3) | December 2017 long term Applicable Federal Rate, compounded monthly, was 2.61%. Overall earnings for the Plan during 2017 was 16.23%. |
The preceding table provides information on the non-qualified deferred compensation of the named executive officers in 2017. Participants in our supplemental executive retirement plan, including the named executive officers, may defer up to 15% of their base salary and bonus compensation.
The deferral amount under such plan is equal to the base compensation and bonus deferral elected by the employee minus salary and bonus deferrals credited to their 401(k) Plan. We provide contributions under this plan, as well, equal to the excess, if any, of the full intended profit sharing contribution, without regard to limitations under the Code, and the actual profit sharing contribution credited to the named executive officer’s 401(k) Plan account. Any amount that would have been contributed under the 401(k) Plan but could not be contributed due to limitations under the Code, and is instead contributed to the supplemental executive retirement plan on the named executive officer’s behalf, is fully vested on deposit. Amounts that would have been contributed under the profit sharing plan but could not be contributed due to limitations under the Code, vest in full after three years of service.
Other Potential Post-Employment Compensation
The following table illustrates the amounts our named executive officers would have received if a change in control occurred as of December 31, 2017 and our Compensation Committee used its discretion to accelerate the vesting of any outstanding stock options or RSUs held by the executives as of that date. The estimates are considered forward-looking information that falls within the safe harbor provisions of the Private Securities Litigation Reform Act of 1995. Due to the number of factors that affect the nature and amount of any benefits provided upon the events discussed below, any actual amounts paid or distributed may differ materially. Factors that could affect these amounts include the timing during the year of such change in control and the amount of future non-equity incentive compensation.
| Other Potential Post-Employment Compensation | ||||||||||||||||||||||||||||
| Target Bonus | Severance Payment | Stock Option Value |
RSU Payment | Retirement Plan Payment |
Welfare Benefit Value |
Total | ||||||||||||||||||||||
| Jenniffer D. Deckard |
$ | 575,000 | $ | 3,225,000 | $ | 251,072 | $ | 855,555 | $ | 518,704 | $ | 31,853 | $ | 5,457,184 | ||||||||||||||
| Michael F. Biehl |
$ | 453,200 | $ | 1,812,800 | $ | 172,353 | $ | 1,142,839 | $ | $ | 34,094 | $ | 3,615,286 | |||||||||||||||
| Gerald E. Clancey |
$ | 353,100 | $ | 1,412,400 | $ | 153,197 | $ | 885,104 | $ | 223,664 | $ | 31,268 | $ | 3,058,732 | ||||||||||||||
| George W. Magaud |
$ | 235,613 | $ | 1,099,525 | $ | 153,197 | $ | 458,315 | $ | $ | 32,166 | $ | 1,978,816 | |||||||||||||||
| Brian J. Richardson |
$ | 228,369 | $ | 1,065,722 | $ | 153,197 | $ | 622,370 | $ | $ | 30,422 | $ | 2,100,080 | |||||||||||||||
Executive Change in Control Severance Plan
Effective January 1, 2016, our Board adopted a CIC Plan providing certain benefits if a participant experiences a separation from service as a result of an involuntary termination of employment without cause or resignation for good reason (as each term is defined in the CIC Plan), in either case within (i) 24 months immediately following a change in control of the Company (as defined in the CIC Plan) or (ii) the 60-day period before a change in control. If such events occur and a participant has signed a general release of claims in favor of the Company and a non-competition/non-solicit agreement with the Company, the CIC Plan provides the following benefits to such participant:
| • | a lump sum payment equal to two times (three times in the case of Ms. Deckard) the sum of (i) the named executive officer’s base salary as of the termination date (or, if greater, salary in effect on the first occurrence of the change in control) and (ii) the named executive officer’s target annual cash bonus for the year in which the termination occurs (or, if greater, in effect as of the occurrence of the change in control); |
27
| • | a prorated annual bonus that the named executive officer would have earned for the entire fiscal year in which the termination of employment occurs at target level based on the number of days the named executive officer was employed during the year; and |
| • | an additional lump sum payment equal to the projected cost of the continuation of group health insurance coverage for the participant and the named executive officer’s eligible dependents pursuant to the Consolidated Omnibus Budget Reconciliation Act of 1985 (“COBRA”). |
If the severance payments under the CIC Plan would trigger an excise tax under Sections 280G and 4999 of the Code, the severance payments would be reduced to a level at which the excise tax is not triggered, unless the named executive officer would receive a greater amount without such reduction after taking into account the excise tax and other federal and state taxes.
The CIC Plan has an initial term of three years and will renew for additional one-year periods unless terminated by the Company. The CIC Plan may not, however, be terminated or expire during the two-year period following a change in control.
Employment Agreements
None of our named executive officers has entered into an employment agreement with the Company or any affiliate that provides for severance or change in control benefits, except Mr. Biehl who entered into a severance agreement with the Company on May 6, 2016. Under the terms of the severance agreement, the Company will provide Mr. Biehl with severance payments in the event his employment with the Company is terminated under certain circumstances. Such payments will include 18 months of pay, in equal monthly installments following termination, based upon Mr. Biehl’s highest annualized base salary for the twelve months immediately preceding such termination, and a pro-rata bonus for the year in which such termination occurs, and the amount of such pro rata bonus shall be at least 25% of Mr. Biehl’s annual base salary. Mr. Biehl will be entitled to be reimbursed for up to 18 months of premiums for health continuation coverage under COBRA. In order to receive the severance payments and benefits provided under the agreement, Mr. Biehl will be required to sign a general release of claims against the Company and its affiliates, as well as satisfy any obligations he has for a period of 18 months after the date Mr. Biehl receives a notice of termination under any non-competition, non-solicitation or non-disclosure agreement he has with the Company.
Equity Awards – Termination of Employment
As summarized above in “Outstanding Equity Awards at Fiscal Year-End for 2017,” certain named executive officers have been granted stock options under our 2006 Long Term Incentive Plan, our 2010 Stock Option Plan and our Long Term Incentive Plan, which we refer to collectively as the “Equity Plans,” and RSUs under our Long Term Incentive Plan.
Stock Options
Pursuant to the applicable award agreement, and except as provided below, our named executive officers will generally forfeit any stock option granted under any of the Equity Plans that is not vested and exercisable as of the date they cease performing services for us, for any reason. If the named executive officer’s employment is terminated for cause (as defined in the applicable plan or award agreement) then the executive will forfeit any outstanding stock options, whether vested or unvested, as of the date of his or her termination of employment. The named executive officer or his or her beneficiary, as applicable, will generally be able to exercise all outstanding and vested stock options until the earlier of (i) the expiration of the option term and (ii) (a) the 12 month anniversary of the executive’s termination of employment due to death or disability (as defined in the applicable plan) or (b) the three month anniversary of the date of termination for any reason other than cause, death, or disability. Pursuant to subsequent amendments, stock options granted under the Long Term Incentive Plan will continue to vest following the named executive officer’s retirement (which is a voluntary termination of employment after attaining age 55 and providing at least 10 years of service). If a named executive officer retires, he or she will be able to exercise the option for the remaining original term of the option. In addition, if a named executive officer dies or becomes disabled, any portion of the option that would have vested during the one-year period following such death or disability will vest and become exercisable.
RSUs
Generally, any unvested RSU granted under the Long Term Incentive Plan and held by a named executive officer will be automatically forfeited upon a termination of employment. However, if a named executive officer retires, any RSUs that would have vested during the one-year period following his or her retirement will continue to vest and pay out as if he or she remained employed until the vesting date. In addition, if the grantee dies or becomes disabled, any RSUs that would have vested during the one-year period following such death or disability will vest and pay out within 45 days of such death or disability.
28
PRSUs
Participants will generally forfeit any unvested PRSUs they hold upon a termination of employment. However, if the participant dies or becomes disabled, he or she will vest in a prorated number of PRSUs, which will be based on the target number of PRSUs granted under the award and the number of full months that the participant was employed during the performance period. In addition, if a participant retires during the performance period, the participant will vest in a prorated number of PRSUs based on the actual number of PRSUs that would have vested if the participant had remained employed during the full performance period and the number of full months the participant was employed during the performance period.
Equity Awards – Change in Control
Long Term Incentive Plan
Upon a change in control (as defined in the Long Term Incentive Plan, as amended) the Compensation Committee may do one of the following with respect to RSUs and/or stock options granted under the Long Term Incentive Plan, as amended: (i) accelerate the time at which stock options may be exercised so that stock options may be exercised in full for a limited period of time on or before a specified date (before or after the change in control), after which specified date all unexercised options will terminate; (ii) require the mandatory surrender to the company by selected holders of some or all of the outstanding awards held by such holders (irrespective of whether such awards are then vested or exercisable) as of a date, before or after such change in control, in which event the Compensation Committee will cancel the surrendered awards in exchange for, in the case of vested RSUs, a cash payment equal to the per share purchase price paid in connection with the change in control event or, in the case of vested stock options, the difference between the per share purchase price and the exercise price of the stock option; (iii) provide for the assumption or substitution or continuation of awards by the successor company or a parent or subsidiary of the successor company; or (iv) make such adjustments to outstanding awards as the Compensation Committee deems appropriate to reflect the change in control.
2010 Stock Option Plan
The 2010 Stock Option Plan provides that, in the event of a change in control (defined as a “Transaction” in the plan), we may, in our sole discretion and without the consent of the participants, provide for (i) the assumption of the 2010 Stock Option Plan by the surviving company, (ii) substitute new options at the surviving company with substantially the same terms for options in us, (iii) require the exercise of outstanding options and terminate all unexercised or unexercisable options, or (iv) settle outstanding vested stock options in cash or equity and cancel all such stock options. Unless otherwise provided in the option agreement or another agreement between the individual and us, the plan provides that, in the event a payment or right accruing to the recipient would constitute a “parachute payment” (as defined in Section 280G of the Code and the regulations issued thereunder), such payment or right will be reduced to the largest amount or greatest right that will result in no portion of the amount payable or right accruing under the plan to be subject to an excise tax under Section 4999 of the Code or being disallowed as a deduction under Section 280G of the Code. Under the 2010 Stock Option Plan, all unvested options immediately become vested in the event of a Transaction.
2006 Long Term Incentive Plan
All options granted under the 2006 Long Term Incentive Plan are fully vested. Accordingly, no accelerated vesting would occur upon a change in control transaction.
Annual Bonus Awards
Our named executive officers forfeit their annual bonuses if their employment terminates for any reason prior to the end of the performance period, except that each named executive officer is eligible to receive a prorated amount of such named executive officer’s target annual bonus if such named executive officer’s employment is terminated after a change in control. See “Executive Change in Control Severance Plan.”
Pay Ratio
For 2017, we estimate that the ratio of the total annual compensation of our Chief Executive Officer ($3,226,504) to the total annual compensation of our median employee ($66,057) is 48.8:1. We determined our median employee based on total cash and equity compensation paid to our active employees as of October 15, 2017. We included all full time, part time, seasonal and temporary employees, employed domestically, whether employed directly or by a consolidated subsidiary. We excluded non-U.S. employees, as permitted by rule, since they account for less than 5% of our total employees. Compensation for employees hired during 2017 was annualized for all employees other than seasonal employees. Once the median employee was identified, total annual compensation for the employee was calculated using the same methodology used for our named executive officers as set forth in our 2017 Summary Compensation Table. Given the different methodologies that various public companies will use to determine an estimate of their pay ratio, the estimated ratio reported above should not be used as a basis for comparison between companies.
29
Director Compensation for Fiscal 2017
The following table sets forth information regarding the compensation of our Directors for fiscal 2017. Jenniffer D. Deckard, our CEO, does not receive any additional compensation for her service as a Director.
| Name | Fees Earned or Paid in Cash ($)(1) |
Stock Awards ($)(2) |
Option Awards ($) |
Non-Equity Incentive Plan Compensation ($) |
Change in Pension Value and Nonqualified Deferred Compensation Earnings ($) |
All Other Compensation ($) |
Total ($) |
|||||||||||||||||||||
| William E. Conway |
$ | 78,750 | $ | 100,000 | — | — | — | — | $ | 178,750 | ||||||||||||||||||
| Michael G. Fisch |
$ | — | $ | — | — | — | — | — | $ | — | ||||||||||||||||||
| Charles D. Fowler |
$ | 78,750 | $ | 100,000 | — | — | — | — | $ | 178,750 | ||||||||||||||||||
| Stephen J. Hadden |
$ | 68,750 | $ | 100,000 | — | — | — | — | $ | 168,750 | ||||||||||||||||||
| Michael C. Kearney |
$ | 68,750 | $ | 100,000 | — | — | — | — | $ | 168,750 | ||||||||||||||||||
| William P. Kelly |
$ | 78,750 | $ | 100,000 | — | — | — | — | $ | 178,750 | ||||||||||||||||||
| Matthew F. LeBaron |
$ | 106,250 | $ | 100,000 | — | — | — | — | $ | 206,250 | ||||||||||||||||||
| Michael E. Sand |
$ | — | $ | — | — | — | — | — | $ | — | ||||||||||||||||||
| Lawrence N. Schultz |
$ | 86,250 | $ | 100,000 | — | — | — | — | $ | 186,250 | ||||||||||||||||||
| (1) | Messrs. Fisch and Sand, did not receive any compensation from us for their service on our Board in 2017 as a result of their employment with American Securities. We paid American Securities $168,750 in 2017 in lieu of compensating Messrs. Fisch and Sand for their service on the Board, which represents half of the combined cash value of the annual Director fees and stock awards Messrs. Fisch and Sand would have received had they been compensated for their service on the Board like our other Directors. In addition, we paid American Securities approximately $66,000 for Company-related expenses, including reimbursement for travel and lodging, market research and other miscellaneous expenses in 2017. |
| (2) | The amounts set forth in this column reflect the fair market value of Common Stock granted during fiscal 2017 under the Long Term Incentive Plan. |
Effective July 1, 2017, the cash and equity compensation program for our unaffiliated Directors consists of the following:
| • | an annual cash retainer of $75,000; |
| • | an additional annual cash retainer of $50,000 for the Chairman of the Board, $20,000 for the chair of the Audit Committee, $10,000 for the chair of the Compensation Committee, $10,000 for the chair of the Nominating and Corporate Governance Committee and $10,000 for the chair of the Executive Committee; and |
| • | an annual grant of Common Stock of approximately $100,000, valued on the date of grant, under our 2014 Long Term Incentive Plan. |
Prior July 1, 2017, the cash and equity compensation program for our unaffiliated Directors consisted of the following:
| • | an annual cash retainer of $62,500; |
| • | an additional annual cash retainer of $25,000 for the Chairman of the Board, $15,000 for the chair of the Audit Committee, $10,000 for the chair of the Compensation Committee, $10,000 for the chair of the Nominating and Corporate Governance Committee and $10,000 for the chair of the Executive Committee; and |
| • | an annual grant of Common Stock of approximately $100,000, valued on the date of grant, under our 2014 Long Term Incentive Plan. |
We reimburse all Directors for reasonable travel and other out-of-pocket expenses incurred in connection with attendance at meetings of the Board and its committees. We do not provide retirement benefits to our non-management Directors. Directors may defer all or a part of their stock retainer under our Non-Qualified Deferred Compensation Plan. Amounts deferred may be distributed either in annual installments over a period or in a lump sum pursuant to a Director’s payment election.
30
| Item 12. | Security Ownership of Certain Beneficial Owners and Management and Related Stockholder Matters |
EQUITY COMPENSATION PLAN INFORMATION
The following table sets forth information concerning shares of our Common Stock authorized or available for issuance under the Company’s equity compensation plans as of December 31, 2017.
| Plan Category | Number of securities to be issued upon exercise of outstanding options, warrants and rights |
Weighted- average exercise price of outstanding options, warrants and rights |
Number of securities remaining available for future issuance under equity compensation plans (excluding securities reflected in column (a)) (#)(1) |
|||||||||
| Equity compensation plans approved by stockholders |
— | — | — | |||||||||
| Equity compensation plans not approved by stockholders |
15,493,717 | 6.63 | 12,812,846 | |||||||||
| Total |
15,493,717 | 6.63 | 12,812,846 | |||||||||
| (1) | Long Term Incentive Plan. Our stockholders adopted the Long Term Incentive Plan, effective as of October 1, 2014. As of December 31, 2017, 9,829,620 shares remain available for issuance under the Long Term Incentive Plan and 6,543,663 shares are subject to outstanding stock options or RSUs. |
2010 Stock Option Plan. On December 7, 2010, the Board adopted the FML Holdings, Inc. Stock Option Plan (the “2010 Plan”), for the officers, employees, and consultants of our company and its subsidiaries who performed services for us. Unless earlier terminated, the term of the 2010 Plan will continue for a period of ten years after adoption. There are 11,900,000 shares of our Common Stock reserved for issuance under the 2010 Plan. As of December 31, 2017, 2,983,226 shares remain available for issuance under the plan and 7,016,230 shares are subject to outstanding stock options. All options granted under the 2010 Plan as of December 31, 2013 have been nonqualified stock options.
STOCK OWNERSHIP OF PRINCIPAL HOLDERS, DIRECTORS AND OFFICERS
The following table sets forth the beneficial ownership of shares of Common Stock as of April 5, 2018, unless otherwise indicated, by (i) each person or group known by the Company to own beneficially more than 5% of the outstanding shares of Common Stock, (ii) each Director and nominee for election as a Director of the Company, (iii) each executive officer named in the Executive Compensation tables in this Proxy Statement and (iv) all Directors and executive officers as a group. All information with respect to beneficial ownership of Directors, Director nominees and executive officers has been furnished by the respective Director, nominee for election as a Director, or executive officer, as the case may be. Unless otherwise indicated below, each person named below has sole voting and investment power with respect to the number of shares set forth opposite his or her name. The address of each Director nominee, Director and executive officer is 8834 Mayfield Road, Chesterland, Ohio 44026.
| Name of Beneficial Owner | Number of Shares of Common Stock Beneficially |
Percentage of Shares of Common Stock(1) |
||||||
| ASP FML Holdings, LLC(2) |
48,156,628 | 21.5% | ||||||
| SailingStone Capital Partners LLC(3) |
26,519,627 | 11.8% | ||||||
| Point72 Asset Management, L.P.(4) |
13,468,364 | 6.0% | ||||||
| The Vanguard Group(5) |
13,188,752 | 5.9% | ||||||
| Charles D. Fowler(6) |
11,148,143 | 4.9% | ||||||
| Matthew F. LeBaron |
46,411 | * | ||||||
| Michael E. Sand(7) |
— | * | ||||||
| Jenniffer D. Deckard(8) |
5,237,735 | 2.3% | ||||||
| Michael F. Biehl(9) |
183,909 | * | ||||||
| Michael G. Fisch(10) |
— | * | ||||||
| Gerald L. Clancey(11) |
4,592,012 | 2.0% | ||||||
| William E. Conway(12) |
799,519 | * | ||||||
| William P. Kelly(13) |
154,333 | * | ||||||
| Lawrence N. Schultz(14) |
129,058 | * | ||||||
| George W. Magaud(15) |
64,808 | * | ||||||
| Stephen J. Hadden |
53,489 | * | ||||||
| Michael C. Kearney |
53,489 | * | ||||||
| Brian J. Richardson(16) |
121,044 | * | ||||||
| All Directors and executive officers as a group (fifteen persons) |
22,788,418 | 10.1% | ||||||
31
| * | Less than 0.1%. |
| (1) | In accordance with SEC rules, each beneficial owner’s holdings have been calculated assuming full exercise of outstanding options covering Common Stock, if any, exercisable by such owner within 60 days after April 5, 2018, but no exercise of outstanding options covering Common Stock held by any other person. |
| (2) | Represents shares held by ASP FML Holdings, LLC, a Delaware limited liability company referred to as ASP FML Holdings. American Securities Partners V, L.P., American Securities Partners V(B), L.P. and American Securities Partners V(C), L.P., collectively referred to as the ASP Sponsors, are owners of approximately 74% of the limited liability company interests of ASP FML Investco, LLC, a Delaware limited liability company, referred to as ASP FML Investco. ASP FML Co-Invest I, LLC, a Delaware limited liability company referred to as ASP FML Co-Invest I, is the owner of approximately 26% of the limited liability company interests of ASP FML Investco. ASP FML Investco is the owner of approximately 89% of the limited liability company interests of ASP FML Holdings. American Securities Associates V, LLC, a Delaware limited liability company referred to as ASA V, is the general partner of each ASP Sponsor. American Securities LLC, a New York limited liability company referred to as American Securities, provides investment advisory services to each ASP Sponsor and to ASA V, and is the owner of 100% of the issued and outstanding shares of ASP Manager Corp., the manager of each of ASP FML Holdings, ASP FML Investco and ASP FML Co-Invest I. As such, American Securities may be deemed to have indirect beneficial ownership of the shares held by ASP FML Holdings. The address for ASP FML Holdings is c/o American Securities LLC, 299 Park Avenue, 34th Floor, New York, NY 10171. As referenced in footnotes (4) and (5) below, each of Messrs. LeBaron and Sand may be deemed to have shared voting and investment power over the shares held by ASP FML Holdings. Such individuals disclaim beneficial ownership of the shares of Common Stock held by ASP FML Holdings, except to the extent of his pecuniary interests therein. Additionally, (a) David L. Horing and (as referenced in footnote (8) below) Michael G. Fisch, in their capacities as the managing members of ASA V, and (b) Michael G. Fisch, in his capacity as trustee of The Michael G. Fisch 2006 Revocable Trust, which is the manager of ASCP, LLC, which is the managing member of American Securities, may be deemed to have shared voting and investment power over the shares held by ASP FML Holdings. Such individuals disclaim beneficial ownership of the shares of Common Stock held by ASP FML Holdings, except to the extent of their pecuniary interests therein. |
| (3) | Information regarding Common Stock ownership was obtained from the Schedule 13G filed jointly on April 10, 2018, by SailingStone Capital Partners LLC (“SailingStone”), SailingStone Holdings LLC (“SailingStone Holdings”), MacKenzie B. Davis (“Davis”) and Kenneth L. Settles Jr. (“Settles”). As of March 31, 2018, SailingStone had shared voting power and shared dispositive power, with SailingStone Holdings, Davis and Settles, over 26,519,627 shares of Common Stock. SailingStone is located at One California Street, 30th Floor, San Francisco, California 94111. |
| (4) | According to a Schedule 13G/A filed with the Commission on February 14, 2018, Point72 Asset Management, L.P. (“Point72 Asset Management”), Point72 Capital Advisors, Inc. (“Point72 Capital Advisors”), Cubist Systematic Strategies, LLC (“Cubist Systematic Strategies”), and Steven A. Cohen (“Mr. Cohen”) own directly no shares of Common Stock. Pursuant to an investment management agreement, Point72 Asset Management maintains investment and voting power with respect to the securities held by certain investment funds it manages. Point72 Capital Advisors is the general partner of Point72 Asset Management. Pursuant to an investment management agreement, Cubist Systematic Strategies maintains investment and voting power with respect the securities held by certain investment funds it manages. Mr. Cohen controls each of Point72 Asset Management, Point72 Capital Advisors, and Cubist Systematic Strategies. As of December 31, 2017, by reason of the provisions of Rule 13d-3 of the Exchange Act, each of (i) Point72 Asset Management, Point72 Capital Advisors and Mr. Cohen may be deemed to beneficially own 13,468,364 shares of Common Stock (constituting approximately 6.0% of the shares outstanding); and (ii) Cubist Systematic Strategies and Mr. Cohen may be deemed to beneficially own 73,385 shares of Common Stock (constituting less than 0.1% of the shares outstanding). Each of Point72 Asset Management, Point72 Capital Advisors, Cubist Systematic Strategies, and Mr. Cohen disclaims beneficial ownership of any of these securities. Point72 Asset Management is located at 72 Cummings Point Road, Stamford, Connecticut 06902. |
| (5) | According to a Schedule 13G/A filed with the Commission on February 9, 2018, The Vanguard Group (“Vanguard”), as of December 31, 2017, has sole voting power over 282,909 shares of Common Stock, shared voting power, with Vanguard Fiduciary Trust Company (“VFTC”) and Vanguard Investments Australia, Ltd. (“VIA”), wholly-owned subsidiaries of Vanguard, over 8,300 shares of Common Stock, sole dispositive power over 12,907,700 shares of Common Stock, and shared dispositive power, with VFTC and VIA, over 281,052 shares of Common Stock shown in the table above. Vanguard is located at 100 Vanguard Blvd., Malvern, Pennsylvania 19355. |
| (6) | Consists of 9,427,988 shares held under the Charles D. Fowler Declaration of Trust dated September 26, 1991, as amended to date (the “Fowler Trust”). Given the revocable nature of the Fowler Trust, Mr. Fowler is deemed to have voting and investment power over the shares held by the Fowler Trust. In addition to the shares described above, Mr. Fowler through the Fowler Trust’s ownership of ASP FML Holdings, LLC (described in footnote 2 above) has an indirect economic ownership in 3,039,099 shares of Common Stock held by ASP FML Holdings. Mr. Fowler disclaims beneficial ownership of shares held by ASP FML Holdings, except to the extent of his pecuniary interest therein. |
| (7) | Mr. Sand may be deemed to have shared voting and investment power of the shares held by ASP FML Holdings in his capacity as a Principal of American Securities, and as a designee of ASP FML Holdings on the Company’s Board of Directors. Mr. Sand disclaims beneficial ownership of the shares of Common Stock owned by ASP FML Holdings, except to the extent of his pecuniary interest therein, as such shares are owned and held by the ASP Sponsors referenced in footnote (2) above. |
| (8) | Includes (i) 857,888 shares held f/b/o/ Abbey Jo Deckard Trust, (ii) 857,888 shares held f/b/o Connor John Deckard Trust, (iii) 2,098,268 shares held under the Jenniffer D. Deckard Family U/A/D dated February 28, 2010 and (iv) 102,000 shares held under the Daryl K. Deckard Irrevocable Trust dated August 29, 2014 (collectively, the “Deckard Trusts”). Given Ms. Deckard’s position as trustee of the Deckard Trusts, Ms. Deckard is deemed to have voting and investment power over the shares held by the Deckard Trusts. Includes 353,600 shares held under the Jenniffer D. Deckard Irrevocable Trust dated December 27, 2012 (the “JDD Trust”). Given Ms. Deckard’s spouse’s position as trustee of the JDD Trust, Ms. Deckard is deemed to have voting and investment power over the shares held by the JDD Trust. Includes 386,543 shares of Common Stock held by the 401(k) Plan. Includes options to purchase 560,182 shares of Common Stock that are exercisable within 60 days of April 5, 2018. In addition to the shares described above, Ms. Deckard’s spouse has an ownership interest in ASP FML Holdings, LLC (described in footnote 2 above), representing indirect economic ownership in 785,569 shares of Common Stock held by ASP FML Holdings. Given this spousal relationship, Ms. Deckard may be deemed to share voting and investment control of these shares, but disclaims beneficial ownership of such shares, except to the extent of her pecuniary interest therein. |
| (9) | Includes options to purchase 62,104 shares of Common Stock that are exercisable within 60 days of April 5, 2018. |
| (10) | Mr. Fisch may be deemed to have shared voting and investment power of the shares held by ASP FML Holdings, as described in footnote (2) above. Mr. Fisch disclaims beneficial ownership of the shares of Common Stock owned by ASP FML Holdings, except to the extent of his pecuniary interest therein, as such shares are owned and held by the ASP Sponsors referenced in footnote (2) above. |
| (11) | Includes 2,242,468 shares held under the Gerald L. Clancey Trust No. 1 and 100,436 shares held under the Gerald L. Clancey Grantor Retained Annuity Trust No. 1. (together, the “Clancey Trusts”). Given Mr. Clancey’s position as trustee of the Clancey Trusts, Mr. Clancey is deemed to have voting and investment power over the shares held by the Clancey Trusts. Includes 442,000 shares held under the Gerald L. Clancey Irrevocable Trust dated December 13, 2012, and 442,000 held under The Connie J. Clancey Irrevocable Trust for the benefit of Gerald L. Clancey (the “GLC Trust”). Given Mr. Clancey’s spouse’s position as Trustee of the GLC Trust, Mr. Clancey is deemed to have voting and |
32
| investment power over the shares held by the GLC Trust. In addition to the shares described above, Mr. Clancey through his ownership of ASP FML Holdings, LLC (described in footnote 2 above) has an indirect economic ownership in 930,017 shares of Common Stock held by ASP FML Holdings. Mr. Clancey disclaims beneficial ownership of shares held by ASP FML Holdings, except to the extent of his pecuniary interest therein. Includes 326,429 shares of Common Stock held in the 401(k) Plan. Includes options to purchase 713,310 shares of Common Stock that are exercisable within 60 days of April 5, 2018. |
| (12) | Includes 199,580 shares held under the Mary F. Conway Declaration of Trust dated December 13, 1980 (the “Mary Conway Trust”), 491,450 shares held under the Under Trust Agreement dated March 10, 1992 (the “Conway UTA”), and 5,000 shares held under the William E. Conway IRA Standard – “Traditional” IRA. Given Mr. Conway’s spouse’s position as trustee under the Mary Conway Trust and Mr. Conway’s position as trustee under the Conway UTA, Mr. Conway is deemed to have voting and investment power over the shares held by the Mary Conway Trust and the Conway UTA. Mr. Conway through his ownership of ASP FML Holdings, LLC (described in footnote 2 above) has an indirect economic ownership in 315,224 shares of Common Stock held by ASP FML Holdings. Mr. Conway disclaims beneficial ownership of shares held by ASP FML Holdings, except to the extent of his pecuniary interest therein. |
| (13) | Includes options to purchase 59,500 shares of Common Stock that are exercisable within 60 days of April 5, 2018. |
| (14) | Includes options to purchase 59,500 shares of Common Stock that are exercisable within 60 days of April 5, 2018. |
| (15) | Includes options to purchase 53,246 shares of Common Stock that are exercisable within 60 days of April 5, 2018. |
| (16) | Includes options to purchase 54,378 shares of Common Stock that are exercisable within 60 days of April 5, 2018. |
33
| Item 13. | Certain Relationships and Related Transactions, and Director Independence |
RELATED PARTY TRANSACTIONS
The Related Party Transactions Policy of the Board ensures that the Company’s transactions with certain persons are not inconsistent with the best interests of the Company. A “Related Party Transaction” is a transaction with the Company or a subsidiary of the Company in an amount exceeding $120,000 in which a Related Party has a direct or indirect material interest. A Related Party includes the executive officers, Directors, and five percent stockholders of the Company, and any immediate family member of such a person. Under the Related Party Transaction Policy, management screens for any potential Related Party Transactions. If management identifies a potential Related Party Transaction, such transaction is brought to the attention of the Audit Committee for its approval, ratification, revision, or rejection in consideration of all of the relevant facts and circumstances. The Audit Committee shall approve each such Related Party Transaction if it is consistent with the Related Party Transaction Policy and is on terms, taken as a whole, which the Audit Committee believes are no less favorable to the Company than could be obtained in an arms’-length transaction with an unrelated third party, unless the Audit Committee otherwise determines that the transaction is not in the best interests of the Company.
American Securities
American Securities is a leading U.S. middle-market private equity firm that currently has approximately $15 billion of assets under management. In August 2010, affiliated funds managed by American Securities acquired control over ASP FML Holdings, LLC (“ASP FML Holdings”). As of April 5, 2018, ASP FML Holdings owns approximately 21.5% of our outstanding Common Stock.
Stockholders’ Agreement
In connection with the investment in our Common Stock by ASP FML Holdings, certain of our stockholders, including ASP FML Holdings entered into an amended and restated stockholders’ agreement on April 28, 2009 between certain stockholders and previous equity sponsors. The stockholders’ agreement provided, among other things, that ASP FML Holdings was entitled to elect (or cause to be elected) three of our Directors. The stockholders’ agreement was amended and restated (the “Fourth Amended and Restated Stockholders’ Agreement”) and removed ASP FML Holdings’ right to elect (or cause to be elected) three of our Directors and to revise certain registration rights.
Registration Rights
Pursuant to the Fourth Amended and Restated Stockholders’ Agreement, we are obligated to register the sale of shares of our Common Stock under certain circumstances.
Demand Rights. Subject to the limitations set forth below, certain major stockholders (or their permitted transferees), including ASP FML Holdings, have the right to require us by written notice to prepare and file a registration statement registering the offer and sale of a number of their shares of Common Stock. Generally, we are required to provide notice of a request by such a major stockholder within one business day following the receipt of such demand request to all other such major stockholders, who may, in certain circumstances, participate in the registration.
We are also not obligated to effect any demand registration in which a notice is received within 90 days after the closing of an underwritten offering, during a Company blackout period, or in which the anticipated aggregate offering price included in such offering is less than $50 million. Any such demand registration may be for a shelf registration statement. Any demand for an underwritten offering pursuant to an effective shelf registration statement shall constitute a demand request subject to the limitations set forth above. We are required to maintain the effectiveness of any such registration statement until the consummation of the distribution by the participating holders. On December 1, 2016, we filed a shelf registration statement on Form S-3 which registered all of ASP FML Holdings’ shares of our Common Stock and under which ASP FML Holdings sold registered shares.
Piggy-back Rights. If, at any time, subject to certain customary limitations we propose to register an offering of Common Stock (subject to certain exceptions) for our own account or for the account of any third party (including a demand registration), then we must give written notice to all holders who own registrable securities, the gross offering price of which is anticipated to be at least $5 million to allow them to include a specified number of their shares in that registration statement.
Conditions and Limitations; Expenses. These registration rights are subject to certain conditions and limitations, including the right of the underwriters to limit the number of shares to be included in a registration and our right to delay or withdraw a registration statement under certain circumstances. We will generally pay all registration expenses in connection with our obligations under the registration rights agreement, regardless of whether a registration statement is filed or becomes effective.
34
As a result of the completion of our Common Stock offering in October 2016, ASP FML Holdings’ ownership fell below 35% of the outstanding shares of our Common Stock. As a result, certain provisions in our amended and restated certificate of incorporation and amended and restated bylaws became effective that increased the voting thresholds required by our amended and restated certificate of incorporation and amended and restated bylaws for various shareholder actions and otherwise may make it more difficult for a third party to acquire control of us. These provisions provide that:
| • | any action required or permitted to be taken by the stockholders must be effected at a duly called annual or special meeting of stockholders and may not be effected by any consent in writing in lieu of a meeting of such stockholders, subject to the rights of the holders of any series of preferred stock with respect to such series; |
| • | our amended and restated bylaws may be amended by the stockholders only by the affirmative vote of the holders of at least two-thirds of our then outstanding Common Stock; |
| • | special meetings of our stockholders may only be called by the board of directors; |
| • | certain provisions of our amended and restated certificate of incorporation may be amended by the affirmative vote of the holders of at least 75% of our then outstanding Common Stock; and |
| • | subject to the rights of the preferred stockholders, if any, any director may be removed only for cause and upon the affirmative vote of the holders of at least 75% of our then outstanding Common Stock. |
Other
We employ Daryl Deckard, the husband of our President and CEO Jenniffer D. Deckard, with one of our wholly-owned subsidiaries, Black Lab, LLC. Mr. Deckard has been employed by Black Lab since August 2005, and became the General Manager in 2012, assuming the responsibilities of the then-retiring Vice President and General Manager. Mr. Deckard is not an executive officer of the Company. We acquired Black Lab in 2011. In 2017, Mr. Deckard earned approximately $290,000 in base salary and bonus, and also received an equity award under our long-term incentive plan. His compensation was established in accordance with our customary employment and compensation practices applicable to employees with equivalent qualifications, experience and responsibilities. This employment relationship was approved by the Audit Committee consistent with our Related Party Transaction Policy.
35
DIRECTOR INDEPENDENCE
Our Corporate Governance Guidelines and the NYSE listing standards provide that at least a majority of the members of our Board must be independent (i.e., free of any material relationship with the Company, other than his or her relationship as a Director or Board committee member). A Director is not independent if he or she fails to satisfy the standards for independence under the NYSE listing standards, the rules of the Securities and Exchange Commission (the “SEC”), and any other applicable laws, rules and regulations.
During the Board’s annual review of Director independence, the Board considers transactions, relationships and arrangements between each Director or an immediate family member of the Director and the Company. The Board of Directors also considers transactions, relationships and arrangements between each Director or an immediate family member of the Director and our senior management.
As a result of its annual Director independence review for the fiscal year ending December 31, 2018, the Board determined that each of William E. Conway, Michael G. Fisch, Charles D. Fowler, Stephen J. Hadden, Michael C. Kearney, William P. Kelly, Matthew F. LeBaron, Michael E. Sand and Lawrence N. Schultz are independent pursuant to the applicable listing requirements of the NYSE and SEC rules and that all members of the Audit Committee, the Compensation Committee and the Nominating and Governance Committee are independent. Jenniffer D. Deckard is not considered to be independent because of her position as our President and Chief Executive Officer.
As part of this review, our Board considered common private and charitable board memberships among our executive officers and Directors. Our Board does not believe that any of these common board memberships impairs the independence of the Directors.
36
| Item 14. | Principal Accounting Fees and Services |
Independent Registered Public Accounting Firm Services and Related Fee Arrangements
During the fiscal years ended December 31, 2017 and 2016, various audit services and non-audit services were provided to the Company by PricewaterhouseCoopers LLP. Set forth below are the aggregate fees billed for these services, all of which were pre-approved by the Audit Committee, for the last two fiscal years:
| Services | 2017 | 2016 | ||||||
| Audit Fees |
$ | 1,278,525 | $ | 1,020,161 | ||||
| Audit-Related Fees |
$ | 12,000 | $ | 175,000 | ||||
| Tax Services |
$ | 210,138 | $ | 193,599 | ||||
| All Other Fees |
$ | 900 | $ | — | ||||
| Total Fees |
$ | 1,501,563 | $ | 1,388,760 | ||||
Audit Fees: Includes fees billed for professional services rendered for the audit of the Company’s financial statements for the fiscal years ended December 31, 2017 and 2016.
Audit-Related Fees: Includes fees for assurance and related services that are traditionally performed by the auditor, including the issuance of comfort letters and consents for equity issuances.
Tax Fees: Includes fees relating to tax compliance, advice and planning billed by PricewaterhouseCoopers LLP.
In accordance with the SEC’s rules issued pursuant to the Sarbanes-Oxley Act of 2002, which require, among other things, that the Audit Committee pre-approve all audit and non-audit services provided by our independent registered public accounting firm, the Audit Committee has adopted a formal policy on auditor independence requiring the approval by the Audit Committee of all professional services rendered by our independent registered public accounting firm. The policy specifically pre-approves certain services up to a budgeted amount to be determined annually by the Audit Committee. All other services require Audit Committee approval on a case-by-case basis.
| Item 15. | Exhibits, Financial Statement Schedules |
(a) The following documents are filed as part of this report:
3. Exhibits:
The exhibits listed in the exhibit index of the Original Form 10-K and the exhibits listed in the exhibit index of this Amendment are filed with, or incorporated by reference in, this report.
37
FAIRMOUNT SANTROL HOLDINGS INC.
EXHIBIT INDEX
The following Exhibits are filed with this Amendment.
| (x) | Filed herewith. |
38
SIGNATURES
Pursuant to the requirements of the Exchange Act, the registrant has duly caused this report to be signed on its behalf by the undersigned hereunto duly authorized.
| FAIRMOUNT SANTROL HOLDINGS INC. (Registrant) | ||||||
| Date: April 16, 2018 | ||||||
| /s/ Michael F. Biehl | ||||||
| Michael F. Biehl | ||||||
| Executive Vice President and Chief Financial Officer | ||||||
39
Exhibit 31.3
CERTIFICATION OF PRINCIPAL EXECUTIVE OFFICER
(Pursuant to Section 302 of the Sarbanes-Oxley Act of 2002)
I, Jenniffer D. Deckard, certify that:
| 1. | I have reviewed this Amendment No. 1 to the Annual Report on Form 10-K for Fairmount Santrol Holdings Inc. for the year ended December 31, 2017; and |
| 2. | Based on my knowledge, this report does not contain any untrue statement of a material fact or omit to state a material fact necessary to make the statements made, in light of the circumstances under which such statements were made, not misleading with respect to the period covered by this report. |
| Date: | April 16, 2018 | |
| By: | /s/ Jenniffer D. Deckard | |
| Jenniffer D. Deckard | ||
| President and Chief Executive Officer (Principal Executive Officer) | ||
Exhibit 31.4
CERTIFICATION OF PRINCIPAL FINANCIAL OFFICER
(Pursuant to Section 302 of the Sarbanes-Oxley Act of 2002)
I, Michael F. Biehl, certify that:
| 1. | I have reviewed this Amendment No. 1 to the Annual Report on Form 10-K for Fairmount Santrol Holdings Inc. for the year ended December 31, 2017; and |
| 2. | Based on my knowledge, this report does not contain any untrue statement of a material fact or omit to state a material fact necessary to make the statements made, in light of the circumstances under which such statements were made, not misleading with respect to the period covered by this report. |
| Date: | April 16, 2018 | |
| By: | /s/ Michael F. Biehl | |
| Michael F. Biehl | ||
| Executive Vice President and Chief Financial Officer (Principal Financial and Accounting Officer) | ||