
Form 8-K Hamilton Beach Brands For: Apr 16
UNITED STATES
SECURITIES AND EXCHANGE COMMISSION
WASHINGTON, DC 20549
FORM 8-K
CURRENT REPORT
Pursuant to Section 13 OR 15(d) of The Securities Exchange Act of 1934
| Date of Report (Date of earliest event reported): | April 16, 2018 | |||
HAMILTON BEACH BRANDS HOLDING COMPANY
(Exact name of registrant as specified in its charter)
| DELAWARE | 1-38214 | 31-1236686 |
| (State or other jurisdiction of incorporation) |
(Commission File Number) | (IRS Employer Identification No.) |
| 4421 WATERFRONT DR, GLEN ALLEN, VA | 23060 | |||
| (Address of principal executive offices) | (Zip code) | |||
(804) 273-9777
(Registrant’s telephone number, including area code)
N/A
(Former name or former address, if changed since last report)
Check the appropriate box below if the Form 8-K filing is intended to simultaneously satisfy the filing obligation of the registrant under any of the following provisions:
[ ] Written communications pursuant to Rule 425 under the Securities Act (17 CFR 230.425)
[ ] Soliciting material pursuant to Rule 14a-12 under the Exchange Act (17 CFR 240.14a-12)
[ ] Pre-commencement communications pursuant to Rule 14d-2(b) under the Exchange Act (17 CFR 240.14d-2(b))
[ ] Pre-commencement communications pursuant to Rule 13e-4(c) under the Exchange Act (17 CFR 240.13e-4(c))
Indicate by check mark whether the registrant is an emerging growth company as defined in Rule 405 of the Securities Act of 1933 (§ 230.405 of this chapter) or Rule 12b2 of the Securities Exchange Act of 1934 (§240.12b-2 of this chapter):
Emerging growth company [X]
If an emerging growth company, indicate by check mark if the registrant has elected not to use the extended transition period for complying with any new or revised financial accounting standards provided pursuant to Section 13(a) of the Exchange Act. [ ]
Item 2.02 Results of Operations and Financial Condition.
Item 7.01 Regulation FD Disclosure.
On April 16, 2018, Hamilton Beach Brands Holding Company (the “Company”) posted on its website, www.hamiltonbeachbrands.com, an updated investor presentation. A copy of the presentation is attached as Exhibit 99 hereto.
The information contained in this Current Report on Form 8-K, including Exhibit 99, is furnished pursuant to Item 2.02 and Item 7.01 of Form 8-K and shall not be deemed to be “filed” for purposes of Section 18 of the Securities Exchange Act of 1934, as amended, or otherwise subject to the liability of that section, nor shall it be deemed incorporated by reference in any filing under the Securities Act of 1933, as amended, except as shall be expressly stated by specific reference in such filing.
Item 9.01 Financial Statements and Exhibits.
As described in Item 2.02 of this Current Report on Form 8-K, the following Exhibit is furnished as part of this Current Report on Form 8-K.
(d) Exhibits
| 99 | Hamilton Beach Brands Holding Company Investor Presentation, dated April 16, 2018. |
SIGNATURES
Pursuant to the requirements of the Securities Exchange Act of 1934, the registrant has duly caused this report to be signed on its behalf by the undersigned hereunto duly authorized.
| HAMILTON BEACH BRANDS HOLDING COMPANY | ||||||
| Date: April 16, 2018 | ||||||
| By: | /s/ James H. Taylor | |||||
| Name: | James H. Taylor | |||||
| Title: | Vice President and Chief Financial Officer | |||||
 EVERYDAY GOOD THINKING Full Year 2017 Investor Presentation Exhibit 99 |
 Safe Harbor Statement
This presentation includes forward-looking comments subject to
important risks and uncertainties. It may also contain
financial measures that are not in conformance with accounting principles generally accepted in the United States of America (GAAP). Refer to Hamilton Beach Brands Holding Company’s reports filed on Forms 8-K (current), 10-Q
(quarterly), and 10-K (annual) for information on factors that could
cause actual results to differ materially from information
in this presentation and for information reconciling financial measures to GAAP. Past performance may not be representative of future results.
Guidance noted in the following slides was effective as of the
company’s most recent earnings release and conference
call (March 8, 2018). Nothing in this presentation should be construed as reaffirming or disaffirming such guidance. This presentation is not an offer to sell or a solicitation of offers to buy any of Hamilton Beach Brands
Holding Company’s securities.
On the Cover: Wolf Gourmet ® is a registered trademark of the Sub-Zero Group, Inc. CHI ® is a registered trademark of Farouk Systems, Inc. 1 |
 Hamilton Beach Brands Holding Company Snapshot
Hamilton Beach Brands Holding Company (NYSE: HBB)
Hamilton Beach Brands Holding Company (“HBBHC”) is a holding
company for two separate businesses: consumer and
commercial small appliances (“Hamilton Beach Brands” or “HBB”) and specialty retail (“The Kitchen Collection” or “KC”) Hamilton Beach Brands is a leading global designer, marketer and distributor of branded small
electric household and specialty housewares appliances, as well as
commercial products for restaurants, bars and
hotels The Kitchen Collection is a national specialty
retailer of kitchenware in outlet and traditional malls
throughout the U.S.
Headquartered in Glen Allen, Virginia
Approximately 1,600 employees at December 31, 2017
12/31/17 Revenues –
$740.7 million
12/31/17 Net Income -
$17.9 million
12/31/17 Adjusted Income –
$22.6 million
(1) 12/31/17 EBITDA – $43.5 million (1) 12/31/17 Net Debt – $40.4 million _____________________ (1) EBITDA and Adjusted Income are non-GAAP measures and should not be considered in isolation or as a substitute for GAAP
measures. The discussion of non-GAAP measures and the
related reconciliations to GAAP measures start on page 29. 2 |
 Proven Business Model Drives Results
#1 Presence in Key Retail and
Commercial Sales Channels
Trusted, Efficient and
Low-Cost Supply Chain
Global Platform Experienced Management Team Strong Performance and Return on Capital Iconic Brands Consistent, Market Leading Innovation 3 |
 The
Innovation Started Over
115 Years Ago! 4 |
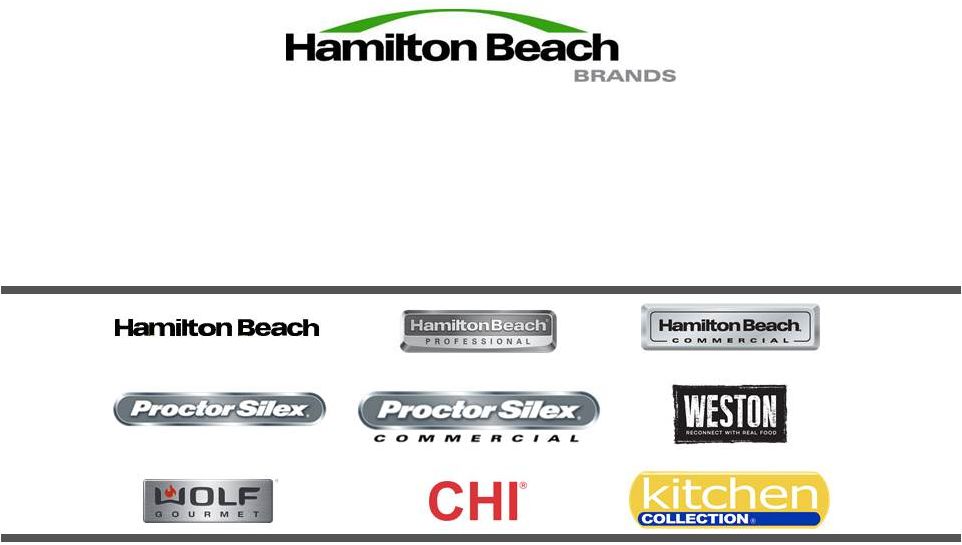
 Iconic Brands and Innovative Products
_____________________
* Wolf Gourmet
® is a registered trademark of the Sub-Zero Group, Inc. ** CHI ® is a registered trademark of Farouk Systems, Inc. 5 Trusted Proven Reliable Innovative CONSUMER COMMERCIAL RETAIL |
 Company Overview
KEY BUSINESS HIGHLIGHTS
Leading designer, marketer and distributor of branded housewares for
retail and commercial applications
Strong brands with leading market share
Hamilton Beach
®
brand ranked #1 small kitchen appliance brand in U.S.
(based on units) in 2017
Strong HBB share in Canada, Mexico and Central America and focused on
growing in other international markets
Strong relationships with leading retail and e-commerce customers
across diverse channels
100+ year track record of innovation and product line
expansion Broad consumer price point segmentation coverage
from value to luxury Multi-layered growth strategy
includes e-commerce leadership, an increase in premium
product offerings, continued international expansion, further penetration of commercial markets, expansion into adjacent categories and strategic
acquisitions
Highly experienced management team
Strong working capital management and returns on capital
HBBHC SALES BY CATEGORY 2017 2017 FINANCIAL HIGHLIGHTS 6 Consumer 76% Commercial 6% Retail (Kitchen Collection) 18% United States 77% International 23% HBB SALES BY GEOGRAPHY 2017 |
 Our Mission Deliver profitable growth from innovative solutions that improve everyday living Our Values Customer Obsession: Consistently meet or exceed the needs of our internal and external
customers
People: Employ and develop the
best Good Thinking:
Encourage and cultivate inspired thinking in all areas of our business Ethics: Honest, ethical behavior
–
always
Passion for Quality: Ensure the quality
of our products and services is best in class Embrace
Change: There is always a better way. Change is accelerating Teamwork: We help each other to succeed. We communicate and move as one Our Environment and Our Community: We proactively manage our business in a sustainable, socially and environmentally responsible manner Our Core Principles 7 |
               “Good Thinking” Culture Is A Core Strength
Excellent Work
Environment
Consumer
Focus Innovation Testing, Testing, Testing Best-in-Class Logistics Trusted, Ethical Work Smart Quality At Hamilton Beach, We Practice “Good Thinking” 8 |
 Comprehensive Product Portfolio
Coffee Makers
Kettles
Toasters
Irons Slow Cookers Hand Mixers Can Openers Blenders Toaster Ovens Meat Grinders Food Processors 9 |
 Strong Portfolio of Branded Products
_____________________
Source: NPD point of sales data for the 12-month period ending
December 2017 (1)
NPD point of sales data for the 12-month period ending June 2017 10 HAMILTON BEACH BRANDS HAS A TOP 3 BRAND SHARE IN 29 OF THE 50 HOUSEWARES CATEGORIES
Breadmaker
Hand Mixer
Single Serve Brewing Systems
Citrus Juicer
Ice Cream/Yogurt Makers
Slow Cooker
Coffee Grinder
Ice Shavers/Sno Cone Makers Specialty Drink Maker Coffee Percolator Irons Stand Mixer Coffeemakers Jar Openers Tea Makers Combo Hand/Stand Mixers Juice Extractor Toaster Electric Can Opener Kitchen System Toaster Oven Electric Griddles Other Blending & Processing Traditional Blending Electric Grills Other Cookers Traditional Chopper Electric Kettles Other Electric Grills/Griddles Traditional Food Processor Electric Knives Other Waffle Iron/Sandwich Maker Vacuum Sealers Electric Skillets Pizza Ovens Waffle Iron Espresso Maker Popcorn Makers Additional Categories - not included in NPD Subscription Food Steamer Rice Cooker Air Purifiers Fryers Roaster Oven Compact Refrigerators Garment Steamers Sandwich Maker Microwave Ovens (1) Hand Blender Single Serve Blending & Processing Odor Eliminators 46 43 39 34 33 27 25 23 20 18 18 Cuisinart Oster Bella Black & Decker Continental Electric Dash KitchenAid Sunbeam Toastmaster Total Product Categories Offered |
 Consistent Innovation in New Product Development
53 37 49 51 70 58 59 58 50 67 87 2007 2008 2009 2010 2011 2012 2013 2014 2015 2016 2017 HBB aggregated data from 37,000 consumers in 2017 to introduce new, research-driven products
HBB generated more than 27% of its revenue in the last
3 years from products that are less than 3 years old
_____________________
(1) Excludes product introductions from The Kitchen Collection and gadget introductions from Weston.
PRODUCT PLATFORM INTRODUCTIONS
(1) SELECT 2018 PRODUCT
INTRODUCTIONS HBB protects its innovations through a
robust patent renewal process
11 Hamilton Beach ® Pressure Cooker Wolf Gourmet ® Precision Griddle Proctor Silex ® Personal Blender with Glass Jar Weston ® Sous Vide Immersion Circulator |
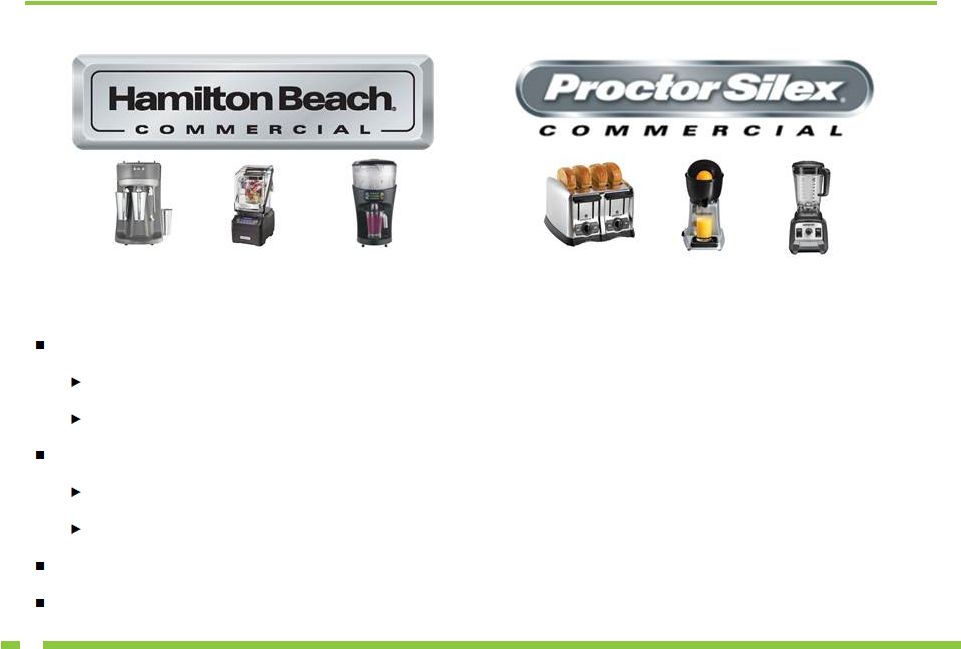
 SPECIALTY RETAILERS DEPARTMENT STORES WAREHOUSE CLUBS MASS MARKET RETAILERS E-COMMERCE RETAILERS Broad Customer Base Across Diverse Channels HBB U.S. SALES BY CHANNEL 2017 HBB Believes it Has the #1 Unit Share of Small Kitchen Appliances at the Top 2 U.S. E-Commerce Retailers HBB Has a Diverse Base of 2,500+ Customers GROCERY STORES INDEPENDENT RETAILERS 2,000+ Customer Accounts HBB SALES BY CUSTOMER 2017 SPORT RETAILERS 12 Costco Sam’s Club PRICESMART Bodega Aurrera Family Dollar Grupo Exito Walmart TARGET JET JD.COM Wayfair TMALL.COM Amazon KOHL’S Liverpool BED BATH & BEYOND El Palacio de Hierro BEST BUY Macy’s Bemol Harrods FAST SHOP Sur la table WILLIAMS-SONOMA Academy SPORT + OUTDOORS Kroger Wakefern FOOD CORP H.E.B Cabela’s DICK’S E-Commerce 25% Other 75% 29% 10% 4% 3% 3% 2% 2% 2% 2% 1% 40% Customer 1 Customer 2 Customer 3 Customer 4 Customer 5 Customer 6 Customer 7 Customer 8 Customer 9 Customer 10 Other |
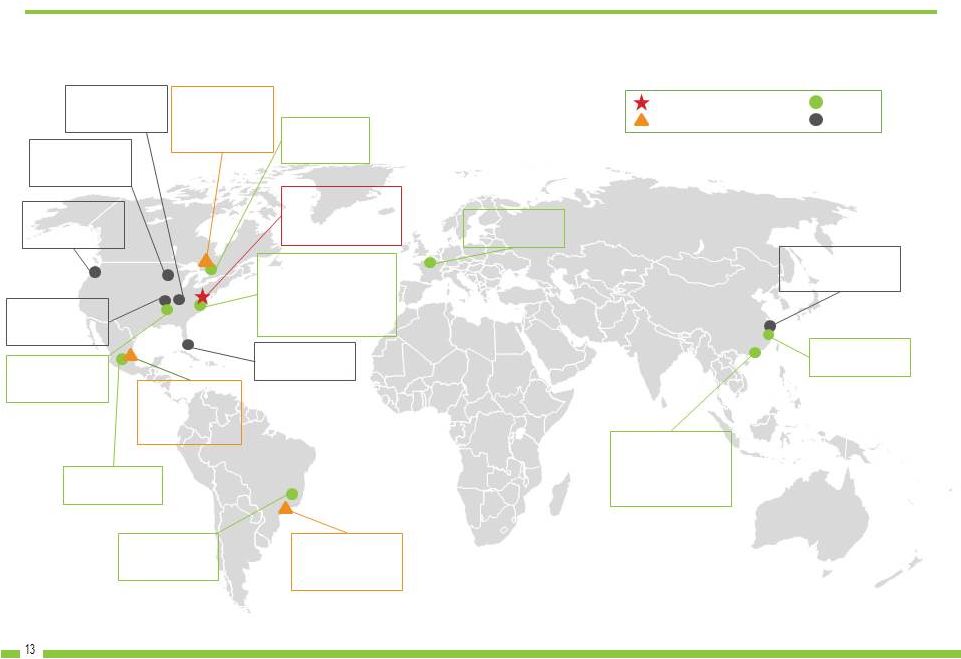 Global Infrastructure to Support HBB Objectives
Picton, Ontario
Distribution
Center
Strategically located footprint to efficiently serve customers
globally Markham, Ontario
Canada Sales and
Administration
Headquarters
Bentonville,
Arkansas Sales Office Richmond, Virginia Corporate Headquarters Sales & Marketing Engineering Southern Pines, North Carolina Service Center for Customer Returns; Catalog Distribution Center; Parts Distribution Center Mexico City, Mexico Mexico Sales and Administrative Headquarters Tultitlan, Mexico Distribution Center Jundiai, Sao Paulo, Brazil Distribution Center Sao Paulo, Brazil Brazil Sales and Administrative Headquarters Geel, Belgium Distribution Center Shanghai, China Sales Office, Engineering, Quality Assurance Shanghai, China Distribution Center Shenzhen, China Engineering, Quality Assurance, Operations, and Distribution Center Distribution Sales Corporate HQ Sales and Administrative HQ Miami, Florida Sales Office Olive Branch, Mississippi Distribution Office Seattle, Washington Sales Office Minneapolis, Minnesota Sales Office 13 Independence, OH Sales & Administration |
 Tangible Growth Opportunities to Generate Attractive Returns
Long-Term HBB Objectives (excludes KC):
Sales: Operating Profit Margin: $750M – $1B 9% – 10% 14 Adjacent Categories E-Commerce leadership Premium Product Offerings Commercial Product Line Expansion Strategic Acquisitions International Market Growth |
 RECENT ONLINE REVIEWS Success in Growing E-Commerce Channel GLOBAL E-COMMERCE FOOTPRINT Online sales of housewares is the fastest growing segment and accounted for 25% of HBB U.S. sales in 2017 Consumers are more discriminating of products due to their ability to
research products online
Consumers are increasingly focused on reviews which take into
account brand reputation, product performance and
safety These habits play into HBB’s favor given the
positive information available on HBB’s products
online E-commerce rewards brands, innovation and
product quality above and beyond traditional
brick-and-mortar retail and HBB is leveraging its
strengths in these areas to execute its online growth
strategy Continue to drive sales and capture market share
with the top global online retailers
Deliver best-in-class communication and promotional strategies
to drive conversion
Excel in direct fulfillment business model
Expand brands into new categories to drive incremental
sales Consistently identify / evaluate new online
participants to ensure maximum channel
presence _____________________
Source: Intelligent Eye, which compiled reviews from
amazon.com, walmart.com and target.com during 2017. The
Hamilton Beach ®
brand is the #1 selling small appliance brand in the U.S. E-Commerce channel 15 _____________________ (1) NPD point of sales data for the 12 month period ending December 2017 Brand Rating Total Reviews 4.1 252,588 4.0 26,653 Rowenta 4.0 16,521 Cuisinart 4.0 109,157 Oster 4.0 53,217 Magic Bullet 3.9 6,558 Mr. Coffee 3.8 58,704 Black & Decker 3.8 86,335 Delonghi 3.7 12,091 Bella 3.7 17,086 2017 Average Star (1) |
 Multi-Initiative Marketing Strategy
HBB delivers over 3.6 billion brand touchpoints annually through its
marketing strategy Advertising
Brand Websites
E-mail Marketing
Influencer Marketing
Everyday
Good Thinking Blog
Facebook
Twitter
Pinterest
Instagram
YouTube
16 Web visits 16,500+ followers 543,000+ followers 18,300+ followers 11,000 followers 2,000 subscribers |
 Premium Product Market Opportunity
Well-positioned to grow in the premium market
Leverage brand strength, engineering, design capabilities and commercial
expertise to expand premium product offering
Expansion
of Hamilton Beach ® Professional and Weston ® brand product lines Robust roadmap of new product introductions from Wolf Gourmet ® through multi-year agreement with Sub-Zero Group, Inc. – Wolf is a premium brand with a reputation of innovation and quality designed to create the ultimate cooking experience Introduction of CHI ® branded garment care line, through multi-year licensing deal with Farouk Systems, Inc. – CHI is a high-quality hair products brand with products that reflect education, the environment and innovation Expand placements and share in the “Only-the-Best” high-end market with strong brands and product lines
17 |
 United States 77% International 23% Asia-Pacific 45% Europe 21% North America 24% Rest of World 10% Expand internationally in the emerging Asia and Latin America markets and continue to expand in Canada and Mexico Target to increase HBB international sales to 35% to 45% of total HBB sales by concentrating on key growth markets, including China and Brazil o Flexible entry model includes establishing a local team and then working through distributors or directly with retailers or e-commerce partners o Provides an opportunity to grow with existing customers as they expand into new markets Invest in resources to identify local consumer needs / preferences through consumer research / feedback and introduce new products for specific markets Leverage strength of brands and innovative products to expand in new geographies Commercial division has been present in global markets for decades, providing a strong platform to build upon Selective licensing of HBB brands with high-quality partners in eight countries International Market Opportunity _____________________ (1) Source: Euromonitor International. SMALL APPLIANCES RETAIL SALES BY REGION 2017 (1) Significant expansion opportunity for international growth HBB GEOGRAPHIC SALES MIX 2017 18 |
 Commercial Market Opportunity
Opportunity
to accelerate growth in the $18 billion global commercial market (1) Food service markets benefiting from changing demographics and shift to healthier food options
Increase in onsite food preparation driving demand for commercial
appliances Company’s commercial brand reputation for
performance, reliability and differentiated products driving growth Investing to understand customers’ unmet needs for unique solutions to build a competitive advantage
Opportunity to accelerate growth through the introduction of new
product capabilities and categories Continuing to build
distribution capabilities and investing resources to establish presence in international food service market Increasing penetration of products at global and regional chains Commercial grade, innovative features, strong performance and heavy-duty durability Dependable value, commercially rated, strong performance and durability _____________________ (1) Company estimate. 19 |
 Expand into New Small Appliance and Adjacent Categories
Pursuing opportunities to grow outside of the small kitchen appliance
category Significant opportunity to expand outside the
small kitchen appliances category Leverage existing
infrastructure and channels to introduce adjacent products
E-commerce channel enhances ability to successfully add new
products Introducing new products in both consumer and
commercial markets Compact
Refrigerators
Coffee Airpots
Kitchen Scales
Commercial
Chamber Sealers
Laundry 20 |
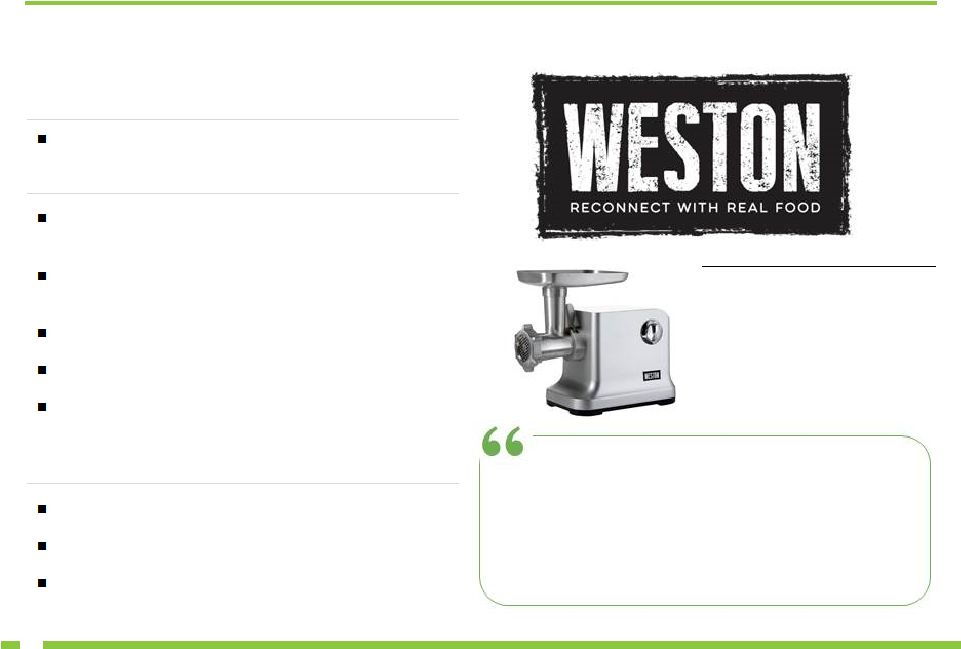 Acquisition Growth Strategy
Large, global housewares market that is highly fragmented
Competitive market position that gives HBB potential to
increase share / enter new product categories
Opportunity in current consumer space, new consumer
categories or commercial
Strong brand and / or channel presence
International presence / focus with differentiated customer
base E-commerce expands acquisition opportunities, as
the platform makes it easier to present new
products Accelerate growth and margins
Highly-accretive when layered into current business
model Meet or exceed return on capital targets
“We are thrilled to welcome the Weston team and their
consumers and vendors to the Hamilton Beach Brands
family. Through the combination of the highly talented
Weston organization, along with our own dedicated
employees, we believe we can achieve significant
opportunities for future growth and profitability in line with our
strategic initiatives”
- Greg Trepp Product expansion opportunity within existing product categories and beyond HBB’s small kitchen and
commercial appliance business
ATTRACTIVE MARKETS
TARGET PROFILE
VALUE CREATION
Value Drivers for HBB
—
Incremental access to new consumer
markets such as outdoor enthusiast
and farm-to-table and also retail
channels such as sporting goods
—
Expands distribution capabilities for
existing HBB brands
21 December 2014 |
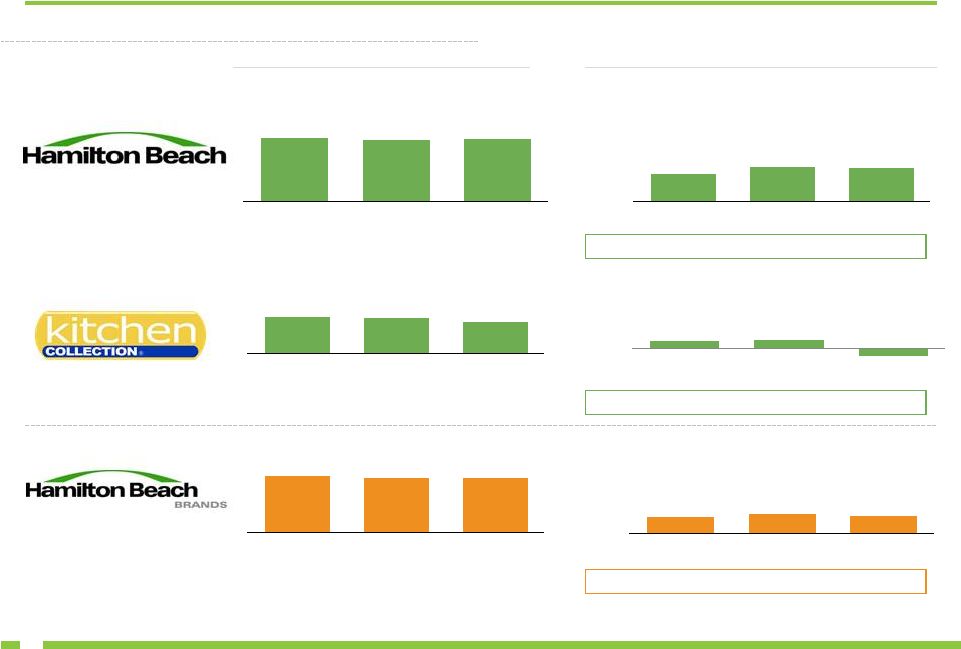
 The Kitchen Collection Strategy
210 stores as of December 31, 2017 strategically located primarily in
outlet malls across the U.S. Meet the challenge of a
difficult environment and evolve aggressively in a
constructive manner, focusing on the outlet mall segment
Outlet malls have a sustainable presence and Kitchen Collection is the
leading housewares player in outlet malls
Optimize store portfolio with stores in strong outlet malls in
well-positioned locations and exit stores that do not
generate acceptable returns Average lease duration
expected to be 12 months or less for 70% of stores by the
end of 2018 Focus on comparable store sales growth
through: Enhancing customers’ store experience
through improved customer interactions to generate
greater average sales transaction size Working to enhance
sales volume and profitability by improving sale closure
rates through continued refinement of product offerings, merchandise
mix and store displays and appearances
Continued focus on gross margin, profit and cash flow improvement
areas Emphasis on increasing sales of higher-margin
products Maintain inventory efficiency and store inventory
controls Ongoing merchandising improvements through use of
highly analytical merchandising skills and disciplined
operating controls 22 |
 Consolidated Financial Overview |
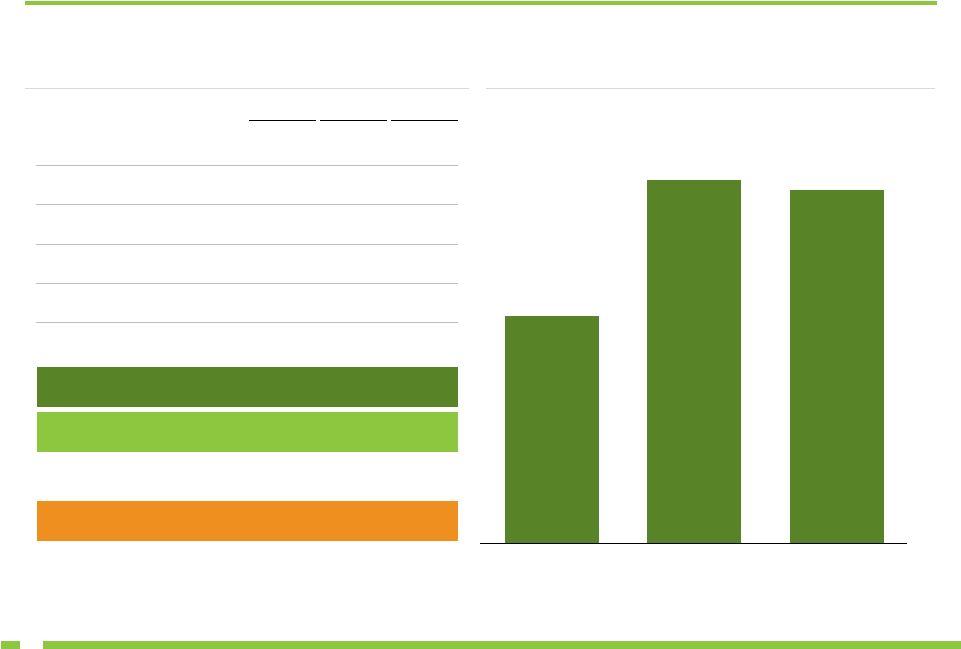
 REVENUE Historical Financial Highlights ($ in millions) $621.0 $605.2 $615.1 2015 2016 2017 EBITDA $38.0 $46.9 $45.4 2015 2016 2017 $151.0 $144.4 $128.5 2015 2016 2017 _____________________ (1) EBITDA is a non-GAAP measure and should not be considered in isolation or as a substitute for GAAP measures. The discussion of
non-GAAP measures and the related reconciliations to GAAP measures starts on page 29. (2) HBBHC financials, net of eliminations. ($ in millions) $767.9 $745.4 $740.7 2015 2016 2017 $40.3 $48.8 $43.5 2015 2016 2017 % of Revenue:
6.1%
7.7% 7.4% % of Revenue:
1.1%
1.3% (1.5)% % of Revenue:
5.2%
6.5% 5.9% (2) 24 $1.6 $1.9 $(1.9) 2015 2016 2017 (1) |
 Capital Structure and Return on Capital
FLEXIBLE CAPITAL STRUCTURE (HBBHC)
19.1%
30.5%
29.7%
2015 2016 2017 ADJUSTED ROTCE (HBB) _____________________ (1) Adjusted income, EBITDA, Net Debt, Adjusted Consolidated Equity, and Adjusted ROTCE are non-GAAP measures and should not be
considered in isolation or as a substitute for GAAP measures. The discussion of non-GAAP measures and the related reconciliations to GAAP measures start on page 29. These non-GAAP measures have been adjusted to exclude the impact of the 2017
U.S. tax reform legislation. (1)
(2) (2) (3) 25 (In millions) 2015 2016 2017 Net Income $19.7 $26.2 $17.9 Adjusted Income (1) $19.7 $26.2 $22.6 EBITDA (1) $40.3 $48.8 $43.5 Cash and Cash Equivalents $16.8 $11.3 $10.9 Consolidated Debt $58.4 $38.7 $51.3 Net Debt (1) $41.6 $27.4 $40.4 Consolidated Debt / EBITDA 1.4x 0.8x 1.2x Net Debt / EBITDA 1.0x 0.6x 0.9x Adjusted Consolidated Equity (1) $82.9 $65.1 $51.1 Debt to Total Capitalization 41.3% 37.3% 50.1% |
 Company Outlook
KC OUTLOOK
HBB OUTLOOK
U.S. consumer retail market for small kitchen appliances grew modestly
in 2017 and is expected to grow modestly in 2018 compared
with 2017. International and commercial markets are
expected to continue to grow modestly.
HBB will continue to focus on strengthening its market position with new
products across various categories and brands; HBB’s
revenues and operating profit expected to increase
moderately in 2018 compared with 2017. Increased revenue
benefits expected to be partly offset by product cost
inflation. 2018 net income expected to increase substantially as a result of lower effective corporate income tax rate. Longer term, HBB will continue to focus on improving return on sales
through scale derived from market growth and strategic
initiatives Declining consumer traffic to physical retail
locations and reduced in-store transactions are
reducing KC’s target consumers’ spending on housewares in mall locations KC 2018 revenues expected to decrease compared with 2017, as it
continues to prudently close non-performing stores. 2018 operating
and net loss expected to be comparable to 2017. Net losses in the first half of 2018 expected to be higher than in prior year and second half of 2018 as a
smaller tax benefit will be realized on the seasonally higher first
half losses due to a lower effective income tax rate
under new Tax Act. Going forward, KC will aggressively
manage its store portfolio with a focus on a defined
profitable product line at favorable mall locations; KC has a goal for average lease duration to be 12 months or less for 70% of stores by
the end of 2018
26 |
 Key Investment Highlights
Multi-Layered Growth Strategy
Increase in Premium Product Offerings
Continued International Expansion
Further Penetration of Commercial Markets
Expansion into Adjacent Markets
Complete Accretive Acquisitions
Business Growth will Drive Further Economies of Scale
Strong Core Business Model
Leading Global Market Share in Branded Housewares
Strong Cash Flows and ROTCE
Global Sourcing and Distribution Platform
Broad Customer Base
Comprehensive Product Offering
Experienced Management Team
Iconic Brands Known Globally
Leading Provider to the Growing E-Commerce Market
E-Commerce Leadership
27 |
 Appendix |
 Non-GAAP Disclosure
This presentation contains non-GAAP financial measures. Included in
this presentation are reconciliations of these non-GAAP
financial measures to the most directly comparable financial measures
calculated in accordance with U.S. generally accepted
accounting principles ("GAAP").
EBITDA is a measure of net income (loss) that differs from financial
results measured in accordance with GAAP.
EBITDA, net debt and adjusted return on capital employed in this
presentation are provided solely as supplemental
non-GAAP disclosures of operating results. Management
believes these non-GAAP financial measures assist
investors in understanding the results of operations of Hamilton Beach
Brands Holding Company and its subsidiaries. In addition, management evaluates results using these non-GAAP financial measures.
Hamilton
Beach
Brands
Holding
Company
defines
non-GAAP
measures
as follows: EBITDA is defined as net income (loss) before income taxes plus net interest expense and depreciation and amortization expense; Debt to Total Capitalization is defined as consolidated debt divided by consolidated debt plus consolidated equity; Net debt is defined as total debt less cash and cash equivalents; and Adjusted return on capital employed is defined as net income (loss), excluding the effect of the 2017 U.S. tax reform legislation, before interest expense, after tax divided by LTM average capital employed. LTM average capital employed is defined as LTM average equity plus LTM average debt less LTM average cash. For reconciliations from GAAP measurements to non-GAAP measurements see pages 30 to 32.
29 |
 Non-GAAP EBITDA Reconciliation
($ in millions)
Note: EBITDA is provided solely as a supplemental disclosure. EBITDA
does not represent net income, as defined by U.S. GAAP and should not be considered as a substitute for net income, or as an indicator of operating performance. The Company defines EBITDA as income (loss) before income tax provision (benefit), plus
net interest expense and depreciation and amortization
expense. EBITDA is not a measurement under U.S. GAAP and is not
necessarily comparable with similarly titled measures of other companies. 30 (1) __________________ (1) HBBHC financials, net of eliminations. |
 HBBHC Equity, Net Income and Capitalization Reconciliation
($ in millions)
EQUITY (HBBHC)
NET INCOME (HBBHC)
(1)(2) _____________________ (1) Adjusted consolidated equity and Adjusted Income are provided solely as a supplemental disclosure. Adjusted consolidated equity
and Adjusted income do not represent stockholders' equity and net income, as defined by U.S. GAAP and should not be considered as a substitute for total stockholders' equity and net income, respectively. The Company defines
Adjusted consolidated equity as total stockholders' equity excluding the impact of the 2017 U.S. tax reform legislation. The Company defines Adjusted Income as net income excluding the impact of the 2017 U.S. tax reform
legislation. (2)
HBBHC financials, net of eliminations
31 CAPITALIZATION (HBBHC) (1)(2) (2) 2015 2016 2017 Consolidated Equity, as reported $82.9 $65.1 $46.4 U.S. Tax Reform Impact - - 4.7 Adjusted Consolidated Equity $82.9 $65.1 $51.1 2015 2016 2017 Net Income, as reported $19.7 $26.2 $17.9 U.S. Tax Reform Impact - - 4.7 Adjusted Income $19.7 $26.2 $22.6 2015 2016 2017 Consolidated Debt $58.4 $38.7 $51.3 Adjusted Consolidated Equity (1) 82.9 65.1 51.1 Total Capitalization $141.3 $103.8 $102.4 Debt to Total Capitalization 41.3% 37.3% 50.1% |
 HBB ROTCE and Net Income Reconciliation
($ in millions)
ADJUSTED ROTCE (HBB)
(1) ____________________ (1) Adjusted return on capital employed is provided solely as a supplemental disclosure with respect to income generation, adjusted
for the impact of the 2017 U.S. tax reform legislation, because management believes it provides useful information with respect to earnings in a form that is comparable to the Company’s cost of capital employed, which
includes both equity and debt securities, net of cash. Return on capital employed is a non-GAAP measure and should not be considered in isolation or as a substitute for a GAAP measure.
(2) Tax rate of 38% represents the Company’s target marginal tax rate.
(3) HBB Adjusted Income is provided solely as a supplemental disclosure. HBB Adjusted income does not represent HBB net income, as
defined by U.S. GAAP and should not be considered as a substitute for HBB net income. The Company defines HBB Adjusted Income as HBB net income excluding the HBB impact of the 2017 U.S. tax reform
legislation. 32
NET INCOME (HBB)
(3) 2015 2016 2017 HBB Net Income, as reported $19.7 $26.6 $21.1 U.S. Tax Reform Impact - - 4.1 HBB Adjusted Income $19.7 $26.6 $25.2 2015 Average Equity (12/31/2014 and each of 2015's quarter ends) $51.5 Average Debt (12/31/2014 and each of 2015's quarter ends) 58.9 Average Cash (12/31/2014 and each of 2015's quarter ends) (1.4) Total 2015 average capital employed $109.0 2015 Net Income, as reported 19.7 Plus: 2015 Interest expense, net 1.8 Less: Income taxes on 2015 interest expense at 38% (2) (0.7) Actual return on capital employed = actual net income before interest expense, net, after tax
20.8 Actual return on capital employed percentage 19.1% 2016 Average Equity (12/31/2015 and each of 2016's quarter ends) $52.0 Average Debt (12/31/2015 and each of 2016's quarter ends) 40.2 Average Cash (12/31/2015 and each of 2016's quarter ends) (2.6) Total 2016 average capital employed $89.5 2016 Net Income, as reported 26.6 Plus: 2016 Interest expense, net 1.2 Less: Income taxes on 2016 interest expense at 38% (0.5) Actual return on capital employed = actual net income before interest expense, net, after tax
27.3 Actual return on capital employed percentage 30.5% 2017 Average Adjusted Equity (12/31/2017, 9/30/2017, 6/30/2017, 3/31/17, 12/31/16)
$38.6
Average Debt (12/31/2017, 9/30/2017, 6/30/2017, 3/31/17,
12/31/16) 52.9
Average Cash (12/31/2017, 9/30/2017, 6/30/2017, 3/31/17,
12/31/16) (3.2)
Total 2017 average capital employed
$88.3
2017 Adjusted Income
25.2 Plus: 2017 Interest expense, net 1.6 Less: Income taxes on 2017 interest expense at 38% (2) (0.6) Actual return on capital employed = actual adjusted income before interest expense, net, after tax
26.2 Actual return on capital employed percentage 29.7% (2) |