
Form 8-K TPI COMPOSITES, INC For: Mar 08
UNITED STATES
SECURITIES AND EXCHANGE COMMISSION
Washington, D.C. 20549
_____________________
Form 8-K
_____________________
CURRENT REPORT
Pursuant to Section 13 or 15(d) of the Securities Exchange Act of 1934
Date of Report (Date of earliest event Reported): March 8, 2018
![]()
TPI Composites, Inc.
(Exact Name of Registrant as Specified in Charter)
| DELAWARE | 001-37839 | 20-1590775 |
| (State or Other Jurisdiction of Incorporation) | (Commission File Number) | (I.R.S. Employer Identification Number) |
| 8501 N. Scottsdale Rd. Suite 100, Scottsdale, Arizona 85253 |
| (Address of Principal Executive Offices) (Zip Code) |
480-305-8910
(Registrant's telephone number, including area code)
(Former name or former address, if changed since last report)
| Check the appropriate box below if the Form 8-K filing is intended to simultaneously satisfy the filing obligation of the registrant under any of the following provisions: | ||
| [ ] | Written communications pursuant to Rule 425 under the Securities Act (17 CFR 230.425) | |
| [ ] | Soliciting material pursuant to Rule 14a-12 under the Exchange Act (17 CFR 240.14a-12) | |
| [ ] | Pre-commencement communications pursuant to Rule 14d-2(b) under the Exchange Act (17 CFR 240.14d-2(b)) | |
| [ ] | Pre-commencement communications pursuant to Rule 13e-4(c) under the Exchange Act (17 CFR 240.13e-4(c)) | |
Indicate by check mark whether the registrant is an emerging growth company as defined in Rule 405 of the Securities Act of 1933 (17 CFR §230.405) or Rule 12b-2 of the Securities Exchange Act of 1934 (17 CFR §240.12b-2). Emerging growth company [ X ]
If an emerging growth company, indicate by check mark if the registrant has elected not to use the extended transition period for complying with any new or revised financial accounting standards provided pursuant to Section 13(a) of the Exchange Act. [ X ]
Item 2.02. Results of Operations and Financial Condition.
On March 8, 2018, TPI Composites, Inc. (the Company) issued a press release announcing its financial results for the three months and full year ended December 31, 2017. A copy of the Company’s press release is furnished herewith as Exhibit 99.1 to this current report on Form 8-K and is incorporated by reference herein. The Company also posted a presentation to its website at www.tpicomposites.com under the tab “Investor Relations” providing information regarding its results of operations and financial condition for the three months and full year ended December 31, 2017. The information contained in the presentation is incorporated by reference herein. The presentation is being furnished herewith as Exhibit 99.2 to this current report on Form 8-K. The Company’s website and the information contained therein is not part of this disclosure. The information in Items 2.02 and 7.01 of this current report on Form 8-K (including Exhibit 99.1) is being furnished and shall not be deemed “filed” for the purposes of Section 18 of the Securities Exchange Act of 1934, as amended, or otherwise subject to the liabilities of that Section. The information in Items 2.02 and 7.01 of this current report on Form 8-K (including Exhibit 99.1 and Exhibit 99.3) shall not be incorporated by reference into any registration statement or other document pursuant to the Securities Act of 1933, as amended.
Item 7.01. Regulation FD Disclosure.
The information set forth under Item 2.02 of this current report on Form 8-K is incorporated by reference as if fully set forth herein.
On March 8, 2018, the Company issued a press release announcing that it has entered into an agreement with Navistar, Inc. to design and develop a Class 8 truck comprised of a composite tractor and frame rails. A copy of the Company’s press release is furnished herewith as Exhibit 99.3 to this current report on Form 8-K and is incorporated by reference herein.
The information in Exhibit 99.3 of this current report on Form 8-K is being furnished and shall not be deemed “filed” for the purposes of Section 18 of the Securities Exchange Act of 1934, as amended, or otherwise subject to the liabilities of that Section. The information in Item 7.01 of this current report on Form 8-K (including Exhibit 99.3) shall not be incorporated by reference into any registration statement or other document pursuant to the Securities Act of 1933, as amended.
Item 9.01. Financial Statements and Exhibits.
(d) Exhibits
99.1 – Press Release dated March 8, 2018
99.2 – Presentation dated March 8, 2018
99.3 – Press Release dated March 8, 2018
SIGNATURE
Pursuant to the requirements of the Securities Exchange Act of 1934, the registrant has duly caused this report to be signed on its behalf by the undersigned hereunto duly authorized.
| TPI Composites, Inc. | ||
| Date: March 8, 2018 | By: | /s/ William E. Siwek |
| William E. Siwek | ||
| Chief Financial Officer | ||
EXHIBIT 99.1
TPI Composites, Inc. Announces Fourth Quarter and Full Year 2017 Earnings Results
SCOTTSDALE, Ariz., March 08, 2018 (GLOBE NEWSWIRE) -- TPI Composites, Inc. (Nasdaq: TPIC), the only independent manufacturer of composite wind blades with a global footprint, today reported financial results for the fourth quarter and full year ended December 31, 2017.
Highlights
For the quarter ended December 31, 2017:
- Net sales of $247.1 million
- Total billings of $242.7 million
- Net income of $5.9 million or $0.17 per diluted share
- EBITDA of $20.9 million, with an EBITDA margin of 8.4%
- Adjusted EBITDA of $25.1 million, with an Adjusted EBITDA margin of 10.2%
For the full year 2017:
- Net sales of $930.3 million
- Total billings of $941.6 million
- Net income of $43.7 million or $1.25 per diluted share
- EBITDA of $89.9 million, with an EBITDA margin of 9.7%
- Adjusted EBITDA of $101.5 million, with an Adjusted EBITDA margin of 10.9%
| KPIs | Q4'17 | Q4'16 | FY‘17 | FY‘16 | |
| Sets1 | 669 | 541 | 2,736 | 2,154 | |
| Estimated megawatts² | 1,726 | 1,234 | 6,602 | 4,920 | |
| Dedicated manufacturing lines³ | 48 | 44 | 48 | 44 | |
| Manufacturing lines installed⁴ | 41 | 33 | 41 | 33 | |
| Manufacturing lines in startup⁵ | 9 | 3 | 9 | 3 | |
| Manufacturing lines in transition⁶ | - | 3 | - | 3 |
- Number of wind blade sets (which consist of three wind blades) invoiced worldwide in the period.
- Estimated megawatts of energy capacity to be generated by wind blade sets invoiced in the period.
- Number of manufacturing lines that are dedicated to our customers under long-term supply agreements. Includes seven lines for GE Wind that were not renewed after December 31, 2017.
- Number of manufacturing lines installed and either in operation, startup or transition.
- Number of manufacturing lines in a startup phase during the pre-production and production ramp-up period.
- Number of manufacturing lines that were being transitioned to a new wind blade model during the period.
“We finished our second year as a public company very strong, delivering another solid quarter along with record results for 2017,” said Steven Lockard, TPI Composites’ President and Chief Executive Officer. “We continue to execute on our strategy to grow globally, diversify among our customer base and across geographies, and expand profitability. Today we have up to $4.6 billion of potential revenue under long-term contracts covering 41 molds and a strong and diverse global pipeline of opportunities to support our growth targets. While 2018 will be a year of significant investment as we transition 14 existing manufacturing lines to larger blade models and start up 12 new lines, we estimate top line growth of approximately 10%. We believe our planned investments this year will position us for revenue growth in 2019 of approximately 35% and enable us to meet our three year revenue CAGR of between 20% and 25%.
“From a business development standpoint, during 2017 we signed multiyear supply agreements for five new manufacturing lines, representing total contract revenue of up to $850 million, plus options for additional lines with Vestas, Siemens Gamesa and a new customer, Senvion, and announced a new manufacturing hub in Matamoros, Mexico. We remain very confident in our ability to convert our prioritized pipeline of 24 manufacturing lines over the next 24 months and in fact we are in active negotiations for a number of lines with the expectation of closing them in the next 1 to 2 months.
“Finally, TPI continues to demonstrate additional commercial capabilities for our advanced composites expertise as we have grown our footprint in the transportation business with our expanded relationship with Proterra, a leading supplier of zero-emission buses. Additionally, today we announced that we entered into an agreement with Navistar, Inc. to design and develop a Class 8 truck comprised of a composite tractor and frame rails. This collaborative development project is being entered into in connection with Navistar’s recent award under the U.S. Department of Energy’s Super Truck II investment program, which is designed to promote freight efficiency in commercial vehicles.
“We remain focused on our commitment to grow our wind business, improve our operational effectiveness, drive improved profitability and continue to drive down the levelized cost of energy while continuing to develop and explore additional opportunities in other strategic markets,” concluded Mr. Lockard.
Fourth Quarter 2017 Financial Results
Net sales for the quarter increased by $61.6 million or 33.2% to $247.1 million compared to $185.6 million in the same period in 2016. Net sales of wind blades were $236.2 million for the quarter as compared to $164.8 million in the same period in 2016. The increase was primarily driven by a 38% increase in the number of wind blades delivered during the quarter as compared to the same period in 2016, primarily from our Turkey, Mexico and China plants. This was partially offset by a decline in the average sales prices of the same blade models delivered in both periods as a result of geographic mix and savings in raw material costs, a portion of which we share with our customers. Total billings for the quarter increased by $45.1 million or 22.8% to $242.7 million compared to $197.6 million in the same period in 2016. The favorable impact of the currency movements on consolidated net sales and total billings were both 2.5% for the quarter.
Total cost of goods sold for the quarter was $219.9 million and included aggregate costs of $11.6 million primarily related to startup costs in our new plants in Mexico and Turkey. This compares to total cost of goods sold of $166.5 million for the same period in 2016, including aggregate costs of $6.7 million related to startup costs in our new plants in Mexico and Turkey. Cost of goods sold as a percentage of net sales of wind blades decreased by four percentage points during the quarter as compared to the same period in 2016, driven by improved operating efficiencies and the impact of savings in raw material costs, partially offset by the increase in startup and transition costs and foreign currency fluctuations. The unfavorable impact of the currency movements on consolidated cost of goods sold was 1.8% for the quarter.
General and administrative expenses for the three months ended December 31, 2017 totaled $12.0 million as compared to $9.7 million for the same period in 2016. As a percentage of net sales, general and administrative expenses were 4.9% for the three months ended December 31, 2017, down from 5.2% in the same period in 2016. The increase in expenses was primarily driven by additional costs incurred related to the adoption of the new revenue recognition accounting standard, our work related to the Sarbanes-Oxley Act and increased personnel costs from filling our key global positions to support our growth and diversification strategy.
Net income for the quarter was $5.9 million as compared to a net loss of $2.3 million in the same period in 2016. This increase was primarily due to the improved operating results discussed above and the write-off of debt issuance costs related to the refinancing of our previous credit facility in the fourth quarter of 2016. Diluted earnings per share was $0.17 for the quarter, compared to a loss of $0.07 per share for the same period in 2016.
EBITDA for the quarter increased to $20.9 million, compared to $12.5 million during the same period in 2016. The EBITDA margin increased to 8.4% compared to 6.7% in the 2016 period. Adjusted EBITDA for the quarter increased to $25.1 million compared to $14.3 million during the same period in 2016. The Adjusted EBITDA margin increased to 10.2% compared to 7.7% during the same period in 2016.
Capital expenditures were $9.5 million for the quarter compared to $11.6 million during the same period in 2016. Current year capital expenditures were primarily related to new facilities and expansion or improvements at existing facilities and costs to enhance our information technology systems.
We ended the quarter with $148.1 million of cash and cash equivalents and net cash was $24.6 million as compared to net debt of $6.4 million as of December 31, 2016.
2018 Outlook
For 2018, the Company is providing the following:
- Total billings and net sales under ASC 606 of between $1.0 billion and $1.05 billion
- Adjusted EBITDA of between $75 million and $80 million under ASC 606
- Fully diluted earnings per share of between $0.38 and $0.42 under ASC 606
- Sets delivered of between 2,500 and 2,550
- Average sales price per blade of between $125,000 and $130,000
- Estimated megawatts of sets delivered to be between 6,950 and 7,100
- Dedicated manufacturing lines under long-term agreements at year end to be between 51 and 55
- Manufacturing lines installed at year end to be 47
- Manufacturing lines in transition during the year to be 14
- Manufacturing lines in startup during the year to be 12
- Startup and transition cost of between $58 million and $62 million
- Capital expenditures to be between $85 million and $90 million (approx. 85% growth related)
- Effective tax rate to be between 40% and 42%
- Depreciation and amortization of between $30 million and $35 million
- Interest expense of between $11.5 million and $12.5 million
- Share-based compensation expense of between $10 million and $11 million
Conference Call and Webcast Information
TPI Composites will host an investor conference call this afternoon, Thursday, March 8, 2018 at 5:00pm ET. Interested parties are invited to listen to the conference call which can be accessed live over the phone by dialing 1-877-407-9208, or for international callers, 1-201-493-6784. A replay will be available two hours after the call and can be accessed by dialing 1-844-512-2921, or for international callers, 1-412-317-6671. The passcode for the live call and the replay is 13676373. The replay will be available until March 15, 2018. Interested investors and other parties may also listen to a simultaneous webcast of the conference call by logging onto the Investor Relations section of the Company’s website at www.tpicomposites.com. The online replay will be available for a limited time beginning immediately following the call.
About TPI Composites, Inc.
TPI Composites, Inc. is the only independent manufacturer of composite wind blades for the wind energy market with a global manufacturing footprint. TPI delivers high-quality, cost-effective composite solutions through long-term relationships with leading global manufacturers. TPI is headquartered in Scottsdale, Arizona and operates factories throughout the U.S., Mexico, China and Turkey.
Forward-Looking Statements
This release contains forward-looking statements which are made pursuant to safe harbor provisions of the Private Securities Litigation Reform Act of 1995. These forward-looking statements include statements, among other things, concerning: effects on our financial statements and our financial outlook; our business strategy, including anticipated trends and developments in and management plans for our business and the wind industry and other markets in which we operate; our projected annual revenue growth; competition; future financial results, operating results, revenues, gross margin, operating expenses, products, projected costs, warranties, our ability to improve our operating margins, and capital expenditures. These forward-looking statements are often characterized by the use of words such as “estimate,” “expect,” “anticipate,” “project,” “plan,” “intend,” “seek,” “believe,” “forecast,” “foresee,” “likely,” “may,” “should,” “goal,” “target,” “might,” “will,” “could,” “predict,” “continue” and the negative or plural of these words and other comparable terminology. Forward-looking statements are only predictions based on our current expectations and our projections about future events. You should not place undue reliance on these forward-looking statements. We undertake no obligation to update any of these forward-looking statements for any reason. These forward-looking statements involve known and unknown risks, uncertainties and other factors that may cause our actual results, levels of activity, performance or achievements to differ materially from those expressed or implied by these statements. These factors include, but are not limited to, the matters discussed in “Risk Factors,” in our Annual Report on Form 10-K and other reports that we will file with the SEC.
Non-GAAP Definitions
This press release includes unaudited non-GAAP financial measures, including total billings, EBITDA, adjusted EBITDA, net cash/debt and free cash flow. We define total billings as total amounts billed from products and services that we are entitled to payment and have billed under the terms of our long-term supply agreements or other contractual arrangements. We define EBITDA as net income plus interest expense (including losses on extinguishment of debt and net of interest income), income taxes and depreciation and amortization. We define adjusted EBITDA as EBITDA plus any share-based compensation expense plus or minus any gains or losses from foreign currency transactions. We define net cash/debt as the total principal amount of debt outstanding less unrestricted cash and equivalents. We define free cash flow as net cash flow generated from operating activities less capital expenditures. We present non-GAAP measures when we believe that the additional information is useful and meaningful to investors. Non-GAAP financial measures do not have any standardized meaning and are therefore unlikely to be comparable to similar measures presented by other companies. The presentation of non-GAAP financial measures is not intended to be a substitute for, and should not be considered in isolation from, the financial measures reported in accordance with GAAP. See below for a reconciliation of certain non-GAAP financial measures to the comparable GAAP measures.
Investor Relations
480-315-8742
[email protected]
| TPI COMPOSITES, INC. AND SUBSIDIARIES | ||||||||||||||
| TABLE ONE - CONDENSED CONSOLIDATED STATEMENTS OF OPERATIONS | ||||||||||||||
| (UNAUDITED) | ||||||||||||||
| Three Months Ended December 31, |
Year Ended December 31, | |||||||||||||
| (in thousands, except per share data) | 2017 | 2016 | 2017 | 2016 | ||||||||||
| Net sales | $ | 247,139 | $ | 185,574 | $ | 930,281 | $ | 754,877 | ||||||
| Cost of sales | 208,285 | 159,849 | 776,944 | 659,745 | ||||||||||
| Startup and transition costs | 11,577 | 6,678 | 40,628 | 18,127 | ||||||||||
| Total cost of goods sold | 219,862 | 166,527 | 817,572 | 677,872 | ||||||||||
| Gross profit | 27,277 | 19,047 | 112,709 | 77,005 | ||||||||||
| General and administrative expenses | 12,000 | 9,738 | 40,373 | 33,892 | ||||||||||
| Income from operations | 15,277 | 9,309 | 72,336 | 43,113 | ||||||||||
| Other income (expense): | ||||||||||||||
| Interest income | 17 | 268 | 95 | 344 | ||||||||||
| Interest expense | (3,166 | ) | (4,905 | ) | (12,381 | ) | (17,614 | ) | ||||||
| Loss on extinguishment of debt | - | (4,487 | ) | - | (4,487 | ) | ||||||||
| Realized loss on foreign currency remeasurement | (1,896 | ) | (57 | ) | (4,471 | ) | (757 | ) | ||||||
| Miscellaneous income | 223 | 46 | 1,191 | 238 | ||||||||||
| Total other expense | (4,822 | ) | (9,135 | ) | (15,566 | ) | (22,276 | ) | ||||||
| Income before income taxes | 10,455 | 174 | 56,770 | 20,837 | ||||||||||
| Income tax provision | (4,566 | ) | (2,430 | ) | (13,080 | ) | (6,995 | ) | ||||||
| Net income (loss) | 5,889 | (2,256 | ) | 43,690 | 13,842 | |||||||||
| Net income attributable to preferred stockholders | - | - | - | 5,471 | ||||||||||
| Net income (loss) attributable to common stockholders | $ | 5,889 | $ | (2,256 | ) | $ | 43,690 | $ | 8,371 | |||||
| Weighted-average common shares outstanding: | ||||||||||||||
| Basic | 34,008 | 33,737 | 33,844 | 17,530 | ||||||||||
| Diluted | 35,198 | 33,737 | 34,862 | 17,616 | ||||||||||
| Net income (loss) per common share: | ||||||||||||||
| Basic | $ | 0.17 | $ | (0.07 | ) | $ | 1.29 | $ | 0.48 | |||||
| Diluted | $ | 0.17 | $ | (0.07 | ) | $ | 1.25 | $ | 0.48 | |||||
| Non-GAAP Measures: | ||||||||||||||
| Total billings | $ | 242,732 | $ | 197,645 | $ | 941,565 | $ | 764,424 | ||||||
| EBITDA | $ | 20,860 | $ | 12,492 | $ | 89,934 | $ | 55,491 | ||||||
| Adjusted EBITDA | $ | 25,086 | $ | 14,334 | $ | 101,529 | $ | 66,150 | ||||||
| TPI COMPOSITES, INC. AND SUBSIDIARIES | |||||
| TABLE TWO - CONDENSED CONSOLIDATED BALANCE SHEETS | |||||
| December 31, | |||||
| (in thousands) | 2017 | 2016 | |||
| Current assets: | |||||
| Cash and cash equivalents | $ | 148,113 | $ | 119,066 | |
| Restricted cash | 3,849 | 2,259 | |||
| Accounts receivable | 121,576 | 67,842 | |||
| Inventories | 67,064 | 53,095 | |||
| Inventories held for customer orders | 64,858 | 52,308 | |||
| Prepaid expenses and other current assets | 27,507 | 30,657 | |||
| Total current assets | 432,967 | 325,227 | |||
| Noncurrent assets: | |||||
| Property, plant, and equipment, net | 123,480 | 91,166 | |||
| Other noncurrent assets | 17,087 | 20,813 | |||
| Total assets | $ | 573,534 | $ | 437,206 | |
| Current liabilities: | |||||
| Accounts payable and accrued expenses | $ | 166,743 | $ | 112,281 | |
| Accrued warranty | 29,163 | 19,912 | |||
| Deferred revenue | 81,048 | 69,568 | |||
| Customer deposits and customer advances | 10,134 | 1,390 | |||
| Current maturities of long-term debt | 35,506 | 33,403 | |||
| Total current liabilities | 322,594 | 236,554 | |||
| Noncurrent liabilities: | |||||
| Long-term debt, net of debt issuance costs and | |||||
| current maturities | 85,879 | 89,752 | |||
| Other noncurrent liabilities | 4,444 | 4,393 | |||
| Total liabilities | 412,917 | 330,699 | |||
| Total stockholders' equity | 160,617 | 106,507 | |||
| Total liabilities and stockholders' equity | $ | 573,534 | $ | 437,206 | |
| Non-GAAP Measure (unaudited): | |||||
| Net cash (debt) | $ | 24,557 | $ | (6,379 | ) |
| TPI COMPOSITES, INC. AND SUBSIDIARIES | ||||||||||||||
| TABLE THREE - CONDENSED CONSOLIDATED STATEMENTS OF CASH FLOWS | ||||||||||||||
| (UNAUDITED) | ||||||||||||||
| Three Months Ended December 31, |
Year Ended December 31, | |||||||||||||
| (in thousands) | 2017 | 2016 | 2017 | 2016 | ||||||||||
| Net cash provided by operating activities | $ | 31,140 | $ | 25,865 | $ | 82,663 | $ | 53,841 | ||||||
| Net cash used in investing activities | (8,666 | ) | (11,590 | ) | (43,978 | ) | (30,507 | ) | ||||||
| Net cash provided by (used in) financing activities | (13,456 | ) | (1,041 | ) | (9,973 | ) | 51,330 | |||||||
| Impact of foreign exchange rates on cash and cash | ||||||||||||||
| equivalents | 30 | (970 | ) | 335 | (1,515 | ) | ||||||||
| Cash and cash equivalents, beginning of period | 139,065 | 106,802 | 119,066 | 45,917 | ||||||||||
| Cash and cash equivalents, end of year | $ | 148,113 | $ | 119,066 | $ | 148,113 | $ | 119,066 | ||||||
| Non-GAAP Measure (unaudited): | ||||||||||||||
| Free cash flow | $ | 21,624 | $ | 14,275 | $ | 37,835 | $ | 23,334 | ||||||
| TPI COMPOSITES, INC. AND SUBSIDIARIES | |||||||||||||
| TABLE FOUR - RECONCILIATION OF NON-GAAP MEASURES | |||||||||||||
| (UNAUDITED) | |||||||||||||
| Total billings is reconciled as follows: | Three Months Ended December 31, |
Year Ended December 31, | |||||||||||
| (in thousands) | 2017 | 2016 | 2017 | 2016 | |||||||||
| Net sales | $ | 247,139 | $ | 185,574 | $ | 930,281 | $ | 754,877 | |||||
| Change in deferred revenue: | |||||||||||||
| Blade-related deferred revenue at beginning of period (1) | (87,294 | ) | (61,949 | ) | (69,568 | ) | (65,520 | ) | |||||
| Blade-related deferred revenue at end of period (1) | 81,048 | 69,568 | 81,048 | 69,568 | |||||||||
| Foreign exchange impact (2) | 1,839 | 4,452 | (196 | ) | 5,499 | ||||||||
| Change in deferred revenue | (4,407 | ) | 12,071 | 11,284 | 9,547 | ||||||||
| Total billings | $ | 242,732 | $ | 197,645 | $ | 941,565 | $ | 764,424 | |||||
| EBITDA and adjusted EBITDA are reconciled as follows: | Three Months Ended December 31, |
Year Ended December 31, | |||||||||||
| (in thousands) | 2017 | 2016 | 2017 | 2016 | |||||||||
| Net income (loss) | $ | 5,889 | $ | (2,256 | ) | $ | 43,690 | $ | 13,842 | ||||
| Adjustments: | |||||||||||||
| Depreciation and amortization | 7,256 | 3,194 | 20,878 | 12,897 | |||||||||
| Interest expense (net of interest income) | 3,149 | 4,637 | 12,286 | 17,270 | |||||||||
| Loss on extinguishment of debt | - | 4,487 | - | 4,487 | |||||||||
| Income tax provision | 4,566 | 2,430 | 13,080 | 6,995 | |||||||||
| EBITDA | 20,860 | 12,492 | 89,934 | 55,491 | |||||||||
| Share-based compensation expense | 2,330 | 1,785 | 7,124 | 9,902 | |||||||||
| Realized loss on foreign currency remeasurement | 1,896 | 57 | 4,471 | 757 | |||||||||
| Adjusted EBITDA | $ | 25,086 | $ | 14,334 | $ | 101,529 | $ | 66,150 | |||||
| Free cash flow is reconciled as follows: | Three Months Ended December 31, |
Year Ended December 31, | |||||||||||
| (in thousands) | 2017 | 2016 | 2017 | 2016 | |||||||||
| Net cash provided by operating activities | $ | 31,140 | $ | 25,865 | $ | 82,663 | $ | 53,841 | |||||
| Capital expenditures | (9,516 | ) | (11,590 | ) | (44,828 | ) | (30,507 | ) | |||||
| Free cash flow | $ | 21,624 | $ | 14,275 | $ | 37,835 | $ | 23,334 | |||||
| Net debt is reconciled as follows: |
December 31, | ||||||||||||
| (in thousands) | 2017 | 2016 | |||||||||||
| Total debt, net of debt issuance costs | $ | 121,385 | $ | 123,155 | |||||||||
| Add debt issuance costs | 2,171 | 2,290 | |||||||||||
| Less cash and cash equivalents | (148,113 | ) | (119,066 | ) | |||||||||
| Net cash (debt) | $ | 24,557 | $ | (6,379 | ) | ||||||||
| (1) Total billings is reconciled using the blade-related deferred revenue amounts at the beginning and the end of the period as follows: | |||||||||||||
| Three Months Ended December 31, |
Year Ended December 31, | ||||||||||||
| (in thousands) | 2017 | 2016 | 2017 | 2016 | |||||||||
| Blade-related deferred revenue at beginning of period | $ | 87,294 | $ | 61,949 | $ | 69,568 | $ | 65,520 | |||||
| Non-blade related deferred revenue at beginning of period | - | - | - | - | |||||||||
| Total current and noncurrent deferred revenue at beginning of period | $ | 87,294 | $ | 61,949 | $ | 69,568 | $ | 65,520 | |||||
| Blade-related deferred revenue at end of period | $ | 81,048 | $ | 69,568 | $ | 81,048 | $ | 69,568 | |||||
| Non-blade related deferred revenue at end of period | - | - | - | - | |||||||||
| Total current and noncurrent deferred revenue at end of period | $ | 81,048 | $ | 69,568 | $ | 81,048 | $ | 69,568 | |||||
| (2) Represents the effect of the difference between the exchange rate used by our various foreign subsidiaries on the invoice date versus the exchange rate used at the period-end balance sheet date. | |||||||||||||
EXHIBIT 99.2

Q4 2017 Earnings Call
Q4 2017 Earnings Call Legal Disclaimer This presentation contains forward - looking statements within the meaning of the federal securities laws. All statements other than statements of historical facts contai ned in this presentation, including statements regarding our future results of operations and financial position, business strategy and p lan s and objectives of management for future operations, are forward - looking statements. In many cases, you can identify forward - looking statements by terms such as “may,” “should,” “expects,” “plans,” “anticipates,” “could,” “intends,” “target,” “projects,” “contemplates,” “believes,” “estimates,” “predicts,” “potential” or “continue” or the negati ve of these terms or other similar words. Forward - looking statements contained in this presentation include, but are not limited to, statements about (i) growth of the wind energy mar ket and our addressable market; (ii) the potential impact of GE’s acquisition of LM Wind Power upon our business; (iii) the potential impact of the increasing prevalence of auction - based tenders in the wind energy market and increased competition from solar energy on our gross margins and overall financial performance; (iv) our ability to successfully expand our transportation business and execute upon our strategy of entering new markets outside of wind energy; (v) our future financial performance, including our net sales, cost of goods sold, gross profit or gross margin, operating expenses, ability to generate positive cash flow, and ability to achieve or maintain profitability; (vi) the sufficiency of our cash and cash equivalents to meet our liquidity needs; ( vii) our ability to attract and retain customers for our products, and to optimize product pricing; ( viii ) competition from other wind blade manufacturers; (ix) the discovery of defects in our products; (x) our ability to successfully expand in our existing markets and into new international markets; (xi) worldwide economic conditions and their impact on customer demand; ( xii) our ability to effectively manage our growth strategy and future expenses; ( xiii ) our ability to maintain, protect and enhance our intellectual property; ( xiv) our ability to comply with existing, modified or new laws and regulations applying to our business; ( xv) the attraction and retention of qualified employees and key personnel; and ( xvi) changes in domestic or international government or regulatory policy, including without limitation, changes in tax policy. These forward - looking statements are only predictions. These statements relate to future events or our future financial performance and involve kno wn and unknown risks, uncertainties and other important factors that may cause our actual results, levels of activity, performance or achievements to materially differ from any future results, levels of activity, performance or achievements expressed or implied by these forward - looking statements. Because forward - looking statements are inherently subject to risks and uncertainties, some of which cannot be predicted or quantified, you should not rely on these forward - looking statements as guarantees of future events. Further information on the factors, risks and uncertainties that could affect our financial results and the forward - looking statements in this presentation are included in our filings with the Securities and Exchange Commission and will be included in subsequent periodic and current reports we make with the Securities and Exchange Com mission from time to time, including in our Annual Report on Form 10 - K for the year ended December 31, 2017. The forward - looking statements in this presentation represent our views as of the date of this presentation. We anticipate that subsequent events an d developments will cause our views to change. However, while we may elect to update these forward - looking statements at some point in the future, we undertake no obligation to update any forward - looking statement to reflect events or developments after the date on which the statement is made or to reflect the occurrence of una nti cipated events except to the extent required by applicable law. You should, therefore, not rely on these forward - looking statements as representing our views as of any date after the date of this presentation. Our forward - looking statements do not reflect the potential impact of any future acquisitions, mergers, dispositions, joint ventures, or investme nts we may make. This presentation includes unaudited non - GAAP financial measures including total billings, EBITDA, adjusted EBITDA, net cash (debt) and free cash flow. We define total billings as the total amounts we have invoiced our customers for products and services for which we are entitled to payment under the ter ms of our long - term supply agreements or other contractual agreements. We define EBITDA as net income (loss) attributable to the Company plus interest expense (including lo sse s on the extinguishment of debt and net of interest income), income taxes and depreciation and amortization. We define Adjusted EBITDA as EBITDA plus any share - based compensation expense, plus or minus any gains or losses from foreign currency remeasurement. We define net cash (debt) as the total principal amount of debt outstanding less unrestricted cash and cash equivalents. We define free cash flow as net cash flow generated from operating activities less capital expenditures. We present non - GAAP measures when we believe that the additional information is useful and meaningful to investors. Non - GAAP financial measures do not have any standardized meaning and are therefore unlikely to be comparable to similar measures presented by other companies. The presentation of non - GAAP financial measures is not intended to be a substitute for, and should not be considered in isolation from, the financial measures reported in accordance with GAAP. See the appendix for the reconciliations of certain non - GAAP financial measures to the comparable GAAP measures. This presentation also contains estimates and other information concerning our industry that are based on industry publicatio ns, surveys and forecasts. This information involves a number of assumptions and limitations, and we have not independently verified the accuracy or completeness of the information . 2 March 8, 2018

Q4 2017 Earnings Call Agenda • Q4 and Full Year 2017 Highlights • Industry Update • Q4 and Full Year 2017 Financial Highlights • Impact of ASC 606 • Impact of Tax Reform • Guidance for 2018 • Q&A • Appendix – Non - GAAP Information 3 March 8, 2018
Q4 and Full Year 2017 Highlights
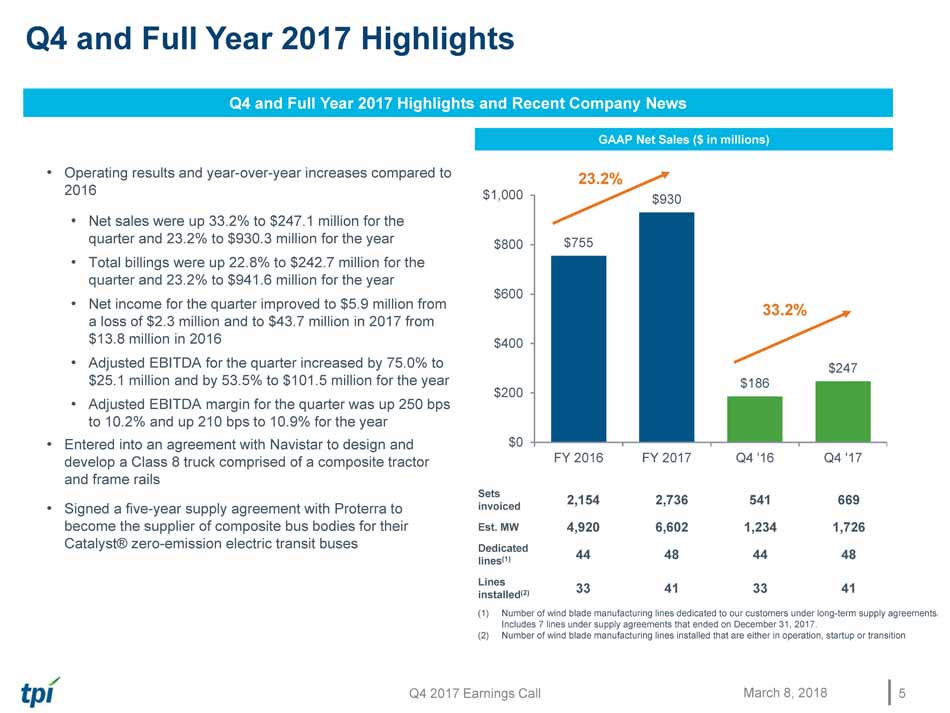
Q4 2017 Earnings Call Q4 and Full Year 2017 Highlights 5 March 8, 2018 Q4 and Full Year 2017 Highlights and Recent Company News • Operating results and year - over - year increases compared to 201 6 • Net sales were up 33.2 % to $247.1 million for the quarter and 23.2% to $930.3 million for the year • Total billings were up 22.8 % to $ 242.7 million for the quarter and 23.2% to $941.6 million for the year • Net income for the quarter i mprove d to $ 5.9 million from a loss of $ 2.3 million and to $43.7 million in 2017 from $13.8 million in 2016 • Adjusted EBITDA for the quarter increased by 75.0% to $ 25.1 million and by 53.5% to $101.5 million for the year • Adjusted EBITDA margin for the quarter was up 250 bps to 10.2 % and up 210 bps to 10.9% for the year • Entered into an agreement with Navistar to design and develop a Class 8 truck comprised of a composite tractor and frame rails • Signed a five - year supply agreement with Proterra to become the supplier of composite bus bodies for their Catalyst® zero - emission electric transit buses GAAP Net Sales ($ in millions) $755 $930 $186 $247 $0 $200 $400 $600 $800 $1,000 FY 2016 FY 2017 Q4 '16 Q4 '17 Sets invoiced 2,154 2,736 541 669 Est. MW 4,920 6 , 602 1,234 1,726 Dedicated lines (1) 44 48 44 48 Lines installed (2) 3 3 41 33 41 (1) Number of wind blade manufacturing lines dedicated to our customers under long - term supply agreement s. Includes 7 lines under supply agreements that ended on December 31, 2017. (2) Number of wind blade manufacturing lines installed that are either in operation, startup or transition 23.2% 33.2%
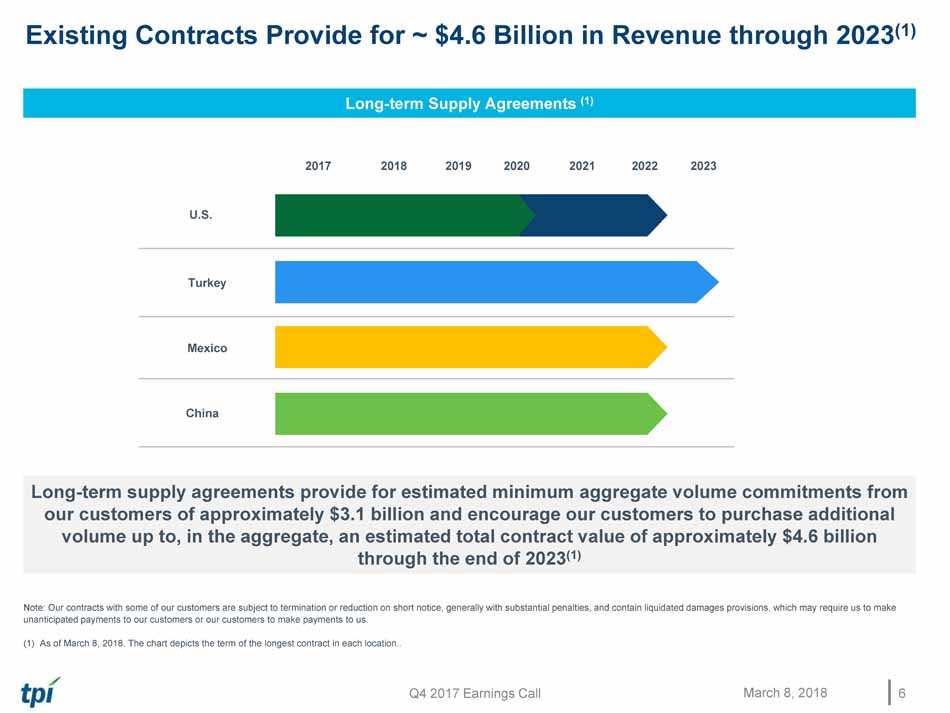
Q4 2017 Earnings Call Existing Contracts Provide for ~ $4.6 Billion in Revenue through 2023 (1 ) 6 March 8, 2018 Long - term Supply Agreements (1) 2017 2018 2019 2020 2021 2022 2023 U.S. Turkey Mexico China Long - term supply agreements provide for estimated minimum aggregate volume commitments from our customers of approximately $ 3.1 billion and encourage our customers to purchase additional volume up to, in the aggregate, an estimated total contract value of approximately $4.6 billion through the end of 2023 (1) Note: Our contracts with some of our customers are subject to termination or reduction on short notice, generally with substa nti al penalties, and contain liquidated damages provisions, which may require us to make unanticipated payments to our customers or our customers to make payments to us. (1) As of March 8 , 2018. The chart depicts the term of the longest contract in each location . .

Industry Update
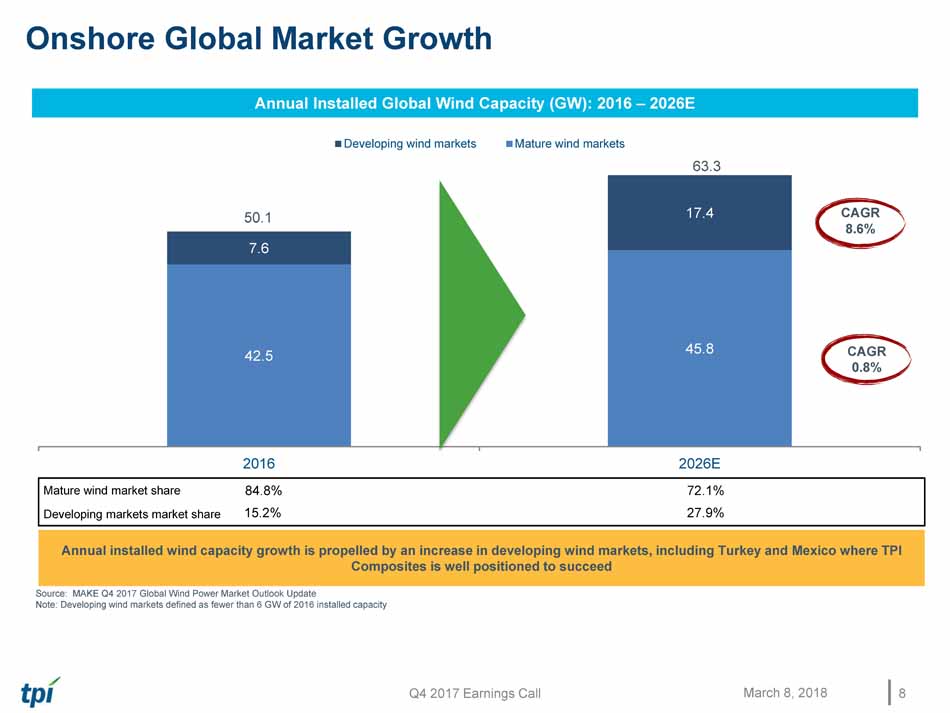
Q4 2017 Earnings Call Onshore Global Market Growth 8 March 8, 2018 Annual I nstalled G lobal W ind C apacity (GW): 2016 – 2026E 42.5 45.8 7.6 17.4 2016 2026E Developing wind markets Mature wind markets Source: MAKE Q 4 2017 Global Wind Power Market Outlook Update Note: Developing wind markets defined as fewer than 6 GW of 2016 installed capacity Annual installed wind capacity growth is propelled by an increase in developing wind markets, including Turkey and Mexico where TPI Composites is well positioned to succeed 50.1 CAGR 0. 8 % CAGR 8. 6 % Mature wind market share Developing market s market share 15.2% 84.8% 2 7 . 9 % 7 2 . 1 % 6 3 . 3

Q4 2017 Earnings Call U.S. Onshore Market Growth: 2011 – 2020E 9 March 8, 2018 The U.S. wind market is expected to experience consistent near - term growth in light of the PTC phase out Source: MAKE Q4 2017 Global Wind Power Market Outlook Update (GW) U.S. Onshore Wind Market Growth - Capacity (2011 – 2015) 6.2 12.5 1.1 4.8 8.6 0 3 6 9 12 15 2011 2012 2013 2014 2015 8.9 7.0 8.9 10.8 12.4 2016 2017E 2018E 2019E 2020E U.S. Onshore Wind Market Growth – Capacity (2016 – 2020E) Average annual installation: 10.7 GW (2018 – 2020) Total U.S. wind installations: 32.1 GW (2018 – 2020) Average annual installation: 6.6 GW Total U.S. wind installations: 33.2 GW

Q4 2017 Earnings Call Market Demand Drivers • Overall competitiveness of wind energy • Corporate and industrial demand • Utilities being driven by consumer demand and sheer economics • Offshore economics • Repowering - globally • Vehicle electrification • Decarbonization of electric sector 10 March 8, 2018

Q4 and Full Year 2017 Financial Highlights

Q4 2017 Earnings Call Q4 and Full Year 2017 Financial Highlights (unaudited ) 12 March 8, 2018 (1) See pages 25 – 28 for reconciliations of non - GAAP financial data (2) Based on n et income (loss) attributable to common stock holders ($ in millions, except per share data and KPIs) Q4 ’17 Q4 ’16 ∆ Full Year ’17 Full Year ’16 ∆ Select Financial Data Net Sales $ 247.1 $ 185.6 33.2% $ 930.3 $ 754.9 23.2% Total Billings (1) $ 242.7 $ 197.6 22.8% $ 941.6 $ 764.4 23.2% Net Income (Loss) $ 5.9 $ (2.3) NM $ 43.7 $ 13.8 215.6% Diluted Earnings (Loss) per Share (2) $ 0.17 $ (0.07) $ 0.24 $ 1.25 $ 0.48 $ 0.77 Adjusted EBITDA (1) $ 25.1 $ 14.3 75.0% $ 101.5 $ 66.2 53.5% Adjusted EBITDA Margin 10.2% 7.7% 250 bps 10.9% 8.8% 210 bps Net Cash (Debt) (1) $ 24.6 $ (6.4) $ 30.9 $ 24.6 $ (6.4) $ 30.9 Free Cash Flow (1) $ 21.6 $ 14.3 $ 7.3 $ 37.8 $ 23.3 $ 14.5 Capital Expenditures $ 9.5 $ 11.6 $ (2.1) $ 44.8 $ 30.5 $ 14.3 Key Performance Indicators (KPIs) Sets Invoiced 669 541 128 2,736 2,154 582 Estimated Megawatts 1,726 1,234 492 6,602 4,920 1,682 Dedicated Wind Blade Manufacturing Lines 48 44 4 lines 48 44 4 lines Wind Blade Manufacturing Lines Installed 41 33 8 lines 41 33 8 lines Wind Blade Manufacturing Lines in Startup 9 3 6 lines 9 3 6 lines Wind Blade Manufacturing Lines in Transition — 3 3 lines — 3 3 lines
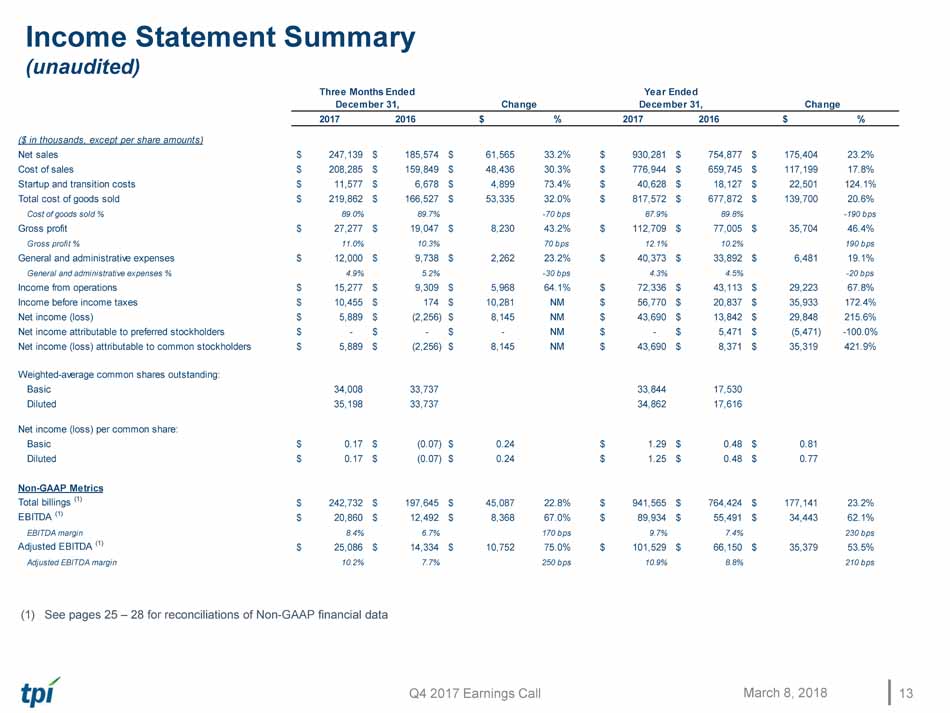
Q4 2017 Earnings Call Income Statement Summary (unaudited) 13 March 8, 2018 (1) See pages 25 – 28 for reconciliations of Non - GAAP financial data 2017 2016 $ % 2017 2016 $ % ($ in thousands, except per share amounts) Net sales 247,139$ 185,574$ 61,565$ 33.2% 930,281$ 754,877$ 175,404$ 23.2% Cost of sales 208,285$ 159,849$ 48,436$ 30.3% 776,944$ 659,745$ 117,199$ 17.8% Startup and transition costs 11,577$ 6,678$ 4,899$ 73.4% 40,628$ 18,127$ 22,501$ 124.1% Total cost of goods sold 219,862$ 166,527$ 53,335$ 32.0% 817,572$ 677,872$ 139,700$ 20.6% Cost of goods sold % 89.0% 89.7% -70 bps 87.9% 89.8% -190 bps Gross profit 27,277$ 19,047$ 8,230$ 43.2% 112,709$ 77,005$ 35,704$ 46.4% Gross profit % 11.0% 10.3% 70 bps 12.1% 10.2% 190 bps General and administrative expenses 12,000$ 9,738$ 2,262$ 23.2% 40,373$ 33,892$ 6,481$ 19.1% General and administrative expenses % 4.9% 5.2% -30 bps 4.3% 4.5% -20 bps Income from operations 15,277$ 9,309$ 5,968$ 64.1% 72,336$ 43,113$ 29,223$ 67.8% Income before income taxes 10,455$ 174$ 10,281$ NM 56,770$ 20,837$ 35,933$ 172.4% Net income (loss) 5,889$ (2,256)$ 8,145$ NM 43,690$ 13,842$ 29,848$ 215.6% Net income attributable to preferred stockholders -$ -$ -$ NM -$ 5,471$ (5,471)$ -100.0% Net income (loss) attributable to common stockholders 5,889$ (2,256)$ 8,145$ NM 43,690$ 8,371$ 35,319$ 421.9% Weighted-average common shares outstanding: Basic 34,008 33,737 33,844 17,530 Diluted 35,198 33,737 34,862 17,616 Net income (loss) per common share: Basic 0.17$ (0.07)$ 0.24$ 1.29$ 0.48$ 0.81$ Diluted 0.17$ (0.07)$ 0.24$ 1.25$ 0.48$ 0.77$ Non-GAAP Metrics Total billings (1) 242,732$ 197,645$ 45,087$ 22.8% 941,565$ 764,424$ 177,141$ 23.2% EBITDA (1) 20,860$ 12,492$ 8,368$ 67.0% 89,934$ 55,491$ 34,443$ 62.1% EBITDA margin 8.4% 6.7% 170 bps 9.7% 7.4% 230 bps Adjusted EBITDA (1) 25,086$ 14,334$ 10,752$ 75.0% 101,529$ 66,150$ 35,379$ 53.5% Adjusted EBITDA margin 10.2% 7.7% 250 bps 10.9% 8.8% 210 bps Three Months Ended December 31, Change Year Ended December 31, Change

Q4 2017 Earnings Call Key Balance Sheet and Cash Flow Data ( unaudited) 14 March 8, 2018 (1) See page 27 for the reconciliation s of net cash ( debt ) and free cash flow ($ in thousands) 2017 2016 Balance Sheet Data: Cash and cash equivalents 148,113$ 119,066$ Restricted cash 3,849$ 2,259$ Accounts receivable 121,576$ 67,842$ Inventories 67,064$ 53,095$ Inventories held for customer orders 64,858$ 52,308$ Deferred revenue 81,048$ 69,568$ Total debt-current and noncurrent, net 121,385$ 123,155$ Net cash (debt) (1) 24,557$ (6,379)$ ($ in thousands) 2017 2016 2017 2016 Cash Flow Data: Net cash provided by operating activities 31,140$ 25,865$ 82,663$ 53,841$ Capital expenditures 9,516$ 11,590$ 44,828$ 30,507$ Free cash flow (1) 21,624$ 14,275$ 37,835$ 23,334$ December 31, Year Ended December 31, Three Months Ended December 31,

Impact of ASC 606

Q4 2017 Earnings Call Estimated Impact of ASC 606 16 March 8, 2018 (in thousands except per share amounts) 2018 Guidance Under ASC 606 Year Ended December 31, 2017 Year Ended December 31, 2016 Low End of Range High End of Range As Reported Estimated Restatement under ASC 606 As Reported Estimated Restatement under ASC 606 Net Sales $1,000,000 $1,050,000 $930,281 $955,000 $754,877 $770,000 EPS – Fully Diluted $0.38 $0.42 $1.25 $1.12 $0.48 $1.05 Adjusted EBITDA $75,000 $80,000 $101,529 $99,000 $66,150 $77,000

Impact of Tax Reform

Q4 2017 Earnings Call Impact of Tax Reform 18 March 8, 2018 • We expect to have no cash taxes in the U.S. in 2018 or 2019 due to the utilization of foreign tax credits and NOLs which includes the estimated impact of taxes on approximately $74.3M of net foreign earnings and profits (repatriation tax) • We expect no direct future impact from the BEAT provisions • We expect a nominal benefit of the immediate expensing of capital expenditures given the relatively small amount in the U.S. • After 2019 we expect tax reform to have an overall positive impact to TPI as a result of lower tax rates in the U.S. once our NOLs are fully utilized

Q4 2017 Earnings Call Effective Tax Rate • A djusting our guidance for 2018 from 25% to a range of 40% to 42% – Under our operating and tax structure, the majority of our operating results in China and Mexico are taxed in the U.S. – We are structured this way to take advantage of the NOLs we’ve generated in the U.S. and as a more efficient way to manage our global cash. – However, we are unable to currently recognize the benefit of NOLs generated in the U.S. due to the valuation allowance recorded against this asset in the U.S. as required under U.S. GAAP. – We will generate U.S. tax losses in 2018 as a result of the startups for Vestas in Matamoros, Senvion in China and Proterra in Iowa. – The inability to recognize the benefit of the U.S. tax losses in 2018 will result in our reported effective tax rate for 2018 being higher than originally anticipated. 19 March 8, 2018

Guidance for 2018
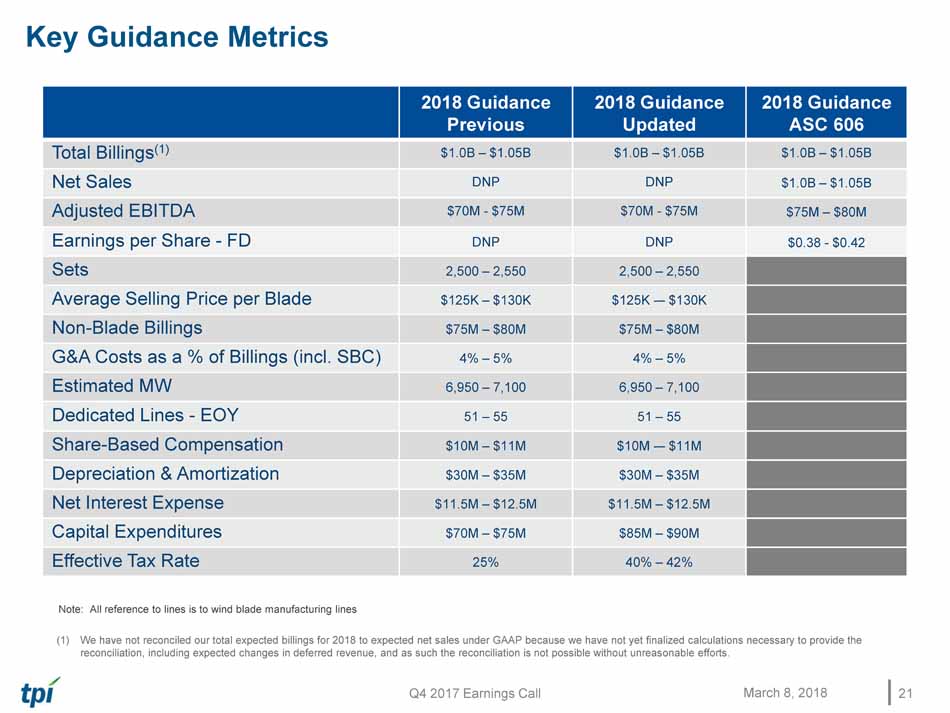
Q4 2017 Earnings Call Key Guidance Metrics 21 March 8, 2018 2018 Guidance Previous 2018 Guidance Updated 2018 Guidance ASC 606 Total Billings (1) $1.0B – $1.05B $1.0B – $1.05B $1.0B – $1.05B Net Sales DNP DNP $1.0B – $1.05B Adjusted EBITDA $70M - $75M $70M - $75M $75M – $80M Earnings per Share - FD DNP DNP $0.38 - $0.42 Sets 2,500 – 2,550 2,500 – 2,550 Average Selling Price per Blade $125K – $130K $125K - – $130K Non - Blade Billings $75M – $80M $75M – $80M G&A Costs as a % of Billings (incl. SBC) 4% – 5% 4% – 5% Estimated MW 6,950 – 7,100 6,950 – 7,100 Dedicated Lines - EOY 51 – 55 51 – 55 Share - Based Compensation $10M – $11M $10M - – $11M Depreciation & Amortization $30M – $35M $30M – $35M Net Interest Expense $11.5M – $12.5M $11.5M – $12.5M Capital Expenditures $70M – $75M $85M – $90M Effective Tax Rate 25% 40% – 42% Note: All reference to lines is to wind blade manufacturing lines (1) We have not reconciled our total expected billings for 2018 to expected net sales under GAAP because we have not yet finalize d c alculations necessary to provide the reconciliation, including expected changes in deferred revenue, and as such the reconciliation is not possible without unreas ona ble efforts.
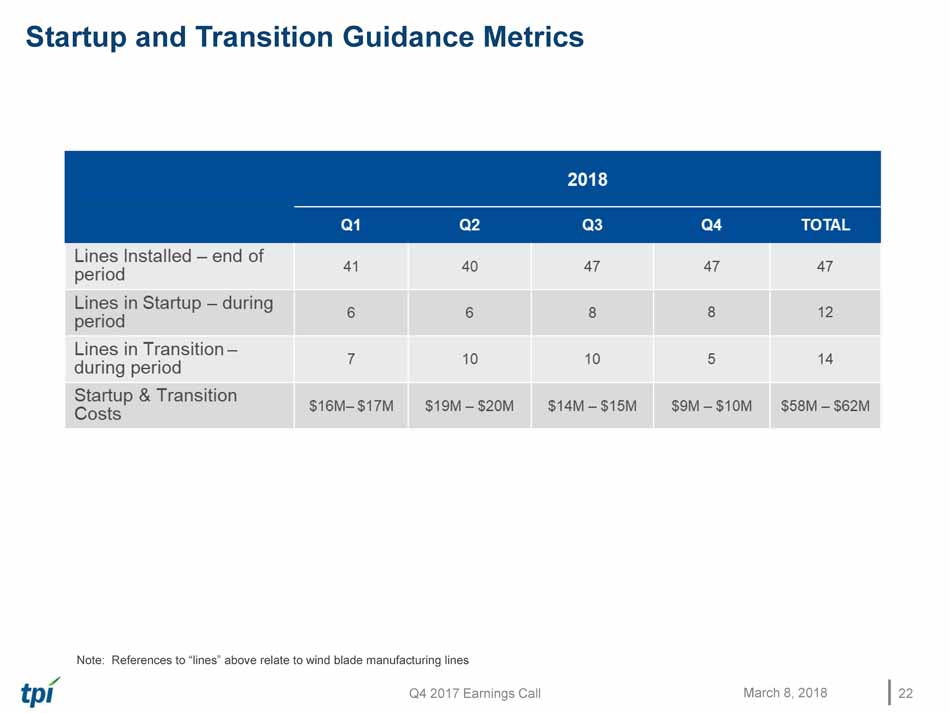
Q4 2017 Earnings Call Startup and Transition Guidance Metrics 22 March 8, 2018 Note: References to “lines” above relate to wind blade manufacturing lines

Q&A

Appendix – Non - GAAP Information This presentation includes unaudited non - GAAP financial measures including total billings, EBITDA, adjusted EBITDA, net cash (debt) and free cash flow. We define total billings as the total amounts we have invoiced our customers for products and services for wh ich we are entitled to payment under the terms of our long - term supply agreements or other contractual agreements. We define EBITDA as net income (loss) attributable to the Company plus interest expense (including losses on the extinguishment of debt and net of in ter est income), income taxes, and depreciation and amortization. We define adjusted EBITDA as EBITDA plus any share - based compensation expense, plus or minus any gains or losses from foreign currency remeasurement. We define net cash (debt) as the total principal amount of debt outstanding less unrestricted cash and cash equivalents. We define free cash flow as net cash flow g ene rated from operating activities less capital expenditures. We present non - GAAP measures when we believe that the additional information is useful and meaningful to investors. Non - GAAP financial measures do not have any standardized meaning and are therefore unlikely to be comparable to similar measures presented by other companies. The presentation of non - GAAP financial measures is not intended to be a substitute for, and should not be considered in isolation from, the financial measures reported in accordance with GA AP. See below for a reconciliation of certain non - GAAP financial measures to the comparable GAAP measures.

Q4 2017 Earnings Call Non - GAAP Reconciliations ( unaudited) Net sales is reconciled to total billings as follows: Net income is reconciled to EBITDA and adjusted EBITDA as follows: Note: Footnote references on the following page 25 March 8, 2018 ($ in thousands) 2017 2016 2017 2016 Net sales 247,139$ 185,574$ 930,281$ 754,877$ Change in deferred revenue: Blade-related deferred revenue at beginning of period (1) (87,294) (61,949) (69,568) (65,520) Blade-related deferred revenue at end of period (1) 81,048 69,568 81,048 69,568 Foreign exchange impact (2) 1,839 4,452 (196) 5,499 Change in deferred revenue (4,407) 12,071 11,284 9,547 Total billings 242,732$ 197,645$ 941,565$ 764,424$ Three Months Ended December 31, Year Ended December 31, ($ in thousands) 2017 2016 2017 2016 Net income (loss) 5,889$ (2,256)$ 43,690$ 13,842$ Adjustments: Depreciation and amortization 7,256 3,194 20,878 12,897 Interest expense (net of interest income) 3,149 4,637 12,286 17,270 Loss on extinguishment of debt - 4,487 - 4,487 Income tax provision 4,566 2,430 13,080 6,995 EBITDA 20,860 12,492 89,934 55,491 Share-based compensation expense 2,330 1,785 7,124 9,902 Realized loss on foreign currency remeasurement 1,896 57 4,471 757 Adjusted EBITDA 25,086$ 14,334$ 101,529$ 66,150$ Three Months Ended December 31, Year Ended December 31,

Q4 2017 Earnings Call Non - GAAP Reconciliations (continued ) (unaudited) (1) Total billings is reconciled using the blade - related deferred revenue amounts at the beginning and the end of the period as follows: (2 ) Represents the effect of the difference in the exchange rate used by our various foreign subsidiaries on the invoice date versus the exchange rate used at the period - end balance sheet date. 26 March 8, 2018 ($ in thousands) 2017 2016 2017 2016 Blade-related deferred revenue at beginning of period 87,294$ 61,949$ 69,568$ 65,520$ Non-blade related deferred revenue at beginning of period - - - - Total current and noncurrent deferred revenue at beginning of period 87,294$ 61,949$ 69,568$ 65,520$ Blade-related deferred revenue at end of period 81,048$ 69,568$ 81,048$ 69,568$ Non-blade related deferred revenue at end of period - - - - Total current and noncurrent deferred revenue at end of period 81,048$ 69,568$ 81,048$ 69,568$ Three Months Ended December 31, Year Ended December 31,

Q4 2017 Earnings Call Non - GAAP Reconciliations (continued) ( unaudited) Net cash (debt) is reconciled as follows: Free cash flow is reconciled as follows: 27 March 8, 2018 ($ in thousands) 2017 2016 2017 2016 Net cash provided by operating activities 31,140$ 25,865$ 82,663$ 53,841$ Less capital expenditures (9,516) (11,590) (44,828) (30,507) Free cash flow 21,624$ 14,275$ 37,835$ 23,334$ Year Ended December 31, Three Months Ended December 31, ($ in thousands) 2017 2016 Total debt, net of debt issuance costs 121,385$ 123,155$ Add debt issuance costs 2,171 2,290 Less cash and cash equivalents (148,113) (119,066) Net cash (debt) 24,557$ (6,379)$ December 31,
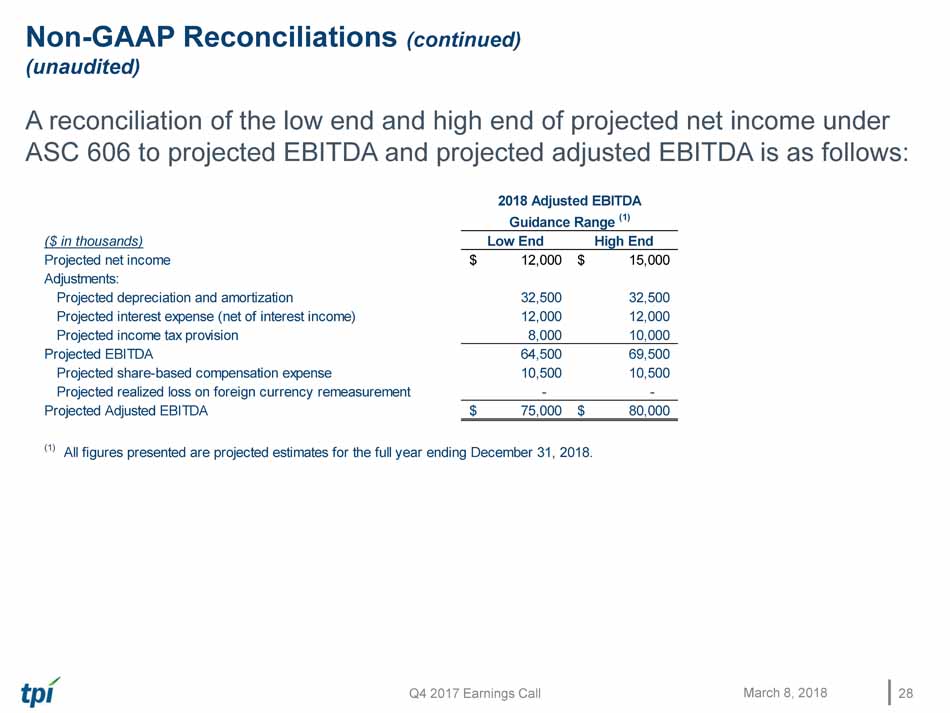
Q4 2017 Earnings Call Non - GAAP Reconciliations (continued ) (unaudited) A reconciliation of the low end and high end of projected net income under ASC 606 to projected EBITDA and projected adjusted EBITDA is as follows: 28 March 8, 2018 ($ in thousands) Low End High End Projected net income 12,000$ 15,000$ Adjustments: Projected depreciation and amortization 32,500 32,500 Projected interest expense (net of interest income) 12,000 12,000 Projected income tax provision 8,000 10,000 Projected EBITDA 64,500 69,500 Projected share-based compensation expense 10,500 10,500 Projected realized loss on foreign currency remeasurement - - Projected Adjusted EBITDA 75,000$ 80,000$ (1) All figures presented are projected estimates for the full year ending December 31, 2018. 2018 Adjusted EBITDA Guidance Range (1)

Exhibit 99.3
TPI to Collaborate with Navistar to Design and Build an All-Composite Class 8 Truck
SCOTTSDALE, Ariz., March 08, 2018 (GLOBE NEWSWIRE) -- TPI Composites, Inc., (TPI) (Nasdaq: TPIC), announced today that it has entered into an agreement with Navistar, Inc. to design and develop a Class 8 truck comprised of a composite tractor and frame rails. This collaborative development project is being entered into in connection with Navistar’s recent award under the U.S. Department of Energy’s Super Truck II investment program, which is designed to promote fuel efficiency in commercial vehicles.
“We are excited about the opportunity to design, develop and validate the use of composite materials and technologies in commercial vehicles in a cost effective and high volume manufacturing environment,” said Steve Lockard, President and CEO of TPI.
With 80% of all goods in the United States transported by Class 8 trucks, there is a significant opportunity to improve the freight efficiency of trucks. Incorporating composite materials into a Class 8 truck structure offers multiple performance advantages compared to traditional metals in terms of weight savings, reduced part count, and non-corrosion properties. TPI and Navistar are targeting 30% plus reduction in the weight of a Class 8 truck by replacing traditional metals with composite materials to enhance the freight efficiency.
About TPI Composites, Inc.
TPI Composites, Inc. is an innovation leader for composite structures in the transportation market utilizing advanced composite technology and manufacturing expertise. TPI Composites, Inc. is the only independent manufacturer of composite wind blades for the wind energy market with a global footprint. TPI delivers high-quality, cost-effective composite solutions through long term relationships with leading wind turbine manufacturers. TPI is headquartered in Scottsdale, Arizona and operates factories throughout the U.S., China, Mexico, and Turkey.
Investor Contact:
[email protected]
480-315-8742
About Navistar
Navistar International Corporation (NYSE:NAV) is a holding company whose subsidiaries and affiliates produce International® brand commercial and military trucks, proprietary diesel engines, and IC Bus® brand school and commercial buses. An affiliate also provides truck and diesel engine service parts. Another affiliate offers financing services. Additional information is available at www.Navistar.com. For further information: Media contact: Lyndi McMillan, [email protected], 331-332-3181; Investor contact: Marty Ketelaar, [email protected], 331-332-2706; Web site: http://www.icbus.com