
Form 10-K Unique Fabricating, Inc. For: Dec 31
UNITED STATES
SECURITIES AND EXCHANGE COMMISSION
WASHINGTON, D.C. 20549
FORM 10-K
x | ANNUAL REPORT PURSUANT TO SECTION 13 OR 15(d) OF THE SECURITIES EXCHANGE ACT OF 1934 |
For the fiscal year ended December 31, 2017
o | TRANSITION REPORT PURSUANT TO SECTION 13 OR 15(d) OF THE SECURITIES EXCHANGE ACT OF 1934 |
For the transition period from to .
Commission file number: 001-37480
UNIQUE FABRICATING, INC.
(Exact name of registrant as specified in its Charter)
Delaware | 001-37480 | 46-1846791 | ||
(State or other jurisdiction of incorporation or organization) | (Commission File Number) | (IRS Employer Identification No.) | ||
Unique Fabricating, Inc.
800 Standard Parkway
Auburn Hills, MI 48326
(248)-853-2333
(Address including zip code, and telephone number, including area code, of registrant’s principal executive offices)
Indicate by check mark if the registrant is a well-known seasoned issuer, as defined in Rule 405 of the Securities Act. Yes o No x
Indicate by check mark if the registrant is not required to file reports pursuant to Section 13 or Section 15(d) of the Securities Act. Yes o No x
Indicate by check mark whether the registrant (1) has filed all reports required to be filed by Section 13 or 15(d) of the Securities Exchange Act of 1934 during the preceding 12 months (or for such shorter period that the registrant was required to file such reports; and (2) has been subject to such filing requirements for the past 90 days. Yes x No o
Indicate by check mark whether the registrant has submitted electronically and posted on its corporate Web site, if any, every Interactive Data File required to be submitted and posted pursuant to rule 405 of Regulation S-T during the preceding 12 months (or for such shorter period that the registrant was required to submit and post such files). Yes x No o
Indicate by check mark if disclosure of delinquent filers pursuant to Item 405 of Regulation S-K is not contained herein, and will not be contained, to the best of registrant's knowledge, in definitive proxy or information statements incorporated by reference in Part III of this Form 10-K or any amendment to this Form 10-K x
Indicate by check mark whether the registrant is a large accelerated filer, an accelerated filer, a non-accelerated filer, or a smaller reporting company. See the definitions of “large accelerated filer,” “accelerated filer” and “smaller reporting company” in Rule 12b-2 of the Exchange Act. (Check one):
Large accelerated filer o | Accelerated filer x | |
Non-accelerated filer o (Do not check if a smaller reporting company) | Smaller reporting company o | |
Emerging growth company x | ||
If an emerging growth company, indicate by check mark if the registrant has elected not to use the extended transition period for complying with any new or revised financial accounting standards provided pursuant to Section 13(a) of the Exchange Act. x
Indicate by check mark whether the registrant is a shell company (as defined in Rule 12b-2 of the Exchange Act). Yes o No x
As of March 2, 2018 the registrant had 9,766,563 shares of common stock outstanding.
As of July 2, 2017 the last business day of the registrant's most recently completed second fiscal quarter, the aggregate market value of the voting stock held by non-affiliates of the registrant was approximately $64.1 million.
DOCUMENTS INCORPORATED BY REFERENCE
Portions of the registrant’s definitive Proxy Statement related to the 2017 Annual Shareholders Meeting to be filed subsequently are incorporated by reference into Part III of this Form 10-K.
TABLE OF CONTENTS
Part I | Page |
Part II | |
Part III | |
Part IV | |
i
PART I
SPECIAL NOTE REGARDING FORWARD-LOOKING STATEMENTS
This Annual Report on Form 10-K, including the exhibits being filed or incorporated by reference as part of this report, as well as other statements made by Unique Fabricating, Inc. (“Unique,” the “Company,” “we,” “us,” and “our”), contains “forward-looking statements” within the meaning of the Private Securities Litigation Reform Act of 1995 that are subject to risks and uncertainties. These forward-looking statements are contained principally in, but not limited to, the sections entitled “Business,” “Risk Factors,” and “Management's Discussion and Analysis of Financial Condition and Results of Operations.” These statements are based on management's beliefs and assumptions and on information currently available to us. These statements relate to future events or to our future financial performance and involve known and unknown risks, uncertainties, and other factors that may cause our or our industry's actual results, levels of activity, performance or achievements to be materially different from any future results, levels of activity, performance or achievements expressed or implied by these statements. When used in this document the words “anticipate,” “believe,” “continue,” “could,” “seek,” “might,” “estimate,” “expect,” “intend,” “may,” “plan,” “potential,” “predict,” “approximately,” “project,” “should,” “will,” “would,” or the negative or plural of these words or similar expressions, as they relate to our company, business and management, are intended to identify forward-looking statements. In light of these risks and uncertainties, the future events and circumstances discussed may not occur, and actual results could differ materially from those anticipated or implied in the forward-looking statements.
Forward-looking statements speak only as of the date of this Annual Report on Form 10-K filing. Except as required by law, we assume no obligation to publicly update or revise any forward-looking statement to reflect actual results, changes in assumptions based on new information, future events or otherwise. If we update one or more forward-looking statements, no inference should be drawn that we will make additional updates with respect to those or other forward-looking statements.
ITEM 1. BUSINESS
Overview
Unique is engaged in the engineering and manufacture of multi-material foam, rubber, and plastic components utilized in noise, vibration and harshness, acoustical management, water and air sealing, decorative and other functional applications. Unique has combined a history of organic growth with recent strategic acquisitions to diversify both its product capabilities and the markets it serves.
Unique’s markets served are the North America automotive and heavy duty truck markets, as well as the appliance, water heater and HVAC markets. Sales are conducted directly to major automotive and heavy duty truck, appliance, water heater and HVAC manufacturers, referred throughout this Annual Report on Form 10-K as OEMs, or indirectly through the Tier 1 suppliers of these OEMs. The Company has its principal executive offices in Auburn Hills, Michigan and has sales, engineering and production facilities in Auburn Hills, Michigan, Concord, Michigan, LaFayette, Georgia, Louisville, Kentucky, Evansville, Indiana, Ft. Smith, Arkansas, Bryan, Ohio, Port Huron, Michigan, Monterrey, Mexico, Queretaro, Mexico and London, Ontario. The Company also has an independent client sales representative who maintains offices in Baldham, Germany. Subsequent to the 2017 fiscal year-end we announced we will be closing the Ft. Smith and Port Huron facilities in 2018. Please refer to Note 8 for further information.
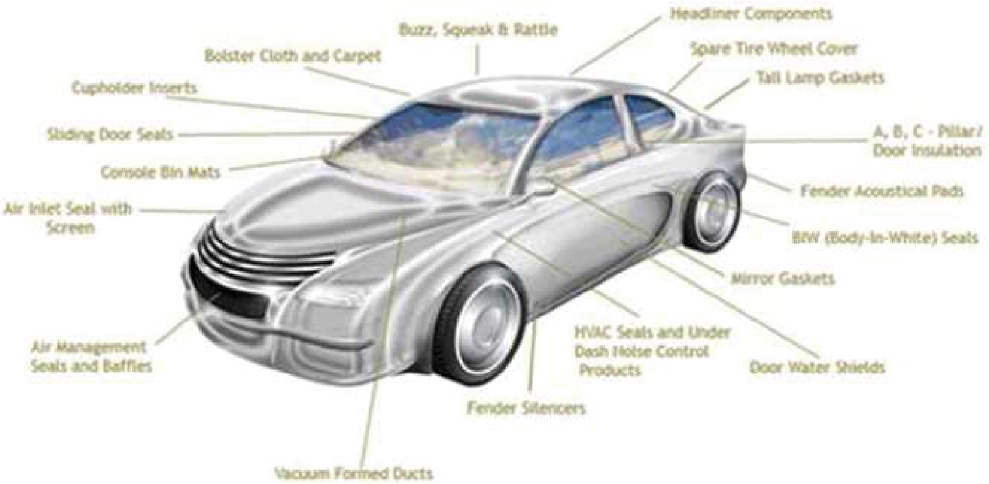
Unique derives the majority of its net sales from the sales of foam, rubber plastic, and tape adhesive related automotive products. These products are produced by a variety of manufacturing processes including die cutting, compression molding, thermoforming, reaction injection molding, and fusion molding. We believe Unique has a broader array of processes and materials utilized than any of its direct competitors, based on our product offerings. By sealing out air, noise and water intrusion, and by providing sound absorption and blocking, Unique’s products improve the interior comfort of a vehicle, increasing perceived vehicle quality and the overall experience of its passengers. Unique’s products perform similar functions for appliances, water heaters and HVAC systems, improving thermal characteristics, reducing noise and prolonging equipment life.
One of Unique’s primary strengths lies in its ability to manage thousands of active part numbers while maintaining a stellar track record of less than six rejected parts per million and over 99.0% on-time delivery for more than three million parts manufactured and shipped on a daily basis. Furthermore, Unique focuses resources on the areas of its business that add value to customers, particularly in its commercial, engineering and supply chain activities. Design innovation and rapid prototyping set Unique apart from the majority of its competitors.
1
Our principal executive offices are currently located at 800 Standard Parkway, Auburn Hills, Michigan, 48326. UFI Acquisition, Inc, a Delaware Corporation (“UFI”), was formed in January 2013 to acquire 100% of the outstanding equity of Unique Fabricating, Inc., and its wholly-owned subsidiaries, Unique Fabricating South, Inc. and Unique Fabricating de Mexico, S.A. de C.V. (collectively, such subsidiaries and other subsidiaries referenced in this Annual Report on Form 10-K, the “Company” or “Unique”). In September 2014, UFI Acquisition, Inc. changed its name to Unique Fabricating, Inc. (“UFI”) which is now the parent company of the group. As a result of the name change, the subsidiary previously named Unique Fabricating, Inc. became Unique Fabricating NA, Inc.
Since 2013, the Company has completed four acquisitions. In December 2013, through a newly formed subsidiary, Unique-Prescotech, Inc., the Company acquired substantially all of the assets of Prescotech Holdings, Inc. (“PTI”). In February 2014, through a newly formed subsidiary, Unique-Chardan, Inc., the Company acquired substantially all of the assets of Chardan Corp. (“Chardan”). In August 2015, the Company acquired substantially all of the assets of Great Lakes Foam Technologies, Inc. (“Great Lakes”) through a newly created subsidiary, Unique Molded Foam Technologies, Inc. In April 2016, Unique-Intasco Canada, Inc., a newly formed subsidiary of the Company, acquired substantially of all of the assets of Intasco Corporation. On the same date, Unique Fabricating NA, Inc., purchased 100% of the outstanding capital stock of Intasco USA, Inc. (together the two entities purchased are referred to as “Intasco”)
Initial Public Offering (the “IPO”)
On July 7, 2015, we completed our IPO of 2,702,500 shares of common stock at a price to the public of $9.50 per share, including 352,500 shares subject to an over-allotment option granted to the underwriters. After underwriting discounts, commissions, and approximate fees and expenses of the offering, we received net IPO proceeds of approximately $22.2 million. We used part of these proceeds to repay the $13.1 million principal amount of our 16% senior subordinated note together with accrued interest through the date of payment. We used the remaining proceeds to temporarily reduce borrowings under the revolver portion of our then senior secured credit facility. Amounts paid under the facility remained available to be re-borrowed, subject to compliance with the terms of the facility. We also issued to the underwriters warrants to purchase up to 141,000 shares of common stock, as additional compensation in the IPO. The warrants are exercisable at a per share exercise price equal to 125% of the inital public offering price of $9.50 per share, and may be exercised until the date five years from the date of the IPO.
Automotive Industry Analysis and Industry Trends
The automotive parts industry provides components, systems, subsystems and modules to OEMs for the manufacture of new vehicles, and had approximately $250 billion of North American annual revenue in 2016 according to a January 2017 Dun & Bradstreet report on the automotive supplier market. Within the automotive parts industry, North America is the Company’s core market. We manufacture multi-material foam, rubber, plastic components, and tape adhesive related products utilized in noise, vibration and harshness management, acoustical management, water and air sealing, decorative and other functional applications.
Demand for automotive parts in the OEM market is generally a function of the number of new vehicles produced, which is primarily driven by macro-economic factors such as credit availability, interest rates, fuel prices, consumer confidence, employment and other trends. Although OEM demand is tied to actual vehicle production, participants in the automotive parts industry also have the opportunity to grow through increasing product content per vehicle by further penetrating business with existing customers and in existing markets, gaining new customers and increasing their presence in global markets. We believe that as a company with a North American presence and advanced technology, engineering, manufacturing and customer support capabilities, we are well-positioned to take advantage of these opportunities.
Overall, we expect modest long-term growth of vehicle sales and production in the OEM market. The automobile industry in general in recent years has seen increased customer sales and production schedules with production volumes in the last few years higher than OEM production volumes prior to the industry disruptions experienced after the financial market crisis of 2008. According to IHS Automotive, North American vehicle production decreased during 2017 to 17.2 million units, a decrease of approximately 4.0% from vehicle production during 2016. However, IHS projects growth in North American unit production volumes in 2018, an approximate 1.4% increase from unit production volumes in 2017, and growth to 17.7 million units in 2022, as depicted in the following chart.
2
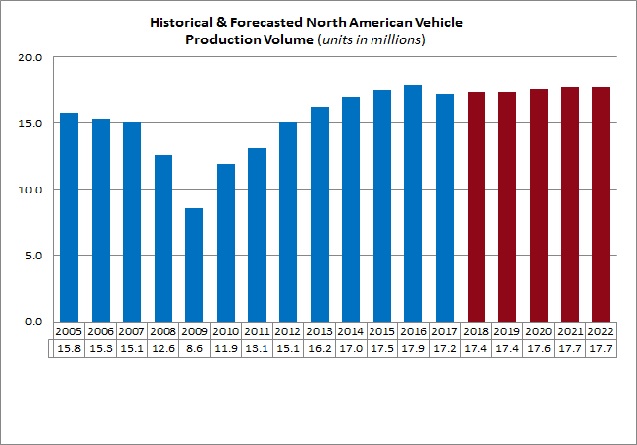
Source: IHS Automotive (December 2017)
In addition to the overall industry growth, we believe there are a variety of trends that are influencing the future of the global automotive market. We believe we are positively positioned to benefit from an increasing number of trends driven by market forces such as:
• | Fuel efficiency/vehicle light-weighting: Expanding government mandates on fuel efficiency and emission reductions, will continue to force the automotive industry to focus on improving the fuel economy of vehicles. In addition, the evolution of materials utilized in vehicles is moving away from conventional steel as the primary material, which comprised approximately 65% of vehicles content in 2010, and is expected to decrease by 10 – 20%, in the aggregate by 2025, according to industry sources. Conventional steel is expected to be increasingly replaced by lighter weight materials with increasing use of plastics and foam materials per vehicle. |
• | Interior comfort: Comfort of interiors consistently rank in the top three factors that consumers consider when purchasing a new vehicle, and is a key area where vehicle manufactures can differentiate their vehicles. The comfort of the interior is an area of increased focus for the OEM manufacturers with each new generation of vehicles. This is expected to continue to increase the use of foam in seats and acoustical insulation in more and more vehicles. |
• | Telematics and Infotainment: The increasing use of telematics and infotainment requires increasingly quieter vehicles for the telematics systems to recognize voice commands and passengers to enjoy the infotainment options. Over the next three years, approximately 80% of all new vehicles are expected to include voice recognition systems, increasing the need for quiet interiors. We expect that the result will be increased use of acoustic insulation materials, more precise air seals and other noise, vibration and harshness products in all vehicles. |
• | Rapid pace of new vehicle launches: In order to meet consumers’ increasing demand for new products, the automotive market will see a significant number of new program launches from vehicle manufacturers over the next few years. Each new vehicle launch creates new product opportunities for us because of the OEMs need for noise, vibration and harshness solutions as OEMs discover unplanned noise issues at the launch of production for a new vehicle program. |
• | Localization of production: Due to freight costs, currency fluctuations, logistic issues and protection of supply, many foreign vehicle manufacturers have increased their production volumes in North America and are increasing local sourcing of vehicle components. We believe that Unique’s production facilities situated in geographic proximity to the majority of North American vehicle assembly locations provide a competitive advantage. |
We believe these market trends create opportunities for us to achieve above market growth rates as a result of increased content per vehicle, higher industry production volumes, geographic shifts in vehicle production, and evolving customer sourcing strategies. Our challenge is to continue developing leading edge solutions focused on addressing these trends, and applying those solutions via products with sustainable margins that enable our customers to produce distinctive market-leading products.
3
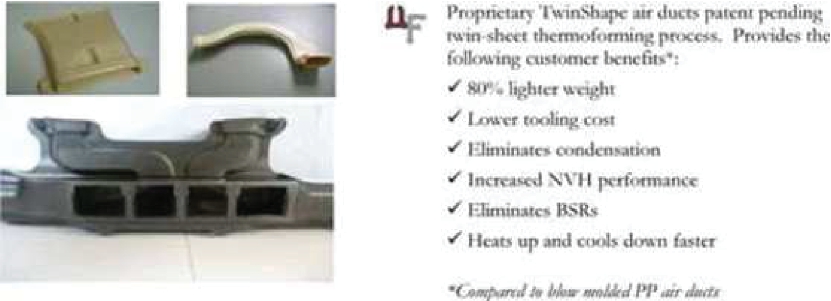
As an example of our innovative technical capabilities, we utilized our thermoforming process to develop and produce a line of lightweight flexible air duct systems for a leading OEM, providing an 80% weight reduction and enhanced functionality. This air duct system has developed into Unique’s patent pending TwinShape line of proprietary ducts. Unique has been awarded four additional production orders for the TwinShape line of ducts, adding three additional OEM customers since launching the product, and have secured development and prototyping contracts with four additional OEMs in the last few years for potential inclusion of this product in vehicle programs starting with model years 2019 and 2020 vehicles.
We generate a significant number of new sales opportunities from customer challenges, such as buzz, squeak, rattle (“BSR”) or noise, vibration and harshness (“NVH”) issues, discovered during the launch of production for a new vehicle program. In many of these situations, we develop and begin supplying a solution within days, a level of responsiveness that avoids competitive requests for quotations and produces premium value for our customers. Given the projected rapid pace of new vehicle launches over the next three years, we believe that we will benefit from an increasing number of opportunities sourced late in the launch cycle.
Appliance, HVAC, and Water Heater Industries
We are a leading provider of fabricated, non-metallic components to a diverse group of OEMs and tiered suppliers in the appliance, HVAC, and water heater industries. These sales represented approximately 12.2% of our net sales for the year ended December 31, 2017. These components are primarily manufactured from foam, adhesives, fiberglass, rubber and board-back material. We have extensive materials, engineering and fabrication expertise and deliver custom-designed, innovative solutions for our customers. Our component solutions primarily consist of products used in gasketing, heat deflection, packaging, insulation, water seals, noise reduction and vibration control. Demand for these end-market products is largely driven by the health of the housing sector. According to the U.S. Census bureau, there were 1.2 million new housing starts in 2017 and the National Association of Home Builders forecasts that there will be approximately another 1.2 million new housing starts in 2018. We believe that the appliance, HVAC, and water heater industries are currently primed for moderately favorable growth.
The United States major household appliance industry, which includes water heaters, is forecast to show modest growth during 2018, as new and existing home sales, as well as home improvement spending, both of which have a direct impact on appliance industry sales, continue to show positive outlooks. According to an independent source published in August 2017, forecasted revenue for this industry in the United States is expected to grow at an annual growth rate of 1.1% from 2017 to 2022 to reach approximately $20.0 billion in revenue in 2022. The United States HVAC industry is also poised to benefit from the positive outlook in the housing and home improvement markets. According to an independent source published in May 2017, forecasted revenue for this industry is expected to grow at an annual growth rate of 1.8% from 2017 to 2022 to reach approximately $50.4 billion in revenue in 2022. We believe these benefits will increase the demand for our products from existing clients including GE,Whirlpool, AO Smith, Rheem and Trane.
Our Objectives
Our goals are to provide exceptional quality, reliable on-time delivery, competitive cost, and technical innovation with rapid engineering support. The objective is for Unique to be the easiest source for our customers to do business with, while being a great place to work for our team members. We seek to execute a business model that generates sustainable ongoing adjusted free cash flow, thereby providing flexibility for capital allocation. We also strive to achieve growth at above industry levels through strong competitive capabilities in engineering, manufacturing, and program management that contribute to leading positions in cost and quality. In addition, the Company will selectively continue to pursue opportunistic acquisitions that provide additional products and processes, as well as entrance into new growth markets.
We work together with our customers in various stages of production, including initial concept and development, routine engineering problem resolution during their product launches and ongoing value engineering. In addition, we work together with our customers on component sourcing, quality assurance, manufacturing and delivery in order to develop long-standing business relationships. We believe we are well-positioned to meet customer needs and have a strong, established reputation with customers for providing high-quality products at competitive prices, as well as for timely delivery and customer service. Given that both the automotive OEM business and the appliance/water heater OEM business involve long-term business awarded on a platform-by-platform basis, our intent is to leverage our strong technical expertise and customer relationships to obtain new platform awards.
4
Our Strengths
Our mission is to deliver innovative and timely customer solutions for NVH management, water and air sealing and other functional and decorative applications. We employ our extensive knowledge of raw materials and adhesives, our engineering and creative resources and our rapid response capabilities to deliver rapid technical innovation, exceptional quality, reliable on-time delivery and competitive costs. We believe the key to our core competitive strengths are as follows:
Strong technical expertise. We have tremendous depth of expertise and knowledge of materials, adhesives, manufacturing processes and the product applications of our customers. Our understanding of our customers’ design and performance needs, and how our products interface with their applications allows us to engineer effective product solutions. We believe that our engineering talent, test facilities and rapid prototyping capabilities distinguish us from our competitors and enable us to rapidly innovate and develop products that resolve customers’ problems, often within 24 to 48 hours. By understanding our customers’ products and processes, when we are confronted with a customer engineering challenge, we can conceptualize a design concept that allows us to capitalize on the optimum combination of materials to solve a given problem. We have the ability to create our own prototype tools in-house so that we can go directly from concept to hardware and quickly present tangible product solutions for our customers to evaluate. Our ability to rapidly address customer challenges and provide prototype parts that include the use of new materials, products or processes is one of our key competitive strengths.
Operational Excellence. We are dedicated to maintaining a culture of continuous improvement. We utilize lean manufacturing techniques and statistical methods to drive productivity and quality improvement. We use quality, delivery and speed-to-market as competitive advantages. Lean manufacturing not only improves overall costs and quality, it also improves product velocity through the manufacturing process. This leads to better response time and greater flexibility in scheduling. Our reputation for high quality, innovative products is attributable to a constant emphasis on engineering, including materials engineering, product and process engineering, and sales engineering, coupled with our dedication to lean manufacturing to ensure effective execution.
Depth of customer relationships. We have developed long-term relationships with a customer base that we target deliberately. Each of our customers has substantial requirements for NVH management, water and air sealing, functional and decorative components. Due to our technical sophistication, raw material and adhesive innovation and rapid responsiveness, we have a reputation with our key customers as the supplier of choice for our core products within the North American automotive and appliance markets. Our sales engineers have developed deep relationships with the technical teams of our key customers. The customers’ engineers leverage our materials knowledge and utilize us as a resource to help them solve problems and/or pursue product enhancements. This enables us to become involved early in the design/development stage of new vehicles or appliances, leading to opportunities to introduce new products. In certain situations, we are able to influence the customer design specifications from which new business is awarded.
Key relationships with suppliers. We have long relationships with over 150 raw material and adhesive suppliers. We track new developments in materials, and pursue exclusive relationships with those suppliers that develop innovative raw materials and adhesives. Our key suppliers see us as a way to introduce their new products and technology to the marketplace and obtain the necessary customer approvals. This, in turn, can lead to Unique being first to market with certain products or materials. For example, this has led to us having exclusive access for our types of products to the only source of recycled polyol for polyurethane in the industry. While products incorporating these materials accounted for less than 1% of net sales for the year ended December 31, 2017, we believe these recycled materials are opening up opportunities for new product variations that other competitors cannot offer. We constantly collaborate with our suppliers to develop new materials and adhesive combinations that exhibit a cost, quality and/or performance enhancement for our customers.
Proximity to key customers. Our manufacturing facilities are strategically located to serve the North American automotive and appliance industries. Our primary manufacturing centers are in the Midwestern and Southeastern regions of the United States, Mexico, and Canada. We believe that our manufacturing facilities are within approximately 500 miles of over 80.0% of North American vehicle production, and even closer to major appliance manufacturing locations. This is advantageous, because our products are light in weight, and transportation costs can be a significant portion of the delivered cost of products.
Our Strategy
Our business strategy is to be a valued partner in our customers’ product development and production processes by producing exceptional quality and providing reliable on-time delivery, competitive costs, and technical innovation with rapid engineering support. We utilize our extensive knowledge of raw materials and adhesives combined with our engineering development and rapid responsiveness to deliver innovative and timely customer solutions for NVH management, water and air sealing, decorative and other functional applications.
5
We attempt to align our internal human resources and technical capabilities to take advantage of industry mega trends, such as light weighting, telematics, and reduced energy consumption, which we believe have contributed to profitable revenue growth opportunities from our existing operations. In addition, our growth plan includes initiatives to develop certain new products and new markets which provide incremental growth opportunities. We believe that significant opportunities exist to continue to grow our business and increase profitability by focusing on the following:
Further Penetrate Existing Markets with Existing Products and Processes. We believe we are positioned to gain share and grow in existing markets with our current products and processes, capitalizing on the industry’s increasing demand for NVH management content coupled with our capabilities, including exclusive proprietary materials sold to existing customers and targeted new customers. As OEM vehicles change materials to reduce weight, vehicles are utilizing more rubber and plastic components like those designed and supplied by Unique. In addition, the increasing use of telematics is driving a need for quieter interiors in vehicles at all levels. This is causing an increase in the amount of acoustical insulation and solutions per vehicle. Separately, the rate of increase in vehicle production is projected to be significantly higher in the Southern United States and Mexico than elsewhere in North America over the next few years. We hope to capitalize on our ability to service customers in different geographical locations through our manufacturing facilities in the Midwestern and Southeastern regions of the United States, Mexico and Canada.
Develop New Products and Processes for Existing Markets. We have developed and earned the reputation as a problem solver to our current customers. As a result, we are in the position to develop complementary products and processes that can be sold to the same purchasing and engineering groups that already do business with us. By adding products and processes to our portfolio that broaden our scope with existing engineers and purchasing groups, we can offer one stop shopping, that allows them to reduce their supply base and complexity, while increasing sales opportunities for Unique. We work closely with raw material and adhesive suppliers to develop innovative solutions that offer cost and performance improvement. We constantly focus on finding new applications for molded products utilizing thermoforming, compression and fusion molding. These activities frequently lead to the development of new or novel products not yet in common use. When this occurs, we actively explore the patentability of the product. Protection of our intellectual property is a conscious part of our strategy of using technology and innovation as a competitive advantage. An example of this is our patent pending for light weight TwinShape duct technology.
Create New Markets with Existing Products and Processes. While the specific products may vary, we have identified numerous opportunities to sell products fabricated using die cut and molding technology into new markets such as medical and industrial markets that we do not currently serve. We have demonstrated the ability to develop cost effective products utilizing various materials. Our recent acquisitions have provided the Company with credible access to a variety of new markets for our products. Because of our strategic acquisitions, we are currently developing new products for the appliance, water heater and HVAC industries utilizing our various molding technologies. We are also exploring increased opportunities for medical products. Raw material and adhesive suppliers rely on us to provide marketplace insight into new or emerging customer challenges. We have the capability to combine new materials with new processes to create cost effective products in new markets.
Pursue Acquisitions. We expect to selectively pursue acquisitions that add new products and/or processes or geographic and market expansion to further expand our portfolio of customer solutions. Since December 2013, management has completed four accretive add-on acquisitions that added new markets, products, and additional manufacturing processes to our capabilities. Management has a long history of identifying and successfully integrating new platforms. We will continue to use our relationship with Taglich Private Equity, LLC, which sponsored our formation, to identify evaluate and execute acquisition opportunities.
Products
Unique’s primary products, which are identified by manufacturing process — die cut products, thermoformed/compression molded products, fusion molded products, and reaction injection molding (RIM) — are highlighted below:
6
Automotive Product Applications
Unique’s rapid responsiveness and extensive product and process capabilities are valued by its customers. We believe Unique’s diverse product offerings, derived from a broad base of raw materials utilizing multiple manufacturing technologies, is the most comprehensive of similar companies operating in this industry. Based on our knowledge of our competitors, we believe that the companies we compete with offer fewer material choices and/or possess fewer manufacturing process alternatives than Unique. Unique’s access to broad production capabilities enables it to work with over 1,000 raw materials to develop the optimum solution for a given application. Unique’s broad product offerings results in it being a single-source supplier to many customers, which creates a competitive advantage.
Die Cut Products
Unique is primarily a supplier of die cut non-metallic materials and components. Historically, this has been the Company’s core business, within all of its markets, developed through its technical expertise, broad customer base, strategic manufacturing footprint, diverse material selection and strong quality and delivery performance. Unique leverages its market position in die cutting by offering more highly engineered, higher value products and processes such as thermoforming, compression molding, fusion molding and RIM molded polyurethane.
Die cut products are utilized in applications such as air and water sealing, insulation, NVH performance and BSR conditions. Unique is a market leader in this product area. The following diagram highlights examples of its die cut products:
Examples of Die Cut Products
Product: | HVAC Seal | Trim Insulation | Headliner Insulation | Fender Acoustical Pad | ||||
Purpose: | Air & Water Sealing | NVH | NVH | NVH | ||||
Material: | PUR Foam | PUR Foam | Non-Woven PP | Thinsulate Fiber | ||||
7
Product: | A/B/C Pillar Cover | Dashboard Seal | Cup Holder Base | Under Hood Insulation | ||||
Purpose: | Decorative (Class A) | NVH | Decorative | NVH | ||||
Material: | Laminated Vinyl | EPDM | Santoprene TPE | Vinyl Nitrile | ||||
Thermoformed/Compression Molded Products
Unique's product offerings include thermoformed and compression molded products. Unique has leveraged its position as a manufacturer of core die cut products to gain traction with customers who wanted a single-source solution for other related products, such as thermoformed, compression molded and fusion molded components. The Company has recently added RIM polyuerethane components to its portfolio.
Management seeks to continue the development of molded products that are complementary to the Company’s die cut products. These products have a higher engineering content and provide increased sales and potential margin growth. These products also differentiate Unique, which we believe will make us more valuable to our target customers. The Company’s development efforts in this area have led to innovative product solutions such as Unique’s existing patent pending thermoformed HVAC duct modules, and Unique’s proprietary TwinShape duct line. The TwinShape line is currently in production at three vehicle OEMs, has been selected by an additional OEM, for a model year 2019 vehicle, and is being evaluated in development programs for four other OEMs.
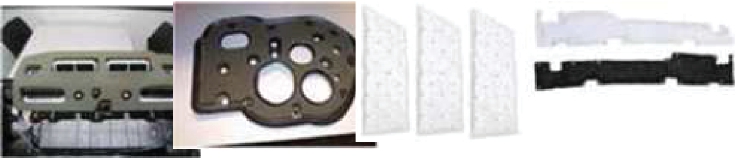
Unique’s thermoformed and compression molded products include HVAC air ducts, door watershields, evaporator liners, console bin mats and fender insulators, among others. Unique believes there is significant room to grow within each of its thermoformed and compression molded product areas. The following diagram highlights examples of Unique’s thermoformed and compression molded products:
Examples of our Thermoformed/Compression Molded Products
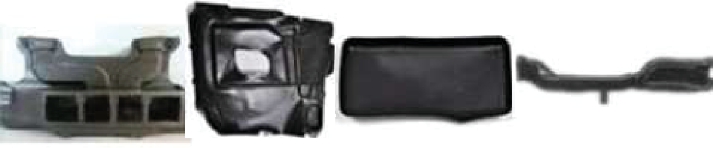
Product: | HVAC Duct Module | Door Watershield | Console Bin Mat | Air Duct | ||||
Purpose: | Functional | Air & Water Sealing | Decorative | Functional | ||||
Material: | Cross Linked PP | Cross Linked PP/PE | PVC | Cross Linked PP | ||||
8
The following highlights Unique’s TwinShape line of innovative twin-sheet thermoformed air duct technology:
TwinShape Twin-Sheet Thermoformed Air Duct Technology
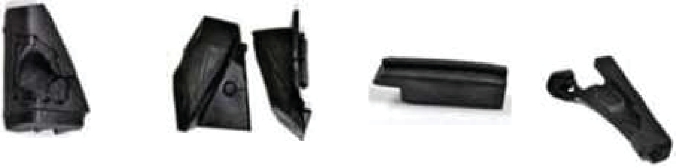
Fusion Molded Products
In February 2014, Unique purchased Chardan, bringing fusion molding capability in-house. Fusion molding is an innovative foam molding process used to manufacture precise three dimensional components that are lightweight and provide excellent thermal and acoustic performance. Primarily used for NVH management and body sealing applications, the fusion molded products are complementary to Unique’s other product lines and give Unique additional options to provide light-weighting and NVH management solutions to its customers.
In Europe, the market for fusion molded products is fairly developed; BMW, Mercedes and VW have integrated the technology in their vehicles for several years. The North American market for fusion molding is growing rapidly as European OEMs source more fusion molded products in their North American vehicles and the technology gains traction with domestic OEMs including Fiat Chrysler Automobiles ("FCA") and General Motors. In addition, since there are a very limited number of North American suppliers with the engineering and manufacturing capabilities to produce fusion molded components, Unique is well positioned to capitalize on the anticipated growth in the North American market.
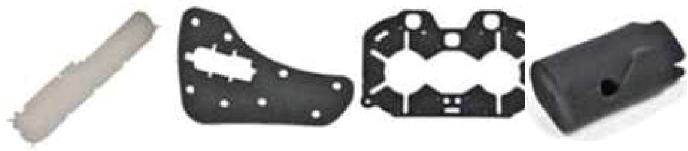
Unique’s fusion molded products include exterior mirror seals, cowl-to-hood seals, cowl-to-fender seals, and other NVH management and sealing applications like fillers, spacers and gaskets. The following diagram highlights examples of Unique’s fusion molded products:
Examples of our fusion molded products
Product: | Interior Mirror Seal | Body-In-White Seal | Cowl to Hood Seal | Cowl to Fender Seal | ||||
Purpose: | NVH | NVH | NVH | NVH | ||||
Material: | Cross Linked PE | Cross Linked PE | Cross Linked PE | Cross Linked PE | ||||
9
The following highlights the Unique’s fusion molding technology:
Fusion Molding Technology
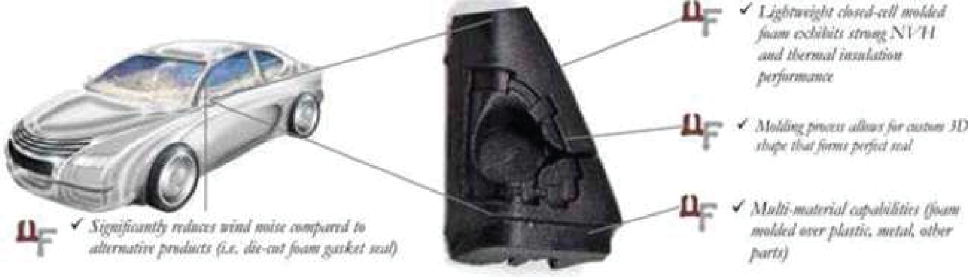
Interior Mirror Seal
Significant Customers
The Company’s customers are principally engaged in the North American automotive industry (approximately 83.3% of our net sales for the year ended December 31, 2017), as well as in the manufacturing of durable residential housing and some commercial products as a result of our acquisition of PTI (approximately 12.2% of our net sales for the year ended December 31, 2017). In the automotive market, the Company’s sales are primarily directly to Tier 1 suppliers to the OEMs. Approximately 16.4% of our net sales for the year ended December 31, 2017 were made directly to vehicle OEMs. Sales of Company products, directly and indirectly through Tier I suppliers, to General Motors, FCA and Ford Motor Company represented approximately 14%, 13% and 11%, respectively, of our net sales for the year ended December 31, 2017. However, no single customer accounted for more than 10% of our net direct sales for the year ended December 31, 2017 and January 1, 2017, respectively. Please refer to Note 1 for further disclosure on net sales made directly to vehicle OEMs in prior years as well as net sales for our foreign operations located in Mexico and Canada for 2017 and prior years.
Competitive Environment
We believe that customer sourcing decisions are based on the responsiveness of a supplier and its ability to deliver innovative solutions, quality products and competitive pricing. In order to be awarded opportunities, Unique strives to develop mutually beneficial relationships with its customers through technical support and consistent/predictable performance. Unique differentiates itself through innovation in materials, rapid responsiveness and broad manufacturing capabilities.
Unique estimates the auto market for its core business of multi-material foam, rubber and plastic components utilized in NVH management, air and water sealing, functional and decorative applications to be approximately $700 million in North America. This is based on management estimates that the average light vehicle utilizes approximately $40.00 of Unique related components, based on typical product usage. Unique estimates the appliance, water heater, and HVAC industry for its core products and business to be around $1 billion in North America. Unique believes that there is not any dominant supplier within its core markets in auto and appliance, water heater, and HVAC, although Unique believes that it is the largest supplier, measured by net sales, within the market. There are significant barriers to entry into such markets, including the complexities of managing production and ordering raw materials at the scale necessary and the difficulty, cost and length of time required to obtain acceptance by customers.
Liability and Insurance
We have liability and other insurance coverage which we believe is sufficient to cover our risks.
10
Employees
As of December 31, 2017, we had 1,023 full-time and 107 contract workers. In the Auburn Hills, Michigan facility, 157 of the hourly workers are represented by a labor union and are covered by a collective bargaining agreement which is effective through August 2019. In the Louisville, Kentucky facility, 28 hourly workers are represented by a labor union and are covered by a collective bargaining agreement which is effective through February 1, 2020. We have never experienced a material work stoppage or disruption to our business relating to employee matters. We believe that our relationship with our employees is good.
11
ITEM 1A. RISK FACTORS
Set forth below are certain risks and uncertainties that could adversely affect our results of operations or financial condition and cause our actual results to differ materially from those expressed in forward-looking statements made by the Company. Also refer to the Special Note Regarding Forward-Looking Statements in Item 1 of this Annual Report on Form 10-K.
RISKS RELATED TO OUR BUSINESS
We have substantial debt and if we were to default on paying our debt or fail to comply with the covenants, our lenders could take action that would likely cause our stockholders to lose their entire investment in us.
As of December 31, 2017, we had approximately $53.6 million of debt outstanding under our senior secured credit facility. Substantially all of our assets are pledged to the lenders to secure this outstanding debt. In the event that we are unable to make principal, interest or other payments due under or we do not comply with the covenants contained in the senior secured credit facility, the lenders could declare an event of default, accelerate all amounts outstanding and seek to foreclose on the collateral securing such indebtedness. In such event, we could be forced to file for bankruptcy protection and stockholders would likely lose their entire investment in us.
The agreement governing our senior secured credit facility contains financial covenants and other covenants that may restrict our current and future operations, particularly our ability to respond to changes in our business or to take certain actions. If we are unable to comply with these covenants, our business, results of operations and liquidity could be materially and adversely affected.
Our ability to comply with the covenants in the senior secured credit facility agreement may be affected by economic or business conditions beyond our control. If we are not able to comply with these covenants when required and we are unable to obtain necessary waivers or amendments from the lenders, we would be precluded from borrowing under the credit facility. If we are unable to borrow under the credit facility, we will need to meet our liquidity requirements using other sources. Alternative sources of liquidity may not be available on acceptable terms, if at all. In addition, if we do not comply with the financial or other covenants in the credit facility when required, the lenders could declare an event of default under the credit facility, and our indebtedness thereunder could be declared immediately due and payable. The lenders would also have the right in these circumstances to terminate any commitments they have to provide further borrowings. Any of these events would have a material adverse effect on our business, financial condition and liquidity.
In addition, the senior secured credit facility contains covenants that, among other things, restrict our ability to:
• | incur liens; |
• | incur or assume additional debt or guarantees; |
• | pay dividends, or make redemptions and repurchases, with respect to capital stock; |
• | make loans and investments; |
• | make capital expenditures; |
• | engage in mergers, acquisitions, asset sales, sale/leaseback transactions and transactions with affiliates; and |
• | change the business conducted by us or our subsidiaries. |
The operating and financial restrictions and covenants in this debt agreement and any future financing agreements may adversely affect our ability to finance future operations or capital needs or to engage in other business activities.
Our substantial amount of indebtedness may adversely affect our cash flow and our ability to operate our business, remain in compliance with debt covenants and make payments on our indebtedness.
Our substantial level of indebtedness increases the possibility that we may be unable to generate cash sufficient to pay, when due, the principal of, interest on or other amounts due with respect to our indebtedness. The level of our indebtedness could have other important consequences to you as a stockholder. For example, it could:
• | make it more difficult for us to satisfy our obligations with respect to our indebtedness and any failure to comply with the obligations under our credit facility, including financial and other restrictive covenants, could result in an event of default under the senior secured credit facility; |
12
• | make us more vulnerable to adverse changes in general economic, industry and competitive conditions and adverse changes in government regulation; |
• | require us to dedicate a substantial portion of our cash flow from operations to payments on our indebtedness, thereby reducing the availability of our cash flows to fund working capital, capital expenditures, acquisitions, pay dividends and other general corporate purposes; |
• | limit our flexibility in planning for, or reacting to, changes in our business and the industry in which we operate; |
• | place us at a competitive disadvantage compared to our competitors that have less debt; and |
• | limit our ability to borrow additional amounts for working capital, capital expenditures, acquisitions, debt service requirements, execution of our business strategy or other purposes. |
Any of the above listed factors could materially adversely affect our business, financial condition and results of operations.
The senior secured credit facility contains restrictive covenants that limit our ability to engage in activities that may be in our long-term best interests. Our failure to comply with those covenants could result in an event of default which, if not cured or waived, could result in the acceleration of our debt.
Our major customers may exert significant influence over us.
The vehicle component supply industry has traditionally been highly fragmented and serves a limited number of large OEMs. As a result, OEMs have historically had a significant amount of leverage over their outside suppliers. Our contracts with major OEM and Tier 1 customers frequently provide for an annual productivity cost reduction. Historically, cost reductions through product design changes, increased productivity and similar programs with our suppliers have generally offset these customer-imposed productivity cost reduction requirements. However, if we are unable to generate sufficient production cost savings in the future to offset price reductions, our gross margin and profitability would be adversely affected. In addition, changes in our customers’ purchasing policies or payment practices could have an adverse effect on our business.
The loss or insolvency of any of our major customers would adversely affect our future results.
Our three largest customers, in the aggregate, accounted for approximately 18.5% of our net sales for the year ended December 31, 2017. We have not entered into long-term agreements with any of our customers. Instead, we enter into a number of purchase order commitments with our customers, based on their current or projected needs. We have in the past lost, and may in the future, lose customers due to the highly competitive conditions in the industries we serve, including pricing pressures. A decision by any significant customer, whether motivated by competitive conditions, financial difficulties or otherwise, to materially decrease the amount of products purchased from us, to change their manner of doing business with us or to stop doing business with us could have a material adverse effect on our business, financial condition and results of operations.
We have no long-term contracts with customers.
We supply our products based on purchase orders placed by our customers from time to time but have no long-term contracts with our customers. We will commit to end-product pricing for a specified quantity of product for the duration of a vehicle’s production, generally three to five years. In the past, we successfully mitigated price volatility though aggressive supplier management and alternative material substitution strategies. Typically, our products are refreshed during a vehicle’s production life creating opportunities to modify pricing if material costs have risen. However, there can be no assurance that we will be able to implement or sustain such strategies in the future or modify pricing to pass potential increases in material costs to customers. Our inability to do so could materially adversely affect our business, financial condition and results of operations.
Our inability to compete effectively in the highly competitive vehicle component supply industry could result in lower prices for our products, reduced gross margins and loss of market share, which could have an adverse effect on our revenues and operating results.
The vehicle component supply industry is highly competitive. Our products primarily compete on the basis of price, breadth of product offerings, product quality, technical expertise and development capability, product delivery and product service. Increased competition may lead to price reductions resulting in reduced gross margins and loss of market share.
Current and future competitors may make strategic acquisitions or establish cooperative relationships among themselves or with others, foresee the course of market development more accurately than we do, develop products that are superior to our
13
products, produce similar products at lower cost than we can or adapt more quickly to new technologies, industry or customer requirements. By doing so, they may enhance their ability to meet the needs of our customers or potential future customers. These developments could limit our ability to obtain revenues from new customers and to maintain existing revenues from our existing customer base. We may not be able to compete successfully against current and future competitors and the failure to do so may have a material adverse effect on our business, operating results and financial condition.
We rely on raw materials suppliers in our business and significant shortages, supplier capacity constraints or supplier production disruptions could adversely affect our financial condition and operating results.
Our reliance on suppliers to secure raw materials exposes us to volatility in the prices and availability of our products. A disruption in deliveries from suppliers could have a material adverse effect on our ability to meet our commitments to customers or could increase our operating costs. Moreover, the cost of raw materials used in the production of our products, represents a significant portion of our direct manufacturing costs. The number of customers to which we are not able to pass on such price increases may increase in the future. We believe that our supply management and production practices are based on an appropriate balancing of the foreseeable risks and the costs of alternative practices. Nonetheless, price increases, supplier capacity constraints, supplier production disruptions or the unavailability of some raw materials may have a material adverse effect on our cash flows, competitive position, financial condition or results of operations. If we are not able to buy raw materials at fixed prices or pass on price increases to our customers, we may lose orders or enter into orders with less favorable terms, any of which could have a material adverse effect on our business, financial condition and results of operations.
We conduct certain of our manufacturing in Mexico and Canada, therefore, are subject to risks associated with doing business outside the United States, including the possible effects of currency exchange rate fluctuations.
We have two manufacturing facilities in Mexico and one in Canada. There are a number of risks associated with doing business in Mexico and Canada, including, exposure to local economic and political conditions, social unrest, including risks of terrorism or other hostilities, export and import restrictions, and the potential for shortages of trained labor. Our sales are denominated in U.S. dollars. Because a portion of our manufacturing costs are incurred in Mexican pesos and Canadian dollars, fluctuations in the U.S. dollar/Mexican peso and U.S dollar/Canadian dollar exchange rates may have a material effect on our profitability, cash flows, financial position, and may significantly affect the comparability of our results between financial periods. Any depreciation in the value of the U.S. dollar in relation to the value of the Mexican peso or Canadian dollar will adversely affect the cost of our Mexican and Canadian operations when remeasured into U.S. dollars. Similarly, any appreciation in the value of the U.S. dollar in relation to the value of the Mexican peso or Canadian dollar will decrease the cost of our Mexican and Canadian operations when remeasured into U.S. dollars. These risks may materially adversely impact our business, results of operations and financial condition.
Prior periods of weakness in the global economy, the global credit markets and the financial services industry severely and negatively affected demand for automobiles and automobile parts and our business, financial condition, results of operations and cash flows.
Demand for and pricing of our products are subject to economic conditions and other factors present in the various markets where our products are sold. The level of demand for our products depends primarily upon the level of consumer demand for new vehicles that are manufactured with our products. The level of new vehicle purchases is cyclical, affected by such factors as general economic conditions, interest rates, consumer confidence, consumer preferences, patterns of consumer spending, fuel costs and the automobile replacement cycle.
The global economic crisis that prevailed throughout 2008 and 2009 resulted in delayed and reduced purchases of durable consumer goods, such as automobiles. Although the global economic climate has improved since 2009, if the global economy were to take another significant downturn, depending upon its length, duration and severity, our business, financial condition, results of operations and cash flow would again be materially adversely affected.
Our business is cyclical in nature and downturns in the automotive industry could reduce the sales and profitability of its business.
The demand for our products is largely dependent on the North American production of automobiles. The markets for our products have been cyclical, because new vehicle demand is dependent on, among other things, consumer spending and is tied closely to the overall strength of the economy. Because our products are used principally in the production of vehicles for the automotive market, our net sales, and therefore results of operations, are significantly dependent on the general state of the economy and other factors which affect these markets. A decline in vehicle production would adversely impact our results of operations and financial condition. In addition, the North American automotive market experienced a downturn during 2008
14
and 2009 as a result of general weakness in the North American economy. Although North American vehicle production declined in 2017, the production levels in 2018 and beyond are forecast to increase again. We cannot provide any assurance as to the level of growth in our markets. If the market stagnates or if there is any extended downturn, it could materially affect our business, financial condition and results of operations.
We are a holding company with no operations of our own, and we depend on our subsidiaries for cash to fund all of our operations and expenses, including to make future dividend payments, if any.
Our operations are conducted entirely through our subsidiaries and our ability to generate cash to fund all of our operations and expenses and to pay dividends or to meet any debt service obligations of the holding company is highly dependent on the earnings and the receipt of funds from our subsidiaries via dividends or intercompany loans. We currently expect to continue to pay dividends on our common stock; however, none of our subsidiaries will be obligated to make funds available to us for the payment of dividends. Further, the agreement governing our senior credit facility, for which our subsidiary, Unique Fabricating NA, Inc. is the borrower, restricts the ability of our subsidiaries to pay dividends, make loans or otherwise transfer assets to us. In addition, the laws of the jurisdictions in which our subsidiaries are organized may impose requirements that may restrict the ability of subsidiaries to pay dividends to us.
We may pursue acquisitions that involve inherent risks, any of which may cause us to not realize anticipated benefits.
Our business strategy includes the potential acquisition of businesses that we expect will complement and expand our business. For example, during the last three fiscal years, we acquired the businesses and substantially all of the assets of PTI, Chardan, Great Lakes, and Intasco. We may not be able to successfully identify suitable acquisition opportunities or complete any particular acquisition, combination or other transaction on acceptable terms. Our identification of suitable acquisition candidates involves risks inherent in assessing the values, strengths, weaknesses, risks and profitability of these opportunities, including their effects on our business, diversion of our management’s attention and risks associated with unanticipated problems or unforeseen liabilities. If we are successful in pursuing future acquisitions, we may be required to expend significant funds, incur additional debt, or issue additional shares of common stock, which may materially and adversely affect our results of operations and be dilutive to our stockholders. If we spend significant funds or incur additional debt, our ability to obtain financing for working capital or other purposes could decline and we may be more vulnerable to economic downturns and competitive pressures. In addition, we cannot guarantee that we will be able to finance additional acquisitions or that we will realize any anticipated benefits from acquisitions that we complete. Should we successfully acquire other businesses, the process of integrating acquired operations into our existing operations may result in unforeseen operating difficulties and may require significant financial resources that would otherwise be available for the ongoing development or expansion of our existing business. Our failure to identify suitable acquisition opportunities may restrict our ability to grow our business.
We may experience increased costs and other disruptions to our business associated with labor unions.
As of December 31, 2017, we had 1,023 full-time employees, of whom 773 are hourly and 250 are salaried. 185 of our hourly employees are represented by labor unions and covered by collective bargaining agreements. A collective bargaining agreement covering 157 hourly workers employed at our Auburn Hills, Michigan facility terminates in August 2019. We cannot assure you that we will negotiate successfully a new collective bargaining agreement in our Auburn Hills facility, or other of our employees will not be represented by a labor organization in the future or that any of our facilities will not experience a work stoppage or other labor disruption. Many of our customers and their suppliers also have unionized work forces. Work stoppages or slow-downs experienced by customers or their other suppliers could result in slow-downs or closures of assembly plants where our products are included in assembled commercial vehicles. Any work stoppage or other labor disruption involving our employees, employees of our customers (many of which customers have employees who are represented by unions), or employees of our suppliers could have a material adverse effect on our business, financial condition or results of operations by disrupting our ability to manufacture our products or reducing the demand for our products.
We would be adversely affected by the loss of key personnel.
Our success is dependent upon the continued services of our senior management team and other key employees. Although certain key members of our senior management have employment agreements for their continued services, there is no guaranty that each such person will choose to remain with us. The loss of any key employees (including such members of our senior management team) could materially adversely affect our business, results of operations and financial condition.
In addition, our success depends in part on our ability to attract, hire, train and retain qualified managerial, engineering, sales and marketing personnel. We face significant competition for these types of employees in our industry. We may be unsuccessful in attracting and retaining the personnel we require to conduct our operations successfully. The loss of any
15
member of our senior management team or other key employees could impair our ability to execute our business plans and strategic initiatives, cause us to lose customers and experience reduced net sales, or lead to employee morale problems and/or the loss of other key employees. In any such event, our financial condition, results of operations, internal control over financial reporting, or cash flows could be adversely affected.
Our results of operations may be negatively impacted by product liability lawsuits and claims.
Our automotive products expose us to potential product liability risks that are inherent in the design, manufacture, sale and use of our products. While we currently maintain what we believe to be suitable product liability insurance, we cannot assure you that we will be able to maintain this insurance on acceptable terms, that this insurance will provide adequate protection against potential liabilities or that our insurance providers will successfully weather the current economic downturn. One or more successful claims against us could materially and adversely affect our reputation and our financial condition, results of operations and cash flows.
Our businesses are subject to statutory environmental and safety regulations in multiple jurisdictions, and the impact of any changes in regulation and/or the violation of any applicable laws and regulations by our businesses could result in a material and adverse effect on our financial condition and results of operations.
We are subject to foreign, federal, state, and local laws and regulations governing the protection of the environment and occupational health and safety, including laws regulating: air emissions; wastewater discharges; the generation, storage, handling, use and transportation of hazardous materials; the emission and discharge of hazardous materials into the soil, ground or air; and the health and safety of our employees. We are also required to obtain permits from governmental authorities for certain of our operations. We cannot assure you that we are, or have been, in complete compliance with such environmental and safety laws, regulations and permits. If we violate or fail to comply with these laws, regulations or permits, we could be fined or otherwise sanctioned by regulators. In some instances, such a fine or sanction could have a material and adverse effect on us. The environmental laws to which we are subject have become more stringent over time, and we could incur material expenses in the future to comply with environmental laws. We are also subject to laws imposing liability for the cleanup of contaminated property. Under these laws, we could be held liable for costs and damages relating to contamination at our past or present facilities and at third party sites to which we sent waste containing hazardous substances. The amount of such liability could be material.
Certain of our operations generate hazardous substances and wastes. If a release of such substances or wastes occurs at or from our properties, or at or from any offsite disposal location to which substances or wastes from our current or former operations were taken, or if contamination is discovered at any of our current or former properties, we may be held liable for the costs of cleanup and for any other claim by governmental authorities or private parties, together with any associated fines, penalties or damages. In most jurisdictions, this liability would arise whether or not we had complied with environmental laws governing the handling of hazardous substances or wastes.
We may be adversely affected by the impact of government regulations on our customers.
Although the products we manufacture and supply to vehicle customers are not subject to significant government regulation, our business is indirectly impacted by the extensive governmental regulation applicable to vehicle customers. These regulations primarily relate to emissions and noise standards imposed by the Environmental Protection Agency, or EPA, state regulatory agencies, such as the California Air Resources Board, or CARB, and other regulatory agencies around the world. Vehicle customers are also subject to the National Traffic and Motor Vehicle Safety Act and Federal Motor Vehicle Safety Standards promulgated by the National Highway Traffic Safety Administration. Changes in emission standards and other proposed governmental regulations could impact the demand for vehicles and, as a result, indirectly impact our operations. For example, emission standards governing heavy-duty (Class 8) diesel engines that went into effect in the United States on October 1, 2002 and January 1, 2007 resulted in significant purchases of new trucks by fleet operators prior to such date and reduced short term demand for such trucks in periods immediately following such date. Emission standards for truck engines used in Class 5 to 8 trucks imposed by the EPA and CARB became effective in 2010. To the extent that current or future governmental regulation has a negative impact on the demand for vehicles, our business, financial condition or results of operations could be adversely affected.
We have only limited protection for our proprietary rights in our intellectual property, which makes it difficult to prevent third parties from infringing upon our rights.
Our success depends to a certain degree on our ability to protect our intellectual property and to operate without infringing on the proprietary rights of third parties. We have not been issued patents and have not registered trademarks with respect to
16
our products. Our competitors could duplicate our designs, processes or other intellectual property or design around any processes or designs on which we may obtain patents or trademark protection in the future. In addition, it is possible that third parties may have or acquire patents, trademarks, or licenses for other technology or designs that we may use or desire to use, so that we may need to acquire licenses to, or to contest the validity of, such patents or trademarks of third parties. Such licenses may not be made available to us on acceptable terms, if at all, and we may not prevail in contesting the validity of third party rights.
We protect trade secrets, know-how and other confidential information against unauthorized use by others or disclosure by persons who have access to them, such as our employees, through contractual or other arrangements. These arrangements may not provide meaningful protection for our trade secrets, know-how or other proprietary information in the event of any unauthorized use, misappropriation or disclosure of such trade secrets, know-how or other proprietary information. If we are unable to maintain the proprietary nature of our technologies, our revenues could be materially adversely affected.
We believe any attempt by President Trump to withdraw from or materially modify NAFTA and certain other international trade agreements could adversely affect our business, financial condition and results of operations.
A significant portion of our business activities are conducted in foreign countries, including Mexico. President Trump has made comments suggesting that he was not supportive of certain existing international trade agreements, including the North American Free Trade Agreement (“NAFTA”). At this time, it remains unclear what President Trump would or would not do with respect to these international trade agreements. If President Trump takes action to withdraw from or materially modify NAFTA or certain other international trade agreements, our business, financial condition and results of operations could be adversely affected.
The United States recently passed a comprehensive tax reform bill that could adversely affect our financial performance.
On December 22, 2017, President Trump signed into law the Tax Cuts and Jobs Act that significantly revises the Internal Revenue Code of 1986, as amended (the “IRC”). The newly enacted federal income tax law, among other things, contains significant changes to corporate taxation, including the reduction of the corporate income tax rate from 35% to 21%, a one-time transition tax on offshore earnings at reduced tax rates regardless of whether the earnings are repatriated, the elimination of U.S. tax on foreign dividends (subject to certain important exceptions), new taxes on certain foreign earnings, a new minimum tax related to payments to foreign subsidiaries and affiliates, immediate deductions for certain new investments and the modification or repeal of many business deductions and credits. Notwithstanding the reduction in the corporate income tax rate, the overall impact of the new federal tax law is uncertain, and our financial performance could be adversely affected. In addition, it is uncertain if, and to what extent, various states will conform to the new tax law and foreign countries will react by adopting tax legislation or taking other actions that could adversely affect our business.
RISKS RELATED TO OUR COMMON STOCK
We may not be able to pay dividends.
We have paid and currently plan to pay dividends quarterly. However, our ability to pay dividends will be affected by our results and our needs for funds for use in our operations and to expand our business. In addition, our senior secured credit facility contains covenants which restrict or limit the amounts that we can pay as dividends or preclude the payments of dividends altogether.
If our executive officers, directors and principal stockholders choose to act together, they will be able to exert significant influence over us and our significant corporate decisions and may act in a manner that advances their best interests and not necessarily those of other stockholders.
Our executive officers, directors, and certain of our large stockholders and their affiliates beneficially own approximately 32.7% of our outstanding common stock. As a result, these persons, if they were to act together, have the ability to significantly influence the outcome of all matters requiring stockholder approval, including the election and removal of directors and any merger, consolidation, or sale of all or substantially all of our assets, and they could act in a manner that advances their best interests and not necessarily those of other stockholders, by among other things:
• | delaying, deferring or preventing a change in control of us; |
• | entrenching our management and/or our board of directors; |
• | impeding a merger, consolidation, takeover or other business combination involving us; |
17
• | discouraging a potential acquirer from making a tender offer or otherwise attempting to obtain control of us; or |
• | causing us to enter into transactions or agreements that are not in the best interests of all stockholders. |
Securities analysts may not initiate or continue coverage of our common stock or may issue negative reports, which may have a negative impact on the market price of our common stock.
To date since our initial public offering, there has been limited coverage of our common stock by securities analysts. Securities analysts may elect not to provide research coverage of our common stock. If securities analysts do not cover our common stock, the lack of research coverage may cause the market price of our common stock to decline, or adversely affect the trading volume for our common stock. The trading market for our common stock may be affected in part by the research and reports that industry or financial analysts publish about our business. If one or more of the analysts who elect to cover us downgrade our stock, our stock price would likely decline rapidly. If one or more of these analysts cease coverage of us, we could lose visibility in the market, which in turn could cause our stock price to decline. In addition, under the Sarbanes-Oxley Act of 2002, or the Sarbanes-Oxley Act, and a global settlement among the Securities and Exchange Commission, or the SEC, other regulatory agencies and a number of investment banks, which was reached in 2003, many investment banking firms are required to contract with independent financial analysts for their stock research. It may be difficult for a company such as ours, with a smaller market capitalization, to attract independent financial analysts that will cover our common stock. This could have a negative effect on the market price of and trading volume for our stock.
Future sales of our common stock in the public market may cause our stock price to decline and impair our ability to raise future capital through the sale of our equity securities.
As of December 31, 2017, we had outstanding 9,757,563 shares of common stock, including 2,702,500 shares of our common stock issued in our initial public offering and 6,729,551 shares of common stock owned by non-affiliates and issued in private placements, in each case more than one year ago. The shares owned by non-affiliates can be traded without restriction under Rule 144 or otherwise at this time. In addition, 3,028,012 shares of common stock are owned by affiliates but can be traded subject to restrictions under Rule 144. In addition, we have registered all shares that may be issued pursuant to our 2013 Stock Incentive Plan and the 2014 Omnibus Performance Award Plan. Sales of a large number of these securities on the public market or the perception that a large number of shares may be sold could reduce the market price of our common stock or impair our ability to raise capital.
Anti-takeover provisions in our organizational documents and Delaware law may discourage or prevent a change in control, even if an acquisition would be beneficial to our stockholders, which could affect our stock price adversely and prevent attempts by our stockholders to replace or remove our current management.
Our restated certificate of incorporation and restated bylaws contain provisions that could discourage, delay or prevent a merger, acquisition or other change in control of our company or changes in our board of directors that our stockholders might consider favorable, including transactions in which you might receive a premium for your shares. These provisions also could limit the price that investors might be willing to pay in the future for shares of our common stock, thereby depressing the market price of our common stock. Stockholders who wish to participate in these transactions may not have the opportunity to do so. Furthermore, these provisions could prevent or frustrate attempts by our stockholders to replace or remove management. These provisions:
• | allow the authorized number of directors to be changed only by resolution of our board of directors; |
• | provide for a classified board of directors, such that not all members of our board will be elected at one time; |
• | prohibit our stockholders from filling board vacancies, limit who may call stockholder meetings, and prohibit the taking of stockholder action by written consent; and |
• | require advance written notice of stockholder proposals that can be acted upon at stockholders meetings and of director nominations to our board of directors. |
In addition, we are subject to the provisions of Section 203 of the Delaware General Corporation Law, which may prohibit certain business combinations with stockholders owning 15% or more of our outstanding voting stock. Any delay or prevention of a change in control transaction or changes in our board of directors could cause the market price of our common stock to decline.
18
RISKS RELATED TO PUBLIC COMPANIES
We are an “emerging growth company” as defined in the Jumpstart Our Business Startups (JOBS) Act of 2012 and the reduced disclosure requirements applicable to emerging growth companies may make our common stock less attractive to investors.
We are an “emerging growth company,” as defined in the JOBS Act. For as long as we continue to be an emerging growth company, we may take advantage of exemptions from various reporting requirements that are applicable to other public companies that are not emerging growth companies, including (1) not being required to comply with the auditor attestation requirements of Section 404 of the Sarbanes-Oxley Act, (2) reduced disclosure obligations regarding executive compensation in our periodic reports and proxy statements and (3) exemptions from the requirements of holding a nonbinding advisory vote on executive compensation and stockholder approval of any golden parachute payments not previously approved. Under the JOBS Act, emerging growth companies can delay adopting new or revised accounting standards until such time as those standards apply to private companies. We have elected to delay such adoption of new or revised accounting standards on the relevant dates on which adoption of such standards is required for private companies. As a result of this election, our financial statements may not be comparable to the financial statements of other public companies that comply with all public company accounting standards.
We may take advantage of these exemptions until we are no longer an emerging growth company. Under the JOBS Act, we may be able to maintain emerging growth company status for up to five years following our initial public offering, although circumstances could cause us to lose that status earlier, including if the market value of our common stock held by non-affiliates exceeds $700 million as of the last business day of our second quarter during any fiscal year before the end of such five-year period or if we have total annual gross revenue of $1.0 billion or more during any fiscal year before that time, in which cases we would no longer be an emerging growth company as of the following December 31. Additionally, if we issue more than $1.0 billion in non-convertible debt during any three-year period before that time, we would cease to be an emerging growth company immediately. Even after we no longer qualify as an emerging growth company, we may qualify as a “smaller reporting company,” which would allow us to take advantage of many of the same exemptions from disclosure requirements, including not being required to comply with the auditor attestation requirements of Section 404 of the Sarbanes-Oxley Act and reduced disclosure obligations regarding executive compensation in our periodic reports and proxy statements. We cannot predict whether investors will find our common stock less attractive because of our reliance on any of these exemptions. If some investors find our common stock less attractive as a result, there may be a less active trading market for our common stock and our stock price may be more volatile.
Regulations related to conflict minerals may force us to incur additional expenses and otherwise adversely impact our business.
The U.S. Securities and Exchange Commission, or the SEC, has promulgated final rules mandated by the Dodd-Frank Act regarding disclosure of the use of tin, tantalum, tungsten and gold, known as conflict minerals, in products manufactured by public companies. These rules require ongoing due diligence to determine whether such minerals originated from the Democratic Republic of Congo, or the DRC, or an adjoining country and whether such minerals helped finance the armed conflict in the DRC. Reporting obligations are required annually. We will be required to comply with the reporting obligations beginning after our fiscal year ended December 31, 2017. There will be costs associated with complying with these disclosure requirements, including costs to determine the origin of conflict minerals in our products. The implementation of these rules and their effect on customer, supplier and/or consumer behavior could adversely affect the sourcing, supply and pricing of materials used in our products. As a result, we may also incur costs with respect to potential changes to products, processes or sources of supply. We may face disqualification as a supplier for customers and reputational challenges if the due diligence procedures we implement do not enable us to verify the origins for all conflict minerals used in our products or to determine if such conflict minerals are conflict-free. Accordingly, the implementation of these rules could have a material adverse effect on our business, results of operations and/or financial condition.
We incur increased costs as a result of being a public company, and potentially will incur more after we are no longer an “emerging growth company”. Our management devotes substantial time to public company compliance programs, and will be required to continue to devote substantial time in the future.
As a public company, we incur significant legal, insurance, accounting and other expenses that we did not incur as a private company. In addition, our administrative staff is required to perform additional tasks. We expect that these expenses will increase when we no longer qualify as an “emerging growth company”. We have invested and intend to invest resources to comply with evolving laws, regulations and standards, and this investment has resulted in increased general and administrative expenses and may divert management’s time and attention from product development and commercialization activities. If our
19
efforts to comply with new laws, regulations and standards differ from the activities intended by regulatory or governing bodies due to ambiguities related to practice, regulatory authorities may initiate legal proceedings against us, and our business may be harmed. In addition, if we are unable to continue to meet these requirements, we may not be able to maintain the listing of our common stock on the NYSE American which would likely have a material adverse effect on the trading price of our common stock.
In the future, it may be more expensive for us to obtain director and officer liability insurance, and we may be required to accept reduced coverage or incur substantially higher costs to obtain coverage. These factors could also make it more difficult for us to attract and retain qualified executive officers and qualified members of our board of directors, particularly to serve on our audit and compensation committees.
Our internal control over financial reporting as a public company now requires us to meet the standards required by Section 404 of the Sarbanes-Oxley Act, and failure to achieve and maintain effective internal control over financial reporting in accordance with Section 404 of the Sarbanes-Oxley Act could result in material misstatements of our annual or interim financial statements and have a material adverse effect on our business and share price.
We are now currently required to comply with the SEC’s rules that implement Section 404 of the Sarbanes-Oxley Act, and are therefore required to make a formal assessment of the effectiveness of our internal control over financial reporting for that purpose. This requires management to certify financial and other information in our quarterly and annual reports and provide an annual management report on the effectiveness of our internal control over financial reporting. This assessment includes the disclosure of any material weaknesses or significant deficiencies in our internal control over financial reporting identified by our management or our independent registered public accounting firm. A “material weakness” is a deficiency, or a combination of deficiencies, in internal control over financial reporting such that there is a reasonable possibility that a material misstatement of our annual or interim financial statements will not be prevented or detected on a timely basis. A “significant deficiency” is a deficiency, or a combination of deficiencies, in internal controls over financial reporting that is less severe than a material weakness, yet important enough to merit attention by those responsible for oversight of our financial reporting, including the audit committee of the board of directors.
Finally, as a public company we believe that we will need to continue to expand our accounting resources, including the size and expertise of our internal accounting team, to effectively execute a quarterly close process and on an appropriate time frame for a public company. If we are unsuccessful or unable to sufficiently expand these resources, we may not be able to produce U.S. generally accepted accounting principles (GAAP)-compliant financial statements on a time frame required to comply with our reporting requirements under the Exchange Act, and the financial statements we produce may contain material misstatements, either of which could cause investors to lose confidence in our financial reports and our financial reporting generally, which could lead to a decline in the trading price of our common stock.
We may pursue acquisitions that involve inherent risks related to potential internal control weaknesses and significant deficiencies which may be costly for us to remedy and could impact management assessment of internal control effectiveness.
We have acquired companies recently that have small accounting and finance staff increasing the potential for material weaknesses and significant deficiencies in financial reporting at the stand alone or subsidiary entity level. Although our independent registered public accounting firm will not be required to formally attest to our internal control effectiveness while we are an emerging growth company, management is still responsible for assessing internal control effectiveness at a consolidated level. As we integrate these acquired companies into our business, the process of integrating acquired operations into our existing operations with entities that potentially have material weaknesses and/or significant deficiencies may result in unforeseen operating difficulties and may require significant financial resources to remedy and material weaknesses or significant deficiencies that would otherwise be available for the ongoing development or expansion of our existing business. These potential material weaknesses and deficiencies may be costly for us to remedy properly and properly assess internal control effectiveness.
ITEM 1B. UNRESOLVED STAFF COMMENTS
None
20
ITEM 2. PROPERTIES
The following sets forth our facilities as of December 31, 2017.
Principal Uses | Location | Approximate Square Footage | Owned or Leased | |||
Headquarters, Sales/Engineering, Manufacturing | Auburn Hills, Michigan | 150,000 | Leased | |||
Sales/Engineering Manufacturing | LaFayette, Georgia | 147,000 | Owned | |||
Sales/Engineering Manufacturing | Monterrey, Mexico | 91,000 | Leased | |||
Manufacturing | Queretaro, Mexico | 64,000 | Leased | |||
Manufacturing | Bryan, Ohio | 42,000 | Leased | |||
Sales/Engineering Manufacturing | Louisville, Kentucky | 73,000 | Owned | |||
Manufacturing | Evansville, Indiana | 66,500 | Owned | |||
Manufacturing | Ft. Smith, Arkansas | 70,000 | Owned | |||
Manufacturing | Concord, Michigan | 72,000 | Leased | |||
Manufacturing | Port Huron, Michigan | 18,000 | Leased | |||
Manufacturing | London, Ontario | 35,000 | Leased | |||
We also have an independent sales representative who maintains offices in Baldham, Germany. We do not lease or own the facilities at which he maintains his offices. Subsequent to the 2017 fiscal year-end we announced we will be closing the Ft. Smith and Port Huron facilities in 2018. Please refer to Note 8 for further information.
Each of our owned properties has been mortgaged to our bank to secure our borrowings under our senior credit facility.
ITEM 3. LEGAL PROCEEDINGS
Management is not aware of any legal proceedings contemplated, pending or threatened against us by any government authority or any other party involving our business. As of the date of this Annual Report on Form 10-K, no director, officer or affiliate is: (1) a party adverse to us in any legal proceeding, or (2) has an adverse interest to us in any legal proceeding.
ITEM 4. MINE SAFETY DISCLOSURES
None
21
PART II
ITEM 5. MARKET FOR REGISTRANTS COMMON EQUITY, RELATED STOCKHOLDER MATTERS AND ISSUES
Price Range of Common Stock
Our common stock began trading on the NYSE American under the symbol “UFAB” on July 1, 2015. Prior to that date, there was no public market for our common stock. Our IPO was priced at $9.50 per share on July 1, 2015. The following table sets forth for the periods indicated the high and low closing sales price per share of our common stock as reported on the NYSE American:
Fiscal Year 2017: | High | Low | |||||
Period from January 2, 2017 through April 2, 2017 | $ | 14.75 | $ | 10.41 | |||
Period from April 3, 2017 through July 2, 2017 | $ | 12.21 | $ | 8.90 | |||
Period from July 3, 2017 through October 1, 2017 | $ | 9.91 | $ | 7.10 | |||
Period from October 2, 2017 through December 31, 2017 | $ | 9.09 | $ | 7.05 | |||
Fiscal Year 2016: | High | Low | |||||
Period from January 4, 2016 through April 3, 2016 | $ | 12.75 | $ | 9.03 | |||
Period from April 4, 2016 through July 3, 2016 | $ | 14.04 | $ | 12.20 | |||
Period from July 4, 2016 through October 2, 2016 | $ | 13.94 | $ | 11.83 | |||
Period from October 3, 2016 through January 1, 2017 | $ | 15.25 | $ | 11.85 | |||
Performance Graph
The following graph compares the cumulative total stockholder return on our common stock with the total cumulative return of the Russell 2000 Index and the S&P Auto Parts & Equipment Index during the period commencing on July 1, 2015 the initial trading day of our common stock and ending on December 31, 2017. The graph assumes that $100 was invested at the beginning of the period in our common stock and in each of the comparative indices, and assumes the reinvestment of any dividends. Historical stock price performance should not be relied upon as an indication of future stock price performance.
22
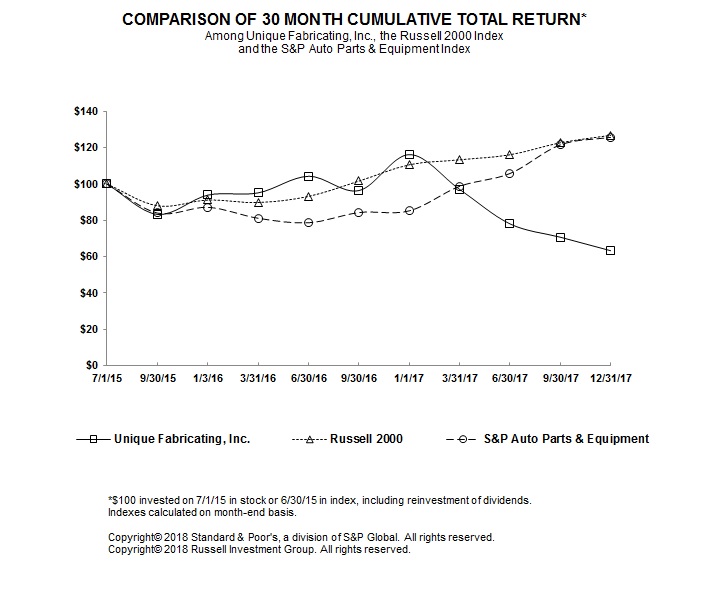
Number of Stockholders
As of March 2, 2018 there were 30 holders of record of the Company's common stock. Due to the fact that many shares are held by brokers and other institutions on behalf of stockholders, the Company is unable to estimate the total number of individual stockholders represented by these holders of record.
Dividends
We paid a dividend of $0.15 per share in each quarter of 2017 and 2016. In addition, on February 16, 2018, the board of directors declared a quarterly cash dividend of $0.15 per common share with respect to the first quarter of 2018. The dividend will be payable on March 7, 2018 to stockholders of record at the close of business on February 28, 2018. Our payment of dividends on our common stock in the future will be determined by our board of directors in its sole discretion and will depend on business conditions, our financial condition, earnings, liquidity, and capital requirements. Our senior secured credit facility contains covenants which restrict or limit the amounts that we can pay as dividends or preclude the payments of dividends altogether.
23
Equity Compensation Plan Table
Plan Category | Number of Securities to be Issued Upon Exercise of Outstanding Options, Warrants, and Rights | Weighted-Average Exercise Price of Outstanding Options, Warrants, and Rights | Number of Securities Remaining Available for Future Issuance Under Equity Compensation Plans | |||||||
Equity compensation plan approved by security holders (1) | 945,000 | $ | 7.06 | 201,000 | ||||||
Equity compensation plans not approved by security holders | — | $ | — | — | ||||||
(1) Includes options approved under the 2013 Stock Incentive Plan and 2014 Omnibus Performance Award Plan that were granted to employees of the Company and the board of directors and were registered on Form S-8 (333-206140) on August 6, 2015. Also includes additional shares under the 2014 Omnibus Performance Award Plan that were registered on Form S-8 (333-212193) on June 23, 2016.
24
ITEM 6. SELECTED FINANCIAL DATA
The following selected consolidated financial and other data should be read in conjunction with “Management’s Discussion and Analysis of Financial Condition and Results of Operations” and our consolidated audited financial statements and related notes, which are included elsewhere in this Annual Report on Form 10-K. Our policy is that fiscal years end on the Sunday closest to December 31. The consolidated statements of operations data, cash flow data and the consolidated balance sheet data for the fiscal years ended December 31, 2017, January 1, 2017 and January 3, 2016 are derived from the audited consolidated financial statements that are included elsewhere in this Annual Report on Form 10-K. The selected consolidated financial data for the fiscal year ended January 4, 2015 and the periods from March 18, 2013 through December 30, 2013 (successor) and from December 31, 2012 through March 17, 2013 (predecessor) and as of January 3, 2016, January 4, 2015 and December 29, 2013 have been derived from audited financial statements not included herein. Our historical results are not necessarily indicative of the results to be expected in the future.
Successor | Successor | Successor | Successor | Successor | (1) Predecessor | ||||||||||||||||||
Fifty-Two Weeks Ended December 31, 2017 | Fifty-Two Weeks Ended January 1, 2017 | Fifty-Two Weeks Ended January 3, 2016 | Fifty-Two Weeks Ended January 4, 2015 | March 18, 2013 through December 29, 2013 | December 31, 2012 through March 17, 2013 | ||||||||||||||||||
(in thousands, except per share data) | |||||||||||||||||||||||
Statement of Operations Data: | |||||||||||||||||||||||
Net Sales | $ | 175,288 | $ | 170,463 | $ | 143,309 | $ | 126,480 | $ | 63,878 | $ | 16,378 | |||||||||||
Cost of Sales | 135,234 | 130,919 | 109,488 | 95,020 | 48,983 | 12,717 | |||||||||||||||||
Gross Profit | 40,054 | 39,544 | 33,821 | 31,460 | 14,895 | 3,661 | |||||||||||||||||
Selling, General, and Administrative Expenses | 29,767 | 27,524 | 23,372 | 21,326 | 12,069 | 5,026 | |||||||||||||||||
Restructuring Expenses | — | 35 | 374 | — | — | — | |||||||||||||||||
Operating Income (Expense) | 10,287 | 11,985 | 10,075 | 10,134 | 2,826 | (1,365 | ) | ||||||||||||||||
Non-operating Income (Expense) | |||||||||||||||||||||||
Investment Income | — | — | — | 21 | 22 | — | |||||||||||||||||
Other Income | 79 | 92 | 23 | 51 | — | — | |||||||||||||||||
Interest Expense | (2,746 | ) | (2,135 | ) | (2,755 | ) | (3,667 | ) | (2,310 | ) | (245 | ) | |||||||||||
Total Non-Operating Expense | (2,667 | ) | (2,043 | ) | (2,732 | ) | (3,595 | ) | (2,288 | ) | (245 | ) | |||||||||||
Income – Before Income Taxes | 7,620 | 9,942 | 7,343 | 6,539 | 538 | (1,610 | ) | ||||||||||||||||
Income Tax Expense | 1,133 | 3,258 | 2,314 | 2,074 | 286 | (450 | ) | ||||||||||||||||
Net Income | $ | 6,487 | $ | 6,684 | $ | 5,029 | $ | 4,465 | $ | 252 | $ | (1,160 | ) | ||||||||||
Net Income per share | |||||||||||||||||||||||
Basic | $ | 0.67 | $ | 0.69 | $ | 0.62 | $ | 0.66 | $ | 0.05 | $ | (33.14 | ) | ||||||||||
Diluted | $ | 0.66 | $ | 0.68 | $ | 0.60 | $ | 0.65 | $ | 0.05 | $ | (33.14 | ) | ||||||||||
Cash dividends declared per share | $ | 0.60 | $ | 0.60 | $ | 0.30 | $ | — | $ | — | $ | — | |||||||||||
Weighted Average Shares Outstanding | |||||||||||||||||||||||
Basic | 9,751 | 9,678 | 8,174 | 6,740 | 5,067 | 39 | |||||||||||||||||
Diluted | 9,899 | 9,896 | 8,427 | 6,864 | 5,067 | 39 | |||||||||||||||||
Statement of Cash Flow Data | |||||||||||||||||||||||
Cash flow provided by (used in): | |||||||||||||||||||||||
Operating Activities | $ | 7,809 | $ | 7,761 | $ | 5,081 | $ | 7,128 | $ | (253 | ) | $ | (256 | ) | |||||||||
Investing Activities | (4,088 | ) | (21,993 | ) | (15,439 | ) | (6,011 | ) | (45,988 | ) | (506 | ) | |||||||||||
Financing Activities | (2,995 | ) | 14,210 | 10,329 | (1,253 | ) | 47,133 | 544 | |||||||||||||||
Other Financial Data | |||||||||||||||||||||||
Adjusted EBITDA (2) | $ | 18,032 | $ | 18,991 | $ | 15,590 | $ | 14,496 | $ | 6,768 | $ | 1,548 | |||||||||||
25
(1) The results of operations presented herein for the period prior to our acquisition of Unique Fabricating NA, Inc. are referred to as the results of operations of the “predecessor”. As a result of the acquisition, the results of operations of the predecessor are not comparable to our results following the acquisition.
(2) See details concerning Adjusted EBITDA, which is a non-GAAP measure, including the definition and calculation of amounts presented here in this document in Item 7. "Management's Discussion and Analysis of Financial Condition and Results of Operations".
Successor | Successor | Successor | Successor | Successor | |||||||||||||||
As of December 31, 2017 | As of January 1, 2017 | As of January 3, 2016 | As of January 4, 2015 | As of December 29, 2013 | |||||||||||||||
(in thousands) | |||||||||||||||||||
Selected Balance Sheet Data: | |||||||||||||||||||
Working capital(1) | $ | 29,847 | $ | 26,758 | $ | 23,047 | $ | 16,318 | $ | 15,087 | |||||||||
Net property, plant and equipment (2) | 22,975 | 21,198 | 18,761 | 17,290 | 14,815 | ||||||||||||||
Total assets | 122,805 | 122,537 | 99,921 | 84,151 | 77,959 | ||||||||||||||
Total debt (3) | 53,565 | 50,611 | 31,213 | 39,972 | 40,063 | ||||||||||||||
Total stockholders' equity | 50,882 | 50,059 | 48,013 | 16,592 | 13,946 | ||||||||||||||
(1) Represents current assets less current liabilities
(2) Excludes assets held for sale of $2,033 as of January 3, 2016.
(3) Amount is net of debt issuance costs which are further discussed in note 1 to our consolidated financial statements.
26
ITEM 7. MANAGEMENT’S DISCUSSION AND ANALYSIS OF FINANCIAL CONDITION AND RESULTS OF OPERATION
This Management's Discussion and Analysis of Financial Condition and Results of Operation is intended to provide a reader of our financial statements with a narrative from the perspective of our management on our financial condition, results of operations, liquidity, and certain other factors that may affect our future results. You should read the following discussion and analysis of our financial condition and results of operations in conjunction with the accompanying consolidated financial statements and the related notes to consolidated financial statements for the fifty-two weeks ended December 31, 2017, January 1, 2017 and January 3, 2016 included in this Annual Report on Form 10-K. Some of the information contained in this discussion and analysis include forward-looking statements. Our actual results and the timing of events could differ materially from those discussed in these forward-looking statements. Factors that could cause or contribute to these differences include those discussed below as well as in other sections of this Annual Report on Form 10-K, particularly in “Business,” “Risk Factors” and “Special Note Regarding Forward-Looking Statements.” We make no guarantees regarding outcomes, and assume no obligation to update the forward-looking statements herein, except as may be required by law.
Basis of Presentation
The Company’s policy is that fiscal years end on the Sunday closest to the end of the calendar year end. Our 2017 fiscal year ended on December 31, 2017, the 2016 fiscal year ended on January 1, 2017, and our 2015 fiscal year ended on January 3, 2016. The Company’s operations are classified in one reportable business segment. Although we have expanded the products that we manufacture and sell to include components used in the appliance, HVAC and water heater industries, products for these industries are manufactured at facilities that also manufacture or are capable of manufacturing products for the automotive industries. All of our manufacturing locations have similar capabilities, and most plants serve multiple markets. The manufacturing operations for our automotive, appliance, HVAC and water heater products share management and labor forces and use common personnel and strategies for new product development, marketing and the sourcing of raw materials.
We qualify as an “emerging growth company” under the JOBS Act. As a result, we are permitted to, and intend to, rely on exemptions from certain disclosure requirements. For so long as we are an emerging growth company, we will not be required to:
• | have an auditor report on our internal controls over financial reporting pursuant to Section 404(b) of the Sarbanes-Oxley Act; |
• | comply with any requirement that may be adopted by the Public Company Accounting Oversight Board regarding mandatory audit firm rotation or a supplement to the auditor’s report providing additional information about the audit and the financial statements (i.e., an auditor discussion and analysis); |
• | submit certain executive compensation matters to shareholder advisory votes, such as “say-on-pay” and “say-on-frequency”; and |
• | disclose certain executive compensation and related items such as the correlation between executive compensation and performance and comparisons of the CEO’s compensation to median employee compensation. |
In addition, Section 107 of the JOBS Act provides that an emerging growth company can take advantage of the extended transition period provided in Section 7(a)(2)(B) of the Securities Act for complying with new or revised accounting standards. In other words, an emerging growth company can delay the adoption of certain accounting standards until those standards would otherwise apply to private companies. We have elected to take advantage of the benefits of this extended transition period. Our financial statements may therefore not be comparable to those of companies that comply with such new or revised accounting standards.
We will remain an “emerging growth company” for up to five years from our initial public offering, or until the earliest to occur of (1) the last day of the first fiscal year in which our total annual gross revenues exceed $1.0 billion, (2) the date that we become a “large accelerated filer” as defined in Rule 12b-2 under the Securities Exchange Act of 1934, which would occur if the market value of our common stock that is held by non-affiliates exceeds $700 million as of the last business day of our most recently completed second fiscal quarter or (3) the date on which we have issued more than $1.0 billion in non-convertible debt during the preceding three year period.
Overview
Unique is engaged in the engineering and manufacture of multi-material foam, rubber and plastic components utilized in noise, vibration and harshness, acoustical management, water and air sealing, decorative and other functional applications. The
27
Company combines a long history of organic growth with some more recent strategic acquisitions to diversify both product capabilities and markets served.
Unique’s markets served are the North America automotive and heavy duty truck, as well as the appliance, water heater and HVAC markets. Sales are conducted directly with major automotive and heavy duty truck, appliance, water heater and HVAC OEMs, or indirectly through the Tier 1 suppliers of these OEMs. The Company has its principal executive offices in Auburn Hills, Michigan and has sales, engineering and production facilities in Auburn Hills, Michigan, Concord, Michigan, LaFayette, Georgia, Louisville, Kentucky, Evansville, Indiana, Ft. Smith, Arkansas, Bryan, Ohio, Port Huron, Michigan, Monterrey, Mexico,Queretaro, Mexico and London, Ontario. The Company also has an independent client sales representative who maintains offices in Baldham, Germany. Subsequent to the 2017 fiscal year-end we announced we will be closing the Ft. Smith and Port Huron facilities in 2018. Please refer to Note 8 for further information.
Unique derives the majority of its net sales from the sales of foam, rubber plastic, and tape adhesive related automotive products. These products are produced from a variety of manufacturing processes including die cutting, compression molding, thermoforming, reaction injection molding, and fusion molding. We believe Unique has a broader array of processes and materials utilized than any of its direct competitors, based on our product offerings. By sealing out air noise and water intrusion, and by providing sound absorption and blocking, Unique’s products improve the interior comfort of a vehicle, increasing perceived vehicle quality and the overall experience of its passengers. Unique’s products perform similar functions for appliances, water heaters and HVAC systems, improving thermal characteristics, reducing noise and prolonging equipment life.
We primarily operate within the highly competitive and cyclical automotive parts industry. Over the past several years the industry has experienced consistent growth as it recovered from the recession of 2009. Many sectors of the supply chain are operating near capacity. Over the same period we have grown our core automotive parts business at a faster rate than the industry as a whole, indicating we are taking market share from competitors and increasing our content per vehicle on the programs we supply. We expect this trend to continue.
Recent Developments
Dividend Declaration
On February 16, 2018, our board of directors declared a quarterly cash dividend of $0.15 per common share. The dividend will be payable on March 7, 2018 to shareholders of record at the close of business on February 28, 2018.
Fort Smith Facility Closure
On February 13, 2018, subsequent to our 2017 fiscal year-end, the Company made the decision to close its manufacturing facility in Fort Smith, Arkansas. The Company currently expects to cease operations at the Fort Smith facility by end of June of 2018, and that approximately 20 positions will be eliminated as a result of the closure. The Company's decision resulted from our desire to streamline operations and to utilize some of the available excess capacity in other of our facilities. As such, the Company will move existing Fort Smith production to our manufacturing facilities in Evansville, Indiana and Monterrey, Mexico. The Company will provide the affected employees severance pay, health benefits continuation and job search assistance. The Company evaluated whether or not this closing met the criteria for discontinued operations and concluded that the closing did not meet the definition as the closing did not represent a strategic shift in the Company's operations and the Company will have continuing cash flows from the production being moved to other facilities within the Company.
The Company currently estimates that it will incur approximately $0.2 million in employee termination costs. At this time, the Company estimates the ranges of amounts of other major types of costs expected to be incurred in connection with the closure to be approximately $0.4 million to $0.5 million.
Following the closure, the Company expects to market the facility, which currently has a net book value of approximately $0.7 million, for sale.
Port Huron Facility Closure
On February 1, 2018, subsequent to our 2017 fiscal year-end, the Company made the decision to close its manufacturing facility in Port Huron, Michigan. The Company currently expects to cease operations at the Port Huron facility by the end of March of 2018, and that approximately 7 positions will be eliminated as a result of the closure. The Company's decision resulted from our desire to streamline operations and to utilize some of the available excess capacity in other of our facilities.
28
As such, the Company will move existing Port Huron production to our manufacturing facilities in London, Ontario, Auburn Hills, Michigan, and Louisville, Kentucky. The Company will provide the affected employees severance pay, health benefits continuation and job search assistance. The Company evaluated whether or not this closing met the criteria for discontinued operations and concluded that the closing did not meet the definition as the closing did not represent a strategic shift in the Company's operations and the Company will have continuing cash flows from the production being moved to other facilities within the Company.
The Company currently estimates that it will incur approximately $0.1 million in employee termination costs. At this time, the Company estimates the ranges of amounts of other major types of costs expected to be incurred in connection with the closure to be approximately $0.1 million to $0.2 million.
Tax Cut and JOBS Act
On December 22, 2017 the Tax Cuts and JOBS Act (the “Act”) was signed into law. The Act changed many aspects of U.S. corporate income taxation and included the reduction of the corporate income tax rate from 35% to 21%. The Act also included implementation of a territorial system and imposition of a one-time tax on deemed repatriated earnings of foreign subsidiaries. At December 31, 2017 we had not completed our accounting for the tax effects of enactment of the Act; however we made a reasonable estimate of the net effects on our existing deferred tax balances and the one-time transition tax. We will continue to assess our provision for income taxes as future guidance becomes available, however we do not currently anticipate significant revisions will be necessary. Any such revisions will be treated in accordance with the measurement period guidance outlined in Staff Accounting Bulletin No. 118. For further discussion on the impact to the Company of the Act for the fifty-two weeks ended December 31, 2017, please refer to the Comparison of Results section below as well as in Note 11.
Acquisition of Intasco
On April 29, 2016, Unique-Intasco Canada, Inc. (the “Canadian Buyer”), a newly formed subsidiary, acquired the business and substantially all of the assets of Intasco Corporation, a Canadian based tape manufacturer, for a purchase price of $21.03 million, net of cash acquired, with a portion being held in escrow to fund the obligations of Intasco Corporation and its stockholders to indemnify Unique against certain claims, losses and liabilities. . On the same date, Unique Fabricating NA, Inc. (the “US Buyer”), an existing subsidiary of the Company, purchased 100% of the outstanding capital stock of Intasco USA, Inc., a United States based tape manufacturer, for a purchase price of $0.89 million paid by the issuance of 70,797 shares of the Company's common stock, par value $0.001 per share. The shares issued were “restricted shares” issued in reliance on an exemption from the registration requirements of the Securities Act of 1933, as amended. The cash purchase price was paid with borrowings under a new credit facility which replaced the Company's existing facility.
Intasco is a material converter of pressure sensitive products such as film, label stock, foams and adhesives primarily provided to the automotive industry in the United States and Canada. Intasco specializes in interior and exterior attachment tape systems. This acquisition has significantly broadened the Company's solution offerings, production capabilities, and potentially expands its reach into new markets.
New Credit Agreement
On April 29, 2016, Unique Fabricating NA, Inc. (the “US Borrower”) and Unique-Intasco Canada, Inc. (the “CA Borrower”) and Citizens Bank, National Association (“Citizens”), acting as lender and Administrative Agent for the other lenders, entered into a credit agreement (the “New Credit Agreement”) providing for borrowings of up to the aggregate principal amount of $62.00 million. The New Credit Agreement is a senior secured credit facility and consists of a revolving line of credit of up to $30.00 million (the “New Revolver”) to the US Borrower, a $17.00 million principal amount Term Loan (the “US Term Loan”) to the US Borrower, and a $15.00 million principal amount Term Loan (the “CA Term Loan”) to the CA Borrower. In conjunction with the acquisition of Intasco, the Company's old senior credit facility, consisting of a term loan and a revolving line of credit, was repaid and terminated. On the date of termination of the old senior credit facility, $15.40 million outstanding principal amount was repaid on the term loan, and $17.30 million outstanding was repaid on the revolving line of credit.
On August 18, 2017, the US Borrower and the CA Borrower entered into the Second Amendment (the “Amendment”) to the New Credit Agreement, with Citizens, acting as syndication agent, and other lenders. The Amendment converted $4.0 million of outstanding borrowings under the New Revolver into an additional $4.0 million term loan to the US Borrower (the “US Term Loan II”). The conversion of a portion of the outstanding borrowings under the New Revolver did not reduce the aggregate amount available to be borrowed under it. This conversion increased our available borrowing amount.
29
Initial Public Offering
On July 7, 2015, we completed our initial public offering (the “IPO”) of 2,702,500 shares of common stock at a price to the public of $9.50 per share, including 352,500 shares subject to an over-allotment option granted to the underwriters. After underwriting discounts, commissions, and approximate fees and expenses of the offering, as set forth in our registration statement for the IPO on Form S-1, we received net IPO proceeds of approximately $22.2 million. We used part of these proceeds to repay the $13.1 million principal amount of our 16% senior subordinated note together with accrued interest through the date of payment. We used the remaining proceeds to temporarily reduce borrowings under the revolving line of credit portion of our senior secured credit facility. Amounts paid to reduce borrowings under the facility were available to be re-borrowed, subject to compliance with the terms of the facility. We also issued to the underwriters warrants to purchase up to 141,000 shares of common stock, as additional compensation in the IPO. The warrants are exercisable at a per share exercise price equal to 125% of the initial public offering price of $9.50 per share, and may be exercised commencing 1 year from the date of the IPO, until the date 5 years from the date of the IPO.
Acquisition of Great Lakes
On August 31, 2015, the Company acquired the business and substantially all of the assets of Great Lakes Foam Technologies, Inc. (“Great Lakes”), a Michigan based polyurethane manufacturer, for total net cash consideration of $11.95 million, with a portion being held in escrow to fund the obligations of Great Lakes and for its stockholders to indemnify Unique against certain claims, losses and liabilities.
Great Lakes manufactures components for application in a wide range of end-markets including the automotive, off-road vehicles, industrial equipment, medical and office equipment industries. Great Lakes is engaged in the manufacture of components from molded polyurethane, including components for automotive applications, industrial equipment, off-road vehicles, office furniture, medical applications and packaging. The Company believes that the acquisition will augment its existing product offerings and potentially enable it to access new customers and increase sales to certain of its existing customers.
Murfreesboro Facility Closure
On October 27, 2015, the Company announced its intention to close its manufacturing facility in Murfreesboro, Tennessee. The Company ceased operations at the Murfreesboro facility in January of 2016. Approximately 30 positions were eliminated as a result of the closing.
The Company's decision resulted from the tight labor market in Murfreesboro and the struggle to staff production levels to meet the ongoing growth strategy for the products manufactured at the plant. The Company evaluated whether or not this closing met the criteria for discontinued operations and concluded that the closing did not meet the definition as the closing did not represent a strategic shift in the Company's operations and the Company will have continuing cash flows from the production being moved to other facilities within the Company.
The Company provided employees severance pay, health benefits continuation and job search assistance. The Company incurred approximately $0.1 million in one-time employee termination costs and $0.3 million in other costs related to the closure, which primarily consists of moving existing production equipment from Murfreesboro to other Company facilities. The expenses were recorded to the restructuring expense line in continuing operations in the Company's statement of operations.The building qualified as held for sale, and was presented properly as such in the consolidated balance sheet as a current asset. On October 31, 2016, the Company sold the building and received net proceeds from the sale of $2.18 million resulting in a gain on the sale of $0.15 million.
Comparison of Results of Operations for the Fifty-Two Weeks Ended December 31, 2017 and the Fifty-Two Weeks Ended January 1, 2017
In 2016, we acquired substantially all of the assets of Intasco Corporation, a Canadian based tape manufacturer, for a purchase price of $21.03 million, net of cash acquired, at closing, with a portion being held in escrow to fund the obligations of Intasco Corporation and its stockholders to indemnify Unique against certain claims, losses and liabilities. On the same date, we purchased 100% of the outstanding capital stock of its U.S. subsidiary, Intasco USA, Inc., a United States based tape manufacturer, for a purchase price of $0.89 million paid by the issuance of 70,797 shares of the Company's common stock, par value $0.001 per share. The purchase price was paid with borrowings under a New Credit Facility which replaced the Company's existing facility. For the fifty-two weeks ended December 31, 2017, our financial results include the Intasco business for the entire period. For the fifty-two weeks ended January 1, 2017, our financial results include the transaction
30
related expenses from the acquisition and the results of operations of the Intasco business from Apri1 29, 2016 through January 1, 2017.
Fifty-Two Weeks Ended December 31, 2017 and Fifty-Two Weeks Ended January 1, 2017
Net Sales
Fifty-Two Weeks Ended December 31, 2017 | Fifty-Two Weeks Ended January 1, 2017 | ||||||
(in thousands) | |||||||
Net sales | $ | 175,288 | $ | 170,463 | |||
Net sales for the fifty-two weeks ended December 31, 2017 were approximately $175.29 million compared to $170.46 million for the fifty-two weeks ended January 1, 2017. The increase in net sales for the fifty-two weeks ended December 31, 2017 is attributable to our increased market penetration and content per vehicle and new product introductions, as well as a full 52 weeks of sales from the Intasco business. The acquisition occurred on April 29, 2016, and therefore only 35 weeks of Intasco sales are included for the fifty-two weeks ended January 1, 2017. This growth was partially offset by an approximately 4% overall decline in North American vehicle production during the fifty-two weeks ended December 31, 2017 period as compared to production during the fifty-two weeks ended January 1, 2017.
Cost of Sales
The major components of cost of sales are raw materials purchased from third parties, direct labor and benefits, and manufacturing overhead, including facility costs, utilities, supplies, repairs and maintenance, insurance, freight costs of products shipped to customers and depreciation.
Fifty-Two Weeks Ended December 31, 2017 | Fifty-Two Weeks Ended January 1, 2017 | ||||||
(in thousands) | |||||||
Materials | $ | 88,303 | $ | 86,893 | |||
Direct labor and benefits | 26,729 | 25,556 | |||||
Manufacturing overhead | 18,288 | 16,895 | |||||
Sub-total | 133,320 | 129,344 | |||||
Depreciation | 1,914 | 1,575 | |||||
Cost of sales | 135,234 | 130,919 | |||||
Gross Profit | $ | 40,054 | $ | 39,544 | |||
Cost of Sales as a Percent of Net Sales
Fifty-Two Weeks Ended December 31, 2017 | Fifty-Two Weeks Ended January 1, 2017 | ||||
Materials | 50.4 | % | 51.0 | % | |
Direct labor and benefits | 15.3 | % | 15.0 | % | |
Manufacturing overhead | 10.4 | % | 9.9 | % | |
Sub-total | 76.1 | % | 75.9 | % | |
Depreciation | 1.1 | % | 0.9 | % | |
Cost of Sales | 77.2 | % | 76.8 | % | |
Gross Profit | 22.8 | % | 23.2 | % | |
Cost of sales as a percentage of net sales for the fifty-two weeks ended December 31, 2017 increased to 77.2% from 76.8% for the fifty-two weeks ended January 1, 2017. The increase in cost of sales as a percentage of net sales was attributable to higher direct labor and benefits and manufacturing overhead as a percentage of net sales, partially offset by lower material costs as a percentage of net sales.
Material costs as a percentage of net sales decreased to 50.4% for the fifty-two weeks ended December 31, 2017 from 51.0% for the fifty-two weeks ended January 1, 2017. Material costs for the fifty-two weeks ended December 31, 2017 as a
31
percentage of net sales were lower compared to the fifty-two weeks ended January 1, 2017 primarily due to favorable product mix in the fifty-two weeks ended January 1, 2017, as well as increased costs in 2016 due to the amortization of the markup to fair market value of inventory acquired in the Intasco acquisition. Direct labor and benefit costs as a percentage of net sales was 15.3% for the fifty-two weeks ended December 31, 2017 compared to 15.0% for the fifty-two weeks ended January 1, 2017. Labor and benefit costs as a percentage of net sales in the fifty-two weeks ended December 31, 2017 were higher due to increased direct and temporary labor hours as a result of change in product mix, and a decline in the use of temporary employees at one of our facilities in Michigan as required under our collective bargaining agreement, resulting in an increase in benefit related costs during the fifty-two weeks ended December 31, 2017 when compared to the fifty-two weeks ended January 1, 2017. Manufacturing overhead costs as a percentage of net sales were 10.4% for the fifty-two weeks ended December 31, 2017 compared 9.9% for the fifty-two weeks ended January 1, 2017. Manufacturing overhead as a percentage of net sales in the fifty-two weeks ended December 31, 2017 were higher due primarily to higher rent costs, as we continued to add capacity in order to meet expected future demand, and increased indirect labor costs as we upgraded our staff and add production capabilities at some of our facilities. Depreciation costs as a percentage of net sales in the fifty-two weeks ended December 31, 2017 were also slightly higher than the fifty-two weeks ended January 1, 2017 as we added machine capacity, again to meet expected future demand, and to increase capabilities in certain of our facilities.
Gross Profit
As a result of the increase in cost of sales as a percentage of net sales described above, gross profit as a percentage of net sales for the fifty-two weeks ended December 31, 2017 decreased to 22.8% from 23.2% for the fifty-two weeks ended January 1, 2017.
Selling, General and Administrative Expenses (“SG&A”)
Fifty-Two Weeks Ended December 31, 2017 | Fifty-Two Weeks Ended January 1, 2017 | ||||||
(in thousands, except SG&A as a % of net sales) | |||||||
SG&A, exclusive of line items below | $ | 25,338 | $ | 22,730 | |||
Transaction expenses | 23 | 867 | |||||
Subtotal | 25,361 | 23,597 | |||||
Depreciation and amortization | 4,406 | 3,927 | |||||
SG&A | $ | 29,767 | $ | 27,524 | |||
SG&A as a % of net sales | 17.0 | % | 16.1 | % | |||
SG&A as a percentage of net sales for the fifty-two weeks ended December 31, 2017 increased to 17.0% from 16.1% for the fifty-two weeks ended January 1, 2017. The increase is primarily the result of one-time consulting and licensing costs associated with the implementation of our new ERP system in the fifty-two weeks ended December 31, 2017 compared to the fifty-two weeks ended January 1, 2017.
Operating Income
As a result of the foregoing factors, operating income for the fifty-two weeks ended December 31, 2017 was $10.29 million compared to operating income of $11.98 million for the fifty-two weeks ended January 1, 2017.
Non-Operating Expense
Non-operating expense for the fifty-two weeks ended December 31, 2017 was $2.67 million compared to $2.04 million for the fifty-two weeks ended January 1, 2017. The change in non-operating expense was primarily driven by interest expense. Interest expense was approximately $2.75 million for the fifty-two weeks ended December 31, 2017, compared to $2.13 million for the fifty-two weeks ended January 1, 2017. The increase in interest expense is primarily due to higher interest rates and a higher average outstanding debt balance in the fifty-two weeks ended December 31, 2017.
Income before Income Taxes
As a result of the foregoing factors, income before income taxes for the fifty-two weeks ended December 31, 2017 was $7.62 million, compared to $9.94 million for the fifty-two weeks ended January 1, 2017.
32
Income Tax Provision
For the fifty-two weeks ended December 31, 2017, income tax expense was $1.13 million, and the effective income tax rate was 14.9%. The difference between the actual effective rate and the statutory rate was mainly a result of the enactment of the Tax Cuts on Jobs Act on December 22, 2017, and research and development credits. These adjustments are further explained in Note 11. For the fifty-two weeks ended January 1, 2017, income tax expense was $3.26 million, and the effective income tax rate was 32.8%. The difference between the actual effective rate and the statutory rate was mainly a result of the domestic production activities deduction, or DPAD, in the U.S. The Company has deferred tax assets associated with timing differences between when an expense is recorded for book purposes versus when it is deductible for tax. The Company has considered evidence both supporting and not supporting the determination that the deferred tax assets are more likely than not to be realized, and has not recorded a tax valuation allowance as of December 31, 2017. The Company will continue to evaluate whether the deferred tax assets will be realizable, and if appropriate, will record a valuation allowance against these assets.
Net income
As a result of the increased net sales and changes in expenses discussed above, net income for the fifty-two weeks ended December 31, 2017 was $6.49 million compared to $6.68 million during the fifty-two weeks ended January 1, 2017.
Comparison of Results of Operations for the Fifty-Two Weeks Ended January 1, 2017 and the Fifty-Two Weeks Ended January 3, 2016
On April 29, 2016, the Canadian Buyer, a newly formed subsidiary of the Company, acquired the business and substantially all of the assets of Intasco Corporation, a Canadian based tape manufacturer, for a purchase price of $21.03 million, net of cash acquired, at closing, with a portion being held in escrow to fund the obligations of Intasco Corporation and its stockholders to indemnify Unique against certain claims, losses and liabilities. On the same date, the US Buyer, an existing subsidiary of the Company, purchased 100% of the outstanding capital stock of Intasco USA, Inc., a United States based tape manufacturer, for a purchase price of $0.89 million paid by the issuance of 70,797 shares of the Company's common stock, par value $0.001 per share. The purchase price was paid with borrowings under a New Credit Facility which replaced the Company's existing facility. For the fifty-two weeks ended January 1, 2017, our financial results include the transaction related expenses from the acquisition and the results of operations of the Intasco business from Apri1 29, 2016 through January 1, 2017.
On August 31, 2015, the Company acquired the business and substantially all of the assets of Great Lakes for a cash purchase price of $11.82 million. Following the closing, we made a payment to the seller of $0.13 million as a result of post-closing calculation of net working capital. For the fifty-two weeks ended January 1, 2017 our financial results include the results of operations of the Great Lakes business for the entire period and for the fifty-two weeks ended January 3, 2016, our financial results include the transaction-related expenses from the acquisition and the results of operations of the Great Lakes business from August 31, 2015 through January 3, 2016.
Fifty-Two Weeks Ended January 1, 2017 and Fifty-Two Weeks Ended January 3, 2016
Net Sales
Fifty-Two Weeks Ended January 1, 2017 | Fifty-Two Weeks Ended January 3, 2016 | ||||||
(in thousands) | |||||||
Net sales | $ | 170,463 | $ | 143,309 | |||
Net sales for the fifty-two weeks ended January 1, 2017 were approximately $170.46 million compared to $143.31 million for the fifty-two weeks ended January 3, 2016. The increase in net sales for the fifty-two weeks ended January 1, 2017 is attributable to our increased market penetration and content per vehicle and new product introductions, including approximately eight months of sales from the Intasco acquisition that occurred on April 29, 2016 included in the results for the fifty-two weeks ended January 3, 2016, and a full year of sales for the fifty-two weeks ended January 1, 2017, compared to eighteen weeks in the fifty-two weeks ended January 3, 2016, from the Great Lakes acquisition that occurred on August 31, 2015.
33
Cost of Sales
The major components of cost of sales are raw materials purchased from third parties, direct labor and benefits, and manufacturing overhead, including facility costs, utilities, supplies, repairs and maintenance, insurance, freight costs of products shipped to customers and depreciation.
Fifty-Two Weeks Ended January 1, 2017 | Fifty-Two Weeks Ended January 3, 2016 | ||||||
(in thousands) | |||||||
Materials | $ | 86,893 | $ | 73,682 | |||
Direct labor and benefits | 25,556 | 20,858 | |||||
Manufacturing overhead | 16,895 | 13,731 | |||||
Sub-total | 129,344 | 108,271 | |||||
Depreciation | 1,575 | 1,217 | |||||
Cost of sales | 130,919 | 109,488 | |||||
Gross Profit | $ | 39,544 | $ | 33,822 | |||
Cost of Sales as a Percent of Net Sales
Fifty-Two Weeks Ended January 1, 2017 | Fifty-Two Weeks Ended January 3, 2016 | ||||
Materials | 51.0 | % | 51.4 | % | |
Direct labor and benefits | 15.0 | % | 14.6 | % | |
Manufacturing overhead | 9.9 | % | 9.6 | % | |
Sub-total | 75.9 | % | 75.6 | % | |
Depreciation | 0.9 | % | 0.8 | % | |
Cost of Sales | 76.8 | % | 76.4 | % | |
Gross Profit | 23.2 | % | 23.6 | % | |
Cost of sales as a percentage of net sales for the fifty-two weeks ended January 1, 2017 increased to 75.9% from 75.6% for the fifty-two weeks ended January 3, 2016. The increase in cost of sales as a percentage of net sales was attributable to higher direct labor and benefits and manufacturing overhead as a percentage of net sales, partially offset by lower material costs as a percentage of net sales. Material costs as a percentage of net sales decreased to 51.0% for the fifty-two weeks ended January 1, 2017 from 51.4% for the fifty-two weeks ended January 3, 2016. Material costs for the fifty-two weeks ended January 1, 2017 as a percentage of net sales were lower compared to the fifty-two weeks ended January 3, 2016 primarily due to favorable product mix. Direct labor and benefit costs as a percentage of net sales was 15.0% for the fifty-two weeks ended January 1, 2017 compared to 14.6% for the fifty-two weeks ended January 3, 2016. Labor and benefit costs as a percentage of net sales in the fifty-two weeks ended January 1, 2017 were higher due to an increase in health insurance claims paid under our self-insured benefit plans, as well as an increase in direct and temporary labor hours as a result of a change in product mix, and the addition of manufacturing capabilities to some of our existing facilities. Manufacturing overhead costs as a percentage of net sales were 9.9% for the fifty-two weeks ended January 1, 2017 compared 9.6% for the fifty-two weeks ended January 3, 2016. Manufacturing overhead as a percentage of net sales in the fifty-two weeks ended January 1, 2017 were higher due primarily to higher rent costs as we added capacity in order to meet expected future demand, and increased indirect labor costs as we upgraded our staff. Depreciation costs as a percentage of net sales in the fifty-two weeks ended January 1, 2017 were also slightly higher than for the year ended January 3, 2016 as we added machine capacity, again to meet expected future demand, and to increase capabilities in certain of our facilities.
Gross Profit
As a result of the increase in cost of sales as a percentage of net sales described above, gross profit as a percentage of net sales for the fifty-two weeks ended January 1, 2017 decreased to 23.2% from 23.6% for the fifty-two weeks ended January 3, 2016.
34
Selling, General and Administrative Expenses
Fifty-Two Weeks Ended January 1, 2017 | Fifty-Two Weeks Ended January 3, 2016 | ||||||
(in thousands, except SG&A as a % of net sales) | |||||||
SG&A, exclusive of line items below | $ | 22,730 | $ | 20,264 | |||
Transaction expenses | 867 | 422 | |||||
Subtotal | 23,597 | 20,686 | |||||
Depreciation and amortization | 3,927 | 2,686 | |||||
SG&A | $ | 27,524 | $ | 23,372 | |||
SG&A as a % of net sales | 16.1 | % | 16.3 | % | |||
SG&A as a percentage of net sales for the fifty-two weeks ended January 1, 2017 decreased to 16.1% from 16.3% for the fifty-two weeks ended January 3, 2016. The decrease is primarily related to the Company effectively leveraging its cost structure as fixed costs in SG&A represent a lower percentage of overall net sales in the fifty-two weeks ended January 1, 2017 compared to the fifty-two weeks ended January 3, 2016. This decrease was partially offset by higher transaction costs related to the Intasco acquisition in April of 2016, as well as by an increase in health insurance claims paid under our self-insured benefit plans.
Restructuring Expenses
Fifty-Two Weeks Ended January 1, 2017 | Fifty-Two Weeks Ended January 3, 2016 | ||||||
(in thousands) | |||||||
Restructuring expenses | $ | 35 | $ | 374 | |||
Restructuring expenses for the fifty-two weeks ended January 1, 2017 were $0.04 million compared to $0.38 million for the fifty-two weeks ended January 3, 2016. The restructuring expenses were all related to the closure of the Murfreesboro facility which was announced in October 2015. Most expenses related to the closure were incurred in the fifty-two weeks ended January 3, 2016.
Operating Income
As a result of the foregoing factors, operating income for the fifty-two weeks ended January 1, 2017 was $11.98 million compared to operating income of $10.08 million for the fifty-two weeks ended January 3, 2016.
Non-Operating Expense
Non-operating expense for the fifty-two weeks ended January 1, 2017 was $2.04 million compared to $2.73 million for the fifty-two weeks ended January 3, 2016. The change in non-operating expense was primarily driven by interest expense. Interest expense was approximately $2.13 million for the fifty-two weeks ended January 1, 2017, compared to $2.76 million for the fifty-two weeks ended January 3, 2016. The decline in interest expense was primarily due to the retirement of our 16% subordinated debt with the proceeds of our IPO in July of 2015, offset by higher interest expense on borrowings under our bank debt due to the refinancing of our bank debt as part of the Intasco acquisition on April 29, 2016. Borrowings to finance the acquisition resulted in a higher average principal balance in our outstanding debt in the fifty-two weeks ended January 1, 2017, as well as higher interest rates.
Income before Income Taxes
As a result of the foregoing factors, income before income taxes for the fifty-two weeks ended January 1, 2017 was $9.94 million, compared to $7.34 million for the fifty-two weeks ended January 3, 2016.
Income Tax Provision
For the fifty-two weeks ended January 1, 2017, income tax expense was $3.26 million, and the effective income tax rate was 32.8%. The difference between the actual effective rate and the statutory rate was mainly a result of the domestic production activities deduction, or DPAD, in the U.S. During the fifty-two weeks ended January 3, 2016, income tax expense
35
was $2.31 million, and the effective income tax rate was 31.5%. The difference between the actual effective rate and the statutory rate was also a result of DPAD in the U.S. The Company has deferred tax assets associated with timing differences between when an expense is recorded for book purposes versus when it is deductible for tax. The Company has considered evidence both supporting and not supporting the determination that the deferred tax assets are more likely than not to be realized, and has not recorded a tax valuation allowance as of January 1, 2017. The Company will continue to evaluate whether the deferred tax assets will be realizable, and if appropriate, will record a valuation allowance against these assets.
Net income
As a result of the increased net sales and changes in expenses discussed above, net income for the fifty-two weeks ended January 1, 2017 was $6.68 million compared to $5.03 million during the fifty-two weeks ended January 3, 2016.
Non-GAAP Financial Measures
Adjusted EBITDA
We present Adjusted EBITDA (defined below), a measure that is not in accordance with generally accepted accounting principles in the United States of America (non-GAAP), in this document to provide investors with a supplemental measure of our operating performance. We believe that Adjusted EBITDA is a useful performance measure and it is used by us to facilitate a comparison of our operating performance on a consistent basis from period-to-period and to provide for a more complete understanding of factors and trends affecting our business than measures under GAAP can provide alone. Our board and management also use Adjusted EBITDA as one of the primary methods for planning and forecasting overall expected performance and for evaluating on a quarterly and annual basis actual results against such expectations, and as a performance evaluation metric in determining achievement of certain compensation programs and plans for company management. In addition, the financial covenants in our new credit facility are based on Adjusted EBITDA, subject to dollar limitations on certain adjustments.
We define “Adjusted EBITDA” as earnings before interest expense, income taxes, depreciation and amortization expense, non-cash stock awards, non-recurring integration expense, non-cash stock awards, non-recurring step-up of inventory basis to fair market value, non-recurring IPO costs, transaction fees related to our acquisitions, restructuring expenses, a one-time gain on the sale of a building, and one-time consulting and licensing ERP system implementation costs as we implement a new ERP system at all locations. We believe omitting these items provides a financial measure that facilitates comparisons of our results of operations with those of companies having different capital structures. Since the levels of indebtedness and tax structures that other companies have are different from ours, we omit these amounts to facilitate investors’ ability to make these comparisons. Similarly, we omit depreciation and amortization because other companies may employ a greater or lesser amount of property and intangible assets. We believe that investors, analysts and other interested parties view our ability to generate Adjusted EBITDA as an important measure of our operating performance and that of other companies in our industry. Adjusted EBITDA should not be considered as an alternative to net income for the periods indicated as a measure of our performance. Other companies in our industry may calculate Adjusted EBITDA differently than we do, limiting its usefulness as a comparative measure.
The use of Adjusted EBITDA has limitations as an analytical tool, and you should not consider this performance measure in isolation from, or as an alternative to, GAAP measures such as net income. Adjusted EBITDA is not a measure of liquidity under GAAP or otherwise, and is not an alternative to cash flow from continuing operating activities. Our presentation of Adjusted EBITDA should not be construed as an inference that our future results will be unaffected by the expenses that are excluded from that term or by unusual or non-recurring items. The limitations of Adjusted EBITDA include that: (1) it does not reflect our cash expenditures or future requirements for capital expenditures or contractual commitments; (2) it does not reflect changes in, or cash requirements for, our working capital needs; (3) it does not reflect income tax payments we may be required to make; and (4) it does not reflect the cash requirements necessary to service interest or principal payments associated with indebtedness.
To properly and prudently evaluate our business, we encourage you to review our audited consolidated financial statements included elsewhere in this Annual Report on Form 10-K, and the reconciliation to Adjusted EBITDA from net income, the most directly comparable financial measure presented in accordance with GAAP, set forth in the following table. All of the items included in the reconciliation from net income to Adjusted EBITDA are either (1) non-cash items or (2) items that management does not consider in assessing our on-going operating performance. In the case of the non-cash items, management believes that investors may find it useful to assess our comparative operating performance because the measures without such items are less susceptible to variances in actual performance resulting from depreciation, amortization and other non-cash charges and more reflective of other factors that affect operating performance. In the case of the other items that management does not
36
consider in assessing our on-going operating performance, management believes that investors may find it useful to assess our operating performance if the measures are presented without these items because their financial impact may not reflect on-going operating performance.
Fifty-Two Weeks Ended December 31, 2017 | Fifty-Two Weeks Ended January 1, 2017 | Fifty-Two Weeks Ended January 3, 2016 | |||||||||
(in thousands) | |||||||||||
Net income | $ | 6,487 | $ | 6,684 | $ | 5,029 | |||||
Plus: Interest expense, net | 2,746 | 2,135 | 2,755 | ||||||||
Plus: Income tax expense | 1,133 | 3,258 | 2,314 | ||||||||
Plus: Depreciation and amortization | 6,320 | 5,502 | 3,903 | ||||||||
Plus: Non-cash stock award | 150 | 166 | 206 | ||||||||
Plus: Non-recurring integration expenses | 158 | 173 | 87 | ||||||||
Plus: Non-recurring step-up of inventory basis to fair market value | — | 318 | 146 | ||||||||
Plus: Non-recurring IPO costs | — | — | 230 | ||||||||
Plus: Transaction fees | 23 | 867 | 546 | ||||||||
Plus: Restructuring expenses | — | 35 | 374 | ||||||||
Plus: One-time consulting and licensing ERP system implementation costs | 1,015 | — | — | ||||||||
Less: Gain on sale of building | — | (147 | ) | — | |||||||
Adjusted EBITDA | $ | 18,032 | $ | 18,991 | $ | 15,590 | |||||
Liquidity and Capital Resources
Our principal sources of liquidity are cash flow from operations and borrowings under our New Credit Agreement from our senior lenders.
Our primary uses of cash are payment of vendors, payroll, operating costs, capital expenditures and debt service. As of December 31, 2017, January 1, 2017 and January 3, 2016, we had a cash balance of $1.43 million, $0.71 million and $0.73 million, respectively. Our excess cash balance is swept daily and applied to reduce borrowings under our revolving line of credit, which remains available for re-borrowing, as needed, subject to compliance with the terms of the facility. As of December 31, 2017, January 1, 2017 and January 3, 2016, we had $7.19 million, $9.42 million and $10.11 million, respectively, available for borrowing under our current credit facility and our old credit facility, respectively, subject, in each case, to borrowing base restrictions, compliance with the terms of the facility and outstanding letters of credit. At each such date, we were in compliance with all debt covenants under such facilities. We believe that our sources of liquidity, including cash flow from operations, existing cash and our revolving credit facility are sufficient to meet our projected cash requirements for at least the next fifty-two weeks.
Subsequent to the closing of our IPO, we used proceeds remaining after paying the 16% senior subordinated note to temporarily reduce the outstanding balance on our then revolving line of credit. We then financed the acquisition of Great Lakes on August 31, 2015 with borrowings under our then revolving line of credit. We also financed the acquisition of Intasco, on April 29, 2016, with borrowings under our $62.00 million New Credit Agreement.
In 2018, we plan to spend approximately $5.50 million in capital expenditures, primarily to add new production equipment as we expand our production capabilities, upgrade existing equipment, and improve our information technology software and hardware throughout our facilities.
While we believe we have sufficient liquidity and capital resources to meet our current operating requirements and planned capital expenditures, we may elect to pursue additional growth opportunities that could require additional debt or equity financing. If we are unable to secure additional financing at favorable terms in order to pursue such additional growth opportunities, our ability to pursue such opportunities could be materially adversely affected.
37
Dividends
Our payment of dividends on our common stock in the future will be determined by our board of directors in its sole discretion and will depend on business conditions, our financial condition, earnings, liquidity and capital requirements. Our New Credit Agreement contains financial covenants which may have the effect of precluding or limiting the amounts that we can pay as dividends.
The following table presents cash flow data for the periods indicated.
Fifty-Two Weeks Ended December 31, 2017 | Fifty-Two Weeks Ended January 1, 2017 | Fifty-Two Weeks Ended January 3, 2016 | |||||||||
(in thousands) | |||||||||||
Cash flow data | |||||||||||
Cash flow provided by (used in): | |||||||||||
Operating activities | $ | 7,809 | $ | 7,761 | $ | 5,081 | |||||
Investing activities | (4,088 | ) | (21,993 | ) | (15,439 | ) | |||||
Financing activities | (2,995 | ) | 14,210 | 10,329 | |||||||
Operating Activities
Cash provided by operating activities consists of net income adjusted for non-cash items, including depreciation and amortization; amortization of debt issuance costs; gain or loss on sale of assets; gain or loss on extinguishments of debt; gain or loss on derivative instruments; bad debt adjustments; stock option expense; changes in deferred income taxes; accrued and other liabilities; prepaid expenses and other assets; and the effect of working capital changes. The primary drivers of cash inflows and outflows are accounts receivable, inventory, prepaid expenses and other assets, accounts payable and accrued interest.
During the fifty-two weeks ended December 31, 2017, net cash provided by operating activities was $7.81 million, compared to cash provided by operating activities of $7.76 million and $5.08 million for the fifty-two weeks ended January 1, 2017 and January 3, 2016, respectively.
Net cash provided by operating activities for the fifty-two weeks ended December 31, 2017 was impacted by net income excluding depreciation and amortization partially offset by working capital changes.
The net cash provided by operating activities for the fifty-two weeks ended January 1, 2017 was mainly impacted by net income of $6.68 million resulting from the expansion of our operations through the acquisition of Intasco and the inclusion of Great Lakes operations for the entire fiscal year and by decreases in inventory, as we sold inventory built up at the end of 2015.
The net cash provided by operating activities for the fifty-two weeks ended January 3, 2016 was mainly impacted by net income of $5.03 million.
Investing Activities
Cash used in investing activities consists principally of business acquisitions and purchases of property, plant and equipment.
In the fifty-two weeks ended December 31, 2017, we made capital expenditures of $4.14 million.
In the fifty-two weeks ended January 1, 2017, we acquired Intasco for a purchase price, net of cash acquired, of $21.03 million. We also made capital expenditures of $3.36 million during 2016. These outflows were partially offset by the $2.18 million we received from the sale of the Murfreesboro building in October 2016.
In the fifty-two weeks ended January 3, 2016, we paid $11.82 million in cash to acquire the Great Lakes business. We also made capital expenditures of $3.57 million during 2015, of which $1.84 million was related to the construction of a new facility in Georgia.
38
Financing Activities
Cash flows (used in) provided by financing activities consisted primarily of borrowings and payments under our new and old senior credit facility, payment of debt issuance costs, proceeds from the sale of sale of stock, the repayment of our 16% subordinated debt through refinancing proceeds received from our IPO, payment of IPO costs, and distribution of cash dividends.
In the fifty-two weeks ended December 31, 2017, we had outflows of $3.00 million primarily due to $3.37 million of mandatory pay-off of the principal amount of our term loans under our new senior credit facility, and $5.85 million for payments of cash dividends. These outflows were partially offset by $6.23 million net proceeds from borrowings under our revolving line of credit under our new senior secured credit facility.
As of December 31, 2017, $22.71 million was outstanding under the new revolving credit facility, gross of debt issuance costs. Borrowings under the new revolving credit facility are subject to a borrowing base which is reduced to the extent of letters of credit issued under the new senior credit facility. As of December 31, 2017, the maximum additional available borrowings under the new revolving credit facility was $7.19 million. Amounts repaid under the new revolving credit facility will be available to be re-borrowed, subject to borrowing base restrictions and compliance with the terms of the facility.
In the fifty-two weeks ended January 1, 2017, we had inflows of $14.21 million primarily due to $32.00 million of gross proceeds from borrowings under our term loans under our new senior credit facility, and $5.69 million net proceeds from borrowings under our revolving line of credit under our new senior credit facility. These inflows were partially offset by $15.38 million used to retire the principal amount of our term loan under our old senior credit facility and $5.81 million for payments of cash dividends.
In the fifty-two weeks ended January 3, 2016, we had inflows of $10.33 million primarily due to $25.67 million of gross proceeds we received in the IPO, as well as $5.83 million of net proceeds from borrowings under our old revolving credit facility. These amounts were partially offset by $15.15 million of payments on debt, including $13.1 million paid to retire our 16% senior subordinated note from proceeds received from the IPO. Other outflows included $3.45 million due to expenses for the completed IPO, $0.75 million for post acquisition payments we made in regards to the 2013 Unique Fabricating acquisition, and outflows of $2.88 million on payments of cash dividends.
New Credit Agreement
On April 29, 2016, the US Borrower and the CA Borrower and Citizens, acting as lender and Administrative Agent for the other lenders, entered into the New Credit Agreement providing for borrowings of up to the aggregate principal amount of $62.00 million. The New Credit Agreement is a senior secured credit facility and consists of a revolving line of credit of up to $30.00 million to the US Borrower, a $17.00 million principal amount term loan to the US Borrower, and a $15.00 million principal term loan to the CA Borrower. The borrowings were used to finance the acquisition of Intasco, including working capital adjustments and amounts paid into escrow, plus to repay the Company’s existing senior credit facility, which was terminated as noted below.
On August 18, 2017, the US Borrower and the CA Borrower entered into the Second Amendment (the “Amendment”) to the New Credit Agreement, with Citizens, acting as syndication agent, and the other lenders. The Amendment converted $4.00 million of outstanding borrowings under the New Revolver under the New Credit Agreement into an additional $4.00 million term loan to the US Borrower (the “US Term Loan II”). The conversion of a portion of the outstanding borrowings under the New Revolver did not reduce the aggregate amount available to be borrowed under it.
The New Revolver, US Term Loan, US Term Loan II, and CA Term Loan all mature on April 28, 2021 and bear interest at the Company's election of either (i) the greater of the Prime Rate or the Federal Funds Effective Rate (the “Base Rate”) or ii) the LIBOR rate plus an applicable margin ranging from 1.75% to 2.50% in the case of the Base Rate and 2.75% to 3.50% in the case of the LIBOR rate, in each case, based on senior leverage ratio thresholds measured quarterly. The effective interest rate on all of our borrowings under the New Credit Agreement as of December 31, 2017 was 5.069% per annum.
In addition, the New Credit Agreement allows for increases in the principal amount of the New Revolver and US and CA Term Loans not to exceed $10.00 million principal amount, in the aggregate, provided that before and after giving effect to any proposed increase (and any transactions to be consummated using proceeds of the increase), the total leverage and debt service coverage ratios do not exceed specified amounts. The New Credit Agreement also provides for the issuance of letters of credit with a face amount of up to $2.00 million, in the aggregate, provided that any letter of credit issued will reduce availability under the New Revolver.
39
We are permitted to prepay in part or in full the amounts due under the New Credit Agreement without penalty, provided that with respect to prepayment of the New Revolver at least $0.10 million remains outstanding. Our obligations under the New Credit Agreement may be accelerated upon the occurrence of an event of default, which include customary events for a financing arrangement of this type, including, without limitation, payment defaults, defaults in the performance of affirmative or negative covenants (including financial ratio maintenance requirements), bankruptcy or related defaults, defaults on certain other indebtedness, the material inaccuracy of representations or warranties, material adverse changes, and changes related to ownership of the US Borrower or Unique Fabricating, Inc. In the event of an event of default, the interest rate on the New Revolver and US Term Loan and CA Term Loan will increase by 3.0% per annum plus the then applicable rate. The New Credit Agreement requires that we repay both the US Term Loan and CA Term Loan principal annually in an amount equal to 25% of excess cash flow, as defined, for the year ended January 1, 2017 and for each subsequent fiscal year until the total leverage ratio, as defined, calculated as of the end of such year is less than 2:00 to 1:00. Additionally, the US Term Loan and CA Term Loan contains a clause, effective January 1, 2017, that requires an excess cash flow payment to be made if the Company’s cash flow exceeds certain thresholds as defined by the New Credit Agreement and certain performance thresholds are not met. The Company made a payment in the second quarter of 2017 in the amount of $0.57 million on the US Term Loan.
The Company entered into an amendment to allow for the sale by the US Borrower and its domestic subsidiaries of accounts receivable, pursuant to agreements in form and content satisfactory to the Administrative Agent, in an aggregate amount of not more than $3,000,000 in any calendar month. To date, we have not sold any receivables and there are currently no plans to do so.
The US Borrower's obligations under the New Credit Agreement are guaranteed by each of its United States subsidiaries and by Unique Fabricating, Inc. and secured by a first priority security interest in all tangible and intangible assets, including a pledge of capital stock of the United States subsidiaries of the US Borrower and of 65% of the capital stock of the CA Borrower, and by mortgages on our facilities in LaFayette, Georgia, Louisville, Kentucky, Evansville, Indiana, and Fort Smith, Arkansas. The US Borrower guarantees all of the obligations and liabilities of the CA Borrower. Unique Fabricating, Inc. also pledged all of the capital stock of the US Borrower.
Effective June 30, 2016, as required under the New Credit Agreement, the Company purchased a derivative financial instrument, in the form of an interest rate swap, for the purpose of hedging certain identifiable transactions in order to mitigate risks related to cash flow variability caused by interest rate fluctuations. The Company has elected not to apply hedge accounting for financial reporting purposes. The interest rate swap requires the Company to pay a fixed rate of 1.055% per annum, while receiving a variable rate of one-month LIBOR for a net monthly settlement based on the notional amount in effect. The notional amount at the effective date began at $16.68 million and decreases by $0.32 million each quarter until June 30, 2017, when it then begins decreasing by $0.43 million per quarter until June 29, 2018, when it begins decreasing by $0.53 million until it expires on June 28, 2019. The interest rate swap is recognized at its fair value. Monthly settlement payments due on the interest rate swap and changes in its fair value are recognized as interest expense in the period incurred. Please see Note 7 of our consolidated financial statements for further information.
Effective October 2, 2017, as required under the Second Amendment to the New Credit Agreement, as discussed in Note 7 of our consolidated financial statements, the Company entered into another interest rate swap that requires the Company to pay a fixed rate of 1.093% percent per annum while receiving a variable interest rate per annum based on one month LIBOR for a net monthly settlement based on the notional amount in effect. The notional amount at the effective date was $1.90 million which decreases by $0.10 million each quarter until it expires on September 30, 2020. The interest rate swap is recognized at its fair value, and monthly settlement payments due on the interest rate swap and changes in its fair value are recognized as interest expense in the period incurred. The Company has elected not to apply hedge accounting for financial reporting purposes
We must comply with a minimum debt service financial covenant and a senior funded indebtedness to EBITDA covenant, as defined. As of December 31, 2017, we were in compliance with all loan covenants.
The New Credit Agreement also contains customary affirmative covenants, including: (1) maintenance of legal existence and compliance with laws and regulations; (2) delivery of consolidated financial statements and other information; (3) maintenance of properties in good working order; (4) payment of taxes; (5) delivery of notices of defaults, litigation, ERISA events and material adverse changes; (6) maintenance of adequate insurance; and (7) inspection of books and records.
The New Credit Agreement contains customary negative covenants, including restrictions on: (1) the incurrence of additional debt; (2) liens and saleleaseback transactions; (3) loans and investments; (4) guarantees and hedging agreements; (5) the sale, transfer or disposition of assets and businesses, or the merger or consolidation with or into another entity; (6) dividends on, and redemptions of, equity interests and other restricted payments, including dividends and distributions to Unique Fabricating, Inc. by its subsidiaries; (7) transactions with affiliates; (8) changes in the business conducted by us; (9)
40
payment or amendment of subordinated debt and amendment of organizational documents; and (10) capital expenditures. The New Credit Agreement prohibits the payment of any dividend, redemption or other payment or distribution by the Borrowers other than distributions to the US Borrower by its subsidiaries, unless after giving effect to the dividend or other distribution, the post distribution DSCR, as defined, is greater than 1.1 to 1.0, and Borrowers remain in compliance with the other financial covenants.
Old Senior Credit Facility
Until April 29, 2016, we maintained a senior credit facility with Citizens Bank, National Association pursuant to which we could borrow up to $25.00 million under a revolving line of credit and up to $20.00 million under a term loan. The borrower under the facility was Unique Fabricating NA, Inc., and borrowings were guaranteed by Unique Fabricating, Inc. and each of our subsidiaries. The term loan bore interest at the LIBOR rate for a period equal to one month, plus 3.0% to 3.5% per annum. The term loan would have matured in December 2017. The revolver bore interest at the LIBOR rate plus an applicable margin ranging from 2.75% to 3.25%. The half percent range per annum on the term loan and revolver was determined quarterly based on the senior leverage ratio. We were permitted to prepay in part or in full amounts due under the senior credit facility without penalty.The senior credit facility required that we repay term loan principal annually in an amount equal to 25% of excess cash flow, as defined, for the year ended January 3, 2016 and for each subsequent fiscal year until the total leverage ratio, as defined, calculated as of the end of each year is less than 2:00 to 1:00.
On April 29, 2016, in conjunction with the acquisition of Intasco, the old senior credit facility was repaid and terminated and replaced with a new senior credit facility which is described above. On the date of termination of the old senior credit facility, $15.38 million outstanding was repaid on the term loan, and $17.26 million outstanding was repaid on the revolver.
Off Balance Sheet Arrangements
We do not have any off balance sheet arrangements that have or are reasonably likely to have a current or future effect on our financial condition, changes in financial condition, sales or expenses, results of operations, liquidity or capital expenditures, or capital resources that are material to an investment in our securities.
Indemnification Agreements
In the normal course of business, we provide customers with indemnification provisions of varying scope against claims of intellectual property infringement by third parties arising from the use of our products. Historically, costs related to these indemnification provisions have not been significant and we are unable to estimate the maximum potential impact of these indemnification provisions on our future results of operations. In addition, we have entered into indemnification agreements with directors and certain officers and employees that will require us, among other things, to indemnify them against certain liabilities that may arise by reason of their status or service as directors, officers or employees. No demands have been made upon us to provide indemnification under such agreements and there are no claims that we are aware of that could have a material effect on our consolidated balance sheets, consolidated statements of operations, consolidated statements of stockholders’ equity or consolidated cash flows.
Contractual Obligations and Commitments
The following table summarizes our future minimum payments under contractual commitments as of December 31, 2017:
Payments Due by Period | |||||||||||||||||||
Contractual Obligations | Total | Less than 1 year | 1-3 years | 3-5 years | More than 5 years | ||||||||||||||
Operating leases | $ | 6,318 | $ | 2,252 | $ | 3,179 | $ | 887 | $ | — | |||||||||
Long-term debt (1) | 54,039 | 3,800 | 9,900 | 40,339 | — | ||||||||||||||
Management services agreement (2) | 1,125 | 225 | 450 | 450 | — | ||||||||||||||
(1) Excludes interest expense. The Company does not include interest expense as the majority of debt the Company has, as discussed in Note 6 to our consolidated financial statements, is based on variable interest rates. The Company cannot predict future interest expense amounts, but firmly believes it will have adequate cash to meet required interest related obligations.
(2) Assumes the extension of the management services agreement which currently terminates in 2018. Amounts do not include additional payments that may be earned in connection with transactions.
41
The contractual commitment amounts in the table above are associated with agreements that are enforceable and legally binding. Obligations under contracts that we can cancel without a significant penalty are not included in the table above.
Critical Accounting Policies and Estimates
Our discussion and analysis of our financial condition and results of operations is based upon our consolidated financial statements which have been prepared in accordance with GAAP. The preparation of these consolidated financial statements requires us to make estimates and judgments that affect amounts reported in those statements. We have made our best estimates of certain amounts contained in our consolidated financial statements. We base our estimates on historical experience and on various other assumptions that we believe are reasonable under the circumstances, the results of which form the basis for making judgments about the carrying value of assets and liabilities. However, application of our accounting policies involves the exercise of judgment and use of assumptions as to future uncertainties and, as a result, actual results could differ materially from these estimates. Management believes that the estimates, assumptions, and judgments involved in the accounting policies described below have the most significant impact on our consolidated financial statements.
Acquisitions
In accordance with accounting guidance for the provisions in Financial Accounting Standards Board Accounting Standards Codification 805, Business Combinations, we allocate the purchase price of an acquired business to its identifiable assets and liabilities based on estimated fair values. The excess of the purchase price over the amount allocated to the assets and liabilities, if any, is recorded as goodwill.
We use all available information to estimate fair values. We typically engage outside appraisal firms to assist in the fair value determination of identifiable intangible assets and any other significant assets or liabilities. We adjust the preliminary purchase price allocation, as necessary, up to one year after the acquisition closing date as we obtain more information regarding asset valuations and liabilities assumed.
Our purchase price allocation methodology contains uncertainties because it requires management to make assumptions and to apply judgment to estimate the fair value of acquired assets and liabilities. Management estimates the fair value of assets and liabilities based upon quoted market prices, the carrying value of the acquired assets and widely accepted valuation techniques, including discounted cash flows and market multiple analyses. Unanticipated events or circumstances may occur which could affect the accuracy of our fair value estimates, including assumptions regarding industry economic factors and business strategies.
Other estimates used in determining fair value include, but are not limited to, future cash flows or income related to intangibles, market rate assumptions and appropriate discount rates. Our estimates of fair value are based upon assumptions believed to be reasonable, but that are inherently uncertain, and therefore, may not be realized. Accordingly, there can be no assurance that the estimates, assumptions, and values reflected in the valuations will be realized, and actual results could vary materially.
Revenue Recognition
Revenue is recognized by the Company upon shipment to customers when the customer takes ownership and assumes the risk of loss, collection of the relevant receivable is probable, persuasive evidence of an arrangement exists, and the sale price is fixed and determinable. Provisions for discounts and rebates to customers, estimated returns and allowances, and other adjustments are provided for in the same period the related sales are recorded.
Stock Based Compensation
The Company accounts for its stock based compensation using the fair value of the award estimated at the grant date of the award. The Company estimates the fair value of awards, consisting of stock options, using the Black Scholes option pricing model. Compensation expense is recognized in earnings using the straight line method over the vesting period, which represents the requisite service period.
Accounts Receivable Allowance
Establishing valuation allowances for doubtful accounts requires the use of estimates and judgment in regard to the risk exposure and ultimate realization. The allowance for doubtful accounts is established based upon analysis of trade receivables for known collectability issues, including bankruptcies, and aging of receivables at the end of each period. Changes to our
42
assumptions could materially affect our recorded allowance. Also, while the Company has a large customer base that is geographically dispersed, certain customers are significant and a general economic downturn could result in higher than expected defaults and, therefore, the need to revise the estimates for bad debts.
Inventory
Inventories are valued at lower of cost or market, using the first-in, first-out (FIFO) method. Inventory includes the cost of materials, labor, and overhead. Abnormal amounts of idle facility expense, freight in, handling costs and spoilage are recognized as current period charges. Overhead is allocated to inventory based upon normal capacity at the production facility.
Goodwill
We review our goodwill for impairment annually during the fourth quarter, or whenever adverse events or changes in circumstances indicate a possible impairment. If it is determined that it is more likely than not that the fair value is greater than the carrying value of a reporting unit then a qualitative assessment may be used for the annual impairment test. Otherwise, a one-step process is used which requires estimating the fair value of each reporting unit compared to its carrying value. If the carrying value exceeds the estimated fair value, goodwill impairment will be the amount by which a reporting unit’s carrying value exceeds its fair value, not to exceed the carrying amount of goodwill.
The determination of the fair value of the reporting unit and corresponding goodwill require us to make significant judgments and estimates. These assumptions require significant judgment and are subject to a considerable degree of uncertainty. We believe that the assumptions and estimates in our review of goodwill for impairment are reasonable. However, different assumptions could materially affect our conclusions on this matter. Currently, the reporting unit is not at risk of impairment.
Impairment and Amortization of Long-Lived and Intangible Assets
Our identifiable intangible assets are amortized on a straight line basis, which approximates the pattern in which the economic benefit of the respective intangible is realized, over their respective estimated useful lives. The remaining useful lives of intangible assets are reviewed annually to determine whether events and circumstances warrant a revision to the remaining period of amortization. Our long-lived assets and intangible assets subject to amortization are reviewed for impairment whenever adverse events or changes in circumstances indicate that the related carrying amount may be impaired. An impairment loss is recognized when the carrying value of a long-lived asset exceeds its fair value. Significant judgments and estimates are used by management when evaluating long-lived assets for impairment. If management used different estimates and assumptions in its impairment tests, then the Company could recognize different amounts of expense over future periods.
Income Taxes
Deferred tax assets and liabilities reflect temporary differences between the amount of assets and liabilities for financial and tax reporting purposes. Such amounts are adjusted, as appropriate, to reflect changes in tax rates expected to be in effect when the temporary differences reverse. A valuation allowance is recorded to reduce our deferred tax assets to the amount that is more likely than not to be realized. Changes in tax laws or accounting standards and methods may affect recorded deferred taxes in future periods.
When establishing a valuation allowance, we consider future sources of taxable income such as “future reversals of existing taxable temporary differences, future taxable income exclusive of reversing temporary differences and carryforwards” and “tax planning strategies.” A tax planning strategy is defined as “an action that: is prudent and feasible; an enterprise ordinarily might not take, but would take to prevent an operating loss or tax credit carryforward from expiring unused; and would result in realization of deferred tax assets.” In the event we determine it is more likely than not that the deferred tax assets will not be realized in the future, the valuation adjustment to the deferred tax assets will be charged to earnings in the period in which we make such a determination. The valuation of deferred tax assets requires judgment and accounting for the deferred tax effect of events that have been recorded in the financial statements or in tax returns and our future projected profitability. Changes in our estimates, due to unforeseen events or otherwise, could have a material impact on our financial condition and results of operations.
We calculate our current and deferred tax provision based on estimates and assumptions that could differ from the actual results reflected in income tax returns filed in subsequent years. Adjustments based on filed returns are recorded when identified. The amount of income taxes we pay is subject to audits by federal, state and foreign tax authorities. Our estimate of the potential outcome of any uncertain tax issue is subject to management’s assessment of relevant risks, facts, and circumstances existing at that time. We use a more-likely-than-not threshold for financial statement recognition and
43
measurement of tax positions taken or expected to be taken in a tax return. We record a liability for the difference between the benefit recognized and measured and tax position taken or expected to be taken on our tax return. To the extent that our assessment of such tax positions changes, the change in estimate is recorded in the period in which the determination is made. We report tax-related interest and penalties as a component of income tax expense. We do not believe there is a reasonable likelihood that there will be a material change in the tax related balances or valuation allowance balances. However, due to the complexity of some of these uncertainties, the ultimate resolution may be materially different from the current estimate.
Recently Issued Accounting Pronouncements
Refer to Note 1 to the consolidated financial statements in Part II Item 8 of this Annual Report on Form 10-K.
44
ITEM 7A. QUANTITATIVE AND QUALITATIVE DISCLOSURES ABOUT MARKET RISK
We have operations both within the United States and internationally, and we are exposed to market risks in the ordinary course of our business. These risks primarily include interest rate and foreign exchange risks.
Interest Rate Fluctuation Risk
Our borrowings under our New Credit Agreement bear interest at fluctuating rates. In order to mitigate, in part, the potential effects of the fluctuating rates, effective June 30, 2016, we entered into a interest rate swap with a notional amount initially of $16.68 million, which decreased by $0.32 million each quarter until June 30, 2017, and began decreasing by $0.43 million each quarter until June 29, 2018, when it will begin decreasing by $0.53 million per quarter until the swap terminates on June 28, 2019. The interest rate swap requires the Company to pay a fixed rate of 1.055 percent per annum while receiving a variable rate per annum based upon the one month LIBOR rate for a net monthly settlement based on the notional amount in effect. The new swap terminated the old swap that we entered into on January 17, 2014 under our old senior credit facility. See Note 7 of our consolidated financial statements for further information. The Company paid $44,624, in the aggregate, in net monthly settlements with respect to the interest rate swap above for the 52 weeks ended January 1, 2017
Effective October 2, 2017, as required under the Second Amendment to the New Credit Agreement, as discussed in Note 7 of our consolidated financial statements, the Company entered into another interest rate swap that requires the Company to pay a fixed rate of 1.093% percent per annum while receiving a variable interest rate per annum based on one month LIBOR for a net monthly settlement based on the notional amount in effect. The notional amount at the effective date was $1.90 million which decreases by $0.10 million each quarter until it expires on September 30, 2020.
The Company paid $1,159, in the aggregate, in net monthly settlements with respect to the interest rate swaps for the 52 weeks ended December 31, 2017.
We do not believe that an increase or decrease in interest rates of 100 basis points related to our swaps would have a material effect on our operating results or financial condition.
Foreign Currency Risk
Our functional currency is the U.S. dollar. To date, substantially all of our net sales and operating expenses have been denominated in U.S. dollars, therefore we are not currently subject to significant foreign currency risk. However, if our international operations continue to grow, our risks associated with fluctuation in currency rates may become greater. Currency fluctuations or a weakening U.S. dollar can increase the costs of our international operations. We intend to continue to assess our approach to managing this potential risk. We do not believe that the effect of a hypothetical 10% change in foreign currency exchange rates applicable to our business would have had a material impact on our operating results or financial condition. To date, foreign currency transaction gains and losses and exchange rate fluctuations have not been material to our consolidated financial statements. However, in order to mitigate some of the risk that we do have with regard to foreign currency, effective June 29, 2016 we entered into a 1 year foreign currency forward contract to hedge the Mexican Peso. The forward contract had an equivalent US dollar notional amount of $3.30 million and expired on June 30, 2017 and did not have a material impact to our consolidated financial statements. See Note 7 to our consolidated financial statements for further information.
45
ITEM 8. FINANCIAL STATEMENTS AND SUPPLEMENTARY DATA
REPORT OF INDEPENDENT REGISTERED PUBLIC ACCOUNTING FIRM
Board of Directors and Stockholders
Unique Fabricating, Inc.
Opinion on the Financial Statements
We have audited the accompanying consolidated balance sheets of Unique Fabricating, Inc. and subsidiaries (the “Company”) as of December 31, 2017 and January 1, 2017, and the related consolidated statements of operations, stockholders' equity and cash flows for each of the fifty-two week periods ended December 31, 2017 and January 1, 2017 and the related notes (collectively referred to as the “financial statements”). In our opinion, the financial statements present fairly, in all material respects, the financial position of the Company as of December 31, 2017 and January 1, 2017 and the results of its operations and its cash flows for each of the fifty-two week periods ended December 31, 2017 and January 1, 2017, in conformity with accounting principles generally accepted in the United States of America.
Basis for Opinion
These financial statements are the responsibility of the Company's management. Our responsibility is to express an opinion on the Company's financial statements based on our audits. We are a public accounting firm registered with the Public Company Accounting Oversight Board (United States) (PCAOB) and are required to be independent with respect to the Company in accordance with the U.S. federal securities laws and the applicable rules and regulations of the Securities and Exchange Commission and the PCAOB.
We conducted our audits in accordance with the standards of the PCAOB. Those standards require that we plan and perform the audit to obtain reasonable assurance about whether the financial statements are free of material misstatement, whether due to error or fraud. The Company is not required to have, nor were we engaged to perform, an audit of its internal control over financial reporting. As part of our audits, we are required to obtain an understanding of internal control over financial reporting but not for the purpose of expressing an opinion on the effectiveness of the Company’s internal control over financial reporting. Accordingly, we express no such opinion.
Our audits included performing procedures to assess the risks of material misstatement of the financial statements, whether due to error or fraud, and performing procedures that respond to those risks. Such procedures included examining, on a test basis, evidence regarding the amounts and disclosures in the financial statements. Our audits also included evaluating the accounting principles used and significant estimates made by management, as well as evaluating the overall presentation of the financial statements. We believe that our audits provide a reasonable basis for our opinion.
/s/ Deloitte & Touche, LLP
Detroit, Michigan
March 8, 2018
We have served as the Company's auditor since 2016
46
REPORT OF INDEPENDENT REGISTERED PUBLIC ACCOUNTING FIRM
Board of Directors and Stockholders
Unique Fabricating, Inc.
We have audited the accompanying consolidated statements of operations, stockholders' equity and cash flows of Unique Fabricating, Inc. (the “Company”) for the fifty-two week period ended January 3, 2016. These consolidated financial statements are the responsibility of the Company's management. Our responsibility is to express an opinion on these consolidated financial statements based on our audit.
We conducted our audit in accordance with the standards of the Public Company Accounting Oversight Board (United States). Those standards require that we plan and perform the audit to obtain reasonable assurance about whether the consolidated financial statements are free of material misstatement. An audit includes examining, on a test basis, evidence supporting the amounts and disclosures in the consolidated financial statements. An audit also includes assessing the accounting principles used and significant estimates made by management, as well as evaluating the overall financial statement presentation. We believe that our audit provides a reasonable basis for our opinion.
In our opinion, the consolidated financial statements referred to above present fairly, in all material respects, the results of operations and cash flows of Unique Fabricating, Inc. for the fifty-two week period ended January 3, 2016, in conformity with accounting principles generally accepted in the United States of America.
/s/ Baker Tilly Virchow Krause, LLP
Pittsburgh, Pennsylvania
March 9, 2016
47
UNIQUE FABRICATING, INC.
Consolidated Balance Sheets
December 31, 2017 | January 1, 2017 | ||||||
Assets | |||||||
Current Assets | |||||||
Cash and cash equivalents | $ | 1,430,937 | $ | 705,535 | |||
Accounts receivable – net | 27,203,296 | 26,887,945 | |||||
Inventory – net | 16,330,084 | 16,731,608 | |||||
Prepaid expenses and other current assets: | |||||||
Prepaid expenses and other | 3,962,012 | 2,087,069 | |||||
Refundable taxes | 646,253 | 783,139 | |||||
Total current assets | 49,572,582 | 47,195,296 | |||||
Property, Plant, and Equipment – Net | 22,975,401 | 21,197,922 | |||||
Goodwill | 28,871,179 | 28,871,179 | |||||
Intangible Assets | 19,635,782 | 23,758,342 | |||||
Other assets | |||||||
Investments – at cost | 1,054,120 | 1,054,120 | |||||
Deposits and other assets | 353,719 | 266,369 | |||||
Deferred tax asset | 342,552 | 193,577 | |||||
Total assets | $ | 122,805,335 | $ | 122,536,805 | |||
Liabilities and Stockholders’ Equity | |||||||
Current Liabilities | |||||||
Accounts payable | $ | 11,708,175 | $ | 13,451,816 | |||
Current maturities of long-term debt | 3,799,998 | 2,405,446 | |||||
Income taxes payable | 348,910 | 610,825 | |||||
Accrued compensation | 2,840,559 | 2,734,155 | |||||
Other accrued liabilities | 1,027,489 | 1,065,740 | |||||
Other liabilities | — | 168,880 | |||||
Total current liabilities | 19,725,131 | 20,436,862 | |||||
Long-term debt – net of current portion | 27,288,846 | 28,029,041 | |||||
Line of credit | 22,476,525 | 20,176,058 | |||||
Other long-term liabilities | |||||||
Deferred tax liability | 2,432,754 | 3,836,281 | |||||
Total liabilities | 71,923,256 | 72,478,242 | |||||
Stockholders’ Equity | |||||||
Common stock, $0.001 par value – 15,000,000 shares authorized and 9,757,563 and 9,719,772 issued and outstanding at December 31, 2017 and January 1, 2017, respectively | 9,758 | 9,720 | |||||
Additional paid-in-capital | 45,712,568 | 45,525,237 | |||||
Retained earnings | 5,159,753 | 4,523,606 | |||||
Total stockholders’ equity | 50,882,079 | 50,058,563 | |||||
Total liabilities and stockholders’ equity | $ | 122,805,335 | $ | 122,536,805 | |||
See Notes to Consolidated Financial Statements.
48
UNIQUE FABRICATING, INC.
Consolidated Statements of Operations
Fifty-Two Weeks Ended December 31, 2017 | Fifty-Two Weeks Ended January 1, 2017 | Fifty-Two Weeks Ended January 3, 2016 | |||||||||
Net Sales | $ | 175,287,982 | $ | 170,462,953 | $ | 143,309,634 | |||||
Cost of Sales | 135,234,448 | 130,918,486 | 109,488,101 | ||||||||
Gross Profit | 40,053,534 | 39,544,467 | 33,821,533 | ||||||||
Selling, General, and Administrative Expenses | 29,766,864 | 27,524,453 | 23,372,201 | ||||||||
Restructuring Expenses | — | 35,054 | 374,230 | ||||||||
Operating Income | 10,286,670 | 11,984,960 | 10,075,102 | ||||||||
Non-operating Income (Expense) | |||||||||||
Investment income | — | — | 230 | ||||||||
Other income | 78,805 | 91,755 | 23,021 | ||||||||
Interest expense | (2,745,904 | ) | (2,134,976 | ) | (2,755,091 | ) | |||||
Total non-operating expense | (2,667,099 | ) | (2,043,221 | ) | (2,731,840 | ) | |||||
Income – Before income taxes | 7,619,571 | 9,941,739 | 7,343,262 | ||||||||
Income Tax Expense | 1,132,880 | 3,257,619 | 2,314,324 | ||||||||
Net Income | $ | 6,486,691 | $ | 6,684,120 | $ | 5,028,938 | |||||
Net Income per share | |||||||||||
Basic | $ | 0.67 | $ | 0.69 | $ | 0.62 | |||||
Diluted | $ | 0.66 | $ | 0.68 | $ | 0.60 | |||||
Cash dividends declared per share | $ | 0.60 | $ | 0.60 | $ | 0.30 | |||||
See Notes to Consolidated Financial Statements.
49
UNIQUE FABRICATING, INC.
Consolidated Statements of Stockholders’ Equity
Number of Shares | Common Stock | Additional Paid-In Capital | Retained Earnings | Total | ||||||||||||||
Balance - January 4, 2015 | 4,324,599 | $ | 4,325 | $ | 13,723,456 | $ | 2,864,154 | $ | 16,591,935 | |||||||||
Net income | — | — | — | 5,028,938 | 5,028,938 | |||||||||||||
Stock option expense | — | — | 205,845 | — | 205,845 | |||||||||||||
Reduction for accretion on redeemable stock | — | — | — | (1,364,031 | ) | (1,364,031 | ) | |||||||||||
Reclass of redeemable common stock to common stock and additional paid-in capital | 2,415,399 | 2,415 | 7,807,592 | — | 7,810,007 | |||||||||||||
Exercise of warrants and options for common stock | 149,362 | 149 | 396,922 | — | 397,071 | |||||||||||||
Issuance of common stock pursuant to an initial public offering | 2,702,500 | 2,703 | 25,671,047 | — | 25,673,750 | |||||||||||||
Common stock initial public offering issuance costs and underwriter fees | — | — | (3,452,674 | ) | — | (3,452,674 | ) | |||||||||||
Cash dividends paid | — | — | — | (2,877,717 | ) | (2,877,717 | ) | |||||||||||
Balance - January 3, 2016 | 9,591,860 | $ | 9,592 | $ | 44,352,188 | $ | 3,651,344 | $ | 48,013,124 | |||||||||
Number of Shares | Common Stock | Additional Paid-In Capital | Retained Earnings | Total | ||||||||||||||
Balance - January 3, 2016 | 9,591,860 | $ | 9,592 | $ | 44,352,188 | $ | 3,651,344 | $ | 48,013,124 | |||||||||
Net income | — | — | — | 6,684,120 | 6,684,120 | |||||||||||||
Stock option expense | — | — | 166,476 | — | 166,476 | |||||||||||||
Exercise of warrants and options for common stock | 57,115 | 57 | 115,918 | — | 115,975 | |||||||||||||
Common stock issued for purchase of Intasco USA, Inc. | 70,797 | 71 | 890,655 | — | 890,726 | |||||||||||||
Cash dividends paid | — | — | — | (5,811,858 | ) | (5,811,858 | ) | |||||||||||
Balance - January 1, 2017 | 9,719,772 | $ | 9,720 | $ | 45,525,237 | $ | 4,523,606 | $ | 50,058,563 | |||||||||
Number of Shares | Common Stock | Additional Paid-In Capital | Retained Earnings | Total | ||||||||||||||
Balance - January 1, 2017 | 9,719,772 | $ | 9,720 | $ | 45,525,237 | $ | 4,523,606 | $ | 50,058,563 | |||||||||
Net income | — | — | — | 6,486,691 | 6,486,691 | |||||||||||||
Stock option expense | — | — | 150,368 | — | 150,368 | |||||||||||||
Exercise of warrants and options for common stock | 37,791 | 38 | 36,963 | — | 37,001 | |||||||||||||
Cash dividends paid | — | — | — | (5,850,544 | ) | (5,850,544 | ) | |||||||||||
Balance - December 31, 2017 | 9,757,563 | $ | 9,758 | $ | 45,712,568 | $ | 5,159,753 | $ | 50,882,079 | |||||||||
See Notes to Consolidated Financial Statements.
50
UNIQUE FABRICATING, INC.
Consolidated Statements of Cash Flows
Fifty-Two Weeks Ended December 31, 2017 | Fifty-Two Weeks Ended January 1, 2017 | Fifty-Two Weeks Ended January 3, 2016 | |||||||||
Cash Flows from Operating Activities | |||||||||||
Net income | $ | 6,486,691 | $ | 6,684,120 | $ | 5,028,938 | |||||
Adjustments to reconcile net income to net cash provided by operating activities: | |||||||||||
Depreciation and amortization | 6,319,975 | 5,501,674 | 3,903,429 | ||||||||
Amortization of debt issuance costs | 148,948 | 127,556 | 269,629 | ||||||||
Loss (gain) on sale of assets | 63,013 | (126,631 | ) | 48,135 | |||||||
Loss on extinguishment of debt | — | 60,202 | 386,552 | ||||||||
Bad debt adjustment | 128,475 | (274,364 | ) | (36,811 | ) | ||||||
(Gain) loss on derivative instruments | (228,387 | ) | 22,193 | (39,638 | ) | ||||||
Stock option expense | 150,368 | 166,476 | 205,845 | ||||||||
Deferred income taxes | (1,552,502 | ) | (1,165,649 | ) | (496,427 | ) | |||||
Changes in operating assets and liabilities that provided (used) cash: | |||||||||||
Accounts receivable | (443,826 | ) | (3,987,313 | ) | (694,902 | ) | |||||
Inventory | 401,524 | 339,784 | (2,981,751 | ) | |||||||
Prepaid expenses and other assets | (1,765,990 | ) | (1,291,654 | ) | 6,005 | ||||||
Accounts payable | (1,705,663 | ) | 1,329,599 | (158,202 | ) | ||||||
Accrued and other liabilities | (193,762 | ) | 375,280 | (359,982 | ) | ||||||
Net cash provided by operating activities | 7,808,864 | 7,761,273 | 5,080,820 | ||||||||
Cash Flows from Investing Activities | |||||||||||
Purchases of property and equipment | (4,140,135 | ) | (3,362,014 | ) | (3,565,578 | ) | |||||
Proceeds from sale of property and equipment | 51,847 | 2,187,366 | 73,847 | ||||||||
Acquisition of Intasco, net of cash acquired | — | (21,030,795 | ) | — | |||||||
Working capital adjustment from acquisition of Intasco | — | 212,823 | — | ||||||||
Acquisition of Great Lakes Foam Technologies, Inc., net of cash | — | — | (11,819,991 | ) | |||||||
Working capital adjustment from acquisition of Great Lakes Foam Technologies, Inc. | — | — | (127,401 | ) | |||||||
Net cash used in investing activities | (4,088,288 | ) | (21,992,620 | ) | (15,439,123 | ) | |||||
Cash Flows from Financing Activities | |||||||||||
Net change in bank overdraft | (37,978 | ) | 548,892 | 660,447 | |||||||
Proceeds from debt | — | 32,000,000 | — | ||||||||
Payments on term loans | (3,374,545 | ) | (2,444,071 | ) | (15,151,028 | ) | |||||
Proceeds from revolving credit facilities, net | 6,230,892 | 5,690,487 | 5,834,326 | ||||||||
Debt issuance costs | — | (514,441 | ) | — | |||||||
Pay-off of old senior credit facility term debt | — | (15,375,000 | ) | — | |||||||
Post acquisition payments for Unique Fabricating | — | — | (755,018 | ) | |||||||
Proceeds from the issuance of common stock pursuant to initial public offering | — | — | 25,673,750 | ||||||||
Payment of initial public offering costs | — | — | (3,452,674 | ) | |||||||
Proceeds from exercise of stock options and warrants | 37,001 | 115,975 | 397,071 | ||||||||
Distribution of cash dividends | (5,850,544 | ) | (5,811,858 | ) | (2,877,717 | ) | |||||
Net cash (used in) provided by financing activities | (2,995,174 | ) | 14,209,984 | 10,329,157 | |||||||
Net Decrease in Cash and Cash Equivalents | 725,402 | (21,363 | ) | (29,146 | ) | ||||||
Cash and Cash Equivalents – Beginning of period | 705,535 | 726,898 | 756,044 | ||||||||
Cash and Cash Equivalents – End of period | $ | 1,430,937 | $ | 705,535 | $ | 726,898 | |||||
51
Supplemental Disclosure of Cash Flow Information – Cash paid for | |||||||||||
Interest | $ | 2,566,956 | $ | 1,552,619 | $ | 2,588,894 | |||||
Income taxes | $ | 2,231,901 | $ | 3,750,845 | $ | 2,619,977 | |||||
Supplemental Disclosure of Cash Flow Information – Non cash investing and financing activities for | |||||||||||
Common stock issued for purchase of Intasco USA, Inc. | $ | — | $ | 890,726 | $ | — | |||||
Accretion on redeemable common stock | $ | — | $ | — | $ | 1,364,031 | |||||
See Notes to Consolidated Financial Statements.
52
Note 1 — Nature of Business and Significant Accounting Policies
Nature of Business — UFI Acquisition, Inc. (“UFI”), a Delaware corporation, was formed on January 14, 2013, for the purpose of acquiring Unique Fabricating, Inc. and its subsidiaries (“Unique Fabricating”) (collectively, the “Company” or “Unique”) on March 18, 2013. The Company operates as one operating and reporting segment to fabricate and broker foam and rubber products, which are primarily sold to original equipment manufacturers (“OEMs”) and tiered suppliers in the automotive, appliance, water heater and heating, ventilation, and air conditioning (“HVAC”) industries. In September 2014, UFI changed its name to Unique Fabricating, Inc. which is now the parent company of the consolidated group. As a result of the name change, the subsidiary previously named Unique Fabricating, Inc. became Unique Fabricating NA, Inc.
Basis of Presentation — The consolidated financial statements have been prepared in accordance with accounting principles generally accepted in the United States of America (“U.S. GAAP”). The accompanying consolidated financial statements have been prepared by the Company, pursuant to the rules and regulations of the Securities and Exchange Commission (the “SEC”).
Principles of Consolidation —The consolidated financial statements include the accounts of the Company and all subsidiaries over which the Company exercises control. All intercompany transactions and balances have been eliminated upon consolidation.
Initial Public Offering — On July 7, 2015, the Company completed its initial public offering of 2,702,500 shares of common stock at a price to the public of $9.50 per share (the "IPO"), including 352,500 shares subject to an over-allotment option granted to the underwriters. After underwriting discounts, commissions, and approximate fees and expenses of the offering, as set forth in our registration statement for the IPO on Form S-1, the Company received net IPO proceeds of approximately $22.2 million. Of these proceeds, the Company used a portion to pay all of the $13.1 million principal amount of its 16% senior subordinated note, together with accrued interest through the date of payment. The Company used the remaining proceeds to temporarily reduce borrowings under the revolver portion of its senior secured credit facility. The Company also issued to the underwriters warrants to purchase up to 141,000 shares of common stock, as additional compensation in the IPO. The warrants are exercisable at a per share exercise price equal to 125% of the initial public offering price of $9.50 per share, and can be exercised commencing 1 year from the date of the IPO, until the date 5 years from the date of the IPO. The warrants had an aggregate grant date fair value of $336,300 and have been classified as equity and incremental direct costs associated with the IPO.
Fiscal Years — The Company’s year-end periods end on the Sunday closest to the end of the calendar year-end period. The 52-week fiscal year periods for 2017, 2016, and 2015 ended on December 31, 2017, January 1, 2017, and January 3, 2016, respectively.
Cash and Cash Equivalents — The Company considers all highly liquid investments with an original maturity of three months or less to be cash and cash equivalents.
Accounts Receivable — Accounts receivable are stated at the invoiced amount and do not bear interest. The allowance for doubtful accounts is management’s best estimate of the amount of probable credit losses in the existing accounts receivable. Management determines the allowance based on historical write off experience and an understanding of individual customer payment history and financial condition. Management reviews the allowance for doubtful accounts at regular intervals. Account balances are charged off against the allowance when management determines it is probable the receivable will not be recovered. The allowance for doubtful accounts was $768,500 and $655,312 at December 31, 2017 and January 1, 2017, respectively.
Inventory — Inventory is stated at the lower of cost or market, with cost determined on the first in, first out method (FIFO). Inventory acquired as part of a business combination is recorded at its estimated fair value at the time of the business combination. The Company periodically evaluates inventory for obsolescence, excess quantities, slow moving goods and other impairments of value and establishes reserves for any identified impairments.
Valuation of Long-Lived Assets — The carrying value of long-lived assets held for use is periodically evaluated when events or circumstances warrant such a review. The carrying value of a long-lived asset held for use is considered impaired when the anticipated separately identifiable undiscounted cash flows from the asset are less than the carrying value of the asset. In that event, a loss is recognized based on the amount by which the carrying value exceeds the fair value of the long-lived
53
asset. The Company determined that no impairment indicators were present and all originally assigned useful lives remained appropriate during the 52 weeks ended December 31, 2017, January 1, 2017, and January 3, 2016, respectively.
Property, Plant, and Equipment — Property, plant, and equipment purchases are recorded at cost. Property, plant, and equipment acquired as part of a business combination are recorded at estimated fair value at the time of the business combination. Depreciation is calculated principally using the straight line method over the estimated useful life of each asset. Leasehold improvements are depreciated over the shorter of the estimated useful life of the asset or the period of the related leases. Upon retirement or disposal, the initial cost or valuation and accumulated depreciation are removed from the accounts, and any gain or loss is included in net income. Repair and maintenance costs are expensed as incurred.
Intangible Assets — The Company does not hold any intangible assets with indefinite lives. Identifiable intangible assets recognized as part of a business combination are recorded at their estimated fair value at the time of the business combination. Amortizable intangible assets are reviewed for impairment whenever events or circumstances indicate that the related carrying amount may be impaired. The remaining useful lives of intangible assets are reviewed annually to determine whether events and circumstances warrant a revision to the remaining period of amortization. The Company determined that no impairment indicators were present and all originally assigned useful lives remained appropriate during the 52 weeks ended December 31, 2017, January 1, 2017, and January 3, 2016, respectively.
Goodwill — Goodwill represents the excess of the acquisition cost of consideration transferred over the fair value of the identifiable net assets acquired and liabilities assumed from business combinations at the date of acquisition. Goodwill is not amortized, but rather is assessed at least on an annual basis for impairment. If it is determined that it is more likely than not that the fair value is greater than the carrying value of a reporting unit then a qualitative assessment may be used for the annual impairment test. Otherwise, a one-step process is used which requires estimating the fair value of each reporting unit compared to its carrying value. If the carrying value exceeds the estimated fair value, goodwill impairment will be the amount by which a reporting unit’s carrying value exceeds its fair value, not to exceed the carrying amount of goodwill. The Company has one reporting unit for goodwill testing purposes.
There were no impairment charges recognized during the 52 weeks ended December 31, 2017, January 1, 2017, and January 3, 2016, respectively.
Debt Issuance Costs — Debt issuance costs represent legal, consulting, and other financial costs associated with debt financing and are reported netted against the related debt instrument. Amounts paid to or on behalf of lenders are presented as debt discount, as a reduction of the noted debt instrument. Debt issuance costs on term debt are amortized using the straight lines basis over the term of the related debt (which is immaterially different from the required effective interest method) while those related to revolving debt are amortized using a straight line basis over the term of the related debt.
At December 31, 2017 and January 1, 2017, debt issuance costs were $232,045 and $301,620, respectively, while amounts paid to or on behalf of lenders presented as debt discounts were $242,059 and $270,959, respectively. On April 29, 2016, the Company refinanced its existing term loan and revolving debt facility with new term loans and a new revolving debt facility which are further described in Note 6. The Company reviewed this refinancing for extinguishment accounting and concluded that $60,202 of the $160,111 remaining issuance costs not amortized on the old revolving debt facility qualified for extinguishment and were recognized as a loss on extinguishment immediately. The remaining $99,909 of unamortized issuance costs not extinguished on the old revolving debt facility and all of the $92,508 of remaining unamortized debt discounts on the old term loan did not meet extinguishment accounting and were therefore carried forward to the new revolving debt facility and term loans.
In July 2015, the Company's 16% senior subordinated note was entirely paid off with the IPO proceeds. On the date paid off, $386,552 of debt discounts remained to be amortized. The Company concluded that the 16% senior subordinated note and related debt discounts qualified for extinguishment accounting and the debt discounts were recognized as a loss on extinguishment immediately in the third quarter of 2015. The extinguishment was recognized as part of interest expense in the consolidated statements of operations.
Amortization expense has been recognized as a component of interest expense which includes both debt issuance costs and debt discounts in the amounts of $148,948 for the 52 weeks ended December 31, 2017, $127,556 for the 52 weeks ended January 1, 2017, and $269,629 for the 52 weeks ended January 3, 2016, respectively.
54
Investments — Investments in entities in which the Company has less than a 20 percent interest or is not able to exercise significant influence are carried at cost. Cost basis investments acquired are recorded at cost. Dividends received are included in income, except for those dividends received in excess of the Company’s proportionate share of accumulated earnings, which are applied as a reduction of the cost of the investment. Impairment losses due to a decline in the value of the investment that is other than temporary are recognized when incurred. Dividend income of $0, $0 and $0 was recognized for the 52 weeks ended December 31, 2017, January 1, 2017, and January 3, 2016, respectively. No impairment loss was recognized for the 52 weeks ended December 31, 2017, January 1, 2017, and January 3, 2016, respectively.
Accounts Payable — Under the Company’s cash management system, checks issued but not yet presented to the Company’s bank frequently result in overdraft balances for accounting purposes and are classified as accounts payable on the consolidated balance sheets. Accounts payable included $2,919,460 and $2,938,750 of checks issued in excess of available cash balances at December 31, 2017 and January 1, 2017, respectively.
Stock Based Compensation — The Company accounts for its stock based compensation using the fair value of the award estimated at the grant date of the award. The Company estimates the fair value of awards, consisting of stock options, using the Black Scholes option pricing model. Compensation expense is recognized in earnings using the straight line method over the vesting period, which represents the requisite service period.
Revenue Recognition — Revenue is recognized by the Company upon shipment to customers when the customer takes ownership and assumes the risk of loss, collection of the relevant receivable is probable, persuasive evidence of an arrangement exists, and the sale price is fixed and determinable. Provisions for discounts and rebates to customers, estimated returns and allowances, and other adjustments are provided for in the same period the related sales are recorded.
Shipping and Handling — Shipping and handling costs are included in cost of sales as they are incurred.
Income Taxes — A current tax liability or asset is recognized for the estimated taxes payable or refundable on tax returns for the period. Deferred tax liabilities or assets are recognized for the estimated future tax effects of temporary differences between financial reporting and tax accounting measured using enacted tax rates expected to apply to taxable income in the years in which those temporary differences are expected to be recovered or settled. The Company also evaluates the need for valuation allowances to reduce the deferred tax assets to realizable amounts. Management evaluates all positive and negative evidence and uses judgment regarding past and future events, including operating results, to help determine when it is more likely than not that all or some portion of the deferred tax assets may not be realized. When appropriate, a valuation allowance is recorded against deferred tax assets to reserve for future tax benefits that may not be realized.
The Company recognizes the benefit of a tax position when it is more likely than not, based on the technical merits, that the position will be sustained upon examination. For tax positions meeting the more likely than not threshold, the amount recognized in the financial statements is the largest benefit that has a greater than 50 percent likelihood of being realized upon settlement with the relevant tax authority. The Company assesses all tax positions for which the statute of limitations remain open.
Foreign Currency Adjustments — The Company’s functional currency for all operations worldwide is the United States dollar. Nonmonetary assets and liabilities of foreign operations are remeasured at historical rates and monetary assets and liabilities are remeasured at exchange rates in effect at the end of each reporting period. Income statement accounts are remeasured at average exchange rates for the year. Gains and losses from translation of foreign currency financial statements into United States dollars are classified in other income in the consolidated statements of operations.
Concentration Risks — The Company is exposed to various significant concentration risks as follows:
Customer and Credit — During the 52 weeks ended December 31, 2017, January 1, 2017, and January 3, 2016, the Company’s sales were derived from customers principally engaged in the North American automotive industry. Company sales directly and indirectly to General Motors Company (“GM”), Fiat Chrysler Automobiles (“FCA”), and Ford Motor Company (“Ford”), as a percentage of total net sales were: 14, 13, and 11 percent, respectively, during the 52 weeks ended December 31, 2017; 15, 11, and 12 percent, respectively, during the 52 weeks ended January 1, 2017; and 15, 15, and 15 percent, respectively, during the 52 weeks ended January 3, 2016. No Tier 1 suppliers represented more than 10 percent of direct Company sales for any period noted above. GM accounted for 11 and 12 percent of direct accounts receivable as of December 31, 2017 and January 1, 2017, respectively.
55
Labor Markets — At December 31, 2017, of the Company’s hourly plant employees working in the United States manufacturing facilities, 32 percent were covered under a collective bargaining agreement which expires in August 2019 while another 6 percent were covered under a separate agreement that expires in February 2020.
Foreign Currency Exchange — The expression of assets and liabilities in a currency other than the functional currency, which is the United States dollar, gives rise to exchange gains and losses when such assets and obligations are paid in another currency. Foreign currency exchange rate adjustments (i.e., differences between amounts recorded and actual amounts owed or paid) are reported in the consolidated statements of operations as the foreign currency fluctuations occur. Foreign currency exchange rate adjustments are reported in the consolidated statements of cash flows using the exchange rates in effect at the time of the cash flows. At December 31, 2017, the Company’s exposure to assets and liabilities denominated in another currency was not significant. To the extent there is a fluctuation in the exchange rates, the amount of local currency to be paid or received to satisfy foreign currency obligations in 2017 may increase or decrease.
International Operations — The Company manufactures and sells products outside of the United States primarily in Mexico and Canada. Foreign operations are subject to various political, economic and other risks and uncertainties inherent in foreign countries. Among other risks, the Company’s operations are subject to the risks of: restrictions on transfers of funds; export duties, quotas, and embargoes; domestic and international customs and tariffs; changing taxation policies; foreign exchange restrictions; political conditions; and governmental regulations. During the 52 weeks ended December 31, 2017, January 1, 2017, and January 3, 2016, 15, 12, and 12 percent, respectively, of the Company’s production occurred in Mexico. During the 52 weeks ended December 31, 2017, January 1, 2017, and January 3, 2016, 9, 6, and 0 percent, respectively, of the Company's production occurred in Canada. Sales derived from customers located in Mexico, Canada, and other foreign countries were 15, 10, and 1 percent, respectively during the 52 weeks ended December 31, 2017, 12, 8, and 1 percent, respectively, during the 52 weeks ended January 1, 2017, and 13, 4, and 1 percent, respectively during the 52 weeks ended January 3, 2016, of the Company’s total sales.
Derivative financial instruments — All derivative instruments are required to be reported on the consolidated balance sheets at fair value unless the transactions qualify and are designated as normal purchases or sales. Changes in fair value are reported currently through earnings unless they meet hedge accounting criteria. See Note 7 for further information regarding the Company's derivative instrument makeup.
Use of Estimates — The preparation of the consolidated financial statements in conformity with U.S. GAAP requires management to make estimates and assumptions that affect the reported amounts of assets and liabilities and disclosure of contingent assets and liabilities at the date of the financial statements and the reported amounts of revenue and expenses during the reporting period. Actual results could differ from those estimates.
Recently Issued Accounting Pronouncements — In April 2015, the Financial Accounting Standards Board (the “FASB”) issued ASU 2015-03, Interest-Imputation of Interest (Subtopic 835-30): Simplifying the Presentation of Debt Issuance Costs. Previously, such costs were required to be presented as a non-current asset in an entity's balance sheet and amortized into interest expense over the term of the related debt instrument. The changes implemented by the ASU require that debt issuance costs be presented in the entity's balance sheet as a direct deduction from the carrying value of the related debt liability. The amortization of debt issuance costs remains unchanged per the ASU. The Company adopted this ASU during 2016 and applied this change to the current and prior periods in the financial statements for comparison purposes. Debt issuance costs are no longer disclosed separately by the Company in the balance sheet and are now shown as a direct deduction from the carrying value of the related debt liability.
In May 2014, the FASB issued ASU 2014-09, Revenue from Contracts with Customers. This ASU supersedes most of the existing guidance on revenue recognition in ASC Topic 605, Revenue Recognition and establishes a broad principle that would require an entity to recognize revenue to depict the transfer of promised goods or services to customers in an amount that reflects the consideration to which the entity expects to be entitled in exchange for those goods or services. To achieve this principle, an entity identifies the contract with a customer, identifies the separate performance obligations in the contract, determines the transaction price, allocates the transaction price to the separate performance obligations and recognizes revenue when each separate performance obligation is satisfied. In August 2015, the FASB issued ASU 2015-14, Revenue From Contracts with Customers (Topic 606): Deferral of the Effective Date to defer implementation of 2014-09 by one year. The guidance is now currently effective for fiscal years beginning after December 15, 2018 and is to be applied retrospectively at the entity's election either to each prior reporting period presented or with the cumulative effect of application recognized at the
56
date of initial application. The ASU allows for early adoption for fiscal years beginning after December 15, 2016, however, the Company is currently evaluating the impact that the adoption of this guidance will have on its consolidated financial statements.
The Company plans to adopt the new accounting standard ASC 606, Revenue from Contracts with Customers and all the related amendments to all contracts using the modified retrospective method.
In November 2015, the FASB issued ASU 2015-17, Income Taxes (Topic 740): Balance Sheet Classification of Deferred Taxes. Currently, deferred income tax liabilities and assets are required to be separated into current and noncurrent amounts in an entity's balance sheet. The changes implemented by the ASU require that all deferred income tax liabilities and assets are to be classified as noncurrent on the balance sheet. The ASU is effective for the Company for financial statements issued for fiscal years beginning after December 15, 2017, with early adoption permitted. The Company adopted this ASU during the first quarter of 2016 and applied the change to only these 2016 periods in the consolidated financial statements as the prior year periods were not retrospectively adjusted. Deferred taxes are now shown as non-current by the Company in the consolidated balance sheet.
In February 2016, the FASB issued ASU 2016-02, Leases, which will supersede the current lease requirements in Topic 850. The ASU requires lessees to recognize a right of use asset and related lease liability for all leases, with a limited exception for short-term leases. Leases will be classified as either finance or operating, with the classification affecting the pattern of expense recognition in the statement of operations. Currently, leases are classified as either capital or operating, with only capital leases recognized on the balance sheet. The reporting of lease related expenses in the consolidated statements of operations and cash flows will be generally consistent with current guidance. The ASU is effective for the Company for financial statements issued for fiscal years beginning after December 15, 2019. The Company believes the impact that the adoption of this guidance will have on its consolidated financial statements will be to materially increase assets and liabilities on the consolidated balance sheet, but it is not expected to materially impact the consolidated statements of operations.
In March 2016, the FASB issued ASU 2016-09, Compensation-Stock Compensation (Topic 718): Improvement to Employee Share-based Payment Accounting(ASU 2016-09), to simplify the accounting for share-based payment transactions. The ASU is effective for the Company for financial statements issued for fiscal years beginning after December 15, 2017. The Company early adopted this ASU during 2016 and applied the change to this period and future periods in the consolidated financial statements. Excess tax benefits are no longer disclosed in the consolidated statements of cash flows as a result of this
early adoption and are also recognized as income tax expense in the income statement. The Company adopted the provisions related to forfeitures as well to record actual forfeitures as they occur, and the impact on our consolidated balance sheet as of all years presented was immaterial.
In January 2017, the FASB issued ASU 2017-4, Intangibles - Goodwill and Other (Topic 350): Simplifying the Test for Goodwill Impairment, accounting guidance which removes Step 2 of the goodwill impairment test. Goodwill impairment will now be the amount by which a reporting unit’s carrying value exceeds its fair value, not to exceed the carrying amount of goodwill. The ASU is effective for annual or interim reporting periods beginning after December 15, 2021. Early adoption is permitted. The Company adopted the provisions related to this ASU during fiscal year 2017 and the impact was not material.
Note 2 — Business Combinations
2016
On April 29, 2016, Unique-Intasco Canada, Inc. (the “Canadian Buyer”), a newly formed subsidiary of the Company, acquired the business and substantially all of the assets of Intasco Corporation, a Canadian based tape manufacturer, for a purchase price of $21,049,045, in cash paid at closing. On the same date, Unique Fabricating NA, Inc. (the “US Buyer”), an existing subsidiary of the Company, purchased 100% of the outstanding capital stock of Intasco USA, Inc. a United States based tape manufacturer, for a purchase price of $890,726 paid by the issuance of 70,797 shares of the Company's common stock. These shares were issued in reliance upon an exemption from the registration requirements of the Securities Act of 1933, as amended. A portion of the purchase price is being held in escrow to fund the obligations of Intasco Corporation and Intasco USA, Inc., (together “Intasco”) and a related party to indemnify the Canadian Buyer and US Buyer against certain claims, losses, and liabilities. The purchase agreement included a potential purchase price adjustment provision based on the actual working capital acquired on the day of closing as compared to what was originally estimated at closing. On the date of closing, the Company paid an estimated working capital adjustment of $126,047 to Intasco, which is included in the total cash consideration paid above. During August 2016, Intasco paid the Company $212,823 for the actual final working capital adjustment. This final actual working capital settlement is included in the table below. The cash purchase price was paid with
57
borrowings under a new senior credit facility which replaced the Company's existing facility as further described in Note 6. The Company incurred transaction costs of $852,580 related to the acquisition of Intasco. The acquisition significantly broadened the Company's solution offerings, production capabilities, and potentially expanded its reach into new markets.
In connection with the business combination, Intasco terminated the leases it had with an affiliated entity for its operating facilities in the United States and Canada and the Company entered into new leases for the same facilities. The terms of the Company's lease in the United States provides for a term of two years with monthly rental payments of $4,000 beginning on May 1, 2016 and $4,080 beginning on May 1, 2017. The terms of the Company's lease in Canada provides for a term of five years with monthly rental payments of $16,750 Canadian dollars beginning on May 1, 2016, $17,085 Canadian dollars beginning on May 1, 2017, and $17,427 Canadian dollars beginning on May 1, 2019.
The following table summarizes the acquisition date fair values of the assets acquired and liabilities assumed.
Cash | $ | 18,250 | |
Accounts receivable | 2,146,082 | ||
Inventory | 2,485,781 | ||
Other current assets | 74,194 | ||
Property, plant, and equipment | 861,491 | ||
Identifiable intangible assets | 7,316,694 | ||
Accounts payable and accrued liabilities | (716,080 | ) | |
Deferred tax liabilities | (97,622 | ) | |
Total identifiable net assets | 12,088,790 | ||
Goodwill | 9,657,221 | ||
Total | $ | 21,746,011 | |
The goodwill arising from the acquisition consisted largely of Intasco's reputation, trained employees, and other unique features that cannot be associated with a specific identifiable asset. Of the total amount of goodwill recognized, $7,267,507 is expected to be deductible for tax purposes. The Company also recognized intangible assets as part of the acquisition which consisted of customer contracts, trade names, and unpatented technology. For further detail of the Company's intangibles please see Note 5.
The consolidated operating results for the 52 weeks ended January 1, 2017 included the operating results of Intasco from April 29, 2016. Intasco's revenue included in the accompanying statement of operations for the 52 weeks ended January 1, 2017, totaled $12,501,386, from the date of the acquisition. Intasco's net income included in the accompanying statement of operations for the 52 weeks ended January 1, 2017, totaled $131,433, from the date of acquisition.
2015
On August 31, 2015, the Company, through a newly created subsidiary, Unique Molded Foam Technologies, Inc., acquired substantially all of the assets of Great Lakes Foam Technologies, Inc. (“Great Lakes”) for total cash consideration of $11,947,392, after all adjustments described below. The purchase agreement included a potential purchase price adjustment provision based on the actual working capital acquired on the day of closing as compared to what was originally estimated at closing. On the date of closing, the Company paid a total purchase price of $12,000,000 less the estimated working capital adjustment of $180,009 owed to the Company by Great Lakes. During November 2015, the Company paid Great Lakes $127,401 for the actual working capital adjustment true-up once the actual working capital was determined. This acquisition was financed through the Company's revolving line of credit without the need for further revisions to any debt or equity agreements. The Company incurred costs of $421,637 related to the acquisition of Great Lakes. The acquisition allowed the Company to strengthen its existing product offerings and enabled it to access new customers and increase sales to certain of its existing customers.
In connection with the business combination, Great Lakes terminated the lease it had with an affiliated entity for its operating facility and the Company entered into a new lease with that entity for the same facility. The terms of the Company's lease provide for monthly rental payments of $7,500 for five years beginning on August 31, 2015.
58
The following table summarizes the acquisition date fair values of the assets acquired and liabilities assumed.
Accounts receivable | $ | 1,001,005 | |
Inventory | 1,115,809 | ||
Deferred tax assets | 1,468 | ||
Other current assets | 2,500 | ||
Property, plant, and equipment | 810,001 | ||
Identifiable intangible assets | 5,915,000 | ||
Accounts payable and accrued liabilities | (928,933 | ) | |
Total identifiable net assets | 7,916,850 | ||
Goodwill | 4,030,542 | ||
Total | $ | 11,947,392 | |
The goodwill arising from the acquisition consisted largely of Great Lakes reputation, trained employees, and other unique features that cannot be associated with a specific identifiable asset. Of the total amount of goodwill recognized, $4,347,457 is expected to be deductible for tax purposes. The Company also recognized intangible assets as part of the acquisition which consisted of customer contracts and non-compete agreements. For further detail of the Company's intangibles please refer to Note 5.
Great Lakes sales included in the accompanying consolidated statements of operations for the 52 weeks ended January 3, 2016, totaled $3,627,337 from the date of acquisition. Great Lakes earnings included in the accompanying statement of operations for the 52 weeks ended January 3, 2016, totaled $235,359 from the date of acquisition. For the 52 weeks ended January 3, 2016, $145,655 in sales was derived from intercompany sales to the Company which were eliminated in consolidation.
The following unaudited pro forma supplementary data for the 52 weeks ended January 1, 2017 and 52 weeks ended January 3, 2016 give effect to the acquisition of Intasco as if it had occurred on January 5, 2015 (the first day of the Company's 2015 fiscal year) and Great Lakes as if it had occurred on December 30, 2013 (the first day of the Company’s 2014 fiscal year), The unaudited pro forma supplementary data is provided for informational purposes only and should not be construed to be indicative of the Company’s results of operations had the acquisition been consummated on the date assumed and does not project the Company’s results of operations for any future date.
Fifty-Two Weeks Ended January 1, 2017 | Fifty-Two Weeks Ended January 3, 2016 | ||||||
(Unaudited) | (Unaudited) | ||||||
Net sales | $ | 176,309,480 | $ | 167,208,908 | |||
Net income | $ | 6,460,512 | $ | 6,505,410 | |||
Net income per common share – basic | $ | 0.67 | $ | 0.80 | |||
Net income per common share – diluted | $ | 0.65 | $ | 0.77 | |||
Note 3 — Inventory
Inventory consists of the following:
December 31, 2017 | January 1, 2017 | ||||||
Raw materials | $ | 9,005,335 | $ | 9,513,980 | |||
Work in progress | 578,056 | 623,504 | |||||
Finished goods | 6,746,693 | 6,594,124 | |||||
Total inventory | $ | 16,330,084 | $ | 16,731,608 | |||
59
The allowance for obsolete inventory was $434,712 and $471,537 at December 31, 2017 and January 1, 2017, respectively.
Included in inventory are assets located in Mexico with a carrying amount of $3,173,944 at December 31, 2017 and $2,911,926 at January 1, 2017, and assets located in Canada with a carrying amount of $1,072,430 at December 31, 2017 and $1,180,400 at January 1, 2017.
The inventory acquired in the 2016 acquisition of Intasco included a fair value adjustment of $318,518, At January 1, 2017, $0 of this fair value adjustment remained in inventory while $318,518 was included in costs of goods sold during the 52 weeks ended January 1, 2017.
The inventory acquired in the 2015 acquisition of Great Lakes included a fair value adjustment of $146,191. At January 3, 2016, $0 of this fair value adjustment remained in inventory while $146,191 was included in cost of goods sold during the 52 weeks ended January 3, 2016.
Note 4 — Property, Plant, and Equipment
Property, plant, and equipment consists of the following:
December 31, 2017 | January 1, 2017 | Depreciable Life – Years | |||||||
Land | $ | 1,663,153 | $ | 1,663,153 | |||||
Buildings | 7,606,125 | 7,541,976 | 23 – 40 | ||||||
Shop equipment | 16,654,811 | 13,003,025 | 7 – 10 | ||||||
Leasehold improvements | 997,277 | 913,097 | 3 – 10 | ||||||
Office equipment | 1,442,082 | 1,188,746 | 3 – 7 | ||||||
Mobile equipment | 223,474 | 218,743 | 3 | ||||||
Construction in progress | 1,253,760 | 1,425,090 | |||||||
Total cost | 29,840,682 | 25,953,830 | |||||||
Accumulated depreciation | 6,865,281 | 4,755,908 | |||||||
Net property, plant, and equipment | $ | 22,975,401 | $ | 21,197,922 | |||||
Depreciation expense was $2,197,415 for the 52 weeks ended December 31, 2017, $1,804,110 for the 52 weeks ended January 1, 2017, and $1,379,176 for the 52 weeks ended January 3, 2016.
Included in property, plant, and equipment are assets located in Mexico with a carrying amount of $2,659,920 and $1,586,472 at December 31, 2017 and January 1, 2017, respectively, and assets located in Canada with a carrying amount of $684,431 and $755,040 at December 31, 2017 and January 1, 2017, respectively.
Note 5 — Intangible Assets
Intangible assets of the Company consist of the following at December 31, 2017:
Gross Carrying Amount | Accumulated Amortization | Weighted Average Life – Years | |||||||
Customer contracts | $ | 26,523,065 | $ | 11,588,946 | 8.16 | ||||
Trade names | 4,673,044 | 1,160,569 | 16.43 | ||||||
Non-compete agreements | 1,161,790 | 995,233 | 2.53 | ||||||
Unpatented technology | 1,534,787 | 512,156 | 5.00 | ||||||
Total | $ | 33,892,686 | $ | 14,256,904 | |||||
Intangible assets of the Company consist of the following at January 1, 2017:
60
Gross Carrying Amount | Accumulated Amortization | Weighted Average Life – Years | |||||||
Customer contracts | $ | 26,523,065 | $ | 8,240,853 | 8.16 | ||||
Trade names | 4,673,044 | 868,866 | 16.43 | ||||||
Non-compete agreements | 1,161,790 | 818,585 | 2.53 | ||||||
Unpatented technology | 1,534,787 | 206,040 | 5.00 | ||||||
Total | $ | 33,892,686 | $ | 10,134,344 | |||||
The weighted average amortization period for all intangible assets is 8.96 years. Amortization expense for intangible assets totaled $4,122,560 for the 52 weeks ended December 31, 2017, $3,697,564 for the 52 weeks ended January 1, 2017, and $2,524,253 for the 52 weeks ended January 3, 2016.
Estimated amortization expense is as follows:
2018 | $ | 4,070,321 | |
2019 | 3,945,264 | ||
2020 | 3,913,627 | ||
2021 | 2,455,712 | ||
2022 | 1,305,314 | ||
Thereafter | 3,945,544 | ||
Total | $ | 19,635,782 | |
Note 6 — Long-term Debt
Old Senior Credit Facility
Until April 29, 2016, The Company had a senior credit facility with Citizens Bank, National Association (“Citizens”) under which we could borrow up to $20.0 million under a term loan and $25.0 million under a revolving line of credit. On April 29, 2016, in conjunction with the acquisition of Intasco, this senior credit facility was repaid and terminated and replaced with a new senior credit facility which is described below. On the date of termination there was $15.4 million outstanding under the Term Loan and $17.3 million outstanding under the revolving line of credit, all of which were repaid.
Borrowings under the revolving line of credit and term loan were subject to a borrowing base, bore interest at the 30 day LIBOR plus, in each case a margin that ranged from 2.75 percent to 3.25 percent, and were secured by substantially all of the Company’s assets. The half percent range per annum on the term loan and revolving line of credit was determined quarterly based on the senior leverage ratio. The Revolver was going to mature on December 18, 2017.
New Credit Agreement
On April 29, 2016, Unique Fabricating NA, Inc. (the “US Borrower”) and Unique-Intasco Canada, Inc. (the “CA Borrower”) and Citizens , acting as syndication agent, and other lenders, entered into a credit agreement (the “New Credit Agreement”) providing for borrowings of up to the aggregate principal amount of $62.0 million. The New Credit Agreement is a senior secured credit facility and consists of a revolving line of credit of up to $30.0 million (the “New Revolver”) to the US Borrower, a $17.0 million principal amount term loan (the “US Term Loan”) to the US Borrower, and a $15.0 million principal amount term loan (the “CA Term Loan”) to the CA Borrower. At Closing, the US Term Loan and the CA Term Loan were fully funded and the US Borrower borrowed approximately $22.9 million under the New Revolver. The borrowings were used to finance the acquisition of Intasco, including working capital adjustments and amounts paid into escrow, and to repay the Company’s existing senior credit facility, which was terminated as noted above.
On August 18, 2017, the US Borrower and the CA borrower entered into the Second Amendment (the “Amendment”) to the New Credit Agreement, with Citizens acting as syndication agent, and other lenders. The amendment converted $4.0 million of outstanding borrowings under the New Revolver into an additional $4.0 million term loan to the US borrower (the “US Term Loan II”). The conversion of a portion of the outstanding borrowings under the New Revolver did not reduce the aggregate amount available to be borrowed under it.
61
The New Revolver, US Term Loan, US Term Loan II, and CA Term Loan all mature on April 28, 2021 and bear interest at the Company's election of either (i) the greater of the Prime Rate or the Federal Funds Effective Rate (the “Base Rate”) or ii) the LIBOR rate, plus an applicable margin ranging from 1.75 percent to 2.50 percent per annum in the case of the Base Rate and 2.75 percent to 3.50 percent per annum in the case of the LIBOR rate, in each case, based on a senior leverage ratio threshold, measured quarterly.
In addition, the New Credit Agreement allows for increases in the principal amount of the New Revolver and the US and CA Term Loans not to exceed a $10.0 million principal amount, in the aggregate, provided that before and after giving effect to the proposed increase (and any transactions to be consummated using proceeds of the increase), the total leverage and debt service coverage ratios do not exceed specified amounts. The New Credit Agreement also provides for the issuance of letters of credit with a face amount of up to a $2.0 million, in the aggregate, provided that any letter of credit that is issued will reduce availability under the New Revolver.
As of December 31, 2017, $22,708,570 was outstanding under the New Revolver. This amount is gross of debt issuance costs which are further described in Note 1. The New Revolver had an effective interest rate of 5.069 percent per annum at December 31, 2017, and is secured by substantially all of the Company’s assets. At December 31, 2017, the maximum additional available borrowings under the New Revolver were $7,191,430, which includes a reduction for a $100,000 letter of credit issued for the benefit of the landlord of one of the Company’s leased facilities. The maximum amount available was further subject to borrowing base restrictions.
Long term debt consists of the following:
December 31, 2017 | January 1, 2017 | ||||||
US Term Loan, payable to lenders in quarterly installments of $318,750 through March 31, 2018, $425,000 through March 31, 2019, and $531,250 through March 31, 2021, with a lump sum due at maturity. The effective interest rate was 5.069% per annum at December 31, 2017. At December 31, 2017 the balance of the US Term Loan is presented net of a debt discount of $139,588 from costs paid to or on behalf of the lenders. | $ | 14,060,065 | $ | 15,862,309 | |||
US Term Loan II, payable to lenders in quarterly installments of $200,000 through March 31, 2021, with a lump sum due at maturity. The effective interest rate was 5.069% per annum at December 31. At December 31, 2017, the balance of the US Term Loan II is presented net of a debt discount of $33,602 from costs paid to or on behalf of the lenders. | 3,566,398 | — | |||||
CA Term Loan, payable to lenders in quarterly installments of $281,250 through March 31, 2018, $375,000 through March 31, 2019, and $468,750 through March 31, 2021, with a lump sum due at maturity. The effective interest rate was 5.069% per annum at December 31, 2017. At December 31, 2017 the balance of the CA Term Loan is presented net of a debt discount of $68,869 from costs paid to or on behalf of the lenders. | 12,962,381 | 14,066,732 | |||||
Note payable to the seller of former owner of business Unique acquired in 2014 which is unsecured and subordinated to the New Credit Agreement. Interest accrues monthly at an annual rate of 6 percent. The note payable is due in full on February 6, 2019. | 500,000 | 500,000 | |||||
Other debt | — | 5,446 | |||||
Total debt excluding revolver | 31,088,844 | 30,434,487 | |||||
Less current maturities | 3,799,998 | 2,405,446 | |||||
Long-term debt – Less current maturities | $ | 27,288,846 | $ | 28,029,041 | |||
The senior credit facility contains customary negative covenants and requires that the Company comply with various financial covenants including a total leverage ratio and a debt service coverage ratio, as defined in the New Credit Agreement. Also, the senior credit facility restricts dividends being paid to the Company from its subsidiaries. As of December 31, 2017 and January 1, 2017, the Company was in compliance with these covenants. Additionally, the US Term Loan and CA Term Loan contains a clause, effective January 1, 2017, that requires an excess cash flow payment to be made to the lenders to reduce
62
the US Term Loan or the CA Term Loan if the Company’s cash flow exceeds certain thresholds as defined by the New Credit Agreement and certain performance thresholds are not met.
Maturities on the Company’s Revolver and other long term debt obligations for the remainder of the current fiscal year and future fiscal years:
2018 | $ | 3,800,000 | |
2019 | 5,100,000 | ||
2020 | 4,800,000 | ||
2021 | 40,339,473 | ||
2022 | — | ||
Thereafter | — | ||
Total | 54,039,473 | ||
Discounts | (242,059 | ) | |
Debt issuance costs | (232,045 | ) | |
Total debt – Net | $ | 53,565,369 | |
Note 7 — Derivative Financial Instruments
Interest Rate Swap
The Company holds derivative financial instruments, in the form of an interest rate swaps, as required by its New Credit Agreement, for the purpose of hedging certain identifiable transactions in order to mitigate risks relating to the variability of future earnings and cash flows caused by interest rate fluctuations. The Company has elected not to apply hedge accounting for financial reporting purposes. The interest rate swaps are recognized in the accompanying consolidated balance sheets at their fair value. Monthly settlement payments due on the interest rate swap and changes in their fair value are recognized currently in net income as interest expense in the consolidated statements of operations.
Effective June 30, 2016, as required under the New Credit Agreement entered into during April 2016, the Company entered into a new interest rate swap which requires the Company to pay a fixed rate of 1.055 percent per annum while receiving a variable rate per annum based on the one month LIBOR for a net monthly settlement based on the notional amount. This terminated the old swap entered into on January 17, 2014. The notional amount at the effective date was $16,681,250 which decreased by $318,750 each quarter until June 30, 2017, and began decreasing by $425,000 per quarter until June 29, 2018, when it will begin decreasing by $531,250 per quarter until it expires on June 28, 2019. The Company paid $44,624, in the aggregate, in net monthly settlements with respect to the interest rate swap for the 52 weeks ended January 1, 2017. Both the change in fair value and the monthly settlements were included in interest expense in the consolidated statement of operations.
Effective October 2, 2017, as required under the Second Amendment to the New Credit Agreement, the Company entered into another interest rate swap that requires the Company to pay a fixed rate of 1.093 percent per annum while receiving a variable interest rate per annum based on the one month LIBOR for a net monthly settlement based on the notional amount in effect. The notional amount at the effective date was $1,900,000 which decreases by $100,000 each quarter until it expires on September 30, 2020. Both the change in fair value and the monthly settlements are included in interest expense in the consolidated statement of operations.
At December 31, 2017, the fair value of the two swaps was $159,320, and was included in other long-term assets in the consolidated balance sheet. The Company paid $1,159, in the aggregate, in net monthly settlements with respect to the interest rate swaps for the 52 weeks ended December 31, 2017.
Foreign Currency Forward Contract
Effective June 29, 2016, the Company entered into a foreign currency forward contract to hedge the Mexican Peso. The forward contract has an equivalent USD notional amount of $3,300,000 and expired on June 30, 2017. The Company is exposed to market risk, including fluctuations in foreign currency exchange rates which may result in cash flow risks, and as a result from time to time will enter into forward contracts to mitigate risks relating to the variability of future earnings and cash flows caused by foreign currency rate fluctuations. The Company elected not to apply hedge accounting for financial reporting
63
purposes. The foreign currency forward contract was recognized in the accompanying consolidated balance sheet at its fair value and changes in its fair value were recognized currently in net income as gain/losses on foreign currency exchange (which is part of other income (expense), net) in the consolidated statement of operations. At December 31, 2017 and January 1, 2017, the fair value of this foreign currency forward contract was $0 and $(168,880).
Note 8 — Restructuring
Unique's restructuring activities are undertaken as necessary to implement management's strategy, streamline operations, take advantage of available capacity and resources, and achieve net cost reductions. The restructuring activities generally relate to realignment of existing manufacturing capacity and closure of facilities and other exit or disposal activities, either in the normal course of business or pursuant to specific restructuring programs.
Fort Smith Restructuring
On February 13, 2018, subsequent to our 2017 fiscal year-end, the Company made the decision to close its manufacturing facility in Fort Smith, Arkansas. The Company currently expects to cease operations at the Fort Smith facility by end of June of 2018, and that approximately 20 positions will be eliminated as a result of the closure. The Company's decision resulted from our desire to streamline operations and to utilize some of the available excess capacity in other of our facilities. As such, the Company will move existing Fort Smith production to our manufacturing facilities in Evansville, Indiana and Monterrey, Mexico. The Company will provide the affected employees severance pay, health benefits continuation and job search assistance. The Company evaluated whether or not this closing met the criteria for discontinued operations and concluded that the closing did not meet the definition as the closing did not represent a strategic shift in the Company's operations and the Company will have continuing cash flows from the production being moved to other facilities within the Company.
The Company currently estimates that it will incur approximately $0.2 million in employee termination costs. At this time, the Company estimates the ranges of amounts of other major types of costs expected to be incurred in connection with the closure to be approximately $0.4 million to $0.5 million.
Following the closure, the Company expects to market the facility, which currently has a net book value of approximately $0.7 million, for sale.
Port Huron Restructuring
On February 1, 2018, subsequent to our 2017 fiscal year-end, the Company made the decision to close its manufacturing facility in Port Huron, Michigan. The Company currently expects to cease operations at the Port Huron facility by end of March of 2018 and expects that approximately 7 positions will be eliminated as a result of the closure. The Company's decision resulted from our desire to streamline operations and to utilize some of the available excess capacity in other of our facilities. As such, the Company will move existing Port Huron production to our manufacturing facilities in London, Ontario, Auburn Hills, Michigan, and Louisville, Kentucky. The Company will provide the affected employees severance pay, health benefits continuation and job search assistance. The Company evaluated whether or not this closing met the criteria for discontinued operations and concluded that the closing did not meet the definition as the closing did not represent a strategic shift in the Company's operations and the Company had continuing cash flows from the production being moved to other facilities within the Company.
The Company currently estimates that it will incur approximately $0.1 million in employee termination costs. At this time, the Company estimates the ranges of amounts of other major types of costs expected to be incurred in connection with the closure to be approximately $0.1 million to $0.2 million.
Murfreesboro Restructuring
On October 27, 2015, the Company announced the planned closure of its manufacturing facility located in Murfreesboro, Tennessee that resulted in a workforce reduction of approximately 30 employees. The planned closure of the Murfreesboro facility was effective in the fourth quarter of 2015 and completed in January 2016. The action was necessary due to the tight labor market in Murfreesboro and the struggle to staff production levels to meet the ongoing growth strategy for Murfreesboro's respective products manufactured at the plant. In order to ensure the Company's ability to service its customers at the increasing volumes projected for the future, the Company decided to move existing Murfreesboro production including equipment to the
64
Company's other manufacturing facilities in Evansville, Indiana and LaFayette, Georgia. The Company evaluated whether or not this closing met the criteria for discontinued operations and concluded that the closing did not meet the definition as the closing did not represent a strategic shift in the Company's operations and the Company had continuing cash flows from the production being moved to other facilities within the Company.
There were no costs incurred with respect to the Murfreesboro restructuring in 2017 as the restructuring and costs associated with the closure were all completed in 2016 as noted below.
The Company reversed severance related costs which had been previously been recorded as a result of this plant closure in the amount of $(51,951) in the 52 weeks ended January 1, 2017. The amount of other costs incurred associated with this plant closure, which primarily consisted of moving existing production equipment at Murfreesboro to other facilities was $87,005 in the 52 weeks ended January 1, 2017. The expenses were recorded to the restructuring expense line in continuing operations in the Company's consolidated statements of operations.
The Company sold the building it owned in Murfreesboro, which had a net book value of $2,033,327 on October 31, 2016, for cash proceeds of $2,175,185 resulting in a gain on the sale of $147,413. Through the date of the sale the building qualified as being held for sale, and therefore was presented as such in the consolidated balance sheet.
The tables below summarize the activity in the restructuring liability for the 52 weeks ended January 1, 2017.
Employee Termination Benefits Liability | Other Exit Costs Liability | Total | |||||||||
Accrual balance at January 3, 2016 | $ | 190,864 | $ | 63,327 | $ | 254,191 | |||||
Provision for estimated expenses incurred during the year | (51,951 | ) | 87,005 | 35,054 | |||||||
Payments made during the year | (138,913 | ) | (150,332 | ) | (289,245 | ) | |||||
Accrual balance at January 1, 2017 | $ | — | $ | — | $ | — | |||||
Note 9 — Redeemable Common Stock
On March 18, 2013, in conjunction with the acquisition of Unique Fabricating, and on December 18, 2013, in conjunction with the acquisition of Prescotech Holdings, Inc. (“PTI”), the Company issued shares of common stock to its subordinated lender. The 1,415,400 shares issued to the subordinated lender included features for the shares to be redeemed at their fair value on the sixth or seventh anniversary of the purchase or when the founders group, as defined, no longer owned 75 percent of the shares originally purchased by such group. The shares issued to the subordinated lender were accounted for as redeemable common stock due to the redemption feature being outside of the Company’s control. These shares were recorded initially using their net proceeds and were adjusted to their redemption value each period using a ratable allocation based on the Company’s estimate of the redemption date and fair value of the shares. The Company accreted the redemption value of these shares over the estimated redemption period to the earliest known redemption date with any changes in estimates accounted for prospectively. However, reductions in the redemption value were only recorded to the extent of previously recorded increases.
On January 14, 2013, the Company sold 999,999 shares of common stock for $0.167 per share to a group of founding shareholders. An agreement that existed before the closing of the Company's IPO required the Company to redeem these shares if the Company were sold, liquidated or completed an initial public offering for less than $4 per share. These shares were accounted for as redeemable common stock due to the redemption feature being outside of the Company’s control. These shares were recorded initially using their proceeds of $0.167 per share and there was not any accretion of these shares from this initial value because they were already recorded at their redemption value. The redemption value of the shares was $166,667.
Effective upon the closing of the IPO in July 2015, the Company’s 999,999 shares issued to the founder group at $0.167 per share were no longer redeemable as the IPO was completed at a price of more than $4 per share and the Company was no longer required to purchase these shares. Furthermore, the 1,415,400 shares issued to the subordinated lender were also no longer redeemable, effective upon the closing of the IPO, as the subordinated lender agreed to terminate its right to require the Company to repurchase its shares in exchange for the Company granting it certain registration rights. As a result, all of the shares included in redeemable common stock were reclassified to common stock and amounts attributable to redeemable common stock were allocated to common stock at par value and additional paid-in-capital.
65
As of the date immediately before the closing of the IPO, the redemption value of the redeemable shares was estimated to be $13,446,300 which was more than the initial proceeds. As a result, $1,364,031 of accretion was recorded immediately prior to the IPO. The redemption value was calculated based on the offering price of $9.50 per share in the IPO, as the offering closed just after the quarter ended June 28, 2015 and represented the best estimate of enterprise value of the Company.
Note 10 — Stock Incentive Plans
2013 Stock Incentive Plan
The Company’s board of directors approved a stock incentive plan (the “Plan”) in 2013. The Plan permits the Company to grant 495,000 non statutory or incentive stock options to the employees, directors and consultants of the Company. 495,000 shares of unissued common stock are reserved for the Plan. The board of directors has the authority to determine the participants to whom stock options shall be awarded as well as any restrictions to be placed upon the awards. The exercise price cannot be less than the fair value of the underlying shares at the time the stock options are issued and the maximum length of an award is ten years.
On July 17, 2013 and January 1, 2014, the board of directors approved the issuance of 375,000 and 120,000 non statutory stock option awards, respectively, to employees of the Company with an exercise price of $3.33 per share with a weighted average grant date fair value of $0.23 and $0.35 per share, respectively. On April 29, 2016, the Company issued 7,200 non statutory stock option awards to employees of the Company with an exercise price of $12.58 and with a weighted average grant date fair value of $2.80 per share. On September 15, 2017, the Company issued 5,000 non statutory stock option awards to employees of the Company with an exercise price of $7.65 per share and with a weighted average grant date fair value of $1.41 per share. All 4 grants of the awards vest 20 percent on the grant date and an additional 20 percent on each of the first, second, third and fourth anniversaries thereafter. Vested awards can only be exercised while the participants are employed by the Company.
The fair value of each option award is estimated on the grant date using a Black Scholes option pricing model that uses the weighted average assumptions noted in the following table. The expected volatility is based on the historical volatility of the stock of comparable companies. The expected term of the awards was estimated based on findings from academic studies investigating the average holding period for options adjusted for the Company’s size and risk factors. The risk free rate for periods within the contractual life of the option is based on the United States Treasury yield curve in effect at the time of grant.
September 15, 2017 | April 29, 2016 | January 1, 2014 | July 17, 2013 | ||||||||
Expected volatility | 40.00 | % | 40.00 | % | 34.00 | % | 34.00 | % | |||
Dividend yield | 7.00 | % | 5.00 | % | — | % | — | % | |||
Expected term (in years) | 5 | 5 | 4 | 4 | |||||||
Risk-free rate | 1.81 | % | 1.28 | % | 1.27 | % | 0.96 | % | |||
2014 Omnibus Performance Award Plan
In 2014 the board of directors and stockholders adopted the Unique Fabricating, Inc. 2014 Omnibus Performance Award Plan, or the 2014 Plan. The 2014 Plan provides for the grant of cash awards, stock options, stock appreciation rights, or SARs, shares of restricted stock and restricted stock units, or RSUs, performance shares and performance units. The 2014 Plan originally authorized the grant of awards relating to 250,000 shares of our common stock. In the event of any transaction that causes a change in capitalization, the Compensation Committee, such other committee administering the 2014 Plan or the board of directors will make such adjustments to the number of shares of common stock delivered, and the number and/or price of shares of common stock subject to outstanding awards granted under the 2014 Plan, as it deems appropriate and equitable to prevent dilution or enlargement of participants’ rights. An amendment approved in March of 2016 by our board of directors which was approved by our stockholders at our annual meeting of stockholders in June 2016, increased the number of shares authorized for grant of awards under the 2014 plan to a total of 450,000 shares of our common stock.
On August 17, 2015, the board of directors approved the issuance stock option awards for 230,000 shares of which 45,000 shares subject to non statutory options were granted to the board of directors, and 185,000 incentive stock options were granted to employees of the Company. All of the awards had an exercise price of $12.50 per share with a weighted average grant date
66
fair value of $2.72 per share. These awards vest 20 percent on the grant date and an additional 20 percent on each of the first, second, third and fourth anniversaries of the grant date thereafter. Vested awards can only be exercised while the participants are employed by the Company.
On November 20, 2015 the board of directors approved the issuance of stock option awards for 15,000 shares to employees of the Company. All of the awards had an exercise price of $11.50 per share with a weighted average grant date fair value of $2.23 per share. The vesting schedule, vesting percentage, and ability of the employees to exercise these options are the same as these for the August 17, 2015 grants described above.
On April 29, 2016 the board of directors approved the issuance of stock option awards for 5,000 shares to employees of the Company. All of the awards had an exercise price of $12.58 per share with a weighted average grant date fair value of $2.80 per share. The vesting schedule, vesting percentage, and ability of the employees to exercise these options are the same as these for the November 20 and August 17, 2015 grants described above.
On September 15, 2017 the board of directors approved the issuance of stock option awards for 15,000 shares to employees of the Company. All of the awards had an exercise price of $7.65 per share with a weighted average grant date fair value of $1.41 per share. The vesting schedule, vesting percentage, and ability of the employees to exercise these options are the same as these for the November 20, August 17, 2015, and April 29, 2016 grants described above.
The fair value of each option award is estimated on the grant date using a Black Scholes option pricing model that uses the weighted average assumptions noted in the following table. The expected volatility is based on the historical volatility of the stock of comparable companies. The expected term of the awards was estimated based on findings from academic studies investigating the average holding period for options adjusted for the Company’s size and risk factors. The risk free rate for periods within the contractual life of the option is based on the United States Treasury yield curve in effect at the time of grant.
September 15, 2017 | April 29, 2016 | November 20, 2015 | August 17, 2015 | ||||||||
Expected volatility | 40.00 | % | 40.00 | % | 35.00 | % | 38.00 | % | |||
Dividend yield | 7.00 | % | 5.00 | % | 5.00 | % | 4.80 | % | |||
Expected term (in years) | 5 | 5 | 5 | 5 | |||||||
Risk-free rate | 1.81 | % | 1.28 | % | 1.7 | % | 1.58 | % | |||
A summary of option activity under both plans is presented below:
Number of Shares | Weighted Average Exercise Price | Weighted Average Remaining Contractual Term (in years) | Aggregate Intrinsic Value(1) | |||||||||
Outstanding at January 1, 2017 | 629,880 | $ | 6.76 | 7.40 | ||||||||
Granted | 20,000 | $ | 7.65 | 10.00 | ||||||||
Exercised | 47,400 | $ | 3.33 | 0 | ||||||||
Forfeited or expired | — | $ | — | 0 | ||||||||
Outstanding at December 31, 2017 | 602,480 | $ | 7.06 | 6.58 | $ | 216,893 | ||||||
Vested and exercisable at December 31, 2017 | 467,560 | $ | 6.11 | 6.26 | $ | 612,504 | ||||||
(1) | The aggregate intrinsic value above is obtained by subtracting the weighted average exercise price from the estimated fair value of the underlying shares as of December 31, 2017 and multiplying this result by the related number of options outstanding and exercisable at December 31, 2017. The estimated fair value of the shares is based on the closing stock price of $7.42 as of December 31, 2017. |
The Company recorded gross compensation expense of $150,368 for the 52 weeks ended December 31, 2017, $166,476 for the 52 weeks ended January 1, 2017, and $205,845 for the 52 weeks ended January 3, 2016 in its consolidated statements of
67
operations, as a component of sales, general and administrative expenses. The income tax benefit related to share based compensation expense was $22,360 for the 52 weeks ended December 31, 2017, $54,549 for the 52 weeks ended January 1, 2017, and $64,882 for the 52 weeks ended January 3, 2016.
As of December 31, 2017, there was $235,289 of total unrecognized compensation cost related to nonvested stock option awards under the plans. That cost is expected to be recognized over a weighted average period of 1.74 years.
Note 11 — Income Taxes
Income before income taxes for U.S. and Non-U.S. operations are as follows:
Fifty-Two Weeks Ended December 31, 2017 | Fifty-Two Weeks Ended January 1, 2017 | Fifty-Two Weeks Ended January 3, 2016 | |||||||||
U.S. income | $ | 3,877,650 | $ | 8,820,049 | 6,310,039 | ||||||
Non-U.S. income | 3,741,921 | 1,121,690 | 1,033,223 | ||||||||
Income before income taxes | $ | 7,619,571 | $ | 9,941,739 | $ | 7,343,262 | |||||
The components of the income tax provision included in the consolidated statements of operations are all attributable to continuing operations and are detailed as follows:
Fifty-Two Weeks Ended December 31, 2017 | Fifty-Two Weeks Ended January 1, 2017 | Fifty-Two Weeks Ended January 3, 2016 | |||||||||
Current tax expense: | |||||||||||
Federal | $ | 1,206,992 | $ | 3,340,070 | $ | 2,256,970 | |||||
State | 292,702 | 355,748 | 244,253 | ||||||||
Foreign | 1,185,688 | 727,450 | 309,528 | ||||||||
Total | 2,685,382 | 4,423,268 | 2,810,751 | ||||||||
Deferred tax expense: | |||||||||||
Federal | (1,165,546 | ) | (766,716 | ) | (468,169 | ) | |||||
State | (235,622 | ) | (68,069 | ) | (41,310 | ) | |||||
Foreign | (151,334 | ) | (330,864 | ) | 13,052 | ||||||
Total | (1,552,502 | ) | (1,165,649 | ) | (496,427 | ) | |||||
Total income tax expense | $ | 1,132,880 | $ | 3,257,619 | $ | 2,314,324 | |||||
Deferred income tax assets and liabilities at December 31, 2017 and January 1, 2017 reflect the effect of temporary differences between amounts of assets, liabilities and equity for financial reporting purposes and the bases of such assets, liabilities and equity as measured based on tax laws, as well as tax loss and tax credit carryforwards. The following table summarizes the components of temporary differences and carryforwards that give rise to deferred tax assets and liabilities:
68
December 31, 2017 | January 1, 2017 | ||||||
Deferred tax assets (liabilities): | |||||||
Allowance for doubtful accounts | $ | 194,684 | $ | 224,966 | |||
Inventories | 118,813 | 198,130 | |||||
Accrued payroll and benefits | 491,214 | 776,309 | |||||
Other | 44,820 | 165,820 | |||||
Deferred tax asset | 849,531 | 1,365,225 | |||||
Property, plant, and equipment | (2,534,440 | ) | (3,417,377 | ) | |||
Goodwill and intangible assets | (405,293 | ) | (1,590,552 | ) | |||
Deferred tax liability | (2,939,733 | ) | $ | (5,007,929 | ) | ||
Total deferred tax liability | $ | (2,090,202 | ) | $ | (3,642,704 | ) | |
Management evaluates all positive and negative evidence and uses judgment regarding past and future events, including operating results, to help determine when it is more likely than not that all or some portion of the deferred tax assets may not be realized. When appropriate, a valuation allowance is recorded against deferred tax assets to reserve for future tax benefits that may not be realized. On the basis of this evaluation, the Company believes that it is more likely than not that all deferred tax will be realized and this, no valuation allowance was recorded as of December 31, 2017 or January 1, 2017.
U.S. income taxes have not been recognized on basis differences in investments that are deemed to be indefinitely reinvested outside the U.S. At December 31, 2017, unremitted earnings have been included in the computation of the transition tax associated with the Tax Act eliminating the basis differences in foreign subsidiaries. The Company remains indefinitely reinvested with respect to its initial investment and any associated potential withholding tax on earnings of its subsidiaries subject to the transition tax, as well as with respect to future earnings that will primarily fund the operations of the subsidiary; however, the Company continues to evaluate its position under SAB 118. As of January 1, 2017 no taxes were provided on basis differences in investments in foreign subsidiaries of $2,183,895 due to the indefinite reinvestment assertion.
A reconciliation of taxes on income from continuing operations based on the statutory federal income tax rate to the provision for income taxes is as follows:
Fifty-Two Weeks Ended December 31, 2017 | Fifty-Two Weeks Ended January 1, 2017 | Fifty-Two Weeks Ended January 3, 2016 | |||||||||
Income tax expense, computed at 34% of pretax income | $ | 2,590,654 | $ | 3,380,191 | $ | 2,496,709 | |||||
State income taxes, net of federal benefit | 66,607 | 193,070 | 133,784 | ||||||||
Foreign tax rate differential | (206,432 | ) | (51,388 | ) | (28,753 | ) | |||||
Impact of U.S. tax reform (1) | (559,286 | ) | — | — | |||||||
Research and Development credits | (681,957 | ) | — | — | |||||||
Other | (76,706 | ) | (264,254 | ) | (287,416 | ) | |||||
Total provision for income taxes | $ | 1,132,880 | $ | 3,257,619 | $ | 2,314,324 | |||||
(1) | On December 22, 2017 the Tax Cuts and JOBS Act (the “Act”) was signed into law. The Act changed many aspects of U.S. corporate income taxation and included the reduction of the corporate income tax rate from 35% to 21%. The Act also included implementation of a territorial system and imposition of a one-time tax on deemed repatriated earnings of foreign subsidiaries. We recognized the impact of the Act for the fifty-two weeks ended December 31, 2017. The impact primarily consists of a $(1,357,472) benefit related to the impact on the U.S. deferred tax liability due to the lowering of the corporate tax rate described above and $798,186 of expense for the estimate for the impact of one-time transition tax on deemed repatriated earnings of foreign subsidiaries. We will continue to assess our provision for income taxes as future guidance becomes available, however we do not currently anticipate significant revisions will be necessary. Any such revisions will be treated in accordance with the measurement period guidance outlined in Staff Accounting Bulletin No. 118. The Act creates a |
69
new requirement that certain income such as Global Intangible Low-Taxed Income (“GILTI”) earned by a controlled foreign corporation (“CFC”) must be included in the gross income of the CFC U.S. shareholder. Because of the complexity of the new GILTI rules, we are continuing to evaluate these provisions of the Act and whether taxes due on future U.S. inclusions related to GILTI should be recorded as a current-period expense when incurred, or factored into a company’s measurement of its deferred taxes. As a result, we have not included an estimate of the tax expense or benefit related to this item for the period ended December 31, 2017.
The Company recognizes the benefit of a tax position when it is more likely than not, based on the technical merits, that the position will be sustained upon examination. For tax positions meeting the more likely than not threshold, the amount recognized in the financial statements is the largest benefit that has a greater than 50 percent likelihood of being realized upon settlement with the relevant tax authority. The Company assesses all tax positions for which the statute of limitations remain open. The Company had no unrecognized tax benefits as of December 31, 2017 and January 1, 2017. The Company recognizes any penalties and interest when necessary as income tax expense. There were no penalties or interest recorded during the 52 weeks ended December 31, 2017, January 1, 2017, and January 3, 2016, respectively.
The Company files income tax returns in the United States, Mexico, and Canada as well as in various state and local jurisdictions. With few exceptions, the Company is no longer subject to income tax examinations by tax authorities for years before 2015 in the United States and before 2012 in Mexico.
Note 12 — Operating Leases
The Company leases office space, production facilities and equipment under operating leases with various expiration dates through the year 2022. The leases for office space and production facilities require the Company to pay taxes, insurance, utilities and maintenance costs. Five of the leases provide for escalating rents over the life of the lease and rent expense is therefore recognized over the term of the lease on a straight line basis, with the difference between lease payments and rent expense recorded as deferred rent in accrued expenses in the consolidated balance sheets. Total rent expense charged to operations was approximately $2,198,051 for the 52 weeks ended December 31, 2017, $2,019,073 for the 52 weeks ended January 1, 2017, and $1,442,155 for the 52 weeks ended January 3, 2016.
Future minimum lease payments required under operating leases that have initial or remaining non-cancelable lease terms in excess of one year are as follows at December 31, 2017:
2018 | $ | 2,252,038 | |
2019 | 1,855,354 | ||
2020 | 1,323,259 | ||
2021 | 510,045 | ||
2022 | 376,878 | ||
Thereafter | — | ||
Total | $ | 6,317,574 | |
Note 13 — Retirement Plans
The Company maintains a defined contribution plan covering certain full time salaried employees. Employees can make elective contributions to the plan. The Company contributes 100 percent of an employee’s contribution up to the first 3 percent of each employee’s total compensation and 50 percent for the next 2 percent of each employee’s total compensation. In addition, the Company, at the discretion of the board of directors, may make additional contributions to the plan on behalf of the plan participants. The Company contributed $451,572 for the 52 weeks ended December 31, 2017, $409,247 for the 52 weeks ended January 1, 2017, and $368,650 for the 52 weeks ended January 3, 2016
The Intasco operations acquired in April 2016 have separate retirement plans. The United States facility sponsors a SIMPLE IRA account for qualifying employees. The plan makes a contribution equal to 3 percent of a participant's gross wages to the participating employees' SIMPLE IRA accounts. Contributions by Intasco in the United States totaled $3,247 for the 52 weeks ended December 31, 2017 and $3,010 for the 52 weeks ended January 1, 2017.
The Canadian facility sponsors a retirement plan whereby Intasco makes a matching contribution of participant contributions up to a maximum amount based on the participants' number of years of service. Contributions by Intasco in Canada totaled $40,643 for the 52 weeks ended December 31, 2017 and $28,195 for the 52 weeks ended January 1, 2017.
70
Note 14 — Related Party Transactions
A stockholder provided subordinated debt financing which is discussed further in Note 6. Effective upon the closing of the IPO, as disclosed in Note 1, this subordinated debt amount was paid off in full with the proceeds received from the IPO. Interest charges were recognized in the amounts of $0 for the 52 weeks ended December 31, 2017, $0 for the 52 weeks ended January 1, 2017, and $1,514,901 for the 52 weeks ended January 3, 2016 related to the subordinated debt financing.
Effective March 18, 2013, the Company is under a five year management agreement with a firm related to several stockholders. The agreement initially provided for annual management fees of $300,000 and additional fees for assistance provided with acquisitions. Effective upon completion of the IPO, the agreement was amended to reduce the annual management fee by an amount equal to the amount, if any, of annual cash retainers and equity awards received as compensation for service on the board of directors by any person who is a related person of Taglich Private Equity, LLC or Taglich Brothers, Inc. The Company incurred management fees of $225,000 for the 52 weeks ended December 31, 2017, $225,000 for the 52 weeks ended January 1, 2017, and $275,000 for the 52 weeks ended January 3, 2016. During the 52 weeks ended January 1, 2017, the Company incurred additional management fees related to the acquisition of Intasco on April 29, 2016 of $259,000. During the 52 weeks ended January 3, 2016, the Company incurred additional management fees related to the acquisition of Great Lakes on August 31, 2015 of $220,000. The Company allocates these fees to the services provided based on their relative fair values. The fees paid were all allocated to and expensed as transaction costs.
Taglich Brothers, Inc. acted as Joint Book Running Manager and a co-representative of the underwriters of our IPO. Taglich Brothers, Inc. received underwriting discounts and commissions of $975,603 in the IPO during the 52 weeks ended January 3, 2016. As mentioned in Note 1, upon closing of the IPO, the Company issued to the underwriters warrants to purchase up to 141,000 shares of common stock, as additional compensation. Taglich Brothers, Inc. was issued 70,500 of these warrants during the 52 weeks ended January 3, 2016. The Company also paid certain expenses and disbursements of the underwriters, which included legal fees, road show expenses, and non accountable expenses. The Company paid $141,684 of these expenses on behalf of or to Taglich Brothers, Inc. during the 52 weeks ended January 3, 2016.
Note 15 — Fair Value Measurements
Financial instruments consist of cash equivalents, accounts receivable, accounts payable and debt. The carrying amount of all significant financial instruments approximates fair value due to either the short maturity or the existence of variable interest rates that approximate prevailing market rates.
Accounting standards require certain other items be reported at fair value in the financial statements and provides a framework for establishing that fair value. The framework for determining fair value is based on a hierarchy that prioritizes the valuation techniques and inputs used to measure fair value.
Fair values determined by Level 1 inputs use quoted prices in active markets for identical assets or liabilities that the Company has the ability to access.
Fair values determined by Level 2 inputs use other inputs that are observable, either directly or indirectly. Level 2 inputs may include quoted prices for similar items in active markets, and other inputs such as interest rates and yield curves that are observable at commonly quoted intervals.
Level 3 inputs are unobservable inputs, including inputs that are available in situations where there is little, if any, market activity for the related item. Level 3 fair value measurements are based primarily on management’s own estimates using inputs such as pricing models, discounted cash flow methodologies or similar techniques taking into account the characteristics of the item.
In instances whereby inputs used to measure fair value fall into different levels of the fair value hierarchy, fair value measurements in their entirety are categorized based on the lowest level input that is significant to the valuation. The Company’s assessment of the significance of particular inputs to these fair value measurements requires judgment and considers factors specific to each item.
The Company measures its interest rate swap at fair value on a recurring basis based primarily on Level 2 inputs using an income model based on disparity between variance and fixed interest rates, the scheduled balance of principal outstanding, yield curves and other information readily available in the market.
71
The Company measures its foreign currency forward contract on a recurring basis based primarily on Level 2 inputs using the present value of future cash flows to be incurred on the contracts. In accordance with market standards and conventions for valuing such contracts, the transactions reflect the current direction and amounts expected in each currency, spot exchange rates at period-end, discount factors and forward interest rate curves for each relevant currency pair and future maturity date. This forward contract expired in fiscal year 2017.
Note 16 — Contingencies
The Company is engaged from time to time in legal matters and proceedings arising out of its normal course of business. The Company establishes a liability related to its legal proceedings and claims when it has determined that it is probable that the Company has incurred a liability and the related amount can be reasonably estimated. If the Company determines that an obligation is reasonably possible, the Company will, if material, disclose the nature of the loss contingency and the estimated range of possible loss, or include a statement that no estimate of loss can be made. While uncertainties are inherent in the final outcome of such matters, the Company believes that there are no pending proceedings in which the Company is currently involved that will have a material effect on its financial position, results of operations or cash flow.
Note 17 — Earnings Per Share
Basic earnings per share is computed by dividing the net income by the weighted-average number of shares outstanding during the period. Diluted earnings per share is computed giving effect to all potentially weighted average dilutive shares including stock options and warrants. The dilutive effect of outstanding awards, if any, is reflected in diluted earnings per share by application of the treasury stock method.
The following table sets forth the computation of basic and diluted earnings per share.
Fifty-Two Weeks Ended December 31, 2017 | Fifty-Two Weeks Ended January 1, 2017 | Fifty-Two Weeks Ended January 3, 2016 | |||||||||
Basic earnings per share calculation: | |||||||||||
Net income | $ | 6,486,691 | $ | 6,684,120 | $ | 5,028,938 | |||||
Net income attributable to common stockholders | $ | 6,486,691 | $ | 6,684,120 | $ | 5,028,938 | |||||
Weighted average shares outstanding | 9,750,948 | 9,678,316 | 8,174,418 | ||||||||
Net income per share-basic | $ | 0.67 | $ | 0.69 | $ | 0.62 | |||||
Diluted earnings per share calculation: | |||||||||||
Net income | $ | 6,486,691 | $ | 6,684,120 | $ | 5,028,938 | |||||
Weighted average shares outstanding | 9,750,948 | 9,678,316 | 8,174,418 | ||||||||
Effect of dilutive securities: | |||||||||||
Stock options(1)(2)(3) | 147,316 | 204,948 | 203,665 | ||||||||
Warrants(1)(2)(3) | 1,154 | 13,019 | 48,855 | ||||||||
Diluted weighted average shares outstanding | 9,899,418 | 9,896,283 | 8,426,938 | ||||||||
Net income per share-diluted | $ | 0.66 | $ | 0.68 | $ | 0.60 | |||||
(1) Options to purchase 345,280 shares of common stock remaining to be exercised under the 2013 plan, and warrants to purchase 1,185 shares of common stock remaining to be exercised, were considered in the computation of diluted earnings per share using the treasury stock method in the 2017 calculation. Options to purchase 225,000 shares of common stock that were granted in August 2015 and November 2015 remaining to be exercised, as discussed in Note 10, under the 2014 plan, options to purchase 7,200 shares of common stock and 5,000 shares of common stock that were granted under the 2013 and 2014 plan, respectively, in April 2016, 5,000 and 15,000 shares of common stock that were granted under the 2013 and 2014 plan, respectively, in September 2017, and warrants to purchase 141,000 shares of common stock issued to the underwriters of the
72
Company's IPO in July 2015, were not included in the computation of diluted earnings per share in the 2017 period because the effect would have been anti-dilutive.
(2) Options to purchase 392,680 shares of common stock remaining to be exercised under the 2013 plan, warrants to purchase 2,286 shares of common stock remaining to be exercised, warrants to purchase 141,000 shares issued to the underwriters in July 2015 as noted in Note 1, and options to purchase 15,000 shares of common stock that were granted in August 2015, as discussed in Note 10 under the 2014 plan, were considered in the computation of diluted earnings per share using the treasury stock method in the 2016 calculation. Options to purchase 210,000 shares of common stock that were granted on January 1, 2014 remaining to be exercised under the 2013 plan and 12,200 shares of common stock that were granted under the 2013 and 2014 plan in April 2016 as noted in Note 10, were not included in the computation of diluted earnings per share in the 2016 period because the effect would have been anti-dilutive.
(3) Options to purchase 450,000 shares of common stock remaining to be exercised,warrants to purchase 24,504 shares of common stock remaining to be exercised and warrants to purchase 141,000 shares issued to the underwriters granted in July 2015, as noted in Note 1, were considered in the computation of diluted earnings per share using the treasury stock method in the 2015 calculation. Options to purchase 245,000 shares of common stock that were granted in August 2015 and November 2015 under the 2014 plan, as noted in Note 10, were not included in the computation of diluted earnings per share in the 2015 period because the effect would have been anti-dilutive.
Note 18 — Selected Quarterly Financial Data (unaudited)
The following tables set forth a condensed summary of the Company's unaudited selected quarterly results for each of the quarters in fiscal 2017 and 2016.
Thirteen Weeks Ended April 2, 2017 | Thirteen Weeks Ended July 2, 2017 | Thirteen Weeks Ended October 1, 2017 | Thirteen Weeks Ended December 31, 2017 | ||||||||||||
2017 | |||||||||||||||
Net sales | $ | 47,857,096 | $ | 44,518,039 | $ | 41,231,366 | $ | 41,681,481 | |||||||
Gross profit | $ | 11,107,161 | $ | 10,666,091 | $ | 8,974,926 | $ | 9,305,356 | |||||||
Operating income | 3,515,457 | 3,070,774 | 1,706,114 | 1,994,325 | |||||||||||
Net income | $ | 2,046,837 | $ | 1,668,410 | $ | 715,106 | $ | 2,056,338 | |||||||
Net income per share | |||||||||||||||
Basic | $ | 0.21 | $ | 0.17 | $ | 0.07 | $ | 0.21 | |||||||
Diluted | $ | 0.21 | $ | 0.17 | $ | 0.07 | $ | 0.21 | |||||||
Thirteen Weeks Ended April 3, 2016 | Thirteen Weeks Ended July 3, 2016 | Thirteen Weeks Ended October 2, 2016 | Thirteen Weeks Ended January 1, 2017 | ||||||||||||
2016 | |||||||||||||||
Net sales | $ | 39,982,504 | $ | 42,048,220 | $ | 44,753,565 | $ | 43,678,664 | |||||||
Gross profit | $ | 9,599,946 | $ | 9,091,238 | $ | 11,250,348 | $ | 9,602,935 | |||||||
Operating income | $ | 3,010,291 | $ | 1,926,252 | $ | 4,301,314 | $ | 2,747,103 | |||||||
Net income | $ | 1,833,651 | $ | 599,172 | $ | 2,520,199 | $ | 1,731,098 | |||||||
Net income per share | |||||||||||||||
Basic | $ | 0.19 | $ | 0.06 | $ | 0.26 | $ | 0.18 | |||||||
Diluted | $ | 0.19 | $ | 0.06 | $ | 0.25 | $ | 0.17 | |||||||
Note 19 — Subsequent Events
73
Declaration of Cash Dividend
On February 16, 2018, our board of directors declared a quarterly cash dividend of $0.15 per common share. The dividend will be payable on March 7, 2018 to shareholders of record at the close of business on February 28, 2018 for an amount of approximately $1.5 million.
74
ITEM 9. CHANGES IN AND DISAGREEMENTS WITH ACCOUNTANTS ON ACCOUNTING AND FINANCIAL DISCLOSURE
None
ITEM 9A. CONTROLS AND PROCEDURES
Evaluation of Disclosure Controls and Procedures
Our management establishes and maintains disclosure controls and procedures (as defined in Exchange Act Rules 13a-15(e) and 15d-15(e)) to ensure that the information we disclose under the Exchange Act is properly and timely reported. We provide this information to our Chief Executive Officer and Chief Financial Officer as appropriate to allow for timely decisions.
Our controls and procedures are based on assumptions. Additionally, even effective controls and procedures only provide reasonable assurance of achieving their objectives. Accordingly, we cannot guarantee that our controls and procedures will succeed or be adhered to in all circumstances.
We have evaluated our disclosure controls and procedures, with the participation, and under the supervision, of our management, including our Chief Executive Officer and Chief Financial Officer. Based on this evaluation, our Chief Executive and Chief Financial Officer have concluded that our disclosure controls and procedures were effective as of the end of the period covered by this report.
Management's Report on Internal Control Over Financial Reporting
Management is responsible for establishing and maintaining adequate internal control over financial reporting, as such term is defined in Exchange Act Rules 13a-15(f) and 15d-15(f), for the Company. Under the supervision of the Chief Executive Officer and Chief Financial Officer, management conducted an evaluation of the effectiveness of the Company's internal control over financial reporting as of December 31, 2017 based on the framework set forth by the Committee of Sponsoring Organizations of the Treadway Commission (COSO) in “Internal Control-Integrated Framework (2013).” Based on that evaluation, management has concluded that the Company's internal control over financial reporting was effective as of December 31, 2017.
This Annual Report on From 10-K does not include an attestation report of our registered public accounting firm due to a transition period established by the rules of the SEC for newly public companies status as an “emerging growth company” under the JOBS Act.
Changes in Internal Control over Financial Reporting
Except in connection with the Intasco acquisition completed during the fifty-two weeks ended January 1, 2017, there were no material changes in the Company's internal controls over financial reporting during the fifty-two weeks ended December 31, 2017 that have materially affected, or are reasonably likely to materially affect, the Company's internal controls over financial reporting. The Company integrated Intasco into the Company's operations and internal control processes during the fifty-two weeks ended December 31, 2017.
ITEM 9B. OTHER INFORMATION
None
75
PART III
ITEM 10. DIRECTORS, EXECUTIVE OFFICERS, AND CORPORATE GOVERNANCE
The information called for by Item 10, as to compliance with Section 16(a) of the Exchange Act, is incorporated by reference to the Company’s Definitive Proxy Statement to be filed with the SEC pursuant to Regulation 14A in connection with the Company’s 2017 Annual Meeting of Shareholders (the “Proxy Statement”) to be filed within 120 days after the fiscal year covered by this Annual Report on Form 10-K and is incorporated herein by reference.
The Company has adopted a code of ethics, which applies to its principal executive officer, principal financial officer, and all other employees and non-employee directors of the Company. The Code of Ethical Business Conduct is posted on the Company’s website (www.uniquefab.com). The Company intends to satisfy the disclosure requirement under Item 5.05 of Form 8-K regarding an amendment to, or waiver from, a provision of the code of ethics that applies to the Company’s principal executive officer and principal financial officer, by posting such information on the Company’s website, at the address specified above.
The Company’s Corporate Governance Guidelines and charters for each Committee of its Board of Directors are also available on the Company’s website.
Information on the Company’s website is not deemed to be incorporated by reference into this Annual Report on Form 10-K.
ITEM 11. EXECUTIVE COMPENSATION
The information called for by Item 11 will be included in the Proxy Statement, and such information is incorporated herein by reference.
ITEM 12. SECURITY OWNERSHIP OF CERTAIN BENEFICIAL OWNERS AND MANAGEMENT AND RELATED STOCKHOLDER MATTERS
The information called for by Item 12 will be included in the Proxy Statement, and such information is incorporated herein by reference.
ITEM 13. CERTAIN RELATIONSHIPS AND RELATED TRANSACTIONS, AND DIRECTOR INDEPENDENCE
The information called for by Item 13 will be included in the Proxy Statement, and such information is incorporated herein by reference.
ITEM 14. PRINCIPAL ACCOUNTING FEES AND SERVICES
The information called for by Item 14 will be included in the Proxy Statement, and such information is incorporated herein by reference.
76
PART IV
ITEM 15. EXHIBITS AND FINANCIAL STATEMENT SCHEDULES
(a) The following documents are filed as part of this Form 10-K
(1) Financial Statements
Reports of Independent Registered Public Accounting Firms
Consolidated Balance Sheets as of December 31, 2017 and January 1, 2017
Consolidated Statements of Operations for the Fifty-Two Weeks Ended December 31, 2017, January 1, 2017 and January 3, 2016
Consolidated Statements of Stockholders' Equity for the Fifty-Two Weeks Ended December 31, 2017, January 1, 2017 and January 3, 2016
Consolidated Statements of Cash Flows for the Fifty-Two Weeks Ended December 31, 2017, January 1, 2017 and January 3, 2016
(2) Financial Statement Schedules: Financial statement schedules have been omitted as information required is inapplicable or the information is presented in the consolidated financial statements and the related notes
(3) Exhibits
Exhibit No. | Description | |
77
78
101.INS+ | XBRL Instance Document | |
101.SCH+ | XBRL Taxonomy Extension Schema Document | |
101.CAL+ | XBRL Taxonomy Calculation Linkbase Document | |
101.DEF+ | XBRL Taxonomy Definition Linkbase Document | |
101.LAB+ | XBRL Taxonomy Label Linkbase Document | |
101.PRE+ | XBRL Taxonomy Presentation Linkbase Document | |
* Filed herewith.
** Pursuant to Item 601(b)(32)(ii) of Regulation S-K(17 C.F.R 229.601(b)(32)(ii)), this certification is deemed furnished, not filed, for purposes of section 18 of the Exchange Act, nor is it otherwise subject to liability under that section. It will not be deemed to be incorporated by reference into any filing under the Securities Act or the Exchange Act, except if the registrant specifically incorporates it by reference.
+ Filed electronically with the report.
# Indicates management contract or compensatory plan, contract or agreement.
79
SIGNATURES
Pursuant to the requirements of the Section 13 or 15(d) of the Securities Exchange Act of 1934, the registrant has duly caused this report to be signed on its behalf by the undersigned, thereunto duly authorized.
UNIQUE FABRICATING, INC. | ||
Date: March 8, 2018 | By: | /s/ John Weinhardt |
Name: John Weinhardt | ||
Title: President and Chief Executive Officer | ||
Pursuant to the requirements of the Securities Act of 1934, this report has been signed by the following persons on behalf of the registrant and in the capacities and on the date indicated.
By: | /s/ John Weinhardt | By: | /s/ Richard L. Baum |
Name: John Weinhardt | Name: Richard L Baum | ||
Title: Chief Executive Officer, President and Director (Principal Executive Officer) | Title: Chairman of the Board | ||
Dated: | March 8, 2018 | Dated: | March 8, 2018 |
By: | /s/ Thomas Tekiele | By: | /s/ Paul Frascoia |
Name: Thomas Tekiele | Name: Paul Frascoia | ||
Title: Chief Financial Officer (Principal Financial and Accounting Officer) | Title: Director | ||
Dated: | March 8, 2018 | Dated: | March 8, 2018 |
By: | /s/ Mary Kim Korth | By: | /s/ William Cooke |
Name: Mary Kim Korth | Name: William Cooke | ||
Title: Director | Title: Director | ||
Dated: | March 8, 2018 | Dated: | March 8, 2018 |
By: | /s/ James Illikman | By: | /s/ Donn Viola |
Name: James Illikman | Name: Donn Viola | ||
Title: Director | Title: Director | ||
Dated: | March 8, 2018 | Dated: | March 8, 2018 |
80
Exhibit 21.1
UNIQUE FABRICATING, INC.
ALL SUBSIDIARIES
Entity Name |
Unique Fabricating NA, Inc. |
Unique Fabricating South, Inc. |
Unique Fabricating de Mexico S.A. de C.V. |
Unique-Prescotech, Inc. |
Unique-Chardan, Inc. |
Unique-Molded Foam Technologies, Inc. |
Unique-Intasco USA, Inc. |
Unique-Intasco Canada, Inc. |
Exhibit 23.1
CONSENT OF INDEPENDENT REGISTERED PUBLIC ACCOUNTING FIRM
We consent to the incorporation by reference in Registration Statement No. 333-206140 and No. 333-212193 on Form S-8 and Registration Statement No. 333-213409 on Form S-3 of our report dated March 8, 2018, relating to the financial statements of Unique Fabricating, Inc. and subsidiaries appearing in this Annual Report on Form 10-K of Unique Fabricating, Inc. for the year ended December 31, 2017.
/s/ Deloitte & Touche, LLP
Detroit, Michigan
March 8, 2018
Exhibit 23.2
CONSENT OF INDEPENDENT REGISTERED PUBLIC ACCOUNTING FIRM
We hereby consent to the incorporation by reference in the Registration Statements on Form S-8 (Nos. 333-206140 and 333-212193) and Form S-3 (No. 333-213409) of Unique Fabricating, Inc. of our report dated March 9, 2016, relating to the consolidated financial statements of Unique Fabricating, Inc. which appears in this Form 10-K.
/s/ Baker Tilly Virchow Krause, LLP
Pittsburgh, Pennsylvania
March 8, 2018
Exhibit 31.1
CERTIFICATION OF CHIEF EXECUTIVE OFFICER
PURSUANT TO 18 U.S.C. SECTION 1350.
AS ADOPTED PURSUANT TO SECTION 302 OF THE SARBANES-OXLEY ACT OF 2002
I, John Weinhardt, certify that:
1. I have reviewed this annual report on Form 10-K of Unique Fabricating, Inc..;
2. Based on my knowledge, this report does not contain any untrue statement of a material fact or omit to state a material fact necessary to make the statements made, in light of the circumstances under which such statements were made, not misleading with respect to the period covered by this report;
3. Based on my knowledge, the financial statements, and other financial information included in this report, fairly present in all material respects the financial condition, results of operations and cash flows of the registrant as of, and for, the periods presented in this report;
4. The registrant’s other certifying officer and I are responsible for establishing and maintaining disclosure controls and procedures (as defined in Exchange Act Rules 13a-15(e) and 15d-15(e)) and [reserved] for the registrant and have:
(a) Designed such disclosure controls and procedures, or caused such disclosure controls and procedures to be designed under our supervision, to ensure that material information relating to the registrant, including its consolidated subsidiaries, is made known to us by others within those entities, particularly during the period in which this report is being prepared;
(b) Designed such internal control over financial reporting, or caused such internal control over financial reporting to be designed under our supervision, to provide reasonable assurance regarding the reliability of financial reporting and the preparation of financial statements for external purposes in accordance with generally accepted accounting principles;
(c) Evaluated the effectiveness of the registrant’s disclosure controls and procedures and presented in this report our conclusions about the effectiveness of the disclosure controls and procedures, as of the end of the period covered by this report based on such evaluation; and
(d) Disclosed in this report any change in the registrant’s internal control over financial reporting (as defined in Exchange Act Rules 13a-15(f) and 15d-15(f)) that occurred during the registrant’s most recent fiscal quarter (the registrant’s fourth fiscal quarter in the case of an annual report) that has materially affected, or is reasonably likely to materially affect, the registrant’s internal control over financial reporting; and
5. The registrant’s other certifying officer and I have disclosed, based on our most recent evaluation of internal control over financial reporting, to the registrant’s auditors and the audit committee of the registrant’s board of directors (or persons performing the equivalent functions):
(a) All significant deficiencies and material weaknesses in the design or operation of internal control over financial reporting which are reasonably likely to adversely affect the registrant’s ability to record, process, summarize and report financial information; and
(b) Any fraud, whether or not material, that involves management or other employees who have a significant role in the registrant’s internal control over financial reporting.
Date: March 8, 2018 | By: | /s/ John Weinhardt |
Name: John Weinhardt | ||
Title: President and Chief Executive Officer | ||
Exhibit 31.2
CERTIFICATION OF CHIEF FINANCIAL OFFICER
PURSUANT TO 18 U.S.C. SECTION 1350.
AS ADOPTED PURSUANT TO SECTION 302 OF THE SARBANES-OXLEY ACT OF 2002
I, Thomas Tekiele, certify that:
1. I have reviewed this annual report on Form 10-K of Unique Fabricating, Inc..;
2. Based on my knowledge, this report does not contain any untrue statement of a material fact or omit to state a material fact necessary to make the statements made, in light of the circumstances under which such statements were made, not misleading with respect to the period covered by this report;
3. Based on my knowledge, the financial statements, and other financial information included in this report, fairly present in all material respects the financial condition, results of operations and cash flows of the registrant as of, and for, the periods presented in this report;
4. The registrant’s other certifying officer and I are responsible for establishing and maintaining disclosure controls and procedures (as defined in Exchange Act Rules 13a-15(e) and 15d-15(e)) and [reserved] for the registrant and have:
(a) Designed such disclosure controls and procedures, or caused such disclosure controls and procedures to be designed under our supervision, to ensure that material information relating to the registrant, including its consolidated subsidiaries, is made known to us by others within those entities, particularly during the period in which this report is being prepared;
(b) Designed such internal control over financial reporting, or caused such internal control over financial reporting to be designed under our supervision, to provide reasonable assurance regarding the reliability of financial reporting and the preparation of financial statements for external purposes in accordance with generally accepted accounting principles;
(c) Evaluated the effectiveness of the registrant’s disclosure controls and procedures and presented in this report our conclusions about the effectiveness of the disclosure controls and procedures, as of the end of the period covered by this report based on such evaluation; and
(d) Disclosed in this report any change in the registrant’s internal control over financial reporting (as defined in Exchange Act Rules 13a-15(f) and 15d-15(f)) that occurred during the registrant’s most recent fiscal quarter (the registrant’s fourth fiscal quarter in the case of an annual report) that has materially affected, or is reasonably likely to materially affect, the registrant’s internal control over financial reporting; and
5. The registrant’s other certifying officer and I have disclosed, based on our most recent evaluation of internal control over financial reporting, to the registrant’s auditors and the audit committee of the registrant’s board of directors (or persons performing the equivalent functions):
(a) All significant deficiencies and material weaknesses in the design or operation of internal control over financial reporting which are reasonably likely to adversely affect the registrant’s ability to record, process, summarize and report financial information; and
(b) Any fraud, whether or not material, that involves management or other employees who have a significant role in the registrant’s internal control over financial reporting.
Date: March 8, 2018 | By: | /s/ Thomas Tekiele |
Name: Thomas Tekiele | ||
Title: Chief Financial Officer (Principal Financial and Accounting Officer) | ||
Exhibit 32.1
CERTIFICATION PURSUANT TO 18 U.S.C. SECTION 1350.
AS ADOPTED PURSUANT TO SECTION 906
OF THE SARBANES-OXLEY ACT OF 2002
Under 18 U.S.C. section 1350, adopted by section 906 of the Sarbanes-Oxley Act of 2002, in connection with the attached annual report on Form 10-K for the year ended January 3, 2016, the undersigned each certify that (i) the annual report fully complies with the requirements of section 13(a) or 15(d) of the Securities Exchange Act of 1934 and (ii) the information contained in the annual report fairly presents, in all material respects, the financial condition and results of operations of the issuer.
Date: March 8, 2018 | By: | /s/ John Weinhardt |
Name: John Weinhardt | ||
Title: President and Chief Executive Officer | ||
Date: March 8, 2018 | By: | /s/ Thomas Tekiele |
Name: Thomas Tekiele | ||
Title: Chief Financial Officer (Principal Financial and Accounting Officer) | ||
The foregoing certification is being furnished as an exhibit to the Form 10-K pursuant to Item 601(b)(32) of Regulation S-K and Section 906 of the Sarbanes-Oxley Act of 2002 (subsections (a) and (b) of Section 1350, Chapter 63 of Title 18, United States Code) and, accordingly, is not being filed as part of the Form 10-K for purposes of Section 18 of the Securities and Exchange Act of 1934, as amended, and is not incorporated by reference into any filing of the Company, whether made before or after the date hereof, regardless of any general incorporation language in such filing.