
Form 10-K BG Staffing, Inc. For: Dec 31
UNITED STATES
SECURITIES AND EXCHANGE COMMISSION
Washington, DC 20549
_______________
FORM 10-K
_______________
(Mark One)
þ | ANNUAL REPORT PURSUANT TO SECTION 13 OR 15(d) OF THE SECURITIES EXCHANGE ACT OF 1934 |
For the fiscal year ended December 31, 2017
o | TRANSITION REPORT PURSUANT TO SECTION 13 OR 15(d) OF THE SECURITIES EXCHANGE ACT OF 1934 |
For the transition period from to
Commission File Number: 001-36704

BG STAFFING, INC.
(Exact Name of Registrant as Specified in Its Charter)
_______________
Delaware | 26-0656684 |
(State of Incorporation) | (I.R.S. Employer Identification Number) |
5850 Granite Parkway, Suite 730, Plano, Texas | 75024 |
(Address of Principal Executive Offices) | (Zip Code) |
Registrant’s telephone number, including area code:
(972) 692-2400
_______________
Securities registered pursuant to Section 12(b) of the Act:
Title of Each Class | Name of Exchange on Which Registered |
Common Stock, par value $0.01 per share | NYSE American LLC |
Securities registered pursuant to Section 12(g) of the Act:
None
_______________
Indicate by check mark if the Registrant is a well-known seasoned issuer, as defined in Rule 405 of the Securities Act. Yes o No þ
Indicate by check mark if the Registrant is not required to file reports pursuant to Section 13 or Section 15(d) of the Act. Yes o No þ
Indicate by check mark whether the Registrant: (1) has filed all reports required to be filed by Section 13 or 15(d) of the Securities Exchange Act of 1934 during the preceding 12 months (or for such shorter period that the Registrant was required to file such reports), and (2) has been subject to such filing requirements for the past 90 days. Yes þ No o
Indicate by check mark whether the Registrant has submitted electronically and posted on its corporate Website, if any, every Interactive Data File required to be submitted and posted pursuant to Rule 405 of Regulation S-T (§232.405 of this chapter) during the preceding 12 months (or for such shorter period that the Registrant was required to submit and post such files). Yes þ No o
Indicate by check mark if disclosure of delinquent filers pursuant to Item 405 of Regulation S-K (§232.405 of this chapter) is not contained herein, and will not be contained, to the best of Registrant’s knowledge, in definitive proxy or information statements incorporated by reference in Part III of this Form 10-K or any amendment to this Form 10-K. þ
Indicate by check mark whether the Registrant is a large accelerated filer, an accelerated filer, a non-accelerated filer, or a smaller reporting company. See the definitions of “large accelerated filer,” “accelerated filer” and “smaller reporting company” in Rule 12b-2 of the Exchange Act. (Check one):
Large accelerated filer | ¨ | Accelerated filer | þ | |
Non-accelerated filer | ¨ | (Do not check if a smaller reporting company) | Smaller reporting company | ¨ |
Emerging growth company | þ | |||
If an emerging growth company, indicate by check mark if the registrant has elected not to use the extended transition period for complying with new or revised financial accounting standards provided pursuant to Section 13(a) of the Exchange Act. ¨
Indicate by check mark whether the Registrant is a shell company (as defined in Rule 12b-2 of the Exchange Act). Yes o No þ
The aggregate market value of the common stock held by non-affiliates of the Registrant as of June 23, 2017 (the last business day of the Registrant’s most recently completed second fiscal quarter) was $158,281,924 (based on the closing sale price of the Registrant's common stock on such date as reported on NYSE American).
As of March 8, 2018, there were 8,763,965 shares of the Registrant’s common stock outstanding.
TABLE OF CONTENTS
Page No. | ||
Forward-Looking Statements | ||
PART I | ||
PART II | ||
Market for Registrant's Common Equity, Related Stockholder Matters and Issuer Purchases of Equity Securities | ||
PART III | ||
PART IV | ||
3
FORWARD-LOOKING STATEMENTS
This Annual Report on Form 10-K contains forward-looking statements. Forward-looking statements may include, but are not limited to, statements with respect to our future financial or operating performance, future plans and objectives, competitive positioning, requirements for additional capital, government regulation of operations and the timing and possible outcome of litigation and regulatory matters. All statements other than statements of historical fact, included or incorporated by reference in this Annual Report on Form 10-K that address activities, events or developments that we, or our subsidiaries, expect or anticipate may occur in the future are forward-looking statements. Often, but not always, forward-looking statements can be identified by use of forward-looking words such as “aim,” “potential,” “may,” “could,” “would,” “might,” “will,” “expect,” “intend,” “plan,” “budget,” “scheduled,” “estimate,” “anticipate,” “believe,” “forecast,” “committed,” “future” or “continue” or the negative thereof or similar variations. Forward-looking statements are based on certain assumptions and analyses made by us, in light of our experience and perception of historical trends, current conditions and expected future developments, as well as other factors we believe are appropriate in the circumstances. Although we believe that the expectations reflected in these forward-looking statements are reasonable, we can give no assurance that these expectations will prove to have been correct. Readers are cautioned not to put undue reliance on such forward-looking statements, which are not a guarantee of performance and are subject to a number of uncertainties and known and unknown risks, many of which are outside our control, which could cause actual results to differ materially from those expressed or implied by such forward-looking statements. Important factors which could cause actual results to differ materially from those expressed or implied by such forward-looking statements include, among other things, general business, economic, competitive, political and social uncertainties, the actual results of current operations, industry conditions, intellectual property and other proprietary rights, liabilities inherent in our industry, accidents, labor disputes, delays in obtaining regulatory approvals or financing and general market factors, including interest rates, equity markets, business competition, changes in government regulations. Additional risks and uncertainties include, but are not limited to, those listed under “Item 1A. Risk Factors.”
Although we have attempted to identify important factors that could cause actual actions, events or results to differ materially from those described in the forward looking statements, there may be other factors that cause results to differ from those anticipated. Forward-looking statements contained in this Annual Report on Form 10-K are made as of the date of the Annual Report on Form 10-K and we disclaim any obligation to update any forward-looking statements, whether as a result of new information, future events, results or otherwise, except as required by applicable securities laws.
4
Part I
ITEM 1. BUSINESS.
Overview and History
BG Staffing, Inc. (“BG Staffing,” “we,” or the “Company”) is a leading national provider of temporary staffing services that operates, along with its wholly owned subsidiaries BG Staffing, LLC, B G Staff Services, Inc., BG Personnel, LP, and BG Finance and Accounting, Inc., within the U.S. in three industry segments: Multifamily, Professional, and Commercial. We provide temporary workers to a variety of customers that are seeking to match their workforce requirements to their business needs. Our customers operate across a diverse set of industries.
We employ a diverse operating model, both from a skill set and a geographic standpoint, which we believe mitigates downside revenue risk.
Our temporary staffing services consist of on-demand or short-term staffing assignments, contract staffing, and on-site management administration. Short-term staffing services assist employers in dealing with employee demands caused by such factors as seasonality, fluctuations in customer demand, vacations, illnesses, parental leave, and special projects without incurring the ongoing expense and administrative responsibilities associated with recruiting, hiring and retaining permanent employees. As more and more companies focus on effectively managing variable costs and reducing fixed overhead, the use of short-term staffing services allows companies to utilize a contingent staffing approach for their personnel needs, thereby converting a portion of their fixed personnel costs to a variable expense.
Our contract staffing services place temporary employees with customers for time-periods of more than three months or for an indefinite time period. This type of arrangement often involves outsourcing an entire department in a large corporation or providing the workforce for a large project.
In an on-site management arrangement, we place an experienced manager on-site at a customer’s place of business. The manager is responsible for conducting all recruiting, employee screening, interviewing, drug testing, hiring and employee placement for temporary workers at the customer’s facility for a long-term or indefinite period.
Management believes that the staffing industry and the employees performing these temporary staffing functions are, and will remain, an integral part of the labor market in local, regional and national economies in which we operate.
BG Staffing, Inc. is the successor by conversion to LTN Staffing, LLC, a Delaware limited liability company that was formed on August 27, 2007. In 2011, we began doing business as BG Staffing. LTN Staffing, LLC converted into a Delaware corporation, BG Staffing, Inc., following the merger of LTN Acquisition, LLC (the former parent of LTN Staffing, LLC) with and into LTN Staffing, LLC. The conversion was completed on November 3, 2013.
We commenced operations on October 17, 2007 and since 2009 new leadership has led an on-going growth and diversification initiative. Since 2010, we have acquired and successfully integrated nine businesses:
• | In June 2010, we purchased the interests of BG Personnel Services, LP and BG Personnel, LP, and purchased the common stock of B G Staff Services, Inc. Shortly after the purchase, we relocated our corporate headquarters to Dallas, Texas. |
• | In December 2010, we purchased substantially all of the assets and assumed certain liabilities of JNA Staffing Inc., which specialized in providing temporary staffing services within the state of Wisconsin. These operations were rolled into our existing operations in Milwaukee, Wisconsin. |
• | In December 2011, we purchased substantially all of the assets and assumed certain liabilities of Extrinsic, LLC, which specialized in providing information technology staffing services to customers within the U.S. We continue to operate under the Extrinsic trade name. |
5
• | In December 2012, we acquired substantially all of the assets and assumed certain liabilities of American Partners, Inc., which specialized in providing information technology staffing services to customers within the U.S. We continue to operate under the American Partners trade name. |
• | In June 2013, we acquired substantially all of the assets and assumed certain liabilities of InStaff Holding Corporation and InStaff Personnel, LLC, a wholly owned subsidiary of InStaff Holding Corporation (collectively, “InStaff”). This acquisition has allowed us to strengthen and expand our operations in our Commercial segment. We continue to operate under the InStaff trade name. |
• | In March 2015, we acquired substantially all of the assets and assumed certain liabilities of D&W Talent, LLC ("D&W"), which specialized in providing temporary and full-time staffing services of accounting and finance personnel and secretarial and administrative personnel to customers in Texas and Louisiana. We continue to operate under the Donovan & Watkins trade name. |
• | In October 2015, we acquired substantially all of the assets and assumed certain liabilities of Vision Technology Services, Inc., Vision Technology Services, LLC, and VTS-VM, LLC (collectively, “VTS”), which provided information technology ("IT") temporary staffing talent and project management services. We continue to operate under the Vision Technology Services trade name. |
• | In April 2017, we acquired substantially all of the assets and assumed certain liabilities of Zycron, Inc. (“Zycron”), which provided information technology ("IT") temporary staffing talent and project management services. We continue to operate under the Zycron trade name. |
• | In September 2017, we acquired substantially all of the assets and assumed certain liabilities of Smart Resources Inc. and Accountable Search, LLC (collectively, "Smart"), which specialized in providing temporary and full-time staffing services of accounting and finance personnel and secretarial and administrative personnel to customers in Chicago market. For the current period, we continue to operate under the Accountable Search and Smart Resources trade names. |
We operate through 65 branch offices and 15 on-site locations located across 26 states. We do not currently have any foreign operations.
Our Industry
The temporary staffing industry supplies temporary staffing services to customers to help them minimize the cost and effort of workforce planning. These services also enable the customer to rapidly respond to changes in business conditions, and in some cases to convert fixed labor costs to variable costs. Temporary staffing companies act as intermediaries in matching available temporary workers to customer assignments. The demand for a flexible workforce continues to grow with competitive and economic pressures to reduce costs and respond to changing market conditions.
The temporary staffing market is subject to volatility based on overall economic conditions. Historically, in periods of economic growth, the number of companies providing temporary staffing services has increased due to low barriers to entry. During recessionary periods, the number of companies has decreased through consolidation, bankruptcies, or other events. The temporary staffing industry is experiencing increased demand in relation to total job growth as customers have placed a greater priority on maintaining a more flexible workforce.
The temporary staffing industry is large and highly fragmented with many competing companies. In September 2017, Staffing Industry Analysts estimated the 2018 U.S. temporary staffing market to be $145 billion, which is up from an estimated $141 billion in 2017. Staffing companies compete both to recruit and retain a supply of temporary workers and to attract and retain customers to use these workers. Customer demand for temporary staffing services is dependent on the overall strength of the labor market and trends toward greater workforce flexibility. The temporary staffing industry includes a number of markets focusing on business needs that vary widely in duration of assignment and level of technical specialization.
Our Operations
We have diversified our operations to provide temporary workers within distinct segments of the industry. We refer to these segments as Multifamily, Professional, and Commercial.
6
We operate branches within each segment as separate profit centers and provide managers considerable operational autonomy and financial incentives. Managers focus on business opportunities within their geographical markets and are provided centralized support to achieve success in those markets. We believe this structure allows us to recruit and retain highly motivated managers who have demonstrated the ability to succeed in a competitive environment. This structure also allows managers and staff to focus on market development while relying on centralized services for support in back-office operations, such as risk management programs and unemployment insurance, credit, collections, accounting, advice on legal and regulatory matters, and quality standards.
Our Segments
Our operations are organized into three business segments: Multifamily, Professional, and Commercial.
Multifamily Segment
Our Multifamily segment is a leading provider of front office and maintenance personnel to the multifamily housing industry. We currently have 43 branch offices in 23 states. The Multifamily division utilizes a centralized recruiting model from recruiting centers in Dallas, Houston, and Austin, Texas, in the Charlotte, North Carolina area, and the Tampa, Florida area. All open positions nationally are recruited from one of these regional recruiting centers. The workers we assign to our multifamily customers are our temporary workers, although our customers provide on-the-job direction, control and supervision.
Professional Segment
Our Professional segment provides highly skilled IT professionals with expertise in SAP, Workday, Olik View, Hyperion, Oracle, project management and other IT staffing skills to customers on a national basis. Our customers include large Fortune 500 companies and consulting firms engaged in systems integration projects. We operate our national coverage of the IT market from our offices in North Carolina, Rhode Island, Maryland, and Tennessee. Additionally, we provide finance, accounting and related support personnel in Texas and Louisiana through our Texas based D&W group and in Chicago through our Smart group.
Commercial Segment
Our Commercial segment provides temporary workers to manufacturing, distribution, and logistics customers needing a flexible workforce. We currently have 12 branch offices and 15 on-site locations operating in 6 states. Our Commercial segment temporary workers perform services in a variety of skilled and unskilled positions. The workers we assign to our Commercial customers are our temporary workers, although our customers provide on-the-job direction, control and supervision.
Financial Information about Segments
Refer to Note 17 in the Notes to Consolidated Financial Statements included in Item 8 of this Annual Report on Form 10-K, which is incorporated by reference.
Financial Information about Geographic Areas
Refer to Notes 1 and 2 in the Notes to Consolidated Financial Statements included in Item 8 of this Annual Report on Form 10-K, which is incorporated by reference.
Our Recruiting
We believe a key component of our success is the ability to recruit and maintain a pool of qualified temporary workers and regularly place them into desirable and appropriate positions. We use comprehensive methods to identify, assess, select and, when appropriate, measure the skills of our temporary workers and permanent placement candidates to meet the needs of our customers.
7
Our Customers
We currently service small and medium-sized companies as well as divisions of Fortune 500 companies. As is common in the staffing industry, our engagements to provide temporary services to our customers are generally of a non-exclusive, short-term nature and subject to termination by the customer with little or no notice. No customer accounted for more than 10% of our revenues in 2017, 2016, or 2015.
Growth Strategy
We are committed to growing our operations. Revenues have grown from $35 million in 2009 to $272.6 million in 2017, by using a growth strategy reliant upon both acquisitions and organic growth.
We will continue to evaluate acquisition opportunities utilizing our proven approach to the assessment, valuation, and integration of acquisitions. Additionally, we are committed to continue to grow our operations in our current markets, as well as expand into new markets within the segments and industries that we currently serve.
We are organized to handle many of the administrative functions at our corporate location so that our branches can focus on business development and the effective recruiting and assignment of temporary workers.
We will continue to invest in technology and process improvements, as necessary, to ensure that we are operating at optimal productivity and performance.
Competition
The staffing services market is highly competitive with limited barriers to entry. We compete in national, regional and local markets with full-service and specialized temporary staffing companies. Some of our competitors have significantly more marketing and financial resources than we do. Price competition in the staffing industry is intense. We expect that the level of competition will remain high, which could limit our ability to maintain or increase our market share or profitability.
The principal competitive factors in attracting qualified candidates for temporary assignments are pay rates, availability of assignments, duration of assignments and responsiveness to requests for placement. We believe that many potential candidates seeking temporary assignments through us may also be pursuing assignments through other means. Therefore, the speed at which we place prospective temporary workers and the availability of appropriate assignments are important factors in our ability to complete assignments of qualified temporary workers. In addition to having high quality temporary workers to assign in a timely manner, the principal competitive factors in obtaining and retaining customers in the temporary staffing industry are properly assessing the customers’ specific job requirements, the appropriateness of the temporary worker assigned to the customer, the price of services and the monitoring of customer satisfaction. Although we believe we compete favorably with respect to these factors, we expect competition to continue to increase.
Seasonality
Our business experiences seasonal fluctuations. Our quarterly operating results are affected by the number of billing days in a quarter, as well as the seasonality of our customers’ business. Demand for our Multifamily staffing services increase in the second and is highest during the third quarter of the year due to the increased turns in multifamily units during the summer months when schools are not in session. Demand for our Commercial staffing services increases during the third quarter of the year and peaks in the fourth quarter. Demand for our Commercial staffing services is lower during the first quarter, in part due to customer shutdowns and adverse weather conditions in the winter months. In addition, our cost of services typically increases in the first quarter primarily due to the reset of payroll taxes.
The staffing industry has historically been cyclical, often acting as an indicator of both economic downturns and upswings. Staffing customers tend to use temporary staffing to supplement their existing workforces and generally hire direct workers when long-term demand is expected to increase. As a consequence, our revenues tend to increase quickly when the economy begins to grow and, conversely, our revenues can also decrease quickly when the economy begins to weaken.
8
Employees and Temporary Workers
As of February 9, 2018, we had 349 staff employees at our corporate and branch offices. During the fiscal year ended 2017, we assigned approximately 29,000 temporary workers and had working, on average, approximately 4,700 temporary workers during the fourth quarter of 2017.
None of our staff employees or temporary workers is represented by a labor union, and we are not aware of any current efforts or plans to organize any of our staff employees or temporary workers. To date we have not experienced any material labor disruptions.
Intellectual Property
We own or have rights to various copyrights, trademarks, service marks, trade names and domain names used in our business, including, but not limited to, BG Staffing, BG Staffing Group, BG Personnel Services, Extrinsic, American Partners, InStaff, BG Temporary Staffing, BG Multifamily, BG Talent, Triance, Donovan & Watkins, D&W Talent, Vision Technology Services, Zycron, Smart Resources, Accountable Search, bgstaffing.com, bgstaffinggroup.com, bgpersonnel.com, bgstaffing.net, ltnstaffing.com, milwaukeetemps.com, milwaukeetmepsinc.com, extrinsicllc.com, extrinsicgroup.com, extrinsicresources.com, jnastaffing.com, bgcompanies.net, bgpersonnel.net, bgmail.com, therightpeoplerightnow.com, rightpeoplerightnow.com, americanpartnersinc.com, instaff.com, donwat.com, vistechs.com, smartstaffing.com, accountablesearch.com and executiveassistantsearch.com. Our trade names are valuable assets that reinforce the distinctiveness of our brands.
Regulation
We are subject to regulation by numerous federal, state and local regulatory agencies, including but not limited to the U.S. Department of Labor, which sets employment practice standards for workers, and similar state and local agencies. We are subject to the laws and regulations of the jurisdictions within which we operate. While the specific laws and regulations vary among these jurisdictions, some require some form of licensing and often have statutory requirements for workplace safety and notice of change in obligation of workers’ compensation coverage in the event of contract termination. Although compliance with these requirements imposes some additional financial risk on us, particularly with respect to those clients who breach their payment obligation to us, such compliance has not had a material adverse effect on our business to date. Any inability or failure to comply with government regulation could materially harm our business. Increased government regulation of the workplace or of the employer-employee relationship, or judicial or administrative proceedings related to such regulation, could also materially harm our business.
Available Information
We file electronically with the SEC, our Annual Report on Form 10-K, Quarterly Reports on Form 10-Q, Current Reports on Form 8-K, and amendments to those reports pursuant to Section 13(a) or 15(d) of the Securities Exchange Act of 1934, as amended. Our website address is www.bgstaffing.com. The information included on our website is not included as a part of, or incorporated by reference into, this Annual Report on Form 10-K. We will make available free of charge through our website our Annual Reports on Form 10-K, Quarterly Reports on Form 10-Q, Current Reports on Form 8-K, and amendments to those reports filed or furnished pursuant to Section 13(a) or 15(d) of the Exchange Act as soon as reasonably practicable after we have filed or furnished such material to the SEC. You may read and copy any materials we file with the SEC at the SEC’s Public Reference room at 100 F Street, NW, Washington, DC 20549. The public may obtain information on the operation of the Public Reference Room by calling the SEC at 1-800-SEC-0330. The SEC also maintains an Internet site that contains reports, proxy and formation statements, and other information regarding issuers that file electronically with the SEC at www.sec.gov. Furthermore, we will provide electronic or paper copies of filings free of charge upon written request to our Chief Financial Officer.
ITEM 1A. RISK FACTORS.
There are numerous and varied risks that may prevent us from achieving our goals, including those described below. You should carefully consider the risks described below and the other information included in this Annual Report on Form 10-K, including our consolidated financial statements and related notes. Our business, financial condition, and results of operations, could be harmed by any of the following risks. If any of the events or circumstances described below were to occur, our business, the financial condition and the results of operations could be materially adversely affected. As a result, the trading price of our common stock could decline, and investors could lose part or all of their investment. The risks below are not the only risks we face. Additional risks not currently known to us or that we currently deem to be immaterial may also adversely affect our business, financial condition or results of operations.
9
Risks Related to Our Company and Our Business
We operate in a highly competitive industry with low barriers to entry, and may be unable to compete successfully against existing or new competitors.
The staffing services market is highly competitive with limited barriers to entry. We compete in national, regional and local markets with full-service and specialized temporary staffing companies. We expect that the level of competition will remain high, which could limit our ability to maintain or increase our market share or profitability.
Several of our existing or potential competitors have substantially greater financial, technical and marketing resources than we do, which may enable them to:
• | Develop and expand their infrastructure and service offerings more quickly and achieve greater cost savings; |
• | Invest in new technologies; |
• | Expand operations into new markets more rapidly; |
• | Devote greater resources to marketing; |
• | Compete for acquisitions more effectively and complete acquisitions more easily; and |
• | Aggressively price products and services and increase benefits in ways that we may not be able to match. |
In order to compete effectively in our markets, we must target our potential customers carefully, continue to improve our efficiencies and the scope and quality of our services, and rely on our service quality, innovation, education and program clarity. If our competitive advantages are not compelling or sustainable, then we are unlikely to increase or sustain profits and our stock price could decline.
In addition, heightened competition among our existing competitors, especially on a price basis, or by new entrants into the market, could create additional competitive pressures that may reduce our margins and adversely affect our business. If we fail to successfully respond to these competitive pressures or to implement our strategies effectively, our revenues or gross margins could be reduced.
Our business is subject to risks associated with geographic market concentration.
Geographic revenue in excess of 10% of the Company's consolidated revenue in fiscal year 2017 and the related percentage for fiscal years 2016 and 2015 was generated in the following areas:
2017 | 2016 | 2015 | |||||||
Maryland | 12 | % | 13 | % | 4 | % | |||
Tennessee | 12 | % | 5 | % | 3 | % | |||
Texas | 29 | % | 32 | % | 41 | % | |||
Consequently, weakness in economic conditions in these regions could have a material adverse effect on the Company’s financial position and results of future operations.
A downturn of the U.S. or global economy could result in our customers using fewer workforce solutions and services or becoming unable to pay us for our services on a timely basis or at all, which would materially adversely affect our business.
Because demand for workforce solutions and services, particularly staffing services, is sensitive to changes in the level of economic activity, our business may suffer during economic downturns. During periods of weak economic growth or economic contraction, the demand for staffing services typically declines. When demand drops, our operating profit is typically impacted unfavorably as we experience a deleveraging of our selling and administrative expense base as expenses may not decline as quickly as revenues. In periods of decline, we can only reduce selling and administrative expenses to a certain level without negatively impacting the long-term potential of our branch network and brands. Additionally, during economic downturns companies may slow the rate at which they pay their vendors, or they may become unable to pay their obligations. If our customers become unable to pay amounts owed to us, or pay us more slowly, then our cash flow and profitability may suffer.
10
Our service agreements may be terminated on short notice, leaving us vulnerable to loss of a significant amount of customers in a short period of time.
Our service agreements with our customers are generally cancelable by the customer with little or no notice to us. As a result, a significant number of our customers can terminate their agreements with us at any time, making us particularly vulnerable to a significant decrease in revenue within a short period of time that could be difficult to quickly replace.
If we are unable to retain existing customers or attract new customers, our results of operations could suffer.
Increasing the growth and profitability of our business is particularly dependent upon our ability to retain existing customers and capture additional customers. Our ability to do so is dependent upon our ability to provide high quality services and offer competitive prices. If we are unable to execute these tasks effectively, we may not be able to attract a significant number of new customers and our existing customer base could decrease, either or both of which could have an adverse impact on our revenues.
We have debt that could adversely affect our financial health and prevent us from fulfilling our obligations or put us at a competitive disadvantage.
Our level of debt and the limitations imposed on us by our lenders could have a material impact on investors, including the requirement to use a portion of our cash flow from operations for debt service rather than for our operations and the need to comply with the various covenants associated with such debt. Additionally, we may not be able to obtain additional debt financing for future working capital, capital expenditures or other corporate purposes or may have to pay more for such financing. We could also be less able to take advantage of significant business opportunities, such as acquisition opportunities, and to react to changes in market or industry conditions, or we may be disadvantaged compared to competitors with less leverage.
We have significant working capital needs and if we are unable to satisfy those needs from cash generated from our operations or borrowings under our revolving credit facility, we may not be able to meet payroll requirements.
We require significant amounts of working capital to operate our business. If we experience a significant and sustained drop in operating profits, or if there are unanticipated reductions in cash inflows or increases in cash outlays, we may be subject to cash shortfalls. If such a shortfall were to occur for even a brief period of time, it may have a significant adverse effect on our business. In particular, we use working capital to pay expenses relating to our employees and temporary workers and to satisfy our workers’ compensation liabilities. Generally, we pay our temporary workers on a weekly basis while we receive payments from our customers 30 to 60 days after billing. As a result, we must maintain sufficient cash availability to pay employees and temporary workers and fund related payroll liabilities prior to receiving payment from customers.
We derive working capital for our operations through cash generated by our operating activities and borrowings under our revolving credit facility. We believe that our current sources of capital are adequate to meet our working capital needs. However, our available sources of capital are limited. If our working capital needs increase in the future, we may be forced to seek additional sources of capital, which may not be available on commercially reasonable terms.
The amount we are entitled to borrow under our revolving credit facility is calculated monthly based on the aggregate value of certain eligible trade accounts receivable generated from our operations, which are affected by financial, business, economic and other factors, as well as by the daily timing of cash collections and cash outflows. The aggregate value of our eligible accounts receivable may not be adequate to allow for borrowings for other corporate purposes, such as capital expenditures or growth opportunities, which could reduce our ability to react to changes in the market or industry conditions.
Our credit agreement includes various financial and other covenants with which the Company has to comply in order to maintain borrowing availability and avoid penalties, including minimum fixed charge coverage ratio, and maximum leverage ratio, and restrictions on the payment of dividends.
Any future failure to comply with the covenants which may occur under our credit agreement could result in an event of default which, if not cured or waived, could trigger prepayment obligations. There can be no assurance that any future lender will waive defaults that may occur in the future. If we were forced to refinance our credit agreement, there can be no assurance that such refinancing would be available or that such refinancing would not have a material adverse effect on our business and financial condition. Even if such refinancing were available, the terms could be less favorable and our results of operations and financial condition could be adversely affected by increased costs and interest rates.
11
We typically experience significant seasonal and other fluctuations in our borrowings and borrowing availability, and we aggressively manage our cash flow to ensure adequate funds to meet working capital needs. Such management steps include working to improve collections, adjusting the timing of cash expenditures and managing operating expenses.
Failure to comply with restrictive covenants under our credit agreement could trigger prepayment obligations or additional costs.
Our future failure to comply with our covenants which may occur under our credit agreement could result in an event of default which, if not cured or waived, could trigger prepayment obligations. There can be no assurances that any future lender will waive defaults that may occur in the future. If we are forced to refinance our credit agreement, there can be no assurance that such refinancing would be available or that such refinancing would not have a material adverse effect on our business and financial condition. Even if such refinancing were available, the terms could be less favorable and our results of operations and financial condition could be adversely affected by increased costs and interest rates.
We could be required to write-off goodwill or intangible assets in future periods if our future operating results suffer.
In accordance with generally accepted accounting principles, we are required to review our goodwill and intangible assets for impairment at least annually. Our goodwill and intangibles assets were $18.0 million and $37.3 million, respectively, at the end of 2017. An unfavorable evaluation could cause us to write-off these assets in future periods. Any future write-offs could have a material adverse impact on our financial condition and results of operations.
The amount of collateral that we are required to maintain to support our workers’ compensation obligations could increase, reducing the amount of capital we have available to support and grow our field operations.
We are contractually obligated to collateralize our workers’ compensation obligations under our workers’ compensation program through irrevocable letters of credit, surety bonds or cash. Our workers’ compensation program renews annually on January 1 of each year, and as part of the renewal, could be subject to an increase in collateral. These collateral requirements are significant and place pressure on our liquidity and working capital capacity. We believe that our current sources of liquidity are adequate to satisfy our immediate needs for these obligations; however, our available sources of capital are limited. Depending on future changes in collateral requirements, we could be required to seek additional sources of capital in the future, which may not be available on commercially reasonable terms, or at all.
We are dependent on workers’ compensation insurance coverage at commercially reasonable terms.
We provide workers’ compensation insurance for our employees and temporary workers. Our workers’ compensation insurance policies are renewed annually. We cannot be certain we will be able to obtain appropriate types or levels of insurance in the future or that adequate replacement policies will be available on commercially reasonable terms. The loss of our workers’ compensation insurance coverage would prevent us from doing business in the majority of our markets. Further, we cannot be certain that our current and former insurance carriers will be able to pay claims we make under such policies. The loss of workers' compensation insurance could have a material adverse effect on the Company’s financial position and results of future operations.
Because we assume the obligation to make wage, tax and regulatory payments in respect of some employees, we are exposed to customer credit risks.
We generally assume responsibility for and manage the risks associated with our employee payroll obligations, including liability for payment of salaries and wages (including payroll taxes), as well as group health and retirement benefits. These obligations are fixed, whether or not the customer makes payments required by our services agreement, which exposes us to credit risks. We attempt to mitigate this risk by generally invoicing our customers weekly and having a high number of customers who are geographically and industry diverse. We also carefully monitor the timeliness of our customers’ payments and impose strict credit standards on our customers. If we fail to successfully manage our credit risk, we may suffer losses which would decrease our profitability.
Our business is subject to federal, state and local labor and employment laws and a failure to comply could materially harm our business.
We are subject to regulation by numerous federal, state and local regulatory agencies, including but not limited to the U.S. Department of Labor, which sets employment practice standards for workers, and similar state and local agencies. We are subject to the laws and regulations of the jurisdictions within which we operate. While the specific laws and regulations vary among these
12
jurisdictions, some require some form of licensing and often have statutory requirements for workplace safety and notice of change in obligation of workers’ compensation coverage in the event of contract termination. Although compliance with these requirements imposes some additional financial risk on us, particularly with respect to those clients who breach their payment obligation to us, such compliance has not had a material adverse effect on our business to date. Any inability or failure to comply with government regulation could materially harm our business. Increased government regulation of the workplace or of the employer-employee relationship, or judicial or administrative proceedings related to such regulation, could also materially harm our business.
The Patient Protection and Affordable Care Act and the Health Care and Education Reconciliation Act of 2010 (collectively, the “Health Care Reform Laws”) include various health-related provisions that took effect during 2014, including requiring most individuals to have health insurance and establishing new regulations on health plans. Although the Health Care Reform Laws do not mandate that employers offer health insurance, beginning in 2015 tax penalties were assessed on employers who do not offer health insurance that meets certain affordability or benefit requirements. Unless modified by regulations or subsequent legislation, if we are required to provide additional health insurance benefits to our temporary workers, or the payment of tax penalties if such coverage is not adequate, may increase our costs. If we are unable to raise the rates we charge our customers to cover these costs, such increases in costs could materially harm our business.
In addition, certain of our clients may require that we indemnify them against losses in the event that the client is determined to be non-compliant with the Health Care Reform Laws with respect to one or more of our temporary workers assigned to such client. We have not received notice from any client that acts or omissions by us may have resulted in losses to the client relating to non-compliance with the Health Care Reform Laws, any future liabilities that may be incurred by us pursuant to any such indemnification provisions could affect our results of operations.
It is likely that President Trump and the U.S. Congress will continue to seek to modify, repeal, or otherwise invalidate all, or certain provisions of, the PPACA. President Trump has issued multiple executive orders in support of repealing the PPACA,in whole or in part, and the U.S. Congress has made several attempts to repeal or modify the PPACA. It is unclear at this point what the scope of any future such legislation will be and when it will become effective. Because of the uncertainty surrounding this replacement health care reform legislation, we cannot predict with any certainty the likely impact of the PPACA’s repeal or the adoption of any other health care reform legislation on the Company’s financial condition or operating results. Whether or not there is alternative health care legislation enacted in the U.S., there is likely to be significant disruption to the health care market in the coming months and years and the costs of the Company’s health care expenditures may increase.
We may be exposed to employment-related claims and losses, including class action lawsuits, which could have a material adverse effect on our business.
Temporary staffing service providers typically assign personnel in the workplaces of other businesses. The risks of these activities include possible claims relating to:
• | discrimination and harassment; |
• | wrongful termination or denial of employment; |
• | violations of employment rights related to employment screening or privacy issues; |
• | classification of temporary workers; |
• | assignment of illegal aliens; |
• | violations of wage and hour requirements; |
• | retroactive entitlement to temporary worker benefits; |
• | errors and omissions by our temporary workers; |
• | misuse of customer proprietary information; |
• | misappropriation of funds; |
• | damage to customer facilities due to negligence of temporary workers; and |
• | criminal activity. |
We may incur fines and other losses or negative publicity with respect to these claims. In addition, these claims may give rise to litigation, which could be time-consuming and expensive. New employment and labor laws and regulations may be proposed or adopted that may increase the potential exposure of employers to employment-related claims and litigation. There can be no assurance that the corporate policies we have in place to help reduce our exposure to these risks will be effective or that we will not experience losses as a result of these risks. There can also be no assurance that the insurance policies we have purchased to insure against certain risks will be adequate or that insurance coverage will remain available on commercially reasonable terms or be sufficient in amount or scope of coverage.
13
We depend on our ability to attract and retain qualified temporary workers.
We depend on our ability to attract qualified temporary workers who possess the skills and experience necessary to meet the staffing requirements of our customers. We must continually evaluate our base of available qualified personnel to keep pace with changing customer needs. Competition for individuals with proven professional skills is intense, and demand for these individuals is expected to remain strong for the foreseeable future. There can be no assurance that qualified personnel will continue to be available. Our success is substantially dependent on our ability to recruit and retain qualified temporary workers.
We would be adversely affected by the loss of key personnel.
Our operations and financial success depends significantly on our management team. The loss of any key members of management could adversely affect our business, financial condition and results of operations.
We are dependent upon technology services, and if we experience damage, service interruptions or failures in our computer and telecommunications systems, or if our security measures are breached, our customer and temporary worker relationships and our ability to attract new customers may be adversely affected.
Our business could be interrupted by damage to or disruption of our computer, telecommunications equipment, or software systems, and we may lose data. Our customers’ businesses may be adversely affected by any system or equipment failure we experience. As a result of any of the foregoing, our relationships with our customers may be impaired, we may lose customers, our ability to attract new customers may be adversely affected and we could be exposed to contractual liability. Precautions in place to protect us from, or minimize the effect of, such events may not be adequate. In addition, our business involves the storage and transmission of temporary workers or customers’ proprietary information, and security breaches could expose us to a risk of loss of this information, litigation and possible liability. If our security measures are breached as a result of third-party action, employee error, malfeasance or otherwise, and, as a result, someone obtains unauthorized access to customer data, our reputation may be damaged, our business may suffer and we could incur significant liability. Techniques used to obtain unauthorized access or to sabotage systems change frequently and are growing increasingly sophisticated. As a result, we may be unable to anticipate these techniques or to implement adequate preventative measures. If an actual or perceived breach of our security occurs, we could be liable and the market perception of our services could be harmed.
Acquisitions and new business initiatives may not be successful.
We expect to continue making acquisitions and entering into new business initiatives as part of our long-term business strategy. These acquisitions and new business initiatives involve significant challenges and risks, including that they may not advance our business strategy, that we may not realize a satisfactory return on our investment, that we may experience difficulty in integrating operations, or diversion of management’s attention from our other business. We may be unable to identify suitable acquisition candidates in the future. Moreover, acquisitions may require substantial capital needs and the incurrence of additional indebtedness which may change significantly our capitalization and results of operations. Further, these acquisitions could result in post-closing discovery of material undisclosed liabilities of the acquired business or assets, title or other defects with respect to acquired assets, discrepancies or errors in furnished financial statements or other information or breaches of representations made by the sellers, or the unexpected loss of key employees or customers from acquired businesses. These events could cause harm to our operating results or financial condition.
Risks Related to the Ownership of Our Securities
An investment in our common stock should be considered high risk.
An investment in our common stock requires a long-term commitment, with no certainty of return. Investment banks may not agree to underwrite primary or secondary offerings on behalf of our company or its stockholders in the future. If all or any of the foregoing risks occur, it would have a material adverse effect on our company.
Our common stock has been traded on the NYSE American since October 27, 2014, and, until recently, has traded in low volumes. We cannot predict whether an active trading market for our common stock will continue. Even if an active trading market continues, the market price of our common stock may remain volatile.
In the absence of an active trading market:
• | you may have difficulty buying and selling our common stock at all or at the price you consider reasonable; |
14
• | market visibility for shares of our common stock may be limited, which may have a depressive effect on the market price for shares of our common stock and on our ability to raise capital or make acquisitions by issuing our common stock. |
Even if an active market for our common stock continues, of which no assurances can be given, the market price for our common stock may be volatile and subject to wide fluctuations in response to factors including the following:
• | actual or anticipated fluctuations in our quarterly or annual operating results; |
• | changes in financial or operational estimates or projections; |
• | conditions in markets generally; |
• | changes in the economic performance or market valuations of companies similar to ours; and |
• | general economic or political conditions in the United States or elsewhere. |
The securities market has from time to time experienced significant price and volume fluctuations that are not related to the operating performance of particular companies. These market fluctuations may also materially and adversely affect the market price of shares of our common stock.
We will likely issue additional common stock in the future, which would dilute the holdings of our existing stockholders.
In the future we may issue additional securities up to our total authorized and unissued amounts, including shares of our common stock or securities convertible into or exchangeable or exercisable for our common stock, resulting in the dilution of the ownership interests of our stockholders. We may issue additional shares of our common stock or securities convertible into or exchangeable or exercisable for our common stock in connection with hiring or retaining personnel, option or warrant exercises, future acquisitions or future placements of our securities for capital-raising or other business purposes. Moreover, the exercise of our existing outstanding warrants and stock options, which are exercisable for or convertible into shares of our common stock, would dilute our existing common stockholders.
Our compliance with complicated regulations concerning corporate governance and public disclosure has resulted and may in the future result in additional expenses.
We are faced with expensive, complicated and evolving disclosure, governance and compliance laws, regulations and standards relating to corporate governance and public disclosure, including the Sarbanes-Oxley Act of 2002, which we refer to as the Sarbanes-Oxley Act, and the Dodd-Frank Wall Street Reform and Consumer Protection Act. New or changing laws, regulations and standards are subject to varying interpretations in many cases due to their lack of specificity, and, as a result, their application in practice may evolve over time as new guidance is provided by regulatory and governing bodies, which could result in continuing uncertainty regarding compliance matters and higher costs necessitated by ongoing revisions to disclosure and governance practices. As a result, our efforts to comply with evolving laws, regulations and standards of a public company are likely to continue to result in increased general and administrative expenses and a diversion of management time and attention from revenue-generating activities to compliance activities.
Our failure to comply with all laws, rules and regulations applicable to U.S. public companies could subject us or our management to regulatory scrutiny or sanction, which could harm our reputation and stock price.
As an “emerging growth company” under applicable law, we will be subject to lessened disclosure requirements, which could leave our stockholders without information or rights available to stockholders of more mature companies.
For as long as we remain an “emerging growth company” as defined in the Jumpstart Our Business Startups Act of 2012 (which we refer to herein as the JOBS Act), we have elected to take advantage of certain exemptions from various reporting requirements that are applicable to other public companies that are not “emerging growth companies” including, but not limited to:
• | not being required to comply with the auditor attestation requirements of Section 404 of the Sarbanes-Oxley Act; |
• | taking advantage of an extension of time to comply with new or revised financial accounting standards; |
• | reduced disclosure obligations regarding executive compensation in our periodic reports and proxy statements; and |
• | exemptions from the requirements of holding a nonbinding advisory vote on executive compensation and stockholder approval of any golden parachute payments not previously approved. |
We expect to take advantage of these exemptions until we are no longer an “emerging growth company.” Because of these lessened regulatory requirements, our stockholders will not have all the information and rights available to stockholders of more mature companies.
15
Because we may elect to use the extended transition period for complying with new or revised accounting standards for an “emerging growth company” our financial statements may not be comparable to companies that comply with public company effective dates.
We may elect to use the extended transition period for complying with new or revised accounting standards under Section 102(b)(1) of the JOBS Act. This election allows us to delay the adoption of new or revised accounting standards that have different effective dates for public and private companies until those standards apply to private companies. As a result of this election, our financial statements may not be comparable to companies that comply with public company effective dates. Because our financial statements may not be comparable to companies that comply with public company effective dates, investors may have difficulty evaluating or comparing our business, performance or prospects in comparison to other public companies, which may have a negative impact on the value and liquidity of our common stock.
There may be limitations on the effectiveness of our internal controls, and a failure of our control systems to prevent error or fraud may materially harm our company.
Proper systems of internal controls over financial reporting and disclosure are critical to the operation of a public company. Should such systems fail to detect or prevent error or fraud, it would leave us without the ability to reliably compile financial information about our company and significantly impair our ability to prevent or detect errors and fraud, all of which would have a negative impact on our company from many perspectives.
Moreover, we do not expect that disclosure controls or internal control over financial reporting, even if established, will prevent all errors and fraud. A control system, no matter how well designed and operated, can provide only reasonable, not absolute, assurance that the control system’s objectives will be met. Further, the design of a control system must reflect the fact that there are resource constraints and the benefits of controls must be considered relative to their costs. Because of the inherent limitations in all control systems, no evaluation of controls can provide absolute assurance that all control issues and instances of fraud, if any, have been detected. Failure of our control systems to prevent and detect errors or fraud could materially adversely impact us.
In the future, our auditors will be required to attest to the effectiveness of our internal control over financial reporting, and at such time our auditors may issue a report that is adverse in the event our auditors are not satisfied with the level at which our internal controls are documented, designed or operating, which could have an adverse impact on our stock price.
Our independent registered public accounting firm will not be required to attest to the effectiveness of our internal control over financial reporting pursuant to Section 404 until, at the earliest, the date we are no longer an “emerging growth company” as defined in the recently enacted JOBS Act. At such time, our independent registered public accounting firm may issue a report that is adverse in the event it is not satisfied with the level at which our controls are documented, designed or operating. Our remediation efforts may not enable us to avoid a material weakness in the future. We will remain an “emerging growth company” through Fiscal 2018, although if the market value of our common stock that is held by non-affiliates exceeds $700 million as of any June 30 before that time, we would cease to be an “emerging growth company” as of the end of that fiscal year.
Any of the foregoing occurrences, should they come to pass, could negatively impact the public perception of our company, which could have a negative impact on our stock price.
We do not have an extended history of paying dividends on our common stock nor can we be sure we will pay them in the foreseeable future, and consequently, your ability to achieve a return on your investment will depend on appreciation in the price of our common stock.
Prior to December 19, 2014, we had not paid cash dividends on our common stock. While we have declared and paid dividends for the prior thirteen quarterly periods, we are limited in our ability to pay dividends by our credit agreement, and therefore, we cannot be certain if we will pay any cash dividends to holders of our common stock in the foreseeable future. Any future determination with respect to the payment of dividends will be at the discretion of our board of directors and will be dependent upon, among other things, our financial condition, results of operations, capital requirements, the terms of our then existing indebtedness, contractual restrictions, future prospects, general economic conditions and other factors considered relevant by our board of directors. Consequently, investors must rely on sales of their common stock after price appreciation, which may never occur, as the only way to realize any future gains on their investments. There is no guarantee that shares of our common stock will appreciate in value or even maintain the price at which our stockholders have purchased their shares.
16
Upon dissolution of our company, you may not recoup all or any portion of your investment.
In the event of a liquidation, dissolution or winding-up of our company, whether voluntary or involuntary, the proceeds and/or assets of our company remaining after giving effect to such transaction, and the payment of all of our debts and liabilities will be distributed to the stockholders of common stock on a pro rata basis. There can be no assurance that we will have available assets to pay to the holders of common stock, or any amounts, upon such a liquidation, dissolution or winding-up of our company. In this event, you could lose some or all of your investment.
Certain provisions of our organizational documents may make it difficult for stockholders to change the composition of our board of directors and may discourage hostile takeover attempts that some of our stockholders may consider to be beneficial.
Certain provisions of our certificate of incorporation and bylaws may have the effect of delaying or preventing changes in control if our board of directors determines that such changes in control are not in the best interests of us and our stockholders. The provisions in such certificate of incorporation and bylaws include, among other things, the following:
• | a classified board of directors with three-year staggered terms; |
• | the ability of our board of directors to issue shares of preferred stock and to determine the price and other terms, including preferences and voting rights, of those shares without stockholder approval; |
• | stockholder action can only be taken at a special or regular meeting and not by written consent except in limited circumstances; |
• | advance notice procedures for nominating candidates to our board of directors or presenting matters at stockholder meetings; |
• | removal of directors only for cause; |
• | allowing only our board of directors to fill vacancies on our board of directors or increase the size of our board of directors; and |
• | super-majority voting requirements to amend certain provisions of our certificate of incorporation. |
We have elected in our certificate of incorporation not to be subject to Section 203 of the Delaware General Corporation Law (the “DGCL”), a statutory provision that may have the effect of delaying, hindering or preventing some takeovers of our company. In general, Section 203 prohibits a publicly held Delaware corporation from engaging in a business combination, such as a merger, with a person or group owning 15% or more of the corporation’s voting stock for a period of three years following the date the person became an “interested stockholder,” unless (with certain exceptions) the business combination or the transaction in which the person became an “interested stockholder” is approved in a prescribed manner. Accordingly, we will not be subject to any anti-takeover effects of Section 203. Our certificate of incorporation contains provisions that have the same effect as Section 203, except that they generally provide that Taglich Private Equity LLC, Taglich Brothers, Inc. or any of their respective affiliates or associates, including any investment funds or portfolio companies managed by any of the foregoing, or any other person with whom any of the foregoing act as a group for the purpose of acquiring, voting or disposing of our shares, or any person that becomes an interested stockholder as a result of a transfer of 5% or more of our voting stock by the forgoing persons to such person, will be excluded from the “interested stockholder” definition in our certificate of incorporation and will therefore not be subject to the restrictions set forth therein that have the same effect as Section 203.
While these provisions have the effect of encouraging persons seeking to acquire control of our company to negotiate with our board of directors, they could enable the board of directors to hinder or frustrate a transaction that some, or a majority, of the stockholders might believe to be in their best interests and, in that case, may prevent or discourage attempts to remove and replace incumbent directors.
These provisions may frustrate or prevent any attempts by our stockholders to replace or remove our current management by making it more difficult for stockholders to replace members of our board of directors, which is responsible for appointing the members of our management.
ITEM 1B. UNRESOLVED STAFF COMMENTS.
None.
17
ITEM 2. PROPERTIES.
Our executive office is located at 5850 Granite Parkway, Suite 730, Plano, Texas 75024, and our telephone number is 972-692-2400. We lease our corporate headquarters, which is approximately 6,200 square feet of space. We operate through 65 branch offices and 15 on-site locations located across 26 states. We lease all of our branch offices, which are located throughout the U.S., through operating leases with terms that range from six months to five years. We also have month to month leases. We believe that our facilities are adequate for our current needs.
ITEM 3. LEGAL PROCEEDINGS.
From time to time we have been threatened with, or named as a defendant in litigation, administrative claims and lawsuits. We carry insurance to mitigate any potential liabilities associated therewith. The principal risks that we insure against, subject to and upon the terms and conditions of our various insurance policies, are workers’ compensation, general liability, automobile liability, property damage, alternative staffing errors and omissions, directors & officers, fiduciary liability and fidelity losses. As of the date of this Annual Report on Form 10-K, management believes that the resolution of these matters will not have a material adverse effect on our consolidated financial statements.
ITEM 4. MINE SAFETY DISCLOSURE.
Not applicable.
18
PART II
Item 5. Market for Registrant’s Common Equity, Related Stockholder Matters and Issuer Purchases of Equity Securities.
Stock Performance Graph
The following graph compares, through December 31, 2017, the cumulative total return of the Company’s common stock, an index of certain publicly traded employment services companies, and the Russell 2000. The graph assumes the investment of $100 at the beginning of the period depicted in the chart and reinvestment of all dividends. Note that historic stock price performance is not necessarily indicative of future stock price performance. The following graph and related information shall not be deemed “soliciting material” or to be “filed” with the SEC, nor shall such information be incorporated by reference into any filing under the Securities Act or the Exchange Act, except to the extent that we specifically incorporate it by reference into such filing.
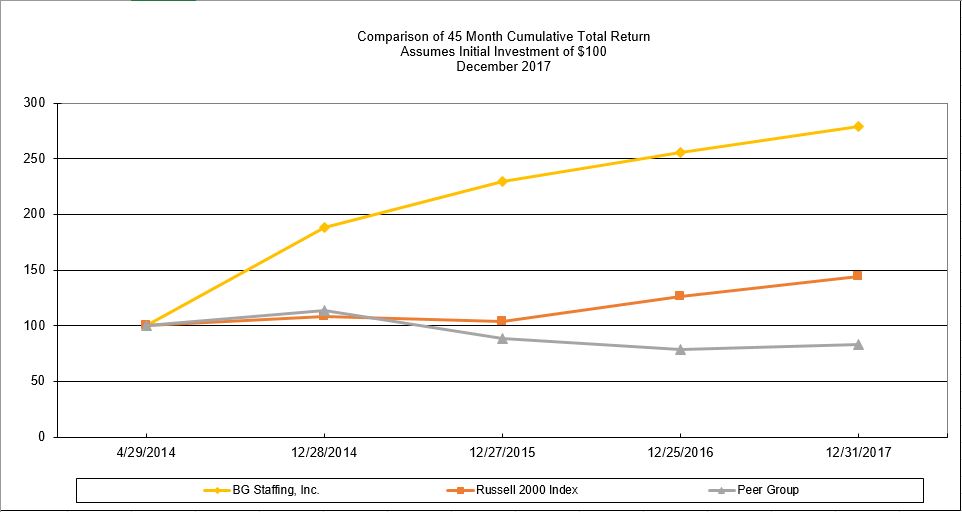
This index represents the cumulative total return of the Company and the following corporations providing temporary or permanent employment services: GEE Group, Mastech Digital, RCM Technologies and Staffing 360 Solutions.
19
Market Information and Holders
Our common stock commenced listing on the NYSE American on October 27, 2014 under the symbol “BGSF.” Our common stock was quoted on the OTC Bulletin Board, or OTCBB, under the symbol “BGSF” from April 30, 2014 to October 27, 2014. Prior to the quotation of our common stock on the OTCBB, there was no public market for our common stock. The table below sets forth information on the range of high and low sales prices for our common stock.
Quarter Ended | High | Low | |||||
December 31, 2017 | $ | 18.17 | $ | 14.65 | |||
September 24, 2017 | $ | 18.85 | $ | 14.26 | |||
June 25, 2017 | $ | 18.50 | $ | 13.85 | |||
March 26, 2017 | $ | 15.64 | $ | 12.84 | |||
December 25, 2016 | $ | 17.03 | $ | 11.77 | |||
September 25, 2016 | $ | 21.09 | $ | 15.38 | |||
June 26, 2016 | $ | 16.72 | $ | 12.55 | |||
March 27, 2016 | $ | 14.95 | $ | 12.07 | |||
As of February 9, 2018, the last reported sales price for our common stock was $16.75 per share.
As of February 9, 2018, there were approximately 2,206 holders of record of our common stock.
Dividends
The board of directors has declared or paid the following cash dividends during the fiscal years ended 2017, 2016 and 2015:
Declared Date | Record Date | Distribution Date | Dividend per Share | Amount Paid | ||||||
December 19, 2014 | December 31, 2014 | January 30, 2015 | $0.15 | $ | 989,722 | |||||
May 1, 2015 | May 11, 2015 | May 25, 2015 | $0.25 | 1,811,161 | ||||||
June 18, 2015 | July 20, 2015 | July 31, 2015 | $0.25 | 1,844,868 | ||||||
October 27, 2015 | November 9, 2015 | November 20, 2015 | $0.25 | 1,846,655 | ||||||
Total | $ | 6,492,406 | ||||||||
January 26, 2016 | February 8, 2016 | February 19, 2016 | $0.25 | $ | 1,846,989 | |||||
April 28, 2016 | May 9, 2016 | May 16, 2016 | $0.25 | 1,849,691 | ||||||
July 26, 2016 | August 8, 2016 | August 15, 2016 | $0.25 | 2,167,121 | ||||||
October 19, 2016 | October 31, 2016 | November 7, 2016 | $0.25 | 2,167,121 | ||||||
Total | $ | 8,030,922 | ||||||||
January 26, 2017 | February 13, 2017 | February 20, 2017 | $0.25 | $ | 2,167,327 | |||||
April 20, 2017 | May 1, 2017 | May 8, 2017 | $0.25 | 2,188,744 | ||||||
July 20, 2017 | July 31, 2017 | August 7, 2017 | $0.25 | 2,189,844 | ||||||
October 23, 2017 | November 2, 2017 | November 7, 2017 | $0.25 | 2,189,844 | ||||||
Total | $ | 8,735,759 | ||||||||
On February 1, 2018, the Company's board of directors declared a cash dividend in the amount of $0.25 per share of common stock to be paid on February 20, 2018 to all shareholders of record as of the close of business on February 12, 2018.
Prior to December 19, 2014, we had not paid cash dividends on our common stock. Our ability to pay dividends is restricted under the terms of our credit agreement and may be restricted under other agreements governing our outstanding indebtedness from time to time. Any future determination with respect to the payment of dividends will be at the discretion of our board of directors and will be dependent upon, among other things, our financial condition, results of operations, capital requirements, the terms of our then existing indebtedness, contractual restrictions, future prospects, general economic conditions and other factors
20
considered relevant by our board of directors. See “Item 7. Management’s Discussion and Analysis of Financial Condition and Results of Operations–Liquidity and Capital Resources–Credit Agreements” for a description of the restrictions in our credit agreements on our ability to pay dividends.
Equity Compensation Plans
The following equity compensation plan information is provided as of December 31, 2017:
Plan Category | Number of Securities to be Issued upon Exercise of Outstanding Options, Warrants and Rights (a) | Weighted-average Exercise Price of Outstanding Options, Warrants and Rights | Number of Securities Remaining Available for Future Issuance Under Equity Compensation Plans (Excluding Securities Reflected in Column (a)) | |||||
Equity Compensation Plans Approved by Security Holders (2013 Long-Term Incentive Plan) | 765,411 | $10.27 | 225,103 | |||||
Total | 765,411 | $10.27 | 225,103 | |||||
A description of the equity compensation plan is incorporated by reference to Note 13 in the Notes to Consolidated Financial Statements included in Item 15 in this Annual Report on Form 10-K.
Recent Sales of Unregistered Securities
In November 2015, we issued 6,482 shares of common stock in a cashless exercise of outstanding warrants. The warrants had an original exercise price of $6.25.
In July 2016, we issued 157, 2,046, and 15,707 shares of common stock in cashless exercises of outstanding warrants. The warrants had an original exercise prices of $4.51, $6.25, and $11.85, respectively.
In April 2017, we issued 70,670 shares of common stock in a private placement for a value of $1.0 million at the closing of the Zycron acquisition.
The foregoing issuances of securities were exempt from registration pursuant to Section 4(a)(2) of the Securities Act of 1933, as amended.
Share Repurchases
There were no share repurchases during the fiscal years ended 2017, 2016 or 2015.
Item 6. Selected Financial Data.
The following tables set forth our summary consolidated historical financial data. You should read the information set forth below in conjunction with “Item 7. Management’s Discussion and Analysis of Financial Condition and Results of Operations” and our consolidated historical financial statements and notes thereto included elsewhere in this Annual Report on Form 10-K. The statement of operations data for the fiscal years ended 2017, 2016, and 2015 and the balance sheet data as of December 31, 2017 and December 25, 2016 set forth below are derived from our audited consolidated financial statements included elsewhere in this Annual Report on Form 10-K. The statement of operations data for the fiscal years ended 2014 and 2013 and the balance sheet data as of December 27, 2015, December 28, 2014, and December 29, 2013 set forth below were derived from our audited financial statements not included in this Annual Report.
21
Fiscal Years Ended | |||||||||||||||||||
December 31, 2017 | December 25, 2016 | December 27, 2015 | December 28, 2014 | December 29, 2013 | |||||||||||||||
(dollars in thousands, except per share data) | |||||||||||||||||||
Statement of Operations Data: | |||||||||||||||||||
Revenues | $ | 272,600 | $ | 253,852 | $ | 217,534 | $ | 172,811 | $ | 151,678 | |||||||||
Gross profit | $ | 68,402 | $ | 60,073 | $ | 47,907 | $ | 34,527 | $ | 29,063 | |||||||||
Selling, general and administrative expenses | $ | 44,350 | $ | 37,804 | $ | 30,390 | $ | 24,084 | $ | 19,041 | |||||||||
Depreciation and amortization | $ | 6,292 | $ | 6,733 | $ | 5,544 | $ | 4,642 | $ | 4,894 | |||||||||
Operating income | $ | 17,760 | $ | 15,536 | $ | 11,973 | $ | 5,801 | $ | 5,128 | |||||||||
Loss on extinguishment of debt | $ | — | $ | 404 | $ | 439 | $ | — | $ | — | |||||||||
Loss on extinguishment of related party debt | $ | — | $ | — | $ | — | $ | 987 | $ | — | |||||||||
Interest expense, net | $ | 3,253 | $ | 3,962 | $ | 2,996 | $ | 2,472 | $ | 4,057 | |||||||||
Interest expense-related party | $ | — | $ | — | $ | — | $ | 213 | $ | — | |||||||||
Change in fair value of put option | $ | — | $ | — | $ | (177 | ) | $ | 1,184 | $ | 236 | ||||||||
Income before income taxes | $ | 14,507 | $ | 11,170 | $ | 8,715 | $ | 945 | $ | 835 | |||||||||
Income tax expense (benefit) | $ | 8,659 | (3) | $ | 4,288 | $ | 3,368 | $ | 1,374 | $ | (7,463 | ) | |||||||
Net income (loss) | $ | 5,848 | $ | 6,882 | $ | 5,347 | $ | (429 | ) | $ | 8,298 | ||||||||
Net Income (Loss) Per Share: | |||||||||||||||||||
Net income (loss) per share – basic | $ | 0.67 | $ | 0.85 | $ | 0.76 | $ | (0.08 | ) | $ | 1.53 | ||||||||
Net income (loss) per share – diluted | $ | 0.65 | $ | 0.82 | $ | 0.73 | $ | (0.08 | ) | $ | 1.47 | ||||||||
Weighted average shares outstanding – basic | 8,734 | 8,108 | 7,079 | 5,649 | 5,425 | ||||||||||||||
Weighted average shares outstanding – diluted | 9,038 | 8,400 | 7,289 | 5,649 | 5,646 | ||||||||||||||
Pro Forma C Corporation Data (1): | |||||||||||||||||||
Historical income before taxes | $ | — | $ | — | $ | — | $ | — | $ | 835 | |||||||||
Pro forma income tax expense | $ | — | $ | — | $ | — | $ | — | $ | 536 | |||||||||
Pro forma income | $ | — | $ | — | $ | — | $ | — | $ | 299 | |||||||||
Pro forma income per share – basic | $ | — | $ | — | $ | — | $ | — | $ | 0.06 | |||||||||
Pro forma income per share – diluted | $ | — | $ | — | $ | — | $ | — | $ | 0.05 | |||||||||
Pro forma weighted average shares outstanding – basic | — | — | — | — | 5,425 | ||||||||||||||
Pro forma weighted average shares outstanding – diluted | — | — | — | — | 5,646 | ||||||||||||||
Other Financial Data: | |||||||||||||||||||
Adjusted EBITDA (2) | $ | 24,499 | $ | 22,583 | $ | 17,870 | $ | 11,636 | $ | 10,022 | |||||||||
Cash dividends declared per common share | $ | 1.00 | $ | 1.00 | $ | 0.75 | $ | 0.15 | $ | — | |||||||||
Balance Sheet Data: | |||||||||||||||||||
Working capital | $ | 16,320 | $ | 19,185 | $ | 10,016 | $ | 8,304 | $ | 8,126 | |||||||||
Total assets | $ | 104,633 | $ | 81,214 | $ | 84,400 | $ | 53,276 | $ | 58,260 | |||||||||
Total outstanding borrowings, net | $ | 44,123 | $ | 23,618 | $ | 30,649 | $ | 21,591 | $ | 32,022 | |||||||||
Total other long-term liabilities | $ | 2,629 | $ | 1,858 | $ | 4,519 | $ | 2,922 | $ | 33,343 | |||||||||
Stockholders’ equity | $ | 39,135 | $ | 40,488 | $ | 25,928 | $ | 16,363 | $ | 8,103 | |||||||||
22
(1) | For comparative purposes, information related to pro forma tax expense, pro forma income and pro forma income per share has been included assuming the Company had been taxed as a C corporation for the period presented in the audited historical consolidated financial statements (Fiscal year 2013). |
(2) | We present Adjusted EBITDA (defined below), a measure that is not in accordance with generally accepted accounting principles (non-GAAP), in this Annual Report on Form 10-K to provide investors with a supplemental measure of our operating performance. We believe that Adjusted EBITDA is a useful performance measure and is used by us to facilitate a comparison of our operating performance on a consistent basis from period-to-period and to provide for a more complete understanding of factors and trends affecting our business than measures under generally accepted accounting principles ("GAAP") can provide alone. Our board and management also use Adjusted EBITDA as one of the primary methods for planning and forecasting overall expected performance and for evaluating on a quarterly and annual basis actual results against such expectations, and as a performance evaluation metric in determining achievement of certain compensation programs and plans for our management. In addition, the financial covenants in our credit agreements are based on EBITDA as defined in the credit agreements. |
(3) | Includes a $3.3 million re-measurement of the net deferred tax assets as a result of the Tax Cuts and Jobs Act ("TCJA"). |
We define “Adjusted EBITDA” as earnings before interest expense and related party interest, income taxes, depreciation and amortization expense, loss on early extinguishment of debt and related party debt, and other non-cash expenses such as the put option adjustment and share-based compensation expense. Omitting interest, taxes and the other items provides a financial measure that facilitates comparisons of our results of operations with those of companies having different capital structures. Since the levels of indebtedness and tax structures that other companies have are different from ours, we omit these amounts to facilitate investors’ ability to make these comparisons. Similarly, we omit depreciation and amortization because other companies may employ a greater or lesser amount of property and intangible assets. We also believe that investors, analysts and other interested parties view our ability to generate Adjusted EBITDA as an important measure of our operating performance and that of other companies in our industry. In addition, the financial covenants in our credit agreement are based on Adjusted EBITDA as defined in the credit agreement. Adjusted EBITDA should not be considered as an alternative to net income (loss) for the periods indicated as a measure of our performance. Other companies in our industry may calculate Adjusted EBITDA differently than we do, limiting its usefulness as a comparative measure.
The use of Adjusted EBITDA has limitations as an analytical tool, and you should not consider this performance measure in isolation from, or as an alternative to, GAAP measures such as net income (loss). Adjusted EBITDA is not a measure of liquidity under GAAP or otherwise, and is not an alternative to cash flow from continuing operating activities. Our presentation of Adjusted EBITDA should not be construed as an inference that our future results will be unaffected by the expenses that are excluded from that term or by unusual or non-recurring items. The limitations of Adjusted EBITDA include: (i) it does not reflect our cash expenditures or future requirements for capital expenditures or contractual commitments; (ii) it does not reflect changes in, or cash requirements for, our working capital needs; (iii) it does not reflect income tax payments we may be required to make; and (iv) it does not reflect the cash requirements necessary to service interest or principal payments associated with indebtedness.
To properly and prudently evaluate our business, we encourage you to review our consolidated financial statements included elsewhere in this Annual Report on Form 10-K and the reconciliation to Adjusted EBITDA from net income (loss), the most directly comparable financial measure presented in accordance with GAAP, set forth in the following table. All of the items included in the reconciliation from net income (loss) to Adjusted EBITDA are either (i) non-cash items or (ii) items that management does not consider in assessing our on-going operating performance. In the case of the non-cash items, management believes that investors may find it useful to assess our comparative operating performance because the measures without such items are less susceptible to variances in actual performance resulting from depreciation, amortization and other non-cash charges and more reflective of other factors that affect operating performance. In the case of the other items that management does not consider in assessing our on-going operating performance, management believes that investors may find it useful to assess our operating performance if the measures are presented without these items because their financial impact may not reflect on-going operating performance.
23
Fiscal Years Ended | |||||||||||||||||||||
December 31, 2017 | December 25, 2016 | December 27, 2015 | December 28, 2014 | December 29, 2013 | |||||||||||||||||
(dollars in thousands) | |||||||||||||||||||||
Net income (loss) | $ | 5,848 | $ | 6,882 | $ | 5,347 | $ | (429 | ) | $ | 8,298 | ||||||||||
Interest expense and related party interest, net | 3,253 | 3,962 | 2,996 | 2,685 | 4,057 | ||||||||||||||||
Income tax expense (benefit) | 8,659 | (3) | 4,288 | 3,368 | 1,374 | (7,463 | ) | ||||||||||||||
Loss on extinguishment of debt and related party debt | — | 404 | 439 | 987 | — | ||||||||||||||||
Change in fair value of put option | — | — | (177 | ) | 1,184 | 236 | |||||||||||||||
Operating income | 17,760 | 15,536 | 11,973 | 5,801 | 5,128 | ||||||||||||||||
Depreciation and amortization | 6,292 | 6,733 | 5,544 | 4,642 | 4,894 | ||||||||||||||||
Share-based compensation | 447 | 314 | 353 | 1,193 | — | ||||||||||||||||
Adjusted EBITDA | $ | 24,499 | $ | 22,583 | $ | 17,870 | $ | 11,636 | $ | 10,022 | |||||||||||
(3) | Includes a $3.3 million re-measurement of the net deferred tax assets as a result of the TCJA. |
Item 7. Management’s Discussion and Analysis of Financial Condition and Results of Operations.
The following discussion and analysis of our financial condition and results of operations, our expectations regarding the future performance of our business and the other non-historical statements in the discussion and analysis are forward-looking statements. These forward-looking statements are subject to risks, uncertainties and other factors including those described in “Item 1A. Risk Factors” of this Annual Report on Form 10-K. Our actual results may differ materially from those contained in any forward-looking statements. You should read the following discussion together with our audited consolidated financial statements and related notes thereto and other financial information included in this Annual Report on Form 10-K.
Our financial information may not be indicative of our future performance.
Overview
We are a leading national provider of temporary staffing services and have completed a series of acquisitions including the acquisition of BG Personnel, LP and B G Staff Services Inc. in June 2010, and substantially all of the assets of JNA Staffing, Inc. in December 2010, Extrinsic, LLC in December 2011, American Partners, Inc. in December 2012, InStaff in June 2013, D&W in March 2015, VTS in October 2015, Zycron in April 2017 and Smart in September 2017. We operate within three industry segments: Multifamily, Professional, and Commercial. We provide services to customers primarily within the United States of America.
The Multifamily segment provides front office and maintenance temporary workers to various apartment communities, in 23 states, via property management companies responsible for the apartment communities' day to day operations.
The Professional segment provides skilled temporary workers on a nationwide basis for information technology ("IT") and finance and accounting customer projects.
The Commercial segment provides temporary workers primarily to logistics, distribution, and call center customers needing a flexible workforce in Illinois, Wisconsin, New Mexico, Texas, Tennessee and Mississippi.
24
Results of Operations
The following tables summarize key components of our results of operations for the periods indicated, both in dollars and as a percentage of revenues, and have been derived from our consolidated financial statements.
Fiscal Year Ended | |||||||||||||
December 31, 2017 | December 25, 2016 | December 27, 2015 | |||||||||||
(dollars in thousands) | |||||||||||||
Revenues | $ | 272,600 | $ | 253,852 | $ | 217,534 | |||||||
Cost of services | 204,198 | 193,779 | 169,627 | ||||||||||
Gross Profit | 68,402 | 60,073 | 47,907 | ||||||||||
Selling, general and administrative expenses | 44,350 | 37,804 | 30,390 | ||||||||||
Depreciation and amortization | 6,292 | 6,733 | 5,544 | ||||||||||
Operating income | 17,760 | 15,536 | 11,973 | ||||||||||
Loss on extinguishment of debt | — | (404 | ) | (439 | ) | ||||||||
Interest expense, net | (3,253 | ) | (3,962 | ) | (2,996 | ) | |||||||
Change in fair value of put option | — | — | 177 | ||||||||||
Income before income tax | 14,507 | 11,170 | 8,715 | ||||||||||
Income tax expense | 8,659 | 4,288 | 3,368 | ||||||||||
Net income | $ | 5,848 | $ | 6,882 | $ | 5,347 | |||||||
Fiscal Year Ended | |||||||||||||
December 31, 2017 | December 25, 2016 | December 27, 2015 | |||||||||||
Revenues | 100.0 | % | 100.0 | % | 100.0 | % | |||||||
Cost of services | 74.9 | 76.3 | 78.0 | ||||||||||
Gross Profit | 25.1 | 23.7 | 22.0 | ||||||||||
Selling, general and administrative expenses | 16.3 | 14.9 | 14.0 | ||||||||||
Depreciation and amortization | 2.3 | 2.7 | 2.5 | ||||||||||
Operating income | 6.5 | 6.1 | 5.5 | ||||||||||
Loss on extinguishment of debt | — | (0.2 | ) | (0.2 | ) | ||||||||
Interest expense, net | (1.2 | ) | (1.6 | ) | (1.4 | ) | |||||||
Change in fair value of put option | — | — | 0.1 | ||||||||||
Income before income tax | 5.3 | 4.4 | 4.0 | ||||||||||
Income tax expense | 3.2 | 1.7 | 1.5 | ||||||||||
Net income | 2.1 | % | 2.7 | % | 2.5 | % | |||||||
25
Fifty-three Week Fiscal Year Ended December 31, 2017 (Fiscal 2017) Compared with Fifty-two Week Fiscal Year Ended December 25, 2016 (Fiscal 2016)
The Fiscal 2017 consolidated statement of operations includes 39 weeks of Zycron operations and 15 weeks of Smart operations.
Revenues:
Fiscal Year Ended | ||||||||||||||
December 31, 2017 | December 25, 2016 | |||||||||||||
(dollars in thousands) | ||||||||||||||
Revenues by Segment: | ||||||||||||||
Multifamily | $ | 71,807 | 26.3 | % | $ | 57,995 | 22.8 | % | ||||||
Professional | 126,641 | 46.5 | % | 107,037 | 42.2 | % | ||||||||
Commercial | 74,152 | 27.2 | % | 88,820 | 35.0 | % | ||||||||
Total Revenues | $ | 272,600 | 100.0 | % | $ | 253,852 | 100.0 | % | ||||||
Multifamily Revenues: Multifamily revenues increased approximately $13.8 million (23.8%) due to our continued geographic expansion plan. Revenue from branches outside of Texas accounted for approximately $8.9 million of the increase and revenue from branches in Texas increased approximately $4.9 million. The increase was due to a 16.4% increase in billed hours and a 6.0% increase in average bill rate. Revenue from existing offices accounted for approximately $11.5 million of the increase and revenue from new offices provided approximately $2.3 million.
Professional Revenues: Professional revenues increased approximately $19.6 million (18.3%), primarily from Zycron, which contributed approximately $27.1 million of new revenues and from Smart, which contributed approximately $3.2 million of new revenues. The remaining IT group decreased $6.9 million and the remaining finance and accounting group decreased $3.7 million. The overall increase was due to a 23.7% increase in billed hours, offset by decrease of 4.7% in average bill rate.
Commercial Revenues: Commercial revenues decreased approximately $14.7 million (16.5%) primarily from operations in Texas. Texas branches decreased revenues $8.3 million and other branches outside of the Midwest decreased $6.9 million, which were offset by Illinois and Wisconsin locations increased $0.5 million. The overall revenue decrease was due to a 20.6% decrease in billed hours that was offset by a 5.0% increase in average bill rate.
Gross Profit:
Gross profit represents revenues from services less cost of services expenses, which consist of payroll, payroll taxes, payroll-related insurance, temporary worker costs, and reimbursable costs.
Fiscal Year Ended | ||||||||
December 31, 2017 | December 25, 2016 | |||||||
(dollars in thousands) | ||||||||
Gross Profit by Segment: | ||||||||
Multifamily | $ | 27,138 | $ | 21,547 | ||||
Professional | 30,626 | 25,728 | ||||||
Commercial | 10,638 | 12,798 | ||||||
Total Gross Profit | $ | 68,402 | $ | 60,073 | ||||
26
Fiscal Year Ended | ||||||
December 31, 2017 | December 25, 2016 | |||||
Gross Profit Percentage by Segment: | ||||||
Multifamily | 37.8 | % | 37.2 | % | ||
Professional | 24.2 | % | 24.0 | % | ||
Commercial | 14.3 | % | 14.4 | % | ||
Company Gross Profit Percentage | 25.1 | % | 23.7 | % | ||
Overall, our gross profit increased approximately $8.3 million (13.9%) due primarily to the Zycron ($5.7 million) and Smart ($1.1 million) acquisitions and increased revenues in our Multifamily segment, offset by decreased revenues in our Commercial segment. As a percentage of revenue, gross profit has increased to 25.1% from 23.7%, primarily due to higher percentage of our revenues from our Multifamily and Professional segments.
We determine spread as the difference between average bill rate and average pay rate.
Multifamily Gross Profit: Multifamily gross profit increased approximately $5.6 million (25.9%) consistent with the increase in revenue. The increase in gross profit percentage of 0.6% was due primarily to 6.1% increase in average spread.
Professional Gross Profit: Professional gross profit increased approximately $4.9 million (19.0%) due to Zycron of $5.7 million, Smart of $1.1 million, a 1.2% increase in average spread, offset by a $0.8 million decrease in the remaining finance and accounting group and a $1.2 million decrease in the remaining IT group.
Commercial Gross Profit: Commercial gross profit decreased approximately $2.2 million (16.9%) due to the corresponding decreased revenue offset by an increase of 5.0% in the average spread .
Selling, General and Administrative Expenses: Selling, general and administrative expenses increased approximately $6.5 million (17.3%) related to an increase in Multifamily of $2.8 million from growth, including $0.7 million of new office expansion, and an increase in Professional of $3.1 million from Zycron and $0.9 million from Smart.
Depreciation and Amortization: Depreciation and amortization charges decreased approximately $0.4 million (6.5%). The decrease in depreciation and amortization is primarily due to Professional segment fully amortized intangible assets related to the
2011 Extrinsic, LLC acquisition of $1.1 million that was partially offset by an increase in the Professional segment intangible
assets acquired in the Zycron acquisition of $0.7 million.
Interest Expense, net: Interest expense, net decreased approximately $0.7 million (17.9%) primarily due to the decrease in the interest of $1.2 million related to the payoff of the 13% subordinated debt, the decrease in contingent consideration discounts of $0.6 million, partially offset by the increase of $0.7 million in the new term debt and the increase of $0.3 million in the revolver.
Income Taxes: Income tax expense, net increased approximately $4.4 million primarily due to the impact of the TCJA which resulted in a re-measurement of the net deferred tax assets of $3.3 million and an increase of $1.1 million from increased pretax income.
27
Fifty-two Week Fiscal Year Ended December 25, 2016 (Fiscal 2016) Compared with Fifty-two Week Fiscal Year Ended December 27, 2015 (Fiscal 2015)
Revenues:
Fiscal Year Ended | ||||||||||||||
December 25, 2016 | December 27, 2015 | |||||||||||||
(dollars in thousands) | ||||||||||||||
Revenues by Segment: | ||||||||||||||
Multifamily | $ | 57,995 | 22.8 | % | $ | 43,197 | 19.9 | % | ||||||
Professional | 107,037 | 42.2 | % | 86,712 | 39.9 | % | ||||||||
Commercial | 88,820 | 35.0 | % | 87,625 | 40.2 | % | ||||||||
Total Revenues | $ | 253,852 | 100.0 | % | $ | 217,534 | 100.0 | % | ||||||
Multifamily Revenues: Multifamily revenues increased approximately $14.8 million (34.3%) due to our continued focus on expansion outside of Texas. Revenue from branches outside of Texas accounted for approximately $13.5 million of the increase and revenue from branches in Texas increased approximately $1.3 million. The increase was due to a 28.8% increase in billed hours and a 4.3% increase in average bill rate. Revenue from existing offices accounted for approximately $12.2 million of the increase and revenue from new offices provided approximately $2.6 million.
Professional Revenues: Professional revenues increased approximately $20.3 million (23.4%). The VTS acquisition contributed approximately $24.3 million of new revenues for 12 months in 2016 verses 3 months in 2015. This revenue increase was offset by a decrease in the other IT divisions of $3.5 million due to a decrease of 3.5% in billed hours and a 2.7% decrease in average bill rate. The finance and accounting division decreased $0.5 million due to 0.9% decrease in billed hours and a 2.8% decrease in average bill rate for 12 months in 2016 verses 10 months in 2015.
Commercial Revenues: Commercial revenues increased approximately $1.2 million (1.4%) primarily from operations in Texas. Texas branches increased revenues $2.4 million, other branches outside of the Midwest increased $2.2 million, and our Illinois and Wisconsin locations decreased $3.4 million. The overall revenue increase was due to a 5.2% increase in average bill rate offset by a 3.7% decrease in billed hours.
Gross Profit:
Gross profit represents revenues from services less cost of services expenses, which consist of payroll, payroll taxes, payroll-related insurance, temporary worker costs, and reimbursable costs.
Fiscal Year Ended | ||||||||
December 25, 2016 | December 27, 2015 | |||||||
(dollars in thousands) | ||||||||
Gross Profit by Segment: | ||||||||
Multifamily | $ | 21,547 | $ | 15,333 | ||||
Professional | 25,728 | 20,020 | ||||||
Commercial | 12,798 | 12,554 | ||||||
Total Gross Profit | $ | 60,073 | $ | 47,907 | ||||
28
Fiscal Year Ended | ||||||
December 25, 2016 | December 27, 2015 | |||||
Gross Profit Percentage by Segment: | ||||||
Multifamily | 37.2 | % | 35.5 | % | ||
Professional | 24.0 | % | 23.1 | % | ||
Commercial | 14.4 | % | 14.3 | % | ||
Company Gross Profit Percentage | 23.7 | % | 22.0 | % | ||
Overall, our gross profit increased approximately $12.2 million (25.4%) due primarily to the VTS ($6.3 million) acquisition (for 12 months in 2016 verses 3 months in 2015) and increased revenues in our Multifamily and Commercial segments. As a percentage of revenue, gross profit has increased to 23.7% from 22.0%, primarily due to higher percentage of our revenues from our Multifamily and Professional segments.
Multifamily Gross Profit: Multifamily gross profit increased approximately $6.3 million (40.5%) mainly due to an increase in revenue and gross profit percentage. The increase in gross profit percentage of 1.7% was due primarily to 7.1% increase in average spread.
Professional Gross Profit: Professional gross profit increased approximately $5.7 million (28.5%) due primarily to the VTS acquisition with a gross profit of 25.3% and the other IT divisions of $0.2 million. These increases were offset by a gross profit decrease of $0.7 million with a gross profit percentage decrease of 3.0% in the finance and accounting group due to a 6.9% decrease in average spread.
Commercial Gross Profit: Commercial gross profit increased approximately $0.2 million (1.9%) due to the corresponding increased revenue. The increase in gross profit percentage of 0.1% is primarily due to a 3.7% increase in average spread.
Selling, General and Administrative Expenses: Selling, general and administrative expenses increased approximately $7.4 million (24.4%) primarily due to the D&W acquisition of $0.3 million and the VTS acquisition of $3.0 million, new multifamily offices of $0.7 million, existing multifamily offices of $2.9 million from increased revenues, and other increased headcount, commissions and bonuses, and other costs associated with our growth, offset by decrease in loss on contingent consideration of $1.2 million.
Depreciation and Amortization: Depreciation and amortization charges increased approximately $1.2 million (21.4%). The increase in depreciation and amortization is primarily due to Professional segment intangible assets acquired in the VTS acquisitions.
Interest Expense, net: Interest expense, net increased approximately $1.0 million (32.2%) primarily due to the increase in the amortization of contingent consideration discounts from the D&W and VTS acquisitions.
Income Taxes: Income tax expense, net increased approximately $0.9 million primarily due to higher taxable income offset by a decrease in the effective rate.
Liquidity and Capital Resources
Our working capital requirements are primarily driven by temporary worker payments, income tax payments and customer accounts receivable receipts. Since receipts from customers lag payments to temporary workers, working capital requirements increase substantially in periods of growth.
Our primary sources of liquidity are cash generated from operations and borrowings under our credit agreement (the “Amended Credit Agreement”) with Texas Capital Bank, National Association (“TCB”) as amended and restated that provides for a revolving credit facility maturing April 3, 2022 (the “Revolving Facility”). Our primary uses of cash are payments to temporary workers, employees, related payroll liabilities, operating expenses, capital expenditures, cash interest, cash taxes, dividends and contingent consideration payments. We believe that the cash generated from operations, together with the borrowing availability under our Revolving Facility, will be sufficient to meet our normal working capital needs for at least the next twelve months, including investments made, and expenses incurred, in connection with opening new branches throughout the next year. Our ability to
29
continue to fund these items may be affected by general economic, competitive and other factors, many of which are outside of our control. If our future cash flow from operations and other capital resources are insufficient to fund our liquidity needs, we may be forced to obtain additional debt or equity capital or refinance all or a portion of our debt.
While we believe we have sufficient liquidity and capital resources to meet our current operating requirements and expansion plans, we may elect to pursue additional growth opportunities within the next year that could require additional debt or equity financing. If we are unable to secure additional financing at favorable terms in order to pursue such additional growth opportunities, our ability to pursue such opportunities could be materially adversely affected.
The Company has an effective Form S-3 shelf registration statement allowing for the offer and sale of up to approximately $36 million of common stock. There is no guarantee that we will be able to consummate any offering on terms we consider acceptable or at all.
A summary of our operating, investing and financing activities are shown in the following table:
Fiscal Year Ended | ||||||||||||
December 31, 2017 | December 25, 2016 | December 27, 2015 | ||||||||||
(dollars in thousands) | ||||||||||||
Net cash provided by operating activities | $ | 18,064 | $ | 9,534 | $ | 11,792 | ||||||
Net cash used in investing activities | (25,644 | ) | (931 | ) | (19,343 | ) | ||||||
Net cash provided by (used in) financing activities | 7,580 | (8,603 | ) | 7,551 | ||||||||
Net change in cash and cash equivalents | $ | — | $ | — | $ | — | ||||||
Operating Activities
Cash provided by operating activities consists of net income adjusted for non-cash items, including depreciation and amortization, loss on extinguishment of debt, share-based compensation expense, put option adjustment, interest expense on contingent consideration payable, and the effect of working capital changes. The primary drivers of cash inflows and outflows are accounts receivable and other current liabilities.
During Fiscal 2017, net cash provided by operating activities was $18.1 million, an increase of $8.5 million compared with $9.5 million for Fiscal 2016. This increase is primarily attributable to the re-measurement of the net deferred tax assets as a result of the TCJA, timing of payments on accounts receivables and accrued payroll and expenses.
During Fiscal 2016, net cash provided by operating activities was $9.5 million, a decrease of $2.3 million compared with $11.8 million for Fiscal 2015. This decrease is primarily attributable to timing of payments on accounts receivables and accrued payroll and expenses offset by higher net income.
Investing Activities
Cash used in investing activities consists primarily of cash paid for businesses acquired and capital expenditures.
In Fiscal 2017, we paid $18.5 million in connection with the Zycron acquisition, $6.0 million in connection with the Smart acquisition and we made capital expenditures of $1.1 million mainly related to computer equipment and software purchased in the ordinary course of business. In Fiscal 2016, we made capital expenditures of $0.9 million mainly related to computer equipment purchased in the ordinary course of business. In Fiscal 2015, we paid $8.8 million in connection with the D&W acquisition in March 2015, $10.0 million in connection with the VTS acquisition in October 2015 and made capital expenditures of $0.6 million mainly related to computer equipment purchased in the ordinary course of business and furniture and fixtures related to the new corporate offices.
30
Financing Activities
Cash flows from financing activities consisted principally of borrowings and payments under our Amended Credit Agreement, deferred financing costs related to our Amended Credit Agreement, payment of dividends and contingent consideration paid.
For Fiscal 2017, we received proceeds from the issuance of the $25.0 million term loan mainly to fund the Zycron acquisition. We paid $8.7 million in cash dividends on our common stock, paid $4.0 million of contingent consideration related to the fiscal October 2015 VTS acquisition, we reduced our revolving line of credit by $2.5 million, paid $1.1 million in principal payments on the term loan, and paid $1.1 million in deferred financing costs related to the Amended Credit Agreement
For Fiscal 2016, we increased borrowings on our revolving credit facility by $7.7 million and received net proceeds from issuance of common stock of $15.3 million to pay off amounts owing under a senior subordinated credit agreement of $15.3 million. We also paid $8.0 million in cash dividends on our common stock and $7.6 million of contingent consideration related to the fiscal March 2015 D&W acquisition & fiscal October 2015 VTS acquisition.
In Fiscal 2015, we increased borrowings under our revolving credit facility by $11.3 million and received net proceeds from issuance of common stock of $7.0 million. We paid $6.5 million in cash dividends on our common stock, decreased our debt and other long-term liabilities by $2.7 million using excess cash flows from operations, paid $0.9 million of contingent consideration primarily related to the fiscal June 2013 InStaff and the fiscal December 2012 American Partners acquisitions, and paid $0.7 million in deferred financing costs related to a credit agreement with TCB.
Credit Agreements
We had a credit agreement with TCB. The credit agreement provided for a revolving facility, maturing August 21, 2019, permitting us to borrow funds from time to time in an aggregate amount equal to the lesser of the borrowing base amount, which was 85% of eligible accounts, and TCB’s commitment of $35.0 million.
In connection with the acquisition of the assets of Zycron described above, on April 3, 2017, we entered into an Amended and Restated Credit Agreement (the “Amended Credit Agreement”) with TCB with an aggregate commitment of $55.0 million. The Amended Credit Agreement provides for the Revolving Facility, which permits us to borrow funds from time to time in an aggregate amount equal to the lesser of the borrowing base amount, which is 85% of eligible accounts, and TCB’s commitment of $35.0 million and also provides for a term loan maturing April 3, 2022 (the “Term Loan”) in the amount of $20.0 million with principal payable quarterly, based on an annual percentage of the original principal amount as defined in the Amended Credit Agreement. TCB may also make loans (“Swing Line Loans”) not to exceed the lesser of $7.5 million or the aggregate commitment. Additionally, the Amended Credit Agreement provides for us to increase the commitment with a $20.0 million accordion feature.
We borrowed $20.0 million on the Term Loan in conjunction with the closing of the Zycron acquisition on April 3, 2017. Proceeds from the foregoing loan arrangements were used to pay off our existing indebtedness on the revolving credit facility under a credit agreement, dated as of August 21, 2015, as amended, with TCB. We borrowed $5.0 million on the accordion in conjunction with the closing of the Smart acquisition on September 18, 2017.
The Revolving Facility and Term Loan bear interest either at the Base Rate plus the Applicable Margin or LIBOR plus the Applicable Margin (as such terms are defined in the Amended Credit Agreement). Swing Line Loans bear interest at the Base Rate plus the Applicable Margin. All interest and commitment fees are generally paid quarterly. Additionally, we pay an unused commitment fee on the unfunded portion of the Revolving Facility. Our obligations under the Amended Credit Agreement are secured by a first priority security interest in substantially all tangible and intangible property of the Company and its subsidiaries.
31
The Amended Credit Agreement's customary affirmative and negative covenants remain substantially the same as those in effect under the original credit agreement including restricting the ability of us to, among other things (with certain exceptions): (i) incur indebtedness; (ii) incur liens; (iii) enter into mergers, consolidations, or similar transactions; (iv) pay dividends or make distributions (except for permitted distributions as defined in the agreement); (v) make loans; (vi) dispose of assets; (vii) enter into transactions with affiliates; or (viii) change the nature of our business and we must comply with certain financial covenants. We may not permit the Leverage Ratio (as defined in the Amended Credit Agreement) to be greater than the following: 2.50 to 1.0 (April 3, 2017 to end of fiscal March 2018), 2.00 to 1.0 (March 31, 2018 to end of fiscal March 2019), 1.50 to 1.0 (March 31, 2019 to end of fiscal March 2020), 1.0 to 1.0 (From and after end of fiscal March, 2020). Moreover, we may not permit, for any four fiscal quarter period, the Fixed Charge Coverage Ratio (as defined in the Amended Credit Agreement) to be less than 1.50 to 1.00, and may not permit the Dividend Fixed Charge Coverage Ratio (as defined in the Amended Credit Agreement) to be less than (a) 1.10 to 1.00 for any four fiscal quarter period ending on or before September 30, 2017 or (b) 1.20 to 1.00 for any four fiscal quarter period thereafter. As of December 31, 2017, the Company was in compliance with these covenants.
Contractual Obligations
The following table summarizes our cash contractual obligations as of December 31, 2017.
Payments due by period | ||||||||||||||||||||
Total | Less than 1 year | 1–3 years | 3–5 years | More than 5 years | ||||||||||||||||
(dollars in thousands) | ||||||||||||||||||||
Long-term debt obligations | $ | 45,256 | $ | 3,063 | $ | 9,800 | $ | 32,393 | $ | — | ||||||||||
Contingent consideration | 7,250 | 4,750 | 2,500 | — | — | |||||||||||||||
Operating lease obligations | 4,579 | 1,539 | 1,990 | 941 | 109 | |||||||||||||||
Contractual cash obligations | $ | 57,085 | $ | 9,352 | $ | 14,290 | $ | 33,334 | $ | 109 | ||||||||||
Off-Balance Sheet Arrangements
We are not party to any off-balance sheet arrangements.
Critical Accounting Policies and Estimates
We have identified the policies listed below as critical to our business and the understanding of our results of operations. For a detailed discussion of the application of these and other accounting policies, see Note 2 in the Notes to the Consolidated Financial Statements of this Annual Report on Form 10-K. The preparation of financial statements in conformity with GAAP, requires management to make estimates and assumptions that affect the reported amounts of assets and liabilities and disclosure of contingent assets and liabilities at the date of the financial statements, and the reported amounts of revenues and expenses during the reporting period.
On an ongoing basis, management evaluates its estimates, including those related to revenue recognition, collectability of accounts receivable, impairment of goodwill and intangible assets, contingencies, litigation, income taxes, stock option expense, and put option liabilities. Management bases its estimates and judgments on historical experiences and on various other factors believed to be reasonable under the circumstances. Actual results under circumstances and conditions different than those assumed could result in differences from the estimated amounts in the consolidated financial statements.
Revenue Recognition
The Company derives its revenues from three segments: Multifamily, Professional, and Commercial. The Company provides temporary staffing and permanent placement services. Revenues as presented on the consolidated statements of operations represent services rendered to customers less sales adjustments and allowances. Reimbursements, including those related to out-of-pocket expenses, are also included in revenues, and equivalent amounts of reimbursable expenses are included in cost of services.
32
The Company and its customers enter into agreements that outline the general terms and conditions of the staffing arrangement. Revenue is recognized as services are performed and associated costs have been incurred. The Company records revenue on a gross basis as a principal versus on a net basis as an agent in the presentation of revenues and expenses. The Company has concluded that gross reporting is appropriate because the Company (i) has the risk of identifying and hiring qualified workers, (ii) has the discretion to select the workers and establish their price and duties and (iii) bears the risk for services that are not fully paid for by customers.
Temporary staffing revenues - The Company's revenues are generated based on negotiated rates and invoiced on a per-hour basis. Accordingly, temporary staffing revenues are recognized on the hours worked when the services are rendered by the Company’s temporary workers. The Company assumes the risk of acceptability of its workers to its customers.
Permanent placement staffing revenues - Permanent placement staffing revenues are recognized when employment candidates start their permanent employment. The Company estimates the effect of permanent placement candidates who do not remain with its customers through the guarantee period (generally 90 days) based on historical experience. Allowances are established to estimate these losses. Fees to customers are generally calculated as a percentage of the new worker’s annual compensation. No fees for permanent placement services are charged to employment candidates.
Goodwill and Intangible Assets
Goodwill represents the excess of the purchase price over the fair value of net assets acquired in the business acquisitions. Intangible assets consist of the value of contract-related intangible assets, trade names and non-compete agreements acquired in acquisitions. We amortize on a straight-line basis intangible assets over their estimated useful lives unless their useful lives are determined to be indefinite. We review goodwill and other intangible assets for impairment annually during the fourth quarter or whenever events or changes in circumstances indicate the carrying value of goodwill may not be recoverable.
Contingent Consideration
The Company has obligations, to be paid in cash, related to its acquisitions if certain future operating and financial goals are met. The fair value of this contingent consideration is determined using expected cash flows and present value technique. Prior to Fiscal 2017, the calculation of the fair value of the expected future payments uses a discount rate that approximates the Company's weighted average cost of capital. For acquisitions beginning in Fiscal 2017, based on a new valuation methodology, the fair value calculation of the expected future payments uses a discount rate commensurate with the risks of the expected cash flow. The resulting discount is amortized as interest expense over the outstanding period using the effective interest method.
Financial Instruments
The Company uses fair value measurements in areas that include, but are not limited to, the allocation of purchase price consideration to tangible and identifiable intangible assets and contingent consideration. The carrying values of cash and cash equivalents, accounts receivables, prepaid expenses, accounts payable, accrued liabilities, and other current assets and liabilities approximate their fair values because of the short-term nature of these instruments. The carrying value of bank debt approximates fair value due to the variable nature of the interest rates under the credit agreement with TCB that provides for the Revolving Facility and term loan and current rates available to the Company for debt with similar terms and risk.
Share-Based Compensation
The Company recognizes compensation expense in selling, general and administrative expenses over the service period for options that are expected to vest and records adjustments to compensation expense at the end of the service period if actual forfeitures differ from original estimates.
Recent Accounting Pronouncements
For a discussion of recent accounting pronouncements and their potential effect on our results of operations and financial condition, refer to Note 2 in the Notes to the Consolidated Financial Statements of this Annual Report on Form 10-K.
33
JOBS Act
The Jumpstart Our Business Startups Act of 2012 provides that an “emerging growth company” can delay the adoption of certain accounting standards until those standards would otherwise apply to private companies. We may elect to delay the adoption of new or revised accounting pronouncements applicable to public and private companies until such pronouncements become mandatory for private companies. As a result, our financial statements may not be comparable to the financial statements of issuers who are required to comply with the effective dates for new or revised accounting standards that are applicable to public and private companies.
Item 7A. Quantitative and Qualitative Disclosures about Market Risk.
We are exposed to certain market risks from transactions we enter into in the normal course of business. Our primary market risk exposure relates to interest rate risk.
Interest Rates
Our Revolving Facility provides available borrowing to us at variable interest rates. Accordingly, future interest rate changes could potentially put us at risk for an adverse impact on future earnings and cash flows. See Note 9 to our Consolidated Financial statements.
34
Item 8. Financial Statements and Supplementary Data.
Page | |
Audited Consolidated Financial Statements of BG Staffing, Inc. | |
Consolidated Balance Sheets as of December 31, 2017 and December 25, 2016 | |
Consolidated Statements of Operations for the three fiscal years ended December 31, 2017 | |
Consolidated Statements of Changes in Stockholders' Equity for the three fiscal years ended December 31, 2017 | |
Consolidated Statements of Cash Flows for the three fiscal years ended December 31, 2017 | |
35
REPORT OF INDEPENDENT REGISTERED PUBLIC ACCOUNTING FIRM
To the Board of Directors and
Stockholders of BG Staffing, Inc.
Opinion on the Financial Statements
We have audited the accompanying consolidated balance sheets of BG Staffing, Inc. (the “Company”), as of December 31, 2017 and December 25, 2016 and the related consolidated statements of operations, changes in stockholders’ equity, and cash flows for each of the years in the three-year period ended December 31, 2017, and the related notes (collectively referred to as the “financial statements”). In our opinion, the consolidated financial statements present fairly, in all material respects, the financial position of the Company as of December 31, 2017 and December 25, 2016, and the results of their operations and their cash flows for each of the years in the three-year period ended December 31, 2017, in conformity with accounting principles generally accepted in the United States of America.
Basis for Opinion
These financial statements are the responsibility of the Company’s management. Our responsibility is to express an opinion on these financial statements based on our audits. We are a public accounting firm registered with the Public Company Accounting Oversight Board (United States) ("PCAOB") and are required to be independent with respect to the Company in accordance with the U.S. federal securities laws and the applicable rules and regulations of the Securities and Exchange Commission and the PCAOB.
We conducted our audits in accordance with the standards of the PCAOB. Those standards require that we plan and perform the audit to obtain reasonable assurance about whether the financial statements are free of material misstatement, whether due to error or fraud. The Company is not required to have, nor were we engaged to perform, an audit of its internal control over financial reporting. As part of our audits we are required to obtain an understanding of internal control over financial reporting, but not for the purpose of expressing an opinion on the effectiveness of the entity’s internal control over financial reporting. Accordingly, we express no such opinion.
Our audits included performing procedures to assess the risks of material misstatement of the financial statements, whether due to error or fraud, and performing procedures that respond to those risks. Such procedures included examining, on a test basis, evidence regarding the amounts and disclosures in the financial statements. Our audits also included evaluating the accounting principles used and significant estimates made by management, as well as evaluating the overall presentation of the financial statements. We believe that our audits provide a reasonable basis for our opinion.
/s/ Whitley Penn LLP
We have served as the Company's auditor since 2013.
Dallas, Texas
March 8, 2018
36
BG Staffing, Inc. and Subsidiaries
CONSOLIDATED BALANCE SHEETS
December 31, 2017 | December 25, 2016 | |||||||||
ASSETS | ||||||||||
Current assets | ||||||||||
Accounts receivable (net of allowance for doubtful accounts of $473,573 at 2017 and 2016) | $ | 36,707,885 | $ | 33,328,900 | ||||||
Prepaid expenses | 947,968 | 950,696 | ||||||||
Income taxes receivable | 190,912 | — | ||||||||
Other current assets | 143,237 | 154,673 | ||||||||
Total current assets | 37,990,002 | 34,434,269 | ||||||||
Property and equipment, net | 2,039,935 | 1,910,858 | ||||||||
Other assets | ||||||||||
Deposits | 2,907,104 | 2,657,517 | ||||||||
Deferred income taxes, net | 6,402,513 | 9,512,455 | ||||||||
Intangible assets, net | 37,323,286 | 23,514,376 | ||||||||
Goodwill | 17,970,049 | 9,184,659 | ||||||||
Total other assets | 64,602,952 | 44,869,007 | ||||||||
Total assets | $ | 104,632,889 | $ | 81,214,134 | ||||||
LIABILITIES AND STOCKHOLDERS' EQUITY | ||||||||||
Current liabilities | ||||||||||
Long-term debt, current portion (net of deferred finance fees of $138,801 and $-0- for 2017 and 2016, respectively) | $ | 2,923,699 | $ | — | ||||||
Accrued interest | 330,630 | 100,868 | ||||||||
Accounts payable | 1,909,612 | 951,672 | ||||||||
Accrued payroll and expenses | 11,540,806 | 9,668,475 | ||||||||
Accrued workers’ compensation | 592,121 | 754,556 | ||||||||
Contingent consideration, current portion | 4,299,184 | 3,580,561 | ||||||||
Other current liabilities | 74,052 | — | ||||||||
Income taxes payable | — | 193,264 | ||||||||
Total current liabilities | 21,670,104 | 15,249,396 | ||||||||
Line of credit (net of deferred finance fees of $747,716 and $264,520 for 2017 and 2016, respectively) | 20,620,352 | 23,618,194 | ||||||||
Long-term debt, less current portion (net of deferred finance fees of $246,030 and $-0- for 2017 and 2016, respectively) | 20,578,970 | — | ||||||||
Contingent consideration, less current portion | 2,178,486 | 1,586,324 | ||||||||
Other long-term liabilities | 450,298 | 271,766 | ||||||||
Total liabilities | 65,498,210 | 40,725,680 | ||||||||
Commitments and Contingencies | ||||||||||
Preferred stock, $0.01 par value per share, 500,000 shares authorized, -0- shares issued and outstanding | — | — | ||||||||
Common stock, $0.01 par value per share; 19,500,000 shares authorized, 8,759,376 and 8,668,485 shares issued and outstanding for 2017 and 2016, respectively | 87,594 | 86,685 | ||||||||
Additional paid in capital | 37,675,329 | 36,142,688 | ||||||||
Retained earnings | 1,371,756 | 4,259,081 | ||||||||
Total stockholders’ equity | 39,134,679 | 40,488,454 | ||||||||
Total liabilities and stockholders’ equity | $ | 104,632,889 | $ | 81,214,134 | ||||||
The accompanying notes are an integral part of these consolidated financial statements.
37
BG Staffing, Inc. and Subsidiaries
CONSOLIDATED STATEMENTS OF OPERATIONS
Years ended December 31, 2017, December 25, 2016 and December 27, 2015
2017 | 2016 | 2015 | |||||||||||
Revenues | $ | 272,600,050 | $ | 253,852,214 | $ | 217,533,856 | |||||||
Cost of services | 204,198,052 | 193,778,848 | 169,627,150 | ||||||||||
Gross profit | 68,401,998 | 60,073,366 | 47,906,706 | ||||||||||
Selling, general and administrative expenses | 44,349,272 | 37,804,208 | 30,390,277 | ||||||||||
Depreciation and amortization | 6,291,958 | 6,733,341 | 5,543,740 | ||||||||||
Operating income | 17,760,768 | 15,535,817 | 11,972,689 | ||||||||||
Loss on extinguishment of debt | — | (404,119 | ) | (438,507 | ) | ||||||||
Interest expense, net | (3,253,134 | ) | (3,961,617 | ) | (2,995,645 | ) | |||||||
Change in fair value of put option | — | — | 176,871 | ||||||||||
Income before income taxes | 14,507,634 | 11,170,081 | 8,715,408 | ||||||||||
Income tax expense | 8,659,200 | 4,287,674 | 3,368,000 | ||||||||||
Net income | $ | 5,848,434 | $ | 6,882,407 | $ | 5,347,408 | |||||||
Net income per share: | |||||||||||||
Basic | $ | 0.67 | $ | 0.85 | $ | 0.76 | |||||||
Diluted | $ | 0.65 | $ | 0.82 | $ | 0.73 | |||||||
Weighted average shares outstanding: | |||||||||||||
Basic | 8,733,941 | 8,107,637 | 7,079,459 | ||||||||||
Diluted | 9,038,187 | 8,399,883 | 7,288,705 | ||||||||||
The accompanying notes are an integral part of these consolidated financial statements.
38
BG Staffing, Inc. and Subsidiaries
CONSOLIDATED STATEMENTS OF CHANGES IN STOCKHOLDERS’ EQUITY
Years ended December 31, 2017, December 25, 2016 and December 27, 2015
Common Stock | ||||||||||||||||||||||
Preferred Stock | Shares | Par Value | Additional Paid in Capital | Retained Earnings | Total | |||||||||||||||||
Stockholders’ equity, December 28, 2014 | — | 6,598,145 | $ | 65,982 | $ | 10,734,438 | $ | 5,562,872 | $ | 16,363,292 | ||||||||||||
Share-based compensation | — | — | — | 352,881 | — | 352,881 | ||||||||||||||||
Issuance of shares, net of offering costs | — | 636,500 | 6,365 | 6,328,245 | — | 6,334,610 | ||||||||||||||||
Retirement of put options | — | — | — | 2,320,145 | — | 2,320,145 | ||||||||||||||||
Exercise of common stock options and warrants | — | 153,310 | 1,533 | 711,239 | — | 712,772 | ||||||||||||||||
Cash dividends declared ($0.25 per share) | — | — | — | — | (5,502,684 | ) | (5,502,684 | ) | ||||||||||||||
Net income | — | — | — | — | 5,347,408 | 5,347,408 | ||||||||||||||||
Stockholders’ equity, December 27, 2015 | — | 7,387,955 | 73,880 | 20,446,948 | 5,407,596 | 25,928,424 | ||||||||||||||||
Share-based compensation | — | — | — | 313,988 | — | 313,988 | ||||||||||||||||
Issuance of shares, net of offering costs | — | 1,191,246 | 11,912 | 15,096,844 | — | 15,108,756 | ||||||||||||||||
Exercise of common stock options and warrants | — | 89,284 | 893 | 284,908 | — | 285,801 | ||||||||||||||||
Cash dividends declared ($0.25 per share) | — | — | — | — | (8,030,922 | ) | (8,030,922 | ) | ||||||||||||||
Net income | — | — | — | — | 6,882,407 | 6,882,407 | ||||||||||||||||
Stockholders’ equity, December 25, 2016 | — | 8,668,485 | 86,685 | 36,142,688 | 4,259,081 | 40,488,454 | ||||||||||||||||
Share-based compensation | — | — | — | 447,301 | — | 447,301 | ||||||||||||||||
Issuance of shares, net of offering costs | — | 70,670 | 707 | 991,793 | — | 992,500 | ||||||||||||||||
Exercise of common stock options and warrants | — | 20,221 | 202 | 93,547 | — | 93,749 | ||||||||||||||||
Cash dividends declared ($0.25 per share) | — | — | — | — | (8,735,759 | ) | (8,735,759 | ) | ||||||||||||||
Net income | — | — | — | — | 5,848,434 | 5,848,434 | ||||||||||||||||
Stockholders’ equity, December 31, 2017 | — | 8,759,376 | $ | 87,594 | $ | 37,675,329 | $ | 1,371,756 | $ | 39,134,679 | ||||||||||||
The accompanying notes are an integral part of these consolidated financial statements.
39
BG Staffing, Inc. and Subsidiaries
CONSOLIDATED STATEMENTS OF CASH FLOWS
Years ended December 31, 2017, December 25, 2016 and December 27, 2015
2017 | 2016 | 2015 | |||||||||||||
Cash flows from operating activities | |||||||||||||||
Net income | $ | 5,848,434 | $ | 6,882,407 | $ | 5,347,408 | |||||||||
Adjustments to reconcile net income to net cash provided by operating activities | |||||||||||||||
Depreciation | 592,317 | 486,682 | 338,707 | ||||||||||||
Amortization | 5,699,641 | 6,246,659 | 5,205,033 | ||||||||||||
Loss on disposal of property and equipment | 17,373 | 10,192 | 1,380 | ||||||||||||
Loss on extinguishment of debt, net | — | 404,119 | 438,507 | ||||||||||||
Contingent consideration adjustment | (225,743 | ) | (167,393 | ) | 1,001,346 | ||||||||||
Amortization of deferred financing fees | 251,376 | 104,847 | 166,133 | ||||||||||||
Amortization of debt discounts | — | 43,159 | 43,140 | ||||||||||||
Interest expense on contingent consideration payable | 1,208,095 | 1,839,429 | 697,660 | ||||||||||||
Paid-in-kind interest | — | — | 166,643 | ||||||||||||
Put option adjustment | — | — | (176,871 | ) | |||||||||||
Provision for doubtful accounts | 760,633 | 389,319 | 371,953 | ||||||||||||
Share-based compensation | 447,301 | 313,988 | 352,881 | ||||||||||||
Deferred income taxes | 3,109,942 | (1,100,663 | ) | (717,373 | ) | ||||||||||
Net changes in operating assets and liabilities, net of effects of acquisitions: | |||||||||||||||
Accounts receivable | 1,434,308 | (1,393,935 | ) | (4,191,615 | ) | ||||||||||
Prepaid expenses | 102,443 | (89,550 | ) | (113,166 | ) | ||||||||||
Other current assets | 27,425 | (20,503 | ) | 112,993 | |||||||||||
Deposits | (245,018 | ) | (424,107 | ) | (345,276 | ) | |||||||||
Accrued interest | 229,762 | (296,363 | ) | 246,112 | |||||||||||
Accounts payable | (555,971 | ) | (620,523 | ) | 185,334 | ||||||||||
Accrued payroll and expenses | 284,667 | (1,927,592 | ) | 2,981,758 | |||||||||||
Accrued workers’ compensation | (162,435 | ) | (34,322 | ) | (564,838 | ) | |||||||||
Other current liabilities | (299,691 | ) | (945,382 | ) | (191,988 | ) | |||||||||
Income taxes receivable and payable | (384,177 | ) | (110,750 | ) | 444,165 | ||||||||||
Other long-term liabilities | (76,959 | ) | (55,878 | ) | (8,112 | ) | |||||||||
Net cash provided by operating activities | 18,063,723 | 9,533,840 | 11,791,914 | ||||||||||||
Cash flows from investing activities | |||||||||||||||
Businesses acquired, net of cash received | (24,500,000 | ) | — | (18,781,091 | ) | ||||||||||
Capital expenditures | (1,145,757 | ) | (938,943 | ) | (563,169 | ) | |||||||||
Proceeds from sale of property and equipment | 2,350 | 7,587 | 1,259 | ||||||||||||
Net cash used in investing activities | (25,643,407 | ) | (931,356 | ) | (19,343,001 | ) | |||||||||
The accompanying notes are an integral part of these consolidated financial statements.
40
BG Staffing, Inc. and Subsidiaries
CONSOLIDATED STATEMENTS OF CASH FLOWS (CONTINUED)
Years ended December 31, 2017, December 25, 2016 and December 27, 2015
2017 | 2016 | 2015 | |||||||||||||
Cash flows from financing activities | |||||||||||||||
Net borrowings (payments) under line of credit | (2,514,646 | ) | 7,665,714 | 11,317,000 | |||||||||||
Proceeds from issuance of long-term debt | 25,000,000 | — | 15,000,000 | ||||||||||||
Principal payments on long-term debt | (1,112,500 | ) | (15,281,657 | ) | (17,187,500 | ) | |||||||||
Payments on other current liabilities | — | (500,000 | ) | (536,488 | ) | ||||||||||
Payments of dividends | (8,735,759 | ) | (8,030,922 | ) | (6,492,406 | ) | |||||||||
Net proceeds from issuance of common stock | 86,249 | 15,254,406 | 7,047,382 | ||||||||||||
Contingent consideration paid | (4,024,257 | ) | (7,556,162 | ) | (869,545 | ) | |||||||||
Deferred financing costs | (1,119,403 | ) | (153,863 | ) | (727,356 | ) | |||||||||
Net cash provided by (used in) financing activities | 7,579,684 | (8,602,484 | ) | 7,551,087 | |||||||||||
Net change in cash and cash equivalents | — | — | — | ||||||||||||
Cash and cash equivalents, beginning of year | — | — | — | ||||||||||||
Cash and cash equivalents, end of year | $ | — | $ | — | $ | — | |||||||||
Supplemental cash flow information: | |||||||||||||||
Cash paid for interest | $ | 1,447,138 | $ | 2,440,757 | $ | 1,463,241 | |||||||||
Cash paid for taxes, net of refunds | $ | 5,909,250 | $ | 5,500,076 | $ | 3,639,253 | |||||||||
Non-cash transactions: | |||||||||||||||
Retirement of put options | $ | — | $ | — | $ | 2,320,145 | |||||||||
Leasehold improvements funded by landlord incentives | $ | 255,493 | $ | — | $ | 321,450 | |||||||||
The accompanying notes are an integral part of these consolidated financial statements.
41
BG Staffing, Inc. and Subsidiaries
NOTES TO CONSOLIDATED FINANCIAL STATEMENTS
NOTE 1 - NATURE OF OPERATIONS
BG Staffing, Inc. is a provider of temporary staffing services that operates, along with its wholly owned subsidiaries BG Staffing, LLC, B G Staff Services Inc., BG Personnel, LP and BG Finance and Accounting, Inc. ("BGFA") (collectively, the "Company"), primarily within the United States of America in three industry segments: Multifamily, Professional, and Commercial .
The Multifamily segment provides front office and maintenance temporary workers to various apartment communities, in 23 states, via property management companies responsible for the apartment communities' day to day operations.
The Professional segment provides skilled temporary workers on a nationwide basis for information technology ("IT") and finance and accounting customer projects.
The Commercial segment provides temporary workers primarily to logistics, distribution, and call center customers needing a flexible workforce in Illinois, Wisconsin, New Mexico, Texas, Tennessee and Mississippi.
NOTE 2 - SUMMARY OF SIGNIFICANT ACCOUNTING POLICIES
Basis of Presentation
The consolidated financial statements include the accounts of the Company. All significant intercompany transactions and balances have been eliminated in consolidation.
Fiscal Year
The Company has a 52/53 week fiscal year. Fiscal years for the consolidated financial statements included herein are for the 53 weeks ended December 31, 2017 and the 52 weeks ended December 25, 2016 and December 27, 2015, referred to herein as Fiscal 2017, 2016 and 2015, respectively.
Reclassifications
Certain reclassifications have been made to the 2015 and 2016 financial statements to conform with the 2017 presentation.
Management Estimates
The preparation of consolidated financial statements in conformity with accounting principles generally accepted in the United States (“GAAP”) requires management to make estimates and assumptions that affect the reported amounts of assets and liabilities and disclosure of contingent assets and liabilities as of the date of the financial statements and the reported amounts of revenues and expenses during the reporting period. Actual results could differ from those estimates. Significant estimates affecting the financial statements include goodwill, intangible assets and contingent consideration obligations related to acquisitions and put option valuation. Additionally, the valuation of share based compensation option expense uses a model based upon interest rates, stock prices, maturity estimates, volatility and other factors. The Company believes these estimates and assumptions are reliable. However, these estimates and assumptions may change in the future based on actual experience as well as market conditions.
Financial Instruments
The Company uses fair value measurements in areas that include, but are not limited to, the allocation of purchase price consideration to tangible and identifiable intangible assets and contingent consideration. The carrying values of cash and cash equivalents, accounts receivables, prepaid expenses, accounts payable, accrued liabilities, and other current assets and liabilities approximate their fair values because of the short-term nature of these instruments. The carrying value of bank debt approximates fair value due to the variable nature of the interest rates under the credit agreement with Texas Capital Bank, National Association (“TCB”) that provides for a revolving credit facility and term loan and current rates available to the Company for debt with similar terms and risk.
Cash and Cash Equivalents
Cash and cash equivalents include all highly liquid investments with an original maturity of three months or less.
42
BG Staffing, Inc. and Subsidiaries
NOTES TO CONSOLIDATED FINANCIAL STATEMENTS
Concentration of Credit Risk
Concentration of credit risk is limited due to the Company’s diverse customer base and their dispersion across many different industries and geographic locations nationwide. No single customer accounted for more than 10% of the Company’s accounts receivable as of December 31, 2017 and December 25, 2016 or revenue in Fiscal 2017, 2016 and 2015. Geographic revenue in excess of 10% of the Company's consolidated revenue in Fiscal 2017 and the related percentage for Fiscal 2016 and 2015 was generated in the following areas:
2017 | 2016 | 2015 | |||||||
Maryland | 12 | % | 13 | % | 4 | % | |||
Tennessee | 12 | % | 5 | % | 3 | % | |||
Texas | 29 | % | 32 | % | 41 | % | |||
Consequently, weakness in economic conditions in these regions could have a material adverse effect on the Company’s financial position and results of future operations.
Accounts Receivable
The Company extends credit to its customers in the normal course of business. Accounts receivable represents unpaid balances due from customers. The Company maintains an allowance for doubtful accounts for expected losses resulting from customers’ non-payment of balances due to the Company. The Company’s determination of the allowance for uncollectible amounts is based on management’s judgments and assumptions, including general economic conditions, portfolio composition, prior loss experience, evaluation of credit risk related to certain individual customers and the Company’s ongoing examination process. Receivables are written off after they are deemed to be uncollectible after all means of collection have been exhausted. Recoveries of receivables previously written off are recorded when received.
Changes in the allowance for doubtful accounts for the fiscal years are as follows:
2017 | 2016 | |||||||
Beginning balance | $ | 473,573 | $ | 446,548 | ||||
Provision for doubtful accounts | 760,633 | 389,319 | ||||||
Amounts written off, net | (760,633 | ) | (362,294 | ) | ||||
Ending balance | $ | 473,573 | $ | 473,573 | ||||
Property and Equipment
The Company depreciates the cost of property and equipment over the estimated useful lives of the assets using the straight-line method ranging from five to seven years. The costs of leasehold improvements are amortized over the shorter of the estimated useful life or lease term. The cost of normal maintenance and repairs is charged to operating expenses as incurred. Material expenditures that increase the life of an asset are capitalized and depreciated over the estimated remaining useful life of the asset. The cost of properties sold, or otherwise disposed of, and the related accumulated depreciation or amortization, are removed from the accounts, and any gains or losses are reflected in current operations.
Deposits
The Company maintains guaranteed costs policies for workers' compensation coverage in the states in which it operates, with minimal loss retention for employees in the commercial segment. Under these policies, the Company is required to maintain refundable deposits of $2.7 million and $2.5 million, which are included in Deposits the accompanying consolidated balance sheets, as of December 31, 2017 and December 25, 2016, respectively.
Long-Lived Assets
The Company reviews its long-lived assets, primarily fixed assets, for impairment whenever events or changes in circumstances indicate that the carrying amount of the asset may not be recovered. The Company looks primarily to the undiscounted future cash flows in its assessment of whether or not long-lived assets have been impaired. There were no impairments during Fiscal 2017, 2016 and 2015.
43
BG Staffing, Inc. and Subsidiaries
NOTES TO CONSOLIDATED FINANCIAL STATEMENTS
Intangible Assets
The Company holds intangible assets with indefinite and finite lives. Intangible assets with indefinite useful lives are not amortized. Intangible assets with finite useful lives are amortized over their respective estimated useful lives, ranging from three to ten years, based on a pattern in which the economic benefit of the respective intangible asset is realized.
Identifiable intangible assets recognized in conjunction with acquisitions are recorded at fair value. Significant unobservable inputs were used to determine the fair value of the identifiable intangible assets based on the income approach valuation model whereby the present worth and anticipated future benefits of the identifiable intangible assets were discounted back to their net present value.
The Company capitalizes purchased software and internal payroll costs directly incurred in the modification of software for internal use. Software maintenance and training costs are expensed in the period incurred.
The Company evaluates the recoverability of intangible assets whenever events or changes in circumstances indicate that an intangible asset’s carrying amount may not be recoverable. The Company determined that there were no impairment indicators for these assets in Fiscal 2017, 2016 and 2015.
The Company annually evaluates the remaining useful lives of the above intangible assets to determine whether events and circumstances warrant a revision to the remaining period of amortization.
Goodwill
Goodwill represents the difference between the enterprise value/cash paid less the fair value of all recognized net asset fair values including identifiable intangible asset values. The Company reviews goodwill for impairment annually during the fourth quarter or whenever events or changes in circumstances indicate the carrying value of goodwill may not be recoverable. Based on annual testing, the Company has determined that there was no goodwill impairment in Fiscal 2017, 2016 or 2015.
The Company first evaluates qualitative factors to determine whether it is more likely than not (that is, a likelihood of more than 50 percent) that the fair value of the reporting unit is less than its carrying amount, including goodwill. If after qualitatively assessing the totality of events or circumstances, the Company determines that it is not more likely than not that the fair value of the reporting unit is less than its carrying amount, then further testing is unnecessary. If after assessing the totality of events or circumstances, the Company determines that it is more likely than not that the fair value of the reporting unit is less than its carrying amount, the Company then estimates the fair value of the reporting unit and compares the fair value of the reporting unit with its carrying amount, including goodwill, as discussed below.
In assessing whether it is more likely than not that an indefinite-lived intangible asset is impaired, the Company assesses relevant events and circumstances that could affect the significant inputs used to determine the fair value.
The quantitative impairment test for an indefinite-lived intangible asset consists of a comparison of the fair value of the asset with its carrying amount. If the carrying amount of an intangible asset exceeds its fair value, a reporting unit shall recognize an impairment loss in an amount equal to that excess.
The quantitative goodwill impairment test involves a two-step process. In the first step, the Company compares the fair value of each reporting unit to its carrying value. If the fair value of the reporting unit exceeds its carrying value, goodwill is not impaired and no further testing is required. If the fair value of the reporting unit is less than the carrying value, the Company must perform the second step of the impairment test to measure the amount of impairment loss. In the second step, the reporting unit's fair value is allocated to all of the assets and liabilities of the reporting unit, including any unrecognized intangible assets, in a hypothetical analysis that calculates the implied fair value of goodwill in the same manner as if the reporting unit was being acquired in a business combination. If the implied fair value of the reporting unit's goodwill is less than the carrying value, the difference is recorded as an impairment loss.
Deferred Rent
The Company recognizes rental expense on a straight-line basis over the life of the agreement. Deferred rent is recognized as the difference between cash payments and rent expense, including any landlord incentives.
44
BG Staffing, Inc. and Subsidiaries
NOTES TO CONSOLIDATED FINANCIAL STATEMENTS
Paid-in-kind Interest
In Fiscal 2015, the Company recorded paid-in-kind interest on a monthly basis to accrued interest. The first month following a quarter, the paid-in-kind accrued interest is reclassed to the related debt principal if not paid.
Deferred Financing Fees
Deferred financing fees are amortized using the effective interest method over the term of the respective loans. Debt issuance costs related to a recognized debt liability are presented in the balance sheet as a direct deduction from the carrying amount of the related debt liability.
Contingent Consideration
The Company has obligations, to be paid in cash, related to its acquisitions if certain future operating and financial goals are met. The fair value of this contingent consideration is determined using expected cash flows and present value technique. Prior to Fiscal 2017, the calculation of the fair value of the expected future payments uses a discount rate that approximates the Company's weighted average cost of capital. For acquisitions beginning in Fiscal 2017, based on a new valuation methodology, the fair value calculation of the expected future payments uses a discount rate commensurate with the risks of the expected cash flow. The resulting discount is amortized as interest expense over the outstanding period using the effective interest method.
Put Option
The Company granted a put option to certain holders of equity in BG Staffing, Inc., which was carried at fair market value in other long-term liabilities in the consolidated balance sheet. Prior to second quarter 2015, the liability was revalued at each balance sheet date at the greater of an adjusted earnings before income taxes, depreciation and amortization method or the fair market value. During third quarter 2015, the liability calculation of fair market value was based on the closing price of the Company's stock. Changes in fair value were recorded as non-cash, non-operating income (expense) in the Company’s consolidated statements of operations. In October 2015, the remaining shares were sold that contained the put right to third parties, which caused the put rights on those shares to expire.
Revenue Recognition
The Company derives its revenues from three segments: Multifamily, Professional, and Commercial. The Company provides temporary staffing and permanent placement services. Revenues as presented on the consolidated statements of operations represent services rendered to customers less sales adjustments and allowances. Reimbursements, including those related to out-of-pocket expenses, are also included in revenues, and equivalent amounts of reimbursable expenses are included in cost of services.
The Company and its customers enter into agreements that outline the general terms and conditions of the staffing arrangement. Revenue is recognized as services are performed and associated costs have been incurred. The Company records revenue on a gross basis as a principal versus on a net basis as an agent in the presentation of revenues and expenses. The Company has concluded that gross reporting is appropriate because the Company (i) has the risk of identifying and hiring qualified workers, (ii) has the discretion to select the workers and establish their price and duties and (iii) bears the risk for services that are not fully paid for by customers.
Temporary staffing revenues - The Company's revenues are generated based on negotiated rates and invoiced on a per-hour basis. Accordingly, temporary staffing revenues are recognized on the hours worked when the services are rendered by the Company’s temporary workers. The Company assumes the risk of acceptability of its workers to its customers.
Permanent placement staffing revenues - Permanent placement staffing revenues are recognized when employment candidates start their permanent employment. The Company estimates the effect of permanent placement candidates who do not remain with its customers through the guarantee period (generally 90 days) based on historical experience. Allowances are established to estimate these losses. Fees to customers are generally calculated as a percentage of the new worker’s annual compensation. No fees for permanent placement services are charged to employment candidates.
Advertising
The Company recognizes advertising expense in selling, general and administrative expenses as the services are incurred. Total advertising expense for Fiscal 2017, 2016 and 2015 was $1.5 million, $1.3 million, and $0.8 million, respectively.
45
BG Staffing, Inc. and Subsidiaries
NOTES TO CONSOLIDATED FINANCIAL STATEMENTS
Share-Based Compensation
The Company recognizes compensation expense in selling, general and administrative expenses over the service period for options that are expected to vest and records adjustments to compensation expense at the end of the service period if actual forfeitures differ from original estimates.
Earnings Per Share
Basic earnings per common share are computed by dividing net income by the weighted average number of common shares outstanding during the period. Diluted earnings per share is calculated by dividing income available to common stockholders by the weighted average number of common shares outstanding during the period adjusted to reflect potentially dilutive securities. Antidilutive shares are excluded from the calculation of earnings per share.
The following is a reconciliation of the number of shares used in the calculation of basic and diluted earnings per share for the respective periods:
December 31, 2017 | December 25, 2016 | December 27, 2015 | ||||||||
Weighted-average number of common shares outstanding: | 8,733,941 | 8,107,637 | 7,079,459 | |||||||
Effect of dilutive securities: | ||||||||||
Stock options | 268,765 | 258,617 | 199,596 | |||||||
Warrants | 35,481 | 33,629 | 9,650 | |||||||
Weighted-average number of diluted common shares outstanding | 9,038,187 | 8,399,883 | 7,288,705 | |||||||
Stock options | 178,000 | 50,000 | 21,042 | |||||||
Warrants | 32,250 | 32,250 | — | |||||||
Anti-dilutive shares | 210,250 | 82,250 | 21,042 | |||||||
Income Taxes
The current provision for income taxes represents estimated amounts payable or refundable on tax returns filed or to be filed for the year. The Company recognizes any penalties when necessary as part of selling, general and administrative expenses.
On December 22, 2017, the President signed the Tax Cuts and Jobs Act (“TCJA”) into law. Effective January 1, 2018, among other changes, TCJA reduces the federal corporate tax rate to 21 percent. Accounting Standards Codification ("ASC") Topic 740-25 and 35 prescribes that the impact of changes in laws or rates shall be recognized at the date of enactment. Accordingly, we recorded a $3.3 million dollar reduction to our net deferred tax assets with an offsetting increase in income tax expense.
Deferred tax assets and liabilities are recorded for the estimated future tax effects of temporary differences between the tax basis of assets and liabilities and amounts are classified net as noncurrent in the consolidated balance sheets. Deferred tax assets are also recognized for net operating loss and tax credit carryovers. The overall change in deferred tax assets and liabilities for the period measures the deferred tax expense or benefit for the period. Effects of changes in enacted tax laws on deferred tax assets and liabilities are reflected as adjustments to tax expense in the period of enactment.
When appropriate, we record a valuation allowance against net deferred tax assets to offset future tax benefits that may not be realized. In determining whether a valuation allowance is appropriate, we consider whether it is more likely than not that all or some portion of our deferred tax assets will not be realized, based in part upon management’s judgments regarding future events and past operating results.
The Company follows the guidance of ASC Topic 740, Accounting for Uncertainty in Income Taxes. ASC Topic 740 prescribes a more-likely-than-not measurement methodology to reflect the financial statement impact of uncertain tax positions taken or expected to be taken in a tax return.
46
BG Staffing, Inc. and Subsidiaries
NOTES TO CONSOLIDATED FINANCIAL STATEMENTS
Recent Accounting Pronouncements
In May 2014, the Financial Accounting Standards Board ("FASB") issued Accounting Standards Updates ("ASU") ASU 2014-09, Revenue from Contracts with Customers. Since May 2014, the FASB has issued additional and amended authoritative guidance regarding revenue from contracts with customers in order to clarify and improve the understanding of the implementation guidance. As amended, the new guidance requires a company to recognize revenue to depict the transfer of goods or services to a customer at an amount that reflects the consideration a company expects to receive in exchange for those goods or services. The new standard is effective for annual and interim periods beginning after December 15, 2017. The Company adopted this ASU on a modified retrospective basis in the first quarter of fiscal 2018 which will not have a material impact on the consolidated financial statements. The Company also had no significant changes to systems, processes, or controls.
In February 2016, the FASB issued ASU 2016-02 Leases, which changes financial reporting as it relates to leasing transactions. Under the new guidance, lessees will be required to recognize a lease liability, measured on a discounted basis; and a right-of-use asset, for the lease term. The new guidance is effective for annual and interim periods beginning after December 15, 2018. Early application is permitted. Lessees and lessors must apply a modified retrospective transition approach for leases existing at, or entered into after, the beginning of the earliest comparative period presented in the financial statements. While the impact of the adoption of this guidance will include the recognition of right-of-use assets and lease liabilities on the Company’s statement of financial position, the Company is in the process of evaluating the impact of adoption of this guidance on its systems, processes, and controls.
In January 2017, the FASB issued ASU No. 2017-04 Intangibles-Goodwill and Other Simplifying the Test for Goodwill Impairment, which provides guidance to simplify the subsequent measurement of goodwill by eliminating the Step 2 procedure from the goodwill impairment test. The new standard is effective for the Company beginning with the fourth quarter of 2020. The Company does not anticipate the adoption of ASU 2017-04 will have a material impact on the Company's financial condition or results of operations.
In May 2017, the FASB issued ASU 2017-09, Compensation-Stock Compensation (Topic 718) Scope of Modification Accounting which provides clarification on when modification accounting should be used for changes to the terms or conditions of a share-based payment award. The new standard is effective for the Company beginning with the first quarter of 2018. The Company does not anticipate the adoption of ASU 2017-09 will have a material impact on the Company's financial condition or results of operations.
NOTE 3 - ACQUISITIONS
Zycron, Inc.
On April 3, 2017, the Company acquired substantially all of the assets and assumed certain liabilities of Zycron, Inc. (“Zycron”) for an initial cash consideration paid of $18.5 million and issued $1.0 million (70,670 shares privately placed) of the Company's common stock at closing. An additional $0.5 million was held back as partial security for post-closing purchase price adjustments and indemnification obligations, which was paid in the fourth quarter of 2017 net of a working capital adjustment. The purchase agreement further provides for contingent consideration of up to $3.0 million based on the performance of the acquired business for the two years following the date of acquisition. The purchase agreement contained a provision for a “true up” of acquired working capital 120 days after the closing date.
The net assets acquired were assigned to the Professional segment. The acquisition of Zycron allows the Company to strengthen and expand its IT operations throughout the southeastern U.S. region and selected markets across the country with talent and project management services.
The Fiscal 2017 consolidated statement of operations includes 39 weeks of Zycron operations, which is approximately $27.1 million of revenue and $2.2 million of operating income. The purchase price has been allocated to the assets acquired and liabilities assumed as of the date of acquisition. All amounts recorded to goodwill are expected to be deductible for tax purposes. The allocation is as follows:
47
BG Staffing, Inc. and Subsidiaries
NOTES TO CONSOLIDATED FINANCIAL STATEMENTS
Accounts receivable | $ | 4,345,312 | ||
Prepaid expenses and other assets | 82,122 | |||
Property and equipment | 128,431 | |||
Intangible assets | 13,818,475 | |||
Goodwill | 7,037,271 | |||
Liabilities assumed | (2,997,027 | ) | ||
Total net assets acquired | $ | 22,414,584 | ||
Cash | $ | 18,500,000 | ||
Hold back | 500,000 | |||
Common stock | 1,000,000 | |||
Working capital adjustment | (177,469 | ) | ||
Fair value of contingent consideration | 2,592,053 | |||
Total fair value of consideration transferred for acquired business | $ | 22,414,584 | ||
The allocation of the intangible assets is as follows:
Estimated Fair Value | Estimated Useful Lives | |||||
Covenants not to compete | $ | 475,000 | 5 years | |||
Trade name | 5,006,000 | Indefinite | ||||
Customer list | 8,337,475 | 5 years | ||||
Total | $ | 13,818,475 | ||||
Smart Resources, Inc.
On September 18, 2017, the Company acquired substantially all of the assets and assumed certain liabilities of Smart Resources, Inc. and Accountable Search, LLC (collectively, "Smart") for an initial cash consideration paid of $6.0 million. The purchase agreement provides for contingent consideration of up to $2.0 million based on the performance of the acquired business for the two years following the date of acquisition. The purchase agreement contained a provision for a “true up” of acquired working capital 90 days after the closing date.
The net assets acquired were assigned to the Professional segment. The acquisition of Smart allows the Company to strengthen and expand its finance and accounting operations in the Chicago market with temporary and direct hire services.
The Fiscal 2017 consolidated statement of operations includes 15 weeks of Smart operations, which is approximately $3.2 million of revenue and $0.1 million of operating income. The preliminary purchase price has been allocated to the assets acquired and liabilities assumed as of the date of acquisition. All amounts recorded to goodwill are expected to be deductible for tax purposes. The allocation is as follows:
Accounts receivable | $ | 1,228,614 | ||
Prepaid expenses and other assets | 38,150 | |||
Property and equipment | 38,270 | |||
Intangible assets | 4,903,602 | |||
Goodwill | 1,748,119 | |||
Liabilities assumed | (144,906 | ) | ||
Total net assets acquired | $ | 7,811,849 | ||
Cash | $ | 6,000,000 | ||
Working capital adjustment | 51,212 | |||
Fair value of contingent consideration | 1,760,637 | |||
Total fair value of consideration transferred for acquired business | $ | 7,811,849 | ||
48
BG Staffing, Inc. and Subsidiaries
NOTES TO CONSOLIDATED FINANCIAL STATEMENTS
The allocation of the intangible assets is as follows:
Estimated Fair Value | Estimated Useful Lives | |||||
Covenants not to compete | $ | 20,000 | 5 years | |||
Customer list | 4,883,602 | 5 years | ||||
Total | $ | 4,903,602 | ||||
The Company incurred costs of $0.3 million related to the Zycron and Smart acquisitions. These costs were expensed as incurred in selling, general and administrative expenses.
Supplemental Unaudited Pro Forma Information
The Company estimates that the revenues and net income for the periods below that would have been reported if the Zycron and Smart acquisitions had taken place on the first day of the Company's 2016 fiscal year would be as follows (dollars in thousands, except per share amounts):
2017 | 2016 | |||||||
Revenues | $ | 290,359 | $ | 305,314 | ||||
Gross profit | $ | 73,647 | $ | 72,280 | ||||
Net income | $ | 6,117 | $ | 7,179 | ||||
Income per share: | ||||||||
Basic | $ | 0.70 | $ | 0.89 | ||||
Diluted | $ | 0.68 | $ | 0.85 | ||||
Pro forma net income includes amortization of identifiable intangible assets, interest expense on additional borrowings on the Revolving Facility at a rate of 4.50% and tax expense of the pro forma adjustments at an effective tax rate of approximately 36.8% for Fiscal 2017 and 38.4% for Fiscal 2016. The pro forma information presented includes adjustments that will have a continuing impact on the operations that management considers non-recurring in assessing Zycron and Smart's historical performances.
Amounts set forth above are not necessarily indicative of the results that would have been attained had the Zycron and Smart acquisitions taken place on the first day of the Company’s 2016 fiscal year or of the results that may be achieved by the combined enterprise in the future.
NOTE 4 - PROPERTY AND EQUIPMENT, NET
Property and equipment as of December 31, 2017 and December 25, 2016 consist of the following:
2017 | 2016 | |||||||
Leasehold improvements | $ | 720,212 | $ | 532,207 | ||||
Furniture and fixtures | 773,268 | 761,471 | ||||||
Computer systems | 1,827,486 | 1,820,848 | ||||||
Vehicles | 96,288 | 97,627 | ||||||
3,417,254 | 3,212,153 | |||||||
Accumulated depreciation | (1,377,319 | ) | (1,301,295 | ) | ||||
Property and equipment, net | $ | 2,039,935 | $ | 1,910,858 | ||||
Total depreciation expense in Fiscal 2017, 2016 and 2015 was $592,317, $486,682 and $338,707, respectively.
49
BG Staffing, Inc. and Subsidiaries
NOTES TO CONSOLIDATED FINANCIAL STATEMENTS
NOTE 5 - INTANGIBLE ASSETS
Finite and indefinite lived intangible assets consist of the following at:
December 31, 2017 | ||||||||||||
Gross Value | Accumulated Amortization | Net Carrying Value | ||||||||||
Finite lives: | ||||||||||||
Customer lists | $ | 51,609,561 | $ | 33,072,346 | $ | 18,537,215 | ||||||
Covenant not to compete | 1,918,000 | 1,289,755 | 628,245 | |||||||||
Computer software | 839,180 | 161,920 | 677,260 | |||||||||
54,366,741 | 34,524,021 | 19,842,720 | ||||||||||
Indefinite lives: | ||||||||||||
Trade names | 18,913,000 | 1,432,434 | 17,480,566 | |||||||||
Total | $ | 73,279,741 | $ | 35,956,455 | $ | 37,323,286 | ||||||
December 25, 2016 | ||||||||||||
Gross Value | Accumulated Amortization | Net Carrying Value | ||||||||||
Finite lives: | ||||||||||||
Customer lists | $ | 38,389,810 | $ | 27,755,016 | $ | 10,634,794 | ||||||
Covenant not to compete | 1,423,000 | 1,017,984 | 405,016 | |||||||||
39,812,810 | 28,773,000 | 11,039,810 | ||||||||||
Indefinite lives: | ||||||||||||
Trade names | 13,907,000 | 1,432,434 | 12,474,566 | |||||||||
Total | $ | 53,719,810 | $ | 30,205,434 | $ | 23,514,376 | ||||||
Estimated future amortization expense for the next five years and thereafter is as follows:
Fiscal Years Ending: | |||
2018 | $ | 4,236,188 | |
2019 | 3,867,937 | ||
2020 | 2,921,490 | ||
2021 | 1,557,771 | ||
2022 | 1,387,594 | ||
Thereafter | 5,871,740 | ||
Total | $ | 19,842,720 | |
During Fiscal 2017, the Company added $0.4 million and reclassified $0.3 million of software assets from property and equipment. Total amortization expense for Fiscal 2017, 2016 and 2015 was $5.7 million, $6.2 million and $5.2 million, respectively.
NOTE 6 - GOODWILL
The changes in the carrying amount of goodwill as of and during the years ended were as follows at:
Multifamily | Professional | Commercial | Total | |||||||||||||
Goodwill, December 27, 2015 and December 25, 2016 | $ | 1,073,755 | $ | 3,086,084 | $ | 5,024,820 | $ | 9,184,659 | ||||||||
Goodwill from acquisitions | — | 8,785,390 | — | 8,785,390 | ||||||||||||
Goodwill, December 31, 2017 | $ | 1,073,755 | $ | 11,871,474 | $ | 5,024,820 | $ | 17,970,049 | ||||||||
50
BG Staffing, Inc. and Subsidiaries
NOTES TO CONSOLIDATED FINANCIAL STATEMENTS
NOTE 7 - ACCRUED PAYROLL AND EXPENSES, CONTINGENT CONSIDERATION, AND OTHER LONG-TERM LIABILITIES
Accrued payroll and expenses consist of the following at:
December 31, 2017 | December 25, 2016 | |||||||
Temporary worker payroll | $ | 5,124,908 | $ | 5,547,161 | ||||
Temporary worker payroll related | 2,454,539 | 2,033,602 | ||||||
Accrued bonuses and commissions | 1,172,497 | 892,742 | ||||||
Other | 2,788,862 | 1,194,970 | ||||||
Accrued payroll and expenses | $ | 11,540,806 | $ | 9,668,475 | ||||
The following is a schedule of future estimated contingent consideration payments to various parties as of December 31, 2017:
Estimated Cash Payment | Discount | Net | |||||||||
Due in: | |||||||||||
Less than one year | $ | 4,750,000 | $ | (450,816 | ) | $ | 4,299,184 | ||||
One to two years | 2,500,000 | (321,514 | ) | 2,178,486 | |||||||
Contingent consideration | $ | 7,250,000 | $ | (772,330 | ) | $ | 6,477,670 | ||||
Other long-term liabilities consisted primarily of deferred rent at December 31, 2017 and December 25, 2016.
NOTE 8 - INCOME TAXES
The Company's income tax expense for the fiscal years are comprised of the following:
2017 | 2016 | 2015 | ||||||||||
Current federal income tax | $ | 4,619,445 | $ | 3,570,814 | $ | 2,874,296 | ||||||
Current state income tax | 929,813 | 1,817,523 | 1,211,077 | |||||||||
Deferred income tax (credit) | 3,109,942 | (1,100,663 | ) | (717,373 | ) | |||||||
Income tax expense | $ | 8,659,200 | $ | 4,287,674 | $ | 3,368,000 | ||||||
Significant components of the Company’s deferred income taxes are as follows at:
December 31, 2017 | December 25, 2016 | ||||||||
Deferred tax assets: | |||||||||
Allowance for doubtful accounts | $ | 104,289 | $ | 155,037 | |||||
Goodwill and intangible assets | 4,840,582 | 7,532,321 | |||||||
Workers’ compensation | 51,115 | 20,992 | |||||||
Contingent consideration | 1,593,048 | 1,889,013 | |||||||
Share-based compensation | 266,094 | 326,300 | |||||||
Deferred tax liabilities: | |||||||||
Prepaid expenses | (268,456 | ) | (348,515 | ) | |||||
Fixed assets | (184,159 | ) | (50,920 | ) | |||||
Accrued interest | — | (11,773 | ) | ||||||
Deferred income taxes, net | $ | 6,402,513 | $ | 9,512,455 | |||||
The Company does not have any net operating loss carry forwards. The Company believes that it is more likely than not that all deferred tax assets will be realized and thus, believes that a valuation allowance is not required as of December 31, 2017 or December 25, 2016.
51
BG Staffing, Inc. and Subsidiaries
NOTES TO CONSOLIDATED FINANCIAL STATEMENTS
The income tax provision, reconciled to the tax computed at the statutory federal rate, is as follows:
2017 | 2016 | 2015 | ||||||||||||||||
Tax expense at federal statutory rate of 34% | $ | 4,979,395 | 34.3 | % | $ | 3,797,828 | 34.0 | % | $ | 2,963,239 | 34.0 | % | ||||||
State income taxes, net of federal benefit | 610,691 | 4.2 | % | 488,498 | 4.4 | % | 335,785 | 3.9 | % | |||||||||
Re-measurement of deferred assets | 3,314,037 | 22.8 | % | — | — | % | — | — | % | |||||||||
Equity, permanent differences and other | (62,318 | ) | (0.4 | )% | 1,348 | — | % | 68,976 | 0.7 | % | ||||||||
Work Opportunity Tax Credit | (182,605 | ) | (1.2 | )% | — | — | % | — | — | % | ||||||||
Income tax expense | $ | 8,659,200 | 59.7 | % | $ | 4,287,674 | 38.4 | % | $ | 3,368,000 | 38.6 | % | ||||||
NOTE 9 - DEBT
The Company had a credit agreement with TCB providing for a Revolving Facility, maturing August 21, 2019, permitting the Company to borrow funds from time to time in an aggregate amount equal to the lesser of the borrowing base amount, which is 85% of eligible accounts receivable, and TCB’s commitment of $35.0 million.
In connection with the acquisition of the assets of Zycron described above, on April 3, 2017, the Company entered into an Amended and Restated Credit Agreement (the “Amended Credit Agreement”) with TCB with an aggregate commitment of $55.0 million. The Amended Credit Agreement provides for a revolving credit facility maturing April 3, 2022 (the “Revolving Facility”), permitting the Company to borrow funds from time to time in an aggregate amount equal to the lesser of the borrowing base amount, which is 85% of eligible accounts receivable, and TCB’s commitment of $35.0 million and also provides for a term loan maturing April 3, 2022 (the “Term Loan”) in the amount of $20.0 million with principal payable quarterly, based on an annual
percentage of the original principal amount as defined in the Amended Credit Agreement. TCB may also make loans (“Swing
Line Loans”) not to exceed the lesser of $7.5 million or the aggregate commitment. Additionally, the Amended Credit Agreement provides for the Company to increase the commitment with a $20.0 million accordion feature.
The Company borrowed $20.0 million on the Term Loan in conjunction with the closing of the Zycron acquisition on April 3, 2017. Proceeds from the foregoing loan arrangements were used to pay off existing indebtedness of the Company on the revolving credit facility under a credit agreement, dated as of August 21, 2015, as amended, with TCB. The Company borrowed $5.0 million on the accordion in conjunction with the closing of the Smart acquisition on September 18, 2017.
The Revolving Facility and Term Loan bear interest either at the Base Rate plus the Applicable Margin or LIBOR plus the Applicable Margin (as such terms are defined in the Amended Credit Agreement). Swing Line Loans bear interest at the Base Rate plus the Applicable Margin. All interest and commitment fees are generally paid quarterly. Additionally, the Company pays an unused commitment fee on the unfunded portion of the Revolving Facility. The Company’s obligations under the Amended Credit Agreement are secured by a first priority security interest in substantially all tangible and intangible property of the Company and its subsidiaries.
The Amended Credit Agreement's customary affirmative and negative covenants remain substantially the same as those in effect under the original credit agreement including restricting the ability of the Company and its subsidiaries to, among other things (with certain exceptions): (i) incur indebtedness; (ii) incur liens; (iii) enter into mergers, consolidations, or similar transactions; (iv) pay dividends or make distributions (except for permitted distributions as defined in the agreement); (v) make loans; (vi) dispose of assets; (vii) enter into transactions with affiliates; or (viii) change the nature of their business and the Company must comply with certain financial covenants. The Company may not permit the Leverage Ratio (as defined in the Amended Credit Agreement) to be greater than the following: 2.50 to 1.0 (April 3, 2017 to end of fiscal March 2018), 2.00 to 1.0 (March 31, 2018 to end of fiscal March 2019), 1.50 to 1.0 (March 31, 2019 to end of fiscal March 2020), 1.0 to 1.0 (from and after end of fiscal March, 2020). Moreover, the Company may not permit, for any four fiscal quarter period, the Fixed Charge Coverage Ratio (as defined in the Amended Credit Agreement) to be less than 1.50 to 1.00, and may not permit the Dividend Fixed Charge Coverage Ratio (as defined in the Amended Credit Agreement) to be less than (a) 1.10 to 1.00 for any four fiscal quarter period ending on or before September 30, 2017 or (b) 1.20 to 1.00 for any four fiscal quarter period thereafter. As of December 31, 2017, the Company was in compliance with these covenants.
In August 2015, the Company entered into a senior subordinated credit agreement (the “Senior Subordinated Credit Agreement”) with Patriot Capital III SBIC, L.P. and Patriot Capital III, L.P. (together, “PC Subordinated Debt”), pursuant to which the foregoing lenders made term loans of $14.3 million and $0.8 million, respectively, with a maturity date of February 21, 2020. Interest accrued at a rate of 13% per annum (with at least 10% paid in cash quarterly and the remainder in cash or PIK interest added to the principal amount of the term loans). Prepayment of the loans prior to maturity was subject to an early repayment fee. The Company's obligations were secured by a security interest in all assets of the Company. Proceeds from the Senior Subordinated
52
BG Staffing, Inc. and Subsidiaries
NOTES TO CONSOLIDATED FINANCIAL STATEMENTS
Credit Agreement were used to pay off existing indebtedness of the Company under a senior credit facility that was in place with Fifth Third Bank and $0.4 million was recorded as a loss on extinguishment of debt in Fiscal 2015. Proceeds from the June 2016 common stock issuance (See Note 12) were used to pay off outstanding amounts under the Senior Subordinated Credit Agreement, $0.4 million was recorded as a loss on extinguishment of debt, and a 2% repayment fee was recorded in interest expense in Fiscal 2016.
Line of Credit
At December 31, 2017 and December 25, 2016, $21.4 million and $23.9 million, respectively, was outstanding on the Revolving Facility with TCB.
Borrowings under the Revolving Facility bore interest at:
December 31, 2017 | December 25, 2016 | ||||||||||||
Base Rate | $ | 6,368,068 | 5.50 | % | $ | 8,882,714 | 4.25 | % | |||||
LIBOR | 5,000,000 | 4.09 | % | 5,000,000 | 3.95 | % | |||||||
LIBOR | 5,000,000 | 4.13 | % | 5,000,000 | 3.99 | % | |||||||
LIBOR | 5,000,000 | 4.24 | % | 5,000,000 | 4.16 | % | |||||||
Total | $ | 21,368,068 | $ | 23,882,714 | |||||||||
Long Term Debt
Long-term debt bore interest at:
December 31, 2017 | December 25, 2016 | |||||||||||
Base Rate | $ | 687,500 | 5.50 | % | $ | — | — | % | ||||
LIBOR | 6,500,000 | 4.34 | % | — | — | % | ||||||
LIBOR | 6,500,000 | 4.38 | % | — | — | % | ||||||
LIBOR | 6,000,000 | 4.49 | % | — | — | % | ||||||
LIBOR | 4,200,000 | 4.64 | % | — | — | % | ||||||
Long-term debt, less current portion | $ | 23,887,500 | $ | — | ||||||||
Maturities on the Revolving Facility and long-term debt as of December 31, 2017, are as follows:
Fiscal: | |||
2018 | $ | 3,062,500 | |
2019 | 4,287,500 | ||
2020 | 5,512,500 | ||
2021 | 6,737,500 | ||
2022 | 25,655,568 | ||
45,255,568 | |||
Less deferred finance fees | (1,132,547 | ) | |
Total | $ | 44,123,021 | |
NOTE 10 - FAIR VALUE MEASUREMENTS
The accounting standard for fair value measurements defines fair value and establishes a market-based framework or hierarchy for measuring fair value. The standard is applicable whenever assets and liabilities are measured at fair value. The fair value hierarchy established prioritizes the inputs used in valuation techniques into three levels as follows:
Level 1 - Observable inputs - quoted prices in active markets for identical assets and liabilities;
53
BG Staffing, Inc. and Subsidiaries
NOTES TO CONSOLIDATED FINANCIAL STATEMENTS
Level 2 - Observable inputs other than the quoted prices in active markets for identical assets and liabilities - includes quoted prices for similar instruments, quoted prices for identical or similar instruments in inactive markets, and amounts derived from valuation models where all significant inputs are observable in active markets, for substantially the full term of the financial instrument; and
Level 3 - Unobservable inputs - includes amounts derived from valuation models where one or more significant inputs are unobservable and require us to develop relevant assumptions.
The following table summarizes the financial assets and liabilities measured at fair value on a recurring basis and the level they fall within the fair value hierarchy:
Amounts Recorded at Fair Value | Financial Statement Classification | Fair Value Hierarchy | December 31, 2017 | December 25, 2016 | ||||||||
Contingent consideration, net | Contingent consideration, net - current and long-term | Level 3 | $ | 6,477,670 | $ | 5,166,885 | ||||||
The changes in the Level 3 fair value measurements from December 25, 2016 to December 31, 2017 relate to $4.4 million attributable to the Zycron and Smart acquisitions, $1.2 million in accretion, $4.0 million in payments on contingent consideration, and the remaining in gains included in earnings. The changes in the Level 3 fair value measurements from December 27, 2015 to December 25, 2016 relate to $1.8 million in accretion, $7.6 million in payments on contingent consideration, and the remaining in losses included in earnings. Key inputs in determining the fair value of the contingent consideration as of December 31, 2017 and December 25, 2016 included discount rates ranging from 8% to 22% as well as management's estimates of future sales volumes and EBITDA.
In connection with the acquisition of substantially all of the assets and assumption of certain liabilities of InStaff Holding Corporation and InStaff Personnel, LLC, a wholly owned subsidiary of InStaff Holding Corporation (collectively, “InStaff”), the Company granted a put option to certain holders of equity in BG Staffing, Inc. In October 2015, the remaining shares were sold that contained the put right to third parties, which caused the put rights on those shares to expire.
NOTE 11 - CONTINGENCIES
The Company is engaged from time to time in legal matters and proceedings arising out of its normal course of business. The Company establishes a liability related to its legal proceedings and claims when it has determined that it is probable that the Company has incurred a liability and the related amount can be reasonably estimated. If the Company determines that an obligation is reasonably possible, the Company will, if material, disclose the nature of the loss contingency and the estimated range of possible loss, or include a statement that no estimate of the loss can be made.
The Company is not currently a party to any material litigation; however, in the ordinary course of our business the Company is periodically threatened with or named as a defendant in various lawsuits or actions. The principal risks that the Company insures against, subject to and upon the terms and conditions of various insurance policies, are workers’ compensation, general liability, automobile liability, property damage, professional liability, employment practices, fiduciary liability, fidelity losses and director and officer liability. Under the Company's bylaws, the Company’s directors and officers are indemnified against certain liabilities arising out of the performance of their duties to the Company. The Company also has an insurance policy for our directors and officers to insure them against liabilities arising from the performance of their positions with the Company or its subsidiaries. The Company has also entered into indemnification agreements with its directors and certain officers.
Employment Agreements
The CEO’s employment agreement was effective as of December 28, 2015 and continues until December 31, 2018 with successive one-year extensions unless terminated pursuant to its terms. In the event that his employment is terminated by the Company without cause or by him for good reason, he will be entitled to an amount equal to twelve months of base salary, bonus, and the amount of monthly COBRA premiums for him and his dependents, grossed-up for federal income taxes, for eighteen months. Should there be a sale of the Company that results in the termination of his employment or a material adverse change in his duties and responsibilities, he will be entitled to an amount equal to eighteen months of base salary, bonus, and the amount of monthly COBRA premiums for him and his dependents, grossed-up for federal income taxes, for eighteen months. Additionally, he will become 100% vested in any awards outstanding under the 2013 Long-Term Incentive Plan (the "2013 Plan") or similar plan.
54
BG Staffing, Inc. and Subsidiaries
NOTES TO CONSOLIDATED FINANCIAL STATEMENTS
The COO’s employment agreement was effective as of August 1, 2016 for one year, and remains in effect under successive one-year extensions unless terminated pursuant to its terms. In the event that her employment is terminated by the Company without cause or by her for good reason, she will be entitled to an amount equal to six months of base salary and bonus. Should there be a sale of the Company that results in the termination of her employment or a material adverse change in her duties and responsibilities, she will be entitled to an amount equal to twelve months of base salary, bonus, and the amount of monthly COBRA premiums for her and her dependents, grossed-up for federal income taxes, for twelve months. Additionally, she will become 100% vested in any awards outstanding under the 2013 Plan or similar plan.
The CFO’s employment agreement was effective as of August 24, 2015 for one year, and remains in effect under successive one-year extensions unless terminated pursuant to its terms. In the event that his employment is terminated by the Company without cause or by him for good reason, he will be entitled to an amount equal to six months of base salary and bonus. Should there be a sale of the Company that results in the termination of his employment or a material adverse change in his duties and responsibilities, he will be entitled to an amount equal to twelve months of base salary, bonus, and the amount of monthly COBRA premiums for him and his dependents, grossed-up for federal income taxes, for twelve months. Additionally, he will become 100% vested in any awards outstanding under the 2013 Plan or similar plan.
NOTE 12 - EQUITY
Authorized capital stock consists of 19,500,000 shares of common stock, par value $0.01 per share and 500,000 shares of undesignated preferred stock, par value $0.01 per share.
In April 3, 2017, the Company issued 70,670 shares of common stock, $0.01 par value per share, in a private placement for a value of $1.0 million at the closing of the Zycron acquisition. The Company incurred $7.5 thousand in offering costs.
In June 2016, the Company issued and sold 1,191,246 shares of common stock, $0.01 par value per share, to various investors in a registered underwritten offering for aggregate gross proceeds of $16.7 million in cash. The purchase price to the public was $14.00 per share. The newly issued shares constituted approximately 16.1% of the total of issued and outstanding shares of common stock immediately before the initial execution of the Underwriting Agreement. In connection with the closing, the Company incurred $1.6 million in offering costs, which included a commission of $0.6 million paid to Taglich Brothers, Inc. ("Taglich Brothers") the placement co-agent. In connection with the sale, the Company issued to Roth Capital Partners, LLC and Taglich Brothers (and/or their designees), warrants (the “2016 Warrant”) for the purchase of an aggregate of 32,250 shares of common stock. The 2016 Warrant is exercisable, in whole or in part, commencing on a date which is one year after the closing of the offering and expires on the five-year anniversary of the closing, and has an initial exercise price per share of $16.80. Proceeds were used to pay off existing indebtedness of the Company under the Senior Subordinated Credit Agreement (See Note 9).
On May 6, 2015, the Company issued and sold 636,500 shares of common stock, $0.01 par value per share, to various investors in a registered offering for aggregate gross proceeds of $7.0 million in cash. The purchase price to the public was $11.00 per share. The newly issued shares constituted approximately 9.6% of the total of issued and outstanding shares of common stock immediately before the initial execution of the Underwriting Agreement. In connection with the closing, the Company incurred $0.7 million in offering costs, which included a commission of $0.4 million paid to Taglich Brothers the placement agent.
NOTE 13 - SHARE-BASED COMPENSATION
Stock Options
In December 2013, the board of directors adopted the 2013 Long-Term Incentive Plan (the "2013 Plan"). Under the 2013 Plan employees, directors and consultants of the Company may receive incentive stock options and other awards. A total of 900,000 shares of common stock of BG Staffing, Inc. were initially reserved for issuance pursuant to the 2013 Plan. To the extent any option or award expires unexercised or is canceled, terminated or forfeited in any manner without the issuance of common stock thereunder, such shares shall again be available for issuance under the 2013 Plan.
On May 16, 2017, stockholders of the Company approved and made effective an amendment to the 2013 Plan to add an additional 250,000 shares of common stock reserved for issuance. The board of directors of the Company had previously approved the amendment subject to stockholder approval.
The term of each option is determined by the board of directors but does not exceed 10 years. Unless otherwise specified in an option agreement, options is vest and become exercisable on the following schedule: 20% immediately and 20% on each anniversary date of the grant date. Each option shall be designated as an incentive stock option (“ISO”) or a non-qualified option (“NQO”). The exercise price of an ISO shall not be less than the fair market value of the stock covered by the ISO at the grant
55
BG Staffing, Inc. and Subsidiaries
NOTES TO CONSOLIDATED FINANCIAL STATEMENTS
date; provided, however, the exercise price of an ISO granted to any person who owns, directly or indirectly, stock of the Company constituting more than 10% of the total combined voting power of all classes of outstanding stock of the Company or of any affiliate of the Company, shall not be less than 110% of such fair market value.
The fair value of each option award was estimated on the date of grant using a Black-Scholes option pricing model and the assumptions in the following table. Because this option valuation model incorporates ranges of assumptions for inputs, those ranges are disclosed below. The Company bases the estimate of expected volatility on the historical volatility of similar entities whose share prices are publicly available. The volatilities of those entities will continue to be considered unless circumstances change such that the identified entities are no longer similar to the Company or until there is sufficient information available to utilize the Company’s own stock volatility. The risk-free rate for periods within the expected term of the option is based on the U.S. Treasury yield curve in effect at the time of grant. The Company expects to use historical data to estimate employee termination within the valuation model; separate groups of employees that have similar historical termination behavior are considered separately for valuation purposes. The Company believes these estimates and assumptions are reasonable. However, these estimates and assumptions may change in the future based on actual experience as well as market conditions.
For Fiscal 2017, 2016 and 2015, the Company recognized $0.4 million, $0.3 million and $0.3 million of compensation expense related to stock awards, respectively. Unamortized share-based compensation expense as of December 31, 2017 amounted to $0.6 million which is expected to be recognized over the next 2.5 years.
The following assumptions were used to estimate the fair value of share options for the years ended:
2017 | 2016 | 2015 | |||||||||||||
Weighted-average fair value of options | $ | 3.94 | $ | 4.05 | $ | 1.83 | |||||||||
Weighted-average risk-free interest rate | 1.8 | % | 1.1 | % | 1.5 | % | |||||||||
Weighted-average dividend yield | $ | 1.00 | $ | 1.00 | $ | 1.00 | |||||||||
Weighted-average volatility factor | 43.2 | % | 43.2 | % | 43.2 | % | |||||||||
Weighted-average expected life | 6.0 | yrs | 6.0 | yrs | 6.0 | yrs | |||||||||
A summary of stock option activity is presented as follows:
Number of Shares | Weighted Average Exercise Price Per Share | Weighted Average Remaining Contractual Life | Total Intrinsic Value of Options (in thousands) | ||||||||||
Options outstanding at December 28, 2014 | 585,466 | $ | 6.52 | 9.1 | $ | 3,204 | |||||||
Granted | 286,000 | $ | 11.03 | ||||||||||
Exercised | (50,800 | ) | $ | 6.66 | |||||||||
Forfeited / Canceled | (45,000 | ) | $ | 6.25 | |||||||||
Options outstanding at December 27, 2015 | 775,666 | $ | 8.19 | 8.7 | $ | 5,246 | |||||||
Granted | 50,000 | $ | 17.46 | ||||||||||
Exercised | (103,055 | ) | $ | 6.91 | |||||||||
Forfeited / Canceled | (44,200 | ) | $ | 9.94 | |||||||||
Options outstanding at December 25, 2016 | 678,411 | $ | 8.95 | 7.8 | $ | 4,511 | |||||||
Granted | 128,000 | $ | 16.76 | ||||||||||
Exercised | (28,800 | ) | $ | 7.71 | |||||||||
Forfeited / Canceled | (12,200 | ) | $ | 11.00 | |||||||||
Options outstanding at December 31, 2017 | 765,411 | $ | 10.27 | 7.3 | $ | 4,521 | |||||||
Options exercisable at December 25, 2016 | 395,911 | $ | 8.01 | 7.6 | $ | 2,965 | |||||||
Options exercisable at December 31, 2017 | 498,611 | $ | 8.74 | 6.8 | $ | 3,640 | |||||||
56
BG Staffing, Inc. and Subsidiaries
NOTES TO CONSOLIDATED FINANCIAL STATEMENTS
Number of Shares | Weighted Average Grant Date Fair Value | ||||||
Nonvested outstanding at December 25, 2016 | 282,500 | $ | 2.57 | ||||
Nonvested outstanding at December 31, 2017 | 266,800 | $ | 3.09 | ||||
For Fiscal 2017, 2016 and 2015, the Company issued 5,221; 55,974 and -0- shares of common stock upon the cashless exercise of 13,800; 87,655 and -0- stock options, respectively.
As of December 31, 2017, a total of 990,514 shares remain available for issuance under the 2013 Plan.
Warrant Activity
For Fiscal 2017, 2016 and 2015, the Company recognized $-0-, $-0- and $6,523 of compensation cost related to warrants, respectively. There is no unamortized stock compensation expense remaining to be recognized as of December 31, 2017.
The following assumptions were used to estimate the fair value of warrants for the years ended:
2017 | 2016 | 2015 | |||||||||||||
Weighted-average fair value of warrants | $ | 2.48 | $ | 2.48 | $ | 2.43 | |||||||||
Weighted-average risk-free interest rate | 0.6 | % | 0.6 | % | 0.9 | % | |||||||||
Weighted-average dividend yield | $ | 1.00 | $ | 1.00 | $ | 1.00 | |||||||||
Weighted-average volatility factor | 43.2 | % | 43.2 | % | 49.0 | % | |||||||||
Weighted-average expected life | 3.0 | yrs | 3.0 | yrs | 5.0 | yrs | |||||||||
A summary of warrant activity is presented as follows:
Number of Shares | Weighted Average Exercise Price Per Share | Weighted Average Remaining Contractual Life | Total Intrinsic Value of Warrants (in thousands) | ||||||||||
Warrants outstanding at December 28, 2014 | 326,822 | $ | 8.24 | 2.9 | $ | 1,226 | |||||||
Granted | 77,970 | $ | 11.85 | ||||||||||
Exercised | (102,510 | ) | $ | 4.68 | |||||||||
Expired | (168,449 | ) | $ | 10.85 | |||||||||
Warrants exercisable at December 27, 2015 | 133,833 | $ | 10.21 | 3.5 | $ | 634 | |||||||
Granted | 32,250 | $ | 16.80 | ||||||||||
Exercised | (42,099 | ) | $ | 11.42 | |||||||||
Expired | — | $ | — | ||||||||||
Warrants outstanding at December 25, 2016 | 123,984 | $ | 11.51 | 2.8 | $ | 532 | |||||||
Granted | — | $ | — | ||||||||||
Exercised | — | $ | — | ||||||||||
Expired | — | $ | — | ||||||||||
Warrants outstanding at December 31, 2017 | 123,984 | $ | 11.51 | 2.2 | $ | 577 | |||||||
Warrants exercisable at December 25, 2016 | 91,734 | $ | 9.65 | 2.2 | $ | 532 | |||||||
Warrants exercisable at December 31, 2017 | 123,984 | $ | 11.51 | 2.2 | $ | 577 | |||||||
57
BG Staffing, Inc. and Subsidiaries
NOTES TO CONSOLIDATED FINANCIAL STATEMENTS
Number of Shares | Weighted Average Grant Date Fair Value | ||||||
Nonvested outstanding at December 25, 2016 | 32,250 | $ | 2.48 | ||||
Nonvested outstanding at December 31, 2017 | — | $ | — | ||||
For Fiscal 2017, 2016 and 2015, the Company issued -0-, 17,910 and 102,510 shares of common stock upon the cashless exercise of -0-, 42,099 and 102,510 warrants, respectively.
The intrinsic value in the table above is the amount by which the market value of the underlying stock exceeded the exercise price of outstanding options or warrants, before applicable income taxes and represents the amount holders would have realized if all in-the-money options or warrants had been exercised on the last business day of the period indicated.
NOTE 14 - OPERATING LEASES
The Company is a party to leases for its facilities, expiring at various dates through fiscal year 2023. Total rental expense charged to operations amounted to $1.7 million, $1.3 million and $1.0 million for Fiscal 2017, 2016 and 2015, respectively.
The following is a schedule by year of future minimum rental payments required under operating leases that have initial or remaining noncancelable lease terms in excess of one year, as of December 31, 2017:
Fiscal: | |||
2018 | $ | 1,539,329 | |
2019 | 1,148,853 | ||
2020 | 841,430 | ||
2021 | 552,301 | ||
2022 | 388,698 | ||
Thereafter | 108,810 | ||
Total | $ | 4,579,421 | |
NOTE 15 - RELATED PARTY TRANSACTIONS
Some of our equity owners are also principals of Taglich Brothers. The Company paid fees to Taglich Brothers related to two equity transactions in 2015 and 2016 (see Note 12).
NOTE 16 - EMPLOYEE BENEFIT PLAN
The Company provides a defined contribution plan (the "401(k) Plan") for the benefit of its eligible full-time employees. The 401(k) Plan allows employees to make contributions subject to applicable statutory limitations. The Company matches employee contributions 100% up to the first 3% and 50% of the next 2% of an employee’s compensation. The Company contributed $0.9 million, $0.8 million and $0.3 million to the 401(k) Plan for Fiscal 2017, 2016 and 2015, respectively.
NOTE 17 - BUSINESS SEGMENTS
The Company operates within three industry segments: Multifamily, Professional, and Commercial. The Multifamily segment provides front office and maintenance temporary workers to various apartment communities, in 23 states, via property management companies responsible for the apartment communities' day to day operations. The Professional segment provides skilled temporary workers on a nationwide basis for IT and finance and accounting customer projects. The Commercial segment provides temporary workers primarily to logistics, distribution, and call center customers needing a flexible workforce in Illinois, Wisconsin, New Mexico, Texas, Tennessee and Mississippi.
Segment operating income includes all revenue and cost of services, direct selling expenses, depreciation and amortization expense and excludes all general and administrative (corporate) expenses. Assets of corporate include cash, unallocated prepaid expenses, deferred tax assets, and other assets.
58
BG Staffing, Inc. and Subsidiaries
NOTES TO CONSOLIDATED FINANCIAL STATEMENTS
The following table provides a reconciliation of revenue and operating income by reportable segment to consolidated results for the periods indicated:
2017 | 2016 | 2015 | ||||||||||
Revenue: | ||||||||||||
Multifamily | $ | 71,806,700 | $ | 57,995,271 | $ | 43,196,739 | ||||||
Professional | 126,641,358 | 107,037,382 | 86,711,561 | |||||||||
Commercial | 74,151,992 | 88,819,561 | 87,625,556 | |||||||||
Total | $ | 272,600,050 | $ | 253,852,214 | $ | 217,533,856 | ||||||
Depreciation: | ||||||||||||
Multifamily | $ | 109,085 | $ | 60,818 | $ | 45,717 | ||||||
Professional | 179,809 | 154,447 | 80,674 | |||||||||
Commercial | 106,867 | 92,701 | 92,750 | |||||||||
Corporate | 196,556 | 178,716 | 119,566 | |||||||||
Total | $ | 592,317 | $ | 486,682 | $ | 338,707 | ||||||
Amortization: | ||||||||||||
Multifamily | $ | — | $ | 62,847 | $ | 150,833 | ||||||
Professional | 5,378,992 | 5,725,711 | 4,357,018 | |||||||||
Commercial | 312,054 | 458,101 | 697,182 | |||||||||
Corporate | 8,595 | — | — | |||||||||
Total | $ | 5,699,641 | $ | 6,246,659 | $ | 5,205,033 | ||||||
Operating income: | ||||||||||||
Multifamily | $ | 11,553,163 | $ | 8,781,822 | $ | 6,021,124 | ||||||
Professional | 8,518,293 | 6,385,934 | 5,997,646 | |||||||||
Commercial | 4,304,018 | 5,717,240 | 5,386,764 | |||||||||
Corporate - selling | (541,160 | ) | (99,242 | ) | — | |||||||
Corporate - general and administrative | (6,073,546 | ) | (5,249,937 | ) | (5,432,845 | ) | ||||||
Total | $ | 17,760,768 | $ | 15,535,817 | $ | 11,972,689 | ||||||
Capital Expenditures: | ||||||||||||
Multifamily | $ | 139,309 | $ | 228,153 | $ | 88,053 | ||||||
Professional | 564,987 | 103,864 | 151,753 | |||||||||
Commercial | 53,969 | 98,077 | 148,913 | |||||||||
Corporate | 387,492 | 508,849 | 174,450 | |||||||||
Total | $ | 1,145,757 | $ | 938,943 | $ | 563,169 | ||||||
Total Assets: | ||||||||||||
Multifamily | $ | 11,678,908 | $ | 9,320,335 | ||||||||
Professional | 67,089,681 | 39,548,308 | ||||||||||
Commercial | 18,075,307 | 21,574,855 | ||||||||||
Corporate | 7,788,993 | 10,770,636 | ||||||||||
Total | $ | 104,632,889 | $ | 81,214,134 | ||||||||
59
BG Staffing, Inc. and Subsidiaries
NOTES TO CONSOLIDATED FINANCIAL STATEMENTS
NOTE 18 - QUARTERLY FINANCIAL DATA (UNAUDITED)
2017 | |||||||||||||||||||
First Quarter | Second Quarter | Third Quarter | Fourth Quarter | Fiscal Year | |||||||||||||||
Revenues | $ | 56,843,687 | $ | 68,773,862 | $ | 71,281,674 | $ | 75,700,827 | $ | 272,600,050 | |||||||||
Gross Profit | $ | 13,671,234 | $ | 17,227,279 | $ | 18,248,059 | $ | 19,255,426 | $ | 68,401,998 | |||||||||
Income before income taxes | $ | 2,134,737 | $ | 3,744,537 | $ | 4,752,516 | $ | 3,875,844 | $ | 14,507,634 | |||||||||
Net income (loss) | $ | 1,301,831 | $ | 2,284,526 | $ | 3,136,863 | $ | (874,786 | ) | $ | 5,848,434 | ||||||||
Net income (loss) per share: | |||||||||||||||||||
Basic | $ | 0.15 | $ | 0.26 | $ | 0.36 | $ | (0.10 | ) | $ | 0.67 | ||||||||
Diluted | $ | 0.15 | $ | 0.25 | $ | 0.35 | $ | (0.10 | ) | $ | 0.65 | ||||||||
Weighted-average shares outstanding: | |||||||||||||||||||
Basic | 8,668,955 | 8,746,100 | 8,759,376 | 8,759,376 | 8,733,941 | ||||||||||||||
Diluted | 8,924,419 | 9,050,596 | 9,077,147 | 8,759,376 | 9,038,187 | ||||||||||||||
2016 | |||||||||||||||||||
First Quarter | Second Quarter | Third Quarter | Fourth Quarter | Fiscal Year | |||||||||||||||
Revenues | $ | 59,550,986 | $ | 62,615,014 | $ | 67,407,350 | $ | 64,278,864 | $ | 253,852,214 | |||||||||
Gross Profit | $ | 13,346,630 | $ | 15,184,525 | $ | 16,431,888 | $ | 15,110,323 | $ | 60,073,366 | |||||||||
Loss on extinguishment of debt | $ | — | $ | (404,119 | ) | $ | — | $ | — | $ | (404,119 | ) | |||||||
Income before income taxes | $ | 1,382,504 | $ | 2,283,688 | $ | 3,764,628 | $ | 3,739,261 | $ | 11,170,081 | |||||||||
Net income | $ | 833,138 | $ | 1,397,481 | $ | 2,347,855 | $ | 2,303,933 | $ | 6,882,407 | |||||||||
Net income per share: | |||||||||||||||||||
Basic | $ | 0.11 | $ | 0.18 | $ | 0.27 | $ | 0.27 | $ | 0.85 | |||||||||
Diluted | $ | 0.11 | $ | 0.17 | $ | 0.26 | $ | 0.26 | $ | 0.82 | |||||||||
Weighted-average shares outstanding: | |||||||||||||||||||
Basic | 7,388,536 | 7,711,050 | 8,658,061 | 8,668,485 | 8,107,637 | ||||||||||||||
Diluted | 7,646,726 | 8,052,996 | 9,028,398 | 8,930,542 | 8,399,883 | ||||||||||||||
NOTE 19 - SUBSEQUENT EVENTS
On February 1, 2018, the Company's board of directors declared a cash dividend in the amount of $0.25 per share of common stock to be paid on February 20, 2018 to all shareholders of record as of the close of business on February 12, 2018.
60
Item 9. Changes in and Disagreements with Accountants on Accounting and Financial Disclosure.
None.
Item 9A. Controls and Procedures.
Evaluation of Disclosure Controls and Procedures
Under the supervision and with the participation of our management, including our chief executive officer and chief financial officer, we have evaluated the effectiveness of our disclosure controls and procedures (as defined in Rules 13a-15(e) and 15d-15(e) promulgated under the Exchange Act) as of the end of the period covered by this report. Based on that evaluation, our chief executive officer and chief financial officer concluded that our disclosure controls and procedures were effective as of the end of the period covered by this report to provide reasonable assurance that information we are required to disclose in reports that are filed or submitted under the Exchange Act is recorded, processed, summarized and reported within the time periods specified in the rules and forms specified by the Securities and Exchange Commission and that information required to be disclosed by the Company in the reports that it files or submits under the Exchange Act is accumulated and communicated to the Company’s management, including its principal executive and principal financial officer, as appropriate to allow timely decisions regarding required disclosure.
We note that the design of any system of controls is based in part upon certain assumptions about the likelihood of future events, and there can be no assurance that any design will succeed in achieving the stated goals under all potential future conditions.
Management’s Annual Report on Internal Control over Financial Reporting
Management of the Company, including the President and Chief Executive Officer and Chief Financial Officer, is responsible for establishing and maintaining adequate internal control over financial reporting (as defined in Rule 13a-15(f) under the Securities Exchange Act of 1934, as amended) for the Company. The Company’s internal control system was designed to provide reasonable assurance to management and the Company’s Board of Directors regarding the reliability of financial reporting and the preparation of financial statements for external purposes in accordance with generally accepted accounting principles.
Management assessed the effectiveness of the Company’s internal control over financial reporting as of December 31, 2017, using criteria established in Internal Control-Integrated Framework (2013) issued by the Committee of Sponsoring Organizations of the Treadway Commission (COSO) and concluded that the Company maintained effective internal control over financial reporting as of December 31, 2017.
Because of its inherent limitations, internal control over financial reporting may not prevent or detect misstatements. Also, projections of any evaluation of effectiveness to future periods are subject to the risk that controls may become inadequate because of changes in conditions, or that the degree of compliance with the policies and procedures may deteriorate.
Changes in Internal Control Over Financial Reporting
There have not been any changes in our internal control over financial reporting (as defined in Rules 13a-15(f) and 15d-15(f) promulgated under the Exchange Act) during the fourth quarter of Fiscal 2017 that have materially affected, or are reasonably likely to materially affect, our internal control over financial reporting.
Item 9B. Other Information.
None.
61
PART III
Item 10. Directors, Executive Officers and Corporate Governance.
Board Composition
Our board of directors consists of five directors. Our board of directors has determined that the following directors are “independent” as defined under the rules of the NYSE American: Richard L. Baum, Jr., Paul A. Seid, C. David Allen, Jr., and Douglas E. Hailey. The authorized number of directors may be changed by resolution of our board of directors. Vacancies on our board of directors can be filled by resolution of our board of directors. Our board of directors is divided into three classes, each serving staggered, three-year terms:
• | Our Class I director is L. Allen Baker, Jr., and the term of such director will expire at the 2018 annual meeting of stockholders; |
• | Our Class II directors are Richard L. Baum, Jr. and Paul A. Seid, and the term of each director will expire at the 2019 annual meeting of stockholders; and |
• | Our Class III directors are C. David Allen, Jr. and Douglas E. Hailey, and the term of each director will expire at the 2020 annual meeting of stockholders. |
As a result, only one class of directors will be elected at each annual meeting of stockholders, with the other classes continuing for the remainder of their respective terms.
Board Leadership and Role in Risk Oversight
Meetings of our board of directors are presided over by L. Allen Baker, Jr. Our board of directors does not have a chairperson. Our board of directors believes that L. Allen Baker, Jr. is currently best situated to preside over meetings of our board of directors because of his familiarity with our business and ability to effectively identify strategic priorities and lead the discussion and execution of strategy.
Our board of directors oversees the risk management activities designed and implemented by our management and executes its oversight responsibility for risk management both directly and through its committees. The full board of directors also considers specific risk topics, including risks associated with our strategic plan, business operations and capital structure. In addition, our board of directors receives detailed regular reports from members of our senior management and other personnel that include assessments and potential mitigation of the risks and exposures involved with their respective areas of responsibility.
Our board of directors delegates to the Audit Committee oversight of our risk management process. Our other board of directors committees also consider and address risk as they perform their respective committee responsibilities. All committees report to the full board of directors as appropriate, including when a matter rises to the level of a material or enterprise level risk.
Committees of the Board of Directors
The standing committees of our board of directors consist of an Audit Committee, a Compensation Committee, and a Nominating and Corporate Governance Committee. Each of the committees reports to our board of directors as they deem appropriate and as our board may request. The composition, duties and responsibilities of these committees are set forth below.
Audit Committee
The Audit Committee is responsible for, among other matters: (1) appointing, retaining and evaluating our independent registered public accounting firm and approving all services to be performed by them; (2) overseeing our independent registered public accounting firm’s qualifications, independence and performance; (3) overseeing the financial reporting process and discussing with management and our independent registered public accounting firm the interim and annual financial statements that we file with the SEC; (4) reviewing and monitoring our accounting principles, accounting policies, financial and accounting controls and compliance with legal and regulatory requirements; (5) establishing procedures for the confidential anonymous submission of concerns regarding questionable accounting, internal controls or auditing matters; (6) reviewing and approving related person transactions; and (7) overseeing the risk management process.
62
Our Audit Committee consists of C. David Allen, Jr., Richard L. Baum, Jr. and Douglas E. Hailey. We believe that each qualifies as independent directors according to the rules and regulations of the SEC and NYSE American with respect to audit committee membership. We also believe that Mr. Hailey qualifies as our “audit committee financial expert,” as such term is defined in Item 407(d)(5)(ii) of Regulation S-K. Our board of directors has adopted a written charter for the Audit Committee, which is available on our corporate website under the investor relations tab at www.bgstaffing.com. The information on our website is not part of this Annual Report on Form 10-K.
Compensation Committee
The Compensation Committee is responsible for, among other matters: (1) reviewing key employee compensation goals, policies, plans and programs; (2) reviewing and approving the compensation of our directors, president and chief executive officer and other executive officers; (3) reviewing and approving employment agreements and other similar arrangements between us and our executive officers; and (4) administering our stock plans and other incentive compensation plans, including our 2013 Long-Term Incentive Plan. The Committee shall have the authority to delegate any of its responsibilities, along with the authority to take action in relation to such responsibilities, to one or more subcommittees as the committee may deem appropriate in its sole discretion. The Compensation Committee may invite such members of management to its meetings as it deems appropriate. However, the Compensation Committee meets regularly without such members present, and in all cases no officer may be present at meetings at which such officer’s compensation or performance is discussed or determined. The Committee has the authority, in its sole discretion, to select, retain and obtain the advice of a compensation consultant as necessary to assist with the execution of its duties and responsibilities. Neither the Compensation Committee nor management engaged a compensation consultant with respect to Fiscal 2017.
Our Compensation Committee consists of C. David Allen, Jr., Richard L. Baum, Jr. and Paul A. Seid. Our board of directors has adopted a written charter for the Compensation Committee, which is available on our corporate website under the investor relations tab at www.bgstaffing.com. The information on our website is not part of this Annual Report on Form 10-K.
Nominating and Corporate Governance Committee
We have a Nominating and Corporate Governance Committee, which identifies, evaluates and recommends qualified nominees to serve on our board of directors, develops and oversees our internal corporate governance processes and maintains a management succession plan. Our Nominating and Corporate Governance Committee charter defines the committee’s primary duties. The Nominating and Corporate Governance Committee will evaluate nominees for director, including nominees recommended by stockholders, using all relevant criteria, including diversity of experience and background. The Nominating and Corporate Governance Committee will consider any director candidates recommended by the Company’s stockholders provided that the notice and information requirements specified by Section 2.06(b)–(c) of the Bylaws (relating to direct stockholder nominations) are complied with. Our Nominating and Corporate Governance Committee consists of Richard L. Baum, Jr., Douglas E. Hailey, and Paul A. Seid. A copy of the Nominating and Corporate Governance Committee’s charter is posted on our website at www.bgstaffing.com. The information on our website is not part of this Annual Report on Form 10-K.
Other Committees
Our board of directors may establish other committees as it deems necessary or appropriate from time to time.
Family Relationships
There are no family relationships among any of our executive officers or any of our directors.
63
Directors
C. David Allen, Jr.
Independent Director
Age: 54
Director Since: 2014
Committees Served: Audit Committee, Compensation Committee
Age: 54
Director Since: 2014
Committees Served: Audit Committee, Compensation Committee
Since 2016, Mr. Allen has served as Chief Financial Officer of Smart Start, LLC, a provider of automotive technology products. Prior to Smart Start, from 2015 to 2016, Mr. Allen has served as Chief Financial Officer of Graebel Vanlines Holdings, LLC, a provider of commercial and residential logistics, moving and storage services. Prior to Graebel, from 2009 to 2015, Mr. Allen served as an officer of Snelling Services, LLC, a workforce solutions, contract and temporary staffing services provider. From 2010 to 2015, Mr. Allen served as President and Chief Executive Officer. From 2009 to 2010 he served as Chief Financial Officer. Prior to Snelling, Mr. Allen served for three years as Chief Operating Officer and six years as Chief Financial Officer for Telvista Inc., a business process outsourcer providing customer relationship management solutions. He earned a Master of Business Administration degree from the Tuck School at Dartmouth College in 1993 and received a Bachelor of Business Administration from Stephen F. Austin State University with honors in 1986. Our board of directors benefits from Mr. Allen's extensive experience in the temporary staffing industry as well as his financial expertise.
L. Allen Baker, Jr.
President and Chief Executive Officer
Age: 68
Age: 68
Director Since: 2013
L. Allen Baker, Jr. joined the board of managers of LTN Acquisition, LLC (the former parent of the predecessor to BG Staffing, Inc.) in 2008 while serving as the Executive Vice President/Chief Financial Officer of Impact Confections, Inc., a confections manufacturing company in Colorado, a position Mr. Baker held from 2002 through 2009 and was appointed to our board of directors in November 2013. He began serving as President and Chief Executive Officer of BG Staffing in 2009. From 1985 to 2002, Mr. Baker served as Executive Vice President and Chief Financial Officer of Piping Design Services, Inc. d/b/a PDS Technical Services, a national, privately held staffing company headquartered in the Dallas/Fort Worth area, with operations in 43 states. Prior to this position, he worked at Core Laboratories, Inc. as the Corporate Controller from 1980 to 1985 and as Data Processing Manager from 1976 to 1980. Mr. Baker held several computer programmer positions prior to joining Core Laboratories, Inc. He has a Bachelor of Science in Mathematics with a minor in Computer Information Systems from West Texas State University and an Master of Business Administration from the University of Dallas. Our board of directors benefits from Mr. Baker's extensive experience in the temporary staffing industry.
Richard L. Baum, Jr.
Independent Director
Age: 57
Director Since: 2013
Committees Served: Audit Committee, Compensation Committee (Chair), Nominating and Corporate Governance Committee (Chair)
Age: 57
Director Since: 2013
Committees Served: Audit Committee, Compensation Committee (Chair), Nominating and Corporate Governance Committee (Chair)
Richard L. Baum, Jr. served on the board of managers of LTN Acquisition, LLC (the former parent of the predecessor to BG Staffing, Inc.) since its inception and was appointed to serve on our board of directors in November 2013. Since March 2013, Mr. Baum has been Chairman of the Board of Unique Fabricating, Inc. (NYSE American: UFAB). Mr. Baum joined Taglich Private Equity LLC in 2005 and currently is an active director with a number of private companies where Taglich has an investment. Prior to joining Taglich, Mr. Baum led a group that purchased a private equity portfolio from Transamerica Business Credit. From 1998 to 2003, Mr. Baum was a Managing Director in the small business merger and acquisition practices of Wachovia Securities and its predecessor, First Union Securities. From 1988 through 1998, Mr. Baum was a Principal with the Mid-Atlantic Companies, Ltd., a financial services firm acquired by First Union in 1998. Mr. Baum received a Bachelor of Science from Drexel University and a Master of Business Administration from the Wharton School of the University of Pennsylvania. Our board of directors benefits from Mr. Baum's perspective and experience with our ongoing operations and strategy that he has obtained through his prolonged service to the company and due to his ability to assist with the evaluation of potential acquisitions.
64
Douglas E. Hailey
Independent Director
Age: 55
Age: 55
Director Since: 2013
Committees Served: Audit Committee (Chair), Nominating and Corporate Governance Committee
Committees Served: Audit Committee (Chair), Nominating and Corporate Governance Committee
Douglas E. Hailey served on the board of managers of LTN Acquisition, LLC (the former parent of the predecessor to BG Staffing, Inc.) since its inception and was appointed to our board of directors in November 2013. Mr. Hailey is the managing director of Taglich Private Equity LLC. Mr. Hailey joined Taglich Brothers, Inc. in 1994 as Head of Investment Banking and is an employee, not a partner, director, shareholder or executive officer. Taglich Brothers, Inc. is not an affiliate of Taglich Private Equity LLC. He co-led the private equity initiative in 2001 and currently participates in evaluating and executing new investments. Prior to joining Taglich Brothers, Inc., Mr. Hailey spent five years with Weatherly Financial Group, assisting in sponsoring leveraged buyouts and five years in structured finance lending at Heller Financial and the Bank of New York. He received a Bachelor of Business Administration from Eastern New Mexico University and a Master of Business Administration in Finance from the University of Texas. Our board of directors benefits from Mr. Hailey's perspective and experience with our ongoing operations and strategy that he has obtained through his prolonged service to the company and due to his ability to assist with the evaluation of potential acquisitions.
Paul A. Seid
Independent Director
Age: 69
Director Since: 2014
Committees Served: Compensation Committee, Nominating and Corporate Governance Committee
Age: 69
Director Since: 2014
Committees Served: Compensation Committee, Nominating and Corporate Governance Committee
Since 2010, Mr. Seid has served on the board of directors of BioVentrix, a medical device company. Starting in 2013, he has served as Chief Executive Officer of RST Automation, a hospital instrumentation automation developer which was established 2004. For the past sixteen years he has been President of Strategic Data Marketing, a research and data collection company. He has also founded, bought and/ or sold over twenty companies in Asia, Europe, North, and South America. Mr. Seid graduated from Queen’s College, a division of the City University of New York, in 1968 with a Bachelor’s degree in Political Science. Mr. Seid has held numerous other board of directors and consulting positions. Our board of directors benefits from Mr. Seid's extensive experience growing diverse businesses.
Executive Officers
Our board of directors appoints our executive officers and updates the executive officer positions as needed throughout the fiscal year. Each executive officer serves at the behest of our board of directors and until their successors are appointed, or until the earlier of their death, resignation or removal.
The following table sets forth certain information with respect to our executive officers as of the date of this Annual Report:
Name | Age | Position |
L. Allen Baker, Jr. | 68 | President and Chief Executive Officer |
Beth Garvey | 52 | Chief Operating Officer |
Dan Hollenbach | 62 | Chief Financial Officer and Secretary |
L. Allen Baker, Jr. joined the board of managers of LTN Acquisition, LLC (the former parent of the predecessor to BG Staffing, Inc.) in 2008 while serving as the Executive Vice President/Chief Financial Officer of Impact Confections, Inc., a confections manufacturing company in Colorado, a position Mr. Baker held from 2002 through 2009 and was appointed to our board of directors in November 2013. He began serving as President and Chief Executive Officer of the Company in 2009. From 1985 to 2002, Mr. Baker served as Executive Vice President and Chief Financial Officer of Piping Design Services, Inc. d/b/a PDS Technical Services, a national, privately held staffing company headquartered in the Dallas/Fort Worth area, with operations in 43 states. Prior to this position, he worked at Core Laboratories, Inc. as the Corporate Controller from 1980 to 1985 and as Data Processing Manager from 1976 to 1980. Mr. Baker held several computer programmer positions prior to joining Core Laboratories, Inc. He has a Bachelor of Science in Mathematics with a minor in Computer Information Systems from West Texas State University and a Master of Business Administration from the University of Dallas.
65
Beth Garvey began serving as Chief Operating Officer of the Company in August 2016 and joined the Company through the Company's acquisition of substantially all of the assets of InStaff Holding Corporation and InStaff Personnel, LLC ("InStaff") in 2013. Ms. Garvey started at InStaff in 1998 as Director of Human Resources, subsequently serving as Director of Operations, VP of Operations, Senior VP of Operations, COO and ultimately CEO prior to our acquisition. In 2016, D CEO listed Garvey as one of the top Dallas 500 Business Leaders. In 2010, Ms Garvey was a Dallas Business Journal ‘Women in Business’ honoree recognizing outstanding local women business leaders who not only make a difference in their industries, but also in their communities. Beth currently serves on the Advisory Board for and the Dallas Regional Chamber and is on the Executive Committee for the Dallas Executive Women’s Roundtable.
Dan Hollenbach joined as CFO and Secretary on August 24, 2015. Prior to joining the Company, Mr. Hollenbach was the CFO of Cybergy Holdings, Inc. (OTC: CYBG), an advisory service and products company for the federal and state governments, and commercial clients, from May 2014 to August 2015. Prior to this position, he led the consulting practice for Robert Half Management Resources in Colorado from June 2010 to May 2014. From August 2004 to July 2009, Dan was the CFO for Global Employment Holdings (OTC: GEYH), a national staffing, consulting and professional employer organization company. Mr. Hollenbach began his career in the Audit and Assurance Services practice of EY before entering the corporate world. He has over three decades of experience in corporate accounting and finance, including expertise in initial public offerings, SEC reporting, mergers and acquisitions, SarbanesOxley, treasury management, process improvement, and all phases of audit, tax, and reporting. Additionally, he has served on audit committees and led negotiations of multiple senior debt restructurings. He is a CPA in the State of Texas, holds a Chartered Global Management Accountant certification, and received his B.B.A. in accounting from Texas Tech University.
Code of Ethics
We have adopted a Code of Ethics that applies to all of our employees, including our chief executive officer and our chief financial officer (who is our principal accounting officer). Our Code of Ethics is available on our website at www.bgstaffing.com. If we amend or grant a waiver of one or more of the provisions of our Code of Ethics, we intend to satisfy the requirements under Item 5.05 of Item 8-K regarding the disclosure of amendments to or waivers from provisions of our Code of Ethics that apply to our principal executive, financial and accounting officers by posting the required information on our website at the above address. Our website is not part of this Annual Report on Form 10-K.
Section 16(a) Beneficial Ownership Reporting Compliance
Based on a review of reports filed by our directors, executive officers, and beneficial owners of more than 10% of our shares of common stock pursuant to Section 16 of the Securities Exchange Act of 1934, as amended, and other information available to us, we believe that all such ownership reports required to be filed by those reporting persons during and with respect to Fiscal 2017 were timely made.
Item 11. Executive Compensation.
Named Executive Officers
Our named executive officers for Fiscal 2017 are:
• | L. Allen Baker, Jr., our President and Chief Executive Officer; |
• | Beth Garvey, our Chief Operating Officer; and |
• | Dan Hollenbach, our Chief Financial Officer and Secretary; and |
Throughout this section, the term “named executive officer” is intended to refer to the individuals identified above. During
Fiscal 2017, we had only three named executive officers, each of whom is set forth above.
66
Summary Compensation Table
The following table presents compensation information for our named executive officers with respect to Fiscal 2017, 2016 and 2015.
Name and Principal Position | Year | Salary ($) | Bonus ($) | Stock Awards ($) (*) | Option Awards ($) (*) | Non-equity incentive plan compensation ($) | Non-qualified deferred compensation earnings ($) | All Other Compensation ($) | Total ($) | ||||||||||
L. Allen Baker, Jr.(1) President and Chief Executive Officer | 2017 | $406,736 | $45,000 | $— | $78,751 | $— | $— | $24,305 | (2) | $554,792 | |||||||||
2016 | $375,000 | $37,500 | $— | $— | $— | $— | $23,217 | (3) | $435,717 | ||||||||||
2015 | $325,000 | $278,750 | $— | $54,814 | $— | $— | $19,733 | (4) | $678,297 | ||||||||||
Beth Garvey (8) Chief Operating Officer | 2017 | $275,000 | $— | $— | $49,264 | $— | $— | $12,500 | (5) | $336,764 | |||||||||
2016 | $111,056 | (6) | $37,500 | $— | $202,623 | $— | $— | $4,053 | (8) | $355,232 | |||||||||
2015 | $— | (7) | $— | $— | $— | $— | $— | $— | $— | ||||||||||
Dan Hollenbach Chief Financial Officer and Secretary | 2017 | $230,000 | $— | $— | $49,264 | $— | $— | $— | $279,264 | ||||||||||
2016 | $210,000 | $21,630 | $— | $— | $— | $— | $— | $231,630 | |||||||||||
2015 | $76,729 | (9) | $17,500 | $— | $119,921 | $— | $— | $19,863 | (10) | $234,013 | |||||||||
(*) | The amounts reflects the dollar amounts recognized for financial statement reporting purposes in accordance with FASB ASC Topic 718. The assumptions used in the calculation of these amounts are included in Note 13 Share-based Compensation to the audited consolidated financial statements included in the Original Form 10-K. |
(1) | Mr. Baker also serves on our board of directors, but does not receive additional compensation to do so. |
(2) | Includes $12,000 representing matching 401(k) contributions made by us and $12,305 in medical benefits. |
(3) | Includes $12,000 representing matching 401(k) contributions made by us and $11,217 in medical benefits. |
(4) | Includes $11,750 representing matching 401(k) contributions made by us and $7,983 in medical benefits. |
(5) | Includes $12,500 representing matching 401(k) contributions made by us. |
(6) | Includes compensation since the executed employment agreement effective August 1, 2016. |
(7) | Beth Garvey was not named executive officer in 2015 and therefore no amounts have been included for this year in the table above. |
(8) | Includes $4,053 representing matching 401(k) contributions made by us. |
(9) | Mr. Hollenbach was named CFO in August 2015. |
(10) | Includes $19,825 representing reimbursed moving and relocation costs. |
Agreements with Executive Officers
President and Chief Executive Officer
On February 1, 2016, we executed an employment agreement effective December 28, 2015 with L. Allen Baker, Jr., pursuant to which Mr. Baker serves as our President and Chief Executive Officer. The contract is effective through December 31, 2018 and automatically renews for successive one-year periods until terminated in accordance with its terms. We refer to each of these one-year periods as employment periods. Mr. Baker’s annual compensation is evaluated annually, but may not be less than $375,000 per year. Effective July 24, 2017, the Compensation Committee approved an increase in Mr. Baker's annual base salary to $450,000.
Mr. Baker is eligible to receive an annual cash bonus based on our adjusted EBITDA (as defined in the employment agreement). At the beginning of each calendar year, our board of directors approves an operating adjusted EBITDA budget. If we achieve:
• | at least 85% of the approved adjusted EBITDA budget for the fiscal year, then Mr. Baker receives a cash bonus in an amount equal to 10% his annual base salary for the applicable employment period in which the calendar year ends (or such greater amount as decided by our board of directors); |
• | at least 95% of the approved adjusted EBITDA budget for the fiscal year, then Mr. Baker receives a cash bonus in an amount equal to 25% of his annual base salary for the applicable employment period in which the calendar year ends (or such other greater amount as decided by our board of directors); |
67
• | at least 100% of the approved adjusted EBITDA budget for the fiscal year, then Mr. Baker receives a cash bonus in an amount equal to 40% of his annual base salary for the applicable employment period in which the calendar year ends (or such other greater amount as decided by our board of directors); and |
• | at least 110% of the approved adjusted EBITDA budget for the fiscal year, then Mr. Baker receives a cash bonus in an amount equal to 55% of his annual base salary for the applicable employment period in which the calendar year ends (or such other greater amount as decided by our board of directors). |
In the event that Mr. Baker’s employment is terminated by us without cause or by Mr. Baker for good reason, Mr. Baker will receive as severance installments equal to twelve months of base salary plus COBRA premiums for eighteen months. In the event that Mr. Baker’s employment is terminated without cause or for good reason within one year of a change in control (as defined in the employment agreement), Mr. Baker will receive as severance installments his base salary plus COBRA premiums for Mr. Baker and his dependents for eighteen months. Mr. Baker will also generally be entitled to receive any bonus payable but unpaid, payment for unused vacation days, and unpaid reimbursements. The severance is contingent upon Mr. Baker’s execution of a separation agreement including a general release. In the event that Mr. Baker’s employment is terminated by us for cause, or by Mr. Baker other than for good reason, we will pay to Mr. Baker any monthly salary, bonus payable but unpaid, unused vacation, and expense reimbursements, earned or due to Mr. Baker but unpaid.
We and Mr. Baker have also entered into a confidentiality, non-solicitation, non-interference and non-competition agreement. Pursuant to the agreement, Mr. Baker generally agrees not to disclose our confidential information (as defined in the agreement) and, for a period of eighteen months following his termination, not to solicit our customers, interfere with our customer and supplier relationships, or solicit our employees. Mr. Baker also agrees not to compete with us for a period of twelve months or for the period during which he is entitled to severance payments (if longer).
Mr. Baker was granted stock options in Fiscal 2017 and 2015 as further described under “Outstanding Equity Awards” below.
Chief Operating Officer
On August 5, 2016, we executed an employment agreement effective August 1, 2016 with Beth Garvey pursuant to which Ms. Garvey serves as our Chief Operating Officer. The contract remains in effect under successive one-year extensions unless terminated pursuant its terms. Ms. Garvey's annual compensation is evaluated annually, but may not be less than $275,000 per year. Ms. Garvey received an annual base salary of $275,000 for Fiscal 2017.
Ms. Garvey is eligible to receive an annual cash bonus based on achieving certain adjusted EBITDA levels (as defined by the Compensation committee) and certain fiscal year objectives as determined by us and provided that Ms. Garvey is in our employment on the date such bonus amount is paid.
In the event that Ms. Garvey’s employment is terminated by us without cause or by Ms. Garvey for good reason, Ms. Garvey will receive as severance installments equal to six months of base salary. In the event that Ms. Garvey’s employment is terminated without cause or for good reason within one year of a change in control, Ms. Garvey will receive as severance installments her base salary plus COBRA premiums for Ms. Garvey and her dependents for twelve months. Ms. Garvey will also generally be entitled to receive any bonus payable but unpaid, payment for unused vacation days, and unpaid reimbursements. The severance is contingent upon Ms. Garvey’s execution of a separation agreement including a general release. In the event that Ms. Garvey’s employment is terminated by us for cause, or by Ms. Garvey other than for good reason, we will pay to Ms. Garvey any monthly salary, bonus payable but unpaid, unused vacation, and expense reimbursements, earned or due to Ms. Garvey but unpaid.
We and Ms. Garvey have also entered into a confidentiality, non-solicitation, non-interference and non-competition agreement. Pursuant to the agreement, Ms. Garvey generally agrees not to disclose our confidential information (as defined in the agreement) and, for a period of eighteen months following her termination, not to solicit our customers, interfere with our customer and supplier relationships, or solicit our employees. Ms. Garvey also agrees not to compete with us for a period of twelve months after termination.
Ms. Garvey was granted stock options in the Fiscal 2017 and 2016 pursuant to her appointment as COO and in Fiscal 2015 in her previous role as further described under “Outstanding Equity Awards” below.
68
Chief Financial Officer
On October 27, 2015, we executed an employment agreement effective August 24, 2015 with Dan Hollenbach pursuant to which Mr. Hollenbach serves as our Chief Financial Officer and Secretary. The contract remains in effect under successive one-year extensions unless terminated pursuant to its terms. Mr. Hollenbach's annual compensation is evaluated annually, but may not be less than $210,000 per year. Effective December 26, 2016, the Compensation committee approved an increase in Mr. Hollenbach's annual base salary to $230,000. Mr. Hollebach received an annual base salary of $230,000 for Fiscal 2017.
Mr. Hollenbach is eligible to receive an annual cash bonus based on achieving certain adjusted EBITDA levels (as defined by the Compensation committee) and certain fiscal year objectives as determined by us and Mr. Hollenbach is in our employment on the date such bonus amount is paid. For purposes of Fiscal 2015 only, Mr. Hollenbach was eligible to receive a discretionary bonus in the gross lump sum amount $17,500. Mr. Hollenbach was able to be reimbursed for moving and relocation costs and temporary living expenses not to exceed $33,000.
In the event that Mr. Hollenbach’s employment is terminated by us without cause or by Mr. Hollenbach for good reason, Mr. Hollenbach will receive as severance installments equal to six months of base salary. In the event that Mr. Hollenbach’s employment is terminated without cause or for good reason within one year of a change in control, Mr. Hollenbach will receive as severance installments his base salary plus COBRA premiums for Mr. Hollenbach and his dependents for twelve months. Mr. Hollenbach will also generally be entitled to receive any bonus payable but unpaid, payment for unused vacation days, and unpaid reimbursements. The severance is contingent upon Mr. Hollenbach’s execution of a separation agreement including a general release. In the event that Mr. Hollenbach’s employment is terminated by us for cause, or by Mr. Hollenbach other than for good reason, we will pay to Mr. Hollenbach any monthly salary, bonus payable but unpaid, unused vacation, and expense reimbursements, earned or due to Mr. Hollenbach but unpaid.
We and Mr. Hollenbach have also entered into a confidentiality, non-solicitation, non-interference and non-competition agreement. Pursuant to the agreement, Mr. Hollenbach generally agrees not to disclose our confidential information (as defined in the agreement) and, for a period of eighteen months following his termination, not to solicit our customers, interfere with our customer and supplier relationships, or solicit our employees. Mr. Hollenbach also agrees not to compete with us for a period of twelve months after termination.
Mr. Hollenbach was granted stock options in Fiscal 2017 and 2015 as further described under “Outstanding Equity Awards” below.
2013 Long-Term Incentive Plan
Our board of directors adopted our 2013 Long-Term Incentive Plan (the "2013 Plan") effective December 20, 2013, and was approved by our shareholders on February 6, 2014. Our 2013 Plan provides for the grant of incentive stock options, within the meaning of Section 422 of the Internal Revenue Code, to our employees and any subsidiary corporations’ employees, and for the grant of nonstatutory stock options, restricted stock, RSUs, stock appreciation rights, performance units and performance shares to our employees, directors and consultants and our parent and subsidiary corporations’ employees and consultants.
A total of 900,000 shares of our common stock were originally reserved for issuance pursuant to our 2013 Plan. On May 16, 2017, stockholders approved and made effective an amendment to the 2013 Plan reserving an additional 250,000 shares of common stock, of which 990,514 shares remain available for issuance as of December 31, 2017.
For more details on our 2013 Plan, see our registration statement on Form S-8 (File No. 333-193014) filed on December 20, 2013, Form S-8 (File No. 333-218869) filed on June 20, 2017, and Note 13 in the Notes to Consolidated Financial Statements.
69
Outstanding Equity Awards
The following table presents outstanding equity awards as of December 31, 2017.
Name | Option Awards | |||||||||||
Grant date | Number of securities underlying unexercised options (#) exercisable | Number of securities underlying unexercised options (#) unexercisable | Equity incentive plan awards: Number of securities underlying unexercised unearned options (#) | Option exercise price ($) | Option expiration date | |||||||
(a) | (b) | (c) | (d) | (e) | (f) | |||||||
L. Allen Baker, Jr. | 06/07/2017 | — | 11,729 | (1) | — | $ | 16.76 | 06/07/2027 | ||||
06/07/2017 | 4,000 | 4,271 | (2) | — | $ | 16.76 | 06/07/2027 | |||||
06/09/2015 | — | 6,000 | (3) | — | $ | 11.00 | 06/09/2025 | |||||
06/09/2015 | 18,000 | 6,000 | (4) | — | $ | 11.00 | 06/09/2025 | |||||
02/06/2014 | 170,271 | — | (5) | — | $ | 6.25 | 02/06/2024 | |||||
02/06/2014 | 17,402 | — | (5) | — | $ | 12.50 | 02/06/2024 | |||||
02/06/2014 | 56,000 | 14,000 | (6) | — | $ | 6.25 | 02/06/2024 | |||||
02/06/2014 | 16,000 | 16,000 | (7) | — | $ | 6.25 | 02/06/2024 | |||||
Beth Garvey | 06/07/2017 | — | 2,500 | (8) | — | $ | 16.76 | 06/07/2027 | ||||
06/07/2017 | 2,500 | 7,500 | (2) | — | $ | 16.76 | 06/07/2027 | |||||
08/16/2016 | 2,834 | 10,351 | (9) | — | $ | 17.46 | 08/16/2026 | |||||
08/16/2016 | 17,166 | 19,649 | (10) | — | $ | 17.46 | 08/16/2026 | |||||
06/09/2015 | 12,000 | 8,000 | (11) | — | $ | 11.00 | 06/09/2025 | |||||
02/06/2014 | 5,000 | 5,000 | (12) | — | $ | 6.25 | 02/06/2024 | |||||
Dan Hollenbach | 06/07/2017 | — | 5,000 | (13) | — | $ | 16.76 | 06/07/2027 | ||||
06/07/2017 | 2,500 | 5,000 | (2) | — | $ | 16.76 | 06/07/2027 | |||||
10/27/2015 | 27,099 | 18,066 | (14) | — | $ | 11.07 | 10/27/2025 | |||||
10/27/2015 | 11,901 | 7,934 | (15) | — | $ | 11.07 | 10/27/2025 | |||||
(1) | Incentive stock options will vest 3,729 shares on June 7, 2019 and the remainder of the options vest in two equal annual increments of 4,000 share beginning on June 7, 2020. |
(2) | Nonqualified stock options vested one-fifth on June 7, 2017 and the remainder of the options vest in four equal annual increments beginning on June 7, 2018. |
(3) | Incentive stock options vested one-fifth on June 9, 2015 and the remainder of the options vest in four equal annual increments beginning on June 9, 2016. |
(4) | Nonqualified stock options vested one-fifth on June 9, 2015 and the remainder of the options vest in four equal annual increments beginning on June 9, 2016. |
(5) | Nonqualified stock options vested in full on the date of grant |
(6) | Nonqualified stock options vested one-fifth on February 6, 2014 and the remainder of the options vest in four equal annual increments beginning on February 6, 2015. |
(7) | Incentive stock options vested one-fifth on February 6, 2014 and the remainder of the options vest in four equal annual increments beginning on February 6, 2015. |
(8) | Incentive stock options will vest on June 7, 2021. |
(9) | Incentive stock options vested one-fifth on August 16, 2016 and the remainder of the options vest in four equal annual increments beginning on August 16, 2017. |
(10) | Nonqualified stock options vested one-fifth on August 16, 2016 and the remainder of the options vest in four equal annual increments beginning on August 16, 2017. |
(11) | Incentive stock options vested one-fifth on June 9, 2015 and the remainder of the options vest in four equal annual increments beginning on June 9, 2016. |
(12) | Incentive stock options vested one-fifth on February 6, 2014 and the remainder of the options vest in four equal annual increments beginning on February 6, 2015. |
(13) | Incentive stock options will vest one-half on June 7, 2020 and the remainder of the options vest on June 7, 2021. |
(14) | Incentive stock options vested one-fifth on October 27, 2015 and the remainder of the options vest in four equal annual increments beginning on October 27, 2016. |
70
(15) | Nonqualified stock options vested one-fifth on October 27, 2015 and the remainder of the options vest in four equal annual increments beginning on October 27, 2016. |
Each option is subject to the condition that the optionee will have remained employed by the Company, or any one or more of its subsidiaries, through such vesting dates, and each option is further subject to the terms and conditions set forth in the 2013 Plan and in the applicable Stock Option Agreement.
Vesting Equity Awards
No stock awards were granted to our named executive officers during Fiscal 2017.
Compensation Committee Interlocks and Insider Participation
No member of our Compensation Committee is a current or former officer or employee of BG Staffing, Inc. or its subsidiaries. No executive officer of BG Staffing, Inc. served as a director or member of the compensation committee of any entity that has one or more executive officers serving as a member of our board of directors or Compensation Committee.
Director Compensation
Set forth below is a summary of the components of compensation payable to our non-management directors.
Cash Compensation
We reimburse each member of our board of directors for all reasonable out-of-pocket expenses incurred in connection with their attendance at meetings of our board of directors and any committees thereof, including, without limitation, reasonable travel, lodging and meal expenses. Each director who is not also an employee or officer of the Company is also entitled to (i) annual retainer of $15,000 for their service on our board of directors, (ii) an annual retainer of $5,000 for each committee on which the director serves, and (iii) an annual retainer of $25,000 for audit and $10,000 for all other committee chairs on which the director serves.
Name | Board Member ($) | Audit Committee ($) | Compensation Committee ($) | Nominating & Governance Committee ($) | Chairman of the Board ($) | Total ($) | ||||||||||||
C. David Allen, Jr. | $ | 15,000 | $ | 5,000 | $ | 5,000 | $ | — | $ | — | $ | 25,000 | ||||||
Richard L. Baum, Jr. | $ | 15,000 | $ | 5,000 | $ | 15,000 | $ | 15,000 | $ | — | $ | 50,000 | ||||||
Douglas E. Hailey | $ | 15,000 | $ | 30,000 | $ | — | $ | 5,000 | $ | — | $ | 50,000 | ||||||
Paul A. Seid | $ | 15,000 | $ | — | $ | 5,000 | $ | 5,000 | $ | — | $ | 25,000 | ||||||
Director Compensation for Fiscal 2017
The table below sets forth the compensation payable to our non-management directors for service during Fiscal 2017.
Name | Fees earned or paid in cash ($) | Stock awards ($) | Option awards ($) (*) | Non-equity incentive plan compensation ($) | Nonqualified deferred compensation earnings ($) | All other compensation ($) | Total ($) | ||||||||||||||
C. David Allen, Jr. | $ | 25,000 | $ | — | $ | — | $ | — | $ | — | $ | — | $ | 25,000 | |||||||
Richard L. Baum, Jr. | $ | 50,000 | $ | — | $ | — | $ | — | $ | — | $ | — | $ | 50,000 | |||||||
Douglas E. Hailey | $ | 50,000 | $ | — | $ | — | $ | — | $ | — | $ | — | $ | 50,000 | |||||||
Paul A. Seid | $ | 25,000 | $ | — | $ | — | $ | — | $ | — | $ | — | $ | 25,000 | |||||||
* | The amounts reflects the dollar amounts recognized for financial statement reporting purposes in accordance with FASB ASC Topic 718. The assumptions used in the calculation of these amounts are included in Note 13 Share-based Compensation to the audited consolidated financial statements included in this Annual Report on Form 10-K. |
71
Item 12. Security Ownership of Certain Beneficial Owners and Management and Related Stockholder Matters.
The following table sets forth information regarding the beneficial ownership of our common stock as of March 8, 2018 by:
• | each person, or group of affiliated persons, known by us to be the beneficial owner of more than 5% of our outstanding shares of common stock; |
• | each of our named executive officers and directors; and |
• | all our executive officers and directors as a group. |
Each stockholder’s percentage ownership is based on 8,763,965 shares of common stock outstanding as of March 8, 2018.
Beneficial ownership is determined in accordance with the rules of the SEC and includes voting or investment power with respect to the securities. Except as otherwise indicated, each person or entity named in the table has sole voting and investment power with respect to all shares of our capital shown as beneficially owned, subject to applicable community property laws.
The number and percentage of shares beneficially owned by a person includes shares that may be acquired by such person within 60 days of March 8, 2018 through the exercise of vested options or warrants, while these shares are not counted as outstanding for computing the percentage ownership of any other person.
Except as otherwise set forth below, the address of the persons below is c/o BG Staffing, Inc., 5850 Granite Parkway Drive, Suite 730, Plano, Texas 75024.
Name of Beneficial Owner | Shares of Common Beneficially Stock Owned | Percent of Common Stock Beneficially Owned | ||||
Dan Hollenbach | 41,500 | (1) | * | |||
Beth Garvey | 60,086 | (2) | * | |||
L. Allen Baker, Jr. | 526,336 | (3) | 5.8 | % | ||
Douglas E. Hailey | 124,632 | (4) | 1.4 | % | ||
Richard L. Baum, Jr. | 86,146 | (5) | * | |||
C. David Allen, Jr. | 9,750 | (6) | * | |||
Paul A. Seid | 79,647 | (7) | * | |||
All executive officers and directors as a group (7 total) | 928,097 | 10.1 | % | |||
Michael N. Taglich (10) | 545,764 | (8) | 6.2 | % | ||
Robert F. Taglich (10) | 523,084 | (9) | 6.0 | % | ||
* | Less than 1%. |
(1) | Includes 41,500 shares of common stock issuable upon exercise of stock options. |
(2) | Includes 44,500 shares of common stock issuable upon exercise of stock options. |
(3) | Includes 311,673 shares of common stock issuable upon exercise of stock options and 214,663 shares of common stock held by a trust. |
(4) | Includes 21,248 and 1,631 shares of common stock issuable upon exercise of stock options and warrants, respectively. |
(5) | Includes 9,750 shares of common stock issuable upon exercise of stock options, 65,111 shares of common stock held by a private investment company controlled by Mr. Baum, and 5,388 shares of common stock held by a family trust. |
72
(6) | Includes 9,750 shares of common stock issuable upon exercise of stock options. |
(7) | Includes 9,750 shares of common stock issuable upon exercise of stock options. |
(8) | Includes 41,870 shares of common stock held by a private investment company controlled by Mr. Taglich, 12,000 shares of common stock held by a partnership 50% controlled by Mr. Taglich, 6,000 shares of common stock registered in the name of an individual third party but over which Mr. Taglich has voting and investment control, 35,397 shares of common stock issuable upon exercise of warrants to purchase shares of common stock, and 12,204 shares of common stock held by Mr. Taglich as custodian for third parties. |
(9) | Includes 220 shares of common stock registered in the name of an individual third party but over which Mr. Taglich has voting and investment control, 12,000 shares of common stock held by a partnership 50% controlled by Mr. Taglich, 31,877 shares of common stock issuable upon exercise of warrants to purchase shares of common stock, and 5,715 shares of common stock held by Mr. Taglich as custodian for third parties. |
(10) | The address of Michael N. Taglich and Robert F. Taglich is c/o Taglich Brothers, Inc., 790 New York Avenue, Suite 209, Huntington, New York 11743. |
Equity Compensation Plans
See Item 5, Market for Registrant’s Common Equity, Related Stockholder Matters and Issuer Purchases of Equity Securities - Equity Compensation Plans in this Annual Report.
Item 13. Certain Relationships and Related Transactions, and Director Independence.
Policy on Review and Approval of Transactions with Related Persons
Our board of directors is currently primarily responsible for developing and implementing processes and controls to obtain information from our directors, executive officers and significant stockholders regarding related-person transactions and then determining, based on the facts and circumstances, whether we or a related person has a direct or indirect material interest in these transactions. Our Audit Committee is responsible for the review, approval and ratification of “related-person transactions” between us and any related person. Under SEC rules, a related person is a director, executive officer, nominee for director or beneficial holder of more than of 5% of any class of our voting securities or an immediate family member of any of the foregoing. In the course of its review and approval or ratification of a related-person transaction, the Audit Committee will consider:
• | the nature of the related person’s interest in the transaction; |
• | the material terms of the transaction, including the amount involved and type of transaction; |
• | the importance of the transaction to the related person and to the Company; |
• | whether the transaction would impair the judgment of a director or executive officer to act in our best interest and the best interest of our stockholders; and |
• | any other matters the Audit Committee deems appropriate. |
Any member of the Audit Committee who is a related person with respect to a transaction under review will not be able to participate in the deliberations or vote on the approval or ratification of the transaction. However, such a director may be counted in determining the presence of a quorum at a meeting of the committee that considers the transaction.
Item 14. Principal Accountant Fees and Services.
The Audit Committee reviews and pre-approves both audit and all permissible non-audit services provided by our independent registered public accounting firm, and accordingly, all services and fees in Fiscal 2017, 2016, and 2015 provided by Whitley Penn LLP were pre-approved by the Audit Committee. The Audit Committee has considered whether the provision of services, other than services rendered in connection with the audit of our annual financial statements, is compatible with maintaining Whitley Penn LLP’s independence. The Audit Committee has determined that the rendering of non-audit services by Whitley Penn LLP during Fiscal 2017, 2016, and 2015 was compatible with maintaining the firm’s independence.
73
Aggregate fees billed or incurred related to the following years for professional services rendered by Whitley Penn LLP for Fiscal 2017 and 2016 are set forth below.
2017 | 2016 | |||||||
Audit Fees (1) | $ | 206,392 | $ | 169,256 | ||||
Audit-Related Fees (2) | 132,893 | 75,214 | ||||||
Tax Fees | — | — | ||||||
All Other Fees | — | — | ||||||
Total | $ | 339,285 | $ | 244,470 | ||||
(1) | Audit fees consist principally of fees for the audit of our consolidated financial statements, review of our interim consolidated financial statements and audit services related to our acquisitions. |
(2) | These fees consist principally of fees related to the preparation of SEC registration statements, acquisition due diligence, and U.S. Department of Labor filings. |
Selection
The Audit Committee appointed Whitley Penn LLP as our independent registered public accounting firm for Fiscal 2017 and Whitley Penn LLP has served in this capacity since 2013. Our board of directors has further directed that we submit the selection of our independent registered public accounting firm for ratification by our stockholders at the 2018 annual meeting.
74
PART IV
Item 15. Exhibits and Financial Statement Schedules.
(1) Financial Statements
The following consolidated financial statements of the Company and the report of the Independent Registered Public Accounting Firm are contained in Item 8 of Part II of this Annual Report on Form 10-K as indicated:
Page | |
Audited Consolidated Financial Statements of BG Staffing, Inc. | |
As of and for the Years Ended December 31, 2017, December 25, 2016, and December 27, 2015. | |
(2) | Financial Statement Schedules |
Financial statement schedules are omitted because they are not applicable, or not required, or because the required information is included in the consolidated financial statements or notes thereto.
(3) | Exhibits |
See the list of exhibits in the Index to Exhibits to this Annual Report on Form 10-K, which is incorporated herein by reference.
75
SIGNATURES
Pursuant to the requirements of Section 13 or 15(d) of the Securities Exchange Act of 1934, the Registrant has duly caused this report to be signed on its behalf by the undersigned, thereunto duly authorized on March 8, 2018.
BG STAFFING, INC. | ||
By: | /s/ L. Allen Baker, Jr. | |
Name: L. Allen Baker, Jr. | ||
Title: President and Chief Executive Officer | ||
Pursuant to the requirements of the Securities Exchange Act of 1934, this report has been signed below by the following persons on behalf of the Registrant and in the capacities indicated on March 8, 2018.
/s/ L. Allen Baker, Jr. | President and Chief Executive Officer and Director |
L. Allen Baker, Jr. | (Principal Executive Officer) |
/s/ Dan Hollenbach | Chief Financial Officer and Secretary |
Dan Hollenbach | (Principal Financial and Accounting Officer) |
/s/ Douglas E. Hailey | Director |
Douglas E. Hailey | |
/s/ Richard L. Baum, Jr. | Director |
Richard L. Baum, Jr. | |
/s/ Paul A. Seid | Director |
Paul A. Seid | |
/s/ C. David Allen, Jr. | Director |
C. David Allen, Jr. | |
76
EXHIBIT INDEX
Exhibit No. | Description | |
2.1 | ||
2.2 | ||
2.3 | ||
2.4 | ||
2.5 | ||
2.6 | ||
2.7 | ||
2.8 | ||
3.1 | ||
3.2 | ||
4.1 | ||
10.1** | ||
10.2** | ||
10.3** | ||
10.4** | ||
10.5** | ||
10.6 | ||
10.7 | ||
77
10.8 | ||
10.9 | ||
10.10 | ||
10.11 | ||
10.12 | ||
10.13 | ||
10.14** | ||
10.15** | ||
10.16 | ||
10.17 | ||
10.18** | ||
21.1* | ||
23.1* | ||
31.1* | ||
31.2* | ||
32.1† | ||
101.INS* | XBRL Instance Document | |
101.SCH* | XBRL Taxonomy Extension Schema Document | |
101.CAL* | XBRL Taxonomy Extension Calculation Linkbase Document | |
101.DEF* | XBRL Taxonomy Extension Definition Linkbase Document. | |
101.LAB* | XBRL Taxonomy Extension Label Linkbase Document | |
101.PRE* | XBRL Taxonomy Extension Presentation Linkbase Document | |
* | Filed herewith. |
** | Management contract or compensatory plan or arrangement. |
† | This certification is deemed not filed for purposes of Section 18 of the Securities Exchange Act of 1934, as amended ("Exchange Act"), or otherwise subject to the liability of that section, nor shall it be deemed incorporated by reference into any filing under the Securities Act of 1933, as amended, or the Exchange Act. |
78
Exhibit 21.1
Subsidiaries
Name of Subsidiary | Jurisdiction of Formation | |
BG Personnel, LP | Texas | |
BG Staffing, LLC | Delaware | |
B G Staff Services, Inc. | Texas | |
BG Finance and Accounting, Inc. | Delaware | |
Exhibit 23.1
CONSENT OF INDEPENDENT REGISTERED PUBLIC ACCOUNTING FIRM
We consent to the incorporation by reference in the Registration Statement No. 333-222058 on Form S-3, and No. 333-218869 and No. 333-193014 on Form S-8 of BG Staffing, Inc., of our report dated March 8, 2018, relating to the consolidated financial statements appearing in this Annual Report on Form 10-K of BG Staffing, Inc. for the year ended December 31, 2017.
/s/ Whitley Penn LLP
Dallas, Texas
March 8, 2018
Exhibit31.1
CERTIFICATIONS
I, L. Allen Baker, Jr., certify that:
1. I have reviewed this Annual Report on Form 10-K of BG Staffing, Inc.;
2. Based on my knowledge, this report does not contain any untrue statement of a material fact or omit to state a material fact necessary to make the statements made, in light of the circumstances under which such statements were made, not misleading with respect to the period covered by this report;
3. Based on my knowledge, the financial statements, and other financial information included in this report, fairly present in all material respects the financial condition, results of operations and cash flows of the registrant as of, and for, the periods presented in this report;
4. The registrant’s other certifying officer(s) and I are responsible for establishing and maintaining disclosure controls and procedures (as defined in Exchange Act Rules 13a-15(e) and 15d-15(e)) and internal control over financial reporting (as defined in Exchange Act Rules 13a-15(f) and 15d-15(f)) for the registrant and have:
(a) Designed such disclosure controls and procedures, or caused such disclosure controls and procedures to be designed under our supervision, to ensure that material information relating to the registrant, including its consolidated subsidiaries, is made known to us by others within those entities, particularly during the period in which this report is being prepared;
(b) Designed such internal control over financial reporting, or caused such internal control over financial reporting to be designed under our supervision, to provide reasonable assurance regarding the reliability of financial reporting and the preparation of financial statements for external purposes in accordance with generally accepted accounting principles;
(c) Evaluated the effectiveness of the registrant’s disclosure controls and procedures and presented in this report our conclusions about the effectiveness of the disclosure controls and procedures, as of the end of the period covered by this report based on such evaluation; and
(d) Disclosed in this report any change in the registrant’s internal control over financial reporting that occurred during the registrant’s most recent fiscal quarter (the registrant’s fourth fiscal quarter in the case of an annual report) that has materially affected, or is reasonably likely to materially affect, the registrant’s internal control over financial reporting; and
5. The registrant’s other certifying officer(s) and I have disclosed, based on our most recent evaluation of internal control over financial reporting, to the registrant’s auditors and the audit committee of the registrant’s board of directors (or persons performing the equivalent functions):
(a) All significant deficiencies and material weaknesses in the design or operation of internal control over financial reporting which are reasonably likely to adversely affect the registrant’s ability to record, process, summarize and report financial information; and
(b) Any fraud, whether or not material, that involves management or other employees who have a significant role in the registrant’s internal control over financial reporting.
Date: | March 8, 2018 | /s/ L. Allen Baker, Jr. |
L. Allen Baker, Jr. | ||
President and Chief Executive Officer | ||
(Principal Executive Officer) | ||
exhibit31.2
CERTIFICATIONS
I, Dan Hollenbach, certify that:
1. I have reviewed this Annual Report on Form 10-K of BG Staffing, Inc.;
2. Based on my knowledge, this report does not contain any untrue statement of a material fact or omit to state a material fact necessary to make the statements made, in light of the circumstances under which such statements were made, not misleading with respect to the period covered by this report;
3. Based on my knowledge, the financial statements, and other financial information included in this report, fairly present in all material respects the financial condition, results of operations and cash flows of the registrant as of, and for, the periods presented in this report;
4. The registrant’s other certifying officer(s) and I are responsible for establishing and maintaining disclosure controls and procedures (as defined in Exchange Act Rules 13a-15(e) and 15d-15(e)) and internal control over financial reporting (as defined in Exchange Act Rules 13a-15(f) and 15d-15(f)) for the registrant and have:
(a) Designed such disclosure controls and procedures, or caused such disclosure controls and procedures to be designed under our supervision, to ensure that material information relating to the registrant, including its consolidated subsidiaries, is made known to us by others within those entities, particularly during the period in which this report is being prepared;
(b) Designed such internal control over financial reporting, or caused such internal control over financial reporting to be designed under our supervision, to provide reasonable assurance regarding the reliability of financial reporting and the preparation of financial statements for external purposes in accordance with generally accepted accounting principles;
(c) Evaluated the effectiveness of the registrant’s disclosure controls and procedures and presented in this report our conclusions about the effectiveness of the disclosure controls and procedures, as of the end of the period covered by this report based on such evaluation; and
(d) Disclosed in this report any change in the registrant’s internal control over financial reporting that occurred during the registrant’s most recent fiscal quarter (the registrant’s fourth fiscal quarter in the case of an annual report) that has materially affected, or is reasonably likely to materially affect, the registrant’s internal control over financial reporting; and
5. The registrant’s other certifying officer(s) and I have disclosed, based on our most recent evaluation of internal control over financial reporting, to the registrant’s auditors and the audit committee of the registrant’s board of directors (or persons performing the equivalent functions):
(a) All significant deficiencies and material weaknesses in the design or operation of internal control over financial reporting which are reasonably likely to adversely affect the registrant’s ability to record, process, summarize and report financial information; and
(b) Any fraud, whether or not material, that involves management or other employees who have a significant role in the registrant’s internal control over financial reporting.
Date: | March 8, 2018 | /s/ Dan Hollenbach |
Dan Hollenbach | ||
Chief Financial Officer and Secretary | ||
(Principal Financial Officer) | ||
exhibit 32.1
CERTIFICATION PURSUANT TO 18 U.S.C. § 1350,
AS ADOPTED PURSUANT TO § 906
OF THE SARBANES-OXLEY ACT OF 2002
In connection with the filing of the Annual Report on Form 10-K of BG Staffing, Inc., a Delaware corporation (the “Company”), for the fiscal year ended December 31, 2017, as filed with the Securities and Exchange Commission on the date hereof (the “Report”), each of the undersigned officers of the Company certifies, pursuant to 18 U.S.C. § 1350, as adopted pursuant to § 906 of the Sarbanes-Oxley Act of 2002, that, to the best of such officer’s knowledge:
1. The Report fully complies with the requirements of Section 13(a) or 15(d) of the Securities Exchange Act of 1934; and
2. The information contained in the Report fairly presents, in all material respects, the financial condition and results of operations of the Company.
Date: | March 8, 2018 | /s/ L. Allen Baker, Jr. |
L. Allen Baker, Jr. | ||
President and Chief Executive Officer | ||
(Principal Executive Officer) | ||
/s/ Dan Hollenbach | ||
Dan Hollenbach | ||
Chief Financial Officer and Secretary | ||
(Principal Financial Officer) | ||
The foregoing certification is being furnished solely pursuant to 18 U.S.C. § 1350 and is not being filed as part of the Report or as a separate disclosure document.
A signed original of this written statement required by Section 906 has been provided to BG Staffing, Inc. and will be retained by BG Staffing, Inc. and furnished to the Securities and Exchange Commission or its staff upon request.