
Form 6-K SIERRA WIRELESS INC For: Dec 31
UNITED STATES SECURITIES AND EXCHANGE COMMISSION
Washington, D.C. 20549
FORM 6-K
Report of Foreign Private Issuer
Pursuant to Rule 13a-16 or 15d-16 of the
Securities Exchange Act of 1934
For the Month of March 2018
(Commission File. No. 000-30718).
SIERRA WIRELESS, INC.
(Translation of registrant’s name in English)
13811 Wireless Way
Richmond, British Columbia, Canada V6V 3A4
(Address of principal executive offices and zip code)
Registrant’s Telephone Number, including area code: 604-231-1100
Indicate by check mark whether the registrant files or will file annual reports under cover Form 20-F or Form 40-F:
Form 20-F | o | 40-F | ý | |
Indicate by check mark if the registrant is submitting the Form 6-K in paper as permitted by Regulation S-T Rule 101(b)(1):
Yes: | o | No: | ý | |
Indicate by check mark if the registrant is submitting the Form 6-K in paper as permitted by Regulation S-T Rule 101(b)(7):
Yes: | o | No: | ý | |
SIGNATURES
Pursuant to the requirements of the Securities Exchange Act of 1934, the registrant has duly caused this report to be signed on its behalf by the undersigned, thereunto duly authorized.
Sierra Wireless, Inc. | ||
By: | /s/ David G. McLennan | |
David G. McLennan, Chief Financial Officer and Secretary | ||
Date: March 7, 2018 | ||
INCORPORATION BY REFERENCE
This Report on Form 6-K is incorporated by reference into the Registration Statement on Form S-8 of the registrant, which was filed with the Securities and Exchange Commission on March 31, 2016 (File No. : 333-210315).

Sierra Wireless, Inc.
Financial Highlights
(Expressed in thousands of United States dollars, except as otherwise stated)
(Prepared in accordance with United States generally accepted accounting principles ("U.S. GAAP"))
Consolidated Statement of Operations Data
Years ended December 31, | 2017 | 2016 | 2015 | ||||||||
GAAP results | |||||||||||
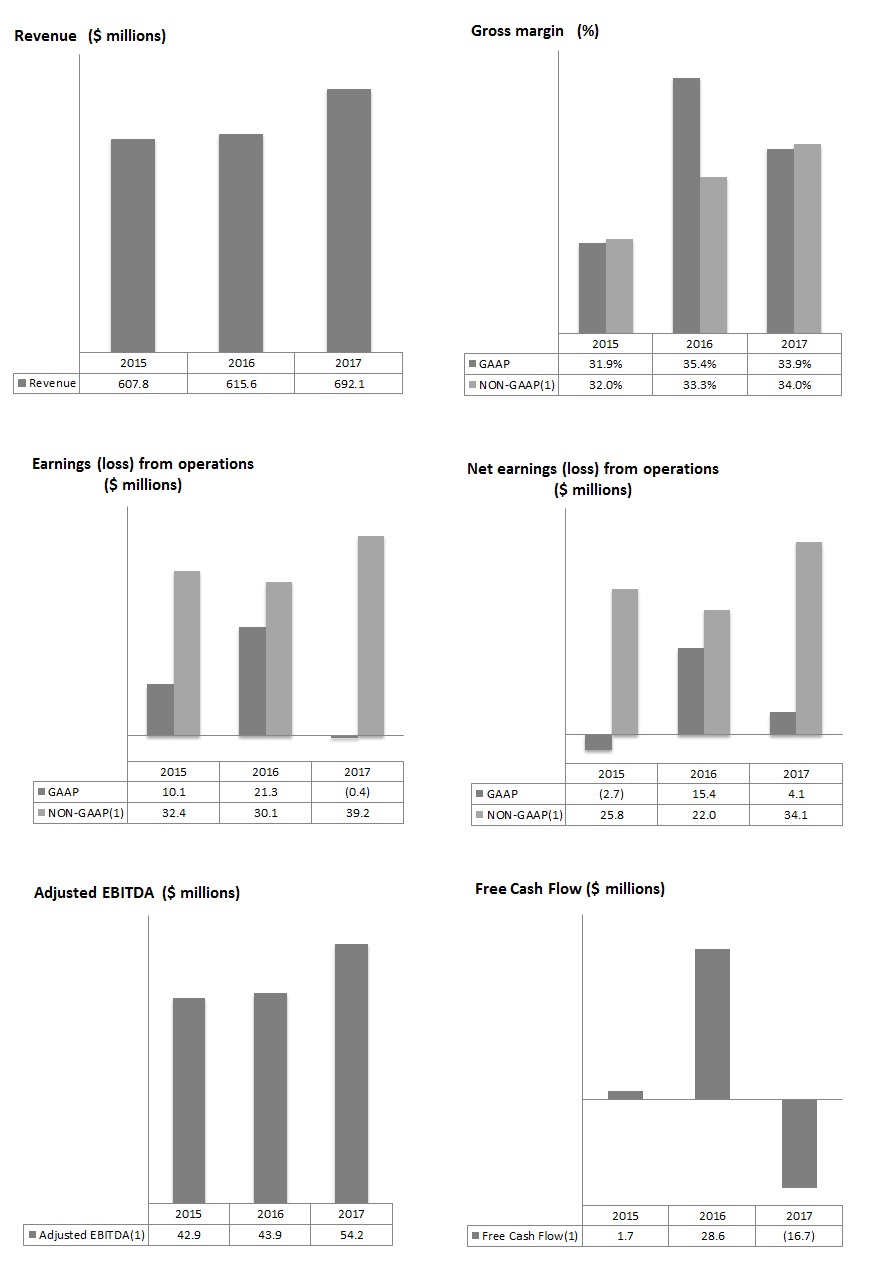
Revenue | $ | 692,077 | $ | 615,607 | $ | 607,798 | |||||
Gross margin percentage | 33.9 | % | 35.4 | % | 31.9 | % | |||||
Total expenses | 235,306 | 196,395 | 183,741 | ||||||||
Earnings (loss) from operations | (359 | ) | 21,348 | 10,114 | |||||||
Net earnings (loss) | 4,135 | 15,385 | (2,674 | ) | |||||||
Basic and diluted net earnings (loss) per share (in dollars) | $ | 0.13 | $ | 0.48 | $ | (0.08 | ) | ||||
Non-GAAP results(1) | |||||||||||
Gross margin percentage | 34.0 | % | 33.3 | % | 32.0 | % | |||||
Total expenses | $ | 196,254 | $ | 174,991 | $ | 162,141 | |||||
Earnings from operations | 39,177 | 30,127 | 32,361 | ||||||||
Adjusted EBITDA | 54,194 | 43,919 | 42,911 | ||||||||
Net earnings | 34,136 | 21,969 | 25,774 | ||||||||
Basic and diluted net earnings per share (in dollars) | $ | 1.04 | $ | 0.68 | $ | 0.80 | |||||
Free cash flow | $ | (16,734 | ) | $ | 28,648 | $ | 1,724 | ||||
Revenue by segment | |||||||||||
OEM Solutions | $ | 555,887 | $ | 516,517 | $ | 523,366 | |||||
Enterprise Solutions | 101,535 | 71,486 | 63,072 | ||||||||
IoT Services | 34,655 | 27,604 | 21,360 | ||||||||
$ | 692,077 | $ | 615,607 | $ | 607,798 | ||||||
Revenue by geographical region | |||||||||||
Americas | 32 | % | 32 | % | 32 | % | |||||
Europe, Middle East and Africa | 23 | % | 22 | % | 19 | % | |||||
Asia-Pacific | 45 | % | 46 | % | 49 | % | |||||
100 | % | 100 | % | 100 | % | ||||||
Consolidated Balance Sheet Data | |||||||||||
December 31, | 2017 | 2016 | 2015 | ||||||||
Cash and cash equivalents | $ | 65,003 | $ | 102,772 | $ | 93,936 | |||||
Long-term obligations | $ | 36,637 | $ | 32,654 | $ | 44,353 | |||||
Shareholders' equity | $ | 466,917 | $ | 361,584 | $ | 358,296 | |||||
Number of common shares outstanding | 35,861,510 | 31,859,960 | 32,337,201 | ||||||||
(1) Our non-GAAP financial measures exclude the impact of stock-based compensation expense and related social taxes, acquisition-related amortization, impairment, acquisition-related costs, integration costs, restructuring costs, certain other nonrecurring costs or recoveries, foreign exchange gains or losses on translation of balance sheet accounts, unrealized foreign exchange gains or losses on forward contracts, and certain tax adjustments. Adjusted EBITDA is defined as net earnings (loss) plus stock-based compensation expense and related social taxes, acquisition-related and integration costs, restructuring cost, impairment, certain other nonrecurring costs or recoveries, amortization, foreign exchange gains or losses on translation of certain balance sheet accounts, unrealized foreign exchange gains or losses on forward contracts, interest and income tax expense. Free cash flow is defined as cash flow from operating activities less capital expenditures and increases in intangibles. Non-GAAP financial measures do not have any standardized meaning prescribed by U.S. GAAP and therefore may not be comparable to similar measures presented by other companies. For further information, refer to "Non-GAAP Financial Measures" on page 31 of the Management's Discussion and Analysis in this Annual Report. | |||||||||||
Report to Shareholders
2017 was a strong year as revenue and profitability improved significantly. We also strengthened our strategic position in the Internet of Things (IoT) with the acquisition of Numerex just before year end.
Revenue in 2017 increased 12.4% to $692.1 million and adjusted EBITDA increased by 23.4% to $54.2 million on a year-over-year basis. Full year revenue in our OEM Solutions business increased 7.6% reflecting improved demand from existing customers and solid contribution from new programs. Enterprise Solutions revenue increased 42.0% in 2017, which included strong contributions from our telematics devices and AirLink networking solutions. Revenue in our IoT Services business (formerly Cloud and Connectivity Services) increased 25.5% in 2017 including a $3.1 million contribution from Numerex. Excluding revenue from Numerex, the organic growth rate in IoT Services was 14.2%. Our profitability improved year-over-year as non-GAAP earnings per share on a fully diluted basis rose 53% from $0.68 in 2016 to $1.04 in 2017.
On December 7, 2017 we closed the acquisition of Numerex, accelerating our IoT device-to-cloud strategy by adding established customers, proven solutions and recurring subscription-based revenue. The combination of Sierra Wireless and Numerex creates a clear global leader in IoT services and solutions. We are now deeply engaged in integration activities with a goal of capturing significant growth, cost and operational synergies.
Throughout the year, we launched many leading products across our lines of business, further bolstering our technology and market leadership position. Key product milestones achieved in 2017 included the launch of our first Ready to Connect devices with fully integrated Smart Connectivity and cloud management, industry leading Low Power Wide Area (LPWA) devices and the industry’s first LTE-Advanced Pro embedded cellular modules. Our new products and solutions address the needs of many emerging use cases and market segments in the IoT.
New customer program acquisition activity was solid in 2017 as we won numerous new programs across our three business segments, including the second largest design win in the company’s history with a large international automotive OEM customer.
As we look forward, we are the clear global leader in cellular connectivity solutions for the Internet of Things and our comprehensive product offering exposes us to a large and valuable market opportunity. We believe that we are better positioned than ever to capture a significant share of this opportunity. We also plan to continue to pursue acquisitions that support our device-to-cloud strategy and that help to accelerate long-term growth and value creation for our shareholders.

Jason W. Cohenour | ||
President and Chief Executive Officer | ||
Cautionary Note Regarding Forward-Looking Statements
Certain statements in this letter constitute forward-looking statements or forward-looking information and, in this regard, you should read carefully the "Cautionary Note Regarding Forward-Looking Statements" in the attached Management's Discussion & Analysis.
1
Table of Contents
MANAGEMENT’S DISCUSSION AND ANALYSIS | |
CAUTIONARY NOTE REGARDING FORWARD-LOOKING STATEMENTS | |
OVERVIEW | |
Business Overview | |
Our Mission, Vision and Values | |
Our Strategy | |
Annual Overview - Financial Highlights | |
Outlook | |
CONSOLIDATED ANNUAL RESULTS OF OPERATIONS | |
Fiscal Year 2017 compared to Fiscal Year 2016 | |
Fiscal Year 2016 compared to Fiscal Year 2015 | |
SEGMENTED INFORMATION | |
FOURTH QUARTER OVERVIEW | |
SUMMARY OF QUARTERLY RESULTS OF OPERATIONS | |
LIQUIDITY AND CAPITAL RESOURCES | |
NON-GAAP FINANCIAL MEASURES | |
OFF-BALANCE SHEET ARRANGEMENTS | |
TRANSACTIONS BETWEEN RELATED PARTIES | |
CRITICAL ACCOUNTING POLICIES AND ESTIMATES | |
OUTSTANDING SHARE DATA | |
IMPACT OF ACCOUNTING PRONOUNCEMENTS AFFECTING CURRENT PERIOD | |
IMPACT OF ACCOUNTING PRONOUNCEMENTS AFFECTING FUTURE PERIODS | |
DISCLOSURE CONTROLS AND PROCEDURES | |
INTERNAL CONTROL OVER FINANCIAL REPORTING | |
LEGAL PROCEEDINGS | |
FINANCIAL RISK MANAGEMENT | |
RISKS AND UNCERTAINTIES | |
CONSOLIDATED FINANCIAL STATEMENTS | |
2
MANAGEMENT’S DISCUSSION AND ANALYSIS OF
FINANCIAL CONDITION AND RESULTS OF OPERATIONS
The following Management’s Discussion and Analysis of Financial Condition and Results of Operations (“MD&A”) provides information for the years ended December 31, 2017, 2016 and 2015 and up to and including March 7, 2018. This MD&A should be read together with our audited consolidated financial statements and the accompanying notes for the year ended December 31, 2017 (“the consolidated financial statements”). The consolidated financial statements have been prepared in accordance with generally accepted accounting principles in the United States (“U.S. GAAP” or "GAAP"). Except where otherwise specifically indicated, all amounts in this MD&A are expressed in United States dollars.
We have prepared this MD&A with reference to National Instrument 51-102 “Continuous Disclosure Obligations” of the Canadian Securities Administrators. Under the U.S./Canada Multijurisdictional Disclosure System, we are permitted to prepare this MD&A in accordance with the disclosure requirements of Canada, which requirements are different than those of the United States.
Certain statements in this MD&A constitute forward-looking statements or forward-looking information within the meaning of applicable securities laws. You should carefully read “Cautionary Note Regarding Forward-looking Statements” in this MD&A and should not place undue reliance on any such forward-looking statements.
Throughout this document, references are made to certain non-GAAP financial measures that are not measures of performance under U.S. GAAP. Management believes that these non-GAAP financial measures provide useful information to investors regarding the Company’s results of operations as they provide additional measures of its performance and assist in comparisons from one period to another. These non-GAAP financial measures do not have any standardized meaning prescribed by U.S. GAAP and are therefore unlikely to be comparable to similar measures presented by other issuers. These non-GAAP financial measures are defined and reconciled to their nearest GAAP measure in “Non-GAAP Financial Measures”.
In this MD&A, unless the context otherwise requires, references to "the Company", "Sierra Wireless", "we", "us" and "our" refer to Sierra Wireless, Inc. and its subsidiaries.
Additional information about the Company, including our most recent consolidated financial statements and our Annual Information Form, is available on SEDAR at www.sedar.com and on EDGAR at www.sec.gov.
3
Cautionary Note Regarding Forward-looking Statements
This MD&A contains certain statements and information that are not based on historical facts and constitute forward-looking statements or forward-looking information within the meaning of the U.S. Private Securities Litigation Reform Act of 1995 and Canadian securities laws (collectively, “forward-looking statements”), including our business outlook for the short and longer term; statements regarding our strategy, plans and future operating performance; the Company’s liquidity and capital resources; the Company’s financial and operating objectives and strategies to achieve them; general economic conditions; expectations regarding the recent acquisition of Numerex Corp. ("Numerex"); estimates of our expenses, future revenues, non-GAAP earnings per share and capital requirements; our expectations regarding the legal proceedings we are involved in; statements with respect to the Company’s estimated working capital; expectations with respect to the adoption of IoT solutions; expectations in respect of our next generation Narrowband IoT; expectations regarding trends in the IoT market and wireless module market; expectations regarding product and price competition from other wireless device manufacturers and solution providers; and our ability to implement effective control procedures. Forward-looking statements are provided to help you understand our views of our short and longer term plans, expectations and prospects. We caution you that forward-looking statements may not be appropriate for other purposes.
Any statements that express or involve discussions with respect to predictions, expectations, beliefs, plans, projections, objectives, assumptions or future events or performance (often, but not always, identified by words or phrases such as “expects”, “is expected”, “anticipates”, “believes”, “plans”, “projects”, “estimates”, “assumes”, “intends”, “strategy”, “goals”, “objectives”, “potential”, “possible” or variations thereof or stating that certain actions, events, conditions or results “may”, “could”, “would”, “should”, “might” or “will” be taken, occur or be achieved, or the negative of any of these terms and similar expressions) are not statements of historical fact and may be forward-looking statements. Forward-looking statements are not promises or guarantees of future performance, they represent our current views and may change significantly. Forward-looking statements are based on a number of material assumptions, including, but not limited to, those listed below, which could prove to be significantly incorrect:
• | our ability to develop, manufacture and sell new products and services that meet the needs of our customers and gain commercial acceptance; |
• | our ability to continue to sell our products and services in the expected quantities at the expected prices and expected times; |
• | expected cost of goods sold; |
• | potential component supply constraints; |
• | our ability to win new business; |
• | our ability to integrate the business, operations and workforce of Numerex and to return the Numerex business to profitable growth and realize the expected benefits of the acquisition; |
• | our ability to integrate other acquired businesses and realize expected benefits; |
• | expected deployment of next generation networks by wireless network operators; |
• | our operations not being adversely disrupted by other developments, operating or regulatory risks; and |
• | expected tax rates and foreign exchange rates. |
4
Forward-looking statements are subject to a variety of known and unknown risks, uncertainties and other factors that could cause actual events or results to differ significantly from those expressed or implied in our forward-looking statements, including, without limitation:
• | competition from new or established competitors or from those with greater resources; |
• | risks related to the recent acquisition of Numerex; |
• | disruption of, and demands on, our ongoing business and diversion of management's time and attention in connection with other acquisitions or divestitures; |
• | the loss of or significant demand fluctuations from any of our significant customers; |
• | cyber-attacks or other breaches of our information technology security; |
• | our financial results being subject to fluctuation; |
• | our ability to respond to changing technology, industry standards and customer requirements; |
• | our ability to attract or retain key personnel; |
• | risks related to infringement on intellectual property rights of others; |
• | our ability to obtain necessary rights to use software or components supplied by third parties; |
• | our ability to enforce our intellectual property rights; |
• | difficult or uncertain global economic conditions; |
• | our reliance on single source suppliers for certain components used in our products; |
• | failures of our products or services due to design flaws and errors, component quality issues, manufacturing defects or other quality issues; |
• | our dependence on a limited number of third party manufacturers; |
• | unanticipated costs associated with litigation or settlements; |
• | our dependence on mobile network operators to offer and promote acceptable wireless service programs; |
• | risks related to contractual disputes with counterparties; |
• | risks related to governmental regulation; |
• | risks related to the transmission, use and disclosure of user data and personal information; and |
• | risks inherent in foreign jurisdictions. |
This list is not exhaustive of the factors that may affect any of our forward-looking statements. Forward-looking statements are statements about the future and are inherently uncertain, and our actual achievements or other future events or conditions may differ materially from those reflected in the forward-looking statements due to a variety of risks, uncertainties and other factors, including, without limitation, those referred to below under "Risks and Uncertainties" and those referred to in our other regulatory filings with the U.S. Securities and Exchange Commission (the "SEC") in the United States and the provincial securities commissions in Canada.
Our forward-looking statements are based on the beliefs, expectations and opinions of management on the date the statements are made, and we do not assume any obligation to update forward-looking statements if circumstances or management’s beliefs, expectations or opinions should change, except as required by applicable law. For the reasons set forth above, investors should not place undue reliance on forward-looking statements.
5
OVERVIEW
Business Overview
Sierra Wireless is an Internet of Things ("IoT") pioneer, empowering businesses and industries to transform and thrive in the connected economy. Customers start their IoT deployments with Sierra Wireless because we provide an integrated device-to-cloud solution comprised of embedded and networking solutions seamlessly connected with our IoT services. Original Equipment Manufacturers ("OEMs") and enterprises worldwide rely on our expertise in delivering fully-integrated solutions to reduce complexity, turn edge network data into intelligent decisions and get their connected products and services to market faster.
We operate our business under three reportable segments: (i) OEM Solutions; (ii) Enterprise Solutions; and (iii) IoT Services. Effective December 11, 2017, our former Cloud and Connectivity Services segment was renamed IoT Services to coincide with the acquisition of Numerex which is now included in our IoT Services segment.
OEM Solutions
As a leading embedded module vendor, we provide standards-based wireless technologies and support open source initiatives that help OEMs and system integrators get their products to market faster. We make it easy to embed cellular, Wi-Fi, Bluetooth and Global Navigation Satellite System ("GNSS") technologies, as well as manage connectivity, devices and data through our cloud platform. Our OEM Solutions segment includes embedded cellular modules, short range wireless modules, software and tools for OEM customers who integrate wireless connectivity into their products and solutions across a broad range of industries, including automotive, transportation, energy, enterprise networking, sales and payment, mobile computing, security, industrial monitoring, field services, smart home, healthcare and others. Within our OEM Solutions segment, our embedded wireless module product portfolio spans second generation ("2G"), third generation ("3G"), fourth generation ("4G") Long-Term Evolution ("LTE") and Low Power Wide Area ("LPWA") cellular technologies, short range modules focused on Bluetooth and Wi-Fi technologies and GNSS. Our broad product portfolio also includes cloud-based remote device and data management capability, as well as support for our embedded application framework called Legato which is an open source, Linux-based platform. We are also advancing our capabilities at the edge of the network to enable intelligent data orchestration through additional software that enhances our integrated IoT offering.
Enterprise Solutions
Our Enterprise Solutions segment provides secure networking solutions comprised of routers and gateways complemented by cloud-based or on-premise software for secure device and network management. Our networking solutions address a range of key segments within the mobility, industrial and enterprise markets.
Sierra Wireless AirLink gateways and routers have strong brand recognition with network operators, value added resellers and end customers. Our gateways and routers are known for their high reliability and technical capability in mission critical applications deployed in hostile environmental conditions. The gateways leverage Sierra Wireless' expertise in wireless technologies and offer the latest capabilities in LTE networking. The acquisition of GenX Mobile Incorporated ("GenX") in 2016 has added vehicle tracking (telematics) devices to our product portfolio, which are sold through large fleet management partners.
We sell our AirLink gateways and routers through channel partners in a two-tier distribution model worldwide. Our Enterprise Solutions team also includes a direct sales force and an expert technical team which engages with key customers in each of our target segments.
6
IoT Services
Our IoT Services segment enables the digital transformation of enterprises through integrated IoT services and comprises three main areas of operation: (i) our cloud services, which provide a secure and scalable cloud platform for deploying and managing IoT subscriptions, over-the-air updates, devices and applications; (ii) our global cellular connectivity services, which include our Smart SIM and core network platforms; and (iii) our managed broadband cellular services, which include a combination of hardware, high speed connectivity and cloud services. These cloud, connectivity and broadband services have been integrated to support our device-to-cloud strategy and enable worldwide IoT deployments by our customers. Our solution makes it simple to rapidly build and scale IoT applications while de-risking the deployment process. Sierra Wireless offers the broadest array of cloud and connectivity services to connect customers to the mobile network, manage devices and power their IoT services.
Our AirVantage cloud platform is used to collect, manage and process data from any number of connected devices. It allows our customers to centrally deploy and monitor IoT devices at the edge of the network, including configuring device settings and delivering firmware and embedded application updates remotely over the air. Our connectivity services offering, which includes our flexible Smart SIM technology, utilizes global, multi-operator subscriptions with unique benefits for IoT deployments including quality of service improvements and multi-operator network coverage. Our managed broadband services provide network connectivity solutions for distributed enterprises utilizing cellular broadband gateways, routers and advanced antennas.
We significantly advanced our device-to-cloud capabilities in 2015 by completing three acquisitions and rapidly expanding our IoT services business. These acquisitions included: Wireless Maingate AB ("Maingate"), a Sweden-based provider of IoT connectivity and data management services; Accel Networks LLC ("Accel"), a provider of secure managed cellular broadband connectivity services for distributed enterprises in North America and MobiquiThings SAS ("MobiquiThings"), a France-based mobile virtual network operator providing intelligent global connectivity services to the IoT marketplace. These businesses have been integrated into our IoT services segment, which now also includes the operations of Numerex, described below.
Acquisition of Numerex
On December 7, 2017, in accordance with the terms of the Agreement and Plan of Merger (the "Merger Agreement"), dated as of August 2, 2017, we acquired all of the outstanding shares of Numerex in a stock-for-stock merger transaction (the "Transaction") whereby Numerex stockholders received a fixed exchange ratio of 0.18 common shares of Sierra Wireless for each share of Numerex common stock. On closing of the Transaction, Sierra Wireless issued 3,580,832 common shares as merger consideration in exchange for all of the outstanding shares of Numerex common stock and certain outstanding Numerex equity awards and warrants. Concurrent with closing, approximately $20.2 million in the aggregate was paid to retire outstanding Numerex debt for total consideration of $97.5 million.
Numerex is a provider of enterprise solutions enabling IoT deployments. Numerex’s solutions produce new revenue streams and create operating efficiencies for its customers. Numerex provides its technology and services through its integrated platforms, which are generally sold on a subscription basis. Numerex offers a portfolio of managed end-to-end IoT solutions including smart devices, network connectivity and service applications capable of addressing the needs of a wide spectrum of vertical markets and industrial customers. Numerex’s mission is to empower enterprise operations with world-class, managed IoT solutions that are simple, scalable, and secure. We expect the acquisition of Numerex to expand our position as a leading global IoT pure-play and significantly increase our subscription-based recurring services revenue.
Numerex is now a wholly owned subsidiary of Sierra Wireless and its operations are being integrated with those of our IoT Services segment. For the period from December 8, 2017 to December 31, 2017, the results of the operations of Numerex have been consolidated into the Company's results and the balance sheet of Numerex as at
7
December 31, 2017 is consolidated with the balance sheet of Sierra Wireless. Numerex contributed $3.1 million in revenue and incurred a $1.5 million operating loss during the period from December 8, 2017 to December 31, 2017.
Other Acquisitions in 2017
During the second quarter, we acquired the technology assets of Flow Search Corp. ("FlowThings"), a small start-up based in Brooklyn, New York for total cash consideration of $0.2 million. The assets acquired provide a data orchestration platform for rapid application development at the edge and in the cloud. We believe this platform and the hiring of the FlowThings research and development ("R&D") team will help strengthen our device-to-cloud offering and accelerate time-to-market for our customers.
On March 31, 2017, we completed the acquisition of substantially all of the assets of the GNSS embedded module business of GlobalTop Technology Inc. ("GlobalTop") for total cash consideration of $3.1 million. GlobalTop is a Taiwan-based business that specializes in the development and manufacture of a wide variety of embedded GNSS modules and serves OEM customers around the world. GlobalTop's products and technologies are complementary to our OEM Solutions portfolio. The acquisition builds on our strategy to expand our embedded solution portfolio for OEM customers in the key IoT markets we serve.
We continue to seek opportunities to acquire or invest in businesses, products and technologies that help us drive our strategy forward and expand our position in the IoT market.
Our Mission, Vision and Values
Our mission is to be the IoT partner of choice for wireless device-to-cloud solutions and our vision is to empower businesses to reimagine their future in the connected world. Our core values are:
• | Innovation: We develop intelligent wireless solutions based on superior technology that provides value to our customers. |
• | Execution: We deliver on our commitments together as a team, and focus on quality and excellence in everything we do. |
• | Trust: We are responsive and collaborative with our customers to help them grow their businesses. |
8
Our Strategy
The global IoT market is growing significantly and new IoT applications are helping people and organizations to increase productivity, save energy costs, create new business models and provide value-added services to their customers. An integral factor in the growth of IoT applications is cellular connectivity, which enables the transmission of data from connected devices and machines, through advanced mobile networks and cloud services, to the enterprise or consumer. Cellular connectivity supports applications such as the connected car, the connected enterprise and the connected factory, as well as smart cities and the smart grid. Adoption of IoT solutions is driven by a number of factors including lower wireless connectivity costs, higher wireless connection speeds, new wireless technologies designed specifically for the IoT, new tools to simplify application development and higher levels of focus on data analytics, artificial intelligence and machine learning.
We believe these factors will continue to create attractive growth opportunities for the Company going forward. Based on third-party industry research, we are the global leader in embedded cellular wireless modules with 30% global market share (source: ABI Research, September 2017) and we are widely recognized as an innovation leader in the cellular IoT sector as well. We are also a leading provider of gateway and router solutions for industrial, enterprise and mobile applications, ranking as the worldwide market leader in shipment volume (source: IHS Research, December 2017). We have developed an IoT services platform that is tightly integrated with our devices and connectivity services.
Our corporate strategy is to drive growth and value creation by:
• | Solidifying our leadership position in IoT devices; |
• | Leveraging our leading position in IoT devices to build and scale our device-to-cloud solutions business; and |
• | Building a scalable company with the right systems, processes and talent to support our growth. |
In 2017, we continued to deliver on our corporate strategy by:
• | Launching our first embedded cellular modules for the LPWA market; |
• | Securing many new customer wins with global OEMs and enterprises, which significantly expanded our customer program pipeline; |
• | Closing and/or integrating a number of acquisitions including Numerex, GlobalTop and Blue Creation; |
• | Delivering on our Smart SIM technology, which enables Sierra Wireless to deliver highly differentiated connectivity services; and |
• | Strengthening our broader organizational capability, including new leadership for our IoT Services segment and additional go-to-market resources to support our continued revenue growth. |
We continue to seek opportunities to acquire or invest in businesses, products and technologies that accelerate our strategy and growth.
9
Annual Overview — Financial Highlights
Our 2017 revenue was $692.1 million, up from $615.6 million in 2016. The increase in revenue was driven by solid year-over-year growth in each of our three reportable segments: our OEM Solutions segment experienced growth from automotive and enterprise customers (including mobile computing); our Enterprise Solutions segment revenues grew as a result of the acquired GenX business and the continuing ramp of new AirLink gateway and router products; and our IoT Services segment revenues grew as a result of subscriber expansion.
Gross margin was 33.9% in 2017 compared to 35.4% in 2016. In 2016, gross margin was favorably impacted by a change in estimate of our Intellectual Property ("IP") royalty accrual ("Change in Estimate") (see Royalty obligations under "Critical Accounting Policies and Estimates" below) and two legal settlements. On a comparable year-over-year basis these items added 210 basis points to gross margin in 2016 compared to 2017. In 2017, gross margin benefited from product cost reductions that were partially offset by unfavorable product mix.
Net earnings decreased in 2017 compared to the prior year due to the above mentioned Change in Estimate, higher operating expenses driven by growth in the business, the added cost structure of acquired businesses, transaction and integration costs associated with acquisitions and an asset impairment, partially offset by foreign exchange gains on balance sheet items and lower income taxes.
Foreign exchange rate changes in 2017 increased our foreign currency denominated revenue by $0.9 million and operating expenses by $1.6 million compared to 2016.
GAAP
• | Revenue increased by $76.5 million, or 12.4%, compared to 2016. |
• | Gross margin was 33.9%, down 150 basis points from 2016. |
• | Loss from operations was $0.4 million compared to earnings from operations of $21.3 million in 2016. |
• | Net earnings decreased by $11.3 million, or $0.35 per share, compared to 2016. |
• | Cash and cash equivalents were $65.0 million at the end of the year, down $37.8 million compared to December 31, 2016, primarily reflecting usage of cash for working capital, and acquisition-related activities which included approximately $20.2 million for retiring outstanding Numerex debt. |
Non-GAAP(1)
• | Gross margin was 34.0%, up 70 basis points from 2016 as a result of component cost savings and lower manufacturing costs, partially offset by unfavorable product mix within our Enterprise Solutions segment. |
• | Operating earnings increased by $9.1 million, or 30.0%, compared to 2016, as a result of higher revenue and gross margin, partially offset by higher operating expenses driven by growth in the business and the added cost structure of acquired businesses. |
• | Adjusted EBITDA increased by $10.3 million, or 23.4%, compared to 2016. |
• | Net earnings increased by $12.2 million, or 55.4%, compared to 2016, mainly driven by growth in the business and lower income taxes. |
(1)Non-GAAP financial measures exclude the impact of stock-based compensation expense and related social taxes, acquisition-related amortization, impairment, acquisition-related costs, integration costs, restructuring costs, certain other nonrecurring costs or recoveries, foreign exchange gains or losses on translation of balance sheet accounts, unrealized foreign exchange gains or losses on forward contracts and certain tax adjustments. Refer to the section titled "Non-GAAP Financial Measures" for additional details and reconciliations to the applicable GAAP financial measures.
10
Select Annual Financial Highlights
(1)Non-GAAP financial measures exclude the impact of stock-based compensation expense and related social taxes, acquisition-related amortization, impairment, acquisition-related costs, integration costs, restructuring costs, certain other nonrecurring costs or recoveries, foreign exchange gains or losses on translation of balance sheet accounts, unrealized foreign gains or losses on forward contracts and certain tax adjustments. Refer to the section titled "Non-GAAP Financial Measures" for additional details and reconciliations to the applicable GAAP financial measures.
11
Selected Annual Financial information:
(In thousands of U.S. dollars, except where otherwise stated) | 2017 | 2016 | 2015 | |||||||||
Statement of Operations data: | ||||||||||||
Revenue | $ | 692,077 | $ | 615,607 | $ | 607,798 | ||||||
Gross Margin | ||||||||||||
- GAAP | $ | 234,947 | $ | 217,743 | $ | 193,855 | ||||||
- Non-GAAP (1) | 235,431 | 205,118 | 194,502 | |||||||||
Gross Margin % | ||||||||||||
- GAAP | 33.9 | % | 35.4 | % | 31.9 | % | ||||||
- Non-GAAP (1) | 34.0 | % | 33.3 | % | 32.0 | % | ||||||
Earnings (loss) from operations | ||||||||||||
- GAAP | $ | (359 | ) | $ | 21,348 | $ | 10,114 | |||||
- Non-GAAP (1) | 39,177 | 30,127 | 32,361 | |||||||||
Adjusted EBITDA | $ | 54,194 | $ | 43,919 | $ | 42,911 | ||||||
Net earnings (loss) | ||||||||||||
- GAAP | $ | 4,135 | $ | 15,385 | $ | (2,674 | ) | |||||
- Non-GAAP (1) | 34,136 | 21,969 | 25,774 | |||||||||
Revenue by Segment: | ||||||||||||
OEM Solutions | $ | 555,887 | $ | 516,517 | $ | 523,366 | ||||||
Enterprise Solutions | 101,535 | 71,486 | 63,072 | |||||||||
IoT Services | 34,655 | 27,604 | 21,360 | |||||||||
Share and per share data: | ||||||||||||
Basic and diluted earnings (loss) per share (in dollars) | ||||||||||||
- GAAP | $ | 0.13 | $ | 0.48 | $ | (0.08 | ) | |||||
- Non-GAAP (1) | $ | 1.04 | $ | 0.68 | $ | 0.80 | ||||||
Common shares (in thousands) | ||||||||||||
At period-end | 35,862 | 31,860 | 32,337 | |||||||||
Weighted average - basic | 32,356 | 32,032 | 32,166 | |||||||||
Weighted average - diluted | 32,893 | 32,335 | 32,166 | |||||||||
Balance sheet data (end of period): | ||||||||||||
Cash and cash equivalents | $ | 65,003 | $ | 102,772 | $ | 93,936 | ||||||
Total assets | 689,106 | 578,459 | 546,332 | |||||||||
Total long-term obligations | 36,637 | 32,654 | 44,353 | |||||||||
(1)Non-GAAP financial measures exclude the impact of stock-based compensation expense and related social taxes, acquisition-related amortization, impairment, acquisition-related costs, integration costs, restructuring costs, certain other nonrecurring costs or recoveries, foreign exchange gains or losses on translation of balance sheet accounts, unrealized foreign exchange gains or losses on forward contracts and certain tax adjustments. Refer to the section titled "Non-GAAP Financial Measures" for additional details and reconciliations to the applicable GAAP financial measures.
See discussion under “Consolidated Annual Results of Operations” for factors that have caused period to period variations.
12
Key highlights for the year ended December 31, 2017:
• | We entered into a joint business relationship with PwC Canada to help enterprises around the world develop and launch transformative IoT services and new business models. |
OEM Solutions
• | Volkswagen selected our AirPrime AR Series modules with our Legato embedded software platform for its next generation of connected cars. Our automotive solutions will deliver high-speed cellular connectivity for the Volkswagen Car-Net platform. |
• | We were recently selected by Nauto, Inc. ("Nauto") as the wireless connectivity solution for the North American launch of Nauto's flagship artificial intelligence-powered auto network. |
• | We launched the world's first 'plug-and-play' cellular modules and routers with pre-integrated global connectivity, IoT operation management and security. |
• | We delivered early modules for Telstra Corporation Limited's upcoming LTE Cat-M1 network to Landis+Gyr, enabling their industry-first live Cat-M1 smart meter trial. |
• | We announced one of the industry's first global, dual-mode LPWA cellular modules. Our AirPrime WP77 smart wireless modules simplify LPWA deployments for customers developing products that need to seamlessly connect to different LPWA technologies. |
• | In collaboration with industry leaders and developers, we announced mass-market availability of the mangOH Red open-source hardware platform to drive the next phase of IoT commercialization. |
• | We announced the industry's first global LTE-Advanced Pro cellular modules, enabling the world's fastest IoT applications for the mobile computing, networking, and industrial segments. |
• | We announced the BX Series Wi-Fi and Bluetooth combo modules with built-in cloud services and security features. The AirPrime BX Series now provides AirVantage cloud services and secure boot in our CF3 form factor to enable scalable Wi-Fi/Bluetooth solutions optimized for industrial IoT applications. |
• | Testing is underway for our next-generation Narrowband IoT ("NB-IoT") embedded cellular modules which are expected to be certified for T-Mobile's NB IoT network in early 2018. |
• | Recently, our mangOH Red open source hardware platform has been recognized with the IoT Breakthrough Award for IoT Development Tool of the Year. |
• | We announced the industry's smallest, lowest power, multi-mode LPWA cellular modules targeted at rapidly growing markets in asset tracking and connected industrial equipment, smart city, healthcare, agriculture and wearables. |
Enterprise Solutions
• | We announced that our industry-leading AirLink MP70 LTE-Advanced vehicle routers now support the most advanced, integrated vehicle telemetry, inertial navigation, and driver behavior features to improve fleet operations and vehicle maintenance. |
• | We signed a distribution agreement with Ingram Micro Inc., one of the largest technology distributors in the world. Through this agreement, Ingram Micro is authorized to distribute our complete AirLink |
13
portfolio of networking solutions, including cellular routers, gateways, and management services to its channel partners in the United States.
• | We announced the release of the AirLink Connection Manager (ACM) 2.0 VPN appliance for vehicle networking use cases. |
IoT Services
• | We announced support for Google Cloud IoT Core, a fully managed service that allows users to easily and securely connect and manage devices at global scale, through integration of our AirVantage IoT Platform with Google Could services. |
• | We announced that Nube has selected our device-to-cloud IoT solution and Microsoft Azure Cloud Services to reinvent consumer gas delivery. |
Outlook
In the first quarter of 2018, we expect revenue to be in the range of $181 million to $189 million and non-GAAP earnings per share to be in the range of $0.04 to $0.10. Our guidance for the first quarter of 2018 includes a full quarter of Numerex following the acquisition of the company on December 7, 2017. We expect the first quarter of 2018 to be impacted by some unusual and mainly non-recurring items, including higher one-time costs related to a Numerex network upgrade and customer migration, and tight component supply constraining revenue and adding to cost of goods sold.
Additionally, with the integration of Numerex, we have commenced various efficiency and effectiveness initiatives. These initiatives are focused on capturing synergies as we integrate Numerex and efficiency gains in other areas of our business. The initiatives being undertaken are expected to reduce cost of goods sold, as well as on-going operating expenses. As a result of implementing these initiatives, we are targeting a quarterly non-GAAP operating expense run rate of $56.5 million in the fourth quarter of 2018, down from approximately $59 million in non-GAAP operating expense that is included in our guidance for the first quarter of 2018. We expect these initiatives will result in a one-time non-GAAP restructuring charge of approximately $4.5 million.
We believe that the market for wireless IoT solutions has strong long-term growth prospects. We anticipate strong long-term growth in the number of devices being wirelessly connected, driven by key enablers, such as lower wireless connectivity costs, faster wireless connection speeds, new wireless technologies designed specifically for the IoT, new devices and tools to simplify the development of IoT applications, and increased focus and investment from large ecosystem players. More importantly, we see emerging customer demand in many of our target verticals driven by increasing recognition of the value created by deploying IoT solutions, such as new revenue streams and cost efficiencies.
14
Key factors that we expect will affect our results in the near term are:
• | the strength of our competitive position in the market; |
• | the timely ramp up of sales of our new products recently launched or currently under development; |
• | our ability to integrate Numerex's business, operations and workforce with ours and our ability to return the Numerex business to profitable growth and to realize the anticipated benefits of the acquisition; |
• | contributions to our operating results from the other acquisitions we completed in 2015, 2016 and 2017; |
• | the level of success our customers achieve with sales of connected solutions; |
• | fluctuations in customer demand and inventory levels, particularly large customers; |
• | our ability to manage component supply issues when they arise; |
• | our ability to attract and retain effective channel partners; |
• | the timely launch and ramp up of new customer programs; |
• | our ability to secure future design wins with both existing and new customers; |
• | the end-of-life of existing customer programs; |
• | manufacturing capacity at our various manufacturing sites; |
• | our ability to manage component and product quality compliance; |
• | fluctuations in foreign exchange rates; |
• | general economic conditions in the markets we serve; and |
• | seasonality in demand. |
We expect that product and price competition from other wireless device manufacturers and solution providers will continue to play a role in the IoT market. As a result of these factors, we may experience volatility in our results on a quarter-to-quarter basis. Gross margin percentage may fluctuate from quarter-to-quarter depending on product and customer mix, average selling prices and product costs.
See "Cautionary Note Regarding Forward-Looking Statements".
15
CONSOLIDATED ANNUAL RESULTS OF OPERATIONS
(In thousands of U.S. dollars, except where otherwise stated) | 2017 | 2016 | 2015 | |||||||||||||||||
$ | % of Revenue | $ | % of Revenue | $ | % of Revenue | |||||||||||||||
Revenue | 692,077 | 100.0 | % | 615,607 | 100.0 | % | 607,798 | 100.0 | % | |||||||||||
Cost of goods sold | 457,130 | 66.1 | % | 397,864 | 64.6 | % | 413,943 | 68.1 | % | |||||||||||
Gross margin | 234,947 | 33.9 | % | 217,743 | 35.4 | % | 193,855 | 31.9 | % | |||||||||||
Expenses | ||||||||||||||||||||
Sales and marketing | 75,594 | 10.9 | % | 64,242 | 10.4 | % | 54,144 | 8.9 | % | |||||||||||
Research and development | 83,361 | 12.0 | % | 73,077 | 11.9 | % | 74,020 | 12.2 | % | |||||||||||
Administration | 42,904 | 6.2 | % | 40,956 | 6.7 | % | 40,321 | 6.6 | % | |||||||||||
Restructuring | 1,076 | 0.2 | % | — | — | % | 951 | 0.2 | % | |||||||||||
Acquisition-related and integration | 8,195 | 1.2 | % | 843 | 0.1 | % | 1,945 | 0.3 | % | |||||||||||
Impairment | 3,668 | 0.5 | % | — | — | % | — | — | % | |||||||||||
Amortization | 20,508 | 3.0 | % | 17,277 | 2.8 | % | 12,360 | 2.0 | % | |||||||||||
235,306 | 34.0 | % | 196,395 | 31.9 | % | 183,741 | 30.2 | % | ||||||||||||
Earnings (loss) from operations | (359 | ) | (0.1 | )% | 21,348 | 3.5 | % | 10,114 | 1.7 | % | ||||||||||
Foreign exchange gain (loss) | 7,550 | (1,736 | ) | (11,843 | ) | |||||||||||||||
Other income | 67 | 83 | 115 | |||||||||||||||||
Earnings (loss) before income taxes | 7,258 | 19,695 | (1,614 | ) | ||||||||||||||||
Income tax expense | 3,123 | 4,310 | 1,060 | |||||||||||||||||
Net earnings (loss) | 4,135 | 15,385 | (2,674 | ) | ||||||||||||||||
Net earnings (loss) per share - basic and diluted (in dollars) | 0.13 | 0.48 | (0.08 | ) | ||||||||||||||||
16
Fiscal Year 2017 Compared to Fiscal Year 2016
Revenue
Revenue increased by $76.5 million, or 12.4%, in 2017 compared to 2016. The increase was driven by contributions from each of our three reportable segments which all experienced solid year-over-year growth:
• | OEM Solutions experienced notable year-over-year increases in automotive and enterprise segment module sales; |
• | Enterprise Solutions experienced a strong contribution from fleet management products and other mobile and industrial gateway products; and |
• | IoT Services experienced solid subscriber additions and contribution from Numerex which was acquired late in the year. |
Our geographic revenue mix for the years ended December 31, 2017 and 2016 was as follows:
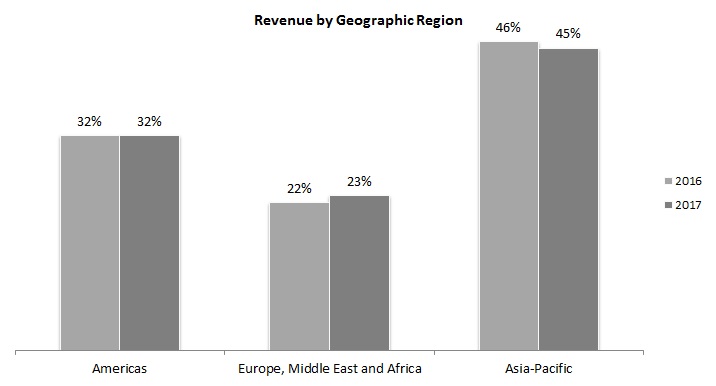
During the years ended December 31, 2017 and 2016, no customer accounted for more than 10% of our aggregated revenue.
Gross margin
Gross margin was 33.9% of revenue in 2017, compared to 35.4% in 2016. In 2016 gross margin was favorably impacted by the Change in Estimate and two legal settlements. On a comparable year-over-year basis these items added 210 basis points to gross margin in 2016 compared to 2017. In 2017, gross margin benefited from product cost reductions that were partially offset by unfavorable product mix. Gross margin included stock-based compensation expense and related social taxes of $0.5 million and $0.4 million in 2017 and 2016, respectively.
Sales and marketing
Sales and marketing expenses increased by $11.4 million, or 17.7%, in 2017, compared to 2016, primarily as a result of targeted investments in our go-to-market capabilities to drive growth, costs added as a result of acquisitions and the unfavorable impact of foreign exchange. Sales and marketing expenses included stock-based compensation and related social taxes of $2.5 million in 2017, compared to $1.7 million in 2016.
Research and development
R&D expenses increased by $10.3 million, or 14.1%, in 2017, compared to 2016. The increase in R&D expenses was primarily due to costs associated with new product development programs, the unfavorable impact of foreign exchange and additional expenses added as a result of acquisitions.
17
R&D expenses included stock-based compensation and related social taxes of $2.0 million in 2017, compared to $1.4 million in 2016. R&D expenses also included acquisition-related amortization of $0.4 million in 2017, compared to $0.5 million in 2016.
Administration
Administration expenses increased by $1.9 million, or 4.8%, in 2017, compared to 2016, primarily due to higher stock-based compensation expense and the unfavorable impact of foreign exchange, partially offset by lower bad debt expense. Administration expenses included stock-based compensation expense and related social taxes of $5.3 million in 2017, compared to $4.1 million in 2016.
Restructuring
Restructuring costs were $1.1 million in 2017. These costs are related to the relocation of our IoT Services customer support operations from Sweden to France and the United States.
Acquisition-related and integration
Acquisition-related and integration costs increased by $7.4 million in 2017, compared to 2016. The increase was primarily due to the acquisition of Numerex, integration activities and higher accruals of acquisition-related contingent consideration.
Impairment
We recorded an impairment of $3.7 million related to an intangible asset recorded on the acquisition of Maingate. The resulting change, which was recorded in the first quarter of 2017, was due to the decision to terminate a service offering that has now been superseded by a more technologically advanced offering in our integrated IoT Services business.
Amortization
Amortization expense increased by $3.2 million, or 18.7%, in 2017, compared to 2016 primarily due to higher acquisition-related amortization. Amortization expense in 2017 included $15.1 million of acquisition-related amortization compared to $11.6 million in 2016.
Foreign exchange gain (loss)
Foreign exchange gain was $7.6 million in 2017, compared to a loss of $1.7 million in 2016. This gain was primarily the result of an increase in the value of the Euro compared to the U.S. dollar.
Income tax expense (recovery)
Income tax expense was $3.1 million in 2017, compared to $4.3 million in 2016. This decrease was due to a recovery related to the impairment charge in the first quarter of 2017 and a shift of earnings between jurisdictions.
Net earnings (loss)
Net earnings were $4.1 million in 2017, compared to $15.4 million in 2016. The decrease of $11.3 million in net earnings reflects decreased earnings from operations as a result of higher operating expenses driven by growth in the business, the added cost structure of acquired businesses, transaction and integration costs associated with acquisitions and an asset impairment, partially offset by foreign exchange gains on balance sheet items and lower income tax expense.
Net earnings in 2017 included stock-based compensation expense and related social taxes of $10.4 million and acquisition-related amortization of $15.1 million. Net earnings in 2016 included stock-based compensation expense and related social taxes of $7.6 million and acquisition-related amortization of $12.1 million.
18
Weighted average number of shares
The weighted average basic and diluted shares outstanding were 32.4 million and 32.9 million, respectively, for the year ended December 31, 2017 and 32.0 million and 32.3 million for the year ended December 31, 2016.
The number of shares outstanding was 35.9 million at December 31, 2017, compared to 31.9 million at December 31, 2016. The increase in the number of shares outstanding was primarily due to the shares issued for the acquisition of Numerex.
Fiscal Year 2016 Compared to Fiscal Year 2015
Revenue
Revenue increased by $7.8 million, or 1.3%, in 2016 compared to 2015. The increase was mainly driven by contributions from businesses acquired in 2016 and 2015 and higher revenues from our new Enterprise gateway products, partially offset by weaker revenues in our OEM Solutions segment.
Our geographic revenue mix for the years ended December 31, 2016 and 2015 was as follows:
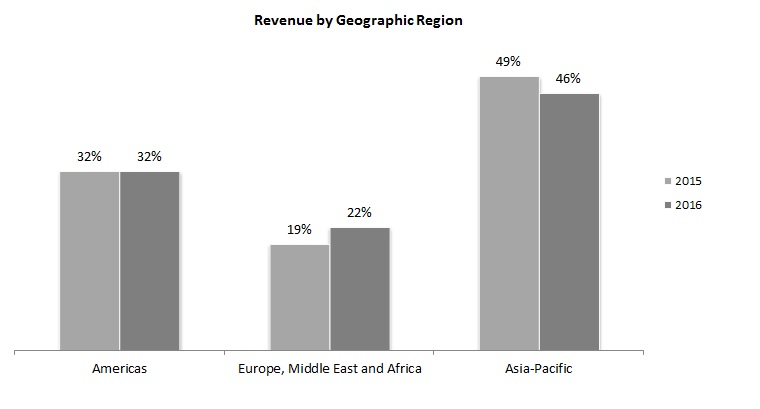
During the years ended December 31, 2016 and 2015, no customer accounted for more than 10% of our aggregated revenue.
Gross margin
Gross margin was 35.4% of revenue in 2016, compared to 31.9% in 2015. The significant increase in gross margin was due to the favorable impact on cost of goods sold of the Change in Estimate, product cost reductions in our OEM Solutions segment, improved margins in our Enterprise Solutions segment and the favorable impact of cost recoveries as a result of two legal settlements received in the first half of 2016. Gross margin included stock-based compensation expense and related social taxes of $0.4 million and $0.6 million in 2016 and 2015, respectively.
Sales and marketing
Sales and marketing expenses increased $10.1 million, or 18.7%, in 2016, compared to 2015, primarily as a result of targeted investments to strengthen our go-to-market capability and costs added as a result of the acquisitions undertaken in 2015 and 2016. Sales and marketing expenses included stock-based compensation and related social taxes of $1.7 million in 2016, compared to $2.2 million in 2015.
19
Research and development
R&D expenses decreased by $0.9 million, or 1.3%, in 2016, compared to 2015. The decrease in R&D expenses was primarily due to lower costs related to development parts and certification fees, lower acquisition-related amortization costs and the favorable impact of foreign exchange. This was partially offset by higher compensation costs and additional expenses associated with acquired businesses.
R&D expenses included stock-based compensation and related social taxes of $1.4 million in 2016, compared to $1.5 million in 2015. R&D expenses also included acquisition-related amortization of $0.5 million in 2016, compared to $1.3 million in 2015.
Administration
Administration expenses increased by $0.6 million, or 1.6%, in 2016, compared to 2015, primarily due to higher compensation costs, including certain termination expenses, partially offset by lower professional fees, stock-based compensation expense and the favorable impact of foreign exchange. Administration expenses included stock-based compensation expense and related social taxes of $4.1 million in 2016, compared to $5.3 million in 2015.
Restructuring
Restructuring costs were $nil in 2016. Restructuring costs in 2015 were related to the implementation of a plan to realign responsibilities within our Enterprise Solutions segment to reflect the evolution of our business and to provide dedicated focus on our enterprise gateways and recently acquired IoT services businesses.
Acquisition-related and integration
Acquisition-related and integration costs decreased by $1.1 million in 2016, compared to 2015. The decrease was primarily due to the lower level of acquisition and integration activities and a decrease in the fair value of acquisition-related contingent consideration.
Amortization
Amortization expense increased by $4.9 million, or 39.8%, in 2016, compared to 2015 primarily due to higher acquisition-related amortization driven by the acquisitions undertaken in 2015 and reflects a change in the estimate of the useful life of some of our assets, including assets related to our office relocation in France. Amortization expense in 2016 included $11.6 million of acquisition-related amortization compared to $8.4 million in 2015.
Foreign exchange gain (loss)
Foreign exchange loss was $1.7 million in 2016, compared to a loss of $11.8 million in 2015. The foreign exchange loss in 2015 included the impact of an unrealized loss of $6.2 million on revaluation of a Euro denominated loan ("Intercompany Loan") to a self-sustaining subsidiary. We classified the Intercompany Loan as a net investment in a foreign subsidiary in the second quarter of 2015 when we determined the loan was permanent. As a result, the foreign exchange gain or loss from revaluation of the Intercompany Loan, since that time, is being recognized in other comprehensive income.
Income tax expense (recovery)
Income tax expense was $4.3 million in 2016, compared to $1.1 million in 2015. The additional expense was due to higher earnings and the impact of a shift of earnings between jurisdictions.
Net earnings (loss)
Net earnings were $15.4 million in 2016, compared to a net loss of $2.7 million in 2015. The increase in net earnings reflects improved earnings from operations as a result of the Change in Estimate and lower foreign exchange losses partially offset by higher income tax expenses.
20
Net earnings in 2016 included stock-based compensation expense and related social taxes of $7.6 million and acquisition-related amortization of $12.1 million. Net loss in 2015 included stock-based compensation expense and related social taxes of $9.7 million and acquisition-related amortization of $9.7 million.
Weighted average number of shares
The weighted average basic and diluted shares outstanding were 32.0 million and 32.3 million, respectively, for the year ended December 31, 2016 and 32.2 million for the year ended December 31, 2015.
The number of shares outstanding was 31.9 million at December 31, 2016, compared to 32.3 million at December 31, 2015. The decrease in the number of shares outstanding was primarily due to the impact of share repurchases made under our Normal Course Issuer Bid ("NCIB") program (refer to "Liquidity and Capital Resources" section below), partially offset by issuance of common shares as a result of stock option exercises and restricted share unit releases.
SEGMENTED INFORMATION
OEM Solutions
% change | ||||||||||||||||||
(In thousands of U.S. dollars, except where otherwise stated) | 2017 | 2016 | 2015 | 2017 vs 2016 | 2016 vs 2015 | |||||||||||||
Revenue | $ | 555,887 | $ | 516,517 | $ | 523,366 | 7.6 | % | (1.3 | )% | ||||||||
Cost of goods sold | 384,872 | 349,921 | 371,559 | 10.0 | % | (5.8 | )% | |||||||||||
Gross margin | $ | 171,015 | $ | 166,596 | $ | 151,807 | 2.7 | % | 9.7 | % | ||||||||
Gross margin % | 30.8 | % | 32.3 | % | 29.0 | % | ||||||||||||
Non-GAAP (1) | ||||||||||||||||||
Gross Margin | $ | 171,402 | $ | 154,988 | $ | 152,368 | 10.6 | % | 1.7 | % | ||||||||
Gross Margin % | 30.8 | % | 30.0 | % | 29.1 | % | ||||||||||||
(1) See section titled "Non-GAAP Financial Measures" for additional details and a reconciliation to the applicable GAAP financial measure.
Fiscal Year 2017 compared to 2016
Revenue increased by $39.4 million, or 7.6%, in 2017, compared to 2016. This increase was primarily due to strong demand from automotive and enterprise customers and programs.
In 2016, gross margin was favorably impacted by the Change in Estimate and a legal settlement. On a comparable year over year basis these items added 190 basis points to gross margin in 2016 compared to 2017. In 2017, gross margin benefited from product cost reductions that were partially offset by unfavorable product mix.
Our non-GAAP gross margin percentage of 30.8% increased in comparison to 2016 reflecting the impact of cost reduction programs, including lower manufacturing and component costs, partially offset by unfavorable product mix principally driven by the ramp up of a new high volume automotive program at lower gross margin which replaced an existing program that went end of life.
21
Fiscal Year 2016 compared to 2015
Revenue decreased by $6.8 million, or 1.3%, in 2016, compared to 2015. This decrease was primarily due to demand softness from certain established customers and programs, partially offset by contribution from new programs.
Higher gross margin percentage in 2016 compared to the prior year reflects a $12.9 million reduction of cost of goods sold, representing the portion of the Change in Estimate that is attributable to our OEM Solutions segment. In addition, our cost reduction initiatives during the year, together with the reimbursement of $1.9 million in certain legal costs pursuant to a favorable arbitration decision on a contract dispute with an IP licensor, of which $1.7 million was attributable to our OEM Solutions segment, also had a positive impact on the gross margin.
Our non-GAAP gross margin percentage of 30.0% excludes $11.7 million of the Change in Estimate attributable to OEM Solutions related to the one-time reduction in our accrued royalties obligations effective October 1, 2016. The $1.2 million balance of the Change in Estimate attributable to the OEM Solutions segment is included in non-GAAP gross margin as it relates to products sold during the fourth quarter of 2016.
Enterprise Solutions
% change | ||||||||||||||||||
(In thousands of U.S. dollars, except where otherwise stated) | 2017 | 2016 | 2015 | 2017 vs 2016 | 2016 vs 2015 | |||||||||||||
Revenue | $ | 101,535 | $ | 71,486 | $ | 63,072 | 42.0 | % | 13.3 | % | ||||||||
Cost of goods sold | 53,014 | 31,537 | 29,945 | 68.1 | % | 5.3 | % | |||||||||||
Gross margin | $ | 48,521 | $ | 39,949 | $ | 33,127 | 21.5 | % | 20.6 | % | ||||||||
Gross margin % | 47.8 | % | 55.9 | % | 52.5 | % | ||||||||||||
Non-GAAP (1) | ||||||||||||||||||
Gross Margin | $ | 48,593 | $ | 38,913 | $ | 33,192 | 24.9 | % | 17.2 | % | ||||||||
Gross Margin % | 47.9 | % | 54.4 | % | 52.6 | % | ||||||||||||
(1) See section titled "Non-GAAP Financial Measures" for additional details and a reconciliation to the applicable GAAP financial measure.
Fiscal Year 2017 compared to 2016
Revenue increased by $30.0 million, or 42.0%, in 2017, compared to 2016 mainly driven by revenue from fleet management products acquired from GenX in 2016 and the growth in sales of gateway products, including the RV50 and MG90, which were launched in the latter half of 2016 and ramped up during 2017.
Gross margin percentage decreased in 2017 in comparison to 2016. In 2016, gross margin was favorably impacted by the Change in Estimate and two legal settlements. On a comparable year over year basis these items added 390 basis points to gross margin in 2016 compared to 2017. In 2017, gross margin percentage was unfavorably impacted by the inclusion of lower margin fleet management revenues from GenX, partially offset by product cost reductions.
Our non-GAAP gross margin percentage of 47.9% decreased in comparison to 2016 because of the unfavorable product mix noted above.
22
Fiscal Year 2016 compared to 2015
Revenue increased by $8.4 million, or 13.3%, in 2016, compared to 2015 mainly driven by revenue from the acquisition of GenX and the impact of new AirLink gateway product introductions in 2016.
Gross margin increased in 2016, reflecting a $1.5 million reduction of cost of goods sold, representing the portion of the Change in Estimate that is attributable to our Enterprise Solutions segment. In addition, a $1.9 million recovery from a legal settlement with a supplier related to a component quality issue received in the first quarter of 2016 and improved product mix resulting from increased sales of higher margin gateway products, also had a positive impact on our Enterprise Solutions segment gross margin.
Our non-GAAP gross margin percentage of 54.4% excludes $1.3 million of the Change in Estimate attributable to Enterprise Solutions related to the one-time reduction in our accrued royalties obligations effective October 1, 2016. The $0.2 million balance of the Change in Estimate attributable to the Enterprise Solutions segment is included in non-GAAP gross margin as it relates to products sold during the fourth quarter of 2016.
IoT Services
% change | ||||||||||||||||||
(In thousands of U.S. dollars, except where otherwise stated) | 2017 | 2016 | 2015 | 2017 vs 2016 | 2016 vs 2015 | |||||||||||||
Revenue | $ | 34,655 | $ | 27,604 | $ | 21,360 | 25.5 | % | 29.2 | % | ||||||||
Cost of goods sold | 19,244 | 16,406 | 12,439 | 17.3 | % | 31.9 | % | |||||||||||
Gross margin | $ | 15,411 | $ | 11,198 | $ | 8,921 | 37.6 | % | 25.5 | % | ||||||||
Gross margin % | 44.5 | % | 40.6 | % | 41.8 | % | ||||||||||||
Non-GAAP (1) | ||||||||||||||||||
Gross Margin | $ | 15,436 | $ | 11,217 | $ | 8,942 | 37.6 | % | 25.4 | % | ||||||||
Gross Margin % | 44.5 | % | 40.6 | % | 41.9 | % | ||||||||||||
(1) See section titled "Non-GAAP Financial Measures" for additional details and a reconciliation to the applicable GAAP financial measure.
Fiscal Year 2017 compared to 2016
Revenue increased by $7.1 million, or 25.5%, in 2017, compared to 2016 as a result of continuing subscriber growth and the inclusion of Numerex revenue which was acquired late in the year.
Gross margin increased in 2017 due to favorable mix from cloud and connectivity services and the fact that there were several one-time charges to cost of sales in 2016 that reduced gross margin compared to 2017.
Fiscal Year 2016 compared to 2015
Revenue increased by $6.2 million, or 29.2%, in 2016, compared to 2015 mainly as a result of the inclusion of a full year of revenue resulting from the acquisitions of Maingate, MobiquiThings and Accel in 2015.
Gross margin percentage was slightly lower in 2016 due to the increased revenue impact of Accel's broadband services, which have gross margins that are lower than the average gross margin for IoT Services.
23
FOURTH QUARTER OVERVIEW
Consolidated Results of Operations:
Three months ended December 31, | ||||||||||||||
(in thousands of U.S. dollars, except where otherwise stated) | 2017 | 2016 | ||||||||||||
% of | % of | |||||||||||||
$ | Revenue | $ | Revenue | |||||||||||
Revenue | 183,533 | 100.0 | % | 163,021 | 100.0 | % | ||||||||
Cost of goods sold | 121,719 | 66.3 | % | 94,225 | 57.8 | % | ||||||||
Gross margin | 61,814 | 33.7 | % | 68,796 | 42.2 | % | ||||||||
Expenses | ||||||||||||||
Sales and marketing | 20,456 | 11.2 | % | 17,048 | 10.4 | % | ||||||||
Research and development | 21,828 | 11.9 | % | 18,047 | 11.1 | % | ||||||||
Administration | 11,379 | 6.2 | % | 9,708 | 6.0 | % | ||||||||
Restructuring | 245 | 0.1 | % | — | — | % | ||||||||
Acquisition-related and integration | 4,792 | 2.6 | % | 376 | 0.2 | % | ||||||||
Amortization | 6,073 | 3.3 | % | 4,372 | 2.7 | % | ||||||||
64,773 | 35.3 | % | 49,551 | 30.4 | % | |||||||||
Earnings (loss) from operations | (2,959 | ) | (1.6 | )% | 19,245 | 11.8 | % | |||||||
Foreign exchange gain (loss) | 1,267 | (3,547 | ) | |||||||||||
Other income | 38 | 2 | ||||||||||||
Earnings (loss) before income taxes | (1,654 | ) | 15,700 | |||||||||||
Income tax expense (recovery) | 1,876 | (18 | ) | |||||||||||
Net earnings (loss) | (3,530 | ) | 15,718 | |||||||||||
Net earnings (loss) per share - Basic and diluted (in dollars) | (0.11 | ) | 0.49 | |||||||||||
GAAP:
• | In the fourth quarter of 2017, revenue increased by $20.5 million, or 12.6%, compared to the same period of 2016 primarily as a result of higher sales of telematics devices, gateways and routers, module sales to automotive and enterprise customers and a contribution from Numerex, which we acquired on December 7, 2017. |
• | Gross margin was 33.7% in the fourth quarter of 2017, which represents a more normalized level compared to the same period of 2016 when gross margin of 42.2% was favorably impacted as a result of a $13.0 million (800 basis point) reduction of cost of goods sold as a result of the Change in Estimate effective October 1, 2016. In the fourth quarter of 2017, gross margin was slightly lower than the normalized 2016 gross margin due to unfavorable mix in our OEM segment driven by the ramp up of a new high volume automotive program at lower gross margin which replaced a previous program and in our Enterprise segment driven by lower gross margin from telematics products, partially offset by favorable mix due to a larger IoT Services contribution. |
• | Earnings from operations decreased by $22.2 million in the fourth quarter of 2017 compared to the fourth quarter of 2016 as a result of lower gross margin, higher operating expenses as a result of continued targeted investments in our go-to-market capabilities, the impact of unfavorable foreign exchange on operating expenses and added costs as a result of recent acquisitions. |
24
• | Net earnings decreased by $19.2 million in the fourth quarter of 2017, compared to the fourth quarter of 2016. Lower operating income in the fourth quarter of 2017 was partially offset by foreign exchange gains on balance sheet items, partially offset by higher income tax expense. |
• | Cash and cash equivalents at the end of the fourth quarter of 2017 were $65.2 million, a decrease of $9.0 million compared to $74.2 million at the end of the third quarter of 2017. The decrease in cash was mainly due to the acquisition of Numerex and capital expenditures, partially offset by cash flows from operating activities. |
NON-GAAP(1):
• | Gross margin was 33.8% in the fourth quarter of 2017, compared to 34.3% in the fourth quarter of 2016. The decrease in gross margin was primarily attributable to the impact of unfavorable mix in our OEM segment driven by the ramp up of a new high volume automotive program at lower gross margin which replaced a previous program that went end of life and lower gross margin from telematics products in our Enterprise segment, partially offset by favorable mix due to a larger IoT Services contribution. |
• | Earnings from operations decreased by $2.3 million compared to the fourth quarter of 2016 due to higher operating expenses, partially offset by higher revenues and gross margin. |
• | Adjusted EBITDA decreased by $1.5 million compared to the fourth quarter of 2016. This decrease mainly reflects lower earnings from operations and higher amortization expense in the fourth quarter of 2017. |
• | Net earnings increased by $0.4 million, compared to the fourth quarter of 2016. This increase was mainly due to lower income tax expense partially offset by the lower earnings from operations. |
(1)Non-GAAP financial measures exclude the impact of stock-based compensation expense and related social taxes, acquisition-related amortization, impairment, acquisition-related costs, integration costs, restructuring costs, certain other nonrecurring costs or recoveries, foreign exchange gains or losses on translation of balance sheet accounts, unrealized foreign exchange gains or losses on forward contracts and certain tax adjustments. Refer to the section titled "Non-GAAP Financial Measures" for additional details and reconciliations to the applicable GAAP financial measures.
25
SUMMARY OF QUARTERLY RESULTS OF OPERATIONS
The following tables highlight selected financial information for each of the eight most recent quarters that, in management’s opinion, have been prepared on a basis consistent with the audited consolidated financial statements for the year ended December 31, 2017. The selected financial information presented below reflects all adjustments, consisting primarily of normal recurring adjustments, which are, in the opinion of management, necessary for a fair presentation of results for the interim periods. These results are not necessarily indicative of results for any future period. You should not rely on these results to predict future performance.
(In thousands of U.S. dollars, except where otherwise stated) | 2017 | 2016 | |||||||||||||||||||||||||||||||
Q4 | Q3 | Q2 | Q1 | Q4 | Q3 | Q2 | Q1 | ||||||||||||||||||||||||||
Revenue | $ | 183,533 | $ | 173,241 | $ | 173,510 | $ | 161,793 | $ | 163,021 | $ | 153,560 | $ | 156,229 | $ | 142,797 | |||||||||||||||||
Cost of goods sold | 121,719 | 115,466 | 113,813 | 106,132 | 94,225 | 104,192 | 103,465 | 95,982 | |||||||||||||||||||||||||
Gross margin | 61,814 | 57,775 | 59,697 | 55,661 | 68,796 | 49,368 | 52,764 | 46,815 | |||||||||||||||||||||||||
Gross margin % | 33.7 | % | 33.3 | % | 34.4 | % | 34.4 | % | 42.2 | % | 32.1 | % | 33.8 | % | 32.8 | % | |||||||||||||||||
Expenses | |||||||||||||||||||||||||||||||||
Sales and marketing | 20,456 | 18,127 | 18,844 | 18,167 | 17,048 | 15,519 | 16,046 | 15,629 | |||||||||||||||||||||||||
Research and development | 21,828 | 21,525 | 20,531 | 19,477 | 18,047 | 18,015 | 18,237 | 18,778 | |||||||||||||||||||||||||
Administration | 11,379 | 10,560 | 10,579 | 10,386 | 9,708 | 11,435 | 10,286 | 9,527 | |||||||||||||||||||||||||
Restructuring | 245 | 199 | 259 | 373 | — | — | — | — | |||||||||||||||||||||||||
Acquisition-related and integration | 4,792 | 2,077 | 875 | 451 | 376 | 34 | 59 | 374 | |||||||||||||||||||||||||
Impairment | — | — | — | 3,668 | — | — | — | — | |||||||||||||||||||||||||
Amortization | 6,073 | 5,049 | 4,760 | 4,626 | 4,372 | 4,418 | 4,725 | 3,762 | |||||||||||||||||||||||||
64,773 | 57,537 | 55,848 | 57,148 | 49,551 | 49,421 | 49,353 | 48,070 | ||||||||||||||||||||||||||
Earnings (loss) from operations | (2,959 | ) | 238 | 3,849 | (1,487 | ) | 19,245 | (53 | ) | 3,411 | (1,255 | ) | |||||||||||||||||||||
Foreign exchange gain (loss) | 1,267 | 1,667 | 3,517 | 1,099 | (3,547 | ) | 590 | (1,071 | ) | 2,292 | |||||||||||||||||||||||
Other income (expense) | 38 | 32 | (12 | ) | 9 | 2 | 23 | 32 | 26 | ||||||||||||||||||||||||
Earnings (loss) before income taxes | (1,654 | ) | 1,937 | 7,354 | (379 | ) | 15,700 | 560 | 2,372 | 1,063 | |||||||||||||||||||||||
Income tax expense (recovery) | 1,876 | 710 | 705 | (168 | ) | (18 | ) | 2,329 | 1,654 | 345 | |||||||||||||||||||||||
Net earnings (loss) | $ | (3,530 | ) | $ | 1,227 | $ | 6,649 | $ | (211 | ) | $ | 15,718 | $ | (1,769 | ) | $ | 718 | $ | 718 | ||||||||||||||
Earnings (loss) per share - GAAP in dollars | |||||||||||||||||||||||||||||||||
Basic | $ | (0.11 | ) | $ | 0.04 | $ | 0.21 | $ | (0.01 | ) | $ | 0.49 | $ | (0.06 | ) | $ | 0.02 | $ | 0.02 | ||||||||||||||
Diluted | $ | (0.11 | ) | $ | 0.04 | $ | 0.20 | $ | (0.01 | ) | $ | 0.49 | $ | (0.06 | ) | $ | 0.02 | $ | 0.02 | ||||||||||||||
Weighted average number of shares (in thousands) | |||||||||||||||||||||||||||||||||
Basic | 33,136 | 32,200 | 32,167 | 31,909 | 31,962 | 32,043 | 31,966 | 32,156 | |||||||||||||||||||||||||
Diluted | 33,136 | 32,735 | 32,766 | 31,909 | 32,367 | 32,043 | 32,430 | 32,500 | |||||||||||||||||||||||||
26
Our quarterly results may fluctuate from quarter-to-quarter, driven by variation in sales volume, product mix and the combination of variable and fixed operating expenses, as well as from the impact of acquisitions completed in the quarter. The impact of significant items incurred during the first three interim periods of the year ended December 31, 2017 are discussed in more detail and disclosed in our quarterly reports and management’s discussion and analysis. Certain of the factors that affected our quarterly results are listed below.
• | In the fourth quarter of 2017, net earnings decreased by $4.8 million, compared to the third quarter of 2017, primarily due to lower earnings from operations as a result of increased operating expenses and higher acquisition and integration related expenses, as well as higher income tax expenses compared to the third quarter of 2017. |
• | In the third quarter of 2017, net earnings decreased by $5.4 million, compared to the second quarter of 2017, driven by a combination of lower earnings from operations and lower foreign exchange gains compared to the second quarter of 2017. |
• | In the second quarter of 2017, net earnings increased by $6.9 million compared to the first quarter of 2017. The increase in the second quarter of 2017 was attributable to higher earnings from operations and foreign exchange gains, partially offset by higher income tax expenses compared to the first quarter of 2017. |
• | In the first quarter of 2017, net loss was $0.2 million compared to net earnings of $15.7 million in the fourth quarter of 2016, driven by seasonally lower revenue, lower gross margin primarily due to the $13.0 million reduction of cost of goods sold related to the change in estimate of our IP royalty accrual recorded in the fourth quarter of 2016 and higher operating expenses, as well as the impact of the impairment in the first quarter of 2017 of $3.7 million related to an intangible asset, partially offset by foreign exchange gains in the first quarter of 2017. |
• | In the fourth quarter of 2016, net earnings increased by $17.5 million, or $0.54 per common share, to $15.7 million, compared to the third quarter of 2016, primarily due to higher revenue and gross margin partially offset by higher foreign exchange loss. |
• | In the third quarter of 2016, net earnings decreased by $2.5 million, or $0.08 per common share, compared to $0.7 million, in the second quarter of 2016, driven by a combination of lower revenue and gross margin, and higher income tax expenses partially offset by foreign exchange gains. |
• | In the second quarter of 2016, net earnings were comparable to the first quarter of 2016. Higher revenue and associated gross margin in the second quarter was offset by higher operating expenses, foreign exchange losses and higher income tax expenses compared to the first quarter. |
• | In the first quarter of 2016, net earnings increased $1.1 million, or $0.03 per common share, to $0.7 million, compared to the fourth quarter of 2015. The increase in net earnings was largely related to a foreign exchange gain in Q1, 2016 compared to Q4, 2015 partially offset by lower operating earnings and higher income tax expenses. |
27
LIQUIDITY AND CAPITAL RESOURCES
Selected Financial Information:
(in thousands of U.S. dollars) | 2017 | 2016 | 2015 | ||||||||||||
Cash flows provided before changes in non-cash working capital: | $ | 40,833 | $ | 31,991 | $ | 29,089 | |||||||||
Changes in non-cash working capital | |||||||||||||||
Accounts receivable | (10,584 | ) | (26,475 | ) | (8,437 | ) | |||||||||
Inventories | (6,806 | ) | (5,785 | ) | (16,262 | ) | |||||||||
Prepaids and other | (4,875 | ) | 6,970 | (5,748 | ) | ||||||||||
Accounts payable and accrued liabilities | (18,932 | ) | 38,601 | 18,612 | |||||||||||
Deferred revenue and credits | (564 | ) | 1,203 | (451 | ) | ||||||||||
(41,761 | ) | 14,514 | (12,286 | ) | |||||||||||
Cash flows provided by (used in): | |||||||||||||||
Operating activities | $ | (928 | ) | $ | 46,505 | $ | 16,803 | ||||||||
Investing activities | $ | (37,641 | ) | $ | (26,636 | ) | $ | (127,969 | ) | ||||||
Acquisitions | (21,870 | ) | (8,782 | ) | (112,895 | ) | |||||||||
Capital expenditures and increase in intangible assets | (15,806 | ) | (17,857 | ) | (15,079 | ) | |||||||||
Financing activities | $ | (271 | ) | $ | (13,689 | ) | $ | (5,317 | ) | ||||||
Issue of common shares, net of issue costs | 5,708 | 2,048 | 3,837 | ||||||||||||
Repurchase of common shares for cancellation | (2,779 | ) | (10,203 | ) | — | ||||||||||
Purchase of treasury shares for RSU distribution | — | (4,214 | ) | (6,584 | ) | ||||||||||
Taxes paid related to net settlement of equity awards | (1,367 | ) | (909 | ) | (2,344 | ) | |||||||||
Payment for contingent consideration | (1,397 | ) | (16 | ) | — | ||||||||||
Free Cash Flow (1) | $ | (16,734 | ) | $ | 28,648 | $ | 1,724 | ||||||||
(1) See section titled "Non-GAAP Financial Measures" for additional details and a reconciliation to the applicable GAAP financial measure.
Operating Activities
Cash used for operating activities increased by $47.4 million in 2017 compared to 2016, primarily due to higher working capital requirements driven by additional stocking of component inventory in order to reduce manufacturing costs.
Investing Activities
Cash used for investing activities increased by $11.0 million in 2017 compared to 2016. Higher cash requirements in 2017 were driven by increased business acquisition activity, including the acquisitions of GlobalTop and Numerex during 2017.
Capital expenditures of $15.8 million in 2017 were utilized primarily for production and tooling equipment, R&D equipment, computer equipment and software, while cash used for intangible assets was driven primarily by software license costs.
Financing Activities
Cash used for financing activities decreased by $13.4 million in 2017 compared to 2016, primarily due to higher proceeds from issue of common shares and a lower level of repurchase of common shares under our NCIB program which expired in February 2017.
28
Free Cash Flow
Our free cash flow decreased by $45.4 million in 2017 compared to 2016 as a result of the significant requirement to fund working capital throughout 2017 as noted above. See "Non-GAAP Financial Measures".
Cash Requirements
Our near-term cash requirements are primarily related to funding our operations, including inventory and other working capital items, capital expenditures, and other obligations discussed below. Cash may also be used to finance acquisitions of businesses in line with our long-term strategy. We continue to believe that our cash and cash equivalents of $65.2 million at December 31, 2017 and cash generated from operations will be sufficient to fund our expected working capital requirements, restructuring costs, and costs to integrate Numerex into our operations for at least the next twelve months. However, we cannot be certain that our actual cash requirements will not be greater than we currently expect.
The following table presents the aggregate amount of future cash outflows for contractual obligations as of December 31, 2017.
Payments due by period (In thousands of dollars) | Total | 2018 | 2019 | 2020 | 2021 | 2022 | Thereafter | ||||||||||||||||||||
Operating lease obligations | $ | 32,593 | $ | 7,164 | $ | 6,157 | $ | 5,863 | $ | 5,804 | $ | 3,140 | $ | 4,465 | |||||||||||||
Capital lease obligations | 1,492 | 636 | 467 | 314 | 75 | — | — | ||||||||||||||||||||
Purchase obligations - Contract Manufacturers (1) | 133,407 | 133,407 | — | — | — | — | — | ||||||||||||||||||||
Purchase obligations - Mobile Network Operators (2) | 33,122 | 14,047 | 7,100 | 8,900 | 3,075 | — | — | ||||||||||||||||||||
Acquisition contingent considerations (3) | 1,263 | 1,263 | — | — | — | — | — | ||||||||||||||||||||
Other long-term liabilities | 853 | 391 | 56 | 18 | 13 | 375 | — | ||||||||||||||||||||
Total | $ | 202,730 | $ | 156,908 | $ | 13,780 | $ | 15,095 | $ | 8,967 | $ | 3,515 | $ | 4,465 | |||||||||||||
(1) Purchase obligations represent obligations with certain contract manufacturers to buy a minimum amount of designated products between January 2018 and June 2018. In certain of these arrangements, we may be required to acquire and pay for such products up to the prescribed minimum or forecasted purchases.
(2) Purchase obligations represent obligations with certain mobile network operators to purchase a minimum amount of wireless data and wireless data services.
(3) Acquisition contingent considerations relate to expected payments to be made under the performance-based earnout formulas for the MobiquiThings and Blue Creation acquisitions.
Normal Course Issuer Bid
On February 4, 2016, we received approval from the TSX of our Notice of Intention to make a Normal Course Issuer Bid. Pursuant to the NCIB, we were permitted to purchase for cancellation up to 3,149,199 of our common shares, or approximately 9.7% of the common shares outstanding as of the date of the announcement. The NCIB commenced on February 9, 2016 and expired on February 8, 2017. During 2017, we purchased and canceled 170,217 common shares at an average price of $16.35 per common share.
29
Capital Resources
The source of funds for our future capital expenditures and commitments includes cash, accounts receivables, cash from operations and borrowings under our credit facilities.
2017 | 2016 | ||||||||||||||||||||||||||||||||
(In thousands of dollars) | Dec 31 | Sept 30 | June 30 | Mar 31 | Dec 31 | Sept 30 | June 30 | Mar 31 | |||||||||||||||||||||||||
Cash and cash equivalents | $ | 65,003 | $ | 74,206 | $ | 89,012 | $ | 92,545 | $ | 102,772 | $ | 112,054 | $ | 98,433 | $ | 86,120 | |||||||||||||||||
Unused credit facilities | 10,000 | 10,000 | 10,000 | 10,000 | 10,000 | 10,000 | 10,000 | 10,000 | |||||||||||||||||||||||||
Total | $ | 75,003 | $ | 84,206 | $ | 99,012 | $ | 102,545 | $ | 112,772 | $ | 122,054 | $ | 108,433 | $ | 96,120 | |||||||||||||||||
At December 31, 2017, we have committed capital expenditures of $4.3 million. Our capital expenditures during the first quarter of 2018 are expected to be primarily for production and R&D equipment.
Credit Facilities
On May 30, 2017, our $10.0 million revolving term credit facility ("Revolving Facility") with Toronto Dominion Bank and the Canadian Imperial Bank of Commerce expired. Subsequently, the Revolving Facility was renewed with the same financial institutions on an uncommitted basis. The Revolving Facility is for general corporate purposes, is secured by a pledge against substantially all of our assets and is subject to borrowing base limitations. As at December 31, 2017, there were no borrowings under the Revolving Facility.
Letters of Credit
We have access to a revolving standby letter of credit facility of $10 million from Toronto Dominion Bank. The credit facility is used for the issuance of letters of credit and guarantees and is guaranteed by Export Development Canada. As at December 31, 2017, there were two letters of credit issued against the revolving standby letter of credit facility for a total value of $0.1 million.
30
NON-GAAP FINANCIAL MEASURES
Our consolidated financial statements are prepared in accordance with U.S. GAAP on a basis consistent for all periods presented. In addition to results reported in accordance with U.S. GAAP, we use non-GAAP financial measures as supplemental indicators of our operating performance. The term “non-GAAP financial measure” is used to refer to a numerical measure of a company’s historical or future financial performance, financial position or cash flows that: (i) excludes amounts, or is subject to adjustments that have the effect of excluding amounts, that are included in the most directly comparable measure calculated and presented in accordance with U.S. GAAP in a company’s statement of earnings, balance sheet or statement of cash flows; or (ii) includes amounts, or is subject to adjustments that have the effect of including amounts, that are excluded from the most directly comparable measure so calculated and presented.
Our non-GAAP financial measures include non-GAAP gross margin, non-GAAP earnings (loss) from operations, non-GAAP net earnings (loss), non-GAAP earnings (loss) per share, adjusted EBITDA (earnings before interest, taxes, depreciation and amortization) and free cash flow.
Non-GAAP gross margin excludes the impact of stock-based compensation expense and related social taxes and certain other nonrecurring costs or recoveries.
Non-GAAP earnings (loss) from operations excludes the impact of stock-based compensation expense and related social taxes, acquisition-related amortization, acquisition-related and integration costs, restructuring costs, impairment and certain other nonrecurring costs or recoveries.
In addition to the above, Non-GAAP net earnings (loss) and non-GAAP earnings (loss) per share exclude the impact of foreign exchange gains or losses on translation of certain balance sheet accounts, unrealized foreign exchange gains or losses on forward contracts and certain tax adjustments.
We use the above-noted non-GAAP financial measures for planning purposes and to allow us to assess the performance of our business before including the impacts of the items noted above as they affect the comparability of our financial results. These non-GAAP measures are reviewed regularly by management and the Board of Directors as part of the ongoing internal assessment of our operating performance. We also use non-GAAP earnings from operations as one component in determining short-term incentive compensation for management employees.
Adjusted EBITDA is defined as net earnings (loss) plus stock-based compensation expense and related social taxes, acquisition-related and integration costs, restructuring costs, impairment, certain other nonrecurring costs or recoveries, amortization, foreign exchange gains or losses on translation of certain balance sheet accounts, unrealized foreign exchange gains or losses on forward contracts, interest and income tax expense. Adjusted EBITDA is a metric used by investors and analysts for valuation purposes and is an important indicator of our operating performance and our ability to generate liquidity through operating cash flow that will fund future working capital needs and capital expenditures.
Free cash flow is defined as cash flow from operating activities less capital expenditures and increases in intangibles. We believe that disclosure of free cash flow provides a good measure of our ability to internally generate cash that can be used for investment in the business and is an important indicator of our financial strength and performance. We also believe that certain investors and analysts use free cash flow to assess our business.
We disclose these non-GAAP financial measures as we believe they provide useful information to investors and analysts to assist them in their evaluation of our operating results and to assist in comparisons from one period to another. Readers are cautioned that non-GAAP financial measures do not have any standardized meaning prescribed by U.S. GAAP and therefore may not be comparable to similar measures presented by other companies. We strongly encourage investors to review our financial information in its entirety and not to rely on a single
31
financial measure. We therefore believe that despite these limitations, it is appropriate to supplement the U.S. GAAP measures with certain non-GAAP measures defined in this section of our MD&A.
The following table provides a reconciliation of the non-GAAP financial measures to our most directly comparable U.S. GAAP results for years ended December 31:
(In thousands of U.S. dollars, except where otherwise stated) | 2017 | 2016 | 2015 | |||||||||
Gross margin - GAAP | $ | 234,947 | $ | 217,743 | $ | 193,855 | ||||||
Stock-based compensation and related social taxes | 461 | 420 | 647 | |||||||||
Realized gains (losses) on hedge contracts | 23 | — | — | |||||||||
Other nonrecurring costs (recoveries) | — | (13,045 | ) | $ | — | |||||||
Gross margin - Non-GAAP | $ | 235,431 | $ | 205,118 | $ | 194,502 | ||||||
Earnings (loss) from operations - GAAP | $ | (359 | ) | $ | 21,348 | $ | 10,114 | |||||
Stock-based compensation and related social taxes | 10,374 | 7,596 | 9,685 | |||||||||
Acquisition-related and integration | 8,195 | 843 | 1,945 | |||||||||
Restructuring | 1,076 | — | 951 | |||||||||
Impairment | 3,668 | — | — | |||||||||
Other nonrecurring costs (recoveries) | 318 | (11,762 | ) | — | ||||||||
Realized gains (losses) on hedge contracts | 419 | — | — | |||||||||
Acquisition-related amortization | 15,486 | 12,102 | 9,666 | |||||||||
Earnings from operations - Non-GAAP | $ | 39,177 | $ | 30,127 | $ | 32,361 | ||||||
Net earnings (loss)- GAAP | $ | 4,135 | $ | 15,385 | $ | (2,674 | ) | |||||
Stock-based compensation and related social taxes, restructuring, impairment, acquisition-related, integration, realized gain (loss) on hedge contracts and other nonrecurring costs (recoveries) | 23,631 | (3,323 | ) | 12,581 | ||||||||
Amortization | 30,503 | 25,894 | 20,216 | |||||||||
Interest and other, net | (67 | ) | (83 | ) | (115 | ) | ||||||
Foreign exchange losses (gains) | (7,131 | ) | 1,736 | 11,843 | ||||||||
Income tax expense (recovery) | 3,123 | 4,310 | 1,060 | |||||||||
Adjusted EBITDA | $ | 54,194 | $ | 43,919 | $ | 42,911 | ||||||
Amortization (exclude acquisition-related amortization) | (15,017 | ) | (13,792 | ) | (10,550 | ) | ||||||
Interest and other, net | 67 | 83 | 115 | |||||||||
Income tax expense - Non-GAAP | (5,108 | ) | (8,241 | ) | (6,702 | ) | ||||||
Net earnings - Non-GAAP | $ | 34,136 | $ | 21,969 | $ | 25,774 | ||||||
Net earnings (loss) - GAAP | $ | 4,135 | $ | 15,385 | $ | (2,674 | ) | |||||
Net earnings (loss) - Non-GAAP | 34,136 | 43,919 | 25,774 | |||||||||
Diluted earnings (loss) per share | ||||||||||||
GAAP - (in dollars) | $ | 0.13 | $ | 0.48 | $ | (0.08 | ) | |||||
Non-GAAP - (in dollars) | $ | 1.04 | $ | 0.68 | $ | 0.80 | ||||||
32
The following table provides a quarterly reconciliation of the non-GAAP financial measures to our most directly comparable U.S. GAAP results:
2017 | 2016 | ||||||||||||||||||||||||||||||||
(In thousands of U.S. dollars, except where otherwise stated) | Q4 | Q3 | Q2 | Q1 | Q4 | Q3 | Q2 | Q1 | |||||||||||||||||||||||||
Gross margin - GAAP | $ | 61,814 | $ | 57,775 | $ | 59,697 | $ | 55,661 | $ | 68,796 | $ | 49,368 | $ | 52,764 | $ | 46,815 | |||||||||||||||||
Stock-based compensation and related social taxes | 122 | 123 | 108 | 108 | 99 | 108 | 107 | 106 | |||||||||||||||||||||||||
Realized gains (losses) on hedge contracts | 11 | 12 | — | — | — | — | — | — | |||||||||||||||||||||||||
Other nonrecurring costs (recoveries) | — | — | — | — | (13,045 | ) | — | — | — | ||||||||||||||||||||||||
Gross margin - Non-GAAP | $ | 61,947 | $ | 57,910 | $ | 59,805 | $ | 55,769 | $ | 55,850 | $ | 49,476 | $ | 52,871 | $ | 46,921 | |||||||||||||||||
Earnings (loss) from operations - GAAP | $ | (2,959 | ) | $ | 238 | $ | 3,849 | $ | (1,487 | ) | $ | 19,245 | $ | (53 | ) | $ | 3,411 | $ | (1,255 | ) | |||||||||||||
Stock-based compensation and related social taxes | 2,869 | 2,780 | 2,577 | 2,148 | 1,845 | 1,856 | 1,902 | 1,993 | |||||||||||||||||||||||||
Acquisition-related and integration | 4,792 | 2,077 | 875 | 451 | 376 | 34 | 59 | 374 | |||||||||||||||||||||||||
Restructuring | 245 | 199 | 259 | 373 | — | — | — | — | |||||||||||||||||||||||||
Impairment | — | — | — | 3,668 | — | — | — | — | |||||||||||||||||||||||||
Realized gains (losses) on hedge contracts | 209 | 210 | — | — | — | — | — | — | |||||||||||||||||||||||||
Other nonrecurring costs (recoveries) | — | — | 42 | 276 | (13,045 | ) | 1,283 | — | — | ||||||||||||||||||||||||
Acquisition-related amortization | 4,306 | 3,845 | 3,694 | 3,641 | 3,308 | 3,206 | 3,058 | 2,530 | |||||||||||||||||||||||||
Earnings (loss) from operations - Non-GAAP | $ | 9,462 | $ | 9,349 | $ | 11,296 | $ | 9,070 | $ | 11,729 | $ | 6,326 | $ | 8,430 | $ | 3,642 | |||||||||||||||||
Net earnings (loss) - GAAP | $ | (3,530 | ) | $ | 1,227 | $ | 6,649 | $ | (211 | ) | $ | 15,718 | $ | (1,769 | ) | $ | 718 | $ | 718 | ||||||||||||||
Stock-based compensation and related social taxes, restructuring, impairment, acquisition-related, integration, realized gains (losses) on hedge contracts and other nonrecurring costs (recoveries) | 7,906 | 5,056 | 3,753 | 6,916 | (10,824 | ) | 3,173 | 1,961 | 2,367 | ||||||||||||||||||||||||
Amortization | 8,764 | 7,548 | 7,194 | 6,997 | 7,043 | 6,577 | 6,706 | 5,568 | |||||||||||||||||||||||||
Interest and other, net | (38 | ) | (32 | ) | 12 | (9 | ) | (2 | ) | (23 | ) | (32 | ) | (26 | ) | ||||||||||||||||||
Foreign exchange loss (gain) | (1,058 | ) | (1,457 | ) | (3,517 | ) | (1,099 | ) | 3,547 | (590 | ) | 1,071 | (2,292 | ) | |||||||||||||||||||
Income tax expense (recovery) | 1,876 | 710 | 705 | (168 | ) | (18 | ) | 2,329 | 1,654 | 345 | |||||||||||||||||||||||
Adjusted EBITDA | $ | 13,920 | $ | 13,052 | $ | 14,796 | $ | 12,426 | $ | 15,464 | $ | 9,697 | $ | 12,078 | $ | 6,680 | |||||||||||||||||
Amortization (exclude acquisition-related amortization) | (4,458 | ) | (3,703 | ) | (3,500 | ) | (3,356 | ) | (3,735 | ) | (3,371 | ) | (3,648 | ) | (3,038 | ) | |||||||||||||||||
Interest and other, net | 38 | 32 | (12 | ) | 9 | 2 | 23 | 32 | 26 | ||||||||||||||||||||||||
Income tax expense - Non-GAAP | (308 | ) | (1,791 | ) | (1,591 | ) | (1,418 | ) | (2,900 | ) | (2,208 | ) | (2,086 | ) | (1,047 | ) | |||||||||||||||||
Net earnings - Non-GAAP | $ | 9,192 | $ | 7,590 | $ | 9,693 | $ | 7,661 | $ | 8,831 | $ | 4,141 | $ | 6,376 | $ | 2,621 | |||||||||||||||||
Diluted earnings (loss) per share | |||||||||||||||||||||||||||||||||
GAAP - (in dollars) | $ | (0.11 | ) | $ | 0.04 | $ | 0.20 | $ | (0.01 | ) | $ | 0.49 | $ | (0.06 | ) | $ | 0.02 | $ | 0.02 | ||||||||||||||
Non-GAAP - (in dollars) | $ | 0.28 | $ | 0.23 | $ | 0.30 | $ | 0.24 | $ | 0.27 | $ | 0.13 | $ | 0.20 | $ | 0.08 | |||||||||||||||||
33
The following table provides a reconciliation of segmented gross margin:
(In thousands of U.S. dollars) | 2017 | 2016 | 2015 | |||||||||
OEM Solutions: | ||||||||||||
Gross margin - GAAP | $ | 171,015 | $ | 166,596 | $ | 151,807 | ||||||
Stock-based compensation and related social taxes | 370 | 352 | 561 | |||||||||
Realized gains (losses) on hedge contracts | 17 | — | — | |||||||||
Other nonrecurring costs (recoveries) | — | (11,960 | ) | — | ||||||||
Gross margin - Non-GAAP | $ | 171,402 | $ | 154,988 | $ | 152,368 | ||||||
Enterprise Solutions: | ||||||||||||
Gross margin - GAAP | $ | 48,521 | $ | 39,949 | $ | 33,127 | ||||||
Stock-based compensation and related social taxes | 68 | 49 | 65 | |||||||||
Realized gains (losses) on hedge contracts | 4 | — | — | |||||||||
Other nonrecurring costs (recoveries) | — | (1,085 | ) | — | ||||||||
Gross margin - Non-GAAP | $ | 48,593 | $ | 38,913 | $ | 33,192 | ||||||
IoT Services: | ||||||||||||
Gross margin - GAAP | $ | 15,411 | $ | 11,198 | $ | 8,921 | ||||||
Stock-based compensation and related social taxes | 23 | 19 | 21 | |||||||||
Realized gains (losses) on hedge contracts | 2 | — | — | |||||||||
Other nonrecurring costs (recoveries) | — | — | — | |||||||||
Gross margin - Non-GAAP | $ | 15,436 | $ | 11,217 | $ | 8,942 | ||||||
The following table provides a reconciliation of free cash flow:
(In thousands of U.S. dollars) | 2017 | 2016 | 2015 | |||||||||||
Cash flows from operating activities | $ | (928 | ) | $ | 46,505 | $ | 16,803 | |||||||
Capital expenditures and increase in intangible assets | (15,806 | ) | (17,857 | ) | (15,079 | ) | ||||||||
Free Cash Flow | $ | (16,734 | ) | $ | 28,648 | $ | 1,724 | |||||||
OFF-BALANCE SHEET ARRANGEMENTS
We did not have any off-balance sheet arrangements during the years ended December 31, 2017 and 2016.
TRANSACTIONS BETWEEN RELATED PARTIES
We did not undertake any transactions with related parties during the years ended December 31, 2017 and 2016.
34
CRITICAL ACCOUNTING POLICIES AND ESTIMATES
We prepare our consolidated financial statements in accordance with U.S. GAAP and we make certain estimates and assumptions that affect the reported amounts of assets, liabilities, revenue, expenses and the related disclosure of contingent liabilities. Note 2, Summary of significant accounting policies, in the December 31, 2017 consolidated financial statements includes a summary of the significant accounting policies used in the preparation of our consolidated financial statements. While all of the significant accounting policies are important to the annual consolidated financial statements, some of these policies may be viewed as involving a high degree of judgment.
On an ongoing basis, we evaluate our estimates and judgments, including those related to business combinations, revenue recognition, adequacy of allowance for doubtful accounts, adequacy of inventory reserve, valuation of goodwill and intangible assets, income taxes, useful lives of long-lived assets, adequacy of warranty reserve, royalty obligations, contingencies, stock-based compensation, and fair value measurement. We base our estimates on historical experience, anticipated results and trends and on various other assumptions that we believe are reasonable under the circumstances. By their nature, estimates are subject to an inherent degree of uncertainty. Actual results could differ materially from our estimates.
The following critical accounting policies require management’s most difficult, subjective and complex judgments, and are subject to measurement uncertainty.
Business combinations
We account for our business combinations using the acquisition method. Under this method, estimates we make to determine the fair values of acquired assets and liabilities assumed include judgments in our determinations of acquired intangible assets and assessment of the fair value of existing property and equipment. Assumed liabilities can include litigation and other contingency reserves existing at the time of the acquisition. Goodwill is recognized as of the acquisition date as the excess of the fair value of consideration transferred over the estimated fair values of net identifiable assets acquired and liabilities assumed at their acquisition date. Acquisition related expenses are separately recognized from business combination and are expensed as incurred.
When establishing fair values, we make significant estimates and assumptions, especially with respect to intangible assets. Intangible assets acquired and recorded by us may include patents, intellectual property, customer relationships, brand, backlog and in-process research and development. Estimates include but are not limited to the forecasting of future cash flows and discount rates. From time to time, we may engage third-party firms to assist us in determining the fair value of assets and liabilities assumed. Our estimates of fair values are based upon assumptions believed to be reasonable, but which are inherently uncertain and unpredictable. As a result, actual results may differ from estimates impacting our earnings.
Revenue recognition
We recognize revenue from sales of products and services upon the later of transfer of title or upon shipment of the product to the customer or rendering of the service, so long as persuasive evidence of an arrangement exists, delivery has occurred, price is fixed or determinable, and collection is reasonably assured. Customers include resellers and distributors, OEMs, mobile network operators, other enterprises and public sector entities. We record deferred revenue when we receive cash in advance of the revenue recognition criteria being met. A significant portion of our revenue is generated from sales to resellers. We recognize revenue on sales to resellers based on the sell-in model. Where certain products are subject to contract provisions allowing various rights of return and stock rotation, a portion of the revenues may be deferred based on historical return rates. Where certain resellers are subject to provisions allowing for a future discount based on the final sales channel under which the products have been reported as sold by the resellers, a reduction of revenue is recorded upon invoicing for the expected discounts to be earned. Such rates are based on historical trends. Adjustments to the expected discounts are booked to revenues as the expected rates fluctuate or upon issuance of the final discount.
35
Revenues from contracts with multiple-element arrangements, such as those including technical support services, are recognized as each element is earned based on the relative fair value of each element and only when there are no undelivered elements that are essential to the functionality of the delivered elements. Revenue from licensed software is recognized at the inception of the license term. Revenue from software maintenance, unspecified upgrades and technical support contracts is recognized over the period such items are delivered or services are provided. Technical support contracts extending beyond the current period are recorded as deferred revenue and amortized into income over the applicable earning period.
Revenue from activation or set up fees charged in advance of contracted monthly recurring revenue is deferred and recognized over the estimated customer life on a straight line basis. Revenue from IoT subscription services are generally billed monthly and recognized when earned.
Funding from certain research and development agreements is recognized as revenue when certain criteria stipulated under the terms of those funding agreements have been met and when there is reasonable assurance the funding will be received.
Allowance for doubtful accounts
We maintain an allowance for doubtful accounts for estimated losses that may arise if any of our customers are unable to make required payments. We consider the following factors when determining whether collection is reasonably assured: customer credit-worthiness, past transaction history with the customer, insured amounts, if any, current economic industry trends and changes in customer payment terms. If we have no previous experience with the customer, we typically obtain reports from credit organizations to ensure that the customer has a history of paying its creditors. We may also request financial information, including financial statements, to ensure that the customer has the means of making payment. If these factors indicate collection is not reasonably assured, revenue is deferred until collection becomes reasonably assured, which is generally upon receipt of cash. If the financial condition of any of our customers deteriorates, we may increase our allowance.
As at December 31, 2017, accounts receivable comprised 24.5% of total assets. Included in this balance was a provision of $1.8 million for doubtful accounts, or 1.1% of accounts receivable compared to $2.5 million for doubtful accounts, or 1.7% of accounts receivable as at December 31, 2016. We believe our allowance for doubtful accounts as at December 31, 2017 is adequate to provide for probable losses existing in accounts receivable.
Inventory
We value our inventory at the lower of cost, determined on a first-in-first-out basis, and estimated net realizable value. We assess the need for an inventory write-down and/or an accrual for estimated losses on inventory purchase commitments based on our assessment of estimated market value using assumptions about future demand and market conditions. Our reserve requirements generally increase as our projected demand requirements decrease, due to market conditions, technological and product life cycle changes and longer than previously expected usage periods. If market conditions are worse than our projections, we may further write-down the value of our inventory or increase the accrual for estimated losses on inventory purchase commitments.
36
Goodwill and intangible assets
Goodwill and intangible assets are assessed for impairment on an annual basis and between annual tests whenever circumstances indicate that the carrying value of the goodwill and intangible assets might be impaired. We performed our annual test on October 1, 2017. Circumstances may include an adverse change in business climate or a more likely than not expectation that a reporting unit will be sold or disposed. On at least a quarterly basis, we assess whether such circumstances exist. An evaluation of recoverability of goodwill requires judgment, including the identification of reporting units, assigning assets and liabilities to reporting units, assigning goodwill to reporting units, and determining the estimated fair value of each reporting unit. Significant judgments that are required on our part to estimate the fair value of reporting units include estimating future cash flows, determining appropriate discount rates, consideration of appropriate control premium, market conditions, and other assumptions. Changes in these estimates and assumptions could materially affect the determination of fair value for each reporting unit and may result in impairment charges in future periods.
At December 31, 2017, our goodwill balance was $218.5 million. We determined that there was no impairment as the fair values of each of our reporting units exceeded their respective carrying values as at October 1, 2017. Our analysis took into consideration an income valuation approach using the expected discounted cash flows for each reporting unit. The principal factors used in the discounted cash flow analysis were the projected results of operations, the discount rate based on our estimated weighted average cost of capital, and terminal value assumptions for each reporting unit. The discounted cash flow model used was based on our business plan, as approved by our Board of Directors. For years subsequent to those contained in our business plan, we analyzed third party forecasts and other macro-economic indicators that impact our reporting units to provide a reasonable estimate of revenue growth in future periods. Our gross margins and operating expense estimates were consistent with those generated in recent historical periods. We also developed assumptions for the amount of working capital and capital expenditures needed to support each reporting unit.
In addition to the income valuation approach noted above, we also considered our current market capitalization, which was approximately $733.4 million at December 31, 2017 and exceeds our book value of $466.9 million.
Income taxes
We recognize and measure each tax position related to income tax positions taken or expected to be taken in a tax return. We have reviewed our tax positions to determine which should be recognized and measured according to the more likely than not threshold requirement. The tax benefits recognized in the financial statements are measured based on the largest benefit that has a greater than fifty percent likelihood of being realized upon ultimate resolution. If the realization of a tax position is not considered more likely than not, we provide for a valuation allowance. The ultimate realization of our deferred tax assets is dependent upon the generation of future taxable income during the periods in which temporary differences become deductible. We consider projected future taxable income from operations, tax planning strategies and transactions in making our assessment. If our assessment of our ability to realize our deferred tax assets changes, we may make an adjustment to our deferred tax assets that would be charged to income (loss).
We do not provide for taxes on foreign earnings as it is our intention to indefinitely reinvest undistributed earnings of our foreign subsidiaries. It is not practical to estimate the income tax liability that might be incurred if there is a change in management’s intention in the event that a remittance of such earnings occurs in the future.
The ultimate amount of future income taxes and income tax provision could be materially different from those recorded, as it is influenced by our future operating results and our tax interpretations.
37
Amortization
Amortization of property and equipment and intangible assets incorporates estimates of useful lives and residual values. These estimates may change as more experience is obtained or as general market conditions change impacting the operation of property and equipment and intangible assets.
Warranty costs
We accrue product warranty costs in accrued liabilities to provide for the repair or replacement of defective products. Our accrual is based on an assessment of historical experience, product quality and management’s estimates. If there is a change in these factors, we adjust our accrual accordingly.
Royalty obligations
Under certain license agreements we are committed to royalty payments based on the sales of products using certain technologies. We recognize royalty obligations as determinable in accordance with agreement terms.
Where agreements are not in place, we recognize our current best estimate of the royalty obligation in accrued liabilities and long-term liabilities. Historically (prior to October 1, 2016), in determining this estimate, we based our calculations on an assumption that royalty calculations could be based on a percentage of the entire value of an end-product (i.e., revenue). This conformed with our legacy license agreements.
Significant legal precedent now exists in the United States supporting the smallest saleable unit (“SSU”) principle (i.e., the principle that any royalty obligations should be no more than a portion of the profits for a component within the product that implements the patented technology) as the appropriate methodology for determining FRAND standard essential patent (“SEP”) royalties. Using this principle, the royalty accrual on our products is based on the value of the patented technology in the chipset, representing the SSU that implements the technology, and not on the entire value of the end-product.
The cumulative effect of these legal changes to the licensing landscape, combined with supportive legislative initiatives and broad industry support for the SSU principle, at the time of the expiry of one of our significant legacy IP licenses, prompted management to reassess its contingent royalty obligation estimate during the fourth quarter of the year ended December 31, 2016. The use of the SSU principle as the basis to determine the estimate, as opposed to value of end-product, resulted in a reduction of $13.0 million to our estimated royalty obligation effective October 1, 2016.
Contingencies
We are from time to time involved in litigation, certain other claims and arbitration matters arising in the ordinary course of our business. We accrue for a liability when it is both probable that a liability has been incurred and the amount of the loss can be reasonably estimated. Significant judgment is required in both the determination of probability and the determination as to whether an amount of a loss is reasonably estimable. These accruals are reviewed at least quarterly and adjusted to reflect the impacts of negotiations, settlements, rulings, advice of legal counsel and technical experts and other information and events pertaining to the particular matter. To the extent there is a reasonable possibility (within the meaning of ASC 450, Contingencies) that the losses could exceed the amounts already accrued, management believes that the amount of any such additional loss would not be material to our results of operations or financial condition.
In some instances, we are unable to reasonably estimate any potential loss or range of loss. The nature and progression of litigation can make it difficult to predict the impact a particular lawsuit will have on the company. There are many reasons why we cannot make these assessments, including, among others, one or more of the following: in the early stage of a proceeding, the claimant is not required to specifically identify the patent that has allegedly been infringed; damages sought that are unspecified, unsupportable, unexplained or uncertain;
38
discovery not having been started or being incomplete; the complexity of the facts that are in dispute (e.g., once a patent is identified, the analysis of the patent and a comparison to our activities is a labour-intensive and highly technical process); the difficulty of assessing novel claims; the parties not having engaged in any meaningful settlement discussions; the possibility that other parties may share in any ultimate liability; and the often slow pace of patent litigation.
We are required to apply judgment with respect to any potential loss or range of loss in connection with litigation. While we believe we have meritorious defenses to the claims asserted against us in our currently outstanding litigation, and intend to defend ourselves vigorously in all cases, in light of the inherent uncertainties in litigation there can be no assurance that the ultimate resolution of these matters will not significantly exceed the reserves currently accrued by us for those cases for which an estimate can be made. Losses in connection with any litigation for which we are not presently able to reasonable estimate any potential loss or range of loss could be material to our results of operations and financial condition.
Stock-based compensation
We recognize stock-based compensation expense for all stock-based compensation awards based on the fair value at grant date. We recognize stock-based compensation expense on a straight-line basis over the requisite service period of the award and account for forfeitures as they occur.
Determining the appropriate fair value model and calculating the fair value of share-based payment awards requires subjective assumptions. The assumptions used in calculating the fair value of share-based payment awards represent management’s best estimates, but these estimates involve inherent uncertainties and the application of management’s judgment. As a result, if factors change and we use different assumptions, our stock-based compensation expense could be materially different in the future.
Fair value measurement
We measure our short-term investments at fair value, defined as the price that would be received from selling an asset or that would be paid to transfer a liability in an orderly transaction between market participants at the measurement date. When determining fair value measurements, we consider the principal or most advantageous market in which it would transact and consider assumptions that market participants would use when pricing the asset or liability, such as inherent risk, transfer restrictions and risk of non-performance.
An established fair value hierarchy requires the company to maximize the use of observable inputs and minimize the use of unobservable inputs when measuring fair value. A financial instrument’s categorization within the fair value hierarchy is based upon the lowest level of input that is both available and significant to the fair value measurement. Three levels of inputs may be used to measure fair value as detailed below.
• | Level 1 - Quoted prices in active markets for identical assets or liabilities. |
• | Level 2 - Observable inputs other than quoted prices in active markets for identical assets and liabilities, such as quoted prices for identical or similar assets or liabilities in markets that are not active, or other inputs that are observable or can be corroborated by observable market data for substantially the full term of the assets or liabilities. |
• | Level 3 - Inputs that are generally unobservable and are supported by little or no market activity and that are significant to the fair value determination of the assets or liabilities. |
The determination of fair value requires judgments, assumptions and estimates and may change over time.
39
OUTSTANDING SHARE DATA
As of March 6, 2018, we had 35,972,276 common shares issued and outstanding, stock options exercisable into 1,728,679 common shares at a weighted average exercise price of $20.16 and 702,435 restricted treasury share units outstanding.
IMPACT OF ACCOUNTING PRONOUNCEMENTS AFFECTING CURRENT PERIOD
In November 2016, the FASB issued ASU 2016-18, Statement of Cash Flows (Topic 230) Restricted Cash. This update is to address diversity in the classification and presentation of changes in restricted cash on the statement of cash flows. This requires that a statement of cash flows explain the change during the period in the total of cash, cash equivalents, and amounts generally described as restricted cash or restricted cash equivalents by including restricted cash and restricted cash equivalents when reconciling the beginning-of-period and end-of-period total amounts shown on the statement of cash flows. The standard is effective for fiscal years beginning after December 15, 2017, and interim periods within those fiscal periods. Early adoption is permitted, and any adjustments should be reflected as of the beginning of the fiscal year that includes that interim period. In the fourth quarter of 2017, we early adopted ASU 2016-18 and there was no material impact to our financial statements and business.
IMPACT OF ACCOUNTING PRONOUNCEMENTS AFFECTING FUTURE PERIODS
In May 2014, the FASB issued ASU 2014-09, Revenue from Contracts with Customers (ASC 606). The update is intended to clarify the principles of recognizing revenue, and to develop a common revenue standard for U.S. GAAP and IFRS that would remove inconsistencies in revenue requirements, leading to improved comparability of revenue recognition practices across entities and industries. ASC 606 contains a single model that applies to contracts with customers and two approaches to recognizing revenue: at a point in time or over time. The model features a contract-based five-step analysis of transactions to determine whether, how much, and when revenue is recognized. New estimates and judgmental thresholds have been introduced, which may affect the amount and/or timing of revenue recognized. The new standard is effective for annual and interim financial statements for fiscal years beginning after December 15, 2017. Early application is permitted in fiscal years beginning after December 15, 2016. We will adopt the full retrospective transition method in the first quarter of 2018. The new revenue standards, under our current business model, are not expected to have a material impact on the amount and timing of revenue recognized. We have identified and have commenced the development of appropriate changes to our business processes, systems, and controls to support recognition and disclosure under the new standard.
In February 2016, the FASB issued ASU 2016-02, Leases (Topic 842). This update is to improve transparency and comparability among organizations by requiring lessees to recognize right-of-use assets and lease liabilities on the balance sheet and requiring additional disclosure about leasing arrangements. The standard is effective for fiscal years beginning after December 15, 2018. Early application is permitted. We are in the process of evaluating the impact of this update and cannot reasonably estimate the effect on our financial statements and business at this time.
In June 2016, the FASB issued ASU 2016-13, Measurement of Credit Losses on Financial Instruments. This update will replace the incurred loss impairment methodology for credit losses on financial instruments with a methodology that requires consideration of a broader range of reasonable and supportable information to inform credit loss estimates. The standard is effective for fiscal years beginning after December 15, 2019, including interim periods within those fiscal years. Early application is permitted as of the fiscal years beginning after December 15, 2018, including interim periods within those fiscal years. We are in the process of evaluating the impact of this update and cannot reasonably estimate the effect on our financial statements and business at this time.
40
In August 2016, the FASB issued ASU 2016-15, Statement of Cash Flows (Topic 230), Classification of Certain Cash Receipts and Cash Payments. The update addresses eight specific cash flow issues with the objective of reducing diversity in practice. The standard is effective for fiscal years beginning after December 15, 2017, and interim periods within those fiscal periods. Early application is permitted. We will adopt the standard in the first quarter of 2018. The update does not have a material impact on our financial statements.
DISCLOSURE CONTROLS AND PROCEDURES
Our management is responsible for establishing and maintaining adequate disclosure controls and procedures for the Company. Our disclosure controls and procedures are designed to ensure that information required to be disclosed in our reports filed with securities regulatory authorities is recorded, processed, summarized and reported within time periods specified in applicable securities regulations, and is accumulated and communicated to our management, including our Chief Executive Officer and our Chief Financial Officer, as appropriate, to allow timely decisions regarding required disclosure.
We conducted an evaluation of the effectiveness of our disclosure controls and procedures, which was carried out under the supervision of, and with the participation of, our management, including our Chief Executive Officer and our Chief Financial Officer, as of December 31, 2017. Based on that evaluation, our Chief Executive Officer and our Chief Financial Officer have concluded that our disclosure controls and procedures were effective as of December 31, 2017 to ensure that information required to be disclosed by us in the reports we file or submit under applicable securities laws and regulations is recorded, processed, summarized, and reported within the time periods specified thereby.
As permitted by SEC guidance and applicable Canadian securities laws, the Company has excluded Numerex controls, policies and procedures from the scope of design of the disclosure controls and procedures for the year ended December 31, 2017. The Company completed the purchase of Numerex on December 7, 2017. Additional information regarding this acquisition is included above and in Note 5 to the consolidated financial statements. Numerex will be included in management’s evaluation of disclosure controls for the fiscal year ending December 31, 2018
We do not expect that our disclosure controls and procedures will prevent all errors and all fraud. Control procedures, no matter how well conceived and operated, can provide only reasonable, not absolute, assurance that the objectives of the control procedures are met. Because of the inherent limitations in all control procedures, no evaluation of controls can provide absolute assurance that all control issues and instances of fraud, if any, within our company have been detected. These inherent limitations include the realities that judgments in decision-making can be faulty, and that breakdowns can occur because of simple error or mistake. Additionally, controls can be circumvented by the individual acts of some persons, by collusion of two or more people, or by management override of the control. We considered these limitations during the development of our disclosure controls and procedures and will periodically re-evaluate them to ensure they provide reasonable assurance that such controls and procedures are effective.
41
INTERNAL CONTROL OVER FINANCIAL REPORTING
Management’s Annual Report on Internal Control over Financial Reporting
Our management is responsible for establishing and maintaining adequate internal control over financial reporting, as such term is defined in Rules 13a-15(f) and 15d-15(f) under the U.S. Securities Exchange Act of 1934 and has designed such internal control over financial reporting to provide reasonable assurance regarding the reliability of financial reporting and the preparation of financial statements for external purposes in accordance with U.S. GAAP.
Our internal control over financial reporting includes those policies and procedures that: (1) pertain to the maintenance of records that, in reasonable detail, accurately and fairly reflect the transactions and dispositions of our assets; (2) provide reasonable assurance that transactions are recorded as necessary to permit preparation of financial statements in accordance with U.S. GAAP, and that our receipts and expenditures are being made only in accordance with authorizations of our management and directors; and (3) provide reasonable assurance regarding prevention or timely detection of unauthorized acquisition, use or disposition of our assets that could have a material effect on the financial statements.
Because of its inherent limitations, internal control over financial reporting may not prevent or detect misstatements on a timely basis. Also, projections of any evaluation of effectiveness of internal control over financial reporting to future periods are subject to the risk that controls may become inadequate because of changes in conditions, or that the degree of compliance with the policies or procedures may deteriorate.
Under the supervision and with the participation of our Chief Executive Officer and our Chief Financial Officer, management conducted an evaluation of the effectiveness of our internal control over financial reporting, as of December 31, 2017, based on the framework set forth in Internal Control-Integrated Framework (2013) issued by the Committee of Sponsoring Organizations of the Treadway Commission ("COSO"). Based on its evaluation under this framework, management concluded that our internal control over financial reporting was effective as of that date.
Ernst & Young LLP ("EY"), an independent registered public accounting firm, who audited and reported on our consolidated financial statements as at and for the year ended December 31, 2017, has issued an attestation report on our internal control over financial reporting as of December 31, 2017. Their attestation report is included with our consolidated financial statements.
As permitted by SEC guidance and applicable Canadian securities laws, the Company has excluded Numerex controls, policies and procedures, from management’s evaluation of the system of internal control over financial reporting for the year ended December 31, 2017. The Company completed the purchase of Numerex on December 7, 2017 and Numerex's total assets and revenues constituted 3.47% and 0.45% respectively, of the Company's consolidated total assets and revenues as shown on our consolidated financial statements as of and for the period ended December 31, 2017. Additional information regarding this acquisition is included above and in Note 5 to the consolidated financial statements. Numerex will be included in management’s evaluation of internal controls over financial reporting for the fiscal year ending December 31, 2018
There were no changes in our internal control over financial reporting during the year ended December 31, 2017 that materially affected, or are reasonably likely to materially affect, our internal control over financial reporting. The design of any system of controls and procedures is based in part upon certain assumptions about the likelihood of certain events. There can be no assurance that any design will succeed in achieving its stated goals under all potential future conditions, regardless of how remote.
42
LEGAL PROCEEDINGS
In January 2017, Koninklijke KPN N.V. filed a patent infringement lawsuit in the United States District Court for the District of Delaware asserting patent infringement by us and our U.S. subsidiary. The lawsuit makes certain allegations concerning the alleged use of data transmission error checking technology in our wireless products. The lawsuit is in the discovery stage. In August 2017, we filed a motion to dismiss the lawsuit pursuant to 35 U.S.C. §101, and a decision on the motion is pending. In December 2017, we filed a Petition for Inter Partes Review of the patent-in-suit with the United States Patent and Trial Appeal Board and a decision on institution of the proceeding is pending.
In December 2016, a patent holding company, Magnacross LLC, filed a patent infringement lawsuit in the United States District Court of the Eastern District of Texas asserting patent infringement by one of our U.S. subsidiaries. The lawsuit makes certain allegations concerning our AirLink wireless routers. The lawsuit has been dismissed with prejudice.
In January 2012, a patent holding company, M2M Solutions LLC ("M2M Solutions"), filed a patent infringement lawsuit in the United States District Court for the District of Delaware asserting patent infringement by us, one of our US subsidiaries, and our competitors. The lawsuit makes certain allegations concerning the AirPrime embedded wireless module products, related AirLink products and related services sold by us for use in M2M communication applications. The claim construction order has determined one of the two patents-in-suit to be indefinite and therefore invalid. The lawsuit was dismissed with prejudice in April 2016. In August 2014, M2M Solutions filed a second patent infringement lawsuit against us in the same court with respect to a recently issued patent held by M2M Solutions (US Patent No. 8,648,717), which patent is a continuation of one of the patents-in-suit in the original lawsuit filed against us by M2M Solutions. The lawsuit was administratively closed in September 2015 pending the result of several Inter Partes Review proceedings filed by us and the other defendants with the United States Patent and Trial Appeal Board ("PTAB"). In March 2017, the PTAB issued its decisions in the instituted proceedings, invalidating all independent claims and several dependent claims in the single patent-in-suit. In June 2017, Blackbird Tech LLC ("Blackbird") was joined as a plaintiff in the lawsuit. The lawsuit has been administratively re-opened. In October 2017, a motion to dismiss the lawsuit pursuant to 35 U.S.C. § 101 was filed and has been briefed.
In October 2017, Numerex, its board of directors, the Company and one of our U.S. subsidiaries, Wireless Acquisition Sub, Inc. were named as defendants in a class action lawsuit filed by purported stockholders of Numerex alleging, among other things, that the defendants issued or caused to be issued a materially misleading and incomplete Registration Statement on Form F-4 with the U.S. Securities and Exchange Commission in connection with the Transaction. In October 2017, Numerex and its board of directors were also named as defendants in a separate class action lawsuit filed by purported stockholders of Numerex. Both lawsuits were voluntarily dismissed in December 2017.
In October 2017, a patent holding company, Iron Oak Technologies, LLC ("Iron Oak"), filed a patent infringement lawsuit in the United States District Court for the District of Delaware asserting patent infringement by us and one of our U.S. subsidiaries. The lawsuit makes certain allegations concerning our embedded wireless module products. The lawsuit has been dismissed with prejudice.
Although there can be no assurance that an unfavorable outcome would not have a material adverse effect on our operating results, liquidity or financial position, we believe the claims made in the foregoing legal proceedings are without merit and intend to defend ourselves and our products vigorously in all cases.
We are engaged in certain other claims, legal actions and arbitration matters, all in the ordinary course of business, and believe that the ultimate outcome of these claims, legal actions and arbitration matters will not have a material adverse effect on our operating results, liquidity or financial position.
43
FINANCIAL RISK MANAGEMENT
Financial instruments consist primarily of cash and cash equivalents, accounts receivable, derivatives such as foreign currency forward and option contracts, accounts payable and accrued liabilities.
We have exposure to the following business risks:
We maintain substantially all of our cash and cash equivalents with major financial institutions or invest in government instruments. Our deposits with banks may exceed the amount of insurance provided on such deposits.
We outsource manufacturing of our products to third parties and, accordingly, we are dependent upon the development and deployment by third parties of their manufacturing abilities. The inability of any supplier or manufacturer to fulfill our supply requirements could impact future results. We have supply commitments to our contract manufacturers based on our estimates of customer and market demand. Where actual results vary from our estimates, whether due to execution on our part or market conditions, we are at risk.
Financial instruments that potentially subject us to concentrations of credit risk are primarily accounts receivable. We perform on-going credit evaluations of our customer’s financial condition and require letters of credit or other guarantees whenever deemed appropriate.
Although a significant portion of our revenues are in U.S. dollars, we incur operating costs that are denominated in other currencies. Fluctuations in the exchange rates between these currencies could have a material impact on our business, financial condition and results of operations.
We are generating and incurring an increasing portion of our revenue and expenses, respectively, outside of North America including Europe, the Middle East and Asia. To manage our foreign currency risks, we enter into foreign currency forward contracts to reduce our exposure to future foreign exchange fluctuations. As of December 31, 2017, we had foreign currency forward contracts totalling $15.6 million Canadian dollars with an average forward rate of 1.290, maturing between January to December 2018. Subsequent to December 31, 2017, we entered into additional foreign currency forward contracts totalling $17.4 million Canadian dollars with an average forward rate of 1.255, maturing between February to December 2018.
We are subject to risks typical of an international business including, but not limited to, differing economic conditions, changes in political climate, differing tax structures other regulations and restrictions and foreign exchange rate volatility. Accordingly, our future results could be materially affected by changes in these or other factors.
44
RISKS AND UNCERTAINTIES
Our business is subject to significant risks and uncertainties and past performance is no guarantee of future performance. The risks and uncertainties described below are those which we currently believe to be material, and do not represent all of the risks that we face. Additional risks and uncertainties, not presently known to us, may become material in the future or those risks that we currently believe to be immaterial may become material in the future. If any of the following risks actually occur, alone or in combination, our business, financial condition and results of operations, as well as the market price of our common shares, could be materially adversely affected.
Competition from new or established IoT, cloud services and wireless services companies or from those with greater resources may prevent us from increasing or maintaining our market share and could result in price reductions and/or loss of business with resulting reduced revenues and gross margins.
The market for IoT products and services is highly competitive and rapidly evolving. We have experienced and expect to continue to experience the impact on our business of intense competition including:
• | competition from more established and larger companies with strong brands and greater financial, technical and marketing resources or companies with different business models; |
• | business combinations or strategic alliances by our competitors which could weaken our competitive position; |
• | introduction of new products or services by us that put us in direct competition with major new competitors; |
• | existing or future competitors who may be able to respond more quickly to technological developments and changes and introduce new products or services before we do; and |
• | competitors who may independently develop and patent technologies and products that are superior to ours or achieve greater acceptance due to factors such as more favorable pricing, more desired or better-quality features or more efficient sales channels. |
If we are unable to compete effectively with our competitors' pricing strategies, technological advances and other initiatives, we may lose customer orders and market share and we may need to reduce the price of our products and services, resulting in reduced revenue and reduced gross margins. In addition, new market entrants or alliances between customers and suppliers could emerge to disrupt the markets in which we operate through disintermediation of our modules business or other means. There can be no assurance that we will be able to compete successfully and withstand competitive pressures.
Our recent acquisition of Numerex is subject to certain risks and uncertainties
As noted above, on December 7, 2017, we acquired Numerex. In connection with our deliberations relating to the Transaction, we considered potential risks and negative factors concerning the Transaction and the other transactions contemplated by the Merger Agreement, including, but not limited to, the following:
• | the potential distraction to our current business and specific initiatives; |
• | the difficulties and management challenges inherent in integrating the business, operations and workforce of Numerex with those of Sierra Wireless; |
• | the difficulties and management challenges inherent in returning the Numerex business to profitable growth; |
• | our assessment of the achievability of Numerex’s financial projections and our expectation that the Transaction will not be accretive to earnings per share until approximately 12 months after the closing, assuming efficiencies and anticipated growth are fully realized; |
• | the risk that the anticipated benefits of the Transaction will not be realized in full or in part, including the risk that expected synergies, expected growth and expected cost savings will not be achieved or not achieved in the expected time frame; |
45
• | the risk of diverting the attention of our senior management from other strategic priorities to implement the Transaction and make arrangements for integration of Sierra Wireless’ and Numerex’s operations and infrastructure following the Transaction; |
• | risks associated with managing the technology transitions; and |
• | other risks relating to acquisitions generally described below under “Risk Factors - Acquisitions and divestitures of businesses or technologies may result in disruptions to our business or may not achieve the anticipated benefits”. |
Acquisitions and divestitures of other businesses or technologies may result in disruptions to our business or may not achieve the anticipated benefits.
The growth of our Company through the successful acquisition and integration of complementary businesses is an important and active component of our business strategy. We continue to seek opportunities to acquire or invest in businesses, products and technologies that expand, complement or otherwise relate to our business. Any acquisitions, investments or business combinations by us may be accompanied by risks commonly encountered including, but not limited to, the following:
• | exposure to unknown liabilities or risks of acquired companies, including unknown litigation related to acts or omissions of an acquired company and/or its directors and officers prior to the acquisition, deficiencies in disclosure controls and procedures of the acquired company and deficiencies in internal controls over financial reporting of the acquired company; |
• | higher than anticipated acquisition and integration costs and expenses; |
• | the difficulty and expense of integrating the operations and personnel of the acquired companies; |
• | use of cash to support the operations of an acquired business; |
• | increased foreign exchange translation risk depending on the currency denomination of the revenue and expenses of the acquired business; |
• | disruption of, and demands on, our ongoing business as a result of integration activities including diversion of management's time and attention from the ongoing business; |
• | failure to maximize our financial and strategic position by the successful incorporation of acquired technology; |
• | the inability to implement uniform standards, disclosure controls and procedures, internal controls over financial reporting and other procedures and policies in a timely manner; |
• | the potential loss of key employees and customers; |
• | decrease in our share price if the market perceives that an acquisition does not fit our strategy, the price paid is excessive in light of other similar transactions or that the terms of the acquisition are not favorable to our earnings growth; |
• | failure to anticipate or adequately address regulatory requirements that may need to be satisfied as part of a business acquisition or disposition; |
• | litigation and settlement costs if shareholders bring lawsuits triggered by acquisition or divestiture activities; |
• | decrease in our share price, if, as a result of our acquisition strategy or growth, we decide to raise additional capital through an offering of securities; and |
• | dilution to our shareholders if the purchase price is paid in common shares or securities convertible into common shares. |
In addition, geographic distances and cultural differences may make integration of businesses more difficult. We may not be successful in overcoming these risks or any other problems encountered in connection with any acquisitions. If realized, these risks could reduce shareholder value.
As business circumstances dictate, we may also decide to divest assets, technologies or businesses. In a divestiture, we may not be successful in identifying or managing the risks commonly encountered, including: higher than anticipated costs; disruption of, and demands on, our ongoing business; diversion of management's time and attention; adverse effects on existing business relationships with suppliers and customers and employee
46
issues. We may not be successful in overcoming these risks or any other problems encountered in connection with a divestiture of assets, technologies or businesses which, if realized, could reduce shareholder value.
In addition, we may be unsuccessful at bringing to conclusion proposed transactions. Negotiations and closing activities, including regulatory review, of transactions are complex functions subject to numerous unforeseen events that may impede the speed at which a transaction is closed or even prevent a transaction from closing. Failure to conclude transactions in an efficient manner may prevent us from advancing other opportunities or introduce unanticipated transition costs.
The loss of any of our significant customers could adversely affect our revenue and profitability, and therefore shareholder value.
We sell our products and services to OEM's, enterprises, government agencies, distributors, resellers and network operators, and we are occasionally party to sales agreements with customers comprising a significant portion of our revenue. Accordingly, our business and future success depends on our ability to maintain and build on existing relationships and develop new relationships with OEMs, enterprises, government agencies, distributors, resellers and network operators. If certain of our significant customers, for any reason, discontinues their relationship with us, reduces or postpones current or expected purchase orders for products, reduces or postpones initiation or usage of our services or suffers from business loss, our revenues and profitability could decline materially.
In addition, our current customers purchase our products under purchase orders. Our customers have no contractual obligation to continue to purchase our products following our fulfillment of current purchase orders and if they do not continue to make purchases, our revenue and our profitability could decline materially.
Cyber-attacks or other breaches of information technology security could have an adverse impact on our business.
We rely on certain internal processes, infrastructure and information technology systems to efficiently operate our business in a secure manner, including infrastructure and systems operated by third parties. The inability to continue to enhance or prevent a failure of these internal processes, infrastructure or information technology systems could negatively impact our ability to operate our business. Our IoT services depend on very high levels of network reliability and availability in order to provide our customers with the ability to continuously monitor and receive data from their devices.
Cyber-attacks or other breaches of network or IT systems security may cause disruptions to our operations including the ability to provide connectivity, device management and other cloud-based services to our customers. The prevalence and sophistication of these types of threats are increasing and our security measures may not be sufficient to prevent the damage that such threats can inflict on our assets and information. The theft, unauthorized use or publication of our intellectual property and/or confidential business information could harm our competitive position, reduce the value of our investment in research and development and other strategic initiatives and/or otherwise adversely affect our business. To the extent that any security breach results in inappropriate disclosure of our customers' confidential information or disruption of service to our customers, we may incur liability, be subject to legal action and suffer damage to our reputation. Our insurance may not be adequate to fully reimburse us for these costs and losses.
Our financial results are subject to fluctuations that could have a material adverse effect on our business and that could affect the market price of our common shares.
Our revenue, gross margin, operating earnings and net earnings may vary from quarter-to-quarter and could be significantly impacted by a number of factors, including but not limited to the following:
• | price and product competition which may result in lower selling prices for some of our products and services or lost market share; |
47
• | price and demand pressure on our products and services from our customers as they experience pressure in their businesses; |
• | demand fluctuation based on the success of our customers in selling their products and solutions which incorporate our wireless products, services and software; |
• | development and timing of the introduction of our new products including the timing of sales orders, OEM and distributor customer sell through and design win cycles in our embedded wireless module business; |
• | transition periods associated with the migration to new technologies; |
• | potential commoditization and saturation in certain markets; |
• | our ability to accurately forecast demand in order to properly align the purchase of components and the appropriate level of manufacturing capability; |
• | product mix of our sales (our products have different gross margins - for example the embedded wireless module product line has lower gross margins than the higher margin rugged mobile product line); |
• | possible delays or shortages in component supplies; |
• | possible delays in the manufacture or shipment of current or new products and the introduction of new services; |
• | possible product or service quality or factory yield issues that may increase our cost of goods sold; |
• | concentration in our customer base; |
• | seasonality in demand; |
• | amount of inventory held by our channel partners; |
• | possible fluctuations in certain foreign currencies relative to the U.S. dollar that may affect foreign denominated revenue, cost of goods sold and operating expenses; |
• | impairment of our goodwill or intangible assets which may result in a significant charge to earnings in the period in which an impairment is determined; |
• | achievement of milestones related to our professional services contracts; and |
• | operating expenses that are generally fixed in the short-term and therefore difficult to rapidly adjust to different levels of business. |
Any of the factors listed above could cause significant variations in our revenues, gross margin and earnings in any given quarter. Therefore, our quarterly results are not necessarily indicative of our overall business, results of operations, and financial condition.
Quarterly variations in operating results or any of the other factors listed above, changes in financial estimates by securities analysts, or other events or factors may result in wide fluctuations in the market price of our common shares. Broad market fluctuations or any failure of our operating results in a particular quarter to meet market expectations may adversely affect the market price of our common shares.
We may have difficulty responding to changing technology, industry standards and customer requirements, and therefore be unable to develop new products or services in a timely manner which meet the needs of our customers.
The wireless communications industry is subject to rapid technological change, including evolving industry standards, frequent new product inventions, constant improvements in performance characteristics and short product life cycles. Our business and future success will depend, in part, on our ability to accurately predict and anticipate evolving wireless technology standards and develop products and services that keep pace with the continuing changes in technology, evolving industry standards and changing customer and end-user preferences and requirements. Our products embody complex technology that may not meet those standards, preferences and requirements. Our ability to design, develop and commercially launch new products and services depends on a number of factors including, but not limited to, the following:
• | our ability to design and manufacture products or implement solutions and services at an acceptable cost and quality; |
• | our ability to attract and retain skilled technical employees; |
• | the availability of critical components from third parties; |
• | our ability to successfully complete the development of products in a timely manner; and |
48
• | the ability of third parties to complete and deliver on outsourced product development engagements. |
A failure by us, or our suppliers, in any of these areas or a failure of new products or services to obtain commercial acceptance, could mean we receive less revenue than we anticipate and we may be unable to recover our research and development expenses.
We develop products and services to meet our customers' requirements. OEM customers award design wins for the integration of wide area embedded wireless modules on a platform by platform basis. Current design wins do not guarantee future design wins. If we are unable or choose not to meet our customers' needs, we may not win their future business and our revenue and profitability may decrease.
In addition, wireless communications service providers require that wireless data systems deployed on their networks comply with their own standards, which may differ from the standards of other providers. We may be unable to successfully address these developments on a timely basis or at all. Our failure to respond quickly and cost-effectively to new standards through the development of new products or enhancements to existing products could cause us to be unable to recover significant research and development expenses and reduce our revenues.
We may be unable to attract or retain key personnel which may harm our ability to compete effectively.
Our success depends in large part on the skills and experience of our executive officers and other key employees. The loss of key employees or deterioration in overall employee morale and engagement as a result of organizational change could have an adverse impact on our growth, operations and profitability.
Competition for highly skilled management, technical, research and development and other key employees is intense in the wireless communications industry. We may not be able to retain our current executive officers or key employees and may not be able to hire and transition in a timely manner experienced and highly qualified additional executive officers and key employees as needed to achieve our business objectives. We do not have fixed-term employment agreements with our key personnel. The loss of executive officers and key employees could disrupt our operations and our ability to compete effectively could be adversely affected.
We may be found to infringe on the intellectual property rights of others.
The industry has many participants that own, or claim to own, proprietary intellectual property. We license technology, intellectual property and software from third parties for use in our products and may be required to license additional technology, intellectual property and software in the future. In some cases, these licenses provide us with certain pass-through rights for the use of other third party intellectual property. There is no assurance that we will be able to maintain our third-party licenses or obtain new licenses when required and this inability could materially adversely affect our business and operating results and the quality and functionality of our products.
In the past we have received, and in the future, we are likely to continue to receive, assertions or claims from third parties alleging that our products violate or infringe their intellectual property rights. We may be subject to these claims directly or through indemnities against these claims which we have provided to certain customers and other third parties. Our component suppliers and technology licensors do not typically indemnify us against these claims and therefore we do not have recourse against them in the event a claim is asserted against us or a customer we have indemnified. This potential liability, if realized, could materially adversely affect our operating results and financial condition.
Activity in this area by third parties, particularly those with tenuous claims, is increasing, resulting in us taking a more aggressive defensive approach, which may result in increased litigation. In the last few years, patent claims have been brought against us by third parties whose primary (or sole) business purpose is to acquire patents and other intellectual property rights, and not to manufacture and sell products and services. These entities aggressively pursue patent litigation, resulting in increased litigation costs for us. We expect that this recent development will continue for the foreseeable future. Infringement of intellectual property can be difficult to
49
verify and litigation may be necessary to establish if we have infringed the intellectual property rights of others. In many cases, these third parties are companies with substantially greater resources than us, and they may choose to pursue complex litigation to a greater degree than we could. Regardless of whether these infringement claims have merit or not, we may be subject to the following:
• | we may be found to be liable for potentially substantial damages, liabilities and litigation costs, including attorneys' fees; |
• | we may be prohibited from further use of intellectual property because of an injunction and may be required to cease selling our products that are subject to the claim; |
• | we may have to license third party intellectual property, incurring royalty fees that may or may not be on commercially reasonable terms; in addition, there is no assurance that we will be able to successfully negotiate and obtain such a license from the third party; |
• | we may have to develop a non-infringing alternative, which could be costly and delay or result in the loss of sales; in addition, there is no assurance that we will be able to develop such a non-infringing alternative; |
• | management attention and resources may be diverted; |
• | our relationships with customers may be adversely affected; and |
• | we may be required to indemnify our customers for certain costs and damages they incur in such a claim. |
In addition to potentially being found to be liable for substantial damages in the event of an unfavorable outcome in such a claim and if we are unable to either obtain a license from the third party on commercial terms or develop a non-infringing alternative, we may have to cease the sale of certain products and restructure our business and, as a result, our operating results and financial condition may be materially adversely affected.
Misappropriation of our intellectual property could place us at a competitive disadvantage.
Our intellectual property is important to our success. We rely on a combination of patent protection, copyrights, trademarks, trade secrets, licenses, non-disclosure agreements and other contractual agreements to protect our intellectual property. Third parties may attempt to copy aspects of our products and technology or obtain information we regard as proprietary without our authorization. If we are unable to protect our intellectual property against unauthorized use by others it could have an adverse effect on our competitive position. Our strategies to deter misappropriation could be inadequate due to the following risks:
• | non-recognition of the proprietary nature or inadequate protection of our methodologies in the United States, Canada, France or other foreign countries; |
• | undetected misappropriation of our intellectual property; |
• | the substantial legal and other costs of protecting and enforcing our rights in our intellectual property; and |
• | development of similar technologies by our competitors. |
In addition, we could be required to spend significant funds and management resources could be diverted to defend our rights, which could disrupt our operations.
Continued difficult or uncertain global economic conditions could adversely affect our operating results and financial condition.
A significant portion of our business is in the United States, Europe and the Asia-Pacific region and we are particularly exposed to the downturns and current uncertainties that impact the wireless communications industry in those economies. Economic uncertainty may cause an increased level of commercial and consumer delinquencies, lack of consumer confidence resulting in delayed purchases or reduced volumes by our customers, credit tightening by lenders, increased market volatility, fluctuations in foreign exchange rates and widespread reduction of business activity generally. To the extent that we experience further economic uncertainty, or deterioration in one of our large markets in the United States, Europe or the Asia-Pacific region, the resulting economic pressure on our customers may cause them to end their relationship with us, reduce or postpone
50
current or expected orders for our products or services, or suffer from business failure, resulting in a material adverse impact to our revenues, profitability, cash flow and bad debt expense.
It is difficult to estimate or project the level of economic activity, including economic growth, in the markets we serve. As our budgeting and forecasting is based on the demand for our products and services, these economic uncertainties result in it being difficult for us to estimate future revenue and expenses.
We depend on single source suppliers for some components used in our products and if these suppliers are unable to meet our demand, the delivery of our products to our customers may be interrupted.
From time to time, certain components used in our products have been, and may continue to be, in short supply. Such shortages in allocation of components may result in a delay in filling orders from our customers, which may adversely affect our business. In addition, our products are comprised of components, some of which are procured from single source suppliers, including where we have licensed certain software embedded in a component. Our single source suppliers may experience damage or interruption in their operations due to unforeseen events, become insolvent or bankrupt, or experience claims of infringement, all of which could delay or stop their shipment of components to us, which may adversely affect our business, operating results and financial condition. If there is a shortage of any such components and we cannot obtain an appropriate substitute from an alternate supplier of components, we may not be able to deliver sufficient quantities of our products to our customers. If such shortages occur, we may lose business or customers and our operating results and financial condition may be materially adversely affected.
Failures of our products or services due to design flaws and errors, component quality issues, manufacturing defects, network service interruptions or other quality issues that may result in product liability claims and product recalls could lead to unanticipated costs or otherwise harm our business.
Our products are comprised of hardware and software that is technologically complex and we are reliant on third parties to provide important components for our products. It is possible that our products and IoT services may contain undetected errors, defects or security vulnerabilities. As a result, our products or IoT services may be rejected by our customers or our services may be unavailable to our customers leading to loss of business, loss of revenue, additional development and customer service costs, unanticipated warranty claims, payment of monetary damages under contractual provisions and damage to our reputation.
In addition, our IoT services, including information systems and telecommunications infrastructure, could be disrupted by technological failures or cyber-attacks which could result in the inability of our customers to receive our services for an indeterminate period of time. Any disruption to our services, such as failure of our network operations centers to function as required, or extended periods of reduced levels of service could cause us to lose customers or revenue, result in delays or cancellations of future implementations of our products and services, result in failure to attract customers, require customer service or repair work that would involve substantial costs, result in loss of customer data, result in litigation, payment of monetary damages under contractual provisions and distract management from operating our business.
We depend on a limited number of third parties to manufacture our products. If they do not manufacture our products properly or cannot meet our needs in a timely manner, we may be unable to fulfill our product delivery obligations and our costs may increase, and our revenue and margins could decrease.
We outsource the manufacturing of our products to several contract manufacturers and depend on these manufacturers to meet our needs in a timely and satisfactory manner at a reasonable cost. Third party manufacturers, or other third parties to which such third-party manufacturers in turn outsource our manufacturing requirements, may not be able to satisfy our manufacturing requirements on a timely basis, including by failing to meet scheduled production and delivery deadlines or to meet our product quality requirements or the product quality requirements of our customers. Insufficient supply or an interruption or stoppage of supply from such third-party manufacturers or our inability to obtain additional or substitute manufacturers when and if needed, and on a cost-effective basis, could have a material adverse effect on our
51
business, results of operations and financial condition. Our reliance on third party manufacturers subjects us to a number of risks, including but not limited to the following:
• | potential business interruption due to unexpected events such as natural disasters, labor unrest, cyber-attacks, technological issues or geopolitical events; |
• | the absence of guaranteed or adequate manufacturing capacity; |
• | potential violations of laws and regulations by our manufacturers that may subject us to additional costs for duties, monetary penalties, seizure and loss of our products or loss of our import privileges, and damage to our reputation; |
• | reduced control over delivery schedules, production levels, manufacturing yields, costs and product quality; |
• | the inability of our contract manufacturers to secure adequate volumes of components in a timely manner at a reasonable cost; and |
• | unexpected increases in manufacturing costs. |
If we are unable to successfully manage any of these risks or to locate alternative or additional manufacturers or suppliers in a timely and cost-effective manner, we may not be able to deliver products in a timely manner. In addition, our results of operations could be harmed by increased costs, reduced revenues and reduced margins.
Under our manufacturing agreements, in many cases we are required to place binding purchase orders with our manufacturers well in advance of our receipt of binding purchase orders from our customers. In these situations, we consider our customers' good faith, non-binding forecasts of demand for our products. As a result, if the number of actual products ordered by our customers is materially different from the number of products we have instructed our manufacturer to build (and to purchase components in respect of), then, if too many components have been purchased by our manufacturer, we may be required to purchase such excess component inventory, or, if an insufficient number of components have been purchased by our manufacturer, we may not be in a position to meet all of our customers' requirements. If we are unable to successfully manage our inventory levels and respond to our customers' purchase orders based on their forecasted quantities, our business, operating results and financial condition could be adversely affected.
We have been subject to certain class action lawsuits, and may in the future be subject to class action or derivative action lawsuits, which if decided against us, could require us to pay substantial judgments, settlements or other penalties.
In addition to being subject to litigation in the ordinary course of business, in the future, we may be subject to class actions, derivative actions and other securities litigation and investigations. We expect that this type of litigation will be time consuming, expensive and will distract us from the conduct of our daily business. It is possible that we will be required to pay substantial judgments, settlements or other penalties and incur expenses that could have a material adverse effect on our operating results, liquidity or financial position. Expenses incurred in connection with these lawsuits, which include substantial fees of lawyers and other professional advisors and our obligations to indemnify officers and directors who may be parties to such actions, could materially adversely affect our reputation, operating results, liquidity or financial position. Furthermore, we do not know with certainty if any of this type of litigation and resulting expenses will be fully or even partially covered by our insurance. In addition, these lawsuits may cause our insurance premiums to increase in future periods.
We depend on mobile network operators to promote and offer acceptable wireless data services.
Our products and our wireless connectivity services can only be used over wireless data networks operated by third parties. Our business and future growth depends, in part, on the successful deployment by mobile network operators of next generation wireless data networks and appropriate pricing of wireless data services. We also depend on successful strategic relationships with our mobile network operator partners and our operating results and financial condition could be harmed if they increase the price of their services or experience operational
52
issues with their networks.In certain cases, our mobile network operator partners may also offer services that compete with our IoT Services business.
Contractual disputes could have a material adverse effect on our business.
Our business is exposed to the risk of contractual disputes with counterparties and as a result we may be involved in complaints, claims and litigation. We cannot predict the outcome of any complaint, claim or litigation. If a dispute cannot be resolved favorably, it may delay or interrupt our operations and may have a material adverse effect on our operating results, liquidity or financial position.
Government regulations could result in increased costs and inability to sell our products and services.
Our products and services are subject to certain mandatory regulatory approvals in the United States, Canada, the European Union, the Asia-Pacific region and other regions in which we operate. For example, in the United States the Federal Communications Commission regulates many aspects of communications devices. In Canada, similar regulations are administered by the Ministry of Industry, through Industry Canada. European Union directives provide comparable regulatory guidance in Europe. Although we have obtained all the necessary Federal Communications Commission, Industry Canada and other required approvals for the products we currently sell, we may not receive approvals for future products on a timely basis, or at all. In addition, regulatory requirements may change or we may not be able to receive regulatory approvals from countries in which we may desire to sell products in the future. If we fail to comply with the applicable regulatory requirements, we may be subject to regulatory and civil liability, additional costs (including fines), reputational harm, and in severe cases, we may be prevented from selling our products in certain jurisdictions.
We may also incur additional expenses or experience difficulties selling our products associated with complying with the SEC rules and reporting requirements related to conflict minerals. In August 2012, the SEC adopted new disclosure requirements implementing Section 1502 of the Dodd-Frank Wall Street Reform and Consumer Protection Act of 2010 for manufacturers of products containing certain minerals that may originate from the Democratic Republic of Congo and adjoining countries. As a result, since 2013 we have been required to conduct certain country of origin and due diligence procedures to meet the SEC reporting requirements. The impact of the regulations may limit the sourcing and availability, or may increase the costs, of some of the metals used in the manufacture of our products. Also, since our supply chain is complex, we may be unable to sufficiently verify the origins for all metals used in our products through our supplier due diligence procedures. As governments change in any of the markets in which we operate, there could be further uncertainties with respect to certain of our regulatory obligations in the near term, including with respect to fiscal and trade-related matters.
The transmission, use and disclosure of user data and personal information could give rise to liabilities or additional costs as a result of laws, governmental regulations and mobile network operator and other customer requirements or differing views of personal privacy rights.
Our products and services are used to transmit a large volume of data and potentially including personal information. This information is increasingly subject to legislation and regulations in numerous jurisdictions around the world that is intended to protect the privacy and security of personal information, as well as the collection, storage, transmission, use and disclosure of such information.
The interpretation of privacy and data protection laws in a number of jurisdictions is unclear and in a state of flux. There is a risk that these laws may be interpreted and applied in conflicting ways from country to country. Complying with these varying international requirements could cause us to incur additional costs and change our business practices. In addition, because our products and services are sold and used worldwide, certain foreign jurisdictions may claim that we are required to comply with their laws, even where we have no local entity, employees, or infrastructure.
We could be adversely affected if legislation or regulations are expanded to require changes in our products, services or business practices, if governmental authorities in the jurisdictions in which we do business interpret or
53
implement their legislation or regulations in ways that negatively affect our business or if end users allege that their personal information was misappropriated because of a defect or vulnerability in our products or services. If we are required to allocate significant resources to modify our products, services or our existing security procedures for the personal information that our products and services transmit, our business, results of operations and financial condition may be adversely affected. The Company is currently assessing its systems and processes regarding compliance with the European Union General Data Protection Regulation (GDPR) when that regulation comes into force in May 2018. The GDPR may result in increased costs and may impact our ability to sell our products and services.
We are subject to risks inherent in foreign operations.
Sales outside North America represented approximately 69% of our revenues in 2017 and and approximately 70% and 69% of our revenue in fiscal 2016 and 2015, respectively. We maintain offices in a number of foreign jurisdictions. We have limited experience conducting business in some of the jurisdictions outside North America and we may not be aware of all the factors that may affect our business in foreign jurisdictions. We are subject to a number of risks associated with our international business operations that may increase liabilities, costs, lengthen sales cycles and require significant management attention. These risks include:
• | compliance with the laws of the United States, Canada and other countries that apply to our international operations, including import and export legislation, lawful access and privacy laws; |
• | compliance with existing and emerging anti-corruption laws, including the Foreign Corrupt Practices Act of the United States, the Corruption of Foreign Public Officials Act of Canada and the UK Bribery Act; |
• | increased reliance on third parties to establish and maintain foreign operations; |
• | the complexities and expense of administering a business abroad; |
• | complications in compliance with, and unexpected changes in, foreign regulatory requirements, including requirements relating to content filtering and requests from law enforcement authorities; |
• | trading and investment policies; |
• | consumer protection laws that impose additional obligations on us or restrict our ability to provide limited warranty protection; |
• | instability in economic or political conditions, including inflation, recession and actual or anticipated military conflicts, social upheaval or political uncertainty; |
• | foreign currency fluctuations; |
• | foreign exchange controls and cash repatriation restrictions; |
• | tariffs and other trade barriers; |
• | difficulties in collecting accounts receivable; |
• | potential adverse tax consequences; |
• | uncertainties of laws and enforcement relating to the protection of intellectual property or secured technology; |
• | litigation in foreign court systems; |
• | cultural and language differences; |
• | difficulty in managing a geographically dispersed workforce in compliance with local laws and customs that vary from country to country; and |
• | other factors, depending upon the country involved. |
There can be no assurance that the policies and procedures implemented by us to address or mitigate these risks will be successful, that our personnel will comply with them, that we will not experience these factors in the future or that they will not have a material adverse effect on our business, results of operations and financial condition.
54
MANAGEMENT’S STATEMENT OF RESPONSIBILITIES
The accompanying consolidated financial statements have been prepared by management and approved by the Board of Directors of Sierra Wireless, Inc. The consolidated financial statements were prepared in accordance with accounting principles generally accepted in the United States and, where appropriate, reflect management’s best estimates and judgments. Where alternative accounting methods exist, management has chosen those methods deemed most appropriate in the circumstances. Management is responsible for the accuracy, integrity and objectivity of the consolidated financial statements within reasonable limits of materiality. Financial information provided elsewhere in the Annual Report is consistent with that in the consolidated financial statements.
To assist management in the discharge of these responsibilities, the Company maintains a system of internal controls over financial reporting as described in Management’s Annual Report on Internal Control Over Financial Reporting on page 42 of Management’s Discussion and Analysis.
The Company’s Audit Committee is appointed by the Board of Directors annually and is comprised exclusively of outside, independent directors. The Audit Committee meets with management as well as with the independent auditors to satisfy itself that management is properly discharging its financial reporting responsibilities and to review the consolidated financial statements and the independent auditors’ report. The Audit Committee reports its findings to the Board of Directors for consideration in approving the consolidated financial statements for presentation to the shareholders. The Audit Committee considers, for review by the Board of Directors and approval by the shareholders, the engagement or reappointment of the independent auditors. Ernst & Young LLP has direct access to the Audit Committee of the Board of Directors.
The consolidated financial statements have been independently audited by Ernst & Young LLP, Chartered Professional Accountants, on behalf of the shareholders, in accordance with the standards of the Public Company Accounting Oversight Board (United States) with respect to the consolidated financial statements for the year ended December 31, 2017. Their report outlines the nature of their audit and expresses their opinion on the consolidated financial statements of the Company.
 |  | |
Jason W. Cohenour | David G. McLennan | |
President and | Chief Financial Officer | |
Chief Executive Officer | ||
March 7, 2018 |
Vancouver, Canada |
55
REPORT OF INDEPENDENT REGISTERED PUBLIC ACCOUNTING FIRM
To the Shareholders and the Board of Directors of Sierra Wireless, Inc.
Opinion on the Financial Statements
We have audited the accompanying consolidated balance sheets of Sierra Wireless, Inc. (the Company) as of December 31, 2017 and 2016, the related consolidated statements of operations and comprehensive earnings (loss), equity and cash flows for each of the two years in the period ended December 31, 2017, and the related notes (collectively referred to as the “consolidated financial statements”). In our opinion, the consolidated financial statements present fairly, in all material respects, the financial position of the Company at December 31, 2017 and 2016, and the results of its operations and its cash flows for each of the two years in the period ended December 31, 2017, in conformity with U.S. generally accepted accounting principles.
We also have audited, in accordance with the standards of the Public Company Accounting Oversight Board (United States) (PCAOB), the Company's internal control over financial reporting as of December 31, 2017, based on criteria established in Internal Control-Integrated Framework issued by the Committee of Sponsoring Organizations of the Treadway Commission (2013 framework), and our report dated March 7, 2018 expressed an unqualified opinion thereon.
Basis for Opinion
These consolidated financial statements are the responsibility of the Company's management. Our responsibility is to express an opinion on the Company’s consolidated financial statements based on our audits. We are a public accounting firm registered with the PCAOB and are required to be independent with respect to the Company in accordance with the U.S. federal securities laws and the applicable rules and regulations of the Securities and Exchange Commission and the PCAOB.
We conducted our audits in accordance with the standards of the PCAOB. Those standards require that we plan and perform the audit to obtain reasonable assurance about whether the consolidated financial statements are free of material misstatement, whether due to error or fraud. Our audits included performing procedures to assess the risks of material misstatement of the consolidated financial statements, whether due to error or fraud, and performing procedures that respond to those risks. Such procedures included examining, on a test basis, evidence regarding the amounts and disclosures in the consolidated financial statements. Our audits also included evaluating the accounting principles used and significant estimates made by management, as well as evaluating the overall presentation of the consolidated financial statements. We believe that our audits provide a reasonable basis for our opinion.
 |
Chartered Professional Accountants |
We have served as the Company’s auditor since 2016. |
Vancouver, Canada |
March 7, 2018 |
56
REPORT OF INDEPENDENT REGISTERED PUBLIC ACCOUNTING FIRM
To the Shareholders and the Board of Directors of Sierra Wireless, Inc.
Opinion on Internal Control over Financial Reporting
We have audited Sierra Wireless, Inc.’s internal control over financial reporting as of December 31, 2017, based on criteria established in Internal Control-Integrated Framework issued by the Committee of Sponsoring Organizations of the Treadway Commission (2013 framework) (the COSO criteria). In our opinion, Sierra Wireless, Inc. (the Company) maintained, in all material respects, effective internal control over financial reporting as of December 31, 2017, based on the COSO criteria.
As indicated in Management’s Annual Report on Internal Control over Financial Reporting, management’s assessment of and conclusion on the effectiveness of internal control over financial reporting did not include the internal controls of Numerex Corp, which is included in the 2017 consolidated financial statements of the Company and constituted 3.47% of total assets as of December 31, 2017 and 0.45% of revenues, for the year then ended. Our audit of internal control over financial reporting of the Company also did not include an evaluation of the internal control over financial reporting of Numerex Corp.
We also have audited, in accordance with the standards of the Public Company Accounting Oversight Board (United States) (PCAOB), the consolidated balance sheets of Sierra Wireless, Inc. as of December 31, 2017 and 2016, the related consolidated statements of operations and comprehensive earnings (loss), equity and cash flows for each of the two years in the period ended December 31, 2017, and the related notes and our report dated March 7, 2018 expressed an unqualified opinion thereon.
Basis for Opinion
The Company’s management is responsible for maintaining effective internal control over financial reporting and for its assessment of the effectiveness of internal control over financial reporting included in the accompanying Management’s Annual Report on Internal Control over Financial Reporting. Our responsibility is to express an opinion on the Company’s internal control over financial reporting based on our audit. We are a public accounting firm registered with the PCAOB and are required to be independent with respect to the Company in accordance with the U.S. federal securities laws and the applicable rules and regulations of the Securities and Exchange Commission and the PCAOB.
We conducted our audit in accordance with the standards of the PCAOB. Those standards require that we plan and perform the audit to obtain reasonable assurance about whether effective internal control over financial reporting was maintained in all material respects. Our audit included obtaining an understanding of internal control over financial reporting, assessing the risk that a material weakness exists, testing and evaluating the design and operating effectiveness of internal control based on the assessed risk, and performing such other procedures as we considered necessary in the circumstances. We believe that our audit provides a reasonable basis for our opinion.
57
Definition and Limitations of Internal Control Over Financial Reporting
A company’s internal control over financial reporting is a process designed to provide reasonable assurance regarding the reliability of financial reporting and the preparation of financial statements for external purposes in accordance with generally accepted accounting principles. A company’s internal control over financial reporting includes those policies and procedures that (1) pertain to the maintenance of records that, in reasonable detail, accurately and fairly reflect the transactions and dispositions of the assets of the company; (2) provide reasonable assurance that transactions are recorded as necessary to permit preparation of financial statements in accordance with generally accepted accounting principles, and that receipts and expenditures of the company are being made only in accordance with authorizations of management and directors of the company; and (3) provide reasonable assurance regarding prevention or timely detection of unauthorized acquisition, use, or disposition of the company’s assets that could have a material effect on the financial statements.
Because of its inherent limitations, internal control over financial reporting may not prevent or detect misstatements. Also, projections of any evaluation of effectiveness to future periods are subject to the risk that controls may become inadequate because of changes in conditions, or that the degree of compliance with the policies or procedures may deteriorate.
|
Chartered Professional Accountants |
Vancouver, Canada |
March 7, 2018 |
58
REPORT OF INDEPENDENT REGISTERED PUBLIC ACCOUNTING FIRM
To the Shareholders and Directors of Sierra Wireless, Inc.
We have audited the consolidated statements of operations and comprehensive earnings (loss), equity and cash flows of Sierra Wireless, Inc. for the year ended December 31, 2015. These consolidated financial statements are the responsibility of Sierra Wireless, Inc.'s management. Our responsibility is to express an opinion on these consolidated financial statements based on our audit.
We conducted our audit in accordance with the standards of the Public Company Accounting Oversight Board (United States). Those standards require that we plan and perform the audit to obtain reasonable assurance about whether the financial statements are free of material misstatement. An audit includes examining, on a test basis, evidence supporting the amounts and disclosures in the financial statements. An audit also includes assessing the accounting principles used and significant estimates made by management, as well as evaluating the overall financial statement presentation. We believe that our audit provides a reasonable basis for our opinion.
In our opinion, the consolidated financial statements referred to above present fairly, in all material respects, the consolidated results of operations and its consolidated cash flows of Sierra Wireless, Inc. for the year period ended December 31, 2015 in conformity with U.S. generally accepted accounting principles.

Chartered Professional Accountants
February 29, 2016
Vancouver, Canada
59
SIERRA WIRELESS, INC.
CONSOLIDATED STATEMENTS OF OPERATIONS AND COMPREHENSIVE EARNINGS (LOSS)
(In thousands of U.S. dollars, except where otherwise stated)
Years ended December 31, | ||||||||||||
2017 | 2016 | 2015 | ||||||||||
Revenue | $ | 692,077 | $ | 615,607 | $ | 607,798 | ||||||
Cost of goods sold | 457,130 | 397,864 | 413,943 | |||||||||
Gross margin | 234,947 | 217,743 | 193,855 | |||||||||
Expenses | ||||||||||||
Sales and marketing | 75,594 | 64,242 | 54,144 | |||||||||
Research and development (note 7) | 83,361 | 73,077 | 74,020 | |||||||||
Administration | 42,904 | 40,956 | 40,321 | |||||||||
Restructuring (note 8) | 1,076 | — | 951 | |||||||||
Acquisition-related and integration | 8,195 | 843 | 1,945 | |||||||||
Impairment (note 17) | 3,668 | — | — | |||||||||
Amortization | 20,508 | 17,277 | 12,360 | |||||||||
235,306 | 196,395 | 183,741 | ||||||||||
Earnings (loss) from operations | (359 | ) | 21,348 | 10,114 | ||||||||
Foreign exchange gain (loss) | 7,550 | (1,736 | ) | (11,843 | ) | |||||||
Other income (note 9) | 67 | 83 | 115 | |||||||||
Earnings (loss) before income taxes | 7,258 | 19,695 | (1,614 | ) | ||||||||
Income tax expense (note 10) | 3,123 | 4,310 | 1,060 | |||||||||
Net earnings (loss) | 4,135 | 15,385 | (2,674 | ) | ||||||||
Other comprehensive income (loss), net of taxes: | ||||||||||||
Foreign currency translation adjustments, net of taxes of $nil | 11,950 | (6,448 | ) | (2,013 | ) | |||||||
Total comprehensive earnings (loss) | $ | 16,085 | $ | 8,937 | $ | (4,687 | ) | |||||
Net earnings (loss) per share (in dollars) (note 12) | ||||||||||||
Basic | $ | 0.13 | $ | 0.48 | $ | (0.08 | ) | |||||
Diluted | 0.13 | $ | 0.48 | (0.08 | ) | |||||||
Weighted average number of shares outstanding (in thousands) (note 12) | ||||||||||||
Basic | 32,356 | 32,032 | 32,166 | |||||||||
Diluted | 32,893 | 32,335 | 32,166 | |||||||||
The accompanying notes are an integral part of the consolidated financial statements.
60
SIERRA WIRELESS, INC.
CONSOLIDATED BALANCE SHEETS
(In thousands of U.S. dollars, except where otherwise stated)
As at December 31, | ||||||||
2017 | 2016 | |||||||
Assets | ||||||||
Current assets | ||||||||
Cash and cash equivalents | $ | 65,003 | $ | 102,772 | ||||
Restricted cash | 221 | — | ||||||
Accounts receivable (note 13) | 168,503 | 143,798 | ||||||
Inventories (note 14) | 53,026 | 40,913 | ||||||
Prepaids and other (note 15) | 8,006 | 6,530 | ||||||
294,759 | 294,013 | |||||||
Property and equipment (note 16) | 42,977 | 34,180 | ||||||
Intangible assets (note 17) | 108,599 | 74,863 | ||||||
Goodwill (note 18) | 218,516 | 154,114 | ||||||
Deferred income taxes (note 10) | 12,197 | 16,039 | ||||||
Other assets | 12,058 | 5,250 | ||||||
$ | 689,106 | $ | 578,459 | |||||
Liabilities | ||||||||
Current liabilities | ||||||||
Accounts payable and accrued liabilities (note 19) | $ | 172,395 | $ | 167,500 | ||||
Deferred revenue and credits | 5,455 | 5,263 | ||||||
177,850 | 172,763 | |||||||
Long-term obligations (note 20) | 36,637 | 32,654 | ||||||
Deferred income taxes (note 10) | 7,702 | 11,458 | ||||||
222,189 | 216,875 | |||||||
Equity | ||||||||
Shareholders’ equity | ||||||||
Common stock: no par value; unlimited shares authorized; issued and outstanding: | ||||||||
35,861,510 shares (December 31, 2016 — 31,859,960 shares) | 427,748 | 342,450 | ||||||
Preferred stock: no par value; unlimited shares authorized; issued and outstanding: nil shares | — | — | ||||||
Treasury stock: at cost; 222,639 shares (December 31, 2016 — 355,471 shares) | (3,216 | ) | (5,134 | ) | ||||
Additional paid-in capital | 27,962 | 24,976 | ||||||
Retained earnings | 16,899 | 13,718 | ||||||
Accumulated other comprehensive loss (note 21) | (2,476 | ) | (14,426 | ) | ||||
466,917 | 361,584 | |||||||
$ | 689,106 | $ | 578,459 | |||||
Commitments and contingencies (note 26) | ||||||||
The accompanying notes are an integral part of the consolidated financial statements.
On behalf of the Board:
 |  | |
Jason W. Cohenour | Paul G. Cataford | |
Director | Director | |
61
SIERRA WIRELESS, INC.
CONSOLIDATED STATEMENTS OF EQUITY
(in thousands of U.S. dollars, except where otherwise stated)
Common Stock | Treasury Shares | |||||||||||||||||||||||||||||
# of shares | $ | # of shares | $ | Additional paid-in capital | Retained earnings (deficit) | Accumulated other comprehensive income (loss) | Total | |||||||||||||||||||||||
Balance as at December 31, 2014 | 31,868,541 | $ | 339,640 | 342,645 | $ | (6,236 | ) | $ | 26,909 | $ | 2,514 | $ | (5,965 | ) | $ | 356,862 | ||||||||||||||
Stock option exercises (note 11) | 357,136 | 5,434 | — | — | (1,597 | ) | — | — | 3,837 | |||||||||||||||||||||
Stock-based compensation (note 11) | — | — | — | — | 8,942 | — | — | 8,942 | ||||||||||||||||||||||
Purchase of treasury shares for RSU distribution | — | — | 306,476 | (6,584 | ) | — | — | — | (6,584 | ) | ||||||||||||||||||||
Distribution of vested RSUs | 111,524 | 1,379 | (408,508 | ) | 8,803 | (12,526 | ) | — | — | (2,344 | ) | |||||||||||||||||||
Excess tax benefits from equity awards | — | — | — | — | 2,270 | — | — | 2,270 | ||||||||||||||||||||||
Net loss | — | — | — | — | — | (2,674 | ) | — | (2,674 | ) | ||||||||||||||||||||
Foreign currency translation adjustments, net of tax | — | — | — | — | — | — | (2,013 | ) | (2,013 | ) | ||||||||||||||||||||
Balance as at December 31, 2015 | 32,337,201 | $ | 346,453 | 240,613 | $ | (4,017 | ) | $ | 23,998 | $ | (160 | ) | $ | (7,978 | ) | $ | 358,296 | |||||||||||||
Common share cancellation (note 22) | (809,872 | ) | (8,696 | ) | — | — | — | (1,507 | ) | — | (10,203 | ) | ||||||||||||||||||
Stock option exercises (note 11) | 231,704 | 2,906 | — | — | (858 | ) | — | — | 2,048 | |||||||||||||||||||||
Stock-based compensation (note 11) | — | — | — | — | 7,629 | — | — | 7,629 | ||||||||||||||||||||||
Purchase of treasury shares for RSU distribution | — | — | 305,629 | (4,214 | ) | — | — | — | (4,214 | ) | ||||||||||||||||||||
Distribution of vested RSUs | 100,927 | 1,787 | (190,771 | ) | 3,097 | (5,793 | ) | — | — | (909 | ) | |||||||||||||||||||
Net earnings | — | — | — | — | — | 15,385 | — | 15,385 | ||||||||||||||||||||||
Foreign currency translation adjustments, net of tax | — | — | — | — | — | — | (6,448 | ) | (6,448 | ) | ||||||||||||||||||||
Balance as at December 31, 2016 | 31,859,960 | $ | 342,450 | 355,471 | $ | (5,134 | ) | $ | 24,976 | $ | 13,718 | $ | (14,426 | ) | $ | 361,584 | ||||||||||||||
Common share cancellation (note 22) | (170,217 | ) | (1,825 | ) | — | — | — | (954 | ) | — | (2,779 | ) | ||||||||||||||||||
Stock option exercises (note 11) | 500,184 | 8,122 | — | — | (2,282 | ) | — | — | 5,840 | |||||||||||||||||||||
Stock-based compensation (note 11) | — | — | — | — | 10,341 | — | — | 10,341 | ||||||||||||||||||||||
Distribution of vested RSUs | 90,751 | 1,788 | (132,832 | ) | 1,918 | (5,073 | ) | — | — | (1,367 | ) | |||||||||||||||||||
Issue of shares on Numerex acquisition, net of share issue cost of $132 (note 5(a)) | 3,580,832 | 77,213 | — | — | — | — | — | 77,213 | ||||||||||||||||||||||
Net earnings | — | — | — | — | — | 4,135 | — | 4,135 | ||||||||||||||||||||||
Foreign currency translation adjustments, net of tax | — | — | — | — | — | — | 11,950 | 11,950 | ||||||||||||||||||||||
Balance as at December 31, 2017 | 35,861,510 | $ | 427,748 | 222,639 | $ | (3,216 | ) | $ | 27,962 | $ | 16,899 | $ | (2,476 | ) | $ | 466,917 | ||||||||||||||
The accompanying notes are an integral part of the consolidated financial statements.
62
SIERRA WIRELESS, INC.
CONSOLIDATED STATEMENTS OF CASH FLOWS
(In thousands of U.S. dollars)
Years ended December 31, | ||||||||||||
2017 | 2016 | 2015 | ||||||||||
Cash flows provided by (used in): | ||||||||||||
Operating activities | ||||||||||||
Net earnings (loss) | $ | 4,135 | $ | 15,385 | $ | (2,674 | ) | |||||
Items not requiring (providing) cash | ||||||||||||
Amortization | 30,503 | 25,894 | 20,216 | |||||||||
Stock-based compensation (note 11(a)) | 10,341 | 7,629 | 8,942 | |||||||||
Deferred income taxes | 748 | (2,707 | ) | (2,841 | ) | |||||||
Reduction in accrued royalty obligation | — | (13,045 | ) | — | ||||||||
Impairment | 3,668 | — | — | |||||||||
Unrealized foreign exchange loss (gain) | (8,507 | ) | (862 | ) | 6,219 | |||||||
Other | (55 | ) | (303 | ) | (773 | ) | ||||||
Changes in non-cash working capital | ||||||||||||
Accounts receivable | (10,584 | ) | (26,475 | ) | (8,437 | ) | ||||||
Inventories | (6,806 | ) | (5,785 | ) | (16,262 | ) | ||||||
Prepaids and other | (4,875 | ) | 6,970 | (5,748 | ) | |||||||
Accounts payable and accrued liabilities | (18,932 | ) | 38,601 | 18,612 | ||||||||
Deferred revenue and credits | (564 | ) | 1,203 | (451 | ) | |||||||
Cash flows provided by (used in) operating activities | (928 | ) | 46,505 | 16,803 | ||||||||
Investing activities | ||||||||||||
Additions to property and equipment | (14,100 | ) | (16,957 | ) | (14,003 | ) | ||||||
Additions to intangible assets | (1,706 | ) | (900 | ) | (1,076 | ) | ||||||
Proceeds from sale of property & equipment | 35 | 3 | 5 | |||||||||
Acquisitions, net of cash acquired: | ||||||||||||
Numerex Corp (note 5(a)) | (18,725 | ) | — | — | ||||||||
GNSS business of GlobalTop (note 5(b)) | (3,145 | ) | — | — | ||||||||
Blue Creation (note 5(c)) | — | (2,882 | ) | — | ||||||||
GenX Mobile Inc. (note 5(d)) | — | (5,900 | ) | — | ||||||||
MobiquiThings SAS (note 5(e)) | — | — | (14,975 | ) | ||||||||
Accel Networks LLC (note 5(f)) | — | — | (9,471 | ) | ||||||||
Wireless Maingate AB (note 5(g)) | — | — | (88,449 | ) | ||||||||
Cash flows used in investing activities | (37,641 | ) | (26,636 | ) | (127,969 | ) | ||||||
Financing activities | ||||||||||||
Issuance of common shares, net of issuance cost | 5,708 | 2,048 | 3,837 | |||||||||
Repurchase of common shares for cancellation (note 22) | (2,779 | ) | (10,203 | ) | — | |||||||
Purchase of treasury shares for RSU distribution | — | (4,214 | ) | (6,584 | ) | |||||||
Taxes paid related to net settlement of equity awards | (1,367 | ) | (909 | ) | (2,344 | ) | ||||||
Payment for contingent consideration | (1,397 | ) | (16 | ) | — | |||||||
Decrease in other long-term obligations | (436 | ) | (395 | ) | (226 | ) | ||||||
Cash flows used in financing activities | (271 | ) | (13,689 | ) | (5,317 | ) | ||||||
Effect of foreign exchange rate changes on cash and cash equivalents | 1,292 | 2,656 | 3,357 | |||||||||
Cash and cash equivalents and restricted cash, increase (decrease) in the year | (37,548 | ) | 8,836 | (113,126 | ) | |||||||
Cash and cash equivalents and restricted cash, beginning of year | 102,772 | 93,936 | 207,062 | |||||||||
Cash and cash equivalents and restricted cash, end of year | $ | 65,224 | $ | 102,772 | $ | 93,936 | ||||||
Supplemental cash flow information (note 23)
The accompanying notes are an integral part of the consolidated financial statements.
63
SIERRA WIRELESS, INC.
TABLE OF CONTENTS
NOTES TO THE CONSOLIDATED FINANCIAL STATEMENTS
Page | ||
Note 1 | Nature of Operations | |
Note 2 | Summary of Significant Accounting Policies | |
Note 3 | Recently Implemented Accounting Standards | |
Note 4 | Changes in Future Accounting Standards | |
Note 5 | Acquisitions | |
Note 6 | Segmented Information | |
Note 7 | Research and Development | |
Note 8 | Restructuring | |
Note 9 | Other Income | |
Note 10 | Income Taxes | |
Note 11 | Stock-based Compensation Plans | |
Note 12 | Earnings (Loss) Per Share | |
Note 13 | Accounts Receivable | |
Note 14 | Inventories | |
Note 15 | Prepaids and Other | |
Note 16 | Property and Equipment | |
Note 17 | Intangible Assets | |
Note 18 | Goodwill | |
Note 19 | Accounts Payable and Accrued Liabilities | |
Note 20 | Long-term Obligations | |
Note 21 | Accumulated Other Comprehensive Loss | |
Note 22 | Share Capital | |
Note 23 | Supplemental Cash Flow Information | |
Note 24 | Fair Value Measurement | |
Note 25 | Financial Instruments | |
Note 26 | Commitments and Contingencies | |
64
SIERRA WIRELESS, INC.
NOTES TO THE CONSOLIDATED FINANCIAL STATEMENTS
(In thousands of U.S. dollars, except where otherwise stated)
1. NATURE OF OPERATIONS
Sierra Wireless, Inc., together with its subsidiaries (collectively, "the company, we, our”) was incorporated under the Canada Business Corporations Act on May 31, 1993. Sierra Wireless is an Internet of Things (“IoT”) pioneer, empowering businesses and industries to transform and thrive in the connected economy. Customers start their IoT deployments with Sierra Wireless because we provide an integrated device-to-cloud solution comprised of embedded and networking solutions seamlessly connected with our IoT services. Original Equipment Manufacturers (“OEMs”) and enterprises worldwide rely on our expertise in delivering fully-integrated solutions to reduce complexity, turn edge network data into intelligent decisions and get their connected products and services to market faster.
We have sales, engineering, and research and development teams located in offices around the world. The primary markets for our products are North America, Europe and Asia Pacific.
We operate our business under three reportable segments:
OEM Solutions | Embedded cellular modules, short range wireless modules, software and tools for OEM customers who integrate wirelessly into their products and solutions. |
Enterprise Solutions | Intelligent routers and gateways, and management solutions that enable cellular connectivity. |
IoT Services | Internet services including a cloud-based platform for deploying and managing IoT applications, Smart SIM supported by our mobile core networks, and managed wireless broadband services to enable worldwide customer IoT deployments. Effective December 11, 2017, our former Cloud and Connectivity Services segment was renamed to IoT Services to reflect the acquisition of Numerex Corp. (note 5 (a)). |
2. SUMMARY OF SIGNIFICANT ACCOUNTING POLICIES
Our consolidated financial statements are prepared in accordance with U.S. GAAP.
(a) Basis of consolidation
Our consolidated financial statements include the accounts of the company and its subsidiaries, all of which are wholly-owned, from their respective dates of acquisition of control. All inter-company transactions and balances have been eliminated on consolidation.
(b) Use of estimates
The consolidated financial statements have been prepared in conformity with U.S. GAAP, which requires management to make estimates and assumptions that affect the reported amounts of assets and liabilities, the disclosure of contingent assets and liabilities at the date of the financial statements, and the reported amounts of revenues and expenses during the year. On an ongoing basis, management reviews its estimates, including those related to inventory obsolescence, estimated useful lives of long-lived assets, valuation of intangible assets, goodwill, royalty and warranty accruals, other liabilities, stock-based compensation, allowance for doubtful accounts receivable, income taxes, restructuring costs, contingent consideration and commitments and contingencies, based on currently available information. Actual amounts could differ from estimates.
65
SIERRA WIRELESS, INC.
NOTES TO THE CONSOLIDATED FINANCIAL STATEMENTS
(In thousands of U.S. dollars, except where otherwise stated)
(c) Revenue recognition
Revenue from sales of products and services is recognized upon the later of transfer of title or upon shipment of the product to the customer or rendering of the service, as long as persuasive evidence of an arrangement exists, delivery has occurred, price is fixed or determinable, and collection is reasonably assured.
Contractual allowances for product returns and price amendments are estimated and recorded as a reduction to revenue.
Cash received in advance of the revenue recognition criteria being met is recorded as deferred revenue.
Revenues from contracts with multiple-element arrangements are recognized as each element is earned based on the relative fair value of each element and only when there are no undelivered elements that are essential to the functionality of the delivered elements.
Revenue from activation or set up fees charged in advance of contracted monthly recurring revenue is deferred and recognized over the estimated customer or specific contract life on a straight line basis. Revenue from cloud and connectivity subscription services are generally billed monthly and recognized when earned.
Revenue from licensed software is recognized at the inception of the license term. Revenue from software maintenance, unspecified upgrades and technical support contracts is recognized over the period such items are delivered or services are provided. Technical support contracts extending beyond the current period are recorded as deferred revenue and amortized into income over the applicable earning period.
Funding from certain research and development agreements is recognized as revenue when certain criteria stipulated under the terms of those funding agreements have been met, and when there is reasonable assurance the funding will be received. Certain research and development funding may be repayable on the occurrence of specified future events.
(d) Research and development costs
Research and development costs are expensed as they are incurred. We capitalize certain software development costs principally related to software coding, designing system interfaces and installation, and testing of the software, once technological feasibility is reached.
We follow the cost reduction method of accounting for certain agreements, including government research and development funding, whereby the benefit of the funding is recognized as a reduction in the cost of the related expenditure when certain criteria stipulated under the terms of those funding agreements have been met, and there is reasonable assurance the research and development funding will be received.
66
SIERRA WIRELESS, INC.
NOTES TO THE CONSOLIDATED FINANCIAL STATEMENTS
(In thousands of U.S. dollars, except where otherwise stated)
(e) Warranty costs
Warranty costs are accrued upon the recognition of related revenue, based on our best estimates, with reference to past and expected future experience. Warranty obligations are included in accounts payable and accrued liabilities in our consolidated balance sheet.
(f) Royalty costs
We have intellectual property license agreements which generally require us to make royalty payments based on a combination of fixed fees and percentage of the revenue generated by sales of products incorporating the licensed technology. We recognize royalty obligations in accordance with the terms of the respective royalty agreements. Royalty costs are recorded as a component of cost of goods sold in the period when incurred.
Where agreements are not in place, we recognize our current best estimate of the royalty obligation in cost of goods sold, accrued liabilities and long-term liabilities. Historically (prior to October 1, 2016), in determining this estimate, we based our calculations on an assumption that royalty calculations could be based on a percentage of the entire value of an end-product (i.e., revenue). This conformed with our legacy license agreements.
Significant legal precedent now exists in the United States supporting the smallest saleable unit (“SSU”) principle (i.e., the principle that any royalty obligations should be no more than a portion of the profits for a component within the product that implements the patented technology) as the appropriate methodology for determining FRAND standard essential patent (“SEP”) royalties. Using this principle, the royalty accrual on our products is based on the value of the patented technology in the chipset, representing the SSU that implements the technology, and not on the entire value of the end-product.
The cumulative effect of these legal changes to the licensing landscape, combined with supportive legislative initiatives and broad industry support for the SSU principle, at the time of the expiry of one of our significant legacy IP licenses, prompted management to reassess its contingent royalty obligation estimate during the fourth quarter of the year ended December 31, 2016. The use of the SSU principle as the basis to determine the estimate, as opposed to value of end-product, resulted in a reduction of $13.0 million to our estimated royalty obligation effective October 1, 2016.
(g) Market development costs
Market development costs are charged to sales and marketing expense to the extent that the benefit is separable from the revenue transaction and the fair value of that benefit is determinable. To the extent that such costs either do not provide a separable benefit, or the fair value of the benefit cannot be reliably estimated, such amounts are recorded as a reduction of revenue.
(h) Income taxes
Income taxes are accounted for using the asset and liability method. Deferred income tax assets and liabilities are based on temporary differences (differences between the accounting basis and the tax basis of the assets and liabilities) and non-capital loss, capital loss, and tax credits carry-forwards are measured using the enacted tax rates and laws expected to apply when these differences reverse. Deferred tax benefits, including non-capital loss, capital loss, and tax credits
67
SIERRA WIRELESS, INC.
NOTES TO THE CONSOLIDATED FINANCIAL STATEMENTS
(In thousands of U.S. dollars, except where otherwise stated)
carry-forwards, are recognized to the extent that realization of such benefits is considered more likely than not. The effect on deferred tax assets and liabilities of a change in tax rates is recognized in earnings in the period that enactment occurs.
We include interest and penalties related to income taxes, including unrecognized tax benefits, in income tax expense.
Liabilities for uncertain tax positions are recorded based on a two-step process. The first step is to evaluate the tax position for recognition by determining if the weight of available evidence indicates that it is more likely than not that the position will be sustained on audit, including resolution of related appeals or litigation processes, if any. The second step is to measure the tax benefit as the largest amount that is more than 50% likely of being realized upon settlement. We regularly assess the potential outcomes of examinations by tax authorities in determining the adequacy of our provision for income taxes. We continually assess the likelihood and amount of potential adjustments and adjust the income tax provision, income taxes payable and deferred taxes in the period in which the facts that give rise to a revision become known.
We recognize the tax effects related to share-based payments at settlement or expiration in Income tax expense.
(i) Stock-based compensation and other stock-based payments
Stock options and restricted share units granted to the company’s key officers, directors and employees are accounted for using the fair value-based method. Under this method, compensation cost for stock options is measured at fair value at the date of grant using the Black-Scholes valuation model, and is expensed over the awards' vesting period using the straight-line method. Any consideration paid by plan participants on the exercise of stock options or the purchase of shares is credited to common stock together with any related stock-based compensation expense. Compensation cost for restricted share units is measured at fair value at the date of grant which is the market price of the underlying security, and is expensed over the awards' vesting period using the straight-line method. In the third quarter of 2016, we early adopted ASU 2016-09 and elected to make an entity-wide election to account for forfeitures in compensation expense when they occur. The application of this election did not have a material impact on our financial statements.
(j) Earnings (loss) per common share
Basic earnings (loss) per share is computed by dividing net earnings (loss) for the period by the weighted average number of company common shares outstanding during the reporting period. Diluted earnings (loss) per share is computed using the treasury stock method. When the effect of options and other securities convertible into common shares is anti-dilutive, including when the company has incurred a loss for the period, basic and diluted earnings (loss) per share are the same.
Under the treasury stock method, the number of dilutive shares, if any, is determined by dividing the average market price of shares for the period into the net proceeds of in-the-money options.
68
SIERRA WIRELESS, INC.
NOTES TO THE CONSOLIDATED FINANCIAL STATEMENTS
(In thousands of U.S. dollars, except where otherwise stated)
(k) Translation of foreign currencies
Our functional and reporting currency is the U.S. dollar.
Revenue and expense items denominated in foreign currencies are translated at exchange rates prevailing during the period. Monetary assets and liabilities denominated in foreign currencies are translated at the period-end exchange rates. Non-monetary assets and liabilities are translated at exchange rates in effect when the assets are acquired or the obligations are incurred. Foreign exchange gains and losses are reflected in net earnings (loss) for the period.
We have foreign subsidiaries that are considered to be self-contained and integrated within their foreign jurisdiction, and accordingly, use the respective local currency as their functional currency. The assets and liabilities of the foreign subsidiaries, including goodwill and fair value adjustments arising on acquisition, are translated at exchange rates at the balance sheet dates, equity is translated at historical rates, and revenue and expenses are translated at exchange rates prevailing during the period. The foreign exchange gains and losses arising from the translation are reported as a component of other comprehensive income (loss), as presented in note 21, Accumulated Other Comprehensive Loss.
(l) Cash and cash equivalents
Cash and cash equivalents include cash and short-term deposits with original maturities of three months or less. The carrying amounts approximate fair value due to the short-term maturities of these instruments.
(m) Allowance for doubtful accounts receivable
We maintain an allowance for our accounts receivable for estimated losses that may result from our customers’ inability to pay. We determine the amount of the allowance by analyzing known uncollectible accounts, aged receivables, economic conditions, historical losses, insured amounts, if any, and changes in customer payment cycles and credit-worthiness. Amounts later determined and specifically identified to be uncollectible are charged against this allowance.
If the financial condition of any of our customers deteriorates resulting in an impairment of their ability to make payments, we may increase our allowance.
(n) Financing receivables
We lease certain hardware devices to a small number of hardware distributors under sales-type leases which have terms ranging from two to four years and bear interest at 2%. Because the devices are not functional on our network without an active service agreement with us, we can de-activate devices for non-payment.
We evaluate the credit quality of our financing receivables on an ongoing basis utilizing an aging of the accounts and write-offs, customer collection experience, the customer’s financial condition, known risk characteristics impacting the respective customer base, and other available economic conditions, to determine the appropriate allowance.
69
SIERRA WIRELESS, INC.
NOTES TO THE CONSOLIDATED FINANCIAL STATEMENTS
(In thousands of U.S. dollars, except where otherwise stated)
(o) Derivatives
Derivatives, such as foreign currency forward contracts, may be used to hedge the foreign exchange risk on cash flows from commitments denominated in a foreign currency. Derivatives are recorded in Accounts receivable or Accounts payable and accrued liabilities and measured at fair value at each balance sheet date. Any resulting gains and losses from changes in the fair value are recorded in Foreign exchange gain (loss).
(p) Inventories
Inventories consist of electronic components and finished goods and are valued at the lower of cost or estimable realizable value, determined on a first-in-first-out basis. Cost is defined as all costs that relate to bringing the inventory to its present condition and location under normal operating conditions.
We review the components of our inventory and our inventory purchase commitments on a regular basis for excess and obsolete inventory based on estimated future usage and sales. Write-downs in inventory value or losses on inventory purchase commitments depend on various items, including factors related to customer demand, economic and competitive conditions, technological advances and new product introductions that vary from current expectations. We believe that the estimates used in calculating the inventory provision are reasonable and properly reflect the risk of excess and obsolete inventory. If customer demands for our inventory are substantially less than our estimates, additional inventory write-downs may be required.
(q) Property and equipment
Property and equipment are stated at cost, less accumulated depreciation and amortization. We amortize our property and equipment on a straight-line basis over the following estimated economic lives:
Furniture and fixtures | 3-5 years | ||
Research and development equipment | 3-10 years | ||
Production equipment | 2-7 years | ||
Tooling | 1.5-3 years | ||
Computer equipment | 1-5 years | ||
Software | 1-5 years | ||
Office equipment | 3-5 years | ||
Monitoring equipment | 3-5 years | ||
Network equipment | 3-7 years | ||
Research and development equipment related amortization is included in research and development expense. Tooling, production, monitoring and certain network equipment related amortization is included in cost of goods sold. All other amortization is included in amortization expense.
Leasehold improvements and leased vehicles are amortized on a straight-line basis over the lesser of their expected average service life or term of the lease.
When we sell property and equipment, we net the historical cost less accumulated depreciation and amortization against the sale proceeds and include the difference in Other income.
70
SIERRA WIRELESS, INC.
NOTES TO THE CONSOLIDATED FINANCIAL STATEMENTS
(In thousands of U.S. dollars, except where otherwise stated)
(r) Intangible assets
The estimated useful life of intangible assets with definite lives is the period over which the assets are expected to contribute to our future cash flows. When determining the useful life, we consider the expected use of the asset, useful life of any related intangible asset, any legal, regulatory or contractual provisions that limit the useful life, any legal, regulatory, or contractual renewal or extension provisions without substantial costs or modifications to the existing terms and conditions, the effects of obsolescence, demand, competition and other economic factors, and the expected level of maintenance expenditures relative to the cost of the asset required to obtain future cash flows from the asset.
We amortize our intangible assets on a straight-line basis over the following specific periods:
Patents and trademarks | — | 3-5 years | |
Licenses | — | over the shorter of the term of the license or an estimate of their useful life, ranging from three to ten years | |
Intellectual property and customer relationships | — | 3-13 years | |
Brand | — | over the estimated life | |
In-process research and development | — | over the estimated life | |
In-process research and development (“IPRD”) are intangible assets acquired as part of business combinations. Prior to their completion, IPRD are intangible assets with indefinite life and they are not amortized but subject to impairment test on an annual basis.
Research and development related amortization is included in research and development expense. All other amortization is included in amortization expense.
(s) Goodwill
Goodwill represents the excess of the purchase price of an acquired business over the fair value assigned to assets acquired and liabilities assumed in a business combination.
Goodwill has an indefinite life, is not amortized, and is subject to a two-step impairment test on an annual basis. The first step compares the fair value of the reporting unit to its carrying amount, which includes the goodwill. When the fair value of a reporting unit exceeds its carrying amount, goodwill of the reporting unit is considered not to be impaired and the second step of the impairment test is unnecessary. If the carrying amount exceeds the implied fair value of the goodwill, the second step measures the amount of the impairment loss. If the carrying amount exceeds the fair value of the goodwill, an impairment loss is recognized equal to that excess.
(t) Impairment of long-lived assets
Long-lived assets, including property and equipment, and intangible assets other than goodwill, are assessed for potential impairment when there is evidence that events or changes in circumstances indicate that the carrying amount of an asset may not be recovered. An impairment loss is recognized when the carrying amount of the long-lived asset is not recoverable and exceeds its fair value. The carrying amount of a long-lived asset is not recoverable if it exceeds the sum of the undiscounted cash flows expected to result from the use and eventual disposition of the asset.
71
SIERRA WIRELESS, INC.
NOTES TO THE CONSOLIDATED FINANCIAL STATEMENTS
(In thousands of U.S. dollars, except where otherwise stated)
Any required impairment loss is measured as the amount by which the carrying amount of a long-lived asset exceeds its fair value and is recorded as a reduction in the carrying value of the related asset and a charge to operating results. Intangible assets with indefinite lives are tested annually for impairment and in interim periods if certain events occur indicating that the carrying value of the intangible assets may be impaired.
(u) Comprehensive income (loss)
Comprehensive income (loss) includes net earnings (loss) as well as changes in equity from other non-owner sources. The other changes in equity included in comprehensive income (loss) are comprised of foreign currency cumulative translation adjustments.
(v) Investment tax credits
Investment tax credits are accounted for using the flow-through method whereby such credits are accounted for as a reduction of income tax expense in the period in which the credit arises.
(w) Comparative figures
Certain figures presented in the consolidated financial statements have been reclassified to conform to the presentation adopted for the current year.
3. RECENTLY IMPLEMENTED ACCOUNTING STANDARDS
In November 2016, the FASB issued ASU 2016-18, Statement of Cash Flows (Topic 230) Restricted Cash. This update is to address diversity in the classification and presentation of changes in restricted cash on the statement of cash flows. This requires that a statement of cash flows explain the change during the period in the total of cash, cash equivalents, and amounts generally described as restricted cash or restricted cash equivalents by including restricted cash and restricted cash equivalents when reconciling the beginning-of-period and end-of-period total amounts shown on the statement of cash flows. The standard is effective for fiscal years beginning after December 15, 2017, and interim periods within those fiscal periods. Early adoption is permitted, and any adjustments should be reflected as of the beginning of the fiscal year that includes that interim period. In the fourth quarter of 2017, we early adopted ASU 2016-18 and there was no material impact to our financial statements and business.
4. CHANGES IN FUTURE ACCOUNTING STANDARDS
In May 2014, the FASB issued ASU 2014-09, Revenue from Contracts with Customers (ASC 606). The update is intended to clarify the principles of recognizing revenue, and to develop a common revenue standard for U.S. GAAP and IFRS that would remove inconsistencies in revenue requirements, leading to improved comparability of revenue recognition practices across entities and industries. ASC 606 contains a single model that applies to contracts with customers and two approaches to recognizing revenue: at a point in time or over time. The model features a contract-based five-step analysis of transactions to determine whether, how much, and when revenue is recognized. New estimates and judgmental thresholds have been introduced, which may affect the amount and/or timing of revenue recognized. The new standard is effective for annual and interim financial statements for fiscal years beginning after December 15, 2017. Early application is permitted in fiscal years beginning after December 15, 2016. We will adopt the full retrospective transition method in the first quarter of 2018. The new revenue standards, under our current business model, are not expected to have a material impact on the amount and timing of revenue
72
SIERRA WIRELESS, INC.
NOTES TO THE CONSOLIDATED FINANCIAL STATEMENTS
(In thousands of U.S. dollars, except where otherwise stated)
recognized. We have identified and have commenced the development of appropriate changes to our business processes, systems, and controls to support recognition and disclosure under the new standard.
In February 2016, the FASB issued ASU 2016-02, Leases (Topic 842). This update is to improve transparency and comparability among organizations by requiring lessees to recognize right-of-use assets and lease liabilities on the balance sheet and requiring additional disclosure about leasing arrangements. The standard is effective for fiscal years beginning after December 15, 2018. Early application is permitted. We are in the process of evaluating the impact of this update and cannot reasonably estimate the effect on our financial statements and business at this time.
In June 2016, the FASB issued ASU 2016-13, Measurement of Credit Losses on Financial Instruments. This update will replace the incurred loss impairment methodology for credit losses on financial instruments with a methodology that requires consideration of a broader range of reasonable and supportable information to inform credit loss estimates. The standard is effective for fiscal years beginning after December 15, 2019, including interim periods within those fiscal years. Early application is permitted as of the fiscal years beginning after December 15, 2018, including interim periods within those fiscal years. We are in the process of evaluating the impact of this update and cannot reasonably estimate the effect on our financial statements and business at this time.
In August 2016, the FASB issued ASU 2016-15, Statement of Cash Flows (Topic 230), Classification of Certain Cash Receipts and Cash Payments. The update addresses eight specific cash flow issues with the objective of reducing diversity in practice. The standard is effective for fiscal years beginning after December 15, 2017, and interim periods within those fiscal periods. Early application is permitted. We will adopt the standard in the first quarter of 2018. The update does not have a material impact on our financial statements.
5. ACQUISITIONS
(a) Numerex Corp.
On December 7, 2017, we completed the stock-for-stock merger transaction to acquire Numerex Corp. ("Numerex"). In accordance with the Agreement and Plan of Merger dated August 2, 2017, by and among the company, Numerex and Wireless Acquisition Sub, Inc. we issued 3,580,832 common shares as merger consideration in exchange for all of the outstanding shares of Numerex common stock and certain outstanding Numerex equity awards and warrants. Additionally, approximately $20.2 million in aggregate was paid at closing to retire outstanding Numerex debt.
Total consideration for the acquisition is as follows:
$ | |||
Issuance of common shares | 77,346 | ||
Debt extinguishment | 20,155 | ||
97,501 | |||
We accounted for the transaction using the acquisition method and accordingly, recorded the tangible and intangible assets acquired and liabilities assumed on the basis of our estimates of their respective preliminary fair values as at December 7, 2017. The excess of the purchase price over the preliminary value assigned to the net assets acquired is recorded as goodwill.
73
SIERRA WIRELESS, INC.
NOTES TO THE CONSOLIDATED FINANCIAL STATEMENTS
(In thousands of U.S. dollars, except where otherwise stated)
The following table summarizes the preliminary values assigned to the assets acquired and liabilities assumed at the acquisition date:
$ | |||
Cash | 1,430 | ||
Deferred income tax asset | 1,049 | ||
Property and equipment | 7,244 | ||
Identifiable intangible assets | 45,700 | ||
Goodwill | 50,642 | ||
Other working capital | (7,417 | ) | |
Long-term obligations | (1,147 | ) | |
Fair value of net assets acquired | 97,501 | ||
The goodwill of $50.6 million resulting from the acquisition consists largely of the expectation that the acquisition will expand our position as a leading global IoT pure-play and significantly increase our subscription-based recurring services revenue. Goodwill has been assigned to the IoT Services segment and approximately $5.8 million is deductible for tax purposes.
The following table provides the components of the identifiable intangible assets acquired that are subject to amortization:
Estimated useful life | $ | ||||
Customer relationships | 9 years | 26,270 | |||
Existing technology | 3 years | 10,210 | |||
Brand | 13 years | 9,220 | |||
45,700 | |||||
The amount of revenue of Numerex included in our consolidated statements of operations from the acquisition date, through the period ended December 31, 2017, was $3.1 million. The amount of net loss of Numerex included in our consolidated statements of operations for the aforementioned period was $0.8 million. We recorded transaction costs of $4.0 million in acquisition-related and integration for the year ended December 31, 2017; transaction cost of $0.1 million related to issuance cost was recorded in common stock during the year ended December 31, 2017.
The following table presents the unaudited pro forma results for the year ended December 31, 2017 and 2016. The pro forma financial information combines the results of operations of Sierra Wireless, Inc. and Numerex as though the businesses had been combined as of the beginning of fiscal 2016. The pro forma financial information is presented for informational purposes only and is not indicative of the results of operations that would have been achieved if the acquisition had taken place at the beginning of fiscal 2016. The unaudited pro forma financial information presented includes amortization charges for acquired tangible and intangible assets, and related tax effects.
2017 | 2016 | ||||||
Pro forma information | |||||||
Revenue | $ | 747,719 | $ | 686,252 | |||
Loss from operations | (8,973 | ) | (5,205 | ) | |||
Net loss | (3,577 | ) | (7,334 | ) | |||
Basic and diluted loss per share (in dollars) | $ | (0.10 | ) | $ | (0.21 | ) | |
74
SIERRA WIRELESS, INC.
NOTES TO THE CONSOLIDATED FINANCIAL STATEMENTS
(In thousands of U.S. dollars, except where otherwise stated)
(b) GNSS business of GlobalTop
On March 31, 2017, we completed the acquisition of substantially all of the assets of the Global Navigation Satellite System ("GNSS") embedded module business of GlobalTop Technology Inc. ("GlobalTop") for total cash consideration of $3.1 million. GlobalTop is a Taiwan-based business that specializes in the development and manufacture of a wide variety of GNSS modules and serves customers around the world. The acquisition builds on our strategy to expand our product offerings beyond cellular, Wi-Fi and Bluetooth, servicing customers in the automotive, telematics and asset tracking markets.
The transaction is accounted for using the acquisition method and accordingly, we have recorded the tangible and intangible assets acquired and liabilities assumed on the basis of their respective fair values as at March 31, 2017. The excess of the purchase price over the final value assigned to the net assets acquired is recorded as goodwill.
The following table summarizes the final values assigned to the assets acquired at the acquisition date:
$ | |||
Assets acquired | |||
Inventory | 604 | ||
Property and equipment | 175 | ||
Identifiable intangible assets | 1,160 | ||
Goodwill | 1,206 | ||
Fair value of net assets acquired | 3,145 | ||
Goodwill of $1.2 million resulting from the acquisition consists largely of the expectation that the acquisition will expand our embedded solution portfolio for OEM customers in the key markets we serve. Goodwill is deductible for tax purposes.
The following table provides the components of the identifiable intangible assets acquired:
Estimated useful life | $ | ||||
Customer Relationships | 5 years | 640 | |||
Existing Technology | 3 years | 410 | |||
Backlog | 11 months | 110 | |||
1,160 | |||||
The amount of revenue and net earnings from the GNSS business included in our consolidated statements of operations from the acquisition date, through the year ended December 31, 2017, was $3.4 million and $nil, respectively. There was no significant impact on the Company's revenue and net earnings on a pro forma basis for all periods presented.
75
SIERRA WIRELESS, INC.
NOTES TO THE CONSOLIDATED FINANCIAL STATEMENTS
(In thousands of U.S. dollars, except where otherwise stated)
(c) Blue Creation
On November 2, 2016, we completed the acquisition of all of the outstanding shares of the parent company and sole owner of Blue Creation for total cash consideration of $6.4 million ($2.9 million, net of cash acquired), plus a maximum contingent consideration of $0.5 million under a performance-based earn-out formula.
We accounted for the transaction using the acquisition method and accordingly, we have recorded the tangible and intangible assets acquired and liabilities assumed on the basis of their respective fair values as at November 2, 2016.
In accordance with ASC 805, Business Combinations, the earn-out has been recognized as acquisition-related costs over the earn-out period.
The following table summarizes the values assigned to the assets acquired and liabilities assumed at the acquisition date:
$ | ||
Assets acquired | ||
Cash | 3,563 | |
Accounts receivable | 237 | |
Other assets | 111 | |
Identifiable intangible assets | 2,540 | |
Goodwill | 920 | |
7,371 | ||
Liabilities assumed | ||
Accounts payable and accrued liabilities | 392 | |
Deferred income taxes | 534 | |
Fair value of net assets acquired | 6,445 | |
Goodwill of $0.9 million resulting from the acquisition will strengthen our strategic position within our OEM Solutions segment. Goodwill is not deductible for tax purposes.
The following table provides the components of the identifiable intangible assets acquired:
Estimated useful life | $ | ||||
Customer relationships | 3.5 years | 2,090 | |||
Existing technology | 4 years | 450 | |||
2,540 | |||||
76
SIERRA WIRELESS, INC.
NOTES TO THE CONSOLIDATED FINANCIAL STATEMENTS
(In thousands of U.S. dollars, except where otherwise stated)
(d) GenX Mobile Inc.
On August 3, 2016, we completed the acquisition of all of the outstanding shares of GenX Mobile Incorporated ("GenX") for total cash consideration of $7.8 million ($5.9 million, net of cash acquired), plus contingent consideration for inventory consumption in excess of $1.0 million, up to a maximum of $1.4 million.
At acquisition date, we recognized the fair value of the contingent consideration at $1.4 million based on a probability estimate of consumption of acquisition date inventory within the specified 12 month period of the contingent consideration.
We accounted for the transaction using the acquisition method and accordingly, we have recorded the tangible and intangible assets acquired and liabilities assumed on the basis of their respective fair values as at August 3, 2016. The excess of the purchase price over the value assigned to the net assets acquired is recorded as goodwill.
Total consideration for the acquisition is as follows:
$ | ||
Cash | 7,752 | |
Contingent consideration | 1,375 | |
9,127 | ||
The following table summarizes the values assigned to the assets acquired and liabilities assumed at the acquisition date:
$ | ||
Assets acquired | ||
Cash | 1,852 | |
Accounts receivable | 1,754 | |
Inventory | 2,375 | |
Other assets | 124 | |
Identifiable intangible assets | 3,926 | |
Goodwill | 1,782 | |
11,813 | ||
Liabilities assumed | ||
Accounts payable and accrued liabilities | 1,458 | |
Deferred income taxes | 1,228 | |
Fair value of net assets acquired | 9,127 | |
Goodwill of $1.8 million resulting from the acquisition consists largely of the expectation that the acquisition will further strengthen our Enterprise Solutions segment. Goodwill is not deductible for tax purposes.
77
SIERRA WIRELESS, INC.
NOTES TO THE CONSOLIDATED FINANCIAL STATEMENTS
(In thousands of U.S. dollars, except where otherwise stated)
The following table provides the components of the identifiable intangible assets acquired:
Estimated useful life | $ | ||||
Customer relationships | 5 years | 2,640 | |||
Existing technology | 4 years | 973 | |||
In-process research and development | 313 | ||||
3,926 | |||||
(e) MobiquiThings SAS
On September 2, 2015, we acquired all of the shares of MobiquiThings SAS ("MobiquiThings") for cash consideration of €13.5 million ($15.2 million), plus a maximum contingent consideration of €12 million under a performance-based earn-out formula. MobiquiThings is a France-based mobile virtual network operator dedicated exclusively to the Machine-to-Machine and Telematics marketplace.
At acquisition date, we recognized the contingent consideration at fair value based on a weighted probability estimate of achievement of the earn-out within the specified periods of the contingent consideration. In accordance with ASC 805, Business Combinations, $0.5 million was recognized as purchase price consideration and the remaining balance is being expensed to acquisition-related costs over the earn-out period. The change in fair value at each reporting period is recognized in earnings.
Total consideration for the acquisition is as follows:
€ | $ | ||||
Cash | 13,506 | 15,216 | |||
Contingent consideration | 470 | 529 | |||
13,976 | 15,745 | ||||
We accounted for the transaction using the acquisition method and accordingly, we have recorded the tangible and intangible assets acquired and liabilities assumed on the basis of our estimates of their respective fair values as at September 2, 2015. The excess of the purchase price over the value assigned to the net assets acquired is recorded as goodwill.
78
SIERRA WIRELESS, INC.
NOTES TO THE CONSOLIDATED FINANCIAL STATEMENTS
(In thousands of U.S. dollars, except where otherwise stated)
The following table summarizes the values assigned to the assets acquired and liabilities assumed at the acquisition date:
€ | $ | ||||
Assets acquired | |||||
Cash | 214 | 241 | |||
Accounts receivable | 1,026 | 1,156 | |||
Prepaids and other assets | 107 | 120 | |||
Property and equipment | 1,041 | 1,173 | |||
Identifiable intangible assets | 5,071 | 5,713 | |||
Goodwill | 9,922 | 11,179 | |||
17,381 | 19,582 | ||||
Liabilities assumed | |||||
Accounts payable and accrued liabilities | 1,715 | 1,932 | |||
Deferred income tax | 1,690 | 1,905 | |||
Fair value of net assets acquired | 13,976 | 15,745 | |||
Goodwill of $11.2 million resulting from the acquisition consists largely of the expectation that the acquisition will further solidify our device-to-cloud strategy. Goodwill is not deductible for tax purposes.
The following table provides the components of the identifiable intangible assets acquired that are subject to amortization:
Estimated useful life | € | $ | ||||||
Customer relationships | 11 years | 3,379 | 3,807 | |||||
Existing technology | 4.5 years | 1,692 | 1,906 | |||||
5,071 | 5,713 | |||||||
The acquisition had no significant impact on revenues and net earnings for the year ended December 31, 2015. There was also no significant impact on the Company's revenues and net income on a pro forma basis for all periods presented.
79
SIERRA WIRELESS, INC.
NOTES TO THE CONSOLIDATED FINANCIAL STATEMENTS
(In thousands of U.S. dollars, except where otherwise stated)
(f) Accel Networks LLC
On June 18, 2015, we acquired substantially all of the assets of Accel Networks LLC ("Accel") for cash consideration of $9.5 million, plus a maximum contingent consideration of $1.5 million under a performance-based earn-out formula. Accel is a leader in managed cellular broadband technology and connectivity services in North America.
At acquisition date, we recognized the fair value of the contingent consideration at $0.8 million based on a weighted probability estimate of achievement of the earn-out within the specified 12 month period of the contingent consideration. At December 31, 2015, management determined that the achievement of the earn-out will not be attained and recorded the reversal of the fair value of the contingent consideration in acquisition-related costs.
We accounted for the transaction using the acquisition method and accordingly, we have recorded the tangible and intangible assets acquired and liabilities assumed on the basis of their respective fair values as at June 18, 2015. The excess of the purchase price over the final value assigned to the net assets acquired is recorded as goodwill.
Total consideration for the acquisition is as follows:
$ | |||
Cash | 9,471 | ||
Contingent consideration | 753 | ||
10,224 | |||
The following table summarizes the final values assigned to the assets acquired and liabilities assumed at the acquisition date:
$ | |||
Assets acquired | |||
Accounts receivable | 551 | ||
Prepaid and other assets | 59 | ||
Inventory | 133 | ||
Property and equipment | 1,388 | ||
Identifiable intangible assets | 5,499 | ||
Goodwill | 3,706 | ||
11,336 | |||
Liabilities assumed | |||
Accounts payable and accrued liabilities | 1,034 | ||
Deferred revenue | 78 | ||
Fair value of net assets acquired | 10,224 | ||
Goodwill of $3.7 million resulting from the acquisition consists largely of the expectation that the acquisition will strengthen our IoT Services segment. Goodwill is deductible for tax purposes.
80
SIERRA WIRELESS, INC.
NOTES TO THE CONSOLIDATED FINANCIAL STATEMENTS
(In thousands of U.S. dollars, except where otherwise stated)
The following table provides the components of the identifiable intangible assets acquired that are subject to amortization:
Estimated useful life | $ | ||||
Brand | 20 years | 1,169 | |||
Customer relationships | 10 years | 2,352 | |||
Existing technology | 5 years | 1,978 | |||
5,499 | |||||
The acquisition had no significant impact on revenues and net earnings for the year ended December 31, 2015. There was also no significant impact on the Company's revenues and net income on a pro forma basis for all periods presented.
(g) Wireless Maingate AB
On January 16, 2015, we acquired all of the shares of Wireless Maingate AB ("Maingate") for cash consideration of $91.6 million ($88.4 million, net of cash acquired). Maingate is a Sweden-based provider of M2M connectivity and data management services.
We accounted for the transaction using the acquisition method and accordingly, recorded the tangible and intangible assets acquired and liabilities assumed on the basis of our estimates of their respective fair values as at January 16, 2015. The excess of the purchase price over the final value assigned to the net assets acquired is recorded as goodwill.
The following table summarizes the final values assigned to the assets acquired and liabilities assumed at the acquisition date:
$ | |||
Assets acquired | |||
Cash | 3,139 | ||
Accounts receivable | 2,795 | ||
Prepaid and other assets | 270 | ||
Inventory | 75 | ||
Property and equipment | 275 | ||
Identifiable intangible assets | 50,231 | ||
Goodwill | 45,593 | ||
102,378 | |||
Liabilities assumed | |||
Accounts payable and accrued liabilities | 4,437 | ||
Deferred revenue | 172 | ||
Deferred income tax | 6,181 | ||
Fair value of net assets acquired | 91,588 | ||
Goodwill of $45.6 million resulting from the acquisition consists largely of the expectation that the acquisition will strengthen our business and offer us significantly enhanced market position in Europe. Goodwill is not deductible for tax purposes.
81
SIERRA WIRELESS, INC.
NOTES TO THE CONSOLIDATED FINANCIAL STATEMENTS
(In thousands of U.S. dollars, except where otherwise stated)
The following table provides the components of the identifiable intangible assets acquired that are subject to amortization:
Estimated useful life | $ | ||||
Brand | 20 years | 4,820 | |||
Customer relationships | 12 years | 34,571 | |||
Existing technology | 4 years | 3,411 | |||
In-process research and development | 8 years | 7,429 | |||
50,231 | |||||
The following table presents the unaudited pro forma results for the year ended December 31, 2015 and 2014. The pro forma financial information combines the results of operations of Sierra Wireless, Inc. and Maingate as though the businesses had been combined as of the beginning of fiscal 2014. The pro forma financial information is presented for informational purposes only and is not indicative of the results of operations that would have been achieved if the acquisition had taken place at the beginning of fiscal 2014. The unaudited pro forma financial information presented includes amortization charges for acquired tangible and intangible assets, and related tax effects.
2015 | 2014 | |||||||
Pro forma information | ||||||||
Revenue | $ | 608,516 | $ | 569,340 | ||||
Earnings (loss) from operations | 8,861 | (4,719 | ) | |||||
Net loss | (3,652 | ) | (15,339 | ) | ||||
Basic and diluted loss per share (in dollars) | $ | (0.11 | ) | $ | (0.49 | ) | ||
6. SEGMENTED INFORMATION
As our chief operating decision maker does not evaluate the performance of our operating segments based on segment assets, management does not classify asset information on a segmented basis. Despite the absence of discrete financial information, we do measure our revenue based on other forms of categorization such as by the geographic distribution in which our products are sold.
REVENUE AND GROSS MARGIN BY SEGMENT
Year ended December 31, 2017 | ||||||||||||||||
OEM Solutions | Enterprise Solutions | IoT Services | Total | |||||||||||||
Revenue | $ | 555,887 | $ | 101,535 | $ | 34,655 | $ | 692,077 | ||||||||
Cost of goods sold | 384,872 | 53,014 | 19,244 | 457,130 | ||||||||||||
Gross margin | $ | 171,015 | $ | 48,521 | $ | 15,411 | $ | 234,947 | ||||||||
Gross margin % | 30.8 | % | 47.8 | % | 44.5 | % | 33.9 | % | ||||||||
Expenses | 235,306 | |||||||||||||||
Loss from operations | $ | (359 | ) | |||||||||||||
Total assets | $ | 689,106 | ||||||||||||||
82
SIERRA WIRELESS, INC.
NOTES TO THE CONSOLIDATED FINANCIAL STATEMENTS
(In thousands of U.S. dollars, except where otherwise stated)
Year ended December 31, 2016 | ||||||||||||||||
OEM Solutions | Enterprise Solutions | IoT Services | Total | |||||||||||||
Revenue | $ | 516,517 | $ | 71,486 | $ | 27,604 | $ | 615,607 | ||||||||
Cost of goods sold | 349,921 | 31,537 | 16,406 | 397,864 | ||||||||||||
Gross margin | $ | 166,596 | $ | 39,949 | $ | 11,198 | $ | 217,743 | ||||||||
Gross margin % | 32.3 | % | 55.9 | % | 40.6 | % | 35.4 | % | ||||||||
Expenses | 196,395 | |||||||||||||||
Earnings from operations | $ | 21,348 | ||||||||||||||
Total assets | $ | 578,459 | ||||||||||||||
Year ended December 31, 2015 | ||||||||||||||||
OEM Solutions | Enterprise Solutions | IoT Services | Total | |||||||||||||
Revenue | $ | 523,366 | $ | 63,072 | $ | 21,360 | $ | 607,798 | ||||||||
Cost of goods sold | 371,559 | 29,945 | 12,439 | 413,943 | ||||||||||||
Gross margin | $ | 151,807 | $ | 33,127 | $ | 8,921 | $ | 193,855 | ||||||||
Gross margin % | 29.0 | % | 52.5 | % | 41.8 | % | 31.9 | % | ||||||||
Expenses | 183,741 | |||||||||||||||
Loss from operations | $ | 10,114 | ||||||||||||||
Total assets | $ | 546,332 | ||||||||||||||
REVENUE BY GEOGRAPHICAL REGION
2017 | 2016 | 2015 | ||||||||||
Americas | $ | 219,453 | $ | 194,019 | $ | 196,476 | ||||||
Europe, Middle East and Africa | 157,975 | 137,803 | 116,686 | |||||||||
Asia-Pacific | 314,649 | 283,785 | 294,636 | |||||||||
$ | 692,077 | $ | 615,607 | $ | 607,798 | |||||||
PROPERTY AND EQUIPMENT BY GEOGRAPHICAL REGION
2017 | 2016 | |||||||
Americas | $ | 26,608 | $ | 18,001 | ||||
Europe, Middle East and Africa | 11,136 | 10,814 | ||||||
Asia-Pacific | 5,233 | 5,365 | ||||||
$ | 42,977 | $ | 34,180 | |||||
83
SIERRA WIRELESS, INC.
NOTES TO THE CONSOLIDATED FINANCIAL STATEMENTS
(In thousands of U.S. dollars, except where otherwise stated)
7. RESEARCH AND DEVELOPMENT
The components of research and development costs consist of the following:
2017 | 2016 | 2015 | ||||||||||
Gross research and development | $ | 84,246 | $ | 73,695 | $ | 74,599 | ||||||
Government tax credits | (885 | ) | (618 | ) | (579 | ) | ||||||
$ | 83,361 | $ | 73,077 | $ | 74,020 | |||||||
8. RESTRUCTURING
In February 2017, we made a decision to relocate the customer support and network operations within the IoT Services segment from Sweden to France and the United States to achieve operational efficiencies. As a result, 19 employees were impacted and we recorded $1.1 million in restructuring costs for the year ended December 31, 2017. As at December 31, 2017, outstanding liability of $0.5 million is included in accounts payable and accrued liabilities and is expected to be paid by February 2019.
9. OTHER INCOME
The components of other income for the years ended December 31 were as follows:
2017 | 2016 | 2015 | ||||||||||
Interest income | $ | 245 | $ | 163 | $ | 269 | ||||||
Interest expense | (159 | ) | (71 | ) | (154 | ) | ||||||
Other | (19 | ) | (9 | ) | — | |||||||
$ | 67 | $ | 83 | $ | 115 | |||||||
10. INCOME TAXES
The components of earnings (loss) before income taxes consist of the following:
2017 | 2016 | 2015 | ||||||||||
Canadian | $ | 7,205 | $ | 15,480 | $ | 2,611 | ||||||
Foreign | 53 | 4,215 | (4,225 | ) | ||||||||
Earnings (loss) before income taxes | $ | 7,258 | $ | 19,695 | $ | (1,614 | ) | |||||
84
SIERRA WIRELESS, INC.
NOTES TO THE CONSOLIDATED FINANCIAL STATEMENTS
(In thousands of U.S. dollars, except where otherwise stated)
The income tax expense (recovery) consists of:
2017 | 2016 | 2015 | ||||||||||
Canadian: | ||||||||||||
Current | $ | 28 | $ | (287 | ) | $ | 11 | |||||
Deferred | 1,665 | 401 | (2,086 | ) | ||||||||
$ | 1,693 | $ | 114 | $ | (2,075 | ) | ||||||
Foreign: | ||||||||||||
Current | $ | 2,347 | $ | 7,304 | $ | 5,511 | ||||||
Deferred | (917 | ) | (3,108 | ) | (2,376 | ) | ||||||
$ | 1,430 | $ | 4,196 | $ | 3,135 | |||||||
Total: | ||||||||||||
Current | $ | 2,375 | $ | 7,017 | $ | 5,522 | ||||||
Deferred | 748 | (2,707 | ) | (4,462 | ) | |||||||
$ | 3,123 | $ | 4,310 | $ | 1,060 | |||||||
The reconciliation of income taxes calculated at the statutory rate to the actual income tax provision for the years ended December 31 was as follows:
2017 | 2016 | 2015 | ||||||||||
Income tax expense (recovery) at Canadian statutory income tax rates of 26.01% (2016 - 26.01%; 2015 - 26.01%) | $ | 1,903 | $ | 5,122 | $ | (421 | ) | |||||
Increase (decrease) in income taxes for: | ||||||||||||
Permanent and other differences | (1,452 | ) | (2,192 | ) | (464 | ) | ||||||
Change in statutory/foreign tax rates and foreign exchange rates | 1,049 | 11,581 | (979 | ) | ||||||||
Change in valuation allowance | 1,571 | (11,403 | ) | 1,952 | ||||||||
Stock-based compensation expense | 1,633 | 1,039 | 1,206 | |||||||||
Adjustment to prior years | (1,581 | ) | 163 | (234 | ) | |||||||
Income tax expense (recovery) | $ | 3,123 | $ | 4,310 | $ | 1,060 | ||||||
Deferred tax assets and liabilities
The tax effects of temporary differences that give rise to significant deferred tax assets and deferred tax liabilities were as follows at December 31:
2017 | 2016 | |||||||
Deferred income tax assets (liabilities) | ||||||||
Property and equipment | $ | 1,470 | $ | 2,223 | ||||
Non capital loss carry-forwards | 87,854 | 63,094 | ||||||
Capital loss carry-forwards | 3,166 | 4,321 | ||||||
Scientific research and development expenses and credits | 23,829 | 25,651 | ||||||
Reserves and other | 14,927 | 13,201 | ||||||
Investments | (16,611 | ) | — | |||||
Acquired intangibles | (13,761 | ) | (9,102 | ) | ||||
100,874 | 99,388 | |||||||
Valuation allowance | 96,379 | 94,807 | ||||||
$ | 4,495 | $ | 4,581 | |||||
85
SIERRA WIRELESS, INC.
NOTES TO THE CONSOLIDATED FINANCIAL STATEMENTS
(In thousands of U.S. dollars, except where otherwise stated)
2017 | 2016 | |||||||
Classification: | ||||||||
Assets | ||||||||
Non-current | $ | 12,197 | $ | 16,039 | ||||
Liabilities | ||||||||
Non-current | (7,702 | ) | (11,458 | ) | ||||
$ | 4,495 | $ | 4,581 | |||||
At December 31, 2017, we have provided for a valuation allowance on our deferred tax assets of $96,379 (2016 - $94,807).
At December 31, 2017, we have Canadian allowable capital loss carry-forwards of $11,519 that are available, indefinitely, to be deducted against future Canadian taxable capital gains. In addition, we have investment tax credits of $22,029 and $9,902 available to offset future Canadian federal and provincial income taxes payable, respectively. The investment tax credits expire between 2018 and 2037. At December 31, 2017, our U.S. subsidiary has $6,445 of California research & development tax credits which may be carried forward indefinitely.
At December 31, 2017, net operating loss carry-forwards for our foreign subsidiaries were $49,682 for U.S. income tax purposes that expire between 2020 and 2037, $599 for Brazil income tax purposes, $15,659 for Sweden income tax purposes, $23 for Norway income tax purposes, $68,430 for Luxembourg income tax purposes, and $214,853 for French income tax purposes. The Brazil, Sweden, Norway, Luxembourg and French net operating loss carry-forward may be carried forward indefinitely. Our foreign subsidiaries may be limited in their ability to use foreign net operating losses in any single year depending on their ability to generate significant taxable income. In addition, the utilization of the U.S. net operating losses is also subject to ownership change limitations provided by U.S. federal and specific state income tax legislation. The amount of Brazil net operating losses deducted each year is limited to 30% of each year's taxable income. The amount of French net operating losses deducted each year is limited to €1.0 million plus 50% of French taxable income in excess of €1.0 million. Our French net operating losses carry-forward is subject to the “continuity of business” requirement. Our French subsidiaries also have research tax credit carried forward of $4,092 as at December 31, 2017. The French tax credits may be used to offset against corporate income tax and if any tax credits are not fully utilized within a three year period following the year the tax credits are earned, it may be refunded by the French tax authorities. Tax loss and tax credits carry-forwards are denominated in the currency of the countries in which the respective subsidiaries are located and operate. Fluctuations in currency exchange rates could reduce the U.S. dollar equivalent value of these tax loss and research tax credit carry forwards in future years.
In assessing the realizability of our deferred tax assets, management considers whether it is more likely than not that some portion or all of the deferred tax assets will not be realized. The ultimate realization of deferred tax assets is dependent upon the generation of future taxable income during periods in which temporary differences become deductible and the loss carry-forwards or tax credits can be utilized. Management considers projected future taxable income and tax planning strategies in making our assessment.
No provision for taxes have been provided on undistributed foreign earnings, as it is the company’s intention to indefinitely reinvest undistributed earnings of its foreign subsidiaries. It is not practical to estimate the income tax liability that might be incurred if there is a change in management’s intention in the event that a remittance of such earnings occur in the future.
86
SIERRA WIRELESS, INC.
NOTES TO THE CONSOLIDATED FINANCIAL STATEMENTS
(In thousands of U.S. dollars, except where otherwise stated)
The Tax Cuts and Jobs Act
The Tax Cuts and Jobs Act was enacted on December 22, 2017. The Act reduces the US federal corporate tax rate from 35% to 21%, requires companies to pay a one-time transition tax on earnings of certain foreign subsidiaries that were previously tax deferred and creates new taxes on certain foreign-sourced earnings. At December 31, 2017, we have not completed our accounting for the tax effects of enactment of the Act; however, we have made a reasonable estimate of the effects on our existing deferred tax balances and the one-time transition tax. Based on a reasonable estimate, we recognized a provisional amount of $1,127, which is included as a component of income tax expense.
Provisional amounts
We remeasured certain deferred tax assets and liabilities based on the rates at which they are expected to reverse in the future, which is generally at a 24% combined rate. However, we are still analyzing certain aspects of the Act and refining our calculations, which could potentially affect the measurement of these balances or potentially give rise to new deferred tax amounts. The provisional amount recorded related to the remeasurement of our deferred tax balance was $1,066.
The one-time transition tax is based on our total post-1986 earnings and profits (E&P) for which we have previously deferred from US income taxes. We recorded a provisional amount for our one-time transition tax liability for our foreign subsidiaries, resulting in an increase in income tax expense of $61. We have not yet completed our calculation of the total post-1986 foreign E&P for these foreign subsidiaries. Further, the transition tax is based in part on the amount of those earnings held in cash and other specified assets. This amount may change when we finalize the calculation of post-1986 foreign E&P previously deferred from US federal taxation and finalize the amounts held in cash or other specified assets. No additional income taxes have been provided for any remaining undistributed foreign earnings not subject to the transition tax and any additional outside basis difference inherent in these entities as these amounts continue to be indefinitely reinvested in foreign operations.
Accounting for uncertainty in income taxes
At December 31, 2017, we had gross unrecognized tax benefits of $4,418 (2016 — $4,329). Of this total, $747 (2016 — $1,859) represents the amount of unrecognized tax benefits that, if recognized, would favorably impact our effective tax rate.
Below is a reconciliation of the total amounts of unrecognized tax benefits for the years ended December 31:
2017 | 2016 | |||||||
Unrecognized tax benefits, beginning of year | $ | 4,329 | $ | 4,346 | ||||
Increases — tax positions taken in prior periods | 36 | 633 | ||||||
Increases — tax positions taken in current period | 61 | 74 | ||||||
Settlements and lapses of statute of limitations | (8 | ) | (724 | ) | ||||
Unrecognized tax benefits, end of year | $ | 4,418 | $ | 4,329 | ||||
We recognize interest expense and penalties related to unrecognized tax benefits within the provision for income tax expense on the consolidated statement of operations. At December 31, 2017, we had reversed $642 (2016 - $1,058) for accruals of interest and penalties.
87
SIERRA WIRELESS, INC.
NOTES TO THE CONSOLIDATED FINANCIAL STATEMENTS
(In thousands of U.S. dollars, except where otherwise stated)
In the normal course of business, we are subject to audit by the Canadian federal and provincial taxing authorities, by the U.S. federal and various state taxing authorities and by the taxing authorities in various foreign jurisdictions. Tax years ranging from 2004 to 2017 remain subject to examination in Canada, the United States, the United Kingdom, France, Germany, Australia, China, Hong Kong, Brazil, South Africa, Japan, Korea, Taiwan, Italy, Sweden, Norway, India, Spain, and Luxembourg.
The Company regularly engages in discussions and negotiations with tax authorities regarding tax matters in various jurisdictions. The Company believes it is reasonably possible that certain tax matters may be concluded in the next 12 months. The Company estimates that the unrecognized tax benefits at December 31, 2017 could increase by approximately $46 in the next 12 months.
11. STOCK-BASED COMPENSATION PLANS
(a) Stock-based compensation expense:
2017 | 2016 | 2015 | ||||||||||
Cost of goods sold | $ | 461 | $ | 420 | $ | 630 | ||||||
Sales and marketing | 2,503 | 1,714 | 2,151 | |||||||||
Research and development | 2,038 | 1,375 | 1,422 | |||||||||
Administration | 5,339 | 4,120 | 4,739 | |||||||||
$ | 10,341 | $ | 7,629 | $ | 8,942 | |||||||
Stock option plan | 3,297 | 2,170 | 2,090 | |||||||||
Restricted stock plan | 7,044 | 5,459 | 6,852 | |||||||||
$ | 10,341 | $ | 7,629 | $ | 8,942 | |||||||
(b) Stock option plan
Under the terms of our Stock Option Plan (the “Plan”), our Board of Directors may grant options to employees, officers and directors. The maximum number of shares available for issue under the Plan is the lesser of 10% of the number of issued and outstanding common shares from time to time or 7,000,000 common shares. Based on the number of shares outstanding as at December 31, 2017, stock options exercisable into 2,122,670 common shares are available for future allocation under the Plan.
The Plan provides that the exercise price of an option will be determined on the date of grant and will not be less than the closing market price of our stock at that date. Options generally vest over four years, with the first 25% vesting at the first anniversary date of the grant and the balance vesting in equal amounts at the end of each month thereafter. We determine the expiry date of each option at the time it is granted, which cannot be more than five years after the date of the grant.
88
SIERRA WIRELESS, INC.
NOTES TO THE CONSOLIDATED FINANCIAL STATEMENTS
(In thousands of U.S. dollars, except where otherwise stated)
The fair value of share options was estimated on the date of grant using the Black-Scholes option-pricing model with the following assumptions:
2017 | 2016 | 2015 | ||||||||||
Risk-free interest rate | 1.37 | % | 0.73 | % | 0.97 | % | ||||||
Annual dividends per share | Nil | Nil | Nil | |||||||||
Expected stock price volatility | 55 | % | 51 | % | 44 | % | ||||||
Expected option life (in years) | 4.0 | 4.0 | 4.0 | |||||||||
Average fair value of options granted (in dollars) | $ | 11.09 | $ | 4.40 | $ | 10.64 | ||||||
There is no dividend yield because we do not pay, and do not plan to pay, cash dividends on our common shares. The expected stock price volatility is based on the historical volatility of our average monthly stock closing prices over a period equal to the expected life of each option grant. The risk-free interest rate is based on yields from risk-free instruments with a term equal to the expected term of the options being valued. The expected life of options represents the period of time that the options are expected to be outstanding based on historical data of option holder exercise and termination behavior. Forfeitures are accounted for in compensation expense as they occur.
The following table presents stock option activity for the years ended December 31:
Number of | Weighted Average Exercise Price | Weighted Average Remaining Contractual Life | Aggregate Intrinsic Value | |||||||||||
Options | Cdn.$ | U.S.$ | In Years | U.S.$ | ||||||||||
Outstanding, December 31, 2014 | 1,144,057 | 13.94 | 12.00 | 2.9 | 40,550 | |||||||||
Granted | 218,331 | 41.62 | 29.94 | |||||||||||
Exercised | (357,136 | ) | 14.42 | 10.37 | 6,813 | |||||||||
Forfeited | (39,341 | ) | 23.74 | 17.09 | ||||||||||
Outstanding, December 31, 2015 | 965,911 | 21.47 | 15.44 | 2.5 | 3,541 | |||||||||
Granted | 651,357 | 14.72 | 10.95 | |||||||||||
Exercised | (231,704 | ) | 11.76 | 8.75 | 1,608 | |||||||||
Forfeited | (69,941 | ) | 19.25 | 14.32 | ||||||||||
Outstanding, December 31, 2016 | 1,315,623 | 19.65 | 14.61 | 2.9 | 4,687 | |||||||||
Granted | 685,936 | 32.16 | 25.58 | |||||||||||
Exercised | (500,184 | ) | 14.91 | 11.86 | 6,997 | |||||||||
Forfeited | (37,894 | ) | 24.58 | 19.55 | ||||||||||
Outstanding, December 31, 2017 | 1,463,481 | 26.38 | 20.98 | 3.2 | 4,788 | |||||||||
The intrinsic value of outstanding stock options is calculated as the quoted market price of the stock at the balance sheet date, or date of exercise, less the exercise price of the option.
89
SIERRA WIRELESS, INC.
NOTES TO THE CONSOLIDATED FINANCIAL STATEMENTS
(In thousands of U.S. dollars, except where otherwise stated)
The following table summarizes the stock options outstanding and exercisable at December 31, 2017:
Options Outstanding | Options Exercisable | |||||||||||||||||||
Range of | Number of | Weighted Average Remaining Option Life | Weighted Average Exercise Price | Number of Options | Weighted Average Exercise Price | |||||||||||||||
Exercise Prices | Options | (years) | Cdn.$ | U.S.$ | Exercisable | Cdn.$ | U.S.$ | |||||||||||||
$9.26 - $11.46 U.S. $11.64 - $14.41 Cdn | 430,255 | 3.0 | 13.60 | 10.81 | 138,865 | 13.57 | 10.79 | |||||||||||||
$11.47 - $25.15 U.S. $14.42 - $31.62 Cdn | 501,534 | 3.2 | 27.79 | 22.10 | 138,343 | 21.33 | 16.97 | |||||||||||||
$25.16 - $28.34 U.S. $31.63 - $35.64 Cdn | 351,879 | 4.2 | 32.79 | 26.08 | — | — | — | |||||||||||||
$28.35 - $33.60 U.S. $35.65 - $42.25 Cdn | 179,813 | 2.1 | 40.44 | 32.16 | 127,550 | 40.44 | 32.16 | |||||||||||||
1,463,481 | 3.2 | 26.38 | 20.98 | 404,758 | 24.69 | 19.64 | ||||||||||||||
The options outstanding at December 31, 2017 expire between February 26, 2018 and November 6, 2022.
As at December 31, 2017, the unrecognized stock-based compensation cost related to the non-vested stock options was $7,879 (2016 — $3,754; 2015 — $3,171), which is expected to be recognized over a weighted average period of 2.8 years (2016 — 2.5 years; 2015 — 2.4 years).
(c) Restricted share plans
We have two market based restricted share unit plans: one for U.S. employees and one for all non-U.S. employees, and a treasury based restricted share unit plan (collectively, the “RSPs”). The RSPs support our growth and profitability objectives by providing long-term incentives to certain executives and other key employees and also encourage our objective of employee share ownership through the granting of restricted share units (“RSUs”). There is no exercise price or monetary payment required from the employees upon the grant of an RSU or upon the subsequent delivery of our common shares (or, in certain jurisdictions, cash in lieu at the option of the Company) to settle vested RSUs. The form and timing of settlement is subject to local laws. With respect to the treasury based RSP, during the second quarter of 2017, the Board of Directors amended the maximum number of share units outstanding under the Plan to not exceed 2.6% (reduced from 3.5%) of the number of issued and outstanding shares. Based on the number of shares outstanding as at December 31, 2017, 410,751 share units are available for future allocation under the Plan. With respect to the two market based RSPs, independent trustees purchase Sierra Wireless common shares over the facilities of the TSX and Nasdaq, which are used to settle vested RSUs. The existing trust funds are variable interest entities and are included in these consolidated financial statements as treasury shares held for RSU distribution.
Generally, RSUs vest over three years, in equal one-third amounts on each anniversary date of the grant and some vest at one year. RSU grants to employees who are resident in France for French tax purposes will not vest before the second anniversary from the date of grant, and any shares issued are subject to an additional two year tax hold period.
The intrinsic value of outstanding RSUs is calculated as the quoted market price of the stock at the balance sheet date, or date of vesting.
90
SIERRA WIRELESS, INC.
NOTES TO THE CONSOLIDATED FINANCIAL STATEMENTS
(In thousands of U.S. dollars, except where otherwise stated)
The following table summarizes the RSU activity for the years ended December 31:
Number of | Weighted Average Grant Date Fair Value | Weighted Average Remaining Contractual Life | Aggregate Intrinsic Value | |||||||||||
RSUs | Cdn.$ | U.S.$ | In years | U.S.$ | ||||||||||
Outstanding, December 31, 2014 | 1,161,765 | 14.56 | 12.54 | 1.7 | 55,118 | |||||||||
Granted | 230,689 | 42.16 | 30.33 | |||||||||||
Vested / settled | (590,720 | ) | 14.20 | 10.21 | 19,494 | |||||||||
Forfeited | (23,501 | ) | 30.02 | 21.60 | ||||||||||
Outstanding, December 31, 2015 | 778,233 | 25.08 | 18.04 | 1.8 | 12,219 | |||||||||
Granted | 354,517 | 15.08 | 11.21 | |||||||||||
Vested / settled | (358,497 | ) | 19.57 | 14.56 | 4,477 | |||||||||
Forfeited | (28,279 | ) | 21.85 | 16.26 | ||||||||||
Outstanding, December 31, 2016 | 745,974 | 22.59 | 16.81 | 2.1 | 11,689 | |||||||||
Granted | 454,685 | 32.02 | 25.47 | |||||||||||
Vested / settled | (284,888 | ) | 22.86 | 18.18 | 6,098 | |||||||||
Forfeited | (39,030 | ) | 21.10 | 16.77 | ||||||||||
Outstanding, December 31, 2017 | 876,741 | 26.80 | 21.31 | 2.1 | 17,919 | |||||||||
Outstanding – vested and not settled | 142,726 | |||||||||||||
Outstanding – unvested | 734,015 | |||||||||||||
Outstanding, December 31, 2017 | 876,741 | |||||||||||||
As at December 31, 2017, the total remaining unrecognized compensation cost associated with the RSUs totaled $9,346 (2016 — $5,408; 2015 — $6,838), which is expected to be recognized over a weighted average period of 1.6 years (2016 — 1.6 years; 2015 — 1.3 years).
12. EARNINGS (LOSS) PER SHARE
The following table provides the reconciliation between basic and diluted earnings (loss) per share:
2017 | 2016 | 2015 | ||||||||||
Net earnings (loss) | $ | 4,135 | $ | 15,385 | $ | (2,674 | ) | |||||
Weighted average shares used in computation of: | ||||||||||||
Basic | 32,356 | 32,032 | 32,166 | |||||||||
Assumed conversion | 537 | 303 | — | |||||||||
Diluted | 32,893 | 32,335 | 32,166 | |||||||||
Net earnings (loss) per share (in dollars): | ||||||||||||
Basic | $ | 0.13 | $ | 0.48 | $ | (0.08 | ) | |||||
Diluted | 0.13 | 0.48 | (0.08 | ) | ||||||||
As the Company incurred a loss for the year ended December 31, 2015, all equity awards for that year were anti-dilutive and were excluded from the diluted weighted average shares.
91
SIERRA WIRELESS, INC.
NOTES TO THE CONSOLIDATED FINANCIAL STATEMENTS
(In thousands of U.S. dollars, except where otherwise stated)
13. ACCOUNTS RECEIVABLE
The components of accounts receivable at December 31 were as follows:
2017 | 2016 | |||||||
Trade receivables | $ | 137,963 | $ | 121,384 | ||||
Less: allowance for doubtful accounts | (1,827 | ) | (2,486 | ) | ||||
136,136 | 118,898 | |||||||
Sales taxes receivable | 3,120 | 2,808 | ||||||
R&D tax credits | 4,408 | 5,331 | ||||||
Financing receivables | 1,442 | — | ||||||
Other receivables | 23,397 | 16,761 | ||||||
$ | 168,503 | $ | 143,798 | |||||
The movement in the allowance for doubtful accounts during the years ended December 31 were as follows:
2017 | 2016 | 2015 | ||||||||||
Balance, beginning of year | $ | 2,486 | $ | 2,088 | $ | 2,275 | ||||||
Bad debt expense (recovery) | (535 | ) | 383 | 615 | ||||||||
Write-offs and settlements | (194 | ) | 15 | (792 | ) | |||||||
Foreign exchange | 70 | — | (10 | ) | ||||||||
$ | 1,827 | $ | 2,486 | $ | 2,088 | |||||||
14. INVENTORIES
The components of inventories at December 31 were as follows:
2017 | 2016 | |||||||
Electronic components | $ | 32,753 | $ | 29,043 | ||||
Finished goods | 20,273 | 11,870 | ||||||
$ | 53,026 | $ | 40,913 | |||||
15. PREPAIDS AND OTHER
The components of prepaids and other at December 31 were as follows:
2017 | 2016 | |||||||
Inventory advances | $ | 93 | $ | 902 | ||||
Insurance and licenses | 608 | 634 | ||||||
Deposits | 2,161 | 1,667 | ||||||
Other | 5,144 | 3,327 | ||||||
$ | 8,006 | $ | 6,530 | |||||
92
SIERRA WIRELESS, INC.
NOTES TO THE CONSOLIDATED FINANCIAL STATEMENTS
(In thousands of U.S. dollars, except where otherwise stated)
16. PROPERTY AND EQUIPMENT
The components of property and equipment at December 31 were as follows:
2017 | ||||||||||||
Cost | Accumulated amortization | Net book value | ||||||||||
Furniture and fixtures | $ | 2,495 | $ | 1,477 | $ | 1,018 | ||||||
Research and development equipment | 35,589 | 25,831 | 9,758 | |||||||||
Production equipment and tooling | 39,426 | 23,229 | 16,197 | |||||||||
Computer equipment | 9,611 | 7,279 | 2,332 | |||||||||
Software | 6,859 | 4,346 | 2,513 | |||||||||
Leasehold improvements | 6,399 | 3,950 | 2,449 | |||||||||
Leased vehicles | 1,122 | 752 | 370 | |||||||||
Office equipment | 1,460 | 971 | 489 | |||||||||
Monitoring equipment | 3,881 | 106 | 3,775 | |||||||||
Network equipment | 5,503 | 1,427 | 4,076 | |||||||||
$ | 112,345 | $ | 69,368 | $ | 42,977 | |||||||
2016 | ||||||||||||
Cost | Accumulated amortization | Net book value | ||||||||||
Furniture and fixtures | $ | 1,885 | $ | 1,209 | $ | 676 | ||||||
Research and development equipment | 31,896 | 23,544 | 8,352 | |||||||||
Production equipment and tooling | 48,685 | 32,766 | 15,919 | |||||||||
Computer equipment | 9,845 | 8,063 | 1,782 | |||||||||
Software | 8,463 | 6,108 | 2,355 | |||||||||
Leasehold improvements | 5,850 | 3,208 | 2,642 | |||||||||
Leased vehicles | 1,127 | 915 | 212 | |||||||||
Office equipment | 1,050 | 594 | 456 | |||||||||
Network equipment | 2,535 | 749 | 1,786 | |||||||||
$ | 111,336 | $ | 77,156 | $ | 34,180 | |||||||
Amortization expense relating to property and equipment was $14,032, $12,492, and $8,479 for the years ended December 31, 2017, 2016, and 2015, respectively.
93
SIERRA WIRELESS, INC.
NOTES TO THE CONSOLIDATED FINANCIAL STATEMENTS
(In thousands of U.S. dollars, except where otherwise stated)
17. INTANGIBLE ASSETS
The components of intangible assets at December 31 were as follows:
2017 | ||||||||||||
Cost | Accumulated amortization | Net book value | ||||||||||
Patents and trademarks | $ | 15,404 | $ | 12,077 | $ | 3,327 | ||||||
Licenses | 51,859 | 50,434 | 1,425 | |||||||||
Intellectual property | 28,411 | 13,541 | 14,870 | |||||||||
Customer relationships | 124,706 | 53,627 | 71,079 | |||||||||
Brand | 15,153 | 1,318 | 13,835 | |||||||||
In-process research and development | 11,012 | 6,949 | 4,063 | |||||||||
$ | 246,545 | $ | 137,946 | $ | 108,599 | |||||||
2016 | ||||||||||||
Cost | Accumulated amortization | Net book value | ||||||||||
Patents and trademarks | $ | 14,181 | $ | 9,638 | $ | 4,543 | ||||||
Licenses | 45,714 | 44,667 | 1,047 | |||||||||
Intellectual property | 16,966 | 10,864 | 6,102 | |||||||||
Customer relationships | 91,156 | 41,679 | 49,477 | |||||||||
Brand | 5,451 | 665 | 4,786 | |||||||||
In-process research and development | 14,422 | 5,514 | 8,908 | |||||||||
$ | 187,890 | $ | 113,027 | $ | 74,863 | |||||||
Estimated annual amortization expense for the next 5 years ended December 31 are as follows:
2018 | 16,908 | |
2019 | 10,062 | |
2020 | 8,247 | |
2021 | 5,835 | |
2022 | 5,034 | |
In the first quarter of 2017, we recorded an impairment of $3,668 related to an intangible asset recorded on the acquisition of Maingate as a result of a decision to terminate a service offering that has now been superseded by a more technologically advanced offering in our integrated IoT Services business.
Amortization expense relating to intangible assets was $16,471, $13,402, and $11,737 for the years ended December 31, 2017, 2016, and 2015, respectively.
The weighted-average remaining useful lives of intangible assets was 6.9 years as at December 31, 2017.
At December 31, 2017, a net carrying amount of $313 (December 31, 2016 - $2,425) included in intangible assets was not subject to amortization.
94
SIERRA WIRELESS, INC.
NOTES TO THE CONSOLIDATED FINANCIAL STATEMENTS
(In thousands of U.S. dollars, except where otherwise stated)
18. GOODWILL
The changes in the carrying amount of goodwill for the years ended December 31 were as follows:
2017 | 2016 | |||||||
Balance at beginning of year | $ | 154,114 | $ | 156,488 | ||||
Goodwill acquired (note 5(a) and 5(b)) | 51,848 | 2,702 | ||||||
Foreign currency translation adjustments | 12,554 | (5,076 | ) | |||||
$ | 218,516 | $ | 154,114 | |||||
OEM Solutions | $ | 111,348 | $ | 101,404 | ||||
Enterprise Solutions | 27,405 | 26,469 | ||||||
IoT Services | 79,763 | 26,241 | ||||||
$ | 218,516 | $ | 154,114 | |||||
We assessed the recoverability of goodwill as at October 1, 2017 for each of the identified reporting units and determined that the fair value of each of the three reporting units exceeded its carrying value. Therefore, the second step of the impairment test that measures the amount of an impairment loss by comparing the implied fair market value with the carrying amount of goodwill for each reporting unit was not required.
There was no impairment of goodwill during the years ended December 31, 2017, 2016 and 2015.
19. ACCOUNTS PAYABLE AND ACCRUED LIABILITIES
The components of accounts payable and accrued liabilities at December 31 were as follows:
2017 | 2016 | |||||||
Trade payables | $ | 94,775 | $ | 109,236 | ||||
Inventory commitment reserve | 1,440 | 3,850 | ||||||
Accrued royalties | 14,548 | 13,042 | ||||||
Accrued payroll and related liabilities | 17,572 | 13,009 | ||||||
Deferred rent | 2,597 | 965 | ||||||
Professional services | 4,153 | 1,496 | ||||||
Taxes payable (including sales taxes) | 4,070 | 4,922 | ||||||
Product warranties (note 26(b)(iii)) | 8,235 | 7,637 | ||||||
Other | 25,005 | 13,343 | ||||||
$ | 172,395 | $ | 167,500 | |||||
95
SIERRA WIRELESS, INC.
NOTES TO THE CONSOLIDATED FINANCIAL STATEMENTS
(In thousands of U.S. dollars, except where otherwise stated)
20. LONG-TERM OBLIGATIONS
The components of long-term obligations at December 31 were as follows:
2017 | 2016 | |||||||
Accrued royalties | $ | 24,318 | $ | 22,763 | ||||
Other | 12,319 | 9,891 | ||||||
$ | 36,637 | $ | 32,654 | |||||
21. ACCUMULATED OTHER COMPREHENSIVE LOSS
The components of accumulated other comprehensive loss at December 31, net of taxes, were as follows:
2017 | 2016 | |||||||
Balance, beginning of period | $ | (14,426 | ) | $ | (7,978 | ) | ||
Foreign currency translation adjustments | 5,416 | (4,891 | ) | |||||
Gain (loss) on long term intercompany balances | 6,534 | (1,557 | ) | |||||
$ | (2,476 | ) | $ | (14,426 | ) | |||
22. SHARE CAPITAL
On February 4, 2016, we received approval from the TSX of our Notice of Intention to make a Normal Course Issuer Bid ("NCIB"). Pursuant to the NCIB, we could purchase for cancellation up to 3,149,199 of our common shares, or approximately 9.7% of the common shares outstanding as of the date of the announcement. The NCIB commenced on February 9, 2016 and expired on February 8, 2017.
During the year ended December 31, 2017, we purchased and canceled 170,217 common shares (2016 — 809,872 common shares) at an average price of $16.35 per share (2016 — $12.61). The excess purchase price over and above the average carrying value in the amount of $954 (2016 - $1,507) were charged to retained earnings.
23. SUPPLEMENTAL CASH FLOW INFORMATION
The following table summarizes supplemental cash flow information and non-cash activities:
2017 | 2016 | 2015 | ||||||||||
Net income taxes paid | $ | 6,100 | $ | 4,181 | $ | 3,093 | ||||||
Interest paid | 105 | 127 | 137 | |||||||||
Non-cash property and equipment additions | — | 200 | — | |||||||||
Non-cash additions funded by obligation under capital leases | 143 | 544 | 237 | |||||||||
Non-cash additions related to asset retirement obligations | 75 | 520 | — | |||||||||
As at December 31, 2017, restricted cash of $221 is held in escrow related to certain vendor obligations.
96
SIERRA WIRELESS, INC.
NOTES TO THE CONSOLIDATED FINANCIAL STATEMENTS
(In thousands of U.S. dollars, except where otherwise stated)
The following table provides a reconciliation of cash, cash equivalents, and restricted cash reported within the statement of financial position that sum to the total of the same such amounts shown in the statement of cash flows:
2017 | 2016 | 2015 | ||||||||||
Cash and cash equivalents | $ | 65,003 | $ | 102,772 | $ | 93,936 | ||||||
Restricted cash | 221 | — | — | |||||||||
Total cash, cash equivalents, and restricted cash shown in the statement of cash flows | $ | 65,224 | $ | 102,772 | $ | 93,936 | ||||||
24. FAIR VALUE MEASUREMENT
(a) Fair value presentation
An established fair value hierarchy requires the Company to maximize the use of observable inputs and minimize the use of unobservable inputs when measuring fair value. A financial instrument’s categorization within the fair value hierarchy is based upon the lowest level of input that is available and significant to the fair value measurement. There are three levels of inputs that may be used to measure fair value:
Level 1 | — | Quoted prices in active markets for identical assets or liabilities. |
Level 2 | — | Observable inputs other than quoted prices in active markets for identical assets and liabilities, such as quoted prices for identical or similar assets or liabilities in markets that are not active, or other inputs that are observable or can be corroborated by observable market data for substantially the full term of the assets or liabilities. |
Level 3 | — | Inputs that are generally unobservable and are supported by little or no market activity and that are significant to the fair value determination of the assets or liabilities. |
The carrying value of cash and cash equivalents, accounts receivable, accounts payable and accrued liabilities approximate their fair value due to the immediate or short-term maturity of these financial instruments. Based on borrowing rates currently available to us for loans with similar terms, the carrying values of our obligations under capital leases, long-term obligations and other long-term liabilities approximate their fair values.
Fair value of the foreign currency forward contracts are based on observable market inputs such as forward rates in active markets, which represents a Level 2 measurement within the fair value hierarchy. As at December 31, 2017, we were committed to foreign currency forward contracts totalling $15.6 million Canadian dollars with an average forward rate of 1.290, maturing between January to December 2018. We recorded unrealized gain of $307 in Foreign exchange gain for those outstanding contracts in the year ended December 31, 2017 (2016 — nil).
We have contingent consideration related to the acquisitions of MobiquiThings in 2015 that was measured using unobservable inputs which represents a Level 3 measurement within the fair value hierarchy. The contingent consideration is measured at each reporting period and any changes in the fair value are recorded in earnings. In the twelve months ended December 31, 2017, a nominal amount (2016 — $303) was recognized in "Acquisition-related and integration" expense related to the change in the fair value of the contingent consideration.
97
SIERRA WIRELESS, INC.
NOTES TO THE CONSOLIDATED FINANCIAL STATEMENTS
(In thousands of U.S. dollars, except where otherwise stated)
(b) Credit Facilities
On May 30, 2017, our $10 million revolving term credit facility ("Revolving Facility") with Toronto Dominion Bank and the Canadian Imperial Bank of Commerce expired. Subsequently, the Revolving Facility was renewed with the same financial institutions on an uncommitted basis. The Revolving Facility is for general corporate purposes, is secured by a pledge against substantially all of our assets and is subject to borrowing base limitations. As at December 31, 2017, there were no borrowings under the Revolving Facility.
(c) Letters of credit
We have access to a revolving standby letter of credit facility of $10 million from Toronto Dominion Bank. The credit facility is used for the issuance of letters of credit and guarantees and is guaranteed by Export Development Canada. As at December 31, 2017, there were two letters of credit issued against the revolving standby letter of credit facility for a total value of $0.1 million.
25. FINANCIAL INSTRUMENTS
Financial Risk Management
Financial instruments consist primarily of cash and cash equivalents, accounts receivable, derivatives such as foreign currency forward and option contracts, accounts payable and accrued liabilities.
We have exposure to the following business risks:
We maintain substantially all of our cash and cash equivalents with major financial institutions or invest in government instruments. Our deposits with banks may exceed the amount of insurance provided on such deposits.
We outsource manufacturing of our products to third parties and, accordingly, we are dependent upon the development and deployment by third parties of their manufacturing abilities. The inability of any supplier or manufacturer to fulfill our supply requirements could impact future results. We have supply commitments to our contract manufacturers based on our estimates of customer and market demand. Where actual results vary from our estimates, whether due to execution on our part or market conditions, we are at risk.
Financial instruments that potentially subject us to concentrations of credit risk are primarily accounts receivable. We perform on-going credit evaluations of our customer’s financial condition and require letters of credit or other guarantees whenever deemed appropriate.
Although a significant portion of our revenues are in U.S. dollars, we incur operating costs that are denominated in other currencies. Fluctuations in the exchange rates between these currencies could have a material impact on our business, financial condition and results of operations.
We are generating and incurring an increasing portion of our revenue and expenses, respectively, outside of North America including Europe, the Middle East and Asia. To manage our foreign currency risks, we may enter into foreign currency forward and options contracts should we consider it to be advisable to reduce our exposure to future foreign exchange fluctuations.
98
SIERRA WIRELESS, INC.
NOTES TO THE CONSOLIDATED FINANCIAL STATEMENTS
(In thousands of U.S. dollars, except where otherwise stated)
We are subject to risks typical of an international business including, but not limited to, differing economic conditions, changes in political climate, differing tax structures other regulations and restrictions and foreign exchange rate volatility. Accordingly, our future results could be materially affected by changes in these or other factors.
26. COMMITMENTS AND CONTINGENCIES
(a) Operating leases
We have entered into operating leases for property and equipment. The minimum future payments under various operating leases for our continuing operations in each of the years ended December 31 is as follows:
2018 | $ | 7,164 | |
2019 | 6,157 | ||
2020 | 5,863 | ||
2021 | 5,804 | ||
2022 | 3,140 | ||
Subsequent years | 4,465 | ||
$ | 32,593 | ||
(b) Contingent liability on sale of products
(i) | Under license agreements, we are committed to make royalty payments based on the sales of products using certain technologies. We recognize royalty obligations as determinable in accordance with agreement terms. Where agreements are not finalized, we have recognized our current best estimate of the obligation. When the agreements are finalized or the potential obligation becomes statute barred, the estimate will be revised accordingly. |
(ii) | We are a party to a variety of agreements in the ordinary course of business under which we may be obligated to indemnify a third party with respect to certain matters. Typically, these obligations arise as a result of contracts for sale of our products to customers where we provide indemnification against losses arising from matters such as potential intellectual property infringements and product liabilities. The impact on our future financial results is not subject to reasonable estimation because considerable uncertainty exists as to whether claims will be made and the final outcome of potential claims. To date, we have not incurred material costs related to these types of indemnifications. |
(iii) We accrue product warranty costs, when we sell the related products, to provide for the repair or replacement of defective products. Our accrual is based on an assessment of historical experience and on management’s estimates. An analysis of changes in the liability for product warranties follows:
2017 | 2016 | |||||||
Balance, beginning of year | $ | 7,637 | $ | 7,362 | ||||
Provisions | 4,431 | 4,214 | ||||||
Expenditures | (3,833 | ) | (3,939 | ) | ||||
Balance, end of year | $ | 8,235 | $ | 7,637 | ||||
99
SIERRA WIRELESS, INC.
NOTES TO THE CONSOLIDATED FINANCIAL STATEMENTS
(In thousands of U.S. dollars, except where otherwise stated)
(c) Other commitments
We have entered into purchase commitments totaling approximately $133,407 net of related electronic components inventory of $5,206 (December 31, 2016 — $105,523, net of electronic components inventory of $9,264), with certain contract manufacturers under which we have committed to buy a minimum amount of designated products between January 2018 and June 2018. In certain of these agreements, we may be required to acquire and pay for such products up to the prescribed minimum or forecasted purchases.
We have also entered into purchase commitments totaling approximately $33,122 with certain mobile network operators, under which we have committed to buy a minimum amount of wireless data and wireless data services between January 2018 and March 2021.
(d) Legal proceedings
We are from time to time involved in litigation, certain other claims and arbitration matters arising in the ordinary course of our business. We accrue for a liability when it is both probable that a liability has been incurred and the amount of the loss can be reasonably estimated. Significant judgment is required in both the determination of probability and the determination as to whether a loss is reasonably estimable. These accruals are reviewed at least quarterly and adjusted to reflect the impacts of negotiations, settlements, rulings, advice of legal counsel and technical experts and other information and events pertaining to a particular matter. To the extent there is a reasonable possibility (within the meaning of ASC 450, Contingencies) that the losses could exceed the amounts already accrued for those cases for which an estimate can be made, management believes that the amount of any such additional loss would not be material to our results of operations or financial condition.
In some instances, we are unable to reasonably estimate any potential loss or range of loss. The nature and progression of litigation can make it difficult to predict the impact a particular lawsuit will have on the company. There are many reasons why we cannot make these assessments, including, among others, one or more of the following: in the early stage of a proceeding, the claimant is not required to specifically identify the patent that has allegedly been infringed; damages sought that are unspecified, unsupportable, unexplained or uncertain; discovery not having been started or being incomplete; the complexity of the facts that are in dispute (e.g., once a patent is identified, the analysis of the patent and a comparison to the activities of the company is a labor-intensive and highly technical process); the difficulty of assessing novel claims; the parties not having engaged in any meaningful settlement discussions; the possibility that other parties may share in any ultimate liability; and the often slow pace of patent litigation.
We are required to apply judgment with respect to any potential loss or range of loss in connection with litigation. While we believe we have meritorious defenses to the claims asserted against us in our currently outstanding litigations, and intend to defend ourselves vigorously in all cases, in light of the inherent uncertainties in litigation there can be no assurance that the ultimate resolution of these matters will not significantly exceed the reserves currently accrued by us for those cases for which an estimate can be made. Losses in connection with any litigation for which we are not presently able to reasonable estimate any potential loss or range of loss could be material to our results of operations and financial condition.
In January 2017, Koninklijke KPN N.V. filed a patent infringement lawsuit in the United States District Court for the District of Delaware asserting patent infringement by us and our US subsidiary. The lawsuit makes certain allegations concerning the alleged use of data transmission error checking
100
SIERRA WIRELESS, INC.
NOTES TO THE CONSOLIDATED FINANCIAL STATEMENTS
(In thousands of U.S. dollars, except where otherwise stated)
technology in our wireless products. The lawsuit is in the discovery stage. In August 2017, we filed a motion to dismiss the lawsuit pursuant to 35 U.S.C. § 101, and a decision on the motion is pending.
In December 2017, we filed a Petition for Inter Partes Review of the patent-in-suit with the United States Patent and Trial Appeal Board and a decision on institution of the proceeding is pending.
In December 2016, a patent holding company, Magnacross LLC, filed a patent infringement lawsuit in the United States District Court of the Eastern District of Texas asserting patent infringement by one of our US subsidiaries. The lawsuit makes certain allegations concerning our AirLink wireless routers. The lawsuit has been dismissed with prejudice.
In January 2012, a patent holding company, M2M Solutions LLC ("M2M Solutions"), filed a patent infringement lawsuit in the United States District Court for the District of Delaware asserting patent infringement by us, one of our US subsidiaries, and our competitors. The lawsuit makes certain allegations concerning the AirPrime embedded wireless module products, related AirLink products and related services sold by us for use in M2M communication applications. The claim construction order has determined one of the two patents-in-suit to be indefinite and therefore invalid. The lawsuit was dismissed with prejudice in April 2016. In August 2014, M2M Solutions filed a second patent infringement lawsuit against us in the same court with respect to a recently issued patent held by M2M Solutions (US Patent No. 8,648,717), which patent is a continuation of one of the patents-in-suit in the original lawsuit filed against us by M2M Solutions. The lawsuit was administratively closed in September 2015 pending the result of several Inter Partes Review proceedings filed by us and the other defendants with the United States Patent and Trial Appeal Board ("PTAB"). In March 2017, the PTAB issued its decisions in the instituted proceedings, invalidating all independent claims and several dependent claims in the single patent-in-suit. In June 2017, Blackbird Tech LLC ("Blackbird") was joined as a plaintiff in the lawsuit. The lawsuit has been administratively re-opened. In October 2017, a motion to dismiss the lawsuit pursuant to 35 U.S.C. § 101 was filed and has been briefed.
In October 2017, Numerex, its board of directors, the Company and one of our U.S. subsidiaries, Wireless Acquisition Sub, Inc. were named as defendants in a class action lawsuit filed by purported stockholders of Numerex alleging, among other things, that the defendants issued or caused to be issued a materially misleading and incomplete Registration Statement on Form F-4 with the U.S. Securities and Exchange Commission in connection with the Transaction. In October 2017, Numerex and its board of directors were also named as defendants in a separate class action lawsuit filed by purported stockholders of Numerex. Both lawsuits were voluntarily dismissed in December 2017.
In October 2017, a patent holding company, Iron Oak Technologies, LLC ("Iron Oak"), filed a patent infringement lawsuit in the United States District Court for the District of Delaware asserting patent infringement by us and one of our U.S. subsidiaries. The lawsuit makes certain allegations concerning our embedded wireless module products. The lawsuit has been dismissed with prejudice.
Although there can be no assurance that an unfavorable outcome would not have a material adverse effect on our operating results, liquidity or financial position, we believe the claims made in the foregoing legal proceedings are without merit and intend to defend ourselves and our products vigorously in all cases.
We are engaged in certain other claims, legal actions and arbitration matters, all in the ordinary course of business, and believe that the ultimate outcome of these claims, legal actions and arbitration matters will not have a material adverse effect on our operating results, liquidity or financial position.
101
Executive Officers | Directors | ||
Jason W. Cohenour | Gregory D. Aasen (3) | ||
President and Chief Executive Officer | Corporate Director | ||
David G. McLennan | Robin A. Abrams (1), (2) | ||
Chief Financial Officer and Secretary | Corporate Director | ||
Philippe Guillemette | Paul G. Cataford (1), (3) | ||
Chief Technology Officer | Corporate Director | ||
Bill G. Dodson | Charles E. Levine (1), (3) | ||
Senior Vice President, Operations | Corporate Director | ||
A. Daniel Schieler | Thomas Sieber (1), (2) | ||
Senior Vice President and General Manager, OEM Solutions | Corporate Director | ||
Jason L. Krause | Kent P. Thexton (2) | ||
Senior Vice President and General Manager, Enterprise Solutions | Chair of the Board | ||
Marc Overton | Jason W. Cohenour | ||
Senior Vice President & General Manager, IoT Services | President and Chief Executive Officer | ||
Sierra Wireless, Inc. | |||
Rene Link | |||
Chief Marketing Officer & Senior Vice President Strategy | |||
(1) Audit Committee | |||
Pierre Teyssier | (2) Governance and Nominating Committee | ||
Senior Vice President, Operations and Purchasing | (3) Human Resources Committee | ||
 | ||||
Annual General Meeting | Head Office | |||
The Annual General Meeting for the shareholders of Sierra Wireless, Inc. will be held on May 17, 2018 at 3:00 p.m. (Pacific Time) at the Company's head office in Richmond, British Columbia. | Sierra Wireless, Inc. | |||
13811 Wireless Way | ||||
Richmond | ||||
British Columbia | ||||
Canada V6V 3A4 | ||||
Telephone :: 604 231 1100 | ||||
Facsimile :: 604 231 1109 | ||||
Website :: www.sierrawireless.com | ||||