
Form 10-K STEVEN MADDEN, LTD. For: Dec 31
UNITED STATES
SECURITIES AND EXCHANGE COMMISSION
WASHINGTON, D.C. 20549
FORM 10-K
(Mark One)
x ANNUAL REPORT PURSUANT TO SECTION 13 OR 15(d) OF THE SECURITIES EXCHANGE ACT OF 1934
For the fiscal year ended December 31, 2017
or
o TRANSITION REPORT PURSUANT TO SECTION 13 OR 15(d) OF THE SECURITIES EXCHANGE ACT OF 1934
For the transition period from ________ to ________
Commission File Number 0-23702
STEVEN MADDEN, LTD.
(Exact name of registrant as specified in its charter)
Delaware | 13-3588231 | |
(State or other jurisdiction of | (I.R.S. Employer Identification No.) | |
incorporation or organization) | ||
52-16 Barnett Avenue, Long Island City, New York 11104
(Address of principal executive offices) (Zip Code)
(718) 446-1800
(Registrant's Telephone Number, Including Area Code)
Securities Registered Pursuant to Section 12(b) of the Act:
Title of Each Class | Name of Each Exchange on Which Registered |
Common Stock, par value $.0001 per share | The NASDAQ Stock Market LLC |
Preferred Stock Purchase Rights | The NASDAQ Stock Market LLC |
Securities Registered Pursuant to Section 12(g) of the Act: None
Indicate by check mark if the registrant is a well-known seasoned issuer, as defined in Rule 405 of the Securities Act.
Yes x No o
Indicate by check mark if the registrant is not required to file reports pursuant to Section 13 or 15(d) of the Securities Act.
Yes o No x
Indicate by check mark whether the registrant: (1) has filed all reports required to be filed by Section 13 or 15(d) of the Securities Exchange Act of 1934 during the preceding 12 months (or for such shorter period that the registrant was required to file such reports), and (2) has been subject to such filing requirements for the past 90 days.
Yes x No o
Indicate by check mark whether the registrant has submitted electronically and posted on its corporate website, if any, every Interactive Data File required to be submitted and posted pursuant to Rule 405 of Regulation S-T (§232.405 of this chapter) during the preceding 12 months (or for such shorter period that the registrant was required to submit and post such files).
Yes x No o
Indicate by check mark if disclosure of delinquent filers pursuant to Item 405 of Regulation S-K (§ 229.405) is not contained herein, and will not be contained, to the best of registrant's knowledge, in definitive proxy or information statements incorporated by reference in Part III of this Form 10-K or any amendment to this Form 10-K. o
Indicate by check mark whether the registrant is a large accelerated filer, an accelerated filer, a non-accelerated filer, a smaller reporting company or an emerging growth company. See the definitions of “large accelerated filer”, “accelerated filer”,“smaller reporting company” and "emerging growth company" in Rule 12b-2 of the Exchange Act.
Large accelerated filer x | Accelerated filer o |
Non-accelerated filer o (do not check if smaller reporting company) | Smaller reporting company o |
Emerging growth company o | |
If an emerging growth company, indicate by check mark if the registrant has elected not to use the extended transition period for complying with any new or revised financial accounting standards provided pursuant to Section 13(a) of the Exchange Act. o
Indicate by check mark whether the registrant is a shell company (as defined in Rule 12b-2 of the Exchange Act).
Yes o No x
The aggregate market value of the common equity held by non-affiliates of the registrant (assuming for these purposes, but without conceding, that all executive officers and directors are “affiliates” of the registrant) as of June 30, 2017, the last business day of the registrant's most recently completed second fiscal quarter, was $2,341,862,448 (based on the closing sale price of the registrant's common stock on that date as reported on The NASDAQ Global Select Market).
The number of outstanding shares of the registrant's common stock as of February 27, 2018 was 58,782,009 shares.
DOCUMENTS INCORPORATED BY REFERENCE:
PART III INCORPORATES CERTAIN INFORMATION BY REFERENCE FROM THE REGISTRANT'S DEFINITIVE PROXY STATEMENT FOR THE REGISTRANT'S 2018 ANNUAL MEETING OF STOCKHOLDERS.
TABLE OF CONTENTS
PART I | |
ITEM 4 MINE SAFETY DISCLOSURES | |
PART II | |
ITEM 5 MARKET FOR REGISTRANT'S COMMON EQUITY, RELATED STOCKHOLDER | |
ITEM 7 MANAGEMENT'S DISCUSSION AND ANALYSIS OF FINANCIAL CONDITION | |
ITEM 9 CHANGES IN AND DISAGREEMENTS WITH ACCOUNTANTS ON | |
PART III | |
ITEM 12 SECURITY OWNERSHIP OF CERTAIN BENEFICIAL OWNERS AND | |
ITEM 13 CERTAIN RELATIONSHIPS AND RELATED TRANSACTIONS, AND | |
PART IV | |
SPECIAL NOTE REGARDING FORWARD-LOOKING STATEMENTS
This Annual Report on Form 10-K contains “forward-looking statements” (as that term is defined in the federal securities laws), which are made pursuant to the safe harbor provisions of the Private Securities Litigation Reform Act of 1995. These forward-looking statements include statements with regard to future revenue, projected 2018 results, earnings, spending, margins, cash flow, customer orders, expected timing of shipment of products, inventory levels, future growth or success in specific countries, categories or market sectors, continued or expected distribution to specific retailers, liquidity, capital resources and market risk, strategies and objectives and other future events. More generally, forward-looking statements include, without limitation, any statement that may predict, forecast, indicate or simply state future results, performance or achievements, and can be identified by the use of forward looking language such as “believe,” “anticipate,” “expect,” “estimate,” “intend,” “plan,” “project,” “will be,” “will continue,” “will result,” “could,” “may,” “might,” or any variations of such words with similar meanings. Factors that may affect our results include, but are not limited to, the risks and uncertainties discussed in Item 1A of this Annual Report on Form 10-K.
Any such forward-looking statements are subject to risks and uncertainties, many of which are beyond our control, which may influence the accuracy of the statements and the projections upon which the statements are based and could cause our actual results to differ materially from those projected in forward-looking statements. As such, we strongly caution you that these forward-looking statements are not guarantees of future performance or events. Our actual results, performance and achievements could differ materially from those expressed or implied in these forward-looking statements. We undertake no obligation to publicly update or revise any forward-looking statements, whether from new information, future events or otherwise.
PART I
ITEM 1. BUSINESS
($ in thousands, except share and per share data)
Overview
Steven Madden, Ltd. and its subsidiaries (collectively, the “Company”, "we", "our", "us", as applicable) design, source, market and sell fashion-forward name brand and private label footwear for women, men and children and name brand and private label fashion handbags and accessories. We also license some of our trademarks for use in connection with the manufacture, marketing and sale of various products by third party licensees. Our products are marketed through our retail stores and our e-commerce websites within the United States, Canada, Mexico, our joint ventures in South Africa, China and Taiwan, as well as better department stores, major department stores, mid-tier department stores, specialty stores, luxury retailers, value priced retailers, national chains, mass merchants, online retailers and catalog retailers throughout the United States, Canada, Mexico, certain European nations, including Albania, Austria, Belgium, Bulgaria, Cyprus, Czech Republic, Denmark, Estonia, Finland, France, Germany, Hungary, Ireland, Kosovo, Latvia, Lithuania, Luxembourg, the Netherlands, Norway, Poland, Romania, Russia, Slovakia, Slovenia, Sweden and Switzerland, and Tunisia. In addition, we have special distribution arrangements for the marketing of our products in Asia, Europe (excluding the aforementioned nations), India, the Middle East, South and Central America and New Zealand. We offer a broad range of updated styles designed to establish or complement and capitalize on market trends. We have established a reputation for design creativity and our ability to offer quality products in popular styles at affordable prices, delivered in an efficient manner and time frame.
Steven Madden, Ltd. was incorporated as a New York corporation on July 9, 1990, reincorporated under the same name in Delaware in November 1998 and completed its initial public offering in December 1993. Shares of Steven Madden, Ltd. common stock, $0.0001 par value per share, currently trade on the NASDAQ Global Select Market under the symbol “SHOO”. Our principal executive offices are located at 52-16 Barnett Avenue, Long Island City, NY 11104. Our telephone number is (718) 446-1800 and our website address is http://www.stevemadden.com.
We file Annual Reports on Form 10-K, Quarterly Reports on Form 10-Q, Current Reports on Form 8-K and other reports and information with the Securities and Exchange Commission (the “SEC”) pursuant to Section 13(a) or 15(d) of the Securities Exchange Act of 1934, as amended (the “Exchange Act”). These reports, any amendments to such reports, and our proxy statements for our stockholders' meetings are available free of charge, on the "Investor Relations" section of our website as soon as reasonably practicable after such material is electronically filed with, or furnished to, the SEC. We will provide paper copies of such filings free of charge upon request. The public may read and copy any materials filed by us with the SEC at the SEC's Public Reference Room at 100 F Street, NE, Washington, D.C. 20549. Information regarding the operation of the SEC's Public Reference Room is available by calling the SEC at 1-800-SEC-0330. In addition, the SEC maintains an Internet site that contains reports, proxy and information statements and other information regarding us, which is available at http://www.sec.gov.
1
We have a Code of Ethics for our Chief Executive Officer and our senior financial officers, as well as a Code of Business Conduct and Ethics specific to directors of the Company and a Code of Business Conduct and Ethics that is applicable to all of our employees, each of which are attached as exhibits to our 2014 Annual Report on Form 10-K filed with the SEC on February 26, 2015 and posted on our website, http://www.stevemadden.com. We will provide paper copies of these codes free of charge upon request. We intend to disclose on our website any amendments to, or waivers of, these codes that would otherwise be reportable on a current report on Form 8-K. Such disclosure would be posted within four business days following the date of the amendment or waiver.
Net sales for 2017 increased 10.5% to $1,546,098 from $1,399,551 in 2016. Net income attributable to Steven Madden, Ltd. decreased 2.5% to $117,948 in 2017 compared to $120,911 in 2016. Diluted earnings per share in 2017 increased to $2.04 per share on 57,830,000 diluted weighted average shares outstanding compared to $2.03 per share on 59,556,000 diluted weighted average shares outstanding in the prior year.
Recent Developments
On December 22, 2017, the U.S. government enacted comprehensive tax legislation commonly referred to as the Tax Cuts and Jobs Act. The Tax Cuts and Jobs Act made broad and complex changes to the U.S. tax code which impacts 2017 in many ways, including, by reducing the U.S. federal corporate tax rate and imposing a one-time transition tax on certain undistributed earnings of foreign subsidiaries. See additional information regarding the impact of the Tax Cuts and Jobs Act in Item 7, “Management's Discussion and Analysis of Financial Condition and Results of Operations” and Note M "Income Taxes" to our consolidated financial statements appearing elsewhere in this Annual Report on Form 10-K.
Product Distribution Segments
Our business is comprised of five distinct segments: Wholesale Footwear, Wholesale Accessories, Retail, First Cost and Licensing.
Our Wholesale Footwear segment is comprised of the following brands: Steve Madden Women's®, Madden Girl®, Steve Madden Men's®, Madden®, Madden NYC, Dolce Vita®, DV by Dolce Vita®, Mad Love®, Steven by Steve Madden®, Report®, Superga® (under license), Betsey Johnson®, Betseyville®, Steve Madden Kids®, FREEBIRD by Steven®, Stevies®, B Brian Atwood®, Blondo®, Kate Spade® (under license), Avec Les Filles® (under license), Alice & Olivia® (through a joint venture) and includes our International business and certain private label footwear business. The agreement with the Alice & Olivia® terminated on December 31, 2017.
Our Wholesale Accessories segment is comprised of Big Buddha®, Madden NYC, Betsey Johnson®, Steve Madden®, Steven by Steve Madden®, Madden Girl®, Cejon®, B Brian Atwood®, Luv Betsey®, DKNY® (under license) and Donna Karan® (under license) accessories brands and also includes our International business and certain private label accessories business.
Steven Madden Retail, Inc., our wholly-owned retail subsidiary, operates Steve Madden, Steven and Superga retail stores, domestically and internationally, as well as Steve Madden, Superga, Betsey Johnson and Dolce Vita e-commerce websites and comprises our Retail segment.
Our First Cost segment represents activities of one of our wholly-owned subsidiaries that earns commissions for serving as a buying agent for footwear products under private labels for many of the country's large mass-market merchandisers, shoe chains and other value priced retailers.
Our Licensing segment is engaged in the licensing of the Steve Madden®, Steven by Steve Madden® and Madden Girl® trademarks for use in the manufacture, marketing and sale of outerwear, hosiery, jewelry, watches, sunglasses, hair accessories, umbrellas, bedding, luggage, and men’s leather accessories. We license the Stevies® trademark for use in the manufacture, marketing and sale of outerwear exclusively to Target. In addition, we license our Betsey Johnson® trademark for use in the manufacture, marketing and sale of women's and children’s apparel, hosiery, swimwear, fragrance and beauty, sleepwear, activewear, jewelry, watches, bedding, luggage, stationary, umbrellas, and household goods. We also license our Dolce Vita® trademark for use in connection with the manufacture, marketing and sale of women's and children's apparel.
Wholesale Footwear Segment
Steve Madden Women's. We design, source and market our Steve Madden brand to department stores, specialty stores, luxury retailers, value priced retailers, national chains, mass merchants, online retailers and catalog retailers throughout the United
2
States. The Steve Madden brand has become a leading life-style brand in the fashion conscious marketplace. Steve Madden Women's offers fashion forward footwear designed to appeal to customers (primarily women ages 16 to 35) seeking exciting, new footwear designs at affordable prices. New products for Steve Madden Women's are test marketed at Company-owned retail stores. Typically, within a few days, we can determine if the test product appeals to our customers. This enables us to use our flexible sourcing model to rapidly respond to changing trends and customer preferences, which we believe is essential for success in the fashion industry.
Madden Girl. We design, source and market a full collection of directional young women's shoes under the Madden Girl® brand. Madden Girl® is geared for young women ages 16 to 23, and is an “opening price point” brand currently sold at major department stores, mid-tier retailers and specialty stores.
Steve Madden Men's. We design, source, and market a life style collection of men's footwear for the fashion forward man, ages 18 to 45 years old, under the Steve Madden® brand. Retail channels include major department stores, mid-tier department stores, better specialty stores, online retailers and independent shoe stores throughout the United States. Price points for Steve Madden Men's products range in price from $70 to $150 at retail per pair.
Madden. The Madden® brand is a denim friendly collection of footwear designed to meet the ever evolving needs of the trend conscious male consumer, ages 13 to 35 years old. Madden products range from $45 to $90 and are sold to national specialty stores, better department stores, mid-tier department stores, online retailers and independent specialty stores.
Steven. We design, source and market women's fashion footwear under the Steven® trademark through major department stores, better footwear specialty stores and shopping networks throughout the United States as well as in our retail stores. Priced a tier above the Steve Madden Women's brand, Steven products are designed to appeal principally to fashion conscious women, ages 25 to 45, who shop at department stores, footwear boutiques and shopping networks.
Stevies and Steve Madden Kids. Our Stevies® and Steve Madden Kids® brands are designed, sourced and marketed to appeal to young girls, ages 6 to 12. Our Stevies® brand is sold exclusively to Target, while our products sold under Steve Madden Kids® brand are distributed through department stores, specialty stores, online retailers and independent boutiques throughout the United States.
Betsey Johnson. On October 5, 2010, the Company acquired the Betsey Johnson® trademark and substantially all other intellectual property of Betsey Johnson LLC. Products branded under the Betsey Johnson shoe brand are distributed through department stores and online retailers.
Superga. On February 9, 2011, the Company entered into a license agreement with Basic Properties America Inc. and BasicNet S.p.A., for the use of the Superga® trademark in connection with the marketing and sale of footwear. Founded in Italy in 1911, Superga is recognized for its fashion sneakers in a wide range of colors, fabrics and prints for women, men and children.
FREEBIRD by Steven. We design, source, and market a full collection of handcrafted, Goodyear welted boots. The designs are inspired by vintage Americana and created using time-honored craftsmanship. The FREEBIRD by Steven® collection conveys a unique fashion life style that transcends multiple generations. FREEBIRD by Steven® products are currently sold, at retail prices ranging from $195 to $450 per pair at major department stores, mid-tier retailers, and specialty boutiques.
Report. The Report® brand was acquired in our May 2011 acquisition of Topline Corporation ("Topline") and its subsidiaries. The Report® brand is a junior women's footwear brand with price points ranging from $20 to $150 per pair. We design, manufacture, market and sell our Report branded products to major department stores, mid-tier department stores and independently-owned boutiques throughout the United States.
Mad Love. The Mad Love® brand is an exclusive beach-to-the-street life style brand created to appeal to women with a young attitude and active life style and marketed exclusively to Target.
Dolce Vita. In August 2014, the Company acquired the Dolce Vita® and DV® brands and other intellectual property assets in the acquisition of Dolce Vita Holdings, Inc. Dolce Vita® is a contemporary women's footwear brand with price points ranging from $120 to $350 per pair. Our Dolce Vita® brand products are distributed through major department stores, mid-tier department stores and independently-owned boutiques throughout the United States. The DV® brand has price points ranging from $20 to $75 per pair and is currently distributed exclusively at Target.
3
Brian Atwood. In March 2014, the Company acquired the Brian Atwood® designer brand and the B Brian Atwood® contemporary brand from Brian Atwood IP Company LLC. Founded in 2011, Brian Atwood is known for luxury shoes manufactured in Italy. We design, manufacture, market and sell our Brian Atwood branded products primarily to major department stores throughout the United States.
Blondo. In January 2015, the Company acquired the intellectual property and related assets of Blondo, a fashion-oriented footwear brand specializing in waterproof leather boots, booties, shoes and sneakers. Founded over 100 years ago, Blondo products are sold to wholesale customers, including better department stores and specialty boutiques in both the United States and Canada.
In January 2017, the Company acquired all of the issued and outstanding capital stock of Schwartz & Benjamin, Inc., a family-owned business that specialized in licensed brands and private label footwear. As a consequence of the acquisition, the Company acquired licenses to manufacture, market and sell footwear under the Kate Spade® and Avec Les Filles® trademarks as well as a design/manufacturing agreement with Rebecca Minkoff® and a joint venture with Alice & Olivia®.
Kate Spade. The Kate Spade® brand, known for its whimsical fashion, is an entry-level luxury footwear brand primarily distributed through department stores throughout the United States. The price points of footwear bearing the Kate Spade® brand range from $48 to $400 per pair with the core product price ranging from $198 to $298 per pair.
Avec Les Filles. The Avec Les Filles® brand is geared toward the millennial customer and is primarily distributed through department stores throughout the United States as well as online at core product prices ranging from $98 to $150 per pair.
Alice & Olivia. The Alice & Olivia® brand is a contemporary luxury footwear brand distributed primarily through department stores throughout the United States with core product prices ranging from $195 to $450 per pair.
Anne Klein. In January 2018, the Company entered into a license agreement with Nine West Development LLC for a license to use the Anne Klein® trademark in connection in the marketing and sale of footwear. Established in the U.S. in 1968, the Anne Klein® brand is recognized as being synonymous with American sportswear.
International Division. The International division, utilizing the brands discussed above, markets products to better department stores, major department stores, mid-tier department stores, specialty stores, luxury retailers, value priced retailers, national chains, mass merchants, online retailers and catalog retailers throughout the United States, Canada, Mexico, certain European nations, including Albania, Austria, Belgium, Bulgaria, Cyprus, Czech Republic, Denmark, Estonia, Finland, France, Germany, Hungary, Ireland, Kosovo, Latvia, Lithuania, Luxembourg, the Netherlands, Norway, Poland, Romania, Russia, Slovakia, Slovenia, Sweden and Switzerland, and Tunisia. In addition, the International division works through special distribution arrangements for the marketing and sales of our products in Asia, Europe (excluding the aforementioned nations), India, the Middle East, South and Central America and New Zealand.
Private label business. We design, source and market private label footwear primarily to mid-tier chains and mass market merchants. In addition, we design, source and market footwear for third party brands, such as Material Girl® and Candies®.
Wholesale Accessories Segment
Our Wholesale Accessories segment designs, sources and markets name brands (including our Steve Madden®, Steven by Steve Madden®, Madden Girl®, Betsey Johnson®, Madden NYC, Big Buddha®, B Brian Atwood®, DKNY® (under license), Donna Karan® (under license), Anne Klein® (under license beginning in 2018) and Luv Betsey® brands) and private label fashion handbags and accessories to department stores, mass merchants, value priced retailers, online retailers and specialty stores throughout the United States, Canada, Mexico and our International distributor network. In addition, we market and sell cold weather accessories, fashion scarves, wraps and other trend accessories primarily under our Cejon®, Steve Madden®, Betsey Johnson® and Big Buddha® brand names and private labels to department stores and specialty stores.
Retail Segment
As of December 31, 2017, we owned and operated 206 retail stores including 138 Steve Madden full price stores, 60 Steve Madden outlet stores, three Steven stores, one Superga store and four e-commerce websites (Steve Madden, Superga, Betsey Johnson and Dolce Vita). In 2017, we opened 13 new full price stores, six new outlet stores and closed two full price stores in the United States. Steve Madden stores are located in major shopping malls and in urban street locations across the United States, Canada, Mexico, South Africa, China and Taiwan. Comparative store sales (sales of those stores, including the e-commerce websites, that were open for all of 2017 and 2016) decreased 3.2% in fiscal year 2017 from the prior year. The Company excludes
4
new locations from the comparable store base for the first year of operations. Stores that are closed for renovations are removed from the comparable store base.
We anticipate that the Retail segment can enhance the Company's overall sales and profitability while increasing recognition for our brands. Additionally, our retail stores enable us to evaluate the appeal of new products and designs to our customers and respond accordingly, which, in turn, strengthens the product development efforts of our two Wholesale segments. We expect to open 11 to 13 new retail stores and close 8 to 10 locations in 2018.
First Cost Segment
The First Cost segment earns commissions for serving as a buying agent for footwear products under private labels for many of the large mass-market merchandisers, shoe chains and other mid-tier retailers. As a buying agent, we utilize our expertise and our relationships with shoe manufacturers to facilitate the production of private label shoes to customer specifications. We believe that operating in the private label, mass merchandising market provides us additional non-branded sales opportunities and leverages our overall sourcing and design capabilities. Our First Cost segment earns commissions serving as a buying agent for the procurement of women's, men's and children's footwear for large retailers, including Kohl's, Sears and K-Mart. In addition, by leveraging the strength of our Steve Madden brands and product designs, we have been able to partially recover our design, product and development costs from our suppliers.
Licensing Segment
We license our Steve Madden®, Steven by Steve Madden® and Madden Girl® trademarks for use in connection with the manufacture, marketing and sale of outerwear, hosiery, jewelry, watches, sunglasses, hair accessories, umbrellas, bedding, luggage, and men’s leather accessories. We license the Stevies® trademark for use in connection with the manufacture, marketing and sale of outerwear exclusively to Target. In addition, the Company licenses the Betsey Johnson® trademark for use in connection with the manufacture, marketing and sale of women's and children’s apparel, hosiery, swimwear, fragrance and beauty, sleepwear, activewear, jewelry, watches, bedding, luggage, stationary, umbrellas, and household goods. We also license the Dolce Vita® trademark for use in connection with the manufacture, marketing and sale of women's and children's apparel. Most of our license agreements require the licensee to pay us a royalty based on actual net sales, a minimum royalty in the event that specified net sales targets are not achieved and a percentage of sales for advertising the brand.
See Note O to our consolidated financial statements included in this Annual Report on Form 10-K for additional information relating to our five operating segments.
Product Design and Development
We have established a reputation for our creative designs, marketing and trendy products at affordable price points. Our future success will substantially depend on our ability to continue to anticipate and react swiftly to changing consumer demands. To meet this objective, we have developed what we believe is an unparalleled design process that allows us to recognize and respond quickly to changing consumer demands. Our design team strives to create designs that fit our image, reflect current or anticipated trends and can be manufactured in a timely and cost-effective manner. Most new Steve Madden products are tested in select Steve Madden retail stores. Based on these tests, among other things, management selects the Steve Madden products that are then offered for wholesale and retail distribution nationwide. We believe that our design and testing processes and flexible sourcing models provide the Steve Madden brands with a significant competitive advantage allowing us to mitigate the risk of incurring costs associated with the production and distribution of less desirable designs.
Product Sourcing and Distribution
We source each of our product lines separately based on the individual design, style and quality specifications of the products in such product lines. We do not own or operate manufacturing facilities; rather, we use agents and our own sourcing office to source our products from independently-owned manufacturers in China, Italy, Brazil, Mexico, India, Vietnam, The Netherlands, The Dominican Republic and South Korea. We have established relationships with a number of manufacturers and agents in each of these countries. We have not entered into any long-term manufacturing or supply contracts. We believe that a sufficient number of alternative sources exist for the manufacture of our products.
We continually monitor the availability of the principal raw materials used in our footwear, which are currently available from a number of sources in various parts of the world. We track inventory flow on a regular basis, monitor sell-through data and
5
incorporate input on product demand from wholesale customers. We use retailers' feedback to adjust the production of products on a timely basis, which helps reduce the close out of slow-moving products.
The manufacturers of our products are required to meet our quality, human rights, safety and other standard requirements. We are committed to the safety and well-being of the workers throughout our supply chain.
Our products are manufactured overseas and a majority of our products filling domestic orders are shipped via ocean freight carriers to ports in California and New Jersey, also via truck from Mexico to our third party distribution facility in Texas, with the greatest reliance on the California ports. To a lesser extent we rely on air and ground freight carriers for the shipping of products. Once our products arrive in the U.S., we distribute them mainly from five third-party distribution centers, three located in California, one located in Texas and one located in New Jersey. Our products are also distributed through two Company-operated distribution centers located in New Jersey and Canada. By utilizing distribution facilities specializing in distribution fulfillment to effect distribution to certain wholesale accounts, Steve Madden retail stores and Internet customers, we believe that our customers are served more promptly and efficiently. For our international markets, products for our businesses in Canada and Mexico are shipped to ports in the respective countries, and products for our overseas distributors are shipped to freight forwarders primarily in China where the distributor arranges for subsequent shipment.
Customers
Our wholesale customers consist principally of better department stores, major department stores, mid-tier department stores, national chains, mass merchants, value priced retailers, specialty stores, online retailers and catalog retailers. These customers include Target Corporation, Nordstrom, Inc., Macy's, Inc., The TJX Companies, Inc., Wal-Mart Stores, Inc., DSW, Inc., Ross Stores, Inc., Kohl's Corporation, Amazon.com, Inc. and Payless ShoeSource, Inc. For the year ended December 31, 2017, Target Corporation represented 13.4% of total accounts receivable and Wal-Mart Stores, Inc. represented 14.6% of total accounts receivable. The Company did not have any customers who accounted for more than 10% of total net sales or any other customers who accounted for more than 10% of total accounts receivable.
Distribution Channels
United States, Canada, Mexico, Europe, South Africa, China and Taiwan
We sell our products principally through department stores, specialty stores, online retailers, luxury retailers, national chains and mass merchants in the United States, Canada, Mexico, certain European nations including Albania, Austria, Belgium, Bulgaria, Cyprus, Czech Republic, Denmark, Estonia, Finland, France, Germany, Hungary, Ireland, Kosovo, Latvia, Lithuania, Luxembourg, the Netherlands, Norway, Poland, Romania, Russia, Slovakia, Slovenia, Sweden and Switzerland, and Tunisia. In addition, we sell our products in our Company-owned retail stores in the United States, Canada and Mexico, under our joint ventures in South Africa, China and Taiwan, and on our e-commerce websites. For the year ended December 31, 2017, our Retail segment and our two Wholesale segments generated net sales of approximately $272,246 and $1,273,852, or 18% and 82% of our total net sales, respectively. Each of these distribution channels is described below.
Steve Madden, Steve Madden Outlet, Steven and Superga Retail Stores. As of December 31, 2017, we operated 138 Steve Madden full price stores within the United States, Canada and Mexico and under our joint ventures in South Africa, China and Taiwan. We also operated 60 Steve Madden outlet stores, three Steven stores and one Superga store within the United States. The Company also operated four e-commerce websites (Steve Madden, Superga, Betsey Johnson and Dolce Vita). We believe that our retail stores will continue to enhance overall sales, profitability, and our ability to react swiftly to changing consumer trends. Our stores also serve as a marketing tool that allows us to strengthen brand recognition and to showcase selected items from our full line of branded and licensed products. Furthermore, our retail stores provide us with venues through which to test and introduce new products, designs and merchandising strategies. We often test new designs at our Steve Madden retail stores before scheduling them for mass production and wholesale distribution. In addition to these test marketing benefits, we have been able to leverage sales information gathered at Steve Madden retail stores to assist our wholesale customers in order placement and inventory management.
A typical Steve Madden store is approximately 1,500 to 2,000 square feet and is located in a mall or street location that we expect will attract the highest concentration of our core demographic, style-conscious customer base. The Steven and Superga stores, which are generally the same size as our Steve Madden stores, have a more sophisticated design and format styled to appeal to a more mature target audience. The typical outlet store is approximately 2,000 to 2,500 square feet and is located within outlet malls throughout the United States. In addition to carefully analyzing mall demographics and locations, we set profitability guidelines for each potential store site. Specifically, we target well trafficked sites at which the demographics fit our consumer
6
profile and seek new locations where the projected fixed annual rent expense stays within our guidelines. By setting these guidelines, we seek to identify stores that will contribute to our overall profitability both in the near and longer terms.
Department Stores. We currently sell our products to over 2,500 doors of 17 department stores throughout the United States, Canada, Mexico and certain European nations. Our major accounts include Macy's, Inc., Dillard's, Inc., Nordstrom, Inc., Belk, Inc. and Lord & Taylor.
We provide merchandising support to our department store customers including, in-store fixtures and signage, supervision of displays and merchandising of our various product lines. Our wholesale merchandising effort includes the creation of in-store concept shops in which to showcase a broader collection of our branded products. These in-store concept shops create an environment that is consistent with our image and are designed to enable the retailer to display and sell a greater volume of our products per square foot of retail space. In addition, these in-store concept shops encourage longer term commitment by the retailer to our products and enhance consumer brand awareness.
In addition to merchandising support, our key account executives maintain weekly communications with their respective accounts to guide them in placing orders and to assist them in managing inventory, assortment and retail sales. We leverage our sell-through data gathered at our retail stores to assist department stores in allocating their open-to-buy dollars to the most popular styles in the product line and phasing out styles with weaker sell-through, which, in turn, reduces markdown exposure at season's end.
National chains and mass merchants. We currently sell to national chains and mass merchants throughout the United States, Canada, Mexico and certain European nations. Our major accounts include Target Corporation, Wal-Mart Stores, Inc., Kohl's Corporation, and The J.C. Penney Company.
Specialty Stores/Catalog Sales. We currently sell to specialty store locations throughout the United States, Canada, Mexico and certain European nations. Our major specialty store accounts include DSW, Inc., Famous Footwear, Journeys and Payless ShoeSource, Inc. We offer our specialty store accounts the same merchandising, sell-through and inventory tracking support offered to our department store accounts. Sales of our products are also made through various catalogs, such as Bloomingdale's and Victoria's Secret.
Off-Price. We currently sell to off-price retailers throughout the United States, Canada, Mexico and certain European nations. Our major accounts include The TJX Companies, Inc., Ross Stores, Inc. and Burlington Stores, Inc.
Internet Sales. We operate four Internet e-commerce website stores (Steve Madden, Superga, Betsey Johnson and Dolce Vita) where customers can purchase numerous styles of our Steve Madden Women's, Steven, Madden Men's, FREEBIRD by Steven, Superga, Betsey Johnson and Dolce Vita, as well as selected styles of Madden Girl, footwear and accessory products. We also sell to online retailers throughout the United States and Canada. Our major accounts include Zappos and Amazon.
International Distributors
In addition to the countries and territories mentioned above, our products are available in many other countries and territories worldwide via retail selling and distribution agreements. Under the terms of these agreements, the distributors and retailers purchase product from the Company and are generally required to open a minimum number of stores each year and to pay a fee for each pair of footwear purchased and an additional sales royalty as a percentage of sales or a predetermined amount per unit of sale. Most of the distributors are required to purchase a minimum number of our products within specified periods. The agreements currently in place expire on various dates through February 14, 2031 and include automatic renewals at the distributors' option provided certain conditions are met. These agreements are exclusive in their specific territories, which include Asia, certain European nations, India, the Middle East, South and Central America and New Zealand.
Competition
The fashion industry is highly competitive. We compete with specialty shoe and accessory companies as well as companies with diversified footwear product lines, such as Aldo, Jessica Simpson, Sam Edelman, Ugg and Vince Camuto. Our competitors may have greater financial and other resources than we do. We believe effective advertising and marketing, favorable brand image, fashionable styling, high quality, value and fast manufacturing turnaround are the most important competitive factors and intend to continue to employ these elements in our business. However, we cannot be certain that we will be able to compete successfully against our current and future competitors, or that competitive pressures will not have a material adverse effect on our business, financial condition and results of operations.
7
Marketing and Sales
We have focused on creating an integrated brand building program to establish Steve Madden as a leading designer of fashion footwear for style-conscious young women and men. Principal marketing activities include social media and digital marketing efforts, public relations including product and brand placements in life style and fashion magazines and digital outlets, as well as personal appearances by our founder and Creative and Design Chief, Steve Madden, and in-store promotions. We continue to promote our e-commerce websites where customers can purchase Steve Madden Women's, Steven, Madden Men's, FREEBIRD by Steven, Superga, Betsey Johnson, Blondo and Dolce Vita, as well as selected styles of Madden Girl, footwear and accessory products, as well as view exclusive content, participate in contests and “live chat” with customer service representatives. We also connect with our customers through social media forums including Twitter, Facebook and Instagram.
Management Information Systems (MIS) Operations
Sophisticated information systems are essential to our ability to maintain our competitive position and to support continued growth. Our wholesale information system is an Enterprise Resource Planning (“ERP”) system. This integrated system supports our wholesale business in the areas of finance and accounting, manufacturing-sourcing, purchase order management, customer order management and inventory control. We completed the implementation of this new ERP system for our wholesale business in 2014 and implemented the system in three of our acquired businesses in 2015 and in two additional acquired businesses in 2016. In 2017, we completed the implementation of the ERP system for Asia first-cost and sourcing operations and for recently-acquired Schwartz & Benjamin. In 2014, we completed the implementation of a new warehouse management system that is utilized by our third-party logistics providers and, during 2015, implemented this warehouse management system in a company-owned warehouse. This warehouse management system is fully integrated with our ERP system. All of our North American wholesale businesses (other than Canada which has a separate ERP system) are now operating on this ERP system. In 2017, we completed the implementation of a new point of sale system for our U.S. retail stores that is integrated with a retail inventory management/store replenishment system. Complimenting all of these systems are ancillary systems and third-party information processing services, including, among others, supply chain, business intelligence/data warehouse, Electronic Data Interchange, credit card processing and payroll. We undertake updates of all of these management information systems on a periodic basis in order to ensure that our functionality is continuously improved.
Intellectual Property
Trademarks
We consider our Company-owned trademarks to be among our most valuable assets and have registered many of our marks in the United States and 94 other countries and in numerous International Classes. From time to time we adopt new trademarks and new logos and/or stylized versions of our trademarks in connection with the marketing of new product lines. We believe that these trademarks have significant value and are important for purposes of identifying the Company, the marketing of our products and the products of our licensees, distinguishing them from the products of others. What follows is a list of the trademarks we believe are most significant to our business:
8
Steve Madden® | Report® |
Steven by Steve Madden® | Report Signature® |
Steven® | R Design® |
Madden Girl® | Brian Atwood® |
Stevies® | B Brian Atwood® |
Big Buddha® | Dolce Vita® |
Betseyville® | DV BY DOLCE VITA® |
Betsey Johnson® | DV® |
LUV BETSEY plus Kiss Design® | Wild Pair® |
LUV BETSEY by Betsey Johnson Design® | MadLove® |
Blondo® | Betsey Johnson plus Kiss Logo® |
Steve Madden plus Design® | Report Seattle® |
Blondo Waterproof plus Heart Design® | R2® |
SM New York® | Topline® |
SM New York plus Design® | Dolcetta® |
Madden Girl by Steve Madden® | DV8® |
Steve Madden plus Heart Logo® | JD FISK® |
Stevies plus Design® | B Blondo plus Design® |
Big Buddha plus Design® | Studio B® |
Big Buddha love big. Live Buddha plus Design® | Studio Blondo® |
Betsey Johnson Too Too® | Blue By Betsey Johnson® |
We act aggressively to register trademarks and we monitor their use in order to protect them against infringement. There can be no assurance, however, that we will be able to effectively obtain rights to our marks throughout all of the world. Moreover, no assurance can be given that others will not assert rights in, or ownership of, our marks and other proprietary rights or that we will be able to resolve any such conflicts successfully. Our failure to adequately protect our trademarks from unlawful and improper appropriation may have a material adverse effect on our business, financial condition, results of operations and liquidity.
Trademark Licensing
Our strategy for the continued growth of the Company's business includes expanding the Company's presence beyond footwear and accessories through the selective out-licensing of our brands. As of December 31, 2017, we license our Steve Madden®, Steven by Steve Madden® and Madden Girl® trademarks for use in connection with the manufacture, marketing and sale of outerwear, hosiery, jewelry, watches, sunglasses, hair accessories, umbrellas, bedding, luggage, and men’s leather accessories. We license the Stevies® trademark for use in connection with the manufacture, marketing and sale of outerwear exclusively to Target. In addition, the Company licenses the Betsey Johnson® trademark for use in connection with the manufacture, marketing and sale of women's and children’s apparel, hosiery, swimwear, fragrance and beauty, sleepwear, activewear, jewelry, watches, bedding, luggage, stationary, umbrellas, and household goods. We also license the Dolce Vita® trademark for use in connection with the manufacture, marketing and sale of women's and children's apparel. Most of our license agreements require the licensee to pay us a royalty based on actual net sales, a minimum royalty in the event that specified net sales targets are not achieved and a percentage of sales for advertising the brand.
In addition to the licensing of our trademarks, we also in-license the trademarks of third parties for use in connection with certain of our product lines. Generally, these licensing arrangements require us to make advertising payments to the licensor as well as royalty payments equal to a percentage of our net sales and/or a minimum royalty and in some cases additional payments in the event that specified net sales targets are not achieved.
• | In August 2017, we entered into a license agreement with Donna Karan Studio LLC for the right to manufacture, market and sell women's belts with the DKNY® and Donna Karan® brands. The agreement, unless extended, expires on December 31, 2020. |
• | In January 2017, we acquired all of the outstanding capital stock of Schwartz & Benjamin, Inc., and, as a consequence of the acquisition, acquired (i) licenses to manufacture, market and sell footwear under the Kate Spade® and Avec Les |
9
Filles® brands and (ii) a joint venture for the Alice & Olivia® brand. As of December 31, 2017, the Alice & Olivia® joint venture agreement was terminated.
• | Through a license agreement with Basic Properties America Inc. and BasicNet S.p.A, we have the right to use the Superga® trademark in connection with the marketing and sale of footwear through December 31, 2022. |
See Notes A and N to our consolidated financial statements included in this Annual Report on Form 10-K for additional disclosure regarding these licensing arrangements.
Employees
On February 1, 2018, we employed approximately 3,884 employees, of whom approximately 2,497 work on a full-time basis and approximately 1,387 work on a part-time basis. Most of our part-time employees work in the Retail segment. Approximately 2,554 of our employees are located in the United States, approximately 709 employees are located in Hong Kong and China, approximately 353 employees are located in Canada, approximately 163 employees are located in Mexico, approximately 84 employees are located in South Africa and approximately 21 employees are located in Europe. None of our employees are represented by a union. Our management considers relations with our employees to be good. The Company has never experienced a material interruption of its operations due to a labor dispute.
Seasonality and Other Factors
Our operating results are subject to some variability due to seasonality and other factors. For example, the highest percentage of our boot sales have occurred in the fall and winter months (our third and fourth fiscal quarters) and the highest percentage of our sandal sales have occurred in the spring and summer months (our first and second fiscal quarters). Historically, some of our businesses, including our Retail segment, have experienced holiday retail seasonality. Our diverse range of product offerings, however, provides some mitigation to the impact of seasonal changes in demand for certain items. In addition to seasonal fluctuations, our operating results fluctuate from quarter to quarter as a result of the weather, the timing of holidays and larger shipments of footwear, market acceptance of our products, pricing and presentation of the products offered and sold, the hiring and training of additional personnel, inventory write downs for obsolescence, the cost of materials, the product mix among our wholesale, retail and licensing businesses, the incurrence of other operating costs and factors beyond our control, such as general economic conditions and actions of competitors. Sales levels in any period are also impacted by customer decisions to increase or decrease their inventory levels in response to anticipated consumer demand. Our customers may cancel orders, change delivery schedules or change the mix of products ordered with minimal notice to us.
Backlog
We had unfilled wholesale customer orders of approximately $367,101 and $337,000, as of February 1, 2018 and 2017, respectively. Our backlog at a particular time is affected by a number of factors, including seasonality, timing of market weeks and wholesale customer purchases of our core products through our open stock program. Accordingly, a comparison of backlog from period to period may not be indicative of eventual shipments.
ITEM 1A. RISK FACTORS
You should carefully consider the risks and uncertainties we describe below and the other information in this Annual Report on Form 10-K before deciding to invest in, sell or retain shares of our common stock. These are not the only risks and uncertainties that we face. Other sections of this report may discuss factors that could adversely affect our business. The retail industry is highly competitive and subject to rapid change. There may be additional risks and uncertainties that we do not currently know about or that we currently believe are immaterial, or that we have not predicted, which may also harm our business or adversely affect us. If any of these risks or uncertainties actually occurs, our business, financial condition, results of operations and liquidity could be materially harmed.
Risks Related to the Industry in Which the Company Operates
Constantly Changing Fashion Trends and Consumer Demands. The strength of our brands and our success depends in significant part upon our ability to anticipate and respond to product and fashion trends as well as to anticipate, gauge and react to changing consumer demands in a timely manner. There can be no assurance that our products will correspond to the changes in taste and demand or that we will be able to successfully market products that respond to such trends. If we misjudge the market
10
for our products, we may be faced with significant excess inventories for some products and missed opportunities as to others. In addition, misjudgments in merchandise selection could adversely affect our image with our customers resulting in lower sales and increased markdown allowances for customers which could have a material adverse effect on our business, financial condition, results of operations and liquidity.
Intense Fashion Industry Competition. The fashion footwear and accessories industry is highly competitive and barriers to entry are low. Our competitors include specialty companies as well as companies with diversified product lines. The recent market growth in the sales of fashion footwear and accessories has encouraged the entry of many new competitors and increased competition from established companies. Many of these competitors, including Nine West, Guess?, Jessica Simpson, Ugg and Aldo, may have significantly greater financial and other resources than we do and there can be no assurance that we will be able to compete successfully with other fashion footwear and accessories companies. Increased competition could result in pricing pressures, increased marketing expenditures and loss of market share, and could have a material adverse effect on our business, financial condition, results of operations and liquidity. We believe effective advertising and marketing, favorable branding of Steve Madden® and our other trademarks, fashionable styling, high quality, competitive pricing and value are the most important competitive factors. We plan to continue to focus on these elements as we develop new products and businesses. Our inability to effectively advertise and market our products and respond to customer preferences could have a material adverse effect on our business, financial condition, results of operations and liquidity.
Cyclical Nature of the Fashion Industry. The overall fashion industry is cyclical, and purchasing tends to decline during recessionary periods when disposable income is low. Likewise, purchases of contemporary shoes and accessories tend to decline during recessionary periods and also may decline at other times. There can be no assurance that we will be able to grow or even maintain our current level of revenues and earnings, or remain profitable in the future. Slow growth in the international, national or regional economies and uncertainties regarding future economic prospects, among other things, could affect consumer spending habits. The volatility and disruption of global economic and financial market conditions that began in 2008 has caused lingering declines in consumer confidence and spending in the United States and internationally. A further deterioration or a continued weakness of economic and financial market conditions for an extended period of time could have a material adverse effect on our business, financial condition, results of operations and liquidity.
A Rapidly Changing Retail Industry. In recent years, the retail industry has experienced consolidation and other ownership changes. In the future, retailers in the United States and in foreign markets may further consolidate, undergo restructurings or reorganizations, or realign their affiliations, any of which could decrease the number of stores that carry our products or our licensees’ products or increase the ownership concentration within the retail industry. Changing shopping patterns, including the rapid expansion of online retail shopping, have adversely affected customer traffic in mall and outlet centers, particularly in North America. We expect competition in the e-commerce market will intensify. As a greater portion of consumer expenditures with retailers occurs online and through mobile commerce applications, our brick-and-mortar retail customers who fail to successfully integrate their physical retail stores and digital retail may experience financial difficulties, including store closures, bankruptcies or liquidations. A continuation or worsening of these trends could cause financial difficulties for one or more of our major customers, which, in turn, could substantially increase our credit risk and have a material adverse effect on our results of operations, financial condition and cash flows. Our future success will be determined, in part, on our ability to manage the impact of the rapidly changing retail environment and identify and capitalize on retail trends, including technology, e-commerce and other process efficiencies that will better service our customers. If we fail to compete successfully, our businesses, market share, results of operations and financial condition will be materially and adversely affected. While such changes in the retail industry to date have not had a material adverse effect on our business or financial condition, results of operations and liquidity, there can be no assurance as to the future effect of any such changes.
Economic Uncertainty. Our opportunities for long-term growth and profitability are accompanied by significant challenges and risks, particularly in the near term. Specifically, our business is dependent on consumer demand for our products and the purchase of our products by consumers is largely discretionary. We believe that declining consumer confidence accompanied with the tightening of credit standards, higher energy and food prices and unemployment rates and a decrease in consumers' disposable income has negatively impacted the level of consumer spending for discretionary items during the years ended December 31, 2017, 2016 and 2015. In addition, economic factors such as inflation, higher labor costs, increased transportation costs and higher healthcare and insurance costs may increase our costs of sales and operating expenses. Changes in economic conditions may have a negative effect on the Company's sales and results of operations during the year ending December 31, 2018 and thereafter.
Legal, Regulatory and Political Risks of a Global Economy. As a result of our large and growing international operations, we are subject to risks associated with our operations in international markets as a result of a number of factors, many of which are beyond our control. These risks include, among other things:
11
• | the challenge of managing broadly dispersed foreign operations; |
• | inflationary pressures and economic changes or volatilities in foreign economies; |
• | the burdens of complying with the laws and regulations of the U.S. and foreign nations; |
• | additional or increased customs duties, tariffs, taxes and other charges on imports or exports; |
• | political corruption or instability; |
• | geopolitical regional conflicts, terrorist activity, political unrest, civil strife, acts of war; |
• | local business practices that do not conform to legal or ethical guidelines; |
• | anti-American sentiment in foreign countries in which we operate; |
• | delays in receipts of our products at our distribution centers due to labor unrest, increasing security requirements or other factors at U.S. or other ports; |
• | significant fluctuations in the value of the dollar against foreign currencies; |
• | increased difficulty in protecting our intellectual property in foreign nations; |
• | restrictions on the transfer of funds between the U.S. and foreign nations; and |
• | natural disasters in areas in which our businesses, customers, suppliers and licensees are located. |
All of these factors could disrupt or limit the countries in which we sell or source our products or significantly increase the cost of operating in or obtaining materials originating from certain countries, result in decreased revenues and could materially and adversely affect our product sales, financial condition and results of operations.
Following the November 2016 U.S. election, the leaders of the U.S. government have increasingly focused on efforts to discourage U.S. corporations from outsourcing manufacturing and production activities to foreign jurisdictions, including through the possibility of imposing tariffs or penalties on goods manufactured outside the United States to attempt to discourage these practices. Changes in tax policy or trade regulations, such as the recently passed Tax Cuts and Jobs Act in the United States, material modifications or withdrawal from existing trade agreements, including the United States’ withdrawal from or significant renegotiation of the North America Free Trade Agreement (NAFTA), the disallowance of tax deductions on imported merchandise, or the imposition of new tariffs on imported products, could necessitate changes in the way we conduct business, including our product sourcing operations, and have a material adverse effect on our business and results of operations.
In June 2016, voters in the United Kingdom approved an advisory referendum, commonly referred to as “Brexit”, to withdraw from the European Union. Brexit has created political and economic uncertainty, particularly in the United Kingdom and the European Union, that may endure for years. The withdrawal of the United Kingdom from the European Union could significantly disrupt the free movement of goods, services, and people between the United Kingdom and the European Union, and increase legal and regulatory complexities, all of which could lead to higher costs of conducting business in Europe. Brexit could also encourage similar referendums in other European countries in which we do business. The terms of the United Kingdom's withdrawal from the European Union are uncertain. Its consequences could adversely impact consumer and investor confidence, and the level of consumer purchases of discretionary items and retail products, including our products. All of these factors could materially adversely affect our business, results of operations, and financial condition.
We are subject to the U.S. Foreign Corrupt Practices Act, which generally prohibits the payment of bribes to foreign officials to assist in obtaining or retaining business. We are also subject to anti-corruption laws of the foreign countries in which we operate. Although we have implemented policies and procedures that are designed to promote compliance with such laws, our employees, contractors and agents may take actions that violate our policies and procedures. Any such violation could result in sanctions or other penalties against the Company and have an adverse effect on our business, reputation and operating results.
Changes in Tax Laws Could Have an Adverse Effect Upon Our Financial Results. We are subject to income tax requirements in various jurisdictions in the United States and internationally. Legislation or other changes in the tax laws of the jurisdictions where we do business could increase our liability and adversely affect our after-tax profitability. In the United States, the Tax Cuts and Jobs Act, which was enacted on December 22, 2017, could have a significant impact on our effective tax rate, net deferred tax assets and cash tax expenses. Among other things, the Tax Cuts and Jobs Act reduces the U.S. corporate statutory tax rate, eliminates or limits deduction of several expenses which were previously deductible, requires a minimum tax on earnings generated by foreign subsidiaries, imposes a mandatory deemed repatriation tax on undistributed historic earnings of foreign subsidiaries and permits a tax-free repatriation of foreign earnings through a dividends-received deduction. We are currently evaluating the overall impact of the Tax Cuts and Jobs Act on our effective tax rate and balance sheet, but expect that the impact may be significant for our fiscal year 2018 and future periods.
Other jurisdictions are contemplating changes or have unpredictable enforcement activity. Increases in applicable tax rates, implementation of new taxes, changes in applicable tax laws and interpretations of these tax laws and actions by tax authorities in jurisdictions in which we operate could reduce our after tax income and have an adverse effect on our results of operations.
12
We May Be Subject to Additional Tax Liabilities as a Result of Audits by Various Taxing Authorities. We are subject to the tax laws and regulations of numerous jurisdictions as a result of our international operations. These tax laws and regulations are highly complex and significant judgment and specialized expertise is required in evaluating and estimating our worldwide provision for income taxes. We are subject to audit by the taxing authorities in each jurisdiction where we conduct our business., and any one of these jurisdictions may assess additional taxes against us as a result of an audit. Although we believe our tax estimates are reasonable, and we undertake to prepare our tax filings in accordance with all applicable tax laws, the final determination with respect to any tax audits, and any related litigation, could be materially different from our estimates or from our historical tax provisions and accruals. The outcome of any audit or audit-related litigation could have a material adverse effect on our operating results or cash flows in the periods for which that determination is made, and may require a restatement of prior financial reports. In addition, future period earnings may be adversely impacted by litigation costs, settlement payments or interest or penalty assessments.
Risks Related to Our Business
Dependence on Key Personnel. The growth and success of our Company since its inception more than a quarter century ago is attributable, to a significant degree, to the talents, skills and efforts of our founder and Creative and Design Chief, Steven Madden. An extended or permanent loss of the services of Mr. Madden could severely disrupt our business and have a material adverse effect on the Company. In addition to Mr. Madden, the Company depends on the contributions of the members of our senior management team. Our senior executives have substantial experience and expertise in our business and industry and have made significant contributions to our growth and success as well. Competition for executive talent in the apparel, footwear and accessories industries is intense. While our employment agreements with Mr. Madden and most of our senior executives include a non-compete provision in the event of the termination of employment, the non-compete periods are of limited duration. Although we believe we have depth within our senior management team, if we were to lose the services of our Creative and Design Chief or any of our senior executives, and especially if any of these individuals were to join a competitor or form a competing company, our business and financial performance could be seriously harmed. A loss of the skills, industry knowledge, contacts and expertise of our Creative and Design Chief or any of our senior executives could cause a setback to our operating plan and strategy.
Dependence Upon Significant Customers. Our customers consist principally of better department stores, major department stores, mid-tier department stores, specialty stores, luxury retailers, value priced retailers, national chains, mass merchants and catalog retailers. Certain of our department store customers, including some under common ownership, account for significant portions of our wholesale business. We generally enter into a number of purchase order commitments with our customers for each of our lines every season and do not enter into long-term agreements with any of our customers. Therefore, a decision by a significant customer, whether motivated by competitive conditions, financial difficulties or otherwise, to decrease the amount of merchandise purchased from us or to change its manner of doing business could have a material adverse effect on our business, financial condition, results of operations and liquidity.
Risks Associated with Extending Credit to Customers. We sell our products primarily to retail stores across the United States and extend credit based on an evaluation of each customer's financial condition, usually without collateral. Various retailers, including some of our customers, have experienced financial difficulties, which has increased the risk of extending credit to such retailers. However, our losses due to bad debts have been limited. Pursuant to the terms of our collection agency agreement, our factor, Rosenthal & Rosenthal, Inc., currently assumes the credit risk related to approximately 84% of our trade accounts receivable. In addition, we have letters of credit for approximately 3% of our trade accounts receivable. Still, if any of our customers experience a shortage of liquidity, the risk that the customer's outstanding payables to us would not be paid could cause us to curtail business with the customer or require us to assume more credit risk relating to the customer's account payable.
Risks Associated with Expansion of Retail Business. Our continued growth depends to a significant degree on whether we are successful in further developing and marketing our brands, and creating new brands, product categories and businesses that are appealing to our customers. The operation of company-owned Steve Madden, Steven and Superga stores and outlets is a significant part of our growth strategy. During the year ended December 31, 2017, we opened 13 new full price stores, six new outlet stores and closed two full price stores in the United States. We have plans to open 11 to 13 new retail stores and close 8 to 10 locations in 2018. Our future expansion plan includes the opening of stores in new geographic markets as well as strengthening existing markets. New store openings involve substantial investments. New markets have in the past presented, and will continue to present, competitive and merchandising challenges that are different from those faced by us in our existing markets. There can be no assurance that we will be able to open new stores, and if opened, that such new stores will be able to achieve sales and profitability levels consistent with management's expectations. Our retail expansion is dependent on the performance of our wholesale and retail operations, generally, as well as on a number of other factors, including our ability to:
• | locate and obtain favorable store sites; |
13
• | negotiate favorable lease terms; |
• | hire, train and retain competent store personnel; |
• | anticipate the preferences of our retail customers in new geographic areas; |
• | successfully integrate new stores into our existing operations. |
Past comparable store sales results may not be indicative of future results and there can be no assurance that our comparable store sales results will increase or even be maintained in the future. Also, as we expand the number of our retail stores, we run the risk that our wholesale customers will perceive that we are increasingly competing directly with them, which may lead them to reduce or terminate purchases of our products.
Management of Growth. The size of our business continues to grow organically and as a result of business acquisitions. In order to gain from our acquisitions, we must be effective in integrating the businesses acquired into our overall operations. Further, the expansion of our operations has increased and will continue to increase the demand on our managerial, operational and administrative resources. In recent years, we have invested significant resources in, among other things, our management information systems and hiring and training of new personnel. However, in order to manage currently anticipated levels of future demand, we may be required to, among other things, expand our distribution facilities, establish relationships with new manufacturers to produce our product, and continue to expand and improve our financial, management and operating systems. We may experience difficulty integrating acquired businesses into our operations and may not achieve anticipated synergies from such integration. There can be no assurance that we will be able to manage future growth effectively and a failure to do so could have a material adverse effect on our business, financial condition, results of operations and liquidity.
Disruptions to Product Delivery Systems and Associated Inventory Management Issues. A majority of our products for U.S. distribution are shipped to us via ocean freight carriers to ports in California, New Jersey and Texas with the greatest reliance on California ports. The trend-focused nature of the fashion industry and the rapid changes in customer preferences leave us vulnerable to risk of inventory obsolescence. Our reliance upon ocean freight transportation for the delivery of our inventory exposes us to various inherent risks, including port workers’ union disputes and associated strikes, work slow-downs and work stoppages, severe weather conditions, natural disasters and terrorism, any of which could result in delivery delays and inefficiencies, increase our costs and disrupt our business. Any severe and prolonged disruption to ocean freight transportation could force us to use alternate and more expensive transportation systems. For example, during the California port workers' dispute in 2014, we were forced to re-route our merchandise by air transit. Efficient and timely inventory deliveries and proper inventory management are important factors in our operations. Inventory shortages can adversely affect the timing of shipments to customers and diminish sales and brand loyalty. Conversely, excess inventories can result in lower gross margins due to the excessive discounts and markdowns that may be necessary to reduce high inventory levels. Severe and extended delays in the delivery of our inventory or our inability to effectively manage our inventory could have a material adverse effect on our business, financial condition, results of operations and liquidity.
Disruption of Information Technology Systems and Websites. We are heavily dependent upon our information technology systems to record and process transactions and manage and operate all aspects of our business ranging from product design and testing, production, forecasting, ordering, transportation, sales and distribution, invoicing and accounts receivable management, quick response replenishment, point of sale support and financial management reporting functions. In addition, we have e-commerce websites. Given the nature of our business and the significant number of transactions in which we engage on an annual basis, it is essential that we maintain constant operation of our information technology systems and websites and that these systems and our websites operate effectively. We depend on our in-house information technology employees and third-parties including “cloud” service providers to maintain and periodically update and/or upgrade these systems and our websites to support the growth of our business. Despite our preventative efforts, our information technology systems and websites may, from time to time, be vulnerable to damage or interruption from events such as difficulties in replacing or integrating the systems of acquired businesses, computer viruses, security breaches and power outages. Cybersecurity attacks are becoming increasingly sophisticated and run the gamut from malicious software and ransomware to electronic security breaches to corruption of data and beyond. We are continually evaluating, improving and upgrading our information technology systems and websites in an effort to address these concerns. Any such problems or interruptions could result in loss of valuable business data, our customers' or employees' personal information, disruption of our operations and other adverse impacts to our business and require significant expenditures by us to remediate any such failure, problem or breach. In addition, we must comply with increasingly complex regulatory standards enacted to protect business and personal data and an inability to maintain compliance with these regulatory standards could subject us to legal risks and penalties.
We maintain $40 million of network-security insurance coverage, above a $250,000 deductible. This coverage and certain other insurance coverage may reduce our exposure to electronic data theft and sabotage. While we maintain other insurance
14
coverage aimed at addressing certain of these other risks, there can be no assurance that depending upon the nature of the issue presented, we will have insurance coverage available or that the amounts of coverage will be adequate.
Breach of Customer Privacy. A routine part of our business includes the gathering, processing and retention of sensitive and confidential information pertaining to our customers, employees and others. Although we believe that our information security and information technology systems and websites allow for the secure storage and transmission of private information regarding our customers and others, including credit card information and personal identification information, we may not have the resources or technical sophistication to anticipate or prevent the rapidly-evolving and complex cyber-attacks being unleashed by increasingly sophisticated hackers and data thieves. As a result, our facilities and information technology systems, as well as those of our third party service providers, may be vulnerable to cyber-attacks and breaches, acts of vandalism, ransomware, software viruses and other similar types of malicious activities. Any actual or threatened cyber-attack may cause us to incur costs, including costs related to the hiring of additional computer experts, business interruption, engaging third party cyber security consultants and upgrading our information security technologies. We also may be vulnerable to data and security breaches by us or by persons with whom we have commercial relationships resulting from misplaced or lost data, programming or human error, or other similar events. As a result of recent security breaches at a number of prominent companies, the media and public scrutiny of information security and privacy has become more intense and the regulatory environment has become more uncertain. Any compromise or breach of our information technology systems that results in the misappropriation, loss or other unauthorized disclosure of a customer's or other person’s confidential or proprietary information, whether by the Company or a third party service provider, could result in a loss of confidence and severely damage our reputation and relationship with our customers and others who entrust us with sensitive information, violate applicable privacy and other laws and adversely affect our business, as well as expose the Company to the risk of litigation and significant potential liability.
Foreign Sourcing and Manufacturing. Virtually all of our products are purchased through arrangements with a number of foreign manufacturers, primarily from China, Italy, Brazil, Mexico, India and Vietnam. During 2017, approximately 93% of our total purchases were from China. Risks inherent in foreign operations including work stoppages, transportation delays and interruptions, social unrest and political upheaval and changes in economic conditions, can result in the disruption of trade from the countries in which our manufacturers or suppliers are located, the imposition of additional regulations relating to imports, the imposition of additional duties, taxes and other charges on imports, significant fluctuations of the value of the dollar against foreign currencies, or restrictions on the transfer of funds, any of which could have a material adverse effect on our business, financial condition, results of operations and liquidity. Although we believe that we manage our exposure to the risk that any such economic or political condition will materially affect our ability to purchase products because we are aware of the availability of a variety of materials and alternative sources, we cannot be certain that we will be able to identify such alternative materials and/or sources without delay or without greater cost to us. Our inability to identify and secure alternative sources of supply in this situation could have a material adverse effect on our business, financial condition, results of operations and liquidity.
Impact of Custom Duties and Other Import Regulations. Virtually all of our products are imported and subject to United States custom duties. In addition, over time we have increased our sales of products outside of the United States. The United States and the countries in which our products are produced or sold, from time to time, may impose new quotas, duties, tariffs or other restrictions on imports or exports, may adversely adjust prevailing quotas, duties or tariff levels, or may impose sanctions in the form of additional duties to remedy perceived illegal actions. The current political landscape has introduced greater uncertainty with respect to future tax and trade regulations for United States companies like ours with significant business and sourcing operations outside the United States. We cannot predict whether, and to what extent, there may be changes to international trade agreements or whether quotas, duties, tariffs, exchange controls or other restrictions will be changed or imposed by the United States or by other countries. If we or our suppliers or licensees are unable to source raw materials or finished goods from the countries where we or they wish to purchase them, either because of such regulatory changes or for any other reason, or if the cost of doing so should increase, it could have a material adverse effect on our business, financial condition, results of operations and liquidity.
Manufacturers' Inability to Produce Our Goods in a Timely Manner or Meet Quality Standards. As is common in the footwear and accessories industries, we contract with foreign manufactures who produce virtually all of our products to our specifications. We do not own or operate any manufacturing facilities; therefore, we are dependent upon third parties for the manufacture of all of our products. The inability of a manufacturer to ship orders of our products in a timely manner or to meet our quality standards could cause us to miss the delivery date requirements of our customers for those items, which, in turn, could result in cancellation of orders, refusal to accept deliveries, a reduction in purchase prices and, ultimately, termination of a customer relationship, any of which could have a material adverse effect on our business, financial condition, results of operations and liquidity.
15
SEC Rules Relating to “Conflict Minerals” Require the Company to Incur Additional Expenses and Could Adversely Affect our Business. The SEC has promulgated final rules mandated by the Dodd-Frank Wall Street Reform and Consumer Protection Act requiring the disclosure of the use of tantalum, tin, tungsten and gold, known as “conflict minerals,” included in products either manufactured by public companies or as to which public companies have contracted for the manufacture. These rules, adopted in an effort to prevent inadvertent support of armed conflict in the Democratic Republic of Congo and certain adjoining countries (collectively, the “DRC”), require companies to investigate their supply chains to determine whether these minerals are present in their products and, if so, from where the minerals originate. The rules also require disclosure and annual reporting as to whether or not conflict minerals, if used in the manufacture of the products offered, originate from the DRC. We currently require our manufacturers to comply with policies addressing legal and ethical concerns relating to labor, employment, political and social matters including restrictions on the use of conflict minerals. Violation of these policies by our manufacturers could harm our reputation, disrupt our supply chain and/or increase our cost of goods sold. Additionally, violation of any of these policies by our manufacturers could cause us to face disqualification as a supplier for our customers and suffer reputational challenges. Due to the complexity of our supply chain, compliance with the rules requires significant efforts from a cross-operational team and diverts our management and personnel and results in potential costs of additional staff. Any of the foregoing could adversely affect our sales, net earnings, business and financial condition and results of operations.
Difficulty in Locating Replacement Manufacturers. Although we enter into a number of purchase order commitments each season specifying a time frame for delivery, method of payment, design and quality specifications and other standard industry provisions, we do not have long-term contracts with any manufacturer. As a consequence, any of these manufacturing relationships may be terminated, by either party, at any time. In addition, we may seek replacement manufacturers for various reasons, including a significant increase in the prices we are required to pay to existing manufacturers of our goods. Although we believe that other facilities are available for the manufacture of our products, there can be no assurance that such facilities would be available to us on an immediate basis, if at all, or be able to meet our quality standards and delivery requirements, or that the costs charged to us by such manufacturers would not be significantly greater than those presently paid.
Manufacturers' Failure to Use Acceptable Labor Practices and Comply with Local Laws and Other Standards. Our products are manufactured by numerous independent manufacturers outside of the United States. We also have license agreements that permit our licensees to manufacture or contract to manufacture products using our trademarks. We impose, and require that our licensees impose, on these manufacturers environmental, health, and safety standards for the benefit of their labor force. In addition, we require these manufacturers to comply with applicable standards for product safety. However, we do not control our independent manufacturers or licensing partners or their labor, product safety and other business practices and, from time to time, our independent manufacturers may not comply with such standards or applicable local law or our licensees may not require their manufacturers to comply with such standards or applicable local law. The violation of such standards and laws by one of the independent manufacturers with whom we contract or by one of our licensing partners, or the divergence of a manufacturer's or a licensing partner's labor practices from those generally accepted as ethical in the United States, could harm our reputation, result in a product recall or require us to curtail our relationship with and locate a replacement for such manufacturer, which, as noted in the immediately preceding risk factor, could be challenging. Any of these events could have a material adverse effect on our business, financial condition, results of operations and liquidity.
Seasonal and Quarterly Fluctuations. Our results of operations may fluctuate from quarter to quarter and are affected by a variety of factors, including:
• | the timing of holidays; |
• | weather conditions; |
• | the timing of larger shipments of product; |
• | market acceptance of our products; |
• | the mix, pricing and presentation of the products offered and sold; |
• | the hiring and training of additional personnel; |
• | inventory write downs for obsolescence; |
• | the cost of materials; |
• | the product mix between wholesale, retail and licensing businesses; |
• | the incurrence of other operating costs; and |
• | factors beyond our control, such as general economic conditions, declines in consumer confidence and actions of competitors. |
In addition, we expect that our sales and operating results may be significantly impacted by the opening of new retail stores and the introduction of new products. Accordingly, the results of operations in any quarter will not necessarily be indicative of the results that may be achieved for a full fiscal year or any future quarter.
16
Extreme or Unseasonable Weather Conditions in Locations in Which We or Our Customers and Suppliers are Located Could Adversely Affect our Business. Our corporate headquarters and principal operational locations, including retail, distribution and warehousing facilities, may be subject to natural disasters and other severe weather and geological events that could disrupt our operations. The occurrence of such natural events may result in sudden disruptions in business conditions of the local economies affected, as well as of the regional and global economies, and may result in decreased demand for our products and disruptions in our management functions, sales channels and manufacturing and distribution networks, which could have a material adverse effect on our business, financial condition and results of operations. Extreme weather events and changes in weather patterns can also influence customer trends and shopping habits. Extended periods of unseasonably warm temperatures during the winter season or cool weather during the summer season may diminish demand for our seasonal merchandise. Heavy snowfall, hurricanes or other severe weather events in the areas in which our retail stores and the retail stores of our wholesale customers are located may decrease customer traffic in those stores and reduce our sales and profitability. If severe weather events force closure of or disrupt operations at the distribution centers we use for our merchandise, we could incur higher costs and experience longer lead times to distribute our products to our retail stores, wholesale customers or e-commerce customers. If prolonged, such extreme or unseasonable weather conditions could adversely affect our business, financial condition and results of operations.
Inadequate Trademark Protections. We believe that our trademarks and other proprietary rights are of major significance to our success and our competitive position and consider some of our trademarks, such as Steve Madden, to be integral to our business and among our most valuable assets. Accordingly, we devote substantial resources to the establishment and protection of our trademarks on a worldwide basis. Nevertheless, policing unauthorized use of our intellectual property is difficult, expensive and time consuming and there can be no assurance that the actions taken by us to establish and protect our trademarks and other proprietary rights will be adequate to prevent imitation of our products by others or to prevent others from seeking to block sales of our products on the basis that our products violate the trademarks and proprietary rights of others. Moreover, no assurance can be given that others will not assert rights in, or ownership of, trademarks and other proprietary rights of ours or that we will be able to successfully resolve such conflicts. We could incur substantial costs in legal actions relating to our use of intellectual property or the use of our intellectual property by others. In addition, the laws of certain foreign countries may not protect proprietary rights to the same extent as do the laws of the United States. Our failure to establish and then protect such proprietary rights from unlawful and improper utilization could have a material adverse effect on our business, financial condition, results of operations and liquidity.
Our Licensees’ Conduct Could Harm our Business. We license to others the rights to produce and market certain products that are sold under our trademarks. Although we retain significant control over our licensees’ products and advertising, we rely on our licensees for operational and financial control over their businesses. If the quality, image or distribution of our licensed products diminish, customer acceptance of and demand for our brands and products could decline. This could materially and adversely affect our business and results of operations. In fiscal year 2017, approximately 76% of our net royalties were derived from our top five licensed product lines. A decrease in customer demand for any of these product lines could have a material adverse effect on our results of operations and financial condition. Although we believe that in most circumstances we could replace existing licensees if necessary, our inability to do so effectively or for any period of time could adversely affect our revenues and results of operations.
Litigation and Other Legal Proceedings. We are involved in various claims, litigations and other legal and regulatory proceedings and governmental investigations that arise from time to time in the ordinary course of our business. Due to the inherent uncertainties of litigation and such other proceedings and investigations, we cannot predict with accuracy the ultimate outcome of any such matters. An unfavorable outcome could have an adverse impact on our business, financial condition and results of operations and the amount of insurance coverage we maintain to address such matters may be inadequate to cover these or other claims. In addition, any significant litigation, investigation or proceeding, regardless of its merits, could divert financial and management resources that would otherwise be used to benefit our operations. See Item 3 “Legal Proceedings,” below for additional information regarding legal proceedings in which we are involved.
Declines in Our Stock Price Due to Inaccurate Predictions. The trading price of our common stock periodically may rise or fall based on the accuracy of predictions of our future performance. As one of our primary objectives, we strive to maximize the long-term strength, growth and profitability of our Company, rather than to achieve an earnings target in any particular fiscal quarter. We believe that this longer-term goal is in the best interests of the Company and our stockholders, but recognize that it may be helpful to our stockholders and potential investors for us to provide guidance as to our quarterly and annual forecast of net sales and earnings. Although we endeavor to provide meaningful and considered guidance at the time it is provided and generally expect to provide updates to our guidance when we report our results each fiscal quarter, actual results may differ from our predictions as the guidance is based on assumptions and expectations that may or may not come to pass and, as such, we assume no responsibility to update any of our forward-looking statements at such times or otherwise. If and when we announce actual results that differ from those that have been predicted by us, the market price of our common stock could be adversely
17
affected. Investors who rely on these predictions in making investment decisions with respect to our common stock do so at their own risk. We take no responsibility for any losses suffered as a result of such changes in the price of our common stock.
In addition, at any given time outside securities analysts may follow our financial results and issue reports that discuss our historical financial results and the analysts' predictions of our future performance, which our stockholders and potential investors may choose to rely on in making investment decisions. These analysts' predictions are based upon their own opinions and are often different from our own forecasts. Our stock price could decline if our results are below the estimates or expectations of these outside analysts.
Exposure to Foreign Currency Fluctuations. We make the majority of our purchases in U.S. dollars. However, we source substantially all of our products overseas and, as such, the cost of these products may be affected by changes in the value of the relevant currencies. Changes in currency exchange rates may also affect the relative prices at which we and our foreign competitors sell products in the same market. We use forward foreign exchange contracts to hedge material exposure to adverse changes in foreign exchange rates. However, no hedging strategy can completely insulate us from foreign exchange risk. We are also exposed to gains and losses resulting from the effect that fluctuations in foreign currency exchange rates have on the reported results in our financial statements due to the translation of operating results and financial position of our foreign subsidiaries. There can be no assurance that foreign currency fluctuations will not have a material adverse effect on our business, financial condition, results of operations and liquidity.
ITEM 1B. UNRESOLVED STAFF COMMENTS
None.
ITEM 2. PROPERTIES
We lease space for our headquarters, our retail stores, showrooms and office facilities in various locations in the United States, as well as overseas. We own one improved real property parcel in Long Island City, New York. We believe that our existing facilities are in good operating condition and are adequate for our present level of operations. The following table sets forth information with respect to our key properties:
18
Location | Leased/Owned | Primary Use | Approximate Area Square Feet | |
Dongguan, Guangdong Province, China | Leased | Offices and sample production | 166,800 | |
Montreal, Canada | Leased | Offices, warehouse | 117,422 | |
Long Island City, NY | Leased | Executive offices | 90,000 | |
Peabody, MA | Leased | Offices and warehouse, Schwartz & Benjamin | 80,424 | |
Bayonne, NJ | Leased | Warehouse | 83,000 | |
Bellevue, WA | Leased | Offices, Topline | 41,500 | |
New York, NY | Leased | Offices and showroom, Accessories | 30,000 | |
New York, NY | Leased | Offices and showroom, Schwartz & Benjamin | 14,110 | |
Putian City, Guangdong Province, China | Leased | Offices | 13,800 | |
New York, NY | Leased | Showroom | 13,401 | |
Seattle, Washington | Leased | Offices and showroom, Dolce Vita | 10,537 | |
New York, NY | Leased | Offices and showroom | 10,000 | |
Long Island City, NY | Leased | Storage | 7,200 | |
Kowloon, Hong Kong | Leased | Offices | 4,800 | |
Mexico City, Mexico | Leased | Offices, SM Mexico | 3,520 | |
Los Angeles, CA | Leased | Showroom, Steven | 2,700 | |
New York, NY | Leased | Offices | 2,700 | |
Long Island City, NY | Owned | Other | 2,200 | |
New York, NY | Leased | Apartments | 1,800 | |
Bucharest, Romania | Leased | Offices, Customer Service | 1,722 | |
New York, NY | Leased | Offices | 850 | |
Dallas, Texas | Leased | Showroom | 800 | |
All of our retail stores are leased pursuant to leases that, under their original terms, extend for an average of ten years. Many of the leases contain rent escalation clauses to compensate for increases in operating costs and real estate taxes over the base year. The current terms of our retail store leases expire as follows:
Years Initial Lease Terms Expire | Number of Stores | |
2018 | 18 | |
2019 | 22 | |
2020 | 24 | |
2021 | 19 | |
2022 | 28 | |
2023 | 24 | |
2024 | 19 | |
2025 | 20 | |
2026 | 16 | |
2027 | 6 | |
2028 | 3 | |
2029 | 3 | |
ITEM 3. LEGAL PROCEEDINGS
In the ordinary course of business, we have various pending cases involving contractual disputes, employee-related matters, distribution matters, product liability claims, trademark infringement and other matters. In the opinion of management, after consulting with legal counsel, the liabilities, if any, resulting from these legal proceedings should not have a material impact on our financial condition, results of operations or cash flows.
19
ITEM 4. MINE SAFETY DISCLOSURES
Not applicable.
PART II
ITEM 5 | MARKET FOR REGISTRANT'S COMMON EQUITY, RELATED STOCKHOLDER MATTERS AND ISSUER PURCHASES OF EQUITY SECURITIES |
Market Information. Our shares of common stock have traded on the NASDAQ Global Select Market since August 1, 2007 and were traded on the NASDAQ National Market prior to that date. The following table sets forth the range of high and low closing sales prices for our common stock during each fiscal quarter during the two-year period ended December 31, 2017 as reported by the NASDAQ Global Select Market. The trading volume of our securities fluctuates and may be limited during certain periods. As a result, the liquidity of an investment in our securities may be adversely affected.
Common Stock
High | Low | High | Low | ||
2017 | 2016 | ||||
Quarter ended March 31, 2017 | $38.95 | $33.50 | Quarter ended March 31, 2016 | $38.48 | $27.80 |
Quarter ended June 30, 2017 | $40.75 | $35.55 | Quarter ended June 30, 2016 | $38.06 | $31.68 |
Quarter ended September 30, 2017 | $43.80 | $38.20 | Quarter ended September 30, 2016 | $36.97 | $32.69 |
Quarter ended December 31, 2017 | $47.55 | $37.25 | Quarter ended December 31, 2016 | $40.55 | $32.30 |
Holders. As of February 27, 2018, there were 152 holders of record of our common stock.
Dividends. Historically, with the exception of a special cash dividend paid in each of November 2005 and November 2006, we have not declared or paid any cash dividends to our common stockholders in the past. Instead, we have chosen to retain earnings, if any, for potential future dividends and to finance the development and expansion of our business.
In February 2018, the Board of Directors of the Company declared a quarterly cash dividend of $0.20 per share on the Company’s outstanding shares of common stock. The dividend is payable on March 29, 2018, to stockholders of record as of the close of business on March 12, 2018. The Company currently expects to continue the practice of paying a cash dividend each quarter; however, the payment of future dividends will be subject to the discretion of our Board of Directors and will be contingent upon future earnings, if any, our financial condition, capital requirements, general business conditions, and other factors. Therefore, we can give no assurance that cash dividends of any kind will be paid to holders of our common stock in the future.
Equity Compensation Plans. Information regarding our equity compensation plans as of December 31, 2017 is disclosed in Item 12, “Security Ownership of Certain Beneficial Owners and Management and Related Stockholder Matters.”
Issuer Repurchases of Equity Securities. The Company's Board of Directors authorized a share repurchase program (the "Share Repurchase Program") effective as of January 1, 2004. The Share Repurchase Program permits the Company to effect repurchases of the Company's common stock from time to time through a combination of open market repurchases or in privately negotiated transactions at such prices and times as are determined to be in the best interest of the Company. The Share Repurchase Program does not have a fixed expiration or termination date and may be modified or terminated by the Board of Directors at any time. On several occasions the Board of Directors has increased the amount authorized for repurchase, most recently, on July 28, 2017, when the Board of Directors approved the continuation of the Share Repurchase Program for an additional $200 million in repurchases of the Company's common stock. During fiscal year 2017, an aggregate of 2,253,802 shares of the Company's common stock were repurchased under the Share Repurchase Program, at an average per share price of $37.62, for an aggregate purchase price of approximately $85 million. At December 31, 2017, an aggregate of approximately $181 million remained available for
20
future repurchases of our common stock under the Share Repurchase Program. The following table presents the total number of shares of the Company's common stock, $.0001 par value, purchased by the Company in the three months ended December 31, 2017, the average price paid per share and the approximate dollar value of the shares that still could have been purchased at the end of the fiscal period, pursuant to the Company's Share Repurchase Program.
Period | Total Number of Shares Purchased(1) | Average Price Paid per Share(1) | Total Number of Shares Purchased as part of Publicly Announced Plans or Programs | Maximum Dollar Amount of Shares that May Yet Be Purchased Under the Plans or Programs | |||||||||
10/1/2017 - 10/31/2017 | 20,982 | $ | 42.91 | 20,982 | $ | 194,803 | |||||||
11/1/2017 - 11/30/2017 | 474,435 | $ | 39.38 | 334,571 | $ | 193,902 | |||||||
12/1/2017 - 12/31/2017 | 143,745 | $ | 45.94 | — | $ | 180,861 | |||||||
Total | 639,162 | $ | 40.97 | 355,553 | $ | 180,861 | |||||||
(1) The Steven Madden, Ltd. 2006 Stock Incentive Plan provides the Company with the right to deduct or withhold, or require employees to remit to the Company, an amount sufficient to satisfy any applicable tax withholding obligations applicable to stock-based compensation awards. To the extent permitted, employees may elect to satisfy all or part of such withholding obligations by tendering to the Company previously owned shares or by having the Company withhold shares having a fair market value equal to the minimum statutory tax withholding rate that could be imposed on the transaction. Included in this table are shares withheld during the fourth quarter of 2017 in connection with the settlement of vested restricted stock and exercises of stock options to satisfy tax withholding requirements, in addition to the shares repurchased pursuant to the Share Repurchase Program. Of the total number of shares repurchased by the Company in the fourth quarter of 2017, 283,609 shares were withheld at an average price per share of $43.17, for an aggregate purchase price of approximately $12,244, in connection with the settlement of vested restricted stock and exercises of stock options to satisfy tax withholding requirements. Excluding the shares withheld in connection with the settlement of vested restricted stock and exercises of stock options, the average price per share was $42.91 in October 2017, $38.98 in November 2017 and $39.21 in the period October 1, 2017 to December 31, 2017.
Performance Graph. The following graph compares the yearly percentage change in the cumulative total stockholder return on our common stock during the period beginning on December 31, 2012, and ending on December 31, 2017, with the cumulative total return on the Russell 2000 Index and a peer group index. In 2016, the Company decided to remove the S&P 500 Footwear Index and replace it with a peer group index of companies believed to be engaged in similar businesses, as we believe the composition of the new peer group is more representative of our current business. The peer group index consists of six companies: Caleres, Inc., Crocs, Inc., Deckers Outdoor Corporation, Genesco Inc., Skechers U.S.A., Inc. and Wolverine World Wide, Inc.
The comparison assumes that $100 was invested on December 31, 2012 in our common stock and in the foregoing indices and assumes the reinvestment of dividends.
21
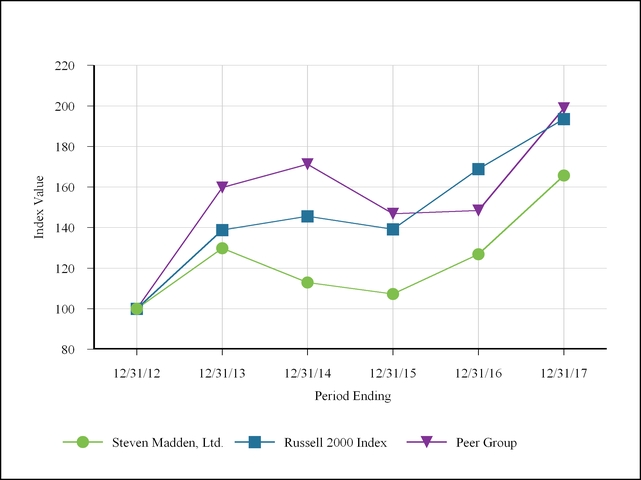
12/31/2012 | 12/31/2013 | 12/31/2014 | 12/31/2015 | 12/31/2016 | 12/31/2017 | ||||||||
Steven Madden, Ltd. | $100.00 | $129.84 | $112.95 | $107.24 | $126.86 | $165.72 | |||||||
Russell 2000 Index | $100.00 | $138.82 | $145.62 | $139.19 | $168.85 | $193.58 | |||||||
Peer Group | $100.00 | $159.77 | $171.29 | $146.88 | $148.44 | $198.83 | |||||||
22
ITEM 6. SELECTED FINANCIAL DATA
The following selected financial data has been derived from our audited consolidated financial statements. The Income Statement Data relating to 2017, 2016 and 2015, and the Balance Sheet data as of December 31, 2017 and 2016 should be read in conjunction with the information provided in Item 7, “Management's Discussion and Analysis of Financial Condition and Results of Operations” and the notes to our consolidated financial statements appearing elsewhere in this Annual Report on Form 10-K.
INCOME STATEMENT DATA Year Ended December 31, (in thousands, except per share data) | |||||||||||||||
2017 | 2016 | 2015 | 2014 | 2013 | |||||||||||
Net sales | $ | 1,546,098 | $ | 1,399,551 | $ | 1,405,239 | $ | 1,334,951 | $ | 1,314,223 | |||||
Cost of sales | 968,357 | 877,568 | 904,747 | 865,951 | 831,847 | ||||||||||
Gross profit | 577,741 | 521,983 | 500,492 | 469,000 | 482,376 | ||||||||||
Commissions and licensing fee income - net | 14,259 | 11,788 | 16,565 | 13,723 | 15,632 | ||||||||||
Operating expenses | (421,216 | ) | (364,595 | ) | (342,364 | ) | (315,081 | ) | (295,223 | ) | |||||
Impairment charges | (1,000 | ) | — | (3,045 | ) | — | (983 | ) | |||||||
Income from operations | 169,784 | 169,176 | 171,648 | 167,642 | 203,768 | ||||||||||
Interest income - net | 2,548 | 2,488 | 2,191 | 3,074 | 4,100 | ||||||||||
Other income (expense) - net | (5 | ) | (664 | ) | (1,373 | ) | 677 | 1,083 | |||||||
Income before provision for income taxes | 172,327 | 171,000 | 172,466 | 171,393 | 208,951 | ||||||||||
Provision for income taxes | 53,189 | 49,726 | 58,811 | 58,764 | 75,666 | ||||||||||
Net income | 119,138 | 121,274 | 113,655 | 112,629 | 133,285 | ||||||||||
Net (income) attributable to non-controlling interests | (1,190 | ) | (363 | ) | (717 | ) | (749 | ) | (1,278 | ) | |||||
Net income attributable to Steven Madden, Ltd. | $ | 117,948 | $ | 120,911 | $ | 112,938 | $ | 111,880 | $ | 132,007 | |||||
Basic income per share | $2.14 | $2.12 | $1.91 | $1.82 | $2.04 | ||||||||||
Diluted income per share | $2.04 | $2.03 | $1.85 | $1.76 | $1.98 | ||||||||||
Basic weighted average shares of common stock | 55,157 | 57,109 | 58,997 | 61,451 | 64,583 | ||||||||||
Effect of dilutive securities - options and restricted stock | 2,673 | 2,447 | 2,145 | 2,225 | 2,253 | ||||||||||
Diluted weighted average shares of common stock outstanding | 57,830 | 59,556 | 61,142 | 63,676 | 66,836 | ||||||||||
BALANCE SHEET DATA At December 31, | |||||||||||||||
2017 | 2016 | 2015 | 2014 | 2013 | |||||||||||
Total assets | $ | 1,057,161 | $ | 960,875 | $ | 914,385 | $ | 911,235 | $ | 880,241 | |||||
Working capital | 438,906 | 345,544 | 284,178 | 264,635 | 342,142 | ||||||||||
Noncurrent liabilities | 41,617 | 36,676 | 60,923 | 64,115 | 46,898 | ||||||||||
Stockholders' equity | $ | 808,932 | $ | 741,072 | $ | 678,663 | $ | 669,529 | $ | 678,840 | |||||
23
ITEM 7. MANAGEMENT’S DISCUSSION AND ANALYSIS OF FINANCIAL CONDITION AND RESULTS OF
OPERATIONS
The following discussion of our Financial Condition and Results of Operations should be read in conjunction with our audited consolidated financial statements and notes thereto appearing elsewhere in this Annual Report on Form 10-K.
Overview:
($ in thousands, except retail sales data per square foot, earnings per share and per share data)
Steven Madden, Ltd. and its subsidiaries (collectively, the “Company”, "we", "our", "us", as applicable) design, source, market and sell fashion-forward branded and private label footwear for women, men and children. In addition, we design, source, market and sell name brand and private label fashion handbags and accessories, through our Accessories Division. We market and sell our products through better department stores, major department stores, mid-tier department stores, specialty stores, luxury retailers, value priced retailers, national chains, mass merchants, online retailers, and catalog retailers throughout the United States, Canada, Mexico, certain European nations, including Albania, Austria, Belgium, Bulgaria, Cyprus, Czech Republic, Denmark, Estonia, Finland, France, Germany, Hungary, Ireland, Kosovo, Latvia, Lithuania, Luxembourg, the Netherlands, Norway, Poland, Romania, Russia, Slovakia, Slovenia, Sweden and Switzerland, and Tunisia. In addition, our products are marketed through our retail stores and our e-commerce websites within the United States, Canada, Mexico, our joint ventures in South Africa, China and Taiwan, and under special distribution arrangements in Asia, Europe (excluding the aforementioned nations), India, the Middle East, South and Central America and New Zealand. Our product line includes a broad range of contemporary styles designed to establish or capitalize on market trends, complemented by core product offerings. We have established a reputation for design creativity and our ability to offer quality products in popular styles at accessible price points, delivered in an efficient manner and time frame.
Our business is comprised of five distinct segments (Wholesale Footwear, Wholesale Accessories, Retail, First Cost and Licensing). Our Wholesale Footwear segment includes the following brands: Steve Madden Women's®, Madden Girl®, Steve Madden Men's®, Madden®, Madden NYC, Report®, Dolce Vita®, DV by Dolce Vita®, Mad Love®, Steven by Steve Madden®, Superga® (under license), Betsey Johnson®, Betseyville®, Steve Madden Kids®, FREEBIRD by Steven®, Stevies®, B Brian Atwood®, Blondo®, Kate Spade® (under license), Avec Les Filles® (under license), Alice & Olivia® (through a joint venture), and includes our International business and certain private label footwear business. The agreement with Alice & Olivia® was terminated on December 31, 2017. Our Wholesale Accessories segment includes Big Buddha®, Madden NYC, Betsey Johnson®, Steve Madden®, Steven by Steve Madden®, Madden Girl®, Luv Betsey®, DKNY® (under license), Donna Karan® (under license), and Cejon® accessories brands and includes our International business and certain private label accessories business. Steven Madden Retail, Inc., our wholly-owned retail subsidiary, operates Steve Madden, Steven, Superga and International retail stores, as well as Steve Madden, Superga, Betsey Johnson and Dolce Vita e-commerce websites and comprises our Retail segment. The First Cost segment represents activities of a subsidiary that earns commissions for serving as a buying agent for footwear products under private labels for many of the country's large mass-market merchandisers, shoe chains and other value priced retailers. Our Licensing segment is engaged in the licensing of the Steve Madden®, Steven by Steve Madden® and Madden Girl® trademarks for use in connection with the manufacture, marketing and sale of outerwear, hosiery, jewelry, watches, sunglasses, hair accessories, umbrellas, bedding, luggage and men’s leather accessories. We license the Stevies® trademark for use in connection with the manufacture, marketing and sale of outerwear exclusively to Target. In addition, we license our Betsey Johnson® trademark for use in connection with the manufacture, marketing and sale of women's and children’s apparel, hosiery, swimwear, fragrance and beauty, sleepwear, activewear, jewelry, watches, bedding, luggage, stationary, umbrellas and household goods. We also license our Dolce Vita® trademark for use in connection with the manufacture, marketing and sale of women's and children's apparel.
On January 30, 2017, the Company entered into an equity purchase agreement (the “Purchase Agreement”) with Schwartz & Benjamin, Inc., a New York corporation (“S&A”), its affiliated companies B.D.S., Inc., a Delaware corporation (“B.D.S.”), Quinby Ridge Enterprises LLC, a Delaware limited liability company (“QRE”), and DANIELBARBARA Enterprises LLC, a New York limited liability company (“DBE” and, collectively with S&A, B.D.S. and QRE, “Schwartz & Benjamin”), the owners of all of the issued and outstanding equity interests in Schwartz & Benjamin (the “Sellers”), and Daniel Schwartz, as designated agent for the Sellers, pursuant to which the Company purchased all of the outstanding equity interests in Schwartz & Benjamin from the Sellers. The total purchase price for the acquisition was approximately $37,112, which included a cash payment at closing of $17,396 less a working capital adjustment of $901, plus potential earn-out payments based on the achievement of certain earnings targets for each of the twelve month periods ending on January 31, 2018 through 2023, inclusive. The fair value of the contingent payments was estimated using the present value of the payments based on management's projections of the financial results of Schwartz & Benjamin during the earn-out period and was finalized at $20,617. On November 27, 2017, the Company entered into an amendment to the Purchase Agreement with the sellers of Schwartz & Benjamin to change the manner of calculating the earn-
24
out and to provide for payments based on the performance of certain specified license agreements. In connection with this amendment, the Company reduced the earn-out liability from $20,617 to $10,000 and recorded a credit to operating expenses in the amount of $10,617. At December 31, 2017, the Company estimated the fair value of the contingent consideration to be approximately $10,000. Schwartz & Benjamin, which was founded in 1923, engages in the design, sourcing and sale of licensed and private label footwear and distributes its fashion footwear to wholesale customers, including better department stores and specialty boutiques, as well as the retail stores of its brand partners.
In 2017, the Company formed a joint venture ("SM Taiwan") with Dolce Limited through its subsidiary, SM Dolce Limited. The Company is the majority interest holder in SM Taiwan and controls all of the significant participating rights of the joint venture. SM Taiwan is the exclusive distributor of the Company's products in Taiwan. Additionally in 2017, the Company formed a joint venture ("SM China") with Xuzhou C. Banner Footwear, Ltd. through its subsidiary, SM (Jiangsu) Co., Ltd. The Company controls all of the significant participating rights of the joint venture. SM China is the exclusive distributor of the Company's products in China.
On December 22, 2017, the U.S. government enacted comprehensive tax legislation commonly referred to as the Tax Cuts and Jobs Act (the “Tax Act”). The Tax Act made significant changes to the Internal Revenue Code of 1986, as amended, including, but not limited to, reducing the U.S. corporate statutory tax rate, eliminating or limiting deduction of several expenses which were previously deductible, requiring a minimum tax on earnings generated by foreign subsidiaries, imposing a mandatory deemed repatriation tax on undistributed historic earnings of foreign subsidiaries and permitting a tax-free repatriation of foreign earnings through a dividends received deduction. The Tax Act could have a significant impact on our effective tax rate, net deferred tax assets and cash tax expenses. We are currently evaluating the overall impact of the Tax Act on our effective tax rate and balance sheet, but expect that the impact may be significant for our fiscal year 2018 and future periods. See additional information regarding the impact of the Tax Act below in this Item and in Note M Income Taxes to our consolidated financial statements appearing elsewhere in this Annual Report on Form 10-K.
Additionally, in February 2018, the Board of Directors of the Company declared a quarterly cash dividend of $0.20 per share on the Company’s outstanding shares of common stock as part of its cash deployment strategy to drive shareholder value or enhance shareholder returns. The dividend is payable on March 29, 2018, to stockholders of record as of the close of business on March 12, 2018. The Company currently expects to continue the practice of paying a cash dividend each quarter; however, the payment of future dividends will be subject to the discretion of our Board of Directors and will be contingent upon future earnings, if any, our financial condition, capital requirements, general business conditions and other factors. Therefore, we can give no assurance that cash dividends of any kind will be paid to holders of our common stock in the future.
Key Performance Indicators and Statistics
The following measurements are among the key business indicators reviewed by various members of management to measure consolidated and segment results of the Company:
• | net sales |
• | gross profit margin |
• | operating expenses |
• | income from operations |
• | adjusted EBITDA |
• | adjusted EBIT |
• | same store sales |
• | inventory turnover |
• | accounts receivable average collection days |
• | cash flow and liquidity determined by the Company’s working capital and free cash flow |
• | store metrics, such as sales per square foot, average unit retail, conversion, average units per transaction, and contribution margin. |
While not all of these metrics are disclosed due to the proprietary nature of the information, many of these metrics are disclosed and discussed in this Management’s Discussion and Analysis of Financial Condition and Results of Operations.
Non-GAAP Financial Measures
The Company reports its financial results in accordance with GAAP. The Company also uses adjusted earnings before interest and taxes ("Adjusted EBIT") and adjusted earnings before interest, taxes, depreciation and amortization ("Adjusted
25
EBITDA"), which are derived from our consolidated financial information but are not presented in our consolidated financial statements and are considered non-GAAP financial measures, in internal management reporting and planning processes as well as in evaluating the performance of the Company. Management believes these measures are useful to investors in evaluating the Company’s ongoing operating and financial results. By providing these non-GAAP measures, as a supplement to GAAP information, we believe we are enhancing investors’ understanding of our business and our results of operations. The non-GAAP financial measures are limited in their usefulness and should be considered in addition to, and not in lieu of, U.S. GAAP financial measures. Further, these non-GAAP measures may be unique to the Company, as they may be different from non-GAAP measures used by other companies.
The table below reconciles these metrics to net income as presented in the consolidated statement of income.
Years Ended December 31 ($ in thousands) | ||||||||||||
2017 | 2016 | 2015 | ||||||||||
Net Income | $ | 119,138 | $ | 121,274 | $ | 113,655 | ||||||
Add back: | ||||||||||||
Provision for income taxes | 53,189 | 49,726 | 58,811 | |||||||||
Provision for legal and early lease termination charges (benefit) | 11,836 | — | (3,048 | ) | ||||||||
Schwartz & Benjamin amendment to the equity purchase agreement | (10,215 | ) | — | — | ||||||||
Bad debt expense related to the Payless ShoeSource bankruptcy | 5,470 | — | — | |||||||||
Schwartz & Benjamin acquisition integration charges | 3,639 | — | — | |||||||||
Charges related to preferred interest investment | 2,700 | — | — | |||||||||
Impairment of Wild Pair trademark | 1,000 | — | 3,045 | |||||||||
Schwartz & Benjamin acquisition inventory fair value adjustment | 591 | — | — | |||||||||
Deduct: | ||||||||||||
Other Income (expense) - net * | (5 | ) | (664 | ) | (1,373 | ) | ||||||
Interest, net | 2,548 | 2,488 | 2,191 | |||||||||
Adjusted EBIT | $ | 184,805 | $ | 169,176 | $ | 171,645 | ||||||
Add back: | ||||||||||||
Depreciation and amortization | $ | 20,406 | $ | 19,868 | $ | 19,382 | ||||||
Loss on disposal of fixed assets | 1,455 | 652 | 1,780 | |||||||||
Adjusted EBITDA | $ | 206,666 | $ | 189,696 | $ | 192,807 | ||||||
* Consists of realized (losses) gains on marketable securities and foreign exchange (losses) gains. | ||||||||||||
Executive Summary
Net sales for 2017 increased by 10.5% to $1,546,098 from $1,399,551 in 2016. Net sales growth was driven by our acquisition of Schwartz & Benjamin, which contributed net sales of $80,020, as well as growth in our core business. Net income attributable to Steven Madden, Ltd. decreased 2.5% to $117,948 in 2017 compared to $120,911 in 2016. The Company's effective tax rate for 2017 increased to 30.9% compared to 29.1% recorded in 2016. Diluted earnings per share in 2017 increased to $2.04 per share on 57,830,000 diluted weighted average shares outstanding compared to $2.03 per share on 59,556,000 diluted weighted average shares outstanding in the prior year.
In our Retail segment, same store sales (sales attributable to those stores, including the e-commerce websites, that were in operation throughout 2017 and 2016) decreased 3.2%, and sales per square foot decreased to $656 in 2017 compared to sales per square foot of $707 in 2016. As of December 31, 2017, we had 206 stores in operation, compared to 189 stores as of December 31, 2016 which increase resulted from the opening of 13 full price stores and six outlet store locations partially offset by the closing of two full price stores.
Our total inventory turnover was 8.6 times compared to 8.2 times in the comparable period of last year. Our accounts receivable average collection days were 75 days in 2017 compared to 66 days in 2016 primarily due to changes in payment terms with certain customers. As of December 31, 2017, we had $274,764 in cash, cash equivalents and marketable securities, no short
26
or long-term debt and total stockholders’ equity of $808,932. Working capital increased to $438,906 as of December 31, 2017, compared to $345,544 on December 31, 2016.
The following table sets forth information on operations for the periods indicated:
Years Ended December 31 ($ in thousands) | |||||||||||||||||||||
2017 | 2016 | 2015 | |||||||||||||||||||
CONSOLIDATED: | |||||||||||||||||||||
Net sales | $ | 1,546,098 | 100.0 | % | $ | 1,399,551 | 100.0 | % | $ | 1,405,239 | 100.0 | % | |||||||||
Cost of sales | 968,357 | 62.6 | % | 877,568 | 62.7 | % | 904,747 | 64.4 | % | ||||||||||||
Gross profit | 577,741 | 37.4 | % | 521,983 | 37.3 | % | 500,492 | 35.6 | % | ||||||||||||
Other operating income – net of expenses | 14,259 | 0.9 | % | 11,788 | 0.8 | % | 16,565 | 1.2 | % | ||||||||||||
Operating expenses | 421,216 | 27.2 | % | 364,595 | 26.1 | % | 342,364 | 24.4 | % | ||||||||||||
Impairment charges | (1,000 | ) | (0.1 | )% | — | — | % | (3,045 | ) | (0.2 | )% | ||||||||||
Income from operations | 169,784 | 11.0 | % | 169,176 | 12.1 | % | 171,648 | 12.2 | % | ||||||||||||
Interest and other income – net | 2,543 | 0.2 | % | 1,824 | 0.1 | % | 818 | 0.1 | % | ||||||||||||
Income before income taxes | 172,327 | 11.1 | % | 171,000 | 12.2 | % | 172,466 | 12.3 | % | ||||||||||||
Net income attributable to Steven Madden, Ltd. | 117,948 | 7.6 | % | 120,911 | 8.6 | % | 112,938 | 8.0 | % | ||||||||||||
By Segment: | |||||||||||||||||||||
WHOLESALE FOOTWEAR SEGMENT: | |||||||||||||||||||||
Net sales | $ | 1,017,557 | 100.0 | % | $ | 881,864 | 100.0 | % | $ | 898,363 | 100.0 | % | |||||||||
Cost of sales | 685,190 | 67.3 | % | 602,029 | 68.3 | % | 632,541 | 70.4 | % | ||||||||||||
Gross profit | 332,367 | 32.7 | % | 279,835 | 31.7 | % | 265,822 | 29.6 | % | ||||||||||||
Operating expenses | 197,722 | 19.4 | % | 169,796 | 19.3 | % | 157,941 | 17.6 | % | ||||||||||||
Income from operations - before impairment charges | 134,645 | 13.2 | % | 110,039 | 12.5 | % | 107,881 | 12.0 | % | ||||||||||||
WHOLESALE ACCESSORIES SEGMENT: | |||||||||||||||||||||
Net sales | $ | 256,295 | 100.0 | % | $ | 254,931 | 100.0 | % | $ | 266,564 | 100.0 | % | |||||||||
Cost of sales | 175,566 | 68.5 | % | 170,509 | 66.9 | % | 178,203 | 66.9 | % | ||||||||||||
Gross profit | 80,729 | 31.5 | % | 84,422 | 33.1 | % | 88,361 | 33.1 | % | ||||||||||||
Operating expenses | 57,092 | 22.3 | % | 52,860 | 20.7 | % | 55,749 | 20.9 | % | ||||||||||||
Income from operations - before impairment charges | 23,637 | 9.2 | % | 31,562 | 12.4 | % | 32,612 | 12.2 | % | ||||||||||||
RETAIL SEGMENT: | |||||||||||||||||||||
Net sales | $ | 272,246 | 100.0 | % | $ | 262,756 | 100.0 | % | $ | 240,312 | 100.0 | % | |||||||||
Cost of sales | 107,601 | 39.5 | % | 105,030 | 40.0 | % | 94,003 | 39.1 | % | ||||||||||||
Gross profit | 164,645 | 60.5 | % | 157,726 | 60.0 | % | 146,309 | 60.9 | % | ||||||||||||
Operating expenses | 165,771 | 60.9 | % | 141,939 | 54.0 | % | 128,674 | 53.5 | % | ||||||||||||
(Loss) income from operations - before impairment charges | (1,126 | ) | (0.4 | )% | 15,787 | 6.0 | % | 17,635 | 7.3 | % | |||||||||||
Number of stores | 206 | 189 | 169 | ||||||||||||||||||
FIRST COST SEGMENT: | |||||||||||||||||||||
Other commission income – net of expenses | $ | 5,159 | 100.0 | % | $ | 3,728 | 100.0 | % | $ | 6,713 | 100.0 | % | |||||||||
LICENSING SEGMENT: | |||||||||||||||||||||
Licensing income – net of expenses | $ | 9,100 | 100.0 | % | $ | 8,060 | 100.0 | % | $ | 9,852 | 100.0 | % | |||||||||
27
RESULTS OF OPERATIONS
($ in thousands)
Year Ended December 31, 2017 vs. Year Ended December 31, 2016
Consolidated:
Net sales for the year ended December 31, 2017 increased by 10.5% to $1,546,098 from $1,399,551 for fiscal year 2016. For the year ended December 31, 2017, gross margin as a percentage of net sales increased slightly to 37.4% in the current year compared to 37.3% in the prior year. Excluding the impact from the Schwartz & Benjamin acquisition, gross margin as a percentage of net sales increased to 38.3% driven by improvement in the Wholesale Footwear and Retail segments. Operating expenses increased in 2017 to $421,216, or 27.2% of total revenue, from $364,595, or 26.1% of total revenue, in 2016. The increase is primarily related to (i) the impact of the Schwartz & Benjamin acquisition, (ii) legal charges consisting of costs and estimated settlement amounts, (iii) bad debt related to the Payless ShoeSource bankruptcy, and (iv) charges to preferred interest investments related to the Brian Atwood acquisition. These increases were partially offset by the benefit received for the reversal of contingent liabilities related to the amended purchase agreement for the Schwartz & Benjamin acquisition. Commission and licensing fee income increased to $14,259 in 2017 compared to $11,788 in 2016. The effective tax rate for the year ended December 31, 2017 increased to 30.9% compared to 29.3% in the same period last year primarily due to the impact of the year-over-year benefit resulting from the exercising and vesting of share based awards coupled with a shift in profitability to jurisdictions with higher tax rates. These were partially offset by the net benefit related to the recently enacted Tax Cuts and Jobs Act in the United States. Net income attributable to Steven Madden, Ltd. for the year ended December 31, 2017 decreased to $117,948 compared to $120,911 for the year ended December 31, 2016.
Wholesale Footwear Segment:
Net sales generated by the Wholesale Footwear segment was $1,017,557, or 65.8%, and $881,864, or 63.0%, of our total net sales for the years ended December 31, 2017 and 2016, respectively. Excluding net sales related to the Schwartz & Benjamin acquisition, net sales increased 6.3%. The increase in net sales is primarily driven by strong growth in our core Steve Madden Women's brand coupled with growth in our Steve Madden Men's, Madden Girl, Steve Madden Kid's and Blondo brands, as well as growth in the SM Europe joint venture.
Gross profit margin increased to 32.7% in 2017 from 31.7% in the prior year period. Excluding the impact from the Schwartz & Benjamin acquisition, gross profit margin was 33.8%. The increase in gross profit margin primarily resulted from reduced mark-downs and closeouts, as well as a sales mix shift between our branded and private label businesses. Operating expenses increased to $197,722, or 19.4%, in 2017 compared to $169,796, or 19.3%, in the same period of 2016 primarily due to (i) the impact of the Schwartz & Benjamin acquisition, (ii) legal charges consisting of costs and estimated settlement amounts, (iii) bad debt related to the Payless ShoeSource bankruptcy, and (iv) charges to preferred interest investments related to the Brian Atwood acquisition. These increases were partially offset with a benefit due to a decrease in contingent liabilities related to the amended purchase agreement for the Schwartz & Benjamin acquisition. Income from operations before impairment charges increased to $134,645 for the year ended December 31, 2017 compared to $110,039 for the year ended December 31, 2016.
Wholesale Accessories Segment:
Net sales generated by the Wholesale Accessories segment accounted for $256,295, or 16.6%, and $254,931, or 18.2%, of total Company net sales for the years ended December 31, 2017 and 2016, respectively.
Gross profit margin in the Wholesale Accessories segment decreased to 31.5% in 2017 from 33.1% in the prior year period primarily due to lower margins in our cold weather business driven by prior season inventory closeouts. In the year ended December 31, 2017, operating expenses increased to $57,092, or 22.3% of revenue, compared to $52,860, or 20.7% of revenue, in the year ended December 31, 2016 due to the impact of the year-over-year benefit received for the reversal of contingent liabilities related to the Cejon acquisition in 2016. Income from operations for the Wholesale Accessories segment decreased to $23,637 in 2017 compared to $31,562 in 2016.
Retail Segment:
Net sales generated by the Retail segment accounted for $272,246, or 17.6%, and $262,756, or 18.8%, of total Company net sales for the years ended December 31, 2017 and 2016, respectively, which represents a $9,490 or 3.6% increase, year-over-year. This growth is due to the net addition of seventeen stores from the prior year partially offset by a decrease in comparable
28
store sales of 3.2%. During 2017, we added thirteen full price stores and six outlets, and closed two full price locations. As a result, we had 206 retail stores as of December 31, 2017, compared to 189 stores as of December 31, 2016. The 206 stores currently in operation include 138 Steve Madden full price stores, 60 Steve Madden outlet stores, three Steven stores, one Superga store and four e-commerce websites. In addition, during 2017, we opened 21 concessions in Asia through our China and Taiwan joint ventures, and ended the year with 38 company-operated concessions in international markets. Comparable store sales (sales of those stores, including the e-commerce websites, that were open for all of 2017 and 2016) for the year ended December 31, 2017 decreased 3.2% when compared to the prior year. The Company excludes new locations from the comparable store base for the first year of operations. Stores that are closed for renovations are removed from the comparable store base. During the year ended December 31, 2017, gross margin increased to 60.5% from 60.0% in 2016 primarily due to lower promotional activity during 2017. In 2017, operating expenses increased to $165,771, or 60.9% of revenue, from $141,939, or 54.0% of revenue, in 2016 primarily due to the incremental costs associated with new store openings, legal charges consisting of costs and estimated settlement amounts related to early lease terminations and increases in employee-related costs. For the year ended December 31, 2017, losses from operations for the Retail segment were $1,126 compared income from operations of $15,787 in the prior year.
First Cost Segment:
Income for the First Cost segment, which includes net commission income and fees, increased to $5,159 for the year ended December 31, 2017, compared to $3,728 in 2016 due to an increase in business with certain private label footwear customers.
Licensing Segment:
During the year ended December 31, 2017, income for the Licensing segment increased to $9,100 as compared to the prior year income of $8,060 primarily due to gains with our Steve Madden licensed products.
Year Ended December 31, 2016 vs. Year Ended December 31, 2015
Consolidated:
Net sales for the year ended December 31, 2016 decreased slightly by 0.4% to $1,399,551 from $1,405,239 for fiscal year 2015. For the year ended December 31, 2016, gross margin as a percentage of net sales increased to 37.3% compared to 35.6% in the prior year primarily resulting from higher initial mark-ups, decreased markdown allowances, and reduced close-outs coupled with sales mix in the Wholesale Footwear segment. Operating expenses increased in 2016 to $364,595 from $342,364 in 2015. Operating expenses for the year ended December 31, 2015 included a benefit of $3,048 related to income arising from the early termination of our lease for our 5th Avenue, New York store, which was closed during the first quarter of 2015. Excluding this benefit, operating expenses in 2015 were $345,412. Excluding the aforementioned benefit, the increase in operating expenses in 2016 is primarily due to the increase in retail store locations, employee-related expenses, charges related to an increase in contingent liabilities related to the Dolce Vita acquisition and costs associated with our SM Europe joint venture. As a result, operating expenses as a percentage of sales increased to 26.1% in the year ended December 31, 2016 compared to 24.6%, excluding the aforementioned benefit, in the previous year. Commission and licensing fee income decreased to $11,788 in 2016 compared to $16,565 in 2015 primarily due to a decline in our First Cost segment. During the year ended December 31, 2016, income from operations decreased to $169,176 and net income attributable to Steven Madden, Ltd. increased to $120,911 compared to income from operations of $171,648 and net income attributable to Steven Madden, Ltd. of $112,938 in 2015. Net income attributable to Steven Madden, Ltd. for the year ended December 30, 2016 included a tax benefit of $5,244 related to the adoption of Accounting Standards Update No. 2016-09, "Improvements to Employee Share-Based Payment Accounting," which changes the accounting for certain aspects of share-based payments to employees. Net income attributable to Steven Madden, Ltd. for the year ended December 30, 2015 included the $3,048 pre-tax benefit related to the closure of our 5th Avenue, New York store location as well as a pre-tax charge of $3,045 related to the partial impairment of our Wild Pair trademark. (See Note A to the Consolidated Financial Statements under “Good will and intangible assets.”)
Wholesale Footwear Segment:
Net sales generated by the Wholesale Footwear segment was $881,864, or 63.0%, and $898,363, or 63.9%, of our total
net sales for the years ended December 31, 2016 and 2015, respectively. The decrease was driven by decreases in sales in our private label business, international distributor business and our Madden Girl brand partially offset by increases in sales of our Dolce Vita, Steve Madden Women's and Blondo brands.
Gross profit margin increased to 31.7% in 2016 from 29.6% in the prior year primarily resulting from higher initial mark-ups, decreased markdown allowances, and reduced close-outs coupled with sales mix. Operating expenses increased to $169,796
29
in 2016 compared to $157,941 in the same period of 2015 primarily due to charges related to an increase in contingent liabilities related to the Dolce Vita acquisition coupled with increases in employee-related expenses, advertising and promotion, and costs associated with our SM Europe joint venture. As a percentage of sales, operating expenses increased to 19.3% in 2016 from 17.6% in 2015 due to the increase in expenses discussed above coupled with deleverage on lower sales. Income from operations, excluding a pre-tax charge of $3,045 related to the partial impairment of our Wild Pair trademark in 2015, increased to $110,039 for the year ended December 31, 2016 compared to $107,881 for the year ended December 31, 2015.
Wholesale Accessories Segment:
Net sales generated by the Wholesale Accessories segment accounted for $254,931, or 18.2%, and $266,564, or 19.0%, of total Company net sales for the years ended December 31, 2016 and 2015, respectively. The decrease year over year is primarily driven by decreases in sales of Big Buddha handbags, cold weather accessories and belts partially offset by increases in sales of private label handbags.
Gross profit margin in the Wholesale Accessories segment remained flat at 33.1% in 2016 and 2015. In the year ended December 31, 2016, operating expenses decreased to $52,860 compared to $55,749 in the year ended December 31, 2015. As a percentage of sales, operating expenses decreased to 20.7% in 2016 from 20.9% in 2015 primarily due to the impact of the year-over-year benefit received for the reversal of contingent liabilities related to acquisitions in the third quarter of 2016 and 2015. Income from operations for the Wholesale Accessories segment decreased to $31,562 in 2016 compared to $32,612 in 2015.
Retail Segment:
Net sales generated by the Retail segment accounted for $262,756, or 18.8%, and $240,312, or 17.1%, of total Company net sales for the years ended December 31, 2016 and 2015, respectively, which represents a $22,444 or 9.3% increase, year over year. This growth is primarily due to the net addition of twenty stores from the prior year coupled with an increase in comparable store sales of 4.0% driven by strong fashion footwear trends and stronger product assortment. During 2016, we added nine full price stores and twelve outlets and closed one full price location. As a result, we had 189 retail stores as of December 31, 2016, compared to 169 stores as of December 31, 2015. The 189 stores in operation as of December 31, 2016 include 129 Steve Madden full price stores, 52 Steve Madden outlet stores, two Steven stores, one Superga store, one multi-branded SHOO store and four e-commerce websites. Comparable store sales (sales of those stores, including the e-commerce websites, that were open for all of 2016 and 2015) for the year ended December 31, 2016 increased 4.0% when compared to the prior year. The Company excludes new locations from the comparable store base for the first year of operations. Stores that are closed for renovations are removed from the comparable store base. During the year ended December 31, 2016, gross margin decreased to 60.0% from 60.9% in 2015 primarily due to the impact of foreign currency fluctuations on our international operations. In 2016, operating expenses increased to $141,939 from $128,674 in 2015 primarily due to the incremental cost associated with new store openings and increases in employee-related and rent expenses in existing locations. Operating expenses in 2015 included a benefit of $3,048 related to income arising from the early termination of our lease for our 5th Avenue, New York store, which was closed during the first quarter of 2015. Excluding this benefit, operating expenses in 2015 were $131,722. Excluding the lease benefit in 2015, operating expenses as a percentage of sales decreased to 54.0% in 2016 from 54.8% in the prior year. For the year ended December 31, 2016, income from operations for the Retail segment decreased to $15,787 compared to $17,635 in the prior year. Excluding the benefit of $3,048 in 2015, income from operations for the Retail segment in 2015 was $14,587.
First Cost Segment:
Income for the First Cost segment, which includes net commission income and fees, decreased to $3,728 for the year ended December 31, 2016, compared to $6,713 in 2015 due to a reduction in business with certain private label footwear customers.
Licensing Segment:
During the year ended December 31, 2016, income for the Licensing segment decreased to $8,060 as compared to the prior year income of $9,852 primarily driven by the discontinuation of the Steve Madden eyewear licenses.
30
LIQUIDITY AND CAPITAL RESOURCES
($ in thousands)
Our primary source of liquidity is cash flows generated from our operations. Our primary use of this liquidity is to fund our ongoing cash requirements, including working capital requirements, share repurchases, acquisitions, system enhancements and retail store expansion and remodeling.
Cash, cash equivalents and short-term investments totaled $245,241 and $165,610 at December 31, 2017 and December 31, 2016, respectively. Of the total cash, cash equivalents and short-term investments at December 31, 2017, $135,884, or approximately 55%, was held in our foreign subsidiaries and of the total cash, cash equivalents and short-term investments at December 31, 2016, $70,450, or approximately 43%, was held in our foreign subsidiaries.
As of December 31, 2017, the Company has recorded $21,944 related to the one-time transition tax and related withholding tax expense on the deemed repatriation of cumulative foreign earnings under the Tax Cuts and Jobs Act, of which $1,566 is expected to be paid within one year. The remaining portion of the tax will be paid over an eight-year period, starting in 2018, and will not accrue interest.
The Company has a collection agency agreement with Rosenthal & Rosenthal, Inc. (“Rosenthal”). The agreement provides us with a credit facility in the amount of $30,000, having a sub-limit of $15,000 on the aggregate face amount of letters of credit, at an interest rate based, at our election, upon either the prime rate or LIBOR. The agreement can be terminated by the Company or Rosenthal at any time with 60 days’ prior written notice. As of December 31, 2017 we had no borrowings against this credit facility.
As of December 31, 2017, we had working capital of $438,906, cash and cash equivalents of $181,214, investments in marketable securities short and long term of $93,550 and we did not have any long-term debt.
We believe that based upon our current financial position and available cash, cash equivalents and marketable securities, we will meet all of our financial commitments and operating needs for at least the next 12 months.
OPERATING ACTIVITIES
($ in thousands)
Cash provided by operations was $157,935 in 2017 compared to cash provided by operations of $153,604 in the prior year. The primary sources of cash were net income of $119,138 and decreases in inventories and accounts receivable of $21,135 and $20,715, respectively. The primary use of cash was an increase in factor accounts receivable of $57,268.
INVESTING ACTIVITIES
($ in thousands)
During the year ended December 31, 2017, we invested $61,209 in marketable securities and received $79,141 from the maturities and sales of securities. We made capital expenditures of $14,775, principally for new stores and improvements to existing stores, systems enhancements and leasehold improvements to office space. Cash of $221 was received in the repayment of the note receivable from the seller of SM Canada. Lastly, we made a payment in the amount of $16,495 for the acquisition of Schwartz & Benjamin.
FINANCING ACTIVITIES
($ in thousands)
During the year ended December 31, 2017, net cash used by financing activities was $90,338, which consisted of share repurchases of $99,412 and payment of contingent liabilities related to acquisitions completed in prior years of $7,359, partially offset by proceeds from the exercise of stock options of $16,433.
CONTRACTUAL OBLIGATIONS
($ in thousands)
Our contractual obligations as of December 31, 2017 were as follows:
31
Payment due by period | ||||||||||||||||||||
Contractual Obligations | Total | 2018 | 2019 - 2020 | 2021 - 2022 | 2023 and after | |||||||||||||||
Operating lease obligations | $ | 249,276 | $ | 44,629 | $ | 78,515 | $ | 59,160 | $ | 66,972 | ||||||||||
Purchase obligations | 156,532 | 156,532 | — | — | — | |||||||||||||||
Contingent payment liability | 10,000 | 7,000 | 3,000 | — | — | |||||||||||||||
Other long-term liabilities (future minimum royalty payments) | 16,138 | 4,078 | 10,060 | 2,000 | — | |||||||||||||||
Total | $ | 431,946 | $ | 212,239 | $ | 91,575 | $ | 61,160 | $ | 66,972 | ||||||||||
At December 31, 2017, we had no open letters of credit for the purchase of inventory.
Virtually all of our products are produced by independent manufacturers at overseas locations, the majority of which are located in China, with a small and growing percentage located in Italy in addition to smaller volumes in Brazil, Mexico, India, Vietnam, The Netherlands, The Dominican Republic and South Korea. We have not entered into any long-term manufacturing or supply contracts with any of these foreign manufacturers. We believe that a sufficient number of alternative sources exist outside of the United States for the manufacture of our products. Purchases are made primarily in United States dollars.
On January 3, 2012, the Company and its Creative and Design Chief, Steven Madden, entered into an amendment, dated as of December 31, 2011, to Mr. Madden’s then existing employment agreement with the Company. The amended agreement, which extends the term of Mr. Madden's employment through December 31, 2023, provides, among other things, for a base salary of approximately $7,026 per annum for the period between January 1, 2016 through the expiration of the term of employment. Also under the employment agreement, Mr. Madden received the right, exercisable on certain specified dates in fiscal year 2012 only, to elect to receive a grant of restricted stock for a number of shares of the Company’s common stock valued at $40,000 in consideration for certain specified reductions in his annual base salary in years subsequent to 2012. Mr. Madden exercised this right and, on July 3, 2012, he was granted 1,893,342 restricted shares of the Company's common stock at the then market price of $21.13, which shares vest in the same manner as the February 8, 2012 restricted stock grant received by Mr. Madden pursuant to the amended agreement. (See Note N to the consolidated financial statements.) Further, in addition to the opportunity for cash bonuses at the sole discretion of the Board of Directors, Mr. Madden’s employment agreement entitles him to an annual life insurance premium payment as well as an annual stock option grant. The employment agreement also provides Mr. Madden the potential for an additional one-time stock option award for 750,000 shares of the Company’s common stock (the “EPS Option”) in the event that the Company achieves earnings per share on a fully-diluted basis equal to $2.00 as to any fiscal year ending December 31, 2015 or thereafter, which performance criteria was achieved for the fiscal year ended December 31, 2016. On March 1, 2017, Mr. Madden was granted the EPS Option at an exercise price of $37.35 per share. The EPS Option vests in equal annual installments over a five-year period commencing on the first anniversary of the grant date.
The Company has employment agreements with certain executive officers, which provide for the payment of compensation aggregating approximately $3,898 in 2018, $1,978 in 2019 and $148 in 2020. In addition, some of these employment agreements provide for discretionary bonuses and some provide for incentive compensation based on various performance criteria as well as other benefits including stock related compensation.
DIVIDENDS
In February 2018, the Board of Directors of the Company declared a quarterly cash dividend of $0.20 per share on the Company’s outstanding shares of common stock. The dividend is payable on March 29, 2018, to stockholders of record as of the close of business on March 12, 2018. The Company currently expects to continue the practice of paying a quarterly cash dividend; however, the payment of future dividends will be subject to the discretion of our Board of Directors and will be contingent upon future earnings, if any, our financial condition, capital requirements, general business conditions, and other factors. Therefore, we can give no assurance that cash dividends of any kind will be paid to holders of our common stock in the future.
INFLATION
We do not believe that inflation and price changes have had a significant effect on the Company's sales or profitability for the fiscal year ended December 31, 2017 and the prior two fiscal years. Historically, we have minimized the impact of product cost increases by increasing prices, changing suppliers and by improving operating efficiencies. However, no assurance can be given that we will be able to offset such inflationary cost increases in the future.
32
OFF BALANCE SHEET ARRANGEMENTS
The Company has no off balance sheet arrangements.
CRITICAL ACCOUNTING POLICIES AND THE USE OF ESTIMATES
Management’s Discussion and Analysis of Financial Condition and Results of Operations is based upon our consolidated financial statements included in this Annual Report on Form 10-K, which have been prepared in accordance with generally accepted accounting principles in the United States ("GAAP"). The preparation of these financial statements requires management to make estimates and judgments that affect the reported amounts of assets, liabilities, sales and expenses, and related disclosure of contingent assets and liabilities. Estimates by their nature are based on judgments and available information. Our estimates are made based upon historical factors, current circumstances and the experience and judgment of management. Assumptions and estimates are evaluated on an ongoing basis and we may employ outside experts to assist in evaluations. Therefore, actual results could materially differ from those estimates under different assumptions and conditions. Management believes the following critical accounting estimates are more significantly affected by judgments and estimates used in the preparation of our consolidated financial statements: allowance for bad debts, returns, and customer chargebacks; inventory valuation; valuation of intangible assets, litigation reserves, and contingent payment liabilities.
Allowances for bad debts, returns and customer chargebacks. We provide reserves against our trade accounts receivables for future customer chargebacks, co-op advertising allowances, discounts, returns and other miscellaneous deductions that relate to the current period. The reserve against our non-factored trade receivables also includes estimated losses that may result from customers’ inability to pay. The amount of the reserve for bad debts, returns, discounts and compliance chargebacks are determined by analyzing aged receivables, current economic conditions, the prevailing retail environment and historical dilution levels for customers. We evaluate anticipated customer markdowns and advertising chargebacks by reviewing several performance indicators for our major customers. These performance indicators (which include inventory levels at the retail floors, sell through rates and gross margin levels) are analyzed by management to estimate the amount of the anticipated customer allowance. Failure to correctly estimate the amount of the reserve could materially impact our results of operations and financial position.
Inventory valuation. Inventories are stated at lower-of-cost or market, on a first-in, first-out basis. We review inventory on a regular basis for excess and slow moving inventory. The review is based on an analysis of inventory on hand, prior sales, and expected net realizable value through future sales. The analysis includes a review of inventory quantities on hand at period-end in relation to year-to-date sales and projections for sales in the foreseeable future as well as subsequent sales. We consider quantities on hand in excess of estimated future sales to be at risk for market impairment. The net realizable value, or market value, is determined based on the estimate of sales prices of such inventory through off-price or discount store channels. The likelihood of any material inventory write-down is dependent primarily on the expectation of future consumer demand for our product. A misinterpretation or misunderstanding of future consumer demand for our product, the economy, or other failure to estimate correctly, in addition to abnormal weather patterns, could result in inventory valuation changes, compared to the valuation determined to be appropriate as of the balance sheet date.
Valuation of intangible assets and goodwill. Accounting Standards Codification (“ASC”) Topic 350, “Intangible – Goodwill and Other”, requires that goodwill and intangible assets with indefinite lives be tested for impairment at least annually. This pronouncement also requires that intangible assets with finite lives be amortized over their respective lives to their estimated residual values, and reviewed for impairment in accordance with ASC Topic 360, “Property, Plant and Equipment” (“ASC Topic 360”).
Indefinite-lived intangible assets and goodwill are assessed for impairment by performing a qualitative assessment which evaluates relevant events or circumstances in order to determine whether it is more likely than not that the fair value of an intangible or a reporting unit is less than its carrying amount. Factors considered include historical financial performance, macroeconomic and industry conditions and legal and regulatory environment. If it is more likely than not that the fair value of the reporting unit is less than its carrying amount, the fair value of the reporting unit is compared with its carrying amount and, if the fair value of the reporting unit is less than its carrying amount, an impairment is recognized equal to the amount by which the reporting unit's carrying value exceeds its fair value, not to exceed the carrying amount. We perform this annual assessment during our third quarter.
In accordance with ASC Topic 360, long-lived assets, such as property, equipment, leasehold improvements and intangible assets subject to amortization, are reviewed for impairment annually or whenever events or changes in circumstances indicate that the carrying amount of an asset may not be recoverable. Recoverability of assets to be held and used is measured by a comparison of the carrying amount of an asset to the estimated undiscounted future cash flows expected to be generated by the asset. If the carrying
33
amount of an asset exceeds its estimated future cash flows, an impairment charge is recognized in the amount by which the carrying amount of the asset exceeds the fair value of the asset.
Litigation reserves. Estimated amounts for litigation claims that are probable and can be reasonably estimated are recorded as liabilities in our consolidated financial statements. The likelihood of a material change in these estimated reserves would be dependent on new claims as they may arise and the favorable or unfavorable events of a particular litigation. As additional information becomes available, management will assess the potential liability related to the pending litigation and revise its estimates. Such revisions in management’s estimates of a contingent liability could materially impact our results of operation and financial position.
Contingent payment liabilities. The Company has completed acquisitions that require us to make contingent payments to the sellers based on the future financial performance of the acquired businesses over a period of from one to six years. The fair value of the contingent payments is estimated using the present value of management's projections of the financial results of the acquired business. Failure to correctly project the financial results of the acquired businesses could materially impact our results of operations and financial position.
ITEM 7A. QUANTITATIVE AND QUALITATIVE DISCLOSURES ABOUT MARKET RISK
($ in thousands)
Our financing arrangements are subject to variable interest rates primarily based on the prime rate and LIBOR. An analysis of our collection agency agreement with Rosenthal can be found in the “Liquidity and Capital Resources” section under Part II, Item 7, and in Note C to the Consolidated Financial Statements included in this Annual Report on Form 10-K under the caption “Factor Receivable.” As of December 31, 2017, we held marketable securities valued at approximately $93,550, which consisted primarily of corporate bonds and certificates of deposit. These securities are subject to interest rate risk and will decrease in value if interest rates increase. We currently have the ability to hold these securities until maturity.
We face market risk to the extent that our U.S. or foreign operations involve the transaction of business in foreign currencies. Also, our inventory purchases are primarily done in foreign jurisdictions and inventory purchases may be impacted by fluctuations in the exchange rates between the U.S. dollar and the local currencies of our contract manufacturers, which could have the effect of increasing the cost of goods sold in the future. We manage these risks primarily by denominating these purchases in U.S. dollars. To mitigate the risk of purchases that are denominated in foreign currencies we may enter into forward foreign exchange contracts for terms of no more than two years. A description of our accounting policies for derivative financial instruments is included in Notes A and K to the Consolidated Financial Statements.
During 2017, the Company entered into forward foreign exchange contracts. We performed a sensitivity analysis based on a model that measures the impact of a hypothetical change in foreign currency exchange rate to determine the effects that market risk exposures may have on the fair values of our forward foreign exchange contracts that were outstanding as of the year-end. As of December 31, 2017, a 10% appreciation or depreciation of the U.S. dollar against the exchange rates for foreign currencies under forward foreign exchange contracts would result in a net increase or decrease, respectively, in the fair value of our derivatives portfolio of approximately $78.
In addition, we are exposed to translation risk in connection with our foreign operations in Canada, Mexico, Europe, South Africa, China and Taiwan because our subsidiaries and joint ventures in these countries utilize the local currency as their functional currency and those financial results must be translated into U.S. dollars. As currency exchange rates fluctuate, foreign currency exchange rate translation adjustments reflected in our financial statements with respect to our foreign operations affects the comparability of financial results between years
ITEM 8. FINANCIAL STATEMENTS AND SUPPLEMENTARY DATA
The information required by this Item is incorporated herein by reference to the consolidated financial statements listed in response to Item 15 of Part IV of this Annual Report on Form 10-K.
ITEM 9. CHANGES IN AND DISAGREEMENTS WITH ACCOUNTANTS ON ACCOUNTING AND
FINANCIAL DISCLOSURE
None.
34
ITEM 9A. CONTROLS AND PROCEDURES
Disclosure Controls and Procedures
As required by Rule 13a-15(b) of the Exchange Act, our management, including our Chief Executive Officer and Chief Financial Officer, has evaluated the effectiveness of our disclosure controls and procedures as of the end of the fiscal year covered by this Annual Report on Form 10-K. Based on that evaluation, the Chief Executive Officer and Chief Financial Officer have concluded that our disclosure controls and procedures (as defined in Rule 13a-15(e) under the Exchange Act) were effective as of the end of the fiscal year covered by this Annual Report on Form 10-K.
Management's Annual Report on Internal Control Over Financial Reporting
Management of Steven Madden, Ltd. is responsible for establishing and maintaining adequate internal control over financial reporting (as defined in Rule 13a-15(f) of the Exchange Act).
Our internal control over financial reporting is a process designed by, or under the supervision of, our principal executive officer and principal financial officer, and effected by the board of directors, management, and other personnel, to provide reasonable assurance regarding the reliability of financial reporting and the preparation of financial statements for external purposes in accordance with U.S. generally accepted accounting principles. Our internal control over financial reporting includes those policies and procedures that (1) pertain to maintenance of records that, in reasonable detail, accurately and fairly reflect the transactions and dispositions of our assets; (2) provide reasonable assurance that transactions are recorded as necessary to permit preparation of financial statements in accordance with U.S. generally accepted accounting principles, and that our receipts and expenditures are being made only in accordance with authorizations of our management and directors; and (3) provide reasonable assurance regarding prevention or timely detection of unauthorized acquisition, use, or disposition of our assets that could have a material effect on the financial statements.
Because of its inherent limitations, internal control over financial reporting may not prevent or detect misstatements. Also, projections of any evaluation of effectiveness to future periods are subject to the risk that controls may become inadequate because of changes in conditions, or that the degree of compliance with the policies or procedures may deteriorate.
With the participation of the Chief Executive Officer and the Chief Financial Officer, our management conducted an evaluation of the effectiveness, as of the end of our fiscal year ended December 31, 2017, of our internal control over financial reporting based on the framework and criteria established in the 2013 Internal Control-Integrated Framework, issued by the Committee of Sponsoring Organizations of the Treadway Commission. Based on this evaluation our management has concluded that, as of December 31, 2017, our internal control over financial reporting was effective.
Our independent registered public accounting firm, EisnerAmper LLP, has audited the Company's consolidated financial statements and the effectiveness of the Company's internal control over financial reporting as of December 31, 2017. Their report appears in this Annual Report on Form 10-K.
Changes in Internal Control Over Financial Reporting
There was no change in our internal control over financial reporting, identified in connection with the evaluation required by paragraph (d) of Rule 13a-15 of the Exchange Act, that occurred during the fiscal quarter ended December 31, 2017, which has materially affected, or is reasonably likely to materially affect, our internal control over financial reporting.
ITEM 9B. OTHER INFORMATION
On February 27, 2018, the Company issued a press release reporting its financial results for the fiscal quarter and fiscal year ended December 31, 2017, a copy of which is attached as Exhibit 99.01 to this Annual Report.
PART III
ITEM 10. DIRECTORS, EXECUTIVE OFFICERS AND CORPORATE GOVERNANCE
The information required to be furnished pursuant to this Item will be set forth in our proxy statement for the 2018 Annual Meeting of Stockholders, and is incorporated herein by reference.
35
ITEM 11. EXECUTIVE COMPENSATION
The information required to be furnished pursuant to this Item will be set forth in our proxy statement for the 2018 Annual Meeting of Stockholders, and is incorporated herein by reference.
ITEM 12. SECURITY OWNERSHIP OF CERTAIN BENEFICIAL OWNERS AND MANAGEMENT AND
RELATED STOCKHOLDER MATTERS
The information required to be furnished pursuant to this Item will be set forth in our proxy statement for the 2018 Annual Meeting of Stockholders, and is incorporated herein by reference.
ITEM 13. CERTAIN RELATIONSHIPS AND RELATED TRANSACTIONS, AND DIRECTOR
INDEPENDENCE
The information required to be furnished pursuant to this Item will be set forth in our proxy statement for the 2018 Annual Meeting of Stockholders, and is incorporated herein by reference.
ITEM 14. PRINCIPAL ACCOUNTING FEES AND SERVICES
The information required to be furnished pursuant to this Item will be set forth in our proxy statement for the 2018 Annual Meeting of Stockholders, and is incorporated herein by reference.
PART IV
ITEM 15 | EXHIBITS AND FINANCIAL STATEMENT SCHEDULES |
(a) Financial Statements and Financial Statements Schedules
See Index to Consolidated Financial Statements included herein.
(b) Exhibits. See the exhibit index included herein.
36
SIGNATURES
Pursuant to the requirements of Section 13 or 15(d) of the Securities Exchange Act of 1934, the Registrant has duly caused this report to be signed on its behalf by the undersigned thereunto duly authorized.
DATE: March 1, 2018
STEVEN MADDEN, LTD. |
/s/ EDWARD R. ROSENFELD |
Edward R. Rosenfeld |
Chairman and Chief Executive Officer |
/s/ ARVIND DHARIA |
Arvind Dharia |
Chief Financial Officer and Chief Accounting Officer |
37
POWER OF ATTORNEY
KNOW ALL PERSONS BY THESE PRESENTS, that each of the undersigned constitutes and appoints Edward R. Rosenfeld and Arvind Dharia, and each of them, as attorneys-in-fact and agents, with full power of substitution and re-substitution, for and in the name, place and stead of the undersigned, in any and all capacities, to sign any and all amendments to this Annual Report on Form 10-K, and to file the same, with all exhibits thereto and all other documents in connection therewith, with the Securities and Exchange Commission, granting unto said attorneys-in-fact and agents full power and authority to do and perform each and every act and thing requisite and necessary to be done in and about the premises, as fully to all intents and purposes as the undersigned might or could do in person, hereby ratifying and confirming all that each of said attorney-in-fact or substitute or substitutes, may lawfully do or cause to be done by virtue hereof.
Pursuant to the requirements of the Securities Exchange Act of 1934, this report has been signed below by the following persons on behalf of the registrant in the capacities and on the dates indicated.
Signature | Title | Date |
/S/ EDWARD R. ROSENFELD | Chairman, Chief Executive Officer and Director | March 1, 2018 |
Edward R. Rosenfeld | ||
/S/ ARVIND DHARIA | Chief Financial Officer and Chief Accounting Officer | March 1, 2018 |
Arvind Dharia | ||
/S/ AMELIA NEWTON VARELA | President and Director | March 1, 2018 |
Amelia Newton Varela | ||
/S/ PETER MIGLIORINI | Director | March 1, 2018 |
Peter Migliorini | ||
/S/ RICHARD P. RANDALL | Director | March 1, 2018 |
Richard P. Randall | ||
/S/ RAVI SACHDEV | Director | March 1, 2018 |
Ravi Sachdev | ||
/S/ THOMAS H. SCHWARTZ | Director | March 1, 2018 |
Thomas H. Schwartz | ||
/S/ ROSE LYNCH | Director | March 1, 2018 |
Rose Lynch | ||
/S/ ROBERT SMITH | Director | March 1, 2018 |
Robert Smith | ||
38
INDEX TO CONSOLIDATED FINANCIAL STATEMENTS
Report of Independent Registered Public Accounting Firm | |
Consolidated Balance Sheets as of December 31, 2017 and 2016 | |
Consolidated Statements of Income for the years ended December 31, 2017, 2016 and 2015 | |
Consolidated Statements of Comprehensive Income for the years ended December 31, 2017, 2016 and 2015 | |
Consolidated Statements of Changes in Stockholders' Equity for the years ended December 31, 2017, 2016 and 2015 | |
Consolidated Statements of Cash Flows for the years ended December 31, 2017, 2016 and 2015 | |
REPORT OF INDEPENDENT REGISTERED PUBLIC ACCOUNTING FIRM
To the Board of Directors and Stockholders of
Steven Madden, Ltd. and subsidiaries
Opinion on the Financial Statements and Internal Control over Financial Reporting
We have audited the accompanying consolidated balance sheets of Steven Madden, Ltd. and subsidiaries (the “Company") as of December 31, 2017 and 2016, and the related consolidated statements of income, comprehensive income, stockholders’ equity, and cash flows for each of the years in the three-year period ended December 31, 2017, and the related notes (collectively referred to as the “financial statements”). We also have audited the Company's internal control over financial reporting as of December 31, 2017, based on criteria established in Internal Control - Integrated Framework (2013) issued by the Committee of Sponsoring Organizations of the Treadway Commission (“COSO”).
In our opinion, the financial statements referred to above present fairly, in all material respects, the consolidated financial position of the Company as of December 31, 2017 and 2016, and the consolidated results of their operations and their cash flows for each of the years in the three-year period ended December 31, 2017, in conformity with accounting principles generally accepted in the United States of America. Also, in our opinion, the Company maintained, in all material respects, effective internal control over financial reporting as of December 31, 2017, based on criteria established in the Internal Control - Integrated Framework (2013) issued by COSO.
Basis for Opinion
The Company’s management is responsible for these financial statements, for maintaining effective internal control over financial reporting, and for its assessment of the effectiveness of internal control over financial reporting, included in the accompanying Management’s Annual Report on Internal Control over Financial Reporting. Our responsibility is to express an opinion on the Company’s financial statements and an opinion on the Company’s internal control over financial reporting based on our audits. We are a public accounting firm registered with the Public Company Accounting Oversight Board (United States) ("PCAOB") and are required to be independent with respect to the Company in accordance with the U.S. federal securities laws and the applicable rules and regulations of the Securities and Exchange Commission and the PCAOB.
We conducted our audits in accordance with the standards of the PCAOB. Those standards require that we plan and perform the audit to obtain reasonable assurance about whether the financial statements are free of material misstatement, whether due to error or fraud.
Our audits of the financial statements included performing procedures to assess the risks of material misstatement of the financial statements, whether due to error or fraud, and performing procedures that respond to those risks. Such procedures included examining, on a test basis, evidence regarding the amounts and disclosures in the financial statements. Our audits also included evaluating the accounting principles used and significant estimates made by management, as well as evaluating the overall presentation of the financial statements. Our audit of internal control over financial reporting included obtaining an understanding of internal control over financial reporting, assessing the risk that a material weakness exists, and testing and evaluating the design and operating effectiveness of internal control based on the assessed risk. Our audits also included performing such other procedures as we considered necessary in the circumstances. We believe that our audits provide a reasonable basis for our opinions.
Definition and Limitations of Internal Control over Financial Reporting
An entity’s internal control over financial reporting is a process designed to provide reasonable assurance regarding the reliability of financial reporting and the preparation of financial statements for external purposes in accordance with generally accepted accounting principles. An entity’s internal control over financial reporting includes those policies and procedures that (i) pertain to the maintenance of records that, in reasonable detail, accurately and fairly reflect the transactions and dispositions of the assets of the entity; (ii) provide reasonable assurance that transactions are recorded as necessary to permit preparation of financial statements in accordance with generally accepted accounting principles, and that receipts and expenditures of the entity are being made only in accordance with authorizations of management and directors of the entity; and (iii) provide reasonable assurance regarding prevention or timely detection of unauthorized acquisition, use, or disposition of the entity’s assets that could have a material effect on the financial statements.
F-1
Because of its inherent limitations, internal control over financial reporting may not prevent or detect misstatements. Also, projections of any evaluation of effectiveness to future periods are subject to the risk that controls may become inadequate because of changes in conditions, or that the degree of compliance with the policies or procedures may deteriorate.
/s/ EisnerAmper LLP
We have served as the Company’s auditor since 1995.
EISNERAMPER LLP
New York, New York
March 1, 2018
F-2
STEVEN MADDEN, LTD. AND SUBSIDIARIES
Consolidated Balance Sheets
(in thousands)
December 31, | |||||||||
2017 | 2016 | ||||||||
ASSETS | |||||||||
Current assets: | |||||||||
Cash and cash equivalents | $ | 181,214 | $ | 126,115 | |||||
Accounts receivable, net of allowances of $1,973 and $1,622 | 39,473 | 56,790 | |||||||
Factor accounts receivable, net of allowances of $26,213 and $20,209 | 201,436 | 144,168 | |||||||
Inventories | 110,324 | 119,824 | |||||||
Marketable securities – available for sale | 64,027 | 39,495 | |||||||
Prepaid expenses and other current assets | 19,538 | 26,351 | |||||||
Prepaid taxes | 29,506 | 15,928 | |||||||
Total current assets | 645,518 | 528,671 | |||||||
Note receivable – related party | 2,289 | 2,644 | |||||||
Property and equipment, net | 71,498 | 72,381 | |||||||
Deferred taxes | 6,370 | 1,813 | |||||||
Deposits and other | 2,121 | 4,710 | |||||||
Marketable securities – available for sale | 29,523 | 70,559 | |||||||
Goodwill – net | 148,538 | 135,711 | |||||||
Intangibles – net | 151,304 | 144,386 | |||||||
Total Assets | $ | 1,057,161 | $ | 960,875 | |||||
LIABILITIES | |||||||||
Current liabilities: | |||||||||
Accounts payable | $ | 66,955 | $ | 80,584 | |||||
Accrued expenses | 120,624 | 86,635 | |||||||
Income taxes payable | 1,566 | — | |||||||
Contingent payment liability – current portion | 7,000 | 7,948 | |||||||
Accrued incentive compensation | 10,467 | 7,960 | |||||||
Total current liabilities | 206,612 | 183,127 | |||||||
Contingent payment liability | 3,000 | — | |||||||
Deferred rent | 16,033 | 14,578 | |||||||
Deferred taxes | 3,602 | 19,466 | |||||||
Other liabilities | 18,982 | 2,632 | |||||||
Total Liabilities | 248,229 | 219,803 | |||||||
Commitments, contingencies and other | |||||||||
STOCKHOLDERS’ EQUITY | |||||||||
Preferred stock – $.0001 par value, 5,000 shares authorized; none issued; Series A Junior Participating preferred stock – $.0001 par value, 60 shares authorized; none issued | — | — | |||||||
Common stock – $.0001 par value, 135,000 shares authorized, 87,306 and 86,417 shares issued, 58,698 and 60,410 shares outstanding | 6 | 6 | |||||||
Additional paid-in capital | 390,723 | 353,443 | |||||||
Retained earnings | 1,135,701 | 1,017,753 | |||||||
Accumulated other comprehensive loss | (25,613 | ) | (31,751 | ) | |||||
Treasury stock – 28,608 and 26,007 shares at cost | (697,996 | ) | (598,584 | ) | |||||
Total Steven Madden, Ltd. stockholders’ equity | 802,821 | 740,867 | |||||||
Non-controlling interests | 6,111 | 205 | |||||||
Total stockholders’ equity | 808,932 | 741,072 | |||||||
Total Liabilities and Stockholders’ Equity | $ | 1,057,161 | $ | 960,875 | |||||
See accompanying notes to consolidated financial statements
F-3
STEVEN MADDEN, LTD. AND SUBSIDIARIES
Consolidated Statements of Income
(in thousands, except per share data)
Years Ended December 31, | ||||||||||||
2017 | 2016 | 2015 | ||||||||||
Net sales | $ | 1,546,098 | $ | 1,399,551 | $ | 1,405,239 | ||||||
Cost of sales | 968,357 | 877,568 | 904,747 | |||||||||
Gross profit | 577,741 | 521,983 | 500,492 | |||||||||
Commission and licensing fee income – net | 14,259 | 11,788 | 16,565 | |||||||||
Operating expenses | (421,216 | ) | (364,595 | ) | (342,364 | ) | ||||||
Impairment charges | (1,000 | ) | — | (3,045 | ) | |||||||
Income from operations | 169,784 | 169,176 | 171,648 | |||||||||
Interest income (expense) - net | 2,548 | 2,488 | 2,191 | |||||||||
Other (expense) income - net | (5 | ) | (664 | ) | (1,373 | ) | ||||||
Income before provision for income taxes | 172,327 | 171,000 | 172,466 | |||||||||
Provision for income taxes | 53,189 | 49,726 | 58,811 | |||||||||
Net income | 119,138 | 121,274 | 113,655 | |||||||||
Net income attributable to non-controlling interests | (1,190 | ) | (363 | ) | (717 | ) | ||||||
Net income attributable to Steven Madden, Ltd. | $ | 117,948 | $ | 120,911 | $ | 112,938 | ||||||
Basic net income per share | $ | 2.14 | $ | 2.12 | $ | 1.91 | ||||||
Diluted net income per share | $ | 2.04 | $ | 2.03 | $ | 1.85 | ||||||
Basic weighted average common shares outstanding | 55,157 | 57,109 | 58,997 | |||||||||
Effect of dilutive securities – options/restricted stock | 2,673 | 2,447 | 2,145 | |||||||||
Diluted weighted average common shares outstanding | 57,830 | 59,556 | 61,142 | |||||||||
See accompanying notes to consolidated financial statements
F-4
STEVEN MADDEN, LTD. AND SUBSIDIARIES
Consolidated Statements of Comprehensive Income
(in thousands)
2017 | ||||||||||||
Pre-tax amounts | Tax benefit/(expense) | After-tax amounts | ||||||||||
Net income | $ | 119,138 | ||||||||||
Other comprehensive income (loss): | ||||||||||||
Foreign currency translation adjustment | $ | 6,836 | — | 6,836 | ||||||||
(Loss) on cash flow hedging derivatives | (1,282 | ) | 468 | (814 | ) | |||||||
Unrealized gain on marketable securities | 183 | (67 | ) | 116 | ||||||||
Total other comprehensive income | $ | 5,737 | $ | 401 | 6,138 | |||||||
Comprehensive income | 125,276 | |||||||||||
Comprehensive income attributable to non-controlling interests | (1,190 | ) | ||||||||||
Comprehensive income attributable to Steven Madden, Ltd. | $ | 124,086 | ||||||||||
2016 | ||||||||||||
Pre-tax amounts | Tax benefit/(expense) | After-tax amounts | ||||||||||
Net income | $ | 121,274 | ||||||||||
Other comprehensive income (loss): | ||||||||||||
Foreign currency translation adjustment | $ | (2,147 | ) | $ | — | (2,147 | ) | |||||
Gain on cash flow hedging derivatives | 797 | (291 | ) | 506 | ||||||||
Unrealized gain on marketable securities | 2,052 | (749 | ) | 1,303 | ||||||||
Total other comprehensive (loss) | $ | 702 | $ | (1,040 | ) | (338 | ) | |||||
Comprehensive income | 120,936 | |||||||||||
Comprehensive income attributable to non-controlling interests | (363 | ) | ||||||||||
Comprehensive income attributable to Steven Madden, Ltd. | $ | 120,573 | ||||||||||
2015 | ||||||||||||
Pre-tax amounts | Tax benefit/(expense) | After-tax amounts | ||||||||||
Net income | $ | 113,655 | ||||||||||
Other comprehensive income (loss): | ||||||||||||
Foreign currency translation adjustment | $ | (18,734 | ) | $ | — | (18,734 | ) | |||||
Gain on cash flow hedging derivatives | 1,962 | (716 | ) | 1,246 | ||||||||
Unrealized (loss) on marketable securities | (1,847 | ) | 674 | (1,173 | ) | |||||||
Total other comprehensive (loss) | $ | (18,619 | ) | $ | (42 | ) | (18,661 | ) | ||||
Comprehensive income | 94,994 | |||||||||||
Comprehensive income attributable to non-controlling interests | (717 | ) | ||||||||||
Comprehensive income attributable to Steven Madden, Ltd. | $ | 94,277 | ||||||||||
See accompanying notes to consolidated financial statements
F-5
STEVEN MADDEN, LTD. AND SUBSIDIARIES
Consolidated Statements of Changes in Stockholders' Equity
(in thousands)
Common Stock | Additional Paid‑in Capital | Retained Earnings | |||||||||||||
Shares | Amount | ||||||||||||||
Balance - December 31, 2014 | 63,625 | $ | 6 | $ | 275,039 | $ | 783,904 | ||||||||
Share repurchases | (3,704 | ) | — | — | — | ||||||||||
Exercise of stock options | 1,460 | — | 21,301 | — | |||||||||||
Tax benefit from stock-based compensation | — | — | 10,510 | — | |||||||||||
Issuance of restricted stock | 312 | — | — | — | |||||||||||
Stock-based compensation | — | — | 18,698 | — | |||||||||||
Foreign currency translation adjustment | — | — | — | — | |||||||||||
Unrealized holding (loss) on securities (net of tax benefit of $674) | — | — | — | — | |||||||||||
Cash flow hedge (net of tax expense of $716) | — | — | — | — | |||||||||||
Distributions to non-controlling interests, net | — | — | — | — | |||||||||||
Non-controlling investment in JV | — | — | — | — | |||||||||||
Net income | — | — | — | 112,938 | |||||||||||
Balance - December 31, 2015 | 61,693 | 6 | 325,548 | 896,842 | |||||||||||
Share repurchases | (2,437 | ) | — | — | — | ||||||||||
Exercise of stock options | 746 | — | 10,713 | — | |||||||||||
Issuance of restricted stock | 408 | — | — | — | |||||||||||
Stock-based compensation | — | — | 19,509 | — | |||||||||||
Foreign currency translation adjustment | — | — | — | — | |||||||||||
Unrealized holding gain on securities (net of tax expense of $749) | — | — | — | — | |||||||||||
Cash flow hedge (net of tax expense of $291) | — | — | — | — | |||||||||||
Distributions to non-controlling interests, net | — | — | — | — | |||||||||||
Acquisition of Minority Interest (net of tax benefit of $1,432) | — | — | (2,327 | ) | — | ||||||||||
Net income | — | — | — | 120,911 | |||||||||||
Balance - December 31, 2016 | 60,410 | 6 | 353,443 | 1,017,753 | |||||||||||
Share repurchases | (2,601 | ) | — | — | — | ||||||||||
Exercise of stock options | 655 | — | 16,433 | — | |||||||||||
Issuance of restricted stock | 234 | — | — | — | |||||||||||
Stock-based compensation | — | — | 20,847 | — | |||||||||||
Foreign currency translation adjustment | — | — | — | — | |||||||||||
Unrealized holding gain on securities (net of tax expense of $67) | — | — | — | — | |||||||||||
Cash flow hedge (net of tax benefit of $468) | — | — | — | — | |||||||||||
Non-controlling investment in JV | — | — | — | — | |||||||||||
Net income | — | — | — | 117,948 | |||||||||||
Balance - December 31, 2017 | 58,698 | $ | 6 | $ | 390,723 | $ | 1,135,701 | ||||||||
F-6
STEVEN MADDEN, LTD. AND SUBSIDIARIES
Consolidated Statements of Changes in Stockholders' Equity (Continued)
(in thousands)
Accumulated Other Comprehensive Gain (Loss) | Treasury Stock | Non-controlling interest | Total Stockholders' Equity | ||||||||||||||||
Shares | Amount | ||||||||||||||||||
Balance - December 31, 2014 | $ | (12,752 | ) | 19,866 | $ | (376,942 | ) | $ | 274 | $ | 669,529 | ||||||||
Share repurchases | — | 3,704 | (135,637 | ) | — | (135,637 | ) | ||||||||||||
Exercise of stock options | — | — | — | — | 21,301 | ||||||||||||||
Tax benefit from stock-based compensation | — | — | — | — | 10,510 | ||||||||||||||
Issuance of restricted stock | — | — | — | — | — | ||||||||||||||
Stock-based compensation | — | — | — | — | 18,698 | ||||||||||||||
Foreign currency translation adjustment | (18,734 | ) | — | — | — | (18,734 | ) | ||||||||||||
Unrealized holding (loss) on securities (net of tax benefit of $674) | (1,173 | ) | — | — | — | (1,173 | ) | ||||||||||||
Cash flow hedge (net of tax expense of $716) | 1,246 | — | — | — | 1,246 | ||||||||||||||
Distributions to non-controlling interests, net | — | — | — | (732 | ) | (732 | ) | ||||||||||||
Non-controlling investment in JV | — | — | — | — | — | ||||||||||||||
Net income | — | — | — | 717 | 113,655 | ||||||||||||||
Balance - December 31, 2015 | (31,413 | ) | 23,570 | (512,579 | ) | 259 | 678,663 | ||||||||||||
Share repurchases | — | 2,437 | (86,005 | ) | — | (86,005 | ) | ||||||||||||
Exercise of stock options | — | — | — | — | 10,713 | ||||||||||||||
Issuance of restricted stock | — | — | — | — | — | ||||||||||||||
Stock-based compensation | — | — | — | 19,509 | |||||||||||||||
Foreign currency translation adjustment | (2,147 | ) | — | — | — | (2,147 | ) | ||||||||||||
Unrealized holding gain on securities (net of tax expense of $749) | 1,303 | — | — | — | 1,303 | ||||||||||||||
Cash flow hedge (net of tax expense of $291) | 506 | — | — | — | 506 | ||||||||||||||
Distributions to non-controlling interests, net | — | — | — | (417 | ) | (417 | ) | ||||||||||||
Acquisition of Minority Interest (net of tax benefit of $1,432) | — | — | — | — | (2,327 | ) | |||||||||||||
Net income | — | — | — | 363 | 121,274 | ||||||||||||||
Balance - December 31, 2016 | (31,751 | ) | 26,007 | (598,584 | ) | 205 | 741,072 | ||||||||||||
Share repurchases | — | 2,601 | (99,412 | ) | — | (99,412 | ) | ||||||||||||
Exercise of stock options | — | — | — | — | 16,433 | ||||||||||||||
Issuance of restricted stock | — | — | — | — | — | ||||||||||||||
Stock-based compensation | — | — | — | 20,847 | |||||||||||||||
Foreign currency translation adjustment | 6,836 | — | — | — | 6,836 | ||||||||||||||
Unrealized holding gain on securities (net of tax expense of $67) | 116 | — | — | — | 116 | ||||||||||||||
Cash flow hedge (net of tax benefit of $468) | (814 | ) | — | — | — | (814 | ) | ||||||||||||
Non-controlling investment in JV | — | — | — | 4,716 | 4,716 | ||||||||||||||
Net income | — | — | — | 1,190 | 119,138 | ||||||||||||||
Balance - December 31, 2017 | $ | (25,613 | ) | 28,608 | $ | (697,996 | ) | $ | 6,111 | $ | 808,932 | ||||||||
See accompanying notes to consolidated financial statements
F-7
STEVEN MADDEN, LTD. AND SUBSIDIARIES
Consolidated Statements of Cash Flows
(in thousands)
Years Ended December 31, | ||||||||||||
2017 | 2016 | 2015 | ||||||||||
Cash flows from operating activities: | ||||||||||||
Net income | $ | 119,138 | $ | 121,274 | $ | 113,655 | ||||||
Adjustments to reconcile net income to net cash provided by operating activities: | ||||||||||||
Stock-based compensation | 20,847 | 19,509 | 18,698 | |||||||||
Tax benefit from stock-based compensation | — | — | (10,510 | ) | ||||||||
Depreciation and amortization | 21,389 | 21,102 | 20,757 | |||||||||
Loss on disposal of fixed assets | 1,455 | 652 | 1,780 | |||||||||
Impairment charges | 1,000 | — | 3,045 | |||||||||
Deferred taxes | (19,274 | ) | (6,588 | ) | 7,271 | |||||||
Accrued interest on note receivable – related party | (54 | ) | (63 | ) | (71 | ) | ||||||
Deferred rent expense and other liabilities | 1,455 | 2,565 | 440 | |||||||||
Realized loss (gain) on sale of marketable securities | (5 | ) | 661 | (67 | ) | |||||||
Change in fair value of contingent liability | (11,206 | ) | (425 | ) | (5,576 | ) | ||||||
Bad debt expense from bankruptcy | 5,470 | — | — | |||||||||
Changes, net of acquisitions, in: | ||||||||||||
Accounts receivable | 22,683 | (13,617 | ) | (11,071 | ) | |||||||
Factor accounts receivable | (57,268 | ) | 11,043 | 7,281 | ||||||||
Notes receivable - related party | 409 | 409 | 409 | |||||||||
Inventories | 21,135 | (17,744 | ) | (9,403 | ) | |||||||
Prepaid expenses, prepaid taxes, deposits and other | 2,403 | (3,461 | ) | 4,784 | ||||||||
Accounts payable and accrued expenses | 9,501 | 15,324 | (8,643 | ) | ||||||||
Accrued incentive compensation | 2,507 | 1,819 | 468 | |||||||||
Other liabilities | 16,350 | 1,144 | 2,716 | |||||||||
Net cash provided by operating activities | 157,935 | 153,604 | 135,963 | |||||||||
Cash flows from investing activities: | ||||||||||||
Capital expenditures | (14,775 | ) | (15,897 | ) | (19,459 | ) | ||||||
Purchases of marketable securities | (61,209 | ) | (40,451 | ) | (48,891 | ) | ||||||
Repayment of notes receivable | 221 | 249 | 466 | |||||||||
Maturity/sale of marketable securities | 79,141 | 52,215 | 43,353 | |||||||||
Acquisitions, net of cash acquired | (16,795 | ) | — | (9,129 | ) | |||||||
Net cash used in investing activities | (13,417 | ) | (3,884 | ) | (33,660 | ) | ||||||
Cash flows from financing activities: | ||||||||||||
Proceeds from exercise of stock options | 16,433 | 10,713 | 21,301 | |||||||||
Purchase of noncontrolling interest | — | (3,759 | ) | — | ||||||||
Tax benefit from the exercise of options | — | — | 10,510 | |||||||||
Payment of contingent liability | (7,359 | ) | (16,402 | ) | (6,270 | ) | ||||||
Common stock purchased for treasury | (99,412 | ) | (86,005 | ) | (135,637 | ) | ||||||
Net cash used by financing activities | (90,338 | ) | (95,453 | ) | (110,096 | ) | ||||||
Effect of exchange rate changes on cash and cash equivalents | 919 | (566 | ) | (1,243 | ) | |||||||
Net increase (decrease) in cash and cash equivalents | 55,099 | 53,701 | (9,036 | ) | ||||||||
Cash and cash equivalents – beginning of year | 126,115 | 72,414 | 81,450 | |||||||||
Cash and cash equivalents – end of year | $ | 181,214 | $ | 126,115 | $ | 72,414 | ||||||
Supplemental disclosures of cash flow information: | ||||||||||||
Cash paid during the year for: | ||||||||||||
Interest | $ | 24 | $ | 222 | $ | 328 | ||||||
Income taxes | $ | 61,979 | $ | 55,384 | $ | 39,424 | ||||||
See accompanying notes to consolidated financial statements.
F-8
STEVEN MADDEN, LTD. AND SUBSIDIARIES
Notes to Consolidated Financial Statements
December 31, 2017, 2016 and 2015
($ in thousands, except share and per share data)
Note A – Summary of Significant Accounting Policies
[1] Organization:
Steven Madden, Ltd. a Delaware corporation, and its subsidiaries, design, source, market and sell name brand and private label women's, men's and children's shoes, worldwide through its wholesale and retail channels under the Steve Madden Women's, Steve Madden Men's, Madden, Madden Girl, Steven, FREEBIRD by Steven, Superga (under license), Dolce Vita and Betsey Johnson brand names and through its wholesale channels under the Stevies, Report, B Brian Atwood, Mad Love and Blondo brand names and, under license, the Kate Spade and Avec Les Filles brand names. The Company had a design and production agreement with Rebecca Minkoff and a joint venture with Alice & Olivia, both of which were terminated as of December 31, 2017.
In addition, the Company designs, sources, markets and sells name brand and private label handbags and accessories to customers worldwide through its Wholesale Accessories segment, including the Big Buddha, Betsey Johnson, Madden Girl, Betseyville, Cejon, Steve Madden, Steven by Steve Madden, Luv Betsey, B Brian Atwood, DKNY (under license) and Donna Karan (under license) accessories brands. Revenue is generated predominantly through the sale of the Company's brand name and private label merchandise and certain licensed products. At December 31, 2017 and 2016, the Company operated 206 (including four e-commerce websites) and 189 (including four e-commerce websites) retail stores, respectively. Revenue is subject to seasonal fluctuations. See Note O for operating segment information.
[2] Principles of consolidation:
The consolidated financial statements include the accounts of Steven Madden, Ltd. and its wholly-owned subsidiaries Steven Madden Retail, Inc., Diva Acquisition Corp., Diva International, Inc., Madden Direct, Inc., Adesso Madden, Inc., Stevies, Inc., Daniel M. Friedman and Associates, Inc., Big Buddha, Inc., the Topline Corporation, Cejon, Inc., SML Holdings S.a.r.l., SML Canada Acquisition Corp., Madden International Ltd., DMF International Ltd., Asean Corporation Ltd., Dolce Vita Holdings, Inc., Trendy Imports S.A de C.V., Comercial Diecesiette S.A. de C.V., Maximus Designer Shoes S.A. de C.V., BA Brand Holdings LLC, BAI Holding, LLC, Mad Love LLC (formerly a joint venture in which the Company acquired the remaining minority interest in 2016) and Schwartz & Benjamin, Inc. (collectively the "Company"). The accounts of (i) Dexascope Proprietary Ltd., a joint venture in South Africa in which the Company is the majority owner, (ii) BA Brand Holdings LLC, a joint venture in which the Company is the majority owner, (iii) SPM Shoetrade Holding B.V., a joint venture in certain regions of Europe in which the Company is the majority owner, (iv) SM (Jiangsu) Co., Ltd., a joint venture in which the Company controls all of the significant participating rights and (v) SM Dolce Limited, a joint venture in which the Company is the majority interest holder, are included in the consolidated financial statements with the other members' interests reflected in “Net (income) loss attributable to non-controlling interests” in the Consolidated Statements of Income and “Non-controlling interests” in the Consolidated Balance Sheets. All significant intercompany balances and transactions have been eliminated. Certain reclassifications were made to prior years' amounts to conform to the 2017 presentation.
[3] Use of Estimates:
The preparation of financial statements in conformity with U.S. Generally Accepted Accounting Principles ("GAAP") requires management to make estimates and assumptions that affect the reported amounts of assets and liabilities and disclosure of contingent assets and liabilities at the date of the financial statements and the reported amounts of revenue and expenses during the reporting period. Actual results could differ from those estimates.
Significant areas involving management estimates include allowances for bad debts, returns and customer chargebacks, inventory valuation, valuation of intangible assets, litigation reserves and contingent payment liabilities. The Company provides reserves on trade accounts receivables and factor receivables for future customer chargebacks and markdown allowances, discounts, returns and other miscellaneous compliance-related deductions that relate to the current period sales. The Company evaluates anticipated chargebacks by reviewing several performance indicators of its major customers.
F-9
STEVEN MADDEN, LTD. AND SUBSIDIARIES
Notes to Consolidated Financial Statements
December 31, 2017, 2016 and 2015
($ in thousands, except share and per share data)
Note A – Summary of Significant Accounting Policies (continued)
These performance indicators, which include retailers’ inventory levels, sell-through rates and gross margin levels, are analyzed by management to estimate the amount of the anticipated customer allowance.
[4] Cash equivalents:
Cash equivalents at December 31, 2017 and 2016 amounted to approximately $58,436 and $3,309, respectively, and consisted of money market accounts. The Company considers all highly liquid instruments with an original maturity of three months or less when purchased to be cash equivalents.
[5] Marketable securities:
Marketable securities consist primarily of certificates of deposit and corporate bonds with maturities greater than three months and up to four years at the time of purchase. These securities, which are classified as available-for-sale, are carried at fair value, with unrealized gains and losses, net of any tax effect, reported in stockholders' equity as accumulated other comprehensive income (loss). These securities are classified as current and non-current marketable securities based upon their maturities. Amortization of premiums and discounts is included in interest income. For the years ended December 31, 2017 and 2016, the amortization of bond premiums totaled $983 and $1,234, respectively. The values of these securities may fluctuate as a result of changes in market interest rates and credit risk. The schedule of maturities at December 31, 2017 and 2016 are as follows:
Maturities as of December 31, 2017 | Maturities as of December 31, 2016 | ||||||||||||||
1 Year or Less | 1 to 4 Years | 1 Year or Less | 1 to 4 Years | ||||||||||||
Corporate bonds | $ | 11,979 | $ | 29,523 | $ | 11,527 | $ | 70,559 | |||||||
Certificates of deposit | 52,048 | — | 27,968 | — | |||||||||||
Total | $ | 64,027 | $ | 29,523 | $ | 39,495 | $ | 70,559 | |||||||
For the year ended December 31, 2017, gains of $5 were reclassified from Accumulated Other Comprehensive Income and recognized in the Consolidated Statements of Income in Other Income as compared to losses of $661 for the year ended December 31, 2016. At December 31, 2017, current marketable securities included unrealized losses of $106 and unrealized gains of $1 while long-term marketable securities included unrealized gains of $3 and unrealized losses of $90. At December 31, 2016, current marketable securities included unrealized losses of $279 and long-term marketable securities included unrealized gains of $89 and unrealized losses of $118.
[6] Inventories:
Inventories, which consist of finished goods on hand and in transit, are stated at the lower of cost (first-in, first-out method) or market.
[7] Property and equipment:
Property and equipment are stated at cost less accumulated depreciation and amortization. Depreciation is computed utilizing the straight-line method based on estimated useful lives ranging from three to ten years. Leasehold improvements are amortized utilizing the straight-line method over the shorter of their estimated useful lives or the remaining lease term. Impairment losses are recognized for long-lived assets, including definite-lived intangibles, used in operations when indicators of impairment are present and the undiscounted cash flows estimated to be generated by those assets are not sufficient to recover the assets' carrying amount. Impairment losses are measured by comparing the fair value of the assets to their carrying amount.
F-10
STEVEN MADDEN, LTD. AND SUBSIDIARIES
Notes to Consolidated Financial Statements
December 31, 2017, 2016 and 2015
($ in thousands, except share and per share data)
Note A – Summary of Significant Accounting Policies (continued)
[8] Goodwill and intangible assets:
The Company's goodwill and indefinite lived intangible assets are not amortized, rather they are tested for impairment on an annual basis, or more often if events or circumstances change that could cause these assets to become impaired.
In January 2017, the Financial Accounting Standards Board (the "FASB") issued Accounting Standards Update ("ASU") No. 2017-04, “Intangibles - Goodwill and Other” (Topic 350) “Simplifying the Test for Goodwill Impairment”. Under the amendments in this update, indefinite-lived intangible assets and goodwill are assessed for impairment by performing a qualitative assessment which evaluates relevant events or circumstances in order to determine whether it is more likely than not that the fair value of an intangible asset or reporting unit is less than its carrying amount. The factors that are considered include historical financial performance, macroeconomic and industry conditions and legal and regulatory environment. If it is more likely than not that the fair value of the intangible asset or reporting unit is less than its carrying amount, the fair value of the intangible asset or reporting unit is compared with its carrying amount and, if the fair value of the intangible asset or reporting unit is less than its carrying amount, an impairment is recognized equal to the amount by which the carrying value of the intangible asset or reporting unit exceeds its fair value, not to exceed the carrying amount. The guidance is effective in fiscal years beginning after December 15, 2020. The Company adopted the new guidance in the second quarter of 2017. During the fourth quarter of 2017, the Company recognized an impairment charge of $1,000 related to the Wild Pair trademark. The impairment was triggered by a loss of future anticipated cash flows. The Company completed its annual impairment tests on goodwill and its remaining indefinite-lived intangible assets during the third quarter of 2017, and no other impairments were recognized.
The Company amortizes its intangible assets with definite useful lives over their estimated useful lives and reviews these assets for impairment when there is a triggering event. The Company is currently amortizing its acquired intangible assets with definite useful lives over periods typically from two to ten years using the straight-line method.
[9] Net Income Per Share of Common Stock:
Basic net income per share is based on the weighted average number of shares of common stock outstanding during the period, which does not include unvested restricted common stock subject to forfeiture. Diluted net income per share reflects: a) the potential dilution assuming shares of common stock were issued upon the exercise of outstanding in-the-money options and the proceeds thereof were used to purchase shares of the Company’s common stock at the average market price during the period, and b) the vesting of granted nonvested restricted stock awards for which the assumed proceeds upon vesting are deemed to be the amount of compensation cost not yet recognized attributable to future services using the treasury stock method, to the extent dilutive. For the years ended December 31, 2017, 2016 and 2015, options to purchase approximately 9,000, 374,000 and 26,000 shares of common stock, respectively, have been excluded in the calculation of diluted income per share as the result would have been anti-dilutive. For the years ended December 31, 2017, 2016 and 2015, all unvested restricted stock awards were dilutive.
[10] Comprehensive Income:
Comprehensive income is the total of net earnings and all other non-owner changes in equity. Comprehensive income for the Company includes net income, foreign currency translation adjustments, cash flow hedging and unrealized gains and losses on marketable securities. The accumulated balances for each component of other comprehensive loss attributable to the Company are as follows:
F-11
STEVEN MADDEN, LTD. AND SUBSIDIARIES
Notes to Consolidated Financial Statements
December 31, 2017, 2016 and 2015
($ in thousands, except share and per share data)
Note A – Summary of Significant Accounting Policies (continued)
2017 | 2016 | |||||||
Currency translation adjustment | $ | (24,798 | ) | $ | (31,634 | ) | ||
Cash flow hedges, net of tax | (623 | ) | 191 | |||||
Unrealized loss on securities, net of tax | (192 | ) | (308 | ) | ||||
Accumulated other comprehensive loss | $ | (25,613 | ) | $ | (31,751 | ) | ||
[11] Advertising costs:
The Company expenses costs of print, radio and billboard advertisements as incurred. Advertising expenses included in operating expenses amounted to approximately $19,629 in 2017, $16,024 in 2016 and $14,892 in 2015.
[12] Revenue Recognition:
The Company recognizes revenue on wholesale sales when (i) products are shipped pursuant to its standard terms, which are freight on board (“FOB”) Company warehouse, or when products are delivered to the consolidators, or any other destination, as per the terms of the customers’ purchase order, (ii) persuasive evidence of an arrangement exists, (iii) the price is fixed and determinable and (iv) collection is reasonably assured. Sales reductions on wholesale sales for anticipated discounts, allowances and other deductions are recognized during the period when sales are recorded. With the exception of our cold weather accessories and Blondo businesses, normally we do not accept returns from our wholesale customers unless there are product quality issues, which we charge back to the vendors at cost. Sales of cold weather accessories
and Blondo products to wholesale customers are recorded net of returns, which are estimated based on historical experience. Such amounts have historically not been material.
Retail sales are recognized when the payment is received from customers and are recorded net of estimated returns. The Company generates commission income acting as a buying agent by arranging to manufacture private label shoes to the specifications of its customers. The Company’s commission revenue also includes fees charged for its design, product and development services provided to certain suppliers in connection with the Company’s private label business. Commission revenue and product and development fees are recognized as earned when title to the product transfers from
the manufacturer to the customer and collections are reasonably assured and are reported on a net basis after deducting related operating expenses.
The Company licenses its Steve Madden®, Steven by Steve Madden® and Madden Girl® trademarks for use in connection with the manufacture, marketing and sale of outerwear, hosiery, jewelry, watches, sunglasses, hair accessories, umbrellas, bedding, luggage, and men’s leather accessories. We license the Stevies® trademark for use in connection with the manufacture, marketing and sale of outerwear exclusively to Target. In addition, the Company licenses the Betsey Johnson® trademark for use in connection with the manufacture, marketing and sale of women's and children’s apparel, hosiery, swimwear, fragrance and beauty, sleepwear, activewear, jewelry, watches, bedding, luggage, stationary, umbrellas and household goods. The Company also licenses the Dolce Vita® trademark for use in connection with the manufacture, marketing and sale of women's and children's apparel. The license agreements require the licensee to pay the Company a royalty and, in substantially all of the agreements, an advertising fee based on the higher of a minimum or a net sales percentage as defined in the various agreements. In addition, under the terms of retail selling agreements, most of the Company’s international distributors are required to pay the Company a royalty based on a percentage of net sales, in addition to a commission and a design fee on the purchases of the Company’s products. In substantially all of the Company’s license agreements, the minimum guaranteed royalty is earned and receivable on a quarterly basis. Licensing revenue is recognized on the basis of net sales reported by the licensees, or the minimum guaranteed royalties, if higher.
F-12
STEVEN MADDEN, LTD. AND SUBSIDIARIES
Notes to Consolidated Financial Statements
December 31, 2017, 2016 and 2015
($ in thousands, except share and per share data)
Note A – Summary of Significant Accounting Policies (continued)
[13] Taxes Collected From Customers:
The Company accounts for certain taxes collected from its customers in accordance with the accounting guidance which permits companies to adopt a policy of presenting taxes in the income statement on either a gross basis (included in revenues and costs) or a net basis (excluded from revenues). Taxes within the scope of this accounting guidance would include taxes that are imposed on a revenue transaction between a seller and a customer, for example, sales taxes, use taxes, value-added taxes and some types of excise taxes. The Company records all taxes on a net basis.
[14] Sales Deductions:
The Company supports retailers’ initiatives to maximize sales of the Company’s products on the retail floor by subsidizing the co-op advertising programs of such retailers, providing them with inventory markdown allowances and participating in various other marketing initiatives of its major customers. In addition, the Company accepts returns for damaged products for which the Company’s costs are normally charged back to the responsible third-party factory. Such expenses are reflected in the consolidated financial statements as deductions to arrive at net sales.
[15] Cost of Sales:
All costs incurred to bring finished products to the Company’s distribution center or to the customers’ freight forwarder and, in the Retail segment, the costs to bring products to the Company’s stores, are included in the cost of sales line on the Consolidated Statements of Income. These include the cost of finished products, purchase commissions, letter of credit fees, brokerage fees, sample expenses, custom duty, inbound freight, royalty payments on licensed products, labels and product packaging. All warehouse and distribution costs related to the Wholesale segments and freight to customers, if any, are included in the operating expenses line item of the Company’s Consolidated Statements of Income. The Company’s gross margins may not be comparable to those of other companies in the industry because some companies may include warehouse and distribution costs, as well as other costs excluded from cost of sales by the Company, as a component of cost of sales, while other companies report on the same basis as the Company and include them in operating expenses.
[16] Warehouse and shipping costs:
The Company includes all warehouse and shipping costs for the Wholesale segment in the Operating Expenses line on the Consolidated Statements of Income. For the years ended December 31, 2017, 2016 and 2015, the total warehouse and distribution costs included in Operating Expenses were $32,395, $27,079 and $24,176 respectively. Since the Company's standard terms of sales are “FOB Steve Madden warehouse,” the Company's wholesale customers absorb most shipping costs. Shipping costs to wholesale customers incurred by the Company are not considered significant and are included in the Operating Expense line in the Consolidated Statements of Income.
[17] Employee benefit plan:
The Company maintains a tax-qualified 401(k) plan which is available to each of the Company's eligible employees who elect to participate after meeting certain length-of-service requirements. The Company made discretionary matching contributions of 50% of employees' contributions up to a maximum of 6% of employees' compensation which vest to the employees over a period of time. Total matching contributions to the plan for 2017, 2016 and 2015 were approximately $1,819, $1,633 and $1,602, respectively.
F-13
STEVEN MADDEN, LTD. AND SUBSIDIARIES
Notes to Consolidated Financial Statements
December 31, 2017, 2016 and 2015
($ in thousands, except share and per share data)
Note A – Summary of Significant Accounting Policies (continued)
[18] Derivative Instruments:
The Company uses derivative instruments to manage its exposure to cash-flow variability from foreign currency risk. Derivatives are carried on the balance sheet at fair value and included in prepaid expenses and other current assets or accrued expenses. The Company applies cash flow hedge accounting for its derivative instruments. Net derivative gains and losses attributable to derivatives subject to cash flow hedge accounting reside in accumulated other comprehensive income (loss) and will be reclassified to earnings in future periods as the economic transactions to which the derivatives relate affect earnings. See Note K - Derivative Instruments.
[19] Income Taxes:
The provision for income taxes is computed using the asset and liability method, under which deferred tax assets and liabilities are recognized for the expected future tax consequences of temporary differences between the financial reporting and tax bases of assets and liabilities, and for operating losses and tax credit carryforwards. Deferred tax assets and liabilities are measured using the currently enacted tax rates that apply to taxable income in effect for the years in which those tax assets are expected to be realized or settled. The Company records a valuation allowance to reduce deferred tax assets to the amount that is believed more likely than not to be realized.
The Company recognizes the tax benefit from an uncertain tax position only if it is more likely than not the tax position will be sustained on examination by the taxing authorities, based on the technical merits of the position. The tax benefits
recognized in the financial statements from such positions are then measured based on the largest benefit that has a greater than 50% likelihood of being realized upon settlement. See Note M - Income Taxes.
[20] Share-based Compensation:
The Company recognizes expense related to share-based payment transactions in which it receives employee services in exchange for equity instruments of the Company. Share-based compensation cost for restricted stock units (“RSUs”) is measured based on the closing fair market value of the Company’s common stock on the date of grant. Share-based compensation cost for stock options is measured at the grant date, based on the fair-value as calculated by the Black-Scholes-Merton (“BSM”) option-pricing model. The BSM option-pricing model incorporates various assumptions including expected volatility, estimated expected life and interest rates. The Company recognizes share-based compensation cost over the award’s requisite service period. The Company recognizes a benefit from share-based compensation in the Consolidated Statements of Income if an incremental tax benefit is realized. See Note H - Stock- Based Compensation.
Note B – Acquisitions
SM Dolce Limited
In September 2017, the Company formed a joint venture ("SM Taiwan") with Dolce Limited through its subsidiary, SM Dolce Limited. The Company is the majority interest holder in SM Taiwan and controls all of the significant participating rights of the joint venture. SM Taiwan is the exclusive distributor of the Company's products in Taiwan. As the Company controls all of the significant participating rights of the joint venture and is the majority interest holder in SM Taiwan, the assets, liabilities and results of operations of SM Taiwan are consolidated and included in the Company’s consolidated financial statements. The other member's interest is reflected in “Net income attributable to noncontrolling interests” in the Consolidated Statements of Income and “Noncontrolling interests” in the Consolidated Balance Sheets.
SM (Jiangsu) Co., Ltd.
In September 2017, the Company formed a joint venture ("SM China") with Xuzhou C. banner Footwear, Ltd. through its subsidiary, SM (Jiangsu) Co., Ltd. The Company controls all of the significant participating rights of the joint venture. SM China is the exclusive distributor of the Company's products in China. As the Company controls all of the significant participating rights of
F-14
STEVEN MADDEN, LTD. AND SUBSIDIARIES
Notes to Consolidated Financial Statements
December 31, 2017, 2016 and 2015
($ in thousands, except share and per share data)
Note B – Acquisitions (continued)
the joint venture in SM China, the assets, liabilities and results of operations of SM China are consolidated and included in the Company’s consolidated financial statements. The other member's interest is reflected in “Net income attributable to noncontrolling interests” in the Consolidated Statements of Income and “Noncontrolling interests” in the Consolidated Balance Sheets.
Schwartz & Benjamin
In January 2017, the Company acquired all of the outstanding capital stock of each of Schwartz & Benjamin, Inc., B.D.S., Inc., Quinby Ridge Enterprises LLC and DANIELBARBARA Enterprises LLC (collectively, "Schwartz & Benjamin"). Founded in 1923, Schwartz & Benjamin specializes in the design, sourcing and sale of licensed and private label footwear and distributes its fashion footwear to wholesale customers, including department stores and specialty boutiques, as well as the retail stores of its brand partners. The total purchase price for the acquisition was approximately $37,112, which included a cash payment at closing of $17,396 less a working capital adjustment of $901, plus potential earn-out payments based on the achievement of certain earnings targets for each of the twelve month periods ending on January 31, 2018 through 2023, inclusive. The fair value of the contingent payments was estimated using the present value of the payments based on management's projections of the financial results of Schwartz & Benjamin during the earn-out period and was finalized at $20,617. On November 27, 2017, the Company entered into
an amendment to the equity purchase agreement with the sellers of Schwartz & Benjamin to change the manner of calculating the earn-out and to provide for payments based on the performance of certain specified license agreements. In connection with this amendment, the Company reduced the earn-out liability from $20,617 to $10,000 and recorded a credit to operating expenses in the amount of $10,617.
The transaction was accounted for using the acquisition method required by GAAP. Accordingly, the assets and liabilities of Schwartz & Benjamin were recorded at their fair values, and the excess of the purchase price over the fair value of the assets acquired and liabilities assumed, including identified intangible assets, was recorded as goodwill. The fair values assigned to tangible and intangible assets acquired and liabilities assumed are based on management’s estimates and assumptions. The purchase price has been allocated as follows:
Inventory | $ | 11,635 | |
Accounts receivable | 10,836 | ||
Trademarks | 4,630 | ||
Customer relations | 5,210 | ||
Fixed assets | 3,281 | ||
Prepaids and other assets | 2,063 | ||
Accounts payable | (7,756 | ) | |
Accrued expenses | (4,669 | ) | |
Total fair value excluding goodwill | 25,230 | ||
Goodwill | 11,882 | ||
Net assets acquired | $ | 37,112 | |
Contingent consideration classified as a liability will be remeasured at fair value at each reporting date, until the contingency is resolved, with changes recognized in earnings. The goodwill related to this transaction is expected to be deductible for tax purposes over 15 years.
Note C – Factor Receivable
The Company has a collection agency agreement with Rosenthal & Rosenthal, Inc. (“Rosenthal”) that became effective on September 15, 2009. The agreement can be terminated by the Company or Rosenthal at any time upon 60 days prior written notice.
F-15
STEVEN MADDEN, LTD. AND SUBSIDIARIES
Notes to Consolidated Financial Statements
December 31, 2017, 2016 and 2015
($ in thousands, except share and per share data)
Note C – Factor Receivable (continued)
Under the agreement, the Company can request advances from Rosenthal in amounts of up to 85% of aggregate receivables submitted to Rosenthal. The agreement provides the Company with a $30,000 credit facility with a $15,000 sub-limit for letters of credit at an interest rate based, at the Company’s election, upon a calculation that utilizes either the prime rate minus 0.5% or LIBOR plus 2.5%. As of December 31, 2017 and 2016, no borrowings or letters of credit were outstanding. The Company also pays Rosenthal a fee of 0.20% of the gross invoice amount submitted to Rosenthal. With respect to receivables related to the Company's private label business, the fee is 0.14% of the gross invoice amount. Rosenthal assumes the credit risk on a substantial portion of the receivables that the Company submits to it and, to the extent of any loans made to the Company, Rosenthal maintains a lien on the Company’s receivables to secure the Company’s obligations. Rosenthal services the collection of the Company's accounts receivable. Funds collected by Rosenthal are applied against advances owed to Rosenthal (if any), and the balance is due and payable to the Company, net of any fees. The allowance against “factor receivables” is a projected provision based on certain formulas and prior approvals for markdowns, allowances, discounts, advertising and other deductions that customers may deduct against their payments.
Note D – Note Receivable – Related Party
On June 25, 2007, the Company made a loan to Steve Madden, its Creative and Design Chief and a principal stockholder of the Company, in the amount of $3,000 in order for Mr. Madden to satisfy a personal tax obligation resulting from the exercise of stock options that were due to expire and to retain the underlying Company common stock. The loan, as amended, is secured by non-company securities held in Mr. Madden's brokerage account. The Company has agreed to forgive a portion of the note as long as Mr. Madden remains an employee of the Company through the note's maturity on December 31, 2023. For the years ended December 31, 2017, 2016 and 2015 the Company also recorded a charge in the amount of $409 for each year, respectively, to write-off the required one-tenth of the principal amount of the secured promissory note, which was partially offset by imputed interest income of $55, $63 and $71, respectively.
Note E – Fair Value Measurement
The accounting guidance under Accounting Standards Codification “Fair Value Measurements and Disclosures” (“ASC 820-10”) provides guidance for disclosures about the fair value of certain of its assets and liabilities. ASC 820-10 clarifies the principle that fair value should be based on the assumptions market participants would use when pricing an asset or liability and establishes a fair value hierarchy that prioritizes the information used to develop those assumptions. ASC 820-10 utilizes a fair value hierarchy that prioritizes the inputs to valuation techniques used to measure fair value into three broad levels. A brief description of those three levels is as follows:
• | Level 1: Observable inputs such as quoted prices in active markets for identical assets or liabilities. |
• | Level 2: Inputs other than quoted prices that are observable for the asset or liability, either directly or indirectly. |
• | Level 3: Significant unobservable inputs. |
The Company’s financial assets and liabilities, subject to fair value measurements, as of December 31, 2017 and 2016 are as follows:
F-16
STEVEN MADDEN, LTD. AND SUBSIDIARIES
Notes to Consolidated Financial Statements
December 31, 2017, 2016 and 2015
($ in thousands, except share and per share data)
Note E – Fair Value Measurement (continued)
December 31, 2017 | ||||||||||||||||
Fair Value Measurements Using Fair Value Hierarchy | ||||||||||||||||
Fair value | Level 1 | Level 2 | Level 3 | |||||||||||||
Assets: | ||||||||||||||||
Cash equivalents | $ | 58,436 | $ | 58,436 | $ | — | $ | — | ||||||||
Current marketable securities – available for sale | 64,027 | 64,027 | — | — | ||||||||||||
Long-term marketable securities – available for sale | 29,523 | 29,523 | — | — | ||||||||||||
Total assets | $ | 151,986 | $ | 151,986 | $ | — | $ | — | ||||||||
Liabilities: | ||||||||||||||||
Contingent consideration | $ | 10,000 | $ | — | $ | — | $ | 10,000 | ||||||||
Forward contracts | 783 | — | 783 | — | ||||||||||||
Total liabilities | $ | 10,783 | $ | — | $ | 783 | $ | 10,000 | ||||||||
December 31, 2016 | ||||||||||||||||
Fair Value Measurements Using Fair Value Hierarchy | ||||||||||||||||
Fair value | Level 1 | Level 2 | Level 3 | |||||||||||||
Assets: | ||||||||||||||||
Cash equivalents | $ | 3,309 | $ | 3,309 | $ | — | $ | — | ||||||||
Current marketable securities – available for sale | 39,495 | 39,495 | — | — | ||||||||||||
Long-term marketable securities – available for sale | 70,559 | 70,559 | — | — | ||||||||||||
Forward contracts | 191 | — | 191 | — | ||||||||||||
Total assets | $ | 113,554 | $ | 113,363 | $ | 191 | $ | — | ||||||||
Liabilities: | ||||||||||||||||
Contingent consideration | $ | 7,948 | $ | — | $ | — | $ | 7,948 | ||||||||
Total liabilities | $ | 7,948 | $ | — | $ | — | $ | 7,948 | ||||||||
Our level 3 balance consists of contingent consideration related to the Schwartz & Benjamin acquisition. The changes in our level 3 liabilities for the years ended December 31, 2017 and 2016 are as follows:
F-17
STEVEN MADDEN, LTD. AND SUBSIDIARIES
Notes to Consolidated Financial Statements
December 31, 2017, 2016 and 2015
($ in thousands, except share and per share data)
Note E – Fair Value Measurement (continued)
Balance at January 1, | Payments | Accrued Interest | Acquisitions | Change in estimate | Foreign Currency Translation | Balance at December 31, | ||||||||||||||||
2017 | ||||||||||||||||||||||
Liabilities: | ||||||||||||||||||||||
Contingent consideration | $ | 7,948 | (7,359 | ) | — | 20,617 | (11,206 | ) | — | $ | 10,000 | |||||||||||
2016 | ||||||||||||||||||||||
Liabilities: | ||||||||||||||||||||||
Contingent consideration | $ | 24,775 | (16,402 | ) | — | — | (425 | ) | — | $ | 7,948 | |||||||||||
The change in estimate of the contingent consideration as of December 31, 2017 and 2016 of $11,206 and $425 has been reflected as a reduction in operating expenses on the Consolidated Statement of Income.
Forward contracts are entered into to manage the risk associated with the volatility of future cash flows denominated in foreign currencies. Fair value of these instruments are based on observable market transactions of spot and forward rates.
The Company has recorded a liability for potential contingent consideration in connection with the January 30, 2017 acquisition of Schwartz & Benjamin. Pursuant to the terms of an earn-out provision contained in the equity purchase agreement, as amended, between the Company and the sellers of Schwartz & Benjamin, earn-out payments are based on the performance of certain specified license agreements. The fair value of the contingent payments was estimated using the present value of the payments based on management’s projections of the financial results of Schwartz & Benjamin during the earn-out period.
The Company recorded a liability for potential contingent consideration in connection with the December 30, 2014 acquisition of all of the outstanding capital stock of Trendy Imports S.A. de C.V., Comercial Diecisiette S.A. de C.V., and Maximus Designer Shoes S.A. de C.V. (together "SM Mexico"). Pursuant to the terms of an earn-out agreement between the Company and the seller
of SM Mexico, earn-out payments were due annually to the seller of SM Mexico based on the financial performance of SM Mexico for each of the twelve-month periods ending on December 31, 2015 and 2016, inclusive. The fair value of the contingent payments was estimated using the present value of management's projections of the financial results of SM Mexico during the earn-out period. The first earn-out payment of $3,482 for the period ended December 31, 2015 was paid to the seller of SM Mexico in the first quarter of 2016. The earn-out payment of $4,618 for the period ended December 31, 2016 was paid to the seller of SM Mexico in 2017.
The Company recorded a liability for potential contingent consideration in connection with the February 21, 2012 acquisition of all of the assets of Steve Madden Canada Inc., Steve Madden Retail Canada Inc., Pasa Agency Inc. and Gelati Imports Inc. (collectively, “SM Canada”). Pursuant to the terms of an earn-out agreement between the Company and the seller of SM Canada, earn-out payments were due annually to the seller of SM Canada based on the financial performance of SM Canada for each of the 12-month periods ending on March 31, 2013 through 2017, inclusive. The fair value of the contingent payments was estimated using the present value of management’s projections of the financial results of SM Canada during the earn-out period. The final earn-out payment of $2,741 for the period ended March 31, 2017 was paid to the seller of SM Canada in 2017.
Accounting guidance permits entities to choose to measure financial instruments and certain other items at fair value that are not currently required to be measured at fair value. The accounting guidance also establishes presentation and disclosure requirements designed to facilitate comparisons between entities that chose different measurement attributes for similar assets and liabilities. The Company has elected not to measure any eligible items at fair value.
The carrying value of certain financial instruments such as accounts receivable, factor accounts receivable and accounts payable approximates their fair values due to the short-term nature of their underlying terms. The fair values of investment in marketable securities available for sale are determined by reference to publicly quoted prices in an active market. Fair value of the notes receivable held by the Company approximates their carrying value based upon their imputed or actual interest rate, which approximates applicable current market interest rates.
F-18
STEVEN MADDEN, LTD. AND SUBSIDIARIES
Notes to Consolidated Financial Statements
December 31, 2017, 2016 and 2015
($ in thousands, except share and per share data)
Note F - Property and Equipment
The major classes of assets and total accumulated depreciation and amortization are as follows:
December 31, | |||||||||
Average Useful Life | 2017 | 2016 | |||||||
Land and building | $ | 767 | $ | 767 | |||||
Leasehold improvements | 81,554 | 79,165 | |||||||
Machinery and equipment | 10 years | 7,132 | 11,112 | ||||||
Furniture and fixtures | 5 years | 8,629 | 8,881 | ||||||
Computer equipment and software | 3 to 5 years | 58,448 | 57,855 | ||||||
156,530 | 157,780 | ||||||||
Less accumulated depreciation and amortization | (85,032 | ) | (85,399 | ) | |||||
Property and equipment - net | $ | 71,498 | $ | 72,381 | |||||
Depreciation and amortization expense related to property and equipment included in operating expenses amounted to approximately $15,160 in 2017, $14,346 in 2016 and $13,237 in 2015.
Note G – Goodwill and Intangible Assets
The following is a summary of the carrying amount of goodwill by segment as of December 31, 2017 and 2016:
Wholesale | Net Carrying | |||||||||||||||
Footwear | Accessories | Retail | Amount | |||||||||||||
Balance at January 1, 2016 | $ | 73,018 | $ | 49,324 | $ | 14,755 | $ | 137,097 | ||||||||
Translation and other | (757 | ) | — | (629 | ) | (1,386 | ) | |||||||||
Balance at December 31, 2016 | 72,261 | 49,324 | 14,126 | 135,711 | ||||||||||||
Acquisition of Schwartz & Benjamin | 11,882 | — | — | 11,882 | ||||||||||||
Translation and other | 719 | — | 226 | 945 | ||||||||||||
Balance at December 31, 2017 | $ | 84,862 | $ | 49,324 | $ | 14,352 | $ | 148,538 | ||||||||
The following table details identifiable intangible assets as of December 31, 2017 and 2016:
F-19
STEVEN MADDEN, LTD. AND SUBSIDIARIES
Notes to Consolidated Financial Statements
December 31, 2017, 2016 and 2015
($ in thousands, except share and per share data)
Note G – Goodwill and Intangible Assets (continued)
2017 | ||||||||||||||||||
Estimated Lives | Cost Basis | Accumulated Amortization (1) | Impairment (2) | Net Carrying Amount | ||||||||||||||
Trade names | 6–10 years | $ | 9,220 | $ | 4,760 | $ | — | $ | 4,460 | |||||||||
Customer relationships | 10 years | 47,019 | 24,127 | — | 22,892 | |||||||||||||
License agreements | 3–6 years | 5,600 | 5,600 | — | — | |||||||||||||
Non-compete agreement | 5 years | 2,440 | 2,375 | — | 65 | |||||||||||||
Re-acquired right | 2 years | 4,200 | 4,200 | — | — | |||||||||||||
Other | 3 years | 14 | 14 | — | — | |||||||||||||
68,493 | 41,076 | — | 27,417 | |||||||||||||||
Re-acquired right | indefinite | 35,200 | 7,601 | — | 27,599 | |||||||||||||
Trade names | indefinite | 100,333 | — | 4,045 | 96,288 | |||||||||||||
$ | 204,026 | $ | 48,677 | $ | 4,045 | $ | 151,304 | |||||||||||
(1) Includes the effect of foreign currency translation related primarily to the changes in the Canadian dollar and Mexican peso in relation to the U.S. dollar. | ||||||||||||||||||
(2) An initial impairment charge of $3,045 was recorded in the first quarter of 2015, and a final impairment charge of $1,000 was recorded in the fourth quarter of 2017 related to the Company's Wild Pair trademark. The impairment was triggered by a loss of future anticipated cash flows from a significant customer. | ||||||||||||||||||
2016 | ||||||||||||||||||
Estimated Lives | Cost Basis | Accumulated Amortization (1) | Impairment (2) | Net Carrying Amount | ||||||||||||||
Trade names | 6–10 years | $ | 4,590 | $ | 3,335 | $ | — | $ | 1,255 | |||||||||
Customer relationships | 10 years | 41,509 | 21,341 | — | 20,168 | |||||||||||||
License agreements | 3–6 years | 5,600 | 5,600 | — | — | |||||||||||||
Non-compete agreement | 5 years | 2,440 | 2,426 | — | 14 | |||||||||||||
Re-acquired right | 2 years | 4,200 | 4,200 | — | — | |||||||||||||
Other | 3 years | 14 | 14 | — | — | |||||||||||||
58,353 | 36,916 | — | 21,437 | |||||||||||||||
Re-acquired right | indefinite | 35,200 | 9,539 | — | 25,661 | |||||||||||||
Trade names | indefinite | 100,333 | — | 3,045 | 97,288 | |||||||||||||
$ | 193,886 | $ | 46,455 | $ | 3,045 | $ | 144,386 | |||||||||||
(1) Includes the effect of foreign currency translation related primarily to the changes in the Canadian dollar and Mexican peso in relation to the U.S. dollar. | ||||||||||||||||||
(2) An impairment charge of $3,045 was recorded in the first quarter of 2015 related to the Company's Wild Pair trademark. The impairment was triggered by a loss of future anticipated cash flows from a significant customer. | ||||||||||||||||||
F-20
STEVEN MADDEN, LTD. AND SUBSIDIARIES
Notes to Consolidated Financial Statements
December 31, 2017, 2016 and 2015
($ in thousands, except share and per share data)
Note G – Goodwill and Intangible Assets (continued)
The amortization of intangible assets amounted to $5,245 for 2017, $5,522 for 2016 and $6,145 for 2015 and is included in operating expenses on the Company's Consolidated Statements of Income. The estimated future amortization expense for intangibles is as follows:
2018 | $ | 4,621 | |
2019 | 4,547 | ||
2020 | 3,721 | ||
2021 | 2,095 | ||
2022 | 1,563 | ||
Thereafter | 10,870 | ||
Total | $ | 27,417 | |
Note H – Stock-Based Compensation
In March 2006, the Board of Directors of the Company approved the Steven Madden, Ltd. 2006 Stock Incentive Plan (the “Plan”) under which nonqualified stock options, stock appreciation rights, performance shares, restricted stock, other stock-based awards and performance-based cash awards may be granted to employees, consultants and non-employee directors. The Company’s stockholders approved the Plan on May 26, 2006. The stockholders have subsequently approved successive amendments of the Plan, most recently on May 25, 2012, when the stockholders approved a third amendment to the Plan that increased the maximum number of shares that may be issued under the Plan to 23,466,000. The following table summarizes the number of shares of common stock authorized for use under the Plan, the number of stock-based awards granted (net of expired or cancelled awards) under the Plan and the number of shares of common stock available for the grant of stock-based awards under the Plan:
Common stock authorized | 23,466,000 | |
Stock-based awards, including restricted stock and stock options granted, net of expired or cancelled | (21,818,000 | ) |
Common stock available for grant of stock-based awards as of December 31, 2017 | 1,648,000 | |
In accordance with accounting guidance relating to stock-based compensation, the Company records compensation for all awards to employees based on the fair value of options and restricted stock on the date of grant. Equity-based compensation is included in operating expenses on the Company's Consolidated Statements of Income. For the years ended December 31, 2017, 2016 and 2015, total equity-based compensation was as follows:
Years Ended December 31, | |||||||||||
2017 | 2016 | 2015 | |||||||||
Restricted stock | $ | 16,616 | $ | 16,494 | $ | 15,543 | |||||
Stock options | 4,231 | 3,015 | 3,155 | ||||||||
Total | $ | 20,847 | $ | 19,509 | $ | 18,698 | |||||
F-21
STEVEN MADDEN, LTD. AND SUBSIDIARIES
Notes to Consolidated Financial Statements
December 31, 2017, 2016 and 2015
($ in thousands, except share and per share data)
Note H – Stock-Based Compensation (continued)
For the year ended December 31, 2015, the Company classified cash flows of $10,510 resulting from the tax benefit from tax deductions in excess of the compensation costs recognized for those options (tax benefits) as financing cash flows. During the third quarter of 2016, the Company adopted Accounting Standards Update No. 2016-09 ("ASU 2016-09"), Improvements to Employee Share-Based Payment Accounting which changes the accounting for certain aspects of share-based payments to employees (refer to Note Q). As a result of the adoption of ASU 2016-09, the Company classifies cash flows resulting from tax benefits as operating cash flows for the years ended December 31, 2017 and 2016. For the years ended December 31, 2017 and 2016, the Company realized a tax benefit from stock-based compensation of $4,019 and $5,244, respectively.
Stock Options
The total intrinsic value of options exercised during 2017, 2016 and 2015 amounted to $9,936, $16,983 and $12,433 respectively. During the years ended December 31, 2017, 2016 and 2015, 409,522 options with a weighted average exercise price of $34.02, 322,022 options with a weighted average exercise price of $32.37 and 455,528 options with a weighted average exercise price of $27.27 vested, respectively. As of December 31, 2017, there were unvested options relating to 1,241,187 shares of common stock with a total of $8,426 of unrecognized compensation cost and an average vesting period of 3.2 years.
The Company uses the Black-Scholes-Merton option-pricing model to estimate the fair value of options granted, which requires several assumptions. The expected term of the options represents the estimated period of time until exercise and is based on the historical experience of similar awards. Expected volatility is based on the historical volatility of the Company’s common stock. The risk free interest rate is based on the U.S. Treasury yield curve in effect at the time of the grant. Historically, with the exception of a special dividend paid in each of November 2005 and November 2006, the Company historically has not paid regular cash dividends and, thus, the expected dividend rate is assumed to be zero. The following weighted average assumptions were used for stock options granted:
2017 | 2016 | 2015 | ||||
Volatility | 23% to 26% | 22% to 26% | 22% to 28% | |||
Risk-free interest rate | 1.48% to 1.99% | 0.86% to 1.90% | 0.99% to 1.60% | |||
Expected life in years | 3 to 5 | 3 to 5 | 3 to 5 | |||
Dividend yield | 0.00% | 0.00% | 0.00% | |||
Weighted average fair value | $8.91 | $7.11 | $8.81 | |||
Activity relating to stock options granted under the Company’s plans and outside the plans during the three years ended December 31, 2017 is as follows:
F-22
STEVEN MADDEN, LTD. AND SUBSIDIARIES
Notes to Consolidated Financial Statements
December 31, 2017, 2016 and 2015
($ in thousands, except share and per share data)
Note H – Stock-Based Compensation (continued)
Number of Shares | Weighted Average Exercise Price | Weighted Average Remaining Contractual Term | Aggregate Intrinsic Value | ||||||||||
Outstanding at January 1, 2015 | 3,428,000 | $ | 19.48 | ||||||||||
Granted | 69,000 | 36.59 | |||||||||||
Exercised | (1,460,000 | ) | 14.59 | ||||||||||
Expired/Forfeited | (21,000 | ) | 28.49 | ||||||||||
Outstanding at December 31, 2015 | 2,016,000 | 23.51 | |||||||||||
Granted | 262,000 | 33.86 | |||||||||||
Exercised | (746,000 | ) | 14.36 | ||||||||||
Expired/Forfeited | (33,000 | ) | 30.59 | ||||||||||
Outstanding at December 31, 2016 | 1,499,000 | 29.72 | |||||||||||
Granted | 1,062,000 | 37.55 | |||||||||||
Exercised | (655,000 | ) | 24.73 | ||||||||||
Expired/Forfeited | (9,000 | ) | 35.23 | ||||||||||
Outstanding at December 31, 2017 | 1,897,000 | $ | 35.80 | 4.9 years | $ | 20,680 | |||||||
Exercisable at December 31, 2017 | 656,000 | $ | 33.67 | 3.1 years | $ | 8,540 | |||||||
The following table summarizes information about stock options at December 31, 2017:
Options Outstanding | Options Exercisable | ||||||||||
Range of Exercise Price | Number Outstanding | Weighted Average Remaining Contractual Life (in Years) | Weighted Average Exercise Price | Number Exercisable | Weighted Average Exercise Price | ||||||
$19.70 to $26.95 | 9,051 | 1.2 | $22.71 | 9,056 | $22.71 | ||||||
$27.03 to $29.45 | 80,309 | 1.8 | 28.64 | 80,352 | 28.64 | ||||||
$30.19 to $33.99 | 263,045 | 3.1 | 31.60 | 181,717 | 31.66 | ||||||
$34.06 to $38.05 | 1,359,071 | 5.3 | 36.53 | 328,974 | 35.25 | ||||||
$38.96 to $43.30 | 185,524 | 6.0 | 40.11 | 55,901 | 39.96 | ||||||
1,897,000 | 4.9 | $35.80 | 656,000 | $33.67 | |||||||
F-23
STEVEN MADDEN, LTD. AND SUBSIDIARIES
Notes to Consolidated Financial Statements
December 31, 2017, 2016 and 2015
($ in thousands, except share and per share data)
Note H – Stock-Based Compensation (continued)
Restricted Stock
The following table summarizes restricted stock activity during the three years ended December 31, 2017:
Number of Shares | Weighted Average Fair Value at Grant Date | ||||||
Outstanding at January 1, 2015 | 4,067,000 | $ | 24.69 | ||||
Granted | 361,000 | 35.71 | |||||
Vested | (304,000 | ) | 23.24 | ||||
Forfeited | (69,000 | ) | 34.23 | ||||
Outstanding at December 31, 2015 | 4,055,000 | 25.32 | |||||
Granted | 434,000 | 34.30 | |||||
Vested | (276,000 | ) | 30.28 | ||||
Forfeited | (22,000 | ) | 33.45 | ||||
Outstanding at December 31, 2016 | 4,191,000 | 25.93 | |||||
Granted | 275,000 | 37.67 | |||||
Vested | (508,000 | ) | 30.58 | ||||
Forfeited | (42,000 | ) | 35.47 | ||||
Outstanding at December 31, 2017 | 3,916,000 | $ | 26.05 | ||||
As of December 31, 2017, there was $63,140 of total unrecognized compensation cost related to restricted stock awards granted under the Plan. This cost is expected to be recognized over a weighted average period of 5.4 years.
The Company determines the fair value of its restricted stock awards based on the market price of its common stock on the date
of grant. The fair value of the restricted stock that vested during the years ended December 31, 2017, 2016 and 2015 was $21,549, $9,758 and $6,980, respectively.
On January 3, 2012, the Company and its Creative and Design Chief, Steven Madden, entered into an amendment of Mr. Madden’s existing employment agreement, pursuant to which, on February 8, 2012, Mr. Madden was granted 1,463,057 restricted shares of the Company’s common stock at the then market price of $27.34, which will vest in equal annual installments over a seven-year period commencing on December 31, 2017 and, thereafter, on each December 31 through December 31, 2023, subject to Mr. Madden’s continued employment on each such vesting date. On June 30, 2012, Mr. Madden exercised his right under his employment agreement to receive an additional restricted stock award, and, on July 3, 2012, he was granted 1,893,342 restricted shares of the Company's common stock at the then market price of $21.13, which vests in equal annual installments over a six-year period commencing on December 31, 2018 and, thereafter, on each December 31 through December 31, 2023, subject to Mr. Madden’s continued employment on each such vesting date. On July 20, 2017, pursuant to the employment agreement, Mr. Madden was granted an option to purchase 150,000 shares of the Company's common stock at an exercise price of $40.15 per share, which option is exercisable in equal quarterly installments commencing on October 20, 2017. On March 1, 2017, pursuant to his employment agreement, Mr. Madden was granted an option to purchase 750,000 shares of the Company’s common stock at an exercise price of $37.35 per share, which option is exercisable in equal annual installments over a five-year period commencing on the first anniversary of the grant date.
F-24
STEVEN MADDEN, LTD. AND SUBSIDIARIES
Notes to Consolidated Financial Statements
December 31, 2017, 2016 and 2015
($ in thousands, except share and per share data)
Note I - Preferred Stock
The Company has authorized 5,000,000 shares of preferred stock. The Board of Directors has designated 60,000 shares of such preferred stock as Series A Junior Participating Preferred Stock (“Series A Preferred”). Holders of the shares of Series A Preferred are entitled to dividends equal to 1,000 times dividends declared or paid on the Company's common stock. Each share of Series A Preferred entitles the holder to 1,000 votes on all matters submitted to the holders of common stock. The Series A Preferred has a liquidation preference of $1,000 per share, and is not redeemable by the Company. No shares of preferred stock have been issued.
Note J - Share Repurchase Program
The Company's Board of Directors authorized a share repurchase program (the “Share Repurchase Program”), effective as of January 1, 2004. The Share Repurchase Program does not have a fixed expiration or termination date and may be modified or terminated by the Board of Directors at any time. On several occasions the Board of Directors has increased the amount authorized for repurchase, most recently on July 28, 2017 when the Board of Directors approved the extension of the Share Repurchase Program for an additional $200,000 in repurchases of the Company's common stock. The Share Repurchase Program permits the Company to effect repurchases from time to time through a combination of open market repurchases or in privately negotiated transactions at such prices and times as are determined to be in the best interest of the Company. During the twelve months ended December 31, 2017, an aggregate of 2,253,802 shares of the Company's common stock was repurchased under the Share Repurchase Program, at an average price per share of $37.62, for an aggregate purchase price of approximately $84,783. As of December 31, 2017, approximately $180,861 remained available for future repurchases under the Share Repurchase Program.
The Steven Madden, Ltd. 2006 Stock Incentive Plan provides the Company with the right to deduct or withhold, or require employees to remit to the Company, an amount sufficient to satisfy any applicable tax withholding obligations applicable to stock-based compensation awards. To the extent permitted, employees may elect to satisfy all or part of such withholding obligations by tendering to the Company previously owned shares or by having the Company withhold shares having a fair market value equal to the minimum statutory tax withholding rate that could be imposed on the transaction. During the twelve months ended December 31, 2017, an aggregate of 346,820 shares were withheld in connection with the settlement of vested restricted stock to satisfy tax withholding requirements, at an average price per share of $42.18, for an aggregate purchase price of approximately $14,629.
Note K - Derivative Instruments
The Company uses derivative instruments, specifically, forward foreign exchange contracts, to manage the risk associated with the volatility of future cash flows. The forward foreign exchange contracts will be used to mitigate the impact of exchange rate fluctuations on forecasted purchases of inventory and are designated as cash flow hedging instruments. The Company enters into forward contracts with terms of no more than two years. As of December 31, 2017, $623 of losses related to cash flow hedges are recorded in accumulated other comprehensive income, net of taxes and are expected to be recognized in earnings at the same time the hedged items affect earnings. As of December 31, 2017, the fair value of the Company's foreign currency derivatives, which is included on the Consolidated Balance Sheet in accrued expenses, was $783. As of December 31, 2016, $191 of gains related to cash flow hedges were recorded in accumulated other comprehensive income, net of taxes and were recognized in earnings at the same time the hedged items affected earnings. As of December 31, 2017 and 2016, none of the Company's hedging activities were considered ineffective and thus no gains and losses relating to ineffectiveness on its hedging activities were recognized in the Consolidated Statements of Income. For the year ended December 31, 2017 losses of $57 were reclassified from accumulated other comprehensive income and recognized in the Consolidated Statements of Income in cost of sales as compared to losses of $472 for the year ended December 31, 2016.
F-25
STEVEN MADDEN, LTD. AND SUBSIDIARIES
Notes to Consolidated Financial Statements
December 31, 2017, 2016 and 2015
($ in thousands, except share and per share data)
Note L - Operating Leases
The Company leases office, showroom, warehouse and retail facilities under noncancelable operating leases with terms expiring at various dates through 2030. Future minimum annual lease payments under noncancelable operating leases consist of the following at December 31:
2018 | $ | 44,629 | |
2019 | 40,510 | ||
2020 | 38,005 | ||
2021 | 32,440 | ||
2022 | 26,720 | ||
Thereafter | 66,972 | ||
Total | $ | 249,276 | |
A majority of the retail store leases provide for contingent rental payments if gross sales exceed certain targets. In addition, many of the leases contain rent escalation clauses to compensate for increases in operating costs and real estate taxes. Rent expense for the years ended December 31, 2017, 2016 and 2015 was approximately $56,027, $52,294 and $47,710, respectively. Included in such amounts are contingent rents of $424, $238 and $157 in 2017, 2016 and 2015, respectively.
Rent expense is calculated by amortizing total base rental payments (net of any rental abatements, construction allowances and other rental concessions), on a straight-line basis, over the lease term. Accordingly, rent expense charged to operations differs from rent paid resulting in the Company recording deferred rent.
Note M - Income Taxes
The components of income before income taxes are as follows:
2017 | 2016 | 2015 | |||||||||
Domestic | $ | 124,472 | $ | 110,526 | $ | 81,785 | |||||
Foreign | 47,855 | 60,474 | 90,681 | ||||||||
$ | 172,327 | $ | 171,000 | $ | 172,466 | ||||||
The components of provision for income taxes for all periods presented were as follows:
F-26
STEVEN MADDEN, LTD. AND SUBSIDIARIES
Notes to Consolidated Financial Statements
December 31, 2017, 2016 and 2015
($ in thousands, except share and per share data)
Note M - Income Taxes (continued)
2017 | 2016 | 2015 | |||||||||
Current: | |||||||||||
Federal | $ | 56,836 | $ | 47,655 | $ | 24,838 | |||||
State and local | 5,746 | 6,063 | 4,136 | ||||||||
Foreign | 10,773 | 3,270 | 13,960 | ||||||||
73,355 | 56,988 | 42,934 | |||||||||
Deferred: | |||||||||||
Federal | (22,061 | ) | (7,050 | ) | 16,976 | ||||||
State and local | 800 | 153 | 1,961 | ||||||||
Foreign | 1,095 | (365 | ) | (3,060 | ) | ||||||
(20,166 | ) | (7,262 | ) | 15,877 | |||||||
$ | 53,189 | $ | 49,726 | $ | 58,811 | ||||||
On December 22, 2017, the Tax Cuts and Jobs Act of 2017 (the “Tax Act”) was signed into law making significant changes to the Internal Revenue Code of 1986, as amended. Changes include, but are not limited to, a reduction in the U.S. corporate statutory tax rate from 35% to 21% effective for tax years beginning after December 31, 2017, the transition from a worldwide tax system to a territorial regime, and a one-time transition tax on the deemed repatriation of cumulative foreign earnings as of December 31, 2017. The Company has calculated its best estimate of the impact of the Tax Act in its year end income tax provision in accordance with its understanding of the Tax Act and guidance available as of the filing of this Annual Report on Form 10-K, and as a result recorded $7,599 as an additional net income tax benefit in the fourth quarter of 2017, the period in which the legislation was enacted. The provisional amount related to the remeasurement of certain deferred tax assets and liabilities based on the rates at which they are expected to reverse in the future resulted in a $2,315 expense. The provisional amount, comprised of a one-time transition tax on the mandatory deemed repatriation of foreign earnings, resulted in a $9,914 benefit (consisting of a $21,994 tax expense, offset by a $31,908 tax benefit from reversal of existing deferred tax liability on unremitted earnings of foreign subsidiaries) based on cumulative foreign earnings of $310,134. In accordance with Staff Accounting Bulletin No. 118, any adjustments to these provisional amounts will be reported as a component of the Income Tax Provision (Benefit) during the reporting period in which any such adjustments are determined, all of which will be reported no later than the fourth quarter of 2018. The Company continues to evaluate the impacts of the Tax Act on its indefinite reinvestment assertion, as further discussed below.
The Company is subject to the provisions of the FASB ASC 740-10, Income Taxes, which requires that the effect on deferred tax assets and liabilities of a change in tax rates be recognized in the period the tax rate change was enacted. However, in December of 2017, the SEC staff issued Staff Accounting Bulletin 118 which provides that companies that have not completed their accounting for the effects of the Tax Act but can determine a reasonable estimate of those effects should include a provisional amount based on their reasonable estimate in their financial statements. The Company, as explained below, has made reasonable estimates in order to account for the effects of the Tax Act.
Although the $7,599 net benefit represents what the Company believes is a reasonable estimate of the impact of the income tax effects of the Tax Act as of December 31, 2017, it should be considered provisional. In light of the complexity of the Tax Act, the Company anticipates additional interpretive guidance from the U.S. Treasury and adjustments during the one year measurement period are probable. Once the Company finalizes certain tax positions when it files its 2017 U.S. tax return it will be able to conclude whether any further adjustments are required to its deferred tax balances in the U.S., as well as to the total liability associated with the one-time mandatory tax.
F-27
STEVEN MADDEN, LTD. AND SUBSIDIARIES
Notes to Consolidated Financial Statements
December 31, 2017, 2016 and 2015
($ in thousands, except share and per share data)
Note M - Income Taxes (continued)
A reconciliation between taxes computed at the Federal statutory rate and the effective tax rate is as follows:
December 31, | ||||||||
2017 | 2016 | 2015 | ||||||
Income taxes at federal statutory rate | 35.0 | % | 35.0 | % | 35.0 | % | ||
Effects of foreign operations | (4.5 | ) | (5.3 | ) | (3.6 | ) | ||
Stock-based compensation | (2.2 | ) | (3.0 | ) | — | |||
State and local income taxes - net of federal income tax benefit | 2.0 | 2.0 | 1.7 | |||||
Nondeductible items | 0.5 | 0.2 | 0.1 | |||||
Impact of tax reform | (4.4 | ) | — | — | ||||
Receivable Adjustment | 2.7 | — | — | |||||
Other | 1.8 | 0.2 | 0.9 | |||||
Effective rate | 30.9 | % | 29.1 | % | 34.1 | % | ||
The components of deferred tax assets and liabilities are as follows:
December 31, | |||||||
2017 | 2016 | ||||||
Deferred taxes assets | |||||||
Receivable allowances | 7,315 | 8,800 | |||||
Inventory | 901 | 2,202 | |||||
Unrealized loss | 321 | 177 | |||||
Accrued expenses | 1,796 | 751 | |||||
Deferred compensation | 11,071 | 17,569 | |||||
Deferred rent | 3,737 | 5,327 | |||||
Net carryforwards | 300 | 1,172 | |||||
Other | 3,842 | 3,515 | |||||
Gross deferred tax assets | 29,283 | 39,513 | |||||
Deferred tax liabilities | |||||||
Depreciation and amortization | (16,210 | ) | (19,264 | ) | |||
Unremitted earnings of foreign subsidiaries | (2,422 | ) | (31,262 | ) | |||
Amortization of goodwill | (7,883 | ) | (6,640 | ) | |||
Gross deferred tax liabilities | (26,515 | ) | (57,166 | ) | |||
Net deferred tax assets (liabilities) | $ | 2,768 | $ | (17,653 | ) | ||
F-28
STEVEN MADDEN, LTD. AND SUBSIDIARIES
Notes to Consolidated Financial Statements
December 31, 2017, 2016 and 2015
($ in thousands, except share and per share data)
Note M - Income Taxes (continued)
The Company applies the asset and liability method of accounting for income taxes. Under this method, deferred tax assets and liabilities are determined based on differences between financial reporting and tax bases of assets and liabilities and are measured using the enacted tax rates and laws that are expected to be in effect when the differences are expected to reverse.
In accordance with accounting guidance, the Company has opted to classify interest and penalties that would accrue according to the provisions of relevant tax law as income tax expense on the Consolidated Statements of Income. The Company determines the amount of interest expense to be recognized by applying the applicable statutory rate of interest to the difference between the tax position recognized and the amount previously taken or expected to be taken on a tax return. The Company's tax years 2014 through 2017 remain open to examination by most taxing authorities. During 2017, the U.S. Internal Revenue Service ("IRS") completed its audit of the Company's 2014 U.S. income tax return. The Company does not have any material unrecognized tax benefits recorded as of December 31, 2017 and 2016.
The Company's consolidated financial statements provide for any related tax liability on amounts that may be repatriated from foreign operations, aside from undistributed earnings of certain of the Company's foreign subsidiaries that are intended to be indefinitely reinvested in operations outside the U.S. The deferred tax liability of $2,422 at December 31, 2017 reflects the withholding and state and local tax on amounts that may be repatriated from foreign operations. The Company continues to analyze the impact of the Tax Act on its indefinite reinvestment assertion, and as of December 31, 2017 has recorded a provisional estimate for the potential taxes related to the one-time mandatory tax.
Note N – Commitments, Contingencies and Other
[1] Legal Proceedings:
In the ordinary course of business, the Company has various pending cases involving contractual disputes, employee-related matters, distribution matters, product liability claims, trademark infringement and other matters. In the opinion of management, after consulting with legal counsel, the liabilities, if any, resulting from these legal proceedings should not have a material impact on the Company's financial condition, results of operations or cash flows. It is the policy of management to disclose the amount or range of reasonably possible losses in excess of recorded amounts.
[2] Employment agreements:
Edward R. Rosenfeld. On December 31, 2015, the Company entered into a new employment agreement with Edward R. Rosenfeld, the Company's Chief Executive Officer and the Chairman of the Board of Directors, to replace an existing employment agreement that expired on December 31, 2015. The agreement, which expires on December 31, 2018, provides for an annual salary of $900 in 2018. In addition, pursuant to his new employment agreement, on December 31, 2015, Mr. Rosenfeld received a grant of 75,000 shares of the Company's common stock subject to certain restrictions and, on February 5, 2016, a further grant of 75,000 shares of the Company's common stock subject to certain restrictions. The restricted shares received by Mr. Rosenfeld on December 31, 2015 and February 5, 2016 were issued under the Company's 2006 Stock Incentive Plan, as amended, and vest in equal annual installments over a five-year period commencing on December 1, 2016 and March 5, 2017, respectively. Additional compensation and bonuses, if any, are at the sole discretion of the Board of Directors.
Steven Madden. On January 3, 2012, the Company and its Creative and Design Chief, Steven Madden, entered into an amendment, dated as of December 31, 2011, to Mr. Madden’s then existing employment agreement with the Company. The amended agreement, which extends the term of Mr. Madden's employment through December 31, 2023, provides,
among other things, for a base salary of approximately $7,026 per annum for the period between January 1, 2016 through the expiration of the term of employment. Also under the amended agreement, Mr. Madden received the right, exercisable on certain specified dates in fiscal year 2012 only, to elect to receive a grant of restricted stock for a number of shares of the Company’s common stock valued at $40,000 in consideration for certain specified reductions in his annual base salary
F-29
STEVEN MADDEN, LTD. AND SUBSIDIARIES
Notes to Consolidated Financial Statements
December 31, 2017, 2016 and 2015
($ in thousands, except share and per share data)
Note N – Commitments, Contingencies and Other (continued)
in years subsequent to 2012. Mr. Madden exercised this right and, on July 3, 2012, he was granted 1,893,342 restricted shares of the Company's common stock at the then market price of $21.13, which shares vest in the same manner as the February 8, 2012 restricted stock grant received by Mr. Madden pursuant to the amended agreement. (See Note N to the Consolidated Financial Statements.) Further, in addition to the opportunity for cash bonuses at the sole discretion of the Board of Directors, Mr. Madden’s amended agreement entitles him to an annual life insurance premium payment as well as an annual stock option grant. The amended agreement also provides Mr. Madden the potential for an additional one-time stock option award for 750,000 shares of the Company’s common stock (the “EPS Option”) in the event that the Company achieves earnings per share on a fully-diluted basis equal to $2.00 as to any fiscal year ending December 31, 2015 or thereafter, which performance criteria was achieved for the fiscal year ended December 31, 2016 and, as such. on March 1, 2017, Mr. Madden was granted the EPS Option at an exercise price of $37.35 per share. The EPS Option vests in equal annual installments over a five-year period commencing on the first anniversary of the grant date.
Arvind Dharia. On February 2, 2015, the Company and its Chief Financial Officer, Arvind Dharia, entered into an amendment of Mr. Dharia's existing employment agreement. The amendment, among other things, increased his annual base salary to $582 effective January 1, 2015 through the remainder of the term of the employment agreement, which ends on December 31, 2018. Pursuant to the amendment, on February 2, 2015, Mr. Dharia received a restricted stock award of 15,000 restricted shares of the Company's common stock, which vests in substantially equal annual installments over a five-year period commencing on February 2, 2016 through February 2, 2020. The agreement, as amended, provides for an annual bonus to Mr. Dharia at the discretion of the Board of Directors.
Amelia Newton Varela. On December 30, 2016, the Company entered into a new employment agreement with Amelia Newton Varela, the Company’s President and a member of the Board of Directors of the Company, to replace an existing employment agreement that expired on December 31, 2016. The agreement, which remains in effect through December 31, 2019, provides for an annual salary of $650 in 2018 and $670 in 2019. In addition, pursuant to her new employment agreement, on January 3, 2017, Ms. Varela was granted an option to purchase 100,000 shares of the Company's common stock at an exercise price of $35.75. The option, which was granted under the Company’s 2006 Stock Incentive Plan, as amended, vests in four equal annual installments on each anniversary of the date of grant, commencing on January 3, 2018. The agreement provides to Ms. Varela the opportunity for an annual performance-based bonus for the fiscal years ended December 31, 2017, 2018 and 2019.
Awadhesh Sinha. On December 30, 2016, the Company entered into a new employment agreement with Awadhesh Sinha, the Company's Chief Operating Officer, to replace an existing employment agreement that expired at the end of 2016. The new agreement, which remains in effect through December 31, 2019, provides for an annual salary of $702, and $723 for the years ended December 31, 2018, and 2019, respectively, and provides to Mr. Sinha the opportunity for annual cash and share based incentive bonuses. In addition, pursuant to his new employment agreement, on January 3, 2017, Mr. Sinha received a grant of 28,169 shares of the Company's common stock subject to certain restrictions. The restricted
shares received by Mr. Sinha were issued under the Company's 2006 Stock Incentive Plan, as amended, and vest in equal annual installments over a three-year period on each of December 15, 2017, December 15, 2018, and December 15, 2019.
Karla Frieders. On April 11, 2017, the Company entered into a new employment agreement with Karla Frieders, the Company’s Chief Merchandising Officer, to replace an existing employment agreement which expired on February 28,
2017. The agreement, which remains in effect through April 30, 2020, provides to Ms. Frieders an annual salary of $550 for the period commencing on April 11, 2017 and ending on April 30, 2018; $570 for the period commencing on May 1, 2018 and ending on April 30, 2019; and $590 for the period commencing on May 1, 2019 and ending on April 30, 2020; and an annual performance-based bonus for the fiscal years ending December 31, 2017, 2018 and 2019 in an amount to be determined at the discretion of the Company. In addition, pursuant to her new employment agreement, on April 11, 2017, Ms. Frieders received a grant of 20,000 shares of the Company's common stock subject to certain restrictions. The
restricted shares received by Ms. Frieders were issued under the Company's 2006 Stock Incentive Plan, as amended, and vest in equal annual installments over a five-year period commencing on April 1, 2018 and ending on April 1, 2022.
F-30
STEVEN MADDEN, LTD. AND SUBSIDIARIES
Notes to Consolidated Financial Statements
December 31, 2017, 2016 and 2015
($ in thousands, except share and per share data)
Note N – Commitments, Contingencies and Other (continued)
Michael Paradise. On April 5, 2016, the Company entered into a new employment agreement with Michael Paradise, the Company's Executive Vice President - Legal Counsel. The agreement, which remains in effect through December 31, 2018, provides to Mr. Paradise an annual salary of $400 subject to periodic increases as determined by the Board of Directors, and an annual performance-based bonus for the fiscal years ending December 31, 2016, December 31, 2017 and December 31, 2018 in an amount to be determined at the discretion of the Company. The agreement also provides Mr. Paradise with a signing bonus in the amount of $250. In addition, pursuant to his employment agreement, on June
1, 2016, Mr. Paradise received a grant of 7,217 shares of the Company's common stock subject to certain restrictions. The restricted shares received by Mr. Paradise were issued under the Company's 2006 Stock Incentive Plan, as amended, and vest in equal annual installments over a four-year period commencing on June 1, 2017 and ending on June 1, 2020.
[3] Letters of credit:
At December 31, 2017, the Company had no open letters of credit for the purchase of imported merchandise.
[4] License agreements:
On January 30, 2017, the Company acquired all of the outstanding capital stock of Schwartz & Benjamin, which holds licenses to manufacture, market and sell footwear with the Kate Spade® and Avec Les Filles® trademarks. The license agreements require Schwartz & Benjamin to pay the licensor a royalty equal to a percentage of net sales and a minimum royalty in the event that specified net sales targets are not achieved. The license agreements extend through December 31, 2020.
In August 2017, the Company entered into a license agreement with Donna Karan Studio LLC for the right to manufacture, market and sell women's belts with the DKNY® and Donna Karan® brands. The agreement, unless extended, expires on December 31, 2020. The agreement requires that the Company pay the licensor a royalty equal to a percentage of net sales and a minimum royalty in the event that specified net sales targets are not achieved.
On March 1, 2014, the Company entered into a license agreement with ABG Juicy Couture, LLC, under which the Company has the right to use the Juicy Couture® trademark in connection with the sale and marketing of women's footwear. The agreement requires the Company to pay the licensor a royalty equal to a percentage of net sales and a minimum royalty in the event that specified net sales targets are not achieved. The agreement terminated on December 31, 2017.
On February 9, 2011, the Company entered into a license agreement with Basic Properties America Inc. and BasicNet S.p.A, under which the Company has the right to use the Superga® trademark in connection with the sale and marketing of women's footwear. The agreement requires the Company to pay the licensor a royalty equal to a percentage of net sales and a minimum royalty in the event that specified net sales targets are not achieved. The agreement was amended on April 11, 2013 to extend the term of the agreement through December 31, 2022.
Future minimum royalty payments are $4,078 for 2018, $10,060 for 2019 through 2020 and $2,000 for 2021 through 2022. Royalty expenses are included in the “cost of goods sold” section of the Company's Consolidated Statements of Income.
[5] Concentrations:
The Company maintains cash and cash equivalents with various major financial institutions which at times are in excess of the amount insured. In addition, the Company's marketable securities are principally held at three brokerage companies.
F-31
STEVEN MADDEN, LTD. AND SUBSIDIARIES
Notes to Consolidated Financial Statements
December 31, 2017, 2016 and 2015
($ in thousands, except share and per share data)
Note N – Commitments, Contingencies and Other (continued)
During the year ended December 31, 2017, the Company did not purchase more than 10% of its merchandise from any single supplier. Total product purchases from China for the year ended December 31, 2017 were approximately 93%.
During the year ended December 31, 2016, the Company did not purchase more than 10% of its merchandise from any single supplier. Total product purchases from China for the year ended December 31, 2016 were approximately 87%.
During the year ended December 31, 2015, the Company did not purchase more than 10% of its merchandise from any single supplier. Total product purchases from China for the year ended December 31, 2015 were approximately 90%.
For the year ended December 31, 2017, Target Corporation represented 13.4% of total accounts receivable and Wal-Mart Stores, Inc. represented 14.6% of total accounts receivable. The Company did not have customers who accounted for more than 10% of total net sales or any other customers who accounted for more than 10% of total accounts receivable.
For the year ended December 31, 2016, Target Corporation represented 12.0% of net sales and 16.9% of total accounts receivable. The Company did not have any other customers who accounted for more than 10% of total net sales or 10% of total accounts receivable.
For the year ended December 31, 2015, Target Corporation represented 12.2% of net sales and 16.7% of total accounts receivable. The Company did not have any customers who accounted for more than 10% of total net sales or 10% of total accounts receivable.
Purchases are made primarily in United States dollars.
[6] Valuation and qualifying accounts:
The following is a summary of the allowance for chargebacks and doubtful accounts related to accounts receivable and the allowance for chargebacks related to the amount due from factor:
Balance at Beginning of Year | Additions | Deductions | Balance at End of Year | ||||||||||||
Year ended December 31, 2017 | |||||||||||||||
Allowance for doubtful accounts | $ | 144 | $ | 15,070 | $ | 14,598 | $ | 616 | |||||||
Allowance for chargebacks | 19,138 | 83,076 | 76,766 | 25,448 | |||||||||||
Returns | 2,549 | 8,750 | 9,177 | 2,122 | |||||||||||
Year ended December 31, 2016 | |||||||||||||||
Allowance for doubtful accounts | 200 | 5 | 61 | 144 | |||||||||||
Allowance for chargebacks | 19,040 | 67,649 | 67,551 | 19,138 | |||||||||||
Returns* | 4,822 | 5,169 | 7,442 | 2,549 | |||||||||||
Year ended December 31, 2015 | |||||||||||||||
Allowance for doubtful accounts | 203 | 162 | 165 | 200 | |||||||||||
Allowance for chargebacks | 18,199 | 76,085 | 75,244 | 19,040 | |||||||||||
Returns* | $ | 5,160 | $ | 5,868 | $ | 6,206 | $ | 4,822 | |||||||
* The return reserve does not take into consideration the Company's ability to resell returned products. | |||||||||||||||
F-32
STEVEN MADDEN, LTD. AND SUBSIDIARIES
Notes to Consolidated Financial Statements
December 31, 2017, 2016 and 2015
($ in thousands, except share and per share data)
Note O – Operating Segment Information
The Company operates the following business segments: Wholesale Footwear, Wholesale Accessories, Retail, First Cost and Licensing. The Wholesale Footwear segment, through sales to department stores, mid-tier retailers, mass market merchants, online retailers and specialty stores, derives revenue, both domestically and worldwide (via our International business), from sales of branded and private label women’s, men’s, girls’ and children’s footwear. The Wholesale Accessories segment, which includes branded and private label handbags, belts and small leather goods as well as cold weather and selected other fashion accessories, derives revenue, both domestically and worldwide (via our International business), from sales to department stores, mid-tier retailers, mass market merchants, online retailers and specialty stores. Our Wholesale Footwear and Wholesale Accessories segments, through our International business, derive revenue from Albania, Austria, Belgium, Bulgaria, Canada, Cyprus, Czech Republic, Denmark, Estonia, Finland, France, Germany, Hungary, Ireland, Kosovo, Latvia, Lithuania, Luxembourg, Mexico, the Netherlands, Norway, Poland, Romania, Russia, Slovakia, Slovenia, Sweden, Switzerland, and Tunisia and, under special distribution arrangements in various other territories within Asia, Europe (excluding the aforementioned nations), the Middle East, India, South and Central America and New Zealand. The Retail segment, through the operation of Company-owned retail stores in the United States, Canada and Mexico, our joint ventures in South Africa, China and Taiwan and the Company’s websites, derives revenue from sales of branded women’s, men’s and children’s footwear, accessories and licensed products to consumers. The First Cost segment represents activities of a subsidiary that earns commissions and design fees for serving as a buying agent of footwear products to mass-market merchandisers, mid-tier department stores and other retailers with respect to their purchase of footwear. In the Licensing segment, the Company generates revenue by licensing its Steve Madden®, Steven by Steve Madden® and Madden Girl® trademarks for use in connection with the manufacture, marketing and sale of outerwear, hosiery, jewelry, watches, sunglasses, hair accessories, umbrellas, bedding, luggage, and men’s leather accessories. We license the Stevies® trademark for use in connection with the manufacture, marketing and sale of outerwear exclusively to Target. In addition, this segment licenses the Betsey Johnson® trademark for use in connection with the manufacture, marketing and sale of women's and children’s apparel, hosiery, swimwear, fragrance and beauty, sleepwear, activewear, jewelry, watches, bedding, luggage, stationary, umbrellas, and household goods. The Licensing segment also licenses the Dolce Vita® trademark for use in connection with the manufacture, marketing and sale of women's and children's apparel.
F-33
STEVEN MADDEN, LTD. AND SUBSIDIARIES
Notes to Consolidated Financial Statements
December 31, 2017, 2016 and 2015
($ in thousands, except share and per share data)
Note O – Operating Segment Information (continued)
Year ended | Wholesale Footwear | Wholesale Accessories | Total Wholesale | Retail | First Cost | Licensing | Consolidated | |||||||||||||||||||||
December 31, 2017: | ||||||||||||||||||||||||||||
Net sales | $ | 1,017,557 | $ | 256,295 | $ | 1,273,852 | $ | 272,246 | $ | — | $ | — | $ | 1,546,098 | ||||||||||||||
Gross profit | 332,367 | 80,729 | 413,096 | 164,645 | — | — | 577,741 | |||||||||||||||||||||
Commissions and licensing fees – net | — | — | — | — | 5,159 | 9,100 | 14,259 | |||||||||||||||||||||
Income from operations | 133,014 | 23,637 | 156,651 | (1,126 | ) | 5,159 | 9,100 | 169,784 | ||||||||||||||||||||
Depreciation and amortization | 11,287 | 9,645 | 457 | — | 21,389 | |||||||||||||||||||||||
Segment assets | $ | 784,334 | $ | 138,720 | 923,054 | 122,111 | 11,996 | — | 1,057,161 | |||||||||||||||||||
Capital expenditures | $ | 5,590 | $ | 9,185 | $ | — | $ | — | $ | 14,775 | ||||||||||||||||||
December 31, 2016: | ||||||||||||||||||||||||||||
Net sales | $ | 881,864 | $ | 254,931 | $ | 1,136,795 | $ | 262,756 | $ | — | $ | — | $ | 1,399,551 | ||||||||||||||
Gross profit | 279,835 | 84,422 | 364,257 | 157,726 | — | — | 521,983 | |||||||||||||||||||||
Commissions and licensing fees – net | — | — | — | — | 3,728 | 8,060 | 11,788 | |||||||||||||||||||||
Income from operations | 110,039 | 31,562 | 141,601 | 15,787 | 3,728 | 8,060 | 169,176 | |||||||||||||||||||||
Depreciation and amortization | 11,734 | 9,087 | 281 | — | 21,102 | |||||||||||||||||||||||
Segment assets | $ | 648,738 | $ | 186,075 | 834,813 | 118,168 | 7,894 | — | 960,875 | |||||||||||||||||||
Capital expenditures | $ | 5,990 | $ | 9,907 | $ | — | $ | — | $ | 15,897 | ||||||||||||||||||
December 31, 2015 | ||||||||||||||||||||||||||||
Net sales | $ | 898,363 | $ | 266,564 | $ | 1,164,927 | $ | 240,312 | $ | — | $ | — | $ | 1,405,239 | ||||||||||||||
Gross profit | 265,822 | 88,361 | 354,183 | 146,309 | — | — | 500,492 | |||||||||||||||||||||
Commissions and licensing fees – net | — | — | — | — | 6,713 | 9,852 | 16,565 | |||||||||||||||||||||
Income from operations | 104,836 | 32,612 | 137,448 | 17,635 | 6,713 | 9,852 | 171,648 | |||||||||||||||||||||
Depreciation and amortization | 12,624 | 7,897 | 236 | — | 20,757 | |||||||||||||||||||||||
Segment assets | $ | 604,015 | $ | 187,895 | 791,910 | 106,823 | 15,652 | — | 914,385 | |||||||||||||||||||
Capital expenditures | $ | 7,237 | $ | 12,222 | $ | — | $ | — | $ | 19,459 | ||||||||||||||||||
Revenues by geographic area are as follows:
Year Ended December 31, | ||||||||||||
2017 | 2016 | 2015 | ||||||||||
Domestic (a) | $ | 1,383,841 | $ | 1,258,973 | $ | 1,255,709 | ||||||
International | 162,257 | 140,578 | 149,530 | |||||||||
Total | $ | 1,546,098 | $ | 1,399,551 | $ | 1,405,239 | ||||||
(a) Includes revenues of $329,107, $312,491 and $331,481 for the years ended 2017, 2016 and 2015 related to sales to U.S. customers where the title is transferred outside the U.S. and the sale is recorded by our International subsidiary. | ||||||||||||
F-34
STEVEN MADDEN, LTD. AND SUBSIDIARIES
Notes to Consolidated Financial Statements
December 31, 2017, 2016 and 2015
($ in thousands, except share and per share data)
Note P - Quarterly Results of Operations (unaudited)
The following is a summary of the quarterly results of operations for the years ended December 31, 2017 and 2016:
March 31, | June 30, | September 30, | December 31, | ||||||||||||
2017: | |||||||||||||||
Net sales | $ | 366,387 | $ | 374,148 | $ | 441,193 | $ | 364,370 | |||||||
Cost of sales | 233,669 | 234,751 | 275,303 | 224,634 | |||||||||||
Gross profit | 132,718 | 139,397 | 165,890 | 139,736 | |||||||||||
Commissions, royalty and licensing fee income - net | 3,927 | 2,166 | 4,745 | 3,421 | |||||||||||
Net income attributable to Steven Madden, Ltd. | $ | 20,158 | $ | 28,964 | $ | 44,229 | $ | 24,597 | |||||||
Net income per share: | |||||||||||||||
Basic | $ | 0.36 | $ | 0.53 | $ | 0.81 | $ | 0.45 | |||||||
Diluted | $ | 0.35 | $ | 0.50 | $ | 0.77 | $ | 0.43 | |||||||
2016: | |||||||||||||||
Net sales | $ | 329,357 | $ | 325,402 | $ | 408,384 | $ | 336,408 | |||||||
Cost of sales | 213,155 | 204,357 | 253,876 | 206,180 | |||||||||||
Gross profit | 116,202 | 121,045 | 154,508 | 130,228 | |||||||||||
Commissions, royalty and licensing fee income - net | 2,171 | 2,826 | 5,358 | 1,529 | |||||||||||
Net income attributable to Steven Madden, Ltd. | $ | 23,659 | $ | 24,737 | $ | 43,767 | $ | 28,748 | |||||||
Net income per share: | |||||||||||||||
Basic | $ | 0.41 | $ | 0.43 | $ | 0.77 | $ | 0.51 | |||||||
Diluted | $ | 0.39 | $ | 0.41 | $ | 0.74 | $ | 0.49 | |||||||
Note Q - Recent Accounting Pronouncements
Recently Adopted
In January 2017, the Financial Accounting Standards Board (the "FASB") issued Accounting Standards Update 2017-04 ("ASU 2017-04"), "Simplifying the Test for Goodwill Impairment." ASU 2017-04 changes the methodology of applying the quantitative approach during interim or annual impairment testing. The guidance is effective in fiscal years beginning after December 15, 2020 with early adoption permitted. The Company adopted the provisions of ASU 2017-04 in the second quarter of 2017; the adoption did not have a material impact on the Company's financial statements.
In July 2015, the FASB issued Accounting Standards Update 2015-11 ("ASU 2015-11"), "Inventory (Topic 330): Simplifying the Measurement of Inventory", which changes the measurement principle for inventory from the lower of cost or market to the lower of cost and net realizable value. ASU 2015-11 defines net realizable value as estimated selling prices in the ordinary course of business, less reasonably predictable costs of completion, disposal, and transportation. The Company adopted the provisions of ASU 2015-11 in the first quarter of 2017; the adoption did not have a material impact on the Company's financial statements.
In November 2015, the FASB issued Accounting Standards Update 2015-17 ("ASU 2015-17"), "Income Taxes (Topic 740): Balance Sheet Classification of Deferred Taxes." ASU 2015-17 simplifies current guidance and requires companies to classify all deferred tax assets and liabilities as noncurrent on the balance sheet. The Company adopted the provisions of ASU 2015-17 in the first quarter of 2017 under the retrospective approach and, as such, the Company reclassified $13,985 of deferred taxes from current to non-current on our balance sheet as of December 31, 2016.
F-35
STEVEN MADDEN, LTD. AND SUBSIDIARIES
Notes to Consolidated Financial Statements
December 31, 2017, 2016 and 2015
($ in thousands, except share and per share data)
Note Q - Recent Accounting Pronouncements (continued)
Not Yet Adopted
In February 2018, the FASB issued Accounting Standards Update No. 2018-02, Income Statement - Reporting Comprehensive Income (Topic 220): Reclassification of Certain Tax Effects from Accumulated Other Comprehensive Income (“ASU 2018-02”), which allows for stranded tax effects in accumulated other comprehensive income resulting from the U.S. Tax Cuts and Jobs Act to be reclassified to retained earnings. ASU 2018-02 is effective for fiscal years, and interim periods within those years, beginning after December 15, 2018. Early adoption is permitted. The Company is currently evaluating the impact of adopting the new standard and does not expect the new standard to have a material impact on the Company’s financial position or results of operations.
In August 2017, the FASB issued Accounting Standards Update 2017-12 ("ASU 2017-12"), "Derivatives and Hedging (Topic 815): Targeted Improvements to Accounting for Hedging Activities." ASU 2017-12 changes the recognition and presentation requirements of hedge accounting. The guidance provides new alternatives for applying hedge accounting to additional hedging strategies and measuring the hedged item in fair value hedges of interest rate risk, as well as applies new alternatives for reducing the cost and complexity of applying hedge accounting by easing the requirements for effectiveness testing, hedge documentation and application of the critical terms match method, and reducing the risk of material error correction if a company applies the shortcut method inappropriately. The guidance is effective for annual and interim periods in fiscal years beginning after December 15, 2018 and early adoption is permitted any time after the issuance of the ASU, including in an interim period. The Company is currently evaluating the effect that the new guidance will have on its financial statements and related disclosures.
In August 2016, the FASB issued Accounting Standards Update 2016-15 ("ASU 2016-15"), "Classification of Certain Cash Receipts and Cash Payments." ASU 2016-15 clarifies how certain cash receipts and payments should be presented in the statement of cash flows. The guidance is effective for fiscal years beginning after December 15, 2017 and interim periods within those fiscal years with early adoption permitted. We will adopt the guidance when it becomes effective in the first quarter of 2018; the guidance is not expected to have a material impact on our financial statements.
In June 2016, the FASB issued Accounting Standards Update 2016-13 ("ASU 2016-13"), "Financial Instruments - Credit Losses (Topic 326): Measurement of Credit Losses on Financial Instruments." ASU 2016-13 replaces the incurred loss impairment methodology in current GAAP with a methodology that reflects expected credit losses and requires consideration of a broader range of reasonable and supportable information to inform credit loss estimates. The new guidance is effective for fiscal years beginning after December 15, 2019, including interim periods within those fiscal years. The Company is currently evaluating the
effect that the new guidance will have on its financial statements and related disclosures.
In February 2016, the FASB issued Accounting Standards Update No. 2016-02 ("ASU 2016-02"), "Leases," which is effective for fiscal years, and interim periods within those years, beginning after December 15, 2018 with early adoption permitted. Under ASU 2016-02, lessees will be required to recognize for all leases with terms longer than twelve months, at the commencement date of the lease, a lease liability, which is a lessee’s obligation to make lease payments arising from a lease measured on a discounted basis, and a right-to-use asset, which is an asset that represents the lessee’s right to use or control the use of a specified asset for the lease term. Leases will be classified as either finance or operating, with classification affecting the pattern of expense recognition. The Company is currently evaluating the effect that the new guidance will have on its financial statements and related disclosures and, although the analysis is not complete, it is expected to have a material impact on the consolidated financial statements.
In January 2016, the FASB issued Accounting Standards Update 2016-01 ("ASU 2016-01"), "Financial Instruments - Overall (Subtopic 825-10): Recognition and Measurement of Financial Assets and Financial Liabilities." ASU 2016-01 generally requires companies to measure investments in equity securities, except those accounted for under the equity method, at fair value and recognize any changes in fair value in net income. The new guidance must be applied using a modified-retrospective approach and is effective for periods beginning after December 15, 2017 and early adoption is not permitted. We will adopt the guidance when it becomes effective in the first quarter of 2018; the guidance is not expected to have a material impact on our financial statements.
In May 2014, the FASB issued new accounting guidance, Accounting Standards Update No. 2014-09 ("ASU 2014-09"), "Revenue from Contracts with Customers," on revenue recognition. The new standard provides for a single five-step model to be applied to
F-36
STEVEN MADDEN, LTD. AND SUBSIDIARIES
Notes to Consolidated Financial Statements
December 31, 2017, 2016 and 2015
($ in thousands, except share and per share data)
Note Q - Recent Accounting Pronouncements (continued)
all revenue contracts with customers as well as requires additional financial statement disclosures that will enable users to understand the nature, amount, timing and uncertainty of revenue and cash flows relating to customer contracts. Companies have an option to use either a retrospective approach or cumulative effect adjustment approach to implement the standard. ASU No. 2014-09 is effective for annual reporting periods beginning after December 15, 2017, and the Company plans to adopt the provisions of the new standard in the first quarter of 2018 using the cumulative effect adjustment approach. The Company is utilizing a comprehensive approach to assess the impact of the guidance on each of our operating segments' revenue streams, including assessment of our performance obligations, principal versus agent considerations and variable consideration. Additionally, the Company is evaluating the impact of the new guidance on disclosures, as well as the impact on controls to support the recognition. Based on the foregoing, at the current time the Company does not believe the adoption to have a material impact on its consolidated financial statements as the Company’s current revenue recognition policies are in-line with the principles of the new guidance.
F-37
Exhibit Index
101 | The following materials from Steven Madden, Ltd.'s Annual Report on Form 10-K for the fiscal year ended December 31, 2017, formatted in XBRL (Extensible Business Reporting Language): (i) the Consolidated Balance Sheets, (ii) the Consolidated Statements of Income, (iii) Consolidated Statements of Comprehensive Income, (iv) the Consolidated Statements of Changes in Stockholders' Equity, (v) the Consolidated Statements of Cash Flows, and (vi) Notes to Consolidated Financial Statements, tagged as blocks of text.* |
† | Filed herewith. |
# | Indicates management contract or compensatory plan or arrangement required to be identified pursuant to Item 15(b) of this Annual Report on Form 10-K. |
* | This exhibit shall not be deemed “filed” for purposes of Section 18 of the Securities Exchange Act of 1934, as amended, or otherwise subject to the liability of that section, nor shall it be deemed incorporated by reference into any filing under the Securities Act of 1933, as amended, or the Securities Exchange Act of 1934, as amended, whether made before or after the date hereof and irrespective of any general incorporation language in any filing, except to the extent the Company specifically incorporates it by reference. |
FIRST AMENDMENT TO EQUITY PURCHASE AGREEMENT
THIS FIRST AMENDMENT TO EQUITY PURCHASE AGREEMENT (this “Amendment”) is entered into as of the 21st day of November, 2017, but effective as of the Effective Date (as defined below), by and among Steven Madden, Ltd., a Delaware corporation (“Buyer”), Schwartz & Benjamin, Inc., a New York corporation, B.D.S., Inc., a Delaware corporation, Quinby Ridge Enterprises LLC, a Delaware limited liability company and DANIELBARBARA ENTERPRISES LLC, a New York limited liability company (collectively, the “Companies” and each, individually, a “Company”), each of the Sellers set forth on the signature page hereto under the heading “Sellers” (each a “Seller” and collectively the “Sellers”) and Daniel Schwartz, as designated agent on behalf of the Sellers (the “Seller Representative”) (collectively, the “Parties”).
W I T N E S S E T H:
WHEREAS, the Parties entered into that certain Equity Purchase Agreement, dated January 30, 2017 (the “Agreement”);
WHEREAS, in connection with the transactions contemplated by this Amendment, each of Daniel Schwartz and Barbara Schwartz are executing that certain Separation Agreement and General Release with Schwartz & Benjamin, Inc. pursuant to which such party’s employment with Schwartz & Benjamin, Inc. shall be terminated (each a “Separation Agreement” and together, the “Separation Agreements”); and
WHEREAS, the Parties desire to amend the Agreement as set forth herein.
NOW, THEREFORE, in consideration of the agreements set forth herein and other good and valuable consideration, the receipt and sufficiency of which are hereby acknowledged, the Parties agree as follows:
1. | Defined Terms. All capitalized terms used herein and not expressly defined shall have the meaning given to them in the Agreement. |
2.Effective Date. This Amendment shall not be effective until the first day following the date that (i) the Revocation Period Expiration Date (as defined in Daniel Schwartz’s Separation Agreement) and (ii) the Revocation Period Expiration Date (as defined in Barbara Schwartz’s Separation Agreement) have each expired such that each are final and binding on the parties thereto (the “Effective Date”). For the avoidance of doubt, this Amendment shall not be effective and for clarity, no payments shall be due hereunder (i) if either of Daniel Schwartz or Barbara Schwartz fail to execute his or her Separation Agreement within the Review Period (as defined in the Separation Agreements) or (ii) if either of Daniel Schwartz or Barbara Schwartz exercise his or her right to revoke the Separation Agreement under Section 4(g)(iii) of his or her applicable Separation Agreement. For the avoidance of doubt, in no event shall Buyer or Seller have the right to terminate this Agreement after the date hereof (regardless of whether the Effective Date has occurred); provided, however, that for clarity, except as otherwise provided herein, this Amendment shall not be effective until Effective Date.
3.Modification of Earn-Out Provision. On the Effective Date, Section 2.2 (e) of the Agreement shall be deemed deleted in its entirety and replaced in lieu thereof with the following:
(e) Earnout. Buyer shall pay to the accounts designated in writing by the Seller Representative for the benefit of the Sellers additional consideration in cash as described herein (the “Earn-Out,” with each payment made pursuant to the Earn-Out being an “Earn-Out Payment”) in accordance with the following:
(i)The Sellers shall receive an Earn-Out Payment from Buyer of Ten Million Dollars ($10,000,000), which shall be paid by Buyer as follows: (a) Seven Million Dollars
($7,000,000) no sooner than January 3, 2018 and no later than January 5, 2018 (such date, the “First Payment Date”), (b) Three Million Dollars ($3,000,000) (the “Kate Spade Escrow Amount”) delivered to the Escrow Account as of the Effective Date to be held by the Escrow Agent and released as follows:
(x) if a Termination Notice has not been provided prior to June 30, 2019, to Sellers on June 30, 2019;
(y) if a Termination Notice has been provided prior to June 30, 2019 and termination of the Kate Spade Agreement becomes effective on or prior to December 31, 2020, to the Buyer within three (3) days of the effective date of termination of the Kate Spade Agreement; and
(z) if a Termination Notice has been provided prior to June 30, 2019, but termination of the Kate Spade Agreement does not become effective on or prior to December 31, 2020, to Sellers no later than January 3, 2021.
“Termination Notice” shall mean a notice provided by Kate Spade or any of its Affiliates, of its termination or cancellation of or intent to terminate or cancel the Kate Spade Agreement for any reason effective at any time on or prior to December 31, 2020.
To the extent required, the Escrow Agreement shall be deemed modified by the provisions hereof and Buyer and Seller shall take such actions as are required to effectuate the terms hereof with respect to the Escrow Agent and the Escrow Account, including, without limitation, using reasonable efforts to modify the Escrow Agreement to provide for automatic release of the Kate Spade Escrow Amount to Sellers if release is made pursuant to Section 2.2(e)(i)(x) and Buyer has not provided the Escrow Agent with notice of the Termination Notice prior to June 30, 2019 and by executing any required Joint Direction to the Escrow Agent in order to effectuate the appropriate payment of the Kate Spade Escrow Amount to Buyer or Seller, as applicable.
(ii)Upon the execution by Kate Spade, LLC (“Kate Spade”) and Quinby Ridge Enterprises, LLC (“Quinby”), Buyer or any of Buyer’s Affiliates of an amendment to, renewal of, or substantially similar replacement agreement to, that certain Revised and Restated License Agreement, dated January 1, 2009, between Kate Spade and Quinby, as amended by the Renewal and First Amendment, dated October 5, 2015, the Second Amendment to License Agreement, dated February 25, 2016, the Slipper Amendment to License Agreement, effective April 19, 2016, the Fourth Amendment to the Revised and Restated License Agreement, dated August 18, 2016, the Fifth Amendment to the Revised and Restated License Agreement, dated August 18, 2016, and the Consent and Sixth Amendment to the Agreement, dated as of December 28, 2016 (the “Kate Spade Agreement”), which such amendment or renewal extends the term of the Kate Spade Agreement through December 31, 2021 or later, the Sellers shall receive an Earn-Out Payment from Buyer of Three Million Dollars ($3,000,000).
(iii)Upon the execution by Kate Spade and Quinby, Buyer or any of Buyer’s Affiliates of an amendment to, renewal of, or substantially similar replacement agreement to the Kate Spade Agreement extending the term of the Kate Spade Agreement through December 31, 2022 or later, the Sellers shall receive an Earn-Out Payment from Buyer of Three Million Dollars ($3,000,000).
(iv)For the avoidance of doubt, in no event shall the Earnout Payments to which the Sellers shall be entitled to receive under this Section 2.2(e) exceed Sixteen Million Dollars
($16,000,000) in the aggregate, with the Earnout Payments under Section 2.2(e)(ii) and Section 2.2(e)(iii) not to exceed Six Million Dollars ($6,000,000) in the aggregate.
4.Operation of the Business During the Earn-Out Period. On the Effective Date, Section 5.8 of the Agreement shall be deemed deleted in its entirety.
5.Modification of Defined Terms. On the Effective Date, the definitions of “BA Lines”, “Earn-Out Period”, and “EBITDA”, shall be deemed deleted in their entirety. The definition of “Kate Spade Agreement” shall be deemed deleted in its entirety and replaced in lieu thereof with the following:
“Effective Date” shall mean the Effective Date of that certain First Amendment to this Agreement dated as of November 21, 2017.
“Kate Spade Agreement” has the meaning set forth in Section 2.2(e)(ii).
On the Effective Date, the following definitions shall be added to the Agreement:
“Brand Partners” means Kate Spade, Banana Republic LLC, Joyce Azria, LLC and/or any of their respective Affiliates.
“Brand Partner Services” means, with respect to each Brand Partner, (a) any and all services related to the design, sourcing, marketing, manufacturing, importing, distribution and sale of footwear and (b) any and all other services provided as of the Effective Date to such Brand Partner by Buyer or its Affiliates.
6. | Noncompetition. On the Effective Date, Section 5.6 of the Agreement shall be deemed deleted in its entirety and replaced in lieu thereof with the following: |
5.6 Noncompetition. As an inducement to Buyer to execute and deliver this Agreement and to consummate the transactions contemplated hereby and to preserve the goodwill associated with the Business, for the period commencing on the Closing Date and lasting until December 31, 2022 (the “Non-Compete Period”), the Sellers shall not, and the Sellers shall cause their respective Affiliates not to, directly or indirectly, without the express prior written approval of Buyer:
i.own or control, whether as shareholder, member, partner, director or otherwise, or manage, operate, be employed or compensated by, or consult with, whether as an officer, employee, consultant or otherwise, (a) any Brand Partner for whom Buyer or any of its Affiliates provided any Brand Partner Services during the prior twelve (12) month period and/or (b) any entity that sells to, licenses from, or acts as a private label manufacturer, licensee, footwear provider or acts in any similar capacity for any Brand Partner for whom Buyer or any of its Affiliates provided any Brand Partner Services during the prior twelve (12) month period (each such entity, a “Competitor”);
ii.consult with, advise or assist in any way, whether or not for consideration, any Competitor or Brand Partner for whom Buyer or any of its Affiliates provided any Brand Partner Services during the prior twelve (12) month period, including advertising the products or services of any such Brand Partner or Competitor, or soliciting customers or loaning money or rendering any other form of financial assistance to any such Brand Partner or Competitor;
iii.sell to, license from, or act as a private label manufacturer, licensee, footwear provider or act in any similar capacity for any Brand Partner for whom Buyer or any of its Affiliates provided any Brand Partner Services during the prior twelve (12) month period;
iv.hire Steve Shapiro;
v.solicit employment or engagement as an independent contractor to, any Person who is or was an employee, commissioned salesperson or consultant of, or who
performed similar services for Buyer and/or any of its Affiliates, including the Companies, or assist any third party with respect to any of the foregoing, unless such Person has been separated from his or her employment or other relationship with Buyer and each of its Affiliates (including the Companies) (x) by Buyer or its Affiliate without cause or (y) if otherwise separated, for a period of six (6) consecutive months; provided, however, that any general solicitation not specifically targeted to any Person who is or was an employee, commissioned salesperson or consultant of, or who performed similar services for the Buyer and/or any of its Affiliates, including the Companies, shall not be deemed a violation of this clause (v); or
vi.voluntarily publish or communicate anything disparaging about any of the Companies, Buyer, their respective Affiliates, or their respective officers or directors;
provided, however, that the foregoing shall not prohibit the ownership of not more than five percent (5%) of the securities of any corporation or other entity that is listed on a national securities exchange or traded in the national over-the-counter market. The geographic scope of this covenant not to compete shall extend to the United States and any other country in which the Companies conduct the Business as of the Closing Date, or as the Companies, to the Knowledge of the Companies, plan or anticipate conducting the Business as of the Closing Date. Buyer may sell, assign, or otherwise transfer this covenant not to compete, in whole or in part, to any Person that purchases all or any material portion of the Business only if such Person expressly assumes in writing for the benefit of the Sellers all of the obligations of Buyer under Section 2.2(e) and Section 5.8. Recognizing the specialized nature of the Business, the Sellers acknowledge and agree that the duration, geographic scope and activity restrictions of this covenant not to compete are reasonable.
7. | Release from Escrow Account; Indemnity Release. |
a.Within two (2) Business Days of the First Payment Date, Buyer and the Seller Representative shall give joint written instructions to the Escrow Agent to release from the Escrow Account and deliver (a) to the accounts specified by the Seller Representative, the sum of Five Hundred Thousand Dollars ($500,000) and (b) to the account specified by the Buyer, all other amounts in the Escrow Account (other than the Kate Spade Escrow Amount and any interest earned thereon). Upon release of the Kate Spade Escrow Amount pursuant to the terms hereof, the Escrow agreement shall be deemed terminated.
b.On the Effective Date, Section 6.2 of the Agreement shall be deemed deleted in its entirety and replaced in lieu thereof with the following:
(b) By Buyer
. Upon the terms and subject to the conditions set forth in this Article 6, Buyer shall indemnify and hold harmless the Sellers and their Affiliates, and their respective shareholders, members, managers, directors, officers, employees, agents and other representatives (collectively, the “Seller Indemnified Parties”), from and against all Claims asserted against, resulting to, imposed upon or incurred by any Seller Indemnified Party, directly or indirectly, by reason of or resulting from any breach of any covenant of Buyer contained in or made pursuant to Sections 2.2(e), 2.3 (as it relates solely to Section 2.2(e)), 5.1, 5.2, 5.3, 5.4, 5.7(e) or 5.11 of this Agreement.
c.On the Effective Date, the first sentence of Section 6.5(a) of the Agreement shall be deemed deleted in its entirety and replaced in lieu thereof with the following: “No claim or action shall be brought under Section 6.1(a) for breach of a representations or warranty after November 21, 2017.” For clarity, the other sentences and provisions of Section 6.5(a) (including subsections (i) through (iii)) thereof shall remain in full force and effect in accordance with their terms.
d.On the Effective Date, paragraph 2 of Schedule 6.1 of the Agreement shall be deemed deleted from Schedule 6.1 of the Agreement and Buyer Indemnified Parties shall have no further rights to indemnification with respect thereto pursuant to Article 6 of the Agreement.
e.As of the Effective Date, the Sellers, on behalf of themselves and the other Seller Indemnified Parties hereby irrevocably, knowingly, absolutely and unconditionally release, remise and discharge Buyer and the other Buyer Indemnified Parties (including, for clarity, the Companies) from any and all Claims, whether known or unknown, arising in the past, present or future, arising under or relating to the Purchase Agreement, as amended hereby, other than Claims arising out of Sections 2.2(e), 2.3 (as it relates solely to Section 2.2(e)), 5.1, 5.2, 5.3, 5.4, 5.7(e), 5.11 or Article 6 of the Purchase Agreement or pursuant to this Amendment, which shall survive in accordance with their terms as set forth in the Purchase Agreement (as amended hereby) (collectively, the “Surviving Buyer Covenants”). Sellers hereby represent and warrant that they do not have knowledge of any Claims or potential Claims against Buyer or any other Buyer Indemnified Party under the Surviving Buyer Covenants. For clarity, as of the Effective Date, Buyer and the other Buyer Indemnified Parties shall have no further obligations under the Purchase Agreement, as amended hereby, other than under the Surviving Buyer Covenants (but only for so long as the Surviving Buyer Covenants survive pursuant to the Purchase Agreement). Buyer and Parent hereby represent and warrant that they do not have knowledge of any Claims or potential Claims against Sellers or any other Seller Indemnified Party under the Purchase Agreement.
8.Non-Disparagement. On the Effective Date, the following shall be added as Section 5.11 of the Agreement:
5.11 Buyer Non-Disparagement. During the Non-Compete Period, Buyer shall not and shall cause its Affiliates and each of their respective officers and directors not to voluntarily publish or communicate anything disparaging about any of the Sellers or any of their respective Affiliates.
9. | Allocation of Purchase Price. Seller and Buyer hereby agree that, and acknowledge their previous agreement that, notwithstanding the requirement in Section 5.2(f) of the Agreement that within one hundred twenty (120) days after the Closing, Buyer shall deliver to the Seller Representative the Proposed Allocation Schedule, the Proposed Allocation Schedule delivery date shall be extended such that Buyer shall deliver to the Seller Representative the Proposed Allocation Schedule no later than December 31, 2017. This Section 9 shall be effective notwithstanding the Effective Date or the conditions thereto. |
10.Controlling Agreement. To the extent any provisions contained herein conflict with the Agreement or any other agreements among the Parties, oral or otherwise, the provisions contained herein shall supersede such conflicting provisions contained in the Agreement or other agreements. Except as expressly modified herein, the Parties hereby agree that the Agreement and the Escrow Agreement, and their respective obligations thereunder (including, for the avoidance of doubt the indemnification obligations under Article 6 (except as modified herein)) all remain in full force and effect in accordance with their terms and are hereby reaffirmed and ratified by each such Party.
11.Counterparts, Signatures. This Amendment may be executed in counterparts. Each executed counterpart of this Amendment will constitute an original document and all executed counterparts, together, will constitute the same Agreement. Facsimile and electronic (pdf) signatures shall be valid for all purposes.
[SIGNATURES ON THE FOLLOWING PAGE.]
IN WITNESS WHEREOF, the Parties have executed this Amendment effective the day and year first set forth above.
BUYER STEVEN MADDEN, LTD. By: /s/ Edward R. Rosenfeld Name:Edward R. Rosenfeld Its:Chief Executive Officer |
COMPANIES
Schwartz & Benjamin, Inc.
By: /s/ Steve Shapiro
Name: Steve Shapiro
Title: President and Chief Operating Officer
B.D.S., Inc.
By: /s/ Steve Shapiro
Name: Steve Shapiro
Title: President and Chief Operating Officer
Quinby Ridge Enterprises LLC
By: /s/ Steve Shapiro
Name: Steve Shapiro
Title: President and Chief Operating Officer
DANIELBARBARA ENTERPRISES LLC
By: /s/ Steve Shapiro
Name: Steve Shapiro
Title: President and Chief Operating Officer
SELLERS
Schwartz & Benjamin Holdings Trust
By: /s/ Daniel L. Schwartz
Daniel L. Schwartz, Trustee
DANIEL SCHWARTZ
________________________________
BARBARA L. SCHWARTZ
________________________________
Jake Schwartz Trust under the Daniel Schwartz 2000 Trust Agreement dated May 1, 2000
By: /s/ Barbara Schwartz
Barbara Schwartz, Trustee
Natalie Schwartz Trust under the Daniel Schwartz 2000 Trust Agreement dated May 1, 2000
By: /s/ Barbara Schwartz
Barbara Schwartz, Trustee
SELLER REPRESENTATIVE
DANIEL L. SCHWARTZ
________________________________
4817-9354-0178.13
Exhibit 21.01
SUBSIDIARIES
NAME OF THE SUBSIDIARY | STATE OF INCORPORATION |
Adesso-Madden, Inc. | New York |
BA Brand Holdings LLC | New York |
BAI Holding, LLC | New York |
B.D.S., Inc. | Delaware |
Big Buddha, Inc. | California |
Cejon, Inc. | New Jersey |
Comercial Diecesiette S.A. de C.V. | Mexico |
DANIELBARBARA Enterprises LLC | New York |
Daniel M. Friedman & Associates, Inc. | New York |
Diva Acquisition Corp. | Delaware |
Dolce Vita Holdings, Inc. | Washington |
Madden International Ltd. | Hong Kong |
Maximus Designer Shoes | Mexico |
Quinby Ridge Enterprises LLC | Delaware |
Schwartz & Benjamin, Inc. | New York |
SML Canada Acquisition Corp. | Canada |
SML Holdings S.a.r.l | Luxembourg |
Steven Madden Retail, Inc. | Delaware |
Stevies, Inc. | Delaware |
The Topline Corporation | Washington |
Trendy Imports S.A. de C.V. | Mexico |
EXHIBIT 23.01
CONSENT OF INDEPENDENT REGISTERED PUBLIC ACCOUNTING FIRM
We consent to the incorporation by reference in the Registration Statements of Steven Madden, Ltd. and subsidiaries on Form S-3 (Nos. 333-91127, 333-46441 and 333-59295), Form S-8 (Nos. 333-160520, 333-138584, and 333-184564) of our report dated March 1, 2018, on our audits of the consolidated financial statements as of December 31, 2017 and 2016 and for each of the years in the three-year period ended December 31, 2017, and the effectiveness of Steven Madden, Ltd.'s internal control over financial reporting as of December 31, 2017, which report is included in this Annual Report on Form 10-K.
/S/ EISNERAMPER LLP
New York, New York
March 1, 2018
Exhibit 31.1
CERTIFICATION PURSUANT TO RULE 13a-14(a) OR 15d-14(a) OF THE SECURITIES
EXCHANGE ACT OF 1934, AS ADOPTED PURSUANT TO SECTION 302
OF THE SARBANES-OXLEY ACT OF 2002
I, Edward R. Rosenfeld, certify that:
1. | I have reviewed this Annual Report on Form 10-K of Steven Madden, Ltd.; |
2. | Based on my knowledge, this report does not contain any untrue statement of a material fact or omit to state a material fact necessary to make the statements made, in light of the circumstances under which such statements were made, not misleading with respect to the period covered by this report; |
3. | Based on my knowledge, the financial statements, and other financial information included in this report, fairly present in all material respects the financial condition, results of operations and cash flows of the registrant as of, and for, the periods presented in this report; |
4. | The registrant’s other certifying officer(s) and I are responsible for establishing and maintaining disclosure controls and procedures (as defined in Exchange Act Rules 13a-15(e) and 15d-15(e)) and internal controls over financial reporting (as defined in Exchange Act Rules 13a-15(f) and 15d-15(f)) for the registrant and have: |
(a) | Designed such disclosure controls and procedures, or caused such disclosure controls and procedures to be designed under our supervision, to ensure that material information relating to the registrant, including its consolidated subsidiaries, is made known to us by others within those entities, particularly during the period in which this report is being prepared; |
(b) | Designed such internal control over financial reporting, or caused such internal control over financial reporting to be designed under our supervision, to provide reasonable assurance regarding the reliability of financial reporting and the preparation of financial statements for external purposes in accordance with generally accepted accounting principles; |
(c) | Evaluated the effectiveness of the registrant’s disclosure controls and procedures and presented in this report our conclusions about the effectiveness of the disclosure controls and procedures, as of the end of the period covered by this report based on such evaluation; and |
(d) | Disclosed in this report any change in the registrant’s internal control over financial reporting that occurred during the registrant’s most recent fiscal quarter (the registrant’s fourth fiscal quarter in the case of an annual report) that has materially affected, or is reasonably likely to materially affect, the registrant’s internal control over financial reporting; and |
5. | The registrant’s other certifying officer(s) and I have disclosed, based on our most recent evaluation of internal control over financial reporting, to the registrant’s auditors and the audit committee of the registrant’s board of directors (or persons performing the equivalent functions): |
(a) | All significant deficiencies and material weaknesses in the design or operation of internal control over financial reporting which are reasonably likely to adversely affect the registrant's ability to record, process, summarize and report financial information; and |
(b) | Any fraud, whether or not material, that involves management or other employees who have a significant role in the registrant’s internal control over financial reporting. |
/s/ EDWARD R. ROSENFELD |
Edward R. Rosenfeld |
Chairman and Chief Executive Officer |
March 1, 2018 |
Exhibit 31.2
CERTIFICATION PURSUANT TO RULE 13a-14(a) OR 15d-14(a) OF THE SECURITIES
EXCHANGE ACT OF 1934, AS ADOPTED PURSUANT TO SECTION 302
OF THE SARBANES-OXLEY ACT OF 2002
I, Arvind Dharia, certify that:
1. | I have reviewed this Annual Report on Form 10-K of Steven Madden, Ltd.; |
2. | Based on my knowledge, this report does not contain any untrue statement of a material fact or omit to state a material fact necessary to make the statements made, in light of the circumstances under which such statements were made, not misleading with respect to the period covered by this report; |
3. | Based on my knowledge, the financial statements, and other financial information included in this report, fairly present in all material respects the financial condition, results of operations and cash flows of the registrant as of, and for, the periods presented in this report; |
4. | The registrant’s other certifying officer(s) and I are responsible for establishing and maintaining disclosure controls and procedures (as defined in Exchange Act Rules 13a-15(e) and 15d-15(e)) and internal controls over financial reporting (as defined in Exchange Act Rules 13a-15(f) and 15d-15(f)) for the registrant and have: |
(a) | Designed such disclosure controls and procedures, or caused such disclosure controls and procedures to be designed under our supervision, to ensure that material information relating to the registrant, including its consolidated subsidiaries, is made known to us by others within those entities, particularly during the period in which this report is being prepared; |
(b) | Designed such internal control over financial reporting, or caused such internal control over financial reporting to be designed under our supervision, to provide reasonable assurance regarding the reliability of financial reporting and the preparation of financial statements for external purposes in accordance with generally accepted accounting principles; |
(c) | Evaluated the effectiveness of the registrant’s disclosure controls and procedures and presented in this report our conclusions about the effectiveness of the disclosure controls and procedures, as of the end of the period covered by this report based on such evaluation; and |
(d) | Disclosed in this report any change in the registrant’s internal control over financial reporting that occurred during the registrant’s most recent fiscal quarter (the registrant’s fourth fiscal quarter in the case of an annual report) that has materially affected, or is reasonably likely to materially affect, the registrant’s internal control over financial reporting; and |
5.The registrant’s other certifying officer(s) and I have disclosed, based on our most recent evaluation of internal control over financial reporting, to the registrant’s auditors and the audit committee of the registrant’s board of directors (or persons performing the equivalent functions):
(a) | All significant deficiencies and material weaknesses in the design or operation of internal control over financial reporting which are reasonably likely to adversely affect the registrant’s ability to record, process, summarize and report financial information; and |
(b) | Any fraud, whether or not material, that involves management or other employees who have a significant role in the registrant’s internal control over financial reporting. |
/s/ ARVIND DHARIA |
Arvind Dharia |
Chief Financial Officer and Chief Accounting Officer |
March 1, 2018 |
Exhibit 32.1
CERTIFICATION PURSUANT TO
18 U.S.C. SECTION 1350
ADOPTED PURSUANT TO
SECTION 906 OF THE SARBANES-OXLEY ACT OF 2002
In connection with the Annual Report of Steven Madden, Ltd. (the “Company”) on Form 10-K for the year ended December 31, 2017, as filed with the Securities and Exchange Commission on the date hereof (the “Report”), I, Edward R. Rosenfeld, Chairman and Chief Executive Officer of the Company, certify, pursuant to 18 U.S.C. Section 1350, as adopted pursuant to Section 906 of the Sarbanes-Oxley Act of 2002, that to my knowledge:
(1) | The Report fully complies with the requirements of Section 13(a) or 15(d) of the Securities Exchange Act of 1934; and |
(2) | The information contained in the Report fairly presents, in all material respects, the financial condition and results of operations of the Company. |
/s/ EDWARD R. ROSENFELD |
Edward R. Rosenfeld |
Chairman and Chief Executive Officer |
March 1, 2018 |
Exhibit 32.2
CERTIFICATION PURSUANT TO
18 U.S.C. SECTION 1350
ADOPTED PURSUANT TO
SECTION 906 OF THE SARBANES-OXLEY ACT OF 2002
In connection with the Annual Report of Steven Madden, Ltd. (the “Company”) on Form 10-K for the year ended December 31, 2017, as filed with the Securities and Exchange Commission on the date hereof (the “Report”), I, Arvind Dharia, Chief Financial Officer and Chief Accounting Officer of the Company, certify, pursuant to 18 U.S.C. Section 1350, as adopted pursuant to Section 906 of the Sarbanes-Oxley Act of 2002, that to my knowledge:
(1) | The Report fully complies with the requirements of Section 13(a) or 15(d) of the Securities Exchange Act of 1934; and |
(2) | The information contained in the Report fairly presents, in all material respects, the financial condition and results of operations of the Company. |
/s/ ARVIND DHARIA |
Arvind Dharia |
Chief Financial Officer and Chief Accounting Officer |
March 1, 2018 |
Steve Madden Announces Fourth Quarter and Full Year 2017 Results and Provides Initial Fiscal Year 2018 Sales and EPS Guidance
~ Announces Initiation of Quarterly Cash Dividend ~
LONG ISLAND CITY, N.Y., February 27, 2018 - Steve Madden (Nasdaq: SHOO), a leading designer and marketer of fashion footwear and accessories for women, men and children, today announced financial results for the fourth quarter ended December 31, 2017 and provided initial fiscal year 2018 sales and EPS guidance.
Amounts referred to as “Adjusted” exclude the items that are described under the heading “Non-GAAP Adjustments.”
For the Fourth Quarter 2017:
• | Net sales increased 8.3% to $364.4 million compared to $336.4 million in the same period of 2016. |
• | Gross margin was 38.4%. Adjusted gross margin was 38.1% as compared to 38.7% in the same period last year, a decrease of 60 basis points. |
• | Operating expenses as a percentage of sales were 30.3%. Adjusted operating expenses as a percentage of sales were 29.0% as compared to 27.4% of sales in the same period of 2016. |
• | Operating income totaled $31.7 million, or 8.7% of net sales. Adjusted operating income was $36.3 million, or 10.0% of net sales, compared with operating income of $39.6 million, or 11.8% of net sales, in the same period of 2016. |
• | Net income was $24.6 million, or $0.43 per diluted share. Adjusted net income was $27.5 million, or $0.48 per diluted share, compared to $28.7 million, or $0.49 per diluted share, in the prior year's fourth quarter. |
Edward Rosenfeld, Chairman and Chief Executive Officer, commented, “We are pleased to have achieved Adjusted diluted EPS at the high end of our guidance range for the fourth quarter of 2017. The solid performance in Q4 capped a strong year for the Company, with double-digit percentage growth in both net sales and Adjusted diluted EPS driven by the outstanding performance of our flagship Steve Madden brand in the wholesale channel.
In addition, we are also pleased to announce that the Board of Directors has just approved the initiation of a quarterly cash dividend, reflecting our confidence in the Company’s long-term prospects and cash flow generation as well as our commitment to delivering value to our shareholders. The dividend complements continued investments in our brands, acquisitions and share repurchases.”
Fourth Quarter 2017 Segment Results
Net sales for the wholesale business increased 10.6% to $278.2 million in the fourth quarter of 2017. Excluding the results of Schwartz & Benjamin, acquired in January 2017, wholesale net sales increased 2.5% to $257.9 million from $251.5 million in the fourth quarter of 2016, as an increase in the wholesale footwear business was partially offset by a decline in wholesale accessories. Gross margin in the wholesale business was 30.6%. Adjusted gross margin in the wholesale business
was 31.0% compared to 31.4% in last year’s fourth quarter, driven by the inclusion of the lower-margin Schwartz & Benjamin business.
Retail net sales in the fourth quarter increased 1.5% to $86.2 million compared to $84.9 million in the fourth quarter of the prior year. Same store sales decreased 5.1% in the quarter compared to a 1.1% same store sales increase in the fourth quarter of 2016. Retail gross margin increased to 60.8% in the fourth quarter of 2017 as compared to 60.5% in the fourth quarter of the prior year.
During the fourth quarter, the Company opened one full price store and one outlet store in the U.S. as well as two full price stores in international markets. The Company ended the quarter with 206 company-operated retail locations, including four Internet stores. In addition, during the fourth quarter, the Company opened six concessions in Asia and ended the quarter with 38 company-operated concessions in international markets.
The Company’s effective tax rate for the fourth quarter of 2017 was 23.2%. On an Adjusted basis, the effective tax rate was 24.9% compared to 28.5% in the fourth quarter of the prior year, due primarily to the impact of the year-over-year benefit resulting from the exercising and vesting of share based awards.
Full Year Ended December 31, 2017
For the full year ended December 31, 2017, net sales increased 10.5% to $1.55 billion from $1.40 billion in the prior year.
Net income was $117.9 million, or $2.04 per diluted share, for the year ended December 31, 2017. On an Adjusted basis, net income was $129.3 million, or $2.24 per diluted share, for the year ended December 31, 2017, compared to net income of $120.9 million, or $2.03 per diluted share, for the year ended December 31, 2016.
Balance Sheet and Cash Flow
During the fourth quarter of 2017, the Company repurchased 639,162 shares of the Company’s common stock for approximately $26.2 million, which includes shares acquired through the net settlement of employee stock awards.
As of December 31, 2017, cash, cash equivalents, and current and non-current marketable securities totaled $274.8 million.
Initiation of Quarterly Cash Dividend
The Board of Directors of the Company has approved the initiation of a quarterly cash dividend, the first quarterly dividend since the Company went public in December 1993. The initial quarterly dividend of $0.20 per share is payable on March 29, 2018 to stockholders of record as of the close of business on March 12, 2018.
The declaration and payment of future dividends, as well as the amount thereof, will be at the discretion of the Board of Directors and will be dependent upon, among other things, the company's
financial position, results of operations, cash flow and other factors. There can be no assurance that the Company will declare and pay dividends in future periods.
Company Outlook
For fiscal year 2018, the Company expects net sales will increase 5% to 7% over net sales in 2017. The Company expects diluted EPS for fiscal year 2018 will be in the range of $2.60 to $2.67.
Non-GAAP Adjustments
Amounts referred to as “Adjusted” exclude the items below.
For the fourth quarter 2017:
• | $1.1 million pre-tax ($0.7 million after-tax) non-cash benefit associated with the purchase accounting fair value adjustment of inventory acquired in the Schwartz & Benjamin acquisition, included in cost of sales. |
• | $11.8 million pre-tax ($7.5 million after-tax) expense in connection with a provision for legal and early lease termination charges, included in operating expenses. |
• | $10.2 million pre-tax ($6.4 million after-tax) benefit in connection with a post-closing amendment to the equity purchase agreement relating to the Schwartz & Benjamin acquisition, included in operating expenses. |
• | $2.4 million pre-tax ($1.5 million after-tax) expense in connection with the integration of the Schwartz & Benjamin acquisition and the related restructuring, included in operating expenses. |
• | $2.7 million pre-tax ($1.7 million after-tax) non-cash expense associated with the impairment of the preferred interest investment in Brian Atwood Italia Holding LLC, included in operating expenses. |
• | $2.0 million pre-tax ($1.7 million after-tax) benefit related to an adjustment to estimated bad debt expense associated with the Payless ShoeSource bankruptcy, included in operating expenses. |
• | $1.0 million pre-tax ($0.6 million after-tax) non-cash expense associated with the impairment of the Wild Pair trademark. |
• | $0.5 million tax expense resulting from the Tax Cuts and Jobs Act transition tax and audit adjustments. |
For the fiscal year 2017:
• | $0.6 million pre-tax ($0.4 million after-tax) non-cash expense associated with the purchase accounting fair value adjustment of inventory acquired in the Schwartz & Benjamin acquisition, included in cost of sales. |
• | $11.8 million pre-tax ($7.5 million after-tax) expense in connection with a provision for legal and early lease termination charges, included in operating expenses. |
• | $10.2 million pre-tax ($6.4 million after-tax) benefit in connection with a post-closing amendment to the equity purchase agreement relating to the Schwartz & Benjamin acquisition, included in operating expenses. |
• | $3.6 million pre-tax ($2.3 million after-tax) expense in connection with the integration of the Schwartz & Benjamin acquisition and the related restructuring, included in operating expenses. |
• | $2.7 million pre-tax ($1.7 million after-tax) non-cash expense associated with the impairment of the preferred interest investment in Brian Atwood Italia Holding LLC, included in operating expenses. |
• | $5.5 million pre-tax ($4.8 million after-tax) bad debt expense associated with the Payless ShoeSource bankruptcy, included in operating expenses. |
• | $1.0 million pre-tax ($0.6 million after-tax) non-cash expense associated with the impairment of the Wild Pair trademark. |
• | $0.5 million tax expense resulting from the Tax Cuts and Jobs Act transition tax and audit adjustments. |
Reconciliations of amounts on a GAAP basis to Adjusted amounts are presented in the Non-GAAP Reconciliation tables at the end of this release and identify and quantify all excluded items.
Conference Call Information
Interested stockholders are invited to listen to the fourth quarter earnings conference call scheduled for today, February 27, 2018, at 8:30 a.m. Eastern Time. The call will be broadcast live over the Internet and can be accessed by logging onto http://www.stevemadden.com. An online archive of the broadcast will be available within one hour of the conclusion of the call and will be accessible for a period of 30 days following the call. Additionally, a replay of the call can be accessed by dialing 1-844-512-2921 (U.S.) and 1-412-317-6671 (international), passcode 1281785, and will be available until March 27, 2018.
About Steve Madden
Steve Madden designs, sources and markets fashion-forward footwear and accessories for women, men and children. In addition to marketing products under its own brands including Steve Madden®, Dolce Vita®, Betsey Johnson®, Report®, Big Buddha®, Brian Atwood®, Cejon®, Blondo® and Mad Love®, Steve Madden is a licensee of various brands, including Kate Spade®, Superga® and Avec Les Filles®. Steve Madden also designs and sources products under private label brand names for various retailers. Steve Madden's wholesale distribution includes department stores, specialty stores, luxury retailers, national chains and mass merchants. Steve Madden also operates 206 retail stores (including Steve Madden's four Internet stores). Steve Madden licenses certain of its brands to third parties for the marketing and sale of certain products, including for ready-to-wear, outerwear, intimate apparel, eyewear, hosiery, jewelry, fragrance, luggage and bedding and bath products. For local store information and the latest Steve Madden booties, pumps, men’s and women’s boots, dress shoes, sandals and more, visit http://www.stevemadden.com.
Safe Harbor
This press release and oral statements made from time to time by representatives of the Company contain certain “forward looking statements” as that term is defined in the federal securities laws.
The events described in forward looking statements may not occur. Generally, these statements relate to business plans or strategies, projected or anticipated benefits or other consequences of the Company's plans or strategies, projected or anticipated benefits from acquisitions to be made by the Company, or projections involving anticipated revenues, earnings or other aspects of the Company's operating results. The words "may," "will," "expect," "believe," "anticipate," "project," "plan," "intend," "estimate," and "continue," and their opposites and similar expressions are intended to identify forward looking statements. The Company cautions you that these statements concern current expectations about the Company’s future results and condition and are not guarantees of future performance or events and are subject to a number of uncertainties, risks and other influences, many of which are beyond the Company's control, that may influence the accuracy of the statements and the projections upon which the statements are based. Factors which may affect the Company's results include, but are not limited to, the risks and uncertainties discussed in the Company's Annual Report on Form 10-K, Quarterly Reports on Form 10-Q and Current Reports on Form 8-K filed with the Securities and Exchange Commission. Any one or more of these uncertainties, risks and other influences could materially affect the Company's results of operations and financial condition and whether forward looking statements made by the Company ultimately prove to be accurate and, as such, the Company's actual results, performance and achievements could differ materially from those expressed or implied in these forward looking statements. The Company undertakes no obligation to publicly update or revise any forward looking statements, whether as a result of new information, future events or otherwise.
STEVEN MADDEN, LTD. AND SUBSIDIARIES
CONDENSED CONSOLIDATED STATEMENT OF OPERATIONS DATA
(In thousands, except per share amounts)
Three Months Ended | Twelve Months Ended | ||||||||||||||
December 31, 2017 | December 31, 2016 | December 31, 2017 | December 31, 2016 | ||||||||||||
Net sales | $ | 364,370 | $ | 336,408 | $ | 1,546,098 | $ | 1,399,551 | |||||||
Cost of sales | 224,634 | 206,180 | 968,357 | 877,568 | |||||||||||
Gross profit | 139,736 | 130,228 | 577,741 | 521,983 | |||||||||||
Commission and licensing fee income, net | 3,421 | 1,529 | 14,259 | 11,788 | |||||||||||
Operating expenses | 110,490 | 92,117 | 421,216 | 364,595 | |||||||||||
Impairment charges | 1,000 | — | 1,000 | — | |||||||||||
Income from operations | 31,667 | 39,640 | 169,784 | 169,176 | |||||||||||
Interest and other income, net | 587 | 707 | 2,543 | 1,824 | |||||||||||
Income before provision for income taxes | 32,254 | 40,347 | 172,327 | 171,000 | |||||||||||
Provision for income taxes | 7,486 | 11,514 | 53,189 | 49,726 | |||||||||||
Net income | 24,768 | 28,833 | 119,138 | 121,274 | |||||||||||
Net income attributable to noncontrolling interest | 171 | 85 | 1,190 | 363 | |||||||||||
Net income attributable to Steven Madden, Ltd. | $ | 24,597 | $ | 28,748 | $ | 117,948 | $ | 120,911 | |||||||
Basic income per share | $ | 0.45 | $ | 0.51 | $ | 2.14 | $ | 2.12 | |||||||
Diluted income per share | $ | 0.43 | $ | 0.49 | $ | 2.04 | $ | 2.03 | |||||||
Basic weighted average common shares outstanding | 54,759 | 56,428 | 55,157 | 57,109 | |||||||||||
Diluted weighted average common shares outstanding | 57,641 | 58,902 | 57,830 | 59,556 | |||||||||||
STEVEN MADDEN, LTD. AND SUBSIDIARIES
CONDENSED CONSOLIDATED BALANCE SHEET DATA
(In thousands)
As of | |||||||
December 31, 2017 | December 31, 2016 | ||||||
(Unaudited) | |||||||
Cash and cash equivalents | $ | 181,214 | $ | 126,115 | |||
Marketable securities (current & non current) | 93,550 | 110,054 | |||||
Accounts receivables, net | 240,909 | 200,958 | |||||
Inventories | 110,324 | 119,824 | |||||
Other current assets | 49,044 | 42,279 | |||||
Property and equipment, net | 71,498 | 72,381 | |||||
Goodwill and intangibles, net | 299,842 | 280,097 | |||||
Other assets | 10,780 | 9,167 | |||||
Total assets | $ | 1,057,161 | $ | 960,875 | |||
Accounts payable | $ | 66,955 | $ | 80,584 | |||
Contingent payment liability (current & non current) | 10,000 | 7,948 | |||||
Other current liabilities | 132,657 | 94,595 | |||||
Other long term liabilities | 38,617 | 36,676 | |||||
Total Steven Madden, Ltd. stockholders' equity | 802,821 | 740,867 | |||||
Noncontrolling interest | 6,111 | 205 | |||||
Total liabilities and stockholders' equity | $ | 1,057,161 | $ | 960,875 | |||
STEVEN MADDEN, LTD. AND SUBSIDIARIES
CONDENSED CONSOLIDATED CASH FLOW DATA
(In thousands)
Twelve Months Ended | |||||||
December 31, 2017 | December 31, 2016 | ||||||
Net cash provided by operating activities | $ | 157,935 | $ | 153,604 | |||
Investing Activities | |||||||
Purchases of property and equipment | (14,775 | ) | (15,897 | ) | |||
Sales of marketable securities, net | 17,932 | 11,764 | |||||
Repayment of notes receivable | 221 | 249 | |||||
Acquisition, net of cash acquired | (16,795 | ) | — | ||||
Net cash used in investing activities | (13,417 | ) | (3,884 | ) | |||
Financing Activities | |||||||
Common stock share repurchases for treasury | (99,412 | ) | (86,005 | ) | |||
Purchase of noncontrolling interest | — | (3,759 | ) | ||||
Payment of contingent liability | (7,359 | ) | (16,402 | ) | |||
Proceeds from exercise of stock options | 16,433 | 10,713 | |||||
Net cash used in financing activities | (90,338 | ) | (95,453 | ) | |||
Effect of exchange rate changes on cash and cash equivalents | 919 | (566 | ) | ||||
Net increase in cash and cash equivalents | 55,099 | 53,701 | |||||
Cash and cash equivalents - beginning of period | 126,115 | 72,414 | |||||
Cash and cash equivalents - end of period | $ | 181,214 | $ | 126,115 | |||
STEVEN MADDEN, LTD. AND SUBSIDIARIES
NON-GAAP RECONCILIATION
(In thousands, except per share amounts)
(Unaudited)
The Company uses non-GAAP financial information to evaluate its operating performance and in order to represent the manner in which the Company conducts and views its business. Additionally, the Company believes the information assists investors in comparing the Company's performance across reporting periods on a consistent basis by excluding items that are not indicative of its core business. The non-GAAP financial information is provided in addition to, and not as an alternative to, the Company’s reported results prepared in accordance with GAAP.
Table 1 - Reconciliation of GAAP gross profit to Adjusted gross profit | |||||||
Three Months Ended | Twelve Months Ended | ||||||
December 31, 2017 | December 31, 2016 | ||||||
Consolidated | |||||||
GAAP gross profit | $ | 139,736 | $ | 577,741 | |||
Non-cash (benefit)/expense associated with the purchase accounting fair value adjustment adjustment of inventory acquired in the Schwartz & Benjamin acquisition | (1,060 | ) | 591 | ||||
Adjusted gross profit | $ | 138,676 | $ | 578,332 | |||
Wholesale | |||||||
GAAP gross profit | $ | 87,379 | $ | 413,096 | |||
Non-cash (benefit)/expense associated with the purchase accounting fair value adjustment adjustment of inventory acquired in the Schwartz & Benjamin acquisition | (1,060 | ) | 591 | ||||
Adjusted gross profit | $ | 86,319 | $ | 413,687 | |||
Table 2 - Reconciliation of GAAP operating expenses to Adjusted operating expenses | |||||||
Three Months Ended | Twelve Months Ended | ||||||
December 31, 2017 | December 31, 2016 | ||||||
GAAP operating expenses | $ | 110,490 | $ | 421,216 | |||
Expense in connection with provision for legal and early lease termination charges | (11,836 | ) | (11,836 | ) | |||
Benefit in connection with a post-closing amendment to the equity purchase agreement relating to the Schwartz & Benjamin acquisition | 10,215 | 10,215 | |||||
Expense in connection with the integration of the Schwartz & Benjamin acquisition and the related restructuring | (2,384 | ) | (3,639 | ) | |||
Impairment of preferred interest investment in Brian Atwood Italia Holding LLC | (2,700 | ) | (2,700 | ) | |||
Bad debt benefit/(expense) associated with the Payless ShoeSource bankruptcy | 2,030 | (5,470 | ) | ||||
Adjusted operating expenses | $ | 105,815 | $ | 407,786 | |||
Table 3 - Reconciliation of GAAP operating income to Adjusted operating income | |||||||
Three Months Ended | Twelve Months Ended | ||||||
December 31, 2017 | December 31, 2016 | ||||||
GAAP operating income | $ | 31,667 | $ | 169,784 | |||
Non-cash (benefit)/expense associated with the purchase accounting fair value adjustment adjustment of inventory acquired in the Schwartz & Benjamin acquisition | (1,060 | ) | 591 | ||||
Expense in connection with provision for legal and early lease termination charges | 11,836 | 11,836 | |||||
Benefit in connection with a post-closing amendment to the equity purchase agreement relating to the Schwartz & Benjamin acquisition | (10,215 | ) | (10,215 | ) | |||
Expense in connection with the integration of the Schwartz & Benjamin acquisition and the related restructuring | 2,384 | 3,639 | |||||
Impairment of preferred interest investment in Brian Atwood Italia Holding LLC | 2,700 | 2,700 | |||||
Bad debt (benefit)/expense associated with the Payless ShoeSource bankruptcy | (2,030 | ) | 5,470 | ||||
Impairment of Wild Pair Trademark | 1,000 | 1,000 | |||||
Adjusted operating income | $ | 36,282 | $ | 184,805 | |||
Table 4 - Reconciliation of GAAP provision for income taxes to Adjusted provision for income taxes | |||||||
Three Months Ended | Twelve Months Ended | ||||||
December 31, 2017 | December 31, 2016 | ||||||
GAAP provision for income taxes | $ | 7,486 | $ | 53,189 | |||
Tax effect of non-cash (benefit)/expense associated with the purchase accounting fair value adjustment of inventory acquired in the Schwartz & Benjamin acquisition | (390 | ) | 189 | ||||
Tax effect of expense in connection with provision for legal and early lease termination charges | 4,379 | 4,379 | |||||
Tax effect of benefit in connection with a post-closing amendment to the equity purchase agreement relating to the Schwartz & Benjamin acquisition | (3,780 | ) | (3,780 | ) | |||
Tax effect of expense in connection with the integration of the Schwartz & Benjamin acquisition and the related restructuring | 882 | 1,346 | |||||
Tax effect of impairment of preferred interest investment in Brian Atwood Italia Holding LLC | 999 | 999 | |||||
Tax effect of bad debt (benefit)/expense associated with the Payless ShoeSource bankruptcy | (293 | ) | 671 | ||||
Tax effect of impairment of Wild Pair Trademark | 370 | 370 | |||||
Tax expense resulting from the Tax Cuts and Jobs Act transition tax and audit adjustments | (463 | ) | (463 | ) | |||
Adjusted provision for income taxes | $ | 9,191 | $ | 56,901 | |||
Table 5 - Reconciliation of GAAP net income to Adjusted net income | |||||||
Three Months Ended | Twelve Months Ended | ||||||
December 31, 2017 | December 31, 2016 | ||||||
GAAP net income attributable to Steven Madden, Ltd. | $ | 24,597 | $ | 117,948 | |||
After-tax impact of non-cash (benefit)/expense associated with the purchase accounting fair value adjustment of inventory acquired in the Schwartz & Benjamin acquisition | (670 | ) | 402 | ||||
After-tax impact of expense in connection with provision for legal and early lease termination charges | 7,457 | 7,457 | |||||
After-tax impact of benefit in connection with a post-closing amendment to the equity purchase agreement relating to the Schwartz & Benjamin acquisition | (6,435 | ) | (6,435 | ) | |||
After-tax impact of expense in connection with the integration of the Schwartz & Benjamin acquisition and the related restructuring | 1,502 | 2,293 | |||||
After-tax impact of impairment of preferred interest investment in Brian Atwood Italia Holding LLC | 1,701 | 1,701 | |||||
After-tax impact of bad debt (benefit)/expense associated with the Payless ShoeSource bankruptcy | (1,737 | ) | 4,799 | ||||
After-tax impact of impairment of Wild Pair Trademark | 630 | 630 | |||||
Tax expense resulting from the Tax Cuts and Jobs Act transition tax and audit adjustments | 463 | 463 | |||||
Adjusted net income attributable to Steven Madden, Ltd. | $ | 27,507 | $ | 129,257 | |||
GAAP diluted income per share | $ | 0.43 | $ | 2.04 | |||
Adjusted diluted income per share | $ | 0.48 | $ | 2.24 | |||
Contact
ICR, Inc.
Investor Relations
Jean Fontana/Megan Crudele
203-682-8200
www.icrinc.com