
Form 10-K BUCKEYE PARTNERS, L.P. For: Dec 31
UNITED STATES SECURITIES AND EXCHANGE COMMISSION
Washington, D.C. 20549
______________________________________________________
FORM 10-K
______________________________________________________
(Mark One)
ý Annual Report Pursuant to Section 13 or 15(d) of the Securities Exchange Act of 1934
For the fiscal year ended December 31, 2017
Or
o Transition Report Pursuant to Section 13 or 15(d) of the Securities Exchange Act of 1934
For the transition period from to
Commission file number 1-9356
______________________________________________________
Buckeye Partners, L.P.
(Exact name of registrant as specified in its charter)
_____________________________________________________________________________
Delaware | 23-2432497 | |
(State or other jurisdiction of incorporation or organization) | (IRS Employer Identification number) | |
One Greenway Plaza | ||
Suite 600 | ||
Houston, TX | 77046 | |
(Address of principal executive offices) | (Zip Code) | |
Registrant’s telephone number, including area code: (832) 615-8600
Securities registered pursuant to Section 12(b) of the Act:
Title of each class | Name of each exchange on which registered | |
Limited partner units representing limited partnership interests | New York Stock Exchange | |
Securities registered pursuant to Section 12(g) of the Act: None
Indicate by check mark if the registrant is a well-known seasoned issuer, as defined in Rule 405 of the Securities Act. Yes ý No o
Indicate by check mark if the registrant is not required to file reports pursuant to Section 13 or Section 15(d) of the Act. Yes o No ý
Indicate by check mark whether the registrant (1) has filed all reports required to be filed by Section 13 or 15(d) of the Securities Exchange Act of 1934 during the preceding 12 months (or for such shorter period that the Registrant was required to file such reports), and (2) has been subject to such filing requirements for the past 90 days. Yes ý No o
Indicate by check mark whether the registrant has submitted electronically and posted on its corporate website, if any, every Interactive Date File required to be submitted and posted pursuant to Rule 405 of Regulation S-T (232.405 of this chapter) during the preceding 12 months (or for such shorter period that the registrant was required to submit and post such files). Yes ý No o
Indicate by check mark if disclosure of delinquent filers pursuant to Item 405 of Regulation S-K is not contained herein, and will not be contained, to the best of registrant’s knowledge, in definitive proxy or information statements incorporated by reference in Part III of this Form 10-K or any amendment to this Form 10-K. ý
Indicate by check mark whether the registrant is a large accelerated filer, an accelerated filer, a non-accelerated filer, or a smaller reporting company. See the definitions of “large accelerated filer,” “accelerated filer” and “smaller reporting company” in Rule 12b-2 of the Exchange Act. (Check one):
Large accelerated filer x | Accelerated filer o | Non-accelerated filer o | Smaller reporting company o | |||
(Do not check if a smaller reporting company) | ||||||
Emerging growth company o | ||||||
If an emerging growth company, indicate by check mark if the registrant has elected not to use the extended transition period for complying with any new or revised financial accounting standards provided pursuant to Section 13(a) of the Exchange Act. ¨
Indicate by check mark whether the registrant is a shell company (as defined in Rule 12b-2 of the Act). Yes o No ý
At June 30, 2017, the aggregate market value of the registrant’s limited partner units held by non-affiliates was $9.0 billion. The calculation of such market value should not be construed as an admission or conclusion by the registrant that any person is in fact an affiliate of the registrant.
As of February 16, 2018, there were 146,931,979 limited partner units outstanding.
DOCUMENTS INCORPORATED BY REFERENCE
Portions of the registrant’s Proxy Statement being prepared for the solicitation of proxies in connection with the 2018 Annual Meeting of Limited Partners are incorporated by reference in Part III of this Form 10-K.
TABLE OF CONTENTS
Page | ||
CAUTIONARY NOTE REGARDING FORWARD-LOOKING STATEMENTS
The information contained in this Annual Report on Form 10-K (this “Report”) includes “forward-looking statements.” All statements that express belief, expectation, estimates or intentions, as well as those that are not statements of historical facts, are forward-looking statements. Such statements use forward-looking words such as “proposed,” “anticipate,” “project,” “potential,” “could,” “should,” “continue,” “estimate,” “expect,” “may,” “believe,” “will,” “plan,” “seek,” “outlook” and other similar expressions that are intended to identify forward-looking statements, although some forward-looking statements are expressed differently. These statements discuss future expectations and contain projections. Specific factors that could cause actual results to differ from those in the forward-looking statements include, but are not limited to: (i) changes in federal, state, local and foreign laws or regulations to which we are subject, including those governing pipeline tariff rates and those that permit the treatment of us as a partnership for federal income tax purposes; (ii) terrorism and other security risks, including cyber risk, adverse weather conditions, including hurricanes, environmental releases and natural disasters; (iii) changes in the marketplace for our products or services, such as increased competition, changes in product flows, better energy efficiency or general reductions in demand; (iv) adverse regional, national, or international economic conditions, adverse capital market conditions and adverse political developments; (v) shutdowns or interruptions at our pipeline, terminalling, storage and processing assets or at the source points for the products we transport, store or sell; (vi) unanticipated capital expenditures in connection with the construction, repair or replacement of our assets; (vii) volatility in the price of liquid petroleum products; (viii) nonpayment or nonperformance by our customers; (ix) our ability to integrate acquired assets with our existing assets and to realize anticipated cost savings and other efficiencies and benefits; and (x) our ability to successfully complete our organic growth projects and to realize the anticipated financial benefits. These factors are not necessarily all of the important factors that could cause actual results to differ materially from those expressed in any of our forward-looking statements. Other known or unpredictable factors could also have material adverse effects on future results. Consequently, all of the forward-looking statements made in this document are qualified by these cautionary statements, and we cannot assure you that actual results or developments that we anticipate will be realized or, even if substantially realized, will have the expected consequences to or effect on us or our business or operations. Also note that we provide additional cautionary discussion of risks and uncertainties under the captions “Risk Factors” and in “Management’s Discussion and Analysis of Financial Condition and Results of Operations” and elsewhere in this Report.
The forward-looking statements contained in this Report speak only as of the date hereof. Although the expectations in the forward-looking statements are based on our current beliefs and expectations, caution should be taken not to place undue reliance on any such forward-looking statements because such statements speak only as of the date hereof. Except as required by federal and state securities laws, we undertake no obligation to publicly update or revise any forward-looking statements, whether as a result of new information, future events or any other reason. All forward-looking statements attributable to us or any person acting on our behalf are expressly qualified in their entirety by the cautionary statements contained or referred to in this Report and in our future periodic reports filed with the U.S. Securities and Exchange Commission (“SEC”). In light of these risks, uncertainties and assumptions, the forward-looking events discussed in this Report may not occur.
PART I
Item 1. Business
Introduction
The original Buckeye Pipe Line Company was founded in 1886 as part of the Standard Oil Company (“Standard Oil”) and became a publicly owned, independent company after the dissolution of Standard Oil in 1911. Expansion into petroleum products transportation after World War II and subsequent acquisitions thereafter ultimately led to Buckeye Pipe Line Company becoming a leading independent common carrier pipeline. In 1964, Buckeye Pipe Line Company was acquired by a subsidiary of the Pennsylvania Railroad, which later became the Penn Central Corporation. In 1986, Buckeye Pipe Line Company was reorganized into a master limited partnership (“MLP”), Buckeye Partners, L.P. We are a publicly traded Delaware master limited partnership, and our limited partnership units representing limited partner interests (“LP Units”) are listed on the New York Stock Exchange (“NYSE”) under the ticker symbol “BPL.” Buckeye GP LLC (“Buckeye GP”) is our general partner. Unless the context requires otherwise, references to “we,” “us,” “our,” the “Partnership” or “Buckeye” are intended to mean the business and operations of Buckeye Partners, L.P. and its consolidated subsidiaries.
We own and operate, or own a significant interest in, a diversified global network of integrated assets providing midstream logistic solutions, primarily consisting of the transportation, storage, processing and marketing of liquid petroleum products. We are one of the largest independent liquid petroleum products pipeline operators in the United States in terms of volumes delivered, with approximately 6,000 miles of pipeline. We also use our service expertise to operate and/or maintain third-party pipelines and perform certain engineering and construction services for our customers. Our global terminal network, including through our interest in VTTI B.V. (“VTTI”), comprises more than 135 liquid petroleum products terminals with aggregate tank capacity of over 176 million barrels across our portfolio of pipelines, inland terminals and marine terminals located primarily in the East Coast, Midwest and Gulf Coast regions of the United States as well as in the Caribbean, Northwest Europe, the Middle East and Southeast Asia. Our global network of marine terminals enables us to facilitate global flows of crude oil and refined petroleum products, offering our customers connectivity between supply areas and market centers through some of the world’s most important bulk storage and blending hubs. Our flagship marine terminal in The Bahamas, Buckeye Bahamas Hub Limited (“BBH”), is one of the largest marine crude oil and refined petroleum products storage facilities in the world and provides an array of logistics and blending services for the global flow of petroleum products. Our Gulf Coast regional hub, Buckeye Texas Partners LLC (“Buckeye Texas”), offers world-class marine terminalling, storage and processing capabilities. Through our 50% equity interest in VTTI, our global terminal network offers premier storage and marine terminalling services for petroleum product logistics in key international energy hubs. We are also a wholesale distributor of refined petroleum products in certain areas served by our pipelines and terminals.
Business Strategy
Our primary business objective is to provide stable and sustainable cash distributions to our unitholders, while maintaining a relatively low investment risk profile. The key elements of our strategy are to:
• | Operate in a safe, regulatory compliant, and environmentally responsible manner; |
• | Maximize utilization of our assets at the lowest cost per unit; |
• | Maintain stable long-term customer relationships; |
• | Optimize, expand and diversify our portfolio of energy assets through accretive acquisitions and organic growth projects; and |
• | Maintain a solid, conservative financial position and our investment-grade credit rating. |
1
We intend to achieve our strategy by:
• | Acquiring, building and operating high quality, strategically-located assets; |
• | Maintaining and enhancing the integrity of our pipelines, terminals and storage assets; |
• | Pursuing strategic cash flow-accretive acquisitions that: |
• | Complement our existing footprint; |
• | Provide geographic, product and/or asset class diversity; and |
• | Leverage existing management capabilities and infrastructure; |
• | Seeking to acquire or develop other energy-related assets that enable us to leverage our asset base, knowledge base and skill sets; |
• | Valuing the effort, teamwork and innovation of our employees; and |
• | Providing superior customer service. |
Recent Developments
Notes Offerings and Repayments
In January 2018, we issued $400.0 million of junior subordinated notes (“Junior Notes”) maturing on January 22, 2078, which are redeemable at Buckeye’s option, in whole or in part, on or after January 22, 2023. The Junior Notes bear interest at a fixed rate of 6.375% per year up to, but not including, January 22, 2023. From January 22, 2023, the Junior Notes will bear interest at a floating rate based on the Three-Month London Interbank Offered Rate (“LIBOR”) plus 4.02%, reset quarterly. Total proceeds from this offering, after underwriting fees, expenses and debt issuance costs, were $394.9 million. We used the net proceeds from this offering for general partnership purposes and to reduce the indebtedness outstanding under our $1.5 billion revolving Credit Facility with SunTrust Bank (the “Credit Facility”).
In November 2017, we issued $400.0 million of senior unsecured 4.125% notes maturing on December 1, 2027. Total proceeds from this offering, after underwriting fees, expenses, and debt issuance costs, were $394.4 million. We used the net proceeds from this offering to reduce the indebtedness outstanding under our Credit Facility, a portion of which was subsequently reborrowed in January 2018 in order to repay in full the $300.0 million of 6.050% notes due on January 15, 2018 and $9.1 million of related accrued interest.
In July 2017, we repaid in full the $125.0 million principal amount and $3.2 million of accrued interest outstanding under our 5.125% notes, using funds available under our Credit Facility.
VTTI Acquisition
In January 2017, we acquired an indirect 50% equity interest in VTTI for cash consideration of $1.15 billion (the “VTTI Acquisition”). We own VTTI jointly with Vitol S.A. (“Vitol”). VTTI is one of the largest independent global marine terminal businesses which, through its subsidiaries and partnership interests, owns and operates approximately 58 million barrels of petroleum products tank capacity across 15 terminals located on 5 continents. These marine terminals are predominately located in key global energy hubs, including Northwest Europe, the Middle East and Southeast Asia, and offer world-class storage and marine terminalling services for liquid petroleum products. We and VIP Terminals Finance B.V., a subsidiary of Vitol, have equal board representation and voting rights in the VTTI joint venture.
In September 2017, VTTI acquired all of the outstanding publicly held units of VTTI Energy Partners LP, formerly a publicly traded master limited partnership (“VTTI MLP”), for an aggregate cash consideration of $473.6 million (the “VTTI Merger”). In connection with the VTTI Merger, VTTI MLP merged with and into a direct wholly owned subsidiary of VTTI. We funded our 50% share of the aggregate cash consideration, in the amount of $236.8 million, excluding transaction costs, through a capital contribution to VTTI, using borrowings under our Credit Facility.
At-the-Market Offering Program
In 2017, we sold approximately 6.2 million LP Units, including a block sale of 3.8 million units, under our equity distribution agreement (the “Equity Distribution Agreement”) with J.P. Morgan Securities LLC, BB&T Capital Markets, a division of BB&T Securities, LLC, BNP Paribas Securities Corp., Deutsche Bank Securities Inc., Jefferies LLC, Morgan Stanley & Co. LLC, RBC Capital Markets, LLC, and SMBC Nikko Securities America, Inc. (collectively, the “ATM Underwriters”). We received $345.8 million in net proceeds after deducting commissions and other related expenses. We used the net proceeds from the block sale to reduce the indebtedness outstanding under our Credit Facility and for general partnership purposes.
2
Business Activities
The following discussion describes the business activities of our business segments, which include Domestic Pipelines & Terminals, Global Marine Terminals and Merchant Services.
The Domestic Pipelines & Terminals, Global Marine Terminals and Merchant Services segments derive a nominal amount of their revenue from U.S. governmental agencies. All of our operated assets are located in the continental United States, except for our terminals located in Puerto Rico, St. Lucia and The Bahamas and, from time to time, our Merchant Services segment buys and/or sells fuel oil to third parties at various locations in the Caribbean. Additional financial information regarding revenue, profits and total assets of each segment and major geographic area can be found in Note 24 in the Notes to Consolidated Financial Statements. The following table shows our consolidated revenue and each segment’s revenue and percentage of consolidated revenue for the periods indicated (revenue in thousands):
Year Ended December 31, | ||||||||||||||||||||
2017 | 2016 | 2015 | ||||||||||||||||||
Revenue | Percent | Revenue | Percent | Revenue | Percent | |||||||||||||||
Domestic Pipelines & Terminals | $ | 1,035,663 | 28.4 | % | $ | 1,011,696 | 31.1 | % | $ | 966,749 | 28.0 | % | ||||||||
Global Marine Terminals | 634,749 | 17.4 | % | 671,465 | 20.7 | % | 514,301 | 14.9 | % | |||||||||||
Merchant Services (1) | 2,038,221 | 55.9 | % | 1,621,915 | 49.9 | % | 2,037,664 | 59.0 | % | |||||||||||
Intersegment | (60,488 | ) | (1.7 | )% | (56,700 | ) | (1.7 | )% | (65,280 | ) | (1.9 | )% | ||||||||
Total | $ | 3,648,145 | 100.0 | % | $ | 3,248,376 | 100.0 | % | $ | 3,453,434 | 100.0 | % | ||||||||
____________________________________
(1) | The change in revenue year to year for Merchant Services is largely driven by fluctuations in refined petroleum products prices, as well as changes in sales volumes. See “Item 7, Management’s Discussion and Analysis of Financial Condition and Results of Operations” for further discussion. |
Domestic Pipelines & Terminals Segment
The Domestic Pipelines & Terminals segment owns a significant interest in and operates approximately 6,000 miles of pipeline located primarily in the northeastern and upper midwestern portions of the United States, and services approximately 110 delivery locations. This segment transports primarily liquid petroleum products, including gasoline, jet fuel and a variety of distillates, from major supply sources to terminals and airports located within end-use markets. The segment also includes 115 active terminals that provide bulk storage and throughput services with respect to liquid petroleum products and renewable fuels, including ethanol, and have an aggregate tank capacity of over 56 million barrels. In addition, certain terminals provide rail loading/unloading services for a variety of petroleum products. Of our terminals in the Domestic Pipelines & Terminals segment, over half are connected to our pipelines. We generally own property on which the terminals are located. The segment’s geographical diversity, connections to multiple sources of supply, and extensive delivery system help create a stable base business.
Pipelines
The Domestic Pipelines & Terminals segment’s pipelines conduct business without the benefit of exclusive franchises from government entities. Our pipelines generally operate as a common carrier, providing transportation services at posted tariffs and without long-term contracts. Additionally, we have secured long-term commitments to support our Michigan-Ohio pipeline expansion project and certain other pipeline expansion projects. Demand for the services provided by our pipelines derives from end-users’ demand for liquid petroleum products in the regions served and the ability and willingness of refiners and marketers to supply such demand by deliveries through our pipelines. Factors affecting demand for liquid petroleum products include price and prevailing general economic conditions. Many of the factors impacting demand for the services provided by our pipelines are, therefore, partially or entirely beyond our control. Typically, this segment receives liquid petroleum products from refineries, connecting pipelines, and bulk and marine terminals and transports those products to other locations for a fee.
3
The following table presents product volumes and percentage of products transported by the pipelines in the Domestic Pipelines & Terminals segment for the periods indicated (barrels per day (“bpd”) in thousands):
Year Ended December 31, | |||||||||||||||||
2017 | 2016 | 2015 | |||||||||||||||
Pipelines: | |||||||||||||||||
Gasoline | 756.3 | 51.8 | % | 759.6 | 53.2 | % | 735.9 | 50.4 | % | ||||||||
Jet fuel | 373.8 | 25.6 | % | 361.1 | 25.3 | % | 358.9 | 24.5 | % | ||||||||
Middle distillates (1) | 309.7 | 21.2 | % | 289.4 | 20.3 | % | 337.4 | 23.1 | % | ||||||||
Other products (2) | 19.1 | 1.4 | % | 16.9 | 1.2 | % | 28.5 | 2.0 | % | ||||||||
Total pipelines throughput | 1,458.9 | 100.0 | % | 1,427.0 | 100.0 | % | 1,460.7 | 100.0 | % | ||||||||
_____________________________
(1) | Includes diesel fuel and heating oil. |
(2) | Includes liquefied petroleum gas (“LPG”), intermediate petroleum products and crude oil. |
We provide pipeline transportation services in the following states: California, Connecticut, Florida, Illinois, Indiana, Iowa, Maine, Massachusetts, Michigan, Missouri, Nevada, New Jersey, New York, Ohio, Pennsylvania and Tennessee. The geographical location and description of these pipelines is as follows:
Pennsylvania—New York—New Jersey. Our operating subsidiary Buckeye Pipe Line Company, L.P. (“BPLC”) serves major population centers in Pennsylvania, New York and New Jersey through approximately 825 miles of pipeline. Liquid petroleum products are received at Linden, New Jersey from 17 major source points and are then transported through two lines to Macungie, Pennsylvania. From Macungie, the pipeline continues west through a connection with a pipeline owned by our operating subsidiary, Laurel Pipe Line Company, L.P. (“Laurel”), to Pittsburgh, Pennsylvania and north through eastern Pennsylvania into New York. We lease capacity in one of the pipelines extending from Pennsylvania to upstate New York to a major public pipeline company. Products received at Linden, New Jersey are also transported to commercial liquid petroleum products terminals at Long Island City and Inwood, New York and to Newark Airport, JFK Airport, and LaGuardia Airport. Buckeye Linden Pipe Line Company LLC (“Buckeye Linden”) provides transportation services within New York Harbor.
A pipeline system owned by our operating subsidiary, Buckeye Pipe Line Transportation LLC (“BPL Transportation”), delivers liquid petroleum products from a refinery located in Paulsboro, New Jersey to destinations in New Jersey, Pennsylvania and upstate New York through approximately 420 miles of pipeline. A portion of the pipeline system extends from Paulsboro, New Jersey to Malvern, Pennsylvania. From Malvern, a pipeline segment delivers liquid petroleum products to locations in upstate New York.
The Laurel pipeline system transports liquid petroleum products through a 350-mile pipeline extending westward from three refineries, a marine terminal and a connection to the Colonial pipeline system in the Philadelphia area to locations across Pennsylvania.
Illinois—Indiana—Michigan—Missouri—Ohio. BPLC, BPL Transportation and our operating subsidiary NORCO Pipe Line Company, LLC (“NORCO”), a subsidiary of Buckeye Pipe Line Holdings, L.P. (“BPH”), transport liquid petroleum products through approximately 1,800 miles of pipeline in northern Illinois, central Indiana, eastern Michigan, western and northern Ohio, and western Pennsylvania. A number of receiving lines and delivery lines connect to a central corridor which runs from Lima, Ohio through Toledo, Ohio to Detroit, Michigan. Liquid petroleum products are received at refineries and other pipeline connection points near Toledo and Lima, Ohio; Detroit, Michigan; and East Chicago, Indiana. Major market areas served include Huntington/Fort Wayne, Indianapolis and South Bend, Indiana; Bay City, Detroit and Flint, Michigan; Cleveland, Columbus, Lima, Warren and Toledo, Ohio; and Pittsburgh, Pennsylvania.
Our operating subsidiary, Wood River Pipe Lines LLC (“Wood River”), owns liquid petroleum products pipelines with aggregate mileage of approximately 1,000 miles located in the Midwestern United States. Liquid petroleum products are received from the Wood River refinery in the East St. Louis, Illinois area and transported to the Chicago area (the “Chicago Complex”), to our terminal in the St. Louis, Missouri area and to the Lambert-St. Louis Airport, to delivery points across Illinois and Indiana and to our pipeline in Lima, Ohio, and from the Chicago Complex to the Kankakee, Illinois area.
4
Other Liquid Petroleum Products Pipelines. BPLC serves Connecticut and Massachusetts through an approximately 110-mile pipeline that carries liquid petroleum products from New Haven, Connecticut to Hartford, Connecticut and Springfield, Massachusetts. This pipeline also serves Bradley International Airport in Windsor Locks, Connecticut. Also, BPL Transportation owns an approximately 650-mile refined product pipeline that originates in Dubuque, Iowa and runs southwest into Missouri and then northwest back into Iowa, serving the Sugar Creek, Missouri, and Council Bluffs and Des Moines, Iowa markets. BPL Transportation also has an approximately 125-mile pipeline that runs from Portland, Maine to Bangor, Maine.
Our operating subsidiary, Everglades Pipe Line Company, L.P. (“Everglades”), transports primarily jet fuel through an approximately 40-mile pipeline from Port Everglades, Florida to Ft. Lauderdale-Hollywood International Airport and Miami International Airport.
Our operating subsidiary, Buckeye Aviation (Reno) LLC (“Buckeye Reno”), owns an approximately 3-mile pipeline serving the Reno/Tahoe International Airport. Our operating subsidiary, Buckeye Aviation (San Diego) LLC (“Buckeye San Diego”), owns an approximately 4-mile pipeline serving the San Diego International Airport. Buckeye Aviation (Memphis) LLC (“Buckeye Memphis”), formerly known as WesPac Pipelines - Memphis LLC, owns an approximately 14-mile pipeline and a related terminalling facility that primarily serves Federal Express Corporation at the Memphis International Airport. Buckeye Reno, Buckeye San Diego and Buckeye Memphis, collectively, have terminalling facilities with aggregate storage capacity of 0.5 million barrels.
Additionally, BPH indirectly owns an approximate 63% interest in the Sabina crude butadiene pipeline (the “Sabina Pipeline”) and owns and operates approximately 25 miles of pipeline, which it leases to third parties, all located in Texas.
Terminals
The Domestic Pipelines & Terminals segment’s terminals receive products from pipelines and, in certain cases, barges, ships or trains, and distribute them to third parties, who in turn deliver them to end-users and retail outlets. This segment’s terminals play a key role in moving products to the end-user market by providing efficient product receipt, storage and distribution capabilities, inventory management, ethanol and biodiesel blending, and other ancillary services including additives injection. Typically, the Domestic Pipelines & Terminals segment’s terminalling facilities consist of multiple storage tanks and are equipped with automated truck loading equipment available 24 hours a day.
The Domestic Pipelines & Terminals segment’s terminals derive most of their revenues from various fees paid by customers. A throughput fee is charged for receiving products into the terminal and delivering them to trucks, barges, ships or pipelines. In addition to these throughput fees, revenues are generated by charging customers fees for blending with renewable fuels, injecting additives and providing storage capacity to customers on either a short-term or long-term basis. The terminals also derive revenue from recovering and selling vapors captured during truck loading. Finally, the terminals derive service fees and blending margins from butane blending activities primarily during certain months (generally mid-September through mid-March), whereby butane is blended into various grades of gasoline. Blending margins depend upon pricing spreads between gasoline and butane, and we use financial derivative instruments to manage the commodity price risk associated with gasoline-to-butane pricing spreads, as deemed necessary. The fair value of such derivative instruments is recorded in our consolidated balance sheets, with the change in fair value recorded currently in earnings. These derivative instruments consist primarily of futures contracts cleared on the New York Mercantile Exchange (“NYMEX”) that are executed and managed by our Merchant Services segment.
The following table sets forth the total average daily throughput for terminals and storage caverns within the Domestic Pipelines & Terminals segment for the periods indicated (volume of bpd in thousands):
Year Ended December 31, | ||||||||
2017 | 2016 | 2015 | ||||||
Products throughput (1) | 1,251.5 | 1,238.4 | 1,215.4 | |||||
____________________________
(1) | Amounts include throughput at the three terminals owned by the Merchant Services segment and operated by the Domestic Pipelines & Terminals segment (as discussed below), as well as two underground propane storage caverns. |
5
The following table sets forth the number of terminals and tank capacity in barrels by location for terminals reported in the Domestic Pipelines & Terminals segment (barrels in thousands):
Location | Number of Terminals (1) | Tank Capacity (2) | |||
Alabama | 2 | 605 | |||
California | 3 | 530 | |||
Connecticut | 2 | 1,212 | |||
Florida | 4 | 1,951 | |||
Iowa | 5 | 1,302 | |||
Illinois | 7 | 2,772 | |||
Indiana | 11 | 9,846 | |||
Kentucky | 1 | 214 | |||
Louisiana | 1 | 304 | |||
Maine | 1 | 140 | |||
Maryland | 1 | 3,232 | |||
Massachusetts | 2 | 433 | |||
Michigan | 14 | 5,467 | |||
Missouri | 3 | 1,767 | |||
Nevada | 1 | 50 | |||
New Jersey | 4 | 5,296 | |||
New York | 16 | 8,450 | |||
North Carolina | 1 | 572 | |||
Ohio | 13 | 3,861 | |||
Pennsylvania | 10 | 3,027 | |||
South Carolina | 4 | 2,191 | |||
Tennessee | 1 | 328 | |||
Virginia | 4 | 1,805 | |||
Wisconsin | 4 | 1,228 | |||
Total | 115 | 56,583 | |||
____________________________
(1) | This table includes three terminals in Pennsylvania with aggregate tank capacity of approximately 1 million barrels, which are owned by the Merchant Services segment and operated by the Domestic Pipelines & Terminals segment (as discussed below). |
(2) | This table includes approximately 20.3 million barrels of storage capacity, with the remaining capacity being used for throughput. |
Operation and Maintenance and Project Management Services
We provide turn-key operations and maintenance, asset development and construction services for third-party pipeline and energy assets across the United States. We also operate and/or maintain third-party pipelines under agreements with major oil and gas, petrochemical and chemical companies, which are located primarily in Texas and Louisiana, and perform pipeline construction management services, typically for cost plus a fixed fee, for these same customers as well as other energy companies in the United States.
6
Equity Investments
We own a 34.6% equity interest in West Shore Pipe Line Company (“West Shore”). West Shore owns an approximately 500-mile pipeline system that originates in the Chicago, Illinois area and extends north to Granville, Wisconsin and west and then north to Madison, Wisconsin. The pipeline system transports liquid petroleum products to markets in northern Illinois and Wisconsin. The other equity holders of West Shore are affiliated with major oil and gas companies. Since January 1, 2009, we have operated the West Shore pipeline system on behalf of West Shore.
We also own a 40% equity interest in Muskegon Pipeline LLC (“Muskegon”). Marathon Pipeline LLC is the majority owner and operator of Muskegon. Muskegon owns an approximately 170-mile pipeline that delivers petroleum products from Griffith, Indiana to Muskegon, Michigan.
Additionally, we own a 25% equity interest in Transport4, LLC (“Transport4”). Transport4 provides an internet-based shipper information system that allows its customers, including shippers, suppliers and tankage partners to access nominations, schedules, tickets, inventories, invoices and bulletins over a secure internet connection.
We also own a 50% equity interest in South Portland Terminal LLC (“South Portland”), which owns a terminal in South Portland, Maine that has approximately 725,000 barrels of storage capacity. We have operated this terminal since July 19, 2011.
Global Marine Terminals Segment
The Global Marine Terminals segment, including through our interest in VTTI, provides marine accessible bulk storage and blending services, rail and truck rack loading/unloading, and petroleum processing services across our network of marine terminals located primarily in the East Coast and Gulf Coast regions of the United States, as well as in the Caribbean, Northwest Europe, the Middle East, and Southeast Asia. The segment owns and operates, or owns a significant interest in, 22 liquid petroleum product terminals, located in these key domestic and international energy hubs.
The following table sets forth the capacity utilization percentage within the Global Marine Terminals segment:
Year Ended December 31, | ||||||||
2017 | 2016 | 2015 | ||||||
Average capacity utilization rate (1) | 92 | % | 99 | % | 96 | % | ||
___________________________
(1) | Represents the average ratio of contracted capacity to capacity available to be contracted during the respective period. Based on total capacity (i.e., including out of service capacity), average capacity utilization rates are approximately 88%, 92% and 85% for the years ended December 31, 2017, 2016 and 2015, respectively. |
7
The following table sets forth terminal locations and tank capacity in barrels for terminals reported in the Global Marine Terminals segment (barrels in thousands):
Location | Number of Terminals | Tank Capacity | |||
Global Marine Terminals: | |||||
Caribbean | |||||
Grand Bahama Island, Bahamas | 1 | 26,173 | |||
Castries, St. Lucia | 1 | 10,241 | |||
Yabucoa, Puerto Rico | 1 | 3,891 | |||
U.S. East Coast | |||||
New York Harbor | 3 | 15,177 | |||
U.S. Gulf Coast | |||||
Corpus Christi, Texas (1) | 1 | 6,668 | |||
Total Global Marine Terminals (2) | 7 | 62,150 | |||
VTTI: | |||||
Northwest Europe | |||||
Amsterdam, Netherlands | 1 | 8,605 | |||
Rotterdam, Netherlands | 1 | 7,032 | |||
Antwerp, Belgium | 1 | 5,994 | |||
Middle East | |||||
Fujairah, United Arab Emirates | 1 | 10,121 | |||
Southeast Asia | |||||
Johore, Malaysia | 1 | 7,296 | |||
Other Regions | |||||
Ventspils, Latvia | 1 | 7,517 | |||
Vasiliko, Cyprus | 1 | 3,428 | |||
Kaliningrad, Russia | 1 | 308 | |||
Ploce, Croatia | 1 | 315 | |||
Cape Canaveral, Florida | 1 | 2,856 | |||
Buenos Aires, Argentina | 1 | 1,371 | |||
Panama City, Panama | 1 | 1,447 | |||
Mombasa, Kenya | 1 | 698 | |||
Lagos, Nigeria | 1 | 101 | |||
Cape Town, South Africa | 1 | 767 | |||
Total VTTI (3) | 15 | 57,856 | |||
Total | 22 | 120,006 | |||
_____________________________
(1) | Represents the terminalling facility owned by Buckeye Texas, which is 80% owned by us. |
(2) | This total represents total tank capacity as of December 31, 2017, of which approximately 8.3 million barrels are unavailable for contracting to third parties due to being out of service for maintenance, capital enhancements or used for internal purposes. |
(3) | This total represents the terminalling facilities owned and operated by VTTI, which is 50% owned by us. |
8
The following descriptions set forth additional information about our and certain of VTTI’s terminals located in key petroleum logistics hubs around the world.
Caribbean
BBH Facility
BBH owns a terminalling facility located along the Northwest Providence Channel of Grand Bahama Island, which it uses to operate a fully integrated terminalling business, and offers customers storage, blending and ancillary services, including but not limited to, berthing, heating, transshipment, product treating and bunkering. Ancillary services also facilitate customer activities within the tank farm and at the jetties.
BBH’s terminalling facility includes more than 80 aboveground storage tanks, which store crude oil, fuel oil and refined petroleum products. The existing marine infrastructure of BBH’s terminalling facility consists of three deep-water jetties, which provide six deep-water berths and an inland dock with two berths that serve as the access points to the storage facilities and marine bunkering services. Certain of these jetties are capable of handling both very large crude carriers and ultra large crude carriers.
We own the 500 acres of property on which the BBH terminalling facility is located. BBH leases 330 acres of seabed on which the deep water jetties are located pursuant to a long-term agreement with The Bahamas government that runs through 2057. BBH also leases the land on which the inland dock is located pursuant to a long-term agreement with the Freeport Harbour Company that runs through 2067.
St. Lucia Terminal
The St. Lucia terminal sits on approximately 700 acres on Cul de Sac Bay in St. Lucia. It has over 10 million barrels of crude oil and refined petroleum products tank capacity, as well as deep-water access capable of berthing very large crude carriers and serves the local market’s refined product demand. The facility provides transshipment services for handling, blending and distribution of crude oil from growing Latin American production to U.S. and global refining centers. Access to the St. Lucia terminal is provided through two ship docks and a truck rack.
Yabucoa Terminal
The Yabucoa terminal in Puerto Rico includes 39 storage tanks, which store gasoline, jet fuel, diesel, fuel oil and crude oil. The facility provides terminalling services for the handling, blending and distribution of liquid petroleum products within the Puerto Rico market as well as residual fuel oil and petroleum distillate fuel for the local and regional Caribbean markets. Access to the Yabucoa terminal is provided through one ship dock, which is leased from the Puerto Rico Ports Authority, two barge docks and an eight-bay truck rack.
9
U.S. East Coast
New York Harbor Terminals
The New York Harbor storage and marine terminals, which consist of our Perth Amboy, Port Reading and Raritan Bay terminals, provide a link between our inland pipelines and terminals, owned and operated by the Domestic Pipelines & Terminals segment, and our BBH facility, enabling our customers to take advantage of BBH’s deep water access and ability to aggregate product. The Perth Amboy facility sits on approximately 250 acres on the Arthur Kill tidal strait in Perth Amboy, New Jersey — six miles from our Linden, New Jersey complex — and has water, pipeline, rail and truck access. In 2014, we completed a high capacity pipeline connection between Perth Amboy and our Linden hub. Furthermore, the Perth Amboy terminal includes 42 storage tanks, a dock, and three operational berths, each with articulated loading arms, allowing both ship and barge berthing. The Port Reading terminal is located on 211 acres in Port Reading, New Jersey and includes 69 storage tanks, a deep-water dock and five operational berths, allowing for both ship and barge berthing. In addition, the facility has bi-directional pipeline access, rail unloading capabilities, and a six-bay driver-operated truck loading rack. The Raritan Bay terminal is located on 62 acres on the Raritan River in Perth Amboy, New Jersey, and includes 30 storage tanks, a barge dock and two operational berths. The Raritan Bay facility also has bi-directional pipeline access and a six-bay driver-operated truck loading rack. Additionally, the Perth Amboy, Port Reading and Raritan Bay terminals are NYMEX delivery locations for both gasoline and ultra low sulfur diesel. The Perth Amboy, Port Reading and Raritan Bay terminals have approximately 4 million, 6 million and 5 million barrels of liquid petroleum products storage capacity, respectively. These terminals extend Buckeye’s connectivity in New York Harbor by offering diverse storage capabilities that include terminalling services for gasoline, blendstocks, distillate and fuel oil. Buckeye is currently constructing a 16” bi-directional pipeline between our Perth Amboy and Raritan Bay terminals, which will allow for customer product movements between the facilities and access to the Linden hub. It is expected to be completed in the spring of 2018.
U.S. Gulf Coast
Corpus Christi Facilities
Buckeye Texas owns storage, petroleum processing and marine terminalling facilities that sit on approximately 730 acres along the Corpus Christi Ship Channel in Texas. The Corpus Christi facilities have five vessel berths, including three deep-water docks, two 25,000 barrels per day condensate splitters and approximately 6.7 million barrels of liquid petroleum products storage capacity, including a refrigerated and compressed LPG storage complex, along with rail and truck loading/unloading capabilities. The platform also comprises three field gathering facilities with associated storage in the Eagle Ford play and pipeline connectivity that allows Buckeye Texas to move Eagle Ford play crude oil and condensate production directly to the terminalling complex in Corpus Christi. These assets form an integrated system with connectivity from the production in the field to the marine terminal infrastructure and the processing complex in Corpus Christi.
Northwest Europe
VTTI’s Amsterdam, Rotterdam and Antwerp terminals offer over 21 million aggregate barrels of storage capacity for liquid petroleum products. The Amsterdam terminal offers complex blending services, connections to truck and rail and a large number of berths that accommodate a broad range of vessel types. The Rotterdam terminal primarily stores fuel oil and middle distillate products and offers connections to vessels, including very large crude carriers, truck, rail, and the North Atlantic Treaty Organization (“NATO”) pipeline system. The Antwerp terminal is connected to an extensive pipeline network and harbor infrastructure, offering connections to the NATO pipeline system, vessels, truck and rail. The Antwerp terminal is also adjacent to the largest dedicated bitumen processing plant in Europe with a capacity of approximately 24,000 barrels per day, which is also owned by VTTI.
Middle East
VTTI’s Fujairah terminal offers approximately 10.1 million barrels of storage capacity for crude oil and refined petroleum products. The terminal is located in the United Arab Emirates on the gateway between the Indian Ocean and the Persian Gulf and strategically sits in one of the major bunker markets in the world. The terminal offers connections to any size or type of vessel, as well as to truck and pipelines. The terminal is also connected to the Fujairah Refinery Limited refinery, which is able to process a combination of condensate and heavy crude oil at a rate of up to 80,000 barrels per day.
10
Southeast Asia
VTTI’s Johore terminal offers approximately 7.3 million barrels of storage capacity for refined petroleum products. The terminal is located in Malaysia next to the Asian hub of Singapore, one of the largest bunkering hubs in the world, and can receive all tanker sizes including partially-laden very large crude carriers.
Merchant Services Segment
The Merchant Services segment is a wholesale distributor of refined petroleum products in the continental United States and in the Caribbean. We increase the utilization of our existing pipeline and terminalling assets by marketing refined petroleum products in certain areas served by our pipelines and terminals. The segment’s customers consist principally of product wholesalers and major commercial users of refined petroleum products including gasoline, propane, ethanol, biodiesel and petroleum distillates such as heating oil, diesel fuel and kerosene. The segment also provides fuel oil supply and distribution services to customers in the Caribbean.
The Merchant Services segment owns three terminals in Pennsylvania with aggregate storage capacity of approximately 1 million barrels, which are operated by the Domestic Pipelines & Terminals segment. Each terminal is equipped with multiple storage tanks and automated truck loading equipment that is available 24 hours a day. We also own the property on which the terminals are located.
The following table sets forth the total gallons of refined petroleum products sold by the Merchant Services segment for the periods indicated (in millions of gallons):
Year Ended December 31, | ||||||||
2017 | 2016 | 2015 | ||||||
Sales volumes | 1,214.8 | 1,179.7 | 1,215.0 | |||||
The Merchant Services segment’s operations are segregated into three categories based on the type of fuel delivered and the delivery method:
• | Wholesale — liquid fuels and propane gas are delivered to distributors and large commercial customers. These customers take delivery of the products using truck loading equipment at storage facilities; |
• | Wholesale Delivered — liquid fuels are delivered to commercial customers, construction companies, school districts and trucking companies through third-party carriers; or via vessel using our marine terminals. |
• | Branded Gasoline — gasoline and on-highway diesel fuel are delivered through third-party trucking companies to independently owned retail gas stations under many leading gasoline brands. |
The operations of the Merchant Services segment expose us to commodity price risk. The commodity price risk is managed by entering into derivative instruments to offset the effect of commodity price fluctuations on the segment’s inventory and fixed price contracts. The fair value of our derivative instruments is recorded in our consolidated balance sheets, with the change in fair value recorded in earnings. The derivative instruments the Merchant Services segment uses consist primarily of futures contracts traded on the NYMEX for the purposes of managing our market price risk from holding physical inventory and entering into physical fixed-price contracts. A majority of the futures contracts executed are designated as fair value hedges of our refined petroleum inventory. The changes in fair value of the hedging instruments and hedged items are both recognized in cost of product sales. However, hedge accounting has not been elected for all of the Merchant Services segment’s derivative instruments. Fixed-price purchase and sales contracts are generally economically hedged with financial instruments; however, these instruments are not designated in a hedge relationship. In the cases in which hedge accounting has not been used for physical derivative contracts, changes in the fair values of the financial instruments, which are included in revenue and cost of product sales, generally are offset by changes in the values of the physical derivative contracts which are also derivative instruments whose changes in value are recognized in product sales or cost of product sales. In addition, hedge accounting has not been elected for financial instruments that have been executed to economically hedge a portion of the Merchant Services segment’s refined petroleum products held in inventory. The changes in value of the financial instruments that are economically hedging inventory are recognized in cost of product sales.
11
Discontinuation of Natural Gas Storage Segment
In December 2013, the Board of Directors of Buckeye GP (“the Board”) approved a plan to divest the natural gas storage facility and related assets that our former subsidiary, Lodi Gas Storage, L.L.C. (“Lodi”), owned and operated in Northern California. We refer to this group of assets as our Natural Gas Storage disposal group. We reported the results of operations as discontinued operations for all periods presented in these financial statements. In December 2014, we completed the sale of our Natural Gas Storage disposal group for $102.6 million in cash, net of expenses and working capital adjustments of $2.4 million. We reported the final working capital adjustments as discontinued operations in the first quarter of 2015. For additional information, see Note 4 in the Notes to Consolidated Financial Statements.
Competition and Customers
Competitive Strengths
We believe that we have the following competitive strengths:
• | We operate in a safe, regulatory compliant, and environmentally responsible manner; |
• | We own and operate high quality assets that are strategically located; |
• | We have stable, long-term relationships with our customers; |
• | We own relatively predictable and stable fee-based businesses with opportunistic revenue generating capabilities that support distribution growth; and |
• | We maintain a conservative financial position with an investment-grade credit rating. |
Domestic Pipelines & Terminals Segment
Generally, pipelines are the lowest cost method for long-haul overland movement of liquid petroleum products. Therefore, the Domestic Pipelines & Terminals segment’s most significant competitors for large volume shipments are other pipelines, some of which are owned or controlled by major integrated oil and gas companies. Although it is unlikely that a pipeline system comparable in size and scope to the Domestic Pipelines & Terminals segment’s pipeline systems will be built in the foreseeable future, new pipelines (including pipeline segments that connect with existing pipeline systems) could be built to effectively compete with the Domestic Pipelines & Terminals segment in particular locations.
In addition to competition from other pipelines, the Domestic Pipelines & Terminals segment faces competition from trucks and rail in a number of areas that we serve. While their costs may not be competitive for longer hauls or large volume shipments, these sources of transportation compete effectively for smaller volumes in many local areas. The availability of truck or rail transportation places a competitive constraint on the ability of the Domestic Pipelines & Terminals segment to increase its market-based and indexed tariff rates.
The Domestic Pipelines & Terminals segment also faces competition from marine transportation in some areas. Tankers and barges account for some deliveries into areas that we serve near the East coast, Great Lakes, Ohio River and Mississippi River.
Privately arranged exchanges of liquid petroleum products between marketers in different locations are another form of competition. Generally, such exchanges reduce both parties’ costs by eliminating or reducing transportation charges. In addition, consolidation among refiners and marketers can alter distribution patterns, reducing demand for transportation services in some markets and increasing them in other markets.
The production and use of biofuels may be a competitive factor in that, to the extent the usage of biofuels increases, some alternative means of transport that compete with our pipelines may be able to provide transportation services for biofuels that our pipelines cannot because of safety or pipeline integrity issues. However, most of our terminals have the necessary infrastructure to blend ethanol with gasoline, and to a lesser extent biodiesel with distillates, and we earn revenue for these services. Biofuel usage may also create opportunities for additional pipeline transportation and blending opportunities, if such biofuels can be transported through our pipelines, although that potential cannot be quantified at present.
12
The Domestic Pipelines & Terminals segment also generally competes with other terminals in the same geographic market. Many competitive terminals are owned by major integrated oil and gas companies. These major oil and gas companies may have the opportunity for product exchanges that are not available to the Domestic Pipelines & Terminals segment’s terminals. While the Domestic Pipelines & Terminals segment’s terminal throughput fees are not regulated, they are subject to price competition from competitive terminals and alternate modes of transporting liquid petroleum products to end-users such as retail gasoline stations.
Global Marine Terminals Segment
Our Global Marine Terminals segment competes on the basis of geographic location, breadth of services, and price with proprietary or third-party terminal operators as well as with major oil and gas companies and with major pipeline and terminal operators in the energy hubs in which we operate. We believe that we are favorably positioned to compete in the industry on a global scale due to the quality and safety of our operations, the geographical locations of our facilities, deep drafts, storage capacity, and the variety of ancillary service capabilities of our facilities. The competitiveness of our service offerings, including the rates we charge for our services, is affected by the availability of storage relative to the overall demand for storage in a given market area and could be impacted by the entry of new competitors into the markets in which we operate. However, we believe that significant barriers to entry exist in the marine terminalling business. These barriers include capital costs, execution risk, a lengthy permitting and development cycle, financing challenges, shortage of personnel with the requisite expertise, and a finite number of sites suitable for development.
Our Corpus Christi facility, owned by Buckeye Texas, is fully contracted under long-term, take-or-pay arrangements. There is no current or near-term capacity available for new customers.
Merchant Services Segment
The Merchant Services segment competes with major energy companies, their marketing affiliates and independent gatherers, investment banks that have established trading platforms, master limited partnerships with marketing businesses, and brokers and marketers of widely varying sizes, financial resources and experience. Some of these competitors have capital resources greater than the Merchant Services segment, and control greater supplies of refined petroleum products.
Customers
For the years ended December 31, 2017, 2016 and 2015, no customer contributed 10% or more of our consolidated revenue. Revenue from Buckeye Texas, which is almost fully contracted to one customer under long-term take-or-pay arrangements, accounted for approximately 38% of total revenue in the segment for the year ended December 31, 2017.
In addition, BBH’s storage revenue accounted for approximately 23% of total revenue in the Global Marine Terminals segment for the year ended December 31, 2017. Currently, BBH has a limited number of long-term storage customers, consisting of major oil companies, energy companies, physical traders and national oil companies. For the year ended December 31, 2017, approximately 40% and 59% of BBH’s storage revenue was derived from the top one and the top three customers, respectively. We expect BBH to continue to derive a substantial portion of its total revenue from a small number of customers in the future. Similarly, a majority of VTTI’s 2017 revenue was derived from its primary customer, Vitol.
Seasonality
The Domestic Pipelines & Terminals segment’s mix and volume of products transported and stored tends to vary seasonally. Declines in demand for heating oil during the summer months are, to a certain extent, offset by increased demand for gasoline and jet fuel. Overall, this segment’s business has been only moderately seasonal, with somewhat lower than average volumes being transported and stored during March, April and May and somewhat higher than average volumes being transported and stored in November, December and January.
The Merchant Services segment’s mix and volume of product sales tend to vary seasonally, with the fourth and first quarters’ volumes generally being higher than the second and third quarters, primarily due to the increased demand for home heating oil in the winter months.
13
The Domestic Pipelines & Terminals and Merchant Services segments both benefit from increased sales of heating oil and butane blending activities at our terminals during the winter months. Blending butane into various grades of gasoline generally increases in the mid-September through mid-March time frame.
The Global Marine Terminals segment’s mix and volume of products stored does not vary significantly by season; however, it can be affected by market structure.
Employees
Except as noted below, we are managed and operated by employees of Buckeye Pipe Line Services Company (“Services Company”). We reimburse Services Company for the cost of providing employee services pursuant to a services agreement. At December 31, 2017, Services Company had approximately 1,600 employees, approximately 400 of whom were represented by labor unions. Additionally, at December 31, 2017, certain of our wholly owned subsidiaries had approximately 270 employees, approximately 150 of whom are employed at our BBH facility. We have not experienced significant work stoppages or other labor problems.
Regulation
General
The operation of pipelines, terminals, and associated facilities is subject to extensive laws and regulations and resulting regulatory oversight by numerous federal, state and local departments and agencies, many of which are authorized by statute to issue binding rules and regulations. In some states, we are subject to the jurisdiction of public utility commissions and state corporation commissions, which have authority over, among other things, intrastate tariffs, the issuance of debt and equity securities, transfers of assets and safety. The failure to comply with such laws and regulations can result in substantial penalties. The regulatory burden on our operations increases our cost of doing business and, consequently, affects our profitability. However, except for certain exemptions that apply to smaller companies, we do not believe that we are affected in a significantly different manner by these laws and regulations than are our competitors.
The following is a discussion of certain laws and regulations affecting us. However, this discussion should not be relied upon as an exhaustive review of all regulatory considerations affecting our business and operations.
Rate Regulation
Overview. BPLC, Wood River, BPL Transportation, Buckeye Linden Pipe Line Company LLC (“Buckeye Linden”) and NORCO operate pipelines subject to the regulatory jurisdiction of the Federal Energy Regulatory Commission (“FERC”) under the Interstate Commerce Act, the Energy Policy Act of 1992 and the Department of Energy Organization Act. FERC regulations require that interstate oil pipeline rates be posted publicly and that these rates be “just and reasonable” and not unduly discriminatory. FERC regulations also enforce common carrier obligations and specify a uniform system of accounts, among certain other obligations.
The generic oil pipeline regulations issued under the Energy Policy Act of 1992 rely primarily on an index methodology that allows a pipeline to change its rates in accordance with an index that the FERC believes reflects cost changes appropriate for application to pipeline rates. In December 2015, the FERC amended its regulations to change the index to the Producer Price Index (“PPI”) - finished goods plus 1.23% effective July 1, 2016.
The indexing methodology is used to establish rates on the pipelines owned by Wood River, BPL Transportation and NORCO, and for certain rates charged by BPLC, and such rates are therefore subject to change annually according to the index. If the index is negative in a future period, we could be required to reduce these rates if they exceed the new maximum allowable rate. Shippers may file protests against the application of the index to the rates of an individual pipeline and may also file complaints against indexed rates as being unjust and unreasonable, subject to the FERC’s standards.
Under the FERC’s rules, as one alternative to indexed rates, a pipeline is allowed to charge market-based rates if the pipeline establishes that it does not possess significant market power in a particular market. BPLC charges market-based rates in its competitive markets and index-based rates in certain of its other markets. Buckeye Linden also charges market based rates in its market.
14
Other types of rate regulation. Laurel operates a pipeline in intrastate service across Pennsylvania, and its tariff rates are regulated by the Pennsylvania Public Utility Commission. Wood River operates a pipeline providing some intrastate services in Illinois, and tariff rates related to this pipeline are regulated by the Illinois Commerce Commission.
Environmental Regulation
General
We are subject to federal, state and local laws and regulations relating to the protection of the environment. Although we believe that our operations comply in all material respects with applicable environmental laws and regulations, risks of substantial environmental liabilities are inherent in pipeline, terminalling and processing operations, and we may incur material environmental liabilities in the future. It is possible that other developments, such as increasingly rigorous environmental laws, regulations and enforcement policies, and claims for damages to property or injuries to persons resulting from our operations, could result in substantial costs and liabilities to us. See “Item 3, Legal Proceedings.” Furthermore, new projects may require approvals and environmental analysis under federal and state laws, including the National Environmental Policy Act and the Endangered Species Act. The resulting costs and delays could materially and negatively affect the viability of such projects. The following is a summary of the significant current environmental laws and regulations to which our business operations are subject and for which compliance may require material capital expenditures or have a material adverse impact on our results of operations or financial position.
Water
The Oil Pollution Act of 1990 (“OPA”) amended certain provisions of the federal Water Pollution Control Act of 1972, commonly referred to as the Clean Water Act (“CWA”), and other statutes, as they pertain to the prevention of and response to petroleum product spills into navigable waters. The OPA subjects owners of facilities to strict joint and several liability for all containment and clean-up costs and certain other damages arising from a spill. The CWA provides penalties for the discharge of petroleum products in reportable quantities and imposes substantial liability for the costs of removing a spill. State laws for the control of water pollution also provide varying civil and criminal penalties and liabilities in the case of releases of petroleum or its derivatives into surface waters or into the ground.
Contamination resulting from spills or releases of liquid petroleum products sometimes occurs in the petroleum pipeline, terminalling and processing industry. Our pipelines cross, and certain facilities are located near, numerous navigable rivers and streams. Although we believe that we comply in all material respects with the spill prevention, control and countermeasure requirements of federal laws, any spill or other release of petroleum products into navigable waters may result in material costs and liabilities to us.
Hazardous Substances and Wastes
The Resource Conservation and Recovery Act (“RCRA”), as amended, establishes a comprehensive program of regulation of “hazardous wastes.” Hazardous waste generators, transporters, and owners or operators of hazardous waste treatment, storage and disposal facilities must comply with regulations designed to ensure detailed tracking, handling and monitoring of these wastes. RCRA also regulates the disposal of certain non-hazardous wastes. As a result of these regulations, certain wastes typically generated by pipeline, terminalling and processing operations are considered “hazardous wastes”, “special wastes” or regulated solid waste. Hazardous wastes are subject to more rigorous and costly disposal requirements than are non-hazardous wastes. Changes in any of the RCRA regulations to, for example, expand the universe of regulated wastes or impose more stringent management requirements, could have a material adverse effect on our maintenance capital expenditures and operating expenses.
15
The Comprehensive Environmental Response, Compensation and Liability Act of 1980 (“CERCLA”), also known as “Superfund,” authorizes the federal and state governments to address the release or threat of release of a “hazardous substance.” Although CERCLA contains a “petroleum exclusion,” that provision generally applies only to unused product not contaminated by contact with other substances, and may exclude product recovered after a release, as well as contact water. A release of a hazardous substance, whether on or off-site, may subject the generator of that substance or the owner of the property on which the release occurred to joint and several liability under CERCLA for the costs of clean-up and other remedial action. Pipeline and facility maintenance and other activities in the ordinary course of our business generate “hazardous substances.” As a result, to the extent a hazardous substance generated by us or our predecessors is released or was released or otherwise disposed of in the past, we may in the future be required to remediate the contaminated property. Governmental authorities such as the Environmental Protection Agency (“EPA”), and in some instances third parties, are authorized under CERCLA to seek to recover remediation and other costs from responsible persons, without regard to fault or the legality of the original disposal. In addition to our potential liability as a generator of “hazardous substances,” to the extent that our property or right-of-way is affected by a release of hazardous substances such that it becomes part of a Superfund or other hazardous waste site, we may be responsible under CERCLA for all or part of the costs required to clean up that site, which could be material.
Air Emissions
The Clean Air Act (“CAA”), amended by the Clean Air Act Amendments of 1990 (the “Amendments”), imposes controls on the emission of pollutants into the air. The Amendments required states to develop facility-wide permitting programs to comply with a wide range of federal air pollution regulatory programs. States also have their own air pollution regulatory programs that impose permitting and control requirements in addition to the federal requirements.
Due to differing EPA air quality standards in certain areas of the country, obtaining permits for constructing new emitting facilities or increasing emissions at existing facilities may be more complicated and may require more expensive emission controls than in other areas.
EPA has also promulgated greenhouse gas (“GHG”) regulations and is otherwise increasing its scrutiny of the oil and gas industry. In addition, certain states and regions have adopted or are considering various GHG regulations which may require controls separate from or in conjunction with federal programs.
It is possible that new or more stringent controls will be imposed on us through these programs which could have a material adverse effect on our maintenance capital expenditures and operating expenses.
State, Local and Foreign Regulations
We are also subject to other environmental laws and regulations adopted by the various states, localities and territories in which we operate. In certain instances, the regulatory standards adopted by the states and/or territories are more stringent than applicable federal laws. In addition, our BBH terminal in The Bahamas and our St. Lucia terminal are subject to the environmental regulatory programs applicable in those countries. While these regulatory programs are today less stringent than in the United States, they have the potential to impose material liabilities on us, particularly in the event of a spill or other release, and if they are made more stringent in the future, we could be required to make significant capital expenditures to meet the new standards. VTTI is subject to environmental regulatory regimes in the locations in which it operates, including the European Union and the United States. In the European Union, many of these laws and regulations are becoming increasingly stringent, and VTTI could be required to make additional capital expenditures to meet new standards.
Pipeline and Terminal Maintenance and Safety Regulation
The pipelines we operate are subject to regulation by the U.S. Department of Transportation (“DOT”), its agency, the Pipeline and Hazardous Materials Safety Administration (“PHMSA”), and state pipeline regulatory bodies as appropriate and consistent with the federal Pipeline Safety Act (“PSA”). The PSA and PHMSA implementing regulations govern the design, installation, testing, construction, operation, replacement and management of pipeline facilities and require any entity that owns or operates pipeline facilities to comply with applicable safety standards, to establish and maintain plans for inspection and maintenance and to comply with such plans and programs. Among others, these programs include: construction, operation and maintenance, integrity management for pipelines located in high consequence areas, operator qualification, control room management, public awareness, and drug and alcohol. Certain states in which we operate participate in oversight and inspection of intrastate and interstate pipeline facilities through certifications and agreements with PHMSA. For intrastate pipelines located in PHMSA certified states, the State may impose additional or more stringent pipeline safety regulations as long as they are not inconsistent with PHMSA standards.
16
We believe that we currently comply in all material respects with the pipeline safety laws and regulations. However, the industry, including us, will incur additional pipeline and tank integrity expenditures in the future, and we are likely to incur increased operating costs based on these and other government regulations.
The PSA was amended in 2011 and again in 2016. Combined, those statutory amendments have extended the jurisdictional reach of federal pipeline regulation, and mandated additional rulemaking by PHMSA. PHMSA issued two Interim Final Rules in 2016, including its new ability to issue ‘Emergency Orders’ without prior notice or hearing and to establish minimum standards for underground natural gas storage.
In 2017, PHMSA issued final rules to, among other things, address incident notification, which would impact both gas (49 CFR Part 192) and liquid regulations (49 CFR Part 195), and liquid pipeline integrity assessment, integrity management, and leak detection requirements. Rules regarding incident notification, among other things, were issued in January 2017 and became effective in March 2017. PHMSA issued a pre-publication copy of another final rule on liquid pipeline issues in January 2017. Before that rule became effective, the new Administration issued an Executive Order on January 20, 2017, freezing all pending federal rules. PHMSA subsequently withdrew the rule in light of the Administration’s Executive Orders on deregulation, but the agency plans to finalize a version of that rule in 2018. Because parts of the new PHMSA rule were directed by Congressional mandates which are to be exempt from the regulatory freeze, it is not yet clear whether and to what extent the final rule will continue to be subject to the regulatory freeze, or be allowed to become effective.
Safety
We are also subject to the requirements of the Occupational Safety and Health Act (“OSHA”) and comparable state statutes. In addition, the OSHA hazard communication standard requires that information be maintained about hazardous materials used or produced in operations and that this information be provided to employees, state and local government authorities and citizens. At qualifying facilities, we are subject to OSHA Process Safety Management regulations that are designed to prevent or minimize the consequences of catastrophic releases of toxic, reactive, flammable or explosive chemicals. We believe that our operations comply in all material respects with applicable OSHA requirements, including general industry standards, record-keeping and the training and monitoring of occupational exposures.
We cannot predict whether or in what form any new legislation or regulatory requirements might be enacted or adopted or the costs of compliance. In general, any such new regulations could increase operating costs and impose additional capital expenditure requirements, but we do not presently expect that such costs or capital expenditure requirements would have a material adverse effect on our results of operations or financial condition.
Environmental Hazards and Insurance
Our business involves a variety of risks, including the risk of natural disasters, adverse weather, fire, explosions, and equipment failures, any of which could lead to environmental hazards such as crude oil and petroleum product spills and other releases. If any of these should occur, we could incur legal defense costs and environmental remediation costs, and could be required to pay amounts due to injury, loss of life, damage or destruction to property, natural resources and equipment, pollution or environmental damage, regulatory investigation and penalties and suspension of operations.
We are covered by site pollution legal liability insurance policies with per incident and aggregate limits of $100.0 million, subject to a maximum self-insured retention of $5.0 million. The policies include coverage for sudden and accidental or gradual releases at our listed sites, and also include a contractor’s pollution coverage endorsement. The policies insure: (i) claims, remediation costs, and associated legal defense expenses for pollution conditions at, or migrating from, a covered location, and (ii) the transportation risks associated with moving waste from a covered location to any location for unloading or disposal. The site pollution legal liability policies contain exclusions, conditions, and limitations that could apply to a particular pollution claim, and may not cover all claims or liabilities we incur. The insurance policies expire on May 1, 2018.
In addition to the site pollution legal liability insurance policies, we maintain excess liability insurance policies that provide coverage for claims involving sudden and accidental releases with aggregate and per occurrence limits of $375 million. Coverage under the excess liability insurance policies is secondary to the site pollution legal liability policies for sudden and accidental releases. The pollution coverage provided in the excess liability insurance policies contain exclusions, definitions, conditions and limitations that could apply to a particular pollution claim, and may not cover all claims or liabilities we incur. The insurance policies expire on May 1, 2018.
17
We generally are not entitled to seek indemnification from our contractual counterparties for any environmental damage caused by the release of products we store, throughput or transport for such counterparties. As discussed above, we maintain insurance policies that are designed to mitigate the risk that we may incur in connection with any such release of products from our facilities, and we believe that the policy limits under site pollution legal liability and excess liability insurance policies are within the range that is customary for entities of our size that operate in our business segments and are appropriate for our business.
We attempt to reduce our exposure to third-party liability by requiring indemnification and access to third party insurance from our contractors or entities who require access to our facilities and our right-of-way. We have requirements for limits of insurance provided by third parties which we believe are in accordance with industry standards and proof of third-party insurance documentation is retained prior to commencement of work.
We have written plans for responding to emergencies along our pipeline systems and at our terminalling and processing facilities. These plans, which describe the organization, responsibilities and actions for responding to emergencies, are reviewed annually and updated as necessary. Our facilities are designed with product containment structures, and we maintain various additional crude oil containment and recovery equipment that would be deployed in the event of an emergency. We are a member of ten oil spill cooperatives or mutual aid groups, and we maintain more than 50 contract relationships with United States Coast Guard certified spill response organizations, spill response contractors and remediation management consultants. We also contract with a third-party to provide enterprise-wide emergency spill response services for certain incidents, which includes the strategic staging of response equipment at our BBH, Yabucoa and St. Lucia terminals. This service contract provides access to over 100 additional local United States Coast Guard certified spill response organizations. This further ensures access to spill response equipment (including boom, recovery pumps, response vehicles, response vessels and response trailers), monitoring and sampling equipment, personal protective equipment and technical expertise needed to respond to an emergency event. We also perform spill response drills to review and exercise the response capabilities of our personnel, contractors and emergency management agencies. Additionally, we have a Crisis Management Team within our organization to provide strategic direction, ensure availability of company resources and manage communications in the event of an emergency situation.
Available Information
We file annual, quarterly and current reports and other documents with the SEC under the Securities Exchange Act of 1934. The public can obtain any documents that we file with the SEC at www.sec.gov. We also make available free of charge our Annual Report on Form 10-K, Quarterly Reports on Form 10-Q, Current Reports on Form 8-K and any amendments to those reports filed or furnished pursuant to Section 13(a) or 15(d) of the Securities Exchange Act of 1934 as soon as reasonably practicable after filing such materials with, or furnishing such materials to, the SEC, on or through our internet website, www.buckeye.com. We are not including the information contained on our website as a part of, or incorporating it by reference into, this Report.
You can also find information about us at the offices of the NYSE, 20 Broad Street, New York, New York 10005 or at the NYSE’s internet website, www.nyse.com.
18
Item 1A. Risk Factors
There are many factors that may affect us and investments in us. Security holders and potential investors in our securities should carefully consider the risk factors set forth below, as well as the discussion of other factors that could affect us or investments in us included elsewhere in this Report. If one or more of these risks were to materialize, our business, financial position or results of operations could be materially and adversely affected. We are identifying these risk factors as important risk factors that could cause our actual results to differ materially from those contained in any written or oral forward-looking statements made by us or on our behalf.
Risks Inherent in our Business
Changes in petroleum demand and distribution and weakness in the United States economy may adversely affect our business.
Demand for the services we provide depends upon the demand for the products we handle in the regions we serve and the supply of products in the regions connected to our pipelines or from which our customers source products handled by our terminals. Prevailing economic conditions, refined petroleum product, fuel oil and crude oil price levels and weather affect the demand for liquid petroleum products. Changes in transportation and travel patterns in the areas served by our pipelines also affect the demand for petroleum products because a substantial portion of the refined petroleum products transported by our pipelines and throughput at our terminals is ultimately used as fuel for motor vehicles and aircraft. If these factors result in a decline in demand for refined petroleum products, our pipeline and terminals business would be particularly susceptible to adverse effects because we operate without the benefit of exclusive franchises from government entities and generally without long-term contracts.
Demand for the services we provide in the Caribbean is partially driven by global demand for refinery feedstock supplied from United States and Latin American crude oil production, and by Latin American demand for clean petroleum products supplied from the United States and European refinery output. Changes in these and other global patterns of supply and demand for fuel oil, crude oil and clean petroleum products could affect the demand for the services we provide in the Caribbean and the prices we can charge for those services.
In recent years, the federal government has enacted renewable fuel or energy efficiency statutory mandates that may have the impact over time of reducing the demand for fuel oil or clean refined petroleum products, particularly with respect to gasoline, in certain markets. Other legislative changes may similarly alter the expected demand and supply projections for refined petroleum products in ways that cannot be predicted.
Energy conservation, changing sources of supply, structural changes in the oil industry and new energy technologies also could adversely affect our business. We cannot predict or control the effect of these factors on us.
Economic conditions worldwide have from time to time contributed to slowdowns in the oil and gas industry, as well as in the specific segments and markets in which we operate, resulting in reduced oil production, reduced supply or demand and increased price competition for our products and services. In addition, economic conditions could result in a loss of customers in our operating segments because their access to the capital necessary to purchase services we provide is limited. Our operating results may also be affected by uncertain or changing economic conditions in certain regions of the United States. If global economic and market conditions (including volatility or sustained weakness in commodity markets) or economic conditions in the United States remain uncertain or persist, spread or deteriorate further, we may experience material impacts on our business, financial condition, results of operations or cash flows.
A significant decline in production at certain refineries served by certain of our pipelines and terminals, disruptions at facilities on which our customers rely, or a fundamental change in the source of supply of petroleum products to a region, could materially reduce the volume of liquid petroleum products we transport and adversely impact our operating results.
Refineries that are the primary source of supply of product to our pipelines and terminals could partially or completely shut down their operations, temporarily or permanently, due to factors such as unscheduled maintenance, catastrophes, labor difficulties, environmental proceedings or other litigation, loss of significant downstream customers; or legislation or regulation that adversely impacts the economics of refinery operations. For example, a significant decline in production at the Wood River refinery, Whiting refinery, Paulsboro refinery or Lima refinery could negatively impact the financial performance of such assets and adversely affect our business, financial position, results of operations or cash flows.
19
In addition, if there is a fundamental shift in the primary source of supply of petroleum products to a region our pipelines serve and our pipeline infrastructure in the region is not well-suited to serve the new primary source, the performance of such assets could be negatively impacted, and adversely affect our business, financial position, results of operations and cash flows.
Furthermore, our customers are dependent upon the ongoing operations of certain facilities owned or operated by such customers or third parties, such as the pipelines, barges and retail fuel distribution assets, as well as refineries and other facilities that generate products our customers handle. Any significant interruption at these facilities or inability to transport products to or from these facilities or to or from our customers for any reason would adversely affect our customers’ operations, and possibly cash flow and in turn this could affect our operations and cash flow and ability to make distributions to our unitholders. Operations at our facilities and at the facilities owned or operated by our customers and their suppliers could be partially or completely shut down, temporarily or permanently, as the result of any number of circumstances that are not within our control.
Competition could adversely affect our operating results.
Our Domestic Pipelines & Terminals and Global Marine Terminals segments compete with other existing pipelines and terminals that provide similar services in the same markets as our assets. In addition, our competitors could construct new assets or redeploy existing assets in a manner that would result in more intense competition in the markets we serve. We compete with other transportation, storage and distribution alternatives on the basis of many factors, including but not limited to rates, service levels, geographic location, connectivity and reliability. Our customers could utilize the assets and services of our competitors instead of our assets and services, or we could be required to lower our prices or increase our costs to retain our customers.
Our Merchant Services segment buys and sells refined petroleum products in connection with its marketing activities, and must compete with major energy companies, their marketing affiliates, and independent brokers and marketers of widely varying sizes, financial resources and experience. Some of these companies have superior access to capital resources, which could affect our ability to effectively compete with them.
All of these competitive pressures could have a material adverse effect on our business, financial condition, results of operations and cash flows.
Mergers among our customers and competitors could result in lower volumes being shipped on our pipelines and stored in our terminals, thereby reducing the amount of cash we generate.
Mergers between existing customers could provide strong economic incentives for the combined entities to utilize their existing pipeline and terminal systems instead of ours. As a result, we could lose some or all of the volumes and associated revenues from these customers, and we could experience difficulty in replacing those lost volumes and revenues. Because most of our operating costs are fixed, a reduction in volumes would result in not only a reduction of revenues, but also a decline in Adjusted EBITDA (see “Non-GAAP Financial Measures” in Item 7 for a discussion of Adjusted EBITDA, which is our primary measure of performance), net income and cash flow of a similar magnitude, which would reduce our ability to meet our financial obligations and pay cash distributions.
We are a holding company and depend entirely on cash flows from our operating subsidiaries to service our debt obligations and pay cash distributions to our unitholders. Our distributions are not guaranteed.
We are a holding company with no material operations, and, as a result, our ability to pay distributions to our unitholders and to service our debt obligations is dependent upon the earnings and cash flows of our operating subsidiaries. If we do not receive distribution of earnings, loans or other payments from our operating subsidiaries, we will not be able to meet our debt service obligations or to make cash distributions to our unitholders. Among other things, this would adversely affect the market price of our LP Units. We are currently bound by the terms of our Credit Facility, which prohibit us from making distributions to our unitholders if a default under the Credit Facility exists at the time of the distribution or would result from the distribution. Our operating subsidiaries may from time to time incur additional indebtedness under agreements that contain restrictions which could further limit each operating subsidiary’s ability to make distributions to us.
20
Our distributable cash flow does not depend solely on profitability, which is affected by non-cash items. As a result, we could pay cash distributions during periods when we record net losses and could be unable to pay cash distributions during periods when we record net income. In addition, the amount of cash we generate from operations is affected by numerous factors beyond our control, fluctuates from quarter to quarter and may change over time. Significant or sustained reductions in the cash generated by our operations could reduce our ability to pay quarterly distributions. Any failure to pay distributions at expected levels could result in a loss of investor confidence and a decrease in the value of our unit price.
We may incur unknown and contingent liabilities from assets we have acquired.
Some of the assets we have acquired have been used for many years to distribute, store or transport petroleum products. Releases from terminals or along pipeline rights-of-way may have occurred prior to our acquisition. In addition, releases may have occurred in the past that have not yet been discovered, which could require costly future remediation.
We perform a certain level of diligence in connection with our acquisitions and attempt to ascertain the extent of liabilities that might be associated with an acquired facility, but there may be unknown and contingent liabilities related to our acquisitions of which we are unaware.
If a significant release or event occurred in the past at any of our acquired assets and we are responsible for all or a significant portion of the liability associated with such release or event, it could adversely affect our business, financial position, results of operations and cash flows. We could be liable for unknown obligations relating to any of our acquired assets, for which indemnification or insurance is not available, which could materially adversely affect our business, financial condition, results of operations or cash flow.
If we incorrectly predict the future results of acquired operations or assets, we may not realize all of the benefits we expect from an acquisition. We may make dispositions on terms that are less favorable than we anticipated.
Part of our business strategy includes making acquisitions and, when appropriate, dispositions. In evaluating acquisitions and dispositions, we prepare one or more financial cases based on a number of business, industry, economic, legal, regulatory, and other assumptions applicable to the proposed transaction. Although we expect a reasonable basis will exist for those assumptions, the assumptions typically involve current estimates of future conditions. Many assumptions are beyond our control and may not materialize. Because of the uncertainty and risk of inaccuracy associated with these assumptions, including financial projections, we may not realize the full benefits we anticipate from an acquisition, or we may encounter unanticipated difficulties locating buyers and securing favorable terms for dispositions, each of which could materially adversely affect our business, financial condition, results of operations or cash flow. Dispositions may also involve continued financial involvement in the divested business, such as through continuing minority equity ownership, guarantees, indemnities or other financial obligations. Under these arrangements, performance by the divested businesses or other conditions outside of our control could adversely affect our future financial results.
Potential future acquisitions and organic growth projects, if any, may affect our business by substantially increasing the level of our indebtedness and contingent liabilities and increasing the risks of our being unable to effectively complete and integrate these new operations.
From time to time, we evaluate and acquire assets and businesses that we believe complement our existing assets and businesses. If we consummate any future acquisitions, our capitalization and results of operations may change significantly. We also routinely execute organic growth projects that complement our existing assets. Our decisions regarding new organic growth projects rely on numerous estimates, including predictions of future demand for our services, future supply shifts, crude oil and refined products production estimates, commodity price environments, economic conditions and potential changes in the financial condition of our customers. Our predictions of such factors could cause us to forgo certain investments or to lose opportunities to competitors who make investments based on more aggressive predictions. Acquisitions and organic growth projects, including the integration of assets into our existing businesses, may require substantial capital.
Acquisitions and organic growth projects involve numerous risks, including difficulties in the assimilation of the assets and operations of the acquired businesses, inefficiencies and difficulties that arise because of unfamiliarity with new assets and the businesses associated with them and new geographic areas and the diversion of management’s attention from other business concerns. Further, we may experience unanticipated delays in realizing the benefits of an acquisition or project or we may be unable to integrate certain assets to the extent such assets relate to a business for which we have no or limited experience. Our failure to properly assess the levels of capital or time required to acquire or build and integrate these assets, or our failure to accurately predict the returns from these assets could have an adverse effect on our business, financial condition, results of operations or cash flows.
21
Debt securities we issue are, and will continue to be, junior to claims of our operating subsidiaries’ creditors.
Our outstanding debt securities are structurally subordinated to the claims of our operating subsidiaries’ creditors. In addition, any debt securities we issue in the future will likewise be subordinated in the same manner. Holders of the debt securities will not be creditors of our operating subsidiaries. Our claim to the assets of our operating subsidiaries derives from our own ownership interests in those operating subsidiaries. Claims of our operating subsidiaries’ creditors will generally have priority as to the assets of our operating subsidiaries over our own ownership interests and will therefore have priority over the holders of our debt, including our debt securities.
Limited access to the debt and equity markets or adverse credit events could adversely affect our business.
Our ability to acquire assets or businesses or make other growth capital investments depends on whether we can access adequate financing. Changes in the debt and equity markets, including market disruptions, limited liquidity, and interest rate volatility, may limit our access to the capital markets, increase the cost of financing and adversely impact our ability to refinance maturing debt. Instability in the financial markets may increase our cost of capital while reducing the availability of funds, affecting our ability to raise capital. If access to the debt and equity markets were limited or not available, our ability to grow our business through acquisitions or other capital investments could be restricted, and it is not certain if other adequate financing options would be available to us on terms and conditions that are acceptable. Any disruption could require us to take additional measures to conserve cash until the markets stabilize or until we can arrange alternative credit arrangements or other funding for our business needs. Such measures could include reducing or delaying investment activities, reducing our operating expenses, limiting our distributions or reducing other uses of cash. Furthermore, a downgrade below our current ratings levels by any of the credit rating agencies could increase our borrowing costs, reduce our borrowing capacity and cause our counterparties to reduce the amount of open credit we receive from them. This could negatively impact our ability to capitalize on market opportunities. Loss of our investment grade credit rating could also adversely impact our cash flows, our ability to make distributions at our current levels and the value of our outstanding equity and debt securities. Under such circumstances, we may be unable to execute our growth strategy or take advantage of other business opportunities, which could negatively impact our business.
Our rate structures are subject to regulation and change by FERC; required changes could be adverse.
BPLC, Wood River, BPL Transportation, Buckeye Linden and NORCO are interstate common carriers regulated by FERC under the Interstate Commerce Act, the Energy Policy Act of 1992 and the Department of Energy Organization Act. FERC’s primary ratemaking methodology is indexing rates for inflation. Where circumstances justify it, FERC permits pipelines to use one of three alternatives to index-based rates: market-based, cost-based, or settlement-based rates. A pipeline is allowed to charge (1) market-based rates if the pipeline establishes that it does not possess significant market power in a particular market, (2) cost-based rates if the pipeline establishes that its costs substantially exceed its indexed rates, and (3) settlement-based rates if the rates are agreed by all shippers receiving a service.
The indexing methodology is used to establish rates on the pipelines owned by Wood River, BPL Transportation and NORCO, and for certain rates charged by BPLC. In December 2015, FERC amended its regulations to change the index to the Producer Price Index (“PPI”) — finished goods plus 1.23% effective July 1, 2016. If the index were to be negative, we could be required to reduce the rates charged by Wood River, BPL Transportation and NORCO, and certain rates charged by BPLC, if they exceed the new maximum allowable rate. In addition, changes in the PPI might not fully reflect actual increases in the costs associated with these pipelines, thus potentially hampering our ability to recover our costs by relying on the index.
In addition to the risks described above, at any time shippers on any of our FERC-regulated pipelines have the right to challenge the application of the index to a pipeline’s rates or the underlying rates themselves as being unjust and unreasonable, subject to the FERC’s cost-of-service standards or that market-based authority is no longer justified because we possess significant market power in a particular market. Such shipper challenges may seek adjustments to our rates prospectively and, subject to limitations, for certain past periods. If a significant shipper challenge were to result in an outcome that is unfavorable to us, our business, financial condition, results of operations and/or cash flows could be adversely impacted.
Climate change legislation or regulations restricting emissions of greenhouse gases or setting fuel economy or air quality standards could result in increased operating costs or reduced demand for the liquid petroleum products and other hydrocarbon products that we transport, store or otherwise handle in connection with our business.
In recent years, federal authorities such as the EPA and various state regulatory bodies have increasingly sought to regulate emissions of carbon dioxide, methane and other GHG. Such regulation has targeted emissions from large industrial sources, such as factories, refineries and other manufacturing facilities, and for increasingly large classes of motor vehicles.
22
While most of the currently effective regulations have not had a material effect on our operations, expansions of the existing regulations or any future laws or regulations that may be adopted to address GHG emissions could require us to incur additional costs to reduce emissions of GHG associated with our operations. The effect on our operations could include increased costs to operate and maintain our facilities, measure and report our emissions, install new emission controls on our facilities, acquire allowances to authorize our GHG emissions, pay any taxes related to our greenhouse gas emissions and administer and manage a GHG emissions program. While we may be able to include some or all of such increased costs in the rates we charge, such recovery of costs is uncertain and may depend on events beyond our control, including the outcome of future rate proceedings before the FERC and the provisions of any final regulations. In addition, laws or regulations regarding fuel economy, air quality or GHG gas emissions (for motor vehicles or otherwise) could include efficiency requirements or other methods of curbing carbon emissions that could adversely affect demand for the liquid petroleum products and other hydrocarbon products that we transport, store or otherwise handle in connection with our business. A significant decrease in demand for petroleum products would have a material adverse effect on our business, financial condition, results of operations or cash flows.
In addition to the regulatory and associated financial risks from climate change discussed above, the effects of climate change may have significant physical impacts, such as an increase in sea level, wetland and barrier island erosion, flooding and increased frequency and severity of storms. We own assets and have employees in, and serve, communities that are at risk of being adversely affected by the physical impacts of climate change and, if any such effects were to occur, they could have an adverse impact on our assets and operations.
Environmental regulation may impose significant costs and liabilities on us.
We are subject to federal, state and local laws and regulations relating to the protection of the environment. Risks of substantial environmental liabilities are inherent in our operations, and we cannot assure you that we will not incur material environmental liabilities. Additionally, our costs could increase significantly, and we could face substantial liabilities, if, among other developments, environmental laws, regulations and enforcement policies become more rigorous; or claims for property damage or personal injury resulting from our operations are filed.
Existing or future state or federal government regulations relating to certain chemicals or additives in gasoline or diesel fuel could require capital expenditures or result in lower pipeline volumes and thereby adversely affect our results of operations and cash flows.
Changes made to governmental regulations governing the components of liquid petroleum products may necessitate changes to our pipelines and terminals which may require significant capital expenditures or result in lower pipeline volumes. For instance, the increasing use of ethanol as a fuel additive, which is blended with gasoline at product terminals, may lead to reduced pipeline volumes and revenue which may not be totally offset by increased terminal blending fees we may receive at our terminals.
DOT and state-level regulations may impose significant costs and liabilities on us.
Our pipeline operations are subject to regulation by the DOT and by some of the states in which we do business. Certain states, particularly California, have been reviewing pipeline safety regulations and increasing inspections and audits. These federal regulations require, among other things, that pipeline operators engage in a regular program of pipeline integrity testing and other inspections to assess, evaluate, repair and validate the integrity of their pipelines, which, in the event of a leak or failure, could affect populated areas, unusually sensitive environmental areas or commercially navigable waterways. In compliance with these regulations, we conduct pipeline integrity tests on an ongoing and regular basis. Depending on the results of these integrity tests, we could incur significant and unexpected capital and operating expenditures, not accounted for in anticipated capital or operating budgets, in order to repair such pipelines to ensure their continued safe and reliable operation. In addition, any new regulations that are the result of PSA 2011, 2016 or any subsequent PSA reauthorization laws or new DOT pipeline safety regulations may affect our operations.
23
Our international operations may be adversely affected by economic, political and regulatory developments.
BBH’s terminalling facility and the St. Lucia terminal are located in The Bahamas and St. Lucia, respectively. VTTI’s operations span the globe, with key locations predominantly located in Northwest Europe, the Middle East and Southeast Asia. As a result, we are exposed to the risks of international operations, including political, economic and regulatory developments and changes in laws or policies affecting our terminalling operations, restrictions on foreign exchange and repatriation, as well as changes in the policies of the United States affecting trade, taxation and investment in other countries. Any such developments or changes could have a material adverse effect on our business, results of operations and cash flow.
Compliance with laws and regulations that apply to our international operations increases the cost of doing business and could interfere with our ability to offer services or expose us to fines and penalties. These numerous laws and regulations include the Foreign Corrupt Practices Act and local laws prohibiting corrupt payments to government officials or agents. Although policies designed to fully ensure compliance with these laws are in place, employees, contractors, or agents may violate the policies. Any such violations could include prohibitions on our ability to offer services internationally and could have a material adverse effect on our business, financial results and cash flow.
We may not be able to fully implement or capitalize upon planned organic growth projects.
We have a number of organic growth projects that involve the construction, expansion or modification of existing assets. Many of these projects involve numerous regulatory, environmental, commercial, economic, weather-related, political and legal uncertainties that are beyond our control, including the following:
• | As these projects are undertaken, required approvals, permits and licenses may not be obtained, may be delayed or may be obtained with conditions that materially alter the expected return associated with the underlying projects; |
• | A depressed crude oil price environment may make it more difficult for producers and other customers to commit to long-term contracts that provide commercial support for certain organic growth projects. |
• | Despite the fact that we will expend significant amounts of capital during the construction phase of these projects, revenues associated with these organic growth projects will not materialize until the projects have been completed and placed into commercial service, and the amount of revenue generated from these projects could be significantly lower than anticipated for a variety of reasons; |
• | We may not be able to secure, or we may be significantly delayed in obtaining, all of the rights of way or other real property interests we need to complete such projects, or the costs we incur in order to obtain such rights of way or other interests may be greater than we anticipated; |
• | We may construct pipelines, facilities or other assets in anticipation of market demand that dissipates or market growth that never materializes; |
• | Due to unavailability or costs of materials, supplies, power, labor or equipment, the cost of completing these projects could turn out to be significantly higher than we budgeted and the time it takes to complete construction of these projects and place them into commercial service could be significantly longer than planned; and |
• | The completion or success of our projects may depend on the completion or success of third-party facilities over which we have no control. |
As a result of these uncertainties, the anticipated benefits associated with our capital projects may not be achieved. In turn, this could negatively impact our cash flow and our ability to make or increase cash distributions to our unitholders.
24
Our results could be adversely affected by volatility in the price of refined petroleum products.
The Merchant Services segment buys and sells refined petroleum products in connection with its marketing activities. If the values of refined petroleum products change in a direction or manner that we do not anticipate, we could experience financial losses from these activities. Furthermore, when refined petroleum product prices decrease rapidly, we may be unable to promptly pass our additional costs to our customers, resulting in lower margins for us which could adversely affect our results of operations. Factors that could cause significant increases or decreases in commodity prices include changes in supply due to production constraints, weather, governmental regulations, and changes in consumer demand. It is our practice to maintain a position that is substantially balanced between commodity purchases, on the one hand, and expected commodity sales or future delivery obligations, on the other hand. Through these transactions, we seek to establish a margin for the commodity purchased by selling the same commodity for physical delivery to third-party users, such as wholesalers or retailers. While our hedging policies are designed to minimize commodity price risk, some degree of exposure to unforeseen fluctuations in market conditions remains. For example, any event that disrupts our anticipated physical supply could expose us to risk of loss resulting from price changes if we are required to obtain alternative supplies to cover these sales transactions. In addition, we are also exposed to basis risk which is created when a commodity of a certain grade or location is purchased, sold, or exchanged for a like commodity at a different time or location. For example, we use NYMEX traded products, which deliver in New York Harbor, to hedge our commodity risk associated with physical transactions that will be delivered at other locations, such as Macungie, Pennsylvania. We are also susceptible to basis risk in our hedging activities that arises when a commodity, such as the purchase of heating oil at one location must be hedged against the New York Harbor ultra low sulfur diesel futures contract as a result of limitations within the financial markets for derivative products.
The loss of one or more key customers in our Global Marine Terminals segment could adversely affect our results of operations and cash flow.
BBH’s storage revenue accounted for approximately 23% of total revenue in the Global Marine Terminals segment for the year ended December 31, 2017. Currently, BBH has a diversified set of storage customers, consisting of major oil companies, energy companies, physical traders and national oil companies. However, for the year ended December 31, 2017, 40% and 59% of BBH’s storage revenue was derived from the top one and the top three customers, in the aggregate, respectively. We expect BBH to continue to derive a substantial portion of its total revenue from a small number of customers in the future. BBH may be unsuccessful in renewing its storage contracts with its customers, and those customers may discontinue or reduce contracted storage from BBH. If any of BBH’s customers, in particular its top three customers, significantly reduces its contracted storage with BBH and if BBH is unable to find other storage customers on terms substantially similar to the terms under BBH’s existing storage contracts, our business, results of operations and cash flow could be adversely affected.
Additionally, revenue from Buckeye Texas, which is contracted predominantly to one customer under long-term take-or-pay arrangements, accounted for approximately 38% of total revenue in the Global Marine Terminals segment for the year ended December 31, 2017. If any one or more of our long-term take-or-pay arrangements with this customer are terminated and we are unable to secure comparable alternative arrangements with one or more third parties, we may not be able to generate sufficient additional revenue to fully replace that generated by the current customer.
Similarly, a majority of VTTI’s 2017 revenue was derived from its primary customer, Vitol. If a significant portion of VTTI’s contractual arrangements with Vitol is terminated and VTTI is unable to secure comparable alternative arrangements with one or more third parties, VTTI may not be able to generate sufficient additional revenue to fully replace that generated by the current customer, which may have a significant adverse effect on its ability to pay distributions to us.
A decrease in storage contract renewals or renewals at substantially lower rates at our storage terminals could cause our storage revenue to decline, which could adversely impact our results of operations and cash flow.
The revenue we earn from storage services at our storage terminals is provided for in contracts negotiated with our storage services customers. Many of those contracts are for multi-year periods and require our customers to pay a fixed rate for storage capacity regardless of market conditions during the contract period. Changing market conditions, including changes in petroleum product supply or demand patterns, availability of storage, forward-price structure, financial market conditions, regulations, accounting rules or other factors could cause our customers to be unwilling to renew their storage services contracts with us when those contracts terminate, or make them willing to renew only at lower rates or for shorter contract periods. Failure by our customers to renew their storage contracts on terms and at rates substantially similar to our existing contracts could result in lower utilization of our facilities and could adversely impact our results of operations and cash flow.
25
Reduced volatility in energy prices or new government regulations could discourage our storage customers from holding positions in petroleum products, which could adversely affect the demand for our storage services.
We have constructed and continue to build new storage tanks in response to increased customer demand for storage. Many of our competitors have also built new storage facilities. The demand for new storage has resulted in part from our customers’ desire to have the ability to take advantage of profit opportunities created by volatility in the prices of petroleum products. If the prices of petroleum products become relatively stable, or if federal or state regulations are passed that discourage our customers from storing these commodities, demand for our storage services could decrease, in which case we may be unable to lease storage capacity or be forced to reduce the rates we charge for storage services capacity, and we may experience material impacts on our business, financial condition, results of operations or cash flows.
Failure of critical information technology systems as a result of cybersecurity breaches and other disruptions could compromise our information and expose us to liability, which could cause our business and reputation to suffer and reduce the amount of cash available for distribution.
We utilize information technology systems to operate our assets and manage our businesses. Some of these systems are proprietary systems that require specialized programming capabilities, while others are based upon or reside on technology that has been in service for many years. Cybersecurity attacks are evolving and include but are not limited to, malicious software, attempts to gain unauthorized access to, or otherwise disrupt, our pipeline control systems, attempts to gain unauthorized access to proprietary information, and other electronic security breaches that could lead to disruptions in critical systems, including our pipeline control systems, unauthorized release of confidential or otherwise protected information and corruption of data. Failures of our information technology systems as a result of cybersecurity attacks or other disruptions could result in a breach of critical operational or financial controls and lead to a disruption of our operations, commercial activities or financial processes. Similarly, cybersecurity attacks or other disruptions impacting significant customers and/or suppliers could also lead to a disruption of our operations or commercial activities. These events could damage our reputation and cause us to incur liabilities that have a material adverse impact on the Partnership, including financial losses from remedial actions, business interruptions, loss of business and reduced ability to pay cash distributions.
Terrorist attacks or other security threats could adversely affect our business.
Since the attacks of September 11, 2001, the United States government has issued warnings that energy assets, specifically our nation’s pipeline infrastructure, may be the future target of terrorist organizations. In addition to the threat of terrorist attacks, we face various other security threats, including cybersecurity threats to gain unauthorized access to sensitive information or systems or to render data or systems unusable; threats to the safety of our employees; threats to the security of our facilities, such as terminals and pipelines, and infrastructure or third-party facilities and infrastructure. These developments have subjected our operations to increased risks.
Although we utilize various procedures and controls to monitor these threats and mitigate our exposure to security threats, there can be no assurance that these procedures and controls will be sufficient in preventing security threats from materializing. If any of these events were to materialize, they could lead to losses of sensitive information, critical infrastructure, personnel or capabilities, essential to our operations and could have a material adverse effect on our reputation, financial position, results of operations, or cash flows.
The Department of Homeland Security promulgated the Chemical Facility Anti-Terrorism Standards (“CFATS”) to regulate the security of facilities that handle certain chemicals. We submit to the Department of Homeland Security certain required information concerning our facilities in compliance with CFATS and, as a result, several of our facilities have been determined to be “high risk” by the Department of Homeland Security. Due to this determination, we are required to prepare a security vulnerability assessment and, in certain locations, develop and implement site security plans required by CFATS. At this time, we do not believe that compliance with CFATS will have a material effect on our business, financial condition, results of operations or cash flows.
In addition to CFATS, our domestic operations are also subject to other laws and regulations promulgated and enforced by the Department of Homeland Security, the Department of Transportation and the United States Coast Guard, including TSA Pipeline Security Guidelines. Our operations in The Bahamas and in St. Lucia are subject to similar security-related regulations. We believe that we currently comply in all material respects with security-related laws and regulations. However, this is an area of continued regulatory developments for our industry and as such, we may incur increased operating costs based on developments associated with these regulations and ongoing compliance. At this time, we do not believe that future compliance with these requirements will have a material effect on our business, financial condition, results of operations or cash flows.
26
We could be adversely affected by violations of the U.S. Foreign Corrupt Practices Act and similar worldwide anti-bribery laws.
Our international operations require us to comply with a number of U.S. and international laws and regulations, including those involving anti-bribery and anti-corruption. For example, the U.S. Foreign Corrupt Practices Act (“FCPA”) and similar international laws and regulations prohibit improper payments to foreign officials for the purpose of obtaining or retaining business. The scope and enforcement of anti-corruption laws and regulations may vary.
We operate in parts of the world that have experienced governmental corruption to some degree, and in certain circumstances, strict compliance with anti-bribery laws may conflict with local customs and practices. Our compliance programs and internal control policies and procedures may not always protect us from reckless or negligent acts committed by our employees or agents. Violations of these laws, or allegations of such violations, could disrupt our business and result in a material adverse effect on our business and operations.
Additionally, if VTTI, or its or officers, directors, employees or agents, were determined to be in violation of anti-corruption laws, including the FCPA and the U.K. Bribery Act, VTTI could become subject to substantial fines, sanctions, civil and/or criminal penalties, or curtailment of VTTI’s operations in certain jurisdictions, which could adversely affect its business, results of operations or financial condition. Any such adverse effects could, in turn, adversely affect VTTI’s ability to make cash distributions to us.
Derivative reform mandated by the Dodd-Frank Act and rules and regulations under the Dodd-Frank Act may have an adverse effect on our ability to use certain derivative instruments to reduce the effect of commodity price, interest rate and other risks associated with our business.
Congress adopted the Dodd-Frank Wall Street Reform and Consumer Protection Act (the “Dodd-Frank Act”) in 2010. Among other things, the Dodd-Frank Act mandated significant changes to the over-the-counter derivative market and requires the Commodities Futures Trading Commission and the SEC and other regulators to promulgate rules and regulations establishing federal oversight and regulation of the over-the-counter derivative market. Although as of December 31, 2017, the rules and regulations under the Dodd-Frank Act have not had an adverse effect on our ability to use certain derivative instruments to reduce the effect of commodity price, interest rate and other risks associated with our business, such rules and regulations may have an adverse effect on our ability to do so in the future.
The rulemaking process under the Dodd-Frank Act has not been fully completed, and in certain cases where rule-making is final, the rules will be phased in over a period of time. As a result, it is not possible at this time to determine the full effect that the Dodd-Frank Act will have on our ability to continue to use the derivative products we currently utilize. The rules and regulations under the Dodd-Frank Act may increase the costs of certain derivative products as a result of the imposition of capital, margin, clearing and exchange-trading requirements either on us or on our counterparties. Any requirement to post more collateral to our counterparties in excess of what we currently post to collateralize our obligations may have a negative impact upon our liquidity. Position limits may be imposed upon certain derivative transactions, which may further restrict our ability to utilize these products. The effects of the rules and regulations under the Dodd-Frank Act may also reduce our ability to monetize or restructure our existing derivative contracts. If, as a result of the Dodd-Frank Act and the rules and regulations promulgated thereunder, we reduce our use of certain derivatives, our results of operations may become more volatile and our cash flows may be less predictable, which could adversely affect our ability to plan for and fund capital expenditures or increase our distributions. Any of these consequences could have a material adverse effect on us, our financial condition, and our results of operations.
27
Our business is exposed to customer credit risk, and we may not be able to fully protect ourselves against such risk.
Our businesses are subject to the risks of nonpayment and nonperformance by our customers. We have in the past and expect to continue to undertake capital expenditures based on commitments, including take-or-pay commitments, from customers upon which we expect to realize a return. Nonperformance by our customers of those commitments or termination of those commitments resulting from our inability to timely meet our obligations could result in substantial losses to us. In addition, some of our customers, counterparties and suppliers may be highly leveraged and subject to their own operating and regulatory risks and, even if our credit review and analysis mechanisms work properly, we may experience financial losses in our dealings with such parties. Volatility in commodity prices might have an impact on many of our customers, which in turn could have a negative impact on their ability to meet their obligations to us. We manage our exposure to credit risk through credit analysis and monitoring procedures, and sometimes collateral, such as letters of credit, prepayments, liens on customer assets and guarantees. However, these procedures and policies cannot fully eliminate customer credit risk, and to the extent our policies and procedures prove to be inadequate, it could negatively affect our financial condition and results of operations.
The marketing business in our Merchant Services segment enters into sales contracts pursuant to which customers agree to buy refined petroleum products from us at a fixed price on a future date. If our customers have not hedged their exposure to reductions in refined petroleum product prices and there is a price drop, then they could have a significant loss upon settlement of their fixed-price contracts with us, which could increase the risk of their nonpayment or nonperformance. In addition, we generally have entered into futures contracts to hedge our exposure under these fixed-price contracts to increases in refined petroleum product prices. If price levels are lower at settlement than when we entered into these futures contracts, then we will be required to make payments upon the settlement thereof. Ordinarily, this settlement payment is offset by the payment received from the customer pursuant to the associated fixed-price contract. We are, however, required to make the settlement payment under the futures contract even if a fixed-price contract customer does not perform. Nonperformance under fixed-price contracts by a significant number of our customers could have an adverse effect on our business, financial condition, results of operations or cash flows.
Our operations are subject to operational hazards and unforeseen interruptions for which we may not be insured or entitled to indemnification.
Our operations are subject to operational hazards and unforeseen interruptions such as natural disasters, adverse weather, accidents, fires, explosions, marine allisions, hazardous materials releases and other events beyond our control. These events might result in a loss of equipment or life, injury, or extensive property or environmental damage, as well as an interruption in our operations. Our operations are currently covered by property, casualty, workers’ compensation and environmental insurance policies. In the future, however, we may not be able to maintain or obtain insurance of the type and amount desired at reasonable rates. As a result of market conditions, premiums and deductibles for certain insurance policies have increased substantially, and could escalate further. In some instances, certain insurance could become unavailable or available only for reduced amounts of coverage. For example, insurance carriers are now requiring broad exclusions for losses due to war risk and terrorist acts. Further, our environmental pollution coverage is subject to exclusions, conditions and limitations that could apply to a particular pollution claim or may not cover all claims or liabilities we incur. The contracts with our customers and other business partners involve risk-allocation and indemnification provisions. However, pursuant to these contracts we generally may not seek indemnification from a counterparty for liabilities, including those associated with the release of petroleum products, arising at a time in which we are in possession of the product owned by the counterparty. If we were to incur a significant liability for which we were not fully insured, or insured at all, it could have a material adverse effect on our business, financial condition, results of operation or cash flows.
Our risk management policies cannot eliminate all commodity price risk and any noncompliance with our risk management policies could result in significant financial losses.
We follow risk management practices that are designed to minimize commodity price risk, credit risk and operational risk. These practices and policies cannot, however, eliminate all price and price-related risks. Additionally, noncompliance with such practices and policies by our employees or agents may create additional risk. We cannot make any assurances that we will detect and prevent all violations of our risk management practices and policies, particularly if deception or other intentional misconduct is involved. Any violations of these practices or policies by our employees or agents could result in significant financial losses.
28
Hurricanes and other severe weather conditions, which may become more frequent as a result of climatic changes, could damage our facilities or disrupt our marine terminals or the operations of their customers, which could have a material adverse effect on our business, financial results and cash flow.
The operations of our facilities, in particular our marine terminals, could be impacted by severe weather conditions, including hurricanes. Any such event could cause a serious business disruption or serious damage to our facilities, which could affect such facilities’ ability to provide services. Additionally, such events could impact our facilities’ customers, and they may be unable to utilize our services. In addition, many scientists believe that global climatic changes are occurring and are likely to lead to increased physical risks, including an increase in sea level, wetland and barrier island erosion, risks of flooding and changes in weather conditions, such as precipitation, average temperatures and extreme weather conditions or storms. We own assets in communities that may be at risk from sea level rise, changes in weather conditions, storms and loss of the protection offered by coastal wetlands. The portion of our assets that is located in these areas may be increasingly susceptible to storm damage that could be aggravated by wetland and barrier island erosion. Existing weather-related risks and increased risks from additional future climate changes could have a material adverse effect on our business, financial condition, results of operation or cash flows.
Increases in interest rates could adversely affect our unit price and our business.
Interest rates on future debt offerings could be higher than current levels, causing our financing costs to increase accordingly. An increase in interest rates could also cause a corresponding decline in demand for equity investments, in general, and in particular for yield-based equity investments such as our LP Units. Lower demand for our LP Units for any reason, including competition from other more attractive investment opportunities, would likely cause the trading price of our LP Units to decline. If we issue additional equity at a significantly lower price, material dilution to our existing unitholders could result.
Additionally, we use both fixed and variable rate debt, and we are exposed to market risk due to the floating interest rates on our Credit Facility. From time to time we use interest rate derivatives to hedge interest obligations on specific debt. In addition, interest rates on future debt offerings could be higher, causing our financing costs to increase accordingly. Our results of operations, cash flows and financial position could be adversely affected by significant increases in interest rates above current levels.
VTTI is subject to many of the same operational and business risks to which our wholly owned operations are subject and we have less control over the way VTTI manages these risks.
VTTI is subject to many of the risks described above, including risks related to shifts in supply and demand, competition, environmental risks, environmental and other regulations, the need to attract and retain customers, credit risks, and terrorism and natural disaster risks. Because we do not control VTTI, we may not be able to mitigate or protect against these risks as we would with our wholly owned assets and business. If VTTI’s business were to be negatively impacted by any of these risks, its results of operations, financial position and cash flows, as well as its ability to pay cash distributions to us could be adversely affected.
We have limited ability to influence significant business decisions affecting VTTI without also receiving the consent of Vitol.
Differences in views among the owners of VTTI could result in delayed decisions or in failures to agree on significant matters, potentially adversely affecting the business and results of operations or prospects of VTTI and, in turn, the amount of cash from operations distributed to us.
In addition, we do not control the day-to-day operations of the VTTI Entities. Our lack of control over the VTTI Entities’ day-to-day operations and the associated costs of such operations could result in our receiving lower cash distributions than we anticipate, which could have an adverse effect on our financial condition or cash flows.
29
Risks Relating to Partnership Structure
We may sell additional units, diluting existing interests of unitholders.
Our partnership agreement allows us to issue additional units and certain other equity securities without unitholder approval. There is no limit on the total number of units and other equity securities we may issue. We regularly issue additional units, through our at-the-market offering program and otherwise, and when we issue additional units or other equity securities, the proportionate partnership interest of our existing unitholders will decrease. The issuance could negatively affect the amount of cash distributed to unitholders and the market price of the units. Issuance of additional units will also diminish the relative voting strength of the previously outstanding LP Units.
Our partnership agreement limits the liability of our general partner and its directors and officers.
Our general partner and its directors and officers owe fiduciary duties to our unitholders. Provisions of our partnership agreement and partnership agreements for each of our operating partnerships, however, contain language limiting the liability of the general partner and its directors and officers to the unitholders for actions or omissions taken in good faith which do not involve gross negligence or willful misconduct. In addition, these partnership agreements grant broad rights of indemnification to the general partner and its directors, officers, employees and affiliates.
Unitholders may not have limited liability in some circumstances.
The limitations on the liability of holders of limited partnership interests for the obligations of a limited partnership have not been clearly established in some states. If it were determined that we had been conducting business in any state without compliance with the applicable limited partnership statute, or that the unitholders as a group took any action pursuant to our partnership agreement that constituted participation in the “control” of our business, then the unitholders could be held liable under some circumstances for our obligations to the same extent as a general partner.
Under applicable state law, our general partner has unlimited liability for our obligations, including our debts and environmental liabilities, if any, except for our contractual obligations that are expressly made without recourse to the general partner.
In addition, Section 17-607 of the Delaware Revised Uniform Limited Partnership Act provides that under some circumstances a unitholder may be liable to us for the amount of distributions paid to the unitholder for a period of three years from the date of the distribution.
Tax Risks to Unitholders
Our tax treatment depends on our status as a partnership for federal income tax purposes, as well as our not being subject to a material amount of entity-level taxation by individual states. If the Internal Revenue Service (“IRS”) were to treat us as a corporation for federal income tax purposes, or we become subject to entity-level taxation for state tax purposes, our cash available for distribution to you would be substantially reduced.
The anticipated after-tax economic benefit of an investment in our LP Units depends largely on our being treated as a partnership for federal income tax purposes.
Despite the fact that we are organized as a limited partnership under Delaware law, we will be treated as a corporation for U.S. federal income tax purposes unless we satisfy a “qualifying income” requirement. Based upon our current operations and the private letter rulings we have received with respect to certain aspects of our business, we believe we satisfy the qualifying income requirement. Failing to meet the qualifying income requirement or a change in current law could cause us to be treated as a corporation for U.S. federal income tax purposes or otherwise subject us to taxation.
If we were treated as a corporation for federal income tax purposes, we would pay U.S. federal income tax on our taxable income at the corporate tax rate, which, effective January 1, 2018, is currently a maximum of 21%. Distributions to you would generally be taxed again as corporate distributions, and no income, gains, losses or deductions would flow through to you. Because a tax would be imposed upon us as a corporation, our cash available for distribution to you would be substantially reduced. Therefore, treatment of us as a corporation would result in a material reduction in the anticipated cash flow and after-tax return to holders of our LP Units, likely causing a substantial reduction in the value of our LP Units.
30
Our partnership agreement provides that if a law is enacted or existing law is modified or interpreted in a manner that subjects us to taxation as a corporation or otherwise subjects us to entity-level taxation for U.S. federal, state, local or foreign income tax purposes, the minimum quarterly distribution amount and the target distribution amounts may be adjusted to reflect the impact of that law or interpretation on us. At the state level, several states have been evaluating ways to subject partnerships to entity-level taxation through the imposition of state income, franchise or other forms of taxation. If any state were to impose a tax upon us as an entity, the cash available for distribution to you would be reduced and the value of our LP Units could be negatively impacted.
The tax treatment of publicly traded partnerships or an investment in our LP Units could be subject to potential legislative, judicial or administrative changes and differing interpretations, possibly on a retroactive basis.
The present U.S. federal income tax treatment of publicly traded partnerships, including us, or an investment in our LP Units may be modified by administrative, legislative or judicial changes or differing interpretations at any time. From time to time, members of Congress propose and consider substantive changes to the existing federal income tax laws that affect publicly traded partnerships. Although there is no current legislative proposal, a prior legislative proposal would have eliminated the qualifying income exception to the treatment of all publicly-traded partnerships as corporations upon which we rely for our treatment as a partnership for U.S. federal income tax purposes.
In addition, on January 24, 2017, final regulations (the “Final Regulations”) regarding which activities give rise to qualifying income within the meaning of Section 7704 of the Internal Revenue Code of 1986, as amended (the “Code”) were published in the Federal Register. We do not believe the Final Regulations affect our ability to be treated as a partnership for U.S. federal income tax purposes.
However, any modification to the U.S. federal income tax laws may be applied retroactively and could make it more difficult or impossible for us to meet the exception for certain publicly traded partnerships to be treated as partnerships for U.S. federal income tax purposes. We are unable to predict whether any of these changes or other proposals will ultimately be enacted. Any such changes could negatively impact the value of an investment in our LP Units.
If the IRS were to contest the federal income tax positions we take, it may adversely impact the market for our LP Units, and the costs of any such contest would reduce cash available for distribution to you.
We have not requested a ruling from the IRS with respect to our treatment as a partnership for federal income tax purposes. The IRS may adopt positions that differ from the positions we take. It may be necessary to resort to administrative or court proceedings to sustain some or all of the positions we take. A court may not agree with some or all of the positions we take. Any contest with the IRS may materially and adversely impact the market for our LP Units and the price at which they trade. Moreover, the costs of any contest between us and the IRS will result in a reduction in cash available for distribution to our unitholders and thus will be borne indirectly by our unitholders.
If the IRS makes audit adjustments to our income tax returns for tax years beginning after December 31, 2017, it (and some states) may assess and collect any taxes (including any applicable penalties and interest) resulting from such audit adjustment directly from us, in which case our cash available for distribution to our unitholders might be substantially reduced and our current and former unitholders may be required to indemnify us for any taxes (including any applicable penalties and interest) resulting from such audit adjustments that were paid on such unitholders’ behalf.
Pursuant to the Bipartisan Budget Act of 2015, for tax years beginning after December 31, 2017, if the IRS makes audit adjustments to our income tax returns, it (and some states) may assess and collect any taxes (including any applicable penalties and interest) resulting from such audit adjustment directly from us. Under our limited partnership agreement, our general partner is permitted to make elections under the new rules to either pay the taxes (including any applicable penalties and interest) directly to the IRS or, if we are eligible, issue a revised Schedule K-1 to each unitholder with respect to an audited and adjusted return. Although our general partner may elect to have our unitholders take such audit adjustment into account in accordance with their interests in us during the tax year under audit, there can be no assurance that such election will be practical, permissible or effective in all circumstances. As a result, our current unitholders may bear some or all of the tax liability resulting from such audit adjustment, even if such unitholders did not own units in us during the tax year under audit. If, as a result of any such audit adjustment, we are required to make payments of taxes, penalties and interest, our cash available for distribution to our unitholders might be substantially reduced and our current and former unitholders may be required to indemnify us for any taxes (including any applicable penalties and interest) resulting from such audit adjustments that were paid on such unitholders’ behalf. These rules are not applicable for tax years beginning on or prior to December 31, 2017.
31
Even if you do not receive any cash distributions from us, you will be required to pay taxes on your share of our taxable income.
You will be required to pay federal income taxes and, in some cases, state and local income taxes, on your share of our taxable income, whether or not you receive cash distributions from us. For example, if we sell assets and use the proceeds to repay existing debt or fund capital expenditures, you may be allocated taxable income and gain resulting from the sale, and our cash available for distribution would not increase. Similarly, taking advantage of opportunities to reduce our existing debt, such as debt exchanges, debt repurchases, or modifications of our existing debt could result in “cancellation of indebtedness income” being allocated to our unitholders as taxable income without any increase in our cash available for distribution. You may not receive cash distributions from us equal to your share of our taxable income or even equal to the actual tax due from you with respect to that income.
Tax gain or loss on disposition of our LP Units could be more or less than expected.
If you sell your LP Units, you will recognize a gain or loss equal to the difference between the amount realized and your tax basis in those LP Units. Because distributions in excess of your allocable share of our net taxable income decrease your tax basis in your LP Units, the amount, if any, of such prior excess distributions with respect to the LP Units you sell will, in effect, become taxable income to you if you sell such LP Units at a price greater than your tax basis in those LP Units, even if the price you receive is less than your original cost. Furthermore, a substantial portion of the amount realized, whether or not representing a gain, may be taxed as ordinary income due to potential recapture items, including depreciation recapture. In addition, because your amount realized includes your share of our nonrecourse liabilities, if you sell your LP Units, you may incur a tax liability in excess of the amount of cash you receive from the sale.
A substantial portion of the amount realized from the sale of your units, whether or not representing gain, may be taxed as ordinary income to you due to potential recapture items, including depreciation recapture. Thus, you may recognize both ordinary income and capital loss from the sale of your units if the amount realized on a sale of your units is less than your adjusted basis in the units. Net capital loss may only offset capital gains and, in the case of individuals, up to $3,000 of ordinary income per year. In the taxable period in which you sell your units, you may recognize ordinary income from our allocations of income and gain to you prior to the sale and from recapture items that generally cannot be offset by any capital loss recognized upon the sale of units.
Unitholders may be subject to limitation on their ability to deduct interest expense incurred by us.
In general, our unitholders are entitled to a deduction for the interest we have paid or accrued on indebtedness properly allocable to our trade or business during our taxable year. However, under the Tax Cuts and Jobs Act (the “Tax Act”), for taxable years beginning after December 31, 2017, our deduction for “business interest” is limited to the sum of our business interest income and 30% of our “adjusted taxable income.” For the purposes of this limitation, adjusted taxable income is computed without regard to any business interest expense or business interest income, and in the case of taxable years beginning before January 1, 2022, any deduction allowable for depreciation, amortization, or depletion. While actual results may differ significantly from current projections, we do not expect the interest expense limitation to impact the interest deductions attributable to our domestic operations, however, we have not yet determined the impact the limitation could have on our unitholders’ ability to deduct the interest expense we derive from VTTI.
Tax-exempt entities face unique tax issues from owning our LP Units that may result in adverse tax consequences to them.
Investment in our LP Units by tax-exempt entities, such as employee benefit plans and individual retirement accounts (known as IRAs) raises issues unique to them. For example, virtually all of our income allocated to organizations that are exempt from U.S. federal income tax, including IRAs and other retirement plans, will be unrelated business taxable income and will be taxable to them. Further, with respect to taxable years beginning after December 31, 2017, a tax-exempt entity with more than one unrelated trade or business (including by attribution from investment in a partnership such as ours that is engaged in one or more unrelated trade or business) is required to compute the unrelated business taxable income of such tax-exempt entity separately with respect to each such trade or business (including for purposes of determining any net operating loss deduction). As a result, for years beginning after December 31, 2017, it may not be possible for tax-exempt entities to utilize losses from an investment in our partnership to offset unrelated business taxable income from another unrelated trade or business and vice versa. Tax-exempt entities should consult a tax advisor before investing in our LP Units.
32
Non-U.S. Unitholders will be subject to U.S. taxes and withholding with respect to their income and gain from owning our LP Units.
Non-U.S. unitholders are generally taxed and subject to income tax filing requirements by the United States on income effectively connected with a U.S. trade or business (“effectively connected income”). Income allocated to our unitholders and any gain from the sale of our LP Units will generally be considered to be “effectively connected” with a U.S. trade or business. As a result, distributions to a Non-U.S. unitholder will be subject to withholding at the highest applicable effective tax rate and a Non-U.S. unitholder who sells or otherwise disposes of an LP Unit will also be subject to U.S. federal income tax on the gain realized from the sale or disposition of that LP Unit to the extent the gain is effectively connected with a U.S. trade or business of the Non-U.S. unitholder.
The Tax Act imposes a withholding obligation of 10% of the amount realized upon a Non-U.S. unitholder’s sale or exchange of an interest in a partnership that is engaged in a U.S. trade or business. However, due to challenges of administering a withholding obligation applicable to open market trading and other complications, the IRS has temporarily suspended the application of this withholding rule to open market transfers of interest in publicly traded partnerships pending promulgation of regulations or other guidance that resolves the challenges. It is not clear if or when such regulations or other guidance will be issued. Non-U.S. unitholders should consult a tax advisor before investing in our LP Units.
We treat each purchaser of LP Units as having the same tax benefits without regard to the LP Units actually purchased. The IRS may challenge this treatment, which could adversely affect the value of the LP Units.
Because we cannot match transferors and transferees of LP Units and because of other reasons, we have adopted depreciation and amortization positions that may not conform to all aspects of existing U.S. Treasury Regulations. A successful IRS challenge to those positions could adversely affect the amount of tax benefits available to you. It also could affect the timing of these tax benefits or the amount of gain from your sale of LP Units and could have a negative impact on the value of our LP Units or result in audit adjustments to your tax returns.
We prorate our items of income, gain, loss and deduction between transferors and transferees of our LP Units each month based upon the ownership of our LP Units on the first day of each month, instead of on the basis of the date a particular LP Unit is transferred. The IRS may challenge this treatment, which could change the allocation of items of income, gain, loss and deduction among our unitholders.
We generally prorate our items of income, gain, loss and deduction between transferors and transferees of our LP Units each month based upon the ownership of our LP Units on the first day of each month (the “Allocation Date”), instead of on the basis of the date a particular LP Unit is transferred. Similarly, we generally allocate certain deductions for depreciation of capital additions, gain or loss realized on a sale or other disposition of our assets and, in the discretion of the general partner, any other extraordinary item of income, gain, loss or deduction based upon ownership on the Allocation Date. The U.S. Department of the Treasury adopted final Treasury Regulations allowing a similar monthly simplifying convention, but such regulations do not specifically authorize all aspects of our proration method. If the IRS were to challenge our proration method, we may be required to change the allocation of items of income, gain, loss and deduction among our unitholders.
A unitholder whose LP Units are the subject of a securities loan (e.g., a loan to a “short seller” to cover a short sale of LP Units) may be considered to have disposed of those LP Units. If so, he would no longer be treated for tax purposes as a partner with respect to those LP Units during the period of the loan and could recognize gain or loss from the disposition.
Because there are no specific rules governing the federal income tax consequences of loaning a partnership interest, a unitholder whose LP Units are the subject of a securities loan may be considered to have disposed of the loaned LP Units. In that case, the unitholder may no longer be treated for tax purposes as a partner with respect to those LP Units during the period of the loan to the short seller and the unitholder may recognize gain or loss from such disposition. Moreover, during the period of the loan, any of our income, gain, loss or deduction with respect to those LP Units may not be reportable by the unitholder and any cash distributions received by the unitholder as to those LP Units could be fully taxable as ordinary income. Unitholders desiring to assure their status as partners and avoid the risk of gain recognition from a securities loan are urged to modify any applicable brokerage account agreements to prohibit their brokers from borrowing their LP Units.
33
Taxable income from our non-U.S. businesses is not eligible for the 20% deduction for qualified publicly traded partnership income.
Pursuant to the Tax Act, a unitholder is generally allowed a deduction equal to 20% of our “qualified publicly traded partnership income” that is allocated to such unitholder. For purposes of the deduction, the term qualified publicly traded income includes the net amount of such unitholder’s allocable share of our income that is effectively connected to our U.S. trade or business activities. Because our non-U.S. business operations and the VTTI business operations earn income that is not effectively connected with a U.S. trade or business, unitholders may not apply the 20% deduction for qualified publicly traded partnership income to that portion of our income.
Our gross income with respect to the VTTI business may not be qualifying income, and we may cause all or a portion of our interest in such business to be held in an entity treated as a corporation for U.S. federal income tax purposes, which could substantially reduce cash available for distribution.
Despite the fact that we are a limited partnership under Delaware law, it is possible in certain circumstances for a publicly traded partnership such as ours to be treated as a corporation for U.S. federal income tax purposes. In order to maintain our status as a partnership for U.S. federal income tax purposes, 90% or more of our gross income in each tax year must be qualifying income under Section 7704 of the Internal Revenue Code, as amended. We expect to derive income from the transportation and storage of refined petroleum products, crude oil and LPG refined petroleum products in part through direct or indirect non-U.S. subsidiaries of VTTI, including VTTI MLP Investments BV, that are treated as corporations for U.S. federal income tax purposes. In specific circumstances we may be required to include certain amounts of this corporate income in our own gross income whether or not these corporations make matching cash distributions. Our counsel on matters of U.S. federal income tax law is unable to opine as to the qualifying income nature of portions of such income inclusions derived from the VTTI assets or operations. Consequently, there is a risk that we will earn significant amounts of income that our counsel cannot opine is qualifying income, and we intend to actively monitor the amounts of any such income inclusions and may seek a ruling from the IRS with respect to the qualifying income nature of these income inclusion amounts.
If these income inclusion amounts are expected to exceed our anticipated tolerance for gross income with respect to which our counsel is unable to opine and we are unable to receive a favorable IRS ruling in a timely manner, it may be necessary for us to hold some or all of our interests in the VTTI business through a taxable U.S. corporate subsidiary. In such case, this corporate subsidiary would be subject to corporate-level tax on its taxable income up to the maximum U.S. federal corporate income tax rate, which is currently 21%, as well as any applicable state and local income tax rates. Imposition of a corporate level income tax would significantly reduce the anticipated cash available for distribution from the VTTI business to us and, in turn, would reduce our cash available for distribution to our unitholders. Moreover, if the IRS were to successfully assert that this corporation had more tax liability than we currently anticipate or legislation was enacted that increased the corporate tax rate, our cash available for distribution to our unitholders would be further reduced.
Notwithstanding our treatment for U.S. federal income tax purposes, we may be subject to additional tax on our non-U.S. income. If a taxing authority were to successfully assert that we have more tax liability than we anticipate or legislation were enacted that increased the taxes to which we are subject, the cash available for distribution to you could be further reduced.
A portion of our business operations and subsidiaries and a portion of the VTTI business operations and subsidiaries are generally subject to income, withholding and other taxes in the non-U.S. jurisdictions in which they are organized or from which they receive income, reducing the amount of cash available for distribution. In computing our tax obligation in these non-U.S. jurisdictions, we are required to take various tax accounting and reporting positions on matters that are not entirely free from doubt and for which we have not received rulings from the governing tax authorities, such as whether withholding taxes will be reduced by the application of certain tax treaties. Upon review of these positions the applicable authorities may not agree with our positions. A successful challenge by a tax authority could result in additional tax being imposed on us, reducing the cash available for distribution to unitholders. In addition, changes in our operations or ownership could result in higher than anticipated tax being imposed in jurisdictions in which we are organized or from which we receive income and further reduce the cash available for distribution.
34
Unitholders will likely be subject to state and local taxes and income tax return filing requirements in jurisdictions where such unitholders do not live.
In addition to U.S. federal income taxes, unitholders may be subject to other taxes, including state and local taxes, unincorporated business taxes and estate, inheritance or intangible taxes that are imposed by the various jurisdictions in which we conduct business or own property now or in the future, even if a unitholder does not live in any of those jurisdictions. Unitholders will likely be required to file state and local income tax returns and pay state and local income taxes in some or all of these various jurisdictions. Further, unitholders may be subject to penalties for failure to comply with those requirements. We own property and conduct business in a number of states in the United States. Most of these states impose an income tax on individuals, corporations and other entities. Additionally, we also directly and indirectly own property and conduct business in multiple non-U.S. jurisdictions. Under current law, unitholders are not required to file a tax return or pay taxes in any of the non-U.S. jurisdictions where we currently directly and indirectly own property or operate in. As we make acquisitions or expand our business, we may own assets or conduct business in additional states or non-U.S. jurisdictions that impose a personal income tax. It is a unitholder’s responsibility to file all non-U.S., federal, state and local tax returns.
We have subsidiaries that are treated as corporations for federal income tax purposes and subject to corporate-level income taxes.
We conduct a portion of our operations through subsidiaries that are corporations for federal income tax purposes. We may elect to conduct additional operations in corporate form in the future. The corporate subsidiaries will be subject to corporate-level tax, which will reduce the cash available for distribution to us and, in turn, to our unitholders. If the IRS were to successfully assert that the corporate subsidiary has more tax liability than we anticipate or legislation was enacted that increased the corporate tax rate, our cash available for distribution would be further reduced.
Item 1B. Unresolved Staff Comments
None.
35
Item 2. Properties
We are managed primarily from two leased commercial business offices located in Breinigsville, Pennsylvania and Houston, Texas that are approximately 75,000 and 73,000 square feet in size, respectively.
In general, our pipelines are located on land owned by others pursuant to rights granted under easements, leases, licenses and permits from railroads, utilities, governmental entities and private parties. Like other pipelines, certain of our rights are revocable at the election of the grantor or are subject to renewal at various intervals, and some require periodic payments. We have not experienced any revocations or lapses of such rights which were material to our business or operations, and we have no reason to expect any such revocation or lapse in the foreseeable future. Most delivery points, gathering, pumping stations and terminalling facilities are located on land that we own.
See “Item 1, Business” for a description of the location and general character of our material property.
We believe that we have sufficient title to our material assets and properties, possess all material authorizations and revocable consents from state and local governmental and regulatory authorities and have all other material rights necessary to conduct our business substantially in accordance with past practice. Although in certain cases our title to assets and properties or our other rights, including our rights to occupy the land of others under easements, leases, licenses and permits, may be subject to encumbrances, restrictions and other imperfections, we do not expect any of such imperfections to materially detract from the value of such assets or properties or interfere materially with the conduct of our businesses.
Item 3. Legal Proceedings
In the ordinary course of business, we are involved in various claims and legal proceedings, some of which are covered by insurance. We are generally unable to predict the timing or outcome of these claims and proceedings. Based upon our evaluation of existing claims and proceedings and the probability of losses relating to such contingencies, we have accrued certain amounts relating to such claims and proceedings, none of which are considered material.
Item 4. Mine Safety Disclosures
Not applicable.
36
PART II
Item 5. Market for the Registrant’s LP Units, Related Unitholder Matters, and Issuer Purchases of LP Units
Our LP Units are listed and traded on the NYSE under the symbol “BPL.” The high and low sales prices of our LP Units during the years ended December 31, 2017 and 2016, as reported in the NYSE Composite Transactions, were as follows:
2017 | 2016 | |||||||||||||||
Quarter | High | Low | High | Low | ||||||||||||
First | $ | 72.00 | $ | 64.50 | $ | 70.84 | $ | 47.07 | ||||||||
Second | 69.95 | 60.70 | 74.35 | 62.29 | ||||||||||||
Third | 65.34 | 55.16 | 75.10 | 67.11 | ||||||||||||
Fourth | 59.25 | 45.24 | 71.79 | 61.37 | ||||||||||||
The following graph compares the total unitholder return performance of our LP Units with the performance of: (i) the Standard & Poor’s 500 Stock Index (“S&P 500”) and (ii) the Alerian MLP Index. The Alerian MLP Index is a composite of the 50 most prominent energy master limited partnerships that provides investors with a comprehensive benchmark for this asset class. The graph assumes that $100 was invested in our LP Units and each comparison index beginning on December 31, 2012 and that all distributions or dividends were reinvested on a quarterly basis.
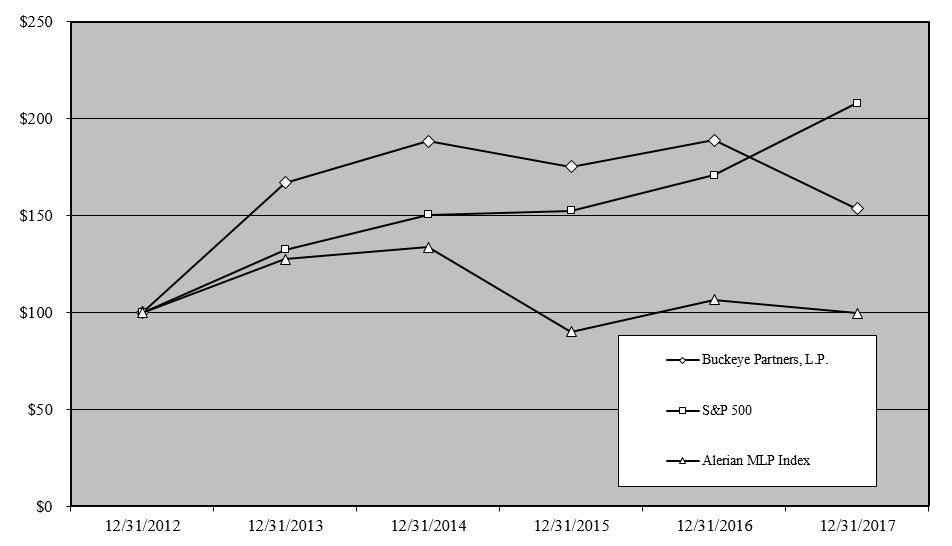
12/31/2012 | 12/31/2013 | 12/31/2014 | 12/31/2015 | 12/31/2016 | 12/31/2017 | ||||||||||||||||||
Buckeye Partners, L.P. | $ | 100.00 | $ | 167.09 | $ | 188.52 | $ | 175.18 | $ | 188.99 | $ | 153.65 | |||||||||||
S&P 500 | 100.00 | 132.39 | 150.51 | 152.59 | 170.84 | 208.14 | |||||||||||||||||
Alerian MLP Index | 100.00 | 127.58 | 133.71 | 90.13 | 106.63 | 99.68 | |||||||||||||||||
We have gathered tax information from our known unitholders and from brokers/nominees and, based on the information collected, we estimate our number of beneficial unitholders to be approximately 159,500 at December 31, 2017.
37
Cash distributions paid to unitholders for the periods indicated were as follows:
Amount Per | ||||||
Record Date | Payment Date | LP Unit | ||||
February 17, 2015 | February 24, 2015 | $1.1375 | ||||
May 11, 2015 | May 18, 2015 | $1.1500 | ||||
August 10, 2015 | August 17, 2015 | $1.1625 | ||||
November 9, 2015 | November 17, 2015 | $1.1750 | ||||
February 23, 2016 | March 1, 2016 | $1.1875 | ||||
May 16, 2016 | May 23, 2016 | $1.2000 | ||||
August 15, 2016 | August 22, 2016 | $1.2125 | ||||
November 15, 2016 | November 22, 2016 | $1.2250 | ||||
February 21, 2017 | February 28, 2017 | $1.2375 | ||||
May 15, 2017 | May 22, 2017 | $1.2500 | ||||
August 14, 2017 | August 21, 2017 | $1.2625 | ||||
November 13, 2017 | November 20, 2017 | $1.2625 | ||||
On February 9, 2018, we announced a quarterly distribution of $1.2625 per LP Unit that will be paid on February 27, 2018, to unitholders of record on February 20, 2018. Based on the LP Units and distribution equivalent rights with respect to certain unit-based compensation awards outstanding as of December 31, 2017, cash expected to be distributed to unitholders on February 27, 2018 is estimated to be approximately $186.2 million.
We generally make quarterly cash distributions of substantially all of our available cash, generally defined as consolidated cash receipts less consolidated cash expenditures and such retentions for working capital, anticipated cash expenditures and contingencies as Buckeye GP deems appropriate.
Buckeye Partners, L.P. is a publicly traded MLP, and is not subject to federal income tax. Instead, unitholders are required to report their allocable share of our income, gain, loss and deduction, regardless of whether we make distributions. We have made quarterly distribution payments since May 1987.
Recent Sales of Unregistered Securities
None.
Issuer Purchases of Equity Securities
None.
38
Item 6. Selected Financial Data
The following tables present our selected consolidated financial data from our audited consolidated financial statements for the periods and at the dates indicated. The tables should be read in conjunction with our consolidated financial statements and our accompanying notes thereto included in Item 8 of this Report (in thousands, except per unit amounts):
Year Ended December 31, | |||||||||||||||||||
2017 | 2016 | 2015 | 2014 | 2013 | |||||||||||||||
Income Statement Data: | |||||||||||||||||||
Revenue (1) | $ | 3,648,145 | $ | 3,248,376 | $ | 3,453,434 | $ | 6,620,247 | $ | 5,054,101 | |||||||||
Operating income | 683,904 | 733,342 | 604,116 | 495,347 | 478,041 | ||||||||||||||
Income from continuing operations | 493,665 | 548,675 | 438,391 | 334,498 | 351,599 | ||||||||||||||
Earnings per unit - diluted from continuing operations | $ | 3.32 | $ | 4.03 | $ | 3.41 | $ | 2.78 | $ | 3.23 | |||||||||
Cash distributions per LP Unit - declared for the period | $ | 5.04 | $ | 4.88 | $ | 4.68 | $ | 4.48 | $ | 4.28 | |||||||||
Diluted weighted average units outstanding | 143,144 | 132,927 | 128,617 | 119,899 | 107,677 | ||||||||||||||
December 31, | |||||||||||||||||||
2017 | 2016 | 2015 | 2014 | 2013 | |||||||||||||||
Balance Sheet Data: | |||||||||||||||||||
Total assets (2) (3) | $ | 10,304,659 | $ | 9,421,103 | $ | 8,369,281 | $ | 8,065,720 | $ | 6,988,024 | |||||||||
Long-term debt (3) | 4,658,321 | 4,217,695 | 3,732,824 | 3,368,618 | 3,075,172 | ||||||||||||||
Total Buckeye Partners, L.P. capital | 4,590,937 | 4,411,723 | 3,735,389 | 3,702,628 | 3,065,665 | ||||||||||||||
____________________________
(1) | The change in revenue year to year for Merchant Services is largely driven by fluctuations in refined petroleum products prices as well as any changes in sales volumes. See “Item 7, Management’s Discussion and Analysis of Financial Condition and Results of Operations” for further discussion. |
(2) | Includes the impact of $181.7 million of assets held for sale as of December 31, 2013 relating to the Natural Gas Storage disposal group sold in December 2014. See Note 4 in the Notes to Consolidated Financial Statements for further discussion. |
(3) | Certain reclassifications of debt issuance costs have been made to prior year amounts to conform to current year presentation. In connection with the retrospective application of new accounting standard for debt issuance costs, we reclassified $20.4 million, and $17.5 million of debt issuance costs originally included in “Other non-current assets” as of each respective year ending December 31, 2014 and 2013 to “Long-term debt” as a direct deduction from the carrying amount of debt liabilities, consistent with debt discounts. |
39
Item 7. Management’s Discussion and Analysis of Financial Condition and Results of Operations
The following discussion should be read in conjunction with our consolidated financial statements and our accompanying notes thereto included in Item 8 of this Report.
Business Overview
We own and operate, or own a significant interest in, a diversified global network of integrated assets providing midstream logistic solutions, primarily consisting of the transportation, storage, processing and marketing of liquid petroleum products. We are one of the largest independent liquid petroleum products pipeline operators in the United States in terms of volumes delivered, with approximately 6,000 miles of pipeline. We also use our service expertise to operate and/or maintain third-party pipelines and perform certain engineering and construction services for our customers. Our global terminal network, including through our interest in VTTI, comprises more than 135 liquid petroleum products terminals with aggregate tank capacity of over 176 million barrels across our portfolio of pipelines, inland terminals and marine terminals located primarily in the East Coast, Midwest and Gulf Coast regions of the United States, as well as in the Caribbean, Northwest Europe, the Middle East and Southeast Asia. Our global network of marine terminals enables us to facilitate global flows of crude oil and refined petroleum products, offering our customers connectivity between supply areas and market centers through some of the world’s most important bulk liquid storage and blending hubs. Our flagship marine terminal in The Bahamas, BBH, is one of the largest marine crude oil and refined petroleum products storage facilities in the world and provides an array of logistics and blending services for the global flow of petroleum products. Our Gulf Coast regional hub, Buckeye Texas, offers world-class marine terminalling, storage and processing capabilities. Through our 50% equity interest in VTTI, our global terminal network offers premier storage and marine terminalling services for petroleum product logistics in key international energy hubs. We are also a wholesale distributor of refined petroleum products in certain areas served by our pipelines and terminals.
Our primary business objective is to provide stable and sustainable cash distributions to our unitholders, while maintaining a relatively low investment risk profile. The key elements of our strategy are to: (i) operate in a safe and environmentally responsible manner; (ii) maximize utilization of our assets at the lowest cost per unit; (iii) maintain stable long-term customer relationships; (iv) optimize, expand and diversify our portfolio of energy assets through accretive acquisitions and organic growth projects; and (v) maintain a solid, conservative financial position and our investment-grade credit rating.
40
Results of Operations
Consolidated Summary
Our summary operating results were as follows for the periods indicated (in thousands, except per unit amounts):
Year Ended December 31, | |||||||||||
2017 | 2016 | 2015 | |||||||||
Revenue | $ | 3,648,145 | $ | 3,248,376 | $ | 3,453,434 | |||||
Costs and expenses | 2,964,241 | 2,515,034 | 2,849,318 | ||||||||
Operating income | 683,904 | 733,342 | 604,116 | ||||||||
Earnings from equity investments | 36,005 | 11,536 | 6,381 | ||||||||
Interest and debt expense | (225,583 | ) | (194,922 | ) | (171,330 | ) | |||||
Other income | 211 | 179 | 98 | ||||||||
Income from continuing operations before taxes | 494,537 | 550,135 | 439,265 | ||||||||
Income tax expense | (872 | ) | (1,460 | ) | (874 | ) | |||||
Income from continuing operations | 493,665 | 548,675 | 438,391 | ||||||||
Loss from discontinued operations (1) | — | — | (857 | ) | |||||||
Net income | 493,665 | 548,675 | 437,534 | ||||||||
Less: Net income attributable to noncontrolling interests | (14,863 | ) | (13,067 | ) | (311 | ) | |||||
Net income attributable to Buckeye Partners, L.P. | $ | 478,802 | $ | 535,608 | $ | 437,223 | |||||
Diluted earnings (loss) per unit attributable to Buckeye Partners, L.P. | |||||||||||
Continuing operations | $ | 3.32 | $ | 4.03 | $ | 3.41 | |||||
Discontinued operations | $ | — | $ | — | $ | (0.01 | ) | ||||
_____________________________
(1) | Represents loss from the operations of our Natural Gas Storage disposal group. See Note 4 in the Notes to Consolidated Financial Statements for more information. |
41
Non-GAAP Financial Measures
Adjusted EBITDA and distributable cash flow are not measures defined by accounting principles generally accepted in the United States of America (“GAAP”). We define Adjusted EBITDA as earnings from continuing operations before interest expense, income taxes, depreciation and amortization, further adjusted to exclude certain non-cash items, such as non-cash compensation expense; transaction, transition, and integration costs associated with acquisitions; certain unrealized gains and losses on foreign currency transactions and foreign currency derivative financial instruments, as applicable; and certain other operating expense or income items, reflected in net income, that we do not believe are indicative of our core operating performance results and business outlook, such as hurricane-related costs, gains and losses on property damage recoveries, and gains and losses on asset sales. We define distributable cash flow as Adjusted EBITDA less cash interest expense, cash income tax expense, and maintenance capital expenditures incurred to maintain the operating, safety, and/or earnings capacity of our existing assets, plus or minus realized gains or losses on certain foreign currency derivative financial instruments, as applicable. These definitions of Adjusted EBITDA and distributable cash flow are also applied to our proportionate share in the Adjusted EBITDA and distributable cash flow of significant equity method investments, such as that in VTTI, and are not applied to our less significant equity method investments. The calculation of our proportionate share of the reconciling items used to derive these VTTI performance metrics is based upon our 50% equity interest in VTTI, prior to adjustments related to noncontrolling interests in several of its subsidiaries and partnerships, which are immaterial. These adjustments include gains and losses on foreign currency derivative financial instruments used to hedge VTTI’s United States dollar denominated distributions which are excluded from Adjusted EBITDA and included in distributable cash flow when realized. Adjusted EBITDA and distributable cash flow are non-GAAP financial measures that are used by our senior management, including our Chief Executive Officer, to assess the operating performance of our business and optimize resource allocation. We use Adjusted EBITDA as a primary measure to: (i) evaluate our consolidated operating performance and the operating performance of our business segments; (ii) allocate resources and capital to business segments; (iii) evaluate the viability of proposed projects; and (iv) determine overall rates of return on alternative investment opportunities. We use distributable cash flow as a performance metric to compare cash-generating performance of Buckeye from period to period and to compare the cash-generating performance for specific periods to the cash distributions (if any) that are expected to be paid to our unitholders. Distributable cash flow is not intended to be a liquidity measure.
We believe that investors benefit from having access to the same financial measures used by management and that these measures are useful to investors because they aid in comparing our operating performance with that of other companies with similar operations. The Adjusted EBITDA and distributable cash flow data presented by us may not be comparable to similarly titled measures at other companies because these items may be defined differently by other companies.
42
The following table presents income from continuing operations on a consolidated basis and a reconciliation of income from continuing operations, which is the most comparable financial measure under GAAP, to Adjusted EBITDA and distributable cash flow, as well as Adjusted EBITDA by segment for the periods indicated (in thousands):
Year Ended December 31, | ||||||||||||
2017 | 2016 | 2015 | ||||||||||
Reconciliation of Income from continuing operations to Adjusted EBITDA and Distributable cash flow: | ||||||||||||
Income from continuing operations | $ | 493,665 | $ | 548,675 | $ | 438,391 | ||||||
Less: | Net income attributable to noncontrolling interests | (14,863 | ) | (13,067 | ) | (311 | ) | |||||
Income from continuing operations attributable to Buckeye Partners, L.P. | 478,802 | 535,608 | 438,080 | |||||||||
Add: | Interest and debt expense | 225,583 | 194,922 | 171,330 | ||||||||
Income tax expense | 872 | 1,460 | 874 | |||||||||
Depreciation and amortization (1) | 269,243 | 254,659 | 221,278 | |||||||||
Non-cash unit-based compensation expense | 30,302 | 33,344 | 29,215 | |||||||||
Acquisition and transition expense (2) | 4,226 | 8,196 | 3,127 | |||||||||
Litigation contingency accrual (3) | — | — | 15,229 | |||||||||
Hurricane-related costs, net of recoveries (4) | 5,780 | 16,795 | — | |||||||||
Proportionate share of Adjusted EBITDA for the equity method investment in VTTI (5) | 126,642 | — | — | |||||||||
Less: | Amortization of unfavorable storage contracts (6) | — | (5,979 | ) | (11,071 | ) | ||||||
Gains on property damage recoveries (7) | (4,621 | ) | (5,700 | ) | — | |||||||
Gain on sale of ammonia pipeline | — | (5,299 | ) | — | ||||||||
Earnings from the equity method investment in VTTI (5) | (22,910 | ) | — | — | ||||||||
Adjusted EBITDA | $ | 1,113,919 | $ | 1,028,006 | $ | 868,062 | ||||||
Less: | Interest and debt expense, excluding amortization of deferred financing costs, debt discounts and other | (208,380 | ) | (177,996 | ) | (154,469 | ) | |||||
Income tax (expense) benefit, excluding non-cash taxes | (297 | ) | 276 | (1,536 | ) | |||||||
Maintenance capital expenditures | (144,046 | ) | (129,691 | ) | (99,617 | ) | ||||||
Proportionate share of VTTI’s interest expense, current income tax expense, realized foreign currency derivative gains and losses, and maintenance capital expenditures (5) | (43,855 | ) | — | — | ||||||||
Add: | Hurricane-related maintenance capital expenditures | 14,577 | 6,054 | — | ||||||||
Distributable cash flow | $ | 731,918 | $ | 726,649 | $ | 612,440 | ||||||
Adjusted EBITDA by segment: | ||||||||||||
Domestic Pipelines & Terminals | $ | 573,021 | $ | 568,405 | $ | 522,196 | ||||||
Global Marine Terminals | 512,821 | 427,229 | 323,840 | |||||||||
Merchant Services | 28,077 | 32,372 | 22,026 | |||||||||
Adjusted EBITDA | $ | 1,113,919 | $ | 1,028,006 | $ | 868,062 | ||||||
____________________________
(1) | Includes 100% of the depreciation and amortization expense of $72.4 million, $71.7 million and $49.3 million for Buckeye Texas for the years ended December 31, 2017, 2016 and 2015, respectively. |
(2) | Represents transaction, internal and third-party costs related to asset acquisition and integration. |
(3) | Represents reductions in revenue related to settlement of a FERC proceeding. |
(4) | Represents costs incurred at our BBH facility in the Bahamas, Yabucoa Terminal in Puerto Rico, Corpus Christi facilities in Texas, and certain terminals in Florida, as a result of Hurricanes Harvey, Irma, and Maria, which occurred in August and September 2017, as well as Hurricane Matthew, which occurred in October 2016, consisting of operating expenses and write-offs of damaged long-lived assets, net of insurance recoveries. |
43
(5) | Due to the significance of our equity method investment in VTTI, effective January 1, 2017, we applied the definitions of Adjusted EBITDA and distributable cash flow, covered in our description of non-GAAP financial measures, with respect to our proportionate share of VTTI’s Adjusted EBITDA and distributable cash flow. The calculation of our proportionate share of the reconciling items used to derive these VTTI performance metrics is based upon our 50% equity interest in VTTI, prior to adjustments related to noncontrolling interests in several of its subsidiaries and partnerships, which are immaterial. |
(6) | Represents fair value adjustment amortization related to certain storage contracts acquired in the BBH acquisition. These contracts were fully amortized by December 31, 2016. |
(7) | Represents gains on recoveries of property damages caused by third parties, primarily related to an allision with a ship dock at our terminal located in Pennsauken, New Jersey. |
The following table presents product volumes in barrels per day (“bpd”) and average tariff rates in cents per barrel for our Domestic Pipelines & Terminals segment, capacity utilization percentage for our Global Marine Terminals segment and total sales volumes for the Merchant Services segment for the periods indicated:
Year Ended December 31, | ||||||||
2017 | 2016 | 2015 | ||||||
Domestic Pipelines & Terminals (average bpd in thousands): | ||||||||
Pipelines: | ||||||||
Gasoline | 756.3 | 759.6 | 735.9 | |||||
Jet fuel | 373.8 | 361.1 | 358.9 | |||||
Middle distillates (1) | 309.7 | 289.4 | 337.4 | |||||
Other products (2) | 19.1 | 16.9 | 28.5 | |||||
Total throughput | 1,458.9 | 1,427.0 | 1,460.7 | |||||
Terminals: | ||||||||
Throughput (3) | 1,251.5 | 1,238.4 | 1,215.4 | |||||
Pipeline average tariff (cents/bbl) | 89.7 | 85.9 | 83.7 | |||||
Global Marine Terminals (percent of capacity): | ||||||||
Average capacity utilization rate (4) | 92 | % | 99 | % | 96 | % | ||
Merchant Services (in millions of gallons): | ||||||||
Sales volumes | 1,214.8 | 1,179.7 | 1,215.0 | |||||
_____________________________
(1) | Includes diesel fuel and heating oil. |
(2) | Includes LPG, intermediate petroleum products and crude oil. |
(3) | Includes throughput of two underground propane storage caverns. |
(4) | Represents the ratio of contracted capacity to capacity available to be contracted. Based on total capacity (i.e., including out of service capacity), average capacity utilization rates are approximately 88%, 92% and 85% for the years ended December 31, 2017, 2016 and 2015, respectively. |
44
Year Ended December 31, 2017 Compared to Year Ended December 31, 2016
Consolidated Overview
Income from continuing operations was $493.7 million for the year ended December 31, 2017, a decrease of $55.0 million, or 10.0%, from $548.7 million in 2016. The decrease was driven by (i) lower operating results primarily in the Global Marine Terminal segment’s Caribbean facilities which were partially offset by earnings from equity investments from the January 2017 investment in VTTI; and (ii) lower operating results in the Merchant Services segment, as further explained in the discussion of Adjusted EBITDA by segment below; as well as (iii) a $14.5 million increase in depreciation and amortization expense related to assets placed in service during the period; and (iv) a $30.7 million increase in interest and debt expense, due to long-term debt issued in the fourth quarter of 2016 to partially fund the VTTI Acquisition, as well as the long-term debt issued in November 2017. The decrease was partially offset by stronger results from the Domestic Pipelines & Terminals segment, as further explained in the discussion of Adjusted EBITDA by segment below.
Total Adjusted EBITDA was $1,113.9 million for the year ended December 31, 2017, an increase of $85.9 million, or 8.4% , from $1,028.0 million in 2016. The increase in Adjusted EBITDA was driven by increases in segment Adjusted EBITDA of $85.6 million and $4.6 million from the Global Marine Terminals segment and Domestic Pipelines & Terminals segment, respectively, which was partially offset by a $4.3 million decrease in Adjusted EBITDA from the Merchant Services segment, as further explained in the discussion of Adjusted EBITDA by segment below.
Distributable cash flow was $731.9 million for the year ended December 31, 2017, an increase of $5.3 million, or 0.7%, from $726.6 million for the corresponding period in 2016, primarily driven by an $85.9 million increase in Adjusted EBITDA from our segments, as described above, which was partially offset by (i) a $30.4 million increase in interest and debt expense, excluding amortization of deferred financing costs, debt discounts and other; (ii) a $5.9 million increase in maintenance capital expenditures, excluding hurricane-related maintenance capital expenditures, primarily resulting from increased asset integrity project costs and upgrades to station and terminalling equipment; and (iii) our $43.9 million net proportionate share of VTTI’s interest expense, current income tax expense, realized foreign currency derivatives gains and losses, and maintenance capital expenditures.
Adjusted EBITDA by Segment
Domestic Pipelines & Terminals. Adjusted EBITDA from the Domestic Pipelines & Terminals segment was $573.0 million for the year ended December 31, 2017, an increase of $4.6 million, or approximately 1%, from $568.4 million in 2016. The increase was primarily due to a $24.2 million increase in revenue, partially offset by a $19.6 million net increase in operating expenses and other.
Pipeline volumes increased by 2.2% due to strong demand for distillate and jet fuel shipments, which were partially offset by weaker demand for gasoline transportation services. Terminalling throughput volumes increased by 1.1% due to higher volumes, reflecting strong customer throughput demand, particularly in the Southeast, partially offset by lower pipeline transfers at our Chicago Complex.
The increase in revenue was due to a $30.2 million increase in pipeline transportation revenues, reflecting contributions from internal growth capital investments placed in service and an increase in average pipeline tariff rates, including the impact of an increase in higher-rate long-haul volumes; a $13.2 million increase in project management revenues due to an increase in project activity; a $7.1 million increase in product recoveries; and a $4.2 million increase in storage revenues, primarily due to storage capacity returned to service and new storage contracts. These revenue increases were partially offset by a $28.6 million decrease in terminalling throughput revenue, primarily due to the exercise by a customer of an early buy-out provision in a crude-by-rail throughput contract at our Albany, New York terminal, in September 2016, partially offset by the positive impact of higher throughput volumes; and a $1.9 million decrease in other revenues. The net increase in operating expenses and other primarily relates to the increased activity within our project management business, as well as increased labor and general and administrative expenses.
45
Global Marine Terminals. Adjusted EBITDA from the Global Marine Terminals segment was $512.8 million for the year ended December 31, 2017, an increase of $85.6 million, or 20.0%, from $427.2 million in 2016. The increase was primarily due to the $126.6 million Adjusted EBITDA contribution from our equity investment in VTTI, acquired in January 2017, partially offset by a $35.8 million decrease in revenue and a $5.2 million increase in operating expenses.
Revenue from storage and terminalling services decreased by $47.5 million due to lower capacity utilization, driven by lower demand for storage services at our Caribbean facilities as a result of weaker market conditions, as well as the exit of a long-term customer from one of our facilities; partially offset by an increase in processing services revenues at Buckeye Texas. This decrease was further offset by a $11.7 million increase in revenue from ancillary services, including tank cleaning, water disposal, berthing and heating. The average capacity utilization of our marine storage assets was 92% for the year ended December 31, 2017, which was a decrease from 99% in the corresponding period in 2016. The increase in operating expenses was primarily driven by higher property taxes as well as business development costs, and general and administrative expenses.
Merchant Services. Adjusted EBITDA from the Merchant Services segment was $28.1 million for the year ended December 31, 2017, a decrease of $4.3 million, or 13.3%, from $32.4 million in 2016. Adjusted EBITDA was negatively impacted by lower rack margins and weaker market conditions, primarily in the distillate market, partially offset by a decrease in operating expenses.
Revenue increased by $416.3 million due to (i) a $48.3 million increase as a result of 3.0% higher sales volumes and (ii) a $368.0 million increase in refined petroleum product sales due to higher commodity prices (average sales prices per gallon were $1.68 and $1.37 for the 2017 and 2016 periods, respectively).
Cost of product sales increased by $421.7 million primarily due to (i) a $46.9 million increase due to higher sales volumes and (ii) a $374.8 million increase in refined petroleum product cost due to higher commodity prices (average prices per gallon were $1.64 and $1.34 for the 2017 and 2016 periods, respectively). This increase was partially offset by a $1.1 million decrease in operating expenses.
Year Ended December 31, 2016 Compared to Year Ended December 31, 2015
Consolidated Overview
Income from continuing operations was $548.7 million for the year ended December 31, 2016, an increase of $110.3 million, or 25.2%, from $438.4 million in 2015. The increase reflected stronger results from all segments, as discussed below in the section covering segment results, as well as $11.0 million in gains from property damage recoveries and the sale of an ammonia pipeline in Texas; partially offset by the following factors: (i) a $33.4 million increase in depreciation and amortization related to assets placed in service during the period, as well as a full year of operation of the Buckeye Texas assets which were commissioned in the fourth quarter of 2015; (ii) a $23.6 million increase in interest and debt expense, due to lower capitalization of interest, as a result of the placement in service of the Buckeye Texas assets during the fourth quarter of 2015, and long-term debt issued in the fourth quarter of 2016 to partially fund the VTTI Acquisition; and (iii) $5.1 million of incremental acquisition and transition expenses.
Total Adjusted EBITDA was $1,028.0 million for the year ended December 31, 2016, an increase of $159.9 million, or 18.4%, from $868.1 million in 2015. The increase in Adjusted EBITDA was primarily related to increases in segment Adjusted EBITDA of $103.4 million, $46.2 million, and $10.4 million, respectively in Global Marine Terminals, Domestic Pipelines & Terminals, and Merchant Services segments, as further explained within the discussion of Adjusted EBITDA by segment below.
Distributable cash flow was $726.6 million for the year ended December 31, 2016, an increase of $114.2 million, or 18.6%, from $612.4 million in 2015. The increase in distributable cash flow was primarily related to an increase of $159.9 million in Adjusted EBITDA as described above. This increase was partially offset by a $24.0 million increase in maintenance capital expenditures, excluding hurricane-related maintenance capital expenditures, primarily resulting from increased tank integrity project costs, marine dock structure upgrades, and upgrades to station and terminalling equipment, as well as a $23.5 million increase in interest and debt expense, excluding amortization of deferred financing costs, debt discounts and other, reflecting the factors discussed above.
46
Adjusted EBITDA by Segment
Domestic Pipelines & Terminals. Adjusted EBITDA from the Domestic Pipelines & Terminals segment was $568.4 million for the year ended December 31, 2016, an increase of $46.2 million, or 8.8%, from $522.2 million for the corresponding period in 2015. The increase in Adjusted EBITDA was primarily due to a $37.1 million net increase in revenue, a $5.2 million increase in earnings from equity investments and a $3.9 million decrease in operating expenses. The increase in revenue was due to a $40.1 million increase in terminalling throughput revenue and product recovery revenue, reflecting new terminalling-services contracts and $14 million in proceeds from the exercise by a customer of an early buy-out provision in a crude-by-rail contract at our Albany, New York terminal, as well as a $23.4 million increase in storage revenue, primarily due to storage capacity brought back into service, internal growth capital investments, and new storage contracts. These increases were partially offset by a $13.6 million decrease in certain blending activities, a $7.2 million decrease in project management revenues, and $5.6 million decrease in other revenues. The decrease in project management revenues was due to a decrease in project activity. The decrease in operating expenses was primarily due to favorable power and utilities, a decrease in reimbursable expenses within our project management business due to a decrease in project activity, and lower general and administrative expenses; partially offset by higher payroll and benefits, reflecting merit increases and incremental property taxes.
Pipeline volumes decreased by 2.3% due to a decline in distillate volumes, reflecting lower industrial activity and warmer weather, which was partially offset by higher gasoline volumes due to increased customer demand. Terminalling throughput volumes increased by 1.9% due to higher gasoline volumes, reflecting increased customer demand, partially offset by absence of throughput activity and subsequent termination of a crude-by-rail contract at our Albany, New York terminal.
Global Marine Terminals. Adjusted EBITDA from the Global Marine Terminals segment was $427.2 million for the year ended December 31, 2016, an increase of $103.4 million, or 31.9%, from $323.8 million for the corresponding period in 2015. The increase in Adjusted EBITDA was primarily due to a $135.0 million net increase in revenue, partially offset by a $31.6 million increase in operating expenses. The increase in revenue was due to a $138.5 million increase in revenue from storage and terminalling services, reflecting increased contributions from our joint venture interest in Buckeye Texas, as a result of assets commissioned during the fourth quarter of 2015. Our internal growth capital investments since the second quarter of 2015 increased available storage capacity and diversified our asset capabilities at Buckeye Texas and other marine storage terminals. In addition, such capital investments enabled us to achieve an increase in storage and terminalling services revenue in 2016. The average capacity utilization of our marine storage assets was 99% for the year ended December 31, 2016, which was an increase from 96% in the corresponding period in 2015. These increases in revenue were partially offset by a $3.5 million decrease in ancillary revenues, which was principally due to lower berthing activity and other related ancillary services. Operating expenses increased by $31.6 million, primarily due to the operation of the Buckeye Texas assets.
Merchant Services. Adjusted EBITDA from the Merchant Services segment was $32.4 million for the year ended December 31, 2016, an increase of $10.4 million, or 47.3%, from $22.0 million for the corresponding period in 2015. Adjusted EBITDA was positively impacted by continued effective inventory management and a decrease in operating expenses.
Adjusted EBITDA was negatively impacted by a $415.8 million decrease in revenue, which included a $59.2 million decrease due to 2.9% lower volumes sold and a $356.6 million decrease in refined petroleum product sales due to lower commodity prices (average sales prices per gallon were $1.37 and $1.68 for the 2016 and 2015 periods, respectively).
Adjusted EBITDA was positively impacted by a $423.8 million decrease in cost of product sales, which included a $58.1 million decrease due to 2.9% lower volumes sold and a $365.7 million decrease in refined petroleum product cost due to lower commodity prices (average prices per gallon were $1.34 and $1.65 for the 2016 and 2015 periods, respectively) and a $2.4 million decrease in operating expenses.
47
General Outlook for 2018
We expect to see solid performance across our reporting segments for 2018 as we benefit from improving market conditions, particularly around our Domestic Pipeline & Terminal segment’s assets. We expect to see incremental returns associated with growth capital investments made across our global portfolio, including the VTTI Merger. Offsetting this growth, we expect to see continued storage market challenges that may impact contract renewal rates and capacity utilization in our segregated storage business.
Domestic Pipelines & Terminals Segment Business Outlook and Growth Projects
In 2018, we expect tariff increases on our market-based and FERC index-based tariff pipelines to drive a part of our pipeline revenue growth. Pipeline throughput volumes are projected to remain relatively flat as strength in distillate volumes is partially offset by the impact of expected refinery turnarounds and other minor system fluctuations. Throughput volumes across our domestic terminals are expected to increase moderately from the completion of growth capital initiatives across our system and expansion of market share, primarily in the Southeast and Northeast United States. Throughput revenues are anticipated to be impacted by the expiration of a crude-by-rail contract at our Chicago Complex in early 2018 that we do not expect to be renewed. Our butane blending and settlement revenues, including revenues associated with the operation of our vapor recovery equipment, are expected to generate incremental benefits compared to the prior year.
We expect to see the benefit, in 2018, from a number of growth projects currently underway. We continue to advance through the regulatory approval process on the second phase of our Michigan/Ohio Expansion Project. This second phase builds on the initial phase of the project to further expand Buckeye’s capabilities to deliver refined products from Midwestern refineries to destinations in Western Pennsylvania, as well as to Altoona in central Pennsylvania, through the planned partial reversal of our Laurel pipeline. While we await final regulatory approval, which is expected in mid-2018, our teams continue to advance engineering and construction planning efforts to meet our expected in-service date of late 2018.
We expect to sign a long-term agreement for an expansion of our Chicago Complex to provide additional services to a major Midwestern-area refinery. This project includes the construction of additional product tankage, for which we have already received necessary air permits, as well as the significant expansion of an existing truck rack on our site. We expect this project to be completed in 2019.
We have completed or are advancing a number of smaller projects that require moderate capital investments and have attractive return profiles that we expect to contribute to our 2018 performance. We have ongoing return capital projects at a number of our terminals that are intended to increase capacity, connectivity and optionality for our customers by adding storage capacity, multi-modal product handling, offloading and take-away capacity at these facilities. We have made investments across our terminalling asset footprint to upgrade our vapor recovery unit equipment, improving the contribution from recovery of truck rack vapors while benefiting the environment by reducing our emissions. We expect to benefit in 2018 from these and other projects completed in 2017 or projected to be completed in 2018.
Buckeye Texas Partners Joint Venture Opportunities
Our operations teams at our Buckeye Texas Partners joint venture remain focused on improving the operational capabilities of our assets in South Texas, and we expect to see improved throughput rates on our condensate splitters. We are working with our partner and customer on various projects intended to debottleneck and improve the throughput capabilities of our facilities. These projects include expanding dock capabilities, adding storage capacity and increasing pipeline connectivity, in advance of an anticipated increase in throughput volumes due to our customer’s increased supply commitments on pipelines from the Permian into Corpus Christi.
48
VTTI Strategic Rationale and Take Private Transaction
Our equity investment in VTTI represents a significant interest in a global network with substantial breadth and scale. Our combined marine storage terminal footprint is situated across major global logistics hubs, including the U.S. Gulf Coast, New York Harbor, Northwest Europe, the Caribbean, the Middle East and Southeast Asia, as well as key terminalling locations in emerging markets. These facilities include state-of-the-art, world class marine terminals designed with a focus on providing superior customer optionality, most with multi-modal capabilities to receive and deliver a wide array of petroleum products. This platform represents a broad set of organic and expansion opportunities capitalizing on a number of emerging market trends at attractive expected investment multiples.
In September 2017, VTTI successfully completed the VTTI Merger, which simplified VTTI’s structure and further enhanced the expected accretion to Buckeye’s distributable cash flow.
Global Marine Terminals Segment Storage Business Outlook and Growth Projects
We continue to be impacted by evolving market conditions that are anticipated to be less favorable for segregated storage demand. Our commercial teams, however, have historically been able to maintain high levels of utilization of available storage capacity through varying market cycles. We believe we are well-positioned to manage through these current market conditions as we continue to be proactive in leveraging our diversified portfolio of assets to meet our customers’ needs, although we may see pressure on storage rates. We are converting certain of our storage capacity in the Caribbean to handle a wider spectrum of products, as well as further enhancing some of our service offerings to accommodate new business lines. In the New York Harbor, we are currently constructing a 16” bi-directional pipeline between our Perth Amboy and Raritan Bay terminals, which will provide enhanced connectivity and is expected to drive improved utilization across our storage assets in the area. The project is expected to be completed in the spring of 2018.
Merchant Services Segment Business Outlook
Our Merchant Services segment continues to focus on optimizing its position across our portfolio of domestic assets to drive higher utilization and incremental value to Buckeye. We believe this segment’s disciplined supply management efforts will deliver stable results in 2018.
Capital Market and Financing Activities
We have $400 million of long-term debt maturing in November 2018. We believe that we have sufficient liquidity available on our $1.5 billion revolving Credit Facility to satisfy this maturity, although we do plan to access the debt capital market in late 2018. We have executed approximately $500 million of forward starting interest rate hedges that mature in late 2018 to partially mitigate the risk of rising interest rates on our expected issuance. During 2017, issuances of LP Units under our at-the-market (“ATM”) offering program aggregated to approximately $346 million. We expect the LP Unit issuances made under our ATM offering program in 2017 to be sufficient to fund the equity portion of our growth capital projects in the near term. Our ATM offering program expired in January 2018 concurrent with the expiration of our traditional shelf registration statement and Equity Distribution Agreement. Our new traditional shelf registration statement became effective in December 2017, and we intend to enter into a new equity distribution agreement in connection with our ATM offering program in 2018. Under current market conditions, we believe that we could raise additional capital in both the debt and equity capital markets on acceptable terms to fund appropriate asset or business acquisitions.
We will continue to evaluate opportunities throughout 2018 to acquire or construct assets that are strategically positioned to support our long-term growth strategy and will determine the appropriate financing structure on acceptable terms for any opportunity we pursue.
The forward-looking statements contained in this “General Outlook for 2018” speak only as of the date hereof. Although the expectations in the forward-looking statements are based on our current beliefs and expectations, caution should be taken not to place undue reliance on any such forward-looking statements because such statements speak only as of the date hereof. Except as required by federal and state securities laws, we undertake no obligation to publicly update or revise any forward-looking statements, whether as a result of new information, future events or any other reason. All such forward-looking statements are expressly qualified in their entirety by the cautionary statements contained or referred to in this Report, including under the captions “Risk Factors” and “Cautionary Note Regarding Forward-Looking Statements” and elsewhere in this Report and in our future periodic reports filed with the SEC. In light of these risks, uncertainties and assumptions, the forward-looking events discussed in this “General Outlook for 2018” may not occur.
49
Liquidity and Capital Resources
General
Our primary cash requirements, in addition to normal operating expenses and debt service, are for working capital, capital expenditures, business acquisitions and distributions to unitholders. Our principal sources of liquidity are cash from operations, borrowings under our $1.5 billion revolving Credit Facility and proceeds from the issuance of our LP Units. We will, from time to time, issue debt securities to refinance amounts borrowed under our Credit Facility. Buckeye Energy Services LLC, Buckeye West Indies Holdings LP, and Buckeye Caribbean Terminals LLC (collectively the Buckeye Merchant Service Companies or “BMSC”) fund their working capital needs principally from their own operations and their portion of our Credit Facility. Our financial policy is to fund maintenance capital expenditures with cash from continuing operations. Expansion and cost reduction capital expenditures, along with acquisitions, have typically been funded from external sources including our Credit Facility, as well as debt and equity offerings. Our goal has been to fund at least half of these expenditures with proceeds from equity offerings in order to maintain an appropriate leverage ratio and our investment-grade credit rating. Based on current market conditions, we believe our borrowing capacity under our Credit Facility, cash flows from continuing operations and access to debt and equity markets, if necessary, will be sufficient to fund our primary cash requirements, including our expansion plans over the next 12 months.
Current Liquidity
As of December 31, 2017, we had a $28.8 million working capital deficit and $1.1 billion of availability under our Credit Facility.
Capital Structuring Transactions
As part of our ongoing efforts to maintain a capital structure that is closely aligned with the cash-generating potential of our asset-based business, we may explore additional sources of external liquidity, including public or private debt or equity issuances. Matters to be considered will include cash interest expense and maturity profile, all to be balanced with maintaining adequate liquidity. We have a universal shelf registration statement that does not place any dollar limits on the amount of debt and equity securities that we may issue thereunder and a traditional shelf registration statement on file with the SEC that allows us to issue up to an aggregate of $1 billion in equity securities. From time to time, we enter into equity distribution agreements in connection with our ATM offering program pursuant to which we may issue and sell LP Units registered under our traditional shelf registration statement. All issuances of equity securities under the Equity Distribution Agreement in 2017 were issued pursuant to a traditional shelf registration statement that expired, along with the Equity Distribution Agreement, on January 15, 2018. We filed a new traditional shelf registration statement with the SEC, under which we had $1 billion of unsold securities available as of December 31, 2017. We intend to enter into a new equity distribution agreement in connection with our ATM offering program in 2018. The universal and traditional shelf registration statements will expire in November and December 2020, respectively.
The timing of any transaction may be impacted by events, such as strategic growth opportunities, legal judgments or regulatory or environmental requirements. The receptiveness of the capital markets to an offering of debt or equity securities cannot be assured and may be negatively impacted by, among other things, our long-term business prospects and other factors beyond our control, including market conditions.
In addition, we periodically evaluate engaging in strategic transactions as a source of capital or may consider divesting non-strategic assets where our evaluation suggests such a transaction is in the best interest of our business.
Capital Allocation
We continually review our investment options with respect to our capital resources that are not distributed to our unitholders or used to pay down our debt and seek to invest these capital resources in various projects and activities based on their return on investment. Potential investments could include, among others: add-on or other enhancement projects associated with our current assets; greenfield or brownfield development projects; and merger and acquisition activities.
50
Debt
At December 31, 2017, we had the following debt obligations (in thousands):
6.050% Notes due January 15, 2018 | $ | 300,000 | |
2.650% Notes due November 15, 2018 | 400,000 | ||
5.500% Notes due August 15, 2019 | 275,000 | ||
4.875% Notes due February 1, 2021 | 650,000 | ||
4.150% Notes due July 1, 2023 | 500,000 | ||
4.350% Notes due October 15, 2024 | 300,000 | ||
3.950% Notes due December 1, 2026 | 600,000 | ||
4.125% Notes due December 1, 2027 | 400,000 | ||
6.750% Notes due August 15, 2033 | 150,000 | ||
5.850% Notes due November 15, 2043 | 400,000 | ||
5.600% Notes due October 15, 2044 | 300,000 | ||
Term Loan due September 30, 2019 | 250,000 | ||
Credit Facility due September 30, 2021 | 418,904 | ||
Unamortized discounts & debt issuance costs | (33,379 | ) | |
Total debt | $ | 4,910,525 | |
At December 31, 2017, the aggregate principal amount outstanding of our various long-term debt obligations (including current maturities) was $4,943.9 million. At December 31, 2017, we were in compliance with the covenants under our Credit Facility and our $250.0 million variable-rate term loan due September 30, 2019 (the “Term Loan”). As of December 31, 2017, we have $1.1 billion of availability under our Credit Facility. For more information regarding our debt-related transactions, see Note 13 in the Notes to Consolidated Financial Statements for additional information.
In January 2018, we issued $400.0 million of Junior Notes maturing on January 22, 2078, which are redeemable at Buckeye’s option, in whole or in part, on or after January 22, 2023. The Junior Notes bear interest at a fixed rate of 6.375% per year up to, but not including, January 22, 2023. From January 22, 2023, the Junior Notes will bear interest at a floating rate based on the Three-Month LIBOR Rate plus 4.02%, reset quarterly. Total proceeds from this offering, after underwriting fees, expenses, and debt issuance costs, were $394.9 million. We used the net proceeds from this offering for general partnership purposes and to reduce the indebtedness outstanding under our Credit Facility.
In November 2017, we issued $400.0 million of senior unsecured 4.125% notes maturing on December 1, 2027 in an underwritten public offering at 99.503% of their principal amount. Total proceeds from this offering, after underwriting fees, expenses, and debt issuance costs, were $394.4 million. We used the net proceeds from this offering to reduce the indebtedness outstanding under our Credit Facility, a portion of which was subsequently reborrowed in January 2018 in order to repay in full the $300.0 million of 6.050% notes due on January 15, 2018 and $9.1 million of related accrued interest.
In July 2017, we repaid in full the $125.0 million principal amount and $3.2 million of accrued interest outstanding under our 5.125% notes, using funds available under our Credit Facility.
Equity
During the year ended December 31, 2017, we sold 6.2 million LP Units in aggregate under the Equity Distribution Agreement, received $345.8 million in net proceeds after deducting commissions and other related expenses. See Note 21 in the Notes to Consolidated Financial Statements for additional information.
Buckeye expects the LP Unit issuances made under the Equity Distribution Agreement in 2017 to be sufficient to fund the equity portion of its growth capital projects in the near term.
51
Cash Flows from Operating, Investing and Financing Activities
The following table summarizes our cash flows from operating, investing and financing activities for the periods indicated (in thousands):
Year Ended December 31, | |||||||||||
2017 | 2016 | 2015 | |||||||||
Cash provided by (used in): | |||||||||||
Operating activities | $ | 888,402 | $ | 717,917 | $ | 710,192 | |||||
Investing activities | (1,809,988 | ) | (481,702 | ) | (614,894 | ) | |||||
Financing activities | 283,426 | 399,244 | (98,625 | ) | |||||||
Operating Activities
2017. Net cash provided by operating activities was $888.4 million for the year ended December 31, 2017, primarily related to $493.7 million of net income, $269.2 million of depreciation and amortization, a $56.4 million decrease in inventory in the Merchant Services segment, $17.2 million in amortization of debt issuance costs, discounts and interest rate swaps, $20.0 million in interest rate swap settlements, and $30.6 million of non-cash unit-based compensation expense, which were partially offset by a $24.7 million net increase in the fair value of derivatives assets.
2016. Net cash provided by operating activities was $717.9 million for the year ended December 31, 2016, primarily related to $548.7 million of net income, $254.7 million of depreciation and amortization, and a $103.3 million net decrease in the fair value of derivatives, which were partially offset by a $162.3 million increase in inventory, primarily driven by an increase in commodity prices.
2015. Net cash provided by operating activities was $710.2 million for the year ended December 31, 2015, primarily related to $437.5 million of net income, $221.3 million of depreciation and amortization, a $56.8 million decrease in working capital, $29.2 million of non-cash unit-based compensation expense and $12.2 million of amortization of losses on terminated interest rate swaps, which were partially offset by $52.8 million in litigation settlement payments.
Future Operating Cash Flows. Our future operating cash flows will vary based on a number of factors, many of which are beyond our control, including demand for our services, the cost of commodities, the effectiveness of our strategy, legal, environmental and regulatory requirements and our ability to capture value associated with commodity price volatility.
Investing Activities
2017. Net cash used in investing activities of $1.8 billion for the year ended December 31, 2017 primarily related to$433.3 million of capital expenditures, $1.2 billion related to the acquisition of an equity investment, and $237.8 million related to the contribution to the same equity investment.
2016. Net cash used in investing activities of $481.7 million for the year ended December 31, 2016 primarily related to $486.3 million of capital expenditures and $26.0 million related to the acquisition of the Indianola terminalling facility, which were partially offset by $19.9 million in refunded escrow deposits.
2015. Net cash used in investing activities of $614.9 million for the year ended December 31, 2015 primarily related to $594.5 million of capital expenditures and $21.4 million in escrow deposits, which were partially offset by $10.3 million of proceeds from the sale and disposition of assets, primarily due to the disposition of an ammonia pipeline in Texas.
See below for a discussion of capital spending. For further discussion on our acquisitions, see Note 3 in the Notes to Consolidated Financial Statements.
52
We have capital expenditures, which we define as “maintenance capital expenditures,” in order to maintain and enhance the safety and integrity of our pipelines, terminals, storage and processing facilities and related assets, and “expansion and cost reduction capital expenditures” to expand the reach or capacity of those assets, to improve the efficiency of our operations and to pursue new business opportunities. Capital expenditures, excluding non-cash changes in accruals for capital expenditures, were as follows for the periods indicated (in thousands):
Year Ended December 31, | |||||||||||
2017 | 2016 | 2015 | |||||||||
Maintenance capital expenditures (1) | $ | 144,046 | $ | 129,691 | $ | 99,617 | |||||
Expansion and cost reduction | 289,289 | 356,625 | 494,903 | ||||||||
Total capital expenditures(2) | $ | 433,335 | $ | 486,316 | $ | 594,520 | |||||
_____________________________
(1) | Includes maintenance capital expenditures of $14.6 million at the BBH facility and Yabucoa Terminal in Puerto Rico as a result of Hurricanes Matthew and Maria for the year ended December 31, 2017 and $6.1 million for the year ended December 31, 2016 as a result of Hurricane Matthew. |
(2) | Amounts exclude the impact of accruals. On an accrual basis, capital expenditure additions to property, plant and equipment were $436.9 million, $457.4 million and $616.1 million for the years ended December 31, 2017, 2016 and 2015, respectively. |
Total capital expenditures decreased for the year ended December 31, 2017, as compared to 2016. Our expansion and cost reduction capital expenditures were $289.3 million for the year ended December 31, 2017, which is a decrease of $67.3 million, or 18.9%, from $356.6 million for the corresponding period in 2016. Year-to-year fluctuations in our expansion and cost reduction capital expenditures were primarily driven by the completion of construction activities and certain large organic growth capital projects, including the first phase of the Michigan/Ohio pipeline expansion project in the fourth quarter of 2016, the continuation of subsequent phases in 2017 for projects in the Midwest and New York Harbor, and new expansion, tank capacity optimization and cost reduction projects in 2017 in our Caribbean locations. Our maintenance capital expenditures were $144.0 million for the year ended December 31, 2017, which is an increase of $14.3 million, or 11.0%, from $129.7 million for the corresponding period in 2016. Year-to-year fluctuations in our maintenance capital expenditures were primarily driven by increased asset integrity and facility infrastructure projects. Our most significant maintenance capital expenditures for the year ended December 31, 2017 included tank integrity work across our asset locations to maintain operating capacity, replacements at our BBH facility and Yabucoa Terminal as a result of Hurricanes Matthew and Maria, marine dock improvements and upgrades to station and terminalling equipment across our asset locations.
Total capital expenditures decreased for the year ended December 31, 2016, as compared to the corresponding period in 2015 primarily due to decreases in expansion and cost reduction capital expenditures. Our expansion and cost reduction capital expenditures were $356.6 million for the year ended December 31, 2016, which is a decrease of $138.3 million, or 27.9%, from $494.9 million for the corresponding period in 2015. Year-to-year fluctuations in our expansion and cost reduction capital expenditures were primarily driven by the completion of major organic growth capital projects associated with the initial build- out of our facilities at Buckeye Texas, including the significant completion of a deep-water marine terminal, two condensate splitters, an LPG storage complex and three crude oil and condensate gathering facilities in 2015. Our most significant organic growth capital expenditures for the year ended December 31, 2016 included cost reduction and revenue generating projects related to enhancements across our portfolio of terminalling assets, butane blending capabilities, completion of rail unloading facilities, crude oil storage/transportation/processing and a pipeline integrity enhancement program that improved the operational efficiencies in our pipeline systems. Our maintenance capital expenditures were $129.7 million for the year ended December 31, 2016, which is an increase of $30.1 million, or 30.2%, from $99.6 million for the corresponding period in 2015. Year-to-year fluctuations in our maintenance capital expenditures were primarily driven by increased asset integrity and facility infrastructure projects. Our most significant maintenance capital expenditures for the year ended December 31, 2016 included tank integrity work necessary to maintain operating capacity, replacements at our BBH facility as a result of Hurricane Matthew, marine dock structure improvements and upgrades to station and terminalling equipment.
53
We estimate our capital expenditures for the period indicated as follows (in thousands):
2018 | |||||||
Low | High | ||||||
Domestic Pipelines & Terminals: | |||||||
Maintenance capital expenditures | $ | 70,000 | $ | 80,000 | |||
Expansion and cost reduction | 219,000 | 249,000 | |||||
Total capital expenditures | $ | 289,000 | $ | 329,000 | |||
Global Marine Terminals: | |||||||
Maintenance capital expenditures | $ | 40,000 | $ | 50,000 | |||
Expansion and cost reduction | 56,000 | 76,000 | |||||
Total capital expenditures (1) | $ | 96,000 | $ | 126,000 | |||
Overall: | |||||||
Maintenance capital expenditures | $ | 110,000 | $ | 130,000 | |||
Expansion and cost reduction | 275,000 | 325,000 | |||||
Total capital expenditures | $ | 385,000 | $ | 455,000 | |||
(1) | Includes 100% of Buckeye Texas’ capital expenditures. |
Estimated maintenance capital expenditures include tank refurbishments and upgrades to station and terminalling equipment, asset integrity, field instrumentation and cathodic protection systems and exclude capital expenditures expected to be incurred in response to hurricane related damages. Estimated major expansion and cost reduction expenditures include the continuing capacity expansion of our pipeline system and terminalling capacity in the Midwest, continuing expansion of the facilities in the New York Harbor, continued investment in South Texas facilities, an expansion of the Jacksonville terminal, and various tank construction and conversion projects in our Global Marine Terminals and Domestic Pipelines & Terminals segments.
Financing Activities
2017. Net cash flows provided by financing activities of $283.4 million for the year ended December 31, 2017 primarily related to $418.9 million of net borrowings under the Credit Facility, $398.0 million of proceeds from the issuance of the 4.125% notes due November 2027, and $345.8 million of proceeds from the issuance of an aggregate 6.2 million LP Units under the Equity Distribution Agreement, partially offset by $714.5 million of cash distributions paid to unitholders ($5.013 per LP Unit) and a $125.0 million principal repayment of our 5.125% notes in July 2017.
2016. Net cash flows provided by financing activities of $399.2 million for the year ended December 31, 2016 primarily related to $689.1 million of net proceeds from the issuance of an aggregate 10.5 million LP Units, $597.9 million of proceeds from the issuance of the 3.950% notes due December 1, 2026, and $250.0 million of borrowings on our Term Loan, partially offset by $641.7 million of cash distributions paid to unitholders ($4.825 per LP Unit) and $472.5 million of net repayments under the Credit Facility.
2015. Net cash flows used in financing activities of $98.6 million for the year ended December 31, 2015 primarily related to $591.0 million of cash distributions paid to unitholders ($4.625 per LP Unit), partially offset by $306.5 million of net borrowings under the Credit Facility and $161.5 million of net proceeds from the issuance of 2.2 million LP Units under equity distribution agreements in connection with our ATM offering program.
For further discussion on our equity offerings, see Note 21 in the Notes to Consolidated Financial Statements.
54
Contractual Obligations
The following table summarizes our contractual obligations as of December 31, 2017 (in thousands):
Payments Due by Period | |||||||||||||||||||
Total | Less than 1 year | 1-3 years | 3-5 years | More than 5 years | |||||||||||||||
Long-term debt (1) | $ | 4,691,700 | 700,000 | 525,000 | 816,700 | 2,650,000 | |||||||||||||
Interest payments (2) | 2,007,926 | 201,244 | 355,772 | 280,682 | 1,170,228 | ||||||||||||||
Operating leases: | |||||||||||||||||||
Office space and other | 14,781 | 3,031 | 5,708 | 3,182 | 2,860 | ||||||||||||||
Equipment (3) | 85,042 | 11,133 | 18,078 | 18,911 | 36,920 | ||||||||||||||
Land leases (4) | 99,863 | 2,659 | 5,318 | 5,318 | 86,568 | ||||||||||||||
Purchase obligations (5) | 167,379 | 167,379 | — | — | — | ||||||||||||||
Total contractual obligations | $ | 7,066,691 | $ | 1,085,446 | $ | 909,876 | $ | 1,124,793 | $ | 3,946,576 | |||||||||
_____________________________
(1) | Includes long-term debt portion borrowed under our Credit Facility. See Note 13 in the Notes to Consolidated Financial Statements for additional information regarding our debt obligations. |
(2) | Includes amounts due on our notes and amounts and commitment fees due on our Credit Facility. The interest amount calculated on the Credit Facility is based on the assumption that the amount outstanding and the interest rate charged both remain at their current levels. |
(3) | Includes leases for tugboats and a barge in our Global Marine Terminals segment. |
(4) | Includes leases for properties in connection with both the jetty and inland dock operations in our Global Marine Terminals segment. |
(5) | Includes short-term purchase obligations for products and services with third-party suppliers and payment obligations relating to capital projects. The prices that we are obligated to pay under these contracts approximate current market prices. |
For the year ended December 31, 2018, our rights-of-way payments are expected to be $7.6 million, which include an estimated amount for annual escalation.
In addition, our obligations related to our pension and postretirement benefit plans are discussed in Note 18 in the Notes to Consolidated Financial Statements.
Employee Stock Ownership Plan
Services Company provides the Employee Stock Ownership Plan (“ESOP”) to the majority of its employees hired before September 16, 2004. Employees hired by Services Company after September 15, 2004 and certain employees covered by a union multi-employer pension plan do not participate in the ESOP. The ESOP owns all of the outstanding common stock of Services Company.
The ESOP was frozen with respect to benefits effective March 27, 2011 (the “Freeze Date”). No Services Company contributions have been or will be made on behalf of current participants in the ESOP on and after the Freeze Date. Even though contributions under the ESOP are no longer being made, each eligible participant’s ESOP account will continue to be credited with its share of any stock dividends or other stock distributions associated with Services Company stock.
All Services Company stock has been allocated to ESOP participants. See Note 18 in the Notes to Consolidated Financial Statements for further information.
Off-Balance Sheet Arrangements
At December 31, 2017 and 2016, we had no off-balance sheet debt or arrangements.
55
Critical Accounting Policies and Estimates
The preparation of consolidated financial statements in conformity with GAAP requires our management to make estimates and assumptions that affect the reported amounts of assets, liabilities, revenue and expenses during the reporting period and disclosure of contingent assets and liabilities at the date of the consolidated financial statements. Estimates and assumptions about future events and their effects cannot be made with certainty. Estimates may change as new events occur, when additional information becomes available and if our operating environment changes. Actual results could differ from our estimates. See Note 2 in the Notes to Consolidated Financial Statements for our significant accounting policies. The following describes significant estimates and assumptions affecting the application of these policies:
Basis of Presentation and Principles of Consolidation
The consolidated financial statements include the accounts of our subsidiaries controlled by us and variable interest entities (“VIEs”), of which we are the primary beneficiary. A VIE is required to be consolidated by its primary beneficiary, which is generally defined as the party who has (i) the power to direct the activities of a VIE that most significantly impact the VIE’s economic performance, and (ii) the obligation to absorb losses of the VIE or the right to receive benefits that could potentially be significant to the VIE. We evaluate our relationships with our VIEs, which include Buckeye Texas, Services Company and Sabina Pipeline, on an ongoing basis to determine whether we continue to be the primary beneficiary. Third party or affiliate ownership interests in our consolidated VIEs are presented as noncontrolling interests. All intercompany transactions are eliminated in consolidation.
Business Combinations and Investments
We allocate the total purchase price of a business combination to the assets acquired and the liabilities assumed based on their estimated fair values at the acquisition date, with the excess purchase price recorded as goodwill. An income, market or cost valuation method may be utilized to estimate the fair value of the assets acquired or liabilities assumed in a business combination. The income valuation method represents the present value of future cash flows over the life of the asset using: (i) discrete financial forecasts, which rely on management’s estimates of revenue and operating expenses; (ii) long-term growth rates; and (iii) appropriate discount rates. The market valuation method uses prices paid for a reasonably similar asset by other purchasers in the market, with adjustments relating to any differences between the assets. The cost valuation method is based on the replacement cost of a comparable asset at prices at the time of the acquisition, reduced for depreciation of the asset. With respect to equity method investments, we make similar determinations in relation to any basis difference between our investment and our interest in the underlying net assets of the investee.
Valuation of Goodwill
Goodwill represents the excess of purchase price over fair value of net assets acquired. Our goodwill amounts are assessed for impairment: (i) on an annual basis on October 31st of each year; or (ii) on an interim basis if circumstances indicate it is more likely than not that the fair value of a reporting unit is less than its carrying value.
For our annual goodwill impairment evaluations as of October 31, 2017, we performed qualitative assessments to evaluate the recoverability of each reporting unit's goodwill. Qualitative factors considered in this assessment include economic conditions, industry and market considerations, overall financial performance and other relevant events and factors affecting each reporting unit. Based on our qualitative assessment, if we determine the fair value of a reporting unit is more likely than not to be less than its carrying amount, we are required to perform a quantitative test in which the fair value of a reporting unit will be compared with its carrying amount. If the reporting unit’s carrying value exceeds its fair value, an impairment charge will be recognized to the extent that the carrying value of goodwill exceeds its fair value. Based on our qualitative assessment, we determined that it is not more likely than not that the fair value of each reporting unit is lower than its carrying value; therefore, the quantitative impairment test was not required. We did not recognize any goodwill impairment during the years ended December 31, 2017, 2016 or 2015.
56
Valuation of Long-Lived Assets and Equity Method Investments
We assess the recoverability of our long-lived assets whenever events or changes in circumstances indicate that the carrying amount of an asset may not be recoverable. If events or circumstances are identified, the carrying amount of the asset is compared to the estimated discounted future cash flows to determine if an impairment exists. Estimates of undiscounted future cash flows include: (i) discrete financial forecasts, which rely on management’s estimates of revenue and operating expenses; (ii) long-term growth rates; and (iii) estimates of useful lives of the assets. The identification of impairment indicators and the estimates of future undiscounted cash flows are highly subjective and are based on numerous assumptions about future operations and market conditions.
In December 2013, the Board of Directors approved a plan to divest the natural gas storage facility and related assets that our former subsidiary, Lodi, owned and operated in Northern California. We refer to this group of assets as our Natural Gas Storage disposal group. In July 2014, we signed a purchase and sale agreement to sell our Natural Gas Storage disposal group and completed the sale in December 2014. See Note 4 in the Notes to Consolidated Financial Statements for further discussion.
We evaluate equity method investments for impairment whenever events or changes in circumstances indicate that there is an “other than temporary” loss in value of the investment. Estimates of future cash flows include: (i) discrete financial forecasts, which rely on management’s estimates of revenue and operating expenses; (ii) long-term growth rates; and (iii) probabilities assigned to different cash flow scenarios. There were no impairments of our equity investments during the years ended December 31, 2017, 2016 or 2015.
Reserves for Environmental Matters
We record environmental liabilities for a specific site when environmental assessments occur or remediation efforts are probable, and the costs can be reasonably estimated based upon past experience, discussion with operating personnel, advice of outside engineering and consulting firms, discussion with legal counsel, and current facts and circumstances. The estimates related to environmental matters are uncertain because: (i) estimated future expenditures are subject to cost fluctuations and change in the estimated remediation period; (ii) unanticipated liabilities may arise; and (iii) changes in federal, state and local environmental laws and regulations may significantly change the extent of remediation.
Valuation of Derivatives
We are exposed to financial market risks, including changes in interest rates and commodity prices, in the course of our normal business operations. We use derivative instruments to manage these risks.
Our Merchant Services segment primarily uses exchange-traded refined petroleum product futures contracts to manage the risk of market price volatility on its refined petroleum product inventories and its physical derivative contracts, which we designated as fair value hedges, with changes in fair value of both the futures contracts and physical inventory reflected in earnings. Our Merchant Services segment also uses exchange-traded refined petroleum contracts to hedge expected future transactions related to certain gasoline inventory that we manage on behalf of a third party, which are designated as cash flow hedges, with the effective portion of the hedge reported in other comprehensive income (“OCI”) and reclassified into earnings when the expected future transaction affects earnings. Any gains or losses incurred on the derivative instruments that are not effective in offsetting changes in fair value or cash flows of the hedged item are recognized immediately in earnings.
Additionally, our Merchant Services segment enters into exchange-traded refined petroleum product futures contracts on behalf of our Domestic Pipelines & Terminals segment to manage the risk of market price volatility on the gasoline-to-butane pricing spreads associated with our butane blending activities managed by a third party. These futures contracts are not designated in a hedge relationship for accounting purposes. Physical forward contracts and futures contracts that have not been designated in a hedge relationship are marked-to-market.
Futures contracts are valued using quoted market prices obtained from the NYMEX. Physical derivative contracts are valued using market approaches based on observable market data inputs, including published commodity pricing data, which is verified against other available market data, and market interest rate and volatility data, and are net of credit value adjustments (“CVAs”).
57
The fixed-price and index purchase contracts are typically executed with credit worthy counterparties and are short-term in nature, thus evaluated for credit risk in the same manner as the fixed-price sales contracts. However, because the fixed-price sales contracts are privately negotiated with customers of the Merchant Services segment who are generally smaller, private companies that may not have established credit ratings, the determination of an adjustment to fair value to reflect counterparty credit risk (a “credit valuation adjustment”) requires management judgment.
Each customer is evaluated for performance under the terms and conditions of their contracts; therefore, we evaluate: (i) the historical payment patterns of the customer; (ii) the current outstanding receivables balances for each customer and contract; and (iii) the level of performance of each customer with respect to volumes called for in the contract. We then evaluated the specific risks and expected outcomes of nonpayment or nonperformance by each customer and contract. We continue to monitor and evaluate performance and collections with respect to these fixed-price contracts.
Additionally, we utilize forward-starting interest rate swaps to manage interest rate risk related to forecasted interest payments on anticipated debt issuances. When entering into interest rate swap transactions, we are exposed to both credit risk and market risk. We manage our credit risk by entering into swap transactions only with major financial institutions with investment-grade credit ratings. We manage our market risk by aligning the swap instrument with the existing underlying debt obligation or a specified expected debt issuance generally associated with the maturity of an existing debt obligation. The fair value of the swap instruments are calculated by discounting the future cash flows of both the fixed rate and variable rate interest payments using appropriate discount rates with consideration given to our non-performance risk.
Item 7A. Quantitative and Qualitative Disclosures About Market Risk
Market Risk — Trading Instruments
We have no trading derivative instruments.
Market Risk — Non-Trading Instruments
We are exposed to financial market risks, including changes in commodity prices and interest rates. The primary factors affecting our market risk and the fair value of our derivative portfolio at any point in time are the volume of open derivative positions, changing refined petroleum commodity prices, and prevailing interest rates for our interest rate swaps. We are also susceptible to basis risk created when we enter into financial hedges that are priced at a certain location, but the sales or exchanges of the underlying commodity are at another location where prices and price changes might differ from the prices and price changes at the location upon which the hedging instrument is based. Since prices for refined petroleum products and interest rates are volatile, there may be material changes in the fair value of our derivatives over time, driven both by price volatility and the changes in volume of open derivative transactions.
58
The following is a summary of changes in fair value of our derivative instruments for the periods indicated (in thousands):
Commodity Instruments | Interest Rate Swaps | Total | |||||||||
Fair value of contracts outstanding at January 1, 2017 | $ | (28,801 | ) | $ | 62,609 | $ | 33,808 | ||||
Cash settlements during the period | 34,964 | (20,018 | ) | 14,946 | |||||||
Change in fair value attributable to new deals during the period | 1,318 | — | 1,318 | ||||||||
Change in fair value attributable to existing deals at January 1st | (11,688 | ) | (10,597 | ) | (22,285 | ) | |||||
Fair value of contracts outstanding at December 31, 2017 | $ | (4,207 | ) | $ | 31,994 | $ | 27,787 | ||||
Commodity Price Risk
Our Merchant Services segment primarily uses exchange-traded refined petroleum product futures contracts to manage the risk of market price volatility on its refined petroleum product inventories and its physical contracts accounted for at fair value. In addition, the segment uses exchange-traded refined petroleum product futures and over-the-counter (“OTC”) traded physical fixed-price derivative contracts to hedge expected future transactions related to certain forecasted purchases and sales of refined petroleum products. Finally, our Merchant Services segment enters into exchange-traded refined petroleum product futures contracts on behalf of our Domestic Pipelines & Terminals segment to manage the risk of market price volatility on pricing spreads between gasoline and butane inventory in connection with our butane blending activities managed by a third party. Based on a hypothetical 10% movement in the underlying quoted market prices of the futures contracts, as well as observable market data from third-party pricing publications for refined petroleum product inventories and physical contracts accounted for at fair value designated in hedging relationships at December 31, 2017, the estimated fair value, excluding variation margins, would be as follows (in thousands):
Scenario | Resulting Classification | Fair Value | ||||
Fair value assuming no change in underlying commodity prices (as is) | Asset | $ | 240,658 | |||
Fair value assuming 10% increase in underlying commodity prices | Asset | $ | 253,628 | |||
Fair value assuming 10% decrease in underlying commodity prices | Asset | $ | 227,688 | |||
Interest Rate Risk
From time to time, we utilize forward-starting interest rate swaps to hedge the variability of the forecasted interest payments on anticipated debt issuances that may result from changes in the benchmark interest rate until the expected debt is issued. When entering into interest rate swap transactions, we are exposed to both credit risk and market risk. We manage our credit risk by entering into swap transactions only with major financial institutions with investment-grade credit ratings. We are subject to credit risk when the change in fair value of the swap instruments is positive and the counterparty may fail to perform under the terms of the contract. We are subject to market risk with respect to changes in the underlying benchmark interest rate that impact the fair value of swaps. We manage our market risk by aligning the swap instrument with the existing underlying debt obligation or a specified expected debt issuance generally associated with the maturity of an existing debt obligation.
Our practice with respect to derivative transactions related to interest rate risk has been to have each transaction in connection with non-routine borrowings authorized by the Board. In February 2009, the Board adopted an interest rate hedging policy which permits us to enter into certain short-term interest rate swap agreements to manage our interest rate and cash flow risks associated with a credit facility. In addition, in August 2016, the Board authorized us to enter into forward-starting interest rate swaps to manage our interest rate and cash flow risks related to certain expected debt issuances associated with the maturity of existing debt obligations. Based on a hypothetical 10% movement in the underlying interest rates at December 31, 2017, the estimated fair value of the interest rate derivative contracts would be as follows (in thousands):
Scenario | Resulting Classification | Fair Value | ||||
Fair value assuming no change in underlying interest rates (as is) | Asset | $ | 31,994 | |||
Fair value assuming 10% increase in underlying interest rates | Asset | $ | 28,795 | |||
Fair value assuming 10% decrease in underlying interest rates | Asset | $ | 35,193 | |||
See Note 16 in the Notes to Consolidated Financial Statements for additional discussion related to derivative instruments and hedging activities.
59
At December 31, 2017, we had total fixed-rate debt obligations under various public notes at an aggregate carrying value of $4.2 billion. Based on a hypothetical 1% movement in the underlying interest rates at December 31, 2017, the estimated fair value of these debt obligations would be as follows (in millions):
Scenario | Fair Value of Fixed-Rate Debt | |||
Fair value assuming no change in underlying interest rates (as is) | $ | 4,420 | ||
Fair value assuming 1% increase in underlying interest rates | $ | 4,170 | ||
Fair value assuming 1% decrease in underlying interest rates | $ | 4,704 | ||
At December 31, 2017, our variable-rate obligations were $668.9 million. Based on the balance outstanding at December 31, 2017, we estimate that a 1% increase or decrease in underlying interest rates would increase or decrease annual interest expense by $6.7 million.
Foreign Currency Risk
Puerto Rico is a commonwealth territory under the U.S., and thus uses the U.S. dollar as its official currency. BBH’s functional currency is the U.S. dollar and it is equivalent in value to the Bahamian dollar. St. Lucia is a sovereign island country in the Caribbean and its official currency is the Eastern Caribbean dollar, which is pegged to the U.S. dollar and has remained fixed for many years. The functional currency for our operations in St. Lucia is the U.S. dollar. Foreign exchange gains and losses arising from transactions denominated in a currency other than the U.S. dollar relate to a nominal amount of supply purchases and are included in “Other income (expense)” within our consolidated statements of operations. The effects of foreign currency transactions were not considered to be material for the years ended December 31, 2017, 2016 and 2015.
Our equity method investment in VTTI indirectly exposes us to foreign currency risk, primarily with respect to the Euro, Malaysian Ringgit and United Arab Emirates Dirham. VTTI manages its exposure to foreign currency risk with foreign exchange hedging strategies. Our proportionate share of VTTI’s foreign currency transaction, hedging and translation gains and losses is included in our earnings from equity investments and accumulated other comprehensive income, as applicable. We recognized our proportionate share of $49.6 million of VTTI’s other comprehensive income, primarily comprised of foreign currency translation adjustments in other comprehensive income for the year ended December 31, 2017.
60
Item 8. Financial Statements and Supplementary Data
Page | |
61
MANAGEMENT’S REPORT ON INTERNAL CONTROL OVER FINANCIAL REPORTING
Management of Buckeye GP LLC, as general partner of Buckeye Partners, L.P. (“Buckeye”), is responsible for establishing and maintaining adequate internal control over financial reporting of Buckeye. Internal control over financial reporting is a process designed to provide reasonable, but not absolute, assurance regarding the reliability of financial reporting and the preparation of financial statements for external purposes in accordance with accounting principles generally accepted in the United States of America. A company’s internal control over financial reporting includes those policies and procedures that pertain to the maintenance of records that, in reasonable detail, accurately and fairly reflect the transactions and dispositions of the assets of the company; provide reasonable assurance that transactions are recorded as necessary to permit preparation of financial statements in accordance with accounting principles generally accepted in the United States of America (“GAAP”), and that receipts and expenditures of the company are being made only in accordance with authorizations of management and directors of the company; and provide reasonable assurance regarding prevention or timely detection of unauthorized acquisition, use, or disposition of the company’s assets that could have a material effect on the financial statements.
Because of its inherent limitations, internal control over financial reporting may not prevent or detect misstatements. Also, projections of any evaluation of effectiveness to future periods are subject to the risk that controls may become inadequate because of changes in conditions, or that the degree of compliance with the policies or procedures may deteriorate.
Management evaluated the internal control over financial reporting of Buckeye as of December 31, 2017. In making this assessment, management used the criteria set forth by the Committee of Sponsoring Organizations of the Treadway Commission in Internal Control—Integrated Framework (2013) (“COSO”). As a result of this assessment and based on the criteria in the COSO framework, management has concluded that, as of December 31, 2017, the internal control over financial reporting of Buckeye was effective.
Buckeye’s independent registered public accounting firm, Deloitte & Touche LLP, has audited the internal control over financial reporting of Buckeye. Their opinion on the effectiveness of internal control over financial reporting of Buckeye appears herein.
/s/ CLARK C. SMITH | /s/ KEITH E. ST.CLAIR |
Clark C. Smith | Keith E. St.Clair |
Chief Executive Officer, President and | Executive Vice President and |
Chairman of the Board | Chief Financial Officer |
February 22, 2018 | |
62
REPORT OF INDEPENDENT REGISTERED PUBLIC ACCOUNTING FIRM
To the Board of Directors of Buckeye GP LLC and the
Partners of Buckeye Partners, L.P.
Opinion on Internal Control over Financial Reporting
We have audited the internal control over financial reporting of Buckeye Partners, L.P. and subsidiaries (“Buckeye”) as of December 31, 2017, based on criteria established in Internal Control — Integrated Framework (2013) issued by the Committee of Sponsoring Organizations of the Treadway Commission (COSO). In our opinion, Buckeye maintained, in all material respects, effective internal control over financial reporting as of December 31, 2017, based on the criteria established in Internal Control—Integrated Framework (2013) issued by COSO.
We have also audited, in accordance with the standards of the Public Company Accounting Oversight Board (United States) (PCAOB), the consolidated financial statements as of and for the year ended December 31, 2017 of Buckeye and our report dated February 22, 2018 expressed an unqualified opinion on those consolidated financial statements.
Basis of Opinion
Buckeye’s management is responsible for maintaining effective internal control over financial reporting and for its assessment of the effectiveness of internal control over financial reporting, included in the accompanying Management’s Report on Internal Control Over Financial Reporting. Our responsibility is to express an opinion on Buckeye’s internal control over financial reporting based on our audit. We are a public accounting firm registered with the PCAOB and are required to be independent with respect to Buckeye in accordance with the U.S. federal securities laws and the applicable rules and regulations of the Securities and Exchange Commission and the PCAOB.
We conducted our audit in accordance with the standards of the PCAOB. Those standards require that we plan and perform the audit to obtain reasonable assurance about whether effective internal control over financial reporting was maintained in all material respects. Our audit included obtaining an understanding of internal control over financial reporting, assessing the risk that a material weakness exists, testing and evaluating the design and operating effectiveness of internal control based on the assessed risk, and performing such other procedures as we considered necessary in the circumstances. We believe that our audit provides a reasonable basis for our opinion.
Definition and Limitations of Internal Control over Financial Reporting
A company’s internal control over financial reporting is a process designed to provide reasonable assurance regarding the reliability of financial reporting and the preparation of financial statements for external purposes in accordance with generally accepted accounting principles. A company’s internal control over financial reporting includes those policies and procedures that (1) pertain to the maintenance of records that, in reasonable detail, accurately and fairly reflect the transactions and dispositions of the assets of the company; (2) provide reasonable assurance that transactions are recorded as necessary to permit preparation of financial statements in accordance with generally accepted accounting principles, and that receipts and expenditures of the company are being made only in accordance with authorizations of management and directors of the company; and (3) provide reasonable assurance regarding prevention or timely detection of unauthorized acquisition, use, or disposition of the company’s assets that could have a material effect on the financial statements.
Because of its inherent limitations, internal control over financial reporting may not prevent or detect misstatements. Also, projections of any evaluation of effectiveness to future periods are subject to the risk that controls may become inadequate because of changes in conditions, or that the degree of compliance with the policies or procedures may deteriorate.
/s/ DELOITTE & TOUCHE LLP |
Houston, Texas |
February 22, 2018 |
63
REPORT OF INDEPENDENT REGISTERED PUBLIC ACCOUNTING FIRM
To the Board of Directors of Buckeye GP LLC and the
Partners of Buckeye Partners, L.P.
Opinion on the Financial Statements
We have audited the accompanying consolidated balance sheets of Buckeye Partners, L.P. and subsidiaries (“Buckeye”) as of December 31, 2017 and 2016, the related consolidated statements of operations, comprehensive income, partners’ capital, and cash flows for each of the three years in the period ended December 31, 2017, and the related notes (collectively referred to as the “financial statements”). In our opinion, the financial statements present fairly, in all material respects, the financial position of Buckeye as of December 31, 2017 and 2016, and the results of its operations and its cash flows for each of the three years in the period ended December 31, 2017, in conformity with accounting principles generally accepted in the United States of America.
We have also audited, in accordance with the standards of the Public Company Accounting Oversight Board (United States) (PCAOB), Buckeye’s internal control over financial reporting as of December 31, 2017, based on the criteria established in Internal Control—Integrated Framework (2013) issued by the Committee of Sponsoring Organizations of the Treadway Commission and our report dated February 22, 2018 expressed an unqualified opinion on Buckeye’s internal control over financial reporting.
Basis for Opinion
These financial statements are the responsibility of Buckeye’s management. Our responsibility is to express an opinion on Buckeye’s financial statements based on our audits. We are a public accounting firm registered with the PCAOB and are required to be independent with respect to Buckeye in accordance with the U.S. federal securities laws and the applicable rules and regulations of the Securities and Exchange Commission and the PCAOB.
We conducted our audits in accordance with the standards of the PCAOB. Those standards require that we plan and perform the audit to obtain reasonable assurance about whether the financial statements are free of material misstatement, whether due to error or fraud. Our audits included performing procedures to assess the risks of material misstatement of the financial statements, whether due to error or fraud, and performing procedures that respond to those risks. Such procedures included examining, on a test basis, evidence regarding the amounts and disclosures in the financial statements. Our audits also included evaluating the accounting principles used and significant estimates made by management, as well as evaluating the overall presentation of the financial statements. We believe that our audits provide a reasonable basis for our opinion.
/s/ DELOITTE & TOUCHE LLP |
Houston, Texas |
February 22, 2018 |
We have served as Buckeye’s auditor since 1985.
64
BUCKEYE PARTNERS, L.P.
CONSOLIDATED STATEMENTS OF OPERATIONS
(In thousands, except per unit amounts)
Year Ended December 31, | |||||||||||
2017 | 2016 | 2015 | |||||||||
Revenue: | |||||||||||
Product sales | $ | 2,014,980 | $ | 1,594,240 | $ | 2,028,323 | |||||
Transportation, storage and other services | 1,633,165 | 1,654,136 | 1,425,111 | ||||||||
Total revenue | 3,648,145 | 3,248,376 | 3,453,434 | ||||||||
Costs and expenses: | |||||||||||
Cost of product sales | 1,969,182 | 1,549,522 | 1,965,844 | ||||||||
Operating expenses | 639,563 | 629,942 | 573,368 | ||||||||
Depreciation and amortization | 269,243 | 254,659 | 221,278 | ||||||||
General and administrative | 90,975 | 86,098 | 88,828 | ||||||||
Other, net | (4,722 | ) | (5,187 | ) | — | ||||||
Total costs and expenses | 2,964,241 | 2,515,034 | 2,849,318 | ||||||||
Operating income | 683,904 | 733,342 | 604,116 | ||||||||
Other income (expense): | |||||||||||
Earnings from equity investments | 36,005 | 11,536 | 6,381 | ||||||||
Interest and debt expense | (225,583 | ) | (194,922 | ) | (171,330 | ) | |||||
Other income | 211 | 179 | 98 | ||||||||
Total other expense, net | (189,367 | ) | (183,207 | ) | (164,851 | ) | |||||
Income from continuing operations before taxes | 494,537 | 550,135 | 439,265 | ||||||||
Income tax expense | (872 | ) | (1,460 | ) | (874 | ) | |||||
Income from continuing operations | 493,665 | 548,675 | 438,391 | ||||||||
Loss from discontinued operations (Note 4) | — | — | (857 | ) | |||||||
Net income | 493,665 | 548,675 | 437,534 | ||||||||
Less: Net income attributable to noncontrolling interests | (14,863 | ) | (13,067 | ) | (311 | ) | |||||
Net income attributable to Buckeye Partners, L.P. | $ | 478,802 | $ | 535,608 | $ | 437,223 | |||||
Basic earnings (loss) per unit attributable to Buckeye Partners, L.P.: | |||||||||||
Continuing operations | $ | 3.33 | $ | 4.05 | $ | 3.42 | |||||
Discontinued operations | — | — | (0.01 | ) | |||||||
Total | $ | 3.33 | $ | 4.05 | $ | 3.41 | |||||
Diluted earnings (loss) per unit attributable to Buckeye Partners, L.P.: | |||||||||||
Continuing operations | $ | 3.32 | $ | 4.03 | $ | 3.41 | |||||
Discontinued operations | — | — | (0.01 | ) | |||||||
Total | $ | 3.32 | $ | 4.03 | $ | 3.40 | |||||
Weighted average units outstanding: | |||||||||||
Basic | 142,501 | 132,242 | 128,084 | ||||||||
Diluted | 143,144 | 132,927 | 128,617 | ||||||||
See Notes to Consolidated Financial Statements
65
BUCKEYE PARTNERS, L.P.
CONSOLIDATED STATEMENTS OF COMPREHENSIVE INCOME
(In thousands)
Year Ended December 31, | |||||||||||
2017 | 2016 | 2015 | |||||||||
Net income | $ | 493,665 | $ | 548,675 | $ | 437,534 | |||||
Other comprehensive income (loss): | |||||||||||
Unrealized (losses) gains on derivative instruments, net | (10,733 | ) | 60,281 | 1,266 | |||||||
Reclassification of derivative losses to net income, net | 11,922 | 10,884 | 12,151 | ||||||||
Changes in benefit plan assets and benefit obligations | 3,393 | 1,083 | 4,030 | ||||||||
Other comprehensive income from equity method investments | 49,642 | — | — | ||||||||
Total other comprehensive income | 54,224 | 72,248 | 17,447 | ||||||||
Comprehensive income | 547,889 | 620,923 | 454,981 | ||||||||
Less: Comprehensive income attributable to noncontrolling interests | (14,863 | ) | (13,067 | ) | (311 | ) | |||||
Comprehensive income attributable to Buckeye Partners, L.P. | $ | 533,026 | $ | 607,856 | $ | 454,670 | |||||
See Notes to Consolidated Financial Statements
66
BUCKEYE PARTNERS, L.P.
CONSOLIDATED BALANCE SHEETS
(In thousands, except unit amounts)
December 31, | |||||||
2017 | 2016 | ||||||
Assets: | |||||||
Current assets: | |||||||
Cash and cash equivalents | $ | 2,180 | $ | 640,340 | |||
Accounts receivable, net | 270,648 | 236,416 | |||||
Construction and pipeline relocation receivables | 11,047 | 17,276 | |||||
Inventories | 301,425 | 356,803 | |||||
Derivative assets | 34,959 | 1,526 | |||||
Prepaid and other current assets | 36,339 | 66,536 | |||||
Total current assets | 656,598 | 1,318,897 | |||||
Property, plant and equipment | 7,928,240 | 7,523,774 | |||||
Less: Accumulated depreciation | (1,192,448 | ) | (1,040,492 | ) | |||
Property, plant and equipment, net | 6,735,792 | 6,483,282 | |||||
Equity investments | 1,494,412 | 89,564 | |||||
Goodwill | 1,007,313 | 1,004,545 | |||||
Intangible assets | 615,086 | 616,286 | |||||
Less: Accumulated amortization | (256,025 | ) | (192,983 | ) | |||
Intangible assets, net | 359,061 | 423,303 | |||||
Other non-current assets | 51,483 | 101,512 | |||||
Total assets | $ | 10,304,659 | $ | 9,421,103 | |||
Liabilities and partners’ capital: | |||||||
Current liabilities: | |||||||
Line of credit | $ | 252,204 | $ | — | |||
Accounts payable | 160,777 | 107,383 | |||||
Derivative liabilities | 7,172 | 26,272 | |||||
Accrued and other current liabilities | 265,207 | 265,893 | |||||
Total current liabilities | 685,360 | 399,548 | |||||
Long-term debt | 4,658,321 | 4,217,695 | |||||
Other non-current liabilities | 92,656 | 105,437 | |||||
Total liabilities | 5,436,337 | 4,722,680 | |||||
Commitments and contingent liabilities (Note 5) | — | — | |||||
Partners’ capital: | |||||||
Buckeye Partners, L.P. capital: | |||||||
Limited Partners (146,677,459 and 140,263,787 units outstanding as of December 31, 2017 and 2016, respectively) | 4,562,306 | 4,437,316 | |||||
Accumulated other comprehensive income (loss) | 28,631 | (25,593 | ) | ||||
Total Buckeye Partners, L.P. capital | 4,590,937 | 4,411,723 | |||||
Noncontrolling interests | 277,385 | 286,700 | |||||
Total partners’ capital | 4,868,322 | 4,698,423 | |||||
Total liabilities and partners’ capital | $ | 10,304,659 | $ | 9,421,103 | |||
See Notes to Consolidated Financial Statements
67
BUCKEYE PARTNERS, L.P.
CONSOLIDATED STATEMENTS OF CASH FLOWS
(In thousands)
Year Ended December 31, | |||||||||||
2017 | 2016 | 2015 | |||||||||
Cash flows from operating activities: | |||||||||||
Net income | $ | 493,665 | $ | 548,675 | $ | 437,534 | |||||
Adjustments to reconcile net income to net cash provided by (used in) operating activities: | |||||||||||
Settlement of terminated interest rate swap agreements | 20,018 | — | — | ||||||||
Depreciation and amortization | 269,243 | 254,659 | 221,278 | ||||||||
Amortization of debt issuance costs, discounts, and terminated interest swaps | 17,202 | 16,926 | 16,861 | ||||||||
Non-cash unit-based compensation expense | 30,568 | 33,482 | 29,215 | ||||||||
Legal reserves, net | — | — | (37,610 | ) | |||||||
(Gain) loss on asset impairments and disposals, net | (5,406 | ) | (5,187 | ) | — | ||||||
Changes in fair value of derivatives, net | (24,730 | ) | 103,336 | (9,177 | ) | ||||||
Amortization of unfavorable storage contracts | — | (5,979 | ) | (11,071 | ) | ||||||
Earnings from equity investments | (36,005 | ) | (11,536 | ) | (6,381 | ) | |||||
Distributions of earnings from equity investments | 35,854 | 3,280 | 5,108 | ||||||||
Other non-cash items | 3,632 | 7,162 | 7,593 | ||||||||
Change in assets and liabilities, net of amounts related to acquisitions: | |||||||||||
Accounts receivable, net | (28,957 | ) | (23,646 | ) | 48,006 | ||||||
Construction and pipeline relocation receivables | 6,229 | (4,961 | ) | 7,051 | |||||||
Inventories | 56,430 | (162,257 | ) | 52,775 | |||||||
Prepaid and other current assets | 23,278 | (41,224 | ) | (3,523 | ) | ||||||
Accounts payable | 46,078 | 25,983 | (65,239 | ) | |||||||
Accrued and other current liabilities | (4,278 | ) | (7,347 | ) | 16,759 | ||||||
Other non-current assets and liabilities | (14,419 | ) | (13,449 | ) | 1,013 | ||||||
Net cash provided by operating activities | 888,402 | 717,917 | 710,192 | ||||||||
Cash flows from investing activities: | |||||||||||
Capital expenditures | (433,335 | ) | (486,316 | ) | (594,520 | ) | |||||
Acquisition of equity investment | (1,150,000 | ) | — | — | |||||||
Contribution to equity investment | (237,844 | ) | — | (300 | ) | ||||||
Distributions from equity investments in excess of earnings | 31,724 | 2,526 | — | ||||||||
Acquisitions of business, net of cash acquired | (26,942 | ) | (26,025 | ) | (8,118 | ) | |||||
Proceeds from property disposals and recoveries | 6,409 | 8,263 | 9,404 | ||||||||
Escrow returns (deposits) | — | 19,850 | (21,360 | ) | |||||||
Net cash used in investing activities | (1,809,988 | ) | (481,702 | ) | (614,894 | ) | |||||
Cash flows from financing activities: | |||||||||||
Net proceeds from issuance of LP Units | 345,795 | 689,128 | 161,474 | ||||||||
Net proceeds from exercise of Unit options | 481 | 300 | 215 | ||||||||
Payment of tax withholding on issuance of LTIP awards | (9,447 | ) | (6,711 | ) | (7,700 | ) | |||||
Issuance of long-term debt | 398,012 | 847,864 | — | ||||||||
Repayment of long term-debt | (125,000 | ) | — | — | |||||||
Debt issuance costs | (3,594 | ) | (6,413 | ) | (1,115 | ) | |||||
Borrowings under the BPL Credit Facility | 1,912,872 | 1,007,200 | 1,627,450 | ||||||||
Repayments under the BPL Credit Facility | (1,746,172 | ) | (1,368,200 | ) | (1,266,450 | ) | |||||
Net borrowings (repayments) under the BMSC Credit Facility | 252,204 | (111,488 | ) | (54,512 | ) | ||||||
Acquisition of remaining noncontrolling interest | — | — | (10,044 | ) | |||||||
Contributions from noncontrolling interests | 12,000 | 5,000 | 57,000 | ||||||||
Distributions paid to noncontrolling interests | (39,230 | ) | (15,750 | ) | (13,972 | ) | |||||
Distributions paid to unitholders | (714,495 | ) | (641,686 | ) | (590,971 | ) | |||||
Net cash provided by (used in) financing activities | 283,426 | 399,244 | (98,625 | ) | |||||||
Net (decrease) increase in cash and cash equivalents | (638,160 | ) | 635,459 | (3,327 | ) | ||||||
Cash and cash equivalents — Beginning of year | 640,340 | 4,881 | 8,208 | ||||||||
Cash and cash equivalents — End of year | $ | 2,180 | $ | 640,340 | $ | 4,881 | |||||
See Notes to Consolidated Financial Statements
68
BUCKEYE PARTNERS, L.P.
CONSOLIDATED STATEMENTS OF PARTNERS’ CAPITAL
(In thousands)
Limited Partners | Accumulated Other Comprehensive (Loss) Income | Noncontrolling Interests | Total | ||||||||||||
Partners' capital - January 1, 2015 | $ | 3,817,916 | $ | (115,288 | ) | $ | 237,968 | $ | 3,940,596 | ||||||
Net income | 437,223 | — | 311 | 437,534 | |||||||||||
Acquisition of remaining noncontrolling interests | (8,276 | ) | — | (1,768 | ) | (10,044 | ) | ||||||||
Adjusted value of noncontrolling interest in acquisition | — | — | (1,220 | ) | (1,220 | ) | |||||||||
Distributions paid to unitholders | (594,132 | ) | — | 3,161 | (590,971 | ) | |||||||||
Contributions from noncontrolling interests | — | — | 57,000 | 57,000 | |||||||||||
Net proceeds from issuance of LP Units | 161,474 | — | — | 161,474 | |||||||||||
Amortization of unit-based compensation awards | 29,332 | — | — | 29,332 | |||||||||||
Net proceeds from exercise of Unit options | 215 | — | — | 215 | |||||||||||
Payment of tax withholding on issuance of LTIP awards | (7,700 | ) | — | — | (7,700 | ) | |||||||||
Distributions paid to noncontrolling interests | — | — | (13,972 | ) | (13,972 | ) | |||||||||
Other comprehensive income | — | 17,447 | — | 17,447 | |||||||||||
Accrual of distribution equivalent rights | (3,085 | ) | — | — | (3,085 | ) | |||||||||
Other | 263 | — | (128 | ) | 135 | ||||||||||
Partners' capital - December 31, 2015 | 3,833,230 | (97,841 | ) | 281,352 | 4,016,741 | ||||||||||
Net income | 535,608 | — | 13,067 | 548,675 | |||||||||||
Distributions paid to unitholders | (644,729 | ) | — | 3,043 | (641,686 | ) | |||||||||
Net proceeds from issuance of LP Units | 689,128 | — | — | 689,128 | |||||||||||
Amortization of unit-based compensation awards | 33,482 | — | — | 33,482 | |||||||||||
Net proceeds from exercise of Unit options | 300 | — | — | 300 | |||||||||||
Payment of tax withholding on issuance of LTIP awards | (6,711 | ) | — | — | (6,711 | ) | |||||||||
Distributions paid to noncontrolling interests | — | — | (15,750 | ) | (15,750 | ) | |||||||||
Contributions from noncontrolling interests | — | — | 5,000 | 5,000 | |||||||||||
Other comprehensive income | — | 72,248 | — | 72,248 | |||||||||||
Accrual of distribution equivalent rights | (3,004 | ) | — | — | (3,004 | ) | |||||||||
Other | 12 | — | (12 | ) | — | ||||||||||
Partners' capital - December 31, 2016 | 4,437,316 | (25,593 | ) | 286,700 | 4,698,423 | ||||||||||
Net income | 478,802 | — | 14,863 | 493,665 | |||||||||||
Distributions paid to unitholders | (717,393 | ) | — | 2,898 | (714,495 | ) | |||||||||
Net proceeds from issuance of LP Units | 345,795 | — | — | 345,795 | |||||||||||
Amortization of unit-based compensation awards | 30,568 | — | — | 30,568 | |||||||||||
Net proceeds from exercise of Unit options | 481 | — | — | 481 | |||||||||||
Payment of tax withholding on issuance of LTIP awards | (9,447 | ) | — | — | (9,447 | ) | |||||||||
Distributions paid to noncontrolling interests | — | — | (39,230 | ) | (39,230 | ) | |||||||||
Contributions from noncontrolling interests | — | — | 12,000 | 12,000 | |||||||||||
Other comprehensive income | — | 54,224 | — | 54,224 | |||||||||||
Accrual of distribution equivalent rights | (3,662 | ) | — | — | (3,662 | ) | |||||||||
Other | (154 | ) | — | 154 | — | ||||||||||
Partners' capital - December 31, 2017 | $ | 4,562,306 | $ | 28,631 | $ | 277,385 | $ | 4,868,322 | |||||||
See Notes to Consolidated Financial Statements
69
1. ORGANIZATION
Buckeye Partners, L.P. is a publicly traded Delaware master limited partnership (“MLP”), and its limited partnership units representing limited partner interests (“LP Units”), are listed on the New York Stock Exchange under the ticker symbol “BPL.” Buckeye GP LLC (“Buckeye GP”) is our general partner. As used in these Notes to Consolidated Financial Statements, “we,” “us,” “our” and “Buckeye” mean Buckeye Partners, L.P. and, where the context requires, includes our subsidiaries.
We were formed as a partnership in 1986 from predecessor companies and own and operate, or own a significant interest in, a diversified global network of integrated assets providing midstream logistic solutions, primarily consisting of the transportation, storage, processing and marketing of liquid petroleum products. We are one of the largest independent liquid petroleum products pipeline operators in the United States in terms of volumes delivered, with approximately 6,000 miles of pipeline. We also use our service expertise to operate and/or maintain third-party pipelines and perform certain engineering and construction services for our customers. Our global terminal network, including through our equity interest in VTTI B.V. (“VTTI”), comprises more than 135 liquid petroleum products terminals with aggregate tank capacity of over 176 million barrels across our portfolio of pipelines, inland terminals and marine terminals located primarily in key petroleum logistics hubs in the East Coast, Midwest and Gulf Coast regions of the United States as well as in the Caribbean, Northwest Europe, the Middle East and Southeast Asia. Our global network of marine terminals enables us to facilitate global flows of crude oil and refined petroleum products, offering our customers connectivity between supply areas and market centers through some of the world’s most important bulk liquid storage and blending hubs. Our wholly-owned flagship marine terminal in The Bahamas, Buckeye Bahamas Hub Limited (“BBH”), is one of the largest marine crude oil and refined petroleum products storage facilities in the world and provides an array of logistics and blending services for the global flow of petroleum products. Our Gulf Coast regional hub, Buckeye Texas Partners LLC (“Buckeye Texas”), offers world-class marine terminalling, storage and processing capabilities. Through our 50% equity interest in VTTI our global terminal network offers premier storage and marine terminalling services for petroleum product logistics in key international energy hubs. We are also a wholesale distributor of refined petroleum products in areas served by our pipelines and terminals.
2. SUMMARY OF SIGNIFICANT ACCOUNTING POLICIES
We adhere to the following significant accounting policies in the preparation of our consolidated financial statements:
Basis of Presentation and Principles of Consolidation
The consolidated financial statements and the accompanying notes are prepared in accordance with accounting principles generally accepted in the United States of America (“GAAP”) and the rules of the U.S. Securities and Exchange Commission (“SEC”). The consolidated financial statements include the accounts of our subsidiaries controlled by us and variable interest entities (“VIEs”) of which we are the primary beneficiary. A VIE is required to be consolidated by its primary beneficiary which is generally defined as the party who has (i) the power to direct the activities of a VIE that most significantly impact the VIE’s economic performance and (ii) the obligation to absorb losses of the VIE or the right to receive benefits that could potentially be significant to the VIE. We evaluate our relationships with our VIEs on an ongoing basis to determine whether we continue to be the primary beneficiary. Third party or affiliate ownership interests in our subsidiaries and consolidated VIEs are presented as noncontrolling interests. Intercompany transactions are eliminated in consolidation.
The preparation of consolidated financial statements in conformity with GAAP requires our management to make estimates and assumptions that affect the reported amounts of assets, liabilities, revenue and expenses during the reporting period and disclosure of contingent assets and liabilities at the date of the consolidated financial statements. Estimates and assumptions about future events and their effects cannot be made with certainty. Estimates may change as new events occur, when additional information becomes available and if our operating environment changes. Actual results could differ from our estimates.
70
Asset Retirement Obligations
We regularly assess our legal obligations with respect to estimated retirements of certain of our long-lived assets to determine if an asset retirement obligation (“ARO”) exists. The fair value of a liability related to the retirement of long-lived assets is recorded at the time a regulatory or contractual obligation is incurred, including obligations to perform an asset retirement activity in which the timing or method of settlement are conditional on a future event that may or may not be within the control of the entity. If an ARO is identified and a liability is recorded, a corresponding asset is recorded concurrently and is depreciated over the remaining useful life of the asset. After the initial measurement, the liability is periodically adjusted for costs incurred or settled, accretion expense, and any revisions made to the assumptions related to the retirement costs. Generally, the fair value of the liability is determined based on estimates and assumptions related to: (i) future retirement costs; (ii) future inflation rates; and (iii) credit-adjusted risk-free interest rates.
Our assets generally consist of terminals that we own and underground liquid petroleum products pipelines installed along rights-of-way acquired from land owners and related above-ground facilities. The significant majority of our rights-of-way agreements do not require the dismantling and removal of the pipelines and reclamation of the rights-of-way upon permanent removal of the pipelines from service. In addition, we assume substantially all of our common carrier properties operate indefinitely, as these assets generally serve in high-population and high-demand markets. Accordingly, other than with respect to facilities that are expected to be taken out of service, we have recorded no liabilities, or corresponding assets because the future dismantlement and removal dates for the majority of our assets, and the amount of any associated costs, are indeterminable. The ARO liability represents our best estimate of the costs to be incurred with information currently available and is based on certain assumptions, including: (i) timing of retirement of assets; (ii) methods of abandonment to be employed; and (iii) if applicable, our requirements under right-of-way agreements; therefore, it is likely that the ultimate costs to settle this liability will be different and such differences could be material.
ARO liabilities are included in accrued and other current liabilities, as well as other non-current liabilities. There were no significant changes in the estimates underlying ARO liabilities during the periods presented.
Business Combinations
We allocate the total purchase price of a business combination to the assets acquired and the liabilities assumed based on their estimated fair values at the acquisition date, with the excess purchase price recorded as goodwill. For material acquisitions, we may engage an independent valuation specialist to assist us in determining the fair value of the assets acquired and liabilities assumed, including goodwill, based on recognized business valuation methodologies. If the initial accounting for the business combination is incomplete by the end of the reporting period in which the acquisition occurs, an estimate will be recorded. Subsequent to the acquisition, and not later than one year from the acquisition date, we will record any material adjustments to the initial estimate in the reporting period in which the adjustment amounts are determined based on facts and circumstances that existed as of the acquisition date, as applicable. An income, market or cost valuation method may be utilized to estimate the fair value of the assets acquired or liabilities assumed in a business combination. The income valuation method represents the present value of future cash flows over the life of the asset using: (i) discrete financial forecasts, which rely on management’s estimates of revenue and operating expenses; (ii) long-term growth rates; and (iii) appropriate discount rates. The market valuation method uses prices paid for a reasonably similar asset by other purchasers in the market, with adjustments relating to any differences between the assets. The cost valuation method is based on the replacement cost of a comparable asset at prices at the time of the acquisition reduced for depreciation of the asset. We expense acquisition-related costs as incurred in connection with each business combination.
Business Segments
We operate and report in three business segments: (i) Domestic Pipelines & Terminals; (ii) Global Marine Terminals; and (iii) Merchant Services. See Note 24 for discussion of our business segments.
71
Capitalization of Interest
Interest on borrowed funds is capitalized on projects during construction based on the approximate average interest rate of our debt. Interest capitalized for the years ended December 31, 2017, 2016 and 2015 was $4.8 million, $4.4 million and $21.3 million, respectively. The weighted average rates used to capitalize interest on borrowed funds was 4.5%, 4.6% and 4.8% for the years ended December 31, 2017, 2016 and 2015, respectively.
Cash and Cash Equivalents
Cash equivalents represent all highly marketable securities with original maturities of three months or less. The carrying value of cash equivalents approximates fair value because of the short-term nature of these investments.
Comprehensive Income
Our comprehensive income is determined based on net income adjusted for unrealized gains and losses on derivative instruments for our cash flow hedging transactions, reclassification of derivative gains and losses to net income, recognition of costs related to our pension and post-retirement benefit plans, adjustments to the funded status of our pension and post-retirement benefit plans and our proportionate share of other comprehensive income from equity method investments.
Concentration of Credit Risk and Trade Receivables
Trade receivables of $265.0 million and $228.5 million included within accounts receivable, net on our consolidated balance sheets as of December 31, 2017 and 2016, respectively, are primarily due from major oil companies, national oil companies, refiners, marketing and trading companies, and commercial airlines. These concentrations of customers may affect our overall credit risk as these customers may be similarly affected by changes in economic, regulatory or other factors. We extend credit to customers and manage our credit risks through credit analysis and monitoring procedures, including credit approvals, credit limits and right of offset. Also, we manage our risk using collateral, such as letters of credit, prepayments, liens on customer assets and guarantees.
Trade receivables represent valid claims against non-affiliated customers and are recognized when products are sold or services are rendered. We record an allowance for doubtful accounts for estimated losses resulting from the inability of our customers to make required payments. We review the adequacy of the allowance for doubtful accounts monthly by making judgments regarding future events and trends based on the: (i) customers’ historical relationship with us; (ii) customers’ current financial condition; and (iii) current and projected economic conditions.
The following table presents activity in the allowance for doubtful accounts at the dates indicated (in thousands):
December 31, | |||||||||||
2017 | 2016 | 2015 | |||||||||
Balance at beginning of period | $ | 7,960 | $ | 8,380 | $ | 5,784 | |||||
Charged to expense | 305 | 2,143 | 2,983 | ||||||||
Write-offs, net of recoveries | (3,372 | ) | (2,563 | ) | (387 | ) | |||||
Balance at end of period | $ | 4,893 | $ | 7,960 | $ | 8,380 | |||||
Construction and Pipeline Relocation Receivables
Construction and pipeline relocation receivables are due from customers or other entities for services rendered in constructing or relocating pipelines and are recognized as revenue when services are rendered over the contract period or as reimbursements of capital expenditures for certain regulated operations, as appropriate.
72
Contingencies
Certain conditions may exist as of the date our consolidated financial statements are issued that may result in a loss to us, but which will only be resolved when one or more future events occur or fail to occur. Our management, with input from legal counsel, assesses such contingent liabilities, and such assessment inherently involves judgment. In assessing loss contingencies related to legal proceedings that are pending against us or unasserted claims that may result in proceedings, our management, with input from legal counsel, evaluates the perceived merits of any legal proceedings or unasserted claims as well as the perceived merits of the amount of relief sought or expected to be sought therein.
If the assessment of a contingency indicates that it is probable that a loss has been incurred and the amount of liability can be estimated, then the estimated liability is accrued in our consolidated financial statements. If the assessment indicates that a potentially material loss contingency is not probable but is reasonably possible, or is probable but cannot be estimated, then the nature of the contingent liability, together with an estimate of the range of possible loss if determinable and material, is disclosed. Actual results could vary from these estimates and judgments.
Loss contingencies considered remote are generally not disclosed unless they involve guarantees, in which case the guarantees would be disclosed.
In addition, we are subject to federal, state and local laws and regulations relating to the protection of the environment, which require us to remove or remedy the effect of the disposal or release of specified substances at our operating sites. We record environmental liabilities at a specific site when environmental assessments indicate remediation efforts are probable, and costs can be reasonably estimated based upon past experience, discussions with operating personnel, advice of outside engineering and consulting firms, discussion with legal counsel or current facts and circumstances. The estimates related to environmental matters are uncertain because: (i) estimated future expenditures are subject to cost fluctuations and change in the estimated remediation period; (ii) unanticipated liabilities may arise; and (iii) changes in federal, state and local environmental laws and regulations may significantly change the extent of remediation.
Our estimated environmental remediation liabilities are not discounted to present value since the ultimate amount and timing of cash payments for such liabilities are not readily determinable. Expenditures to mitigate or prevent future environmental contamination are capitalized. We monitor the environmental liabilities regularly and record adjustments to our initial estimates, from time to time, to reflect changing circumstances and estimates based upon additional developments or information obtained in subsequent periods. We maintain insurance which may cover certain environmental expenditures. Recoveries of environmental remediation expenses from other parties are recorded when their receipt is assured beyond a reasonable doubt.
Cost of Product Sales
Cost of product sales relates to sales of refined petroleum products, consisting primarily of gasoline, propane, ethanol, biodiesel and middle distillates, such as heating oil, diesel fuel and kerosene, and fuel oil, as well as the effects of hedges on refined petroleum product acquisition costs and hedges of fixed-price contracts.
Debt Issuance Costs
Costs incurred upon the issuance of our debt instruments are capitalized and amortized over the life of the associated debt instrument on a straight-line basis, which approximates the effective interest method. If the debt instrument is retired before its scheduled maturity date, any remaining issuance costs associated with that debt instrument are expensed in the same period. Debt issuance costs related to our existing $1.5 billion revolving Credit Facility with SunTrust Bank, as administrative agent, and other lenders dated September 30, 2014 (the “Credit Facility”), are reported in “Other non-current assets”. Debt issuance costs related to our outstanding notes and our $250.0 million variable-rate term loan with SunTrust Bank, as administrative agent, and other lenders due September 30, 2019 (the “Term Loan”) are reported in “Long-term debt” as a direct deduction from the carrying amount of our outstanding notes.
73
Derivative Instruments
Derivatives are financial and physical instruments whose fair value is determined by changes in a specified benchmark such as interest rates or commodity prices. We use derivative instruments such as forwards, futures, swaps and other contracts to manage market price risks associated with inventories, firm commitments, interest rates and certain forecasted transactions. We do not engage in speculative trading activities.
We recognize these transactions on our consolidated balance sheets as assets and liabilities based on the instrument’s fair value. Changes in fair value of derivative instrument contracts are recognized in earnings in the current period unless specific hedge accounting criteria are met. If the derivative instrument is designated as a hedging instrument in a fair value hedge, gains and losses incurred on the instrument will be recorded in earnings to offset corresponding losses and gains on the hedged item. If the derivative instrument is designated as a hedging instrument in a cash flow hedge, gains and losses incurred on the instrument are recorded in other comprehensive income. Any gains or losses incurred on the derivative instrument that are not effective in offsetting changes in fair value or cash flows of the hedged item are recognized immediately in earnings. Gains and losses on cash flow hedges are reclassified from accumulated other comprehensive income (“AOCI”) to earnings when the forecasted transaction occurs and affects net income or, as appropriate, over the economic life of the underlying asset or liability. Gains and losses related to a derivative instrument designated as a hedge of a forecasted transaction that is no longer likely to occur are immediately recognized in earnings. Physical forward contracts and futures contracts that have not been designated in a hedge relationship are marked-to-market.
To qualify as a hedge, the item to be hedged must expose us to risk and we must have an expectation that the related hedging instrument will be effective at reducing or mitigating that exposure. In accordance with the hedging requirements, we document all hedging relationships at inception and include a description of the risk management objective and strategy for undertaking the hedge, identification of the hedging instrument, the hedged item, the nature of the risk being hedged, the method for assessing effectiveness of the hedging instrument in offsetting the hedged risk and the method of measuring any ineffectiveness. We link all derivative instruments that are designated as fair value or cash flow hedges to specific assets and liabilities on our consolidated balance sheets or to specific firm commitments or forecasted transactions. When an event or transaction occurs, such as the sale of hedged fuel inventory or the expiration of derivative contracts, we discontinue hedge accounting. We also formally assess, both at the hedge’s inception and on an ongoing basis, whether the derivative instruments that are used in designated hedging relationships are highly effective in offsetting changes in fair values or cash flows of hedged items. If it is determined that a derivative instrument is not highly effective as a hedge or that it has ceased to be a highly effective hedge, we discontinue hedge accounting prospectively. We measure ineffectiveness by comparing the change in fair value of the hedge instrument to the change in fair value of the hedged item. The time value component is excluded from our hedge assessment and reported directly in earnings.
Discontinued Operations
In December 2013, the Board of Directors of Buckeye GP (the “Board”) approved a plan to divest the natural gas storage facility and related assets that our former subsidiary, Lodi Gas Storage, L.L.C. (“Lodi”), owned and operated in Northern California. We refer to this group of assets as our Natural Gas Storage disposal group. The results of operations for our Natural Gas Storage disposal group have been segregated and presented as discontinued operations for all periods presented in these financial statements. On December 31, 2014, we completed the sale of our Natural Gas Storage disposal group and have reported the final working capital adjustments as discontinued operations in the first quarter of 2015. See Note 4 for additional information.
Earnings per Unit
Basic and Diluted earnings per unit (“EPU”) are computed taking into account the weighted average outstanding limited partner units as well as the effect of participating securities. Our participating securities are generally comprised of certain unvested restricted units, granted under the 2013 Long Term Incentive Plan of Buckeye Partners, L.P. (the “LTIP”), and participate in earnings only to the extent of certain distribution equivalent rights. Net income allocable to participating securities reduces net income attributable to Buckeye Partners, L.P. to arrive at net income attributable to unitholders. For Diluted EPU, we use the more dilutive of the treasury stock or two-class method, taking into consideration dilutive securities resulting from LP Unit option grants or restricted-unit grants under the LTIP. See Note 23, Earnings Per Unit, for additional information.
74
Equity Investments
We account for investments in entities in which we do not exercise control, but have significant influence, using the equity method of accounting. Under this method, an investment is recorded at acquisition cost plus our equity in undistributed earnings or losses since acquisition, reduced by distributions received and amortization of excess net investment. Excess investment is the amount by which the total investment exceeds our proportionate share of the book value of the net assets of the investment. Such excess investment not related to any specific accounts of the investee is treated as goodwill and not amortized. Amounts associated with specific accounts of the investee are amortized. The amortization of excess net investment is included in earnings from equity investments in our consolidated statement of operations. We evaluate equity method investments for impairment whenever events or changes in circumstances indicate that there is an other than temporary loss in value of the investment. In the event that the loss in value of an investment is other than temporary, we record a charge to earnings to adjust the carrying value to fair value. We assess the fair value of equity investments using commonly accepted valuation methodologies, including but not limited to, peer group multiples, comparable sales-transaction multiples, and discounted cash flow models. Estimates of future cash flows that would be used to determine fair value include: (i) discrete financial forecasts, which rely on management’s estimates of revenue and operating expenses; (ii) long-term growth rates; and (iii) probabilities assigned to different cash flow scenarios. A significant change in these underlying assumptions could result in an impairment charge. There were no impairments of our equity investments for the years ended December 31, 2017, 2016 or 2015.
Fair Value Measurements
Fair value is defined as the price that would be received to sell an asset or paid to transfer a liability in an orderly transaction between market participants at a specified measurement date. Our fair value estimates are based on either: (i) actual market data or (ii) assumptions that other market participants would use in pricing an asset or liability, including estimates of risk. Recognized valuation techniques employ inputs such as product prices, operating costs, discount factors and business growth rates. These inputs may be either readily observable, corroborated by market data or generally unobservable. In developing our estimates of fair value, we endeavor to utilize the best information available and apply market-based data to the extent possible. Accordingly, we utilize valuation techniques that maximize the use of observable inputs and minimize the use of unobservable inputs.
A three-tier hierarchy has been established that classifies fair value amounts recognized or disclosed in the financial statements based on the observability of inputs used to estimate such fair values. The characteristics of fair value amounts classified within each level of the hierarchy are described as follows:
• | Level 1 inputs — unadjusted quoted prices which are available in active markets for identical, unrestricted assets or liabilities as of the reporting date; |
• | Level 2 inputs — quoted market prices in markets that are not considered to be active or financial instruments for which all significant inputs are observable, either directly or indirectly; and |
• | Level 3 inputs — prices or valuations that require inputs that are both significant to the fair value measurement and unobservable. These inputs are typically used in connection with internally developed valuation methodologies where management makes its best estimate of an instrument’s fair value. |
We categorize our financial assets and liabilities using this hierarchy at each balance sheet reporting date.
Foreign Currency
Puerto Rico is a commonwealth country under the U.S., and thus uses the U.S. dollar as its official currency. The functional currency of our operations in BBH and St. Lucia is the U.S. dollar. Foreign exchange gains and losses arising from transactions denominated in a currency other than the U.S. dollar relate to a nominal amount of supply purchases and are included in “Other income (expense)” within the consolidated statements of operations. The effects of foreign currency transactions were not material for the years ended December 31, 2017, 2016 and 2015.
75
Our equity method investment in VTTI indirectly exposes us to foreign currency risk, primarily with respect to the Euro, Malaysian Ringgit and United Arab Emirates Dirham. VTTI manages its exposure to foreign currency risk with foreign exchange hedging strategies. Our proportionate share of VTTI’s foreign currency transaction, hedging and translation gains and losses is included in our earnings from equity investments and accumulated other comprehensive income, as applicable. We recognized our proportionate share, of $49.6 million, of VTTI’s other comprehensive income, primarily comprised of foreign currency translation adjustments, in other comprehensive income for the year ended December 31, 2017.
Goodwill
Goodwill represents the excess of purchase price over fair value of net assets acquired. Our goodwill amounts are assessed for impairment: (i) on an annual basis on October 31st each year or (ii) on an interim basis if circumstances indicate it is more likely than not the fair value of a reporting unit is less than its fair value.
Goodwill is tested for impairment at each reporting unit. A reporting unit is a business segment or one level below a business segment for which discrete financial information is available and regularly reviewed by segment management. Our reporting units are our business segments, with the exception of our Global Marine Terminals segment which consists of: (i) our operations in the Caribbean and New York Harbor, including our equity investment in VTTI; and (ii) our operations in Buckeye Texas.
We may perform a qualitative assessment to determine whether the fair value of our reporting units are more likely than not less than the carrying amount. If we believe the fair value is less than the carrying amount, we would perform step one of the two-step goodwill impairment test. The first step of the goodwill impairment test determines whether an impairment exists by comparing the fair value of a reporting unit with its carrying amount, including goodwill. If the estimated fair value of the reporting unit exceeds its carrying amount, no impairment is indicated. If the carrying amount of a reporting unit exceeds its estimated fair value, an impairment is indicated and the second step of the test would be to measure the amount of impairment by comparing the implied fair value of the reporting unit goodwill to the carrying amount of that goodwill. The fair value of the reporting unit is allocated to all of the assets and liabilities of that unit as if the reporting unit had been acquired in a business combination. The excess of the fair value of the reporting unit over the amounts assigned to its assets and liabilities is the implied fair value of goodwill. The estimate of the fair value of the reporting unit is determined using a combination of an expected present value of future cash flows and a market multiple valuation method. The present value of future cash flows is estimated using: (i) discrete financial forecasts, which rely on management’s estimates of revenue and operating expenses; (ii) long-term growth rates; and (iii) appropriate discount rates. The market multiple valuation method uses appropriate market multiples from comparable companies on the reporting unit’s earnings before interest, tax, depreciation and amortization. We evaluate industry and market conditions for purposes of weighting the income and market valuation approach.
Income Taxes
With the exception of federal and state income taxes from Buckeye Development & Logistics I LLC (“BDL”), the Partnership’s federal and certain state income taxes are the responsibility of the partners and are not reflected in these consolidated financial statements.
In addition, outside the continental U.S., our operations at BBH and St. Lucia are exempt from income taxes. Our operations at BBH are tax exempt by the Bahamian government pursuant to concessions granted under the Hawksbill Creek Agreement between the Government of The Bahamas and the Grand Bahama Port Authority. These concessions have been extended through May 2036 by the Grand Bahama Investment Incentives Act. Our operations in St. Lucia are exempt from income taxes and duties pursuant to concessions granted under the terms of a tax concession agreement effective in 2007 and in effect for a minimum of 50 years. Our operations at the Yabucoa terminal are subject to income taxes within the Commonwealth of Puerto Rico. Buckeye Caribbean Terminals LLC (“Buckeye Caribbean”) is the holder of a tax exemption grant issued by the Office of Industrial Tax Exemption of the Puerto Rico Department of State under the Tax Incentives Act of 1998 (the “Act”). Under the current terms of the tax exemption grant, Buckeye Caribbean is subject to an income tax rate of 4% to 7% on industrial development income. The grant also provides additional exemptions as follows: (i) 90% exempt from real and personal property taxes; (ii) 60% exempt from municipal taxes on industrial development income; and (iii) 100% exempt from excise taxes imposed under Subtitle C of the Puerto Rico Internal Revenue Code, to the extent provided in Section 6(c) of the Act. The tax exemption grant provides a 20 year exemption period, which commenced on January 1, 2002 and, unless renewed, would end with the tax year ending December 31, 2021. We are currently seeking a renewal of our tax exemption grant.
76
We recognize deferred tax assets and liabilities for temporary differences between the amounts of assets and liabilities measured for financial reporting purposes and income tax purposes. Changes in tax legislation are included in the relevant computations in the period in which such changes are effective. Refer to Note 22 for the impact of recent tax legislation. We evaluate the need for a valuation allowance and consider all available positive and negative evidence, including projected operating income or losses for the foreseeable future, to determine the likelihood of realizing the benefits of deferred tax assets. If the value of the deferred tax assets exceeds the estimated future benefit, we record a valuation allowance to reduce our deferred tax assets to the amount of future benefit that is more likely than not to be realized. In the future, if the realization of the deferred tax assets should occur, a reduction to the valuation allowance related to the deferred tax assets would increase net income in the period such determination is made. We have no unrecognized tax benefits related to uncertain tax positions.
Intangible Assets
Intangible assets with finite useful lives are reviewed for impairment when events or changes in circumstances indicate that the carrying amount of such assets may not be recoverable. Intangible assets that have finite useful lives are amortized over their useful lives. Intangible assets include contracts and customer relationships. The fair values of these intangibles are based on the present value of cash flows attributable to the customer relationship or contract, which includes management’s estimates of revenue and operating expenses and costs relating to utilization of other assets to fulfill such contracts. The customer contracts are being amortized over their contractual lives with a range of 1 to 10 years. For the customer relationships, we determine the recovery period based on historical customer attrition rates and management’s assumptions on future events, including customer demand, contract renewal, useful lives of related assets and market conditions. The customer relationships are being amortized over the estimated recovery period of 12 to 20 years. When necessary, intangible assets’ useful lives are revised and the impact on amortization is reflected on a prospective basis.
Inventories
We generally maintain two types of inventory. Our Merchant Services segment principally maintains refined petroleum products inventory, consisting of gasoline, propane, ethanol, biodiesel and middle distillates, such as heating oil, diesel fuel and kerosene. Inventory is generally valued at the lower of weighted average cost or net realizable value, unless such inventories are hedged. Net realizable value is defined as the estimated selling price in the ordinary course of business, less reasonably predictable costs of completion, disposal and transportation. Hedged inventory is adjusted for the effects of applying fair value hedge accounting.
We also maintain materials and supplies inventory such as pipes, valves, pumps, electrical/electronic components, drag reducing agent and other miscellaneous items that are valued at the lower of weighted average cost or net realizable value.
Noncontrolling Interests
The consolidated balance sheets and statements of operations include noncontrolling interests that relate primarily to Buckeye Texas, Buckeye Pipe Line Services Company (“Services Company”) and the Sabina crude butadiene pipeline (the “Sabina Pipeline”) that are not wholly owned by Buckeye.
Pensions and Postretirement Benefits
Services Company sponsors a defined contribution plan, a defined benefit plan and the Employee Stock Ownership Plan (“ESOP”) that provide retirement benefits to certain regular full-time employees. Services Company also sponsors an unfunded post-retirement plan that provides health care and life insurance benefits for certain of its retirees. We develop pension and postretirement health care and life insurance benefits costs from actuarial valuations. The measurement of expenses and liabilities related to these plans is based on management’s assumptions related to future events, including discount rate, expected return on plan assets, rate of compensation increase, and health care cost trend rates. The actuarial assumptions that we use may differ from actual results due to changing market rates or other factors. These differences could affect the amount of pension and postretirement health care and life insurance benefit expense we have recorded or may record.
77
Property, Plant and Equipment
We record property, plant and equipment at its original acquisition cost. Property, plant and equipment consist primarily of pipelines, terminals, storage and processing facilities, jetties, subsea pipelines and docks, and pumping and station equipment. Generally, we depreciate property, plant and equipment based on the straight-line method over the estimated useful lives, except for land. See Note 8 for the depreciation life of our assets.
Additions to property, plant and equipment, including maintenance and expansion and cost reduction capital expenditures, are recorded at cost. Maintenance capital expenditures maintain and enhance the safety and integrity of our pipelines, terminals, storage and processing facilities, and related assets, and expansion and cost reduction capital expenditures expand the reach or capacity of those assets, to improve the efficiency of our operations and to pursue new business opportunities. We expense routine maintenance and repairs as incurred in the period incurred. The cost of property, plant and equipment sold or retired and the related accumulated depreciation, except for certain pipeline system assets, are removed from our consolidated balance sheet in the period of sale or disposition, and any resulting gain or loss is included in earnings. For our pipeline system assets where we apply group depreciation method, we generally charge the original cost of property sold or retired to accumulated depreciation and amortization, net of salvage and cost of removal. When a separately identifiable group of assets, such as a stand-alone pipeline system is sold, we will recognize a gain or loss in our consolidated statements of operations for the difference between the cash received and the net book value of the assets sold.
We assess the recoverability of our long-lived assets whenever events or changes in circumstances indicate that the carrying amount of an asset may not be recoverable. We determine the estimated undiscounted future cash flows expected to result from the use of the asset and its eventual disposal. If the sum of the estimated undiscounted future cash flows exceeds the carrying amount, no impairment is necessary. If the carrying amount exceeds the sum of the undiscounted cash flows, an impairment charge is recognized based on the amount by which the carrying amount of the assets exceeds the estimated fair value of the assets. Assets to be disposed of are reported at the lower of the carrying amount or estimated fair value less costs to sell. Estimates of undiscounted future cash flows include: (i) discrete financial forecasts, which rely on management’s estimates of revenue and operating expenses; (ii) long-term growth rates; and (iii) estimates of useful lives of the assets. Such estimates of future undiscounted net cash flows are highly subjective and are based on numerous assumptions about future operations and market conditions.
Revenue Recognition
Domestic Pipelines & Terminals segment. Revenue from pipeline operations is comprised of tariffs and fees associated with the transportation of liquid petroleum products or crude oil at published tariffs as well as revenue associated with line leases for committed capacity on a particular system. Tariff revenue is recognized either at the point of delivery or at the point of receipt, pursuant to specifications outlined in the respective tariffs. Revenue associated with line leases is recognized ratably over the respective lease terms, regardless of whether the capacity is actually utilized, and is subject to take-or-pay arrangements. Pipeline tariff and fee revenue is based upon actual volumes and rates. As is common in the industry, our tariffs incorporate loss allocation or loss allowance factors that are intended to, among other things, offset losses due to evaporation, measurement and other product losses in transit. We value the variance of allowance volumes to actual losses at the estimated net realizable value at the time the variance occurred, and the result is recorded as either an increase or decrease to transportation and other service revenue. In addition, we have certain agreements that require counterparties to ship a minimum volume over an agreed-upon period. Revenue pursuant to such agreements is recognized at the earlier of when the volume is shipped, the counterparty’s ability to meet the minimum volume commitment has expired, or the probability of the commitment being met is determined to be remote.
78
Revenue from terminalling and storage operations is recognized as services are performed. Storage and terminalling revenue include storage fees, which are generated when we provide storage capacity, and terminalling or throughput fees, which are generated when we receive liquid petroleum products from one connecting pipeline and redeliver such products to another connecting carrier pipeline or to customers through a truck, vessel, or rail-loading rack. We generate revenue through a combination of month-to-month and multi-year storage capacity and terminalling service arrangements. Storage fees resulting from short-term and long-term contracts are typically recognized in revenue ratably over the term of the contract, regardless of the actual storage capacity utilized. Terminalling fees are recognized as the refined petroleum product or crude oil is received or exits the terminal and is delivered to a connecting carrier, third-party terminal or a customer through a truck, vessel, or rail-loading rack. In addition, we have certain agreements that require counterparties to throughput a minimum volume over an agreed-upon period. Revenue pursuant to such agreements is recognized at the earlier of when the volume exits the terminal or when the counterparty’s ability to meet the minimum volume commitment has expired, or the probability of the commitment being met is determined to be remote. Butane blending revenues are recognized as blending activities are completed and include the change in the fair value of financial derivative instruments used to manage the commodity price risk associated with gasoline-to-butane pricing spreads.
Revenue from contract operation and construction services of facilities and pipelines not directly owned by us is recognized as the services are performed. Contract and construction services revenue typically includes costs to be reimbursed by the customer plus an operator fee.
Global Marine Terminals segment. Revenue from terminalling and storage operations is recognized as the services are performed. Storage and terminalling revenue includes storage fees, which are generated when we provide storage capacity, and terminalling or throughput fees, which are generated when we receive liquid petroleum products or crude oil from sea going vessels, pipelines, trucks, or rail and redeliver such products to customers through marine applications, truck-loading racks, and pipelines. We generate revenue through a combination of storage capacity, terminalling and tolling service arrangements. Storage fees resulting from short-term and long-term contracts are typically recognized in revenue ratably over the term of the contract, regardless of the actual storage capacity utilized. Terminalling fees are recognized as the liquid petroleum product or crude oil exits the terminal and is delivered to a connecting carrier, third-party terminal or a customer through a truck-loading rack or vessel. Tolling agreement fees related to our processing operations are recognized as volumes are tolled and are based on minimum volume and product specification requirements. In addition, we have agreements that require counterparties to throughput a minimum volume over an agreed-upon period. Revenue pursuant to such agreements is recognized ratably over the agreed-upon period until such time the minimum obligation is fulfilled, and thereafter as volume exits the terminal. Revenue from other ancillary services is recognized in the accounting period in which the services are rendered.
Merchant Services segment. Revenue from the sale of petroleum products, including fuel oil, which are sold on a wholesale basis, is recognized at the time title to the product sold transfers to the purchaser, which occurs upon delivery of the product to the purchaser or its designee. We enter into exchange contracts and matching buy/sell arrangements whereby we agree to deliver a particular quantity and quality of crude oil or refined products at a specified location and date to a particular counterparty and to receive from the same counterparty the same or similar commodity at a specified location on the same or another specified date. The exchange receipts and deliveries are nonmonetary transactions, with the exception of associated grade or location differentials that are settled in cash. The matching buy/sell purchase and sale transactions are settled in cash. Both exchange and matching buy/sell transactions are accounted for as exchanges of inventory, and pricing differentials are recorded in “Product sales” revenues. The exchange transactions are recognized at the carrying amount of the inventory transferred.
Unit-Based Compensation
We award unit-based compensation to employees and directors primarily under the LTIP. All unit-based payments to employees under the LTIP, including grants of phantom units and performance units, are recognized in our consolidated statements of operations based on their grant date fair values. Compensation expense equal to the fair value of those performance unit and phantom unit awards that are expected to vest is estimated and recorded over the period the grants are earned, which is the vesting period. Compensation expense estimates are updated periodically. The vesting of the performance unit awards is also contingent upon the attainment of predetermined performance goals. Depending on the estimated probability of attainment of those performance goals, the compensation expense recognized related to the awards could increase or decrease over the remaining vesting period.
79
Variable Interest Entities
We evaluate our financial interests in business enterprises to determine if they represent VIEs of which we are the primary beneficiary. If such criteria are met (as discussed above in “Basis of Presentation and Principles of Consolidation”), we reflect these entities as consolidated subsidiaries. There were no changes to the entities consolidated for the year ended December 31, 2017.
Buckeye Texas, Services Company and Sabina Pipeline are VIEs of which we are the primary beneficiary and are, therefore, consolidated. We own an 80% interest in Buckeye Texas and a 63% interest in Sabina Pipeline. Third party or affiliate ownership interests in our consolidated VIEs are presented as noncontrolling interests.
Recent Accounting Developments
Tax Cuts and Jobs Act. In December 2017, the Tax Cuts and Jobs Act (the “Tax Act”) was passed into law. The Tax Act makes changes to the U.S. tax code including, but not limited to (i) reducing the U.S. federal corporate income tax rate from a top rate of 35% to 21% effective January 1, 2018, (ii) requiring a one-time transition tax on certain unrepatriated earnings of foreign subsidiaries that may electively be paid over eight years, and (iii) accelerated first year expensing of certain capital expenditures.
Shortly after the Tax Act was enacted, the SEC staff issued Staff Accounting Bulletin (“SAB”) No. 118, Income Tax Accounting Implications of the Tax Cuts and Jobs Act (“SAB 118”) which provides guidance on accounting for the Tax Act’s impact. SAB No. 118 provides a measurement period, which in no case should extend beyond one year from the Tax Act enactment date, during which an entity acting in good faith may complete the accounting for the impacts of the Tax Act under Accounting Standards Codification (“ASC”) Topic 740. In accordance with SAB No. 118, the entity must reflect the income tax effects of the Tax Act in the reporting period in which the accounting under ASC Topic 740 is complete. Since we and each of our subsidiaries, except for BDL, are not taxable entities, the Tax Act did not have a material impact on our consolidated financial statements or on our disclosures. We continue to evaluate certain aspects of the Tax Act and have recorded certain adjustments to our deferred taxes as discussed in Note 22.
Income Statement. In November 2017, the Financial Accounting Standards Board (“FASB”) issued guidance which amends previously issued guidance from the SEC. The amendments in Accounting Standards Update (“ASU”) 2017-14, “Income Statement—Reporting Comprehensive Income (Topic 220), Revenue Recognition (Topic 605), and Revenue from Contracts with Customers (Topic 606): Amendments to SEC Paragraphs Pursuant to Staff Accounting Bulletin No. 116 and SEC Release 33-10403” amend various paragraphs in ASC 220, Income Statement — Reporting Comprehensive Income; ASC 605, Revenue Recognition; and ASC 606, Revenue From Contracts With Customers, that contain SEC guidance. The amendments include guidance superseding ASC 605-10-S25-1 (SAB Topic 13) as a result of SEC Staff Accounting Bulletin No. 116 and adding ASC 606-10-S25-1 as a result of SEC Release No. 33-10403. We do not believe our adoption of this guidance will have a material impact on our consolidated financial statements or on our disclosures.
Derivatives and Hedging. In August 2017, the FASB issued guidance which amends and simplifies existing guidance in order to improve the financial reporting of hedging relationships to better align risk management activities in financial statements and make targeted improvements to simplify the application of current guidance related to the assessment of hedge effectiveness. The amendments are effective for fiscal years beginning after December 15, 2018, and interim periods within those fiscal years, with early application permitted. The new guidance requires prospective application, with a cumulative effect adjustment to the beginning balance of partners’ capital for existing hedging relationships. We are currently evaluating the impact the adoption of this guidance will have on our consolidated financial statements.
Modifications to Share-Based Payment Awards. In May 2017, the FASB issued guidance to clarify when changes in the terms or conditions of share-based payment awards must be accounted for as modifications under existing guidance. The guidance requires that entities apply modification accounting unless the award’s fair value, vesting conditions and classification as an equity or liability instrument are the same immediately before and after the change. The amendments are effective for interim and annual periods beginning after December 15, 2017, with early adoption permitted. The amendments should be applied prospectively to awards modified on or after the adoption date. We adopted this guidance on January 1, 2018, and it will be applied prospectively to modifications of our unit-based awards, if any.
80
Retirement Benefits. In March 2017, the FASB issued guidance to amend the presentation of net periodic pension cost and net periodic postretirement benefit cost. The guidance requires that the service cost component of net periodic pension and postretirement benefit cost be presented in the same income statement line item as other employee compensation costs, while the other components are required to be presented separately within non-operating income. The guidance also allows only the service cost component to be eligible for capitalization when applicable. The amendments are effective for interim and annual periods beginning after December 15, 2017. The amendments should be applied retrospectively for the presentation of the service cost component and the other components of net periodic pension cost and net periodic postretirement benefit cost in the income statement and prospectively, on and after the effective date, for the capitalization of the service cost component of net periodic pension cost and net periodic postretirement benefit in assets. We adopted this guidance on January 1, 2018, and it did not have a material impact on our consolidated financial statements.
Goodwill Impairment. In January 2017, the FASB issued guidance simplifying the test for goodwill impairment. The guidance eliminates Step 2 from the goodwill impairment test, which required entities to calculate the implied fair value of a reporting unit’s goodwill by assigning the fair value of a reporting unit to all of its assets and liabilities as if that reporting unit had been acquired in a business combination. Under the new guidance, entities will recognize an impairment charge for the amount by which the fair value of a reporting unit exceeds its carrying amount. The guidance must be applied using a prospective approach and is effective for interim and annual goodwill impairment tests in fiscal years beginning after December 15, 2019, with early adoption permitted. We do not believe our adoption of this guidance will have a material impact on our consolidated financial statements or on our disclosures.
Business Combinations. In January 2017, the FASB issued guidance clarifying the definition of a business in order to assist entities with evaluating whether transactions should be accounted for as acquisitions/disposals of assets or businesses. The guidance provides a screen to help entities determine when an integrated set of assets and activities is not a business. The screen requires that when substantially all of the fair value of the gross assets acquired (or disposed of) is concentrated in a single identifiable asset or a group of similar identifiable assets, the set of assets is not a business. If the threshold of the screen is not met, the guidance further clarifies that the set of assets is not a business unless it includes an input and a substantive process that together significantly contribute to the ability to create output. The guidance must be applied using a prospective approach and is effective for annual reporting periods beginning after December 15, 2017 and interim periods within those annual periods, with early adoption permitted for specific transactions. We adopted this guidance on January 1, 2018 and it will be applied prospectively to future business combinations.
Classification of Certain Cash Receipts and Cash Payments. In August 2016, the FASB issued guidance requiring changes in the presentation of certain items including but not limited to debt prepayment or debt extinguishment costs; contingent consideration payments made after a business combination; proceeds from the settlement of insurance claims; proceeds from the settlement of corporate-owned life insurance policies and distributions received from equity method investees. The amendments in this ASU are effective for annual reporting periods beginning after December 15, 2017 and interim periods within those annual periods, with early adoption permitted. The amendments in this ASU should be applied retrospectively. We adopted this guidance on January 1, 2018 and it did not have a material impact on our consolidated financial statements.
Equity-Based Compensation. In March 2016, the FASB issued guidance to simplify several aspects of the accounting for employee equity-based payment transactions, including the accounting for income taxes, forfeitures and statutory tax withholding requirements, as well as classification in the statement of cash flows and classification of awards as liabilities or equity. The guidance was effective for annual reporting periods beginning after December 15, 2016 and interim periods within those annual periods, with early adoption permitted. Amendments related to the timing of when excess tax benefits are recognized, statutory withholding requirements and forfeitures were to be applied using a modified retrospective transition method by means of a cumulative-effect adjustment to equity as of the beginning of the period in which the guidance is adopted. Amendments related to the presentation of employee taxes paid on the statement of cash flows were to be applied retrospectively. Amendments requiring recognition of excess tax benefits and tax deficiencies in the income statement were to be applied prospectively. Amendments related to the presentation of excess tax benefits on the statement of cash flows were to be applied using either a prospective transition method or a retrospective transition method. We adopted this guidance as of January 1, 2017 and did not recognize a retrospective transition adjustment. The adoption of this guidance did not have a material impact on our consolidated financial statements or on our disclosures.
81
Leases. In February 2016, the FASB issued guidance requiring lessees to recognize a right-of-use asset and a lease liability on the balance sheet for leases with lease terms greater than twelve months. This update also requires enhanced disclosures regarding the amount, timing and uncertainty of cash flows arising from leases. The guidance must be applied using a modified retrospective approach. The amendments in this ASU are effective for annual reporting periods beginning after December 15, 2018 and interim periods within those annual periods, with early adoption permitted. We expect to adopt this ASU on January 1, 2019. We are currently evaluating the impact the adoption of this guidance will have on our consolidated financial statements.
Revenue from Contracts with Customers. In May 2014, the FASB issued a new standard related to revenue recognition. Under the new standard and its related subsequent amendments (collectively known as ASC 606), revenue is recognized when a customer obtains control of promised goods and services. This new standard amended existing accounting standards for revenue recognition, including industry-specific requirements, and provides entities with a single revenue recognition model for recognizing revenue from contracts with customers. The core principle of ASC 606 is that an entity should recognize revenue from contracts with customers when it transfers promised goods or services to customers in an amount that reflects the consideration to which the entity expects to be entitled in exchange for those goods or services. Furthermore, additional disclosures will be required to describe the nature, amount, timing and uncertainty of revenue and cash flows arising from customer contracts. The two permitted transition methods under ASC 606 are the full retrospective method, which would be applied to each prior reporting period presented and the cumulative effect of applying the standard would be recognized at the earliest period shown, or the modified retrospective method, in which the cumulative effect of applying the standard would be recognized at the date of initial application. We adopted this guidance on January 1, 2018, using the modified retrospective transition method. The adoption of this standard did not have a material impact on the timing or amount of our revenue recognition. Enhanced disclosures will be included in our quarterly and annual consolidated financial statements beginning in 2018.
3. ACQUISITIONS AND DISPOSITION
Business Combinations
2017 Transaction
Duck Island terminal acquisition
In December 2017, we acquired Duck Island Terminal LLC, a liquid petroleum products terminalling business in Trenton, New Jersey, for approximately $27.0 million, net of cash acquired of $2.4 million, which remains subject to a final working capital adjustment. The assets of this entity are reported in our Domestic Pipelines & Terminals segment. The purchase price has been allocated on a preliminary basis to assets acquired and liabilities assumed based on estimated fair values at the acquisition date, with amounts exceeding the fair value recorded as goodwill, which represent expected synergies from combining acquired assets with our existing operations. Fair values have been developed using recognized business valuation techniques, with inputs classified as Level 3 within the fair value hierarchy. The purchase price has been allocated to tangible and intangible assets acquired as follows (in thousands):
Current assets, including cash acquired of $2,444 | $ | 9,901 | |
Property, plant and equipment | 18,306 | ||
Intangible Assets | 2,200 | ||
Goodwill | 2,768 | ||
Current liabilities | (3,490 | ) | |
Environmental liabilities | (299 | ) | |
Allocated purchase price | $ | 29,386 | |
Unaudited Pro forma Financial Results for Duck Island terminal acquisition
Our consolidated statements of operations do not include earnings from the terminalling business prior to December 20, 2017, the closing date of the acquisition. Unaudited pro forma financial information for this acquisition was not prepared because the impact was immaterial to our financial results for the year ended December 31, 2017.
82
2016 Transaction
Indianola terminalling facility acquisition
In August 2016, we acquired a liquid petroleum products terminalling facility in Indianola, Pennsylvania from Kinder Morgan Transmix Company, LLC for $26.0 million. The operations of these assets are reported in our Domestic Pipelines & Terminals segment. The purchase price has been allocated to assets acquired based on estimated fair values at the acquisition date, with amounts exceeding the fair value recorded as goodwill, which represent expected synergies from combining the acquired assets with our existing operations. Fair values have been developed using recognized business valuation techniques, with inputs classified as Level 3 within the fair value hierarchy. The purchase price has been allocated to tangible and intangible assets acquired as follows (in thousands):
Inventories | $ | 1,554 | |
Property, plant and equipment | 16,713 | ||
Goodwill | 7,758 | ||
Allocated purchase price | $ | 26,025 | |
We finalized the purchase price allocation during the third quarter of 2017 without significant adjustments.
Unaudited Pro forma Financial Results for the Indianola terminalling facility acquisition
Our consolidated statements of operations do not include earnings from the terminalling facility prior to August 4, 2016, the closing date of the acquisition. The preparation of unaudited pro forma financial information for the terminalling facility is impracticable due to the fact that meaningful historical revenue information is not available. The revenues and earnings impact of this acquisition was not significant to our financial results for the year ended December 31, 2016.
2015 Transactions
Pennsauken pipeline acquisition
In December 2015, we acquired a pipeline and associated tanks and other infrastructure in Pennsauken, New Jersey for $5.3 million. The operations of these assets are reported in our Domestic Pipelines & Terminals segment. The acquisition cost has been allocated to assets acquired and liabilities assumed based on estimated fair values at the acquisition date, with amounts exceeding the fair value recorded as goodwill, which represent expected synergies from combining the acquired assets with our existing operations. Fair values have been developed using recognized business valuation techniques, with inputs classified as Level 3 within the fair value hierarchy. The purchase price has been allocated to tangible and intangible assets acquired and liabilities assumed as follows (in thousands):
Property, plant and equipment | 7,159 | ||
Goodwill | 500 | ||
Environmental liabilities | (2,372 | ) | |
Allocated purchase price | $ | 5,287 | |
We finalized the purchase price allocation during the third quarter of 2016. Adjustments to the preliminary purchase price allocation resulted in an increase to property, plant and equipment of $1.9 million, with a corresponding decrease to goodwill. The change to the preliminary amount resulted in a nominal increase to depreciation expense and accumulated depreciation.
Unaudited Pro forma Financial Results for the Pennsauken pipeline acquisition
Our consolidated statements of operations do not include earnings from the pipeline and associated tanks and other infrastructure prior to December 10, 2015, the effective acquisition date of these assets. The preparation of unaudited pro forma financial information for the pipeline and associated tanks and other infrastructure is impracticable due to the fact that meaningful historical revenue information is not available. The revenues and earnings impact of this acquisition was not significant to our financial results for the year ended December 31, 2015.
83
Springfield pipeline and terminal acquisitions
In March and May 2015, we acquired a terminal and pipeline in Springfield, Massachusetts from ExxonMobil Oil Corporation (“ExxonMobil”) for an aggregate $7.7 million. The operations of these assets are reported in our Domestic Pipelines & Terminals segment. The acquisition cost has been allocated to assets acquired and liabilities assumed based on estimated fair values at the acquisition date, with amounts exceeding the fair value recorded as goodwill, which represents both expected synergies from combining the acquired assets with our existing operations and the economic value attributable to optimizing, modernizing and commercializing the asset from this acquisition. Fair values have been developed using recognized business valuation techniques, with inputs classified as Level 3 within the fair value hierarchy. We finalized the purchase price allocation during the first quarter of 2016. The purchase price has been allocated to tangible and intangible assets acquired and liabilities assumed as follows (in thousands):
Property, plant and equipment | $ | 4,040 | |
Goodwill | 8,165 | ||
Asset retirement obligation | (4,200 | ) | |
Environmental liabilities | (293 | ) | |
Allocated purchase price | $ | 7,712 | |
Unaudited Pro forma Financial Results for the Springfield pipeline and terminal acquisition
Our consolidated statements of operations do not include earnings from the pipeline and terminal acquired from ExxonMobil prior to March 31, 2015 and May 5, 2015, the effective acquisition dates of the terminal and pipeline acquired from ExxonMobil, respectively. The preparation of unaudited pro forma financial information for the terminal and pipeline acquired from ExxonMobil is impracticable due to the fact that ExxonMobil historically operated the assets as part of its integrated distribution network and, therefore, meaningful historical revenue information is not available. The revenues and earnings impact of this acquisition was not significant to our financial results for the year ended December 31, 2015.
Acquisition of Remaining Interest in WesPac Pipelines - Memphis LLC
In April 2015, our operating subsidiary, BPH, purchased from Kealine LLC for $10.0 million the remaining 10% ownership interest in Buckeye Aviation (Memphis) LLC, formerly known as WesPac Pipelines - Memphis LLC (“Buckeye Memphis”), which was accounted for as an equity transaction. As a result of the acquisition, we now own 100% of Buckeye Memphis. The acquisitions were accounted for as equity transactions since BPH retained controlling interest in Buckeye Memphis.
Equity Investment Transactions
VTTI Acquisition
In January 2017, we acquired an indirect 50% equity interest in VTTI for cash consideration of $1.15 billion (the “VTTI Acquisition”). We own VTTI jointly with Vitol S.A. (“Vitol”). VTTI is one of the largest independent global marine terminal businesses which, through its subsidiaries and partnership interests, owns and operates approximately 58 million barrels of petroleum products storage across 15 terminals located on five continents. These marine terminals are predominately located in key global energy hubs, including Northwest Europe, the Middle East and Southeast Asia, and offer world-class storage and marine terminalling services for liquid petroleum products. We and VIP Terminals Finance B.V., a subsidiary of Vitol, have equal board representation and voting rights in the VTTI joint venture. We account for this investment using the equity method of accounting. Under this method, an investment is recorded at acquisition cost plus our equity in undistributed earnings or losses since acquisition, reduced by distributions received and amortization of excess net investment. The earnings from our equity investment in VTTI are reported in our Global Marine Terminals segment. In addition, we include our proportionate share of our equity method investments’ unrealized gains and losses in other comprehensive income in our consolidated financial statements.
84
The estimated fair values used to calculate the excess net investment in VTTI were primarily developed using an income approach, with inputs classified as Level 3 within the fair value hierarchy. The excess net investment was $583.3 million at the acquisition date and was comprised of the following components: (i) $233.0 million related to the excess of the fair values of identifiable property, plant and equipment and intangible assets over their carrying values, which is being amortized on a straight-line basis over the estimated useful lives of these underlying assets of approximately 28 years; and (ii) $350.3 million of implied goodwill, which is not subject to amortization. The amortization of the excess net investment is included in earnings from equity investments in our consolidated statements of operations.
In September 2017, VTTI acquired all of the outstanding publicly held units of VTTI Energy Partners LP, formerly a publicly traded master limited partnership (“VTTI MLP”), for an aggregate cash consideration of $473.6 million (the “VTTI Merger”). In connection with the VTTI Merger, VTTI MLP merged with and into a direct wholly owned subsidiary of VTTI. We funded our 50% share of the aggregate cash consideration, in the amount of $236.8 million, excluding transaction costs, through a capital contribution to VTTI, using borrowings under our Credit Facility.
4. DISCONTINUED OPERATIONS
In December 2013, the Board approved a plan to divest our Natural Gas Storage disposal group. In December 2014, we completed the sale of our Natural Gas Storage disposal group for $102.6 million in cash, net of expenses and working capital adjustments of $2.4 million. We reported the final working capital adjustments recorded in the first quarter of 2015 as a loss from discontinued operations for the year ended December 31, 2015.
The following table summarizes the results from discontinued operations (in thousands):
December 31, 2015 | |||
Revenue | $ | — | |
Loss from discontinued operations | (857 | ) | |
5. COMMITMENTS AND CONTINGENCIES
Claims and Legal Proceedings
In the ordinary course of business, we are involved in various claims and legal proceedings, some of which are covered by insurance. We are generally unable to predict the timing or outcome of these claims and proceedings. Based upon our evaluation of existing claims and proceedings and the probability of losses relating to such contingencies, we have accrued certain amounts relating to such claims and proceedings, none of which are considered material.
Environmental Contingencies
We recorded operating expenses, net of recoveries, of $7.4 million, $8.2 million and $6.2 million during the years ended December 31, 2017, 2016 and 2015, respectively, related to environmental remediation liabilities unrelated to claims and legal proceedings. See Notes 12 and 14 for further information. Costs ultimately incurred may be in excess of our estimates, which may have a material impact on our financial condition, results of operations or cash flows. At December 31, 2017 and 2016, we had $5.3 million and $7.2 million, respectively, of receivables related to these environmental remediation liabilities covered by insurance or third-party claims.
85
Lease Obligations
We lease certain property, plant and equipment under noncancelable and cancelable operating leases. Rental expense is charged to operating expenses on a straight-line basis over the period of expected benefit. Contingent rental payments are expensed as incurred. Total rental expense for the years ended December 31, 2017, 2016 and 2015 was $29.9 million, $32.8 million and $31.0 million, respectively. The following table presents minimum lease payment obligations under our operating leases with terms in excess of one year for the years ending December 31st (in thousands):
Total (1) | |||
2018 | 16,823 | ||
2019 | 14,420 | ||
2020 | 14,684 | ||
2021 | 14,535 | ||
2022 | 12,876 | ||
Thereafter | 126,348 | ||
Total | $ | 199,686 | |
____________________________
(1) | Includes BBH facility leases for properties in connection with jetty and inland dock operations, as well as tugboats and a barge in our Global Marine Terminals segment. |
Additionally, our rights-of-way payments for the years ended December 31, 2017, 2016 and 2015 were $7.4 million, $7.1 million and $7.0 million, respectively; and are subject to an annual escalation for the remaining life of all pipelines and terminals.
6. INVENTORIES
Our inventory amounts were as follows at the dates indicated (in thousands):
December 31, | |||||||
2017 | 2016 | ||||||
Liquid petroleum products (1) | $ | 280,934 | $ | 337,424 | |||
Materials and supplies | 20,491 | 19,379 | |||||
Total inventories | $ | 301,425 | $ | 356,803 | |||
____________________________
(1) | Ending inventory was 142.1 million and 198.2 million gallons of liquid petroleum products at December 31, 2017 and 2016, respectively. |
At December 31, 2017 and 2016, approximately 85% and 88% of our liquid petroleum products inventory volumes were designated in a fair value hedge relationship, respectively. Because we generally designate inventory as a hedged item upon purchase, hedged inventory is valued at current market prices with the change in value of the inventory reflected in our consolidated statements of operations.
86
7. PREPAID AND OTHER CURRENT ASSETS
Prepaid and other current assets consist of the following at the dates indicated (in thousands):
December 31, | |||||||
2017 | 2016 | ||||||
Prepaid insurance | $ | 7,146 | $ | 7,609 | |||
Margin deposits | 7,989 | 43,912 | |||||
Unbilled revenue | 13,999 | 1,615 | |||||
Prepaid taxes | 2,865 | 7,357 | |||||
Other | 4,340 | 6,043 | |||||
Total prepaid and other current assets | $ | 36,339 | $ | 66,536 | |||
87
8. PROPERTY, PLANT AND EQUIPMENT
Property, plant and equipment consist of the following at the dates indicated (in thousands):
Estimated Useful Lives (Years) | December 31, | ||||||||
2017 | 2016 | ||||||||
Land | N/A | $ | 677,866 | $ | 670,437 | ||||
Rights-of-way | (1) | 109,282 | 107,448 | ||||||
Buildings and leasehold improvements | 13-50 | 282,778 | 254,421 | ||||||
Jetties, subsea pipeline and docks | 20-50 | 646,922 | 629,316 | ||||||
Gas storage facility | 25-50 | 2,349 | 2,349 | ||||||
Pipelines and terminals | 7-50 | 5,289,096 | 4,968,574 | ||||||
Vehicles, equipment and office furnishings | 3-20 | 150,403 | 130,247 | ||||||
Processing facilities | 30-50 | 589,971 | 598,837 | ||||||
Construction in progress | N/A | 179,573 | 162,145 | ||||||
Total property, plant and equipment | 7,928,240 | 7,523,774 | |||||||
Less: Accumulated depreciation | (1,192,448 | ) | (1,040,492 | ) | |||||
Total property, plant and equipment, net | $ | 6,735,792 | $ | 6,483,282 | |||||
____________________________
(1) | Rights-of-way assets are depreciated over the useful life of the related pipeline assets. |
Depreciation expense was $202.8 million, $186.6 million and $158.7 million for the years ended December 31, 2017, 2016 and 2015, respectively.
9. EQUITY INVESTMENTS
The following table presents our equity investments at the dates indicated (in thousands):
December 31, | |||||||||||
Segment | Ownership | 2017 | 2016 | ||||||||
VTTI B.V. | Global Marine Terminals | 50.0% | $ | 1,399,825 | $ | — | |||||
West Shore Pipe Line Company | Domestic Pipelines & Terminals | 34.6% | 70,035 | 66,065 | |||||||
Muskegon Pipeline LLC | Domestic Pipelines & Terminals | 40.0% | 13,335 | 13,523 | |||||||
Transport4, LLC | Domestic Pipelines & Terminals | 25.0% | 699 | 474 | |||||||
South Portland Terminal LLC | Domestic Pipelines & Terminals | 50.0% | 10,518 | 9,502 | |||||||
Total equity investments | $ | 1,494,412 | $ | 89,564 | |||||||
The following table presents earnings from equity investments for the periods indicated (in thousands):
Year Ended December 31, | |||||||||||||
Segment | 2017 | 2016 | 2015 | ||||||||||
VTTI B.V. | Global Marine Terminals | $ | 22,910 | $ | — | $ | — | ||||||
West Shore Pipe Line Company | Domestic Pipelines & Terminals | 9,451 | 7,647 | 7,070 | |||||||||
Muskegon Pipeline LLC | Domestic Pipelines & Terminals | 1,778 | 2,002 | (2,876 | ) | ||||||||
Transport4, LLC | Domestic Pipelines & Terminals | 850 | 765 | 606 | |||||||||
South Portland Terminal LLC | Domestic Pipelines & Terminals | 1,016 | 1,122 | 1,581 | |||||||||
Total earnings from equity investments | $ | 36,005 | $ | 11,536 | $ | 6,381 | |||||||
88
Summarized combined financial information for our equity method investments is as follows for the periods indicated (amounts represent 100% of investee financial information in thousands):
December 31, | |||||||
2017 | 2016 | ||||||
BALANCE SHEET DATA: | |||||||
Current assets | $ | 288,085 | $ | 39,214 | |||
Noncurrent assets | 2,600,231 | 134,937 | |||||
Total assets | $ | 2,888,316 | $ | 174,151 | |||
Current liabilities | $ | 151,850 | $ | 15,790 | |||
Other liabilities | 1,246,406 | 44,224 | |||||
Combined equity | 1,490,060 | 114,137 | |||||
Total liabilities and combined equity | $ | 2,888,316 | $ | 174,151 | |||
Year Ended December 31, | |||||||||||
2017 | 2016 | 2015 | |||||||||
INCOME STATEMENT DATA: | |||||||||||
Revenue | $ | 553,396 | $ | 87,434 | $ | 92,501 | |||||
Operating Income | 184,692 | 45,932 | 35,595 | ||||||||
Net income | 122,506 | 30,942 | 19,692 | ||||||||
Net income attributable to investee | $ | 99,130 | $ | 30,942 | $ | 19,692 | |||||
10. GOODWILL AND INTANGIBLE ASSETS
Goodwill
The changes in the carrying amount of goodwill by segment are as follows at the dates indicated (in thousands):
Domestic Pipelines & Terminals | Global Marine Terminals | Merchant Services | Total | ||||||||||||
January 1, 2016 | $ | 289,906 | $ | 704,343 | $ | 4,499 | $ | 998,748 | |||||||
Acquisition | 7,758 | — | — | 7,758 | |||||||||||
Purchase price adjustments | (1,961 | ) | — | — | (1,961 | ) | |||||||||
December 31, 2016 | 295,703 | 704,343 | 4,499 | 1,004,545 | |||||||||||
Acquisition | 2,768 | — | — | 2,768 | |||||||||||
December 31, 2017 | $ | 298,471 | $ | 704,343 | $ | 4,499 | $ | 1,007,313 | |||||||
For our annual goodwill impairment test as of October 31, 2017, we performed a qualitative assessment to determine whether the fair value of each of our reporting units was more likely than not less than the carrying value. Based on economic conditions and industry and market considerations, we determined that it is not more likely than not that the fair value of each reporting unit is lower than the carrying value; therefore, the quantitative impairment test was not performed. For our annual goodwill impairment test as of October 31, 2016, we performed quantitative assessments to determine the fair value of each of our reporting units. Based on such calculations, each reporting unit’s fair value was in excess of its carrying value. Therefore, we did not record any goodwill impairment for the years ended December 31, 2017 and 2016.
89
Intangible Assets
Intangible assets consist of the following at the dates indicated (in thousands):
December 31, | |||||||
2017 | 2016 | ||||||
Customer relationships | $ | 231,620 | $ | 231,620 | |||
Accumulated amortization | (96,147 | ) | (83,187 | ) | |||
Net carrying amount | 135,473 | 148,433 | |||||
Customer contracts | 383,466 | 384,666 | |||||
Accumulated amortization | (159,878 | ) | (109,796 | ) | |||
Net carrying amount | 223,588 | 274,870 | |||||
Total intangible assets, net | $ | 359,061 | $ | 423,303 | |||
For the years ended December 31, 2017, 2016 and 2015, amortization expense related to intangible assets was $66.4 million, $68.1 million and $62.6 million, respectively. Amortization expense related to intangible assets is expected to be $65.7 million for 2018, $64.9 million for 2019, $65.1 million for 2020, $52.0 million for 2021 and $24.5 million for 2022.
11. OTHER NON-CURRENT ASSETS
Other non-current assets consist of the following at the dates indicated (in thousands):
December 31, | |||||||
2017 | 2016 | ||||||
Debt issuance costs | $ | 3,022 | $ | 3,794 | |||
Insurance receivables related to environmental remediation reserves | 2,794 | 3,635 | |||||
BBH jetty insurance receivable | 7,372 | 6,827 | |||||
Derivative assets | — | 62,768 | |||||
Other | 38,295 | 24,488 | |||||
Total other non-current assets | $ | 51,483 | $ | 101,512 | |||
12. ACCRUED AND OTHER CURRENT LIABILITIES
Accrued and other current liabilities consist of the following at the dates indicated (in thousands):
December 31, | |||||||
2017 | 2016 | ||||||
Taxes - other than income | $ | 33,327 | $ | 34,052 | |||
Accrued employee benefit liabilities | 7,228 | 6,849 | |||||
Accrued environmental remediation liabilities | 9,242 | 8,410 | |||||
Interest payable | 57,164 | 59,508 | |||||
Unearned revenue | 34,734 | 32,183 | |||||
Employee compensation related accruals | 32,616 | 31,693 | |||||
Accrued capital expenditures | 48,690 | 45,664 | |||||
ARO | 1,255 | 2,543 | |||||
Other | 40,951 | 44,991 | |||||
Total accrued and other current liabilities | $ | 265,207 | $ | 265,893 | |||
90
13. LONG-TERM DEBT
Long-term debt consists of the following at the dates indicated (in thousands):
December 31, | |||||||
2017 | 2016 | ||||||
5.125% Notes due July 1, 2017 (1) | $ | — | $ | 125,000 | |||
6.050% Notes due January 15, 2018 (1) | 300,000 | 300,000 | |||||
2.650% Notes due November 15, 2018 (1) | 400,000 | 400,000 | |||||
5.500% Notes due August 15, 2019 (1) | 275,000 | 275,000 | |||||
4.875% Notes due February 1, 2021 (1) | 650,000 | 650,000 | |||||
4.150% Notes due July 1, 2023 (1) | 500,000 | 500,000 | |||||
4.350% Notes due October 15, 2024 (1) | 300,000 | 300,000 | |||||
3.950% Notes due December 1, 2026 (1) | 600,000 | 600,000 | |||||
4.125% Notes due December 1, 2027 (1) | 400,000 | — | |||||
6.750% Notes due August 15, 2033 (1) | 150,000 | 150,000 | |||||
5.850% Notes due November 15, 2043 (1) | 400,000 | 400,000 | |||||
5.600% Notes due October 15, 2044 (1) | 300,000 | 300,000 | |||||
Term Loan due September 30, 2019 | 250,000 | 250,000 | |||||
Credit Facility due September 30, 2021 | 418,904 | — | |||||
Unamortized discounts & debt issuance costs | (33,379 | ) | (32,305 | ) | |||
Total debt | 4,910,525 | 4,217,695 | |||||
Less: Current portion - line of credit (2) | (252,204 | ) | — | ||||
Total long-term debt | $ | 4,658,321 | $ | 4,217,695 | |||
____________________________
(1) | We make semi-annual interest payments on these notes based on the rates noted above with the principal balances outstanding to be paid on or before the due dates as shown above. |
(2) | A portion of the line of credit is classified as a current liability in our consolidated balance sheets as related funds are used to finance the Buckeye Merchant Service Companies’ current working capital needs. |
The following table presents the scheduled maturities of principal amounts of our debt obligations for the next five years and in total thereafter (in thousands):
Years Ending | |||
December 31, | |||
2018 | $ | 952,204 | |
2019 | 525,000 | ||
2020 | — | ||
2021 | 816,700 | ||
2022 | — | ||
Thereafter | 2,650,000 | ||
Total | $ | 4,943,904 | |
Credit Facility
In September 2016, Buckeye and BMSC exercised their remaining option with consenting lenders to extend $1.4 billion of our existing $1.5 billion revolving Credit Facility with SunTrust Bank by one year to September 30, 2021 (the “Initial Facility Extension”).
91
After the consummation of the Initial Facility Extension, approximately $90.0 million of our revolving Credit Facility retained a maturity date of September 30, 2020 (the “Unextended Tranche”). In November 2017, Buckeye and BMSC entered into an agreement with the lender holding the Unextended Tranche to extend the maturity date of such tranche to September 30, 2021 matching the Initial Facility Extension. As a result of such agreement, the full amount of our $1.5 billion revolving Credit Facility now has a maturity date of September 30, 2021.
Under the Credit Facility, interest accrues on advances at the London Interbank Offered Rate (“LIBOR”) rate or a base rate plus an applicable margin based on the election of the applicable borrower for each interest period. The issuing fees for all letters of credit are also based on an applicable margin. The applicable margin used in connection with interest rates and fees is based on the credit ratings assigned to our senior unsecured long-term debt securities. The applicable margin for LIBOR rate loans, swing line loans, and letter of credit fees ranges from 1.0% to 1.75% and the applicable margin for base rate loans ranges from 0% to 0.75%. Buckeye and BMSC will also pay a fee based on our credit ratings on the actual daily unused amount of the aggregate commitments.
At December 31, 2017, Buckeye and BMSC collectively had a $418.9 million outstanding balance under the Credit Facility. The weighted average interest rate for borrowings under the Credit Facility was 2.6% at December 31, 2017.
The Credit Facility includes covenants limiting, as of the last day of each fiscal quarter, the ratio of consolidated funded debt to consolidated EBITDA (“Funded Debt Ratio”), as defined in the Credit Facility, measured for the preceding twelve months, to not more than 5.0 to 1.0. This requirement is subject to a provision for increases to 5.5 to 1.0 in connection with certain future acquisitions. The Funded Debt Ratio is calculated by dividing consolidated debt by annualized EBITDA, which is defined in the Credit Facility as earnings before interest, taxes, depreciation, amortization, and certain other adjustments determined on a consolidated basis. At December 31, 2017, our Funded Debt Ratio was 4.34 to 1.00, and we were in compliance with the covenants under our Credit Facility.
At both December 31, 2017 and 2016, we had committed $2.4 million in support of letters of credit. The obligations for letters of credit are not reflected as debt on our consolidated balance sheets. At December 31, 2017, we had $1.1 billion of availability under our Credit Facility
Term Loan
In September 2016, we entered into our $250.0 million Term Loan (“Term Loan”) due September 30, 2019, with an option to extend the term with consenting lenders for up to two one-year periods. We used the proceeds from the Term Loan to reduce the indebtedness outstanding under our Credit Facility. Under the Term Loan, interest accrues at the LIBOR rate or a base rate plus an applicable margin based on the election of the borrower. The applicable margin used in connection with interest rates and fees is based on the credit ratings assigned to our senior unsecured long-term debt securities. The applicable margin for LIBOR rate loans ranges from 1.0% to 1.6% and the applicable margin for base rate loans ranges from 0% to 0.6%.
The Term Loan also has the same Funded Debt Ratio requirements and provisions as the Credit Facility, as described above. At December 31, 2017, we were in compliance with the covenants under the Term Loan.
Notes Offerings
In November 2016, we issued $600.0 million of senior unsecured 3.950% notes maturing on December 1, 2026 in an underwritten public offering at 99.644% of their principal amount. Total proceeds from this offering, after underwriting fees, expenses and debt issuance costs were $592.7 million. In January 2017, we used the net proceeds from this offering to fund a portion of the purchase price for the VTTI Acquisition (see Note 3).
In November 2017, we issued $400.0 million of senior unsecured 4.125% notes maturing December 1, 2027 in an underwritten public offering at 99.503% of their principal amount. Total proceeds from this offering, after underwriting fees, expenses, and debt issuance costs, were $394.4 million. We used the net proceeds from this offering to reduce the indebtedness outstanding under our Credit Facility, a portion of which was subsequently reborrowed in January 2018 in order to repay in full the $300.0 million of 6.050% notes due on January 15, 2018 and $9.1 million of related accrued interest.
92
In January 2018, we issued $400.0 million of junior subordinated notes (“Junior Notes”) maturing on January 22, 2078, which are redeemable at Buckeye’s option, in whole or in part, on or after January 22, 2023. The Junior Notes bear interest at a fixed rate of 6.375% per year up to, but not including, January 22, 2023. From January 22, 2023, the Junior Notes will bear interest at a floating rate based on the Three-Month LIBOR Rate plus 4.02%, reset quarterly. Total proceeds from this offering, after underwriting fees, expenses and debt issuance costs, were $394.9 million. We used the net proceeds from this offering for general partnership purposes and to reduce the indebtedness outstanding under our Credit Facility.
Extinguishment of Debt
In July 2017, we repaid in full the $125.0 million principal amount and $3.2 million of accrued interest outstanding under our 5.125% notes, using funds available under our $1.5 billion revolving Credit Facility.
In January 2018, we repaid in full the $300.0 million principal amount and $9.1 million of accrued interest outstanding under our 6.050% notes, using funds available under our $1.5 billion revolving Credit Facility.
14. OTHER NON-CURRENT LIABILITIES
Other non-current liabilities consist of the following at the dates indicated (in thousands):
December 31, | |||||||
2017 | 2016 | ||||||
Accrued employee benefit liabilities | $ | 31,969 | $ | 37,795 | |||
Accrued environmental remediation liabilities | 31,803 | 35,878 | |||||
Deferred consideration | 19,640 | 19,126 | |||||
ARO | 3,833 | 3,439 | |||||
Derivative liabilities | — | 4,214 | |||||
Other | 5,411 | 4,985 | |||||
Total other non-current liabilities | $ | 92,656 | $ | 105,437 | |||
15. ACCUMULATED OTHER COMPREHENSIVE INCOME (LOSS)
Accumulated other comprehensive income (loss) consists of the following at the dates indicated (in thousands):
December 31, | |||||||
2017 | 2016 | ||||||
Unrealized gains on derivative instruments | $ | 29,530 | $ | 60,281 | |||
Net loss on settlement of interest rate swaps, net of amortization | (47,924 | ) | (79,864 | ) | |||
Unrecognized loss on benefit plans | (2,617 | ) | (6,010 | ) | |||
Other comprehensive income from equity method investments | 49,642 | — | |||||
Total accumulated other comprehensive income (loss) | $ | 28,631 | $ | (25,593 | ) | ||
93
16. DERIVATIVE INSTRUMENTS AND HEDGING ACTIVITIES
We are exposed to financial market risks, including changes in interest rates and commodity prices, in the course of our normal business operations. We use derivative instruments to manage such risks.
Interest Rate Derivatives
From time to time, we utilize forward-starting interest rate swaps to hedge the variability of the forecasted interest payments on anticipated debt issuances that may result from changes in the benchmark interest rate until the expected debt is issued. When entering into interest rate swap transactions, we become exposed to both credit risk and market risk. We are subject to credit risk when the change in fair value of the swap instrument is positive and the counterparty may fail to perform under the terms of the contract. We are subject to market risk with respect to changes in the underlying benchmark interest rate that impacts the fair value of the swaps. We manage our credit risk by entering into swap transactions only with major financial institutions with investment-grade credit ratings. We manage our market risk by aligning the swap instrument with the existing underlying debt obligation or a specified expected debt issuance, generally associated with the maturity of an existing debt obligation. We designate the swap agreements as cash flow hedges at inception and expect the changes in values to be highly correlated with the changes in value of the underlying borrowings.
During 2016, we entered into seven forward-starting interest rate swaps with a total aggregate notional amount of $350.0 million, which we entered into in anticipation of the issuance of debt on or before January 15, 2018, and eleven forward-starting interest rate swaps with a total aggregate notional amount of $500.0 million, which we entered into in anticipation of the issuance of debt on or before November 15, 2018. In November 2017, we issued $400.0 of senior unsecured 4.125% fixed-rate notes (see Note 13 for further discussion) in contemplation of the repayment of the $300.0 million of 6.050% notes that were due on January 15, 2018. In connection with the issuance of these notes, we settled the related seven forward-starting interest rate swaps for $20.0 million in settlement proceeds. We expect to issue new fixed-rate debt on or before November 15, 2018 to repay the $400.0 million of 2.650% notes that are due on November 15, 2018, as well as to fund capital expenditures and other general partnership purposes, although no assurances can be given that the issuance of fixed-rate debt will be possible on acceptable terms.
During the year ended December 31, 2017, unrealized losses of $10.6 million were recorded in accumulated other comprehensive income (“AOCI”) to reflect the change in the fair values of the forward-starting interest rate swaps.
Commodity Derivatives
Our Merchant Services segment primarily uses exchange-traded refined petroleum product futures contracts to manage the risk of market price volatility on its refined petroleum product inventories and its physical derivative contracts, which we designated as fair value hedges, with changes in fair value of both the futures contracts and physical inventory reflected in earnings. Our Merchant Services segment also uses exchange-traded refined petroleum contracts to hedge expected future transactions related to certain gasoline inventory that we manage on behalf of a third party, which are designated as cash flow hedges, with the effective portion of the hedge reported in other comprehensive income (“OCI”) and reclassified into earnings when the expected future transaction affects earnings. Any gains or losses incurred on the derivative instruments that are not effective in offsetting changes in fair value or cash flows of the hedged item are recognized immediately in earnings.
Additionally, our Merchant Services segment enters into exchange-traded refined petroleum product futures contracts on behalf of our Domestic Pipelines & Terminals segment to manage the risk of market price volatility on the gasoline-to-butane pricing spreads associated with our butane blending activities managed by a third party. These futures contracts are not designated in a hedge relationship for accounting purposes. Physical forward contracts and futures contracts that have not been designated in a hedge relationship are marked-to-market through earnings.
94
The following table summarizes our commodity derivative instruments outstanding at December 31, 2017 (amounts in thousands of gallons):
Volume (1) | ||||||||
Derivative Purpose | Current | Long-Term | ||||||
Derivatives NOT designated as hedging instruments: | ||||||||
Physical fixed price derivative contracts | 8,678 | 246 | ||||||
Physical index derivative contracts | 60,298 | — | ||||||
Futures contracts for refined petroleum products | 1,241 | 630 | ||||||
Hedge Type | ||||||||
Derivatives designated as hedging instruments: | ||||||||
Cash flow hedge futures contracts | 5,334 | — | Cash Flow Hedge | |||||
Futures contracts for refined petroleum products | 120,792 | — | Fair Value Hedge | |||||
(1) | Volume represents absolute value of net notional volume position. All volumes represent net short positions. |
Our futures contracts designated as fair value hedges relate to our inventory portfolio and extend to the fourth quarter of 2018. Our futures contracts relate to forecasted purchases and sales of refined petroleum products and extend to the second quarter of 2019.
Effective January 2017, the Chicago Mercantile Exchange (“CME”) amended its rulebook, resulting in the characterization of variation margin transfers as settlement payments, as opposed to adjustments to collateral. These amendments impacted the accounting treatment of our exchange-traded derivatives contracts, primarily comprised of our futures contracts, for which the CME serves as the central clearing party, and exchange-settled derivatives traded on the over-the-counter (“OTC”) market. As a result, commencing with the first quarter of 2017, we began reducing the corresponding derivative asset and liability balances for our exchange-settled derivative contracts to reflect the settlement of those positions via the variation margin. The variation margin is now considered partial settlement of the derivative contract and will result in realized gains or losses which, prior to January 1, 2017, were classified as unrealized gains or losses on derivatives. In addition, we maintain an initial margin deposit with the broker in an amount sufficient to cover the fair value of our open futures positions. This margin deposit is considered collateral and is included within prepaid and other current assets in our consolidated balance sheets and is not offset against the fair values of our derivative instruments.
95
The following table sets forth the fair value of each classification of derivative instruments and the locations of the derivative instruments on our consolidated balance sheets at the dates indicated (in thousands):
December 31, 2017 | |||||||||||||||||||
Derivatives NOT Designated as Hedging Instruments | Derivatives Designated as Hedging Instruments | Derivative Carrying Value | Netting Balance Sheet Adjustment (1) | Total | |||||||||||||||
Physical fixed price derivative contracts | $ | 2,582 | $ | — | $ | 2,582 | $ | (63 | ) | $ | 2,519 | ||||||||
Physical index derivative contracts | 455 | — | 455 | (9 | ) | 446 | |||||||||||||
Interest rate derivatives | — | 31,994 | 31,994 | — | 31,994 | ||||||||||||||
Total current derivative assets | 3,037 | 31,994 | 35,031 | (72 | ) | 34,959 | |||||||||||||
Total non-current derivative assets | — | — | — | — | — | ||||||||||||||
Physical fixed price derivative contracts | (7,226 | ) | — | (7,226 | ) | 63 | (7,163 | ) | |||||||||||
Physical index derivative contracts | (18 | ) | — | (18 | ) | 9 | (9 | ) | |||||||||||
Total current derivative liabilities | (7,244 | ) | — | (7,244 | ) | 72 | (7,172 | ) | |||||||||||
Total non-current derivative liabilities | — | — | — | — | — | ||||||||||||||
Net derivative (liabilities) assets | $ | (4,207 | ) | $ | 31,994 | $ | 27,787 | $ | — | $ | 27,787 | ||||||||
____________________________
(1) | Amounts represent the netting of physical fixed and index contracts’ assets and liabilities when a legal right of offset exists. Futures contracts are subject to settlement through margin requirements and are additionally presented on a net basis. |
December 31, 2016 | |||||||||||||||||||
Derivatives NOT Designated as Hedging Instruments | Derivatives Designated as Hedging Instruments | Derivative Carrying Value | Netting Balance Sheet Adjustment (1) | Total | |||||||||||||||
Physical fixed price derivative contracts | $ | 1,499 | $ | — | $ | 1,499 | $ | (306 | ) | $ | 1,193 | ||||||||
Physical index derivative contracts | 334 | — | 334 | (1 | ) | 333 | |||||||||||||
Futures contracts for refined products | 51,431 | 21 | 51,452 | (51,452 | ) | — | |||||||||||||
Total current derivative assets | 53,264 | 21 | 53,285 | (51,759 | ) | 1,526 | |||||||||||||
Physical fixed price derivative contracts | 164 | — | 164 | (5 | ) | 159 | |||||||||||||
Futures contracts for refined products | 226 | — | 226 | (226 | ) | — | |||||||||||||
Interest rates derivatives | — | 62,609 | 62,609 | — | 62,609 | ||||||||||||||
Total non-current derivative assets | 390 | 62,609 | 62,999 | (231 | ) | 62,768 | |||||||||||||
Physical fixed price derivative contracts | (4,517 | ) | — | (4,517 | ) | 306 | (4,211 | ) | |||||||||||
Physical index derivative contracts | (1 | ) | — | (1 | ) | 1 | — | ||||||||||||
Futures contracts for refined products | (57,828 | ) | (15,685 | ) | (73,513 | ) | 51,452 | (22,061 | ) | ||||||||||
Total current derivative liabilities | (62,346 | ) | (15,685 | ) | (78,031 | ) | 51,759 | (26,272 | ) | ||||||||||
Physical fixed price derivative contracts | (61 | ) | — | (61 | ) | 5 | (56 | ) | |||||||||||
Futures contracts for refined products | (4,384 | ) | — | (4,384 | ) | 226 | (4,158 | ) | |||||||||||
Total non-current derivative liabilities | (4,445 | ) | — | (4,445 | ) | 231 | (4,214 | ) | |||||||||||
Net derivative (liabilities) assets | $ | (13,137 | ) | $ | 46,945 | $ | 33,808 | $ | — | $ | 33,808 | ||||||||
(1) | Amounts represent the netting of physical fixed and index contracts’ assets and liabilities when a legal right of offset exists. Futures contracts are subject to settlement through margin requirements and are additionally presented on a net basis. |
At December 31, 2017, open refined petroleum product derivative contracts (represented by the physical fixed-price contracts, physical index contracts, and futures contracts for refined products contracts noted above) varied in duration in the overall portfolio, but did not extend beyond June 2019. In addition, at December 31, 2017, we had refined petroleum product inventories that we intend to use to satisfy a portion of the physical derivative contracts.
96
The gains and (losses) on our derivative instruments recognized in income were as follows for the periods indicated (in thousands):
Year Ended December 31, | |||||||||
Location | 2017 | 2016 | |||||||
Derivatives NOT designated as hedging instruments: | |||||||||
Physical fixed price derivative contracts | Product sales | $ | (6,748 | ) | $ | (11,161 | ) | ||
Physical index derivative contracts | Product sales | 82 | 349 | ||||||
Physical fixed price derivative contracts | Cost of product sales | 3,937 | 8,790 | ||||||
Physical index derivative contracts | Cost of product sales | 1,147 | 308 | ||||||
Futures contracts for refined products | Cost of product sales | 13,710 | 4,463 | ||||||
Derivatives designated as fair value hedging instruments: | |||||||||
Futures contracts for refined products | Cost of product sales | $ | (22,362 | ) | $ | (55,693 | ) | ||
Physical inventory - hedged items | Cost of product sales | 32,016 | 77,555 | ||||||
Ineffectiveness excluding the time value component on fair value hedging instruments: | |||||||||
Fair value hedge ineffectiveness (excluding time value) | Cost of product sales | $ | (4,673 | ) | $ | (1,410 | ) | ||
Time value excluded from hedge assessment | Cost of product sales | 14,327 | 23,272 | ||||||
Net gain in income | $ | 9,654 | $ | 21,862 | |||||
The change in value recognized in OCI and the losses reclassified from AOCI to income attributable to our derivative instruments designated as cash flow hedges were as follows for the periods indicated (in thousands):
Gain (Loss) Recognized in OCI on Derivatives for the Year Ended December 31, | |||||||
2017 | 2016 | ||||||
Derivatives designated as cash flow hedging instruments: | |||||||
Interest rate contracts | $ | (10,597 | ) | $ | 62,609 | ||
Commodity derivatives | (136 | ) | (2,328 | ) | |||
Total | $ | (10,733 | ) | $ | 60,281 | ||
Gain (Loss) Reclassified From AOCI to Income (Effective Portion) for the Year Ended December 31, | |||||||||
Location | 2017 | 2016 | |||||||
Derivatives designated as cash flow hedging instruments: | |||||||||
Interest rate contracts | Interest and debt expense | $ | (11,922 | ) | $ | (12,150 | ) | ||
Commodity derivatives | Product sales | — | 1,266 | ||||||
Total | $ | (11,922 | ) | $ | (10,884 | ) | |||
Over the next twelve months, we expect to reclassify $8.3 million of net losses attributable to interest rate derivatives from AOCI to earnings as an increase to interest and debt expense. These net losses consist of $11.2 million of amortization of hedge losses on settled forward-starting interest rate swaps, partially offset by $2.9 million of amortization of hedge gains on settled forward-starting interest rate swaps settled in November 2017 and forecasted hedge gains on forward-starting interest rate swaps that we expect to settle in late 2018. Additionally, the unrealized gains and losses for refined petroleum products designated as cash flow hedges at December 31, 2017, of $0.1 million, are estimated to be realized and reclassified from AOCI to product sales during over the next twelve months. The ineffective portion of the change in fair value of cash flow hedges was not material for the years ended December 31, 2017 and 2016.
97
17. FAIR VALUE MEASUREMENTS
We categorize our financial assets and liabilities using the three-tier hierarchy as follows:
Recurring
The following table sets forth financial assets and liabilities, measured at fair value on a recurring basis, as of the measurement dates indicated, and the basis for that measurement, by level within the fair value hierarchy (in thousands):
December 31, 2017 | December 31, 2016 | ||||||||||||||
Level 1 | Level 2 | Level 1 | Level 2 | ||||||||||||
Financial assets: | |||||||||||||||
Physical fixed price derivative contracts | $ | — | $ | 2,582 | $ | — | $ | 1,352 | |||||||
Physical index derivative contracts | — | 455 | — | 333 | |||||||||||
Interest rate derivatives | — | 31,994 | — | 62,609 | |||||||||||
Financial liabilities: | |||||||||||||||
Physical fixed price derivative contracts | — | (7,226 | ) | — | (4,267 | ) | |||||||||
Physical index derivative contracts | — | (18 | ) | — | — | ||||||||||
Futures contracts for refined products | — | — | (26,219 | ) | — | ||||||||||
Fair value | $ | — | $ | 27,787 | $ | (26,219 | ) | $ | 60,027 | ||||||
The values of the Level 1 derivative assets and liabilities were based on quoted market prices obtained from the New York Mercantile Exchange. The values for exchange-settled commodity derivatives at December 31, 2017 are presented after the application of the CME rulebook amendment, which deems that these instruments are settled daily via variation margin payments. As a result of this rulebook amendment, CME-settled derivatives, primarily comprised of our futures contracts for refined petroleum products, are considered to have no fair value at the balance sheet date for financial reporting purposes; however, the derivatives remain outstanding and subject to future commodity price fluctuations until they are settled in accordance with their contractual terms.
The values of the Level 2 interest rate derivatives were determined using fair value estimates obtained from our counterparties, which are verified using other available market data, including cash flow models which incorporate market inputs including the implied forward LIBOR yield curve for the same period as the future interest rate swap settlements. Credit value adjustments (“CVAs”), which are used to reflect the potential nonperformance risk of our counterparties, are considered in the fair value assessment of interest rate derivatives. We determined that the impact of CVAs is not significant to the overall valuation of interest rate derivatives as of December 31, 2017 and 2016.
The values of the Level 2 commodity derivative contracts were calculated using market approaches based on observable market data inputs, including published commodity pricing data, which is verified against other available market data, and market interest rate and volatility data. Level 2 physical fixed price derivative assets are net of CVAs determined using an expected cash flow model, which incorporates assumptions about the credit risk of the derivative contracts based on the historical and expected payment history of each customer, the amount of product contracted for under the agreement and the customer’s historical and expected purchase performance under each contract. The Merchant Services segment determined CVAs are appropriate because few of the Merchant Services segment’s customers entering into these derivative contracts are large organizations with nationally recognized credit ratings. The CVAs were nominal as of December 31, 2017 and 2016. As of December 31, 2017 and 2016, the Merchant Services segment did not hold any net liability derivative position containing credit contingent features.
98
Financial instruments included in current assets and current liabilities are reported in the consolidated balance sheets at amounts which approximate fair value due to the relatively short period to maturity of these financial instruments. The fair values of our fixed-rate debt were estimated by observing market trading prices and by comparing the historical market prices of our publicly issued debt with the market prices of the publicly issued debt of other MLP’s with similar credit ratings and terms. The fair value of our variable-rate debt approximates the carrying amount since the associated interest rates are market-based. The carrying value and fair value of our debt, using Level 2 input values, were as follows at the dates indicated (in thousands):
December 31, 2017 | December 31, 2016 | ||||||||||||||
Carrying Amount | Fair Value | Carrying Amount | Fair Value | ||||||||||||
Fixed-rate debt | $ | 4,241,963 | $ | 4,384,336 | $ | 3,967,695 | $ | 4,083,488 | |||||||
Variable-rate debt | 668,562 | 668,904 | 250,000 | 250,000 | |||||||||||
Total debt | $ | 4,910,525 | $ | 5,053,240 | $ | 4,217,695 | $ | 4,333,488 | |||||||
In addition, our pension plan assets are measured at fair value on a recurring basis, based on Level 1 and Level 3 inputs. See Note 18 for additional information.
We recognize transfers between levels within the fair value hierarchy as of the beginning of the reporting period. We did not have any transfers between Level 1 and Level 2 during the years ended December 31, 2017 and 2016.
Non-Recurring
Certain nonfinancial assets and liabilities are measured at fair value on a nonrecurring basis and are subject to fair value adjustments in certain circumstances, such as when there is evidence of impairment. See Note 2 for further discussion of our fair value techniques. For the years ended December 31, 2017 and 2016, there were no significant fair value adjustments related to such assets or liabilities reflected in our consolidated financial statements.
18. PENSIONS AND OTHER POSTRETIREMENT BENEFITS
RIGP and Retiree Medical Plan
Services Company, which employs the majority of our workforce, sponsors a Retirement Income Guarantee Plan (“RIGP”), which is a defined benefit plan that generally guarantees employees hired before January 1, 1986 a retirement benefit based on years of service and the employee’s highest compensation for any consecutive 5-year period during the last 10 years of service or other compensation measures as defined under the respective plan provisions. The retirement benefit is subject to reduction at varying percentages for certain offsetting amounts, including benefits payable under a retirement and savings plan discussed further below. Services Company funds this benefit plan through contributions to pension trust assets, generally subject to minimum funding requirements as provided by applicable law.
Services Company also sponsors an unfunded post-retirement benefit plan (the “Retiree Medical Plan”), which provides health care and life insurance benefits to certain of its retirees. To be eligible for the health care benefits, an employee must have been hired prior to January 1, 1991 and meet certain age and service requirements. To be eligible for the life insurance benefits, an employee must have been hired prior to January 1, 2002 and meet certain service requirements.
99
The components of projected benefit obligations and plan assets, and the funded status of the RIGP and the Retiree Medical Plan (“the Plans”) were as follows for the periods indicated (in thousands):
RIGP | Retiree Medical Plan | ||||||||||||||
Year Ended December 31, | Year Ended December 31, | ||||||||||||||
2017 | 2016 | 2017 | 2016 | ||||||||||||
Change in benefit obligation: | |||||||||||||||
Benefit obligation at beginning of year | $ | 13,178 | $ | 17,405 | $ | 31,958 | $ | 33,730 | |||||||
Service cost | (58 | ) | (34 | ) | 287 | 323 | |||||||||
Interest cost | 333 | 421 | 1,209 | 1,309 | |||||||||||
Plan participants’ contributions | — | — | 481 | 474 | |||||||||||
Actuarial (gain) loss | (1,524 | ) | (555 | ) | 689 | 2,871 | |||||||||
Plan curtailment | — | (1,513 | ) | — | — | ||||||||||
Settlements | (1,900 | ) | (598 | ) | — | — | |||||||||
Benefit payments | (182 | ) | (1,948 | ) | (3,074 | ) | (6,749 | ) | |||||||
Substantive provision change | — | — | (2,187 | ) | — | ||||||||||
Benefit obligation at end of year | $ | 9,847 | $ | 13,178 | $ | 29,363 | $ | 31,958 | |||||||
Change in plan assets: | |||||||||||||||
Fair value of plan assets at beginning of year | $ | 4,524 | $ | 5,544 | $ | — | $ | — | |||||||
Actual return on plan assets | 452 | 256 | — | — | |||||||||||
Plan participants’ contributions | — | — | 481 | 474 | |||||||||||
Employer contributions | 1,590 | 1,270 | 2,593 | 6,275 | |||||||||||
Settlements | (1,900 | ) | (598 | ) | — | — | |||||||||
Benefit payments | (182 | ) | (1,948 | ) | (3,074 | ) | (6,749 | ) | |||||||
Fair value of plan assets at end of year | $ | 4,484 | $ | 4,524 | $ | — | $ | — | |||||||
Funded status at end of year | $ | (5,363 | ) | $ | (8,654 | ) | $ | (29,363 | ) | $ | (31,958 | ) | |||
The change in benefit obligation for the Retiree Medical Plan reflects a substantive provision change whereby plan participants are expected to share in a higher portion of future increases in health care costs.
Amounts recognized in our consolidated balance sheets for the Plans consist of the following at the dates indicated below (in thousands):
RIGP | Retiree Medical Plan | ||||||||||||||
December 31, | December 31, | ||||||||||||||
2017 | 2016 | 2017 | 2016 | ||||||||||||
Liabilities: | |||||||||||||||
Accrued employee benefit liabilities - current | $ | — | $ | — | $ | (2,757 | ) | $ | (2,817 | ) | |||||
Accrued employee benefit liabilities - noncurrent | (5,363 | ) | (8,654 | ) | (26,606 | ) | (29,141 | ) | |||||||
Total | $ | (5,363 | ) | $ | (8,654 | ) | $ | (29,363 | ) | $ | (31,958 | ) | |||
AOCI: | |||||||||||||||
Prior service credit | $ | — | $ | — | $ | (2,187 | ) | $ | — | ||||||
Net actuarial loss | 722 | 2,616 | 4,082 | 3,394 | |||||||||||
Total | $ | 722 | $ | 2,616 | $ | 1,895 | $ | 3,394 | |||||||
100
Information regarding the accumulated benefit obligation in excess of plan assets for the RIGP is as follows at the dates indicated (in thousands):
RIGP | |||||||
December 31, | |||||||
2017 | 2016 | ||||||
Projected benefit obligation | $ | 9,847 | $ | 13,178 | |||
Accumulated benefit obligation (1) | 9,128 | 11,590 | |||||
Fair value of plan assets | 4,484 | 4,524 | |||||
(1) | The accumulated benefit obligation does not include an assumption for future compensation increases. |
The weighted average assumptions used in determining net periodic benefit cost for the Plans were as follows for the periods indicated:
RIGP | Retiree Medical Plan | ||||||||||||||||
Year Ended December 31, | Year Ended December 31, | ||||||||||||||||
2017 | 2016 | 2015 | 2017 | 2016 | 2015 | ||||||||||||
Discount rate | 3.2 | % | 3.0 | % | 3.3 | % | 4.0 | % | 4.1 | % | 3.9 | % | |||||
Expected return on plan assets | 5.8 | % | 5.8 | % | 5.8 | % | N/A | N/A | N/A | ||||||||
Rate of compensation increase | 3.0 | % | 3.0 | % | 3.0 | % | 3.0 | % | 3.0 | % | 3.0 | % | |||||
The assumptions used in determining benefit obligations for the Plans were as follows at the dates indicated:
RIGP | Retiree Medical Plan | ||||||||||
December 31, | December 31, | ||||||||||
2017 | 2016 | 2017 | 2016 | ||||||||
Discount rate | 3.3 | % | 3.3 | % | 3.6 | % | 4.0 | % | |||
Rate of compensation increase | 3.0 | % | 3.0 | % | 3.0 | % | 3.0 | % | |||
The discount rate reflects the rate at which benefits could be effectively settled on the measurement date. For the years ended December 31, 2017, 2016, and 2015, the discount rate was determined based on a projection of expected cash flows from the Plans using relevant economic benchmarks available as of each year end. The expected return on plan assets was determined based on projected long-term market returns for each asset class in which the Plans are invested, weighted by the target asset class allocations. The rate of compensation increase represents the long-term assumption for future increases to salaries.
The assumed annual rate of increase in the per capita cost of covered health care benefits as of December 31, 2017 in the Retiree Medical Plan was 7.0% for 2018, grading down to 4.5% in 2025, and thereafter. A hypothetical 1% movement in the assumed health care cost trend rates would not significantly affect our benefit cost or obligation.
101
The components of the net periodic benefit cost and other changes recognized in OCI for the Plans were as follows for the periods indicated (in thousands):
RIGP | Retiree Medical Plan | ||||||||||||||||||||||
Year Ended December 31, | Year Ended December 31, | ||||||||||||||||||||||
2017 | 2016 | 2015 | 2017 | 2016 | 2015 | ||||||||||||||||||
Components of net periodic benefit cost: | |||||||||||||||||||||||
Service cost | $ | (58 | ) | $ | (34 | ) | $ | 11 | $ | 287 | $ | 323 | $ | 365 | |||||||||
Interest cost | 333 | 421 | 551 | 1,209 | 1,309 | 1,334 | |||||||||||||||||
Expected return on plan assets | (251 | ) | (256 | ) | (334 | ) | — | — | — | ||||||||||||||
Actuarial loss due to settlements | 150 | 598 | 469 | — | — | — | |||||||||||||||||
Amortization of unrecognized loss | 19 | 522 | 842 | — | 766 | 199 | |||||||||||||||||
Net periodic benefit cost | $ | 193 | $ | 1,251 | $ | 1,539 | $ | 1,496 | $ | 2,398 | $ | 1,898 | |||||||||||
Other changes in plan assets and benefit obligations recognized in OCI: | |||||||||||||||||||||||
Prior service credit | $ | — | $ | — | $ | — | $ | (2,187 | ) | $ | — | — | |||||||||||
Net actuarial (gain) loss | (1,725 | ) | (2,068 | ) | 1,053 | 688 | 2,871 | (3,573 | ) | ||||||||||||||
Amortization of unrecognized loss | (19 | ) | (522 | ) | (842 | ) | — | (766 | ) | (199 | ) | ||||||||||||
Actuarial loss due to settlements | (150 | ) | (598 | ) | (469 | ) | — | — | — | ||||||||||||||
Total recognized in OCI | $ | (1,894 | ) | $ | (3,188 | ) | $ | (258 | ) | $ | (1,499 | ) | $ | 2,105 | $ | (3,772 | ) | ||||||
Total recognized in net period benefit cost and OCI | $ | (1,701 | ) | $ | (1,937 | ) | $ | 1,281 | $ | (3 | ) | $ | 4,503 | $ | (1,874 | ) | |||||||
Actuarial gains and losses are amortized over the average future service period of current plan participants expected to receive benefits. The corridor approach is used to determine when actuarial gains and losses are to be amortized and is equal to 10 percent of the greater of the projected benefit obligation or the fair value of plan assets. The amount of gain or loss in excess of the calculated corridor is subject to amortization. We expect that the following amounts, currently included in OCI, for the Plans will be recognized in our consolidated statement of operations during the year ending December 31, 2018 (in thousands):
RIGP | Retiree Medical Plan | ||||||
Amortization of unrecognized loss | $ | — | $ | 236 | |||
Prior service credit | — | (461 | ) | ||||
We estimate the following benefit payments, which reflect expected future service, as appropriate, will be paid for the Plans in the years indicated below as such (in thousands):
RIGP | Retiree Medical Plan | ||||||
2018 | $ | 3,094 | $ | 2,807 | |||
2019 | 1,140 | 2,707 | |||||
2020 | 927 | 2,592 | |||||
2021 | 991 | 2,464 | |||||
2022 | 765 | 2,408 | |||||
Thereafter | 2,218 | 9,295 | |||||
102
We expect to contribute $3.3 million to our benefit plans in 2018. Funding requirements for subsequent years are uncertain and will depend on whether there are any changes in the actuarial assumptions used to calculate plan funding levels, the actual return on plan assets and any legislative or regulatory changes affecting plan funding requirements. For tax planning, financial planning, cash flow management or cost reduction purposes, we may increase, accelerate, decrease or delay contributions to the plan to the extent permitted by law.
We do not fund the Retiree Medical Plan and, accordingly, no assets are invested in the plan. A summary of investments in the RIGP are as follows at the dates indicated (in thousands):
December 31, 2017 | December 31, 2016 | ||||||||||||||
Level 1 | Level 3 | Level 1 | Level 3 | ||||||||||||
Mutual fund - fixed-income securities | $ | 2,454 | $ | — | $ | 2,305 | $ | — | |||||||
Mutual fund - money market | 222 | — | 212 | — | |||||||||||
Coal lease | — | 1,808 | — | 2,007 | |||||||||||
Fair value of plan assets | $ | 2,676 | $ | 1,808 | $ | 2,517 | $ | 2,007 | |||||||
The values of the Level 1 mutual funds were based on quoted market prices in active markets for identical assets. The mutual fund — fixed-income securities generally seeks long-term growth of capital and income and invests in a portfolio consisting primarily of fixed-income securities.
The values of the Level 3 coal lease were determined using an expected present value of future cash flows valuation model. This investment relates to a 20.8% interest in a coal lease, which derives value from specified minimum royalty payments received from CONSOL Energy Inc. related to coal reserves mined from two Pennsylvania mines owned by the lessor. The coal lease extends through 2023.
The following table summarizes the activity in our Level 3 pension assets for the periods indicated (in thousands):
Year Ended December 31, | |||||||
2017 | 2016 | ||||||
Beginning balance, January 1 | $ | 2,007 | $ | 2,320 | |||
Royalty payments received | 380 | 369 | |||||
Unrealized loss | (199 | ) | (313 | ) | |||
Transfers out of Level 3 | (380 | ) | (369 | ) | |||
Ending balance, December 31 | $ | 1,808 | $ | 2,007 | |||
The RIGP investment policy does not target specific asset classes, but seeks to balance the preservation and growth of capital in the plan’s mutual funds with the income derived with proceeds from the coal lease. While no significant changes in the asset class allocation of the plan are expected during the upcoming year, Services Company may make changes at any time.
Retirement and Savings Plans
Services Company also sponsors the Retirement and Savings Plan (“RASP”) through which it provides retirement benefits for substantially all of its regular full-time employees located in the continental United States, except those covered by certain labor contracts. The RASP consists of two components. Under the first component, Services Company contributes 5% of each eligible employee’s covered salary to an employee’s separate account maintained in the RASP. Under the second component, Services Company makes a matching contribution into the employee’s separate account for 100% of an employee’s contribution to the RASP up to 5% (or 6% if an employee has over 20 years of service) of an employee’s eligible covered salary. Total costs of providing these benefits through the RASP were $17.6 million, $16.4 million and $15.2 million during the years ended December 31, 2017, 2016 and 2015, respectively.
103
Services Company also participates in a multi-employer retirement income plan and a multi-employer postretirement benefit plan, both of which provide retirement and health care and life insurance benefits to employees covered by certain labor contracts. We do not administer these plans and contribute to them in accordance with the provisions of negotiated labor contracts. The costs of providing these benefits, in aggregate, were $1.4 million for all years ended December 31, 2017, 2016 and 2015, respectively.
Additionally, certain of our wholly owned subsidiaries provide a savings and retirement plan to employees. The costs of providing these benefits were $2.1 million for year ended December 31, 2017 and $1.4 million for the years ended December 31, 2016 and 2015.
Employee Stock Ownership Plan
Services Company provides the ESOP to the majority of its employees hired before September 16, 2004. Employees hired by Services Company after September 15, 2004 and certain employees covered by a union multi-employer pension plan do not participate in the ESOP. The ESOP owns all of the outstanding common stock of Services Company. Buckeye, as primary beneficiary, consolidates Services Company.
The ESOP was frozen with respect to benefits effective March 27, 2011 (the “Freeze Date”). No Services Company contributions (other than dividend equivalent payments) have been made on behalf of current participants in the Plan after the Freeze Date. Even though contributions under the ESOP are no longer being made, each eligible participant’s ESOP account continues to be credited with its share of any stock dividends or other stock distributions associated with Services Company stock.
Individual employees were allocated shares based upon the ratio of their eligible compensation to total eligible compensation. Eligible compensation generally included base salary, overtime payments and certain bonuses. All Services Company stock has been released to ESOP participants. Total ESOP related costs charged to earnings were nominal for each of the years ended December 31, 2017, 2016, and 2015.
19. UNIT-BASED COMPENSATION PLANS
We award unit-based compensation to employees and directors primarily under the LTIP, which was approved by the Partnership’s unitholders in June 2013 and subsequently amended and restated in June 2017. The LTIP replaced the 2009 Long-Term Incentive Plan (the “2009 Plan”), which was merged with and into the LTIP, and no further grants have since been made under the 2009 Plan. We formerly awarded options to acquire LP Units to employees pursuant to the Buckeye Partners, L.P. Unit Option and Distribution Equivalent Plan (the “Option Plan”).
We recognized compensation expense related to the LTIP, which includes awards under the LTIP, and the Option Plan of $30.6 million, $33.5 million and $29.3 million for the years ended December 31, 2017, 2016 and 2015, respectively.
LTIP
The LTIP, which is overseen by the Compensation Committee of the Board of Directors of Buckeye GP (the “Compensation Committee”), provides for the grant of phantom units, performance units and in certain cases, distribution equivalent rights (“DERs”), which provide the participant a right to receive payments based on distributions we make on our LP Units. Phantom units are notional LP Units whose vesting is subject to service-based restrictions or other conditions established by the Compensation Committee in its discretion. Phantom units entitle a participant to receive an LP Unit without payment of an exercise price upon vesting. Performance units are notional LP Units whose vesting is subject to the attainment of one or more performance goals, and which also entitle a participant to receive LP Units without payment of an exercise price upon vesting. DERs are rights to receive a cash payment per phantom unit or performance unit, as applicable, equal to the per unit cash distribution we pay on our LP Units. If awards are forfeited, terminated or otherwise not paid in full, the LP Units underlying such awards will again be available for purposes of the LTIP, subject to certain limitations. Persons eligible to receive grants under the LTIP are (i) officers and employees of Buckeye GP and any of our affiliates who provide services to us and (ii) independent members of the Board of Directors of Buckeye GP. Phantom units or performance units may be granted to participants at any time as determined by the Compensation Committee.
A total of 2,672,370 LP Units were available for issuance under the LTIP as of December 31, 2017.
104
Deferral Plan under the LTIP
On December 13, 2016, the Compensation Committee approved the terms of the amended and restated Buckeye Partners, L.P. Unit Deferral and Incentive Plan (“Deferral Plan”). The Compensation Committee is expressly authorized to adopt the Deferral Plan under the terms of the LTIP, which grants the Compensation Committee the authority to establish a program pursuant to which our phantom units may be awarded in lieu of cash compensation at the election of the employee. At December 31, 2017, 2016 and 2015, eligible employees were allowed to defer up to 50% of their 2017, 2016 and 2015 compensation awards under our Annual Incentive Compensation Plan or other discretionary bonus program in exchange for grants of phantom units equal in value to the amount of their cash award deferral (each such unit, a “Deferral Unit”). Participants also receive one matching phantom unit for each Deferral Unit. Deferral Units and their matching phantom units vest on December 15 of the second year after the year in which such units are granted. During 2017 and 2016, 145,138 and 139,526 phantom units were granted under this plan, respectively. These grants are included as granted in the LTIP activity table below.
Awards under the LTIP
During the year ended December 31, 2017, the Compensation Committee granted 316,800 phantom units to employees (including the 145,138 phantom units granted pursuant to the Deferral Plan discussed above), 18,000 phantom units to independent directors of Buckeye GP and 212,372 performance units to employees. The vesting criteria for the performance units are the attainment of certain performance goals during the third year of a three-year period and remaining employed by us throughout such three-year period.
Phantom unit grantees will be paid quarterly distributions on DERs associated with phantom units over their respective vesting periods of one to three years in the same amounts per phantom unit as distributions paid on our LP Units over those same periods. The phantom unit DERs distributions were $4.1 million and $3.6 million for the years ended December 31, 2017 and 2016, respectively. Distributions may be paid on performance units at the end of the three-year vesting period. In such case, DERs will be paid on the number of LP Units for which the performance units will be settled. Quarterly distributions related to DERs associated with phantom and performance units are recorded as a reduction of our Limited Partners’ Capital on our consolidated balance sheets.
105
The following table sets forth the LTIP activity for the periods indicated (in thousands, except per unit amounts):
Number of LP Units | Weighted Average Grant Date Fair Value per LP Unit (1) | |||||
Unvested at January 1, 2016 | 1,011 | $ | 68.20 | |||
Granted (2) | 637 | 53.47 | ||||
Vested | (333 | ) | 58.89 | |||
Forfeited | (19 | ) | 60.76 | |||
Unvested at December 31, 2016 | 1,296 | $ | 63.54 | |||
Granted (2) | 547 | 69.91 | ||||
Performance adjustment (3) | 32 | 71.50 | ||||
Vested | (386 | ) | 70.98 | |||
Forfeited | (39 | ) | 64.26 | |||
Unvested at December 31, 2017 | 1,450 | $ | 64.04 | |||
(1) | Determined by dividing the aggregate grant date fair value of awards by the number of awards issued. The weighted-average grant date fair value per LP Unit for forfeited and vested awards is determined before an allowance for forfeitures. |
(2) | Includes both phantom and performance awards. Performance awards are granted at a target amount but, depending on our performance during the vesting period with respect to certain pre-established goals, the number of LP Units issued upon vesting of such performance awards can be greater or less than the target amount. |
(3) | Represents the LP Units issued in excess of target amounts for performance awards that vested during the year ended December 31, 2017 as a result of our above target performance with respect to applicable performance goals. |
At December 31, 2017, we expect to recognize $32.5 million of compensation expense related to the unvested LTIP over a weighted average remaining period of 1.7 years.
Unit Option and Distribution Equivalent Plan
We also sponsor the Option Plan pursuant to which we historically granted options to employees to purchase LP Units at the market price of our LP Units on the date of grant. Generally, the options vest three years from the date of grant and expire ten years from the date of grant. As unit options are exercised, we issue new LP Units to the holder. We have not historically repurchased, and do not expect to repurchase in 2018, any of our LP Units. Following the adoption of the 2009 Plan, effective March 20, 2009, we ceased making additional grants under the Option Plan.
106
The following is a summary of the changes in the options outstanding (all of which are vested) under the Option Plan for the periods indicated (in thousands, except per unit amounts):
Number of LP Units | Weighted- Average Strike Price ($/LP Unit) | Weighted- Average Remaining Contractual Term (in years) | Aggregate Intrinsic Value (1) | |||||||||
Outstanding at January 1, 2016 | 17 | $ | 48.71 | 0.9 | $ | 300 | ||||||
Exercised | (6 | ) | 47.17 | |||||||||
Forfeited, cancelled or expired | (1 | ) | $ | 44.73 | ||||||||
Outstanding at December 31, 2016 | 10 | $ | 50.36 | 0.1 | $ | 151 | ||||||
Exercised | (10 | ) | 50.36 | |||||||||
Forfeited, cancelled or expired | — | — | ||||||||||
Outstanding at December 31, 2017 | — | $ | — | 0 | $ | — | ||||||
Exercisable at December 31, 2017 | — | $ | — | 0 | $ | — | ||||||
(1) | Aggregate intrinsic value reflects fully vested LP Unit options at the date indicated. Intrinsic value is determined by calculating the difference between our closing LP Unit price on the last trading day of the period and the exercise price, multiplied by the number of exercisable, in-the-money options. |
The total intrinsic value of options exercised during the years ended December 31, 2017, 2016 and 2015 was $0.2 million, $0.1 million and $0.1 million, respectively. At December 31, 2017 and 2016, there was no unrecognized compensation cost related to unvested options, as all options were vested as of November 24, 2011. The fair value of options vested was zero for each of the years ended December 31, 2017, 2016 and 2015, respectively.
20. RELATED PARTY TRANSACTIONS
We are managed by Buckeye GP, our general partner. Services Company is considered a related party with respect to us. Services Company employees provide services to the majority of our operating subsidiaries. Pursuant to a services agreement entered into in December 2004, our operating subsidiaries reimburse Services Company for the costs of the services provided by Services Company. As Services Company is consolidated, these amounts eliminate in consolidation. Services Company, which is beneficially owned by the ESOP, owned 0.6 million of our LP Units (0.4% of our LP Units outstanding) as of December 31, 2017. Distributions received by Services Company from us on such LP Units are distributed to ESOP participants for investment pursuant to the terms of the ESOP. Distributions paid to Services Company totaled $2.9 million, $3.0 million and $3.2 million for the years ended December 31, 2017, 2016 and 2015, respectively. Total distributions paid to Services Company decrease over time as Services Company sells LP Units to fund benefits payable to ESOP participants who exit the ESOP or otherwise choose to diversify their holdings.
107
21. PARTNERS’ CAPITAL AND DISTRIBUTIONS
Our LP Units represent limited partner interests, which give the holders thereof the right to participate in distributions and to exercise the other rights and privileges available to them under our partnership agreement. The partnership agreement provides that, without prior approval of our limited partners holding an aggregate of at least two-thirds of the outstanding LP Units, we cannot issue any LP Units of a class or series having preferences or other special or senior rights over the LP Units.
At-the-Market Offering Program
In March 2016, we entered into an equity distribution agreement (the “Equity Distribution Agreement”) with J.P. Morgan Securities LLC, BB&T Capital Markets, a division of BB&T Securities, LLC, BNP Paribas Securities Corp., Deutsche Bank Securities Inc., Jefferies LLC, Morgan Stanley & Co. LLC, RBC Capital Markets, LLC, and SMBC Nikko Securities America, Inc. (collectively, the “ATM Underwriters”). Under the terms of the Equity Distribution Agreement, we could offer and sell up to $500.0 million in aggregate gross sales proceeds of LP Units from time to time through the ATM Underwriters, acting as agents of Buckeye or as principals, subject in each case to the terms and conditions set forth in the Equity Distribution Agreement. Sales of LP Units, if any, may be made by means of ordinary brokers’ transactions on the New York Stock Exchange or otherwise at market prices prevailing at the time of sale, at prices related to prevailing market prices or at negotiated prices or as otherwise agreed with any of such firms. During the years ended December 31, 2017, 2016 and 2015, we sold 6.2 million, 1.6 million and 2.2 million LP Units in aggregate under the active equity distribution agreements and received $345.8 million, $108.4 million and $161.5 million in net proceeds after deducting commissions and other related expenses, including $1.9 million, $1.1 million and $1.6 million of compensation paid in aggregate to the agents under their active equity distribution agreements, respectively. The 6.2 million LP Units sold under the Equity Distribution Agreement in 2017 included a block sale of approximately 3.8 million LP Units on September 21, 2017. The Equity Distribution Agreement expired on January 15, 2018. We intend to enter into a new equity distribution agreement in 2018.
Other Equity Offerings
In October 2016, we completed a public offering of 7.75 million LP Units pursuant to an effective shelf registration statement, which priced at $66.05 per unit. The underwriters also exercised an option to purchase 1.16 million additional LP Units, resulting in total gross proceeds of $588.7 million before deducting underwriting fees and other related expenses of $8.0 million. We used the net proceeds from this offering to initially reduce the indebtedness outstanding under our Credit Facility and for general partnership purposes, as well as to subsequently fund a portion of the purchase price for the VTTI Acquisition in January 2017.
108
Summary of Changes in Outstanding Units
The following is a summary of changes in Buckeye’s outstanding units for the periods indicated (in thousands):
Limited Partners | ||
Units outstanding at January 1, 2015 | 127,043 | |
LP Units issued pursuant to the Option Plan (1) | 5 | |
LP Units issued pursuant to the LTIP (1) | 229 | |
Issuance of units through equity distribution agreements | 2,247 | |
Units outstanding at December 31, 2015 | 129,524 | |
LP Units issued pursuant to the Option Plan (1) | 6 | |
LP Units issued pursuant to the LTIP (1) | 254 | |
Issuance of units to institutional investors | 8,913 | |
Issuance of units through equity distribution agreements | 1,567 | |
Units outstanding at December 31, 2016 | 140,264 | |
LP Units issued pursuant to the Option Plan (1) | 10 | |
LP Units issued pursuant to the LTIP (1) | 244 | |
Issuance of units through equity distribution agreements | 6,159 | |
Units outstanding at December 31, 2017 | 146,677 | |
(1) | The number of units issued represents issuance net of tax withholding. |
109
Cash Distributions
We generally make quarterly cash distributions to unitholders of substantially all of our available cash, generally defined in our partnership agreement as consolidated cash receipts less consolidated cash expenditures and such retentions for working capital, anticipated cash expenditures and contingencies as our general partner deems appropriate. Cash distributions are paid for LP Units and for DERs with respect to certain unit-based compensation awards outstanding as of each respective period. Cash distributions paid to unitholders of Buckeye for the periods indicated were as follows (in thousands, except per unit amounts):
Amount Per | Total Cash | |||||||||
Record Date | Payment Date | LP Unit | Distributions | |||||||
February 17, 2015 | February 24, 2015 | $ | 1.1375 | $ | 145,382 | |||||
May 11, 2015 | May 18, 2015 | 1.1500 | 147,085 | |||||||
August 10, 2015 | August 17, 2015 | 1.1625 | 149,490 | |||||||
November 9, 2015 | November 17, 2015 | 1.1750 | 152,175 | |||||||
Total | $ | 594,132 | ||||||||
February 23, 2016 | March 1, 2016 | $ | 1.1875 | $ | 154,928 | |||||
May 16, 2016 | May 23, 2016 | 1.2000 | 157,247 | |||||||
August 15, 2016 | August 22, 2016 | 1.2125 | 159,881 | |||||||
November 15, 2016 | November 22, 2016 | 1.2250 | 172,673 | |||||||
Total | $ | 644,729 | ||||||||
February 21, 2017 | February 28, 2017 | $ | 1.2375 | $ | 174,888 | |||||
May 15, 2017 | May 22, 2017 | 1.2500 | 176,832 | |||||||
August 14, 2017 | August 21, 2017 | 1.2625 | 179,631 | |||||||
November 13, 2017 | November 20, 2017 | 1.2625 | 186,042 | |||||||
Total | $ | 717,393 | ||||||||
On February 9, 2018, we announced a quarterly distribution of $1.2625 per LP Unit that will be paid on February 27, 2018, to unitholders of record on February 20, 2018. Based on the LP Units and distribution equivalent rights with respect to certain unit-based compensation awards outstanding as of December 31, 2017, cash expected to be distributed to LP unitholders on February 27, 2018 is estimated to be approximately $186.2 million.
22. INCOME TAXES
Our current and deferred income tax expense (benefit) was $0.3 million and $0.6 million, respectively, for the year ended December 31, 2017, $(0.2) million and $1.7 million, respectively, for the year ended December 31, 2016 and $1.6 million and ($0.7) million, respectively, for the year ended December 31, 2015. We have no unrecognized tax benefits related to uncertain tax positions. Deferred tax assets and liabilities as of December 31, 2017 and 2016 relate to BDL and Buckeye Caribbean. The Tax Act, which went into effect January 1, 2018, did not have a significant impact on the consolidated financial statements.
The net operating loss carryforwards, underlying related deferred tax assets, will expire between 2020 and 2022. Accordingly, a valuation allowance has been provided for deferred tax assets that are not more likely than not to be realized.
110
The tax effects of significant items comprising our net deferred tax assets and liabilities at December 31, 2017 and 2016 are as follows (in thousands):
December 31, | |||||||
2017 | 2016 | ||||||
Deferred tax asset: | |||||||
Net operating loss carryforward | $ | 19,234 | $ | 18,909 | |||
Capital loss carryforward | 11,453 | 22,333 | |||||
Other | 2,697 | 2,608 | |||||
Total deferred tax asset | $ | 33,384 | $ | 43,850 | |||
Deferred tax liability: | |||||||
Property, plant and equipment | $ | 1,536 | $ | 1,224 | |||
Other | 83 | 123 | |||||
Total deferred tax liability | 1,619 | 1,347 | |||||
Net deferred tax asset | 31,765 | 42,503 | |||||
Less: Valuation allowance | (29,451 | ) | (40,972 | ) | |||
Deferred taxes, net | $ | 2,314 | $ | 1,531 | |||
We are currently under an income tax audit for Buckeye Caribbean by the Puerto Rico Treasury Department for tax years from 2014 through 2016. As of December 31, 2017, BDL’s tax years from 2014 to 2017 and Buckeye Caribbean’s tax years from 2013 through 2017 were open to examination by the Internal Revenue Service and Puerto Rico Treasury Department, respectively.
23. EARNINGS PER UNIT
The following tables set forth the calculation of earnings per unit, attributable to Buckeye’s unit holders, taking into consideration net income allocable to participating securities, as well as the reconciliation of basic weighted average units outstanding to diluted weighted average units outstanding (in thousands, except per unit amounts):
Year Ended December 31, | |||||||||||
2017 | 2016 | 2015 | |||||||||
Net income attributable to unitholders | $ | 474,794 | $ | 535,608 | $ | 437,223 | |||||
Basic: | |||||||||||
Weighted average units outstanding - basic | 142,501 | 132,242 | 128,084 | ||||||||
Earnings per unit - basic | $ | 3.33 | $ | 4.05 | $ | 3.41 | |||||
Diluted: | |||||||||||
Weighted average units outstanding - basic | 142,501 | 132,242 | 128,084 | ||||||||
Effect of dilutive securities | 643 | 685 | 533 | ||||||||
Weighted average units outstanding - diluted | 143,144 | 132,927 | 128,617 | ||||||||
Earnings per unit - diluted | $ | 3.32 | $ | 4.03 | $ | 3.40 | |||||
111
24. BUSINESS SEGMENTS
We operate and report in three business segments: (i) Domestic Pipelines & Terminals; (ii) Global Marine Terminals; and (iii) Merchant Services. All inter-segment revenues, expenses, operating income and assets have been eliminated.
Domestic Pipelines & Terminals
The Domestic Pipelines & Terminals segment receives liquid petroleum products from refineries, connecting pipelines, vessels, trains, and bulk and marine terminals, transports those products to other locations for a fee, and provides bulk liquid storage and terminal throughput services. The segment also has butane blending capabilities and provides crude oil services, including train loading/unloading, storage and throughput. This segment owns and operates pipeline systems and liquid petroleum products terminals in the continental United States, including three terminals owned by the Merchant Services segment but operated by the Domestic Pipelines & Terminals segment, and two underground propane storage caverns. Additionally, this segment provides turn-key operations and maintenance of third-party pipelines and performs pipeline construction management services typically for cost plus a fixed or variable fee.
Global Marine Terminals
The Global Marine Terminals segment, including through its interest in VTTI, provides marine accessible bulk storage and blending services, rail and truck rack loading/unloading along with petroleum processing services in the New York Harbor on the East Coast and Corpus Christi, Texas in the Gulf Coast region of the United States, as well as The Bahamas, Puerto Rico and St. Lucia in the Caribbean, Northwest Europe, the Middle East and Southeast Asia. The segment owns and operates, or owns a significant interest in, 22 liquid petroleum product and crude oil terminals, located in these key domestic and international energy hubs, that enable us to facilitate global flows of crude and refined petroleum products, offer connectivity between supply areas and market centers, and provide premier storage, marine terminalling, blending, and processing services to a diverse customer base.
Merchant Services
The Merchant Services segment is a wholesale distributor of refined petroleum products in the United States and in the Caribbean. The segment’s products include gasoline, natural gas liquids, ethanol, biodiesel and petroleum distillates such as heating oil, diesel fuel, kerosene and fuel oil. The segment owns three terminals, which are operated by the Domestic Pipelines & Terminals segment. The segment’s customers consist principally of product wholesalers, as well as major commercial users of these refined petroleum products.
Financial Information by Segment
The following tables summarize our financial information by each segment for the periods indicated (in thousands):
Year Ended December 31, | |||||||||||
2017 | 2016 | 2015 | |||||||||
Revenue: | |||||||||||
Domestic Pipelines & Terminals | $ | 1,035,663 | $ | 1,011,696 | $ | 966,749 | |||||
Global Marine Terminals | 634,749 | 671,465 | 514,301 | ||||||||
Merchant Services | 2,038,221 | 1,621,915 | 2,037,664 | ||||||||
Intersegment | (60,488 | ) | (56,700 | ) | (65,280 | ) | |||||
Total revenue | $ | 3,648,145 | $ | 3,248,376 | $ | 3,453,434 | |||||
112
The following tables summarize our earnings from equity investments by each segment for the periods indicated (in thousands):
Year Ended December 31, | |||||||||||
2017 | 2016 | 2015 | |||||||||
Earnings from equity investments: | |||||||||||
Domestic Pipelines & Terminals | $ | 13,095 | $ | 11,536 | $ | 6,381 | |||||
Global Marine Terminals | 22,910 | — | — | ||||||||
Total earnings from equity investments | $ | 36,005 | $ | 11,536 | $ | 6,381 | |||||
For the years ended December 31, 2017, 2016 and 2015, no customer contributed 10% or more of consolidated revenue.
Year Ended December 31, | |||||||||||
2017 | 2016 | 2015 | |||||||||
Capital expenditures (1) | |||||||||||
Domestic Pipelines & Terminals | $ | 250,454 | $ | 294,849 | $ | 218,283 | |||||
Global Marine Terminals | 182,267 | 191,422 | 375,267 | ||||||||
Merchant Services | 614 | 45 | 970 | ||||||||
Total capital expenditures, net | $ | 433,335 | $ | 486,316 | $ | 594,520 | |||||
(1) | Amounts exclude the impact of accruals. See Note 25 for supplemental cash flow information. |
December 31, | |||||||
2017 | 2016 | ||||||
Total Assets: | |||||||
Domestic Pipelines & Terminals | $ | 3,936,058 | $ | 4,412,464 | |||
Global Marine Terminals | 5,924,731 | 4,494,995 | |||||
Merchant Services | 443,870 | 513,644 | |||||
Total assets | $ | 10,304,659 | $ | 9,421,103 | |||
The Global Marine Terminals segment’s long-lived assets consist of property, plant and equipment, goodwill, intangible assets and other non-current assets. Total long-lived assets located in our international locations were $2.1 billion for both years ended December 31, 2017 and 2016, located in the Caribbean.
The following tables summarize our revenues by major geographic area, for the periods indicated (in thousands):
Year Ended December 31, | |||||||||||
2017 | 2016 | 2015 | |||||||||
Revenue: | |||||||||||
United States | $ | 3,361,160 | $ | 2,915,619 | $ | 3,115,450 | |||||
International | 286,985 | 332,757 | 337,984 | ||||||||
Total revenue | $ | 3,648,145 | $ | 3,248,376 | $ | 3,453,434 | |||||
113
Adjusted EBITDA
Adjusted EBITDA is a measure not defined by GAAP. We define Adjusted EBITDA as earnings from continuing operations before interest expense, income taxes, depreciation and amortization, further adjusted to exclude certain non-cash items, such as non-cash compensation expense; transaction, transition, and integration costs associated with acquisitions; certain gains and losses on foreign currency transactions and foreign currency derivative financial instruments, as applicable; and certain other operating expense or income items, reflected in net income, that we do not believe are indicative of our core operating performance results and business outlook, such as hurricane-related costs, gains and losses on property damage recoveries, and gains and losses on asset sales. The definition of Adjusted EBITDA is also applied to our proportionate share in the Adjusted EBITDA of significant equity method investments, such as that in VTTI, and is not applied to our less significant equity method investments. The calculation of our proportionate share of the reconciling items used to derive Adjusted EBITDA is based upon our 50% equity interest in VTTI, prior to adjustments related to noncontrolling interests in several of its subsidiaries and partnerships, which are immaterial. Adjusted EBITDA is a non-GAAP financial measure that is used by our senior management, including our Chief Executive Officer, to assess the operating performance of our business and optimize resource allocation. We use Adjusted EBITDA as a primary measure to: (i) evaluate our consolidated operating performance and the operating performance of our business segments; (ii) allocate resources and capital to business segments; (iii) evaluate the viability of proposed projects; and (iv) determine overall rates of return on alternative investment opportunities.
We believe that investors benefit from having access to the same financial measures that we use and that these measures are useful to investors because they aid in comparing our operating performance with that of other companies with similar operations. The Adjusted EBITDA data presented by us may not be comparable to similarly titled measures at other companies because these items may be defined differently by other companies.
114
The following table presents income from continuing operations on a consolidated basis and a reconciliation of income from continuing operations, which is the most comparable financial measure under GAAP, to Adjusted EBITDA, as well as Adjusted EBITDA by segment for the periods indicated (in thousands):
December 31, | ||||||||||||
2017 | 2016 | 2015 | ||||||||||
Reconciliation of Income from continuing operations to Adjusted EBITDA: | ||||||||||||
Income from continuing operations | $ | 493,665 | $ | 548,675 | $ | 438,391 | ||||||
Less: | Net income attributable to noncontrolling interests | (14,863 | ) | (13,067 | ) | (311 | ) | |||||
Income from continuing operations attributable to Buckeye Partners, L.P. | 478,802 | 535,608 | 438,080 | |||||||||
Add: | Interest and debt expense | 225,583 | 194,922 | 171,330 | ||||||||
Income tax expense | 872 | 1,460 | 874 | |||||||||
Depreciation and amortization (1) | 269,243 | 254,659 | 221,278 | |||||||||
Non-cash unit-based compensation expense | 30,302 | 33,344 | 29,215 | |||||||||
Acquisition and transition expense (2) | 4,226 | 8,196 | 3,127 | |||||||||
Litigation contingency accrual (3) | — | — | 15,229 | |||||||||
Hurricane-related costs, net of recoveries (4) | 5,780 | 16,795 | — | |||||||||
Proportionate share of Adjusted EBITDA for equity method investment in VTTI (5) | 126,642 | — | — | |||||||||
Less: | Amortization of unfavorable storage contracts (6) | — | (5,979 | ) | (11,071 | ) | ||||||
Gains on property damage recoveries (7) | (4,621 | ) | (5,700 | ) | — | |||||||
Gain on sale of ammonia pipeline | — | (5,299 | ) | — | ||||||||
Earnings from equity method investment in VTTI (5) | (22,910 | ) | — | — | ||||||||
Adjusted EBITDA | $ | 1,113,919 | $ | 1,028,006 | $ | 868,062 | ||||||
Adjusted EBITDA | ||||||||||||
Domestic Pipelines & Terminals | $ | 573,021 | $ | 568,405 | $ | 522,196 | ||||||
Global Marine Terminals | 512,821 | 427,229 | 323,840 | |||||||||
Merchant Services | 28,077 | 32,372 | 22,026 | |||||||||
Adjusted EBITDA | $ | 1,113,919 | $ | 1,028,006 | $ | 868,062 | ||||||
____________________________
(1) | Includes 100% of the depreciation and amortization expense of $72.4 million, $71.7 million and $49.3 million for Buckeye Texas for the years ended December 31, 2017, 2016 and 2015, respectively. |
(2) | Represents transaction, internal and third-party costs related to asset acquisition and integration. |
(3) | Represents reductions in revenue related to settlement of a FERC proceeding. |
(4) | Represents costs incurred at our BBH facility in the Bahamas, Yabucoa Terminal in Puerto Rico, Corpus Christi facilities in Texas, and certain terminals in Florida, as a result of Hurricanes Harvey, Irma, and Maria, which occurred in August and September 2017, as well as Hurricane Matthew, which occurred in October 2016, consisting of operating expenses and write-offs of damaged long-lived assets, net of insurance recoveries. |
(5) | Due to the significance of our equity method investment in VTTI, effective January 1, 2017, we applied the definition of Adjusted EBITDA, covered in our description of Adjusted EBITDA, with respect to our proportionate share of VTTI’s Adjusted EBITDA. The calculation of our proportionate share of the reconciling items used to derive Adjusted EBITDA is based upon our 50% equity interest in VTTI, prior to adjustments related to noncontrolling interests in several of its subsidiaries and partnerships, which are immaterial. |
(6) | Represents fair value adjustment amortization related to certain storage contracts acquired in the BBH acquisition. These contracts were fully amortized by December 31, 2016. |
(7) | Represents gains on recoveries of property damages caused by third parties, primarily related to vessel allision with a dock at our terminal located in Pennsauken, New Jersey. |
115
25. SUPPLEMENTAL CASH FLOW INFORMATION
Supplemental cash flows and non-cash transactions were as follows for the periods indicated (in thousands):
Year Ended December 31, | |||||||||||
2017 | 2016 | 2015 | |||||||||
Cash paid for interest (net of capitalized interest) | $ | 210,723 | $ | 174,555 | $ | 156,654 | |||||
Cash paid for income taxes | 1,333 | 812 | 1,705 | ||||||||
Capitalized interest | 4,792 | 4,371 | 21,257 | ||||||||
Liabilities related to capital projects outstanding at December 31, 2017, 2016, and 2015 of $62.6 million, $59.1 million, and $87.9 million, respectively, are not included under “Capital expenditures” within the consolidated statement of cash flows.
26. QUARTERLY FINANCIAL DATA (UNAUDITED)
Summarized quarterly financial data for the periods indicated is set forth below (in thousands, except per unit amounts). Quarterly results were influenced by seasonal and other factors inherent in our business.
First Quarter | Second Quarter | Third Quarter | Fourth Quarter | Total | |||||||||||||||
2017 | |||||||||||||||||||
Revenue | $ | 969,273 | $ | 810,201 | $ | 922,619 | $ | 946,052 | $ | 3,648,145 | |||||||||
Operating income | 172,030 | 170,641 | 167,953 | 173,280 | 683,904 | ||||||||||||||
Net income | 126,309 | 116,379 | 120,224 | 130,753 | 493,665 | ||||||||||||||
Net income attributable to Buckeye Partners, L.P. | 123,576 | 112,722 | 116,187 | 126,317 | 478,802 | ||||||||||||||
Earnings per unit - basic | $ | 0.88 | $ | 0.80 | $ | 0.82 | $ | 0.85 | $ | 3.33 | |||||||||
Earnings per unit - diluted | $ | 0.88 | $ | 0.80 | $ | 0.81 | $ | 0.85 | $ | 3.32 | |||||||||
2016 | |||||||||||||||||||
Revenue | $ | 780,594 | $ | 777,122 | $ | 766,605 | $ | 924,055 | $ | 3,248,376 | |||||||||
Operating income | 180,207 | 189,944 | 206,227 | 156,964 | 733,342 | ||||||||||||||
Net income | 134,977 | 144,499 | 160,270 | 108,929 | 548,675 | ||||||||||||||
Net income attributable to Buckeye Partners, L.P. | 131,113 | 140,456 | 156,374 | 107,665 | 535,608 | ||||||||||||||
Earnings per unit - basic | $ | 1.01 | $ | 1.08 | $ | 1.19 | $ | 0.78 | $ | 4.05 | |||||||||
Earnings per unit - diluted | $ | 1.01 | $ | 1.07 | $ | 1.19 | $ | 0.78 | $ | 4.03 | |||||||||
116
Item 9. Changes in and Disagreements with Accountants on Accounting and Financial Disclosure
None.
Item 9A. Controls and Procedures
Evaluation of Disclosure Controls and Procedures
Our management, with the participation of our Chief Executive Officer (the “CEO”) and Chief Financial Officer (the “CFO”), evaluated the design and effectiveness of our disclosure controls and procedures as of the end of the period covered by this Report. Based on that evaluation, the CEO and CFO concluded that our disclosure controls and procedures as of the end of the period covered by this Report are designed and operating effectively to provide reasonable assurance that the information required to be disclosed by us in reports filed under the Securities Exchange Act of 1934, as amended, is: (i) recorded, processed, summarized and reported within the time periods specified in the SEC’s rules and forms and (ii) accumulated and communicated to management, including the CEO and CFO, as appropriate to allow timely decisions regarding disclosure. A controls system cannot provide absolute assurance, however, that the objectives of the controls system are met, and no evaluation of controls can provide absolute assurance that all control issues and instances of fraud, if any, within a company have been detected.
Management’s Report on Internal Control Over Financial Reporting
Management’s report on internal control over financial reporting is set forth in Item 8 of this Report and is incorporated by reference herein.
Attestation Report of the Registered Public Accounting Firm
The attestation report of our registered public accounting firm with respect to internal controls over financial reporting is set forth in Item 8 of this Report and is incorporated by reference herein.
Change in Internal Control Over Financial Reporting
There have been no changes in our internal controls over financial reporting (as defined in Rule 13a-15(f) under the Securities Exchange Act of 1934) or in other factors during the fourth quarter of 2017, that have materially affected, or are reasonably likely to materially affect, our internal controls over financial reporting.
Item 9B. Other Information
None.
117
PART III
Item 10. Directors, Executive Officers and Corporate Governance
The information required by this item will be included in our definitive Proxy Statement in connection with our 2018 Annual Meeting of unitholders (the “2018 Proxy Statement”), which will be filed with the SEC within 120 days after the end of the fiscal year ended December 31, 2017, under the headings “Proposal One: Election of Directors,” “Executive Officers” and “Section 16(a) Beneficial Ownership Reporting Compliance” and is incorporated herein by reference.
Item 11. Executive Compensation
The information required by this item will be set forth in our 2018 Proxy Statement, which will be filed with the SEC within 120 days after the end of the fiscal year ended December 31, 2017, under the headings “Compensation of Directors,” “Compensation Discussion and Analysis,” “Executive Compensation” and “Compensation Committee Interlocks and Insider Participation” and is incorporated herein by reference.
Item 12. Security Ownership of Certain Beneficial Owners and Management and Related Unitholder Matters
The information required by this item will be set forth in our 2018 Proxy Statement, which will be filed with the SEC within 120 days after the end of the fiscal year ended December 31, 2017, under the headings “Security Ownership of Management and Certain Beneficial Owners” and “Equity Compensation Plans” and is incorporated herein by reference.
Item 13. Certain Relationships and Related Transactions, and Director Independence
The information required by this item will be set forth in our 2018 Proxy Statement, which will be filed with the SEC within 120 days after the end of the fiscal year ended December 31, 2017, under the headings “Independence of Directors” and “Related Person Transactions and Procedures” and is incorporated herein by reference.
Item 14. Principal Accounting Fees and Services
The information required by this item will be included in our 2018 Proxy Statement, which will be filed with the SEC within 120 days after the end of the fiscal year ended December 31, 2017, under the heading “Fees Paid to Deloitte & Touche LLP” and is incorporated herein by reference.
PART IV
Item 15. Exhibits, Financial Statement Schedules
(a) | The following documents are filed as a part of this Report: |
(1) | Financial Statements — See Item 8 of this Report. |
(2) | Financial Statement Schedules — None. |
(3) | Exhibits — The following is a list of exhibits filed as part of this Report including those incorporated by reference. |
118
Exhibit Number | Description | |
Share Purchase Agreement, dated as of October 24, 2016, by and between VIP Terminals Finance B.V. and Buckeye Partners, L.P. (Incorporated by reference to Exhibit 2.1 of Buckeye Partners, L.P.’s Current Report on Form 8-K filed on October 24, 2016). | ||
Amended and Restated Certificate of Limited Partnership of Buckeye Partners, L.P., dated as of February 4, 1998 (Incorporated by reference to Exhibit 3.2 of Buckeye Partners, L.P.’s Annual Report on Form 10-K for the year ended December 31, 1997). | ||
Certificate of Amendment to Amended and Restated Certificate of Limited Partnership of Buckeye Partners, L.P., dated as of April 26, 2002 (Incorporated by reference to Exhibit 3.2 of Buckeye Partners, L.P.’s Quarterly Report on Form 10-Q for the quarterly period ended March 31, 2002). | ||
Certificate of Amendment to Amended and Restated Certificate of Limited Partnership of Buckeye Partners, L.P., dated as of June 1, 2004, effective as of June 3, 2004 (Incorporated by reference to Exhibit 3.3 of the Buckeye Partners, L.P.’s Registration Statement on Form S-3 filed June 16, 2004). | ||
Certificate of Amendment to Amended and Restated Certificate of Limited Partnership of Buckeye Partners, L.P., dated as of December 15, 2004 (Incorporated by reference to Exhibit 3.5 of Buckeye Partners, L.P.’s Annual Report on Form 10-K for the year ended December 31, 2004). | ||
Amended and Restated Agreement of Limited Partnership of Buckeye Partners, L.P., dated as of November 19, 2010 (Incorporated by reference to Exhibit 3.1 of Buckeye Partners, L.P.’s Current Report on Form 8-K filed November 22, 2010). | ||
Amendment No. 1 to Amended and Restated Agreement of Limited Partnership of Buckeye Partners, L.P., dated as of January 18, 2011 (Incorporated by reference to Exhibit 3.1 of Buckeye Partners, L.P.’s Current Report on Form 8-K filed on January 20, 2011). | ||
Amendment No. 2 to Amended and Restated Agreement of Limited Partnership of Buckeye Partners, L.P., dated as of February 21, 2013 (Incorporated by reference to Exhibit 3.1 of Buckeye Partners, L.P.’s Current Report on Form 8-K filed on February 25, 2013). | ||
Amendment No. 3 to Amended and Restated Agreement of Limited Partnership of Buckeye Partners, L.P., dated as of October 1, 2013, (Incorporated by reference to Exhibit 3.1 of Buckeye Partners, L.P.’s Current Report on Form 8-K filed on October 7, 2013). | ||
Amendment No. 4 to Amended and Restated Agreement of Limited Partnership of Buckeye Partners, L.P., dated as of September 29, 2014, (Incorporated by reference to Exhibit 3.1 of Buckeye Partners, L.P.’s Current Report on Form 8-K filed on September 29, 2014). | ||
Amendment No. 5 to Amended and Restated Agreement of Limited Partnership of Buckeye Partners, L.P., dated as of December 13, 2017, (Incorporated by reference to Exhibit 3.1 of Buckeye Partners, L.P.’s Current Report on Form 8-K filed on December 18, 2017). | ||
Indenture dated as of July 10, 2003, between Buckeye Partners, L.P. and SunTrust Bank, as Trustee (Incorporated by reference to Exhibit 4.1 of Buckeye Partners, L.P.’s Registration Statement on Form S-4 filed September 19, 2003). | ||
Second Supplemental Indenture dated as of August 19, 2003, between Buckeye Partners, L.P. and SunTrust Bank, as Trustee (Incorporated by reference to Exhibit 4.3 of Buckeye Partners, L.P.’s Registration Statement on Form S-4 filed September 19, 2003). | ||
119
Third Supplemental Indenture dated as of October 12, 2004, between Buckeye Partners, L.P. and SunTrust Bank, as Trustee (Incorporated by reference to Exhibit 4.1 of Buckeye Partners, L.P.’s Current Report on Form 8-K filed on October 14, 2004). | ||
Fourth Supplemental Indenture dated as of June 30, 2005, between Buckeye Partners, L.P. and SunTrust Bank, as Trustee (Incorporated by reference to Exhibit 4.1 of Buckeye Partners, L.P.’s Current Report on Form 8-K filed on June 30, 2005). | ||
Fifth Supplemental Indenture dated as of January 11, 2008, between Buckeye Partners, L.P. and U.S. Bank National Association (successor to SunTrust Bank), as Trustee (Incorporated by reference to Exhibit 4.1 of Buckeye Partners, L.P.’s Current Report on Form 8-K filed on January 11, 2008). | ||
Sixth Supplemental Indenture dated as of August 18, 2009, between Buckeye Partners, L.P. and U.S. Bank National Association (successor-in-interest to SunTrust Bank), as Trustee (Incorporated by reference to Exhibit 4.1 of Buckeye Partners, L.P.’s Current Report on Form 8-K filed on August 24, 2009). | ||
Seventh Supplemental Indenture dated as of January 13, 2011, between Buckeye Partners, L.P. and U.S. Bank National Association (successor-in-interest to SunTrust Bank), as Trustee (Incorporated by reference to Exhibit 4.1 of Buckeye Partners, L.P.’s Current Report on Form 8-K filed on January 20, 2011). | ||
Eighth Supplemental Indenture dated as of June 10, 2013, between Buckeye Partners, L.P. and U.S. Bank National Association (successor-in-interest to SunTrust Bank), as Trustee (Incorporated by reference to Exhibit 4.1 of Buckeye Partners, L.P.’s Current Report on Form 8-K filed on June 12, 2013). | ||
Ninth Supplemental Indenture dated as of November 14, 2013, between Buckeye Partners, L.P. and U.S. Bank National Association (successor-in-interest to SunTrust Bank), as Trustee (Incorporated by reference to Exhibit 4.1 of Buckeye Partners, L.P.’s Current Report on Form 8-K filed on November 19, 2013). | ||
Tenth Supplemental Indenture, dated September 12, 2014, between Buckeye Partners, L.P. and U.S. Bank National Association (successor-in-interest to SunTrust Bank), as trustee (Incorporated by reference to Exhibit 4.1 of Buckeye Partners, L.P.’s Current Report on Form 8-K filed on September 12, 2014). | ||
Eleventh Supplemental Indenture, dated November 7, 2016, between Buckeye Partners, L.P. and U.S. Bank National Association (successor-in-interest to SunTrust Bank), as trustee (Incorporated by reference to Exhibit 4.1 of Buckeye Partners, L.P.’s Current Report on Form 8-K filed on November 7, 2016). | ||
Twelfth Supplemental Indenture, dated November 20, 2017, between Buckeye Partners, L.P. and Branch Banking and Trust Company (successor-in-interest to U.S. Bank National Association), as trustee (Incorporated by reference to Exhibit 4.1 of Buckeye Partners, L.P.’s Current Report on Form 8-K filed on November 20, 2017). | ||
Buckeye Partners, L.P. Unit Deferral and Incentive Plan, as amended and restated effective January 1, 2017 (Incorporated by reference to Exhibit 10.1 of Buckeye Partners, L.P.’s Current Report on Form 8-K filed on December 19, 2016). | ||
Services Agreement dated as of February 21, 2013, among Buckeye Partners, L.P., certain operating subsidiaries of Buckeye Partners, L.P. and Services Company (Incorporated by reference to Exhibit 10.2 of Buckeye Partners, L.P.’s Annual Report on Form 10-K for the year ended December 31, 2012). | ||
*10.3 | Form of Severance Agreement for each Named Executive Officer (Incorporated by reference to Exhibit 10.1 of Buckeye Partners, L.P.’s Quarterly Report on Form 10-Q for the quarterly period ended September 30, 2015). | |
120
*10.4 | Amended and Restated Unit Option and Distribution Equivalent Plan of Buckeye Partners, L.P., dated as of April 1, 2005 (Incorporated by reference to Exhibit 10.1 of Buckeye Partners, L.P.’s Current Report on Form 8-K filed on April 4, 2005). | |
*10.5 | Buckeye Partners, L.P. 2013 Long-Term Incentive Plan (as amended and restated, effective June 6, 2017) (Incorporated by reference to Exhibit A of Buckeye Partners, L.P.’s Definitive Proxy Statement filed April 19, 2017). | |
* **10.6 | Buckeye Partners, L.P. Annual Incentive Compensation Plan (as amended and restated, effective January 1, 2018). | |
*10.7 | Buckeye Partners, L.P. Non-Employee Director Deferred Compensation Plan, effective as of January 1, 2013 (Incorporated by reference to Exhibit 10.8 of Buckeye Partners, L.P.’s Annual Report on Form 10-K for the year ended December 31, 2012). | |
*10.8 | Buckeye Pipe Line Company Benefit Equalization Plan, effective as of January 1, 2012 (Incorporated by reference to Exhibit 10.9 of Buckeye Partners, L.P.’s Annual Report on Form 10-K for the year ended December 31, 2012). | |
*10.9 | Revolving Credit Agreement, dated September 30, 2014, by and among Buckeye Partners, L.P., Buckeye Energy Services LLC, Buckeye Caribbean Terminals LLC, Buckeye West Indies Holdings LP, SunTrust Bank and other lenders party thereto (Incorporated by reference to Exhibit 10.1 to Buckeye Partners, L.P.’s Current Report on Form 8-K filed on October 6, 2014). | |
First Amendment to Revolving Credit Agreement dated as of December 16, 2015, by and among Buckeye Partners, L.P., Buckeye Energy Services LLC, Buckeye Caribbean Terminals LLC and Buckeye West Indies Holdings LP, as borrowers, the lenders party thereto and SunTrust Bank, as administrative agent (Incorporated by reference to Exhibit 10.1 to Buckeye Partners, L.P.’s Current Report on Form 8-K filed on December 18, 2015). | ||
Second Amendment to Revolving Credit Agreement dated as of September 30, 2016, by and among Buckeye Partners, L.P., Buckeye Energy Services LLC, Buckeye Caribbean Terminals LLC and Buckeye West Indies Holdings LP, as borrowers, the lenders party thereto and SunTrust Bank, as administrative agent (Incorporated by reference to Exhibit 10.1 of Buckeye Partners, L.P.’s Current Report on Form 8-K filed on October 3, 2016). | ||
Third Amendment to Revolving Credit Agreement dated as of June 6, 2017, by and among Buckeye Partners, L.P., Buckeye Energy Services LLC, Buckeye Caribbean Terminals LLC and Buckeye West Indies Holdings LP, as borrowers, the lenders party thereto and SunTrust Bank, as administrative agent (Incorporated by reference to Exhibit 10.1 of Buckeye Partners, L.P.’s Current Report on Form 8-K filed on June 9, 2017) | ||
Term Loan Agreement dated as of September 30, 2016, by and among Buckeye Partners, L.P., as borrower, the lenders party thereto and SunTrust Bank, as administrative agent (Incorporated by reference to Exhibit 10.2 of Buckeye Partners, L.P.’s Current Report on Form 8-K filed on October 3, 2016). | ||
First Amendment to Term Loan Agreement dated as of June 6, 2017, by and among Buckeye Partners, L.P., as borrower, the lenders party thereto and SunTrust Bank, as administrative agent (Incorporated by reference to Exhibit 10.2 of Buckeye Partners, L.P.’s Current Report on Form 8-K filed on June 9, 2017). | ||
121
Distribution Agreement, dated March 9, 2016, among Buckeye Partners, L.P., Buckeye GP LLC and J.P. Morgan Securities LLC, BB&T Capital Markets, a division of BB&T Securities, LLC, BNP Paribas Securities Corp., Deutsche Bank Securities Inc., Jefferies LLC, Morgan Stanley & Co. LLC, RBC Capital Markets, LLC, and SMBC Nikko Securities America, Inc. (Incorporated by reference to Exhibit 1.1 to Buckeye Partners, L.P.’s Current Report on Form 8-K filed on March 9, 2016). | ||
Shareholders’ Agreement, dated as of January 4, 2017, by and among VIP Terminals Finance B.V., Buckeye North Sea Coöperatief U.A. and VIP Terminals Holding B.V. (Incorporated by reference to Exhibit 10.1 of Buckeye Partners, L.P.’s Current Report on Form 8-K filed on January 4, 2017). | ||
Form of Phantom Unit Grant Agreement (Employee) (Incorporated by reference to Exhibit 10.14 of Buckeye Partners, L.P.’s Annual Report on Form 10-K for the year ended December 31, 2016). | ||
Form of Phantom Unit Grant Agreement (UDIP - Employee) (Incorporated by reference to Exhibit 10.15 of Buckeye Partners, L.P.’s Annual Report on Form 10-K for the year ended December 31, 2016). | ||
Form of Phantom Unit Grant Agreement (Director) (Incorporated by reference to Exhibit 10.16 of Buckeye Partners, L.P.’s Annual Report on Form 10-K for the year ended December 31, 2016). | ||
Form of Performance Unit Grant Agreement (Employee) (Incorporated by reference to Exhibit 10.17 of Buckeye Partners, L.P.’s Annual Report on Form 10-K for the year ended December 31, 2016). | ||
**12.1 | Computation of Ratio of Earnings to Fixed Charges. | |
**21.1 | List of Subsidiaries of Buckeye Partners, L.P. | |
**23.1 | Consent of Deloitte & Touche LLP. | |
**31.1 | Certification of Chief Executive Officer pursuant to Rule 13a-14 (a) under the Securities Exchange Act of 1934. | |
**31.2 | Certification of Chief Financial Officer pursuant to Rule 13a-14(a) under the Securities Exchange Act of 1934. | |
**32.1 | Certification by Chief Executive Officer pursuant to 18 U.S.C. Section 1350. | |
**32.2 | Certification by Chief Financial Officer pursuant to 18 U.S.C. Section 1350. | |
**101.INS | XBRL Instance Document. | |
**101.SCH | XBRL Taxonomy Extension Schema Document. | |
**101.CAL | XBRL Taxonomy Extension Calculation Linkbase Document. | |
**101.LAB | XBRL Taxonomy Extension Label Linkbase Document. | |
**101.PRE | XBRL Taxonomy Extension Presentation Linkbase Document. | |
**101.DEF | XBRL Taxonomy Extension Definition Linkbase Document. | |
122
_________________________
* Represents management contract or compensatory plan or arrangement.
** Filed herewith.
† Schedules have been omitted pursuant to Item 601(b)(2) of Regulation S-K. Buckeye agrees to furnish supplementally a copy of the omitted schedules to the SEC upon request.
(a) Exhibits — See Item 15(a)(3) above.
Item 16. Form 10-K Summary
None.
123
SIGNATURES
Pursuant to the requirements of Section 13 of 15(d) of the Securities Exchange Act of 1934, the registrant has duly caused this report to be signed on its behalf by the undersigned, thereunto duly authorized.
BUCKEYE PARTNERS, L.P. | |||
(Registrant) | |||
By: | Buckeye GP LLC, | ||
as General Partner | |||
Dated: February 22, 2018 | By: | /s/ | CLARK C. SMITH |
Clark C. Smith | |||
Chief Executive Officer, President and | |||
Chairman of the Board | |||
(Principal Executive Officer) | |||
Pursuant to the requirements of the Securities Exchange Act of 1934, this report has been signed below by the following persons on behalf of the registrant and in the capacities and on the dates indicated.
Dated: February 22, 2018 | By: | /s/ | CLARK C. SMITH |
Clark C. Smith | |||
Chairman of the Board, President and Chief Executive Officer | |||
(Principal Executive Officer) | |||
Dated: February 22, 2018 | By: | /s/ | KEITH E. ST.CLAIR |
Keith E. St.Clair | |||
Executive Vice President and Chief Financial Officer | |||
(Principal Financial Officer) | |||
Dated: February 22, 2018 | By: | /s/ | GARY L. BOHNSACK |
Gary L. Bohnsack | |||
Vice President, Controller and Chief Accounting Officer | |||
(Principal Accounting Officer) | |||
Dated: February 22, 2018 | By: | /s/ | PIETER BAKKER |
Pieter Bakker | |||
Director | |||
Dated: February 22, 2018 | By: | /s/ | BARBARA M. BAUMANN |
Barbara M. Baumann | |||
Director | |||
Dated: February 22, 2018 | By: | /s/ | BARBARA J. DUGANIER |
Barbara J. Duganier | |||
Director | |||
124
Dated: February 22, 2018 | By: | /s/ | JOSEPH A. LASALA, JR. |
Joseph A. LaSala, Jr. | |||
Director | |||
Dated: February 22, 2018 | By: | /s/ | MARK C. MCKINLEY |
Mark C. McKinley | |||
Director | |||
Dated: February 22, 2018 | By: | /s/ | LARRY C. PAYNE |
Larry C. Payne | |||
Director | |||
Dated: February 22, 2018 | By: | /s/ | OLIVER G. “RICK” RICHARD, III |
Oliver “Rick” G. Richard, III | |||
Director | |||
Dated: February 22, 2018 | By: | /s/ | FRANK S. SOWINSKI |
Frank S. Sowinski | |||
Lead Independent Director | |||
Dated: February 22, 2018 | By: | /s/ | MARTIN A. WHITE |
Martin A. White | |||
Director | |||
125
Exhibit 10.6
BUCKEYE PARTNERS, L.P.
ANNUAL INCENTIVE COMPENSATION PLAN
(As Amended and Restated, Effective As Of January 1, 2018)
ANNUAL INCENTIVE COMPENSATION PLAN
Buckeye Partners, L.P., a Delaware limited partnership, hereby establishes the Buckeye Partners, L.P. Annual Incentive Compensation Plan, as amended and restated, effective as of January 1, 2018. The Plan permits annual discretionary cash awards to Employees, based upon the level of the achievement of Performance Goals and Individual Performance. The Plan shall remain in effect until terminated as herein provided.
ARTICLE I PLAN PURPOSES
The purpose of the Plan is to provide discretionary annual incentive awards to Employees based upon the level of attainment of the Partnership’s Performance Goals and the Employee’s Individual Performance.
ARTICLE II DEFINITIONS
The terms defined in this Article II shall, for all purposes of this Plan, have the meanings herein specified, unless the context expressly, or by necessary implication, requires otherwise:
2.1 | “Actual Award” shall mean the actual dollar amount paid out of the Actual Award Pool to an Employee under the Plan. |
2.2 | “Actual Award Pool” shall mean the aggregate annual incentive pool available to the Administrator for making Actual Awards as determined pursuant to Section 6.1. |
2.3 | “Administrator” shall mean the Committee for the general administration of the Plan, including the establishment and determinations with respect to Performance Goals and all determinations regarding Actual Awards to Executive Officers. The Chief Executive Officer of the General Partner or his designee shall be the Administrator with respect to Actual Awards to non-Executive Officers. |
2.4 | “Affiliate” shall have the meaning ascribed to such term in Rule 12b-2 of the General Rules under the Securities Exchange Act of 1934, as amended. Any reference to an Affiliate in this Plan shall include an Affiliate of the Partnership or the General Partner, as applicable, including Buckeye Pipe Line Services Company. |
2.5 | “Board” shall mean the Board of Directors of the General Partner. |
2.6 | “Code” shall mean the Internal Revenue Code of 1986, as amended. Reference in the Plan to any section of the Code shall be deemed to include any amendment or successor provisions to such section and any regulations under such section. |
1
Exhibit 10.6
2.7 | “Committee” shall mean the Compensation Committee of the Board, or such other committee as determined by the Board. |
2.8 | “Employee” shall mean, unless otherwise determined by the Administrator, a regular full-time exempt or non-exempt employee of the Partnership, General Partner or Affiliate; provided, however, that an Employee shall not include any individual (a) whose terms of employment are governed by a collective bargaining agreement, or (b) characterized as a "leased employee" within the meaning of Code Section 414. Notwithstanding the foregoing, if an individual is engaged in a non-employee status (including, but not limited to, as an independent contractor, an individual being paid through an employee leasing company or other third party agency) and is subsequently reclassified by the Partnership, General Partner, Affiliate, the Internal Revenue Service, or a court as an employee for payroll purposes, such individual, for purposes of the Plan, shall be deemed an Employee from the actual (and not the effective) date of such reclassification, unless expressly provided otherwise by the Partnership, General Partner or Affiliate. |
2.9 | “Executive Officers” shall mean the executive officers of the Partnership, General Partner or Affiliate as defined in Rule 3b-7 of the Exchange Act and as determined by the Administrator in its sole discretion. |
2.10 | “Performance Goals” shall mean the goals established by the Administrator based on one or more financial criteria, including, but not limited to, the following: Adjusted EBITDA, EBITDA, unit price, earnings per unit, net earnings, operating earnings, total capital spending, maintenance capital spending, return on assets, total unit holder return, return on equity, growth in assets, cash flow, market share, distribution growth, distributable cash flow, distributable cash flow per unit, relative performance to a comparison group, or strategic business criteria, including, but not limited to, meeting specified revenue goals, business expansion goals, cost targets, goals relating to acquisitions or divestitures, safety, operational incident and environmental goals and standards. |
2.11 | “General Partner” means Buckeye GP LLC, a Delaware limited liability company, and any successor thereto. |
2.12 | “Individual Performance” shall mean each Employee’s work performance during the Performance Period which may be assessed by the Administrator based on one or more criteria, including, but not limited to: personal or team performance and measures such as teamwork, interpersonal skills, communication skills, employee development, project management skills, and leadership, or individual or team business objectives such as performance versus budget and attainment of safety, operational incident and environmental standards. |
2.13 | “Participant” shall mean an Employee who meets the eligibility requirements of Section 4.1 and is awarded an Actual Award under the Plan. |
2
Exhibit 10.6
2.14 | “Partnership” means Buckeye Partners, L.P., a Delaware limited partnership, and any successor thereto. |
2.15 | “Performance Period” shall mean the Plan Year or any other period designated by the Administrator with respect to which performance of the Company, Employees, or both, is measured. |
2.16 | “Plan” shall mean the Buckeye Partners, L.P. Annual Incentive Compensation Plan, or if hereafter amended or supplemented, as so amended or supplemented. |
2.17 | “Plan Year” shall mean the calendar year. |
2.18 | “Target Award Level” shall mean the target incentive amount for each Employee as determined by the Administrator in its sole discretion. |
2.19 | “Target Award Pool” shall mean the Target Award Pool established by the Administrator pursuant to Section 5.3. |
ARTICLE III CONSTRUCTION
3.1 | Gender and Number. The masculine pronoun whenever used in the Plan shall include the feminine, and the feminine pronoun whenever used in the Plan shall include the masculine, in each case as the context or facts may require. Whenever any words are used herein in the singular, they shall be construed as if they were also used in the plural in all cases where the context so applies. |
3.2 | Captions. The captions to the articles and sections of this Plan are for convenience only and shall not control or affect the meaning or construction of any of its provisions. |
3.3 | Severability. In the event any provision of the Plan shall be held illegal or invalid for any reason, the illegality or invalidity shall not affect the remaining parts of the Plan, and the Plan shall be construed and enforced as if the illegal or invalid provision had not been included. |
3.4 | Controlling Law. The Plan and all related documents shall be governed by and construed in accordance with the laws of the State of Delaware, without regard to the conflict of law principles of any state. Any persons or companies who now are or shall subsequently become parties to the Plan shall be deemed to consent to this provision. |
3.5 | No Right to Employment. This Plan does not confer nor shall it be construed as creating an express or implied contract of employment between any Employee and the Partnership, General Partner or Affiliate or other party. Nothing in the Plan shall interfere with or limit in any way the right of the Partnership, General Partner or Affiliate to terminate any Employee’s employment at any time, nor confer upon any |
3
Exhibit 10.6
Employee any right to continue in the employment of the Partnership, General Partner or Affiliate.
ARTICLE IV ELIGIBILITY AND PARTICIPATION
4.1 | Eligibility. Except to the extent determined otherwise in accordance with Section 4.3, in order to be eligible to participate in the Plan for a Performance Period, an individual must be (a) an Employee; (b) hired before the commencement of the last quarter of the Performance Period; (c) employed on the last day of the Plan Year and (d) employed on the date an Actual Award is paid as set forth herein. |
4.2 | No Right to Participation. No Employee shall have a right to participate in the Plan, regardless of prior participation in the Plan. |
4.3 | Status Change During Performance Period. Unless otherwise determined by the Administrator in its sole discretion, an Employee shall be ineligible to receive an Actual Award if the Employee is not employed on the date an Actual Award is paid pursuant to Section 7.1. |
4.4 | Leave of Absence. Unless the Administrator determines otherwise, except when leave is taken under the Family and Medical Leave Act of 1993 ("FMLA"), the Uniformed Services Employment and Reemployment Rights Act of 1994 ("USERRA"), or the reasonable accommodation provisions of the Americans with Disabilities Act of 1990, as amended ("ADA") (or equivalent state or local laws), or is otherwise prohibited by any applicable law, an Employee on paid or un-paid leave for more than ninety (90) days during any Plan Year shall be ineligible for an Actual Award for that Plan Year. |
ARTICLE V ESTABLISHMENT OF PERFORMANCE GOALS AND SETTING TARGET AWARD LEVELS
5.1 | Establishment of Performance Goals. For each Performance Period, the Committee shall establish the Performance Goals in its sole discretion. The Committee may adjust the Performance Goals to take into account such unanticipated circumstances or significant events as the Committee determines, including but not limited to, a corporate transaction, such as an acquisition, divestiture, a merger, consolidation, separation, reorganization or partial or complete liquidation, or to equitably reflect the occurrence of any other extraordinary or unusual event in the marketplace, any change in applicable accounting rules or principles, any change in applicable law, litigation, any change due to any merger, consolidation, acquisition, reorganization, distribution, or other changes in the Partnership's corporate structure or units, or any other change of a similar nature. |
5.2 | Setting Target Award Levels. For each Performance Period, the Administrator shall establish a Target Award Level for each Employee in its sole discretion, taking into account an Employee’s responsibility level or the position or positions held during |
4
Exhibit 10.6
the Performance Period. The Administrator shall determine the Target Award Level for each Employee at such time or times as the Administrator determines.
5.3 | Setting the Target Award Pool. The Target Award Pool shall equal the sum of the Target Award Levels for all Employees for a Performance Period, plus such additional amount as the Committee shall determine prior to, or contemporaneously with, the establishment of the Performance Goals. |
ARTICLE VI DETERMINATION OF ACTUAL AWARDS
6.1 | Calculation of the Actual Award Pool. The amount of the Actual Award Pool shall be based upon the level of achievement of the Performance Goals for the Performance Period, as determined by the Committee, in its sole discretion, such that the amount of the Actual Award Pool equals the sum of the Target Award Levels for all Employees as adjusted (upward or downward) by the Committee based upon the level of achievement of the Performance Goals as determined by the Committee, plus the additional amount added to the Target Award Pool for the Performance Period by the Committee prior to, or contemporaneously with, the establishment of the Performance Goals pursuant to Section 5.3, if any. |
6.2 | Calculation of Actual Awards. All Actual Awards shall be one hundred percent (100%) discretionary. The Administrator shall determine the Actual Award payable to an Employee from the Actual Award Pool for a Performance Period based upon the level of attainment of the Performance Goal and taking into account the Employee’s Individual Performance and the performance of the Employee’s reporting segment, as determined by the Administrator. Individual Performance shall be assessed by the Administrator in its sole discretion or an immediate supervisor or department head of an Employee to whom the Administrator delegates such authority. The Administrator may determine, in its sole discretion, to pay (a) an Actual Award to an Employee that is greater than, equal to, or less than such Employee’s Target Award Level and (b) Actual Awards to Employees for a Performance Period that, in the aggregate, are equal to or less than the total amount of the Actual Award Pool. |
6.3 | Award Adjustments. No Employee shall be entitled to an Actual Award under the Plan and an Employee shall not become a Participant in the Plan until an Actual Award is made to the Employee. The Administrator shall have the sole discretion to determine or adjust the amount, if any, of any Actual Award payable under the Plan until such Actual Award is paid. |
6.4 | Discretionary Awards. Notwithstanding any provision of the Plan to the contrary, in addition to the Actual Award made to an Employee under the Plan, if any, the Administrator may pay to an Employee an additional amount, taking into account such factors as it deems appropriate and determines in its sole and absolute discretion. |
5
Exhibit 10.6
ARTICLE VII PAYMENT OF ACTUAL AWARDS
7.1 | Timing and Form of Payment. A Participant’s Actual Award shall be paid in cash as soon as administratively practicable after the end of the Performance Period. To the extent a Participant obtains a “legally binding right” (within the meaning of Code Section 409A) to his Actual Award, such Actual Award shall be paid in cash as soon as practicable after, and no later than, March 15th following the end of the calendar year in which the Award is no longer subject to a “substantial risk of forfeiture” (within the meaning of Code Section 409A). With respect to any Participant paid in foreign currency, the amount of any Actual Award paid to a Participant shall be based on such exchange rate as the Administrator reasonably determines. |
ARTICLE VIII ADMINISTRATION
8.1 | Administrator Authority. The Plan shall be administered by the Administrator, which, in addition to the other powers set forth herein, shall have the full power, subject to, and within the limits of the Plan, to: |
(a) | make all determinations and interpretations and approve all rules as may be necessary or advisable for the administration of the Plan, including, but not limited to, those necessary to resolve any ambiguities with respect to any of the terms and provisions of the Plan; |
(b) | exercise all powers and perform such acts in connection with the Plan as are deemed necessary or appropriate to promote the best interests of the Partnership, General Partner or Affiliate; |
(c) | construe and interpret the Plan and any agreement or instrument entered into under the Plan; and |
(d) | establish, amend or waive rules and regulations for the Plan’s administration. |
8.2 | Authorized Agents. The Administrator may authorize any officer of the General Partner to execute and deliver documents on behalf of the Administrator, including administrative guidelines for this Plan. |
8.3 | Binding Decisions. All determinations and decisions of the Administrator as to any disputed question arising under the Plan, including questions of construction and interpretation, shall be final, binding and conclusive upon all parties. |
ARTICLE IX AMENDMENT AND TERMINATION
9.1 | The Administrator may amend, suspend, or terminate the Plan or any portion thereof at any time and for any reason or no reason. |
6
Exhibit 10.6
ARTICLE X MISCELLANEOUS
10.1 | Nontransferability. No right or interest of any Participant in the Plan shall be assignable or transferable, or subject to any lien, directly, by operation of law or otherwise, including, but not limited to, execution, levy, garnishment, attachment, pledge and bankruptcy. |
10.2 | Tax Withholding. The Partnership, the General Partner or Affiliates, as applicable, shall have the right to deduct from all payments under the Plan any foreign, federal, state or local income or other taxes required by law to be withheld with respect to such payments. |
10.3 | Employment Not Affected. Eligibility for participation or participation in the Plan shall not confer upon an Employee any right to be retained by, or in the employ or service of, the Partnership, the General Partner or an Affiliate, and shall not interfere in any way with the right of the Partnership, General Partner or an Affiliate, as applicable, to terminate the Employee’s employment or service at any time. |
10.4 | Non-uniform Determinations. The Administrator’s determinations under the Plan (including without limitation, determinations of the persons to receive Actual Awards, the form, amount, size and timing of such payments, the terms and provisions of such payments, and the agreement evidencing same) need not be uniform and may be made selectively among persons who receive, or are eligible to receive, Actual Awards under the Plan, whether or not such persons are similarly situated. |
10.5 | No Fund. The Partnership shall have no obligation to reserve or otherwise fund in advance any amounts which are or may in the future become payable under this Plan. Any funds, which the Partnership acting in its sole discretion determines to reserve for future payments under this Plan, may be commingled with other funds of the Partnership and need not in any way be segregated from other assets or funds held by the Partnership. |
10.6 | Successors. All obligations of the Partnership under the Plan shall be binding upon and inure to the benefit of any successor of the Partnership, whether the existence of such successor is the result of a direct or indirect purchase, merger, consolidation, or otherwise, of all or substantially all of the business and/or assets of the Partnership. |
10.7 | Other Plans. Nothing contained in this Plan shall prevent the Administrator or the Board from adopting other or additional compensation arrangements, and such arrangements may be either generally applicable or applicable only in specific cases. |
10.8 | Employees Subject to Taxation outside the United States. With respect to Employees who are subject to taxation in countries other than the United States, the Administrator may make Actual Awards on such terms and conditions as the Administrator deems necessary or appropriate to comply with the laws of the applicable countries, and the Administrator may create such procedures, addenda |
7
Exhibit 10.6
and subplans and make such modifications as may be necessary or advisable to comply with such laws.
8
Exhibit 12.1
Buckeye Partners, L.P.
Computation of Ratio of Earnings to Fixed Charges
(Dollars in thousands)
2017 | 2016 | 2015 | 2014 | 2013 | |||||||||||||||
Earnings: | |||||||||||||||||||
Income from continuing operations before taxes (1) | $ | 479,674 | $ | 537,068 | $ | 438,954 | $ | 333,046 | $ | 348,507 | |||||||||
Equity income (greater than) less than distributions | 31,573 | (5,731 | ) | (1,273 | ) | (10,795 | ) | (3,931 | ) | ||||||||||
Less: Capitalized interest (2) | (3,816 | ) | (3,354 | ) | (20,398 | ) | (9,364 | ) | (6,501 | ) | |||||||||
Total earnings | $ | 507,431 | $ | 527,983 | $ | 417,283 | $ | 312,887 | $ | 338,075 | |||||||||
Fixed Charges: | |||||||||||||||||||
Interest and debt expense | $ | 225,583 | $ | 194,922 | $ | 171,330 | $ | 171,235 | $ | 130,920 | |||||||||
Capitalized interest | 4,792 | 4,371 | 21,257 | 9,903 | 7,007 | ||||||||||||||
Portion of rentals representing an interest factor | 9,972 | 10,916 | 10,328 | 8,883 | 8,217 | ||||||||||||||
Total fixed charges | $ | 240,347 | $ | 210,209 | $ | 202,915 | $ | 190,021 | $ | 146,144 | |||||||||
Earnings available for fixed charges | $ | 747,778 | $ | 738,192 | $ | 620,198 | $ | 502,908 | $ | 484,219 | |||||||||
Ratio of earnings to fixed charges | 3.11 | 3.51 | 3.06 | 2.65 | 3.31 | ||||||||||||||
_________________________
(1) | Excludes income attributable to noncontrolling interests. |
(2) | Excludes amortization of capitalized interest of $1.0 million, $1.0 million, $0.9 million, $0.5 million and $0.5 million for the years ended December 31, 2017, 2016, 2015, 2014 and 2013, respectively. |
Exhibit 21.1
BUCKEYE PARTNERS, L.P.
SUBSIDIARIES OF THE REGISTRANT
Subsidiary | Jurisdiction of Organization | |
Baproven Limited | Bahamas | |
Borco Towing Company Limited | Bahamas | |
Buckeye Albany Terminal LLC | Delaware | |
Buckeye Atlantic Holdings GP LLC | Delaware | |
Buckeye Atlantic Holdings LLC | Delaware | |
Buckeye Aviation (Memphis) LLC | Nevada | |
Buckeye Aviation (Reno) LLC | Delaware | |
Buckeye Aviation (San Diego) LLC | Delaware | |
Buckeye Bahamas Hub Limited | Bahamas | |
Buckeye Bayonne Terminal LLC | Delaware | |
Buckeye Caribbean Holdings Limited | Cayman Islands | |
Buckeye Caribbean Terminals LLC | Puerto Rico | |
Buckeye Development & Logistics I LLC | Delaware | |
Buckeye Development & Logistics II LLC | Delaware | |
Buckeye East Chicago Railroad LLC | Delaware | |
Buckeye Energy Holdings LLC | Delaware | |
Buckeye Energy Services LLC | Delaware | |
Buckeye Field Services LLC | Delaware | |
Buckeye Fuel Services and Logistics LLC | Delaware | |
Buckeye GP LLC | Delaware | |
Buckeye Hammond Railroad LLC | Delaware | |
Buckeye JV Holdings LLC | Delaware | |
Buckeye Linden Pipe Line Company LLC | Delaware | |
Buckeye North Sea Coöperatief U.A. | Netherlands | |
Buckeye North Sea Holdings LLC | Delaware | |
Buckeye Pennsauken Terminal LLC | Delaware | |
Buckeye Perth Amboy Terminal LLC | Delaware | |
Buckeye Pipe Line Company, L.P. | Delaware | |
Buckeye Pipe Line Holdings, L.P. | Delaware | |
Buckeye Pipe Line Transportation LLC | Delaware | |
Buckeye Pitons Limited | Saint Lucia | |
Buckeye Port Reading Terminal LLC | Delaware | |
Buckeye Products Pipe Line, L.P. | Delaware | |
Buckeye Railroad Holdings LLC | Delaware | |
Buckeye Raritan Bay Terminal LLC | Delaware | |
Buckeye Rochester Terminal LLC | Delaware | |
Buckeye South Texas Gateway Holdings LLC | Delaware | |
Buckeye St. Lucia Terminal Limited | Saint Lucia | |
Buckeye Syracuse Terminal LLC | Delaware | |
Buckeye Tank Terminals LLC | Delaware | |
Buckeye Terminals, LLC | Delaware | |
Buckeye Texas Hub LLC | Delaware | |
Buckeye Texas Logistics LLC | Delaware | |
Buckeye Texas Market Center LLC | Delaware | |
Buckeye Texas Partners LLC | Delaware | |
Buckeye Texas Partners Holdings LLC | Delaware | |
Buckeye Texas Processing LLC | Delaware | |
Buckeye Texas Transportation LLC | Delaware | |
Buckeye West Indies Holdings GP LLC | Delaware | |
Buckeye West Indies Holdings LP | Cayman Islands | |
Corpus Fuels LLC | Delaware | |
Cul de Sac Agencies, Limited | Saint Lucia | |
Cul de Sac Harbour Pilotage Ltd. | Saint Lucia | |
Duck Island Terminal, LLC | Delaware | |
Everglades Pipe Line Company, L.P. | Delaware | |
Ferrysburg Terminal, LLC | Delaware | |
FR Borco Coop Holdings GP Limited | Cayman Islands | |
FR Borco Coop Holdings Limited | Cayman Islands | |
FR Borco Coop Holdings, L.P. | Cayman Islands | |
FR Borco Holdings L.P. | Cayman Islands | |
FR Borco Holdings Limited | Cayman Islands | |
FR Borco Topco L.P. | Cayman Islands | |
Gulf Coast Pipe Line, L.P. | Delaware | |
Gulf Coast/Products GP Holding LLC | Delaware | |
Gulf Coast/Products Holding L.P. | Delaware | |
Laurel Pipe Line Company, L.P. | Delaware | |
MainLine GP LLC | Delaware | |
MainLine L.P. | Delaware | |
NORCO Pipe Line Company, LLC | Delaware | |
South Portland Terminal LLC | Delaware | |
South Texas Gateway Operating LLC | Delaware | |
South Texas Gateway Pipeline LLC | Delaware | |
St. Lucia International Petrol Company Limited | Saint Lucia | |
TTL Services LLC | Delaware | |
Wood River Pipe Lines LLC | Delaware | |
Exhibit 23.1
CONSENT OF INDEPENDENT REGISTERED PUBLIC ACCOUNTING FIRM
We consent to the incorporation by reference in Registration Statement No. 333-200443 on Form S-3, Registration Statement No. 333-200441 on Form S-3, Registration Statement No. 333-176344 on Form S-3, Registration Statement No. 333-172581 on Form S-3, Registration Statement No. 333-172023 on Form S-3, Registration Statement No. 333-172022 on Form S-3, Registration Statement No. 333-170569 on Form S-3, Registration Statement No. 033-52761 on Form S-8, Registration Statement No. 333-127361 on Form S-8 and Registration Statement No. 333-189778 on Form S-8 of our reports dated February 22, 2018, relating to the consolidated financial statements of Buckeye Partners, L.P. and subsidiaries, and the effectiveness of Buckeye Partners, L.P. and subsidiaries’ internal control over financial reporting, appearing in this Annual Report on Form 10-K of Buckeye Partners, L.P. for the year ended December 31, 2017.
/s/ DELOITTE & TOUCHE LLP | |
Houston, Texas | |
February 22, 2018 | |
Exhibit 31.1
CERTIFICATION
I, Clark C. Smith, certify that:
1. | I have reviewed this Annual Report on Form 10-K of Buckeye Partners, L.P.; |
2. | Based on my knowledge, this report does not contain any untrue statement of a material fact or omit to state a material fact necessary to make the statements made, in light of the circumstances under which such statements were made, not misleading with respect to the period covered by this report; |
3. | Based on my knowledge, the financial statements, and other financial information included in this report, fairly present in all material respects the financial condition, results of operations and cash flows of the registrant as of, and for, the periods presented in this report; |
4. | The registrant’s other certifying officer and I are responsible for establishing and maintaining disclosure controls and procedures (as defined in Exchange Act Rules 13a-15(e) and 15d-15(e)) and internal control over financial reporting (as defined in Exchange Act Rules 13a-15(f) and 15d-15(f)) for the registrant and have: |
(a) | Designed such disclosure controls and procedures, or caused such disclosure controls and procedures to be designed under our supervision, to ensure that material information relating to the registrant, including its consolidated subsidiaries, is made known to us by others within those entities, particularly during the period in which this report is being prepared; |
(b) | Designed such internal control over financial reporting, or caused such internal control over financial reporting to be designed under our supervision, to provide reasonable assurance regarding the reliability of financial reporting and the preparation of financial statements for external purposes in accordance with generally accepted accounting principles; |
(c) | Evaluated the effectiveness of the registrant’s disclosure controls and procedures and presented in this report our conclusions about the effectiveness of the disclosure controls and procedures, as of the end of the period covered by this report based on such evaluation; and |
(d) | Disclosed in this report any change in the registrant’s internal control over financial reporting that occurred during the registrant’s most recent fiscal quarter (the registrant’s fourth fiscal quarter in the case of an annual report) that has materially affected, or is reasonably likely to materially affect, the registrant’s internal control over financial reporting; and |
5. | The registrant’s other certifying officer and I have disclosed, based on our most recent evaluation of internal control over financial reporting, to the registrant’s auditors and the audit committee of the registrant’s board of directors (or persons performing the equivalent functions): |
(a) | All significant deficiencies and material weaknesses in the design or operation of internal control over financial reporting which are reasonably likely to adversely affect the registrant’s ability to record, process, summarize and report financial information; and |
(b) | Any fraud, whether or not material, that involves management or other employees who have a significant role in the registrant’s internal control over financial reporting. |
BUCKEYE GP LLC, as general partner of the registrant | |
Date: February 22, 2018 | /s/ CLARK C. SMITH |
Clark C. Smith | |
Chief Executive Officer, President and Chairman of the Board | |
Exhibit 31.2
CERTIFICATION
I, Keith E. St.Clair, certify that:
1. | I have reviewed this Annual Report on Form 10-K of Buckeye Partners, L.P.; |
2. | Based on my knowledge, this report does not contain any untrue statement of a material fact or omit to state a material fact necessary to make the statements made, in light of the circumstances under which such statements were made, not misleading with respect to the period covered by this report; |
3. | Based on my knowledge, the financial statements, and other financial information included in this report, fairly present in all material respects the financial condition, results of operations and cash flows of the registrant as of, and for, the periods presented in this report; |
4. | The registrant’s other certifying officer and I are responsible for establishing and maintaining disclosure controls and procedures (as defined in Exchange Act Rules 13a-15(e) and 15d-15(e)) and internal control over financial reporting (as defined in Exchange Act Rules 13a-15(f) and 15d-15(f)) for the registrant and have: |
(a) | Designed such disclosure controls and procedures, or caused such disclosure controls and procedures to be designed under our supervision, to ensure that material information relating to the registrant, including its consolidated subsidiaries, is made known to us by others within those entities, particularly during the period in which this report is being prepared; |
(b) | Designed such internal control over financial reporting, or caused such internal control over financial reporting to be designed under our supervision, to provide reasonable assurance regarding the reliability of financial reporting and the preparation of financial statements for external purposes in accordance with generally accepted accounting principles; |
(c) | Evaluated the effectiveness of the registrant’s disclosure controls and procedures and presented in this report our conclusions about the effectiveness of the disclosure controls and procedures, as of the end of the period covered by this report based on such evaluation; and |
(d) | Disclosed in this report any change in the registrant’s internal control over financial reporting that occurred during the registrant’s most recent fiscal quarter (the registrant’s fourth fiscal quarter in the case of an annual report) that has materially affected, or is reasonably likely to materially affect, the registrant’s internal control over financial reporting; and |
5. | The registrant’s other certifying officer and I have disclosed, based on our most recent evaluation of internal control over financial reporting, to the registrant’s auditors and the audit committee of the registrant’s board of directors (or persons performing the equivalent functions): |
(a) | All significant deficiencies and material weaknesses in the design or operation of internal control over financial reporting which are reasonably likely to adversely affect the registrant’s ability to record, process, summarize and report financial information; and |
(b) | Any fraud, whether or not material, that involves management or other employees who have a significant role in the registrant’s internal control over financial reporting. |
BUCKEYE GP LLC, as general partner of the registrant | |
Date: February 22, 2018 | /s/ KEITH E. ST.CLAIR |
Keith E. St.Clair | |
Executive Vice President and Chief Financial Officer | |
Exhibit 32.1
CERTIFICATION PURSUANT TO
18 U.S.C. SECTION 1350
In connection with the Annual Report of Buckeye Partners, L.P. (“Buckeye”) on Form 10-K for the period ended December 31, 2017 as filed with the Securities and Exchange Commission on the date hereof (the “Report”), I, Clark C. Smith, Chief Executive Officer, President and Chairman of the Board of Buckeye GP LLC, the general partner of Buckeye, hereby certify, to my knowledge, pursuant to 18 U.S.C. § 1350, as adopted pursuant to § 906 of the Sarbanes-Oxley Act of 2002, that:
(1) | The Report fully complies with the requirements of Section 13(a) of the Securities Exchange Act of 1934, as amended; and |
(2) | The information contained in the Report fairly presents, in all material respects, the financial condition and results of operations of Buckeye. |
BUCKEYE GP LLC, as general partner of Buckeye | |
Date: February 22, 2018 | /s/ CLARK C. SMITH |
Clark C. Smith | |
Chief Executive Officer, President and Chairman of the Board | |
Exhibit 32.2
CERTIFICATION PURSUANT TO
18 U.S.C. SECTION 1350
In connection with the Annual Report of Buckeye Partners, L.P. (“Buckeye”) on Form 10-K for the period ended December 31, 2017 as filed with the Securities and Exchange Commission on the date hereof (the “Report”), I, Keith E. St.Clair, Executive Vice President and Chief Financial Officer of Buckeye GP LLC, the general partner of Buckeye, hereby certify, to my knowledge, pursuant to 18 U.S.C. § 1350, as adopted pursuant to § 906 of the Sarbanes-Oxley Act of 2002, that:
(1) | The Report fully complies with the requirements of Section 13(a) of the Securities Exchange Act of 1934, as amended; and |
(2) | The information contained in the Report fairly presents, in all material respects, the financial condition and results of operations of Buckeye. |
BUCKEYE GP LLC, as general partner of Buckeye | |
Date: February 22, 2018 | /s/ KEITH E. ST.CLAIR |
Keith E. St.Clair | |
Executive Vice President and Chief Financial Officer | |