Form 8-K Elevate Credit, Inc. For: Feb 08
UNITED STATES
SECURITIES AND EXCHANGE COMMISSION
Washington, D.C. 20549
____________________________________________________________________
FORM 8-K
____________________________________________________________________
CURRENT REPORT
Pursuant to Section 13 or 15(d)
of the Securities Exchange Act of 1934
Date of Report (Date of earliest event reported)
February 8, 2018
____________________________________________________________________
ELEVATE CREDIT, INC.
(Exact name of registrant as specified in its charter)
____________________________________________________________________
Delaware | 001-37680 | 46-4714474 | ||
(State or other jurisdiction of incorporation) | (Commission File Number) | (I.R.S. Employer Identification No.) | ||
4150 International Plaza, Suite 300
Fort Worth, Texas 76109
(Address of principal executive offices, including zip code)
Registrant’s telephone number, including area code (817) 928-1500
Not Applicable
(Former name or former address, if changed since last report.)
____________________________________________________________________
Check the appropriate box below if the Form 8-K filing is intended to simultaneously satisfy the filing obligation of the registrant under any of the following provisions:
o | Written communications pursuant to Rule 425 under the Securities Act (17 CFR 230.425) |
o | Soliciting material pursuant to Rule 14a-12 under the Exchange Act (17 CFR 240.14a-12) |
o | Pre-commencement communications pursuant to Rule 14d-2(b) under the Exchange Act (17 CFR 240.14d-2(b)) |
o | Pre-commencement communications pursuant to Rule 13e-4(c) under the Exchange Act (17 CFR 240.13e-4(c)) |
Indicate by check mark whether the registrant is an emerging growth company as defined in as defined in Rule 405 of the Securities Act of 1933 (§230.405 of this chapter) or Rule 12b-2 of the Securities Exchange Act of 1934 (§240.12b-2 of this chapter).
Emerging growth company x
If an emerging growth company, indicate by check mark if the registrant has elected not to use the extended transition period for complying with any new or revised financial accounting standards provided pursuant to Section 13(a) of the Exchange Act. x
Item 2.02 | Results of Operations and Financial Condition. |
On February 8, 2018, Elevate Credit, Inc. (the "Company") issued a press release announcing its financial results for the quarter and year ended December 31, 2017. The full text of the press release, along with the slide presentation to be used during the earnings call on February 8, 2018, are furnished herewith as Exhibits 99.1 and 99.2, respectively.
Item 9.01 | Financial Statements and Exhibits. |
(d) Exhibits.
Exhibit No. | Description |
99.1 | |
99.2 | |
SIGNATURES
Pursuant to the requirements of the Securities Exchange Act of 1934, the registrant has duly caused this report to be signed on its behalf by the undersigned hereunto duly authorized.
Elevate Credit, Inc. | |||
Date: | February 8, 2018 | By: | /s/ Christopher Lutes |
Christopher Lutes | |||
Chief Financial Officer | |||

ELEVATE CREDIT ANNOUNCES FOURTH QUARTER & FULL YEAR 2017 RESULTS
Continued strong quarterly growth and profitability excluding one-time tax adjustment
FORT WORTH, TX - February 8, 2018 - Elevate Credit, Inc. (NYSE: ELVT) (“Elevate” or the “Company”), a leading tech-enabled provider of innovative and responsible online credit solutions for non-prime consumers, today announced results for the fourth quarter and full year ended December 31, 2017.
“Elevate ended its first year as a public company with strong loan growth and delivered on our goals of top-line growth, margin expansion, and stable credit quality,” said Ken Rees, Chief Executive Officer of Elevate. “Between the beneficial impact of U.S. federal tax reform and the loan portfolio growth, Elevate is set up to deliver even greater levels of revenue growth and profit margin expansion in 2018.”
Fourth Quarter 2017 Financial Highlights1
• | Fourth quarter GAAP net loss due to federal tax law charge, but fourth consecutive quarter of net income on an adjusted basis: Fourth quarter 2017 net loss totaled $12.2 million, or $(0.29) per diluted share, reflecting a one-time $12.5 million charge associated with the change in the federal tax law resulting from the tax reform in 2017. Excluding the impact from the tax law change, net income for the fourth quarter of 2017 would have been $0.3 million, or $0.01 per diluted share, versus a net loss of $4.4 million, or $(0.34) per diluted share, for the fourth quarter of 2016. The net loss for full-year 2017 totaled $6.9 million, or $(0.20) per diluted share. Excluding the impact of the federal tax law, net income for full year 2017 would have been $5.5 million, or $0.16 per diluted share, compared to a net loss of $22.4 million, or $(1.74) per diluted share, for full-year 2016. See "Non-GAAP Financial Measures" for a reconciliation of the tax impact to the GAAP measures of net loss and diluted earnings per share. |
Additionally, due to strong year-end consumer demand, the Company increased its marketing spend above initial fourth quarter 2017 planned expenditures. This increased marketing spend resulted in $21 million more in year-end 2017 loan balances, which is anticipated to have a positive impact on 2018 revenue growth and profitability. The Company incurred approximately $5.3 million in additional upfront direct marketing and loan loss provision expense as a result of this decision, which negatively impacted net income in the fourth quarter of 2017 by $4.2 million, or $0.09 per diluted share.
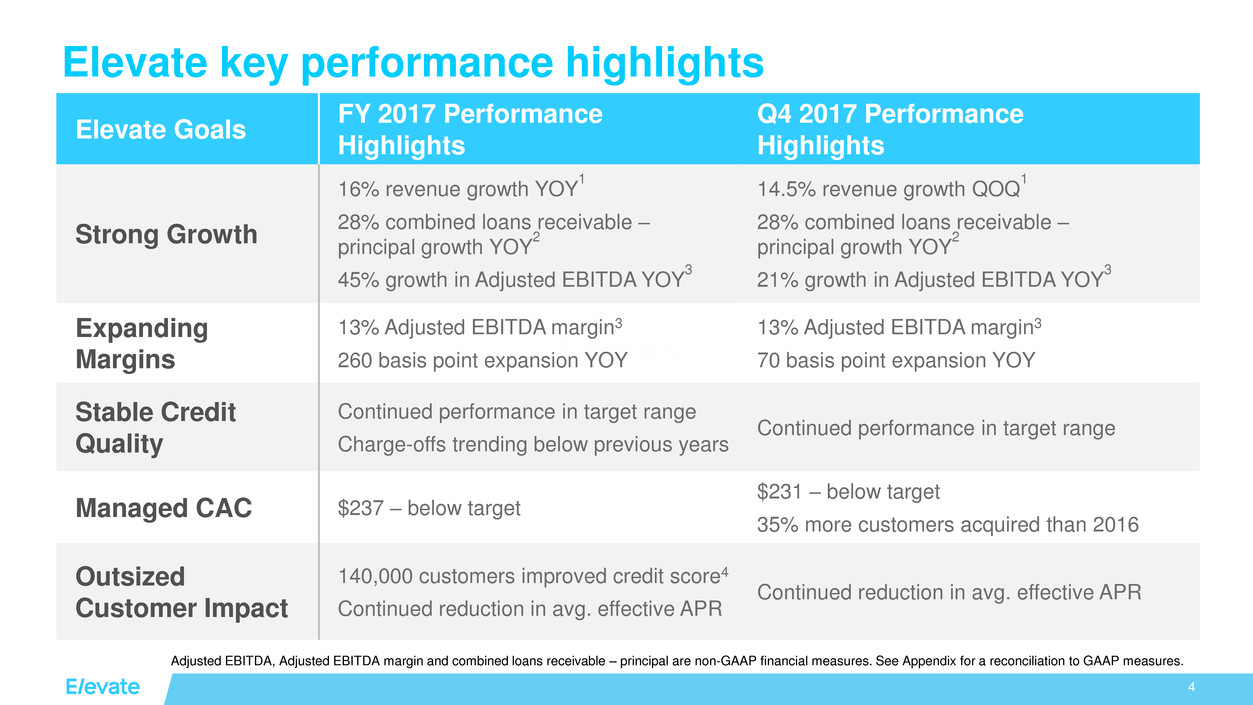
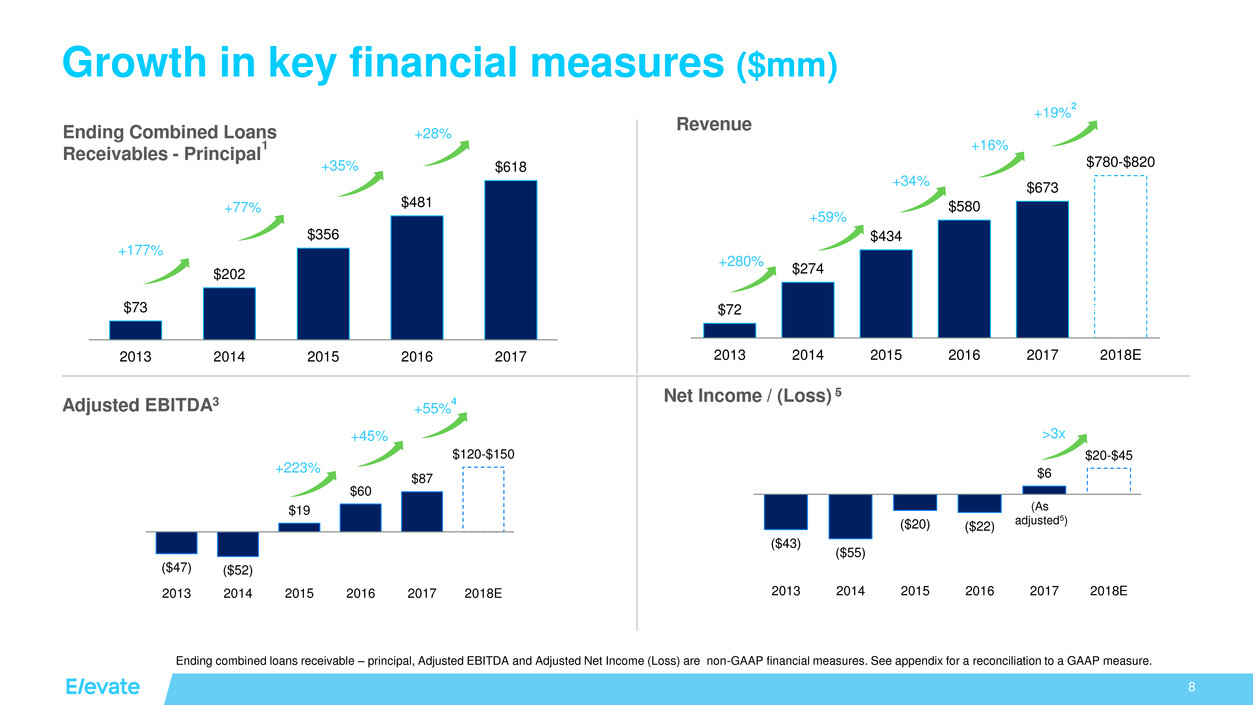
• | 16% year-over-year revenue growth: Revenues for the fourth quarter of 2017 increased 14.5% from the fourth quarter of 2016 and were up 16.0% for full-year 2017 versus 2016. Revenues totaled $193.4 million in the fourth quarter of 2017 compared to $169.0 million for the prior-year period. Full-year 2017 revenues totaled $673.1 million compared to $580.4 million for full-year 2016. |
__________________________
1 Adjusted EBITDA, Adjusted EBITDA margin, combined loans receivable - principal, combined loan loss reserve and combined loans receivable are non-GAAP financial measures. These terms are defined elsewhere in this release. Please see the schedules appearing later in this release for reconciliations of these non-GAAP measures to the most directly comparable GAAP measures.
1
• | More than 28% year-over-year growth in combined loans receivable - principal: Combined loans receivable - principal totaled $618.4 million, a 28.5% increase from $481.2 million for the prior-year period. The Rise installment loan and Elastic line of credit combined loans receivable - principal balances as of December 31, 2017 were up 19.6% and 47.4% over the prior year-end balances, respectively. |
• | Adjusted EBITDA up 45% compared to prior year: 2017 Adjusted EBITDA totaled $87.5 million, up 44.7% from $60.4 million in 2016. Adjusted EBITDA margin was 13% for both the fourth quarter of 2017 and full-year 2017. |
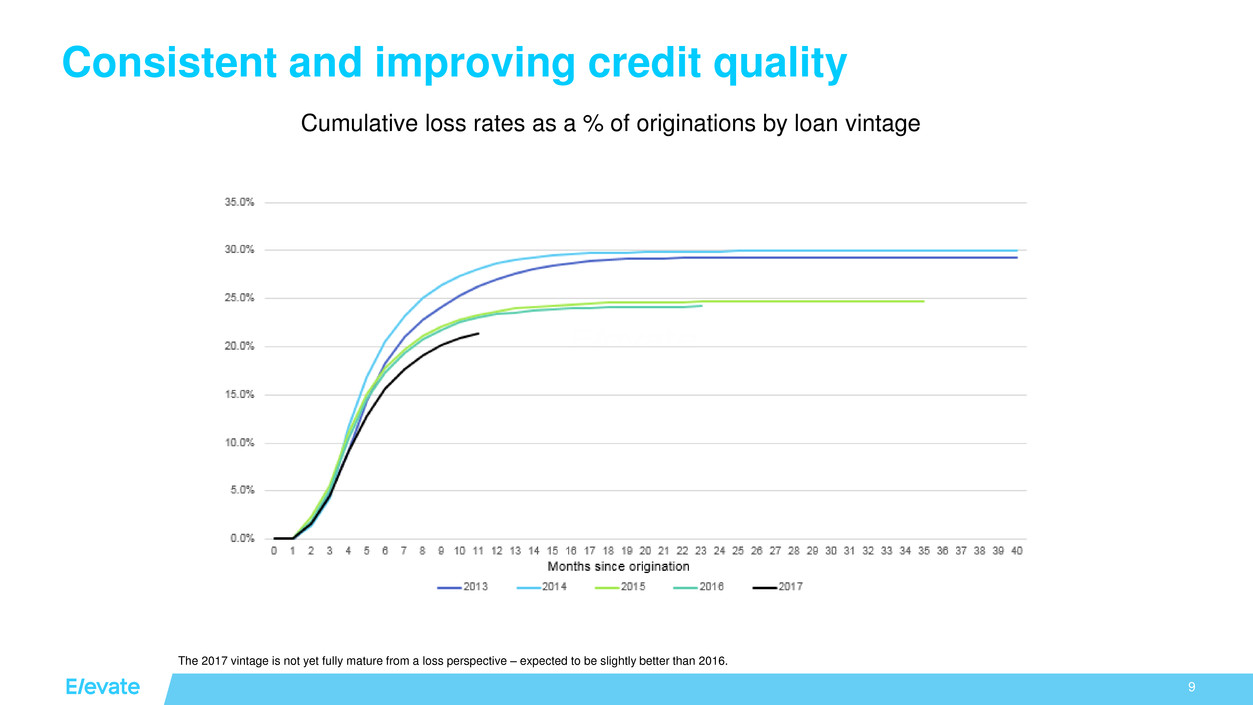
• | Continued stable credit quality: The ending combined loan loss reserve as a percentage of combined loans receivable was 14.3%, lower than the 16.1% reported for the prior-year period due to the improved credit quality and the continued maturation of the loan portfolio. Charge-offs as a percentage of originations for full-year 2017 continued to trend below previous years at less than 25% of principal originations. |
• | Strong new customer acquisition with costs below targeted range: The total number of new customers acquired during the fourth quarter of 2017 was approximately 95,000 with an average customer acquisition cost of $231, below the targeted range of $250-$300. This represented a 34.6% increase over the approximately 70,000 new customers acquired in the fourth quarter of 2016. |
Liquidity and Capital Resources
There were no material changes from a liquidity and funding standpoint during the fourth quarter of 2017. The Company borrowed an incremental $36 million during the quarter while combined loans receivable - principal increased $69.5 million, demonstrating the Company’s ability to self-fund a large portion of its loan growth. Interest expense as a percentage of revenue in the fourth quarter of 2017 was 9.5%, the lowest it has been in the last two years.
Recent Business Highlights
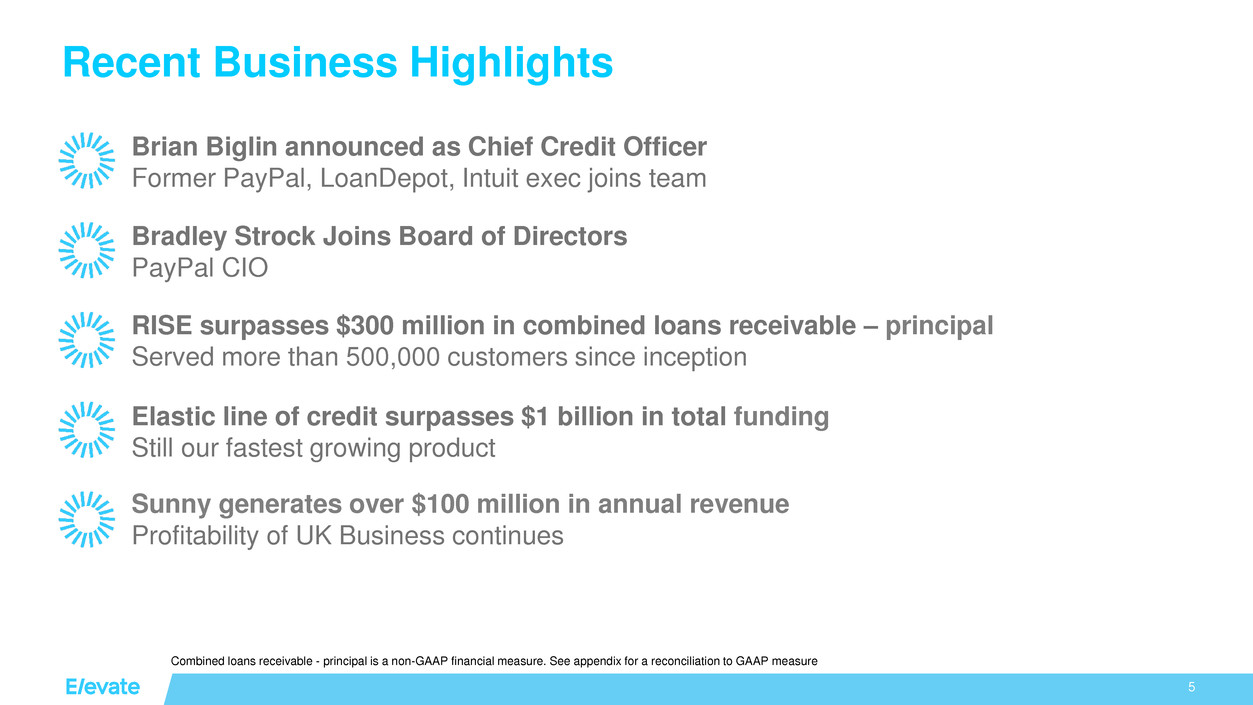
• | New Chief Credit Officer and Board Director. Elevate announced the hiring of Brian Biglin as Chief Credit Officer and the appointment of Bradley Strock as a member of the Board of Directors. Mr. Biglin was Chief Credit Officer at BillMeLater, PayPal and loanDepot.com, among other positions. Mr. Strock is currently the Chief Information Officer at PayPal, and previously held senior technology roles at Bank of America and J.P. Morgan Chase. |
• | Elevate’s Rise product surpasses $300 million in outstandings. In November 2017, Rise surpassed $300 million in total combined loans receivable - principal. Since inception, Rise has originated more than $1.8 billion in loans and served more than 500,000 customers. |
• | Elastic product surpasses $1 billion in total fundings. In December 2017, the Elastic line of credit product, originated by Republic Bank, surpassed $1 billion in total originations, having served more than 200,000 customers since 2013. |
• | Sunny surpasses $100 million in revenue during 2017. The Company's profitable UK business, offering installment loans under the brand name Sunny, generated $100 million of annual revenue in 2017 for the first time since its launch in 2013. |
2
Financial Outlook
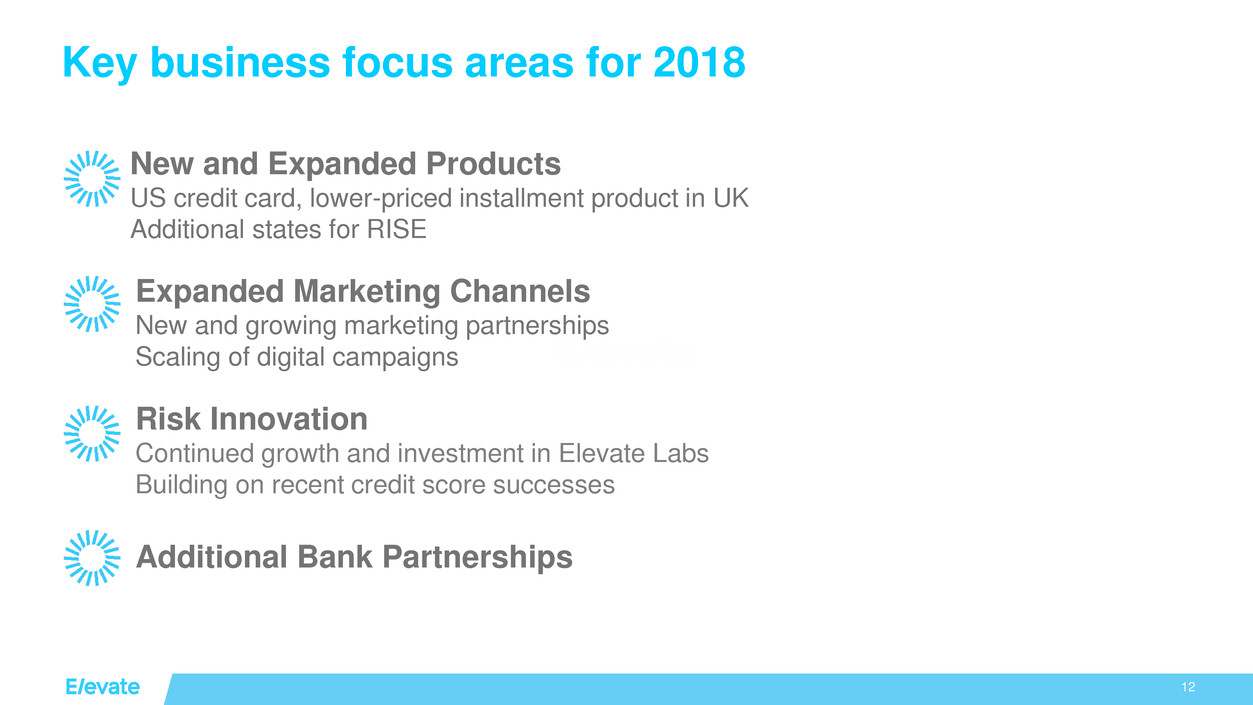
For the full year 2018, the Company expects total revenue of $780 million to $820 million, net income of $20 million to $45 million, or $0.50 to $1.05 in diluted earnings per share, and Adjusted EBITDA of $120 million to $150 million.
Conference Call
The Company will host a conference call to discuss its fourth quarter and full-year 2017 financial results on Thursday, February 8th at 4:00pm Central Time / 5:00pm Eastern Time. Interested parties may access the conference call live over the phone by dialing 1-877-407-0792 (domestic) or 1-201-689-8263 (international) and requesting the Elevate Fourth Quarter 2017 Earnings Conference Call. Participants are asked to dial in a few minutes prior to the call to register for the event. The conference call will also be webcast live through Elevate’s website at http://www.elevate.com/investors.
An audio replay of the conference call will be available approximately three hours after the conference call until 11:59 pm ET on February 22, 2018, and can be accessed by dialing 1-844-512-2921 (domestic) or 1-412-317-6671 (international), and providing the passcode 13675590, or by accessing Elevate’s website.
3
Forward-Looking Statements
This press release contains forward-looking statements within the meaning of Section 27A of the Securities Act of 1933, as amended, and Section 21E of the Securities Exchange Act of 1934, as amended. Such statements contain words such as "may," "will," "might," "expect," "believe," "anticipate," "could," "would," "estimate," "continue," "pursue," or the negative thereof or comparable terminology, and may include (without limitation) information regarding the Company's expectations, goals or intentions regarding future performance. These statements may include words such as “anticipate,” “estimate,” “expect,” “project,” “plan,” “intend,” “believe,” “may,” “will,” “should,” “likely” and other words and terms of similar meaning. The forward-looking statements include statements regarding: our future financial performance including our outlook for full fiscal year 2018 (including all statements under the heading "Financial Outlook"); our expectation that we are set up to deliver even greater levels of revenue growth and profit margin expansion in 2018; our expectation that the increased marketing spend in the fourth quarter of 2017 will have a positive impact on 2018 revenue growth and profitability; and the Company’s targeted customer acquisition cost range of $250-$300. Forward-looking statements involve certain risks and uncertainties, and actual results may differ materially from those discussed in any such statement. These risks and uncertainties include, but are not limited to: the Company’s limited operating history in an evolving industry; new laws and regulations in the consumer lending industry in many jurisdictions that could restrict the consumer lending products and services the Company offers, impose additional compliance costs on the Company, render the Company’s current operations unprofitable or even prohibit the Company’s current operations; scrutiny by regulators and payment processors of certain online lenders’ access to the Automated Clearing House system to disburse and collect loan proceeds and repayments; a lack of sufficient debt financing at acceptable prices or disruptions in the credit markets; the impact of competition in our industry and innovation by our competitors; our ability to prevent security breaches, disruption in service and comparable events that could compromise the personal and confidential information held in our data systems, reduce the attractiveness of our platform or adversely impact our ability to service loans; and other risks related to litigation, compliance and regulation. Additional factors that could cause actual results to differ are discussed under the heading "Risk Factors" and in other sections of the Company's most recent Quarterly Report on Form 10-Q, and in the Company's other current and periodic reports filed from time to time with the SEC. All forward-looking statements in this press release are made as of the date hereof, based on information available to the Company as of the date hereof, and the Company assumes no obligation to update any forward-looking statement.
4
About Elevate
Elevate (NYSE: ELVT) has originated $5.2 billion in non-prime credit to more than 1.9 million non-prime consumers to date. Its responsible, tech-enabled online credit solutions provide immediate relief to customers today and help them build a brighter financial future. The company is committed to rewarding borrowers’ good financial behavior with features like interest rates that can go down over time, free financial training and free credit monitoring. Elevate’s suite of groundbreaking credit products includes RISE, Sunny and Elastic. For more information, please visit http://www.elevate.com.
Investor Relations:
Solebury Communications
Sloan Bohlen, (817) 928-1646
or
Media Inquiries:
Vested
Ishviene Arora, (917) 765-8720
5
Elevate Credit, Inc. and Subsidiaries
Condensed Consolidated Income Statements
(Unaudited, except year ended December 31, 2016 amounts)
Three Months Ended December 31, | Years Ended December 31, | |||||||||||||||
(dollars in thousands, except share and per share amounts) | 2017 | 2016 | 2017 | 2016 | ||||||||||||
Revenues | $ | 193,443 | $ | 169,019 | $ | 673,132 | $ | 580,441 | ||||||||
Cost of sales: | ||||||||||||||||
Provision for loan losses | 106,281 | 100,316 | 357,574 | 317,821 | ||||||||||||
Direct marketing costs | 21,900 | 14,989 | 72,222 | 65,190 | ||||||||||||
Other cost of sales | 6,169 | 4,569 | 20,536 | 17,433 | ||||||||||||
Total cost of sales | 134,350 | 119,874 | 450,332 | 400,444 | ||||||||||||
Gross profit | 59,093 | 49,145 | 222,800 | 179,997 | ||||||||||||
Operating expenses: | ||||||||||||||||
Compensation and benefits | 21,115 | 15,477 | 81,969 | 65,657 | ||||||||||||
Professional services | 7,803 | 7,561 | 32,848 | 30,659 | ||||||||||||
Selling and marketing | 1,691 | 1,874 | 8,353 | 9,684 | ||||||||||||
Occupancy and equipment | 3,892 | 2,994 | 13,895 | 11,475 | ||||||||||||
Depreciation and amortization | 2,615 | 2,623 | 10,272 | 10,906 | ||||||||||||
Other | 1,505 | 1,346 | 4,600 | 3,812 | ||||||||||||
Total operating expenses | 38,621 | 31,875 | 151,937 | 132,193 | ||||||||||||
Operating income | 20,472 | 17,270 | 70,863 | 47,804 | ||||||||||||
Other income (expense): | ||||||||||||||||
Net interest expense | (18,441 | ) | (19,479 | ) | (73,043 | ) | (64,277 | ) | ||||||||
Foreign currency transaction gain (loss) | 80 | (2,535 | ) | 2,900 | (8,809 | ) | ||||||||||
Non-operating income (loss) | (112 | ) | (43 | ) | 2,295 | (43 | ) | |||||||||
Total other expense | (18,473 | ) | (22,057 | ) | (67,848 | ) | (73,129 | ) | ||||||||
Income (loss) before taxes | 1,999 | (4,787 | ) | 3,015 | (25,325 | ) | ||||||||||
Income tax expense (benefit) | 14,193 | (365 | ) | 9,931 | (2,952 | ) | ||||||||||
Net loss | $ | (12,194 | ) | $ | (4,422 | ) | $ | (6,916 | ) | $ | (22,373 | ) | ||||
Basic loss per share | $ | (0.29 | ) | $ | (0.34 | ) | $ | (0.20 | ) | $ | (1.74 | ) | ||||
Diluted loss per share | $ | (0.29 | ) | $ | (0.34 | ) | $ | (0.20 | ) | $ | (1.74 | ) | ||||
Basic weighted average shares outstanding | 41,897,080 | 13,001,220 | 33,911,520 | 12,894,262 | ||||||||||||
Diluted weighted average shares outstanding | 41,897,080 | 13,001,220 | 33,911,520 | 12,894,262 | ||||||||||||
6
Elevate Credit, Inc. and Subsidiaries
Condensed Consolidated Balance Sheets
(dollars in thousands) | December 31, 2017 | December 31, 2016 | ||||||
(unaudited) | (audited) | |||||||
ASSETS | ||||||||
Cash and cash equivalents* | $ | 41,142 | $ | 53,574 | ||||
Restricted cash | 1,595 | 1,785 | ||||||
Loans receivable, net of allowance for loan losses of $87,946 and $77,451, respectively* | 524,619 | 392,663 | ||||||
Prepaid expenses and other assets* | 9,891 | 11,314 | ||||||
Receivable from CSO lenders | 22,811 | 26,053 | ||||||
Receivable from payment processors* | 21,126 | 19,105 | ||||||
Deferred tax assets, net | 23,619 | 31,197 | ||||||
Property and equipment, net | 24,249 | 16,159 | ||||||
Goodwill | 16,027 | 16,027 | ||||||
Intangible assets, net | 2,123 | 2,304 | ||||||
Total assets | $ | 687,202 | $ | 570,181 | ||||
LIABILITIES AND STOCKHOLDERS’ EQUITY | ||||||||
Accounts payable and accrued liabilities * | $ | 42,213 | $ | 31,390 | ||||
State and other taxes payable | 469 | 1,026 | ||||||
Deferred revenue | 33,023 | 28,970 | ||||||
Notes payable, net* | 513,295 | 493,478 | ||||||
Derivative liability | 1,972 | 1,750 | ||||||
Total liabilities | 590,972 | 556,614 | ||||||
COMMITMENTS, CONTINGENCIES AND GUARANTEES | ||||||||
STOCKHOLDERS’ EQUITY | ||||||||
Preferred stock | — | — | ||||||
Common stock | 17 | 5 | ||||||
Convertible preferred stock; Series A | — | 3 | ||||||
Convertible preferred stock; Series B | — | 3 | ||||||
Accumulated other comprehensive income | 2,077 | 1,087 | ||||||
Additional paid-in capital | 174,090 | 88,854 | ||||||
Accumulated deficit | (79,954 | ) | (76,385 | ) | ||||
Total stockholders’ equity | 96,230 | 13,567 | ||||||
Total liabilities and stockholders’ equity | $ | 687,202 | $ | 570,181 | ||||
* These balances include certain assets and liabilities of a variable interest entity (“VIE”) that can only be used to settle the liabilities of that VIE. All assets of the Company are pledged as security for the Company’s outstanding debt, including debt held by the VIE.
7
Non-GAAP Financial Measures
This press release and the attached financial tables contain certain non-GAAP financial measures, including Adjusted EBITDA, Adjusted EBITDA margin, combined loans receivable and combined loan loss reserve.
Adjusted EBITDA and Adjusted EBITDA margin
In addition to net income (loss) determined in accordance with GAAP, Elevate uses certain non-GAAP measures such as “Adjusted EBITDA” and "Adjusted EBITDA margin" in assessing its operating performance. Elevate believes these non-GAAP measures are appropriate measures to be used in evaluating the performance of its business.
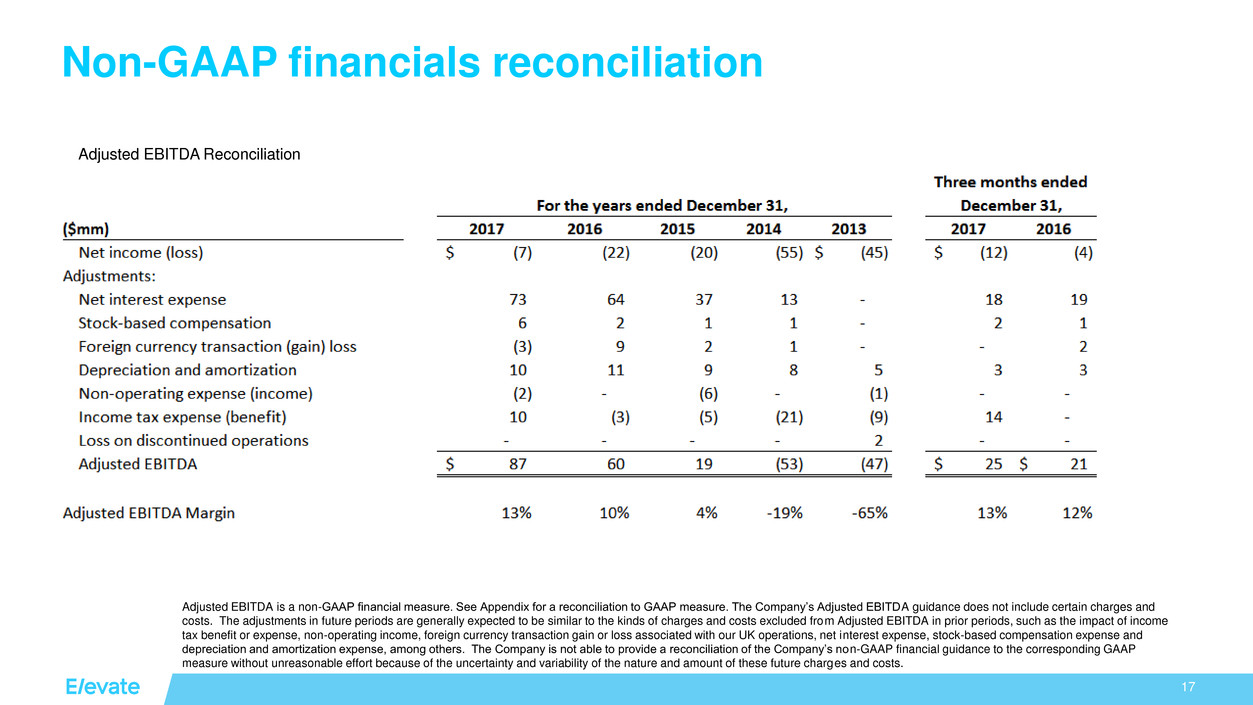
Elevate defines Adjusted EBITDA as net income (loss) excluding the impact of income tax benefit or expense, non-operating income or expense, foreign currency transaction gain or loss associated with our UK operations, net interest expense, stock-based compensation expense and depreciation and amortization expense. Elevate defines Adjusted EBITDA margin as Adjusted EBITDA divided by revenue.
Management believes that Adjusted EBITDA and Adjusted EBITDA margin are useful supplemental measures to assist management and investors in analyzing the operating performance of the business and provide greater transparency into the results of operations of our core business. Management uses this non-GAAP financial measure frequently in its decision-making because it provides supplemental information that facilitates internal comparisons to the historical operating performance of prior periods and gives an additional indication of Elevate’s core operating performance. Elevate includes this non-GAAP financial measure in its earnings announcement in order to provide transparency to its investors and enable investors to better compare its operating performance with the operating performance of its competitors.
Adjusted EBITDA and Adjusted EBITDA margin should not be considered as alternatives to net income (loss) or any other performance measure derived in accordance with GAAP. Management's use of Adjusted EBITDA and Adjusted EBITDA margin has limitations as an analytical tool, and investors should not consider it in isolation or as a substitute for analysis of the Company's results as reported under GAAP. Some of these limitations are:
• | Although depreciation and amortization are non-cash charges, the assets being depreciated and amortized may have to be replaced in the future, and Adjusted EBITDA does not reflect expected cash capital expenditure requirements for such replacements or for new capital assets; |
• | Adjusted EBITDA does not reflect changes in, or cash requirements for, the Company's working capital needs; and |
• | Adjusted EBITDA does not reflect interest associated with notes payable used for funding customer loans, for other corporate purposes or tax payments that may represent a reduction in cash available to the Company. |
Additionally, Elevate’s definition of Adjusted EBITDA may not be comparable to similarly titled measures reported by other companies.
The Company’s Adjusted EBITDA guidance does not include certain charges and costs. The adjustments in future periods are generally expected to be similar to the kinds of charges and costs excluded from Adjusted EBITDA in prior periods. The Company is not able to provide a reconciliation of the Company’s non-GAAP financial guidance to the corresponding GAAP measure without unreasonable effort because of the uncertainty and variability of the nature and amount of these future charges and costs.
8
The following table presents a reconciliation of Adjusted EBITDA and Adjusted EBITDA margin to Elevate’s net loss for the three and twelve months ended December 31, 2017 and 2016:
Three Months Ended December 31, | Years Ended December 31, | |||||||||||||||
(dollars in thousands) | 2017 | 2016 | 2017 | 2016 | ||||||||||||
Net loss | $ | (12,194 | ) | $ | (4,422 | ) | $ | (6,916 | ) | $ | (22,373 | ) | ||||
Adjustments: | ||||||||||||||||
Net interest expense | 18,441 | 19,479 | 73,043 | 64,277 | ||||||||||||
Stock-based compensation | 1,882 | 678 | 6,318 | 1,707 | ||||||||||||
Foreign currency transaction (gains) losses | (80 | ) | 2,535 | (2,900 | ) | 8,809 | ||||||||||
Depreciation and amortization | 2,615 | 2,623 | 10,272 | 10,906 | ||||||||||||
Non-operating (income) loss | 112 | 43 | (2,295 | ) | 43 | |||||||||||
Income tax expense (benefit) | 14,193 | (365 | ) | 9,931 | (2,952 | ) | ||||||||||
Adjusted EBITDA | $ | 24,969 | $ | 20,571 | $ | 87,453 | $ | 60,417 | ||||||||
Adjusted EBITDA margin | 12.9 | % | 12.2 | % | 13.0 | % | 10.4 | % | ||||||||
Adjusted net income (loss), adjusted diluted income (loss) per share and adjusted diluted weighted average shares outstanding
The Tax Cuts and Jobs Act was enacted on December 22, 2017. U.S. GAAP requires the remeasurement of all U.S. deferred income tax assets and liabilities for temporary differences from the current tax rate of 35% to the new corporate tax rate of 21%. The cumulative adjustment of $12.5 million was recognized in income tax expense in the current period, which includes the enactment date. The following table presents a reconciliation of net loss and diluted loss per share to adjusted net income (loss) and adjusted diluted income (loss) per share, which excludes the impact of the tax reform.
Three Months Ended December 31, | Years Ended December 31, | ||||||||||||||
(dollars in thousands except per share amounts) | 2017 | 2016 | 2017 | 2016 | |||||||||||
Net loss | $ | (12,194 | ) | $ | (4,422 | ) | $ | (6,916 | ) | $ | (22,373 | ) | |||
Impact of tax reform | 12,462 | — | 12,462 | — | |||||||||||
Adjusted net income (loss) | $ | 268 | $ | (4,422 | ) | $ | 5,546 | $ | (22,373 | ) | |||||
Diluted loss per share | $ | (0.29 | ) | $ | (0.34 | ) | $ | (0.20 | ) | $ | (1.74 | ) | |||
Impact of tax reform | 0.30 | — | 0.36 | — | |||||||||||
Adjusted diluted income (loss) per share | $ | 0.01 | $ | (0.34 | ) | $ | 0.16 | $ | (1.74 | ) | |||||
Diluted weighted average shares outstanding | 41,897,080 | 13,001,220 | 33,911,520 | 12,894,262 | |||||||||||
Effect of potentially dilutive shares outstanding(1) | 1,438,086 | — | 1,446,611 | — | |||||||||||
Adjusted diluted weighted average shares outstanding | 43,335,166 | 13,001,220 | 35,358,131 | 12,894,262 | |||||||||||
(1) Represents potentially dilutive shares that had not been included in the Company's quarter or year-ended December 31, 2017 diluted weighted average shares outstanding as the Company is in a net loss position under U.S. GAAP. Including these shares would have been anti-dilutive when in a net loss position.
9
Supplemental Schedules
10
Revenue by Product
Three Months Ended December 31, 2017 | ||||||||||||||||||||
(dollars in thousands) | Rise (US)(1) | Elastic (US) | Total Domestic | Sunny (UK) | Total | |||||||||||||||
Average combined loans receivable – principal(1) | $ | 301,941 | $ | 236,728 | $ | 538,669 | $ | 44,427 | $ | 583,096 | ||||||||||
Effective APR | 141 | % | 97 | % | 121 | % | 242 | % | 130 | % | ||||||||||
Finance charges | $ | 106,954 | $ | 57,751 | $ | 164,705 | $ | 27,046 | $ | 191,751 | ||||||||||
Other | 1,080 | 541 | 1,621 | 71 | 1,692 | |||||||||||||||
Total revenue | $ | 108,034 | $ | 58,292 | $ | 166,326 | $ | 27,117 | $ | 193,443 | ||||||||||
Three Months Ended December 31, 2016 | ||||||||||||||||||||
(dollars in thousands) | Rise (US)(1) | Elastic (US) | Total Domestic | Sunny (UK) | Total | |||||||||||||||
Average combined loans receivable – principal(1) | $ | 274,773 | $ | 155,553 | $ | 430,326 | $ | 45,060 | $ | 475,386 | ||||||||||
Effective APR | 152 | % | 96 | % | 132 | % | 226 | % | 141 | % | ||||||||||
Finance charges | $ | 105,142 | $ | 37,414 | $ | 142,556 | $ | 25,629 | $ | 168,185 | ||||||||||
Other | 390 | 444 | 834 | — | 834 | |||||||||||||||
Total revenue | $ | 105,532 | $ | 37,858 | $ | 143,390 | $ | 25,629 | $ | 169,019 | ||||||||||
(1) | Includes loans originated by third-party lenders through the CSO programs, which are not included in the Company's condensed consolidated financial statements. |
(2) | Average combined loans receivable - principal is calculated using daily principal balances. See the "Combined Loan Information" section for a reconciliation of this non-GAAP measure to the most comparable GAAP measure. |
11
Revenue by Product (continued)
Year Ended December 31, 2017 | ||||||||||||||||||||
(dollars in thousands) | Rise (US)(1) | Elastic (US) | Total Domestic | Sunny (UK) | Total | |||||||||||||||
Average combined loans receivable – principal(1) | $ | 261,101 | $ | 202,530 | $ | 463,631 | $ | 43,297 | $ | 506,928 | ||||||||||
Effective APR | 141 | % | 97 | % | 122 | % | 237 | % | 131 | % | ||||||||||
Finance charges | $ | 368,453 | $ | 195,592 | $ | 564,045 | $ | 102,509 | $ | 666,554 | ||||||||||
Other | 4,345 | 1,926 | 6,271 | 307 | 6,578 | |||||||||||||||
Total revenue | $ | 372,798 | $ | 197,518 | $ | 570,316 | $ | 102,816 | $ | 673,132 | ||||||||||
Year Ended December 31, 2016 | ||||||||||||||||||||
(dollars in thousands) | Rise (US)(1) | Elastic (US) | Total Domestic | Sunny (UK) | Total | |||||||||||||||
Average combined loans receivable – principal(1) | $ | 244,201 | $ | 109,892 | $ | 354,093 | $ | 41,123 | $ | 395,216 | ||||||||||
Effective APR | 156 | % | 91 | % | 136 | % | 233 | % | 146 | % | ||||||||||
Finance charges | $ | 382,163 | $ | 100,276 | $ | 482,439 | $ | 95,978 | $ | 578,417 | ||||||||||
Other | 572 | 1,451 | 2,023 | 1 | 2,024 | |||||||||||||||
Total revenue | $ | 382,735 | $ | 101,727 | $ | 484,462 | $ | 95,979 | $ | 580,441 | ||||||||||
(1) | Includes loans originated by third-party lenders through the CSO programs, which are not included in the Company's condensed consolidated financial statements. |
(2) | Average combined loans receivable - principal is calculated using daily principal balances. See the "Combined Loan Information" section for a reconciliation of this non-GAAP measure to the most comparable GAAP measure. |
12
Loan Loss Reserve by Product
Three Months Ended December 31, 2017 | ||||||||||||||||||||
(dollars in thousands) | Rise (US) | Elastic (US) | Total Domestic | Sunny (UK) | Total | |||||||||||||||
Combined loan loss reserve(1): | ||||||||||||||||||||
Beginning balance | $ | 49,756 | $ | 27,802 | $ | 77,558 | $ | 8,511 | $ | 86,069 | ||||||||||
Net charge-offs | (60,024 | ) | (30,653 | ) | (90,677 | ) | (7,941 | ) | (98,618 | ) | ||||||||||
Provision for loan losses | 66,135 | 31,721 | 97,856 | 8,425 | 106,281 | |||||||||||||||
Effect of foreign currency | — | — | — | 57 | 57 | |||||||||||||||
Ending balance | $ | 55,867 | $ | 28,870 | $ | 84,737 | $ | 9,052 | $ | 93,789 | ||||||||||
Combined loans receivable(1)(2) | $ | 342,652 | $ | 261,222 | $ | 603,874 | $ | 54,156 | $ | 658,030 | ||||||||||
Combined loan loss reserve as a percentage of ending combined loans receivable | 16 | % | 11 | % | 14 | % | 17 | % | 14 | % | ||||||||||
Net charge-offs as a percentage of revenues | 56 | % | 53 | % | 55 | % | 29 | % | 51 | % | ||||||||||
Provision for loan losses as a percentage of revenues | 61 | % | 54 | % | 59 | % | 31 | % | 55 | % | ||||||||||
Three Months Ended December 31, 2016 | ||||||||||||||||||||
(dollars in thousands) | Rise (US) | Elastic (US) | Total Domestic | Sunny (UK) | Total | |||||||||||||||
Combined loan loss reserve(1): | ||||||||||||||||||||
Beginning balance | $ | 53,931 | $ | 16,652 | $ | 70,583 | $ | 8,302 | $ | 78,885 | ||||||||||
Net charge-offs | (66,870 | ) | (19,512 | ) | (86,382 | ) | (10,030 | ) | (96,412 | ) | ||||||||||
Provision for loan losses | 66,275 | 22,249 | 88,524 | 11,792 | 100,316 | |||||||||||||||
Effect of foreign currency | — | — | — | (413 | ) | (413 | ) | |||||||||||||
Ending balance | $ | 53,336 | $ | 19,389 | $ | 72,725 | $ | 9,651 | $ | 82,376 | ||||||||||
Combined loans receivable(1)(2) | $ | 289,348 | $ | 174,574 | $ | 463,922 | $ | 46,690 | $ | 510,612 | ||||||||||
Combined loan loss reserve as a percentage of ending combined loans receivable | 18 | % | 11 | % | 16 | % | 21 | % | 16 | % | ||||||||||
Net charge-offs as a percentage of revenues | 63 | % | 52 | % | 60 | % | 39 | % | 57 | % | ||||||||||
Provision for loan losses as a percentage of revenues | 63 | % | 59 | % | 62 | % | 46 | % | 59 | % | ||||||||||
(1) Not a financial measure prepared in accordance with GAAP. See the "Combined Loan Information" section for a reconciliation of this non-GAAP measure to the most comparable GAAP measure.
(2) Includes loans originated by third-party lenders through the CSO programs, which are not included in the Company's consolidated financial statements.
13
Loan Loss Reserve by Product (continued)
Year Ended December 31, 2017 | ||||||||||||||||||||
(dollars in thousands) | Rise (US) | Elastic (US) | Total Domestic | Sunny (UK) | Total | |||||||||||||||
Combined loan loss reserve(1): | ||||||||||||||||||||
Beginning balance | $ | 53,336 | $ | 19,389 | $ | 72,725 | $ | 9,651 | $ | 82,376 | ||||||||||
Net charge-offs | (209,533 | ) | (99,283 | ) | (308,816 | ) | (38,194 | ) | (347,010 | ) | ||||||||||
Provision for loan losses | 212,064 | 108,764 | 320,828 | 36,746 | 357,574 | |||||||||||||||
Effect of foreign currency | — | — | — | 849 | 849 | |||||||||||||||
Ending balance | $ | 55,867 | $ | 28,870 | $ | 84,737 | $ | 9,052 | $ | 93,789 | ||||||||||
Combined loans receivable(1)(2) | $ | 342,652 | $ | 261,222 | $ | 603,874 | $ | 54,156 | $ | 658,030 | ||||||||||
Combined loan loss reserve as a percentage of ending combined loans receivable | 16 | % | 11 | % | 14 | % | 17 | % | 14 | % | ||||||||||
Net charge-offs as a percentage of revenues | 56 | % | 50 | % | 54 | % | 37 | % | 52 | % | ||||||||||
Provision for loan losses as a percentage of revenues | 57 | % | 55 | % | 56 | % | 36 | % | 53 | % | ||||||||||
Year Ended December 31, 2016 | ||||||||||||||||||||
(dollars in thousands) | Rise (US) | Elastic (US) | Total Domestic | Sunny (UK) | Total | |||||||||||||||
Combined loan loss reserve(1): | ||||||||||||||||||||
Beginning balance | $ | 46,635 | $ | 10,016 | $ | 56,651 | $ | 9,133 | $ | 65,784 | ||||||||||
Net charge-offs | (214,328 | ) | (49,089 | ) | (263,417 | ) | (36,283 | ) | (299,700 | ) | ||||||||||
Provision for loan losses | 221,029 | 58,462 | 279,491 | 38,330 | 317,821 | |||||||||||||||
Effect of foreign currency | — | — | — | (1,529 | ) | (1,529 | ) | |||||||||||||
Ending balance | $ | 53,336 | $ | 19,389 | $ | 72,725 | $ | 9,651 | $ | 82,376 | ||||||||||
Combined loans receivable(1)(2) | $ | 289,348 | $ | 174,574 | $ | 463,922 | $ | 46,690 | $ | 510,612 | ||||||||||
Combined loan loss reserve as a percentage of ending combined loans receivable | 18 | % | 11 | % | 16 | % | 21 | % | 16 | % | ||||||||||
Net charge-offs as a percentage of revenues | 56 | % | 48 | % | 54 | % | 38 | % | 52 | % | ||||||||||
Provision for loan losses as a percentage of revenues | 58 | % | 57 | % | 58 | % | 40 | % | 55 | % | ||||||||||
(1) Not a financial measure prepared in accordance with GAAP. See the "Combined Loan Information" section for a reconciliation of this non-GAAP measure to the most comparable GAAP measure.
(2) Includes loans originated by third-party lenders through the CSO programs, which are not included in the Company's consolidated financial statements.
14
Customer Loan Data by Product
Three Months Ended December 31, 2017 | ||||||||||||||||||||
Rise (US) | Elastic (US) | Total Domestic | Sunny (UK) | Total | ||||||||||||||||
Beginning number of combined loans outstanding | 123,978 | 126,677 | 250,655 | 74,924 | 325,579 | |||||||||||||||
New customer loans originated | 41,856 | 30,986 | 72,842 | 21,822 | 94,664 | |||||||||||||||
Former customer loans originated | 18,871 | — | 18,871 | — | 18,871 | |||||||||||||||
Attrition | (43,915 | ) | (16,991 | ) | (60,906 | ) | (16,236 | ) | (77,142 | ) | ||||||||||
Ending number of combined loans outstanding | 140,790 | 140,672 | 281,462 | 80,510 | 361,972 | |||||||||||||||
Customer acquisition cost | $ | 243 | $ | 222 | $ | 234 | $ | 223 | $ | 231 | ||||||||||
Average customer loan balance | $ | 2,276 | $ | 1,784 | $ | 2,030 | $ | 584 | $ | 1,708 | ||||||||||
Three Months Ended December 31, 2016 | ||||||||||||||||||||
Rise (US) | Elastic (US) | Total Domestic | Sunny (UK) | Total | ||||||||||||||||
Beginning number of combined loans outstanding | 129,524 | 75,191 | 204,715 | 76,475 | 281,190 | |||||||||||||||
New customer loans originated | 23,481 | 25,336 | 48,817 | 21,503 | 70,320 | |||||||||||||||
Former customer loans originated | 17,867 | 2 | 17,869 | — | 17,869 | |||||||||||||||
Attrition | (48,876 | ) | (11,376 | ) | (60,252 | ) | (19,934 | ) | (80,186 | ) | ||||||||||
Ending number of combined loans outstanding | 121,996 | 89,153 | 211,149 | 78,044 | 289,193 | |||||||||||||||
Customer acquisition cost | $ | 263 | $ | 167 | $ | 213 | $ | 213 | $ | 213 | ||||||||||
Average customer loan balance | $ | 2,196 | $ | 1,909 | $ | 2,075 | $ | 551 | $ | 1,664 | ||||||||||
15
Customer Loan Data by Product (continued)
Year Ended December 31, 2017 | ||||||||||||||||||||
Rise (US) | Elastic (US) | Total Domestic | Sunny (UK) | Total | ||||||||||||||||
Beginning number of combined loans outstanding | 121,996 | 89,153 | 211,149 | 78,044 | 289,193 | |||||||||||||||
New customer loans originated | 116,030 | 110,145 | 226,175 | 79,011 | 305,186 | |||||||||||||||
Former customer loans originated | 71,109 | — | 71,109 | — | 71,109 | |||||||||||||||
Attrition | (168,345 | ) | (58,626 | ) | (226,971 | ) | (76,545 | ) | (303,516 | ) | ||||||||||
Ending number of combined loans outstanding | 140,790 | 140,672 | 281,462 | 80,510 | 361,972 | |||||||||||||||
Customer acquisition cost | $ | 281 | $ | 182 | $ | 233 | $ | 249 | $ | 237 | ||||||||||
Average customer loan balance | $ | 2,276 | $ | 1,784 | $ | 2,030 | $ | 584 | $ | 1,708 | ||||||||||
Year Ended December 31, 2016 | ||||||||||||||||||||
Rise (US) | Elastic (US) | Total Domestic | Sunny (UK) | Total | ||||||||||||||||
Beginning number of combined loans outstanding | 118,222 | 36,487 | 154,709 | 68,014 | 222,723 | |||||||||||||||
New customer loans originated | 109,686 | 82,880 | 192,566 | 85,071 | 277,637 | |||||||||||||||
Former customer loans originated | 81,174 | 112 | 81,286 | — | 81,286 | |||||||||||||||
Attrition | (187,086 | ) | (30,326 | ) | (217,412 | ) | (75,041 | ) | (292,453 | ) | ||||||||||
Ending number of combined loans outstanding | 121,996 | 89,153 | 211,149 | 78,044 | 289,193 | |||||||||||||||
Customer acquisition cost | $ | 278 | $ | 152 | $ | 224 | $ | 259 | $ | 235 | ||||||||||
Average customer loan balance | $ | 2,196 | $ | 1,909 | $ | 2,075 | $ | 551 | $ | 1,664 | ||||||||||
16
Combined Loan Information
The Elastic line of credit product is originated by a third party lender, Republic Bank, which initially provides all of the funding for that product. Republic Bank retains 10% of the balances of all of the loans originated and sells a 90% loan participation in the Elastic lines of credit to a third party SPV, Elastic SPV, Ltd. Elevate is required to consolidate Elastic SPV, Ltd. as a variable interest entity under GAAP and the consolidated financial statements include revenue, losses and loans receivable related to the 90% of Elastic lines of credit originated by Republic Bank and sold to Elastic SPV, Ltd.
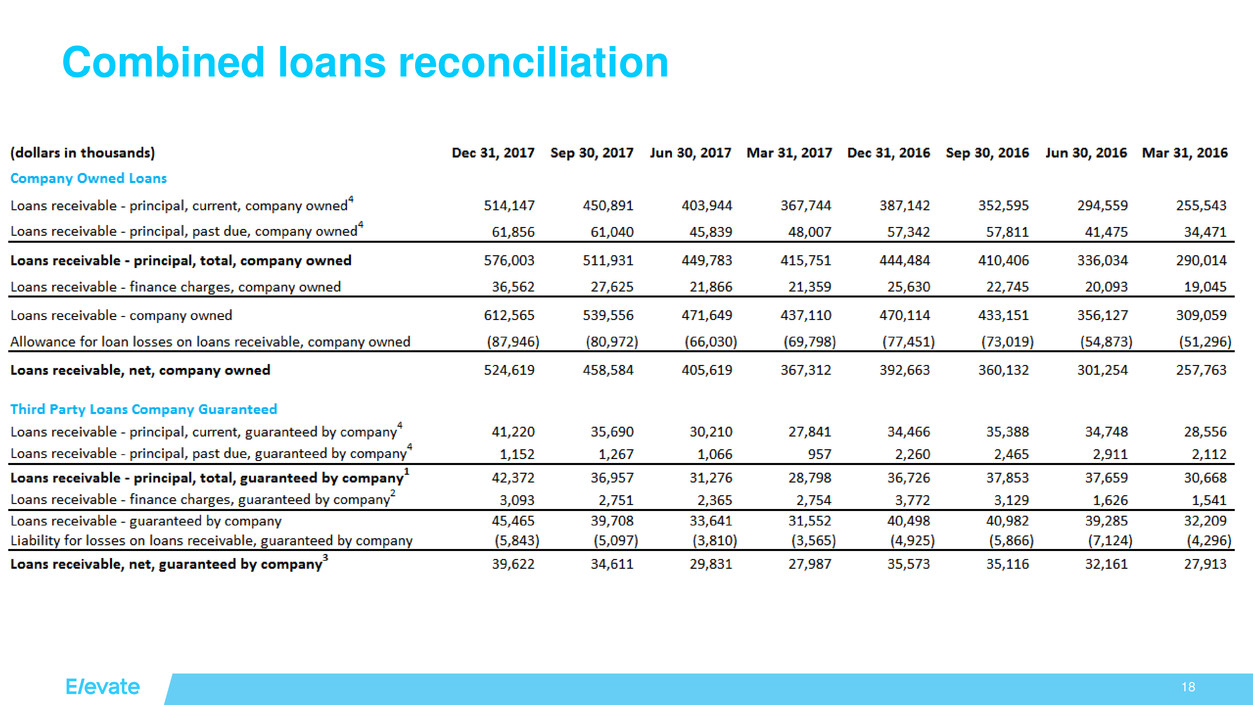
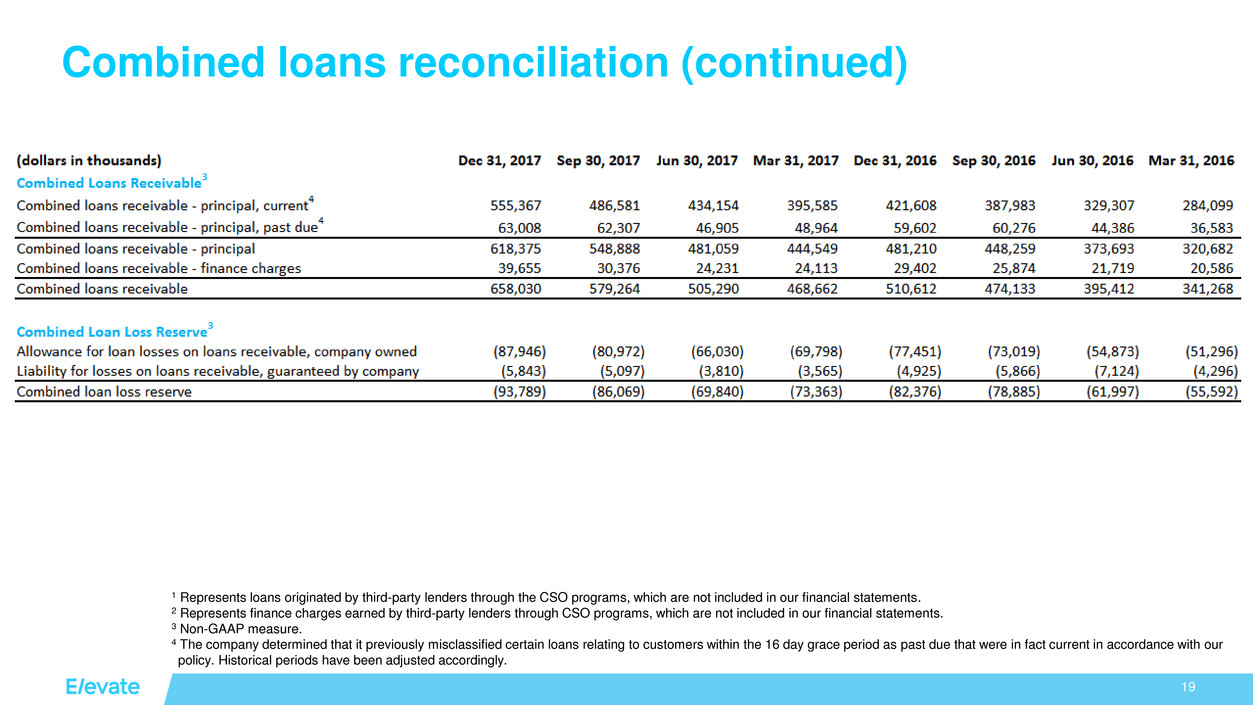
Elevate defines combined loans receivable - principal as loans owned by the Company plus loans originated and owned by third-party lenders pursuant to our CSO programs. In Texas and Ohio, the Company does not make Rise loans directly, but rather act as a Credit Services Organization (which is also known as a Credit Access Business in Texas), or, collectively, “CSO,” and the loans are originated by an unaffiliated third party. Elevate defines combined loan loss reserve as the loan loss reserve for loans owned by the Company plus the loan loss reserve for loans originated and owned by third-party lenders and guaranteed by the Company. The information presented in the tables below on a combined basis are non-GAAP measures based on a combined portfolio of loans, which includes the total amount of outstanding loans receivable that the Company owns and that are on the Company's consolidated balance sheets plus outstanding loans receivable originated and owned by third parties that the Company guarantees pursuant to CSO programs in which the Company participates.
The Company believes these non-GAAP measures provide investors with important information needed to evaluate the magnitude of potential loan losses and the opportunity for revenue performance of the combined loan portfolio on an aggregate basis. The Company also believes that the comparison of the combined amounts from period to period is more meaningful than comparing only the amounts reflected on the Company's consolidated balance sheets since both revenues and cost of sales as reflected in the Company's consolidated financial statements are impacted by the aggregate amount of loans the Company owns and those CSO loans the Company guarantees.
The Company's use of total combined loans and fees receivable has limitations as an analytical tool, and investors should not consider it in isolation or as a substitute for analysis of the Company's results as reported under GAAP. Some of these limitations are:
• | Rise CSO loans are originated and owned by a third party lender; and |
• | Rise CSO loans are funded by a third party lender and are not part of the VPC Facility. |
As of each of the period ends indicated, the following table presents a reconciliation of:
• | Loans receivable, net, Company owned (which reconciles to the Company's consolidated balance sheets included elsewhere in this press release); |
• | Loans receivable, net, guaranteed by the Company; |
• | Combined loans receivable (which the Company uses as a non-GAAP measure); and |
• | Combined loan loss reserve (which the Company uses as a non-GAAP measure). |
17
2016 | 2017 | |||||||||||||||||||||||||||||||
(dollars in thousands) | Mar 31 | Jun 30 | Sep 30 | Dec 31 | Mar 31 | Jun 30 | Sep 30 | Dec 31 | ||||||||||||||||||||||||
Company Owned Loans: | ||||||||||||||||||||||||||||||||
Loans receivable – principal, current, company owned(4) | $ | 255,543 | $ | 294,559 | $ | 352,595 | $ | 387,142 | $ | 367,744 | $ | 403,944 | $ | 450,891 | $ | 514,147 | ||||||||||||||||
Loans receivable – principal, past due, company owned(4) | 34,471 | 41,475 | 57,811 | 57,342 | 48,007 | 45,839 | 61,040 | 61,856 | ||||||||||||||||||||||||
Loans receivable – principal, total, company owned | 290,014 | 336,034 | 410,406 | 444,484 | 415,751 | 449,783 | 511,931 | 576,003 | ||||||||||||||||||||||||
Loans receivable – finance charges, company owned | 19,045 | 20,093 | 22,745 | 25,630 | 21,359 | 21,866 | 27,625 | 36,562 | ||||||||||||||||||||||||
Loans receivable – company owned | 309,059 | 356,127 | 433,151 | 470,114 | 437,110 | 471,649 | 539,556 | 612,565 | ||||||||||||||||||||||||
Allowance for loan losses on loans receivable, company owned | (51,296 | ) | (54,873 | ) | (73,019 | ) | (77,451 | ) | (69,798 | ) | (66,030 | ) | (80,972 | ) | (87,946 | ) | ||||||||||||||||
Loans receivable, net, company owned | $ | 257,763 | $ | 301,254 | $ | 360,132 | $ | 392,663 | $ | 367,312 | $ | 405,619 | $ | 458,584 | $ | 524,619 | ||||||||||||||||
Third Party Loans Guaranteed by the Company: | ||||||||||||||||||||||||||||||||
Loans receivable – principal, current, guaranteed by company(4) | $ | 28,556 | $ | 34,748 | $ | 35,388 | $ | 34,466 | $ | 27,841 | $ | 30,210 | $ | 35,690 | $ | 41,220 | ||||||||||||||||
Loans receivable – principal, past due, guaranteed by company(4) | 2,112 | 2,911 | 2,465 | 2,260 | 957 | 1,066 | 1,267 | 1,152 | ||||||||||||||||||||||||
Loans receivable – principal, total, guaranteed by company(1) | 30,668 | 37,659 | 37,853 | 36,726 | 28,798 | 31,276 | 36,957 | 42,372 | ||||||||||||||||||||||||
Loans receivable – finance charges, guaranteed by company(2) | 1,541 | 1,626 | 3,129 | 3,772 | 2,754 | 2,365 | 2,751 | 3,093 | ||||||||||||||||||||||||
Loans receivable – guaranteed by company | 32,209 | 39,285 | 40,982 | 40,498 | 31,552 | 33,641 | 39,708 | 45,465 | ||||||||||||||||||||||||
Liability for losses on loans receivable, guaranteed by company | (4,296 | ) | (7,124 | ) | (5,866 | ) | (4,925 | ) | (3,565 | ) | (3,810 | ) | (5,097 | ) | (5,843 | ) | ||||||||||||||||
Loans receivable, net, guaranteed by company(3) | $ | 27,913 | $ | 32,161 | $ | 35,116 | $ | 35,573 | $ | 27,987 | $ | 29,831 | $ | 34,611 | $ | 39,622 | ||||||||||||||||
Combined Loans Receivable(3): | ||||||||||||||||||||||||||||||||
Combined loans receivable – principal, current(4) | $ | 284,099 | $ | 329,307 | $ | 387,983 | $ | 421,608 | $ | 395,585 | $ | 434,154 | $ | 486,581 | $ | 555,367 | ||||||||||||||||
Combined loans receivable – principal, past due(4) | 36,583 | 44,386 | 60,276 | 59,602 | 48,964 | 46,905 | 62,307 | 63,008 | ||||||||||||||||||||||||
Combined loans receivable – principal | 320,682 | 373,693 | 448,259 | 481,210 | 444,549 | 481,059 | 548,888 | 618,375 | ||||||||||||||||||||||||
Combined loans receivable – finance charges | 20,586 | 21,719 | 25,874 | 29,402 | 24,113 | 24,231 | 30,376 | 39,655 | ||||||||||||||||||||||||
Combined loans receivable | $ | 341,268 | $ | 395,412 | $ | 474,133 | $ | 510,612 | $ | 468,662 | $ | 505,290 | $ | 579,264 | $ | 658,030 | ||||||||||||||||
18
2016 | 2017 | |||||||||||||||||||||||||||||||
(dollars in thousands) | Mar 31 | Jun 30 | Sep 30 | Dec 31 | Mar 31 | Jun 30 | Sep 30 | Dec 31 | ||||||||||||||||||||||||
Combined Loan Loss Reserve(3): | ||||||||||||||||||||||||||||||||
Allowance for loan losses on loans receivable, company owned | $ | (51,296 | ) | $ | (54,873 | ) | $ | (73,019 | ) | $ | (77,451 | ) | $ | (69,798 | ) | $ | (66,030 | ) | $ | (80,972 | ) | $ | (87,946 | ) | ||||||||
Liability for losses on loans receivable, guaranteed by company | (4,296 | ) | (7,124 | ) | (5,866 | ) | (4,925 | ) | (3,565 | ) | (3,810 | ) | (5,097 | ) | (5,843 | ) | ||||||||||||||||
Combined loan loss reserve | $ | (55,592 | ) | $ | (61,997 | ) | $ | (78,885 | ) | $ | (82,376 | ) | $ | (73,363 | ) | $ | (69,840 | ) | $ | (86,069 | ) | $ | (93,789 | ) | ||||||||
(1) Represents loans originated by third-party lenders through the CSO programs, which are not included in the Company's consolidated financial statements.
(2) Represents finance charges earned by third-party lenders through the CSO programs, which are not included in the Company's consolidated financial statements.
(3) Non-GAAP measure.
(4) Certain amounts in the prior periods presented here have been reclassified to conform to the current period financial statement presentation related to customers within the 16 day grace period that were reported as past due that were in fact current in accordance with the Company's policy.
# # #
19

Q4 and Full Year 2017 Earnings Call
February 2018
2
Forward-Looking Statements
This presentation and responses to various questions contain forward-looking statements within the meaning of Section 27A of the Securities Act of 1933, as amended, and Section 21E of the Securities
Exchange Act of 1934, as amended. The forward-looking statements present our current expectations and projections relating to our business, financial condition and results of operations, and do not
refer to historical or current facts. These statements may include words such as “anticipate,” “estimate,” “expect,” “project,” “plan,” “intend,” “believe,” “may,” “will,” “should,” “likely” and other words and
terms of similar meaning. The forward-looking statements include statements regarding: our future financial performance including our outlook for full fiscal year 2018; our perspectives on 2018, including
our expectations regarding revenue, growth rate of revenue, net charge-offs, gross margin, operating expenses, operating margins, Adjusted EBITDA, net income, loan loss provision, direct marketing
and other cost of sales and Adjusted EBITDA margin; our expectations regarding regulatory trends; our expectations regarding the cumulative loss rate as a percentage of originations for the 2017
vintage; our growth strategies and our ability to effectively manage that growth; anticipated key marketing and underwriting initiatives; new and expanded products like a US credit card and power-priced
installment product in the UK; our expectations regarding the future expansion of the states in which our products are offered; the cost of customer acquisition, the efficacy and cost of our marketing
efforts, including in the first quarter of 2018; expanded marketing channels and new and growing marketing partnerships; continued growth and investment in Elevate Labs; and additional bank
partnerships. Forward‐looking statements involve certain risks and uncertainties, and actual results may differ materially from those discussed in any such statement. These risks and uncertainties
include, but are not limited to: the Company’s limited operating history in an evolving industry; new laws and regulations in the consumer lending industry in many jurisdictions that could restrict the
consumer lending products and services the Company offers, impose additional compliance costs on the Company, render the Company’s current operations unprofitable or even prohibit the Company’s
current operations; scrutiny by regulators and payment processors of certain online lenders’ access to the Automated Clearing House system to disburse and collect loan proceeds and repayments; a lack
of sufficient debt financing at acceptable prices or disruptions in the credit markets; the impact of competition in our industry and innovation by our competitors; our ability to prevent security breaches,
disruption in service and comparable events that could compromise the personal and confidential information held in our data systems, reduce the attractiveness of our platform or adversely impact our
ability to service loans; and other risks related to litigation, compliance and regulation. Additional factors that could cause actual results to differ are discussed under the heading "Risk Factors" and in
other sections of the most recent Quarterly Report on Form 10-Q and in the Company's other current and periodic reports filed from time to time with the SEC. All written and oral forward-looking
statements attributable to us, or persons acting on our behalf, are expressly qualified in their entirety by the cautionary statements regarding risks and uncertainties that are included in our public
communications. You should evaluate all forward-looking statements made in this presentation in the context of these risks and uncertainties. Neither we nor any of our respective agents, employees or
advisors intend or have any duty or obligation to supplement, amend, update or revise any of the forward-looking statements contained in this presentation.
This presentation also contains estimates and other statistical data made by independent parties and by us relating to market size and growth and other data about our industry. This data involves a
number of assumptions and limitations, and you are cautioned not to give undue weight to such estimates. Neither we nor any other person makes any representation as to the accuracy or completeness
of such data or undertakes any obligation to update such data after the date of this presentation. In addition, projections, assumptions and estimates of our future performance and the future performance
of the markets in which we operate are necessarily subject to a high degree of uncertainty and risk.
The information and opinions contained in this presentation are provided as of the date of this presentation and are subject to change without notice. This presentation has not been approved by any
regulatory or supervisory agency.
See Appendix for additional information and definitions.

3 3
Elevate is reinventing
non-prime credit with
online products that provide
financial relief today, and
help people build a brighter
financial future.
So far, we’ve originated
$5.2 billion to 1.9 million
customers1 and saved
them more than $2 billion
over payday loans2
4
Elevate key performance highlights
Adjusted EBITDA, Adjusted EBITDA margin and combined loans receivable – principal are non-GAAP financial measures. See Appendix for a reconciliation to GAAP measures.
Elevate Goals
FY 2017 Performance
Highlights
Q4 2017 Performance
Highlights
Strong Growth
16% revenue growth YOY
1
28% combined loans receivable –
principal growth YOY
2
45% growth in Adjusted EBITDA YOY
3
14.5% revenue growth QOQ
1
28% combined loans receivable –
principal growth YOY
2
21% growth in Adjusted EBITDA YOY
3
Expanding
Margins
13% Adjusted EBITDA margin3
260 basis point expansion YOY
13% Adjusted EBITDA margin3
70 basis point expansion YOY
Stable Credit
Quality
Continued performance in target range
Charge-offs trending below previous years
Continued performance in target range
Managed CAC $237 – below target
$231 – below target
35% more customers acquired than 2016
Outsized
Customer Impact
140,000 customers improved credit score4
Continued reduction in avg. effective APR
Continued reduction in avg. effective APR
5
Recent Business Highlights
Sunny generates over $100 million in annual revenue
Profitability of UK Business continues
Elastic line of credit surpasses $1 billion in total funding
Still our fastest growing product
RISE surpasses $300 million in combined loans receivable – principal
Served more than 500,000 customers since inception
Bradley Strock Joins Board of Directors
PayPal CIO
Brian Biglin announced as Chief Credit Officer
Former PayPal, LoanDepot, Intuit exec joins team
Combined loans receivable - principal is a non-GAAP financial measure. See appendix for a reconciliation to GAAP measure
6
Key Marketing and Underwriting Initiatives
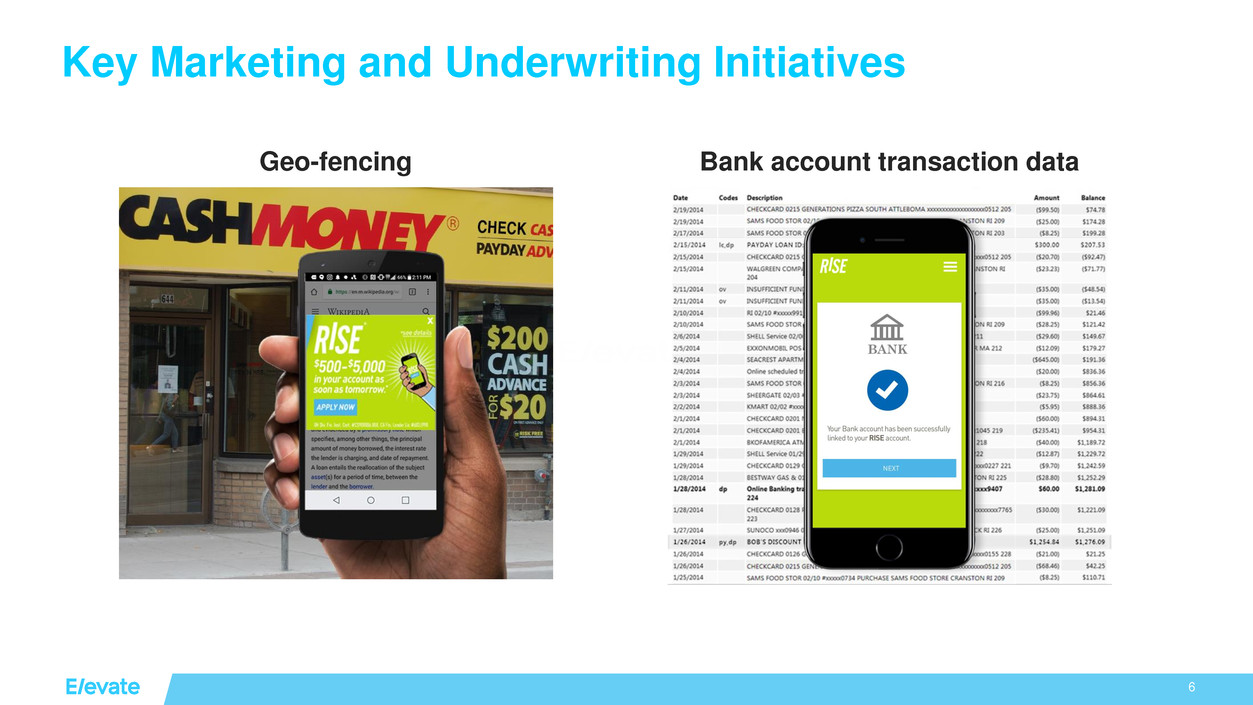
Geo-fencing Bank account transaction data
7
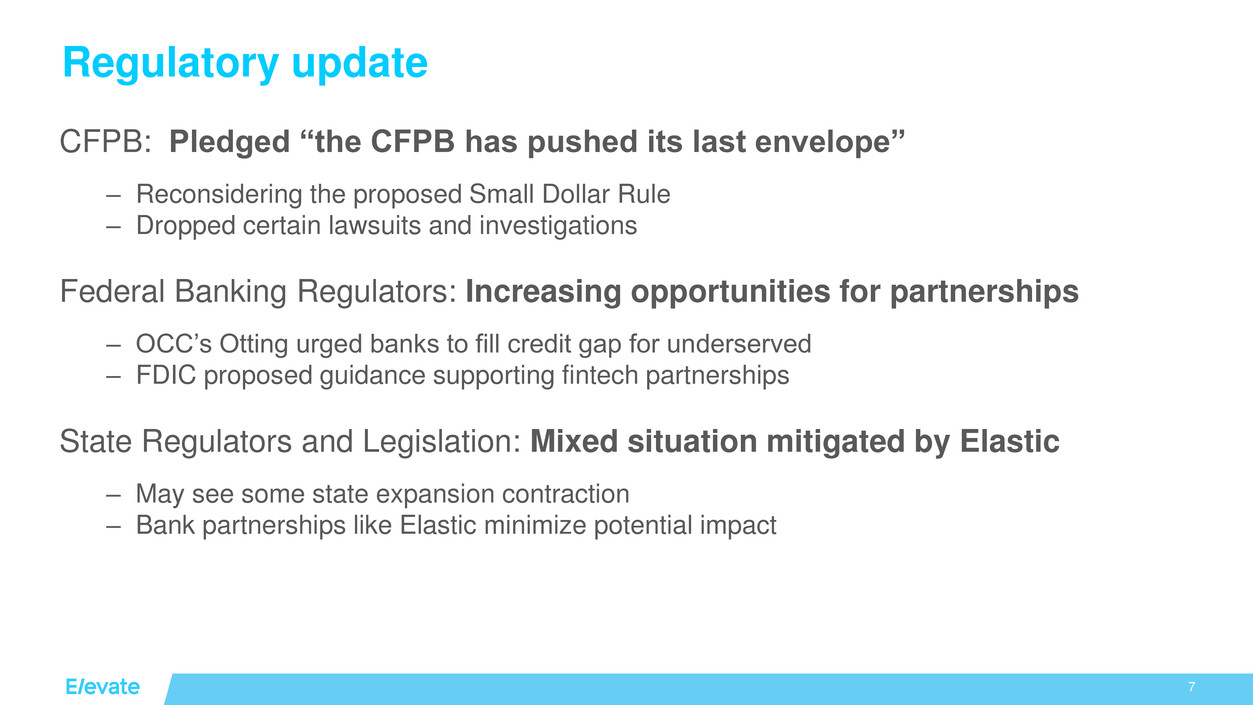
Regulatory update
CFPB: Pledged “the CFPB has pushed its last envelope”
– Reconsidering the proposed Small Dollar Rule
– Dropped certain lawsuits and investigations
Federal Banking Regulators: Increasing opportunities for partnerships
– OCC’s Otting urged banks to fill credit gap for underserved
– FDIC proposed guidance supporting fintech partnerships
State Regulators and Legislation: Mixed situation mitigated by Elastic
– May see some state expansion contraction
– Bank partnerships like Elastic minimize potential impact
8
$73
$202
$356
$481
$618
2013 2014 2015 2016 2017
($47) ($52)
$19
$60
$87
$120-$150
2013 2014 2015 2016 2017 2018E
$72
$274
$434
$580
$673
$780-$820
2013 2014 2015 2016 2017 2018E
Revenue
Adjusted EBITDA3
+280%
+59%
+34%
+16%
+223%
Growth in key financial measures ($mm)
+45%
Ending combined loans receivable – principal, Adjusted EBITDA and Adjusted Net Income (Loss) are non-GAAP financial measures. See appendix for a reconciliation to a GAAP measure.
Net Income / (Loss) 5
YTD
$480
+19%
2
+55%
4
($43)
($55)
($20) ($22)
$6
$20-$45
2013 2014 2015 2016 2017 2018E
(As
adjusted5)
Ending Combined Loans
Receivables - Principal
1
+177%
+77%
+35%
+28%
>3x
9
Cumulative loss rates as a % of originations by loan vintage
Consistent and improving credit quality
The 2017 vintage is not yet fully mature from a loss perspective – expected to be slightly better than 2016.
10
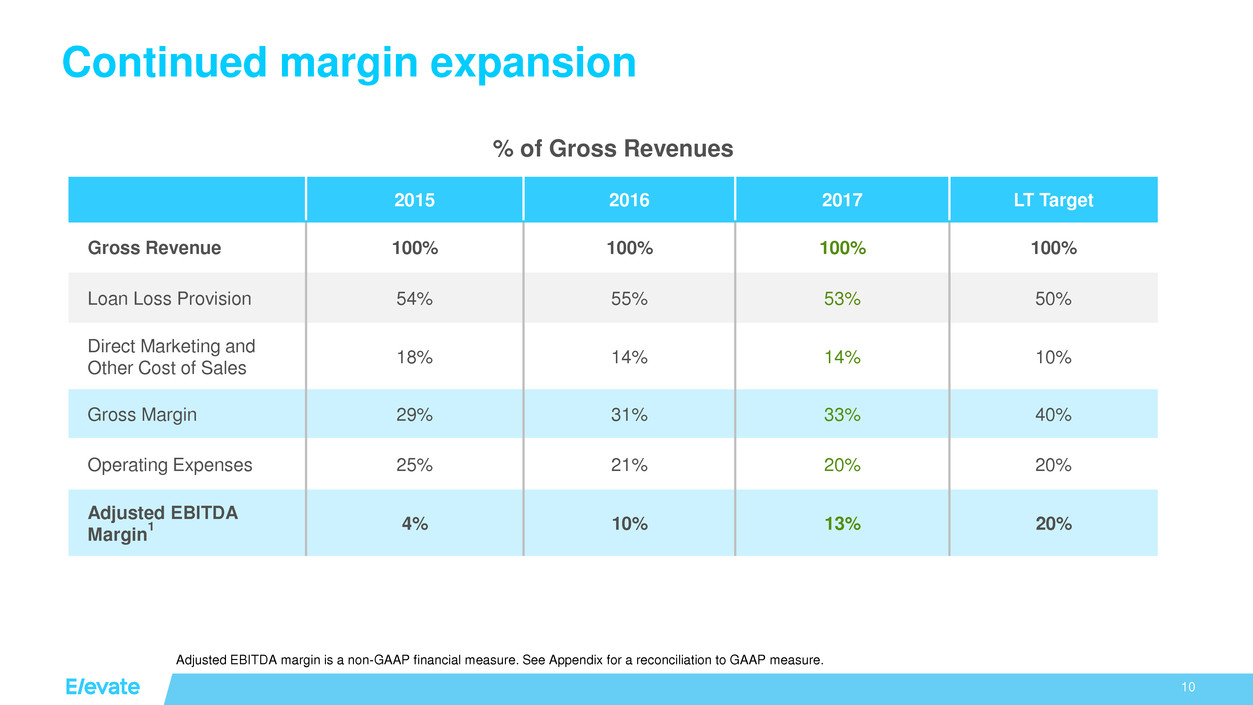
Continued margin expansion
Adjusted EBITDA margin is a non-GAAP financial measure. See Appendix for a reconciliation to GAAP measure.
2015 2016 2017 LT Target
Gross Revenue 100% 100% 100% 100%
Loan Loss Provision 54% 55% 53% 50%
Direct Marketing and
Other Cost of Sales
18% 14% 14% 10%
Gross Margin 29% 31% 33% 40%
Operating Expenses 25% 21% 20% 20%
Adjusted EBITDA
Margin
1 4% 10% 13% 20%
% of Gross Revenues
11
2018 Outlook
Revenue = $780mm - $820mm
Diluted EPS= $0.50 - $1.05
Net Income = $20mm - $45mm
Adjusted EBITDA1 = $120mm - $150mm
Accelerating revenue growth based on
strong demand and Q4 2017 momentum
Perspective on 2018 Annual guidance
Adjusted EBITDA is a non-GAAP financial measure. See appendix for a reconciliation to GAAP measures.
Full year margin expansion as the model
continues to scale
Continued stable credit quality
CAC within range of $250 - $300
12
Key business focus areas for 2018
Expanded Marketing Channels
New and growing marketing partnerships
Scaling of digital campaigns
Risk Innovation
Continued growth and investment in Elevate Labs
Building on recent credit score successes
Additional Bank Partnerships
New and Expanded Products
US credit card, lower-priced installment product in UK
Additional states for RISE

13 13
We believe
everyone
deserves
a lift.

14
Appendix
15
Footnotes
Page 3:
1 Originations and customers from 2002-December 2017, attributable to the combined current and predecessor direct and branded products.
2 For the period from 2013 to 2017. Based on the average effective APR of 131% for the year ended December 31, 2017. This estimate, which has not been independently confirmed, is based on our
internal comparison of revenues from our combined loan portfolio and the same portfolio with an APR of 400%, which is the approximate average APR for a payday loan according to the Consumer
Financial Protection Bureau, or the "CFPB."
Page 4:
1 Fourth quarter 2017 revenue of $193 million and fourth quarter 2016 revenue of $169 million. FY 2017 revenue of $673 million and FY 2016 revenue of $580 million.
2 Combined loans receivable – principal at December 31, 2017 of $618 million and at December 31, 2016 of $481 million. Combined loans receivable - principal is not a financial measure prepared in
accordance with GAAP. Combined loans receivable – principal represents loans owned by the company plus loans originated and owned by third-party lenders pursuant to our CSO programs.
3 Fourth quarter 2017 Adjusted EBITDA of $25 million and fourth quarter 2016 Adjusted EBITDA of $21 million. FY 2017 Adjusted EBITDA of $87 million and FY 2016 Adjusted EBITDA of $60 million.
Adjusted EBITDA is not a financial measure prepared in accordance with GAAP. Adjusted EBITDA represents our net loss, adjusted to exclude: net interest expense primarily associated with notes
payable under the VPC Facility and ESPV facility used to fund or purchase loans; foreign currency gains and losses associated with our UK operations; depreciation and amortization expense on
fixed assets and intangible assets; non-operating income (loss); stock-based compensation expense and income tax expense (benefit). See the Appendix for a reconciliation to GAAP net loss.
Adjusted EBITDA margin is Adjusted EBITDA divided by revenue.
4 According to analysis of anonymized Rise customer data from a major credit bureau. Credit scores were reviewed from the customer acquisition point up to two quarters after loan completion.
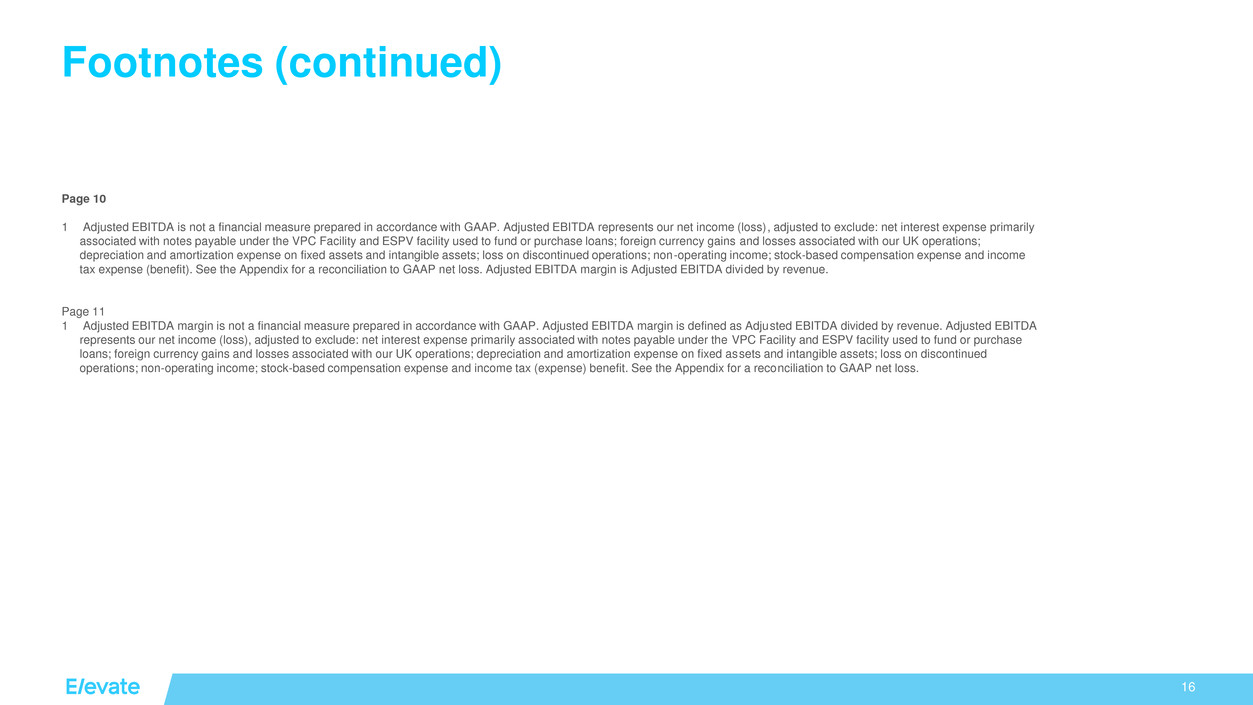
Page 8:
1 Ending combined loans receivable - principal is a non-GAAP financial measure. See appendix for a reconciliation to a GAAP measure.
2 19% is based on 2018 estimate midpoint.
3 Adjusted EBITDA is not a financial measure prepared in accordance with GAAP. Adjusted EBITDA represents our net loss, adjusted to exclude: net interest expense primarily associated with
notes payable under the VPC Facility and ESPV facility used to fund or purchase loans; foreign currency gains and losses associated with our UK operations; depreciation and
amortization expense on fixed assets and intangible assets; non-operating income (loss); stock-based compensation expense and income tax expense (benefit). See the Appendix for a
reconciliation to GAAP net loss.
4 55% is based on 2018 estimate midpoint.
5 2017 adjusted net income of $5.5 million is not a financial measure prepared in accordance with GAAP. Adjusted net income for 2017 represents our $6.9 million net loss for the year ended
December 31, 2017, adjusted to exclude the impact of $12.5 million in tax expense incurred during the fourth quarter of 2017 due to the enactment of the Tax Cuts and Jobs Act.
16
Footnotes (continued)
Page 10
1 Adjusted EBITDA is not a financial measure prepared in accordance with GAAP. Adjusted EBITDA represents our net income (loss), adjusted to exclude: net interest expense primarily
associated with notes payable under the VPC Facility and ESPV facility used to fund or purchase loans; foreign currency gains and losses associated with our UK operations;
depreciation and amortization expense on fixed assets and intangible assets; loss on discontinued operations; non-operating income; stock-based compensation expense and income
tax expense (benefit). See the Appendix for a reconciliation to GAAP net loss. Adjusted EBITDA margin is Adjusted EBITDA divided by revenue.
Page 11
1 Adjusted EBITDA margin is not a financial measure prepared in accordance with GAAP. Adjusted EBITDA margin is defined as Adjusted EBITDA divided by revenue. Adjusted EBITDA
represents our net income (loss), adjusted to exclude: net interest expense primarily associated with notes payable under the VPC Facility and ESPV facility used to fund or purchase
loans; foreign currency gains and losses associated with our UK operations; depreciation and amortization expense on fixed assets and intangible assets; loss on discontinued
operations; non-operating income; stock-based compensation expense and income tax (expense) benefit. See the Appendix for a reconciliation to GAAP net loss.
17
Non-GAAP financials reconciliation
Adjusted EBITDA Reconciliation
Adjusted EBITDA is a non-GAAP financial measure. See Appendix for a reconciliation to GAAP measure. The Company’s Adjusted EBITDA guidance does not include certain charges and
costs. The adjustments in future periods are generally expected to be similar to the kinds of charges and costs excluded from Adjusted EBITDA in prior periods, such as the impact of income
tax benefit or expense, non-operating income, foreign currency transaction gain or loss associated with our UK operations, net interest expense, stock-based compensation expense and
depreciation and amortization expense, among others. The Company is not able to provide a reconciliation of the Company’s non-GAAP financial guidance to the corresponding GAAP
measure without unreasonable effort because of the uncertainty and variability of the nature and amount of these future charges and costs.
18
Combined loans reconciliation
19
Combined loans reconciliation (continued)
1 Represents loans originated by third-party lenders through the CSO programs, which are not included in our financial statements.
2 Represents finance charges earned by third-party lenders through CSO programs, which are not included in our financial statements.
3 Non-GAAP measure.
4 The company determined that it previously misclassified certain loans relating to customers within the 16 day grace period as past due that were in fact current in accordance with our
policy. Historical periods have been adjusted accordingly.

© 2017 Elevate. All Rights Reserved.
