
Form 8-K Voya Financial, Inc. For: Nov 02
UNITED STATES
SECURITIES AND EXCHANGE COMMISSION
Washington, D.C. 20549
FORM 8-K
CURRENT REPORT
Pursuant to Section 13 or 15(d)
of the Securities Exchange Act of 1934
Date of Report (Date of earliest event reported):
November 2, 2016
VOYA FINANCIAL, INC.
(Exact name of registrant as specified in its charter)
| Delaware | 001-35897 | No. 52-1222820 | ||
| (State or other jurisdiction of incorporation) |
(Commission File Number) |
(IRS Employer Identification Number) | ||
| 230 Park Avenue New York, New York |
10169 | |||
| (Address of principal executive offices) | (Zip Code) | |||
Registrant’s telephone number, including area code: (212) 309-8200
N/A
(Former name or former address, if changed since last report)
Check the appropriate box below if the Form 8-K filing is intended to simultaneously satisfy the filing obligation of the registrant under any of the following provisions:
| ¨ | Written communications pursuant to Rule 425 under the Securities Act (17 CFR 230.425) |
| ¨ | Soliciting material pursuant to Rule 14a-12 under the Exchange Act (17 CFR 240.14a-12) |
| ¨ | Pre-commencement communications pursuant to Rule 14d-2(b) under the Exchange Act (17 CFR 240.14d-2(b)) |
| ¨ | Pre-commencement communications pursuant to Rule 13e-4(c) under the Exchange Act (17 CFR 240.13e-4(c)) |
Item 2.02 Results of Operations and Financial Condition
On November 2, 2016, Voya Financial, Inc. (“Voya Financial”) reported its financial results for the three months and nine months ended September 30, 2016. A copy of the press release containing this information is furnished as Exhibit 99.1 hereto and is incorporated by reference in this item 2.02.
As previously announced, Voya Financial will host a conference call on Wednesday, November 2, 2016 at 10:00 am EDT to discuss its third-quarter 2016 results. The call can be accessed via Voya Financial’s investor relations website at http://investors.voya.com. The call will be accompanied by a slide presentation, which will be accessible via Voya Financial’s investor relations website at http://investors.voya.com beginning at 9:30 am EDT on Wednesday, November 2, 2016. In addition, more detailed financial information can be found in Voya Financial’s Quarterly Investor Supplement for the quarter ended September 30, 2016, available on Voya Financial’s investor relations website at http://investors.voya.com. The Quarterly Investor Supplement for the quarter ended September 30, 2016 is furnished herewith as Exhibit 99.2 and is incorporated by reference in this Item 2.02.
As provided in General Instruction B.2 of Form 8-K, the information and exhibits provided pursuant to this Item 2.02 shall not be deemed to be “filed” for purposes of the Securities Exchange Act of 1934, as amended, nor shall they be deemed to be incorporated by reference in any filing under the Securities Act of 1933, as amended, except as shall be expressly set forth by specific reference in such filing.
Item 9.01 Financial Statements and Exhibits
| (d) | Exhibits |
| 99.1 | Press release of Voya Financial, Inc., dated November 2, 2016 (furnished and not filed) | |
| 99.2 | Quarterly Investor Supplement for the quarter ended September 30, 2016 (furnished and not filed) | |
SIGNATURES
Pursuant to the requirements of the Securities Exchange Act of 1934, the Registrant has duly caused this report to be signed on its behalf by the undersigned hereunto duly authorized.
| Voya Financial, Inc. (Registrant) | ||
| By: | /s/ Trevor Ogle | |
| Name: | Trevor Ogle | |
| Title: | Senior Vice President and Deputy General Counsel | |
Dated: November 2, 2016
Exhibit 99.1

| NEWS RELEASE |

|
Voya Financial Announces Third-Quarter 2016 Results
Board of Directors Authorizes an Additional $600 Million of Share Repurchases
Voya Announces Plans to Achieve Additional Cost Savings in 2018
NEW YORK, Nov. 2, 2016 – Voya Financial, Inc. (NYSE: VOYA) today announced financial results for the third quarter of 2016.
| • | 3Q 2016 net loss available to common shareholders of $1.24 per diluted share, which reflects: |
| • | Closed Block Variable Annuity (CBVA) segment loss of $1.06 per diluted share, after-tax, which includes a $0.31 per diluted share, after-tax, loss related to the annual review of actuarial assumptions and models for the segment; the CBVA segment, which is in run-off, is supported by a hedge program that is primarily designed to mitigate the impacts of market movements on regulatory and rating agency capital resources, creating an accounting asymmetry with U.S. GAAP financial results; and |
| • | A loss of $0.75 per diluted share, after-tax, (operating and non-operating) from the annual review of actuarial assumptions and models in the Ongoing Business, which reflects the lower level of interest rates. |
| • | 3Q 2016 operating earnings1,2 of $0.37 per diluted share, after-tax, which includes: |
| • | $(0.47) per diluted share, after-tax, of deferred acquisition costs and value of business acquired (“DAC/VOBA”) and other intangibles unlocking primarily related to the company’s annual review of actuarial assumptions and models; and |
| • | $0.05 per diluted share, after-tax and DAC/VOBA, of prepayment fee and alternative investment income above, in aggregate, the company’s long-term expectations. |
| • | 3Q 2016 segment results include: |
| • | Retirement net inflows of $1.4 billion due to net inflows in all markets; |
| • | Investment Management net inflows of $297 million (excluding sub-advisor replacements and variable annuity outflows); |
| • | Positive inflows for Annuities investment-only products; |
| • | Unfavorable mortality in Individual Life, although improved compared with 3Q 2015; |
| • | Higher Stop Loss and Group Life loss ratios compared with 3Q 2015, but within the annual expected range; and |
| • | CBVA hedge program continued to protect regulatory and rating agency capital. |
| 1 | Voya Financial assumes a 32% tax rate on operating earnings and all components of operating earnings described as “after-tax.” A 35% tax rate is applied to all non-operating items. The 32% tax rate for operating earnings and components reflects the estimated benefit of the dividend received deduction related to the company’s five Ongoing Business segments, which include Retirement, Investment Management, Annuities, Individual Life, and Employee Benefits. |
| 2 | Consolidated operating earnings, operating earnings for the Ongoing Business, Ongoing Business adjusted operating earnings, and adjusted operating earnings for each segment are each non-GAAP financial measures; information regarding the non-GAAP financial measures included in this press release, and reconciliations to the most comparable U.S. GAAP measures, are provided under the “Use of Non-GAAP Financial Measures” section of this release, and in the “Reconciliations” section of the Quarterly Investor Supplement. |
1
| • | Total assets under management (AUM) of $283 billion; total AUM and administration of $480 billion as of Sept. 30, 2016. |
| • | $150 million of share repurchases in 3Q 2016 through a previously announced share repurchase agreement; $200 million share repurchase agreement planned for 4Q 2016. |
| • | Planning at least $100 million in annual run rate cost savings to be realized in 2018 and subsequent years; represents an increase from the company’s previously announced plans to achieve $30 to $40 million in annual run rate cost savings. |
| • | Estimated combined risk-based capital (RBC) ratio of 468%3, which is above the company’s target of 425%. |
| • | Debt-to-capital ratio, excluding accumulated other comprehensive income (AOCI), of 23.3%4. |
| • | Book value per share (excluding AOCI) of $60.075. |
Third-Quarter Summary
3Q 2016 net income (loss) available to common shareholders was $(248) million, or $(1.24) per diluted share, compared with net income (loss) available to common shareholders of $40 million, or $0.18 per diluted share in 3Q 20156. The following items primarily accounted for this change:
| • | A $322 million loss related to the company’s annual review of actuarial assumptions and models during 3Q 2016, compared with a loss of $214 million in 3Q 2015; and |
| • | A loss of $123 million in 3Q 2016 due to changes in the fair value of guaranteed benefit derivatives related to nonperformance risk in CBVA, which the company considers a non-economic factor, compared with a gain of $241 million in 3Q 20157. |
Net income available to common shareholders includes the effect of the company’s CBVA hedge program – which focuses on protecting regulatory and rating agency capital from market movements, rather than minimizing GAAP earnings volatility – as well as net investment gains and losses, among other items.
| 3 | Estimated combined RBC ratio primarily for Voya Financial’s four principal U.S. insurance subsidiaries. |
| 4 | Debt-to-capital ratio, excluding AOCI, is a non-GAAP financial measure. Information regarding this non-GAAP financial measure, and a reconciliation to the most comparable U.S. GAAP measure, is provided under the “Use of Non-GAAP Financial Measures” section of this release, and in the “Reconciliations” section of the Quarterly Investor Supplement. |
| 5 | Book value per share (excluding AOCI) is a non-GAAP financial measure. Information regarding this non-GAAP financial measure, and a reconciliation to the most comparable U.S. GAAP measure, is provided under the “Use of Non-GAAP Financial Measures” section of this release, and in the “Reconciliations” section of the Quarterly Investor Supplement. |
| 6 | For the three months ended Sept. 30, 2016 and 2015, weighted-average fully diluted common shares outstanding were 201.5 million and 223.6 million, respectively. |
| 7 | Includes actuarial assumptions and model updates of $(36) million in 3Q 2016 and $21 million in 3Q 2015. |
2
3Q 2016 after-tax operating earnings were $74 million, or $0.37 per diluted share, compared with $93 million, or $0.42 per diluted share, in 3Q 20158. The following items primarily accounted for this change:
| • | $32 million, after tax, of incremental unfavorable DAC/VOBA and other intangibles unlocking; |
| • | $18 million, after tax, of higher adjusted operating earnings from the Ongoing Business; and |
| • | $6 million, after tax, of lower operating earnings from other Closed Blocks primarily due to the accelerated recognition of the deferred financing cost related to terminating three funding agreements. |
“During the third quarter, we demonstrated strong sales momentum across our Ongoing Business,” said Rodney O. Martin, Jr., chairman and chief executive officer, Voya Financial. “We achieved positive net flows in Retirement, Investment Management third party assets and in investment-only products in Annuities while also achieving strong sales in Employee Benefits and Individual Life. We continue to execute on our plans to grow our Ongoing Business at higher returns on capital and – while our industry remains challenged by the low interest rate environment – we are taking actions to help maintain and improve profitability. For example, during the third quarter, we announced plans to combine our Annuities and Individual Life businesses to share resources among the businesses and provide us with greater agility and flexibility.
“At the same time, our CBVA hedge program continued to protect regulatory and rating agency capital during the third quarter, and our capital position at Voya remains strong. At Sept. 30, 2016, we had excess capital of $978 million, even after repurchasing $150 million of common stock during the quarter. With the additional $600 million repurchase authorization we’ve received from the board of directors, we plan to continue repurchasing shares opportunistically to help drive greater shareholder value,” added Martin.
New Cost Savings Target
Voya Financial also announced today a higher cost savings target as part of the company’s broader plans to achieve its 2018 return on equity target.
Through a series of initiatives focused on Voya becoming a simpler, more-agile company able to deliver an enhanced customer experience, the company now expects to achieve annual run rate cost savings of at least $100 million in 2018 and subsequent years. These cost savings represent an increase of at least $60 to $70 million annually from the company’s previously announced plans to achieve $30 to $40 million in annual run rate cost savings in 2018. The additional cost savings will be achieved, in part, by simplifying how the company operates, including a further emphasis on less capital-intensive products; greater migration to an information technology cloud environment; and the achievement of operational synergies from the combination of its Annuities and Individual Life businesses.
To achieve its new, targeted annual run rate cost savings of at least $100 million in 2018 and beyond, Voya will incur certain restructuring expenses through 2018. These expenses, which
| 8 | For the three months ended Sept. 30, 2016 and 2015, weighted-average fully diluted common shares outstanding were 201.5 million and 223.6 million, respectively. |
3
will be classified as non-operating items, are not reflected in the company’s run-rate cost savings estimates for 2018. Those estimates also exclude development expenses that will be incurred in 2018 as part of the company’s $350 million strategic investment program.
In the fourth quarter of 2016, Voya will incur restructuring expenses of at least $30 million in connection with these cost-saving initiatives. Additional restructuring costs, which cannot currently be estimated, but which could be material, will be recognized in one or more periods through the end of 2018.
“Since our initial public offering in 2013, we have consistently demonstrated our ability to take proactive steps to achieve our goals and help our customers get ready to retire better,” said Martin. “By increasing our efforts to simplify our company and allocate capital to areas of higher return, we are actively addressing the low interest rate environment while increasing our ability to meet our customers’ needs.”
4
| Three months ended Sept. 30, | ||||||||||||
| ($ in millions, except per share amounts) | 2016 | 2015 | % Change | |||||||||
| Operating earnings before income taxes by segment |
||||||||||||
| Retirement |
$ | 63 | $ | 80 | (21 | )% | ||||||
| Investment Management |
52 | 46 | 13 | |||||||||
| Annuities |
113 | 51 | 116 | |||||||||
| Individual Life |
(76 | ) | (11 | ) | NM | |||||||
| Employee Benefits |
41 | 44 | (7 | ) | ||||||||
|
|
|
|
|
|
|
|||||||
| Ongoing Business |
$ | 193 | $ | 210 | (8 | )% | ||||||
| Corporate |
(78 | ) | (76 | ) | NM | |||||||
| Closed Block Other |
(7 | ) | 3 | NM | ||||||||
|
|
|
|
|
|
|
|||||||
| Total operating earnings before income taxes |
$ | 108 | $ | 137 | (21 | )% | ||||||
|
|
|
|
|
|
|
|||||||
| Closed Block Variable Annuity |
(328 | ) | (7 | ) | NM | |||||||
| Net investment gains (losses) |
(66 | ) | (65 | ) | NM | |||||||
| Other adjustments* |
(70 | ) | 15 | NM | ||||||||
|
|
|
|
|
|
|
|||||||
| Income (loss) before income taxes |
$ | (356 | ) | 80 | NM | |||||||
| Less: Income tax expenses (benefit) |
(119 | ) | (36 | ) | NM | |||||||
|
|
|
|
|
|
|
|||||||
| Net income (loss), after-tax |
$ | (237 | ) | $ | 116 | NM | ||||||
| Net income (loss) attributable to non-controlling interest |
11 | 76 | NM | |||||||||
|
|
|
|
|
|
|
|||||||
| Net income (loss) available to common shareholders, after-tax |
$ | (248 | ) | $ | 40 | NM | ||||||
|
|
|
|
|
|
|
|||||||
| ($ in per diluted share) |
||||||||||||
| Operating earnings, after-tax** |
$ | 0.37 | $ | 0.42 | (12 | )% | ||||||
| Closed Block Variable Annuity, after-tax*** |
(1.06 | ) | (0.02 | ) | NM | |||||||
| Net investment gains (losses), after-tax*** |
(0.21 | ) | (0.19 | ) | NM | |||||||
| Other adjustments, after-tax*** |
(0.26 | ) | (0.18 | ) | NM | |||||||
| Effect of assumed tax rate vs. actual tax rate**** |
(0.07 | ) | 0.15 | NM | ||||||||
| Adjustment due to antidilutive effect of net loss in the current period |
(0.01 | ) | — | NM | ||||||||
|
|
|
|
|
|
|
|||||||
| Net income (loss) available to common shareholders |
$ | (1.24 | ) | $ | 0.18 | NM | ||||||
|
|
|
|
|
|
|
|||||||
| Fully diluted weighted average shares outstanding (in millions) |
201.5 | 223.6 | ||||||||||
| * | “Other adjustments” consists of net guaranteed benefit hedging gains (losses) and related charges and adjustments; income (loss) from business exited; income (loss) attributable to non-controlling interests; immediate recognition of net actuarial gains (losses) related to pension and other post-retirement benefit obligations and gains (losses) from plan amendments and curtailments; expenses associated with the rebranding of Voya Financial from ING U.S.; and restructuring expenses (severance, lease write-offs, etc.). |
| ** | Voya Financial assumes a 32% tax rate on operating earnings and all components of operating earnings described as “after-tax.” The 32% tax rate for operating earnings reflects the estimated dividends received deduction benefit related to the Ongoing Business. |
| *** | A 35% tax rate is applied to all non-operating items. |
| **** | Represents the difference between actual tax expense and the tax expense reflected in other line items using the assumed 32% (operating) tax rate or 35% (non-operating) tax rate. |
NM = Not Meaningful
5
Ongoing Business Results
Voya Financial’s Ongoing Business includes the Retirement, Investment Management, Annuities, Individual Life, and Employee Benefits segments. The Corporate and closed block segments, including CBVA, are not reflected in Ongoing Business results.
| Three months ended Sept. 30, | ||||||||
| ($ in millions, before income taxes) |
2016 | 2015 | ||||||
| Ongoing Business operating earnings |
$ | 193 | $ | 210 | ||||
| Less: Gain due to Lehman bankruptcy settlement |
3 | — | ||||||
| Less: DAC/VOBA and other intangibles unlocking |
(140 | ) | (93 | ) | ||||
|
|
|
|
|
|||||
| Ongoing Business adjusted operating earnings |
$ | 330 | $ | 303 | ||||
|
|
|
|
|
|||||
Ongoing Business operating earnings in 3Q 2016 benefitted from a gain resulting from a Lehman Brothers bankruptcy settlement, which is not reflected in Ongoing Business adjusted operating earnings.
DAC/VOBA and other intangibles, which affects Ongoing Business operating earnings but not adjusted operating earnings, was $47 million unfavorable compared with 3Q 2015 and reflects updated market return assumptions and unfavorable liability and expense assumptions.
Ongoing Business adjusted operating earnings before income taxes were $330 million, compared with $303 million in 3Q 2015. The following items primarily accounted for the change in operating earnings (in addition to DAC/VOBA and other intangibles unlocking) and adjusted operating earnings:
| • | Lower DAC/VOBA and other intangible amortization ($32 million positive variance) and lower underwriting gain and other revenue ($23 million negative variance) primarily driven by a positive change in net mortality in Individual Life as a result of reduced severity when compared with 3Q 2015, partially offset by a negative change in Annuities as a result of model refinements in 3Q 2016 compared with 3Q 2015; |
| • | Higher investment spread and other income ($24 million positive variance) across the segments primarily due to higher prepayment fee income, higher alternative investment income and higher volume resulting from customer transfers from variable to fixed investment accounts, partially offset by declining fixed income portfolio yields; |
| • | Higher commissions ($7 million negative variance) and lower administrative expenses ($2 million positive variance); and |
| • | Higher fee-based margin ($1 million positive variance) primarily due to higher performance fees and higher average AUM due to Investment Management sourced net cash flows and market improvements, partially offset by lower recordkeeping fees as well as lower full-service variable fees from customer transfers from variable to fixed accounts. |
6
Segment Discussions
The following segment discussions compare 3Q 2016 with 3Q 2015, unless otherwise noted. All figures are presented before income taxes.
Retirement
Positive Net Flows; Higher Investment Spread and Lower Administrative Expenses
| Three months ended Sept. 30, | ||||||||
| ($ in millions, before income taxes) |
2016 | 2015 | ||||||
| Operating earnings |
$ | 63 | $ | 80 | ||||
| Less: DAC/VOBA and other intangibles unlocking |
(74 | ) | (48 | ) | ||||
|
|
|
|
|
|||||
| Adjusted operating earnings |
$ | 137 | $ | 129 | ||||
|
|
|
|
|
|||||
DAC/VOBA and other intangibles unlocking, which affects Retirement operating earnings but not adjusted operating earnings, was $26 million unfavorable compared with 3Q 2015.
The following items primarily accounted for the change in Retirement operating earnings (in addition to DAC/VOBA and other intangibles unlocking) and adjusted operating earnings:
| • | Higher investment spread and other income ($9 million positive variance) driven by materially higher investment volumes arising, in part, from a shift in participant assets from variable to fixed investment accounts, offset by declining fixed income portfolio earned yields and higher credited interest; |
| • | Lower fee-based margin ($3 million negative variance) due to lower recordkeeping fees reflecting Voya’s exit from the defined benefit business as well as lower full-service, variable fees due in part to customer transfers from variable to fixed investment accounts; |
| • | Lower administrative expenses ($6 million positive variance) due to lower recordkeeping, IT and operations expenses, partially offset by higher trail commissions ($3 million negative variance) resulting from growth in the business; and |
| • | Higher underwriting income ($1 million positive variance). |
Prepayment fee and alternative investment income was $6 million above long-term expectations, in aggregate, before the effect of income taxes and after DAC.
Retirement net inflows were $1.4 billion, compared with net outflows of $1.1 billion in 3Q 2015 and net inflows of $693 million in 2Q 2016. Net flows vary in size and timing, sometimes substantially, from one quarter to the next. Retirement AUM totaled $120 billion, up from $115 billion as of June 30, 2016, and $107 billion as of Sept. 30, 2015.
7
Investment Management
Positive Investment Management Sourced and Affiliate Sourced Net Flows; Higher Revenues from Investment Capital, Partially Offset by Higher Administrative Expenses
| Three months ended Sept. 30, | ||||||||
| ($ in millions, before income taxes) |
2016 | 2015 | ||||||
| Operating earnings |
$ | 52 | $ | 46 | ||||
| Less: Gain due to Lehman bankruptcy settlement |
3 | — | ||||||
|
|
|
|
|
|||||
| Adjusted operating earnings |
$ | 49 | $ | 46 | ||||
|
|
|
|
|
|||||
Investment Management operating earnings in 3Q 2016 benefitted from a gain resulting from a Lehman Brothers bankruptcy settlement, which is not reflected in Investment Management adjusted operating earnings.
The following items primarily accounted for the change in Investment Management operating earnings (in addition to the gain resulting from a Lehman Brothers bankruptcy settlement) and adjusted operating earnings:
| • | Higher investment capital and other investment income ($4 million positive variance) due to income earned on alternative investments; |
| • | Higher fee-based margin ($4 million positive variance) primarily due to higher performance fees and higher average AUM due to Investment Management sourced net cash flows and market improvements; and |
| • | Higher administrative expenses ($5 million negative variance) primarily due to higher compensation-related expenses associated with sales and due, in part, to timing of expenses. |
Alternative investment income was in line with long-term expectations before the impact of income taxes.
Investment Management Operating Margin
| 3Q 2016 | 2Q 2016 | 3Q 2015 | ||||||||||
| Operating Margin |
30.5 | %9 | 22.3 | % | 29.9 | % | ||||||
| Operating Margin, excluding investment capital results10 |
28.7 | % | 26.8 | % | 29.7 | % | ||||||
The increase in the 3Q 2016 operating margin, excluding investment capital and other investment income, compared with 2Q 2016 was primarily due to higher fee-based revenue resulting from higher performance fees and higher average AUM. Compared with 3Q 2015, the 3Q 2016 operating margin excluding investment capital and other investment income declined primarily due to higher compensation-related expenses associated with sales and due, in part, to timing of expenses.
| 9 | Excludes gain resulting from a Lehman Brothers bankruptcy settlement. |
| 10 | Operating margin, excluding investment capital results, is a non-GAAP financial measure. Information regarding this non-GAAP financial measure, and a reconciliation to the most comparable U.S. GAAP measure, is provided under the “Use of Non-GAAP Financial Measures” section of this release, and in the “Reconciliations” section of the Quarterly Investor Supplement. |
8
Investment Management Net Flows
| ($ in billions) |
3Q 2016 | 2Q 2016 | 3Q 2015 | |||||||||
| Investment Management Sourced Net Flows |
$ | 0.2 | $ | 0.5 | $ | (1.1 | ) | |||||
| Affiliate Sourced Net Flows |
0.1 | 0.0 | (1.4 | ) | ||||||||
| Sub-Advisor Replacements |
0.2 | 0.0 | 1.4 | |||||||||
| VA Net Flows |
(0.8 | ) | (0.7 | ) | (0.8 | ) | ||||||
|
|
|
|
|
|
|
|||||||
| Total |
$ | (0.3 | ) | $ | (0.2 | ) | $ | (1.9 | ) | |||
|
|
|
|
|
|
|
|||||||
During 3Q 2016, Investment Management Sourced net inflows were driven by institutional net flows, including flows from global distribution and alternative asset classes.
Third-party11 sales were $4.7 billion, compared with $6.2 billion in 3Q 2015 and $4.3 billion in 2Q 2016. Third-party AUM totaled $128 billion as of Sept. 30, 2016, up from $125 billion as of June 30, 2016, and $122 billion as of Sept. 30, 2015.
Annuities
Positive Net Flows for Investment-Only Products; Lower Underwriting Results Partially Offset by Higher Prepayment Fee Income
| Three months ended Sept. 30, | ||||||||
| ($ in millions, before income taxes) |
2016 | 2015 | ||||||
| Operating earnings |
$ | 113 | $ | 51 | ||||
| Less: DAC/VOBA and other intangibles unlocking |
56 | (13 | ) | |||||
|
|
|
|
|
|||||
| Adjusted operating earnings |
$ | 57 | $ | 63 | ||||
|
|
|
|
|
|||||
DAC/VOBA and other intangibles unlocking, which affects Annuities operating earnings but not adjusted operating earnings, was $69 million favorable compared with 3Q 2015.
The following items primarily accounted for the change in Annuities operating earnings (in addition to DAC/VOBA and other intangibles unlocking) and adjusted operating earnings:
| • | Lower net underwriting income ($24 million negative variance) primarily due to a $6 million negative reserve adjustment in 3Q 2016 related to valuation model refinements, compared with a $22 million positive reserve adjustment in 3Q 2015 – this was partially offset by favorable mortality; |
| • | Higher investment spread and other income ($9 million positive variance) primarily due to higher prepayment fee income; and |
| • | Lower DAC/VOBA and other intangibles amortization ($9 million positive variance) primarily due to the previously mentioned valuation model refinements. |
| 11 | Excludes general account assets of Voya Financial’s insurance company subsidiaries. |
9
Prepayment fee and alternative investment income was $5 million above long-term expectations, before the effect of income taxes and after DAC. Total Annuities net outflows were $135 million as net inflows of $81 million in investment-only products were more than offset by net outflows of $9 million in fixed indexed annuities, $151 million in fixed rate annuities, and $56 million in income and other annuities.
Annuities AUM totaled $28 billion as of Sept. 30, 2016, up from $27 billion as of June 30, 2016, and $27 billion as of Sept. 30, 2015.
Individual Life
Higher Underwriting Income and Favorable Amortization Offset by Lower Investment Spread
| Three months ended Sept. 30, | ||||||||
| ($ in millions, before income taxes) |
2016 | 2015 | ||||||
| Operating earnings |
$ | (76 | ) | $ | (11 | ) | ||
| Less: DAC/VOBA and other intangibles unlocking |
(122 | ) | (29 | ) | ||||
|
|
|
|
|
|||||
| Adjusted operating earnings |
$ | 46 | $ | 19 | ||||
|
|
|
|
|
|||||
DAC/VOBA and other intangibles unlocking, which affects Individual Life operating earnings but not adjusted operating earnings, was $93 million unfavorable compared with 3Q 2015.
The following items primarily accounted for the change in Individual Life operating earnings (in addition to DAC/VOBA and other intangibles unlocking) and adjusted operating earnings:
| • | Higher net underwriting income and lower DAC/VOBA and other intangibles amortization ($27 million positive variance) primarily driven by net mortality as a result of reduced severity when compared to 3Q 2015; |
| • | Lower administrative expenses ($2 million positive variance); and |
| • | Lower investment spread ($2 million negative variance) primarily due to lower yields on fixed income portfolios partially offset by favorable prepayment fee income. |
Prepayment fee and alternative investment income was $2 million above long-term expectations, before the impact of income taxes and after DAC.
Total sales were $24 million, $20 million (or 82%) of which were indexed life sales. This compares with 3Q 2015 total sales of $25 million, $18 million (or 74%) of which were indexed life sales.
10
Employee Benefits
Continued Revenue Growth Across the Business Offset by Higher, but Within Expected Range, Loss Ratios
| Three months ended Sept. 30, | ||||||||
| ($ in millions, before income taxes) |
2016 | 2015 | ||||||
| Operating earnings |
$ | 41 | $ | 44 | ||||
| Less: DAC/VOBA and other intangibles unlocking |
(0 | ) | (3 | ) | ||||
|
|
|
|
|
|||||
| Adjusted operating earnings |
$ | 42 | $ | 47 | ||||
|
|
|
|
|
|||||
DAC/VOBA and other intangibles unlocking, which affects Employee Benefits operating earnings but not adjusted operating earnings, was approximately $3 million favorable compared with 3Q 2015.
The following items primarily accounted for the change in Employee Benefits operating earnings (in addition to DAC/VOBA and other intangibles unlocking) and adjusted operating earnings:
| • | Lower net underwriting income ($4 million negative variance) as both Stop Loss and Group Life loss ratios were within expected ranges, but higher than the very favorable results in 3Q 2015 – this was partially offset by in-force premium growth across the business and a $17 million, post-DAC, favorable reserve refinement on the company’s Compass product line; |
| • | Higher trail commissions ($5 million negative variance) due to growth in the business; and |
| • | Higher investment spread and other income ($2 million positive variance). |
Prepayment fee and alternative investment income was $1 million above long-term expectations, before the impact of income taxes.
The loss ratio for Group Life was 77.9%, compared with 75.6%. The loss ratio for Stop Loss was 79.5%, compared with 67.3%. The expected annual loss ratio range for Group Life and Stop Loss is 77-80%.
Sales were $54 million, compared with $43 million in 3Q 2015.
CBVA
CBVA had a net loss before income taxes of $328 million, compared with a net loss before income taxes of $7 million in 3Q 2015. Changes in the fair value of guaranteed benefit derivatives related to nonperformance risk, which the company considers a non-economic factor, generated a loss of $123 million in 3Q 2016, compared to a gain of $241 million in 3Q 2015.
CBVA’s $328 million net loss in 3Q 2016 included a $96 million loss due to annual assumption changes. The $96 million loss reflects the negative impact of lower interest rate assumptions and other model updates, which were partially offset by the positive impact of policyholder behavior assumption changes.
The CBVA segment contains variable annuity products with substantial guarantee features, which are in run-off. CBVA is supported by a hedge program that is primarily designed to mitigate the impacts of market movements on capital resources. As U.S. GAAP accounting differs from the methods used to determine regulatory and rating agency capital measures, the CBVA hedge program can create earnings volatility for U.S. GAAP financial statements.
11
During 3Q 2016, the hedge program resulted in a net gain to regulatory surplus as a result of the difference between the decrease in reserves and hedge resources related to equity market movements.
As of Sept. 30, 2016, Voya had estimated available resources of $6.3 billion for CBVA, $1.0 billion higher than statutory reserve requirements, and no letters of credit required or issued.
Corporate
Corporate operating losses were $78 million, compared with losses of $76 million in 3Q 2015.
Share Repurchases
During 3Q 2016, Voya completed the repurchase agreement announced in 2Q 2016 by repurchasing 5.7 million shares of its common stock at an average price per share of approximately $26.36 for an aggregate purchase price of approximately $150 million. In 4Q 2016, Voya plans to enter into an agreement to repurchase $200 million of its common stock.
Additional Share Repurchase Authorization
Voya Financial announced today that its board of directors has increased the amount of the company’s common stock authorized for repurchase under the company’s share repurchase program by an additional $600 million. Including this additional $600 million authorization and giving effect to the planned repurchase of $200 million of shares under an agreement to be entered into in 4Q 2016, the aggregate amount currently available under the company’s share repurchase authorization would be approximately $633 million. Under its share repurchase program, the company may, from time to time, purchase shares of its common stock through various means, including open market transactions, privately negotiated transactions, forward, derivative, accelerated repurchase, or automatic repurchase transactions, or tender offers. The additional $600 million share repurchase authorization expires on Dec. 31, 2017 (unless extended), and does not obligate the company to purchase any shares. The authorization for the share repurchase program may be terminated, increased or decreased by the board of directors at any time.
Supplementary Financial Information
More detailed financial information can be found in the company’s Quarterly Investor Supplement, which is available on Voya’s investor relations website, investors.voya.com.
Earnings Conference Call and Slide Presentation
Voya will host a conference call on Wednesday, Nov. 2, 2016, at 10 a.m. ET, to discuss the company’s third-quarter 2016 results. The call and slide presentation can be accessed via the company’s investor relations website at investors.voya.com. A replay of the call will be available on the company’s investor relations website at investors.voya.com starting at 1 p.m. ET on Nov. 2, 2016.
12
| Media Contact: | Investor Contact: | |
| Christopher Breslin 212-309-8941 |
Darin Arita 212-309-8999 |
About Voya Financial®
Voya Financial, Inc. (NYSE: VOYA), helps Americans plan, invest and protect their savings — to get ready to retire better. Serving the financial needs of approximately 13 million individual and institutional customers in the United States, Voya is a Fortune 500 company that had $11 billion in revenue in 2015. The company had $480 billion in total assets under management and administration as of Sept. 30, 2016. With a clear mission to make a secure financial future possible – one person, one family, one institution at a time – Voya’s vision is to be America’s Retirement Company™. The company is equally committed to conducting business in a way that is socially, environmentally, economically and ethically responsible – Voya has been recognized as one of the 2016 World’s Most Ethical Companies® by the Ethisphere Institute, and as one of the Top Green Companies in the U.S., by Newsweek magazine. For more information, visit voya.com. Follow Voya Financial on Facebook and Twitter @Voya.
Use of Non-GAAP Financial Measures
Operating earnings before income taxes is a financial measure we use to evaluate segment performance. We believe that operating earnings before income taxes provides a meaningful measure of our business and segment performances and enhances the understanding of our financial results by focusing on the operating performance and trends of our underlying business segments and excluding items that tend to be highly variable from period to period based on capital market conditions and/or other factors. We use the same accounting policies and procedures to measure segment operating earnings before income taxes as we do for consolidated net income (loss). We also report operating earnings on an aggregate basis (both before and after income taxes) for both our Ongoing Business and for our company as a whole. Operating earnings does not replace net income (loss) as the measure of our results of operations. Therefore, we believe that it is useful to evaluate both net income (loss) and Operating earnings before income taxes when reviewing our financial and operating performance. Each segment’s operating earnings before income taxes is calculated by adjusting income (loss) before income taxes for the following items:
| • | Net investment gains (losses), net of related amortization of DAC, VOBA, sales inducements and unearned revenue, which are significantly influenced by economic and market conditions, including interest rates and credit spreads. Net investment gains (losses) include gains (losses) on the sale of securities, impairments, changes in the fair value of investments using the fair value option unrelated to the implied loan-backed security income recognition for certain mortgage-backed obligations and changes in the fair value of derivative instruments, excluding realized gains (losses) associated with swap settlements and accrued interest; |
| • | Net guaranteed benefit hedging gains (losses), which are significantly influenced by economic and market conditions, include changes in the fair value of derivatives related to guaranteed benefits, net of related reserve increases (decreases) and net of related amortization of DAC, VOBA and sales inducements, less the estimated cost of these benefits. The estimated cost, which is reflected in operating results, reflects the expected cost of these benefits if markets perform in line with our long-term expectations and includes the cost of hedging. Other derivative and reserve changes related to guaranteed benefits are excluded from operating results, including the impacts related to changes in our nonperformance spread; |
| • | Income (loss) related to businesses exited through reinsurance or divestment (including net investment gains (losses) on securities sold and expenses directly related to these transactions); |
| • | Income (loss) attributable to non-controlling interest; |
| • | Income (loss) related to early extinguishment of debt; |
| • | Impairment of goodwill, value of management contract rights and value of customer relationships acquired; |
| • | Immediate recognition of net actuarial gains (losses) related to our pension and other postretirement benefit obligations and gains (losses) from plan amendments and curtailments; and |
| • | Other items, including restructuring expenses (severance, lease write-offs, etc.), certain third-party expenses and deal incentives related to the divestment of Voya Financial by ING Group and expenses associated with the rebranding of Voya Financial from ING U.S., Inc. |
13
Operating earnings before income taxes, when presented on a consolidated basis, also does not reflect the results of operations of our CBVA segment because this segment is managed to focus on protecting regulatory and rating agency capital rather than achieving operating metrics or generating net income. As a result of this focus on regulatory and rating agency capital, the financial results of the CBVA segment presented in accordance with GAAP tend to exhibit a high degree of volatility based on factors, such as the asymmetry between the accounting for certain liabilities and the corresponding hedging assets, and gains and losses due to changes in nonperformance risk, that are not necessarily reflective of the economic costs and benefits of our CBVA business. When we present the adjustments to income (loss) before income taxes on a consolidated basis, each adjustment excludes the portions attributable to our CBVA segment.
We also use adjusted operating earnings before income taxes as a measure of our financial performance. This measure excludes from operating earnings the following items: (1) DAC/VOBA and other intangibles unlocking, (2) net gains from a distribution of cash in conjunction with a Lehman Brothers bankruptcy settlement for assets held in a partnership owned by the company, (3) losses on certain receivables associated with the previously disposed low-income housing tax credit partnerships, and (4) interest expense related to debt in our Corporate segment. Because DAC/VOBA and other intangibles unlocking can be volatile, excluding the effect of this item can improve period to period comparability. The net gain from the Lehman Brothers bankruptcy settlement and the loss from the disposition of low-income housing tax credit partnerships affected run-rate results and we believe that this effect is not reflective of our ongoing performance.
We report Ongoing Business operating earnings before income taxes (both adjusted and unadjusted as described above) because we believe this measure is a useful indicator of the business performance for our Ongoing Business segments, excluding the effect of our Closed Blocks and Corporate segments.
Operating earnings (both before and after income taxes), adjusted operating earnings before income taxes, Ongoing Business operating earnings before income taxes and Ongoing Business adjusted operating earnings before income taxes, are each non-GAAP measures. For a reconciliation of each of these non-GAAP measures to the most directly comparable U.S. GAAP measures, see the tables that accompany this release, as well as our Quarterly Investor Supplement.
We report Ongoing Business adjusted operating ROE and adjusted operating ROC because we believe these measures are useful indicators of how effectively we use capital resources allocated to our Ongoing Business. The most directly comparable U.S. GAAP measure to Ongoing Business adjusted operating ROE and adjusted operating ROC is return on equity. For a reconciliation of these non-GAAP measures to return on equity, see the tables that accompany this release as well as our Quarterly Investor Supplement.
In our Investment Management business, we report the operating margin excluding Investment Capital results. Because results from Investment Capital can be volatile, excluding the effect of this item can improve period-to-period comparability.
In addition to net income (loss) per share, we report operating earnings per share because we believe that operating earnings before income taxes provides a meaningful measure of its business and segment performances and enhances the understanding of our financial results by focusing on the operating performance and trends of the underlying business segments and excluding items that tend to be highly variable from period to period based on capital market conditions and/or other factors.
In addition to book value per share including AOCI, we report book value per share excluding AOCI. Included in AOCI are investment portfolio unrealized gains or losses. In the ordinary course of business we do not plan to sell most investments for the sole purpose of realizing gains or losses, and book value per share excluding AOCI provides a measure consistent with that view.
We also analyze our Ongoing Business performance based on the sources of earnings. We believe this supplemental information is useful in order to gain a better understanding of our financial performance, because it provides insight into the main drivers of operating earnings (loss) before income taxes of our Ongoing Business. The sources of earnings are defined as follows:
| • | Investment spread and other investment income consists of net investment income and net realized investment gains (losses) associated with swap settlements and accrued interest, less interest credited to policyholder reserves. |
| • | Fee-based margin consists primarily of fees earned on AUM, AUA, and transaction-based recordkeeping fees. |
| • | Net underwriting gain (loss) and other revenue contains the difference between fees charged for insurance risks and incurred benefits, including mortality, morbidity, and surrender results, contractual charges for universal life and annuity contracts, the change in the unearned revenue reserve for universal life contracts, and that portion of |
14
| traditional life insurance premiums intended to cover expenses and profits. Certain contract charges for universal life insurance are not recognized in income immediately, but are deferred as unearned revenues and are amortized into income in a manner similar to the amortization of DAC. |
| • | Administrative expenses are general expenses, net of amounts capitalized as acquisition expenses and exclude commission expenses and fees on letters of credit. |
| • | Trail commissions are commissions paid that are not deferred and thus recorded directly to expense. |
| • | For a detailed explanation of DAC/VOBA and other intangibles amortization/unlocking see “Management’s Discussion and Analysis of Financial Condition and Results of Operations – Unlocking of DAC/VOBA and other Contract Owner/Policyholder Intangibles” in our 2015 Annual Report on Form 10-K, filed with the Securities and Exchange Commission on Feb. 25, 2016, and our Quarterly Report on Form 10-Q for the three months ended Sept. 30, 2016, which the company expects to file with the Securities and Exchange Commission on or before Nov. 9, 2016. |
More details on these sources of earnings can be found in Voya Financial’s Quarterly Investor Supplement, which is available on Voya Financial’s investor relations website, investors.voya.com.
Forward-Looking and Other Cautionary Statements
This press release contains forward-looking statements. Forward-looking statements include statements relating to future developments in our business or expectations for our future financial performance and any statement not involving a historical fact. Forward-looking statements use words such as “anticipate,” “believe,” “estimate,” “expect,” “intend,” “plan,” and other words and terms of similar meaning in connection with a discussion of future operating or financial performance. Actual results, performance or events may differ materially from those projected in any forward-looking statement due to, among other things, (i) general economic conditions, particularly economic conditions in our core markets, (ii) performance of financial markets, including emerging markets, (iii) the frequency and severity of insured loss events, (iv) mortality and morbidity levels, (v) persistency and lapse levels, (vi) interest rates, (vii) currency exchange rates, (viii) general competitive factors, (ix) changes in laws and regulations, including those relating to the use of and possible application of NAIC accreditation standards to captive reinsurance entities and those made pursuant to the Dodd-Frank Wall Street Reform and Consumer Protection Act or the U.S. Department of Labor’s final rules and exemptions pertaining to the fiduciary status of providers of investment advice, and (x) changes in the policies of governments and/or regulatory authorities. Factors that may cause actual results to differ from those in any forward-looking statement also include those described under “Risk Factors” and “Management’s Discussion and Analysis of Results of Operations and Financial Condition – Trends and Uncertainties” in our Annual Report on Form 10-K for the year ended Dec. 31, 2015, filed with the Securities and Exchange Commission on Feb. 25, 2016, and our Quarterly Report on Form 10-Q for the three-month period ended Sept. 30, 2016, which the company expects to file with the Securities and Exchange Commission on or before Nov. 9, 2016.
15
Reconciliation of Ongoing Business Adjusted Operating Earnings to Net Income (Loss) - Quarter-to-Date
| ($ in millions) | Three Months ended September 30, 2016 |
Three Months ended September 30, 2015 |
||||||
| Net income (loss) |
(236.5 | ) | 116.2 | |||||
| Less: Net income (loss) attributable to noncontrolling interest |
11.6 | 75.9 | ||||||
|
|
|
|
|
|||||
| Net income (loss) available to Voya Financial, Inc.’s common shareholders |
(248.1 | ) | 40.3 | |||||
| Less: Adjustments to operating earnings |
||||||||
| Closed Block Variable Annuity |
(328.0 | ) | (7.1 | ) | ||||
| Net investment gains (losses) and related charges and adjustments |
(65.6 | ) | (64.6 | ) | ||||
| Other adjustments |
(82.3 | ) | (60.9 | ) | ||||
|
|
|
|
|
|||||
| Total adjustments to operating earnings before tax effect |
(475.9 | ) | (132.6 | ) | ||||
| Income taxes on adjustments to operating earnings (1) |
166.6 | 46.4 | ||||||
|
|
|
|
|
|||||
| Total Adjustments to operating earnings, after tax (1) |
(309.3 | ) | (86.2 | ) | ||||
| Less: Difference between actual tax (expense) benefit and assumed tax rate |
(12.5 | ) | 33.3 | |||||
|
|
|
|
|
|||||
| Operating earnings, after-tax (1) |
73.7 | 93.2 | ||||||
| Less: Income taxes (1) |
(34.7 | ) | (43.8 | ) | ||||
|
|
|
|
|
|||||
| Total operating earnings before income taxes |
108.4 | 137.0 | ||||||
| Less: Corporate |
(77.5 | ) | (75.6 | ) | ||||
| Less: Closed Block Other |
(6.9 | ) | 2.6 | |||||
|
|
|
|
|
|||||
| Operating earnings before income taxes for Ongoing Business |
192.8 | 210.0 | ||||||
| Less: DAC/VOBA and other intangibles unlocking |
(140.0 | ) | (93.1 | ) | ||||
| Less: Lehman bankruptcy (2) |
2.6 | — | ||||||
|
|
|
|
|
|||||
| Ongoing Business adjusted operating earnings before income taxes |
$ | 330.2 | $ | 303.1 | ||||
|
|
|
|
|
|||||
| (1) | Voya Financial assumes a 32% tax rate on operating earnings and all components of operating earnings described as “after tax.” A 35% tax rate is applied to all non-operating items. The 32% tax rate for operating earnings and components reflects the estimated benefit of the dividend received deduction related to the Company’s five Ongoing Business segments, which include Retirement, Annuities, Investment Management, Individual Life, and Employee Benefits. |
| (2) | Includes the net gain included in operating earnings from a distribution of cash and securities in conjunction with a Lehman Brothers bankruptcy settlement. |
Voya Financial
Reconciliation of Book Value Per Share
| As of September 30, 2016 |
||||
| Book value per share, including AOCI |
$ | 78.14 | ||
| Per share impact of AOCI |
$ | (18.07 | ) | |
|
|
|
|||
| Book value per share, excluding AOCI |
$ | 60.07 | ||
|
|
|
|||
16
Voya Financial
Reconciliation of Investment Management Operating Margin
| ($ in millions, unless otherwise indicated) | Three Months Ended September 30, 2016 |
Three Months Ended June 30, 2016 |
Three Months Ended September 30, 2015 |
|||||||||
| Operating revenues * |
$ | 160.4 | $ | 142.4 | $ | 152.6 | ||||||
| Operating expenses |
(111.5 | ) | (110.6 | ) | (107.0 | ) | ||||||
|
|
|
|
|
|
|
|||||||
| Operating earnings before income taxes * |
$ | 48.9 | $ | 31.8 | $ | 45.6 | ||||||
| Operating margin |
30.5 | % | 22.3 | % | 29.9 | % | ||||||
| Operating revenues * |
$ | 160.4 | $ | 142.4 | $ | 152.6 | ||||||
| Less: |
||||||||||||
| Investment Capital Results * |
4.1 | (8.6 | ) | 0.4 | ||||||||
|
|
|
|
|
|
|
|||||||
| Revenues excluding Investment Capital |
156.3 | 151.0 | 152.2 | |||||||||
| Operating expenses |
(111.5 | ) | (110.6 | ) | (107.0 | ) | ||||||
|
|
|
|
|
|
|
|||||||
| Operating earnings excluding Investment Capital * |
$ | 44.8 | $ | 40.4 | $ | 45.2 | ||||||
|
|
|
|
|
|
|
|||||||
| Operating margin excluding Investment Capital |
28.7 | % | 26.8 | % | 29.7 | % | ||||||
| * | Excludes gain from Lehman recovery in 3Q 2016. |
17
Exhibit 99.2

Exhibit 99.1
Quarterly Investor Supplement
September 30, 2016
This report should be read in conjunction with Voya Financial, Inc.’s Quarterly Report on Form 10-Q for the nine months ended September 30, 2016. Voya Financial’s Annual Reports on Form 10-K, and Quarterly Reports on Form 10-Q, can be accessed upon filing at the Securities and Exchange Commission’s website at www.sec.gov, and at our website at investors.voya.com. All information is unaudited.
Table of Contents
Page
Consolidated
Explanatory Note on Non-GAAP Financial Information 3—5
Organizational Chart 6
Consolidated Balance Sheets 7
Consolidated Statements of Operations 8
Key Metrics 9
Operating Revenues and Operating Earnings by Segment 10
Consolidated Earnings Before Income Taxes 11
Operating Earnings by Segment (QTD) 12
Operating Earnings by Segment (YTD) 13
Adjusted Operating Earnings Before Interest, After Income Taxes 14
Adjusted Operating Return on Capital and Return on Equity 15
Ongoing Business Sources of Operating Earnings 16
DAC/VOBA Segment Trends 17
Consolidated Capital Structure 18
Consolidated Assets Under Management/Assets Under Administration 19
Retirement
Operating Earnings 21
Sources of Operating Earnings 22
Assets Under Management/Assets Under Administration 23
Assets Under Management Rollforward 24
Investment Management
Operating Earnings 26
Sources of Operating Earnings 27
Key Metrics 28
Account Value Rollforward by Source 29
Account Value by Asset Type 30
Annuities
Operating Earnings 32
Sources of Operating Earnings 33
Assets Under Management 34
Assets Under Management Rollforward 35
Individual Life
Operating Earnings 37
Sources of Operating Earnings 38
Key Metrics 39
Employee Benefits
Operating Earnings 41
Sources of Operating Earnings 42
Key Metrics 43
Page
Corporate
Operating Earnings 45
Closed Blocks
Closed Block Other Operating Earnings 47
Closed Block Variable Annuity Income (Loss) Before Income Taxes 48
Closed Block Variable Annuity Death and Living Benefits 49
Closed Block Variable Annuity Assets Under Management Rollforward 50
Investment Information
Portfolio Composition 52
Portfolio Results 53
Alternative Investment Income 54
Unrealized Gains (Losses) 55
Asset Backed Securities 56
RMBS Securities Summary 57
CMBS and Other Asset-Backed Securities Summary 58
Mortgage Loans on Real Estate 59
US and Foreign Corporate Securities 60
Exposure to European Debt—Fixed Maturities and Equity Securities 61
Reconciliations
Reconciliation of Operating Revenues and Earnings by Segment 63
Reconciliation of Operating Revenues by Segment 64
Reconciliation of Ongoing Business Adjusted Operating Earnings to Net
Income (Loss) 65—66
Reconciliation of Adjusted Operating Earnings 67—68
Reconciliation of Adjusted Operating Earnings and Calculation of
Adjusted Operating Return on Capital 69—72
Reconciliation of Ongoing Business Adjusted ROE and Capital 73
Impacts of Prepayments and Alternative Income Above (Below) Long-
Term Expectations 74
Calculation of ROE and ROC 75
Reconciliation of Operating Earnings Per Share: Book Value Per Share
Excluding AOCI 76
Reconciliation of Average Capital: Debt to Capital, Excluding AOCI 77
Reconciliation of Ongoing Business Sources of Earnings 78—80
Reconciliation of Investment Management Operating Margin, Excluding
Investment Capital 81
Additional Information
Fixed Maturity Securities—Businesses Exited Through Reinsurance 83
Ratings 84
Voya Financial
Explanatory Note on Non-GAAP Financial Information
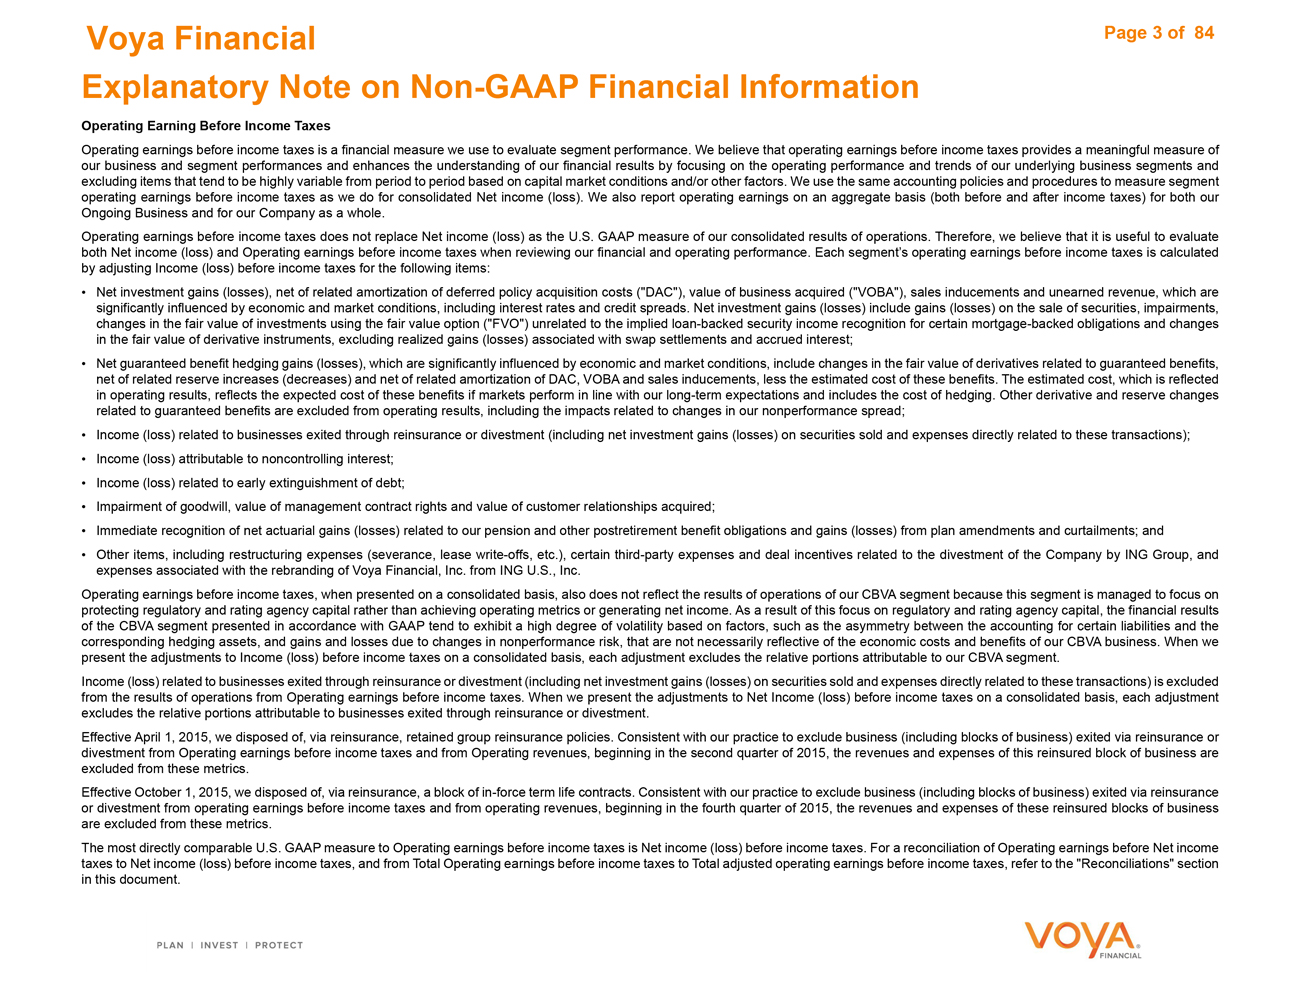
Operating Earning Before Income Taxes
Operating earnings before income taxes is a financial measure we use to evaluate segment performance. We believe that operating earnings before income taxes provides a meaningful measure of our business and segment performances and enhances the understanding of our financial results by focusing on the operating performance and trends of our underlying business segments and excluding items that tend to be highly variable from period to period based on capital market conditions and/or other factors. We use the same accounting policies and procedures to measure segment operating earnings before income taxes as we do for consolidated Net income (loss). We also report operating earnings on an aggregate basis (both before and after income taxes) for both our Ongoing Business and for our Company as a whole.
Operating earnings before income taxes does not replace Net income (loss) as the U.S. GAAP measure of our consolidated results of operations. Therefore, we believe that it is useful to evaluate both Net income (loss) and Operating earnings before income taxes when reviewing our financial and operating performance. Each segment’s operating earnings before income taxes is calculated by adjusting Income (loss) before income taxes for the following items:
Net investment gains (losses), net of related amortization of deferred policy acquisition costs (“DAC”), value of business acquired (“VOBA”), sales inducements and unearned revenue, which are significantly influenced by economic and market conditions, including interest rates and credit spreads. Net investment gains (losses) include gains (losses) on the sale of securities, impairments, changes in the fair value of investments using the fair value option (“FVO”) unrelated to the implied loan-backed security income recognition for certain mortgage-backed obligations and changes in the fair value of derivative instruments, excluding realized gains (losses) associated with swap settlements and accrued interest;
Net guaranteed benefit hedging gains (losses), which are significantly influenced by economic and market conditions, include changes in the fair value of derivatives related to guaranteed benefits, net of related reserve increases (decreases) and net of related amortization of DAC, VOBA and sales inducements, less the estimated cost of these benefits. The estimated cost, which is reflected in operating results, reflects the expected cost of these benefits if markets perform in line with our long-term expectations and includes the cost of hedging. Other derivative and reserve changes related to guaranteed benefits are excluded from operating results, including the impacts related to changes in our nonperformance spread;
Income (loss) related to businesses exited through reinsurance or divestment (including net investment gains (losses) on securities sold and expenses directly related to these transactions);
Income (loss) attributable to noncontrolling interest;
Income (loss) related to early extinguishment of debt;
Impairment of goodwill, value of management contract rights and value of customer relationships acquired;
Immediate recognition of net actuarial gains (losses) related to our pension and other postretirement benefit obligations and gains (losses) from plan amendments and curtailments; and
Other items, including restructuring expenses (severance, lease write-offs, etc.), certain third-party expenses and deal incentives related to the divestment of the Company by ING Group, and expenses associated with the rebranding of Voya Financial, Inc. from ING U.S., Inc.
Operating earnings before income taxes, when presented on a consolidated basis, also does not reflect the results of operations of our CBVA segment because this segment is managed to focus on protecting regulatory and rating agency capital rather than achieving operating metrics or generating net income. As a result of this focus on regulatory and rating agency capital, the financial results of the CBVA segment presented in accordance with GAAP tend to exhibit a high degree of volatility based on factors, such as the asymmetry between the accounting for certain liabilities and the corresponding hedging assets, and gains and losses due to changes in nonperformance risk, that are not necessarily reflective of the economic costs and benefits of our CBVA business. When we present the adjustments to Income (loss) before income taxes on a consolidated basis, each adjustment excludes the relative portions attributable to our CBVA segment.
Income (loss) related to businesses exited through reinsurance or divestment (including net investment gains (losses) on securities sold and expenses directly related to these transactions) is excluded from the results of operations from Operating earnings before income taxes. When we present the adjustments to Net Income (loss) before income taxes on a consolidated basis, each adjustment excludes the relative portions attributable to businesses exited through reinsurance or divestment.
Effective April 1, 2015, we disposed of, via reinsurance, retained group reinsurance policies. Consistent with our practice to exclude business (including blocks of business) exited via reinsurance or divestment from Operating earnings before income taxes and from Operating revenues, beginning in the second quarter of 2015, the revenues and expenses of this reinsured block of business are excluded from these metrics.
Effective October 1, 2015, we disposed of, via reinsurance, a block of in-force term life contracts. Consistent with our practice to exclude business (including blocks of business) exited via reinsurance or divestment from operating earnings before income taxes and from operating revenues, beginning in the fourth quarter of 2015, the revenues and expenses of these reinsured blocks of business are excluded from these metrics.
The most directly comparable U.S. GAAP measure to Operating earnings before income taxes is Net income (loss) before income taxes. For a reconciliation of Operating earnings before Net income taxes to Net income (loss) before income taxes, and from Total Operating earnings before income taxes to Total adjusted operating earnings before income taxes, refer to the “Reconciliations” section in this document.
Page 3 of 84
Voya Financial
Explanatory Note on Non-GAAP Financial Information
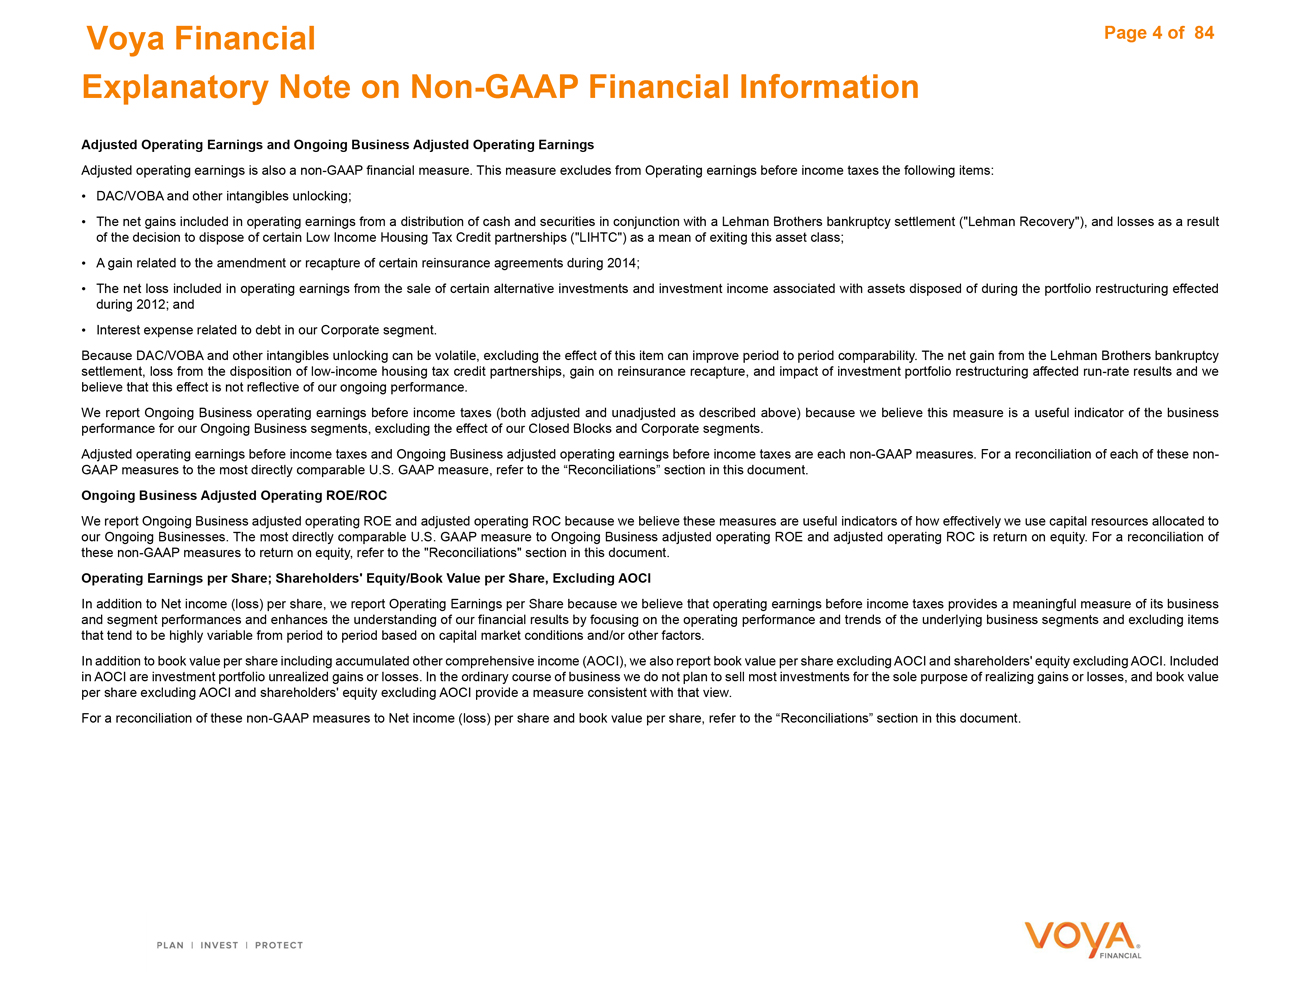
Adjusted Operating Earnings and Ongoing Business Adjusted Operating Earnings
Adjusted operating earnings is also a non-GAAP financial measure. This measure excludes from Operating earnings before income taxes the following items:
DAC/VOBA and other intangibles unlocking;
The net gains included in operating earnings from a distribution of cash and securities in conjunction with a Lehman Brothers bankruptcy settlement (“Lehman Recovery”), and losses as a result of the decision to dispose of certain Low Income Housing Tax Credit partnerships (“LIHTC”) as a mean of exiting this asset class;
A gain related to the amendment or recapture of certain reinsurance agreements during 2014;
The net loss included in operating earnings from the sale of certain alternative investments and investment income associated with assets disposed of during the portfolio restructuring effected during 2012; and
Interest expense related to debt in our Corporate segment.
Because DAC/VOBA and other intangibles unlocking can be volatile, excluding the effect of this item can improve period to period comparability. The net gain from the Lehman Brothers bankruptcy settlement, loss from the disposition of low-income housing tax credit partnerships, gain on reinsurance recapture, and impact of investment portfolio restructuring affected run-rate results and we believe that this effect is not reflective of our ongoing performance.
We report Ongoing Business operating earnings before income taxes (both adjusted and unadjusted as described above) because we believe this measure is a useful indicator of the business performance for our Ongoing Business segments, excluding the effect of our Closed Blocks and Corporate segments.
Adjusted operating earnings before income taxes and Ongoing Business adjusted operating earnings before income taxes are each non-GAAP measures. For a reconciliation of each of these non-GAAP measures to the most directly comparable U.S. GAAP measure, refer to the “Reconciliations” section in this document.
Ongoing Business Adjusted Operating ROE/ROC
We report Ongoing Business adjusted operating ROE and adjusted operating ROC because we believe these measures are useful indicators of how effectively we use capital resources allocated to our Ongoing Businesses. The most directly comparable U.S. GAAP measure to Ongoing Business adjusted operating ROE and adjusted operating ROC is return on equity. For a reconciliation of these non-GAAP measures to return on equity, refer to the “Reconciliations” section in this document.
Operating Earnings per Share; Shareholders’ Equity/Book Value per Share, Excluding AOCI
In addition to Net income (loss) per share, we report Operating Earnings per Share because we believe that operating earnings before income taxes provides a meaningful measure of its business and segment performances and enhances the understanding of our financial results by focusing on the operating performance and trends of the underlying business segments and excluding items that tend to be highly variable from period to period based on capital market conditions and/or other factors.
In addition to book value per share including accumulated other comprehensive income (AOCI), we also report book value per share excluding AOCI and shareholders’ equity excluding AOCI. Included in AOCI are investment portfolio unrealized gains or losses. In the ordinary course of business we do not plan to sell most investments for the sole purpose of realizing gains or losses, and book value per share excluding AOCI and shareholders’ equity excluding AOCI provide a measure consistent with that view.
For a reconciliation of these non-GAAP measures to Net income (loss) per share and book value per share, refer to the “Reconciliations” section in this document.
Page 4 of 84
Voya Financial
Explanatory Note on Non-GAAP Financial Information
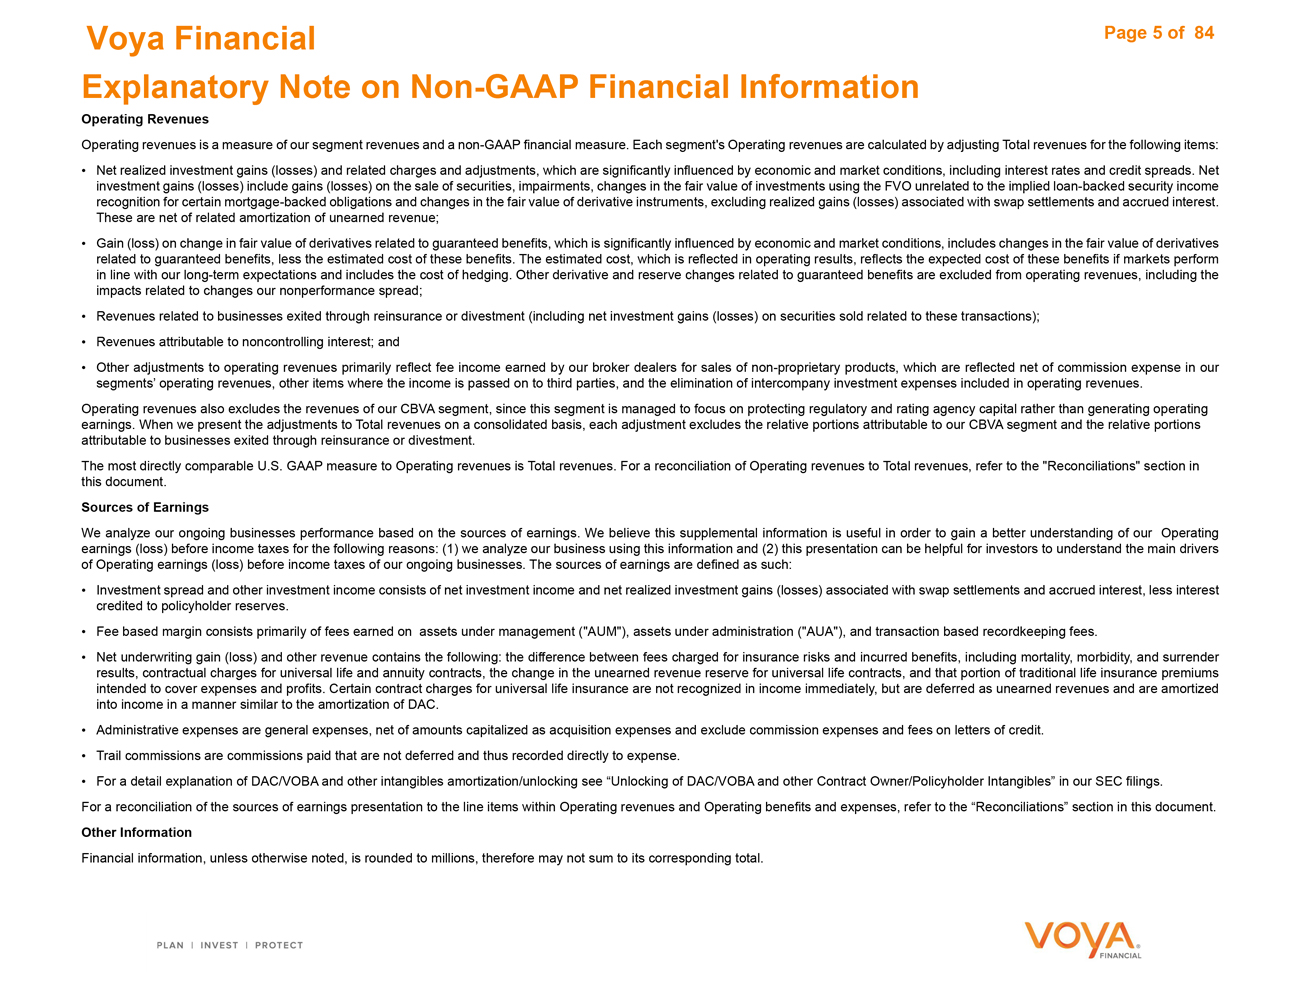
Operating Revenues
Operating revenues is a measure of our segment revenues and a non-GAAP financial measure. Each segment’s Operating revenues are calculated by adjusting Total revenues for the following items:
Net realized investment gains (losses) and related charges and adjustments, which are significantly influenced by economic and market conditions, including interest rates and credit spreads. Net investment gains (losses) include gains (losses) on the sale of securities, impairments, changes in the fair value of investments using the FVO unrelated to the implied loan-backed security income recognition for certain mortgage-backed obligations and changes in the fair value of derivative instruments, excluding realized gains (losses) associated with swap settlements and accrued interest. These are net of related amortization of unearned revenue;
Gain (loss) on change in fair value of derivatives related to guaranteed benefits, which is significantly influenced by economic and market conditions, includes changes in the fair value of derivatives related to guaranteed benefits, less the estimated cost of these benefits. The estimated cost, which is reflected in operating results, reflects the expected cost of these benefits if markets perform in line with our long-term expectations and includes the cost of hedging. Other derivative and reserve changes related to guaranteed benefits are excluded from operating revenues, including the impacts related to changes our nonperformance spread;
Revenues related to businesses exited through reinsurance or divestment (including net investment gains (losses) on securities sold related to these transactions);
Revenues attributable to noncontrolling interest; and
Other adjustments to operating revenues primarily reflect fee income earned by our broker dealers for sales of non-proprietary products, which are reflected net of commission expense in our segments’ operating revenues, other items where the income is passed on to third parties, and the elimination of intercompany investment expenses included in operating revenues.
Operating revenues also excludes the revenues of our CBVA segment, since this segment is managed to focus on protecting regulatory and rating agency capital rather than generating operating earnings. When we present the adjustments to Total revenues on a consolidated basis, each adjustment excludes the relative portions attributable to our CBVA segment and the relative portions attributable to businesses exited through reinsurance or divestment.
The most directly comparable U.S. GAAP measure to Operating revenues is Total revenues. For a reconciliation of Operating revenues to Total revenues, refer to the “Reconciliations” section in this document.
Sources of Earnings
We analyze our ongoing businesses performance based on the sources of earnings. We believe this supplemental information is useful in order to gain a better understanding of our Operating earnings (loss) before income taxes for the following reasons: (1) we analyze our business using this information and (2) this presentation can be helpful for investors to understand the main drivers of Operating earnings (loss) before income taxes of our ongoing businesses. The sources of earnings are defined as such:
Investment spread and other investment income consists of net investment income and net realized investment gains (losses) associated with swap settlements and accrued interest, less interest credited to policyholder reserves.
Fee based margin consists primarily of fees earned on assets under management (“AUM”), assets under administration (“AUA”), and transaction based recordkeeping fees.
Net underwriting gain (loss) and other revenue contains the following: the difference between fees charged for insurance risks and incurred benefits, including mortality, morbidity, and surrender results, contractual charges for universal life and annuity contracts, the change in the unearned revenue reserve for universal life contracts, and that portion of traditional life insurance premiums intended to cover expenses and profits. Certain contract charges for universal life insurance are not recognized in income immediately, but are deferred as unearned revenues and are amortized into income in a manner similar to the amortization of DAC.
Administrative expenses are general expenses, net of amounts capitalized as acquisition expenses and exclude commission expenses and fees on letters of credit.
Trail commissions are commissions paid that are not deferred and thus recorded directly to expense.
For a detail explanation of DAC/VOBA and other intangibles amortization/unlocking see “Unlocking of DAC/VOBA and other Contract Owner/Policyholder Intangibles” in our SEC filings.
For a reconciliation of the sources of earnings presentation to the line items within Operating revenues and Operating benefits and expenses, refer to the “Reconciliations” section in this document.
Other Information
Financial information, unless otherwise noted, is rounded to millions, therefore may not sum to its corresponding total.
Page 5 of 84
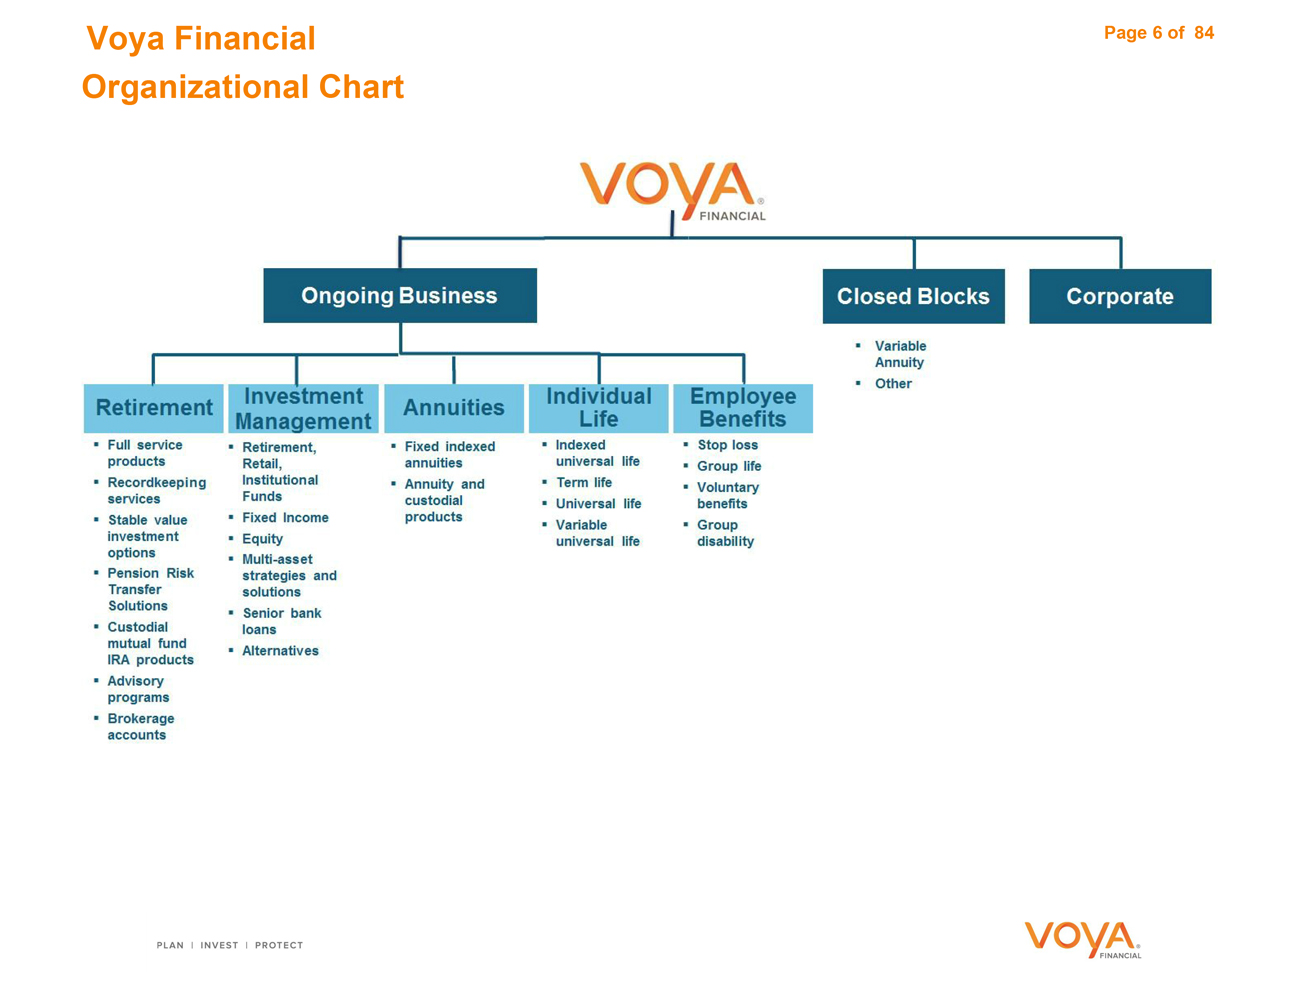
Voya Financial Organizational Chart
Page 6 of 84
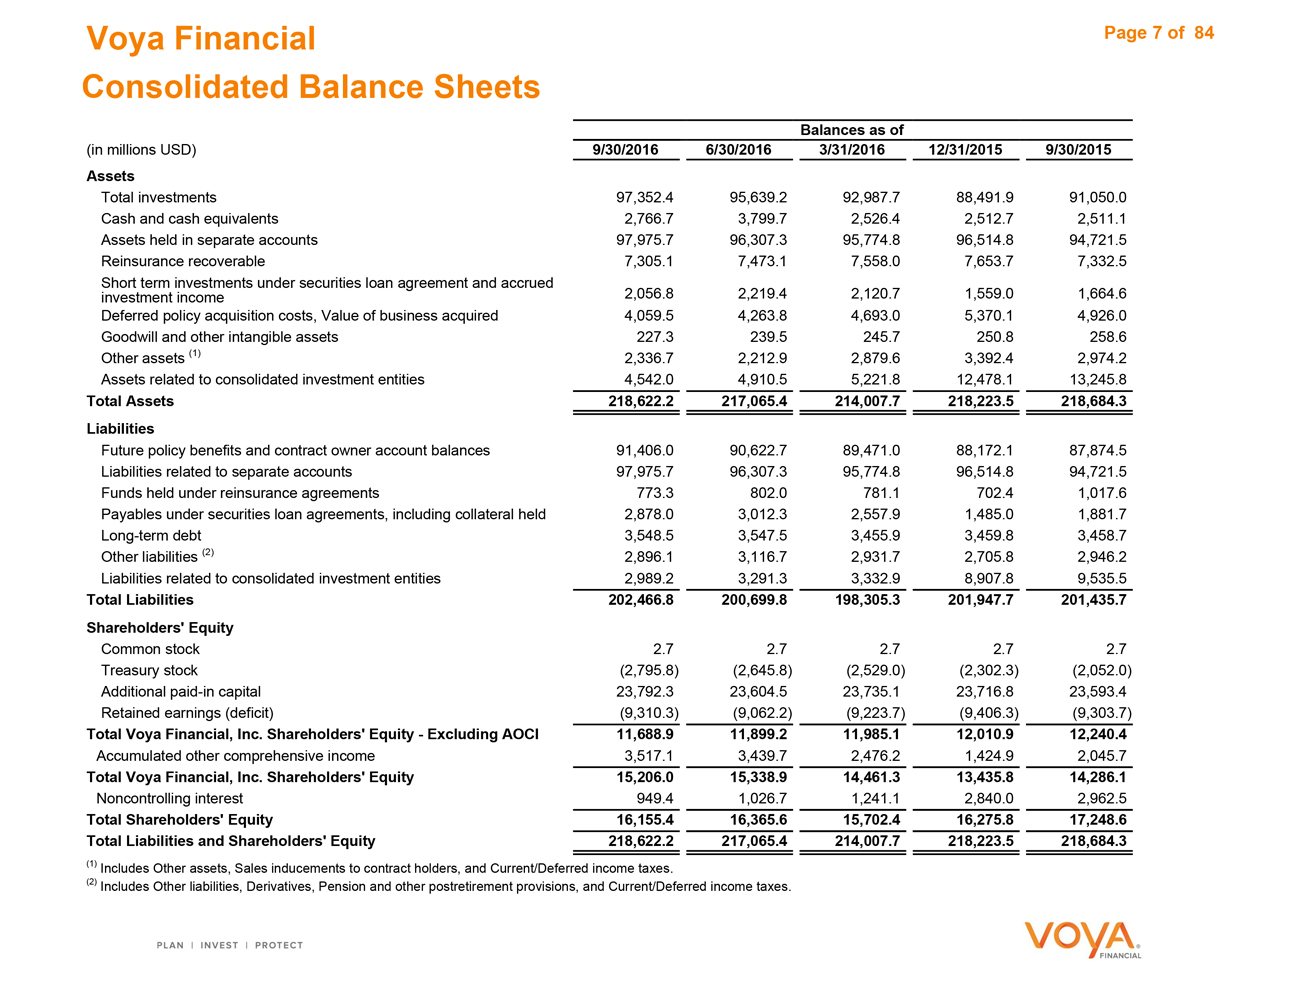
Voya Financial
Consolidated Balance Sheets
Balances as of
(in millions USD) 9/30/2016 6/30/2016 3/31/2016 12/31/2015 9/30/2015
Assets
Total investments 97,352.4 95,639.2 92,987.7 88,491.9 91,050.0
Cash and cash equivalents 2,766.7 3,799.7 2,526.4 2,512.7 2,511.1
Assets held in separate accounts 97,975.7 96,307.3 95,774.8 96,514.8 94,721.5
Reinsurance recoverable 7,305.1 7,473.1 7,558.0 7,653.7 7,332.5
Short term investments under securities loan agreement and accrued
investment income 2,056.8 2,219.4 2,120.7 1,559.0 1,664.6
Deferred policy acquisition costs, Value of business acquired 4,059.5 4,263.8 4,693.0 5,370.1 4,926.0
Goodwill and other intangible assets 227.3 239.5 245.7 250.8 258.6
Other assets (1) 2,336.7 2,212.9 2,879.6 3,392.4 2,974.2
Assets related to consolidated investment entities 4,542.0 4,910.5 5,221.8 12,478.1 13,245.8
Total Assets 218,622.2 217,065.4 214,007.7 218,223.5 218,684.3
Liabilities
Future policy benefits and contract owner account balances 91,406.0 90,622.7 89,471.0 88,172.1 87,874.5
Liabilities related to separate accounts 97,975.7 96,307.3 95,774.8 96,514.8 94,721.5
Funds held under reinsurance agreements 773.3 802.0 781.1 702.4 1,017.6
Payables under securities loan agreements, including collateral held 2,878.0 3,012.3 2,557.9 1,485.0 1,881.7
Long-term debt 3,548.5 3,547.5 3,455.9 3,459.8 3,458.7
Other liabilities (2) 2,896.1 3,116.7 2,931.7 2,705.8 2,946.2
Liabilities related to consolidated investment entities 2,989.2 3,291.3 3,332.9 8,907.8 9,535.5
Total Liabilities 202,466.8 200,699.8 198,305.3 201,947.7 201,435.7
Shareholders’ Equity
Common stock 2.7 2.7 2.7 2.7 2.7
Treasury stock (2,795.8) (2,645.8) (2,529.0) (2,302.3) (2,052.0)
Additional paid-in capital 23,792.3 23,604.5 23,735.1 23,716.8 23,593.4
Retained earnings (deficit) (9,310.3) (9,062.2) (9,223.7) (9,406.3) (9,303.7)
Total Voya Financial, Inc. Shareholders’ Equity—Excluding AOCI 11,688.9 11,899.2 11,985.1 12,010.9 12,240.4
Accumulated other comprehensive income 3,517.1 3,439.7 2,476.2 1,424.9 2,045.7
Total Voya Financial, Inc. Shareholders’ Equity 15,206.0 15,338.9 14,461.3 13,435.8 14,286.1
Noncontrolling interest 949.4 1,026.7 1,241.1 2,840.0 2,962.5
Total Shareholders’ Equity 16,155.4 16,365.6 15,702.4 16,275.8 17,248.6
Total Liabilities and Shareholders’ Equity 218,622.2 217,065.4 214,007.7 218,223.5 218,684.3
(1) Includes Other assets, Sales inducements to contract holders, and Current/Deferred income taxes.
(2) Includes Other liabilities, Derivatives, Pension and other postretirement provisions, and Current/Deferred income taxes.
Page 7 of 84

Voya Financial
Consolidated Statements of Operations
Three Months Ended Year-to-Date
(in millions USD) 9/30/2016 6/30/2016 3/31/2016 12/31/2015 9/30/2015 9/30/2016 9/30/2015
Revenues
Net investment income 1,163.4 1,175.2 1,094.1 1,178.5 1,103.6 3,432.7 3,359.8
Fee income 857.9 826.7 825.8 837.1 871.8 2,510.4 2,644.0
Premiums 726.7 711.6 966.8 619.7 1,128.8 2,405.1 2,404.8
Net realized capital gains (losses) (367.7) (101.3) 10.7 (772.6) 299.1 (458.3) 39.3
Income (loss) related to consolidated investment entities 57.7 (0.8) 29.1 18.5 186.4 86.0 505.7
Other revenues 90.5 84.6 82.8 91.6 106.7 257.9 315.3
Total revenues 2,528.5 2,696.0 3,009.3 1,972.8 3,696.4 8,233.8 9,268.9
Benefits and expenses
Interest credited and other benefits to contract owners/
policyholders (1,906.9) (1,549.7) (1,875.7) (1,234.5) (2,454.8) (5,332.3) (5,275.5)
Operating expenses (723.6) (716.4) (720.2) (788.3) (727.8) (2,160.2) (2,215.2)
Net amortization of DAC/VOBA (180.7) (98.0) (102.5) (75.9) (316.3) (381.2) (587.5)
Interest expense (45.4) (149.7) (47.7) (46.1) (46.4) (242.8) (150.4)
Operating expenses related to consolidated investment
entities (27.8) (29.1) (21.9) (71.3) (70.8) (78.8) (212.5)
Total benefits and expenses (2,884.4) (2,542.9) (2,768.0) (2,216.1) (3,616.1) (8,195.3) (8,441.1)
Income (loss) before income taxes (355.9) 153.1 241.3 (243.3) 80.3 38.5 827.8
Page 8 of 84
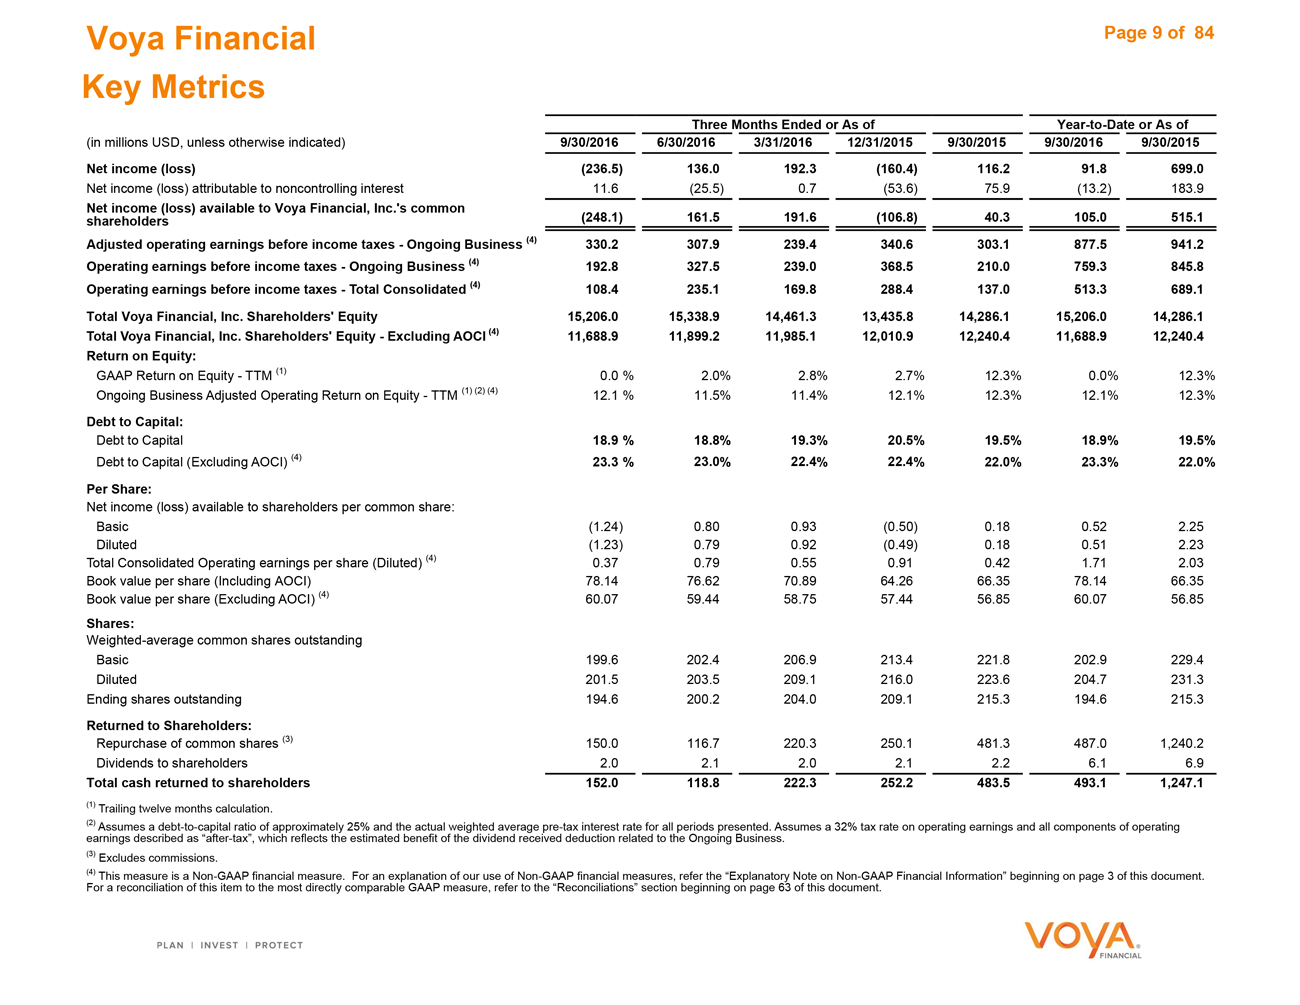
Voya Financial Key Metrics
Three Months Ended or As of Year-to-Date or As of
(in millions USD, unless otherwise indicated) 9/30/2016 6/30/2016 3/31/2016 12/31/2015 9/30/2015 9/30/2016 9/30/2015
Net income (loss) (236.5) 136.0 192.3 (160.4) 116.2 91.8 699.0
Net income (loss) attributable to noncontrolling interest 11.6 (25.5) 0.7 (53.6) 75.9 (13.2) 183.9
Net income (loss) available to Voya Financial, Inc.‘s common
shareholders (248.1) 161.5 191.6 (106.8) 40.3 105.0 515.1
Adjusted operating earnings before income taxes—Ongoing Business (4) 330.2 307.9 239.4 340.6 303.1 877.5 941.2
Operating earnings before income taxes—Ongoing Business (4) 192.8 327.5 239.0 368.5 210.0 759.3 845.8
Operating earnings before income taxes—Total Consolidated (4) 108.4 235.1 169.8 288.4 137.0 513.3 689.1
Total Voya Financial, Inc. Shareholders’ Equity 15,206.0 15,338.9 14,461.3 13,435.8 14,286.1 15,206.0 14,286.1
Total Voya Financial, Inc. Shareholders’ Equity—Excluding AOCI (4) 11,688.9 11,899.2 11,985.1 12,010.9 12,240.4 11,688.9 12,240.4
Return on Equity:
GAAP Return on Equity—TTM (1) 0.0 % 2.0% 2.8% 2.7% 12.3% 0.0% 12.3%
Ongoing Business Adjusted Operating Return on Equity—TTM (1) (2) (4) 12.1 % 11.5% 11.4% 12.1% 12.3% 12.1% 12.3%
Debt to Capital:
Debt to Capital 18.9 % 18.8% 19.3% 20.5% 19.5% 18.9% 19.5%
Debt to Capital (Excluding AOCI) (4) 23.3 % 23.0% 22.4% 22.4% 22.0% 23.3% 22.0%
Per Share:
Net income (loss) available to shareholders per common share:
Basic (1.24) 0.80 0.93 (0.50) 0.18 0.52 2.25
Diluted (1.23) 0.79 0.92 (0.49) 0.18 0.51 2.23
Total Consolidated Operating earnings per share (Diluted) (4) 0.37 0.79 0.55 0.91 0.42 1.71 2.03
Book value per share (Including AOCI) 78.14 76.62 70.89 64.26 66.35 78.14 66.35
Book value per share (Excluding AOCI) (4) 60.07 59.44 58.75 57.44 56.85 60.07 56.85
Shares:
Weighted-average common shares outstanding
Basic 199.6 202.4 206.9 213.4 221.8 202.9 229.4
Diluted 201.5 203.5 209.1 216.0 223.6 204.7 231.3
Ending shares outstanding 194.6 200.2 204.0 209.1 215.3 194.6 215.3
Returned to Shareholders:
Repurchase of common shares (3) 150.0 116.7 220.3 250.1 481.3 487.0 1,240.2
Dividends to shareholders 2.0 2.1 2.0 2.1 2.2 6.1 6.9
Total cash returned to shareholders 152.0 118.8 222.3 252.2 483.5 493.1 1,247.1
(1) Trailing twelve months calculation.
(2) Assumes a debt-to-capital ratio of approximately 25% and the actual weighted average pre-tax interest rate for all periods presented. Assumes a 32% tax rate on operating earnings and all components of operating
earnings described as “after-tax”, which reflects the estimated benefit of the dividend received deduction related to the Ongoing Business.
(3) Excludes commissions.
(4) This measure is a Non-GAAP financial measure. For an explanation of our use of Non-GAAP financial measures, refer the “Explanatory Note on Non-GAAP Financial Information” beginning on page 3 of this document.
For a reconciliation of this item to the most directly comparable GAAP measure, refer to the “Reconciliations” section beginning on page 63 of this document.
Page 9 of 84
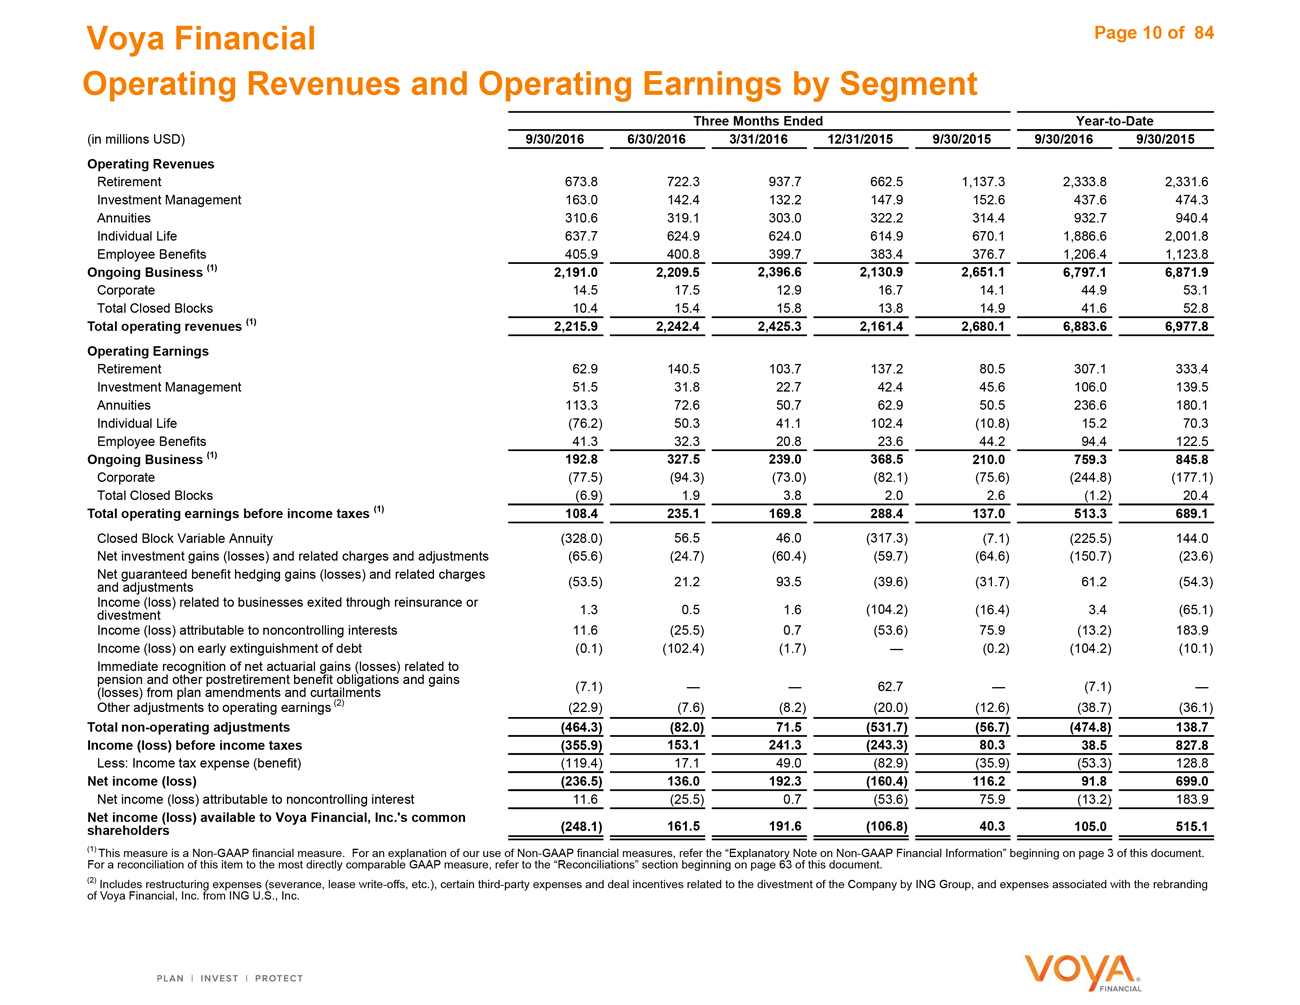
Voya Financial
Operating Revenues and Operating Earnings by Segment
Three Months Ended Year-to-Date
(in millions USD) 9/30/2016 6/30/2016 3/31/2016 12/31/2015 9/30/2015 9/30/2016 9/30/2015
Operating Revenues
Retirement 673.8 722.3 937.7 662.5 1,137.3 2,333.8 2,331.6
Investment Management 163.0 142.4 132.2 147.9 152.6 437.6 474.3
Annuities 310.6 319.1 303.0 322.2 314.4 932.7 940.4
Individual Life 637.7 624.9 624.0 614.9 670.1 1,886.6 2,001.8
Employee Benefits 405.9 400.8 399.7 383.4 376.7 1,206.4 1,123.8
Ongoing Business (1) 2,191.0 2,209.5 2,396.6 2,130.9 2,651.1 6,797.1 6,871.9
Corporate 14.5 17.5 12.9 16.7 14.1 44.9 53.1
Total Closed Blocks 10.4 15.4 15.8 13.8 14.9 41.6 52.8
Total operating revenues (1) 2,215.9 2,242.4 2,425.3 2,161.4 2,680.1 6,883.6 6,977.8
Operating Earnings
Retirement 62.9 140.5 103.7 137.2 80.5 307.1 333.4
Investment Management 51.5 31.8 22.7 42.4 45.6 106.0 139.5
Annuities 113.3 72.6 50.7 62.9 50.5 236.6 180.1
Individual Life (76.2) 50.3 41.1 102.4 (10.8) 15.2 70.3
Employee Benefits 41.3 32.3 20.8 23.6 44.2 94.4 122.5
Ongoing Business (1) 192.8 327.5 239.0 368.5 210.0 759.3 845.8
Corporate (77.5) (94.3) (73.0) (82.1) (75.6) (244.8) (177.1)
Total Closed Blocks (6.9) 1.9 3.8 2.0 2.6 (1.2) 20.4
Total operating earnings before income taxes (1) 108.4 235.1 169.8 288.4 137.0 513.3 689.1
Closed Block Variable Annuity (328.0) 56.5 46.0 (317.3) (7.1) (225.5) 144.0
Net investment gains (losses) and related charges and adjustments (65.6) (24.7) (60.4) (59.7) (64.6) (150.7) (23.6)
Net guaranteed benefit hedging gains (losses) and related charges
and adjustments (53.5) 21.2 93.5 (39.6) (31.7) 61.2 (54.3)
Income (loss) related to businesses exited through reinsurance or
divestment 1.3 0.5 1.6 (104.2) (16.4) 3.4 (65.1)
Income (loss) attributable to noncontrolling interests 11.6 (25.5) 0.7 (53.6) 75.9 (13.2) 183.9
Income (loss) on early extinguishment of debt (0.1) (102.4) (1.7) — (0.2) (104.2) (10.1)
Immediate recognition of net actuarial gains (losses) related to
pension and other postretirement benefit obligations and gains
(losses) from plan amendments and curtailments (7.1) — — 62.7 — (7.1) —
Other adjustments to operating earnings (2) (22.9) (7.6) (8.2) (20.0) (12.6) (38.7) (36.1)
Total non-operating adjustments (464.3) (82.0) 71.5 (531.7) (56.7) (474.8) 138.7
Income (loss) before income taxes (355.9) 153.1 241.3 (243.3) 80.3 38.5 827.8
Less: Income tax expense (benefit) (119.4) 17.1 49.0 (82.9) (35.9) (53.3) 128.8
Net income (loss) (236.5) 136.0 192.3 (160.4) 116.2 91.8 699.0
Net income (loss) attributable to noncontrolling interest 11.6 (25.5) 0.7 (53.6) 75.9 (13.2) 183.9
Net income (loss) available to Voya Financial, Inc.‘s common
shareholders (248.1) 161.5 191.6 (106.8) 40.3 105.0 515.1
(1) This measure is a Non-GAAP financial measure. For an explanation of our use of Non-GAAP financial measures, refer the “Explanatory Note on Non-GAAP Financial Information” beginning on page 3 of this document.
For a reconciliation of this item to the most directly comparable GAAP measure, refer to the “Reconciliations” section beginning on page 63 of this document.
(2) Includes restructuring expenses (severance, lease write-offs, etc.), certain third-party expenses and deal incentives related to the divestment of the Company by ING Group, and expenses associated with the rebranding
of Voya Financial, Inc. from ING U.S., Inc.
Page 10 of 84
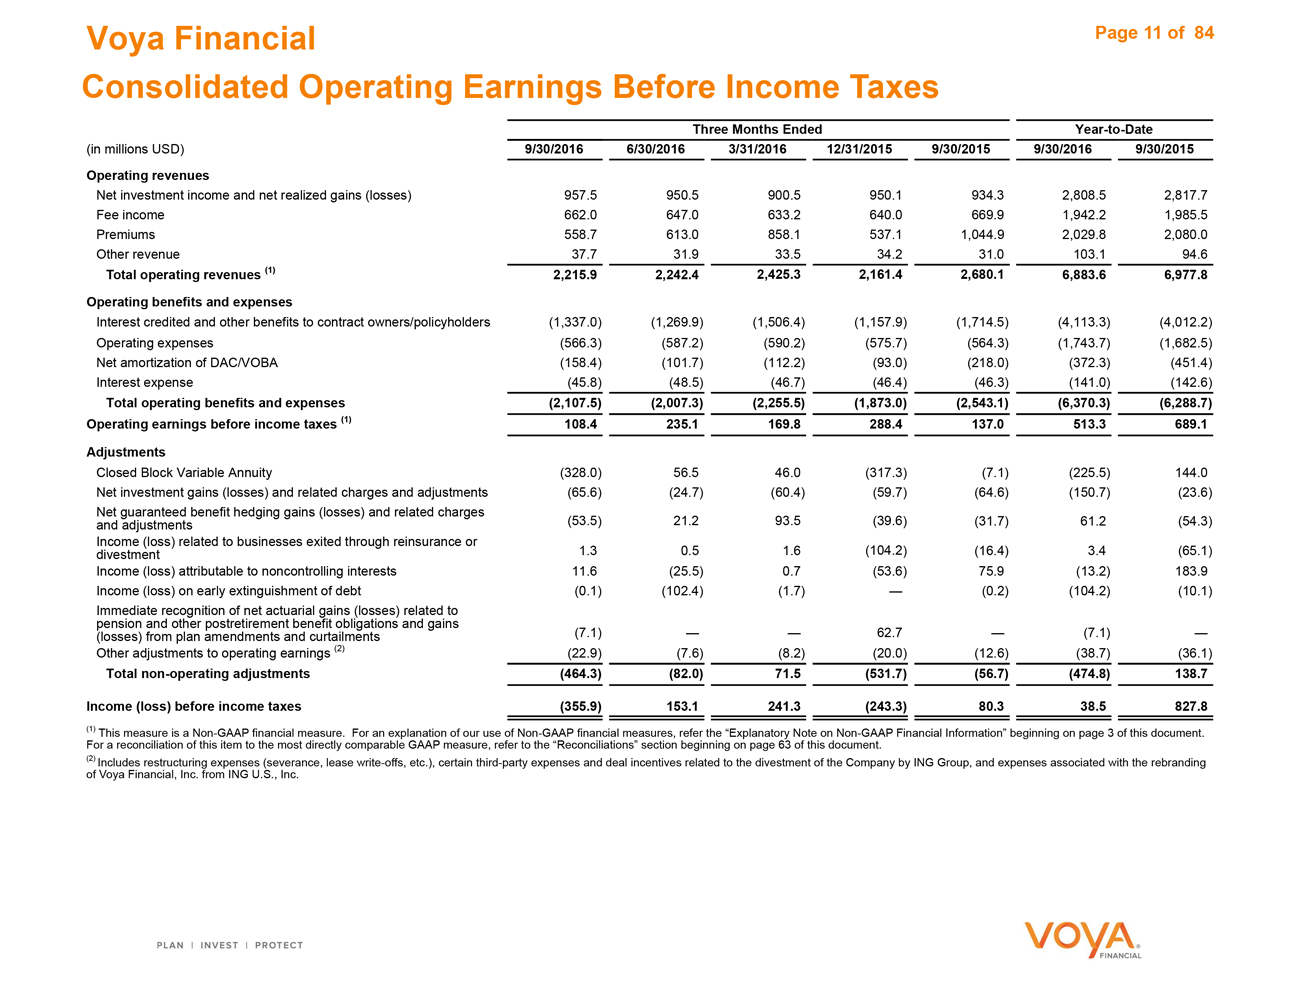
Voya Financial
Consolidated Operating Earnings Before Income Taxes
Three Months Ended Year-to-Date
(in millions USD) 9/30/2016 6/30/2016 3/31/2016 12/31/2015 9/30/2015 9/30/2016 9/30/2015
Operating revenues
Net investment income and net realized gains (losses) 957.5 950.5 900.5 950.1 934.3 2,808.5 2,817.7
Fee income 662.0 647.0 633.2 640.0 669.9 1,942.2 1,985.5
Premiums 558.7 613.0 858.1 537.1 1,044.9 2,029.8 2,080.0
Other revenue 37.7 31.9 33.5 34.2 31.0 103.1 94.6
Total operating revenues (1) 2,215.9 2,242.4 2,425.3 2,161.4 2,680.1 6,883.6 6,977.8
Operating benefits and expenses
Interest credited and other benefits to contract owners/policyholders (1,337.0) (1,269.9) (1,506.4) (1,157.9) (1,714.5) (4,113.3) (4,012.2)
Operating expenses (566.3) (587.2) (590.2) (575.7) (564.3) (1,743.7) (1,682.5)
Net amortization of DAC/VOBA (158.4) (101.7) (112.2) (93.0) (218.0) (372.3) (451.4)
Interest expense (45.8) (48.5) (46.7) (46.4) (46.3) (141.0) (142.6)
Total operating benefits and expenses (2,107.5) (2,007.3) (2,255.5) (1,873.0) (2,543.1) (6,370.3) (6,288.7)
Operating earnings before income taxes (1) 108.4 235.1 169.8 288.4 137.0 513.3 689.1
Adjustments
Closed Block Variable Annuity (328.0) 56.5 46.0 (317.3) (7.1) (225.5) 144.0
Net investment gains (losses) and related charges and adjustments (65.6) (24.7) (60.4) (59.7) (64.6) (150.7) (23.6)
Net guaranteed benefit hedging gains (losses) and related charges (53.5) 21.2 93.5 (39.6)
and adjustments (31.7) 61.2 (54.3)
Income (loss) related to businesses exited through reinsurance or
divestment 1.3 0.5 1.6 (104.2) (16.4) 3.4 (65.1)
Income (loss) attributable to noncontrolling interests 11.6 (25.5) 0.7 (53.6) 75.9 (13.2) 183.9
Income (loss) on early extinguishment of debt (0.1) (102.4) (1.7) — (0.2) (104.2) (10.1)
Immediate recognition of net actuarial gains (losses) related to
pension and other postretirement benefit obligations and gains (7.1
(losses) from plan amendments and curtailments ) — — 62.7 — (7.1) —
Other adjustments to operating earnings (2) (22.9) (7.6) (8.2) (20.0) (12.6) (38.7) (36.1)
Total non-operating adjustments (464.3) (82.0) 71.5 (531.7) (56.7) (474.8) 138.7
Income (loss) before income taxes (355.9) 153.1 241.3 (243.3) 80.3 38.5 827.8
(1) This measure is a Non-GAAP financial measure. For an explanation of our use of Non-GAAP financial measures, refer the “Explanatory Note on Non-GAAP Financial Information” beginning on page 3 of this document.
For a reconciliation of this item to the most directly comparable GAAP measure, refer to the “Reconciliations” section beginning on page 63 of this document.
(2) Includes restructuring expenses (severance, lease write-offs, etc.), certain third-party expenses and deal incentives related to the divestment of the Company by ING Group, and expenses associated with the rebranding
of Voya Financial, Inc. from ING U.S., Inc.
Page 11 of 84
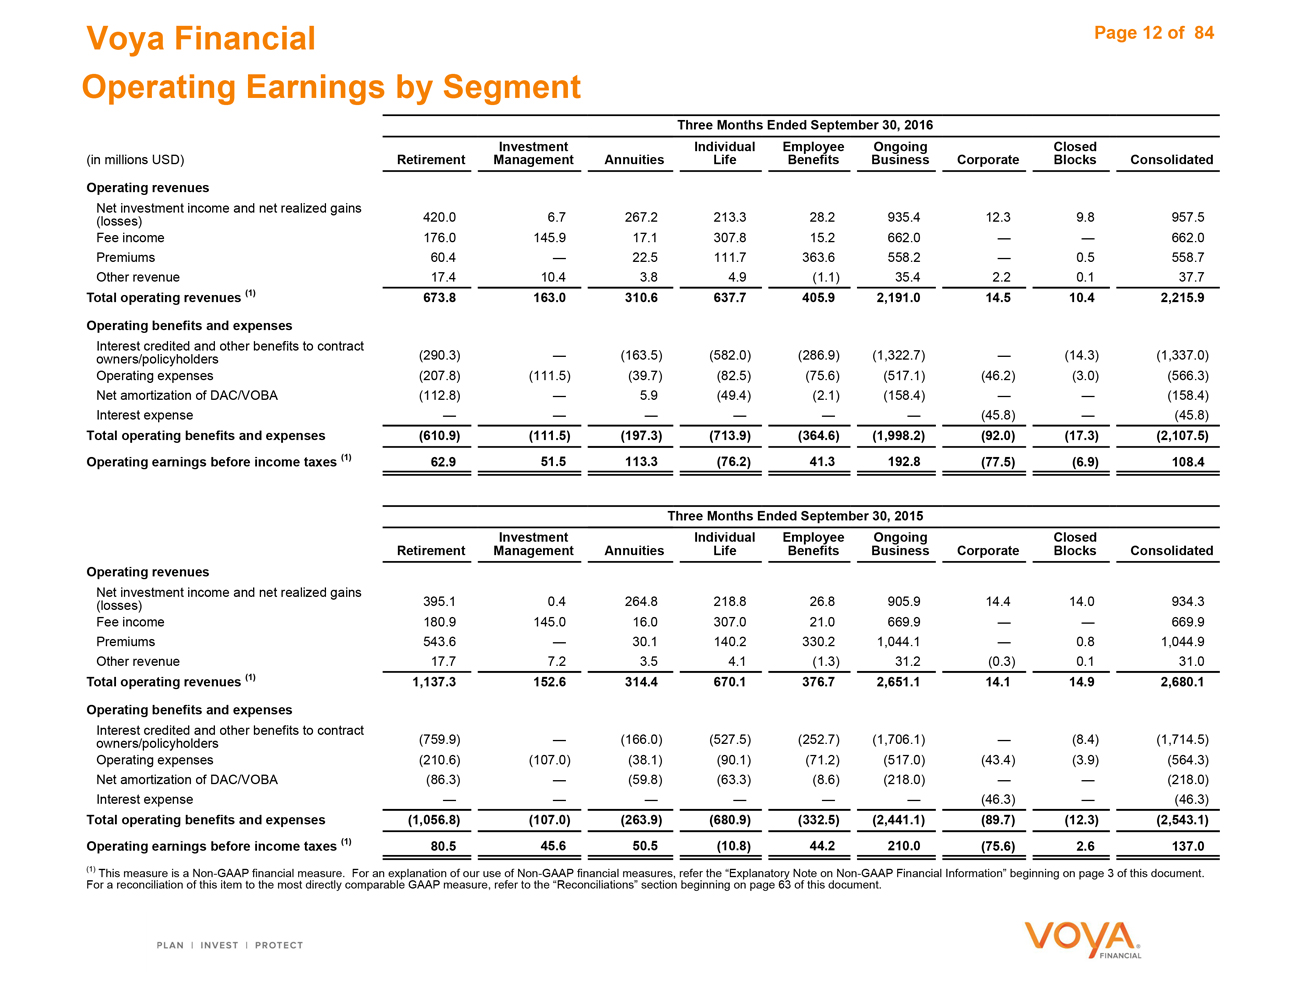
Voya Financial
Operating Earnings by Segment
Three Months Ended September 30, 2016
Investment Individual Employee Ongoing Closed
(in millions USD) Retirement Management Annuities Life Benefits Business Corporate Blocks Consolidated
Operating revenues
Net investment income and net realized gains 420.0
(losses) 6.7 267.2 213.3 28.2 935.4 12.3 9.8 957.5
Fee income 176.0 145.9 17.1 307.8 15.2 662.0 — — 662.0
Premiums 60.4 — 22.5 111.7 363.6 558.2 — 0.5 558.7
Other revenue 17.4 10.4 3.8 4.9 (1.1) 35.4 2.2 0.1 37.7
Total operating revenues (1) 673.8 163.0 310.6 637.7 405.9 2,191.0 14.5 10.4 2,215.9
Operating benefits and expenses
Interest credited and other benefits to contract
owners/policyholders (290.3) — (163.5) (582.0) (286.9) (1,322.7) — (14.3) (1,337.0)
Operating expenses (207.8) (111.5) (39.7) (82.5) (75.6) (517.1) (46.2) (3.0) (566.3)
Net amortization of DAC/VOBA (112.8) — 5.9 (49.4) (2.1) (158.4) — — (158.4)
Interest expense — — — — — — (45.8) — (45.8)
Total operating benefits and expenses (610.9) (111.5) (197.3) (713.9) (364.6) (1,998.2) (92.0) (17.3) (2,107.5)
Operating earnings before income taxes (1) 62.9 51.5 113.3 (76.2) 41.3 192.8 (77.5) (6.9) 108.4
Three Months Ended September 30, 2015
Investment Individual Employee Ongoing Closed
Retirement Management Annuities Life Benefits Business Corporate Blocks Consolidated
Operating revenues
Net investment income and net realized gains 395.1
(losses) 0.4 264.8 218.8 26.8 905.9 14.4 14.0 934.3
Fee income 180.9 145.0 16.0 307.0 21.0 669.9 — — 669.9
Premiums 543.6 — 30.1 140.2 330.2 1,044.1 — 0.8 1,044.9
Other revenue 17.7 7.2 3.5 4.1 (1.3) 31.2 (0.3) 0.1 31.0
Total operating revenues (1) 1,137.3 152.6 314.4 670.1 376.7 2,651.1 14.1 14.9 2,680.1
Operating benefits and expenses
Interest credited and other benefits to contract
owners/policyholders (759.9) — (166.0) (527.5) (252.7) (1,706.1) — (8.4) (1,714.5)
Operating expenses (210.6) (107.0) (38.1) (90.1) (71.2) (517.0) (43.4) (3.9) (564.3)
Net amortization of DAC/VOBA (86.3) — (59.8) (63.3) (8.6) (218.0) — — (218.0)
Interest expense — — — — — — (46.3) — (46.3)
Total operating benefits and expenses (1,056.8) (107.0) (263.9) (680.9) (332.5) (2,441.1) (89.7) (12.3) (2,543.1)
Operating earnings before income taxes (1) 80.5 45.6 50.5 (10.8) 44.2 210.0 (75.6) 2.6 137.0
(1) This measure is a Non-GAAP financial measure. For an explanation of our use of Non-GAAP financial measures, refer the “Explanatory Note on Non-GAAP Financial Information” beginning on page 3 of this document.
For a reconciliation of this item to the most directly comparable GAAP measure, refer to the “Reconciliations” section beginning on page 63 of this document.
Page 12 of 84
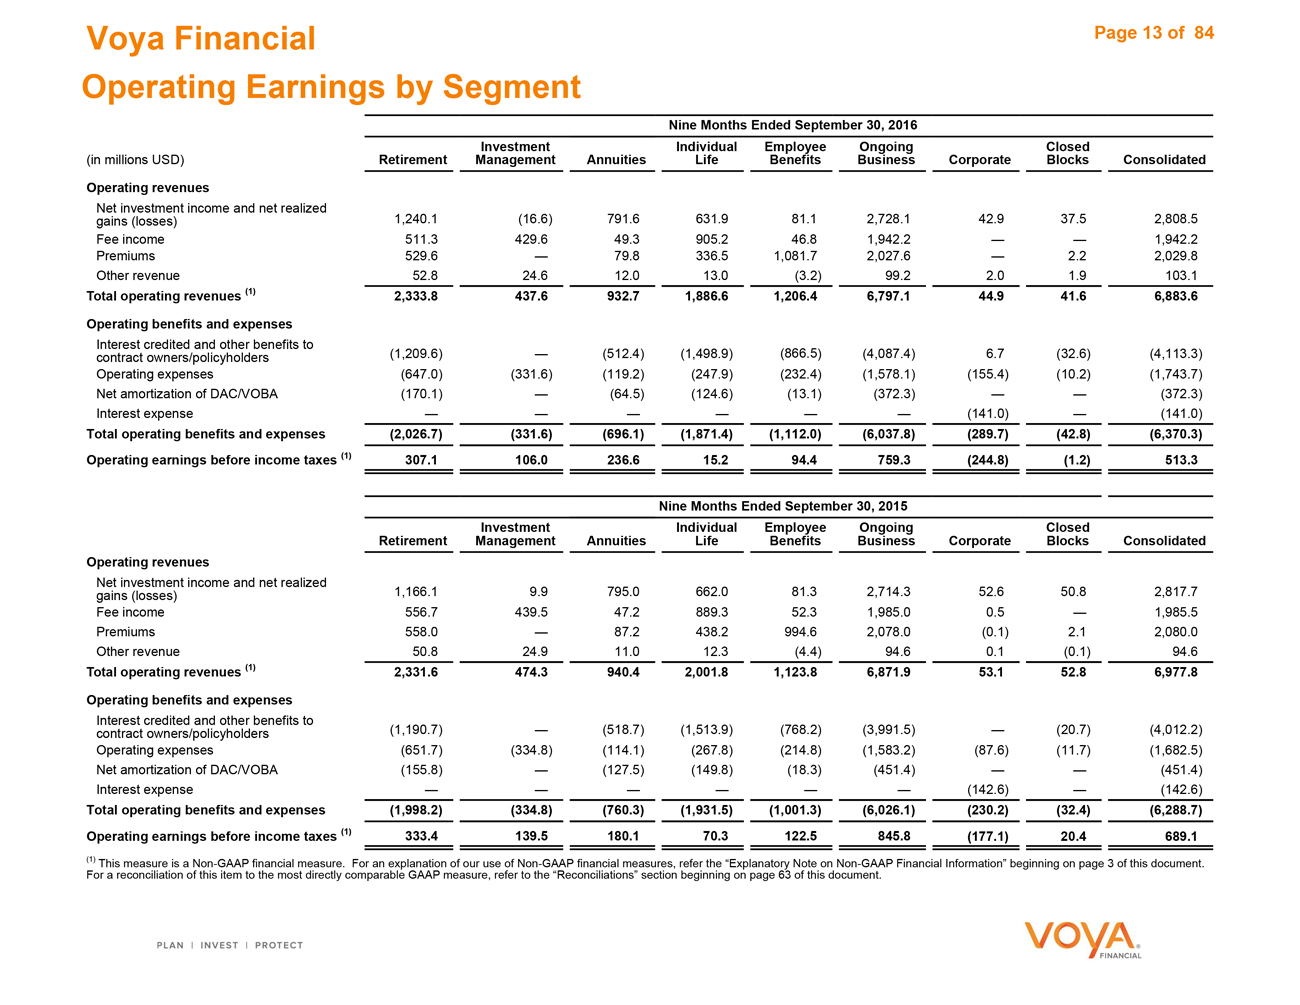
Voya Financial
Operating Earnings by Segment
Nine Months Ended September 30, 2016
Investment Individual Employee Ongoing Closed
(in millions USD) Retirement Management Annuities Life Benefits Business Corporate Blocks Consolidated
Operating revenues
Net investment income and net realized
gains (losses) 1,240.1 (16.6) 791.6 631.9 81.1 2,728.1 42.9 37.5 2,808.5
Fee income 511.3 429.6 49.3 905.2 46.8 1,942.2 — — 1,942.2
Premiums 529.6 — 79.8 336.5 1,081.7 2,027.6 — 2.2 2,029.8
Other revenue 52.8 24.6 12.0 13.0 (3.2) 99.2 2.0 1.9 103.1
Total operating revenues (1) 2,333.8 437.6 932.7 1,886.6 1,206.4 6,797.1 44.9 41.6 6,883.6
Operating benefits and expenses
Interest credited and other benefits to
contract owners/policyholders (1,209.6) — (512.4) (1,498.9) (866.5) (4,087.4) 6.7 (32.6) (4,113.3)
Operating expenses (647.0) (331.6) (119.2) (247.9) (232.4) (1,578.1) (155.4) (10.2) (1,743.7)
Net amortization of DAC/VOBA (170.1) — (64.5) (124.6) (13.1) (372.3) — — (372.3)
Interest expense — — — — — — (141.0) — (141.0)
Total operating benefits and expenses (2,026.7) (331.6) (696.1) (1,871.4) (1,112.0) (6,037.8) (289.7) (42.8) (6,370.3)
Operating earnings before income taxes (1) 307.1 106.0 236.6 15.2 94.4 759.3 (244.8) (1.2) 513.3
Nine Months Ended September 30, 2015
Investment Individual Employee Ongoing Closed
Retirement Management Annuities Life Benefits Business Corporate Blocks Consolidated
Operating revenues
Net investment income and net realized
gains (losses) 1,166.1 9.9 795.0 662.0 81.3 2,714.3 52.6 50.8 2,817.7
Fee income 556.7 439.5 47.2 889.3 52.3 1,985.0 0.5 — 1,985.5
Premiums 558.0 — 87.2 438.2 994.6 2,078.0 (0.1) 2.1 2,080.0
Other revenue 50.8 24.9 11.0 12.3 (4.4) 94.6 0.1 (0.1) 94.6
Total operating revenues (1) 2,331.6 474.3 940.4 2,001.8 1,123.8 6,871.9 53.1 52.8 6,977.8
Operating benefits and expenses
Interest credited and other benefits to
contract owners/policyholders (1,190.7) — (518.7) (1,513.9) (768.2) (3,991.5) — (20.7) (4,012.2)
Operating expenses (651.7) (334.8) (114.1) (267.8) (214.8) (1,583.2) (87.6) (11.7) (1,682.5)
Net amortization of DAC/VOBA (155.8) — (127.5) (149.8) (18.3) (451.4) — — (451.4)
Interest expense — — — — — — (142.6) — (142.6)
Total operating benefits and expenses (1,998.2) (334.8) (760.3) (1,931.5) (1,001.3) (6,026.1) (230.2) (32.4) (6,288.7)
Operating earnings before income taxes (1) 333.4 139.5 180.1 70.3 122.5 845.8 (177.1) 20.4 689.1
(1) This measure is a Non-GAAP financial measure. For an explanation of our use of Non-GAAP financial measures, refer the “Explanatory Note on Non-GAAP Financial Information” beginning on page 3 of this document.
For a reconciliation of this item to the most directly comparable GAAP measure, refer to the “Reconciliations” section beginning on page 63 of this document.
Page 13 of 84
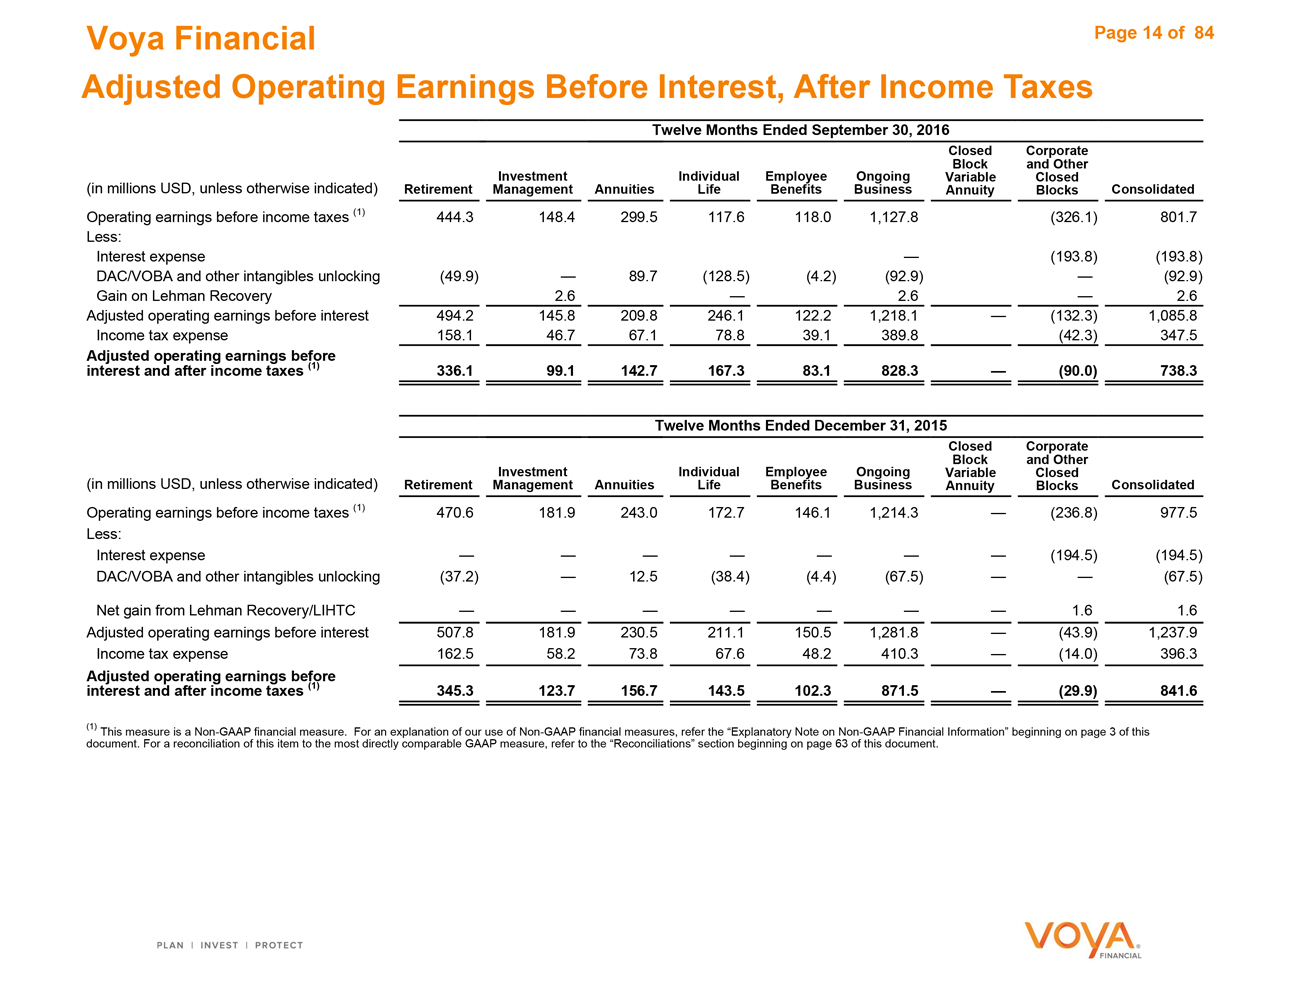
Voya Financial
Adjusted Operating Earnings Before Interest, After Income Taxes
Twelve Months Ended September 30, 2016
Closed Corporate
Block and Other
Investment Individual Employee Ongoing Variable Closed
(in millions USD, unless otherwise indicated) Retirement Management Annuities Life Benefits Business Annuity Blocks Consolidated
Operating earnings before income taxes (1) 444.3 148.4 299.5 117.6 118.0 1,127.8 (326.1) 801.7
Less:
Interest expense — (193.8) (193.8)
DAC/VOBA and other intangibles unlocking (49.9) — 89.7 (128.5) (4.2) (92.9) — (92.9)
Gain on Lehman Recovery 2.6 — 2.6 — 2.6
Adjusted operating earnings before interest 494.2 145.8 209.8 246.1 122.2 1,218.1 — (132.3) 1,085.8
Income tax expense 158.1 46.7 67.1 78.8 39.1 389.8 (42.3) 347.5
Adjusted operating earnings before
interest and after income taxes (1) 336.1 99.1 142.7 167.3 83.1 828.3 — (90.0) 738.3
Twelve Months Ended December 31, 2015
Closed Corporate
Block and Other
Investment Individual Employee Ongoing Variable Closed
(in millions USD, unless otherwise indicated) Retirement Management Annuities Life Benefits Business Annuity Blocks Consolidated
Operating earnings before income taxes (1) 470.6 181.9 243.0 172.7 146.1 1,214.3 — (236.8) 977.5
Less:
Interest expense — — — — — — — (194.5) (194.5)
DAC/VOBA and other intangibles unlocking (37.2) — 12.5 (38.4) (4.4) (67.5) — — (67.5)
Net gain from Lehman Recovery/LIHTC — — — — — — — 1.6 1.6
Adjusted operating earnings before interest 507.8 181.9 230.5 211.1 150.5 1,281.8 — (43.9) 1,237.9
Income tax expense 162.5 58.2 73.8 67.6 48.2 410.3 — (14.0) 396.3
Adjusted operating earnings before
interest and after income taxes (1) 345.3 123.7 156.7 143.5 102.3 871.5 — (29.9) 841.6
(1) This measure is a Non-GAAP financial measure. For an explanation of our use of Non-GAAP financial measures, refer the “Explanatory Note on Non-GAAP Financial Information” beginning on page 3 of this
document. For a reconciliation of this item to the most directly comparable GAAP measure, refer to the “Reconciliations” section beginning on page 63 of this document.
Page 14 of 84
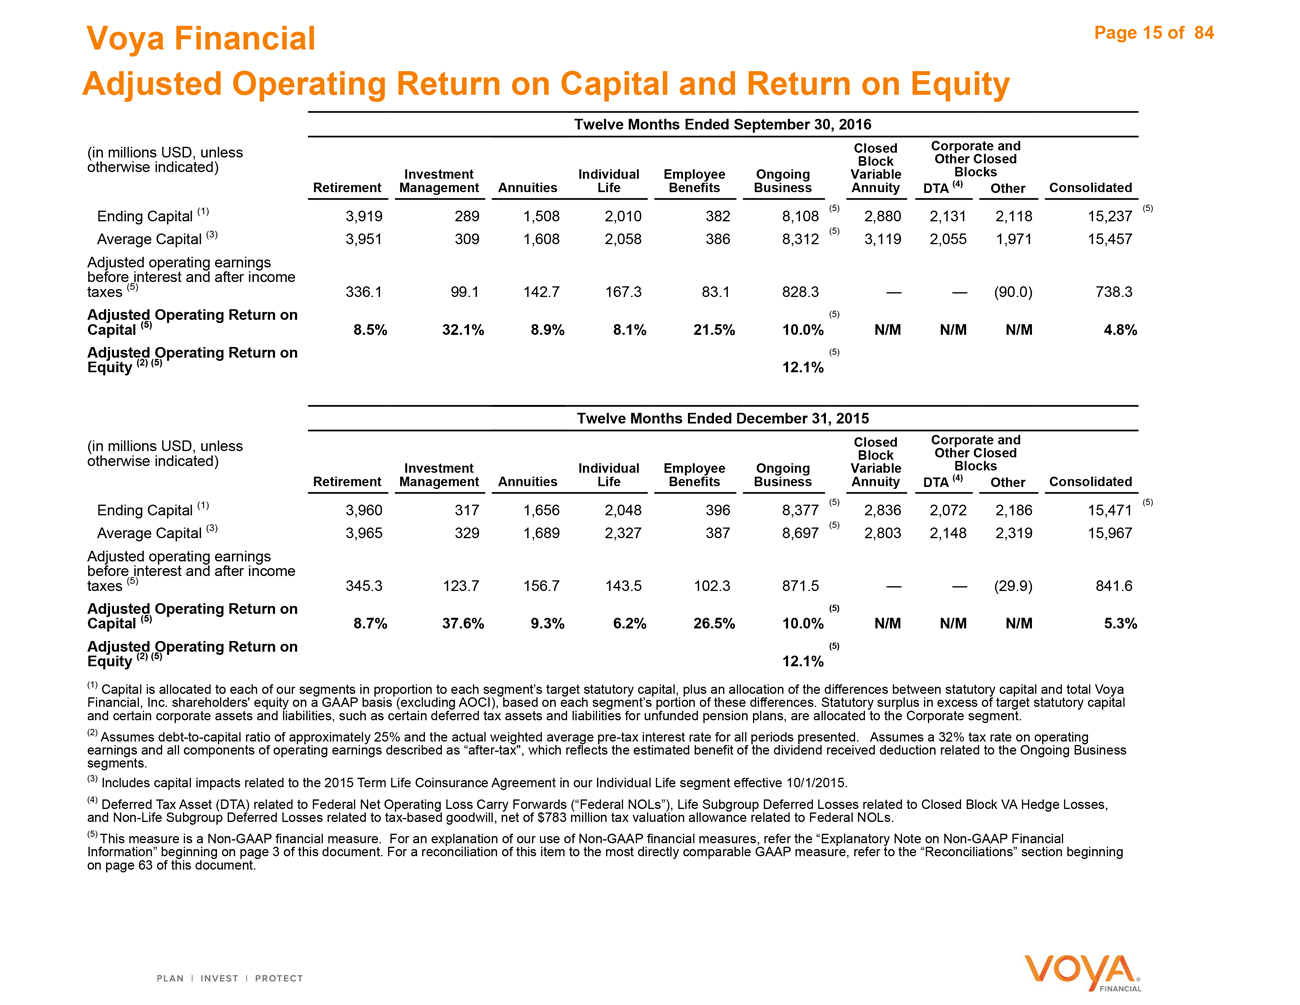
Voya Financial
Adjusted Operating Return on Capital and Return on Equity
Twelve Months Ended September 30, 2016
(in millions USD, unless Closed Corporate and
Block Other Closed
otherwise indicated) Investment Individual Employee Ongoing Variable Blocks
Retirement Management Annuities Life Benefits Business Annuity DTA (4) Other Consolidated
Ending Capital (1) 3,919 289 1,508 2,010 382 8,108 (5) 2,880 2,131 2,118 15,237 (5)
Average Capital (3) 3,951 309 1,608 2,058 386 8,312 (5) 3,119 2,055 1,971 15,457
Adjusted operating earnings
before interest and after income
taxes (5) 336.1 99.1 142.7 167.3 83.1 828.3 — — (90.0) 738.3
Adjusted Operating Return on (5)
Capital (5) 8.5% 32.1% 8.9% 8.1% 21.5% 10.0% N/M N/M N/M 4.8%
Adjusted Operating Return on (5)
Equity (2) (5) 12.1%
Twelve Months Ended December 31, 2015
(in millions USD, unless Closed Corporate and
Block Other Closed
otherwise indicated) Investment Individual Employee Ongoing Variable Blocks
Retirement Management Annuities Life Benefits Business Annuity DTA (4) Other Consolidated
Ending Capital (1) 3,960 317 1,656 2,048 396 8,377 (5) 2,836 2,072 2,186 15,471 (5)
Average Capital (3) 3,965 329 1,689 2,327 387 8,697 (5) 2,803 2,148 2,319 15,967
Adjusted operating earnings
before interest and after income
taxes (5) 345.3 123.7 156.7 143.5 102.3 871.5 — — (29.9) 841.6
Adjusted Operating Return on (5)
Capital (5) 8.7% 37.6% 9.3% 6.2% 26.5% 10.0% N/M N/M N/M 5.3%
Adjusted Operating Return on (5)
Equity (2) (5) 12.1%
(1) Capital is allocated to each of our segments in proportion to each segment’s target statutory capital, plus an allocation of the differences between statutory capital and total Voya
Financial, Inc. shareholders’ equity on a GAAP basis (excluding AOCI), based on each segment’s portion of these differences. Statutory surplus in excess of target statutory capital
and certain corporate assets and liabilities, such as certain deferred tax assets and liabilities for unfunded pension plans, are allocated to the Corporate segment.
(2) Assumes debt-to-capital ratio of approximately 25% and the actual weighted average pre-tax interest rate for all periods presented. Assumes a 32% tax rate on operating
earnings and all components of operating earnings described as “after-tax”, which reflects the estimated benefit of the dividend received deduction related to the Ongoing Business
segments.
(3) Includes capital impacts related to the 2015 Term Life Coinsurance Agreement in our Individual Life segment effective 10/1/2015.
(4) Deferred Tax Asset (DTA) related to Federal Net Operating Loss Carry Forwards (“Federal NOLs”), Life Subgroup Deferred Losses related to Closed Block VA Hedge Losses,
and Non-Life Subgroup Deferred Losses related to tax-based goodwill, net of $783 million tax valuation allowance related to Federal NOLs.
(5) This measure is a Non-GAAP financial measure. For an explanation of our use of Non-GAAP financial measures, refer the “Explanatory Note on Non-GAAP Financial
Information” beginning on page 3 of this document. For a reconciliation of this item to the most directly comparable GAAP measure, refer to the “Reconciliations” section beginning
on page 63 of this document.
Page 15 of 84
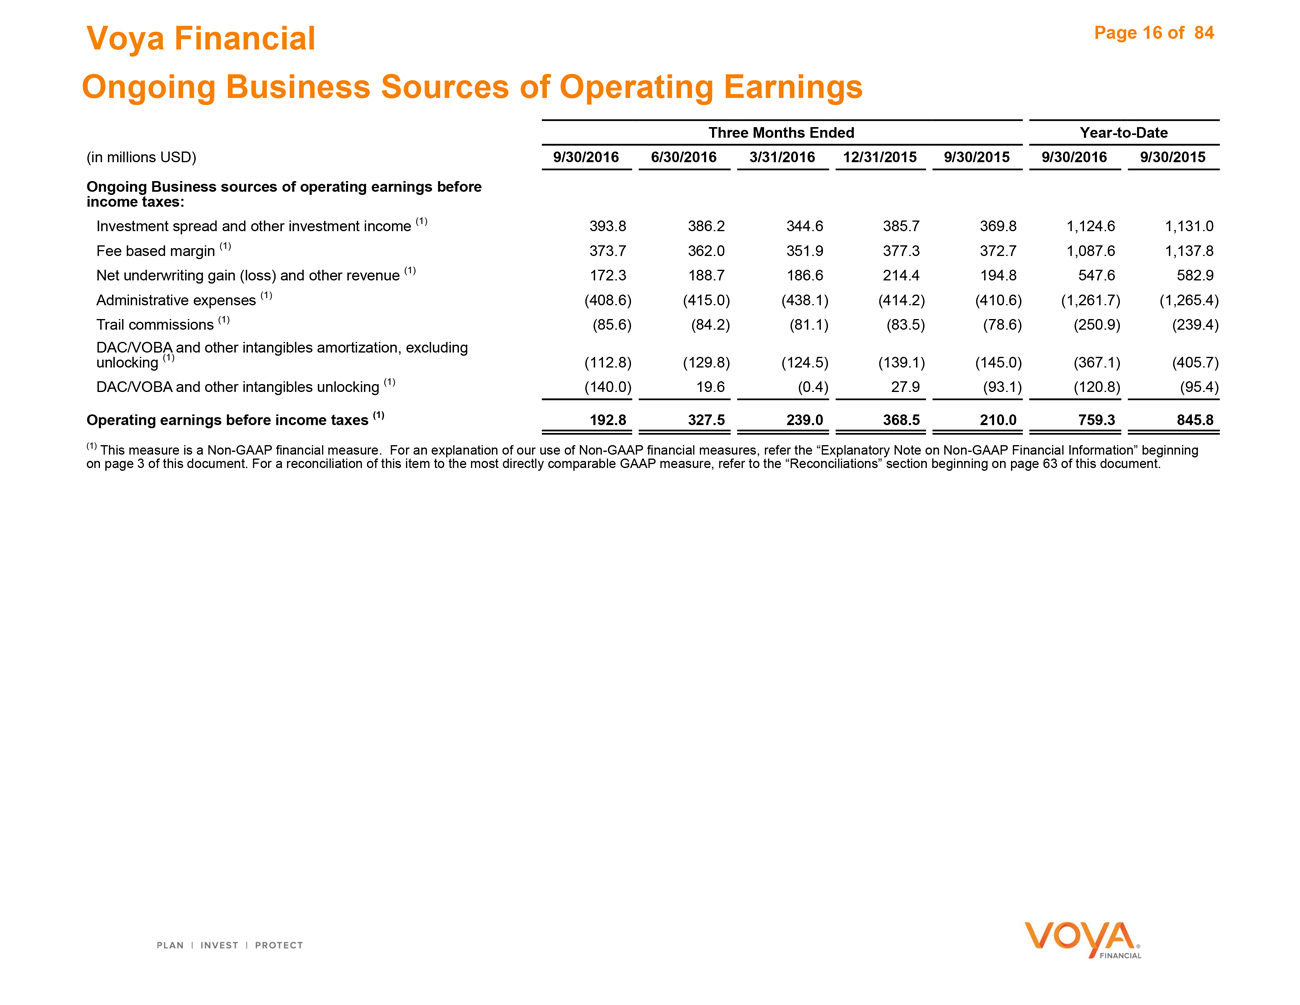
Voya Financial
Ongoing Business Sources of Operating Earnings
Three Months Ended Year-to-Date
(in millions USD) 9/30/2016 6/30/2016 3/31/2016 12/31/2015 9/30/2015 9/30/2016 9/30/2015
Ongoing Business sources of operating earnings before
income taxes:
Investment spread and other investment income (1) 393.8 386.2 344.6 385.7 369.8 1,124.6 1,131.0
Fee based margin (1) 373.7 362.0 351.9 377.3 372.7 1,087.6 1,137.8
Net underwriting gain (loss) and other revenue (1) 172.3 188.7 186.6 214.4 194.8 547.6 582.9
Administrative expenses (1) (408.6) (415.0) (438.1) (414.2) (410.6) (1,261.7) (1,265.4)
Trail commissions (1) (85.6) (84.2) (81.1) (83.5) (78.6) (250.9) (239.4)
DAC/VOBA and other intangibles amortization, excluding
unlocking (1) (112.8) (129.8) (124.5) (139.1) (145.0) (367.1) (405.7)
DAC/VOBA and other intangibles unlocking (1) (140.0) 19.6 (0.4) 27.9 (93.1) (120.8) (95.4)
Operating earnings before income taxes (1) 192.8 327.5 239.0 368.5 210.0 759.3 845.8
(1) This measure is a Non-GAAP financial measure. For an explanation of our use of Non-GAAP financial measures, refer the “Explanatory Note on Non-GAAP Financial Information” beginning
on page 3 of this document. For a reconciliation of this item to the most directly comparable GAAP measure, refer to the “Reconciliations” section beginning on page 63 of this document.
Page 16 of 84
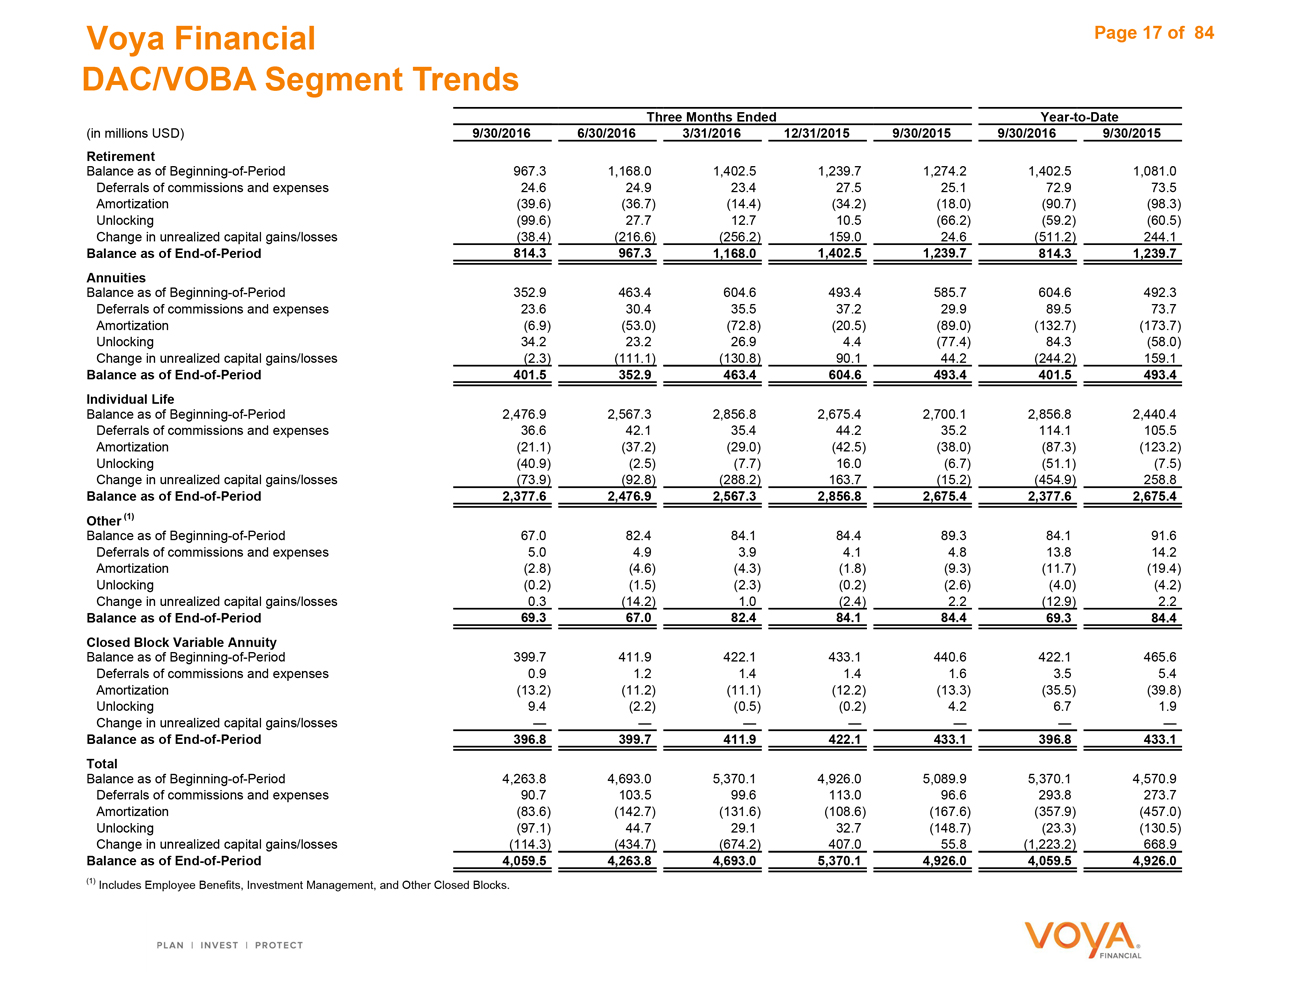
Voya Financial
DAC/VOBA Segment Trends
Three Months Ended Year-to-Date
(in millions USD) 9/30/2016 6/30/2016 3/31/2016 12/31/2015 9/30/2015 9/30/2016 9/30/2015
Retirement
Balance as of Beginning-of-Period 967.3 1,168.0 1,402.5 1,239.7 1,274.2 1,402.5 1,081.0
Deferrals of commissions and expenses 24.6 24.9 23.4 27.5 25.1 72.9 73.5
Amortization (39.6) (36.7) (14.4) (34.2) (18.0) (90.7) (98.3)
Unlocking (99.6) 27.7 12.7 10.5 (66.2) (59.2) (60.5)
Change in unrealized capital gains/losses (38.4) (216.6) (256.2) 159.0 24.6 (511.2) 244.1
Balance as of End-of-Period 814.3 967.3 1,168.0 1,402.5 1,239.7 814.3 1,239.7
Annuities
Balance as of Beginning-of-Period 352.9 463.4 604.6 493.4 585.7 604.6 492.3
Deferrals of commissions and expenses 23.6 30.4 35.5 37.2 29.9 89.5 73.7
Amortization (6.9) (53.0) (72.8) (20.5) (89.0) (132.7) (173.7)
Unlocking 34.2 23.2 26.9 4.4 (77.4) 84.3 (58.0)
Change in unrealized capital gains/losses (2.3) (111.1) (130.8) 90.1 44.2 (244.2) 159.1
Balance as of End-of-Period 401.5 352.9 463.4 604.6 493.4 401.5 493.4
Individual Life
Balance as of Beginning-of-Period 2,476.9 2,567.3 2,856.8 2,675.4 2,700.1 2,856.8 2,440.4
Deferrals of commissions and expenses 36.6 42.1 35.4 44.2 35.2 114.1 105.5
Amortization (21.1) (37.2) (29.0) (42.5) (38.0) (87.3) (123.2)
Unlocking (40.9) (2.5) (7.7) 16.0 (6.7) (51.1) (7.5)
Change in unrealized capital gains/losses (73.9) (92.8) (288.2) 163.7 (15.2) (454.9) 258.8
Balance as of End-of-Period 2,377.6 2,476.9 2,567.3 2,856.8 2,675.4 2,377.6 2,675.4
Other (1)
Balance as of Beginning-of-Period 67.0 82.4 84.1 84.4 89.3 84.1 91.6
Deferrals of commissions and expenses 5.0 4.9 3.9 4.1 4.8 13.8 14.2
Amortization (2.8) (4.6) (4.3) (1.8) (9.3) (11.7) (19.4)
Unlocking (0.2) (1.5) (2.3) (0.2) (2.6) (4.0) (4.2)
Change in unrealized capital gains/losses 0.3 (14.2) 1.0 (2.4) 2.2 (12.9) 2.2
Balance as of End-of-Period 69.3 67.0 82.4 84.1 84.4 69.3 84.4
Closed Block Variable Annuity
Balance as of Beginning-of-Period 399.7 411.9 422.1 433.1 440.6 422.1 465.6
Deferrals of commissions and expenses 0.9 1.2 1.4 1.4 1.6 3.5 5.4
Amortization (13.2) (11.2) (11.1) (12.2) (13.3) (35.5) (39.8)
Unlocking 9.4 (2.2) (0.5) (0.2) 4.2 6.7 1.9
Change in unrealized capital gains/losses — — — — — — —
Balance as of End-of-Period 396.8 399.7 411.9 422.1 433.1 396.8 433.1
Total
Balance as of Beginning-of-Period 4,263.8 4,693.0 5,370.1 4,926.0 5,089.9 5,370.1 4,570.9
Deferrals of commissions and expenses 90.7 103.5 99.6 113.0 96.6 293.8 273.7
Amortization (83.6) (142.7) (131.6) (108.6) (167.6) (357.9) (457.0)
Unlocking (97.1) 44.7 29.1 32.7 (148.7) (23.3) (130.5)
Change in unrealized capital gains/losses (114.3) (434.7) (674.2) 407.0 55.8 (1,223.2) 668.9
Balance as of End-of-Period 4,059.5 4,263.8 4,693.0 5,370.1 4,926.0 4,059.5 4,926.0
| (1) |
|
Includes Employee Benefits, Investment Management, and Other Closed Blocks. |
Page 17 of 84
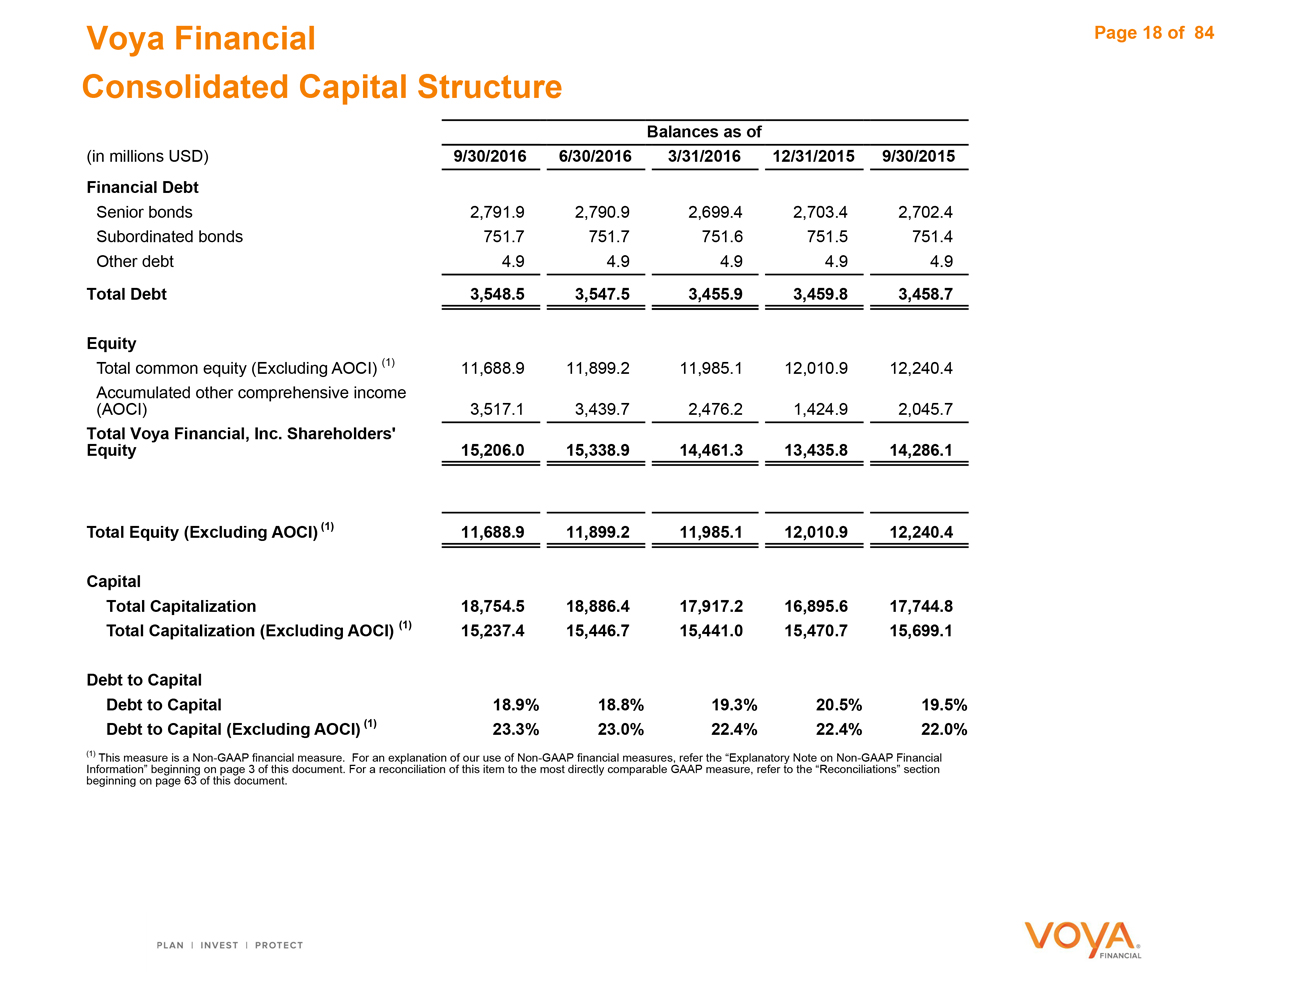
Voya Financial
Consolidated Capital Structure
Balances as of
(in millions USD) 9/30/2016 6/30/2016 3/31/2016 12/31/2015 9/30/2015
Financial Debt
Senior bonds 2,791.9 2,790.9 2,699.4 2,703.4 2,702.4
Subordinated bonds 751.7 751.7 751.6 751.5 751.4
Other debt 4.9 4.9 4.9 4.9 4.9
Total Debt 3,548.5 3,547.5 3,455.9 3,459.8 3,458.7
Equity
Total common equity (Excluding AOCI) (1) 11,688.9 11,899.2 11,985.1 12,010.9 12,240.4
Accumulated other comprehensive income
(AOCI) 3,517.1 3,439.7 2,476.2 1,424.9 2,045.7
Total Voya Financial, Inc. Shareholders’
Equity 15,206.0 15,338.9 14,461.3 13,435.8 14,286.1
Total Equity (Excluding AOCI) (1) 11,688.9 11,899.2 11,985.1 12,010.9 12,240.4
Capital
Total Capitalization 18,754.5 18,886.4 17,917.2 16,895.6 17,744.8
Total Capitalization (Excluding AOCI) (1) 15,237.4 15,446.7 15,441.0 15,470.7 15,699.1
Debt to Capital
Debt to Capital 18.9% 18.8% 19.3% 20.5% 19.5%
Debt to Capital (Excluding AOCI) (1) 23.3% 23.0% 22.4% 22.4% 22.0%
(1) This measure is a Non-GAAP financial measure. For an explanation of our use of Non-GAAP financial measures, refer the “Explanatory Note on Non-GAAP Financial
Information” beginning on page 3 of this document. For a reconciliation of this item to the most directly comparable GAAP measure, refer to the “Reconciliations” section
beginning on page 63 of this document.
Page 18 of 84
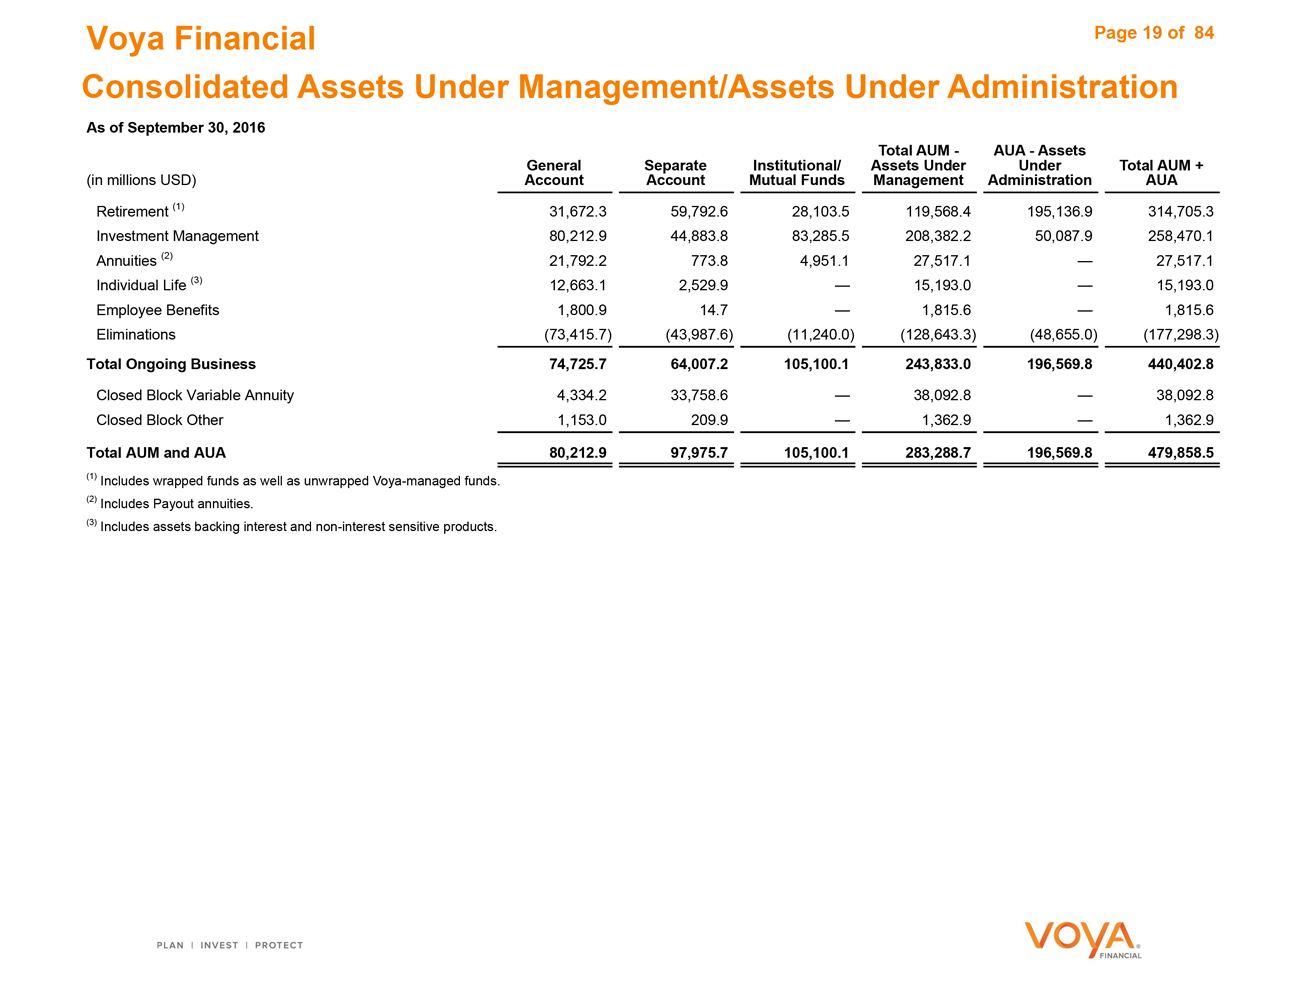
Voya Financial Consolidated Assets Under Management/Assets Under Administration
As of September 30, 2016
Total AUM—AUA—Assets
General Separate Institutional/ Assets Under Under Total AUM +
(in millions USD) Account Account Mutual Funds Management Administration AUA
Retirement (1) 31,672.3 59,792.6 28,103.5 119,568.4 195,136.9 314,705.3
Investment Management 80,212.9 44,883.8 83,285.5 208,382.2 50,087.9 258,470.1
Annuities (2) 21,792.2 773.8 4,951.1 27,517.1 — 27,517.1
Individual Life (3) 12,663.1 2,529.9 — 15,193.0 — 15,193.0
Employee Benefits 1,800.9 14.7 — 1,815.6 — 1,815.6
Eliminations (73,415.7) (43,987.6) (11,240.0) (128,643.3) (48,655.0) (177,298.3)
Total Ongoing Business 74,725.7 64,007.2 105,100.1 243,833.0 196,569.8 440,402.8
Closed Block Variable Annuity 4,334.2 33,758.6 — 38,092.8 — 38,092.8
Closed Block Other 1,153.0 209.9 — 1,362.9 — 1,362.9
Total AUM and AUA 80,212.9 97,975.7 105,100.1 283,288.7 196,569.8 479,858.5
(1) Includes wrapped funds as well as unwrapped Voya-managed funds.
(2) Includes Payout annuities.
(3) Includes assets backing interest and non-interest sensitive products.
Page 19 of 84
Retirement
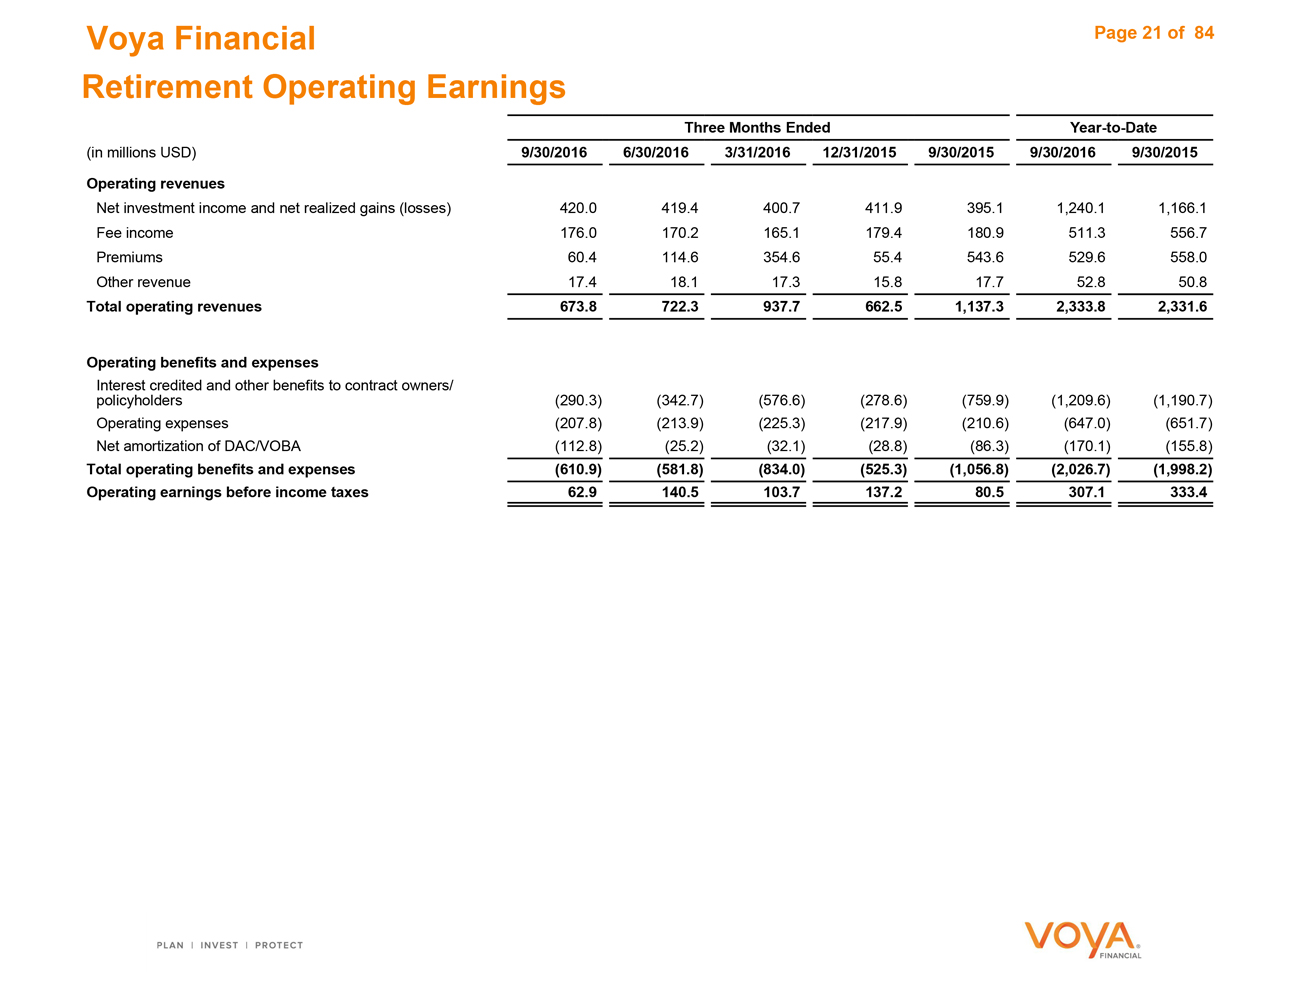
Voya Financial
Retirement Operating Earnings
Three Months Ended Year-to-Date
(in millions USD) 9/30/2016 6/30/2016 3/31/2016 12/31/2015 9/30/2015 9/30/2016 9/30/2015
Operating revenues
Net investment income and net realized gains (losses) 420.0 419.4 400.7 411.9 395.1 1,240.1 1,166.1
Fee income 176.0 170.2 165.1 179.4 180.9 511.3 556.7
Premiums 60.4 114.6 354.6 55.4 543.6 529.6 558.0
Other revenue 17.4 18.1 17.3 15.8 17.7 52.8 50.8
Total operating revenues 673.8 722.3 937.7 662.5 1,137.3 2,333.8 2,331.6
Operating benefits and expenses
Interest credited and other benefits to contract owners/
policyholders (290.3) (342.7) (576.6) (278.6) (759.9) (1,209.6) (1,190.7)
Operating expenses (207.8) (213.9) (225.3) (217.9) (210.6) (647.0) (651.7)
Net amortization of DAC/VOBA (112.8) (25.2) (32.1) (28.8) (86.3) (170.1) (155.8)
Total operating benefits and expenses (610.9) (581.8) (834.0) (525.3) (1,056.8) (2,026.7) (1,998.2)
Operating earnings before income taxes 62.9 140.5 103.7 137.2 80.5 307.1 333.4
Page 21 of 84
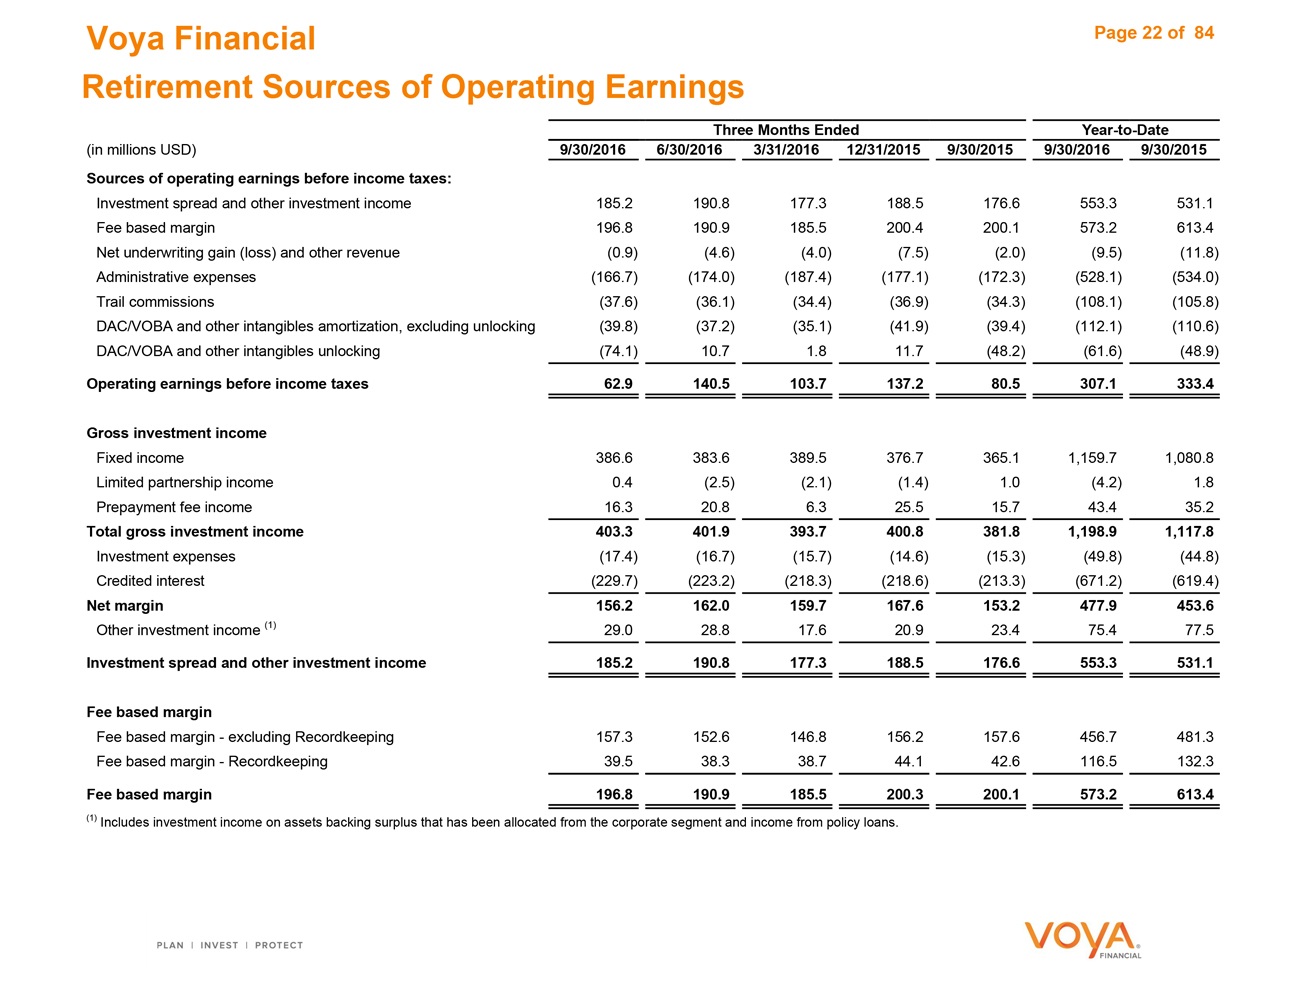
Voya Financial
Retirement Sources of Operating Earnings
Three Months Ended Year-to-Date
(in millions USD) 9/30/2016 6/30/2016 3/31/2016 12/31/2015 9/30/2015 9/30/2016 9/30/2015
Sources of operating earnings before income taxes:
Investment spread and other investment income 185.2 190.8 177.3 188.5 176.6 553.3 531.1
Fee based margin 196.8 190.9 185.5 200.4 200.1 573.2 613.4
Net underwriting gain (loss) and other revenue (0.9) (4.6) (4.0) (7.5) (2.0) (9.5) (11.8)
Administrative expenses (166.7) (174.0) (187.4) (177.1) (172.3) (528.1) (534.0)
Trail commissions (37.6) (36.1) (34.4) (36.9) (34.3) (108.1) (105.8)
DAC/VOBA and other intangibles amortization, excluding unlocking (39.8) (37.2) (35.1) (41.9) (39.4) (112.1) (110.6)
DAC/VOBA and other intangibles unlocking (74.1) 10.7 1.8 11.7 (48.2) (61.6) (48.9)
Operating earnings before income taxes 62.9 140.5 103.7 137.2 80.5 307.1 333.4
Gross investment income
Fixed income 386.6 383.6 389.5 376.7 365.1 1,159.7 1,080.8
Limited partnership income 0.4 (2.5) (2.1) (1.4) 1.0 (4.2) 1.8
Prepayment fee income 16.3 20.8 6.3 25.5 15.7 43.4 35.2
Total gross investment income 403.3 401.9 393.7 400.8 381.8 1,198.9 1,117.8
Investment expenses (17.4) (16.7) (15.7) (14.6) (15.3) (49.8) (44.8)
Credited interest (229.7) (223.2) (218.3) (218.6) (213.3) (671.2) (619.4)
Net margin 156.2 162.0 159.7 167.6 153.2 477.9 453.6
Other investment income (1) 29.0 28.8 17.6 20.9 23.4 75.4 77.5
Investment spread and other investment income 185.2 190.8 177.3 188.5 176.6 553.3 531.1
Fee based margin
Fee based margin—excluding Recordkeeping 157.3 152.6 146.8 156.2 157.6 456.7 481.3
Fee based margin—Recordkeeping 39.5 38.3 38.7 44.1 42.6 116.5 132.3
Fee based margin 196.8 190.9 185.5 200.3 200.1 573.2 613.4
(1) Includes investment income on assets backing surplus that has been allocated from the corporate segment and income from policy loans.
Page 22 of 84
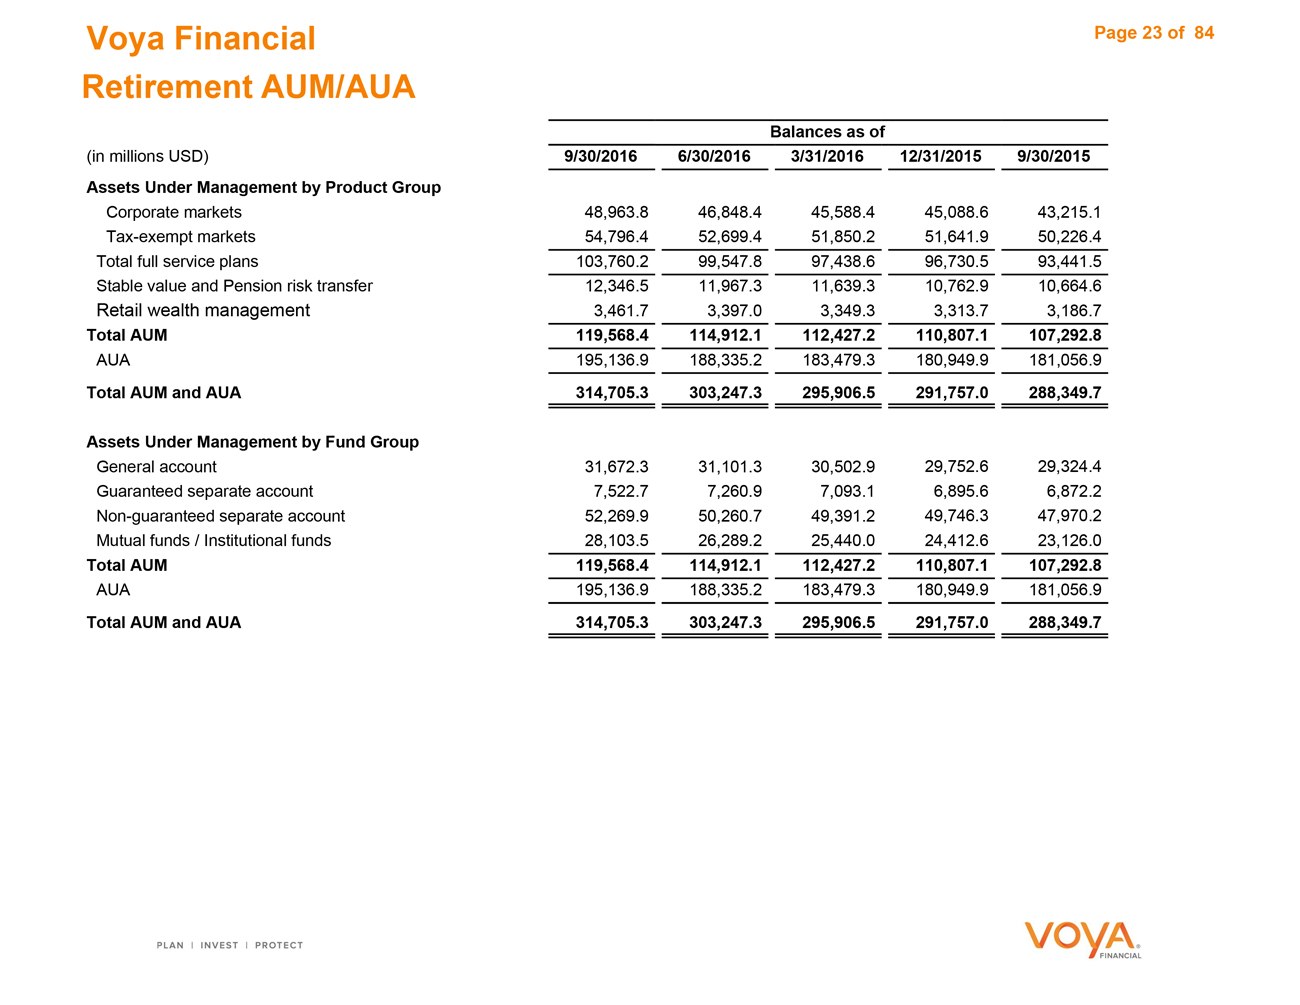
Voya Financial Retirement AUM/AUA
Balances as of
(in millions USD) 9/30/2016 6/30/2016 3/31/2016 12/31/2015 9/30/2015
Assets Under Management by Product Group
Corporate markets 48,963.8 46,848.4 45,588.4 45,088.6 43,215.1
Tax-exempt markets 54,796.4 52,699.4 51,850.2 51,641.9 50,226.4
Total full service plans 103,760.2 99,547.8 97,438.6 96,730.5 93,441.5
Stable value and Pension risk transfer 12,346.5 11,967.3 11,639.3 10,762.9 10,664.6
Retail wealth management 3,461.7 3,397.0 3,349.3 3,313.7 3,186.7
Total AUM 119,568.4 114,912.1 112,427.2 110,807.1 107,292.8
AUA 195,136.9 188,335.2 183,479.3 180,949.9 181,056.9
Total AUM and AUA 314,705.3 303,247.3 295,906.5 291,757.0 288,349.7
Assets Under Management by Fund Group
General account 31,672.3 31,101.3 30,502.9 29,752.6 29,324.4
Guaranteed separate account 7,522.7 7,260.9 7,093.1 6,895.6 6,872.2
Non-guaranteed separate account 52,269.9 50,260.7 49,391.2 49,746.3 47,970.2
Mutual funds / Institutional funds 28,103.5 26,289.2 25,440.0 24,412.6 23,126.0
Total AUM 119,568.4 114,912.1 112,427.2 110,807.1 107,292.8
AUA 195,136.9 188,335.2 183,479.3 180,949.9 181,056.9
Total AUM and AUA 314,705.3 303,247.3 295,906.5 291,757.0 288,349.7
Page 23 of 84
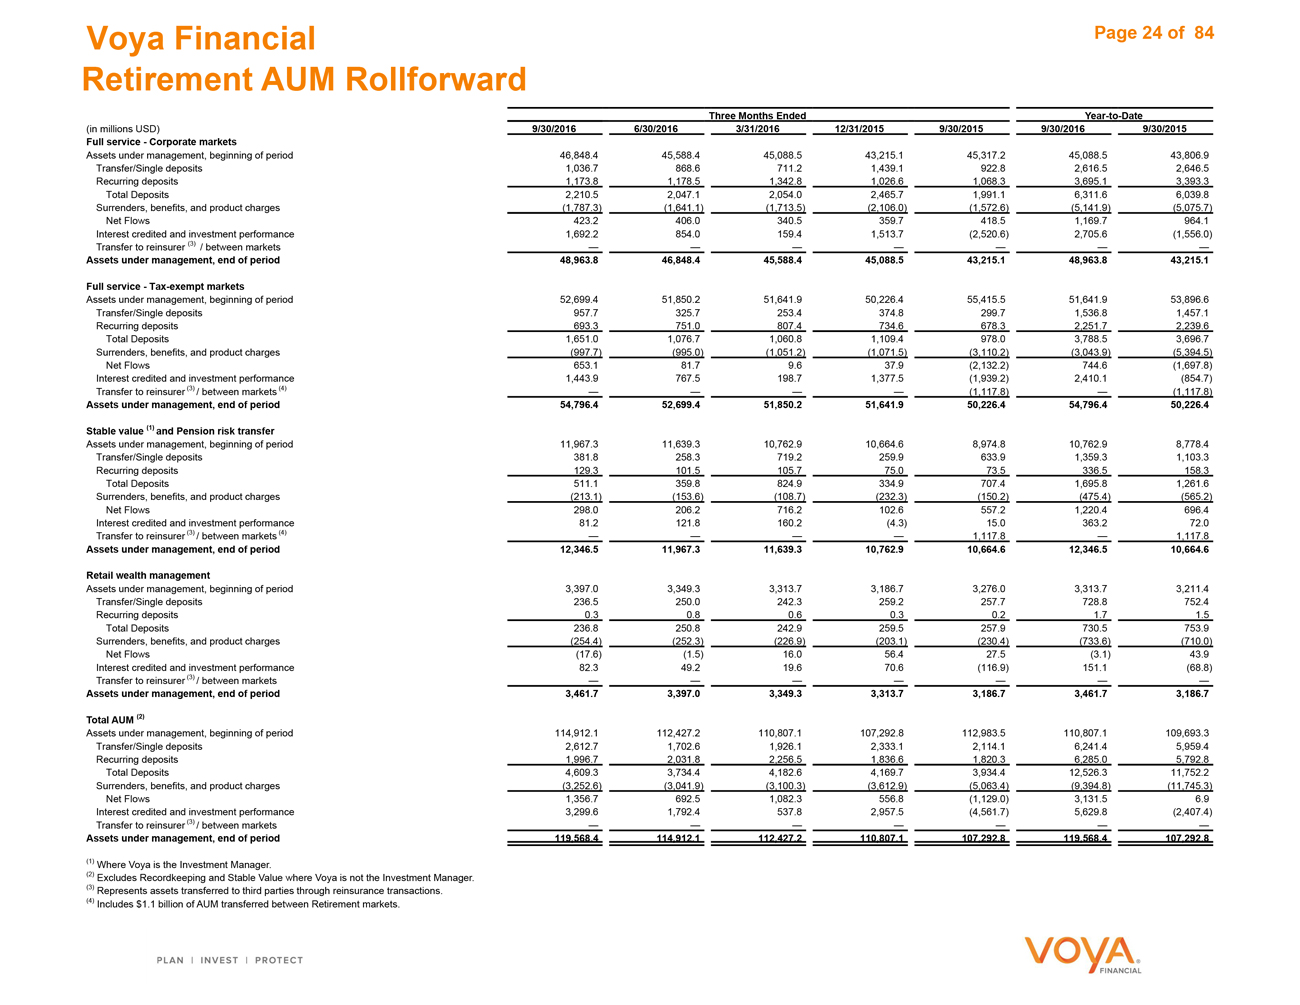
Voya Financial
Retirement AUM Rollforward
Three Months Ended Year-to-Date
(in millions USD) 9/30/2016 6/30/2016 3/31/2016 12/31/2015 9/30/2015 9/30/2016 9/30/2015
Full service—Corporate markets
Assets under management, beginning of period 46,848.4 45,588.4 45,088.5 43,215.1 45,317.2 45,088.5 43,806.9
Transfer/Single deposits 1,036.7 868.6 711.2 1,439.1 922.8 2,616.5 2,646.5
Recurring deposits 1,173.8 1,178.5 1,342.8 1,026.6 1,068.3 3,695.1 3,393.3
Total Deposits 2,210.5 2,047.1 2,054.0 2,465.7 1,991.1 6,311.6 6,039.8
Surrenders, benefits, and product charges (1,787.3) (1,641.1) (1,713.5) (2,106.0) (1,572.6) (5,141.9) (5,075.7)
Net Flows 423.2 406.0 340.5 359.7 418.5 1,169.7 964.1
Interest credited and investment performance 1,692.2 854.0 159.4 1,513.7 (2,520.6) 2,705.6 (1,556.0)
Transfer to reinsurer (3) / between markets — — — — — — —
Assets under management, end of period 48,963.8 46,848.4 45,588.4 45,088.5 43,215.1 48,963.8 43,215.1
Full service—Tax-exempt markets
Assets under management, beginning of period 52,699.4 51,850.2 51,641.9 50,226.4 55,415.5 51,641.9 53,896.6
Transfer/Single deposits 957.7 325.7 253.4 374.8 299.7 1,536.8 1,457.1
Recurring deposits 693.3 751.0 807.4 734.6 678.3 2,251.7 2,239.6
Total Deposits 1,651.0 1,076.7 1,060.8 1,109.4 978.0 3,788.5 3,696.7
Surrenders, benefits, and product charges (997.7) (995.0) (1,051.2) (1,071.5) (3,110.2) (3,043.9) (5,394.5)
Net Flows 653.1 81.7 9.6 37.9 (2,132.2) 744.6 (1,697.8)
Interest credited and investment performance 1,443.9 767.5 198.7 1,377.5 (1,939.2) 2,410.1 (854.7)
Transfer to reinsurer (3) / between markets (4) — — — — (1,117.8) — (1,117.8)
Assets under management, end of period 54,796.4 52,699.4 51,850.2 51,641.9 50,226.4 54,796.4 50,226.4
Stable value (1) and Pension risk transfer
Assets under management, beginning of period 11,967.3 11,639.3 10,762.9 10,664.6 8,974.8 10,762.9 8,778.4
Transfer/Single deposits 381.8 258.3 719.2 259.9 633.9 1,359.3 1,103.3
Recurring deposits 129.3 101.5 105.7 75.0 73.5 336.5 158.3
Total Deposits 511.1 359.8 824.9 334.9 707.4 1,695.8 1,261.6
Surrenders, benefits, and product charges (213.1) (153.6) (108.7) (232.3) (150.2) (475.4) (565.2)
Net Flows 298.0 206.2 716.2 102.6 557.2 1,220.4 696.4
Interest credited and investment performance 81.2 121.8 160.2 (4.3) 15.0 363.2 72.0
Transfer to reinsurer (3) / between markets (4) — — — — 1,117.8 — 1,117.8
Assets under management, end of period 12,346.5 11,967.3 11,639.3 10,762.9 10,664.6 12,346.5 10,664.6
Retail wealth management
Assets under management, beginning of period 3,397.0 3,349.3 3,313.7 3,186.7 3,276.0 3,313.7 3,211.4
Transfer/Single deposits 236.5 250.0 242.3 259.2 257.7 728.8 752.4
Recurring deposits 0.3 0.8 0.6 0.3 0.2 1.7 1.5
Total Deposits 236.8 250.8 242.9 259.5 257.9 730.5 753.9
Surrenders, benefits, and product charges (254.4) (252.3) (226.9) (203.1) (230.4) (733.6) (710.0)
Net Flows (17.6) (1.5) 16.0 56.4 27.5 (3.1) 43.9
Interest credited and investment performance 82.3 49.2 19.6 70.6 (116.9) 151.1 (68.8)
Transfer to reinsurer (3) / between markets — — — — — — —
Assets under management, end of period 3,461.7 3,397.0 3,349.3 3,313.7 3,186.7 3,461.7 3,186.7
Total AUM (2)
Assets under management, beginning of period 114,912.1 112,427.2 110,807.1 107,292.8 112,983.5 110,807.1 109,693.3
Transfer/Single deposits 2,612.7 1,702.6 1,926.1 2,333.1 2,114.1 6,241.4 5,959.4
Recurring deposits 1,996.7 2,031.8 2,256.5 1,836.6 1,820.3 6,285.0 5,792.8
Total Deposits 4,609.3 3,734.4 4,182.6 4,169.7 3,934.4 12,526.3 11,752.2
Surrenders, benefits, and product charges (3,252.6) (3,041.9) (3,100.3) (3,612.9) (5,063.4) (9,394.8) (11,745.3)
Net Flows 1,356.7 692.5 1,082.3 556.8 (1,129.0) 3,131.5 6.9
Interest credited and investment performance 3,299.6 1,792.4 537.8 2,957.5 (4,561.7) 5,629.8 (2,407.4)
Transfer to reinsurer (3) / between markets — — — — — — —
Assets under management, end of period 119,568.4 114,912.1 112,427.2 110,807.1 107,292.8 119,568.4 107,292.8
(1) Where Voya is the Investment Manager.
(2) Excludes Recordkeeping and Stable Value where Voya is not the Investment Manager.
(3) Represents assets transferred to third parties through reinsurance transactions.
(4) Includes $1.1 billion of AUM transferred between Retirement markets.
Page 24 of 84

Investment Management
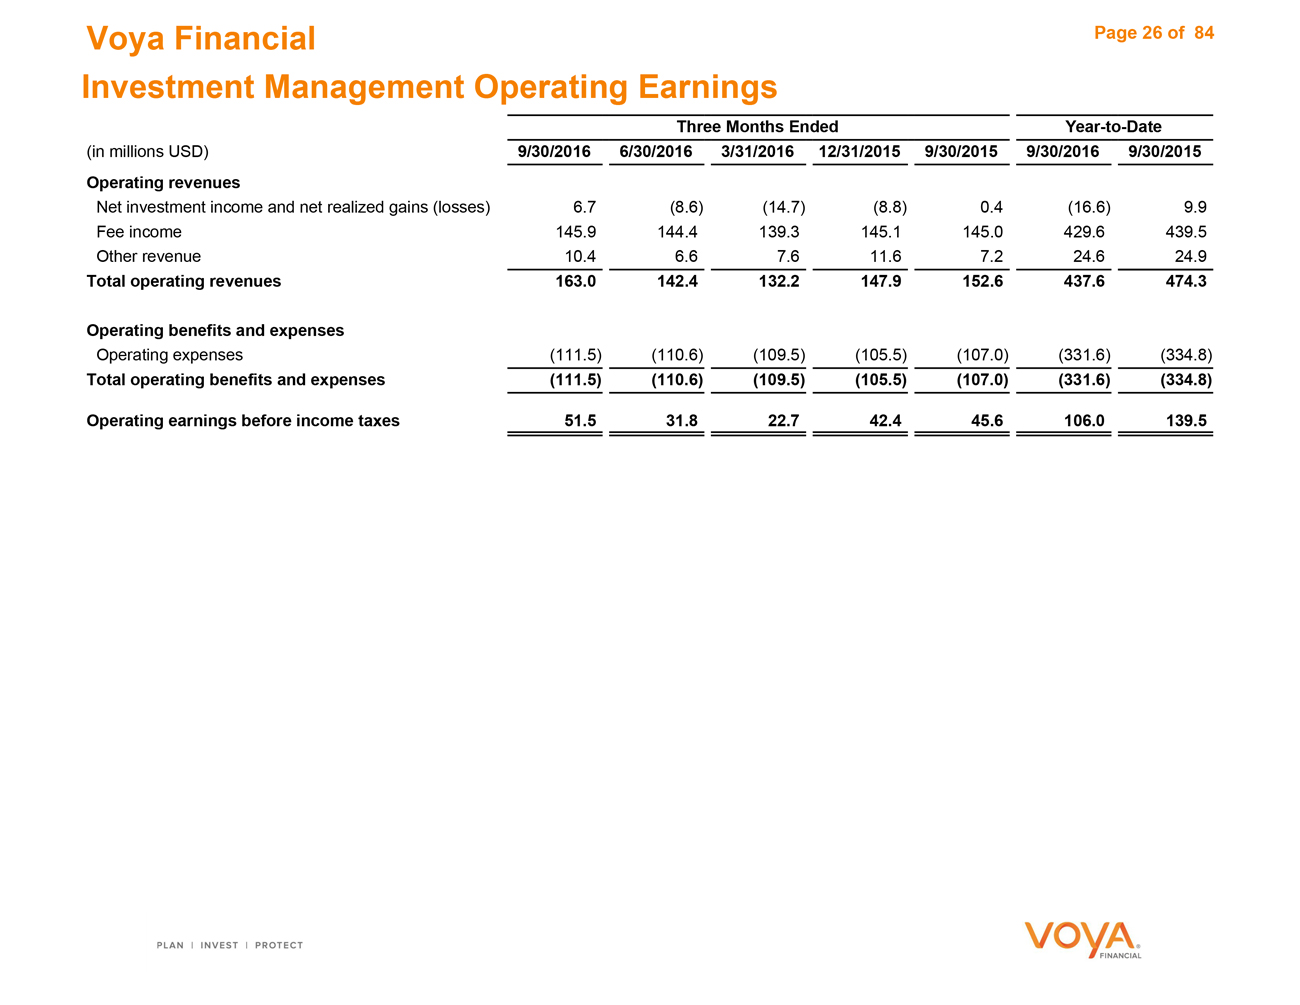
Voya Financial
Investment Management Operating Earnings
Three Months Ended Year-to-Date
(in millions USD) 9/30/2016 6/30/2016 3/31/2016 12/31/2015 9/30/2015 9/30/2016 9/30/2015
Operating revenues
Net investment income and net realized gains (losses) 6.7 (8.6) (14.7) (8.8) 0.4 (16.6) 9.9
Fee income 145.9 144.4 139.3 145.1 145.0 429.6 439.5
Other revenue 10.4 6.6 7.6 11.6 7.2 24.6 24.9
Total operating revenues 163.0 142.4 132.2 147.9 152.6 437.6 474.3
Operating benefits and expenses
Operating expenses (111.5) (110.6) (109.5) (105.5) (107.0) (331.6) (334.8)
Total operating benefits and expenses (111.5) (110.6) (109.5) (105.5) (107.0) (331.6) (334.8)
Operating earnings before income taxes 51.5 31.8 22.7 42.4 45.6 106.0 139.5
Page 26 of 84
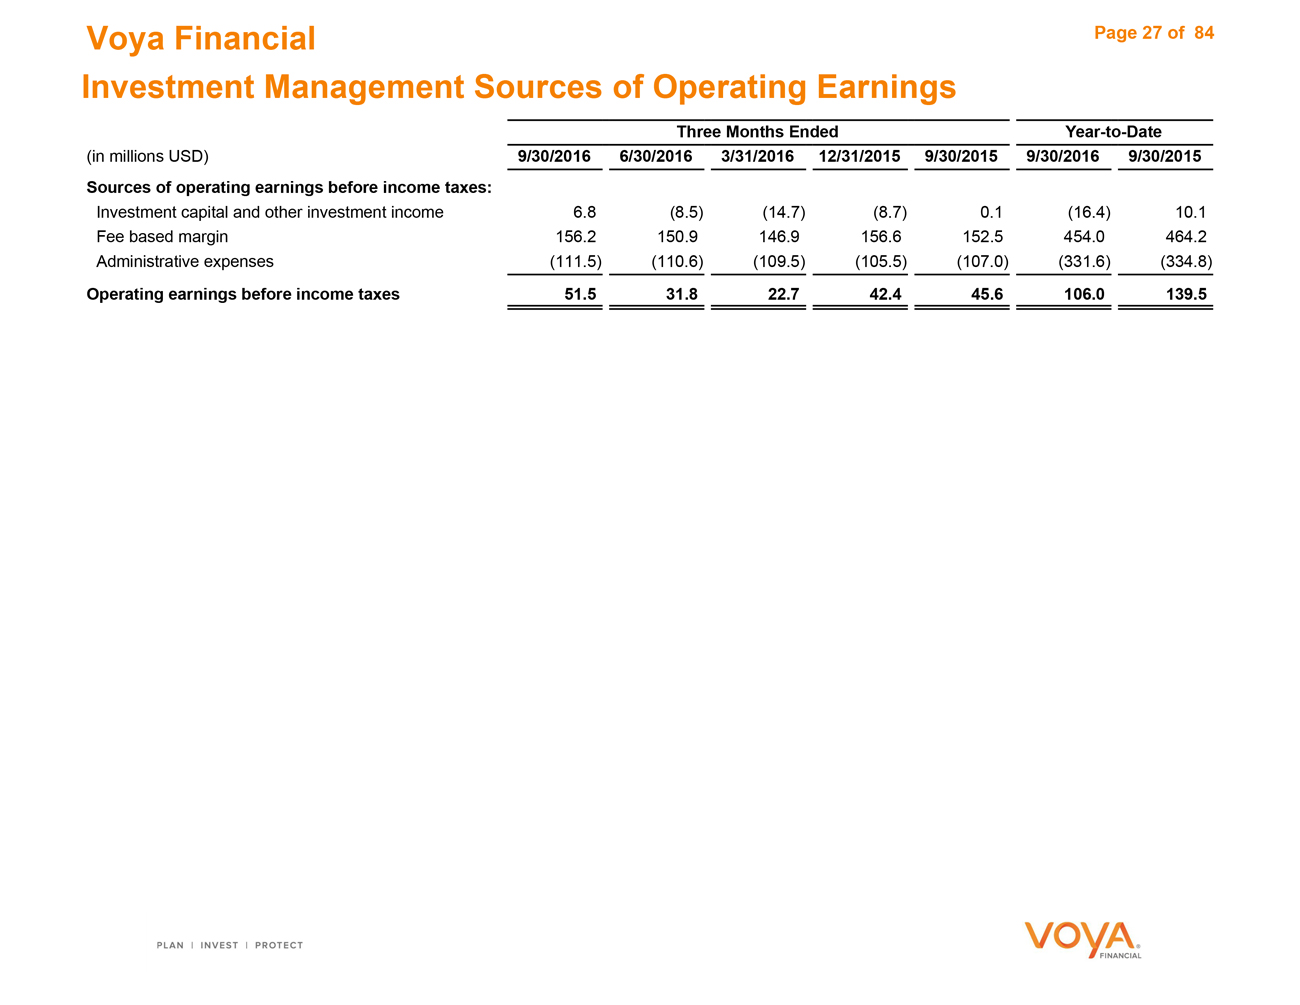
Voya Financial
Investment Management Sources of Operating Earnings
Three Months Ended Year-to-Date
(in millions USD) 9/30/2016 6/30/2016 3/31/2016 12/31/2015 9/30/2015 9/30/2016 9/30/2015
Sources of operating earnings before income taxes:
Investment capital and other investment income 6.8 (8.5) (14.7) (8.7) 0.1 (16.4) 10.1
Fee based margin 156.2 150.9 146.9 156.6 152.5 454.0 464.2
Administrative expenses (111.5) (110.6) (109.5) (105.5) (107.0) (331.6) (334.8)
Operating earnings before income taxes 51.5 31.8 22.7 42.4 45.6 106.0 139.5
Page 27 of 84
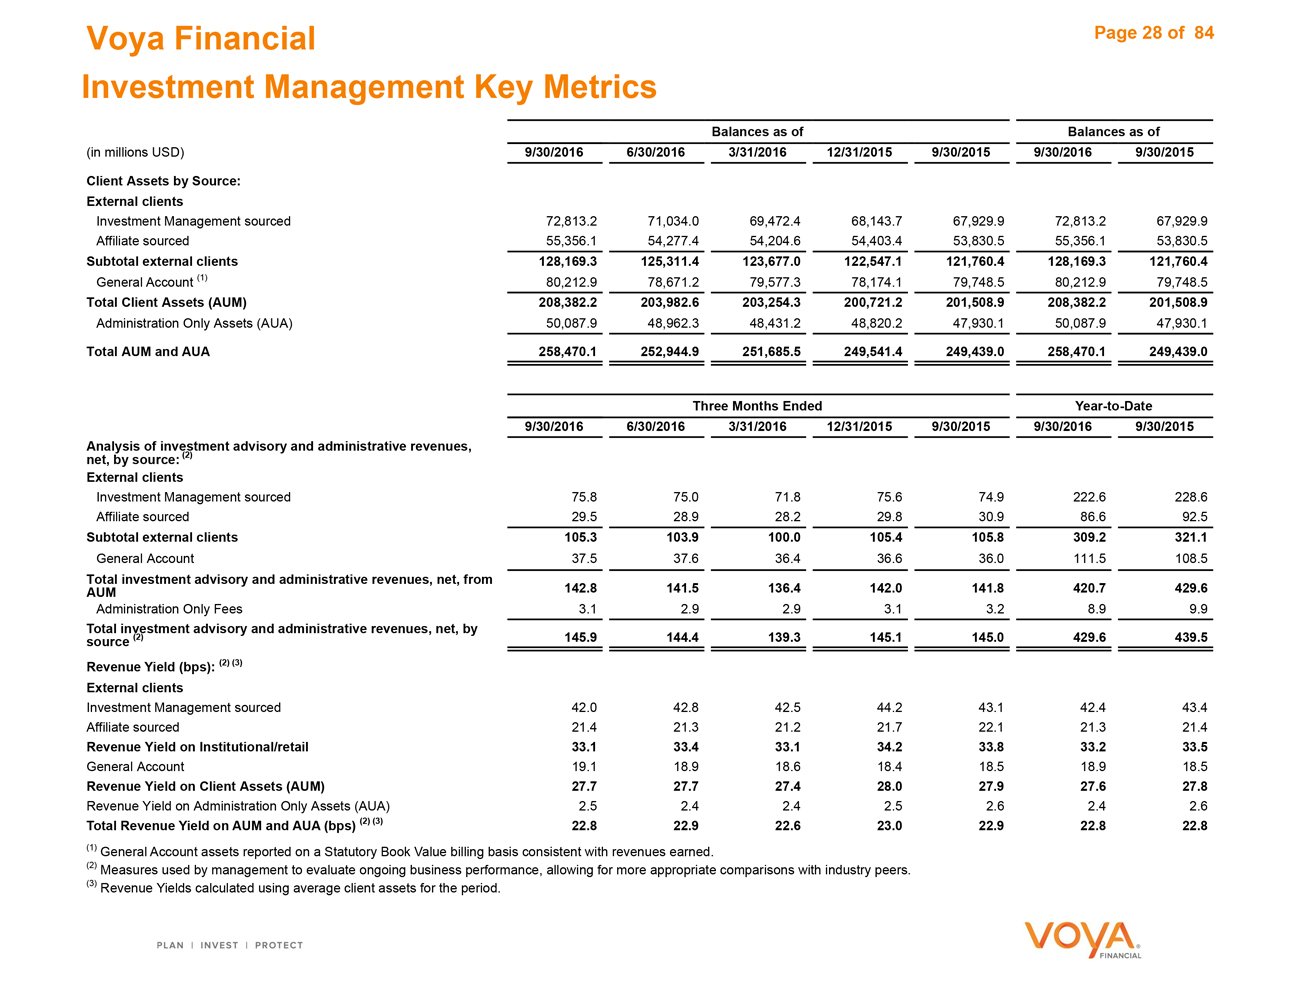
Voya Financial
Investment Management Key Metrics
Balances as of Balances as of
(in millions USD) 9/30/2016 6/30/2016 3/31/2016 12/31/2015 9/30/2015 9/30/2016 9/30/2015
Client Assets by Source:
External clients
Investment Management sourced 72,813.2 71,034.0 69,472.4 68,143.7 67,929.9 72,813.2 67,929.9
Affiliate sourced 55,356.1 54,277.4 54,204.6 54,403.4 53,830.5 55,356.1 53,830.5
Subtotal external clients 128,169.3 125,311.4 123,677.0 122,547.1 121,760.4 128,169.3 121,760.4
General Account (1) 80,212.9 78,671.2 79,577.3 78,174.1 79,748.5 80,212.9 79,748.5
Total Client Assets (AUM) 208,382.2 203,982.6 203,254.3 200,721.2 201,508.9 208,382.2 201,508.9
Administration Only Assets (AUA) 50,087.9 48,962.3 48,431.2 48,820.2 47,930.1 50,087.9 47,930.1
Total AUM and AUA 258,470.1 252,944.9 251,685.5 249,541.4 249,439.0 258,470.1 249,439.0
Three Months Ended Year-to-Date
9/30/2016 6/30/2016 3/31/2016 12/31/2015 9/30/2015 9/30/2016 9/30/2015
Analysis of investment advisory and administrative revenues,
net, by source: (2)
External clients
Investment Management sourced 75.8 75.0 71.8 75.6 74.9 222.6 228.6
Affiliate sourced 29.5 28.9 28.2 29.8 30.9 86.6 92.5
Subtotal external clients 105.3 103.9 100.0 105.4 105.8 309.2 321.1
General Account 37.5 37.6 36.4 36.6 36.0 111.5 108.5
Total investment advisory and administrative revenues, net, from 142.8 141.5 136.4 142.0
AUM 141.8 420.7 429.6
Administration Only Fees 3.1 2.9 2.9 3.1 3.2 8.9 9.9
Total investment advisory and administrative revenues, net, by
source (2) 145.9 144.4 139.3 145.1 145.0 429.6 439.5
Revenue Yield (bps): (2) (3)
External clients
Investment Management sourced 42.0 42.8 42.5 44.2 43.1 42.4 43.4
Affiliate sourced 21.4 21.3 21.2 21.7 22.1 21.3 21.4
Revenue Yield on Institutional/retail 33.1 33.4 33.1 34.2 33.8 33.2 33.5
General Account 19.1 18.9 18.6 18.4 18.5 18.9 18.5
Revenue Yield on Client Assets (AUM) 27.7 27.7 27.4 28.0 27.9 27.6 27.8
Revenue Yield on Administration Only Assets (AUA) 2.5 2.4 2.4 2.5 2.6 2.4 2.6
Total Revenue Yield on AUM and AUA (bps) (2) (3) 22.8 22.9 22.6 23.0 22.9 22.8 22.8
(1) General Account assets reported on a Statutory Book Value billing basis consistent with revenues earned.
(2) Measures used by management to evaluate ongoing business performance, allowing for more appropriate comparisons with industry peers.
(3) Revenue Yields calculated using average client assets for the period.
Page 28 of 84
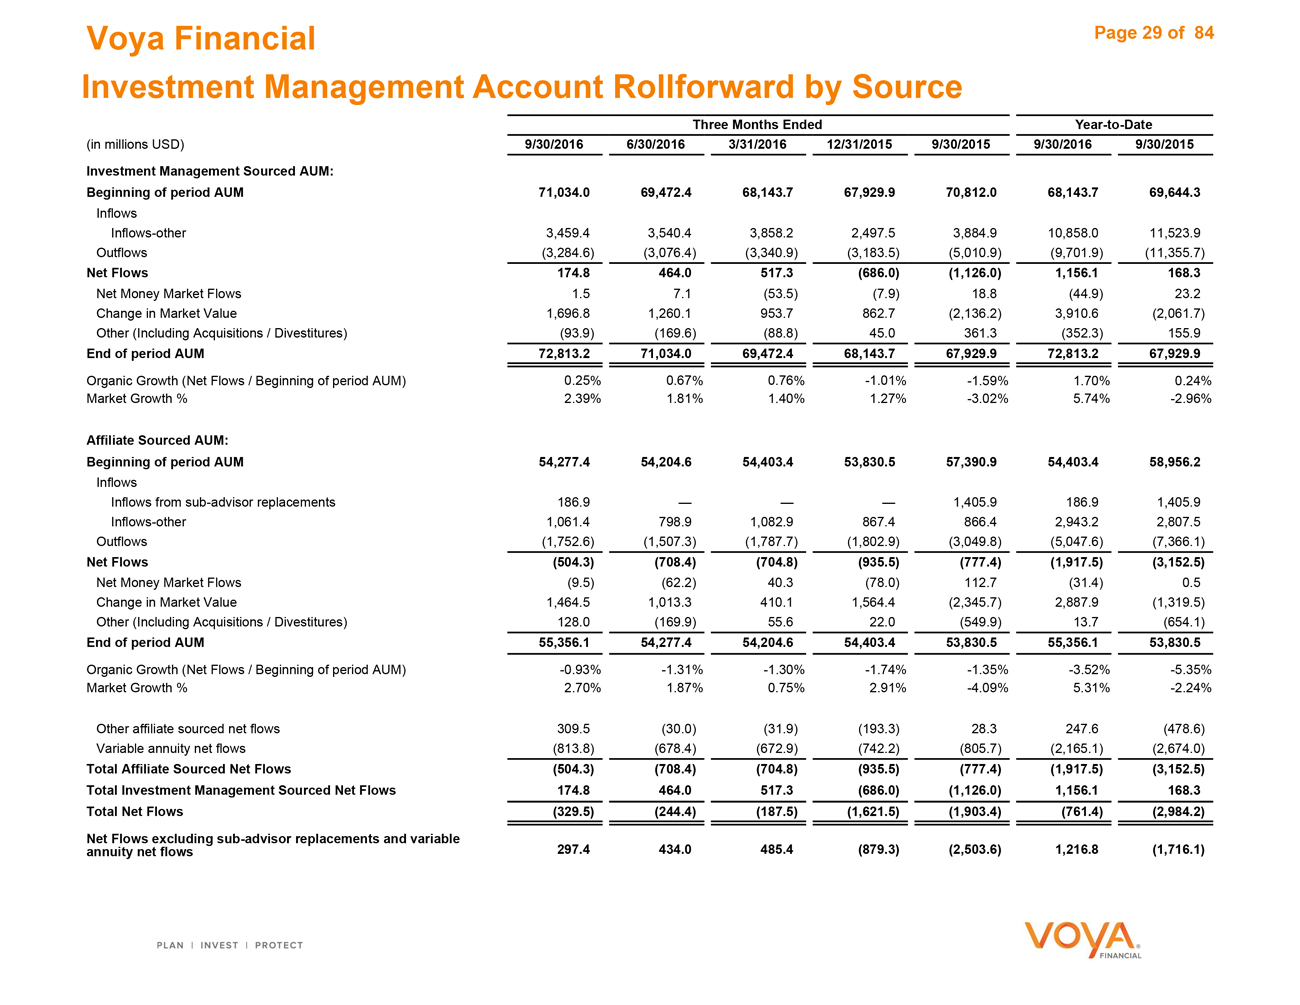
Voya Financial
Investment Management Account Rollforward by Source
Three Months Ended Year-to-Date
(in millions USD) 9/30/2016 6/30/2016 3/31/2016 12/31/2015 9/30/2015 9/30/2016 9/30/2015
Investment Management Sourced AUM:
Beginning of period AUM 71,034.0 69,472.4 68,143.7 67,929.9 70,812.0 68,143.7 69,644.3
Inflows
Inflows-other 3,459.4 3,540.4 3,858.2 2,497.5 3,884.9 10,858.0 11,523.9
Outflows (3,284.6) (3,076.4) (3,340.9) (3,183.5) (5,010.9) (9,701.9) (11,355.7)
Net Flows 174.8 464.0 517.3 (686.0) (1,126.0) 1,156.1 168.3
Net Money Market Flows 1.5 7.1 (53.5) (7.9) 18.8 (44.9) 23.2
Change in Market Value 1,696.8 1,260.1 953.7 862.7 (2,136.2) 3,910.6 (2,061.7)
Other (Including Acquisitions / Divestitures) (93.9) (169.6) (88.8) 45.0 361.3 (352.3) 155.9
End of period AUM 72,813.2 71,034.0 69,472.4 68,143.7 67,929.9 72,813.2 67,929.9
Organic Growth (Net Flows / Beginning of period AUM) 0.25% 0.67% 0.76% -1.01% -1.59% 1.70% 0.24%
Market Growth % 2.39% 1.81% 1.40% 1.27% -3.02% 5.74% -2.96%
Affiliate Sourced AUM:
Beginning of period AUM 54,277.4 54,204.6 54,403.4 53,830.5 57,390.9 54,403.4 58,956.2
Inflows
Inflows from sub-advisor replacements 186.9 — — — 1,405.9 186.9 1,405.9
Inflows-other 1,061.4 798.9 1,082.9 867.4 866.4 2,943.2 2,807.5
Outflows (1,752.6) (1,507.3) (1,787.7) (1,802.9) (3,049.8) (5,047.6) (7,366.1)
Net Flows (504.3) (708.4) (704.8) (935.5) (777.4) (1,917.5) (3,152.5)
Net Money Market Flows (9.5) (62.2) 40.3 (78.0) 112.7 (31.4) 0.5
Change in Market Value 1,464.5 1,013.3 410.1 1,564.4 (2,345.7) 2,887.9 (1,319.5)
Other (Including Acquisitions / Divestitures) 128.0 (169.9) 55.6 22.0 (549.9) 13.7 (654.1)
End of period AUM 55,356.1 54,277.4 54,204.6 54,403.4 53,830.5 55,356.1 53,830.5
Organic Growth (Net Flows / Beginning of period AUM) -0.93% -1.31% -1.30% -1.74% -1.35% -3.52% -5.35%
Market Growth % 2.70% 1.87% 0.75% 2.91% -4.09% 5.31% -2.24%
Other affiliate sourced net flows 309.5 (30.0) (31.9) (193.3) 28.3 247.6 (478.6)
Variable annuity net flows (813.8) (678.4) (672.9) (742.2) (805.7) (2,165.1) (2,674.0)
Total Affiliate Sourced Net Flows (504.3) (708.4) (704.8) (935.5) (777.4) (1,917.5) (3,152.5)
Total Investment Management Sourced Net Flows 174.8 464.0 517.3 (686.0) (1,126.0) 1,156.1 168.3
Total Net Flows (329.5) (244.4) (187.5) (1,621.5) (1,903.4) (761.4) (2,984.2)
Net Flows excluding sub-advisor replacements and variable
annuity net flows 297.4 434.0 485.4 (879.3) (2,503.6) 1,216.8 (1,716.1)
Page 29 of 84
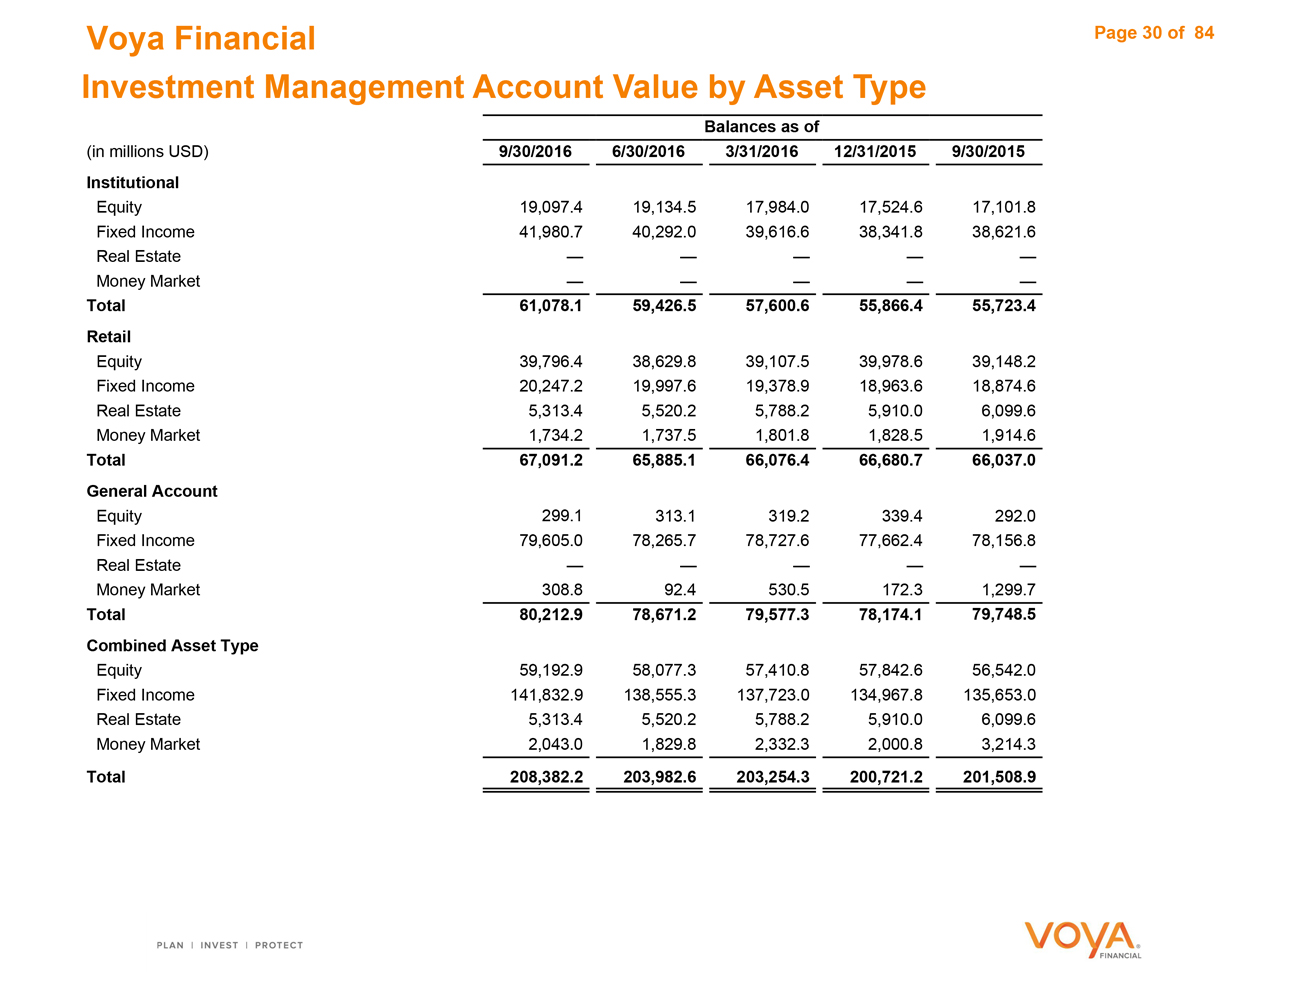
Voya Financial
Investment Management Account Value by Asset Type
Balances as of
(in millions USD) 9/30/2016 6/30/2016 3/31/2016 12/31/2015 9/30/2015
Institutional
Equity 19,097.4 19,134.5 17,984.0 17,524.6 17,101.8
Fixed Income 41,980.7 40,292.0 39,616.6 38,341.8 38,621.6
Real Estate — — — — —
Money Market — — — — —
Total 61,078.1 59,426.5 57,600.6 55,866.4 55,723.4
Retail
Equity 39,796.4 38,629.8 39,107.5 39,978.6 39,148.2
Fixed Income 20,247.2 19,997.6 19,378.9 18,963.6 18,874.6
Real Estate 5,313.4 5,520.2 5,788.2 5,910.0 6,099.6
Money Market 1,734.2 1,737.5 1,801.8 1,828.5 1,914.6
Total 67,091.2 65,885.1 66,076.4 66,680.7 66,037.0
General Account
Equity 299.1 313.1 319.2 339.4 292.0
Fixed Income 79,605.0 78,265.7 78,727.6 77,662.4 78,156.8
Real Estate — — — — —
Money Market 308.8 92.4 530.5 172.3 1,299.7
Total 80,212.9 78,671.2 79,577.3 78,174.1 79,748.5
Combined Asset Type
Equity 59,192.9 58,077.3 57,410.8 57,842.6 56,542.0
Fixed Income 141,832.9 138,555.3 137,723.0 134,967.8 135,653.0
Real Estate 5,313.4 5,520.2 5,788.2 5,910.0 6,099.6
Money Market 2,043.0 1,829.8 2,332.3 2,000.8 3,214.3
Total 208,382.2 203,982.6 203,254.3 200,721.2 201,508.9
Page 30 of 84

Annuities

Voya Financial
Annuities Operating Earnings
Three Months Ended Year-to-Date
(in millions USD) 9/30/2016 6/30/2016 3/31/2016 12/31/2015 9/30/2015 9/30/2016 9/30/2015
Operating revenues
Net investment income and net realized gains (losses) 267.2 269.3 255.1 273.1 264.8 791.6 795.0
Fee income 17.1 16.4 15.8 16.4 16.0 49.3 47.2
Premiums 22.5 29.5 27.8 29.2 30.1 79.8 87.2
Other revenue 3.8 3.9 4.3 3.5 3.5 12.0 11.0
Total operating revenues 310.6 319.1 303.0 322.2 314.4 932.7 940.4
Operating benefits and expenses
Interest credited and other benefits to contract owners/
policyholders (163.5) (173.0) (175.9) (179.2) (166.0) (512.4) (518.7)
Operating expenses (39.7) (39.0) (40.5) (38.2) (38.1) (119.2) (114.1)
Net amortization of DAC/VOBA 5.9 (34.5) (35.9) (41.9) (59.8) (64.5) (127.5)
Total operating benefits and expenses (197.3) (246.5) (252.3) (259.3) (263.9) (696.1) (760.3)
Operating earnings before income taxes 113.3 72.6 50.7 62.9 50.5 236.6 180.1
Page 32 of 84
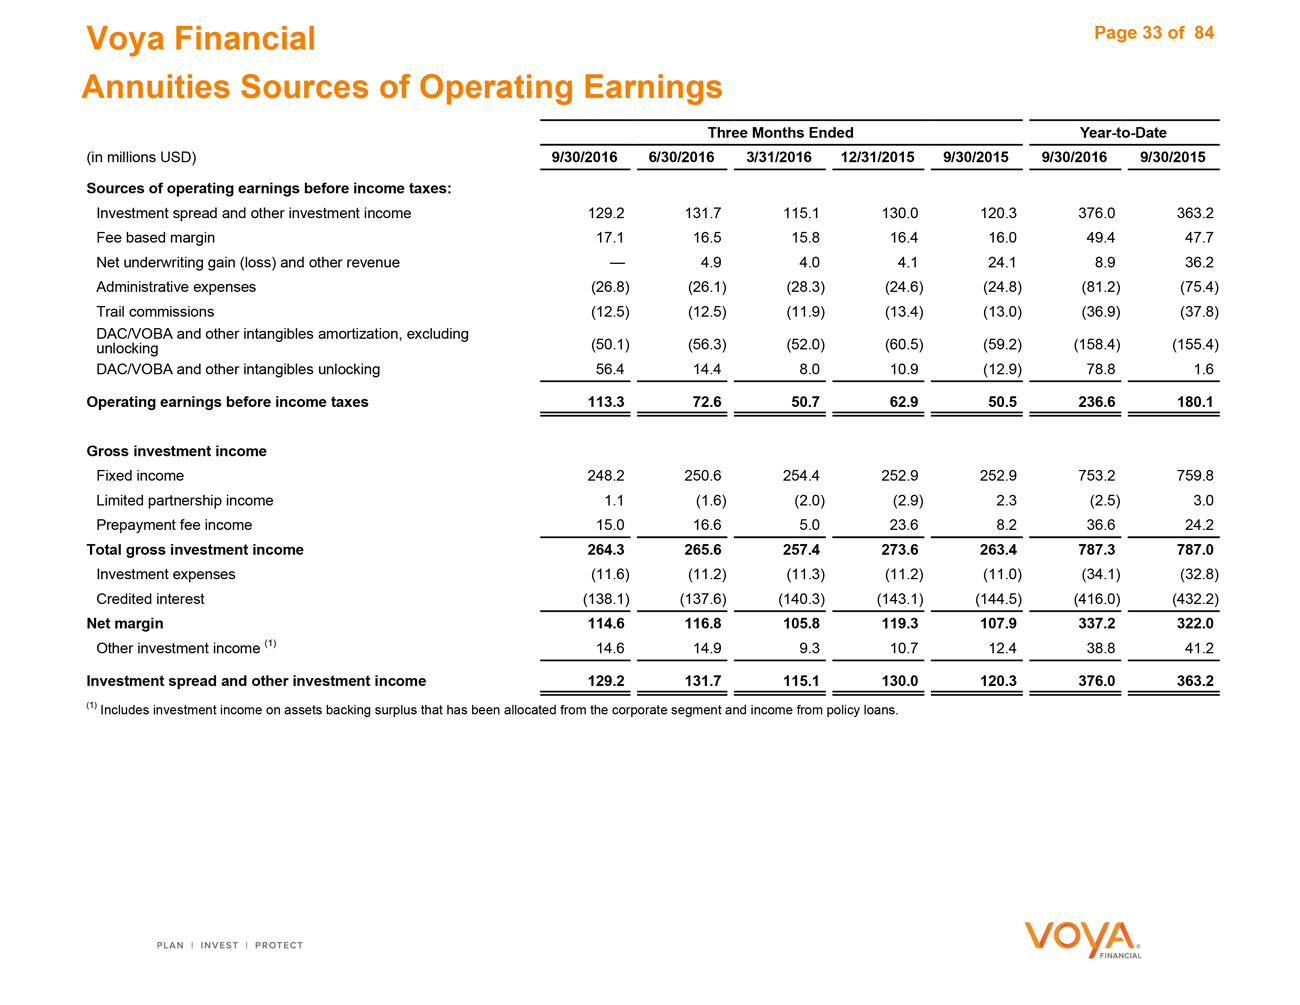
Voya Financial
Annuities Sources of Operating Earnings
Three Months Ended Year-to-Date
(in millions USD) 9/30/2016 6/30/2016 3/31/2016 12/31/2015 9/30/2015 9/30/2016 9/30/2015
Sources of operating earnings before income taxes:
Investment spread and other investment income 129.2 131.7 115.1 130.0 120.3 376.0 363.2
Fee based margin 17.1 16.5 15.8 16.4 16.0 49.4 47.7
Net underwriting gain (loss) and other revenue — 4.9 4.0 4.1 24.1 8.9 36.2
Administrative expenses (26.8) (26.1) (28.3) (24.6) (24.8) (81.2) (75.4)
Trail commissions (12.5) (12.5) (11.9) (13.4) (13.0) (36.9) (37.8)
DAC/VOBA and other intangibles amortization, excluding
unlocking (50.1) (56.3) (52.0) (60.5) (59.2) (158.4) (155.4)
DAC/VOBA and other intangibles unlocking 56.4 14.4 8.0 10.9 (12.9) 78.8 1.6
Operating earnings before income taxes 113.3 72.6 50.7 62.9 50.5 236.6 180.1
Gross investment income
Fixed income 248.2 250.6 254.4 252.9 252.9 753.2 759.8
Limited partnership income 1.1 (1.6) (2.0) (2.9) 2.3 (2.5) 3.0
Prepayment fee income 15.0 16.6 5.0 23.6 8.2 36.6 24.2
Total gross investment income 264.3 265.6 257.4 273.6 263.4 787.3 787.0
Investment expenses (11.6) (11.2) (11.3) (11.2) (11.0) (34.1) (32.8)
Credited interest (138.1) (137.6) (140.3) (143.1) (144.5) (416.0) (432.2)
Net margin 114.6 116.8 105.8 119.3 107.9 337.2 322.0
Other investment income (1) 14.6 14.9 9.3 10.7 12.4 38.8 41.2
Investment spread and other investment income 129.2 131.7 115.1 130.0 120.3 376.0 363.2
(1) Includes investment income on assets backing surplus that has been allocated from the corporate segment and income from policy loans.
Page 33 of 84
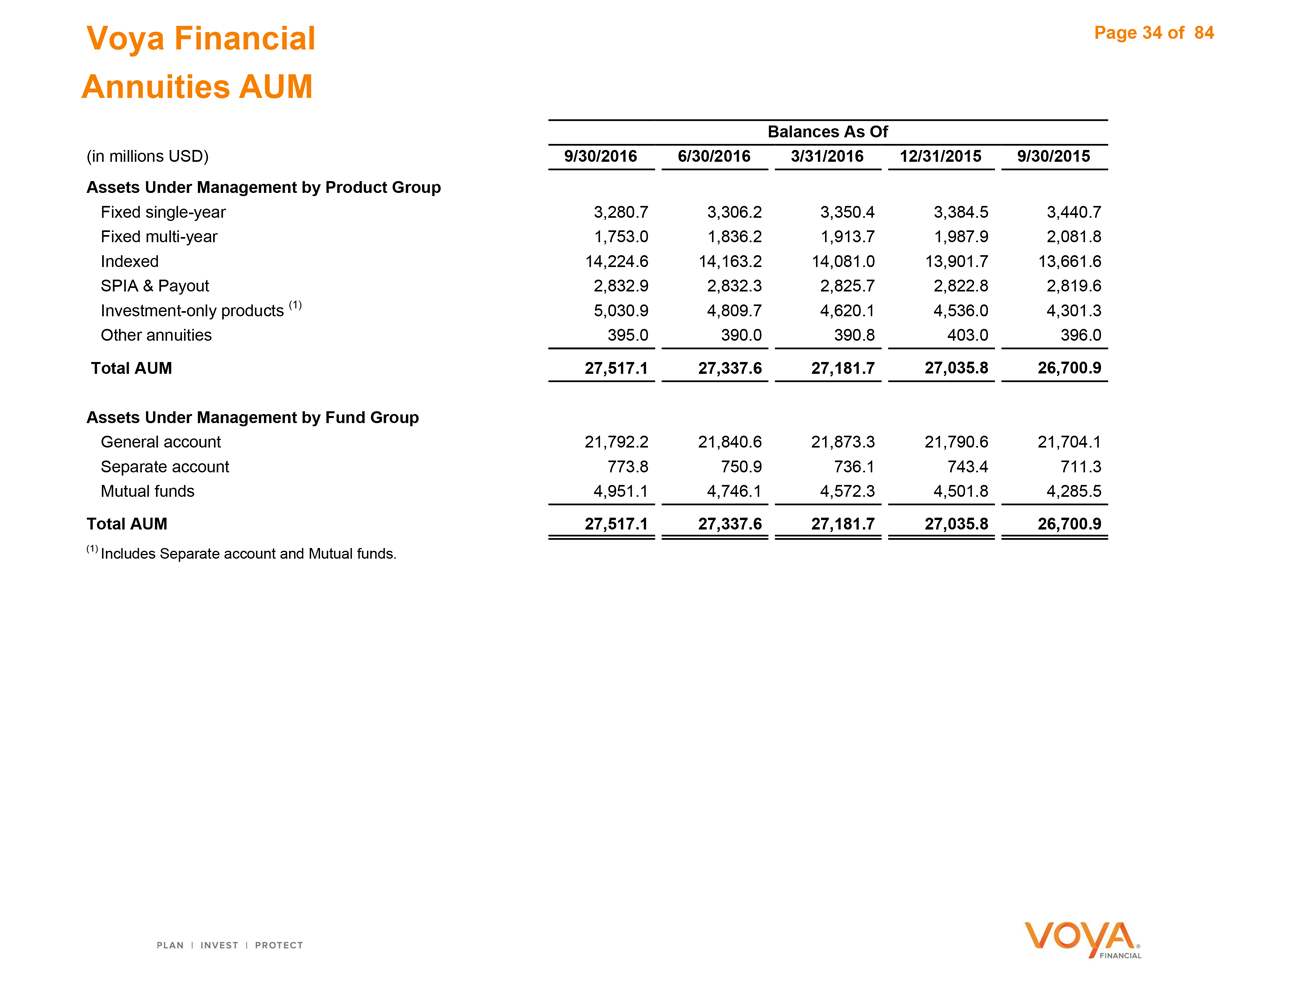
Voya Financial Annuities AUM
Balances As Of
(in millions USD) 9/30/2016 6/30/2016 3/31/2016 12/31/2015 9/30/2015
Assets Under Management by Product Group
Fixed single-year 3,280.7 3,306.2 3,350.4 3,384.5 3,440.7
Fixed multi-year 1,753.0 1,836.2 1,913.7 1,987.9 2,081.8
Indexed 14,224.6 14,163.2 14,081.0 13,901.7 13,661.6
SPIA & Payout 2,832.9 2,832.3 2,825.7 2,822.8 2,819.6
Investment-only products (1) 5,030.9 4,809.7 4,620.1 4,536.0 4,301.3
Other annuities 395.0 390.0 390.8 403.0 396.0
Total AUM 27,517.1 27,337.6 27,181.7 27,035.8 26,700.9
Assets Under Management by Fund Group
General account 21,792.2 21,840.6 21,873.3 21,790.6 21,704.1
Separate account 773.8 750.9 736.1 743.4 711.3
Mutual funds 4,951.1 4,746.1 4,572.3 4,501.8 4,285.5
Total AUM 27,517.1 27,337.6 27,181.7 27,035.8 26,700.9
| (1) |
|
Includes Separate account and Mutual funds. |
Page 34 of 84
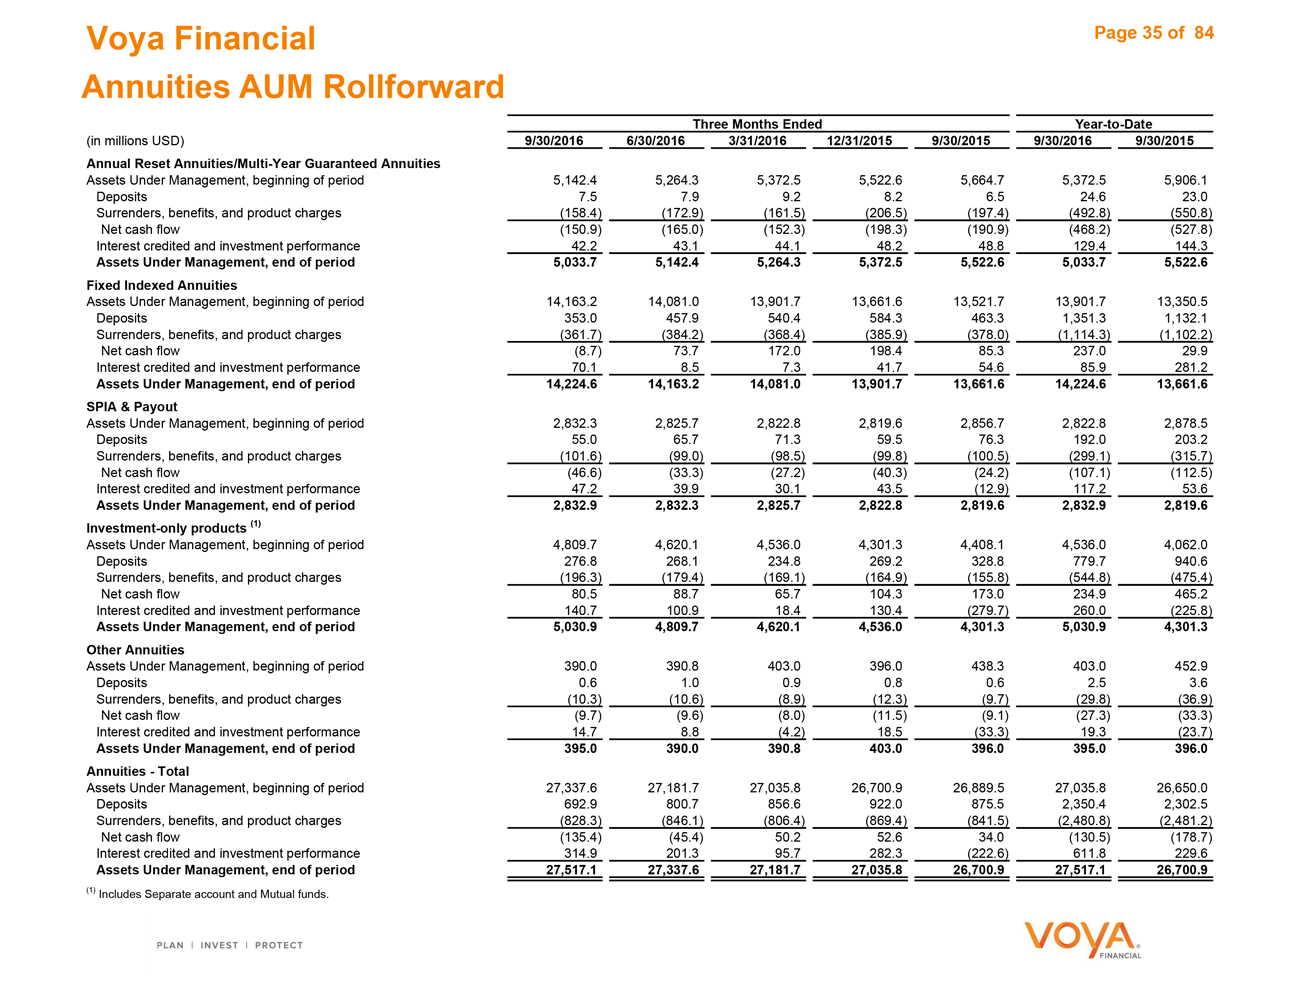
Three Months Ended Year-to-Date
(in millions USD) 9/30/2016 6/30/2016 3/31/2016 12/31/2015 9/30/2015 9/30/2016 9/30/2015
Annual Reset Annuities/Multi-Year Guaranteed Annuities
Assets Under Management, beginning of period 5,142.4 5,264.3 5,372.5 5,522.6 5,664.7 5,372.5 5,906.1
Deposits 7.5 7.9 9.2 8.2 6.5 24.6 23.0
Surrenders, benefits, and product charges (158.4) (172.9) (161.5) (206.5) (197.4) (492.8) (550.8)
Net cash flow (150.9) (165.0) (152.3) (198.3) (190.9) (468.2) (527.8)
Interest credited and investment performance 42.2 43.1 44.1 48.2 48.8 129.4 144.3
Assets Under Management, end of period 5,033.7 5,142.4 5,264.3 5,372.5 5,522.6 5,033.7 5,522.6
Fixed Indexed Annuities
Assets Under Management, beginning of period 14,163.2 14,081.0 13,901.7 13,661.6 13,521.7 13,901.7 13,350.5
Deposits 353.0 457.9 540.4 584.3 463.3 1,351.3 1,132.1
Surrenders, benefits, and product charges (361.7) (384.2) (368.4) (385.9) (378.0) (1,114.3) (1,102.2)
Net cash flow (8.7) 73.7 172.0 198.4 85.3 237.0 29.9
Interest credited and investment performance 70.1 8.5 7.3 41.7 54.6 85.9 281.2
Assets Under Management, end of period 14,224.6 14,163.2 14,081.0 13,901.7 13,661.6 14,224.6 13,661.6
SPIA & Payout
Assets Under Management, beginning of period 2,832.3 2,825.7 2,822.8 2,819.6 2,856.7 2,822.8 2,878.5
Deposits 55.0 65.7 71.3 59.5 76.3 192.0 203.2
Surrenders, benefits, and product charges (101.6) (99.0) (98.5) (99.8) (100.5) (299.1) (315.7)
Net cash flow (46.6) (33.3) (27.2) (40.3) (24.2) (107.1) (112.5)
Interest credited and investment performance 47.2 39.9 30.1 43.5 (12.9) 117.2 53.6
Assets Under Management, end of period 2,832.9 2,832.3 2,825.7 2,822.8 2,819.6 2,832.9 2,819.6
Investment-only products (1)
Assets Under Management, beginning of period 4,809.7 4,620.1 4,536.0 4,301.3 4,408.1 4,536.0 4,062.0
Deposits 276.8 268.1 234.8 269.2 328.8 779.7 940.6
Surrenders, benefits, and product charges (196.3) (179.4) (169.1) (164.9) (155.8) (544.8) (475.4)
Net cash flow 80.5 88.7 65.7 104.3 173.0 234.9 465.2
Interest credited and investment performance 140.7 100.9 18.4 130.4 (279.7) 260.0 (225.8)
Assets Under Management, end of period 5,030.9 4,809.7 4,620.1 4,536.0 4,301.3 5,030.9 4,301.3
Other Annuities
Assets Under Management, beginning of period 390.0 390.8 403.0 396.0 438.3 403.0 452.9
Deposits 0.6 1.0 0.9 0.8 0.6 2.5 3.6
Surrenders, benefits, and product charges (10.3) (10.6) (8.9) (12.3) (9.7) (29.8) (36.9)
Net cash flow (9.7) (9.6) (8.0) (11.5) (9.1) (27.3) (33.3)
Interest credited and investment performance 14.7 8.8 (4.2) 18.5 (33.3) 19.3 (23.7)
Assets Under Management, end of period 395.0 390.0 390.8 403.0 396.0 395.0 396.0
Annuities—Total
Assets Under Management, beginning of period 27,337.6 27,181.7 27,035.8 26,700.9 26,889.5 27,035.8 26,650.0
Deposits 692.9 800.7 856.6 922.0 875.5 2,350.4 2,302.5
Surrenders, benefits, and product charges (828.3) (846.1) (806.4) (869.4) (841.5) (2,480.8) (2,481.2)
Net cash flow (135.4) (45.4) 50.2 52.6 34.0 (130.5) (178.7)
Interest credited and investment performance 314.9 201.3 95.7 282.3 (222.6) 611.8 229.6
Assets Under Management, end of period 27,517.1 27,337.6 27,181.7 27,035.8 26,700.9 27,517.1 26,700.9
| (1) |
|
Includes Separate account and Mutual funds. |
Page 35 of 84

Individual Life
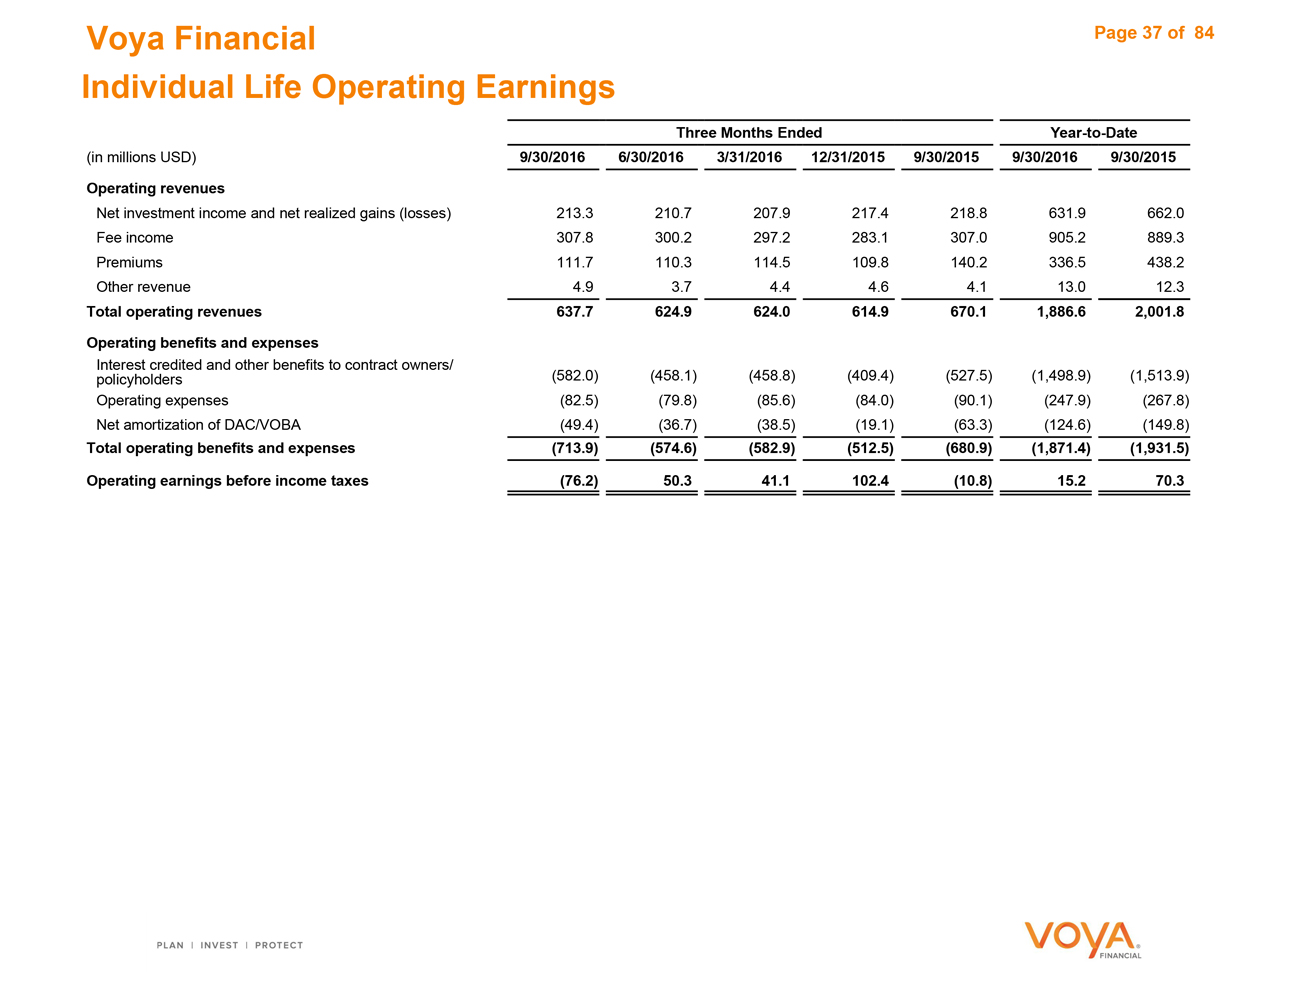
Voya Financial
Individual Life Operating Earnings
Three Months Ended Year-to-Date
(in millions USD) 9/30/2016 6/30/2016 3/31/2016 12/31/2015 9/30/2015 9/30/2016 9/30/2015
Operating revenues
Net investment income and net realized gains (losses) 213.3 210.7 207.9 217.4 218.8 631.9 662.0
Fee income 307.8 300.2 297.2 283.1 307.0 905.2 889.3
Premiums 111.7 110.3 114.5 109.8 140.2 336.5 438.2
Other revenue 4.9 3.7 4.4 4.6 4.1 13.0 12.3
Total operating revenues 637.7 624.9 624.0 614.9 670.1 1,886.6 2,001.8
Operating benefits and expenses
Interest credited and other benefits to contract owners/
policyholders (582.0) (458.1) (458.8) (409.4) (527.5) (1,498.9) (1,513.9)
Operating expenses (82.5) (79.8) (85.6) (84.0) (90.1) (247.9) (267.8)
Net amortization of DAC/VOBA (49.4) (36.7) (38.5) (19.1) (63.3) (124.6) (149.8)
Total operating benefits and expenses (713.9) (574.6) (582.9) (512.5) (680.9) (1,871.4) (1,931.5)
Operating earnings before income taxes (76.2) 50.3 41.1 102.4 (10.8) 15.2 70.3
Page 37 of 84
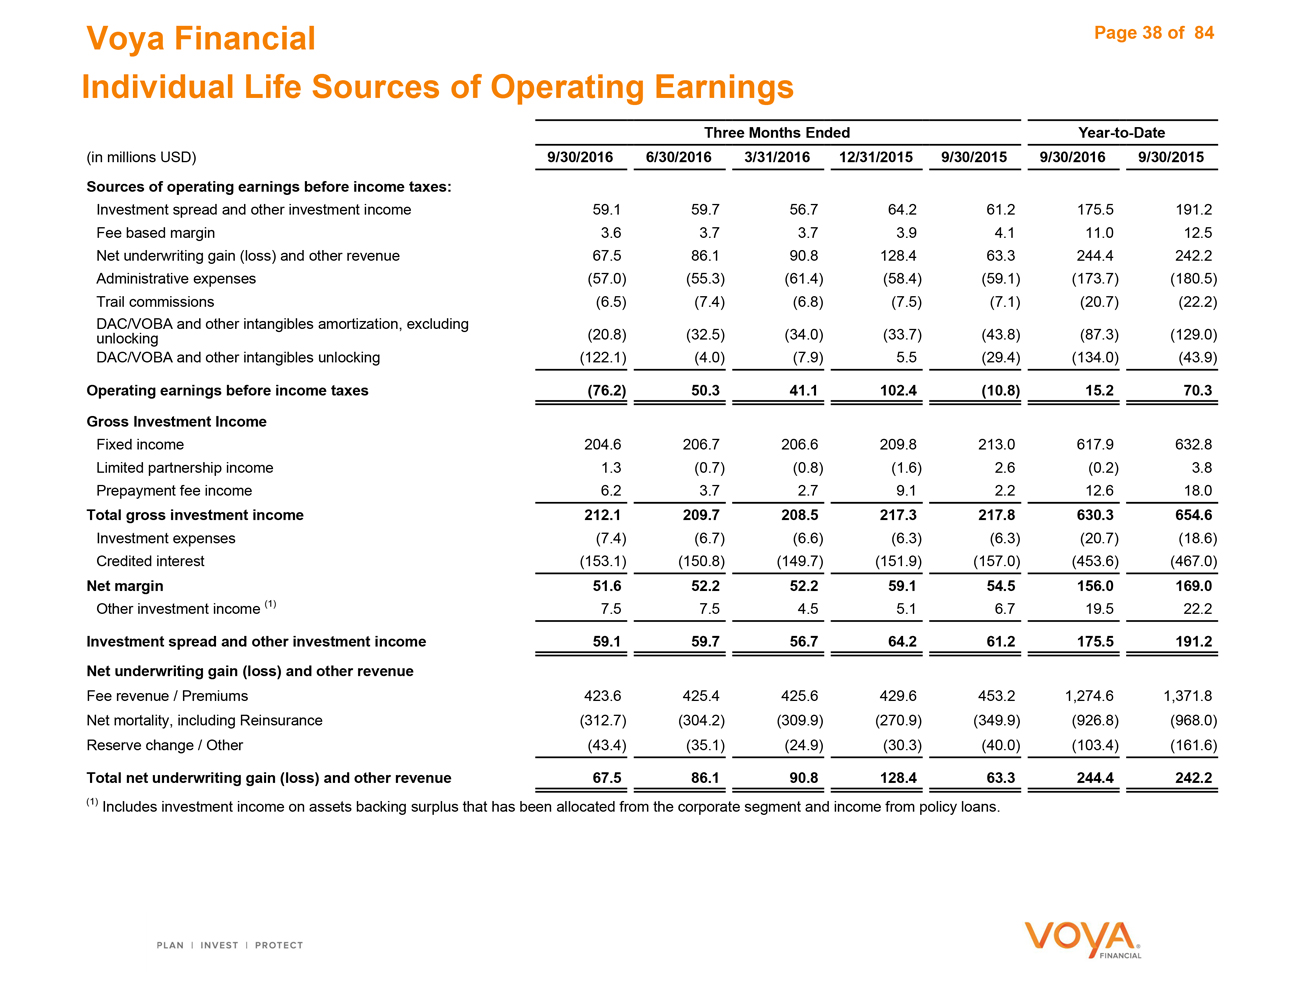
Voya Financial
Individual Life Sources of Operating Earnings
Three Months Ended Year-to-Date
(in millions USD) 9/30/2016 6/30/2016 3/31/2016 12/31/2015 9/30/2015 9/30/2016 9/30/2015
Sources of operating earnings before income taxes:
Investment spread and other investment income 59.1 59.7 56.7 64.2 61.2 175.5 191.2
Fee based margin 3.6 3.7 3.7 3.9 4.1 11.0 12.5
Net underwriting gain (loss) and other revenue 67.5 86.1 90.8 128.4 63.3 244.4 242.2
Administrative expenses (57.0) (55.3) (61.4) (58.4) (59.1) (173.7) (180.5)
Trail commissions (6.5) (7.4) (6.8) (7.5) (7.1) (20.7) (22.2)
DAC/VOBA and other intangibles amortization, excluding
unlocking (20.8) (32.5) (34.0) (33.7) (43.8) (87.3) (129.0)
DAC/VOBA and other intangibles unlocking (122.1) (4.0) (7.9) 5.5 (29.4) (134.0) (43.9)
Operating earnings before income taxes (76.2) 50.3 41.1 102.4 (10.8) 15.2 70.3
Gross Investment Income
Fixed income 204.6 206.7 206.6 209.8 213.0 617.9 632.8
Limited partnership income 1.3 (0.7) (0.8) (1.6) 2.6 (0.2) 3.8
Prepayment fee income 6.2 3.7 2.7 9.1 2.2 12.6 18.0
Total gross investment income 212.1 209.7 208.5 217.3 217.8 630.3 654.6
Investment expenses (7.4) (6.7) (6.6) (6.3) (6.3) (20.7) (18.6)
Credited interest (153.1) (150.8) (149.7) (151.9) (157.0) (453.6) (467.0)
Net margin 51.6 52.2 52.2 59.1 54.5 156.0 169.0
Other investment income (1) 7.5 7.5 4.5 5.1 6.7 19.5 22.2
Investment spread and other investment income 59.1 59.7 56.7 64.2 61.2 175.5 191.2
Net underwriting gain (loss) and other revenue
Fee revenue / Premiums 423.6 425.4 425.6 429.6 453.2 1,274.6 1,371.8
Net mortality, including Reinsurance (312.7) (304.2) (309.9) (270.9) (349.9) (926.8) (968.0)
Reserve change / Other (43.4) (35.1) (24.9) (30.3) (40.0) (103.4) (161.6)
Total net underwriting gain (loss) and other revenue 67.5 86.1 90.8 128.4 63.3 244.4 242.2
(1) Includes investment income on assets backing surplus that has been allocated from the corporate segment and income from policy loans.
Page 38 of 84

Voya Financial
Individual Life Key Metrics
Three Months Ended Year-to-Date
(in millions USD) 9/30/2016 6/30/2016 3/31/2016 12/31/2015 9/30/2015 9/30/2016 9/30/2015
Sales by Product Line:
Guaranteed — — 0.1 — 0.1 0.1 0.1
Accumulation 0.9 1.3 1.8 1.1 1.4 4.0 4.0
Indexed 19.7 23.1 17.3 23.7 18.2 60.1 48.1
Total Universal life 20.6 24.4 19.2 24.8 19.7 64.2 52.2
Variable life 0.7 1.0 0.8 1.8 1.0 2.5 3.7
Term 2.6 3.0 3.5 3.8 4.0 9.1 14.0
Whole life — — — — — — —
Total sales by product line 23.9 28.4 23.5 30.4 24.7 75.8 69.9
Gross Premiums and Deposits by Product (1)
Interest sensitive 302.0 308.4 296.7 320.9 289.6 907.1 869.3
Non—interest sensitive 140.6 139.6 142.9 146.4 175.1 423.1 540.6
Total gross premiums and deposits 442.6 448.0 439.6 467.3 464.7 1,330.2 1,409.9
Applications
New business policy count (Paid) 3,526 3,969 4,251 4,552 4,654 11,746 15,668
End of Period:
In-Force Face Amount by Product (1)
Universal life 79,443 79,131 78,518 78,274 77,846 79,443 77,846
Variable life 23,430 23,878 24,361 24,734 25,224 23,430 25,224
Term 246,453 249,561 252,871 252,274 361,173 246,453 361,173
Whole life 1,871 1,895 1,923 1,938 1,974 1,871 1,974
Total in-force face amount 351,197 354,465 357,673 357,220 466,216 351,197 466,216
In-Force Policy Count (in whole numbers) (1)
Universal life 260,777 263,781 266,463 269,568 272,179 260,777 272,179
Variable life 55,776 56,695 57,593 58,524 59,669 55,776 59,669
Term 462,001 467,925 473,843 474,389 633,872 462,001 633,872
Whole life 118,913 120,597 122,402 124,437 126,230 118,913 126,230
Total in-force policy count 897,467 908,998 920,301 926,918 1,091,950 897,467 1,091,950
Assets Under Management by Fund Group (1)
General account 12,663.1 12,632.1 12,758.4 12,603.1 13,015.3 12,663.1 13,015.3
Separate account 2,529.9 2,473.4 2,477.6 2,520.8 2,470.6 2,529.9 2,470.6
Total AUM 15,193.0 15,105.5 15,236.0 15,123.9 15,485.9 15,193.0 15,485.9
| (1) |
|
Excludes amounts transferred to third parties through reinsurance transactions. |
Page 39 of 84

Employee Benefits
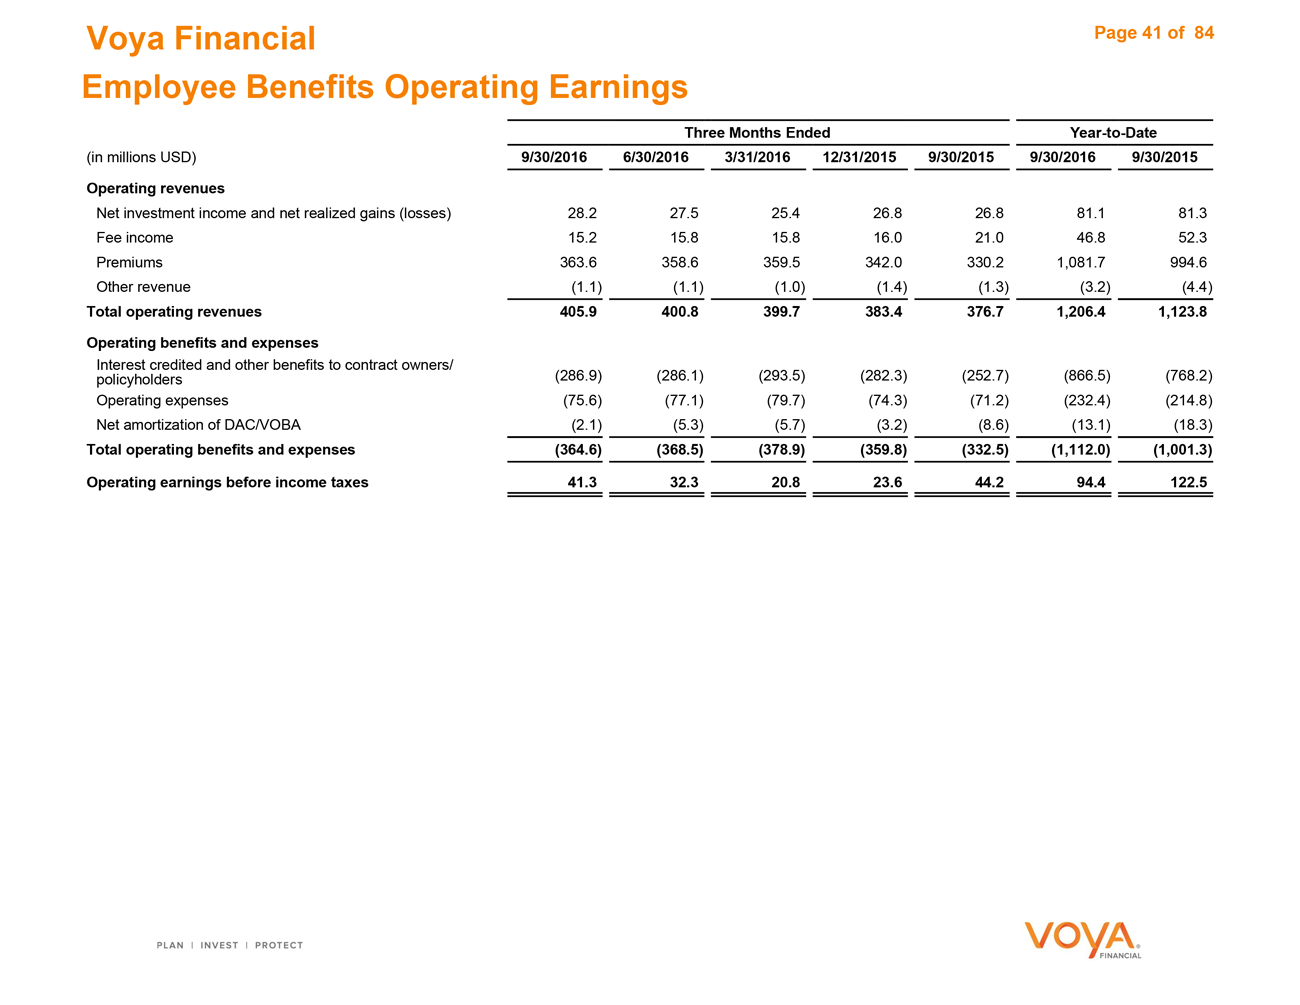
Voya Financial
Employee Benefits Operating Earnings
Three Months Ended Year-to-Date
(in millions USD) 9/30/2016 6/30/2016 3/31/2016 12/31/2015 9/30/2015 9/30/2016 9/30/2015
Operating revenues
Net investment income and net realized gains (losses) 28.2 27.5 25.4 26.8 26.8 81.1 81.3
Fee income 15.2 15.8 15.8 16.0 21.0 46.8 52.3
Premiums 363.6 358.6 359.5 342.0 330.2 1,081.7 994.6
Other revenue (1.1) (1.1) (1.0) (1.4) (1.3) (3.2) (4.4)
Total operating revenues 405.9 400.8 399.7 383.4 376.7 1,206.4 1,123.8
Operating benefits and expenses
Interest credited and other benefits to contract owners/
policyholders (286.9) (286.1) (293.5) (282.3) (252.7) (866.5) (768.2)
Operating expenses (75.6) (77.1) (79.7) (74.3) (71.2) (232.4) (214.8)
Net amortization of DAC/VOBA (2.1) (5.3) (5.7) (3.2) (8.6) (13.1) (18.3)
Total operating benefits and expenses (364.6) (368.5) (378.9) (359.8) (332.5) (1,112.0) (1,001.3)
Operating earnings before income taxes 41.3 32.3 20.8 23.6 44.2 94.4 122.5
Page 41 of 84
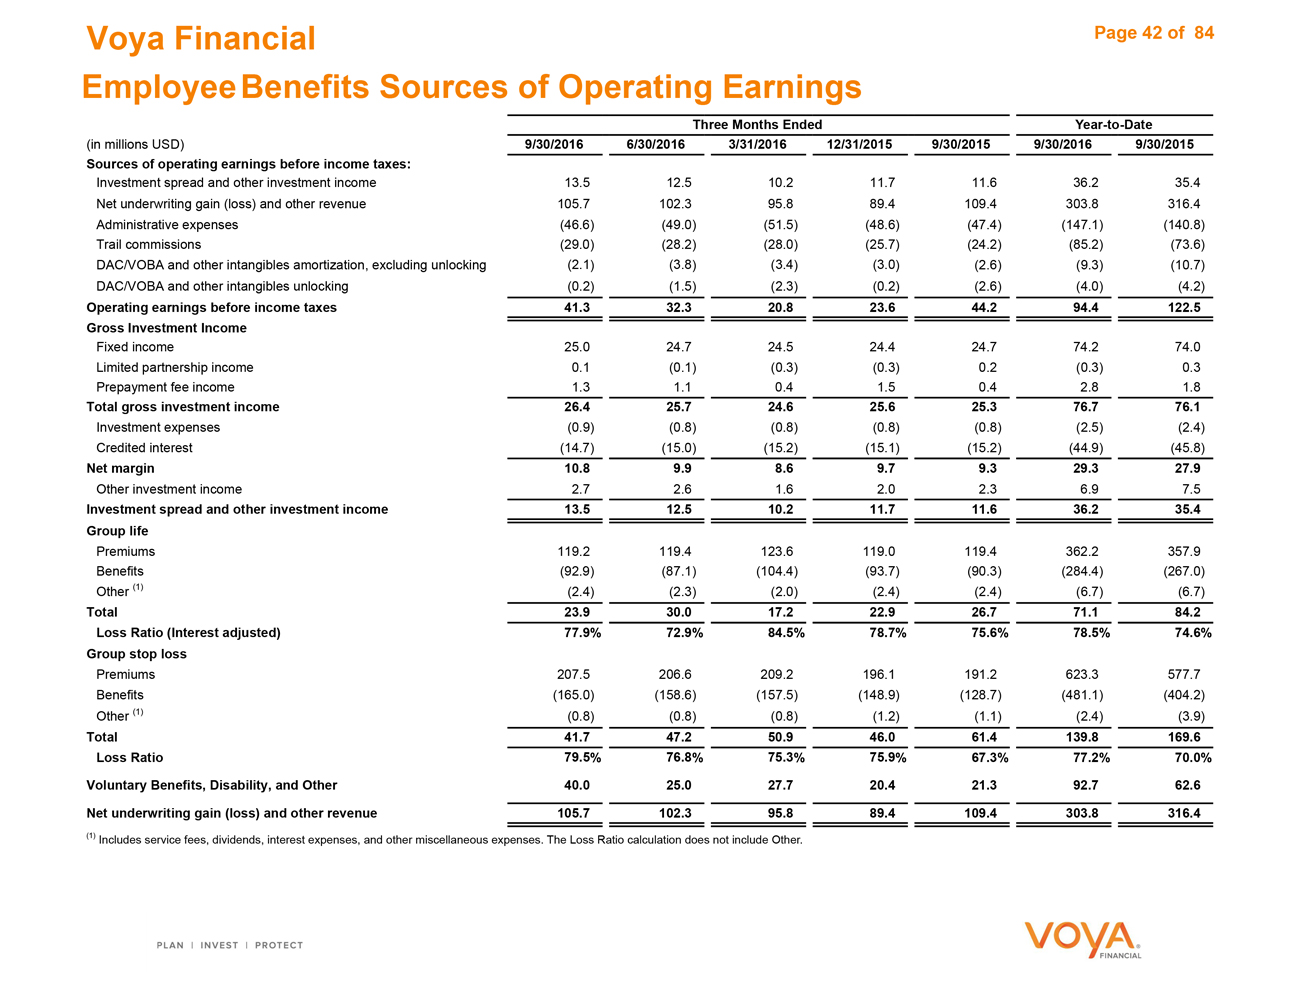
Voya Financial
Employee Benefits Sources of Operating Earnings
Three Months Ended Year-to-Date
(in millions USD) 9/30/2016 6/30/2016 3/31/2016 12/31/2015 9/30/2015 9/30/2016 9/30/2015
Sources of operating earnings before income taxes:
Investment spread and other investment income 13.5 12.5 10.2 11.7 11.6 36.2 35.4
Net underwriting gain (loss) and other revenue 105.7 102.3 95.8 89.4 109.4 303.8 316.4
Administrative expenses (46.6) (49.0) (51.5) (48.6) (47.4) (147.1) (140.8)
Trail commissions (29.0) (28.2) (28.0) (25.7) (24.2) (85.2) (73.6)
DAC/VOBA and other intangibles amortization, excluding unlocking (2.1) (3.8) (3.4) (3.0) (2.6) (9.3) (10.7)
DAC/VOBA and other intangibles unlocking (0.2) (1.5) (2.3) (0.2) (2.6) (4.0) (4.2)
Operating earnings before income taxes 41.3 32.3 20.8 23.6 44.2 94.4 122.5
Gross Investment Income
Fixed income 25.0 24.7 24.5 24.4 24.7 74.2 74.0
Limited partnership income 0.1 (0.1) (0.3) (0.3) 0.2 (0.3) 0.3
Prepayment fee income 1.3 1.1 0.4 1.5 0.4 2.8 1.8
Total gross investment income 26.4 25.7 24.6 25.6 25.3 76.7 76.1
Investment expenses (0.9) (0.8) (0.8) (0.8) (0.8) (2.5) (2.4)
Credited interest (14.7) (15.0) (15.2) (15.1) (15.2) (44.9) (45.8)
Net margin 10.8 9.9 8.6 9.7 9.3 29.3 27.9
Other investment income 2.7 2.6 1.6 2.0 2.3 6.9 7.5
Investment spread and other investment income 13.5 12.5 10.2 11.7 11.6 36.2 35.4
Group life
Premiums 119.2 119.4 123.6 119.0 119.4 362.2 357.9
Benefits (92.9) (87.1) (104.4) (93.7) (90.3) (284.4) (267.0)
Other (1) (2.4) (2.3) (2.0) (2.4) (2.4) (6.7) (6.7)
Total 23.9 30.0 17.2 22.9 26.7 71.1 84.2
Loss Ratio (Interest adjusted) 77.9% 72.9% 84.5% 78.7% 75.6% 78.5% 74.6%
Group stop loss
Premiums 207.5 206.6 209.2 196.1 191.2 623.3 577.7
Benefits (165.0) (158.6) (157.5) (148.9) (128.7) (481.1) (404.2)
Other (1) (0.8) (0.8) (0.8) (1.2) (1.1) (2.4) (3.9)
Total 41.7 47.2 50.9 46.0 61.4 139.8 169.6
Loss Ratio 79.5% 76.8% 75.3% 75.9% 67.3% 77.2% 70.0%
Voluntary Benefits, Disability, and Other 40.0 25.0 27.7 20.4 21.3 92.7 62.6
Net underwriting gain (loss) and other revenue 105.7 102.3 95.8 89.4 109.4 303.8 316.4
(1) Includes service fees, dividends, interest expenses, and other miscellaneous expenses. The Loss Ratio calculation does not include Other.
Page 42 of 84
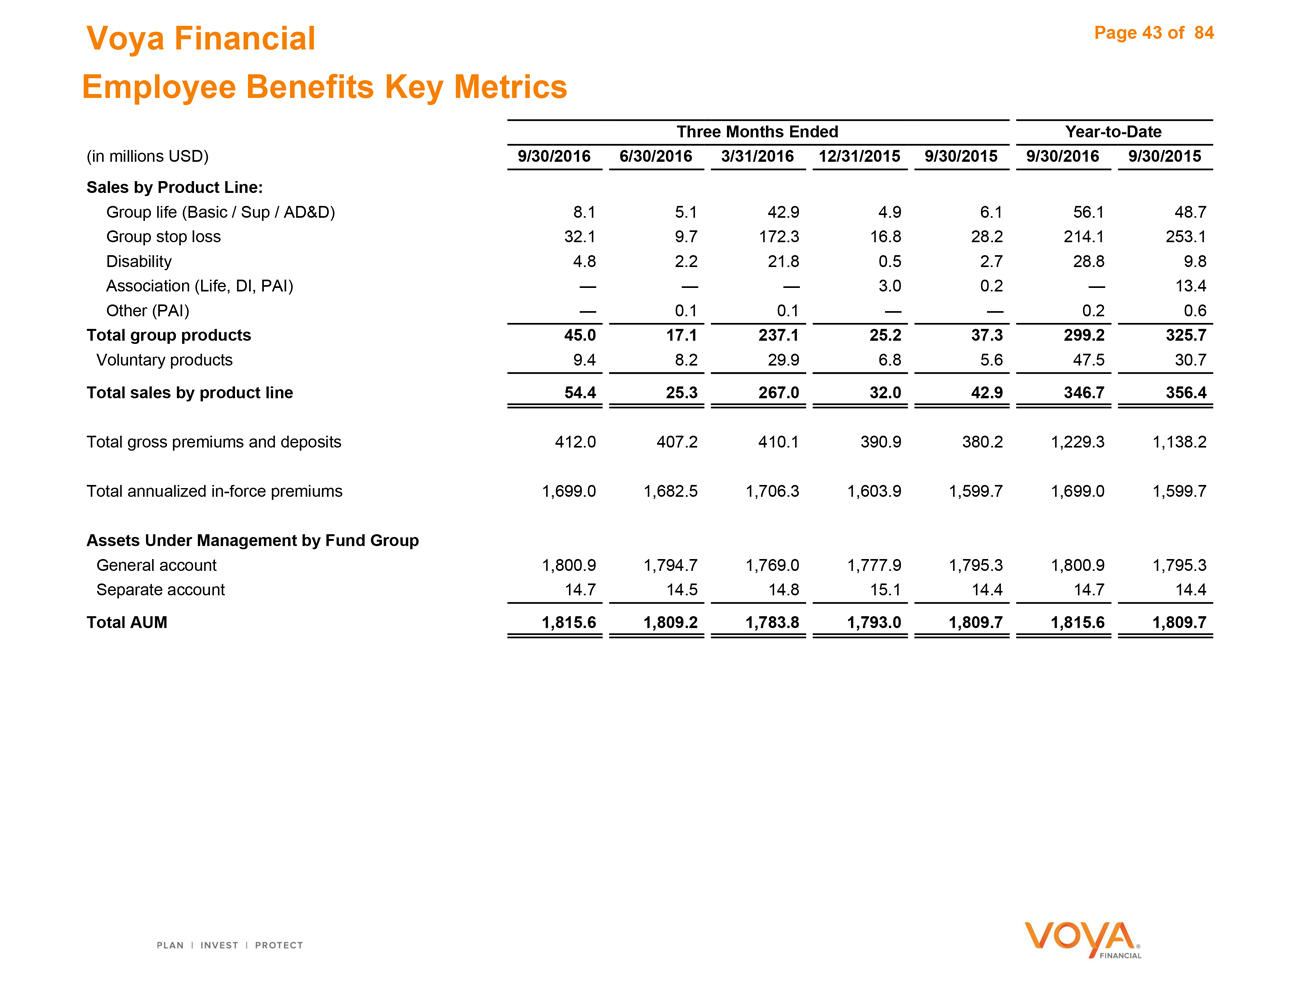
Voya Financial
Employee Benefits Key Metrics
Three Months Ended Year-to-Date
(in millions USD) 9/30/2016 6/30/2016 3/31/2016 12/31/2015 9/30/2015 9/30/2016 9/30/2015
Sales by Product Line:
Group life (Basic / Sup / AD&D) 8.1 5.1 42.9 4.9 6.1 56.1 48.7
Group stop loss 32.1 9.7 172.3 16.8 28.2 214.1 253.1
Disability 4.8 2.2 21.8 0.5 2.7 28.8 9.8
Association (Life, DI, PAI) — — — 3.0 0.2 — 13.4
Other (PAI) — 0.1 0.1 — — 0.2 0.6
Total group products 45.0 17.1 237.1 25.2 37.3 299.2 325.7
Voluntary products 9.4 8.2 29.9 6.8 5.6 47.5 30.7
Total sales by product line 54.4 25.3 267.0 32.0 42.9 346.7 356.4
Total gross premiums and deposits 412.0 407.2 410.1 390.9 380.2 1,229.3 1,138.2
Total annualized in-force premiums 1,699.0 1,682.5 1,706.3 1,603.9 1,599.7 1,699.0 1,599.7
Assets Under Management by Fund Group
General account 1,800.9 1,794.7 1,769.0 1,777.9 1,795.3 1,800.9 1,795.3
Separate account 14.7 14.5 14.8 15.1 14.4 14.7 14.4
Total AUM 1,815.6 1,809.2 1,783.8 1,793.0 1,809.7 1,815.6 1,809.7
Page 43 of 84

Corporate

Voya Financial
Corporate Operating Earnings
Three Months Ended Year-to-Date
(in millions USD) 9/30/2016 6/30/2016 3/31/2016 12/31/2015 9/30/2015 9/30/2016 9/30/2015
Interest expense (47.6) (49.0) (48.7) (48.5) (48.1) (145.3) (146.0)
Amortization of intangibles (8.9) (9.1) (9.1) (9.1) (9.1) (27.1) (27.5)
Strategic investment program (1) (28.9) (31.3) (33.3) (34.7) (31.7) (93.5) (44.8)
Other (2) 7.9 (4.9) 18.1 10.2 13.3 21.1 41.2
Operating earnings before income taxes (77.5) (94.3) (73.0) (82.1) (75.6) (244.8) (177.1)
(1) On June 2, 2015, we announced that we would undertake a strategic investment program over the next four years as it relates to IT simplification, digital and analytics,
and cross-enterprise initiatives.
(2) The three months ended 9/30/15 include $1.6 million of net investment income from Lehman Recovery/LIHTC.
Page 45 of 84

Closed Blocks (Variable Annuity and Other)
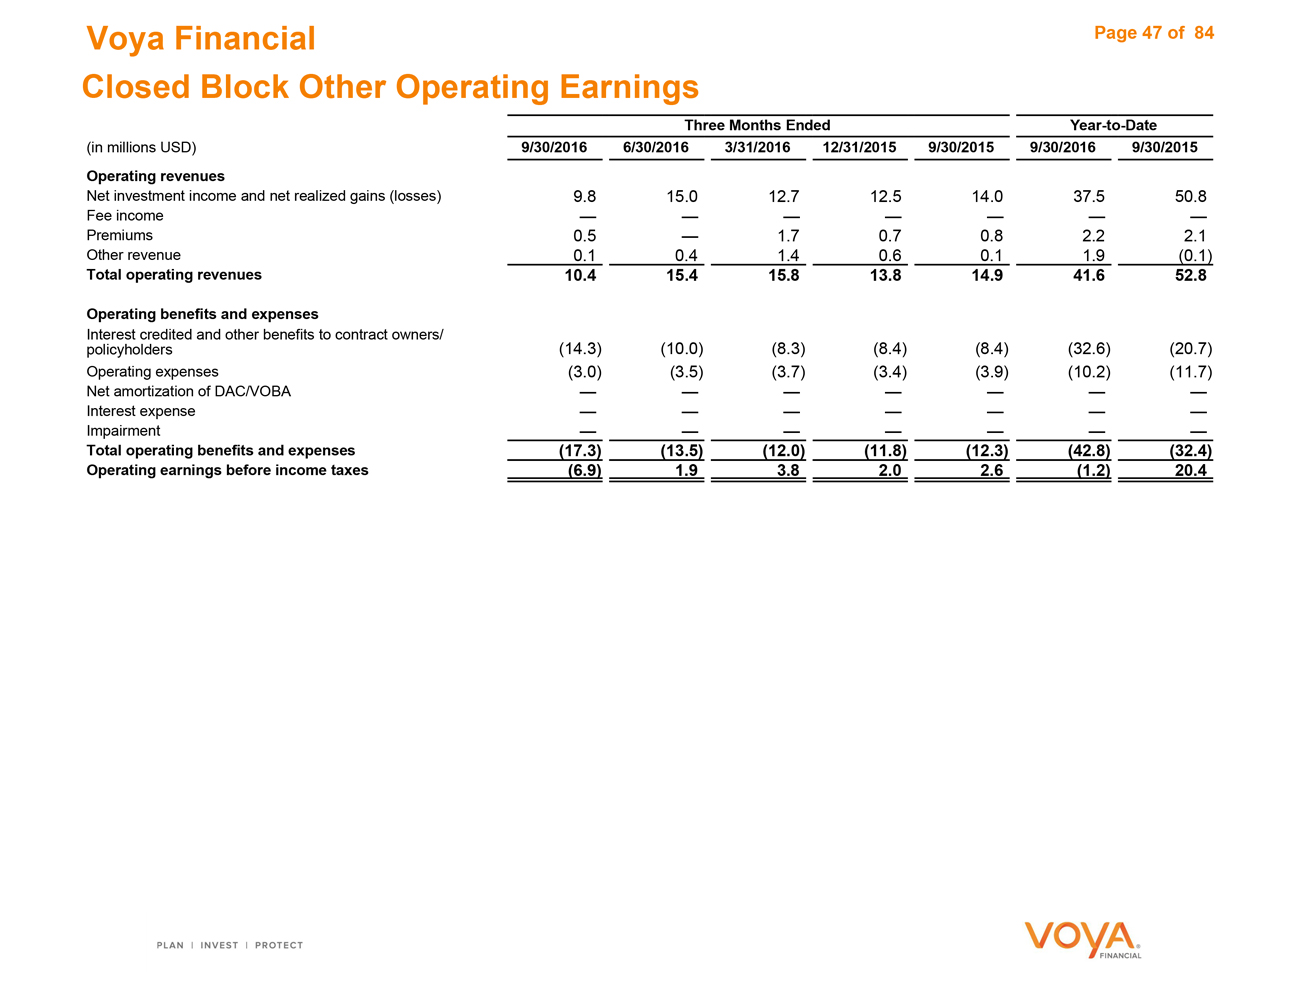
Voya Financial
Closed Block Other Operating Earnings
Three Months Ended Year-to-Date (in millions USD) 9/30/2016 6/30/2016 3/31/2016 12/31/2015 9/30/2015 9/30/2016 9/30/2015 Operating revenues
Net investment income and net realized gains (losses) 9.8 15.0 12.7 12.5 14.0 37.5 50.8 Fee income Premiums 0.5 1.7 0.7 0.8 2.2 2.1 Other revenue 0.1 0.4 1.4 0.6 0.1 1.9 (0.1)
Total operating revenues 10.4 15.4 15.8 13.8 14.9 41.6 52.8
Operating benefits and expenses
Interest credited and other benefits to contract owners/ (14.3) (10.0) (8.3) (8.4) (8.4) (32.6) (20.7) policyholders Operating expenses (3.0) (3.5) (3.7) (3.4) (3.9) (10.2) (11.7)
Net amortization of DAC/VOBA Interest expense Impairment
Total operating benefits and expenses (17.3) (13.5) (12.0) (11.8) (12.3) (42.8) (32.4)
Operating earnings before income taxes (6.9) 1.9 3.8 2.0 2.6 (1.2) 20.4
Page 47 of 84
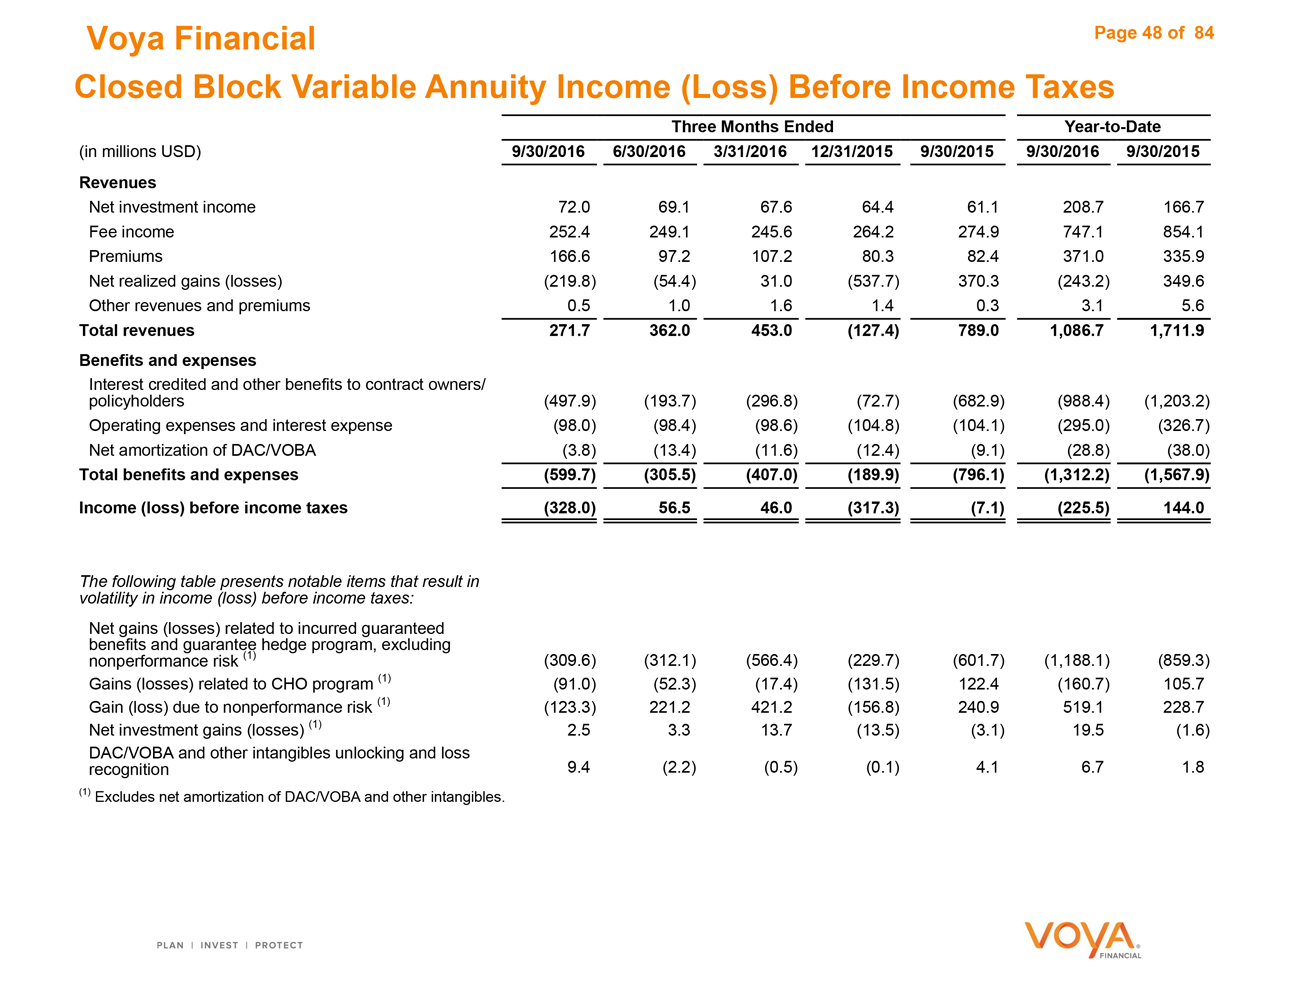
Voya Financial Closed Block Variable Annuity Income (Loss) Before Income Taxes
Three Months Ended Year-to-Date (in millions USD) 9/30/2016 6/30/2016 3/31/2016 12/31/2015 9/30/2015 9/30/2016 9/30/2015 Revenues
Net investment income 72.0 69.1 67.6 64.4 61.1 208.7 166.7 Fee income 252.4 249.1 245.6 264.2 274.9 747.1 854.1 Premiums 166.6 97.2 107.2 80.3 82.4 371.0 335.9 Net realized gains (losses) (219.8) (54.4) 31.0 (537.7) 370.3 (243.2) 349.6 Other revenues and premiums 0.5 1.0 1.6 1.4 0.3 3.1 5.6
Total revenues 271.7 362.0 453.0 (127.4) 789.0 1,086.7 1,711.9 Benefits and expenses
Interest credited and other benefits to contract owners/ policyholders (497.9) (193.7) (296.8) (72.7) (682.9) (988.4) (1,203.2) Operating expenses and interest expense (98.0) (98.4) (98.6) (104.8) (104.1) (295.0) (326.7) Net amortization of DAC/VOBA (3.8) (13.4) (11.6) (12.4) (9.1) (28.8) (38.0)
Total benefits and expenses (599.7) (305.5) (407.0) (189.9) (796.1) (1,312.2) (1,567.9) Income (loss) before income taxes (328.0) 56.5 46.0 (317.3) (7.1) (225.5) 144.0
The following table presents notable items that result in volatility in income (loss) before income taxes:
Net gains (losses) related to incurred guaranteed benefits and guarantee hedge program, excluding nonperformance risk (1) (309.6) (312.1) (566.4) (229.7) (601.7) (1,188.1) (859.3) Gains (losses) related to CHO program (1) (91.0) (52.3) (17.4) (131.5) 122.4 (160.7) 105.7 Gain (loss) due to nonperformance risk (1) (123.3) 221.2 421.2 (156.8) 240.9 519.1 228.7 Net investment gains (losses) (1) 2.5 3.3 13.7 (13.5) (3.1) 19.5 (1.6) DAC/VOBA and other intangibles unlocking and loss 9.4 (2.2) (0.5) (0.1) 4.1 6.7 1.8 recognition
(1) Excludes net amortization of DAC/VOBA and other intangibles.
Page 48 of 84
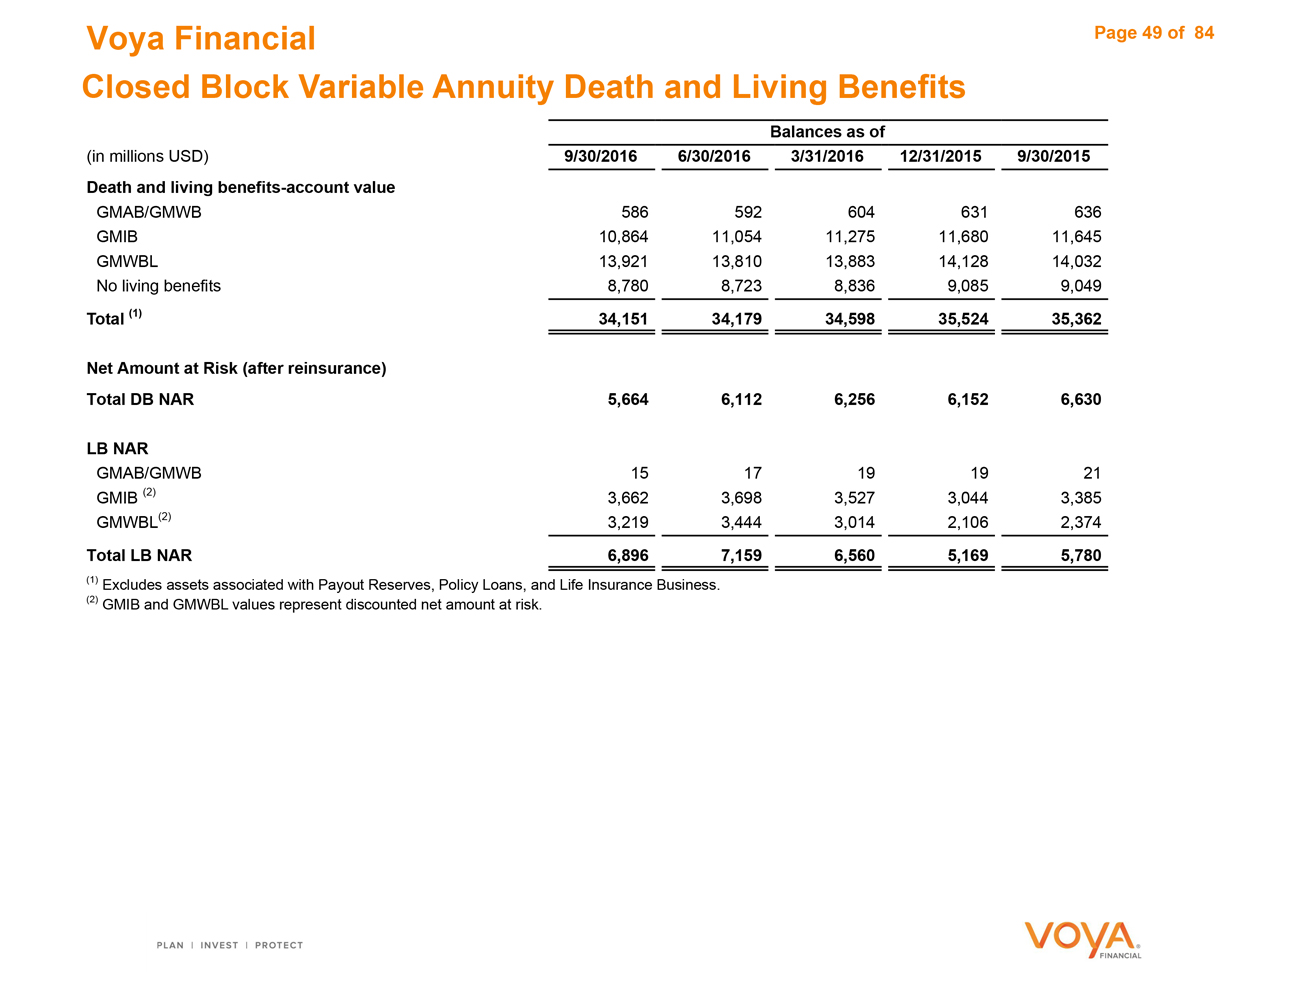
Voya Financial
Closed Block Variable Annuity Death and Living Benefits
Balances as of
(in millions USD) 9/30/2016 6/30/2016 3/31/2016 12/31/2015 9/30/2015 Death and living benefits-account value
GMAB/GMWB 586 592 604 631 636 GMIB 10,864 11,054 11,275 11,680 11,645 GMWBL 13,921 13,810 13,883 14,128 14,032 No living benefits 8,780 8,723 8,836 9,085 9,049
Total (1) 34,151 34,179 34,598 35,524 35,362
Net Amount at Risk (after reinsurance)
Total DB NAR 5,664 6,112 6,256 6,152 6,630
LB NAR
GMAB/GMWB 15 17 19 19 21 GMIB (2) 3,662 3,698 3,527 3,044 3,385 GMWBL(2) 3,219 3,444 3,014 2,106 2,374
Total LB NAR 6,896 7,159 6,560 5,169 5,780
(1) Excludes assets associated with Payout Reserves, Policy Loans, and Life Insurance Business. (2) GMIB and GMWBL values represent discounted net amount at risk.
Page 49 of 84
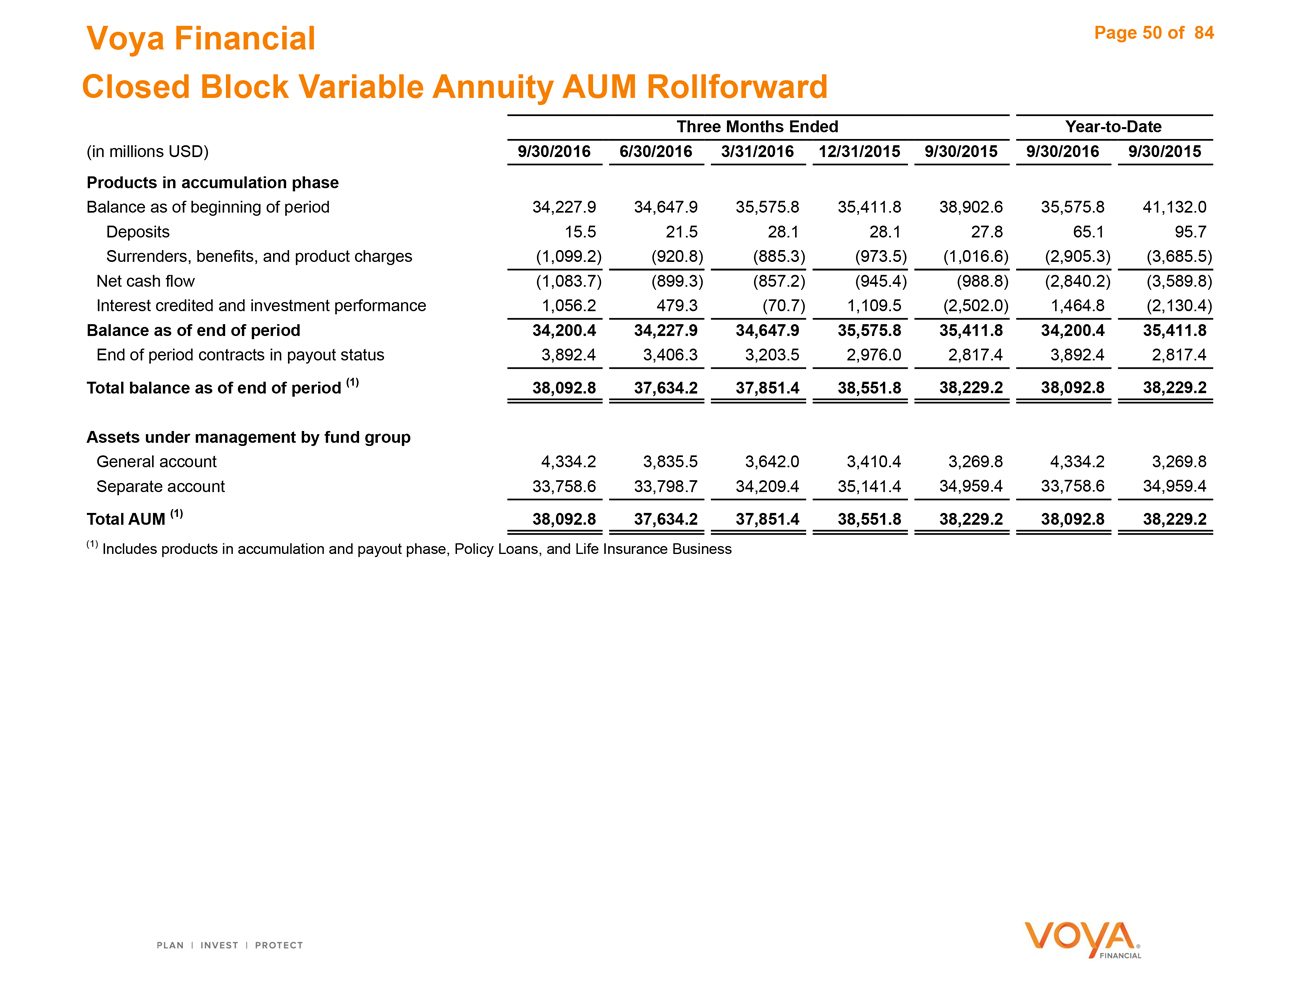
Voya Financial
Closed Block Variable Annuity AUM Rollforward
Three Months Ended
Three Months Ended Year-to-Date (in millions USD) 9/30/2016 6/30/2016 3/31/2016 12/31/2015 9/30/2015 9/30/2016 9/30/2015 Products in accumulation phase
Balance as of beginning of period 34,227.9 34,647.9 35,575.8 35,411.8 38,902.6 35,575.8 41,132.0 Deposits 15.5 21.5 28.1 28.1 27.8 65.1 95.7 Surrenders, benefits, and product charges (1,099.2) (920.8) (885.3) (973.5) (1,016.6) (2,905.3) (3,685.5) Net cash flow (1,083.7) (899.3) (857.2) (945.4) (988.8) (2,840.2) (3,589.8) Interest credited and investment performance 1,056.2 479.3 (70.7) 1,109.5 (2,502.0) 1,464.8 (2,130.4)
Balance as of end of period 34,200.4 34,227.9 34,647.9 35,575.8 35,411.8 34,200.4 35,411.8
End of period contracts in payout status 3,892.4 3,406.3 3,203.5 2,976.0 2,817.4 3,892.4 2,817.4
Total balance as of end of period (1) 38,092.8 37,634.2 37,851.4 38,551.8 38,229.2 38,092.8 38,229.2
Assets under management by fund group
General account 4,334.2 3,835.5 3,642.0 3,410.4 3,269.8 4,334.2 3,269.8 Separate account 33,758.6 33,798.7 34,209.4 35,141.4 34,959.4 33,758.6 34,959.4
Total AUM (1) 38,092.8 37,634.2 37,851.4 38,551.8 38,229.2 38,092.8 38,229.2
(1) Includes products in accumulation and payout phase, Policy Loans, and Life Insurance Business
Page 50 of 84

Investment Information
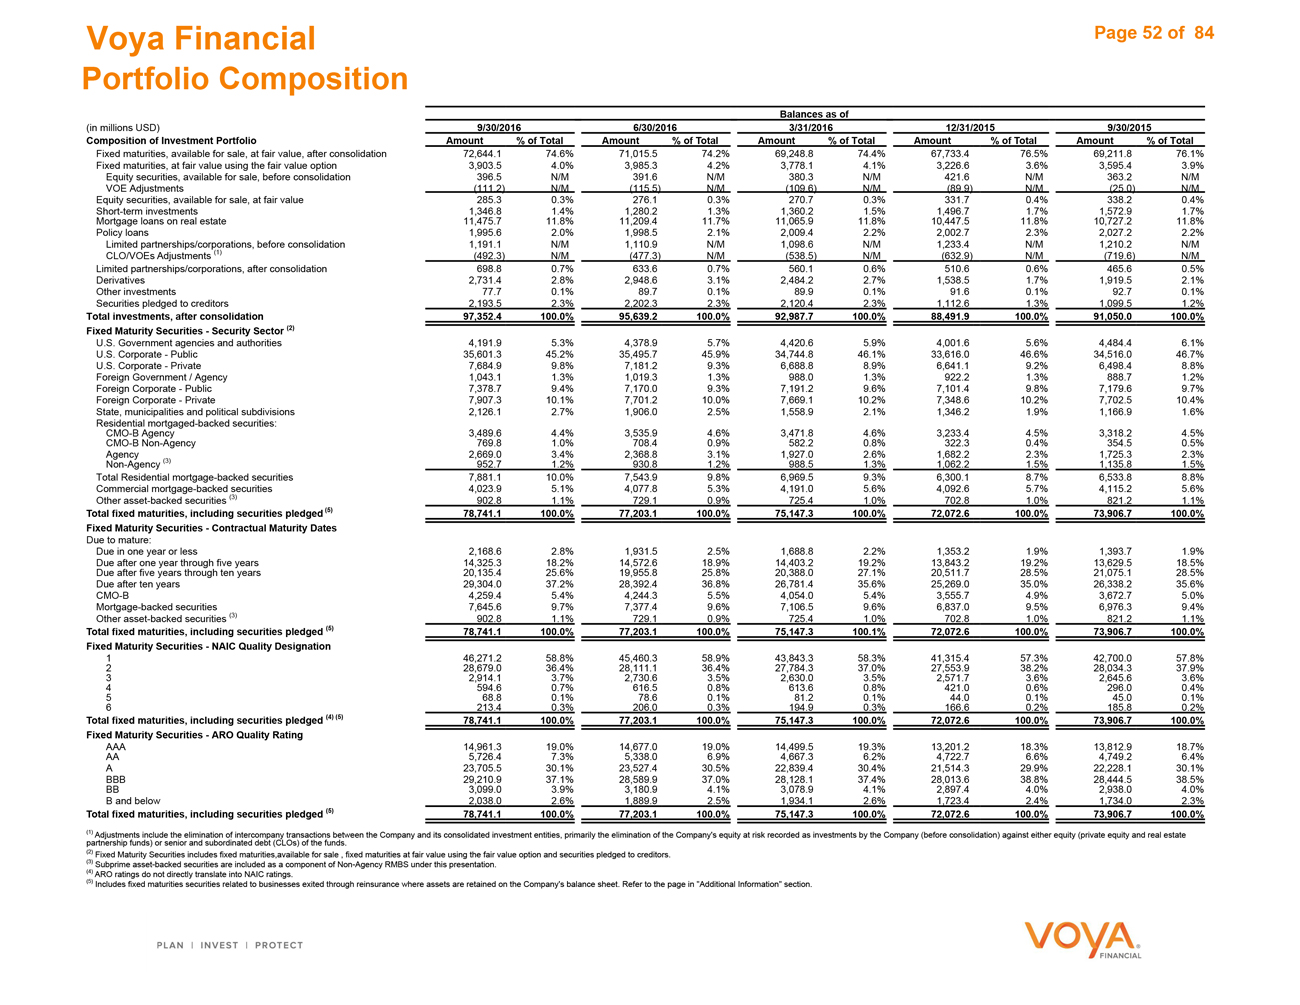
Voya Financial
Portfolio Composition
Balances as of
(in millions USD) 9/30/2016 6/30/2016 3/31/2016 12/31/2015 9/30/2015
Composition of Investment Portfolio Amount % of Total Amount % of Total Amount % of Total Amount % of Total Amount % of Total
Fixed maturities, available for sale, at fair value, after consolidation 72,644.1 74.6% 71,015.5 74.2% 69,248.8 74.4% 67,733.4 76.5% 69,211.8 76.1% Fixed maturities, at fair value using the fair value option 3,903.5 4.0% 3,985.3 4.2% 3,778.1 4.1% 3,226.6 3.6% 3,595.4 3.9% Equity securities, available for sale, before consolidation 396.5 N/M 391.6 N/M 380.3 N/M 421.6 N/M 363.2 N/M
VOE Adjustments (111.2) N/M (115.5) N/M (109.6) N/M (89.9) N/M (25.0) N/M Equity securities, available for sale, at fair value 285.3 0.3% 276.1 0.3% 270.7 0.3% 331.7 0.4% 338.2 0.4% Short-term investments 1,346.8 1.4% 1,280.2 1.3% 1,360.2 1.5% 1,496.7 1.7% 1,572.9 1.7% Mortgage loans on real estate 11,475.7 11.8% 11,209.4 11.7% 11,065.9 11.8% 10,447.5 11.8% 10,727.2 11.8% Policy loans 1,995.6 2.0% 1,998.5 2.1% 2,009.4 2.2% 2,002.7 2.3% 2,027.2 2.2% Limited partnerships/corporations, before consolidation 1,191.1 N/M 1,110.9 N/M 1,098.6 N/M 1,233.4 N/M 1,210.2 N/M
CLO/VOEs Adjustments (1) (492.3) N/M (477.3) N/M (538.5) N/M (632.9) N/M (719.6) N/M Limited partnerships/corporations, after consolidation 698.8 0.7% 633.6 0.7% 560.1 0.6% 510.6 0.6% 465.6 0.5% Derivatives 2,731.4 2.8% 2,948.6 3.1% 2,484.2 2.7% 1,538.5 1.7% 1,919.5 2.1% Other investments 77.7 0.1% 89.7 0.1% 89.9 0.1% 91.6 0.1% 92.7 0.1% Securities pledged to creditors 2,193.5 2.3% 2,202.3 2.3% 2,120.4 2.3% 1,112.6 1.3% 1,099.5 1.2%
Total investments, after consolidation 97,352.4 100.0% 95,639.2 100.0% 92,987.7 100.0% 88,491.9 100.0% 91,050.0 100.0% Fixed Maturity Securities—Security Sector (2)
U.S. Government agencies and authorities 4,191.9 5.3% 4,378.9 5.7% 4,420.6 5.9% 4,001.6 5.6% 4,484.4 6.1% U.S. Corporate—Public 35,601.3 45.2% 35,495.7 45.9% 34,744.8 46.1% 33,616.0 46.6% 34,516.0 46.7% U.S. Corporate—Private 7,684.9 9.8% 7,181.2 9.3% 6,688.8 8.9% 6,641.1 9.2% 6,498.4 8.8% Foreign Government / Agency 1,043.1 1.3% 1,019.3 1.3% 988.0 1.3% 922.2 1.3% 888.7 1.2% Foreign Corporate—Public 7,378.7 9.4% 7,170.0 9.3% 7,191.2 9.6% 7,101.4 9.8% 7,179.6 9.7% Foreign Corporate—Private 7,907.3 10.1% 7,701.2 10.0% 7,669.1 10.2% 7,348.6 10.2% 7,702.5 10.4% State, municipalities and political subdivisions 2,126.1 2.7% 1,906.0 2.5% 1,558.9 2.1% 1,346.2 1.9% 1,166.9 1.6% Residential mortgaged-backed securities: CMO-B Agency 3,489.6 4.4% 3,535.9 4.6% 3,471.8 4.6% 3,233.4 4.5% 3,318.2 4.5% CMO-B Non-Agency 769.8 1.0% 708.4 0.9% 582.2 0.8% 322.3 0.4% 354.5 0.5% Agency (3) 2,669.0 3.4% 2,368.8 3.1% 1,927.0 2.6% 1,682.2 2.3% 1,725.3 2.3% Non-Agency 952.7 1.2% 930.8 1.2% 988.5 1.3% 1,062.2 1.5% 1,135.8 1.5% Total Residential mortgage-backed securities 7,881.1 10.0% 7,543.9 9.8% 6,969.5 9.3% 6,300.1 8.7% 6,533.8 8.8% Commercial mortgage-backed securities 4,023.9 5.1% 4,077.8 5.3% 4,191.0 5.6% 4,092.6 5.7% 4,115.2 5.6% Other asset-backed securities (3) 902.8 1.1% 729.1 0.9% 725.4 1.0% 702.8 1.0% 821.2 1.1%
Total fixed maturities, including securities pledged (5) 78,741.1 100.0% 77,203.1 100.0% 75,147.3 100.0% 72,072.6 100.0% 73,906.7 100.0% Fixed Maturity Securities—Contractual Maturity Dates
Due to mature:
Due in one year or less 2,168.6 2.8% 1,931.5 2.5% 1,688.8 2.2% 1,353.2 1.9% 1,393.7 1.9% Due after one year through five years 14,325.3 18.2% 14,572.6 18.9% 14,403.2 19.2% 13,843.2 19.2% 13,629.5 18.5% Due after five years through ten years 20,135.4 25.6% 19,955.8 25.8% 20,388.0 27.1% 20,511.7 28.5% 21,075.1 28.5% Due after ten years 29,304.0 37.2% 28,392.4 36.8% 26,781.4 35.6% 25,269.0 35.0% 26,338.2 35.6% CMO-B 4,259.4 5.4% 4,244.3 5.5% 4,054.0 5.4% 3,555.7 4.9% 3,672.7 5.0% Mortgage-backed securities 7,645.6 9.7% 7,377.4 9.6% 7,106.5 9.6% 6,837.0 9.5% 6,976.3 9.4% Other asset-backed securities (3) 902.8 1.1% 729.1 0.9% 725.4 1.0% 702.8 1.0% 821.2 1.1%
Total fixed maturities, including securities pledged (5) 78,741.1 100.0% 77,203.1 100.0% 75,147.3 100.1% 72,072.6 100.0% 73,906.7 100.0% Fixed Maturity Securities—NAIC Quality Designation
1 46,271.2 58.8% 45,460.3 58.9% 43,843.3 58.3% 41,315.4 57.3% 42,700.0 57.8%
2 28,679.0 36.4% 28,111.1 36.4% 27,784.3 37.0% 27,553.9 38.2% 28,034.3 37.9%
3 2,914.1 3.7% 2,730.6 3.5% 2,630.0 3.5% 2,571.7 3.6% 2,645.6 3.6%
4 594.6 0.7% 616.5 0.8% 613.6 0.8% 421.0 0.6% 296.0 0.4%
5 68.8 0.1% 78.6 0.1% 81.2 0.1% 44.0 0.1% 45.0 0.1%
6 213.4 0.3% 206.0 0.3% 194.9 0.3% 166.6 0.2% 185.8 0.2%
Total fixed maturities, including securities pledged (4) (5) 78,741.1 100.0% 77,203.1 100.0% 75,147.3 100.0% 72,072.6 100.0% 73,906.7 100.0% Fixed Maturity Securities—ARO Quality Rating
AAA 14,961.3 19.0% 14,677.0 19.0% 14,499.5 19.3% 13,201.2 18.3% 13,812.9 18.7% AA 5,726.4 7.3% 5,338.0 6.9% 4,667.3 6.2% 4,722.7 6.6% 4,749.2 6.4% A 23,705.5 30.1% 23,527.4 30.5% 22,839.4 30.4% 21,514.3 29.9% 22,228.1 30.1% BBB 29,210.9 37.1% 28,589.9 37.0% 28,128.1 37.4% 28,013.6 38.8% 28,444.5 38.5% BB 3,099.0 3.9% 3,180.9 4.1% 3,078.9 4.1% 2,897.4 4.0% 2,938.0 4.0% B and below 2,038.0 2.6% 1,889.9 2.5% 1,934.1 2.6% 1,723.4 2.4% 1,734.0 2.3%
Total fixed maturities, including securities pledged (5) 78,741.1 100.0% 77,203.1 100.0% 75,147.3 100.0% 72,072.6 100.0% 73,906.7 100.0%
(1) Adjustments include the elimination of intercompany transactions between the Company and its consolidated investment entities, primarily the elimination of the Company’s equity at risk recorded as investments by the Company (before consolidation) against either equity (private equity and real estate partnership funds) or senior and subordinated debt (CLOs) of the funds.
(2) Fixed Maturity Securities includes fixed maturities,available for sale , fixed maturities at fair value using the fair value option and securities pledged to creditors. (3) Subprime asset-backed securities are included as a component of Non-Agency RMBS under this presentation.
(4) ARO ratings do not directly translate into NAIC ratings.
(5) Includes fixed maturities securities related to businesses exited through reinsurance where assets are retained on the Company’s balance sheet. Refer to the page in “Additional Information” section.
Page 52 of 84
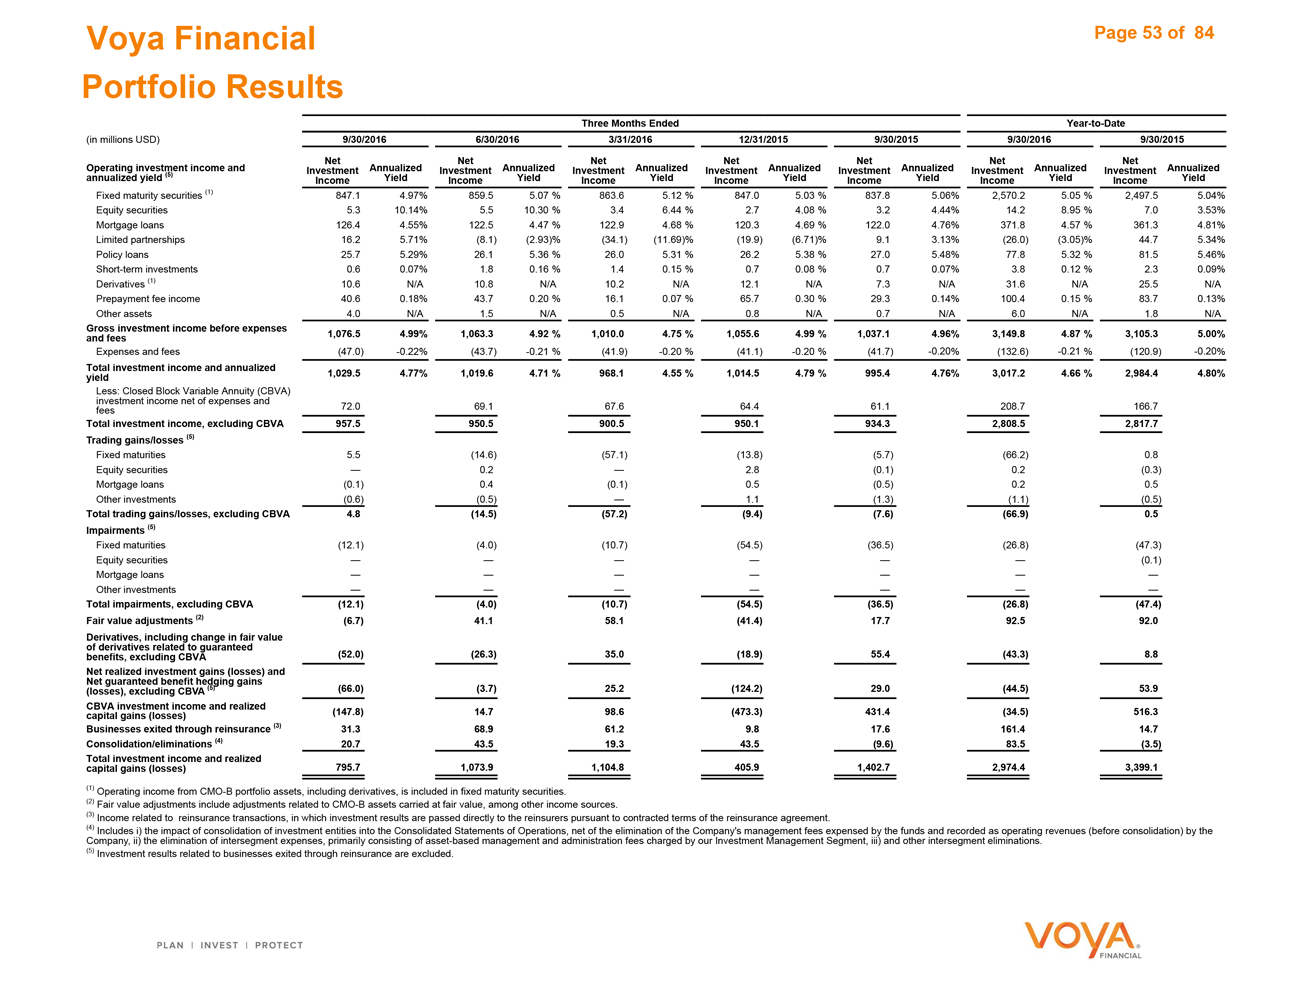
Voya Financial Portfolio Results
Three Months Ended Year-to-Date
(in millions USD) 9/30/2016 6/30/2016 3/31/2016 12/31/2015 9/30/2015 9/30/2016 9/30/2015
Net Net Net Net Net Net Net
Operating investment (5) income and Investment Annualized Investment Annualized Investment Annualized Investment Annualized Investment Annualized Investment Annualized Investment Annualized annualized yield Income Yield Income Yield Income Yield Income Yield Income Yield Income Yield Income Yield
Fixed maturity securities (1) 847.1 4.97% 859.5 5.07 % 863.6 5.12 % 847.0 5.03 % 837.8 5.06% 2,570.2 5.05 % 2,497.5 5.04% Equity securities 5.3 10.14% 5.5 10.30 % 3.4 6.44 % 2.7 4.08 % 3.2 4.44% 14.2 8.95 % 7.0 3.53% Mortgage loans 126.4 4.55% 122.5 4.47 % 122.9 4.68 % 120.3 4.69 % 122.0 4.76% 371.8 4.57 % 361.3 4.81% Limited partnerships 16.2 5.71% (8.1) (2.93)% (34.1) (11.69)% (19.9) (6.71)% 9.1 3.13% (26.0) (3.05)% 44.7 5.34% Policy loans 25.7 5.29% 26.1 5.36 % 26.0 5.31 % 26.2 5.38 % 27.0 5.48% 77.8 5.32 % 81.5 5.46% Short-term investments 0.6 0.07% 1.8 0.16 % 1.4 0.15 % 0.7 0.08 % 0.7 0.07% 3.8 0.12 % 2.3 0.09% Derivatives (1) 10.6 N/A 10.8 N/A 10.2 N/A 12.1 N/A 7.3 N/A 31.6 N/A 25.5 N/A Prepayment fee income 40.6 0.18% 43.7 0.20 % 16.1 0.07 % 65.7 0.30 % 29.3 0.14% 100.4 0.15 % 83.7 0.13% Other assets 4.0 N/A 1.5 N/A 0.5 N/A 0.8 N/A 0.7 N/A 6.0 N/A 1.8 N/A
Gross investment income before expenses and fees 1,076.5 4.99% 1,063.3 4.92 % 1,010.0 4.75 % 1,055.6 4.99 % 1,037.1 4.96% 3,149.8 4.87 % 3,105.3 5.00%
Expenses and fees (47.0) -0.22% (43.7) -0.21 % (41.9) -0.20 % (41.1) -0.20 % (41.7) -0.20% (132.6) -0.21 % (120.9) -0.20%
Total investment income and annualized yield 1,029.5 4.77% 1,019.6 4.71 % 968.1 4.55 % 1,014.5 4.79 % 995.4 4.76% 3,017.2 4.66 % 2,984.4 4.80%
Less: Closed Block Variable Annuity (CBVA) investment income net of expenses and fees 72.0 69.1 67.6 64.4 61.1 208.7 166.7
Total investment income, excluding CBVA 957.5 950.5 900.5 950.1 934.3 2,808.5 2,817.7 Trading gains/losses (5)
Fixed maturities 5.5 (14.6) (57.1) (13.8) (5.7) (66.2) 0.8 Equity securities — 0.2 — 2.8 (0.1) 0.2 (0.3) Mortgage loans (0.1) 0.4 (0.1) 0.5 (0.5) 0.2 0.5 Other investments (0.6) (0.5) — 1.1 (1.3) (1.1) (0.5)
Total trading gains/losses, excluding CBVA 4.8 (14.5) (57.2) (9.4) (7.6) (66.9) 0.5 Impairments (5)
Fixed maturities (12.1) (4.0) (10.7) (54.5) (36.5) (26.8) (47.3) Equity securities — — — — — — (0.1) Mortgage loans — — — — — — —Other investments — — — — — — —
Total impairments, excluding CBVA (12.1) (4.0) (10.7) (54.5) (36.5) (26.8) (47.4) Fair value adjustments (2) (6.7) 41.1 58.1 (41.4) 17.7 92.5 92.0 Derivatives, including change in fair value of derivatives related to guaranteed benefits, excluding CBVA (52.0) (26.3) 35.0 (18.9) 55.4 (43.3) 8.8 Net realized investment gains (losses) and Net guaranteed benefit hedging (5) gains (losses), excluding CBVA (66.0) (3.7) 25.2 (124.2) 29.0 (44.5) 53.9 CBVA investment income and realized capital gains (losses) (147.8) 14.7 98.6 (473.3) 431.4 (34.5) 516.3 Businesses exited through reinsurance (3) 31.3 68.9 61.2 9.8 17.6 161.4 14.7 Consolidation/eliminations (4) 20.7 43.5 19.3 43.5 (9.6) 83.5 (3.5) Total investment income and realized 795.7 1,073.9 1,104.8 405.9 1,402.7 2,974.4 3,399.1 capital gains (losses)
| (1) |
|
Operating income from CMO-B portfolio assets, including derivatives, is included in fixed maturity securities. |
(2) Fair value adjustments include adjustments related to CMO-B assets carried at fair value, among other income sources.
(3) Income related to reinsurance transactions, in which investment results are passed directly to the reinsurers pursuant to contracted terms of the reinsurance agreement.
(4) Includes i) the impact of consolidation of investment entities into the Consolidated Statements of Operations, net of the elimination of the Company’s management fees expensed by the funds and recorded as operating revenues (before consolidation) by the Company, ii) the elimination of intersegment expenses, primarily consisting of asset-based management and administration fees charged by our Investment Management Segment, iii) and other intersegment eliminations.
| (5) |
|
Investment results related to businesses exited through reinsurance are excluded. |
Page 53 of 84
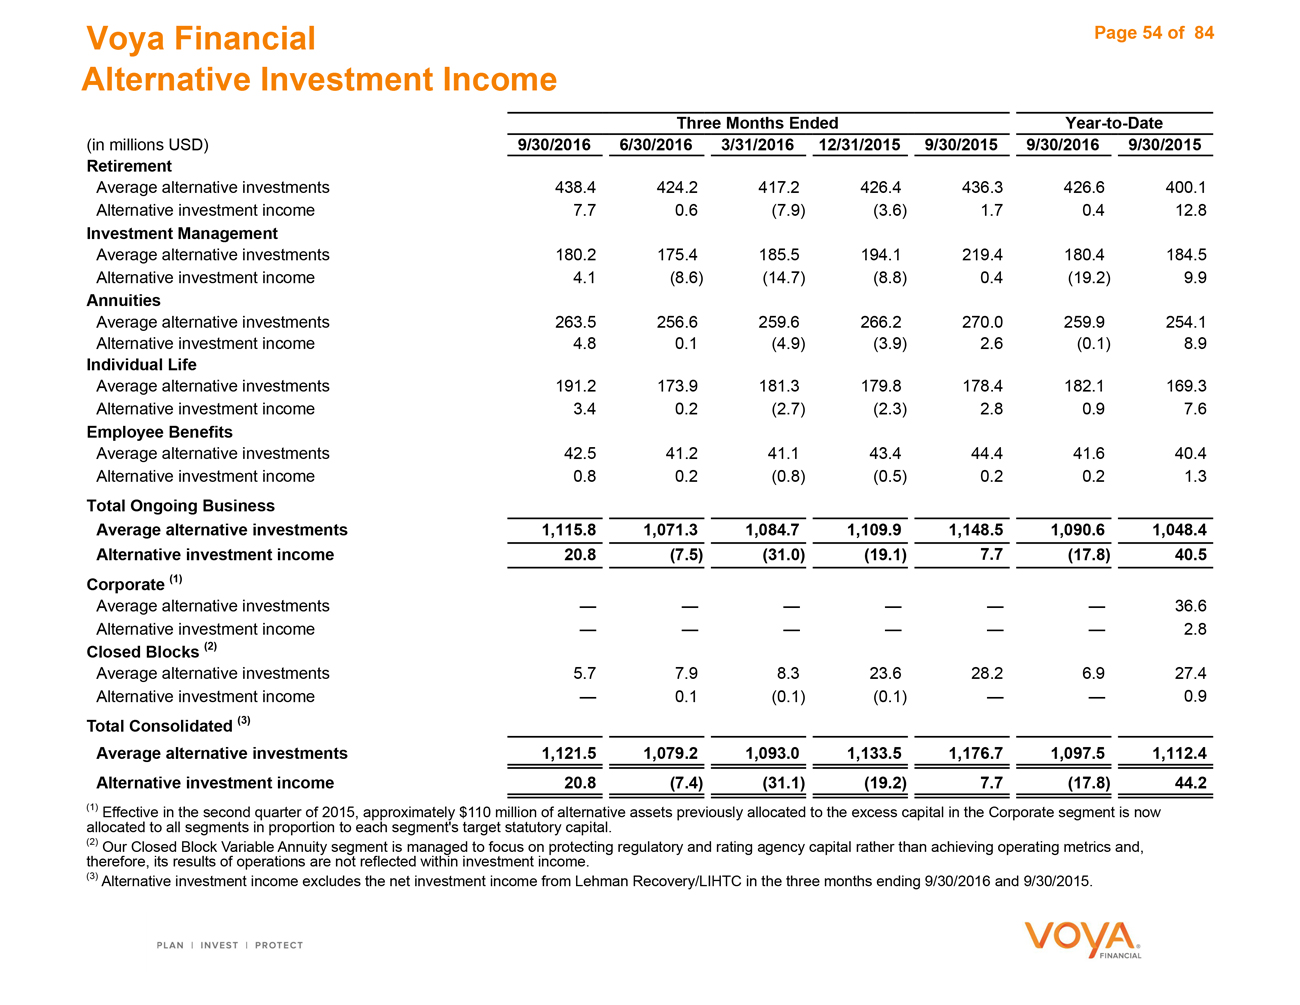
Voya Financial
Alternative Investment Income
Three Months Ended Year-to-Date (in millions USD) 9/30/2016 6/30/2016 3/31/2016 12/31/2015 9/30/2015 9/30/2016 9/30/2015 Retirement
Average alternative investments 438.4 424.2 417.2 426.4 436.3 426.6 400.1 Alternative investment income 7.7 0.6 (7.9) (3.6) 1.7 0.4 12.8
Investment Management
Average alternative investments 180.2 175.4 185.5 194.1 219.4 180.4 184.5 Alternative investment income 4.1 (8.6) (14.7) (8.8) 0.4 (19.2) 9.9
Annuities
Average alternative investments 263.5 256.6 259.6 266.2 270.0 259.9 254.1 Alternative investment income 4.8 0.1 (4.9) (3.9) 2.6 (0.1) 8.9
Individual Life
Average alternative investments 191.2 173.9 181.3 179.8 178.4 182.1 169.3 Alternative investment income 3.4 0.2 (2.7) (2.3) 2.8 0.9 7.6
Employee Benefits
Average alternative investments 42.5 41.2 41.1 43.4 44.4 41.6 40.4 Alternative investment income 0.8 0.2 (0.8) (0.5) 0.2 0.2 1.3
Total Ongoing Business
Average alternative investments 1,115.8 1,071.3 1,084.7 1,109.9 1,148.5 1,090.6 1,048.4 Alternative investment income 20.8 (7.5) (31.0) (19.1) 7.7 (17.8) 40.5 Corporate (1)
Average alternative investments — — — — — — 36.6 Alternative investment income — — — — — — 2.8
Closed Blocks (2)
Average alternative investments 5.7 7.9 8.3 23.6 28.2 6.9 27.4 Alternative investment income — 0.1 (0.1) (0.1) — — 0.9
Total Consolidated (3)
Average alternative investments 1,121.5 1,079.2 1,093.0 1,133.5 1,176.7 1,097.5 1,112.4 Alternative investment income 20.8 (7.4) (31.1) (19.2) 7.7 (17.8) 44.2
(1) Effective in the second quarter of 2015, approximately $110 million of alternative assets previously allocated to the excess capital in the Corporate segment is now allocated to all segments in proportion to each segment’s target statutory capital.
(2) Our Closed Block Variable Annuity segment is managed to focus on protecting regulatory and rating agency capital rather than achieving operating metrics and, therefore, its results of operations are not reflected within investment income.
(3) Alternative investment income excludes the net investment income from Lehman Recovery/LIHTC in the three months ending 9/30/2016 and 9/30/2015.
Page 54 of 84
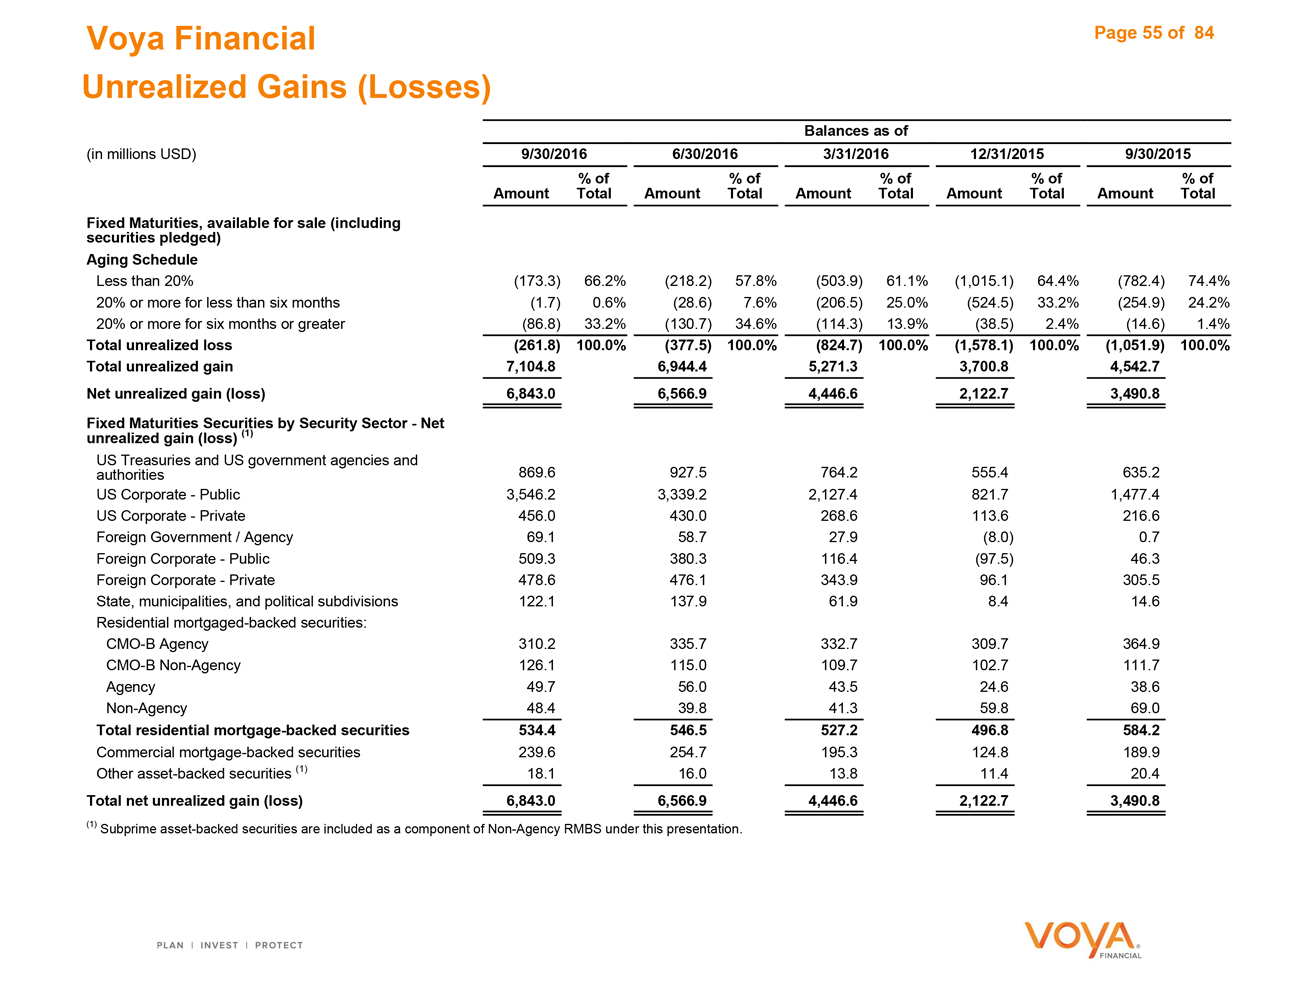
Voya Financial
Unrealized Gains (Losses)
Balances as of
(in millions USD) 9/30/2016 6/30/2016 3/31/2016 12/31/2015 9/30/2015 % of % of % of % of % of Amount Total Amount Total Amount Total Amount Total Amount Total Fixed Maturities, available for sale (including securities pledged) Aging Schedule
Less than 20% (173.3) 66.2% (218.2) 57.8% (503.9) 61.1% (1,015.1) 64.4% (782.4) 74.4% 20% or more for less than six months (1.7) 0.6% (28.6) 7.6% (206.5) 25.0% (524.5) 33.2% (254.9) 24.2% 20% or more for six months or greater (86.8) 33.2% (130.7) 34.6% (114.3) 13.9% (38.5) 2.4% (14.6) 1.4%
Total unrealized loss (261.8) 100.0% (377.5) 100.0% (824.7) 100.0% (1,578.1) 100.0% (1,051.9) 100.0% Total unrealized gain 7,104.8 6,944.4 5,271.3 3,700.8 4,542.7 Net unrealized gain (loss) 6,843.0 6,566.9 4,446.6 2,122.7 3,490.8 Fixed Maturities Securities by Security Sector—Net unrealized gain (loss) (1)
US Treasuries and US government agencies and authorities 869.6 927.5 764.2 555.4 635.2 US Corporate—Public 3,546.2 3,339.2 2,127.4 821.7 1,477.4 US Corporate—Private 456.0 430.0 268.6 113.6 216.6 Foreign Government / Agency 69.1 58.7 27.9 (8.0) 0.7 Foreign Corporate—Public 509.3 380.3 116.4 (97.5) 46.3 Foreign Corporate—Private 478.6 476.1 343.9 96.1 305.5 State, municipalities, and political subdivisions 122.1 137.9 61.9 8.4 14.6 Residential mortgaged-backed securities: CMO-B Agency 310.2 335.7 332.7 309.7 364.9 CMO-B Non-Agency 126.1 115.0 109.7 102.7 111.7 Agency 49.7 56.0 43.5 24.6 38.6 Non-Agency 48.4 39.8 41.3 59.8 69.0
Total residential mortgage-backed securities 534.4 546.5 527.2 496.8 584.2
Commercial mortgage-backed securities 239.6 254.7 195.3 124.8 189.9 Other asset-backed securities (1) 18.1 16.0 13.8 11.4 20.4
Total net unrealized gain (loss) 6,843.0 6,566.9 4,446.6 2,122.7 3,490.8
| (1) |
|
Subprime asset-backed securities are included as a component of Non-Agency RMBS under this presentation. |
Page 55 of 84
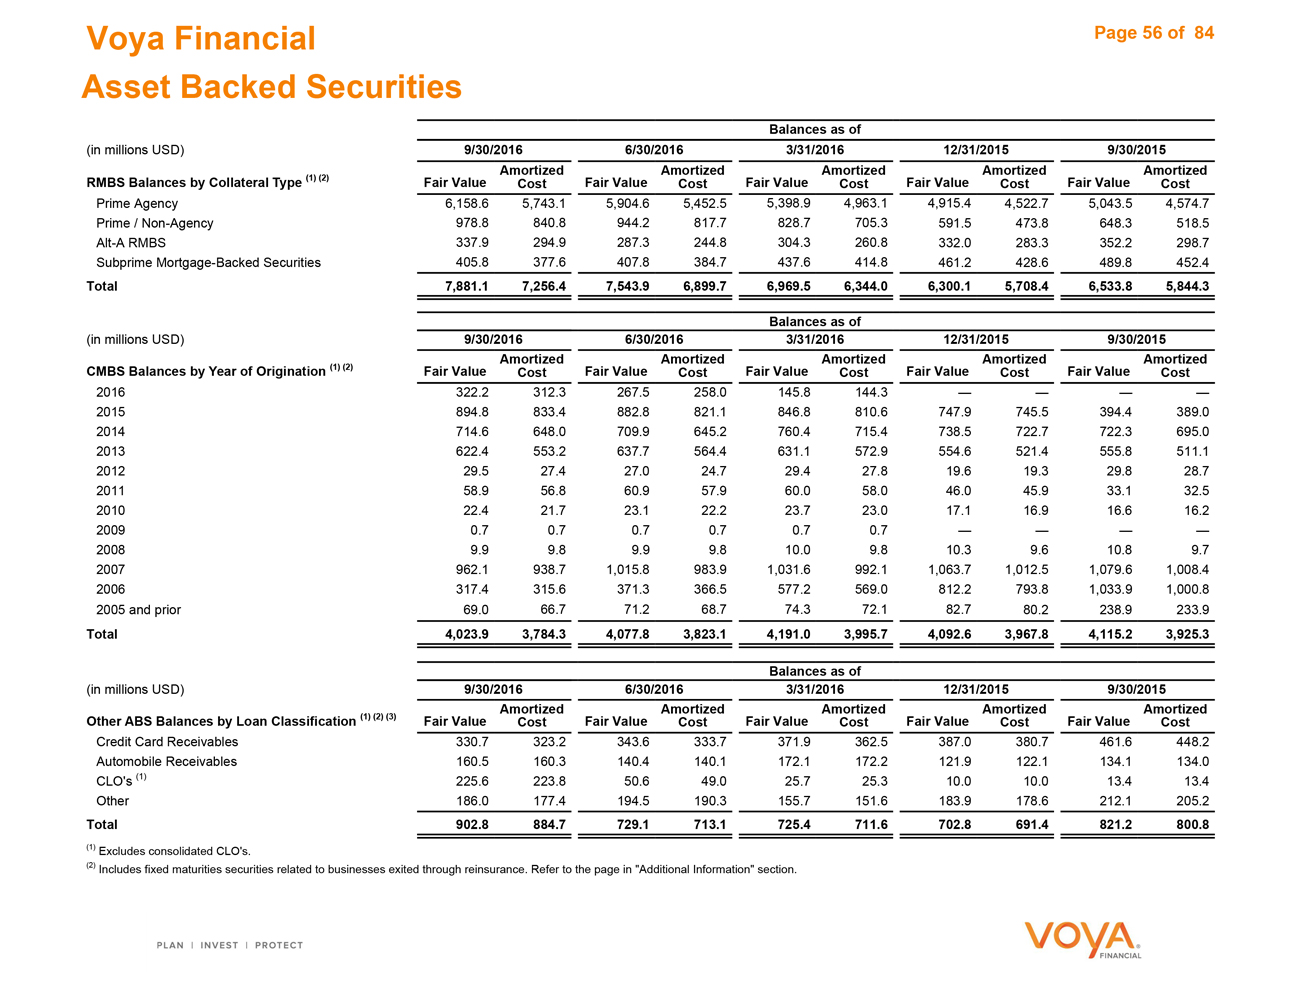
Voya Financial
Asset Backed Securities
Balances as of
(in millions USD) 9/30/2016 6/30/2016 3/31/2016 12/31/2015 9/30/2015 Amortized Amortized Amortized Amortized Amortized RMBS Balances by Collateral Type (1) (2) Fair Value Cost Fair Value Cost Fair Value Cost Fair Value Cost Fair Value Cost
Prime Agency 6,158.6 5,743.1 5,904.6 5,452.5 5,398.9 4,963.1 4,915.4 4,522.7 5,043.5 4,574.7 Prime / Non-Agency 978.8 840.8 944.2 817.7 828.7 705.3 591.5 473.8 648.3 518.5 Alt-A RMBS 337.9 294.9 287.3 244.8 304.3 260.8 332.0 283.3 352.2 298.7 Subprime Mortgage-Backed Securities 405.8 377.6 407.8 384.7 437.6 414.8 461.2 428.6 489.8 452.4
Total 7,881.1 7,256.4 7,543.9 6,899.7 6,969.5 6,344.0 6,300.1 5,708.4 6,533.8 5,844.3
Balances as of
(in millions USD) 9/30/2016 6/30/2016 3/31/2016 12/31/2015 9/30/2015 Amortized Amortized Amortized Amortized Amortized CMBS Balances by Year of Origination (1) (2) Fair Value Cost Fair Value Cost Fair Value Cost Fair Value Cost Fair Value Cost
2016 322.2 312.3 267.5 258.0 145.8 144.3 — — — —2015 894.8 833.4 882.8 821.1 846.8 810.6 747.9 745.5 394.4 389.0 2014 714.6 648.0 709.9 645.2 760.4 715.4 738.5 722.7 722.3 695.0 2013 622.4 553.2 637.7 564.4 631.1 572.9 554.6 521.4 555.8 511.1 2012 29.5 27.4 27.0 24.7 29.4 27.8 19.6 19.3 29.8 28.7 2011 58.9 56.8 60.9 57.9 60.0 58.0 46.0 45.9 33.1 32.5 2010 22.4 21.7 23.1 22.2 23.7 23.0 17.1 16.9 16.6 16.2 2009 0.7 0.7 0.7 0.7 0.7 0.7 — — — —2008 9.9 9.8 9.9 9.8 10.0 9.8 10.3 9.6 10.8 9.7 2007 962.1 938.7 1,015.8 983.9 1,031.6 992.1 1,063.7 1,012.5 1,079.6 1,008.4 2006 317.4 315.6 371.3 366.5 577.2 569.0 812.2 793.8 1,033.9 1,000.8 2005 and prior 69.0 66.7 71.2 68.7 74.3 72.1 82.7 80.2 238.9 233.9
Total 4,023.9 3,784.3 4,077.8 3,823.1 4,191.0 3,995.7 4,092.6 3,967.8 4,115.2 3,925.3
Balances as of
(in millions USD) 9/30/2016 6/30/2016 3/31/2016 12/31/2015 9/30/2015 Amortized Amortized Amortized Amortized Amortized Other ABS Balances by Loan Classification (1) (2) (3) Fair Value Cost Fair Value Cost Fair Value Cost Fair Value Cost Fair Value Cost
Credit Card Receivables 330.7 323.2 343.6 333.7 371.9 362.5 387.0 380.7 461.6 448.2 Automobile Receivables 160.5 160.3 140.4 140.1 172.1 172.2 121.9 122.1 134.1 134.0 CLO’s (1) 225.6 223.8 50.6 49.0 25.7 25.3 10.0 10.0 13.4 13.4 Other 186.0 177.4 194.5 190.3 155.7 151.6 183.9 178.6 212.1 205.2
Total 902.8 884.7 729.1 713.1 725.4 711.6 702.8 691.4 821.2 800.8
| (1) |
|
Excludes consolidated CLO’s. |
(2) Includes fixed maturities securities related to businesses exited through reinsurance. Refer to the page in “Additional Information” section.
Page 56 of 84
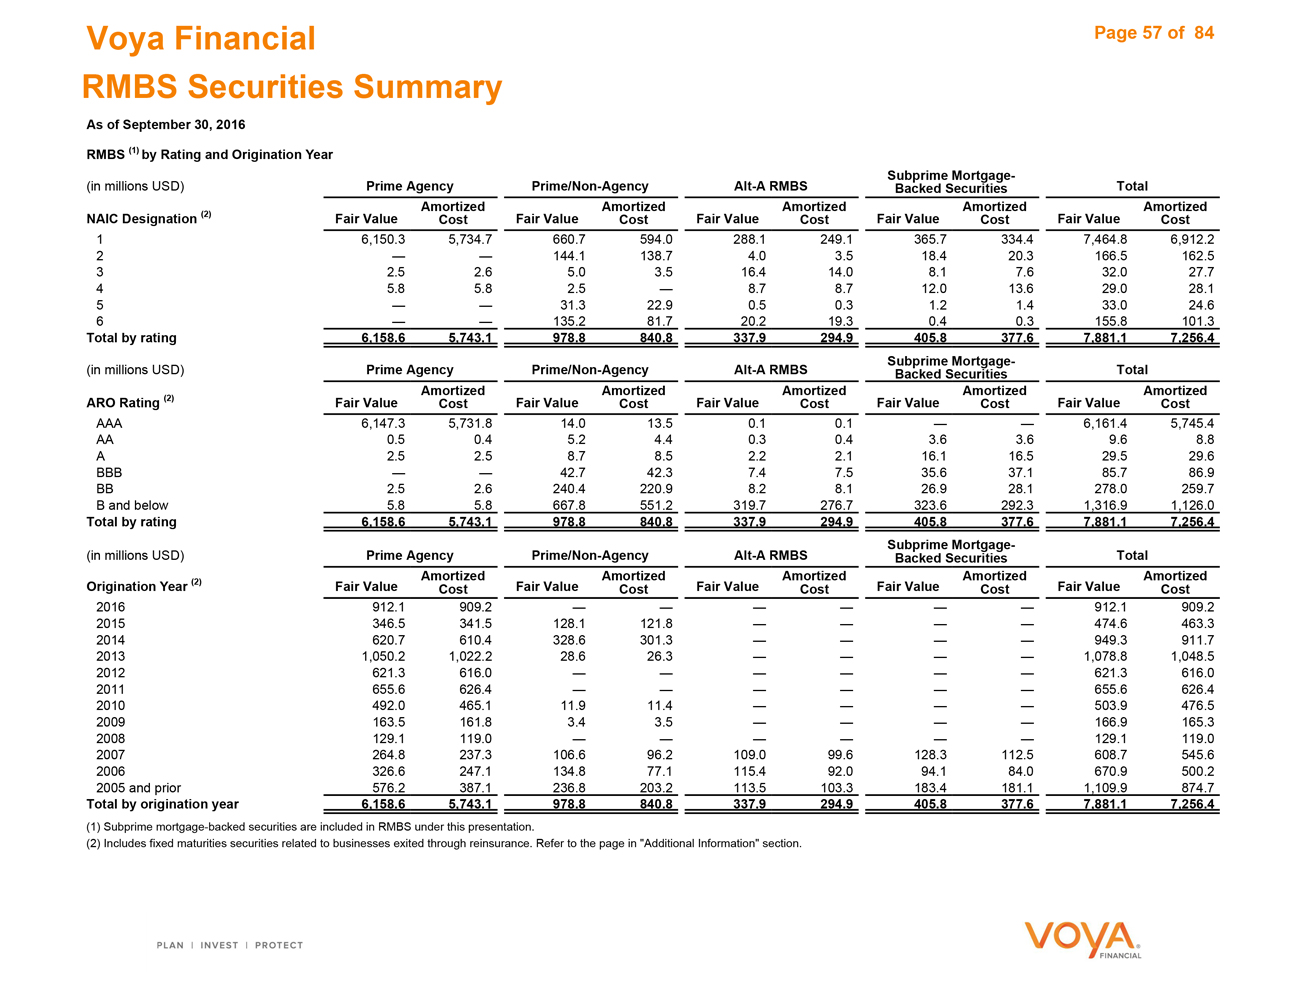
Voya Financial
RMBS Securities Summary
As of September 30, 2016
RMBS (1) by Rating and Origination Year
Subprime Mortgage-
(in millions USD) Prime Agency Prime/Non-Agency Alt-A RMBS Backed Securities Total
Amortized Amortized Amortized Amortized Amortized NAIC Designation (2) Fair Value Cost Fair Value Cost Fair Value Cost Fair Value Cost Fair Value Cost
| 1 |
|
6,150.3 5,734.7 660.7 594.0 288.1 249.1 365.7 334.4 7,464.8 6,912.2 |
| 2 |
|
— — 144.1 138.7 4.0 3.5 18.4 20.3 166.5 162.5 |
| 3 |
|
2.5 2.6 5.0 3.5 16.4 14.0 8.1 7.6 32.0 27.7 |
| 4 |
|
5.8 5.8 2.5 — 8.7 8.7 12.0 13.6 29.0 28.1 |
| 5 |
|
— — 31.3 22.9 0.5 0.3 1.2 1.4 33.0 24.6 |
| 6 |
|
— — 135.2 81.7 20.2 19.3 0.4 0.3 155.8 101.3 |
Total by rating 6,158.6 5,743.1 978.8 840.8 337.9 294.9 405.8 377.6 7,881.1 7,256.4 Subprime Mortgage-(in millions USD) Prime Agency Prime/Non-Agency Alt-A RMBS Backed Securities Total Amortized Amortized Amortized Amortized Amortized ARO Rating (2) Fair Value Cost Fair Value Cost Fair Value Cost Fair Value Cost Fair Value Cost
AAA 6,147.3 5,731.8 14.0 13.5 0.1 0.1 — — 6,161.4 5,745.4 AA 0.5 0.4 5.2 4.4 0.3 0.4 3.6 3.6 9.6 8.8 A 2.5 2.5 8.7 8.5 2.2 2.1 16.1 16.5 29.5 29.6 BBB — — 42.7 42.3 7.4 7.5 35.6 37.1 85.7 86.9 BB 2.5 2.6 240.4 220.9 8.2 8.1 26.9 28.1 278.0 259.7 B and below 5.8 5.8 667.8 551.2 319.7 276.7 323.6 292.3 1,316.9 1,126.0
Total by rating 6,158.6 5,743.1 978.8 840.8 337.9 294.9 405.8 377.6 7,881.1 7,256.4 Subprime Mortgage-(in millions USD) Prime Agency Prime/Non-Agency Alt-A RMBS Backed Securities Total Amortized Amortized Amortized Amortized Amortized Origination Year (2) Fair Value Fair Value Fair Value Fair Value Fair Value Cost Cost Cost Cost Cost
2016 912.1 909.2 — — — — — — 912.1 909.2 2015 346.5 341.5 128.1 121.8 — — — — 474.6 463.3 2014 620.7 610.4 328.6 301.3 — — — — 949.3 911.7 2013 1,050.2 1,022.2 28.6 26.3 — — — — 1,078.8 1,048.5 2012 621.3 616.0 — — — — — — 621.3 616.0 2011 655.6 626.4 — — — — — — 655.6 626.4 2010 492.0 465.1 11.9 11.4 — — — — 503.9 476.5 2009 163.5 161.8 3.4 3.5 — — — — 166.9 165.3 2008 129.1 119.0 — — — — — — 129.1 119.0 2007 264.8 237.3 106.6 96.2 109.0 99.6 128.3 112.5 608.7 545.6 2006 326.6 247.1 134.8 77.1 115.4 92.0 94.1 84.0 670.9 500.2 2005 and prior 576.2 387.1 236.8 203.2 113.5 103.3 183.4 181.1 1,109.9 874.7
Total by origination year 6,158.6 5,743.1 978.8 840.8 337.9 294.9 405.8 377.6 7,881.1 7,256.4
| (1) |
|
Subprime mortgage-backed securities are included in RMBS under this presentation. |
(2) Includes fixed maturities securities related to businesses exited through reinsurance. Refer to the page in “Additional Information” section.
Page 57 of 84
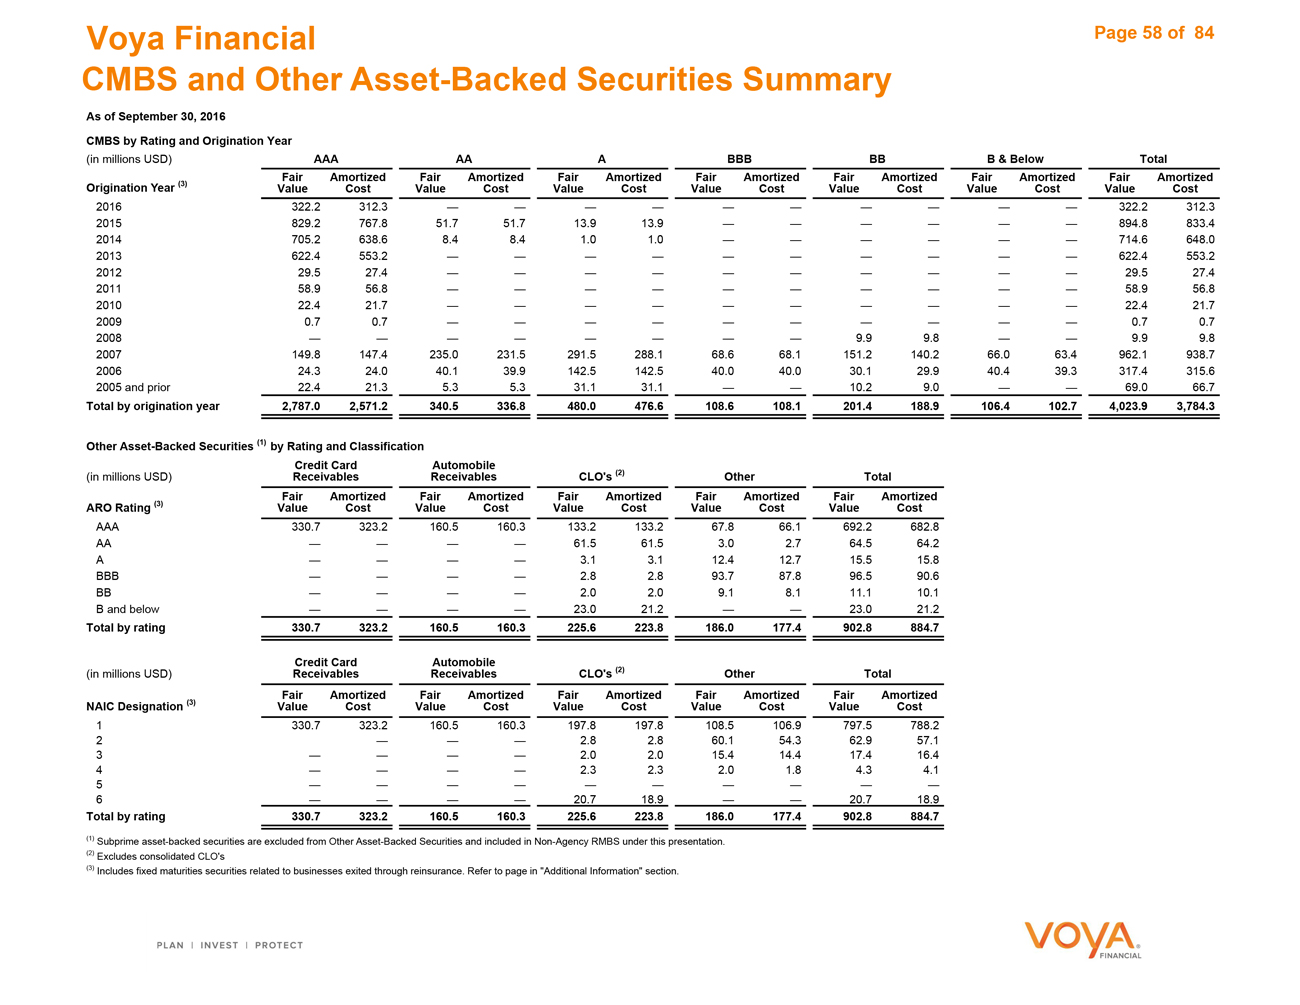
Voya Financial
CMBS and Other Asset-Backed Securities Summary
As of September 30, 2016
CMBS by Rating and Origination Year
(in millions USD) AAA AA A BBB BB B & Below Total Fair Amortized Fair Amortized Fair Amortized Fair Amortized Fair Amortized Fair Amortized Fair Amortized Origination Year (3) Value Cost Value Cost Value Cost Value Cost Value Cost Value Cost Value Cost
2016 322.2 312.3 — — — — — — — — — — 322.2 312.3 2015 829.2 767.8 51.7 51.7 13.9 13.9 — — — — — — 894.8 833.4 2014 705.2 638.6 8.4 8.4 1.0 1.0 — — — — — — 714.6 648.0 2013 622.4 553.2 — — — — — — — — — — 622.4 553.2 2012 29.5 27.4 — — — — — — — — — — 29.5 27.4 2011 58.9 56.8 — — — — — — — — — — 58.9 56.8 2010 22.4 21.7 — — — — — — — — — — 22.4 21.7 2009 0.7 0.7 — — — — — — — — — — 0.7 0.7 2008 — — — — — — — — 9.9 9.8 — — 9.9 9.8 2007 149.8 147.4 235.0 231.5 291.5 288.1 68.6 68.1 151.2 140.2 66.0 63.4 962.1 938.7 2006 24.3 24.0 40.1 39.9 142.5 142.5 40.0 40.0 30.1 29.9 40.4 39.3 317.4 315.6 2005 and prior 22.4 21.3 5.3 5.3 31.1 31.1 — — 10.2 9.0 — — 69.0 66.7
Total by origination year 2,787.0 2,571.2 340.5 336.8 480.0 476.6 108.6 108.1 201.4 188.9 106.4 102.7 4,023.9 3,784.3
Other Asset-Backed Securities (1) by Rating and Classification
Credit Card Automobile (2)
(in millions USD) Receivables Receivables CLO’s Other Total (3) Fair Amortized Fair Amortized Fair Amortized Fair Amortized Fair Amortized ARO Rating Value Cost Value Cost Value Cost Value Cost Value Cost
AAA 330.7 323.2 160.5 160.3 133.2 133.2 67.8 66.1 692.2 682.8 AA — — — — 61.5 61.5 3.0 2.7 64.5 64.2 A — — — — 3.1 3.1 12.4 12.7 15.5 15.8 BBB — — — — 2.8 2.8 93.7 87.8 96.5 90.6 BB — — — — 2.0 2.0 9.1 8.1 11.1 10.1 B and below — — — — 23.0 21.2 — — 23.0 21.2
Total by rating 330.7 323.2 160.5 160.3 225.6 223.8 186.0 177.4 902.8 884.7
Credit Card Automobile (2)
(in millions USD) Receivables Receivables CLO’s Other Total (3) Fair Amortized Fair Amortized Fair Amortized Fair Amortized Fair Amortized NAIC Designation Value Cost Value Cost Value Cost Value Cost Value Cost
| 1 |
|
330.7 323.2 160.5 160.3 197.8 197.8 108.5 106.9 797.5 788.2 |
| 2 |
|
— — — 2.8 2.8 60.1 54.3 62.9 57.1 |
| 3 |
|
— — — — 2.0 2.0 15.4 14.4 17.4 16.4 |
| 4 |
|
— — — — 2.3 2.3 2.0 1.8 4.3 4.1 |
| 5 |
|
— — — — — — — — — — |
| 6 |
|
— — — — 20.7 18.9 — — 20.7 18.9 |
Total by rating 330.7 323.2 160.5 160.3 225.6 223.8 186.0 177.4 902.8 884.7
(1) Subprime asset-backed securities are excluded from Other Asset-Backed Securities and included in Non-Agency RMBS under this presentation. (2) Excludes consolidated CLO’s (3) Includes fixed maturities securities related to businesses exited through reinsurance. Refer to page in “Additional Information” section.
Page 58 of 84
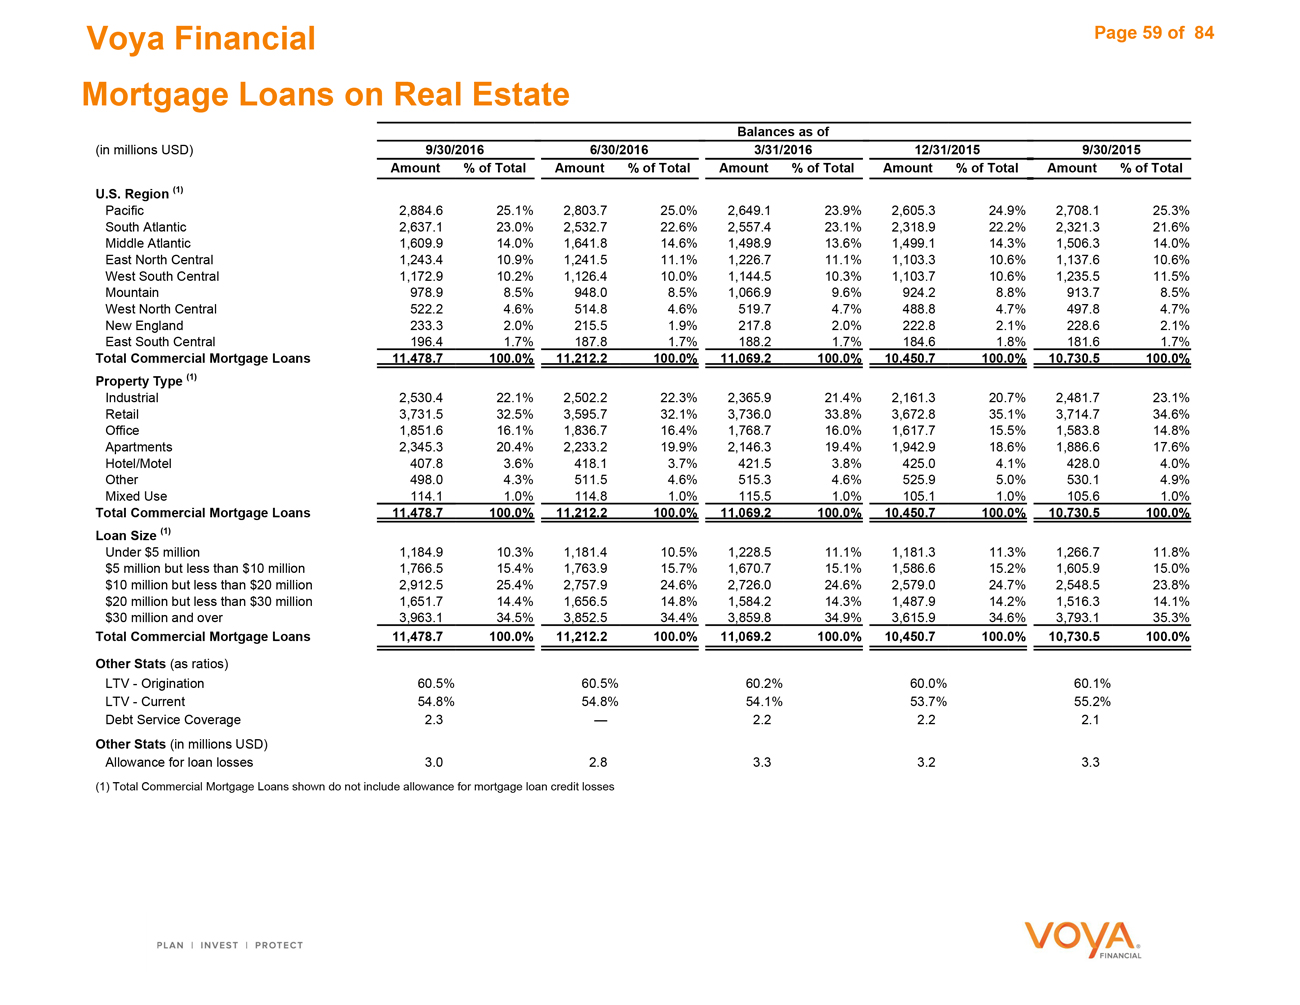
Voya Financial
Mortgage Loans on Real Estate
Balances as of
(in millions USD) 9/30/2016 6/30/2016 3/31/2016 12/31/2015 9/30/2015 Amount % of Total Amount % of Total Amount % of Total Amount % of Total Amount % of Total U.S. Region (1)
Pacific 2,884.6 25.1% 2,803.7 25.0% 2,649.1 23.9% 2,605.3 24.9% 2,708.1 25.3% South Atlantic 2,637.1 23.0% 2,532.7 22.6% 2,557.4 23.1% 2,318.9 22.2% 2,321.3 21.6% Middle Atlantic 1,609.9 14.0% 1,641.8 14.6% 1,498.9 13.6% 1,499.1 14.3% 1,506.3 14.0% East North Central 1,243.4 10.9% 1,241.5 11.1% 1,226.7 11.1% 1,103.3 10.6% 1,137.6 10.6% West South Central 1,172.9 10.2% 1,126.4 10.0% 1,144.5 10.3% 1,103.7 10.6% 1,235.5 11.5% Mountain 978.9 8.5% 948.0 8.5% 1,066.9 9.6% 924.2 8.8% 913.7 8.5% West North Central 522.2 4.6% 514.8 4.6% 519.7 4.7% 488.8 4.7% 497.8 4.7% New England 233.3 2.0% 215.5 1.9% 217.8 2.0% 222.8 2.1% 228.6 2.1% East South Central 196.4 1.7% 187.8 1.7% 188.2 1.7% 184.6 1.8% 181.6 1.7%
Total Commercial Mortgage Loans 11,478.7 100.0% 11,212.2 100.0% 11,069.2 100.0% 10,450.7 100.0% 10,730.5 100.0% Property Type (1)
Industrial 2,530.4 22.1% 2,502.2 22.3% 2,365.9 21.4% 2,161.3 20.7% 2,481.7 23.1% Retail 3,731.5 32.5% 3,595.7 32.1% 3,736.0 33.8% 3,672.8 35.1% 3,714.7 34.6% Office 1,851.6 16.1% 1,836.7 16.4% 1,768.7 16.0% 1,617.7 15.5% 1,583.8 14.8% Apartments 2,345.3 20.4% 2,233.2 19.9% 2,146.3 19.4% 1,942.9 18.6% 1,886.6 17.6% Hotel/Motel 407.8 3.6% 418.1 3.7% 421.5 3.8% 425.0 4.1% 428.0 4.0% Other 498.0 4.3% 511.5 4.6% 515.3 4.6% 525.9 5.0% 530.1 4.9% Mixed Use 114.1 1.0% 114.8 1.0% 115.5 1.0% 105.1 1.0% 105.6 1.0%
Total Commercial Mortgage Loans 11,478.7 100.0% 11,212.2 100.0% 11,069.2 100.0% 10,450.7 100.0% 10,730.5 100.0% Loan Size (1)
Under $5 million 1,184.9 10.3% 1,181.4 10.5% 1,228.5 11.1% 1,181.3 11.3% 1,266.7 11.8% $5 million but less than $10 million 1,766.5 15.4% 1,763.9 15.7% 1,670.7 15.1% 1,586.6 15.2% 1,605.9 15.0% $10 million but less than $20 million 2,912.5 25.4% 2,757.9 24.6% 2,726.0 24.6% 2,579.0 24.7% 2,548.5 23.8% $20 million but less than $30 million 1,651.7 14.4% 1,656.5 14.8% 1,584.2 14.3% 1,487.9 14.2% 1,516.3 14.1% $30 million and over 3,963.1 34.5% 3,852.5 34.4% 3,859.8 34.9% 3,615.9 34.6% 3,793.1 35.3%
Total Commercial Mortgage Loans 11,478.7 100.0% 11,212.2 100.0% 11,069.2 100.0% 10,450.7 100.0% 10,730.5 100.0%
Other Stats (as ratios)
LTV—Origination 60.5% 60.5% 60.2% 60.0% 60.1% LTV—Current 54.8% 54.8% 54.1% 53.7% 55.2% Debt Service Coverage 2.3 — 2.2 2.2 2.1 Other Stats (in millions USD) Allowance for loan losses 3.0 2.8 3.3 3.2 3.3
| (1) |
|
Total Commercial Mortgage Loans shown do not include allowance for mortgage loan credit losses |
Page 59 of 84
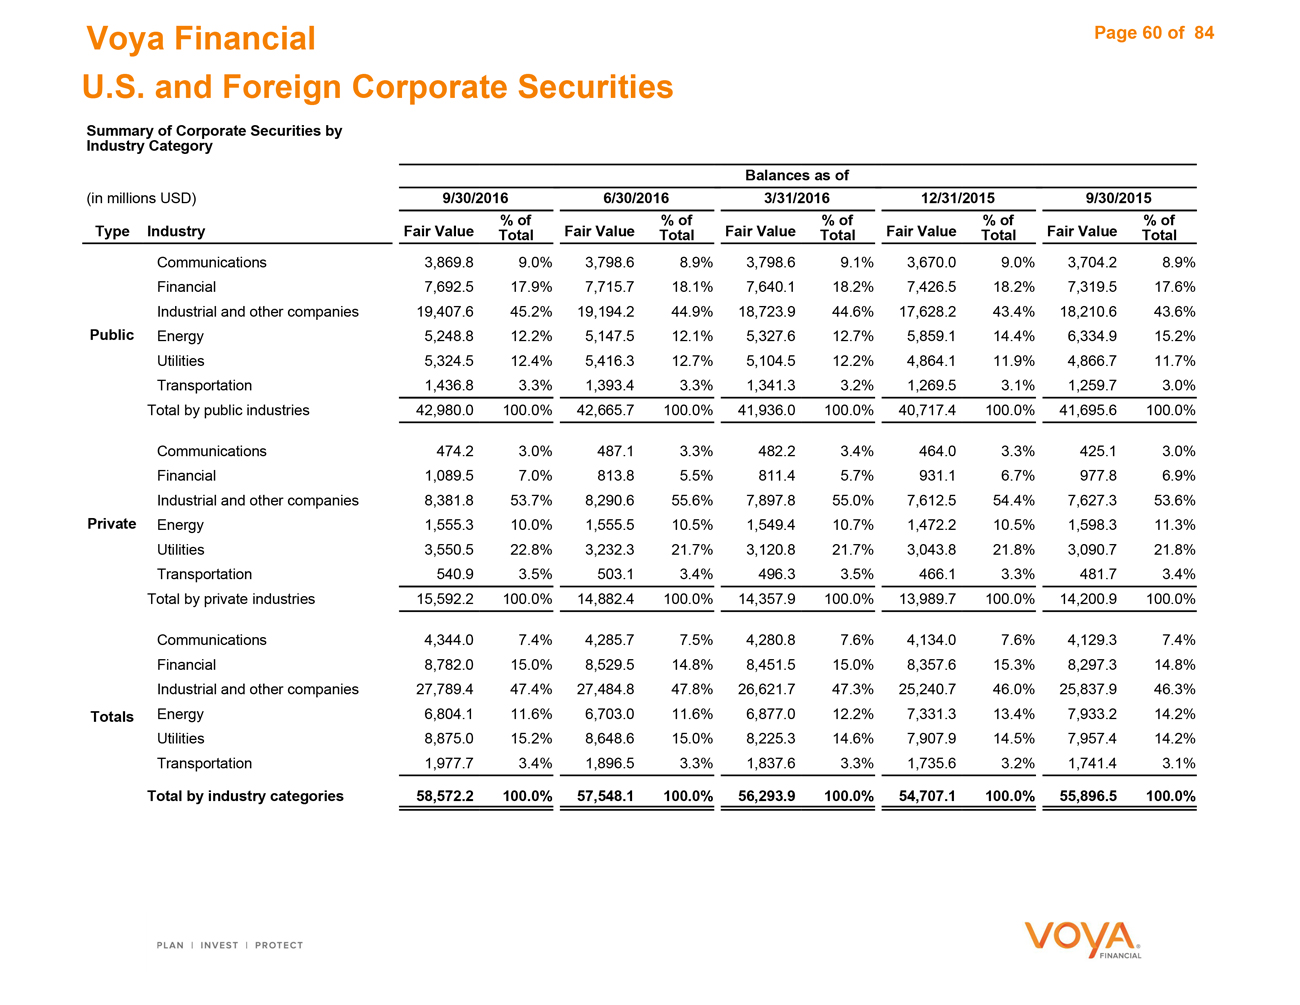
Voya Financial
U.S. and Foreign Corporate Securities
Summary of Corporate Securities by Industry Category
Balances as of
(in millions USD) 9/30/2016 6/30/2016 3/31/2016 12/31/2015 9/30/2015 % of % of % of % of % of Type Industry Fair Value Total Fair Value Total Fair Value Total Fair Value Total Fair Value Total
Communications 3,869.8 9.0% 3,798.6 8.9% 3,798.6 9.1% 3,670.0 9.0% 3,704.2 8.9% Financial 7,692.5 17.9% 7,715.7 18.1% 7,640.1 18.2% 7,426.5 18.2% 7,319.5 17.6% Industrial and other companies 19,407.6 45.2% 19,194.2 44.9% 18,723.9 44.6% 17,628.2 43.4% 18,210.6 43.6% Public Energy 5,248.8 12.2% 5,147.5 12.1% 5,327.6 12.7% 5,859.1 14.4% 6,334.9 15.2% Utilities 5,324.5 12.4% 5,416.3 12.7% 5,104.5 12.2% 4,864.1 11.9% 4,866.7 11.7% Transportation 1,436.8 3.3% 1,393.4 3.3% 1,341.3 3.2% 1,269.5 3.1% 1,259.7 3.0% Total by public industries 42,980.0 100.0% 42,665.7 100.0% 41,936.0 100.0% 40,717.4 100.0% 41,695.6 100.0%
Communications 474.2 3.0% 487.1 3.3% 482.2 3.4% 464.0 3.3% 425.1 3.0% Financial 1,089.5 7.0% 813.8 5.5% 811.4 5.7% 931.1 6.7% 977.8 6.9% Industrial and other companies 8,381.8 53.7% 8,290.6 55.6% 7,897.8 55.0% 7,612.5 54.4% 7,627.3 53.6% Private Energy 1,555.3 10.0% 1,555.5 10.5% 1,549.4 10.7% 1,472.2 10.5% 1,598.3 11.3% Utilities 3,550.5 22.8% 3,232.3 21.7% 3,120.8 21.7% 3,043.8 21.8% 3,090.7 21.8% Transportation 540.9 3.5% 503.1 3.4% 496.3 3.5% 466.1 3.3% 481.7 3.4% Total by private industries 15,592.2 100.0% 14,882.4 100.0% 14,357.9 100.0% 13,989.7 100.0% 14,200.9 100.0%
Communications 4,344.0 7.4% 4,285.7 7.5% 4,280.8 7.6% 4,134.0 7.6% 4,129.3 7.4% Financial 8,782.0 15.0% 8,529.5 14.8% 8,451.5 15.0% 8,357.6 15.3% 8,297.3 14.8% Industrial and other companies 27,789.4 47.4% 27,484.8 47.8% 26,621.7 47.3% 25,240.7 46.0% 25,837.9 46.3% Totals Energy 6,804.1 11.6% 6,703.0 11.6% 6,877.0 12.2% 7,331.3 13.4% 7,933.2 14.2% Utilities 8,875.0 15.2% 8,648.6 15.0% 8,225.3 14.6% 7,907.9 14.5% 7,957.4 14.2% Transportation 1,977.7 3.4% 1,896.5 3.3% 1,837.6 3.3% 1,735.6 3.2% 1,741.4 3.1%
Total by industry categories 58,572.2 100.0% 57,548.1 100.0% 56,293.9 100.0% 54,707.1 100.0% 55,896.5 100.0%
Page 60 of 84
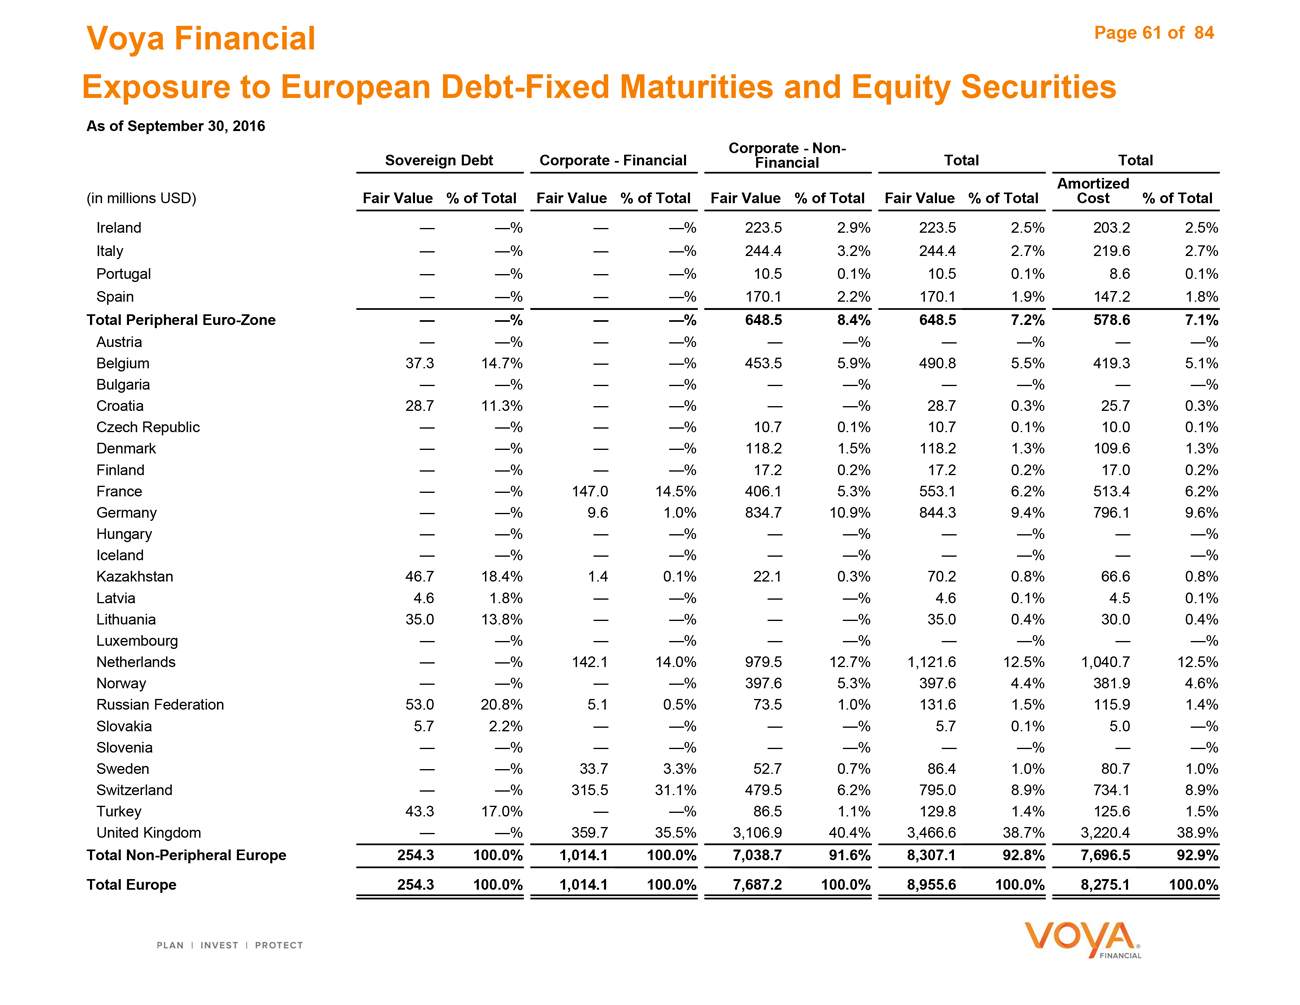
Voya Financial Page Exposure to European Debt-Fixed Maturities and Equity Securities
As of September 30, 2016
Corporate—Non-
Sovereign Debt Corporate—Financial Financial Total Total Amortized (in millions USD) Fair Value % of Total Fair Value % of Total Fair Value % of Total Fair Value % of Total Cost % of Total
Ireland — —% — —% 223.5 2.9% 223.5 2.5% 203.2 2.5% Italy % — —% 244.4 3.2% 244.4 2.7% 219.6 2.7% Portugal — —% — —% 10.5 0.1% 10.5 0.1% 8.6 0.1% Spain — —% — —% 170.1 2.2% 170.1 1.9% 147.2 1.8%
Total Peripheral Euro-Zone — —% — —% 648.5 8.4% 648.5 7.2% 578.6 7.1%
Austria — —% — —% — —% — —% — —% Belgium 37.3 14.7% — —% 453.5 5.9% 490.8 5.5% 419.3 5.1% Bulgaria — —% — —% — —% — —% — —% Croatia 28.7 11.3% — —% — —% 28.7 0.3% 25.7 0.3% Czech Republic — —% — —% 10.7 0.1% 10.7 0.1% 10.0 0.1% Denmark — —% — —% 118.2 1.5% 118.2 1.3% 109.6 1.3% Finland — —% — —% 17.2 0.2% 17.2 0.2% 17.0 0.2% France — —% 147.0 14.5% 406.1 5.3% 553.1 6.2% 513.4 6.2% Germany — —% 9.6 1.0% 834.7 10.9% 844.3 9.4% 796.1 9.6% Hungary — —% — —% — —% — —% — —% Iceland — —% — —% — —% — —% — —% Kazakhstan 46.7 18.4% 1.4 0.1% 22.1 0.3% 70.2 0.8% 66.6 0.8% Latvia 4.6 1.8% — —% — —% 4.6 0.1% 4.5 0.1% Lithuania 35.0 13.8% — —% — —% 35.0 0.4% 30.0 0.4% Luxembourg — —% — —% — —% — —% — —% Netherlands — —% 142.1 14.0% 979.5 12.7% 1,121.6 12.5% 1,040.7 12.5% Norway — —% — —% 397.6 5.3% 397.6 4.4% 381.9 4.6% Russian Federation 53.0 20.8% 5.1 0.5% 73.5 1.0% 131.6 1.5% 115.9 1.4% Slovakia 5.7 2.2% — —% — —% 5.7 0.1% 5.0 —% Slovenia — —% — —% — —% — —% — —% Sweden — —% 33.7 3.3% 52.7 0.7% 86.4 1.0% 80.7 1.0% Switzerland — —% 315.5 31.1% 479.5 6.2% 795.0 8.9% 734.1 8.9% Turkey 43.3 17.0% — —% 86.5 1.1% 129.8 1.4% 125.6 1.5% United Kingdom — —% 359.7 35.5% 3,106.9 40.4% 3,466.6 38.7% 3,220.4 38.9%
Total Non-Peripheral Europe 254.3 100.0% 1,014.1 100.0% 7,038.7 91.6% 8,307.1 92.8% 7,696.5 92.9% Total Europe 254.3 100.0% 1,014.1 100.0% 7,687.2 100.0% 8,955.6 100.0% 8,275.1 100.0%
Page 61 of 84

Reconciliations
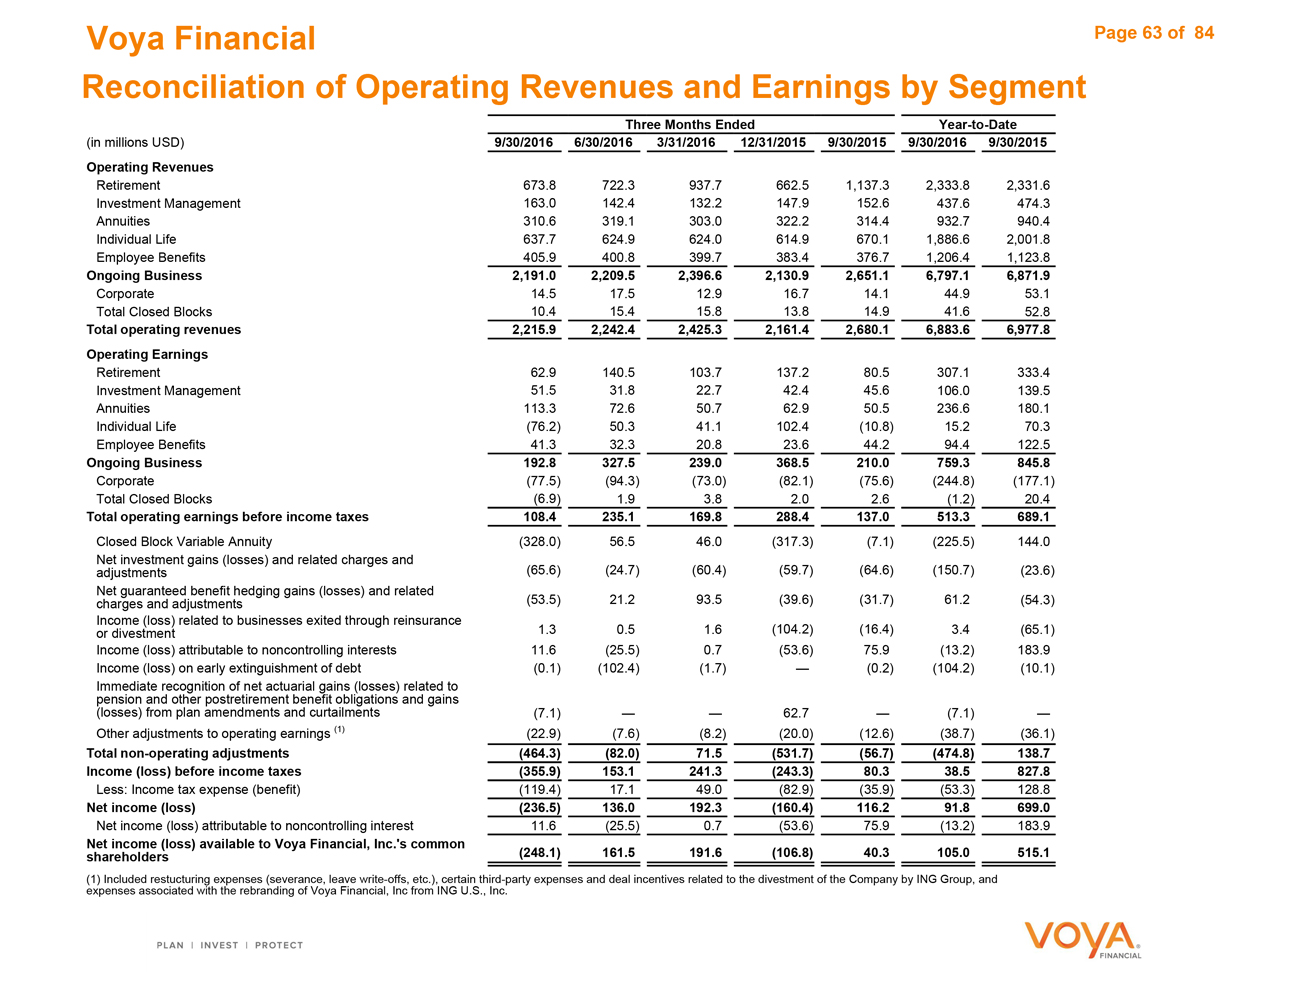
Voya Financial Page Reconciliation of Operating Revenues and Earnings by Segment
Three Months Ended Year-to-Date (in millions USD) 9/30/2016 6/30/2016 3/31/2016 12/31/2015 9/30/2015 9/30/2016 9/30/2015 Operating Revenues
Retirement 673.8 722.3 937.7 662.5 1,137.3 2,333.8 2,331.6 Investment Management 163.0 142.4 132.2 147.9 152.6 437.6 474.3 Annuities 310.6 319.1 303.0 322.2 314.4 932.7 940.4 Individual Life 637.7 624.9 624.0 614.9 670.1 1,886.6 2,001.8 Employee Benefits 405.9 400.8 399.7 383.4 376.7 1,206.4 1,123.8
Ongoing Business 2,191.0 2,209.5 2,396.6 2,130.9 2,651.1 6,797.1 6,871.9
Corporate 14.5 17.5 12.9 16.7 14.1 44.9 53.1 Total Closed Blocks 10.4 15.4 15.8 13.8 14.9 41.6 52.8
Total operating revenues 2,215.9 2,242.4 2,425.3 2,161.4 2,680.1 6,883.6 6,977.8 Operating Earnings
Retirement 62.9 140.5 103.7 137.2 80.5 307.1 333.4 Investment Management 51.5 31.8 22.7 42.4 45.6 106.0 139.5 Annuities 113.3 72.6 50.7 62.9 50.5 236.6 180.1 Individual Life (76.2) 50.3 41.1 102.4 (10.8) 15.2 70.3 Employee Benefits 41.3 32.3 20.8 23.6 44.2 94.4 122.5
Ongoing Business 192.8 327.5 239.0 368.5 210.0 759.3 845.8
Corporate (77.5) (94.3) (73.0) (82.1) (75.6) (244.8) (177.1) Total Closed Blocks (6.9) 1.9 3.8 2.0 2.6 (1.2) 20.4
Total operating earnings before income taxes 108.4 235.1 169.8 288.4 137.0 513.3 689.1
Closed Block Variable Annuity (328.0) 56.5 46.0 (317.3) (7.1) (225.5) 144.0 Net investment gains (losses) and related charges and adjustments (65.6) (24.7) (60.4) (59.7) (64.6) (150.7) (23.6) Net guaranteed benefit hedging gains (losses) and related charges and adjustments (53.5) 21.2 93.5 (39.6) (31.7) 61.2 (54.3) Income (loss) related to businesses exited through reinsurance or divestment 1.3 0.5 1.6 (104.2) (16.4) 3.4 (65.1) Income (loss) attributable to noncontrolling interests 11.6 (25.5) 0.7 (53.6) 75.9 (13.2) 183.9 Income (loss) on early extinguishment of debt (0.1) (102.4) (1.7) — (0.2) (104.2) (10.1) Immediate recognition of net actuarial gains (losses) related to pension and other postretirement benefit obligations and gains (losses) from plan amendments and curtailments (7.1) — — 62.7 — (7.1) —Other adjustments to operating earnings (1) (22.9) (7.6) (8.2) (20.0) (12.6) (38.7) (36.1)
Total non-operating adjustments (464.3) (82.0) 71.5 (531.7) (56.7) (474.8) 138.7 Income (loss) before income taxes (355.9) 153.1 241.3 (243.3) 80.3 38.5 827.8
Less: Income tax expense (benefit) (119.4) 17.1 49.0 (82.9) (35.9) (53.3) 128.8
Net income (loss) (236.5) 136.0 192.3 (160.4) 116.2 91.8 699.0
Net income (loss) attributable to noncontrolling interest 11.6 (25.5) 0.7 (53.6) 75.9 (13.2) 183.9
Net income (loss) available to Voya Financial, Inc.‘s common shareholders (248.1) 161.5 191.6 (106.8) 40.3 105.0 515.1
(1) Included restucturing expenses (severance, leave write-offs, etc.), certain third-party expenses and deal incentives related to the divestment of the Company by ING Group, and expenses associated with the rebranding of Voya Financial, Inc from ING U.S., Inc.
Page 63 of 84
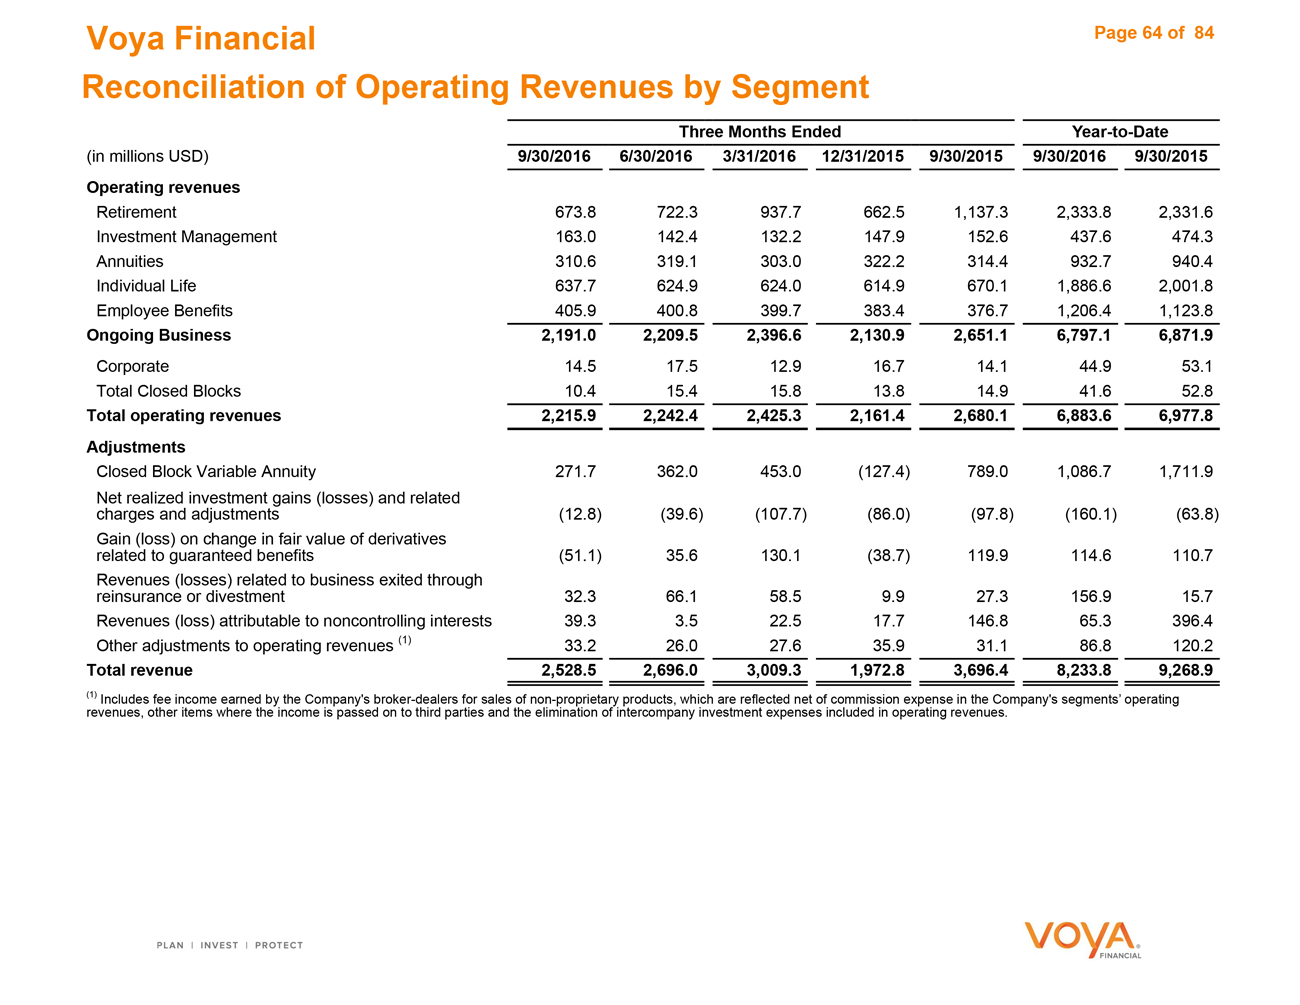
Voya Financial
Reconciliation of Operating Revenues by Segment
Three Months Ended Year-to-Date (in millions USD) 9/30/2016 6/30/2016 3/31/2016 12/31/2015 9/30/2015 9/30/2016 9/30/2015 Operating revenues
Retirement 673.8 722.3 937.7 662.5 1,137.3 2,333.8 2,331.6 Investment Management 163.0 142.4 132.2 147.9 152.6 437.6 474.3 Annuities 310.6 319.1 303.0 322.2 314.4 932.7 940.4 Individual Life 637.7 624.9 624.0 614.9 670.1 1,886.6 2,001.8 Employee Benefits 405.9 400.8 399.7 383.4 376.7 1,206.4 1,123.8
Ongoing Business 2,191.0 2,209.5 2,396.6 2,130.9 2,651.1 6,797.1 6,871.9
Corporate 14.5 17.5 12.9 16.7 14.1 44.9 53.1 Total Closed Blocks 10.4 15.4 15.8 13.8 14.9 41.6 52.8
Total operating revenues 2,215.9 2,242.4 2,425.3 2,161.4 2,680.1 6,883.6 6,977.8 Adjustments
Closed Block Variable Annuity 271.7 362.0 453.0 (127.4) 789.0 1,086.7 1,711.9 Net realized investment gains (losses) and related charges and adjustments (12.8) (39.6) (107.7) (86.0) (97.8) (160.1) (63.8) Gain (loss) on change in fair value of derivatives related to guaranteed benefits (51.1) 35.6 130.1 (38.7) 119.9 114.6 110.7 Revenues (losses) related to business exited through reinsurance or divestment 32.3 66.1 58.5 9.9 27.3 156.9 15.7 Revenues (loss) attributable to noncontrolling interests 39.3 3.5 22.5 17.7 146.8 65.3 396.4 Other adjustments to operating revenues (1) 33.2 26.0 27.6 35.9 31.1 86.8 120.2
Total revenue 2,528.5 2,696.0 3,009.3 1,972.8 3,696.4 8,233.8 9,268.9
(1) Includes fee income earned by the Company’s broker-dealers for sales of non-proprietary products, which are reflected net of commission expense in the Company’s segments’ operating revenues, other items where the income is passed on to third parties and the elimination of intercompany investment expenses included in operating revenues.
Page 64 of 84
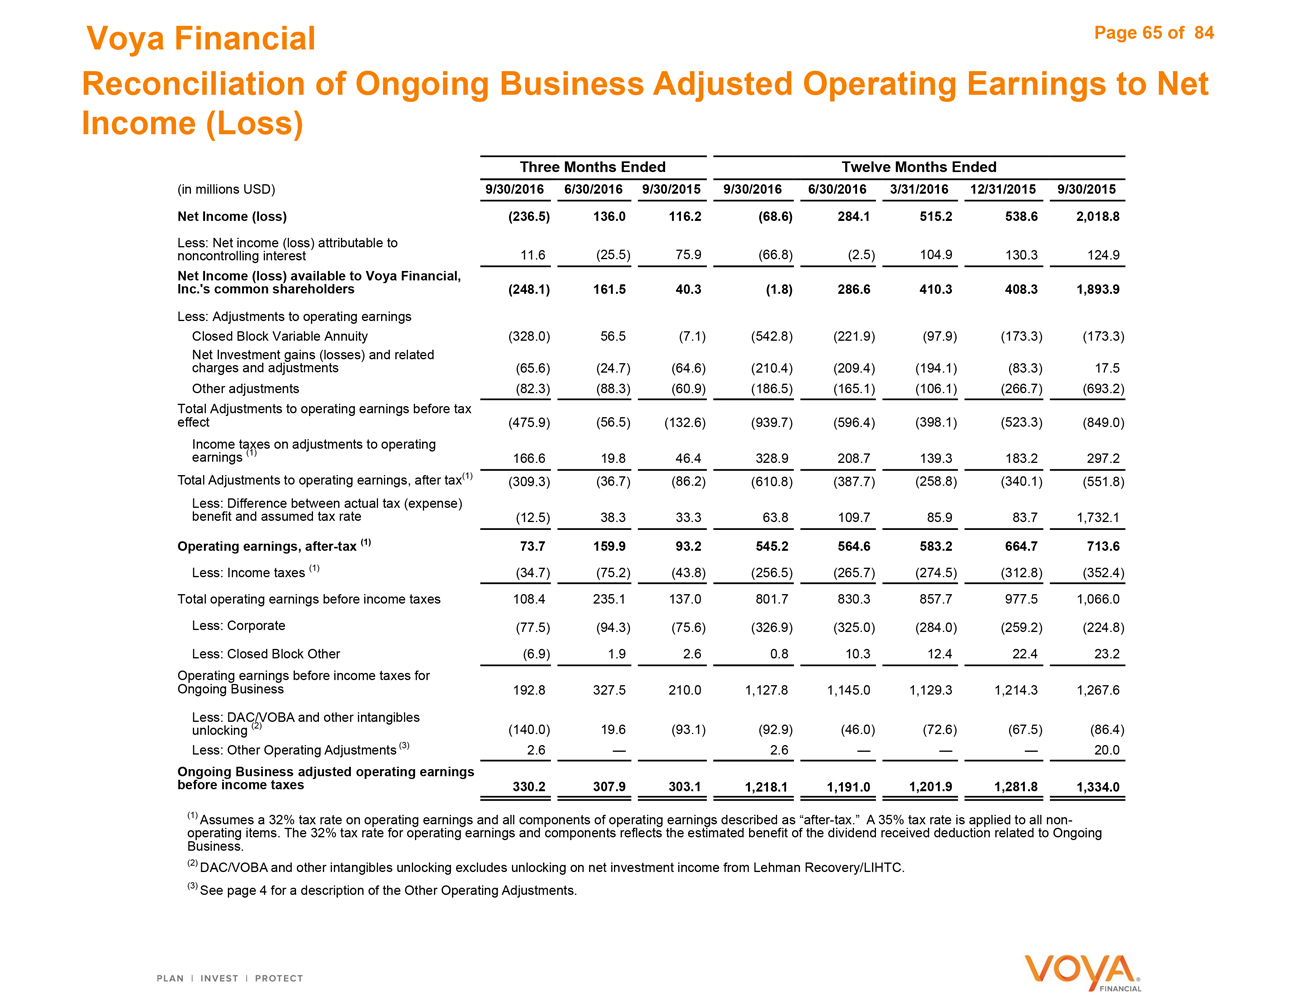
Voya Financial
Reconciliation of Ongoing Business Adjusted Operating Earnings to Net Income (Loss)
Three Months Ended Twelve Months Ended
(in millions USD) 9/30/2016 6/30/2016 9/30/2015 9/30/2016 6/30/2016 3/31/2016 12/31/2015 9/30/2015
Net Income (loss) (236.5) 136.0 116.2 (68.6) 284.1 515.2 538.6 2,018.8
Less: Net income (loss) attributable to 11.6 (25.5) 75.9 (66.8) (2.5) 104.9 130.3 124.9 noncontrolling interest
Net Income (loss) available to Voya Financial,
Inc.‘s common shareholders (248.1) 161.5 40.3 (1.8) 286.6 410.3 408.3 1,893.9
Less: Adjustments to operating earnings
Closed Block Variable Annuity (328.0) 56.5 (7.1) (542.8) (221.9) (97.9) (173.3) (173.3) Net Investment gains (losses) and related charges and adjustments (65.6) (24.7) (64.6) (210.4) (209.4) (194.1) (83.3) 17.5 Other adjustments (82.3) (88.3) (60.9) (186.5) (165.1) (106.1) (266.7) (693.2) Total Adjustments to operating earnings before tax effect (475.9) (56.5) (132.6) (939.7) (596.4) (398.1) (523.3) (849.0) Income taxes on adjustments to operating earnings (1) 166.6 19.8 46.4 328.9 208.7 139.3 183.2 297.2 Total Adjustments to operating earnings, after tax(1) (309.3) (36.7) (86.2) (610.8) (387.7) (258.8) (340.1) (551.8) Less: Difference between actual tax (expense) benefit and assumed tax rate (12.5) 38.3 33.3 63.8 109.7 85.9 83.7 1,732.1
Operating earnings, after-tax (1) 73.7 159.9 93.2 545.2 564.6 583.2 664.7 713.6
Less: Income taxes (1) (34.7) (75.2) (43.8) (256.5) (265.7) (274.5) (312.8) (352.4) Total operating earnings before income taxes 108.4 235.1 137.0 801.7 830.3 857.7 977.5 1,066.0 Less: Corporate (77.5) (94.3) (75.6) (326.9) (325.0) (284.0) (259.2) (224.8) Less: Closed Block Other (6.9) 1.9 2.6 0.8 10.3 12.4 22.4 23.2 Operating earnings before income taxes for Ongoing Business 192.8 327.5 210.0 1,127.8 1,145.0 1,129.3 1,214.3 1,267.6 Less: DAC/VOBA and other intangibles unlocking (2) (140.0) 19.6 (93.1) (92.9) (46.0) (72.6) (67.5) (86.4) Less: Other Operating Adjustments (3) 2.6 — 2.6 — — — 20.0
Ongoing Business adjusted operating earnings before income taxes 330.2 307.9 303.1 1,218.1 1,191.0 1,201.9 1,281.8 1,334.0
(1) Assumes a 32% tax rate on operating earnings and all components of operating earnings described as “after-tax.” A 35% tax rate is applied to all non-operating items. The 32% tax rate for operating earnings and components reflects the estimated benefit of the dividend received deduction related to Ongoing Business.
(2) DAC/VOBA and other intangibles unlocking excludes unlocking on net investment income from Lehman Recovery/LIHTC. (3) See page 4 for a description of the Other Operating Adjustments.
Page 65 of 84
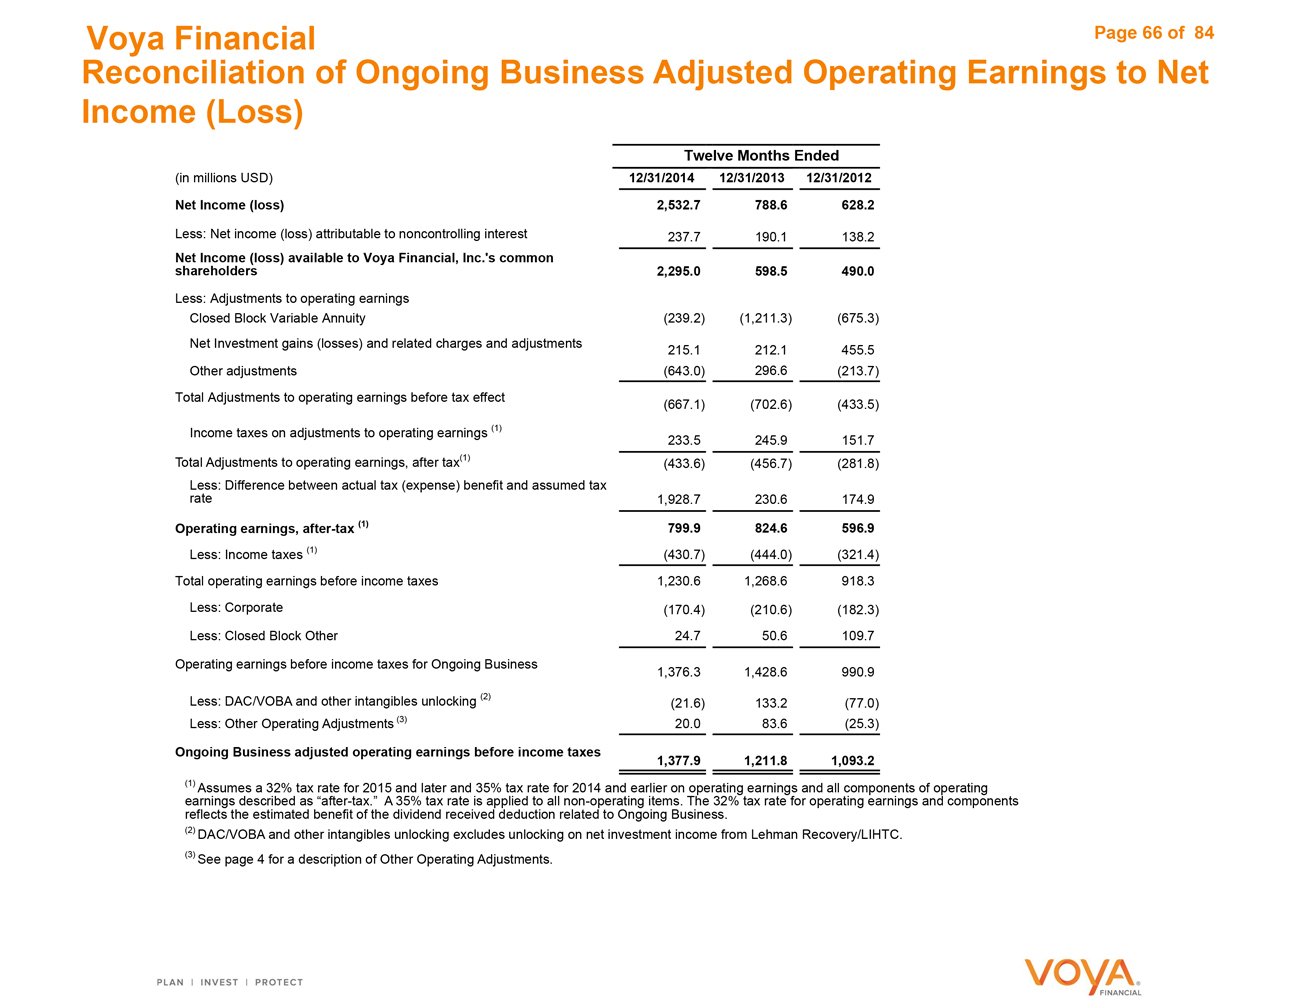
Voya Financial
Reconciliation of Ongoing Business Adjusted Operating Earnings to Net Income (Loss)
Twelve Months Ended
(in millions USD) 12/31/2014 12/31/2013 12/31/2012
Net Income (loss) 2,532.7 788.6 628.2
Less: Net income (loss) attributable to noncontrolling interest 237.7 190.1 138.2
Net Income (loss) available to Voya Financial, Inc.‘s common shareholders 2,295.0 598.5 490.0
Less: Adjustments to operating earnings
Closed Block Variable Annuity (239.2) (1,211.3) (675.3) Net Investment gains (losses) and related charges and adjustments 215.1 212.1 455.5 Other adjustments (643.0) 296.6 (213.7) Total Adjustments to operating earnings before tax effect (667.1) (702.6) (433.5) Income taxes on adjustments to operating earnings (1) 233.5 245.9 151.7 Total Adjustments to operating earnings, after tax(1) (433.6) (456.7) (281.8) Less: Difference between actual tax (expense) benefit and assumed tax rate 1,928.7 230.6 174.9
Operating earnings, after-tax (1) 799.9 824.6 596.9
Less: Income taxes (1) (430.7) (444.0) (321.4) Total operating earnings before income taxes 1,230.6 1,268.6 918.3 Less: Corporate (170.4) (210.6) (182.3) Less: Closed Block Other 24.7 50.6 109.7
Operating earnings before income taxes for Ongoing Business
1,376.3 1,428.6 990.9
Less: DAC/VOBA and other intangibles unlocking (2)
(21.6) 133.2 (77.0) Less: Other Operating Adjustments (3) 20.0 83.6 (25.3)
Ongoing Business adjusted operating earnings before income taxes
1,377.9 1,211.8 1,093.2
(1) Assumes a 32% tax rate for 2015 and later and 35% tax rate for 2014 and earlier on operating earnings and all components of operating earnings described as “after-tax.” A 35% tax rate is applied to all non-operating items. The 32% tax rate for operating earnings and components reflects the estimated benefit of the dividend received deduction related to Ongoing Business.
(2) DAC/VOBA and other intangibles unlocking excludes unlocking on net investment income from Lehman Recovery/LIHTC. (3) See page 4 for a description of Other Operating Adjustments.
Page 66 of 84
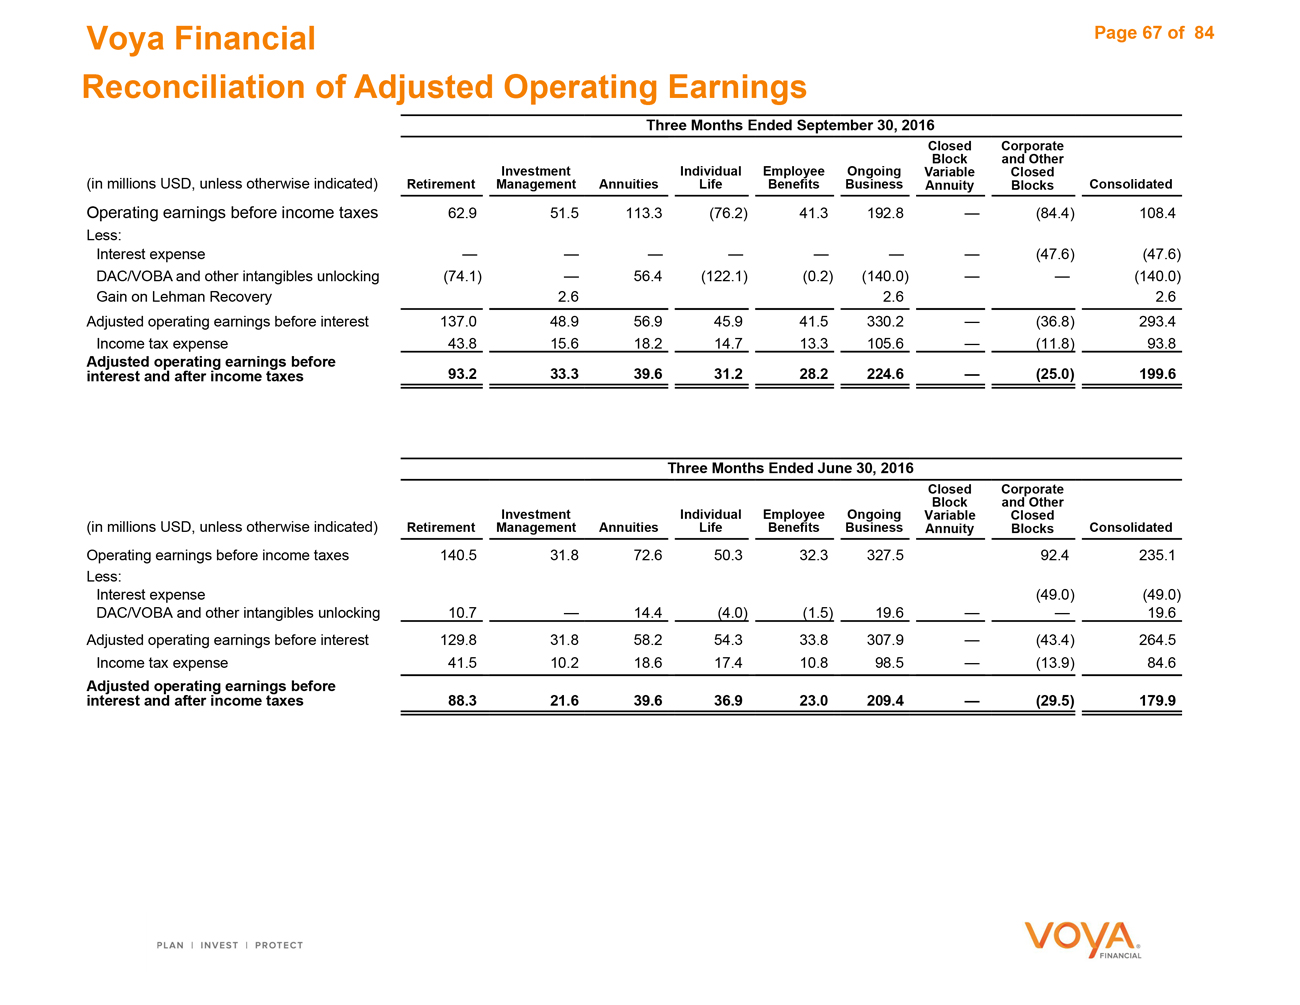
Voya Financial
Reconciliation of Adjusted Operating Earnings
Three Months Ended September 30, 2016
Closed Corporate Investment Individual Employee Ongoing Block and Other Variable Closed
(in millions USD, unless otherwise indicated) Retirement Management Annuities Life Benefits Business Annuity Blocks Consolidated
Operating earnings before income taxes 62.9 51.5 113.3 (76.2) 41.3 192.8 — (84.4) 108.4 Less: Interest expense — — — — — — — (47.6) (47.6) DAC/VOBA and other intangibles unlocking (74.1) — 56.4 (122.1) (0.2) (140.0) — — (140.0) Gain on Lehman Recovery 2.6 2.6 2.6 Adjusted operating earnings before interest 137.0 48.9 56.9 45.9 41.5 330.2 — (36.8) 293.4 Income tax expense 43.8 15.6 18.2 14.7 13.3 105.6 — (11.8) 93.8
Adjusted operating earnings before interest and after income taxes 93.2 33.3 39.6 31.2 28.2 224.6 — (25.0) 199.6
Three Months Ended June 30, 2016
Closed Corporate Investment Individual Employee Ongoing Block and Other Variable Closed
(in millions USD, unless otherwise indicated) Retirement Management Annuities Life Benefits Business Annuity Blocks Consolidated
Operating earnings before income taxes 140.5 31.8 72.6 50.3 32.3 327.5 92.4 235.1 Less: Interest expense (49.0) (49.0) DAC/VOBA and other intangibles unlocking 10.7 — 14.4 (4.0) (1.5) 19.6 — — 19.6 Adjusted operating earnings before interest 129.8 31.8 58.2 54.3 33.8 307.9 — (43.4) 264.5 Income tax expense 41.5 10.2 18.6 17.4 10.8 98.5 — (13.9) 84.6
Adjusted operating earnings before interest and after income taxes 88.3 21.6 39.6 36.9 23.0 209.4 — (29.5) 179.9
Page 67 of 84
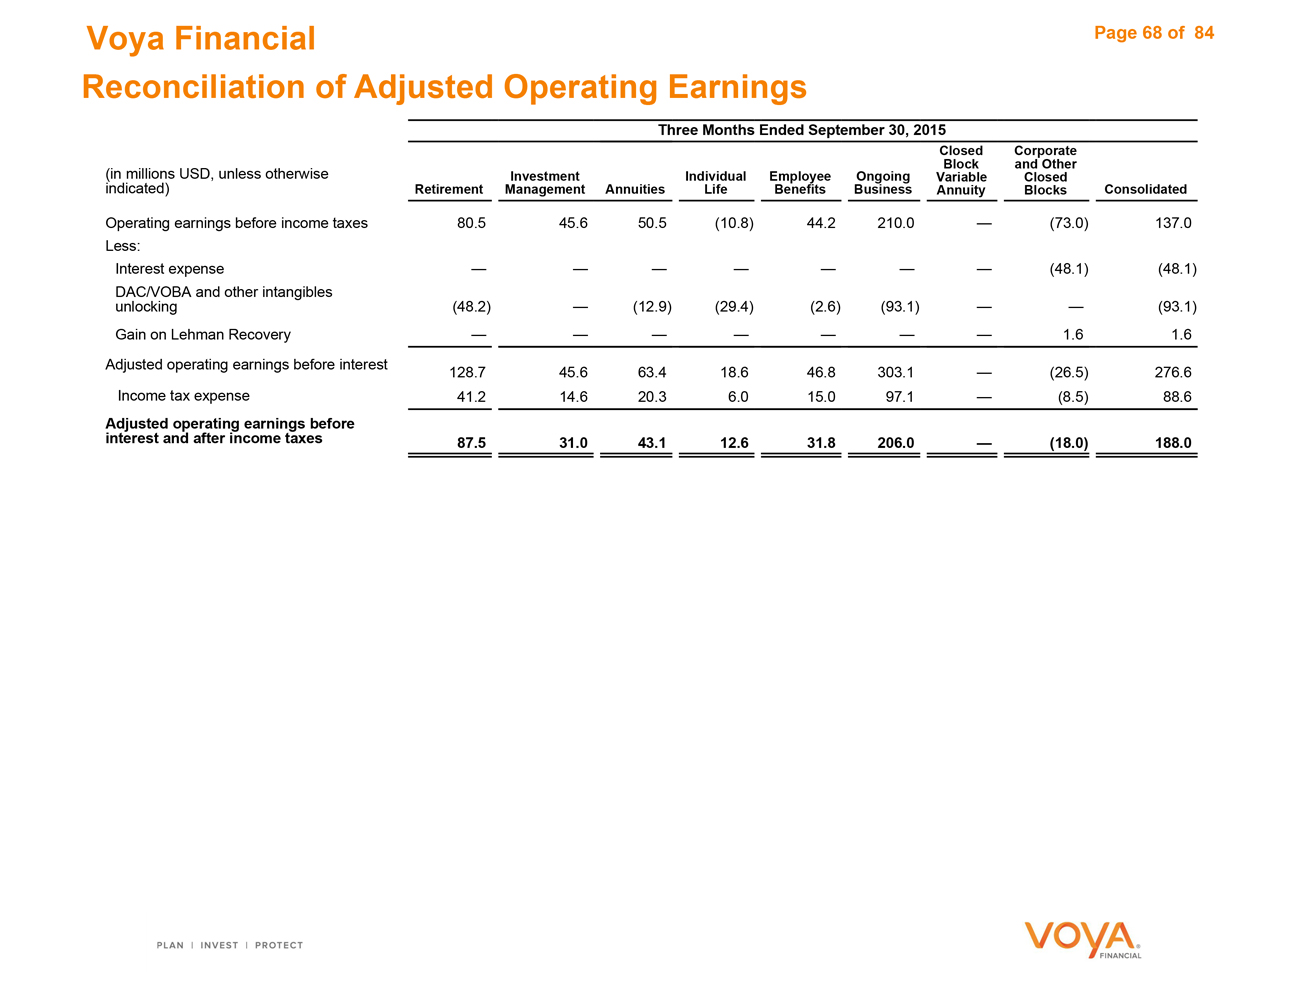
Voya Financial
Reconciliation of Adjusted Operating Earnings
Three Months Ended September 30, 2015
Closed Corporate Block and Other (in millions USD, unless otherwise Investment Individual Employee Ongoing Variable Closed indicated) Retirement Management Annuities Life Benefits Business Annuity Blocks Consolidated
Operating earnings before income taxes 80.5 45.6 50.5 (10.8) 44.2 210.0 — (73.0) 137.0 Less: Interest expense — — — — — — — (48.1) (48.1) DAC/VOBA and other intangibles unlocking (48.2) — (12.9) (29.4) (2.6) (93.1) — — (93.1) Gain on Lehman Recovery — — — — — — — 1.6 1.6 Adjusted operating earnings before interest 128.7 45.6 63.4 18.6 46.8 303.1 — (26.5) 276.6 Income tax expense 41.2 14.6 20.3 6.0 15.0 97.1 — (8.5) 88.6
Adjusted operating earnings before interest and after income taxes 87.5 31.0 43.1 12.6 31.8 206.0 — (18.0) 188.0
Page 68 of 84
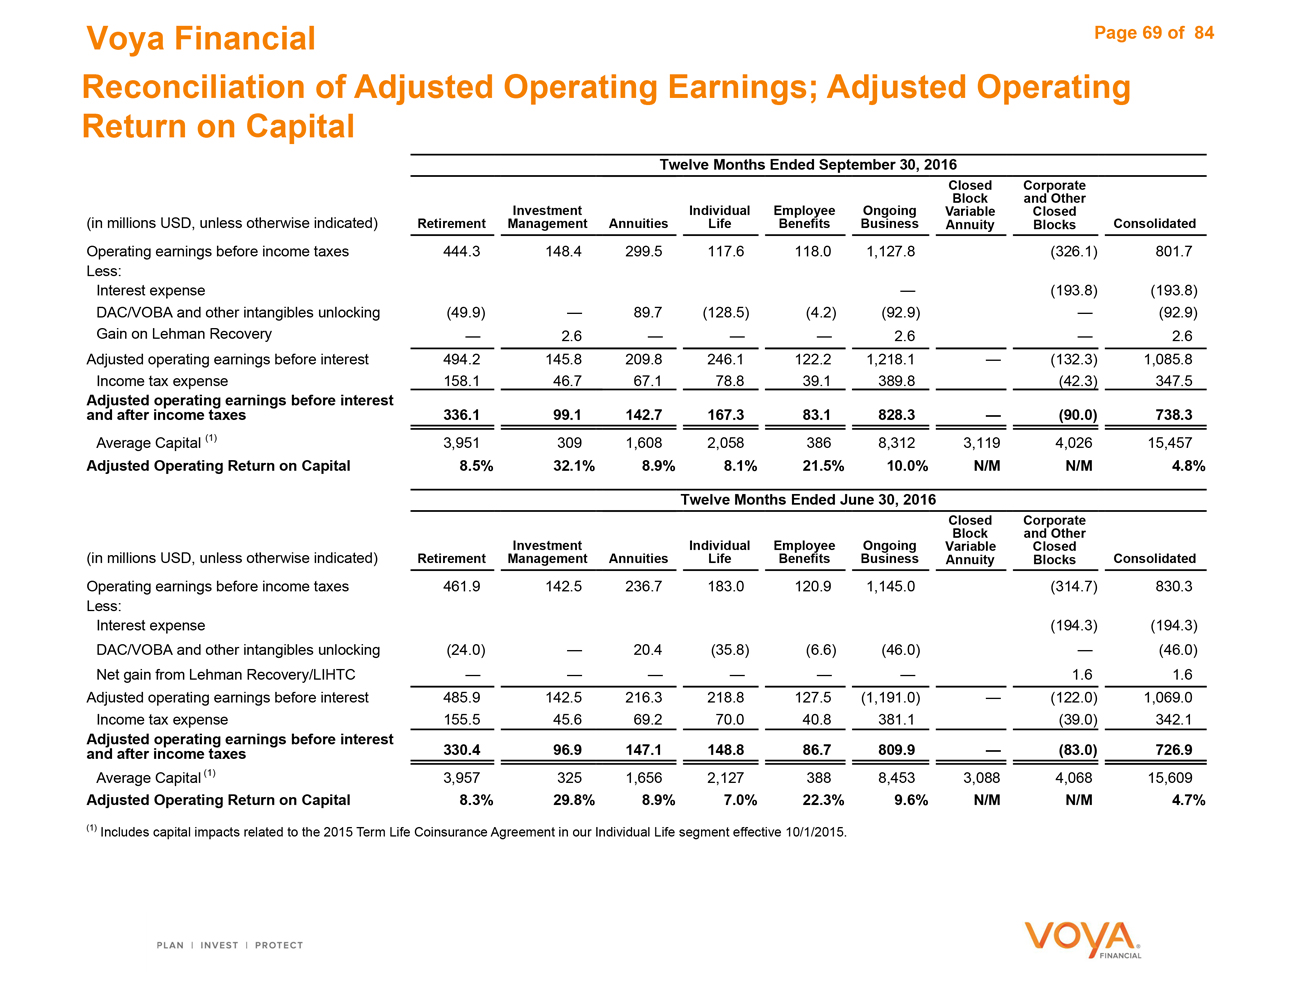
Voya Financial
Reconciliation of Adjusted Operating Earnings; Adjusted Operating Return on Capital
Twelve Months Ended September 30, 2016
Closed Corporate Investment Individual Employee Ongoing Block and Other Variable Closed
(in millions USD, unless otherwise indicated) Retirement Management Annuities Life Benefits Business Annuity Blocks Consolidated
Operating earnings before income taxes 444.3 148.4 299.5 117.6 118.0 1,127.8 (326.1) 801.7 Less: Interest expense — (193.8) (193.8) DAC/VOBA and other intangibles unlocking (49.9) — 89.7 (128.5) (4.2) (92.9) — (92.9) Gain on Lehman Recovery — 2.6 — — — 2.6 — 2.6 Adjusted operating earnings before interest 494.2 145.8 209.8 246.1 122.2 1,218.1 — (132.3) 1,085.8 Income tax expense 158.1 46.7 67.1 78.8 39.1 389.8 (42.3) 347.5
Adjusted operating earnings before interest and after income taxes 336.1 99.1 142.7 167.3 83.1 828.3 — (90.0) 738.3
Average Capital (1) 3,951 309 1,608 2,058 386 8,312 3,119 4,026 15,457
Adjusted Operating Return on Capital 8.5% 32.1% 8.9% 8.1% 21.5% 10.0% N/M N/M 4.8%
Twelve Months Ended June 30, 2016
Closed Corporate Investment Individual Employee Ongoing Block and Other Variable Closed
(in millions USD, unless otherwise indicated) Retirement Management Annuities Life Benefits Business Annuity Blocks Consolidated
Operating earnings before income taxes 461.9 142.5 236.7 183.0 120.9 1,145.0 (314.7) 830.3 Less: Interest expense (194.3) (194.3) DAC/VOBA and other intangibles unlocking (24.0) — 20.4 (35.8) (6.6) (46.0) — (46.0) Net gain from Lehman Recovery/LIHTC — — — — — — 1.6 1.6 Adjusted operating earnings before interest 485.9 142.5 216.3 218.8 127.5 (1,191.0) — (122.0) 1,069.0 Income tax expense 155.5 45.6 69.2 70.0 40.8 381.1 (39.0) 342.1
Adjusted operating earnings before interest and after income taxes 330.4 96.9 147.1 148.8 86.7 809.9 — (83.0) 726.9
Average Capital (1) 3,957 325 1,656 2,127 388 8,453 3,088 4,068 15,609
Adjusted Operating Return on Capital 8.3% 29.8% 8.9% 7.0% 22.3% 9.6% N/M N/M 4.7%
(1) Includes capital impacts related to the 2015 Term Life Coinsurance Agreement in our Individual Life segment effective 10/1/2015.
Page 69 of 84
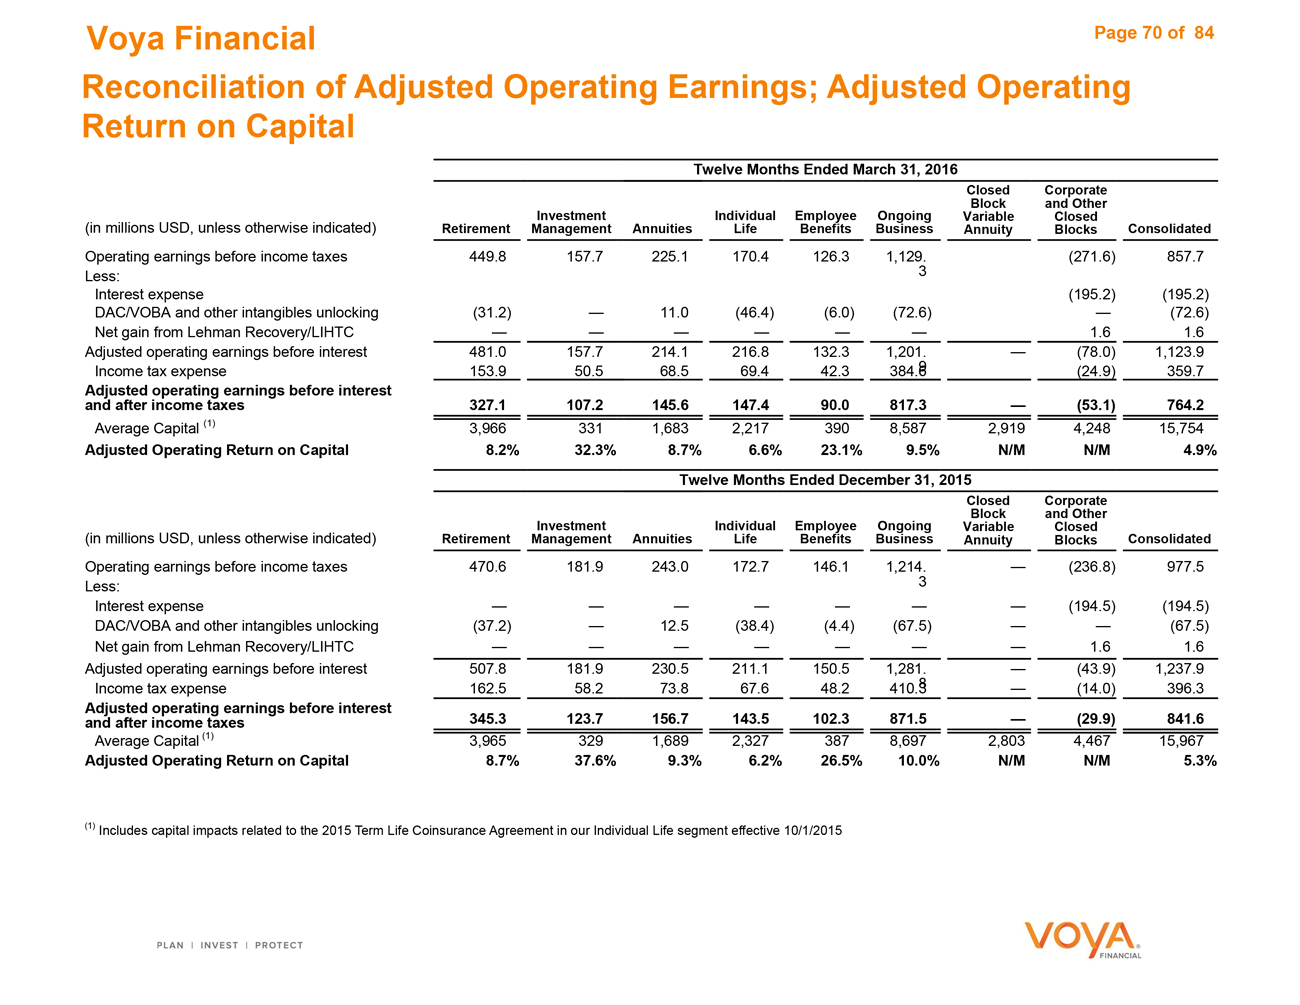
Voya Financial
Reconciliation of Adjusted Operating Earnings; Adjusted Operating Return on Capital
Twelve Months Ended March 31, 2016
Closed Corporate Investment Individual Employee Ongoing Block and Other Variable Closed
(in millions USD, unless otherwise indicated) Retirement Management Annuities Life Benefits Business Annuity Blocks Consolidated
Operating earnings before income taxes 449.8 157.7 225.1 170.4 126.3 1,129. (271.6) 857.7 Less: 3 Interest expense (195.2) (195.2) DAC/VOBA and other intangibles unlocking (31.2) — 11.0 (46.4) (6.0) (72.6) — (72.6) Net gain from Lehman Recovery/LIHTC — — — — — — 1.6 1.6 Adjusted operating earnings before interest 481.0 157.7 214.1 216.8 132.3 1,201. — (78.0) 1,123.9 Income tax expense 153.9 50.5 68.5 69.4 42.3 384.6 9 (24.9) 359.7
Adjusted operating earnings before interest and after income taxes 327.1 107.2 145.6 147.4 90.0 817.3 — (53.1) 764.2
Average Capital (1) 3,966 331 1,683 2,217 390 8,587 2,919 4,248 15,754
Adjusted Operating Return on Capital 8.2% 32.3% 8.7% 6.6% 23.1% 9.5% N/M N/M 4.9% Twelve Months Ended December 31, 2015
Closed Corporate Investment Individual Employee Ongoing Block and Other Variable Closed
(in millions USD, unless otherwise indicated) Retirement Management Annuities Life Benefits Business Annuity Blocks Consolidated
Operating earnings before income taxes 470.6 181.9 243.0 172.7 146.1 1,214. — (236.8) 977.5 Less: 3 Interest expense — — — — — — — (194.5) (194.5) DAC/VOBA and other intangibles unlocking (37.2) — 12.5 (38.4) (4.4) (67.5) — — (67.5) Net gain from Lehman Recovery/LIHTC — — — — — — — 1.6 1.6 Adjusted operating earnings before interest 507.8 181.9 230.5 211.1 150.5 1,281. — (43.9) 1,237.9 Income tax expense 162.5 58.2 73.8 67.6 48.2 410.3 8 — (14.0) 396.3
Adjusted operating earnings before interest and after income taxes 345.3 123.7 156.7 143.5 102.3 871.5 — (29.9) 841.6
Average Capital (1) 3,965 329 1,689 2,327 387 8,697 2,803 4,467 15,967
Adjusted Operating Return on Capital 8.7% 37.6% 9.3% 6.2% 26.5% 10.0% N/M N/M 5.3%
(1) Includes capital impacts related to the 2015 Term Life Coinsurance Agreement in our Individual Life segment effective 10/1/2015
Page 70 of 84
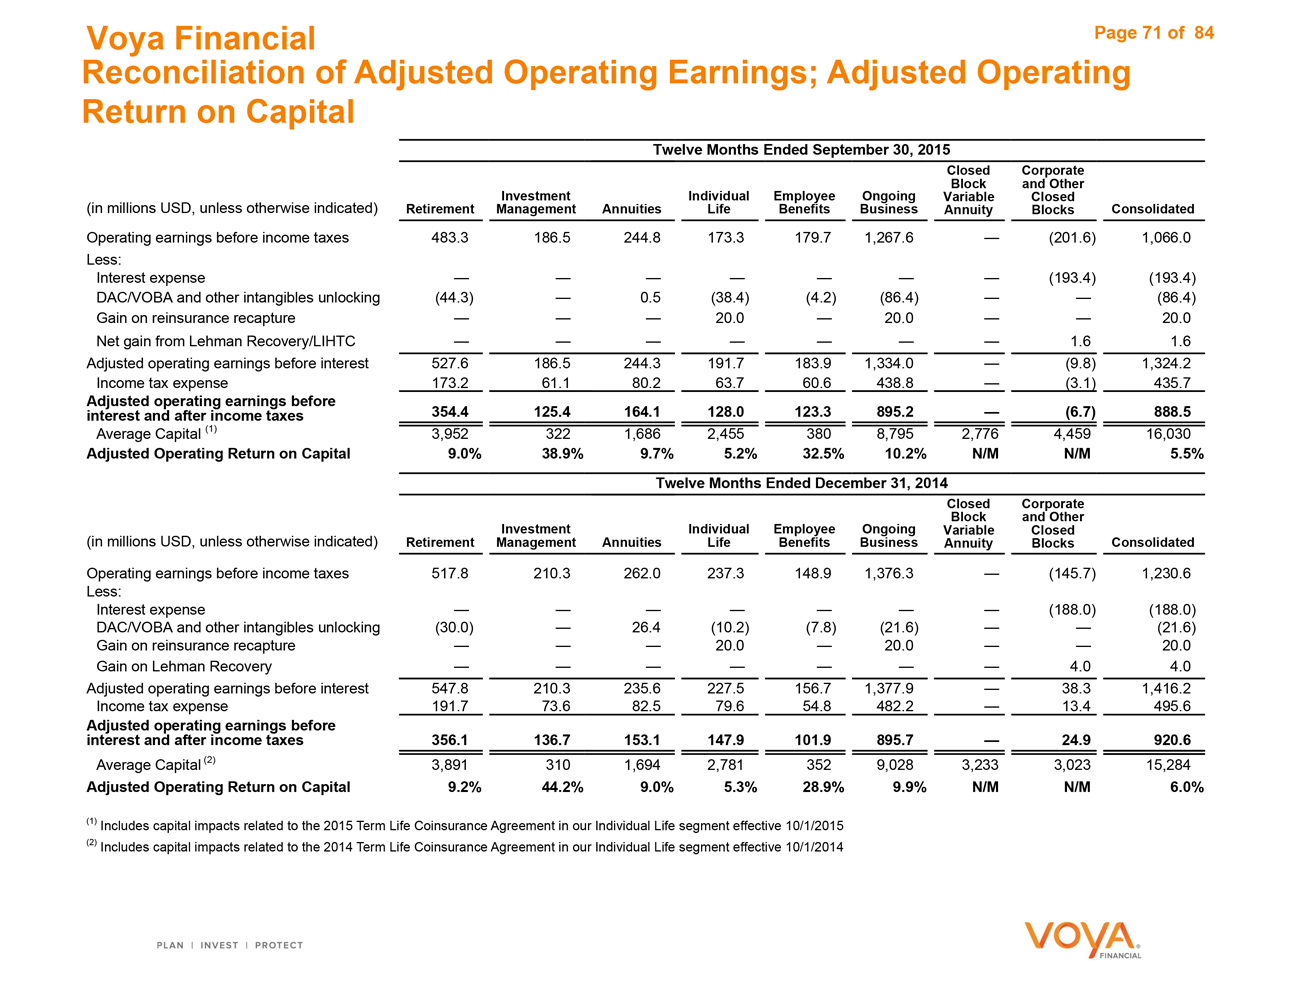
Voya Financial
Reconciliation of Adjusted Operating Earnings; Adjusted Operating Return on Capital
Twelve Months Ended September 30, 2015
Closed Corporate Investment Individual Employee Ongoing Block and Other Variable Closed
(in millions USD, unless otherwise indicated) Retirement Management Annuities Life Benefits Business Annuity Blocks Consolidated
Operating earnings before income taxes 483.3 186.5 244.8 173.3 179.7 1,267.6 — (201.6) 1,066.0 Less: Interest expense — — — — — — — (193.4) (193.4) DAC/VOBA and other intangibles unlocking (44.3) — 0.5 (38.4) (4.2) (86.4) — — (86.4) Gain on reinsurance recapture — — — 20.0 — 20.0 — — 20.0 Net gain from Lehman Recovery/LIHTC — — — — — — — 1.6 1.6 Adjusted operating earnings before interest 527.6 186.5 244.3 191.7 183.9 1,334.0 — (9.8) 1,324.2 Income tax expense 173.2 61.1 80.2 63.7 60.6 438.8 — (3.1) 435.7
Adjusted operating earnings before interest and after income taxes 354.4 125.4 164.1 128.0 123.3 895.2 — (6.7) 888.5
Average Capital (1) 3,952 322 1,686 2,455 380 8,795 2,776 4,459 16,030
Adjusted Operating Return on Capital 9.0% 38.9% 9.7% 5.2% 32.5% 10.2% N/M N/M 5.5% Twelve Months Ended December 31, 2014
Closed Corporate Investment Individual Employee Ongoing Block and Other Variable Closed
(in millions USD, unless otherwise indicated) Retirement Management Annuities Life Benefits Business Annuity Blocks Consolidated
Operating earnings before income taxes 517.8 210.3 262.0 237.3 148.9 1,376.3 — (145.7) 1,230.6 Less: Interest expense — — — — — — — (188.0) (188.0) DAC/VOBA and other intangibles unlocking (30.0) — 26.4 (10.2) (7.8) (21.6) — — (21.6) Gain on reinsurance recapture — — — 20.0 — 20.0 — — 20.0 Gain on Lehman Recovery — — — — — — — 4.0 4.0 Adjusted operating earnings before interest 547.8 210.3 235.6 227.5 156.7 1,377.9 — 38.3 1,416.2 Income tax expense 191.7 73.6 82.5 79.6 54.8 482.2 — 13.4 495.6
Adjusted operating earnings before interest and after income taxes 356.1 136.7 153.1 147.9 101.9 895.7 — 24.9 920.6
Average Capital (2) 3,891 310 1,694 2,781 352 9,028 3,233 3,023 15,284
Adjusted Operating Return on Capital 9.2% 44.2% 9.0% 5.3% 28.9% 9.9% N/M N/M 6.0%
(1) Includes capital impacts related to the 2015 Term Life Coinsurance Agreement in our Individual Life segment effective 10/1/2015 (2) Includes capital impacts related to the 2014 Term Life Coinsurance Agreement in our Individual Life segment effective 10/1/2014
Page 71 of 84
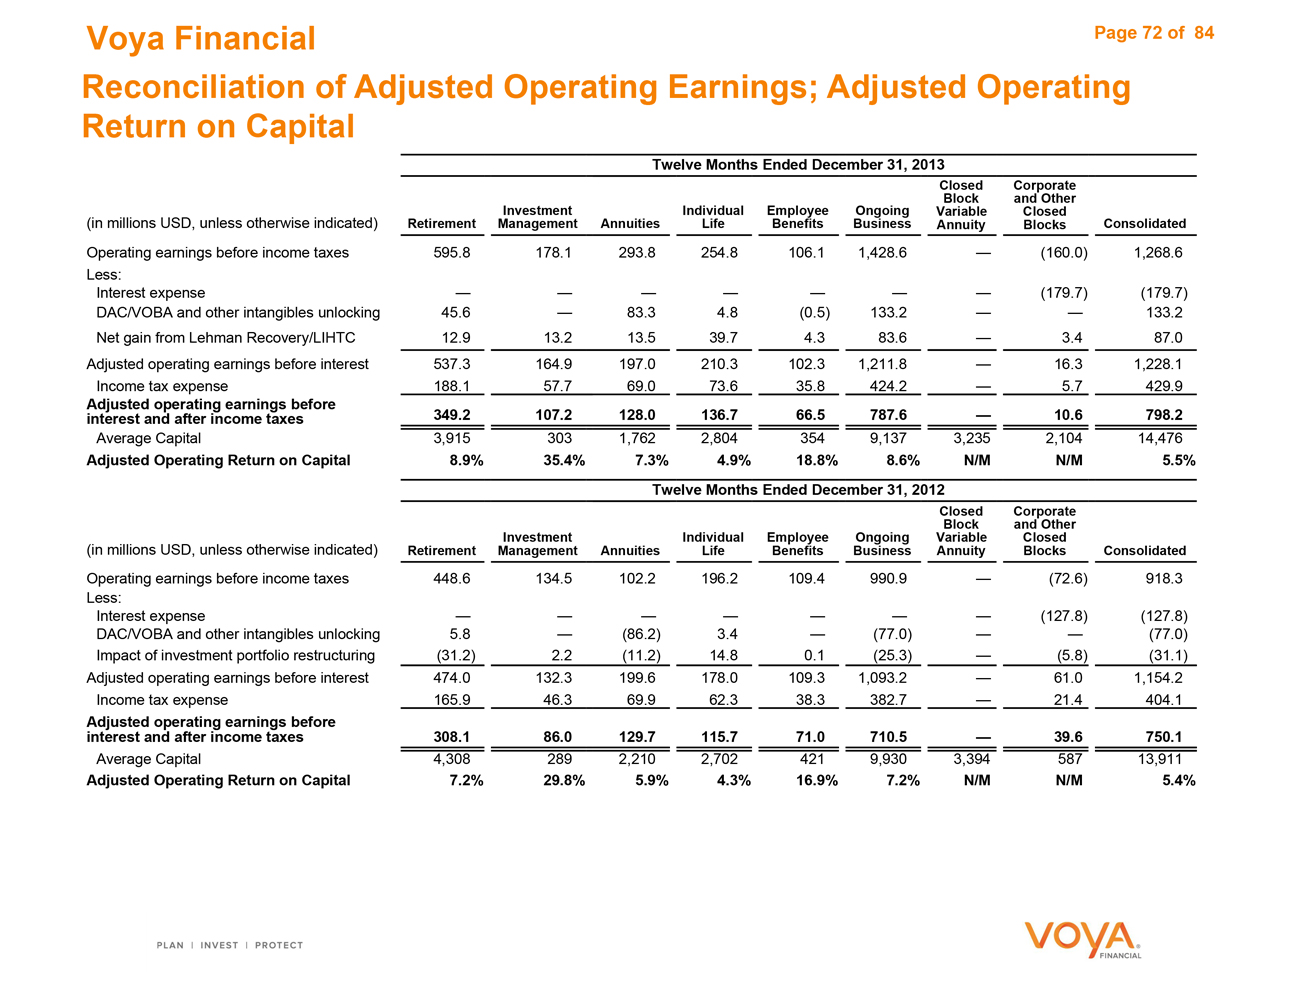
Voya Financial
Reconciliation of Adjusted Operating Earnings; Adjusted Operating Return on Capital
Twelve Months Ended December 31, 2013
Closed Corporate Investment Individual Employee Ongoing Block and Other Variable Closed
(in millions USD, unless otherwise indicated) Retirement Management Annuities Life Benefits Business Annuity Blocks Consolidated
Operating earnings before income taxes 595.8 178.1 293.8 254.8 106.1 1,428.6 — (160.0) 1,268.6 Less: Interest expense — — — — — — — (179.7) (179.7) DAC/VOBA and other intangibles unlocking 45.6 — 83.3 4.8 (0.5) 133.2 — — 133.2 Net gain from Lehman Recovery/LIHTC 12.9 13.2 13.5 39.7 4.3 83.6 — 3.4 87.0 Adjusted operating earnings before interest 537.3 164.9 197.0 210.3 102.3 1,211.8 — 16.3 1,228.1 Income tax expense 188.1 57.7 69.0 73.6 35.8 424.2 — 5.7 429.9
Adjusted operating earnings before interest and after income taxes 349.2 107.2 128.0 136.7 66.5 787.6 — 10.6 798.2
Average Capital 3,915 303 1,762 2,804 354 9,137 3,235 2,104 14,476
Adjusted Operating Return on Capital 8.9% 35.4% 7.3% 4.9% 18.8% 8.6% N/M N/M 5.5% Twelve Months Ended December 31, 2012
Closed Corporate Block and Other (in millions USD, unless otherwise indicated) Investment Individual Employee Ongoing Variable Closed
Retirement Management Annuities Life Benefits Business Annuity Blocks Consolidated
Operating earnings before income taxes 448.6 134.5 102.2 196.2 109.4 990.9 — (72.6) 918.3 Less: Interest expense — — — — — — — (127.8) (127.8) DAC/VOBA and other intangibles unlocking 5.8 — (86.2) 3.4 — (77.0) — — (77.0) Impact of investment portfolio restructuring (31.2) 2.2 (11.2) 14.8 0.1 (25.3) — (5.8) (31.1) Adjusted operating earnings before interest 474.0 132.3 199.6 178.0 109.3 1,093.2 — 61.0 1,154.2 Income tax expense 165.9 46.3 69.9 62.3 38.3 382.7 — 21.4 404.1
Adjusted operating earnings before interest and after income taxes 308.1 86.0 129.7 115.7 71.0 710.5 — 39.6 750.1
Average Capital 4,308 289 2,210 2,702 421 9,930 3,394 587 13,911
Adjusted Operating Return on Capital 7.2% 29.8% 5.9% 4.3% 16.9% 7.2% N/M N/M 5.4%
Page 72 of 84

Voya Financial
Reconciliation of Ongoing Business Adjusted Return On Equity and Capital
Twelve Months Ended
9/30/2016 6/30/2016 3/31/2016 12/31/2015 9/30/2015 12/31/2014 12/31/2013 12/31/2012
GAAP Return on Equity 0.0 % 2.0 % 2.8 % 2.7 % 12.3 % 15.8 % 4.4 % 3.7 %
Effect of Adjustments to Ongoing Business Adjusted Operating Earnings After Income Tax and Ongoing Business Equity and Capital:
Exclusion of AOCI 2.1 % 1.7 % 1.7 % 2.0 % 2.2 % 2.3 % 2.1 % 2.0 %
DAC/VOBA and Other Intangible Unlocking Excluded from
Ongoing Business Adjusted Operating Earnings 0.6 % 0.3 % 0.5 % 0.4 % 0.6 % 0.1 % (1.0)% 0.6 % Other Adjustments to Ongoing Business adjusted Operating Earnings — — — — (0.1)% (0.1)% (0.6)% 0.2 % Exclusion of Corporate and Closed Block Other Operating Earnings Before Income Taxes and Allocated Capital 2.6 % 2.4 % 2.2 % 2.2 % 2.1 % 2.0 % 0.8 % (0.1)% Exclusion of Capital Allocated to Deferred Tax Assets 1.7 % 1.7 % 1.7 % 1.7 % 1.5 % 0.2 % — —Effect of Calculated Interest Expense and Assumed 25% Debt-to-Capital Ratio (vs actual) (0.6)% (0.5)% (0.5)% (0.6)% (0.5)% (0.5)% (0.6)% (1.0)%
Exclusion of Closed Block Variable Annuity Result and
Allocated Capital 6.4 % 4.0 % 3.0 % 3.4 % 3.4 % 4.3 % 12.0 % 7.3 % Exclusion of Net Investment Gains and Losses 1.5 % 1.5 % 1.3 % 0.6 % (0.1)% (1.5)% (1.6)% (3.5)% Exclusion of Net Guaranteed Benefit Hedging Gains and Losses (0.1)% (0.3)% (0.3)% 0.6 % 0.6 % 0.1 % (0.1)% (0.7)% Exclusion of Income (Loss) Related to Business Exited Through Reinsurance or Divestment 0.7 % 0.8 % 1.1 % 1.1 % 1.0 % 1.1 % 0.4 % —Exclusion of Loss Related to Early Extinguishment of Debt 0.7 % 0.7 % 0.1 % 0.1 % 0.1 % — — —Exclusion of Immediate Recognition of Net Actuarial Gains (Losses) Related to Pension and Other Postretirement Benefit Obligations and Gains (Losses) from Plan Amendments and Curtailments (0.4)% (0.4)% (0.4)% (0.4)% 2.4 % 2.6 % (3.0)% 1.3 % Effect of Other Adjustments to Operating Earnings 0.3 % 0.4 % 0.3 % 0.5 % 0.3 % 0.6 % 0.5 % 1.1 %
Effect of Assumed Tax Rate vs actual effective tax rate 2.6 % (4.1)% (1.7)% (1.9)% 16.4 % (21.3)% (3.1)% (2.6)% Other Income Tax Effects (6.0)% 1.3 % (0.4)% (0.3)% (29.9)% 6.4 % 0.1 % — %
Ongoing Business Adjusted Operating Return on Equity 12.1 % 11.5 % 11.4 % 12.1 % 12.3 % 12.1 % 10.3 % 8.3 %
Inclusion of debt (based on 25% debt to capital ratio) (3.0)% (2.8)% (2.8)% (3.0)% (3.0)% (3.1)% (2.6)% (2.0)% Exclusion of assumed interest expense 0.9 % 0.9 % 0.9 % 0.9 % 0.9 % 0.9 % 0.9 % 0.9 %
Ongoing Business Adjusted Operating Return on
Capital 10.0 % 9.6 % 9.5 % 10.0 % 10.2 % 9.9 % 8.6 % 7.2 %
Page 73 of 84
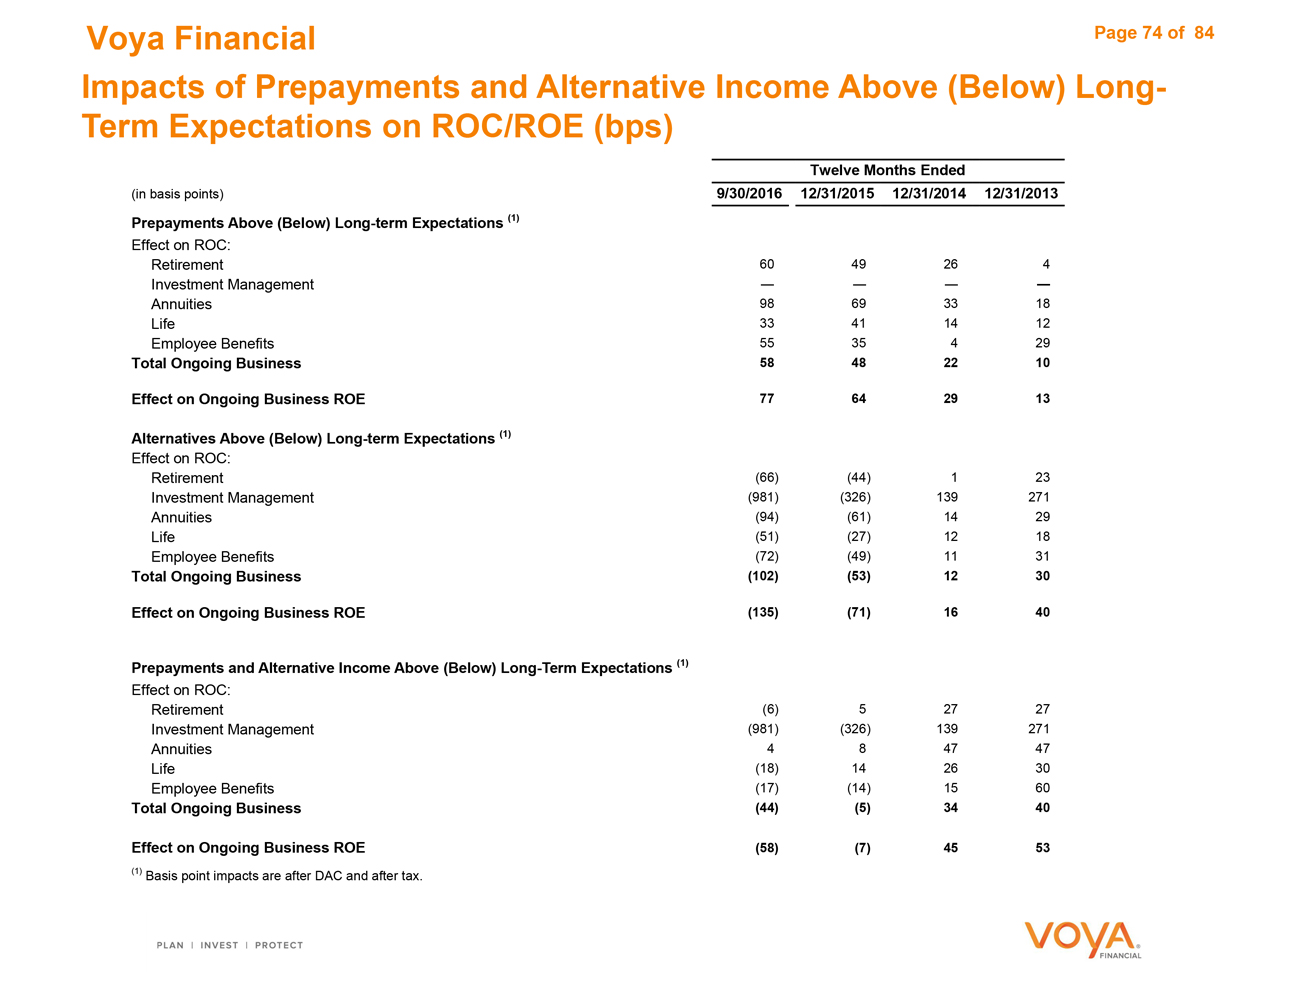
Voya Financial
Impacts of Prepayments and Alternative Income Above (Below) Long-Term Expectations on ROC/ROE (bps)
Twelve Months Ended
(in basis points) 9/30/2016 12/31/2015 12/31/2014 12/31/2013 Prepayments Above (Below) Long-term Expectations (1)
Effect on ROC:
Retirement 60 49 26 4 Investment Management — — — —Annuities 98 69 33 18
Life 33 41 14 12
Employee Benefits 55 35 4 29
Total Ongoing Business 58 48 22 10
Effect on Ongoing Business ROE 77 64 29 13
Alternatives Above (Below) Long-term Expectations (1)
Effect on ROC:
Retirement (66) (44) 1 23
Investment Management (981) (326) 139 271
Annuities (94) (61) 14 29 Life (51) (27) 12 18
Employee Benefits (72) (49) 11 31
Total Ongoing Business (102) (53) 12 30
Effect on Ongoing Business ROE (135) (71) 16 40
Prepayments and Alternative Income Above (Below) Long-Term Expectations (1)
Effect on ROC:
Retirement (6) 5 27 27 Investment Management (981) (326) 139 271 Annuities 4 8 47 47
Life (18) 14 26 30
Employee Benefits (17) (14) 15 60
Total Ongoing Business (44) (5) 34 40
Effect on Ongoing Business ROE (58) (7) 45 53
(1) Basis point impacts are after DAC and after tax.
Page 74 of 84
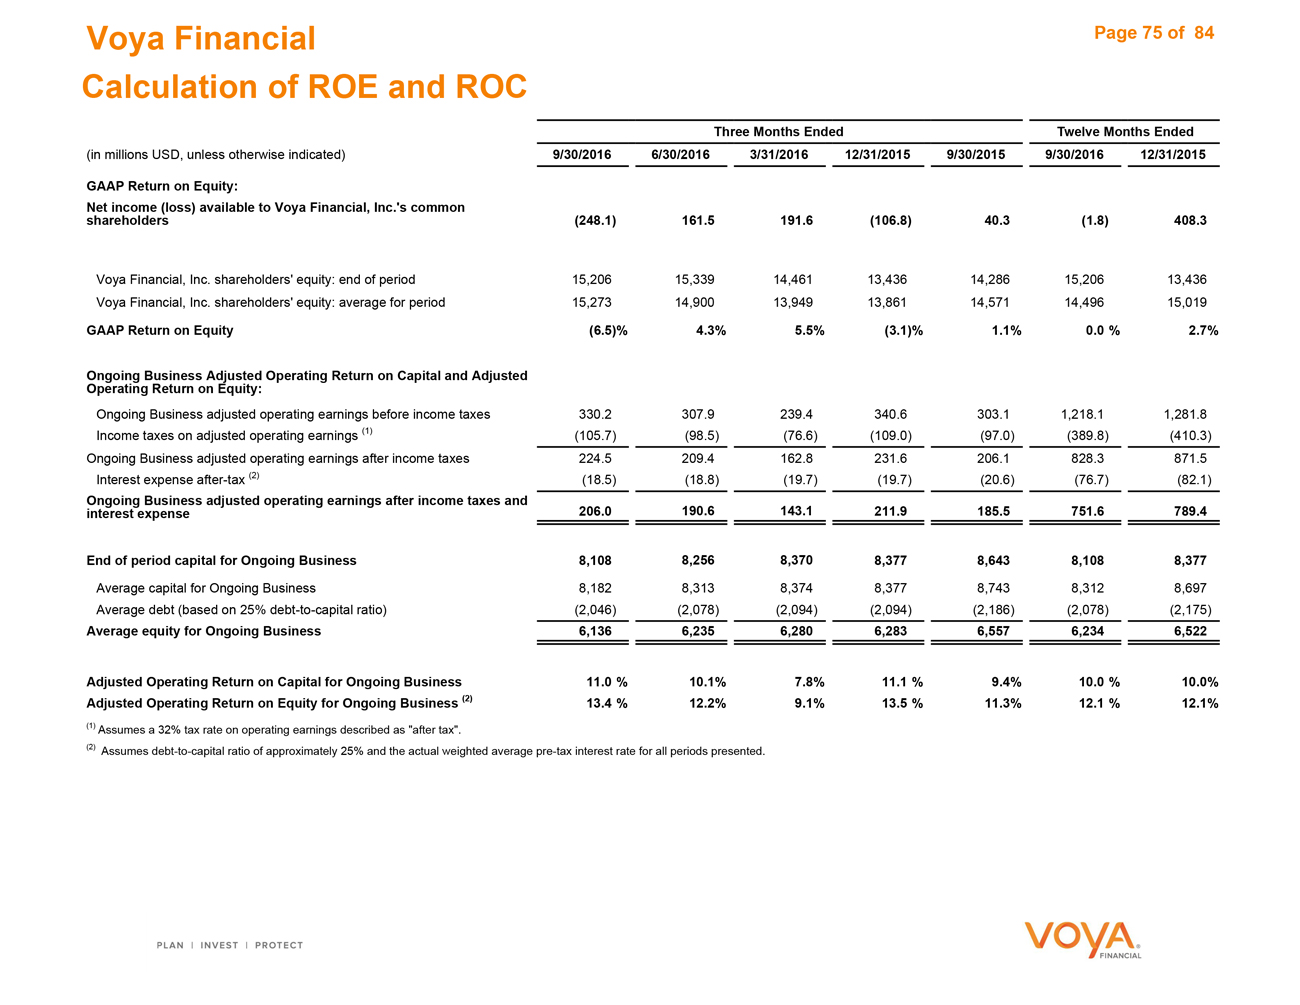
Voya Financial
Calculation of ROE and ROC
Three Months Ended Twelve Months Ended (in millions USD, unless otherwise indicated) 9/30/2016 6/30/2016 3/31/2016 12/31/2015 9/30/2015 9/30/2016 12/31/2015
GAAP Return on Equity:
Net income (loss) available to Voya Financial, Inc.‘s common shareholders (248.1) 161.5 191.6 (106.8) 40.3 (1.8) 408.3
Voya Financial, Inc. shareholders’ equity: end of period 15,206 15,339 14,461 13,436 14,286 15,206 13,436 Voya Financial, Inc. shareholders’ equity: average for period 15,273 14,900 13,949 13,861 14,571 14,496 15,019
GAAP Return on Equity (6.5)% 4.3% 5.5% (3.1)% 1.1% 0.0 % 2.7%
Ongoing Business Adjusted Operating Return on Capital and Adjusted Operating Return on Equity:
Ongoing Business adjusted operating earnings before income taxes 330.2 307.9 239.4 340.6 303.1 1,218.1 1,281.8 Income taxes on adjusted operating earnings (1) (105.7) (98.5) (76.6) (109.0) (97.0) (389.8) (410.3) Ongoing Business adjusted operating earnings after income taxes 224.5 209.4 162.8 231.6 206.1 828.3 871.5 Interest expense after-tax (2) (18.5) (18.8) (19.7) (19.7) (20.6) (76.7) (82.1)
Ongoing Business adjusted operating earnings after income taxes and interest expense 206.0 190.6 143.1 211.9 185.5 751.6 789.4
End of period capital for Ongoing Business 8,108 8,256 8,370 8,377 8,643 8,108 8,377
Average capital for Ongoing Business 8,182 8,313 8,374 8,377 8,743 8,312 8,697 Average debt (based on 25% debt-to-capital ratio) (2,046) (2,078) (2,094) (2,094) (2,186) (2,078) (2,175)
Average equity for Ongoing Business 6,136 6,235 6,280 6,283 6,557 6,234 6,522
Adjusted Operating Return on Capital for Ongoing Business 11.0 % 10.1% 7.8% 11.1 % 9.4% 10.0 % 10.0% Adjusted Operating Return on Equity for Ongoing Business (2) 13.4 % 12.2% 9.1% 13.5 % 11.3% 12.1 % 12.1%
(1) Assumes a 32% tax rate on operating earnings described as “after tax”.
(2) Assumes debt-to-capital ratio of approximately 25% and the actual weighted average pre-tax interest rate for all periods presented.
Page 75 of 84
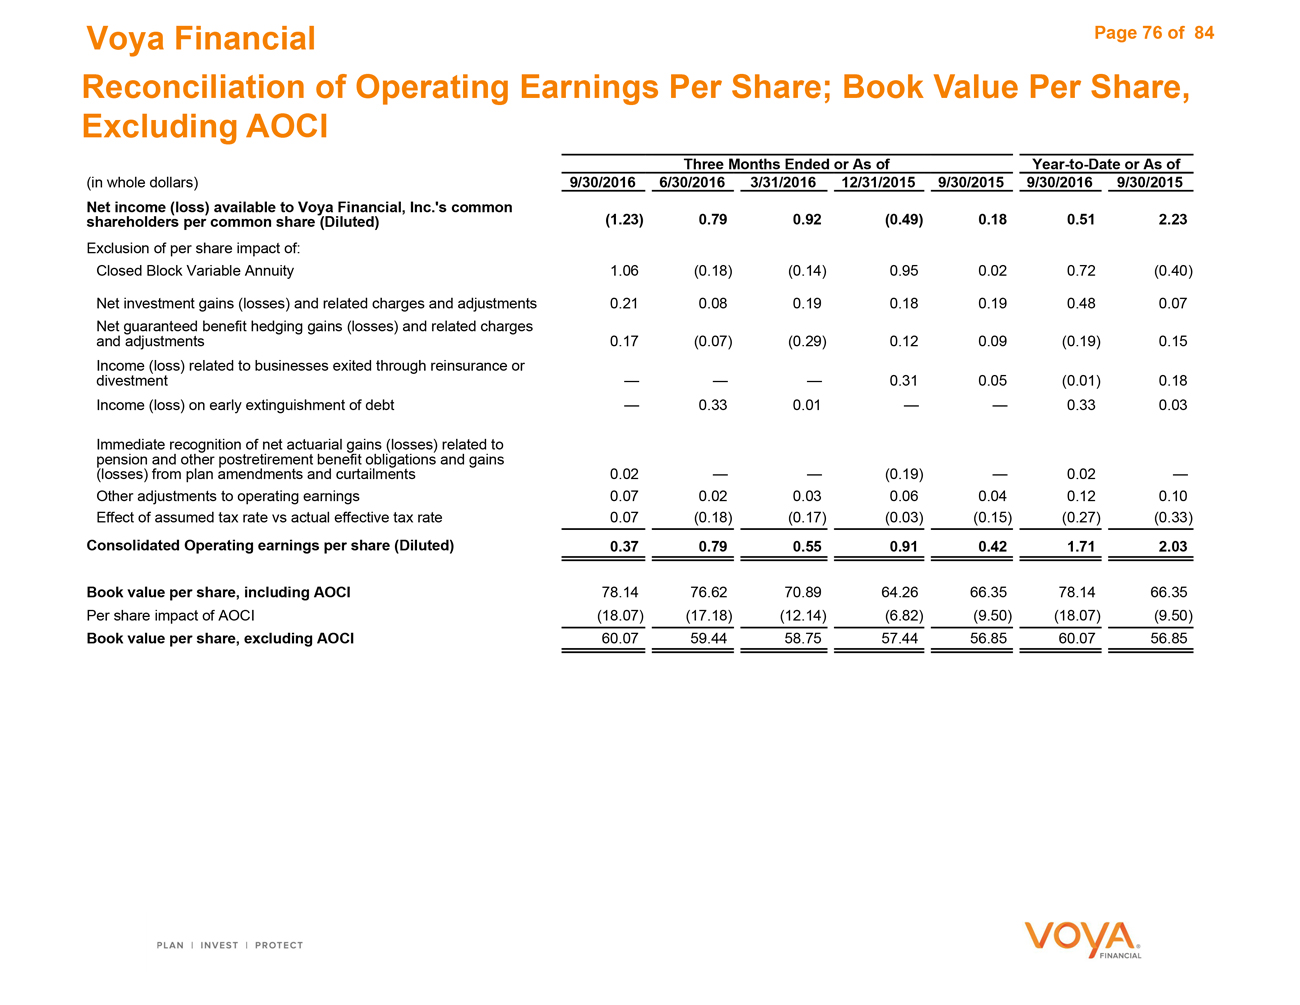
Voya Financial
Reconciliation of Operating Earnings Per Share; Book Value Per Share, Excluding AOCI
Three Months Ended or As of Year-to-Date or As of (in whole dollars) 9/30/2016 6/30/2016 3/31/2016 12/31/2015 9/30/2015 9/30/2016 9/30/2015 Net income (loss) available to Voya Financial, Inc.‘s common shareholders per common share (Diluted) (1.23) 0.79 0.92 (0.49) 0.18 0.51 2.23
Exclusion of per share impact of:
Closed Block Variable Annuity 1.06 (0.18) (0.14) 0.95 0.02 0.72 (0.40)
Net investment gains (losses) and related charges and adjustments 0.21 0.08 0.19 0.18 0.19 0.48 0.07 Net guaranteed benefit hedging gains (losses) and related charges and adjustments 0.17 (0.07) (0.29) 0.12 0.09 (0.19) 0.15 Income (loss) related to businesses exited through reinsurance or divestment — — — 0.31 0.05 (0.01) 0.18 Income (loss) on early extinguishment of debt — 0.33 0.01 — — 0.33 0.03
Immediate recognition of net actuarial gains (losses) related to pension and other postretirement benefit obligations and gains
(losses) from plan amendments and curtailments 0.02 — — (0.19) — 0.02 —Other adjustments to operating earnings 0.07 0.02 0.03 0.06 0.04 0.12 0.10 Effect of assumed tax rate vs actual effective tax rate 0.07 (0.18) (0.17) (0.03) (0.15) (0.27) (0.33)
Consolidated Operating earnings per share (Diluted) 0.37 0.79 0.55 0.91 0.42 1.71 2.03
Book value per share, including AOCI 78.14 76.62 70.89 64.26 66.35 78.14 66.35 Per share impact of AOCI (18.07) (17.18) (12.14) (6.82) (9.50) (18.07) (9.50)
Book value per share, excluding AOCI 60.07 59.44 58.75 57.44 56.85 60.07 56.85
Page 76 of 84
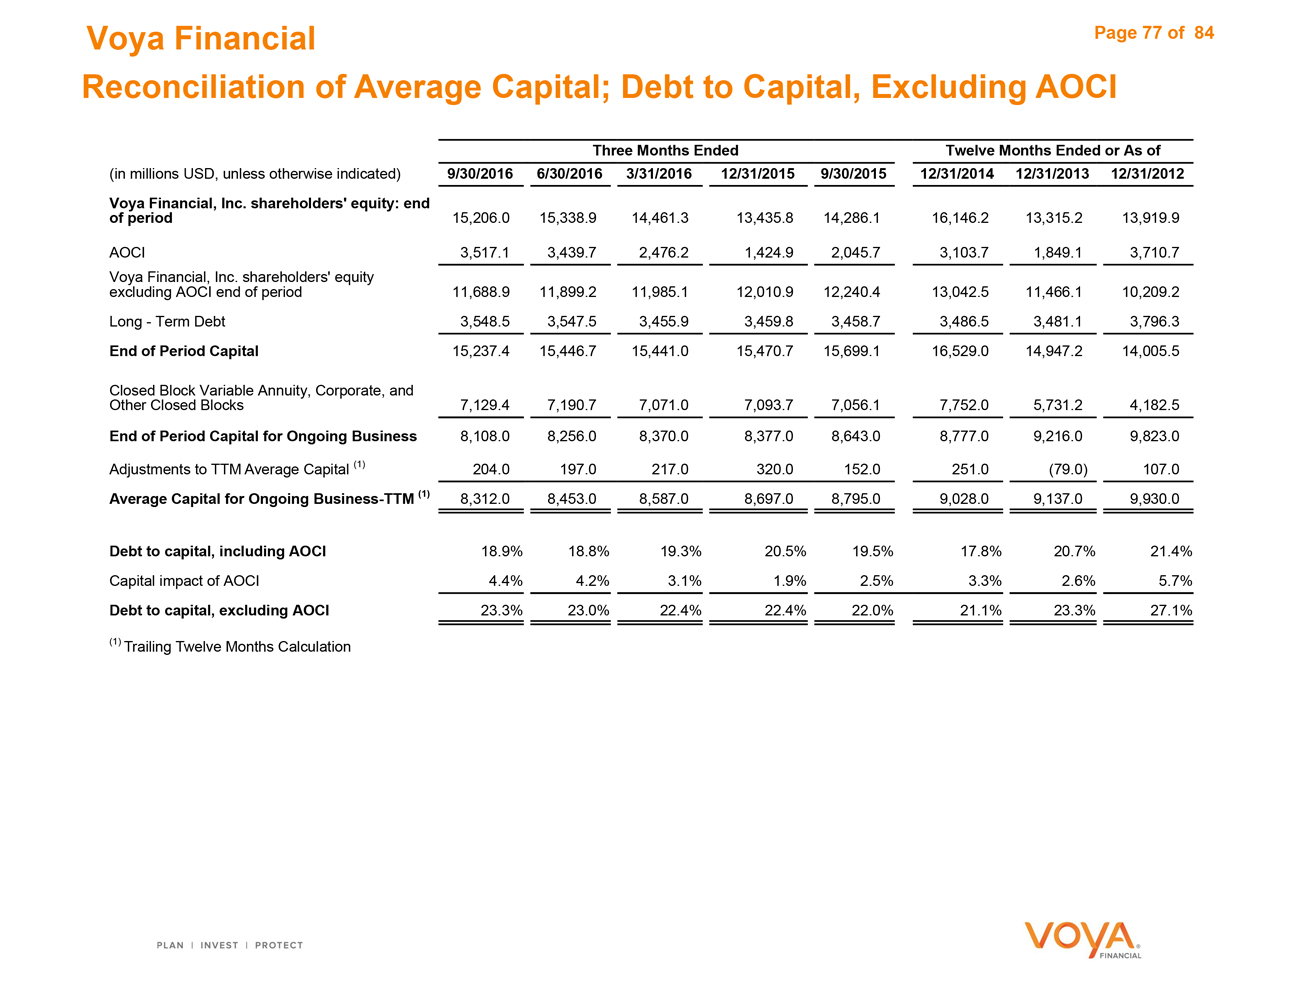
Voya Financial
Reconciliation of Average Capital; Debt to Capital, Excluding AOCI
Three Months Ended Twelve Months Ended or As of (in millions USD, unless otherwise indicated) 9/30/2016 6/30/2016 3/31/2016 12/31/2015 9/30/2015 12/31/2014 12/31/2013 12/31/2012 Voya Financial, Inc. shareholders’ equity: end of period 15,206.0 15,338.9 14,461.3 13,435.8 14,286.1 16,146.2 13,315.2 13,919.9
AOCI 3,517.1 3,439.7 2,476.2 1,424.9 2,045.7 3,103.7 1,849.1 3,710.7 Voya Financial, Inc. shareholders’ equity excluding AOCI end of period 11,688.9 11,899.2 11,985.1 12,010.9 12,240.4 13,042.5 11,466.1 10,209.2 Long—Term Debt 3,548.5 3,547.5 3,455.9 3,459.8 3,458.7 3,486.5 3,481.1 3,796.3 End of Period Capital 15,237.4 15,446.7 15,441.0 15,470.7 15,699.1 16,529.0 14,947.2 14,005.5
Closed Block Variable Annuity, Corporate, and
Other Closed Blocks 7,129.4 7,190.7 7,071.0 7,093.7 7,056.1 7,752.0 5,731.2 4,182.5
End of Period Capital for Ongoing Business 8,108.0 8,256.0 8,370.0 8,377.0 8,643.0 8,777.0 9,216.0 9,823.0
Adjustments to TTM Average Capital (1) 204.0 197.0 217.0 320.0 152.0 251.0 (79.0) 107.0 Average Capital for Ongoing Business-TTM (1) 8,312.0 8,453.0 8,587.0 8,697.0 8,795.0 9,028.0 9,137.0 9,930.0
Debt to capital, including AOCI 18.9% 18.8% 19.3% 20.5% 19.5% 17.8% 20.7% 21.4% Capital impact of AOCI 4.4% 4.2% 3.1% 1.9% 2.5% 3.3% 2.6% 5.7% Debt to capital, excluding AOCI 23.3% 23.0% 22.4% 22.4% 22.0% 21.1% 23.3% 27.1%
(1) Trailing Twelve Months Calculation
Page 77 of 84
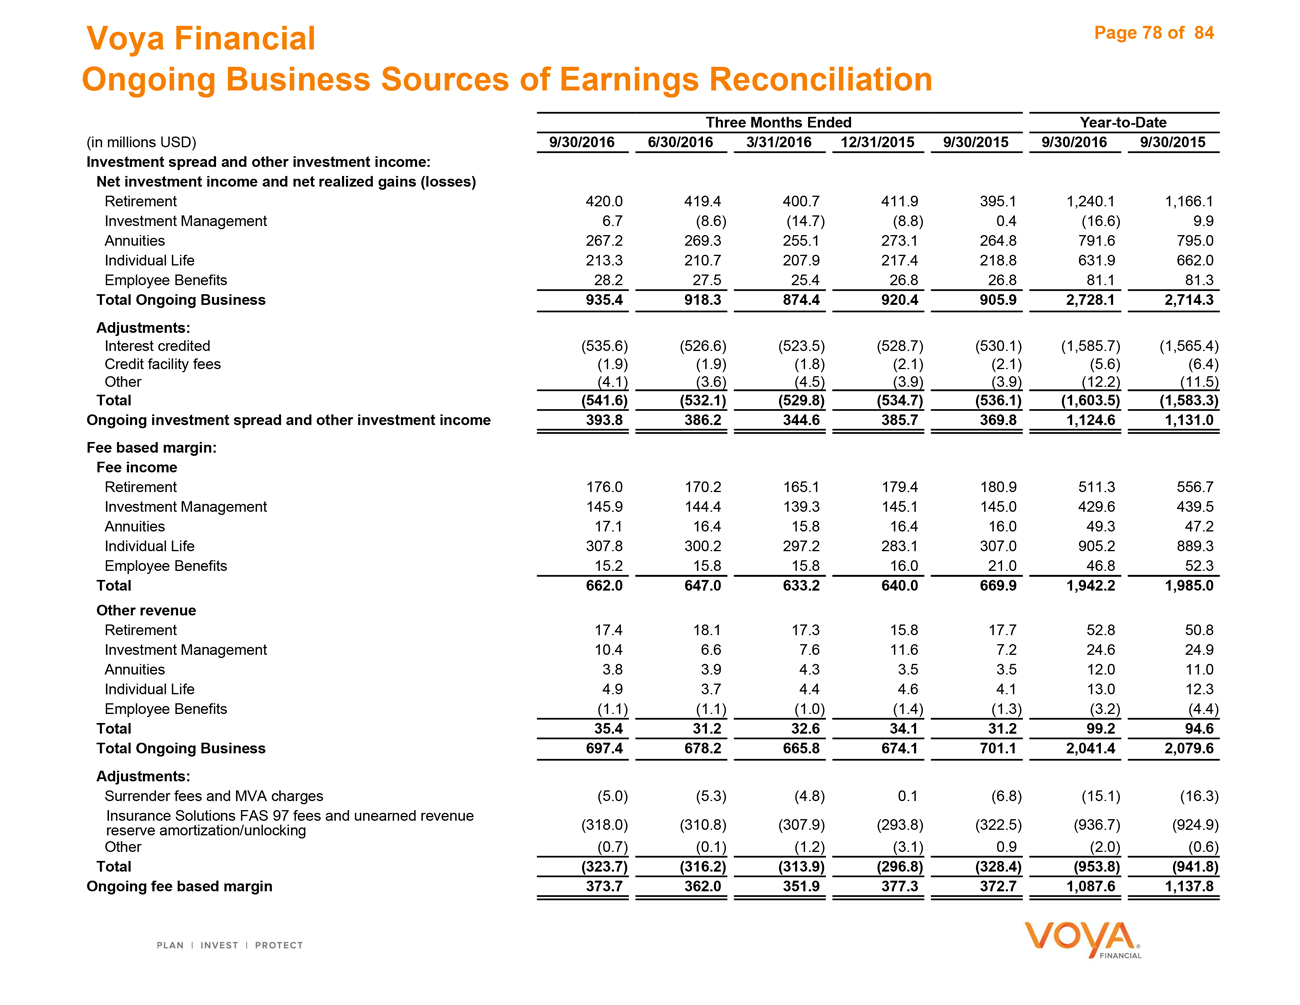
Voya Financial
Ongoing Business Sources of Earnings Reconciliation
Three Months Ended Year-to-Date (in millions USD) 9/30/2016 6/30/2016 3/31/2016 12/31/2015 9/30/2015 9/30/2016 9/30/2015 Investment spread and other investment income: Net investment income and net realized gains (losses)
Retirement 420.0 419.4 400.7 411.9 395.1 1,240.1 1,166.1 Investment Management 6.7 (8.6) (14.7) (8.8) 0.4 (16.6) 9.9 Annuities 267.2 269.3 255.1 273.1 264.8 791.6 795.0 Individual Life 213.3 210.7 207.9 217.4 218.8 631.9 662.0 Employee Benefits 28.2 27.5 25.4 26.8 26.8 81.1 81.3
Total Ongoing Business 935.4 918.3 874.4 920.4 905.9 2,728.1 2,714.3 Adjustments:
Interest credited (535.6) (526.6) (523.5) (528.7) (530.1) (1,585.7) (1,565.4) Credit facility fees (1.9) (1.9) (1.8) (2.1) (2.1) (5.6) (6.4) Other (4.1) (3.6) (4.5) (3.9) (3.9) (12.2) (11.5)
Total (541.6) (532.1) (529.8) (534.7) (536.1) (1,603.5) (1,583.3) Ongoing investment spread and other investment income 393.8 386.2 344.6 385.7 369.8 1,124.6 1,131.0 Fee based margin: Fee income
Retirement 176.0 170.2 165.1 179.4 180.9 511.3 556.7 Investment Management 145.9 144.4 139.3 145.1 145.0 429.6 439.5 Annuities 17.1 16.4 15.8 16.4 16.0 49.3 47.2 Individual Life 307.8 300.2 297.2 283.1 307.0 905.2 889.3 Employee Benefits 15.2 15.8 15.8 16.0 21.0 46.8 52.3
Total 662.0 647.0 633.2 640.0 669.9 1,942.2 1,985.0 Other revenue
Retirement 17.4 18.1 17.3 15.8 17.7 52.8 50.8 Investment Management 10.4 6.6 7.6 11.6 7.2 24.6 24.9 Annuities 3.8 3.9 4.3 3.5 3.5 12.0 11.0 Individual Life 4.9 3.7 4.4 4.6 4.1 13.0 12.3 Employee Benefits (1.1) (1.1) (1.0) (1.4) (1.3) (3.2) (4.4)
Total 35.4 31.2 32.6 34.1 31.2 99.2 94.6 Total Ongoing Business 697.4 678.2 665.8 674.1 701.1 2,041.4 2,079.6 Adjustments:
Surrender fees and MVA charges (5.0) (5.3) (4.8) 0.1 (6.8) (15.1) (16.3) Insurance Solutions FAS 97 fees and unearned revenue reserve amortization/unlocking (318.0) (310.8) (307.9) (293.8) (322.5) (936.7) (924.9) Other (0.7) (0.1) (1.2) (3.1) 0.9 (2.0) (0.6)
Total (323.7) (316.2) (313.9) (296.8) (328.4) (953.8) (941.8) Ongoing fee based margin 373.7 362.0 351.9 377.3 372.7 1,087.6 1,137.8
Page 78 of 84
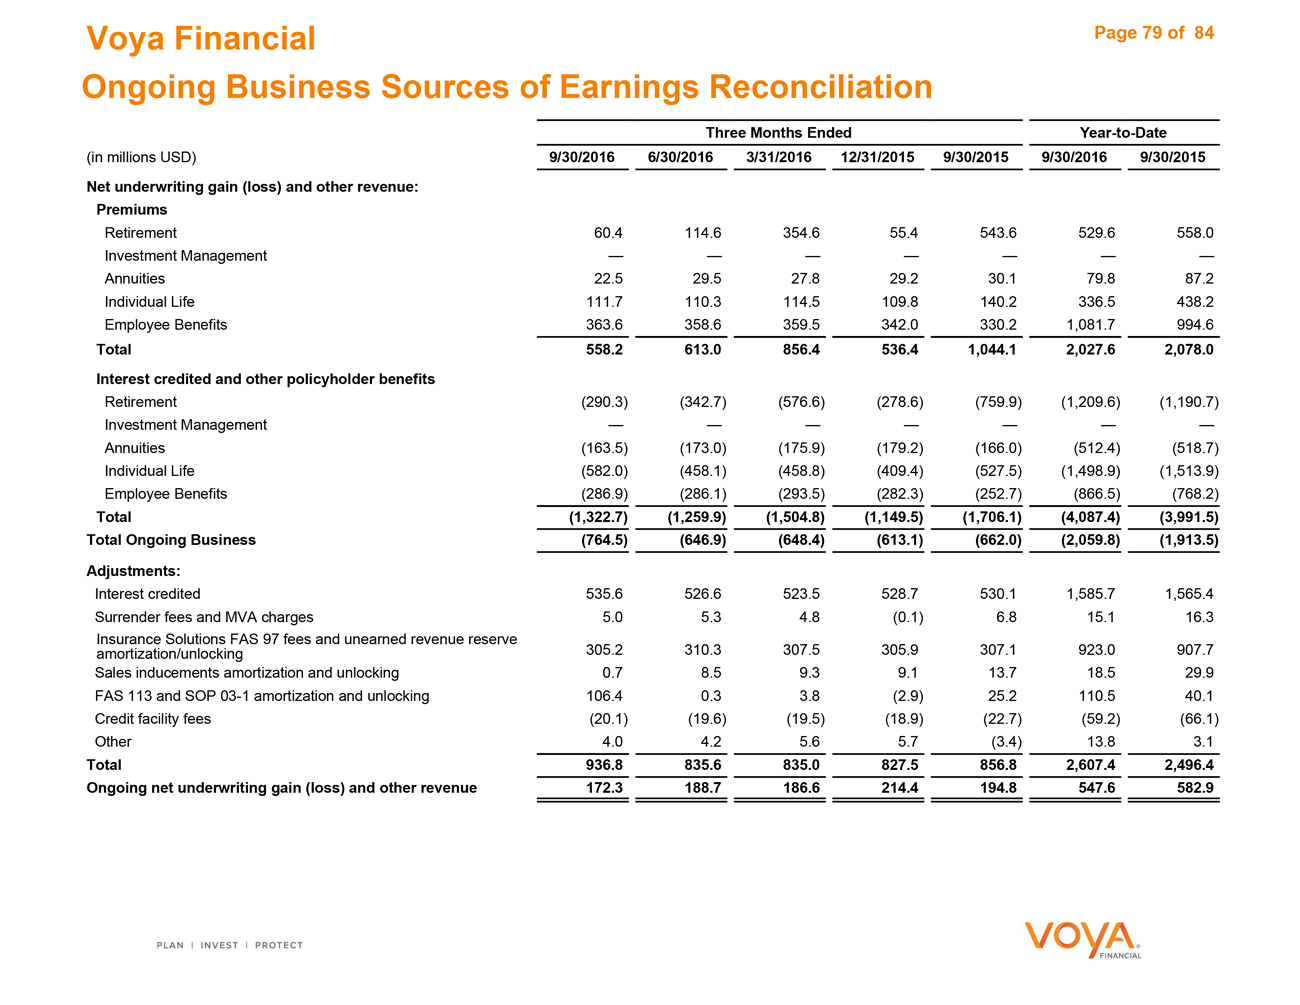
Voya Financial
Ongoing Business Sources of Earnings Reconciliation
Three Months Ended Year-to-Date (in millions USD) 9/30/2016 6/30/2016 3/31/2016 12/31/2015 9/30/2015 9/30/2016 9/30/2015 Net underwriting gain (loss) and other revenue: Premiums
Retirement 60.4 114.6 354.6 55.4 543.6 529.6 558.0 Investment Management — — — — — — — Annuities 22.5 29.5 27.8 29.2 30.1 79.8 87.2 Individual Life 111.7 110.3 114.5 109.8 140.2 336.5 438.2 Employee Benefits 363.6 358.6 359.5 342.0 330.2 1,081.7 994.6
Total 558.2 613.0 856.4 536.4 1,044.1 2,027.6 2,078.0 Interest credited and other policyholder benefits
Retirement (290.3) (342.7) (576.6) (278.6) (759.9) (1,209.6) (1,190.7) Investment Management — — — — — — — Annuities (163.5) (173.0) (175.9) (179.2) (166.0) (512.4) (518.7) Individual Life (582.0) (458.1) (458.8) (409.4) (527.5) (1,498.9) (1,513.9) Employee Benefits (286.9) (286.1) (293.5) (282.3) (252.7) (866.5) (768.2)
Total (1,322.7) (1,259.9) (1,504.8) (1,149.5) (1,706.1) (4,087.4) (3,991.5) Total Ongoing Business (764.5) (646.9) (648.4) (613.1) (662.0) (2,059.8) (1,913.5)
Adjustments:
Interest credited 535.6 526.6 523.5 528.7 530.1 1,585.7 1,565.4 Surrender fees and MVA charges 5.0 5.3 4.8 (0.1) 6.8 15.1 16.3 Insurance Solutions FAS 97 fees and unearned revenue reserve amortization/unlocking 305.2 310.3 307.5 305.9 307.1 923.0 907.7 Sales inducements amortization and unlocking 0.7 8.5 9.3 9.1 13.7 18.5 29.9 FAS 113 and SOP 03-1 amortization and unlocking 106.4 0.3 3.8 (2.9) 25.2 110.5 40.1 Credit facility fees (20.1) (19.6) (19.5) (18.9) (22.7) (59.2) (66.1) Other 4.0 4.2 5.6 5.7 (3.4) 13.8 3.1
Total 936.8 835.6 835.0 827.5 856.8 2,607.4 2,496.4 Ongoing net underwriting gain (loss) and other revenue 172.3 188.7 186.6 214.4 194.8 547.6 582.9
Page 79 of 84
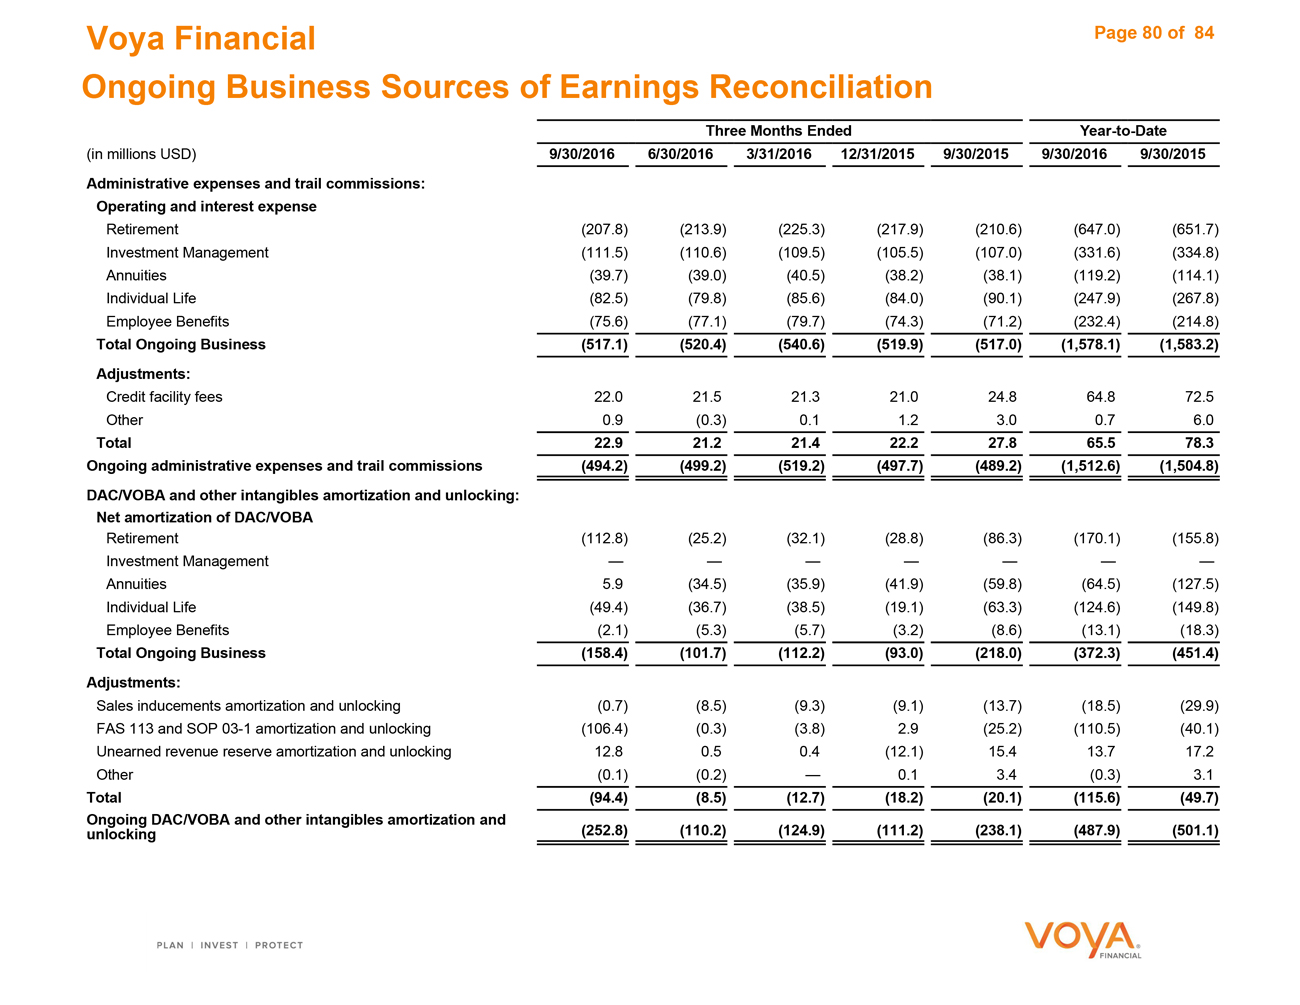
Voya Financial
Ongoing Business Sources of Earnings Reconciliation
Three Months Ended Year-to-Date (in millions USD) 9/30/2016 6/30/2016 3/31/2016 12/31/2015 9/30/2015 9/30/2016 9/30/2015 Administrative expenses and trail commissions: Operating and interest expense
Retirement (207.8) (213.9) (225.3) (217.9) (210.6) (647.0) (651.7) Investment Management (111.5) (110.6) (109.5) (105.5) (107.0) (331.6) (334.8) Annuities (39.7) (39.0) (40.5) (38.2) (38.1) (119.2) (114.1) Individual Life (82.5) (79.8) (85.6) (84.0) (90.1) (247.9) (267.8) Employee Benefits (75.6) (77.1) (79.7) (74.3) (71.2) (232.4) (214.8)
Total Ongoing Business (517.1) (520.4) (540.6) (519.9) (517.0) (1,578.1) (1,583.2) Adjustments:
Credit facility fees 22.0 21.5 21.3 21.0 24.8 64.8 72.5 Other 0.9 (0.3) 0.1 1.2 3.0 0.7 6.0
Total 22.9 21.2 21.4 22.2 27.8 65.5 78.3 Ongoing administrative expenses and trail commissions (494.2) (499.2) (519.2) (497.7) (489.2) (1,512.6) (1,504.8) DAC/VOBA and other intangibles amortization and unlocking: Net amortization of DAC/VOBA
Retirement (112.8) (25.2) (32.1) (28.8) (86.3) (170.1) (155.8) Investment Management — — — — — — —Annuities 5.9 (34.5) (35.9) (41.9) (59.8) (64.5) (127.5) Individual Life (49.4) (36.7) (38.5) (19.1) (63.3) (124.6) (149.8) Employee Benefits (2.1) (5.3) (5.7) (3.2) (8.6) (13.1) (18.3)
Total Ongoing Business (158.4) (101.7) (112.2) (93.0) (218.0) (372.3) (451.4) Adjustments:
Sales inducements amortization and unlocking (0.7) (8.5) (9.3) (9.1) (13.7) (18.5) (29.9) FAS 113 and SOP 03-1 amortization and unlocking (106.4) (0.3) (3.8) 2.9 (25.2) (110.5) (40.1) Unearned revenue reserve amortization and unlocking 12.8 0.5 0.4 (12.1) 15.4 13.7 17.2 Other (0.1) (0.2) — 0.1 3.4 (0.3) 3.1
Total (94.4) (8.5) (12.7) (18.2) (20.1) (115.6) (49.7) Ongoing DAC/VOBA and other intangibles amortization and unlocking (252.8) (110.2) (124.9) (111.2) (238.1) (487.9) (501.1)
Page 80 of 84
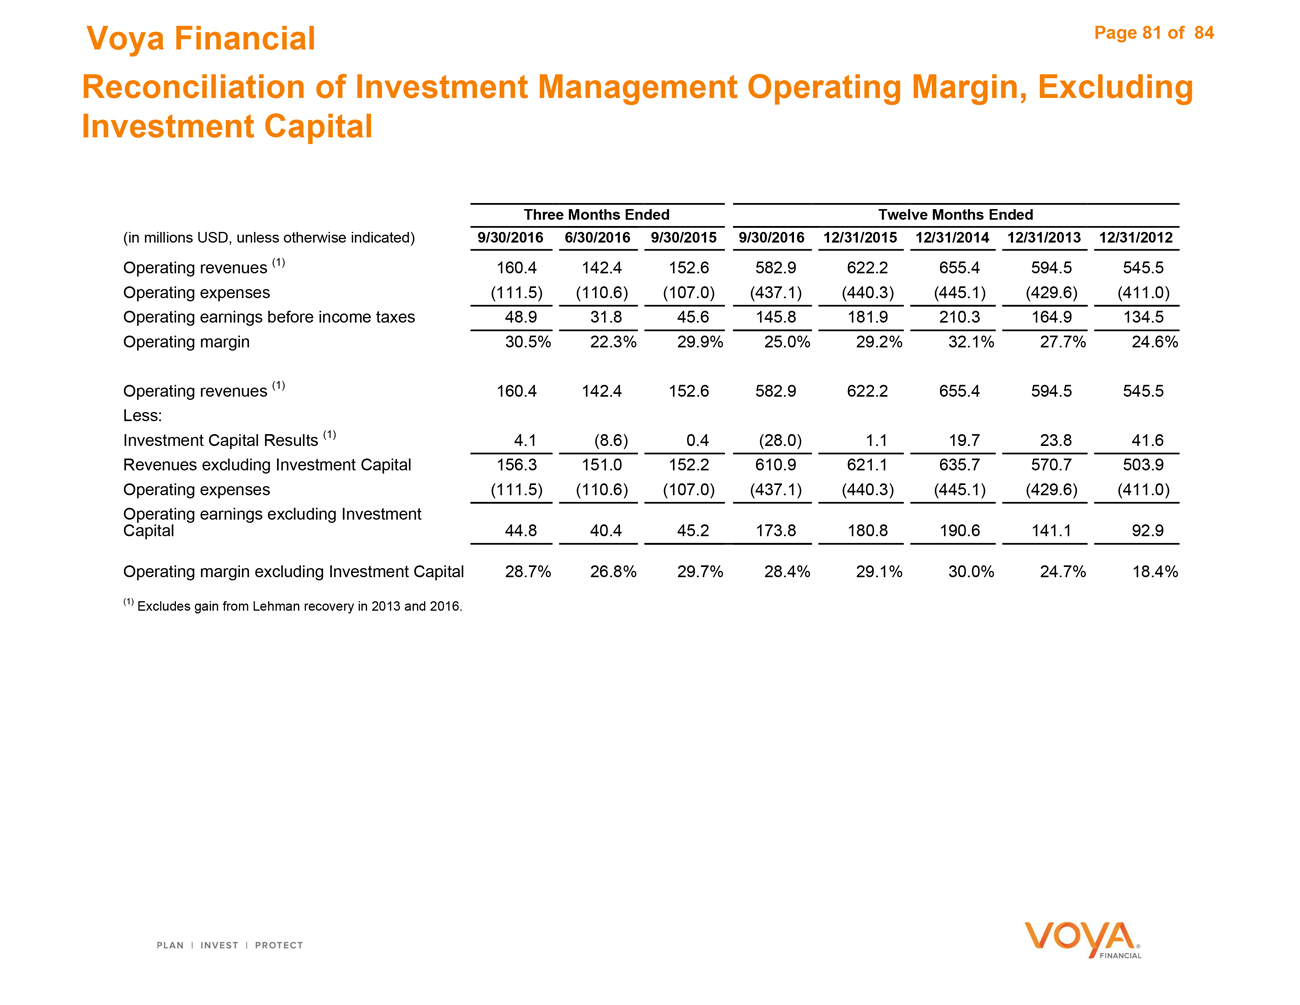
Voya Financial
Reconciliation of Investment Management Operating Margin, Excluding Investment Capital
Three Months Ended Twelve Months Ended
(in millions USD, unless otherwise indicated) 9/30/2016 6/30/2016 9/30/2015 9/30/2016 12/31/2015 12/31/2014 12/31/2013 12/31/2012
Operating revenues (1) 160.4 142.4 152.6 582.9 622.2 655.4 594.5 545.5 Operating expenses (111.5) (110.6) (107.0) (437.1) (440.3) (445.1) (429.6) (411.0) Operating earnings before income taxes 48.9 31.8 45.6 145.8 181.9 210.3 164.9 134.5 Operating margin 30.5% 22.3% 29.9% 25.0% 29.2% 32.1% 27.7% 24.6%
Operating revenues (1) 160.4 142.4 152.6 582.9 622.2 655.4 594.5 545.5 Less: Investment Capital Results (1) 4.1 (8.6) 0.4 (28.0) 1.1 19.7 23.8 41.6 Revenues excluding Investment Capital 156.3 151.0 152.2 610.9 621.1 635.7 570.7 503.9 Operating expenses (111.5) (110.6) (107.0) (437.1) (440.3) (445.1) (429.6) (411.0) Operating earnings excluding Investment Capital 44.8 40.4 45.2 173.8 180.8 190.6 141.1 92.9
Operating margin excluding Investment Capital 28.7% 26.8% 29.7% 28.4% 29.1% 30.0% 24.7% 18.4%
(1) Excludes gain from Lehman recovery in 2013 and 2016.
Page 81 of 84

Additional Information
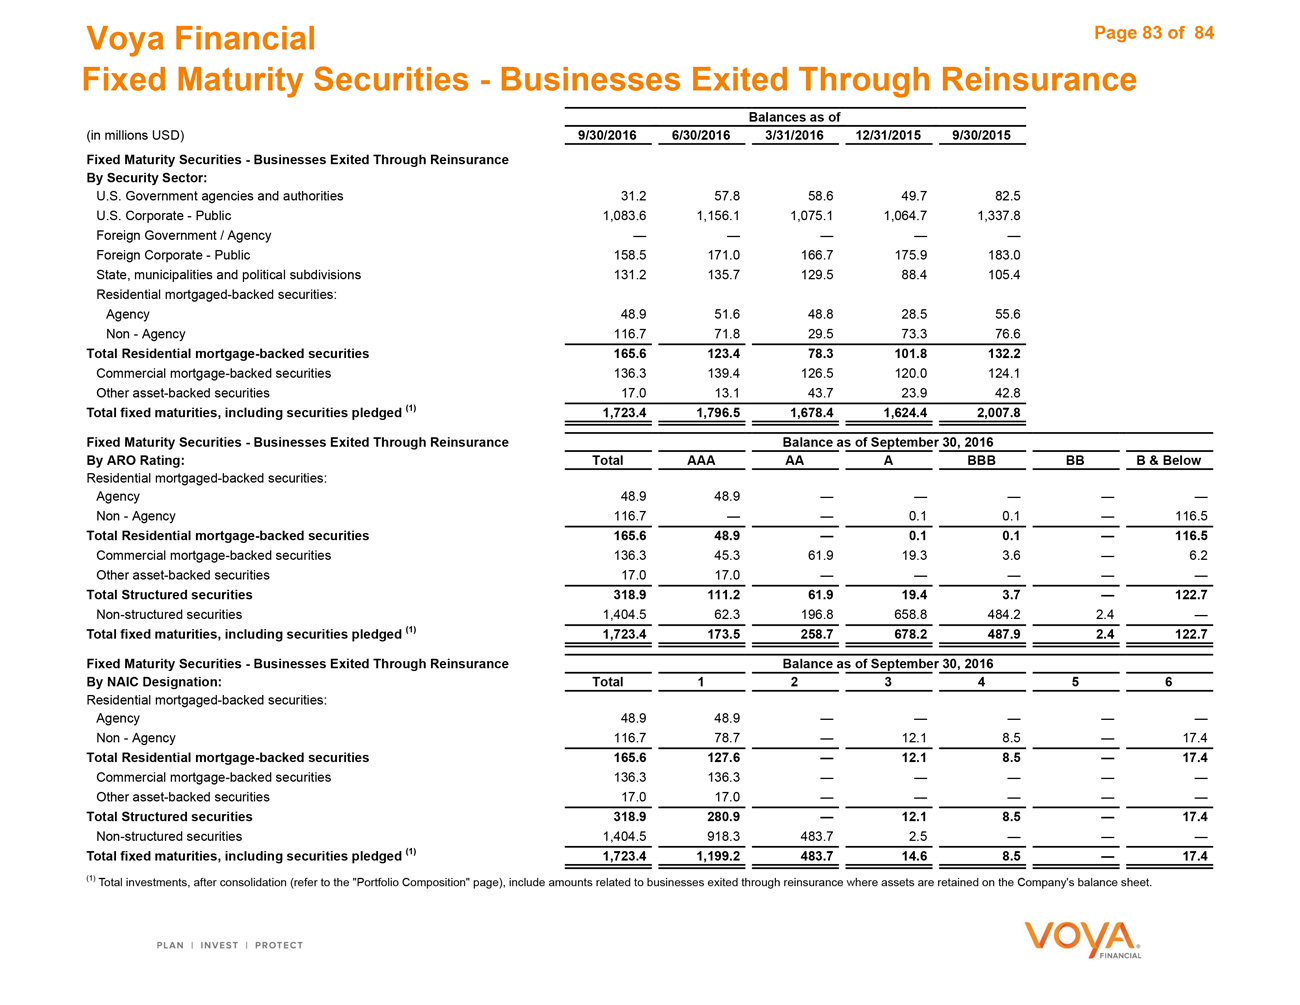
Voya Financial
Fixed Maturity Securities—Businesses Exited Through Reinsurance
Balances as of
(in millions USD) 9/30/2016 6/30/2016 3/31/2016 12/31/2015 9/30/2015 Fixed Maturity Securities—Businesses Exited Through Reinsurance By Security Sector:
U.S. Government agencies and authorities 31.2 57.8 58.6 49.7 82.5 U.S. Corporate—Public 1,083.6 1,156.1 1,075.1 1,064.7 1,337.8 Foreign Government / Agency — — — — —Foreign Corporate—Public 158.5 171.0 166.7 175.9 183.0 State, municipalities and political subdivisions 131.2 135.7 129.5 88.4 105.4 Residential mortgaged-backed securities: Agency 48.9 51.6 48.8 28.5 55.6 Non—Agency 116.7 71.8 29.5 73.3 76.6
Total Residential mortgage-backed securities 165.6 123.4 78.3 101.8 132.2
Commercial mortgage-backed securities 136.3 139.4 126.5 120.0 124.1 Other asset-backed securities 17.0 13.1 43.7 23.9 42.8
Total fixed maturities, including securities pledged (1) 1,723.4 1,796.5 1,678.4 1,624.4 2,007.8
Fixed Maturity Securities—Businesses Exited Through Reinsurance Balance as of September 30, 2016
By ARO Rating: Total AAA AA A BBB BB B & Below
Residential mortgaged-backed securities:
Agency 48.9 48.9 — — — — —Non—Agency 116.7 — — 0.1 0.1 — 116.5
Total Residential mortgage-backed securities 165.6 48.9 — 0.1 0.1 — 116.5
Commercial mortgage-backed securities 136.3 45.3 61.9 19.3 3.6 — 6.2 Other asset-backed securities 17.0 17.0 — — — — —
Total Structured securities 318.9 111.2 61.9 19.4 3.7 — 122.7
Non-structured securities 1,404.5 62.3 196.8 658.8 484.2 2.4 —
Total fixed maturities, including securities pledged (1) 1,723.4 173.5 258.7 678.2 487.9 2.4 122.7
Fixed Maturity Securities—Businesses Exited Through Reinsurance Balance as of September 30, 2016
By NAIC Designation: Total 1 2 3 4 5 6
Residential mortgaged-backed securities:
Agency 48.9 48.9 — — — — —Non—Agency 116.7 78.7 — 12.1 8.5 — 17.4
Total Residential mortgage-backed securities 165.6 127.6 — 12.1 8.5 — 17.4
Commercial mortgage-backed securities 136.3 136.3 — — — — —Other asset-backed securities 17.0 17.0 — — — — —
Total Structured securities 318.9 280.9 — 12.1 8.5 — 17.4
Non-structured securities 1,404.5 918.3 483.7 2.5 — — —
Total fixed maturities, including securities pledged (1) 1,723.4 1,199.2 483.7 14.6 8.5 — 17.4
(1) Total investments, after consolidation (refer to the “Portfolio Composition” page), include amounts related to businesses exited through reinsurance where assets are retained on the Company’s balance sheet.
Page 83 of 84
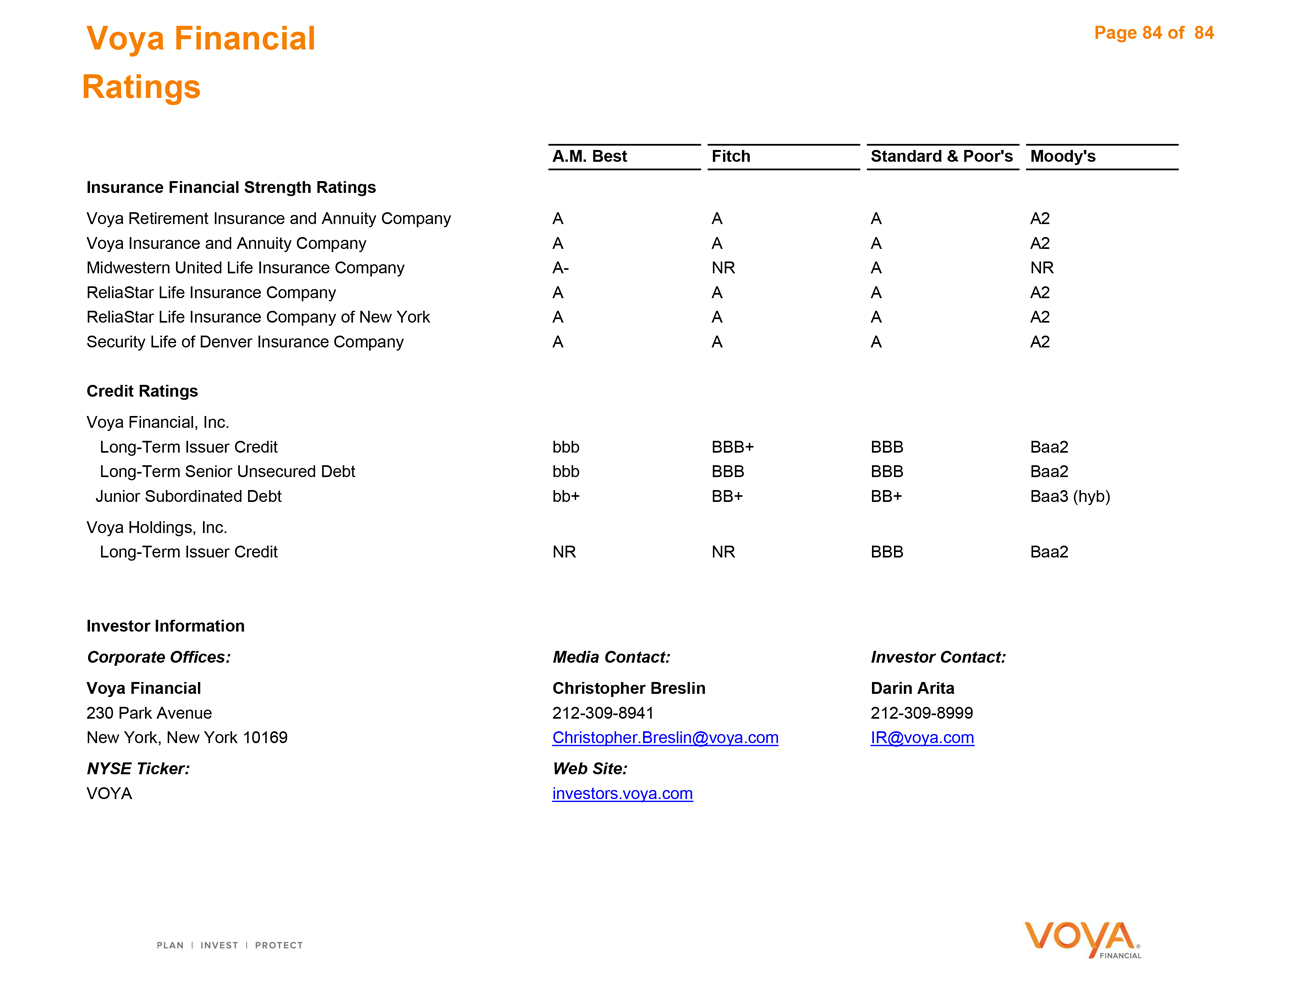
Voya Financial Ratings
A.M. Best Fitch Standard & Poor’s Moody’s Insurance Financial Strength Ratings
Voya Retirement Insurance and Annuity Company A A A A2 Voya Insurance and Annuity Company A A A A2 Midwestern United Life Insurance Company A- NR A NR ReliaStar Life Insurance Company A A A A2 ReliaStar Life Insurance Company of New York A A A A2 Security Life of Denver Insurance Company A A A A2
Credit Ratings
Voya Financial, Inc.
Long-Term Issuer Credit bbb BBB+ BBB Baa2 Long-Term Senior Unsecured Debt bbb BBB BBB Baa2 Junior Subordinated Debt bb+ BB+ BB+ Baa3 (hyb) Voya Holdings, Inc.
Long-Term Issuer Credit NR NR BBB Baa2
Investor Information
Corporate Offices: Media Contact: Investor Contact:
Voya Financial Christopher Breslin Darin Arita
230 Park Avenue 212-309-8941 212-309-8999 New York, New York 10169 [email protected] [email protected]
NYSE Ticker: Web Site:
VOYA investors.voya.com
Page 84 of 84