
Form 8-K Global Net Lease, Inc. For: Feb 26
UNITED STATES
SECURITIES AND EXCHANGE COMMISSION
WASHINGTON, D.C. 20549
FORM 8-K
CURRENT REPORT
PURSUANT TO SECTION 13 OR 15(d) OF THE
SECURITIES EXCHANGE ACT OF 1934
Date of Report (Date of earliest event reported): February 26, 2016
Global Net Lease, Inc.
(Exact Name of Registrant as Specified in Charter)
| Maryland | 001-37390 | 45-2771978 | ||
|
(State or other jurisdiction of incorporation) |
(Commission File Number) |
(I.R.S. Employer Identification No.) |
| 405 Park Avenue, 14th Floor New York, New York 10022 |
|
(Address, including zip code, of Principal Executive Offices)
Registrant's telephone number, including area code: (212) 415-6500 |
Check the appropriate box below if the Form 8-K filing is intended to simultaneously satisfy the filing obligation of the registrant under any of the following provisions:
| ¨ | Written communications pursuant to Rule 425 under the Securities Act (17 CFR 230.425) |
| ¨ | Soliciting material pursuant to Rule 14a-12 under the Exchange Act (17 CFR 240.14a-12) |
| ¨ | Pre-commencement communications pursuant to Rule 14d-2(b) under the Exchange Act (17 CFR 240.14d-2(b)) |
| ¨ | Pre-commencement communications pursuant to Rule 13e-4(c) under the Exchange Act (17 CFR 240.13e-4(c)) |
Item 2.02. Results of Operations and Financial Condition.
On February 26, 2016, Global Net Lease, Inc. (the “Company”) issued a press release announcing its results of operations for the fiscal year ended December 31, 2015, and supplemental financial information for the quarter ended December 31, 2015, attached hereto as Exhibits 99.1 and 99.2, respectively.
Item 7.01. Regulation FD Disclosure.
Press Release and Supplemental Information
As disclosed in Item 2.02 above, on February 26, 2016, the Company issued a press release announcing its results of operations for the fiscal year ended December 31, 2015, and supplemental financial information for the quarter ended December 31, 2015, attached hereto as Exhibits 99.1 and 99.2, respectively. The information set forth in Item 7.01 of this Current Report on Form 8-K and in the attached Exhibit 99.1 is deemed to be “furnished” and shall not be deemed to be “filed” for purposes of Section 18 of the Securities Exchange Act of 1934, as amended (the “Exchange Act”), or otherwise subject to the liabilities of that Section. The information set forth in Items 2.02 and 7.01 of this Current Report on Form 8-K, including Exhibits 99.1 and 99.2, shall not be deemed incorporated by reference into any filing under the Exchange Act or the Securities Act of 1933, as amended, regardless of any general incorporation language in such filing.
Item 9.01. Financial Statements and Exhibits.
(d) Exhibits
| Exhibit No. | Description | |
| 99.1 | Press release dated February 26, 2016 | |
| 99.2 | Quarterly supplemental information for the year ended December 31, 2015 |
SIGNATURES
Pursuant to the requirements of the Securities Exchange Act of 1934, the registrant has duly caused this report to be signed on its behalf by the undersigned hereunto duly authorized.
| Date: February 26, 2016 | By: | /s/ Scott J. Bowman | |
| Name: | Scott J. Bowman | ||
| Title: | Chief Executive Officer and President | ||
Exhibit 99.1

FOR IMMEDIATE RELEASE
Global Net Lease Announces Operating Results for Fourth Quarter and Full Year 2015
New York, February 26, 2016 – Global Net Lease, Inc. (NYSE: GNL) (“GNL” or the “Company”), a real estate investment trust focused on acquiring and managing a diversified global portfolio of single tenant net lease commercial properties, announced today its financial and operating results for the fourth quarter and full year ended December 31, 2015.
Fourth Quarter 2015 Results and Highlights
| · | Net Income attributable to stockholders of $12.8 million |
| · | Net Operating Income (“NOI”) of $48.7 million |
| · | NAREIT defined Funds from Operations (“FFO”) of $36.7 million, or $0.21 per fully diluted share |
| · | Core Funds from Operations (“Core-FFO”) of $33.6 million, or $0.20 per fully diluted share |
| · | Adjusted Funds from Operations (“AFFO”) of $30.7 million, or $0.18 per fully diluted share |
| · | Appointed Tim Salvemini to serve as Chief Financial Officer, Treasurer, and Secretary, effective as of December 1, 2015 |
| · | Included in MSCI US REIT Index in November 2015 |
For the fourth quarter of 2015, the Company recognized total revenues of approximately $56.0 million, an increase of 11.5% over total revenues of $50.3 million reported in the prior quarter. The increase in total revenues for the period was offset by approximately $2.4 million true-up adjustments recorded in the current quarter related to non-billable operating expenses and income taxes as well as other non-recurring items. Excluding these items result in a go-forward run-rate of $0.20 cents per share for the 4th quarter, or $0.80 cents per share on a full-year run rate, representing a dividend payout ratio of 89%.
As a result of the significant increase in the property portfolio during 2014, the Company does not believe an evaluation of results for this quarterly period against the fourth quarter 2014 provides a meaningful comparison.
Full Year 2015 Results and Highlights
| · | NOI of $187.2 million |
| · | NAREIT defined FFO of $88.5 million |
| · | Core FFO of $127.7 million |
| · | AFFO of $122.9 million |
| · | Paid total dividends of $127 million during 2015, inclusive of $28.6 million under the Dividend Reinvestment Program (“DRIP”) |
| · | Subsequent to year-end, the Company paid down $20.0 million on its outstanding line of credit |
| · | Completed $255 million in acquisitions at an average cap rate of 8.2% |
“We are pleased to report strong results for the fourth quarter and full year 2015 built on a foundation of our best-in-class portfolio,” commented Scott Bowman, Chief Executive Officer and President of GNL. “This was a transformative year for GNL, as we listed on the NYSE in June, were added to the MSCI US REIT index in November, and were SOX compliant as of the end of 2015. As we head into 2016, we have a strong and flexible balance sheet that positions GNL well for future success.”
2016 Outlook
| · | 2016 AFFO guidance in the range of $0.78-$0.83 per share; midpoint $0.805 per share represents a year over year increase of 12% |
| · | Maintain dividend of $0.71 per share on an annualized basis, representing a yield of 8.9% based on the Company’s closing stock price on December 31, 2015 |
| · | Utilize our strong teams in the US and Europe to exploit various market cycles, including accretive buy and sell opportunities as well as capital market opportunities |
| · | We plan to recycle $100 to $150 million in assets over the remainder of 2016 to fine tune portfolio, using proceeds for new accretive acquisitions and debt reduction |
| · | Opportunistically access the public markets over the next 12-18 months to broaden our debt structure, which will allow GNL to reduce its reliance on its corporate debt facility including adding unsecured debt to our debt stack while laddering out maturities |
Property Portfolio Composition at December 31, 2015
The Company’s diversified property portfolio consisted of 329 net lease assets located in 5 countries and comprising 18.7 million total square feet leased to 86 tenants across 36 industries. The real estate portfolio attributes included:
| · | 100% Occupancy |
| · | 73% of NOI derived from investment grade rated or implied investment grade rated tenants |
| · | 89% of portfolio NOI with contractual rent increases |
| · | 60% U.S. and 40% Europe (based on purchase price) |
| · | 54% Office, 30% Industrial / Distribution and 15% Retail (based on an annualized NOI and is based on foreign currency exchange rates as of December 31, 2015) |
| · | Weighted average remaining portfolio lease term of 11.3 years |
Mr. Bowman continued, “In 2015, we acquired $255 million in assets, further enhancing our portfolio of mission critical properties with long duration leases to largely investment grade tenants. We continue to see attractive investment opportunities in the U.S. and Europe and remain focused on building our global portfolio. As we look forward, we plan to recycle between $100-$150 million in assets through the end of 2016 while continuing to fine tune our portfolio, manage leverage, and enhance our strong balance sheet.”
Capital Structure and Liquidity Resources
At December 31, 2015, the Company had $69.9 million of cash and cash equivalents and $22.7 million available under its revolving credit facility based on foreign exchange rates as of December 31, 2015. The Company’s net debt to enterprise value was 46.8% with enterprise value of $2.5 billion based on the December 31, 2015 closing share price of $7.95 and total combined debt of $1.2 billion at year end, including $531.7 million of outstanding mortgage debt.
As of December 31, 2015, the Company’s total combined debt had a weighted average interest rate cost of 2.5%, consisting of 63.4% fixed rate1 and 36.6% floating rate debt, resulting in an interest coverage ratio of 5.5x.
“Our results reinforce GNL’s position as a best in class real estate investment trust with an investment grade quality balance sheet,” said Tim Salvemini, Chief Financial Officer of GNL. “Our unique strategy to source acquisitions and debt in the U.S. and strong markets in Western Europe generate accretive spreads between cost of debt and acquisition cap rates, results in an enhanced interest coverage ratio and provides the company with a unique competitive advantage.”
Conference Call
GNL will host a conference call on February 26, 2016 at 10:00 a.m. ET to discuss financial and operating results for the fourth quarter and full year 2015.
Dial-in instructions for the conference call and the replay are outlined below. This conference call will also be broadcast live over the Internet and can be accessed by all interested parties through the GNL website, www.globalnetlease.com, in the “Investor Relations” section.
1 Inclusive of floating rate debt with in place rate hedges allowing debt to effectively act as fixed.
To listen to the live call, please go to GNL's “Investor Relations” section of the website at least 15 minutes prior to the start of the call to register and download any necessary audio software. For those who are not able to listen to the live broadcast, a replay will be available shortly after the call on the GNL website at www.globalnetlease.com.
Conference Call Details
Live Call
Dial-In (Toll Free): 1-888-317-6003
International Dial In (Toll Free): 1-412-317-6061
Canada Dial In (Toll Free): 1-866-284-3684
Participant Elite Entry Number: 0499766
Conference Replay*
Domestic Dial In (Toll Free): 1-877-344-7529
International Dial In (Toll Free): 1-412-317-0088
Canada Dial In (Toll Free): 1-855-669-9658
Conference Number: 10081202
*Available one hour after the end of the conference call through May 25, 2016.
(Participants will be required to state their name and company upon entering call.)
Supplemental Schedules
The Company will file supplemental information packages with the Securities and Exchange Commission (the “SEC”) to provide additional disclosure and financial information. Once posted, the supplemental package can be found under the “Presentations” tab in the Investor Relations section of GNL’s website at www.globalnetlease.com and on the SEC website at www.sec.gov.
About Global Net Lease, Inc.
Global Net Lease, Inc. (NYSE: GNL) is a publicly traded real estate investment trust listed on the NYSE focused on acquiring and managing a diversified global portfolio of commercial properties, with an emphasis on sale-leaseback transactions involving single tenant, mission critical, income producing, net-leased assets across the United States, Western and Northern Europe. Additional information about GNL can be found on its website at www.globalnetlease.com.
Important Notice
The statements in this press release that are not historical facts may be forward-looking statements. These forward-looking statements involve risks and uncertainties that could cause actual results or events to be materially different. Forward-looking statements may include, but are not limited to, statements regarding stockholder liquidity and investment value and returns. The words "anticipates," "believes," "expects," "estimates," "projects," "plans," "intends," "may," "will," "would" and similar expressions are intended to identify forward-looking statements, although not all forward-looking statements contain these identifying words. Actual results may differ materially from those contemplated by such forward-looking statements, including those set forth in the Risk Factors section of GNL’s Annual Report on Form 10-K filed with the SEC on April 3, 2015, the Quarterly Reports on Form 10-Q filed for the quarters ended March 31, 2015, June 30, 2015 and November 30, 2015, filed on May 18, 2015, August 10, 2015 and November 10, 2015 and in future filings with the SEC. Further, forward-looking statements speak only as of the date they are made, and GNL undertakes no obligation to update or reverse any forward-looking statement to reflect changed assumptions, the occurrence of unanticipated events on changes to future operating results, unless required to do so by law.
The discussion regarding 2016 projected Pro Forma Run Rate AFFO includes estimated projections of future operating results. These projections were not prepared in accordance with published guidelines of the SEC or the guidelines established by the American Institute of Certified Public Accountants for preparation and presentation of financial projections. This information is not fact and should not be relied upon as being necessarily indicative of future results; the projections were prepared in good faith by management and are based on numerous assumptions that may prove to be wrong. Important factors that may affect actual results and cause the projections to not be achieved include, but are not limited to, risks and uncertainties relating to the company and other factors described under “Risk Factors” section of the Company’s Annual Report on Form 10-K and any subsequent Quarterly Reports on Form 10-Q or Current Reports on Form 8-K and “Forward-Looking Statements.” The projections also reflect assumptions as to certain business decisions that are subject to change. As a result, actual results may differ materially from those contained in the estimates. Accordingly, there can be no assurance that the estimates will be realized.
Contacts
Media Inquiries: Investor Inquiries:
Tim Cifelli President DDCworks Ph: (484-342-3600) |
Matthew Furbish Director Investor & Public Relations Ph: (212-415-6500) |
Scott J. Bowman Chief Executive Officer Global Net Lease, Inc. Ph: (212-415-6500) |
Global Net Lease, Inc.
Consolidated Balance Sheets
(in thousands, except share and per share data)
| December 31, | December 31, | |||||||
| 2015 | 2014 | |||||||
| (Unaudited) | ||||||||
| Assets | ||||||||
| Real estate investments, at cost: | ||||||||
| Land | $ | 341,911 | $ | 326,696 | ||||
| Buildings, fixtures and improvements | 1,685,919 | 1,519,558 | ||||||
| Construction in progress | 180 | 9,706 | ||||||
| Acquired intangible lease assets | 518,294 | 484,079 | ||||||
| Total real estate investments, at cost | 2,546,304 | 2,340,039 | ||||||
| Less accumulated depreciation and amortization | (133,329 | ) | (42,568 | ) | ||||
| Total real estate investments, net | 2,412,975 | 2,297,471 | ||||||
| Cash and cash equivalents | 69,938 | 64,684 | ||||||
| Restricted cash | 3,319 | 6,104 | ||||||
| Derivatives, at fair value | 5,812 | 13,638 | ||||||
| Investment securities, at fair value | - | 490 | ||||||
| Prepaid expenses and other assets | 38,393 | 24,873 | ||||||
| Due from affiliates | 136 | 500 | ||||||
| Deferred tax assets | 2,890 | 2,102 | ||||||
| Goodwill and other intangible assets, net | 2,988 | 3,665 | ||||||
| Deferred financing costs, net | 11,855 | 15,270 | ||||||
| Total Assets | $ | 2,548,306 | $ | 2,428,797 | ||||
| Liabilities and Equity | ||||||||
| Mortgage notes payable | $ | 531,708 | $ | 281,186 | ||||
| Mortgage premium, net | 676 | 1,165 | ||||||
| Credit facility | 717,286 | 659,268 | ||||||
| Below-market lease liabilities, net | 27,978 | 21,676 | ||||||
| Derivatives, at fair value | 6,028 | 6,115 | ||||||
| Listing note, at fair value | - | - | ||||||
| Due to affiliates | 399 | 400 | ||||||
| Accounts payable and accrued expenses | 22,783 | 15,692 | ||||||
| Prepaid rent | 15,491 | 12,252 | ||||||
| Taxes payable | 4,530 | 3,665 | ||||||
| Deferred tax liability | 424 | - | ||||||
| Dividends payable | 407 | 10,709 | ||||||
| Total liabilities | 1,327,710 | 1,012,128 | ||||||
| Commitments and contingencies | ||||||||
| Equity: | ||||||||
| Preferred stock, $0.01 par value, 50,000,000 authorized, none issued and outstanding at December 31, 2015 and December 31, 2014 | - | - | ||||||
| Common stock, $0.01 par value, 300,000,000 shares authorized, 168,936,633 and 177,933,175 shares issued and outstanding at December 31, 2015 and December 31, 2014, respectively | 1,692 | 1,782 | ||||||
| Additional paid-in capital | 1,480,162 | 1,575,592 | ||||||
| Accumulated other comprehensive loss | (3,649 | ) | (5,589 | ) | ||||
| Accumulated deficit | (272,335 | ) | (155,116 | ) | ||||
| Total stockholders' equity | 1,205,870 | 1,416,669 | ||||||
| Non-controlling interest | 14,726 | - | ||||||
| Total equity | 1,220,596 | 1,416,669 | ||||||
| Total Liabilities and Equity | $ | 2,548,306 | $ | 2,428,797 | ||||
Global Net Lease, Inc.
Consolidated Statements of Operations
(in thousands, except share and per share data)
| Three Months Ended | Year Ended | |||||||||||||||||||
| December 31, 2015 | September 30, 2015 | December 31, 2014 | December 31, 2015 | December 31, 2014 | ||||||||||||||||
| (Unaudited) | (Unaudited) | (Unaudited) | (Unaudited) | |||||||||||||||||
| Revenues: | ||||||||||||||||||||
| Rental income | $ | 52,118 | $ | 47,836 | $ | 42,220 | $ | 194,620 | $ | 88,158 | ||||||||||
| Operating expense reimbursements | 3,925 | 2,416 | 4,086 | 10,712 | 5,225 | |||||||||||||||
| Total revenues | 56,043 | 50,252 | 46,306 | 205,332 | 93,383 | |||||||||||||||
| Expenses: | ||||||||||||||||||||
| Property operating | 7,389 | 3,355 | 5,500 | 18,180 | 7,947 | |||||||||||||||
| Operating fees to affiliates | 4,956 | 4,902 | 376 | 15,167 | 797 | |||||||||||||||
| Acquisition and transaction related | 76 | 4,680 | 29,615 | 6,053 | 83,498 | |||||||||||||||
| Listing fees | 150 | - | - | 18,653 | - | |||||||||||||||
| Change in fair value of listing note | (3,380 | ) | (1,050 | ) | - | - | - | |||||||||||||
| General and administrative | 1,537 | 2,014 | 2,187 | 7,175 | 4,314 | |||||||||||||||
| Equity based compensation | (90 | ) | 1,917 | (98 | ) | 2,345 | - | |||||||||||||
| Depreciation and amortization | 23,918 | 22,949 | 13,267 | 90,070 | 40,387 | |||||||||||||||
| Total expenses | 34,556 | 38,767 | 50,847 | 172,123 | 136,943 | |||||||||||||||
| Operating income (loss) | 21,487 | 11,485 | (4,541 | ) | 33,209 | (43,560 | ) | |||||||||||||
| Other income (expense): | ||||||||||||||||||||
| Interest expense | (10,065 | ) | (9,041 | ) | (6,467 | ) | (34,864 | ) | (14,852 | ) | ||||||||||
| Income from investments | - | 8 | 14 | 15 | 14 | |||||||||||||||
| Gains on foreign currency | - | - | 570 | - | (186 | ) | ||||||||||||||
| Realized losses on investment securities | - | (66 | ) | - | (66 | ) | - | |||||||||||||
| Gains on derivative instruments | 1,150 | 2,310 | 1,282 | 3,935 | 1,881 | |||||||||||||||
| Gains on hedges and derivatives deemed ineffective | 2,679 | 1,505 | 1,387 | 5,124 | 1,387 | |||||||||||||||
| Unrealized losses on non-functional foreign currency advances not designated as net investment hedges | (623 | ) | - | - | (3,558 | ) | - | |||||||||||||
| Other income (expense) | 64 | (10 | ) | 88 | 79 | 291 | ||||||||||||||
| Total other expense, net | (6,795 | ) | (5,294 | ) | (3,126 | ) | (29,335 | ) | (11,465 | ) | ||||||||||
| Net income (loss) before income taxes | 14,692 | 6,191 | (7,667 | ) | 3,874 | (55,025 | ) | |||||||||||||
| Income tax (expense) benefit | (1,766 | ) | (703 | ) | 2,459 | (5,412 | ) | 1,431 | ||||||||||||
| Net income (loss) | 12,926 | 5,488 | (5,208 | ) | (1,538 | ) | (53,594 | ) | ||||||||||||
| Non-controlling interest | (137 | ) | (56 | ) | - | (50 | ) | - | ||||||||||||
| Net income (loss) attributable to stockholders | $ | 12,789 | $ | 5,432 | $ | (5,208 | ) | $ | (1,588 | ) | $ | (53,594 | ) | |||||||
| Basic Earnings Per Share: | ||||||||||||||||||||
| Basic net income (loss) per share attributable to stockholders | $ | 0.07 | $ | 0.03 | $ | (0.03 | ) | $ | (0.01 | ) | $ | (0.43 | ) | |||||||
| Basic weighted average shares outstanding | 168,936,633 | 168,948,345 | 177,414,574 | 174,309,894 | 126,079,369 | |||||||||||||||
| Diluted Earnings Per Share: | ||||||||||||||||||||
| Diluted net income (loss) per share attributable to stockholders | $ | 0.07 | $ | 0.03 | $ | (0.03 | ) | $ | (0.01 | ) | $ | (0.43 | ) | |||||||
| Diluted weighted average shares outstanding | 168,936,633 | 169,136,283 | 177,414,574 | 174,309,894 | 126,079,369 | |||||||||||||||
Global Net Lease, Inc.
Quarterly Reconciliation of Non-GAAP Measures (Unaudited)
(in thousands, except share and per share data)
| Three Months Ended | Year Ended | |||||||||||||||||||
| March 31, 2015 | June 30, 2015 | September 30, 2015 | December 31, 2015 | December 31, 2015 | ||||||||||||||||
| Net income (loss) attributable to stockholders (in accordance with GAAP) | $ | 25,855 | $ | (45,664 | ) | $ | 5,432 | $ | 12,789 | $ | (1,588 | ) | ||||||||
| Depreciation and amortization | 21,114 | 22,089 | 22,949 | 23,918 | 90,070 | |||||||||||||||
| FFO (as defined by NAREIT) attributable to stockholders | 46,969 | (23,575 | ) | 28,381 | 36,707 | 88,482 | ||||||||||||||
| Acquisition and transaction fees | 1,085 | 212 | 4,680 | 76 | 6,053 | |||||||||||||||
| Listing fees | - | 18,503 | - | 150 | 18,653 | |||||||||||||||
| Vesting of Class B units upon listing | - | 14,480 | - | - | 14,480 | |||||||||||||||
| Change in fair value of listing note | - | 4,430 | (1,050 | ) | (3,380 | ) | - | |||||||||||||
| Core FFO | 48,054 | 14,050 | 32,011 | 33,553 | 127,668 | |||||||||||||||
| Non-cash equity based compensation | 8 | 510 | 1,917 | (90 | ) | 2,345 | ||||||||||||||
| Non-cash portion of interest expense | 1,944 | 1,994 | 2,306 | 2,365 | 8,609 | |||||||||||||||
| Class B distributions | 124 | 309 | (94 | ) | - | 339 | ||||||||||||||
| Nonrecurring general and administrative expenses (1) | - | - | 188 | 302 | 490 | |||||||||||||||
| Straight-line rent | (4,439 | ) | (3,437 | ) | (3,697 | ) | (3,236 | ) | (14,809 | ) | ||||||||||
| Amortization of above- and below- market leases and ground lease assets and liabilities, net | 109 | 101 | 94 | (52 | ) | 252 | ||||||||||||||
| Realized losses on investment securities | - | - | 66 | - | 66 | |||||||||||||||
| (Gains) losses on on hedges and derivatives deemed ineffective | (1,448 | ) | 508 | (1,505 | ) | (2,679 | ) | (5,124 | ) | |||||||||||
| Unrealized (gains) losses on non-functional foreign currency advances not designated as net investment hedges | (8,907 | ) | 11,842 | - | 623 | 3,558 | ||||||||||||||
| Amortization of mortgage premium | (42 | ) | (202 | ) | (123 | ) | (122 | ) | (489 | ) | ||||||||||
| AFFO | $ | 35,403 | $ | 25,675 | $ | 31,163 | $ | 30,664 | $ | 122,905 | ||||||||||
| (1) | Represents our estimate of non-recurring internal audit service fees associated with our SOX readiness efforts and other non-recurring charges. |
Non-GAAP Financial Measures
These non-GAAP financial measures are not intended as alternative measures of operating results or cash flow from operations as determined in accordance with Generally Accepted Accounting Principles ("GAAP"). Funds from Operations ("FFO"), Core Funds from Operations (“Core FFO”) and AFFO are calculated using inputs which are computed in accordance with GAAP.
Funds from Operations, Core Funds from Operations and Adjusted Funds from Operations
Due to certain unique operating characteristics of real estate companies, as discussed below, the National Association of Real Estate Investment Trusts ("NAREIT"), an industry trade group, has promulgated a measure known as FFO, which we believe to be an appropriate supplemental measure to reflect the operating performance of a REIT. The use of FFO is recommended by the REIT industry as a supplemental performance measure. FFO is not equivalent to net income or loss as determined under GAAP.
We define FFO, a non-GAAP measure, consistent with the standards established by the White Paper on FFO approved by the Board of Governors of NAREIT, as revised in February 2004 (the "White Paper"). The White Paper defines FFO as net income or loss computed in accordance with GAAP, excluding gains or losses from sales of property but including asset impairment writedowns, plus depreciation and amortization, and after adjustments for unconsolidated partnerships and joint ventures. Adjustments for unconsolidated partnerships and joint ventures are calculated to reflect FFO. Our FFO calculation complies with NAREIT's definition.
The historical accounting convention used for real estate assets requires straight-line depreciation of buildings and improvements, and straight-line amortization of intangibles, which implies that the value of a real estate asset diminishes predictably over time, especially if not adequately maintained or repaired and renovated as required by relevant circumstances or as requested or required by lessees for operational purposes in order to maintain the value disclosed. We believe that, because real estate values historically rise and fall with market conditions, including inflation, interest rates, the business cycle, unemployment and consumer spending, presentations of operating results for a REIT using historical accounting for depreciation and certain other items may be less informative. Historical accounting for real estate involves the use of GAAP. Any other method of accounting for real estate such as the fair value method cannot be construed to be any more accurate or relevant than the comparable methodologies of real estate valuation found in GAAP. Nevertheless, we believe that the use of FFO, which excludes the impact of real estate related depreciation and amortization, among other things, provides a more complete understanding of our performance to investors and to management, and when compared year over year, reflects the impact on our operations from trends in occupancy rates, rental rates, operating costs, general and administrative expenses, and interest costs, which may not be immediately apparent from net income. However, FFO, Core FFO and AFFO, as described below, should not be construed to be more relevant or accurate than the current GAAP methodology in calculating net income or in its applicability in evaluating our operating performance. The method utilized to evaluate the value and performance of real estate under GAAP should be construed as a more relevant measure of operational performance and considered more prominently than the non-GAAP FFO, Core FFO and AFFO measures and the adjustments to GAAP in calculating FFO, Core FFO and AFFO. Other REITs may not define FFO in accordance with the current NAREIT definition (as we do) or may interpret the current NAREIT definition differently than we do and/or calculate Core FFO and/or AFFO differently than we do. Consequently, our presentation of FFO, Core FFO and AFFO may not be comparable to other similarly titled measures presented by other REITs.
We consider FFO, Core FFO and AFFO useful indicators of our performance. Because FFO calculations exclude such factors as depreciation and amortization of real estate assets and gains or losses from sales of operating real estate assets (which can vary among owners of identical assets in similar conditions based on historical cost accounting and useful-life estimates), FFO facilitates comparisons of operating performance between periods and between other REITs in our peer group.
Changes in the accounting and reporting promulgations under GAAP (for acquisition fees and expenses from a capitalization/depreciation model to an expensed-as-incurred model) that were put into effect in 2009 and other changes to GAAP accounting for real estate subsequent to the establishment of NAREIT's definition of FFO have prompted an increase in cash-settled expenses, specifically acquisition fees and expenses for all industries as items that are expensed under GAAP, that are typically accounted for as operating expenses.
Core FFO is FFO, excluding acquisition and transaction related costs as well as certain other costs that are considered to be non-core, such as charges relating to the Listing Note and listing related fees. The purchase of properties, and the corresponding expenses associated with that process, is a key operational feature of our business plan to generate operational income and cash flows in order to make dividend payments to stockholders. In evaluating investments in real estate, we differentiate the costs to acquire the investment from the operations derived from the investment. By excluding expensed acquisition and transaction related costs as well as non-core costs, we believe Core FFO provides useful supplemental information that is comparable for each type of real estate investment and is consistent with management's analysis of the investing and operating performance of our properties.
We exclude certain income or expense items from AFFO that we consider more reflective of investing activities, other non-cash income and expense items and the income and expense effects of other activities that are not a fundamental attribute of our business plan. These items include unrealized gains and losses, which may not ultimately be realized, such as gains or losses on contingent valuation rights, gains and losses on investments and early extinguishment of debt. We also exclude dividends on Class B OP Units as the related shares are assumed to have converted to common stock in our calculation of fully diluted weighted average shares of common stock. In addition, by excluding non-cash income and expense items such as amortization of above-market and below-market leases intangibles, amortization of deferred financing costs, straight-line rent and equity-based compensation from AFFO, we believe we provide useful information regarding income and expense items which have no cash impact and do not provide liquidity to the company or require capital resources of the company. By providing AFFO, we believe we are presenting useful information that assists investors and analysts to better assess the sustainability of our ongoing operating performance without the impacts of transactions that are not related to the ongoing profitability of our portfolio of properties. We also believe that AFFO is a recognized measure of sustainable operating performance by the REIT industry. Further, we believe AFFO is useful in comparing the sustainability of our operating performance with the sustainability of the operating performance of other real estate companies that are not making a significant number of acquisitions. Investors are cautioned that AFFO should only be used to assess the sustainability of our operating performance excluding these activities, as it excludes certain costs that have a negative effect on our operating performance during the periods in which these costs are incurred.
In calculating AFFO, we exclude certain expenses, which under GAAP are characterized as operating expenses in determining operating net income. These expenses are paid in cash by us, and therefore such funds will not be available to distribute to investors. All paid and accrued merger, acquisition and transaction related fees and certain other expenses negatively impact our operating performance during the period in which expenses are incurred or properties are acquired will also have negative effects on returns to investors, the ability to fund dividends or distributions in the future, and cash flows generated by us, unless earnings from operations or net sales proceeds from the disposition of other properties are generated to cover the purchase price of the property and certain other expenses. AFFO that excludes such costs and expenses would only be comparable to companies that did not have such activities. Further, under GAAP, certain contemplated non-cash fair value and other non-cash adjustments are considered operating non-cash adjustments to net income in determining cash flow from operating activities. In addition, we view fair value adjustments as items which are unrealized and may not ultimately be realized. We view both gains and losses from fair value adjustments as items which are not reflective of ongoing operations and are therefore typically adjusted for when assessing operating performance. Excluding income and expense items detailed above from our calculation of AFFO provides information consistent with management's analysis of the operating performance of the properties. Additionally, fair value adjustments, which are based on the impact of current market fluctuations and underlying assessments of general market conditions, but can also result from operational factors such as rental and occupancy rates, may not be directly related or attributable to our current operating performance. By excluding such changes that may reflect anticipated and unrealized gains or losses, we believe AFFO provides useful supplemental information.
As a result, we believe that the use of FFO, Core FFO and AFFO, together with the required GAAP presentations, provide a more complete understanding of our performance relative to our peers and a more informed and appropriate basis on which to make decisions involving operating, financing, and investing activities.
The table above presents the items deducted or added to net income in our calculation of FFO, Core FFO and AFFO for the periods indicated. Management believes these Non-GAAP measures are more meaningful to the users of our financial statements given our Listing.
Exhibit 99.2
Global Net Lease, Inc.
Supplemental Information
Quarter ended December 31, 2015 (unaudited)
| Global Net Lease, Inc. |
| Supplemental Information |
| Quarter ended December 31, 2015 (unaudited) |
Table of Contents
| Item | Page | ||
| Non-GAAP Definitions | 3 | ||
| Key Metrics | 7 | ||
| Consolidated Balance Sheets | 8 | ||
| Consolidated Statements of Income | 9 | ||
| Non-GAAP Measures | 10 | ||
| Debt Overview | 12 | ||
| Investment Activity | 13 | ||
| Top Ten Tenants | 14 | ||
| Diversification by Property Type | 15 | ||
| Diversification by Tenant Industry | 16 | ||
| Diversification by Geography | 17 | ||
| Lease Expirations | 18 |
Please note that totals may not add due to rounding.
Forward-looking Statements:
This supplemental package includes “forward looking statements”. Forward-looking statements may be identified by the use of words such as “believes,” “expects,” “may,” “will,” “should,” “seeks,” “approximately,” “intends,” “plans,” “pro forma,” “estimates,” “contemplates,” “aims,” “continues,” “would” or “anticipates” or the negative of these words and phrases or similar words or phrases. The following factors, among others, could cause actual results and future events to differ materially from those set forth or contemplated in the forward-looking statements: the factors included in (i) the Annual Report on Form 10-K for the year ended December 31, 2014 of Global Net Lease, Inc. (the “Company”), including those set forth under the headings “Risk Factors,” “Management’s Discussion and Analysis of Financial Condition and Results of Operations,” and “Business,” (ii) the Quarterly Reports on Form 10-Q for the quarters ended March 31, 2015, June 30, 2015, and September 30, 2015, filed on May 18, 2015, August 10, 2015, and November 10, 2015 and (iii) in future periodic reports filed by the Company under the Securities Exchange Act of 1934, as amended. While forward-looking statements reflect the Company’s good faith beliefs, they are not guarantees of future performance. The Company disclaims any obligation to publicly update or revise any forward-looking statement to reflect changes in underlying assumptions or factors, new information, data or methods, future events or other changes after the date of this press release, except as required by applicable law. For a further discussion of these and other factors that could impact the Company’s future results, performance or transactions, see the section entitled “Risk Factors” in the Annual Report on Form 10-K for the year ended December 31, 2014, and other risks described in documents subsequently filed by the Company from time to time with the Securities and Exchange Commission. Prospective investors should not place undue reliance on any forward-looking statements, which are based only on information currently available to the Company (or to third parties making the forward-looking statements).
| 2 |
| Global Net Lease, Inc. |
| Supplemental Information |
| Quarter ended December 31, 2015 (unaudited) |
Non-GAAP Definitions
This section includes non-GAAP financial measures, including Funds from Operations, Core Funds from Operations, Adjusted Funds from Operations, Adjusted Earnings Before Interest, Taxes, Depreciation and Amortization, Net Operating Income, and Cash Net Operating Income. A description of these non-GAAP measures and reconciliations to the most directly comparable GAAP measure, which is net income, is provided below.
Funds from Operations, Core Funds from Operations and Adjusted Funds from Operations
Due to certain unique operating characteristics of real estate companies, as discussed below, the National Association of Real Estate Investment Trusts ("NAREIT"), an industry trade group, has promulgated a measure known as funds from operations ("FFO"), which we believe to be an appropriate supplemental measure to reflect the operating performance of a REIT. The use of FFO is recommended by the REIT industry as a supplemental performance measure. FFO is not equivalent to net income or loss as determined under accounting principles generally accepted in the United States ("GAAP").
We define FFO, a non-GAAP measure, consistent with the standards established by the White Paper on FFO approved by the Board of Governors of NAREIT, as revised in February 2004 (the "White Paper"). The White Paper defines FFO as net income or loss computed in accordance with GAAP, excluding gains or losses from sales of property but including asset impairment writedowns, plus depreciation and amortization, and after adjustments for unconsolidated partnerships and joint ventures. Adjustments for unconsolidated partnerships and joint ventures are calculated to reflect FFO. Our FFO calculation complies with NAREIT's definition.
The historical accounting convention used for real estate assets requires straight-line depreciation of buildings and improvements, and straight-line amortization of intangibles, which implies that the value of a real estate asset diminishes predictably over time, especially if not adequately maintained or repaired and renovated as required by relevant circumstances or as requested or required by lessees for operational purposes in order to maintain the value disclosed. We believe that, because real estate values historically rise and fall with market conditions, including inflation, interest rates, the business cycle, unemployment and consumer spending, presentations of operating results for a REIT using historical accounting for depreciation and certain other items may be less informative. Historical accounting for real estate involves the use of GAAP. Any other method of accounting for real estate such as the fair value method cannot be construed to be any more accurate or relevant than the comparable methodologies of real estate valuation found in GAAP. Nevertheless, we believe that the use of FFO, which excludes the impact of real estate related depreciation and amortization, among other things, provides a more complete understanding of our performance to investors and to management, and when compared year over year, reflects the impact on our operations from trends in occupancy rates, rental rates, operating costs, general and administrative expenses, and interest costs, which may not be immediately apparent from net income. However, FFO, core funds from operations ("Core FFO") and adjusted funds from operations (“AFFO”), as described below, should not be construed to be more relevant or accurate than the current GAAP methodology in calculating net income or in its applicability in evaluating our operating performance. The method utilized to evaluate the value and performance of real estate under GAAP should be construed as a more relevant measure of operational performance and considered more prominently than the non-GAAP FFO, Core FFO and AFFO measures and the adjustments to GAAP in calculating FFO, Core FFO and AFFO. Other REITs may not define FFO in accordance with the current NAREIT definition (as we do) or may interpret the current NAREIT definition differently than we do and/or calculate Core FFO and/or AFFO differently than we do. Consequently, our presentation of FFO, Core FFO and AFFO may not be comparable to other similarly titled measures presented by other REITs.
| 3 |
| Global Net Lease, Inc. |
| Supplemental Information |
| Quarter ended December 31, 2015 (unaudited) |
Non-GAAP Definitions
We consider FFO, Core FFO and AFFO useful indicators of our performance. Because FFO calculations exclude such factors as depreciation and amortization of real estate assets and gains or losses from sales of operating real estate assets (which can vary among owners of identical assets in similar conditions based on historical cost accounting and useful-life estimates), FFO facilitates comparisons of operating performance between periods and between other REITs in our peer group.
Changes in the accounting and reporting promulgations under GAAP (for acquisition fees and expenses from a capitalization/depreciation model to an expensed-as-incurred model) that were put into effect in 2009 and other changes to GAAP accounting for real estate subsequent to the establishment of NAREIT's definition of FFO have prompted an increase in cash-settled expenses, specifically acquisition fees and expenses for all industries as items that are expensed under GAAP, that are typically accounted for as operating expenses.
Core FFO is FFO, excluding acquisition and transaction related costs as well as certain other costs that are considered to be non-core, such as charges relating to the Listing Note and listing related fees. The purchase of properties, and the corresponding expenses associated with that process, is a key operational feature of our business plan to generate operational income and cash flows in order to make dividend payments to stockholders. In evaluating investments in real estate, we differentiate the costs to acquire the investment from the operations derived from the investment. By excluding expensed acquisition and transaction related costs as well as non-core costs, we believe Core FFO provides useful supplemental information that is comparable for each type of real estate investment and is consistent with management's analysis of the investing and operating performance of our properties.
We exclude certain income or expense items from AFFO that we consider more reflective of investing activities, other non-cash income and expense items and the income and expense effects of other activities that are not a fundamental attribute of our business plan. These items include unrealized gains and losses, which may not ultimately be realized, such as gains or losses on contingent valuation rights, gains and losses on investments and early extinguishment of debt. We also exclude dividends on Class B Units as the related shares are assumed to have converted to common stock in our calculation of fully diluted weighted average shares of common stock. In addition, by excluding non-cash income and expense items such as amortization of above-market and below-market leases intangibles, amortization of deferred financing costs, straight-line rent and equity-based compensation from AFFO, we believe we provide useful information regarding income and expense items which have no cash impact and do not provide liquidity to the company or require capital resources of the company. By providing AFFO, we believe we are presenting useful information that assists investors and analysts to better assess the sustainability of our ongoing operating performance without the impacts of transactions that are not related to the ongoing profitability of our portfolio of properties. We also believe that AFFO is a recognized measure of sustainable operating performance by the REIT industry. Further, we believe AFFO is useful in comparing the sustainability of our operating performance with the sustainability of the operating performance of other real estate companies that are not making a significant number of acquisitions. Investors are cautioned that AFFO should only be used to assess the sustainability of our operating performance excluding these activities, as it excludes certain costs that have a negative effect on our operating performance during the periods in which these costs are incurred.
| 4 |
| Global Net Lease, Inc. |
| Supplemental Information |
| Quarter ended December 31, 2015 (unaudited) |
Non-GAAP Definitions
In calculating AFFO, we exclude certain expenses, which under GAAP are characterized as operating expenses in determining operating net income. These expenses are paid in cash by us, and therefore such funds will not be available to distribute to investors. All paid and accrued merger, acquisition and transaction related fees and certain other expenses negatively impact our operating performance during the period in which expenses are incurred or properties are acquired will also have negative effects on returns to investors, the ability to fund dividends or distributions in the future, and cash flows generated by us, unless earnings from operations or net sales proceeds from the disposition of other properties are generated to cover the purchase price of the property and certain other expenses. AFFO that excludes such costs and expenses would only be comparable to companies that did not have such activities. Further, under GAAP, certain contemplated non-cash fair value and other non-cash adjustments are considered operating non-cash adjustments to net income in determining cash flow from operating activities. In addition, we view fair value adjustments as items which are unrealized and may not ultimately be realized. We view both gains and losses from fair value adjustments as items which are not reflective of ongoing operations and are therefore typically adjusted for when assessing operating performance. Excluding income and expense items detailed above from our calculation of AFFO provides information consistent with management's analysis of the operating performance of the properties. Additionally, fair value adjustments, which are based on the impact of current market fluctuations and underlying assessments of general market conditions, but can also result from operational factors such as rental and occupancy rates, may not be directly related or attributable to our current operating performance. By excluding such changes that may reflect anticipated and unrealized gains or losses, we believe AFFO provides useful supplemental information.
As a result, we believe that the use of FFO, Core FFO and AFFO, together with the required GAAP presentations, provide a more complete understanding of our performance relative to our peers and a more informed and appropriate basis on which to make decisions involving operating, financing, and investing activities.
| 5 |
| Global Net Lease, Inc. |
| Supplemental Information |
| Quarter ended December 31, 2015 (unaudited) |
Non-GAAP Definitions
Adjusted Earnings before Interest, Taxes, Depreciation and Amortization, Net Operating Income, Cash Net Operating Income and Adjusted Cash Net Operating Income.
We believe that earnings before interest, taxes, depreciation and amortization adjusted for acquisition and transaction-related expenses, other non-cash items and including our pro-rata share from unconsolidated joint ventures ("Adjusted EBITDA") is an appropriate measure of our ability to incur and service debt. Adjusted EBITDA should not be considered as an alternative to cash flows from operating activities, as a measure of our liquidity or as an alternative to net income as an indicator of our operating activities. Other REITs may calculate Adjusted EBITDA differently and our calculation should not be compared to that of other REITs.
Net operating income ("NOI") is a non-GAAP financial measure equal to net income (loss), the most directly comparable GAAP financial measure, less discontinued operations, interest, other income and income from preferred equity investments and investment securities, plus corporate general and administrative expense, acquisition and transaction-related expenses, depreciation and amortization, other non-cash expenses and interest expense. NOI is adjusted to include our pro rata share of NOI from unconsolidated joint ventures. We use NOI internally as a performance measure and believe NOI provides useful information to investors regarding our financial condition and results of operations because it reflects only those income and expense items that are incurred at the property level. Therefore, we believe NOI is a useful measure for evaluating the operating performance of our real estate assets and to make decisions about resource allocations. Further, we believe NOI is useful to investors as a performance measure because, when compared across periods, NOI reflects the impact on operations from trends in occupancy rates, rental rates, operating costs and acquisition activity on an unlevered basis, providing perspective not immediately apparent from net income. NOI excludes certain components from net income in order to provide results that are more closely related to a property's results of operations. For example, interest expense is not necessarily linked to the operating performance of a real estate asset and is often incurred at the corporate level as opposed to the property level. In addition, depreciation and amortization, because of historical cost accounting and useful life estimates, may distort operating performance at the property level. NOI presented by us may not be comparable to NOI reported by other REITs that define NOI differently. We believe that in order to facilitate a clear understanding of our operating results, NOI should be examined in conjunction with net income (loss) as presented in our consolidated financial statements. NOI should not be considered as an alternative to net income (loss) as an indication of our performance or to cash flows as a measure of our liquidity.
Cash NOI is NOI presented on a cash basis, which is NOI after eliminating the effects of straight-lining of rent and the amortization of above and below market leases.
| 6 |
| Global Net Lease, Inc. |
| Supplemental Information |
| Quarter ended December 31, 2015 (unaudited) |
Key Metrics
As of and for the three months ended December 31, 2015
Amounts in thousands, except per share data, ratios and percentages
| Financial Results | ||||
| Rental income | $ | 52,118 | ||
| Net income attributable to stockholders | 12,789 | |||
| Basic and diluted net income per share attributable to stockholders | $ | 0.07 | ||
| Cash NOI | 45,366 | |||
| Adjusted EBITDA | 42,161 | |||
| AFFO | 30,664 | |||
| AFFO per fully diluted share | 0.18 | |||
| Dividends paid per share - fourth quarter | 0.18 | |||
| Dividend yield - annualized, based on quarter end share price of $7.95 | 8.8 | % | ||
| Dividend payout ratio - fourth quarter | 100.0 | % | ||
| Balance Sheet and Capitalization | ||||
| Equity market capitalization - based on quarter end share price of $7.95 | $ | 1,343,046 | ||
| Net debt | 1,179,732 | |||
| Enterprise value | 2,522,778 | |||
| Total capitalization | 2,592,716 | |||
| Total consolidated debt | 1,248,994 | |||
| Total assets | 2,548,306 | |||
| Liquidity | 92,652 | |||
| Common shares outstanding as of Dec 31, 2015 (thousands) | 168,937 | |||
| Share price, end of quarter | $ | 7.95 | ||
| Net debt to enterprise value | 46.8 | % | ||
| Net debt to adjusted EBITDA (annualized) | 7.0 | x | ||
| Weighted-average interest rate cost | 2.5 | % | ||
| Weighted-average debt maturity (years)[1] | 2.0 | |||
| Real Estate Portfolio | ||||
| Number of properties | 329 | |||
| Number of tenants | 86 | |||
| Square footage (millions) | 18.7 | |||
| Occupancy | 100.0 | % | ||
| Weighted-average remaining lease term (years) | 11.3 | |||
Footnotes:
[1] Credit facility has an initial maturity date of July 25, 2016 with two one-year extensions, subject to certain conditions. Weighted-average debt maturity assumes that the extensions are exercised.
| 7 |
| Global Net Lease, Inc. | |||
| Supplemental Information | |||
| Quarter ended December 31, 2015 (unaudited) | |||
| Consolidated Balance Sheets | |||
| Amounts in thousands | |||
| Dec 31, 2015 | Dec 31, 2014 | |||||||
| Assets | ||||||||
| Real estate investments, at cost: | ||||||||
| Land | $ | 341,911 | $ | 326,696 | ||||
| Buildings, fixtures and improvements | 1,685,919 | 1,519,558 | ||||||
| Construction in progress | 180 | 9,706 | ||||||
| Acquired intangible lease assets | 518,294 | 484,079 | ||||||
| Total real estate investments, at cost | 2,546,304 | 2,340,039 | ||||||
| Less accumulated depreciation and amortization | (133,329 | ) | (42,568 | ) | ||||
| Total real estate investments, net | 2,412,975 | 2,297,471 | ||||||
| Cash and cash equivalents | 69,938 | 64,684 | ||||||
| Restricted cash | 3,319 | 6,104 | ||||||
| Derivatives, at fair value | 5,812 | 13,638 | ||||||
| Investment securities, at fair value | - | 490 | ||||||
| Prepaid expenses and other assets | 38,393 | 24,873 | ||||||
| Due from affiliates | 136 | 500 | ||||||
| Deferred tax assets | 2,890 | 2,102 | ||||||
| Goodwill and other intangible assets, net | 2,988 | 3,665 | ||||||
| Deferred financing costs, net | 11,855 | 15,270 | ||||||
| Total assets | $ | 2,548,306 | $ | 2,428,797 | ||||
| Liabilities and Equity | ||||||||
| Mortgage notes payable | $ | 531,708 | $ | 281,186 | ||||
| Mortgage premium, net | 676 | 1,165 | ||||||
| Credit facility | 717,286 | 659,268 | ||||||
| Below-market lease liabilities, net | 27,978 | 21,676 | ||||||
| Derivatives, at fair value | 6,028 | 6,115 | ||||||
| Listing note, at fair value | - | - | ||||||
| Due to affiliates | 399 | 400 | ||||||
| Accounts payable and accrued expenses | 22,783 | 15,692 | ||||||
| Prepaid rent | 15,491 | 12,252 | ||||||
| Taxes payable | 4,530 | 3,665 | ||||||
| Deferred tax liability | 424 | - | ||||||
| Dividends payable | 407 | 10,709 | ||||||
| Total liabilities | 1,327,710 | 1,012,128 | ||||||
| Common stock | 1,692 | 1,782 | ||||||
| Additional paid in capital | 1,480,162 | 1,575,592 | ||||||
| Accumulated other comprehensive loss | (3,649 | ) | (5,589 | ) | ||||
| Accumulated deficit | (272,335 | ) | (155,116 | ) | ||||
| Total stockholders' equity | 1,205,870 | 1,416,669 | ||||||
| Non-controlling interest | 14,726 | - | ||||||
| Total equity | 1,220,596 | 1,416,669 | ||||||
| Total liabilities and equity | $ | 2,548,306 | $ | 2,428,797 | ||||
| 8 |
| Global Net Lease, Inc. | |||||
| Supplemental Information | |||||
| Quarter ended December 31, 2015 (unaudited) | |||||
| Consolidated Statements of Income | |||||
| Amounts in thousands, except per share data and ratios |
| Three Months Ended | ||||||||||||||||
| Dec 31, 2015 | Sep 30, 2015 | Jun 30, 2015 | Mar 31, 2015 | |||||||||||||
| Revenues: | ||||||||||||||||
| Rental income | $ | 52,118 | $ | 47,836 | $ | 47,234 | $ | 47,432 | ||||||||
| Operating expense reimbursements | 3,925 | 2,416 | 1,834 | 2,537 | ||||||||||||
| Total revenues | 56,043 | 50,252 | 49,068 | 49,969 | ||||||||||||
| Expenses: | ||||||||||||||||
| Property operating | 7,389 | 3,355 | 3,377 | 4,059 | ||||||||||||
| Operating fees to affiliates | 4,956 | 4,902 | 4,065 | 1,244 | ||||||||||||
| Acquisition and transaction related | 76 | 4,680 | 212 | 1,085 | ||||||||||||
| Listing fees | 150 | - | 18,503 | - | ||||||||||||
| Vesting of class B units | - | - | 14,480 | - | ||||||||||||
| Change in fair value of Listing Note | (3,380 | ) | (1,050 | ) | 4,430 | - | ||||||||||
| General and administrative | 1,537 | 2,014 | 1,885 | 1,739 | ||||||||||||
| Equity based compensation | (90 | ) | 1,917 | 510 | 8 | |||||||||||
| Depreciation and amortization | 23,918 | 22,949 | 22,089 | 21,114 | ||||||||||||
| Total expenses | 34,556 | 38,767 | 69,551 | 29,249 | ||||||||||||
| Operating income (loss) | 21,487 | 11,485 | (20,483 | ) | 20,720 | |||||||||||
| Other income (expense): | ||||||||||||||||
| Interest expense | (10,065 | ) | (9,041 | ) | (7,947 | ) | (7,811 | ) | ||||||||
| Income from investments | - | 8 | - | 7 | ||||||||||||
| Gains on foreign currency | - | - | - | - | ||||||||||||
| Realized losses on investment securities | - | (66 | ) | - | - | |||||||||||
| Gains (losses) on derivative instruments | 1,150 | 2,310 | (3,736 | ) | 4,211 | |||||||||||
| Gains (losses) hedges and derivatives deemed ineffective | 2,679 | 1,505 | (508 | ) | 1,448 | |||||||||||
| Unrealized (losses) gains on non-functional foreign currency advances not designated as net investment hedges | (623 | ) | - | (11,842 | ) | 8,907 | ||||||||||
| Other income (expense) | 64 | (10 | ) | 12 | 13 | |||||||||||
| Total other income (expense), net | (6,795 | ) | (5,294 | ) | (24,021 | ) | 6,775 | |||||||||
| Net income (loss) before income taxes | 14,692 | 6,191 | (44,504 | ) | 27,495 | |||||||||||
| Income tax expense | (1,766 | ) | (703 | ) | (1,303 | ) | (1,640 | ) | ||||||||
| Net income (loss) | 12,926 | 5,488 | (45,807 | ) | 25,855 | |||||||||||
| Non-controlling interest | (137 | ) | (56 | ) | 143 | - | ||||||||||
| Net income (loss) attributable to stockholders | $ | 12,789 | $ | 5,432 | $ | (45,664 | ) | $ | 25,855 | |||||||
| Basic and Diluted Earnings Per Share: | ||||||||||||||||
| Basic and diluted net income (loss) per share attributable to stockholders | $ | 0.07 | $ | 0.03 | $ | (0.25 | ) | $ | 0.14 | |||||||
| Basic and diluted weighted average shares outstanding (thousands) | 168,937 | 168,948 | 180,380 | 179,156 | ||||||||||||
| 9 |
| Global Net Lease, Inc. | |||||
| Supplemental Information | |||||
| Quarter ended December 31, 2015 (unaudited) | |||||
| Non-GAAP Measures | |||||
| Amounts in thousands, except per share data and ratios |
| Three Months Ended | ||||||||||||||||
| Dec 31, 2015 | Sep 30, 2015 | Jun 30, 2015 | Mar 31, 2015 | |||||||||||||
| EBITDA: | ||||||||||||||||
| Net income (loss) | $ | 12,926 | $ | 5,488 | $ | (45,807 | ) | $ | 25,855 | |||||||
| Depreciation and amortization | 23,918 | 22,949 | 22,089 | 21,114 | ||||||||||||
| Interest expense | 10,065 | 9,041 | 7,947 | 7,811 | ||||||||||||
| Income tax expense | 1,766 | 703 | 1,303 | 1,640 | ||||||||||||
| EBITDA | $ | 48,675 | $ | 38,181 | $ | (14,468 | ) | $ | 56,420 | |||||||
| Adjusted EBITDA: | ||||||||||||||||
| Listing Fees | $ | 150 | $ | - | $ | 18,503 | $ | - | ||||||||
| Vesting of class B units | - | - | 14,480 | - | ||||||||||||
| Change in fair value of Listing Note | (3,380 | ) | (1,050 | ) | 4,430 | - | ||||||||||
| Equity based compension | (90 | ) | 1,917 | 510 | 8 | |||||||||||
| Acquisition and transaction related | 76 | 4,680 | 212 | 1,085 | ||||||||||||
| Income from investments | - | (8 | ) | - | (7 | ) | ||||||||||
| Gains on foreign currency | - | - | - | - | ||||||||||||
| Realized losses on investment securities | - | 66 | - | - | ||||||||||||
| (Gains) losses on derivative instruments | (1,150 | ) | (2,310 | ) | 3,736 | (4,211 | ) | |||||||||
| (Gains) losses hedges and derivatives deemed ineffective | (2,679 | ) | (1,505 | ) | 508 | (1,448 | ) | |||||||||
| Unrealized losses (gains) on non-functional foreign currency advances not designated as net investment hedges | 623 | - | 11,842 | (8,907 | ) | |||||||||||
| Other (income) expense | (64 | ) | 10 | (12 | ) | (13 | ) | |||||||||
| Adjusted EBITDA | $ | 42,161 | $ | 39,981 | $ | 39,741 | $ | 42,927 | ||||||||
| Net Operating Income (NOI): | ||||||||||||||||
| Operating fees to affiliates | $ | 4,956 | $ | 4,902 | $ | 4,065 | $ | 1,244 | ||||||||
| General and administrative | 1,537 | 2,014 | 1,885 | 1,739 | ||||||||||||
| NOI | $ | 48,654 | $ | 46,897 | $ | 45,691 | $ | 45,910 | ||||||||
| Cash Net Operating Income (Cash NOI): | ||||||||||||||||
| Amortization of above/below market lease assets and liabilities | (52 | ) | 94 | 101 | 109 | |||||||||||
| Straight-line rent | (3,236 | ) | (3,697 | ) | (3,437 | ) | (4,439 | ) | ||||||||
| Cash NOI | 45,366 | 43,294 | 42,355 | 41,580 | ||||||||||||
| 10 |
| Global Net Lease, Inc. | |||||
| Supplemental Information | |||||
| Quarter ended December 31, 2015 (unaudited) | |||||
| Non-GAAP Measures | |||||
| Amounts in thousands, except per share data and ratios |
| Three Months Ended | ||||||||||||||||
| Dec 31, 2015 | Sep 30, 2015 | Jun 30, 2015 | Mar 31, 2015 | |||||||||||||
| Funds from operations (FFO): | ||||||||||||||||
| Net income (loss) attributable to stockholders (in accordance with GAAP) | $ | 12,789 | $ | 5,432 | $ | (45,664 | ) | $ | 25,855 | |||||||
| Depreciation and amortization | 23,918 | 22,949 | 22,089 | 21,114 | ||||||||||||
| FFO (as defined by NAREIT) attributable to stockholders | $ | 36,707 | $ | 28,381 | $ | (23,575 | ) | $ | 46,969 | |||||||
| Acquisition fees and expenses | 76 | 4,680 | 212 | 1,085 | ||||||||||||
| Listing fees | 150 | - | 18,503 | - | ||||||||||||
| Vesting of class B units upon listing | - | - | 14,480 | - | ||||||||||||
| Change in fair value of Listing Note | (3,380 | ) | (1,050 | ) | 4,430 | - | ||||||||||
| Core FFO | $ | 33,553 | $ | 32,011 | $ | 14,050 | $ | 48,054 | ||||||||
| Non-cash equity based compensation | (90 | ) | 1,917 | 510 | 8 | |||||||||||
| Non-cash portion of interest expense | 2,365 | 2,306 | 1,994 | 1,944 | ||||||||||||
| Realized losses on investment securities | - | 66 | - | - | ||||||||||||
| Non-recurring general and administrative expenses[1] | 302 | 188 | - | - | ||||||||||||
| Class B distributions | - | (94 | ) | 309 | 124 | |||||||||||
| Amortization of above and below-market leases and ground lease assets and liabilities, net | (52 | ) | 94 | 101 | 109 | |||||||||||
| Straight-line rent | (3,236 | ) | (3,697 | ) | (3,437 | ) | (4,439 | ) | ||||||||
| (Gains) losses on hedges and derivatives deemed ineffective | (2,679 | ) | (1,505 | ) | 508 | (1,448 | ) | |||||||||
| Unrealized losses (gains) on non-functional foreign currency advances not designated as net investment hedges | 623 | - | 11,842 | (8,907 | ) | |||||||||||
| Amortization of mortgage premiums | (122 | ) | (123 | ) | (202 | ) | (42 | ) | ||||||||
| Adjusted funds from operations (AFFO) | $ | 30,664 | $ | 31,163 | $ | 25,675 | $ | 35,403 | ||||||||
| Fully diluted shares outstanding[2] (thousands) | 171,838 | 170,934 | 182,190 | 179,156 | ||||||||||||
| FFO per diluted share | $ | 0.21 | $ | 0.17 | $ | (0.13 | ) | $ | 0.26 | |||||||
| Core FFO per diluted share | 0.20 | 0.19 | 0.08 | 0.27 | ||||||||||||
| AFFO per diluted share | 0.18 | 0.18 | 0.14 | 0.20 | ||||||||||||
| Dividends declared | $ | 30,306 | $ | 30,314 | $ | 24,289 | $ | 31,364 | ||||||||
Footnotes:
[1] Represents our estimate of non-recurring internal audit service fees.
[2] Fully diluted shares outstanding represents common shares outstanding and all participating common share equivalents (OP units, unvested restricted stock units and unearned LTIP units equivalent) as of each respective reporting period.
| 11 |
| Global Net Lease, Inc. | ||||||||||
| Supplemental Information | ||||||||||
| Quarter ended December 31, 2015 (unaudited) | ||||||||||
| Debt Overview | ||||||||||
| As of December 31, 2015 | ||||||||||
| Amounts in thousands, except per share data, ratios and percentages |
| Year of Maturity | Number of Properties | Weighted-Average Debt Maturity (Years) | Weighted-Average Interest Rate[2] | Total Outstanding Balance | Percent | |||||||||||||||
| Non-Recourse Debt | ||||||||||||||||||||
| 2016 | - | - | - | $ | - | |||||||||||||||
| 2017 | 19 | 1.4 | 6.24 | % | 23,182 | |||||||||||||||
| 2018 | 8 | 2.6 | 2.82 | % | 83,513 | |||||||||||||||
| 2019 | 10 | 3.5 | 2.63 | % | 189,894 | |||||||||||||||
| 2020 | 35 | 4.7 | 2.94 | % | 217,136 | |||||||||||||||
| 2021 | 1 | 5.5 | 5.32 | % | 17,982 | |||||||||||||||
| 2022 | - | - | - | - | ||||||||||||||||
| Total Non-Recourse Debt | 73 | 3.8 | 3.04 | % | $ | 531,708 | 43 | % | ||||||||||||
| Recourse Debt | ||||||||||||||||||||
| Senior Unsecured Credit Facility[1] | 0.6 | 2.17 | % | $ | 717,286 | |||||||||||||||
| Total Recourse Debt | 0.6 | 2.17 | % | $ | 717,286 | 57 | % | |||||||||||||
| Total Debt | 2.0 | 2.54 | % | $ | 1,248,994 | 100 | % | |||||||||||||
| Total Debt by Currency | Percent | |||||
| USD | 23 | % | ||||
| EUR | 40 | % | ||||
| GBP | 37 | % | ||||
| Total | 100 | % | ||||
Footnotes:
[1] Credit facility has an initial maturity date of July 25, 2016 with two one-year extensions, subject to certain conditions. Weighted average debt maturity assumes that the extensions are exercised.
[2] As of December 31, 2015, the Company’s total combined debt had a weighted average interest rate cost of 2.5%, of which 63.4% was fixed rate or swapped to a fixed rate and 36.6% at floating rate.
| 12 |
| Global Net Lease, Inc. | |||||
| Supplemental Information | |||||
| Quarter ended December 31, 2015 (unaudited) | |||||
| Investment Activity | |||||
| As of December 31, 2015 | |||||
| Amounts in thousands, except per share data, ratios and percentages | |||||
| 2015 Acquisitions | ||||||||||||||
| Property | Property Location(s) | Purchase Price [1] | Closing Date | Property Type(s) | Gross Square Footage | |||||||||
| 1Q15 | ||||||||||||||
| C&J Energy | 3990 Rogerdale, Houston, TX | Mar 05, 2015 | Office | 125 | ||||||||||
| FedEx Ground Package System, Inc. | 603 West b1550 South, Salina, UT | Mar 12, 2015 | Distribution | 12 | ||||||||||
| 1Q15 Total | $ | 38,655 | 137 | |||||||||||
| 2Q15 | ||||||||||||||
| FedEx Ground Package System, Inc. | 3815 Airport Road, Pierre, SD | Apr 09, 2015 | Distribution | 26 | ||||||||||
| Fresenius | 520 Physicians Lane, Sumter, SC | May 01, 2015 | Office | 10 | ||||||||||
| 2Q15 Total | $ | 8,529 | 36 | |||||||||||
| 3Q15 | ||||||||||||||
| Fresenius | 3801 Woodlake Dr, Hephzibah, GA | Jul 15, 2015 | Office | 6 | ||||||||||
| Crowne Group | 24358 Groesbeck Highway, Warren, MI | Aug 03, 2015 | Industrial | 92 | ||||||||||
| Crowne Group | 576 Beck Street, Jonesville, MI | Aug 03, 2015 | Industrial | 89 | ||||||||||
| Crowne Group | 18401 Malyn Blvd, Fraser, MI | Aug 03, 2015 | Industrial | 115 | ||||||||||
| Crowne Group | 3108 Highway 76 East, Marion, SC | Aug 31, 2015 | Industrial | 225 | ||||||||||
| Crowne Group | 4004 North US 421, Madison, IN | Aug 31, 2015 | Industrial | 232 | ||||||||||
| Crowne Group | 101 East Industrial Blvd, Logansport, IN | Aug 31, 2015 | Industrial | 186 | ||||||||||
| JIT Steel | 610 Manufacturers Way, Chattanooga, TN | Sep 08, 2015 | Industrial | 76 | ||||||||||
| JIT Steel | 530 Manufacturers Way, Chattanooga, TN | Sep 08, 2015 | Industrial | 51 | ||||||||||
| Mapes & Sprowl | 1100 East Devon Avenue, Elk Grove Village, IL | Sep 08, 2015 | Industrial | 61 | ||||||||||
| Beacon Health | 3355 Douglas Rd, South Bend, IN | Sep 16, 2015 | Office | 50 | ||||||||||
| National Oilwell [2] | 4612 County Road 430, Pleasanton, TX | Sep 17, 2015 | Industrial | 16 | ||||||||||
| Office Depot | Columbusweg 33, Venlo, The Netherlands | Sep 22, 2015 | Office | 206 | ||||||||||
| Finnair | Helsinki Airport, Helsinki, Finland | Sep 23, 2015 | Industrial | 656 | ||||||||||
| Hannibal | 6501 Bimgle Rd, Houston, TX | Sep 24, 2015 | Industrial | 109 | ||||||||||
| FedEx | 1730 Energy Drive, Mankato, MN | Sep 25, 2015 | Industrial | 91 | ||||||||||
| 3Q15 Total | $ | 207,823 | 2,261 | |||||||||||
| 4Q15 | ||||||||||||||
| 4Q15 Total | $ | - | - | |||||||||||
| Year-to-Date Total Acqusitions | $ | 255,007 | 2,434 | |||||||||||
Footnotes:
[1] Purchase price, excluding acquisition related costs, based on the exchange rate at the date of purchase, where applicable.
[2] The property was initially acquired in May 2014. The company has expanded the property in September 2015 by purchasing an additional 15,975 square feet with 14.5 years of remaining lease term as of December 31, 2015.
| 13 |
| Global Net Lease, Inc. | ||||||
| Supplemental Information | ||||||
| Quarter ended December 31, 2015 (unaudited) | ||||||
| Top Ten Tenants | ||||||
| As of December 31, 2015 | ||||||
| Amounts in thousands, except per share data, ratios and percentages | ||||||
| Tenant / Lease Guarantor | Property Type | Tenant Industry | GAAP NOI[1] | Percent | ||||||||
| RWE AG | Office | Utilities | $ | 10,396 | 5 | % | ||||||
| FedEx Ground Package System, Inc. | Distribution | Freight | 9,620 | 5 | % | |||||||
| Family Dollar | Retail | Discount Retail | 8,825 | 4 | % | |||||||
| Government Services Administration (GSA) | Office | Government | 8,571 | 4 | % | |||||||
| Finnair | Industrial | Aerospace | 8,546 | 4 | % | |||||||
| Quest Diagnostics, Inc. | Office | Healthcare | 6,308 | 3 | % | |||||||
| Crown Crest | Distribution | Retail Food Distribution | 5,890 | 3 | % | |||||||
| Tokmanni | Office | Discount Retail | 5,618 | 3 | % | |||||||
| Fujitsu Office Properties | Office | Technology | 4,779 | 2 | % | |||||||
| Trinity Health | Office | Healthcare | 4,656 | 2 | % | |||||||
| Subtotal | $ | 73,208 | 35 | % | ||||||||
| Remaining portfolio | 128,028 | 65 | % | |||||||||
| Total Portfolio | $ | 201,236 | 100 | % | ||||||||
Footnotes:
[1] GAAP NOI is on an annualized basis and is based on foreign currency exchange rates as of December 31, 2015.
| 14 |
| Global Net Lease, Inc. | ||||||||||||||||
| Supplemental Information | ||||||||||||||||
| Quarter ended December 31, 2015 (unaudited) | ||||||||||||||||
| Diversification by Property Type | ||||||||||||||||
| As of December 31, 2015 | ||||||||||||||||
| Amounts in thousands, except per share data, ratios and percentages | ||||||||||||||||
| Total Portfolio | Unencumbered Portfolio | |||||||||||||||||||||||||||||||
| Property Type | GAAP NOI[1] | GAAP NOI Percent | Square Footage | Sq. ft. Percent | GAAP NOI[1] | GAAP NOI Percent | Square Footage | Sq. ft. Percent | ||||||||||||||||||||||||
| Office | $ | 107,430 | 53 | % | 7,075 | 38 | % | $ | 52,055 | 46 | % | 3,410 | 29 | % | ||||||||||||||||||
| Industrial | 38,834 | 19 | % | 5,004 | 27 | % | 26,819 | 24 | % | 3,762 | 32 | % | ||||||||||||||||||||
| Retail | 30,346 | 15 | % | 2,920 | 16 | % | 15,887 | 14 | % | 1,796 | 15 | % | ||||||||||||||||||||
| Distribution | 22,346 | 11 | % | 3,683 | 20 | % | 15,476 | 14 | % | 2,702 | 23 | % | ||||||||||||||||||||
| Other | 2,279 | 1 | % | 58 | 0 | % | 2,279 | 2 | % | 58 | 0 | % | ||||||||||||||||||||
| Total | $ | 201,236 | 100 | % | 18,740 | 100 | % | $ | 112,516 | 100 | % | 11,727 | 100 | % | ||||||||||||||||||
Footnotes:
[1] GAAP NOI is on an annualized basis and is based on foreign currency exchange rates as of December 31, 2015.
| 15 |
| Global Net Lease, Inc. | ||||||||||||||||
| Supplemental Information | ||||||||||||||||
| Quarter ended December 31, 2015 (unaudited) | ||||||||||||||||
| Diversification by Tenant Industry | ||||||||||||||||
| As of December 31, 2015 | ||||||||||||||||
| Amounts in thousands, except per share data, ratios and percentages | ||||||||||||||||
| Total Portfolio | Unencumbered Portfolio | |||||||||||||||||||||||||||||||
| Industry Type | GAAP NOI[1] | GAAP NOI Percent | Square Footage | Sq. ft. Percent | GAAP NOI[1] | GAAP NOI Percent | Square Footage | Sq. ft. Percent | ||||||||||||||||||||||||
| Financial Services | $ | 20,252 | 10 | % | 1,650 | 9 | % | $ | 5,061 | 4 | % | 559 | 5 | % | ||||||||||||||||||
| Discount Retail | 18,248 | 9 | % | 2,032 | 11 | % | 12,630 | 11 | % | 1,231 | 10 | % | ||||||||||||||||||||
| Technology | 16,424 | 8 | % | 892 | 5 | % | 5,517 | 5 | % | 253 | 2 | % | ||||||||||||||||||||
| Aerospace | 14,323 | 7 | % | 1,258 | 7 | % | 5,777 | 5 | % | 602 | 5 | % | ||||||||||||||||||||
| Energy | 14,097 | 7 | % | 1,043 | 6 | % | 14,097 | 13 | % | 1,043 | 9 | % | ||||||||||||||||||||
| Healthcare | 12,294 | 6 | % | 664 | 4 | % | 5,986 | 5 | % | 440 | 4 | % | ||||||||||||||||||||
| Utilities | 12,288 | 6 | % | 673 | 4 | % | - | - | - | - | ||||||||||||||||||||||
| Freight | 11,087 | 6 | % | 1,164 | 6 | % | 11,087 | 10 | % | 1,164 | 10 | % | ||||||||||||||||||||
| Pharmaceuticals | 9,789 | 5 | % | 390 | 2 | % | 9,789 | 9 | % | 390 | 3 | % | ||||||||||||||||||||
| Telecommunications | 8,821 | 4 | % | 648 | 3 | % | 2,164 | 2 | % | 133 | 1 | % | ||||||||||||||||||||
| Government | 8,571 | 4 | % | 333 | 2 | % | 8,571 | 8 | % | 333 | 3 | % | ||||||||||||||||||||
| Auto Manufacturing | 6,556 | 3 | % | 1,940 | 10 | % | 6,556 | 6 | % | 1,940 | 17 | % | ||||||||||||||||||||
| Retail Food Distribution | 5,890 | 3 | % | 806 | 4 | % | - | - | - | - | ||||||||||||||||||||||
| Restaurant - Quick Service | 3,419 | 2 | % | 74 | 0 | % | - | - | - | - | ||||||||||||||||||||||
| Specialty Retail | 3,390 | 2 | % | 280 | 1 | % | - | - | - | - | ||||||||||||||||||||||
| Automotive Parts Supplier | 3,380 | 2 | % | 411 | 2 | % | 1,311 | 1 | % | 91 | 1 | % | ||||||||||||||||||||
| Home Decor | 3,256 | 2 | % | 565 | 3 | % | 3,256 | 3 | % | 565 | 5 | % | ||||||||||||||||||||
| Metal Processing | 2,862 | 1 | % | 448 | 2 | % | 2,862 | 3 | % | 448 | 4 | % | ||||||||||||||||||||
| Home Maintenance | 2,447 | 1 | % | 231 | 1 | % | - | - | - | - | ||||||||||||||||||||||
| Office Supplies | 2,181 | 1 | % | 206 | 1 | % | 2,181 | 2 | % | 206 | 2 | % | ||||||||||||||||||||
| Foot Apparel | 2,141 | 1 | % | 589 | 3 | % | 2,141 | 2 | % | 589 | 5 | % | ||||||||||||||||||||
| Metal Fabrication | 2,120 | 1 | % | 297 | 2 | % | 2,120 | 2 | % | 297 | 3 | % | ||||||||||||||||||||
| Consumer Goods | 2,030 | 1 | % | 272 | 1 | % | 1,049 | 1 | % | 96 | 1 | % | ||||||||||||||||||||
| Other [2] | 15,370 | 8 | % | 1,875 | 10 | % | 10,360 | 9 | % | 1,348 | 11 | % | ||||||||||||||||||||
| Total | $ | 201,236 | 100 | % | 18,740 | 100 | % | $ | 112,516 | 100 | % | 11,727 | 100 | % | ||||||||||||||||||
Footnotes:
[1] GAAP NOI is on an annualized basis and is based on foreign currency exchange rates as of December 31, 2015.
[2] Other includes 9 industry types as of December 31, 2015.
| 16 |
| Global Net Lease, Inc. | ||||||||||||||||
| Supplemental Information | ||||||||||||||||
| Quarter ended December 31, 2015 (unaudited) | ||||||||||||||||
| Diversification by Geography | ||||||||||||||||
| As of December 31, 2015 | ||||||||||||||||
| Amounts in thousands, except per share data, ratios and percentages | ||||||||||||||||
| Total Portfolio | Unencumbered Portfolio | |||||||||||||||||||||||||||||||
| Region | GAAP NOI[1] | GAAP NOI Percent | Square Footage | Sq. ft. Percent | GAAP NOI | GAAP NOI Percent | Square Footage | Sq. ft. Percent | ||||||||||||||||||||||||
| United States | $ | 117,125 | 58.2 | % | 12,085 | 64.5 | % | $ | 103,917 | 92.4 | % | 11,173 | 95.3 | % | ||||||||||||||||||
| Texas | 23,244 | 11.6 | % | 2,010 | 10.7 | % | 18,756 | 16.7 | % | 1,608 | 13.7 | % | ||||||||||||||||||||
| Michigan | 15,966 | 7.9 | % | 2,296 | 12.3 | % | 15,966 | 14.2 | % | 2,296 | 19.6 | % | ||||||||||||||||||||
| California | 12,890 | 6.4 | % | 675 | 3.6 | % | 4,170 | 3.7 | % | 165 | 1.4 | % | ||||||||||||||||||||
| New Jersey | 8,505 | 4.2 | % | 349 | 1.9 | % | 8,505 | 7.6 | % | 349 | 3.0 | % | ||||||||||||||||||||
| Tennessee | 5,810 | 2.9 | % | 789 | 4.2 | % | 5,810 | 5.2 | % | 789 | 6.7 | % | ||||||||||||||||||||
| Indiana | 4,485 | 2.2 | % | 1,114 | 5.9 | % | 4,485 | 4.0 | % | 1,114 | 9.5 | % | ||||||||||||||||||||
| Ohio | 4,203 | 2.1 | % | 508 | 2.7 | % | 4,203 | 3.7 | % | 508 | 4.3 | % | ||||||||||||||||||||
| Pennsylvania | 3,785 | 1.9 | % | 376 | 2.0 | % | 3,785 | 3.4 | % | 376 | 3.2 | % | ||||||||||||||||||||
| Kentucky | 3,687 | 1.8 | % | 517 | 2.8 | % | 3,687 | 3.3 | % | 517 | 4.4 | % | ||||||||||||||||||||
| South Carolina | 3,587 | 1.8 | % | 424 | 2.3 | % | 3,587 | 3.2 | % | 424 | 3.6 | % | ||||||||||||||||||||
| Florida | 3,421 | 1.7 | % | 244 | 1.3 | % | 3,421 | 3.0 | % | 244 | 2.1 | % | ||||||||||||||||||||
| Illinois | 2,629 | 1.3 | % | 571 | 3.0 | % | 2,629 | 2.3 | % | 571 | 4.9 | % | ||||||||||||||||||||
| Missouri | 2,582 | 1.3 | % | 139 | 0.7 | % | 2,582 | 2.3 | % | 139 | 1.2 | % | ||||||||||||||||||||
| New York | 2,398 | 1.2 | % | 221 | 1.2 | % | 2,398 | 2.1 | % | 221 | 1.9 | % | ||||||||||||||||||||
| Minnesota | 1,865 | 0.9 | % | 150 | 0.8 | % | 1,865 | 1.7 | % | 150 | 1.3 | % | ||||||||||||||||||||
| Massachusetts | 1,772 | 0.9 | % | 127 | 0.7 | % | 1,772 | 1.6 | % | 127 | 1.1 | % | ||||||||||||||||||||
| Oklahoma | 1,617 | 0.8 | % | 159 | 0.8 | % | 1,617 | 1.4 | % | 159 | 1.4 | % | ||||||||||||||||||||
| North Carolina | 1,467 | 0.7 | % | 243 | 1.3 | % | 1,467 | 1.3 | % | 243 | 2.1 | % | ||||||||||||||||||||
| Maine | 1,441 | 0.7 | % | 50 | 0.3 | % | 1,441 | 1.3 | % | 50 | 0.4 | % | ||||||||||||||||||||
| Kansas | 1,275 | 0.6 | % | 179 | 1.0 | % | 1,275 | 1.1 | % | 179 | 1.5 | % | ||||||||||||||||||||
| Louisiana | 1,260 | 0.6 | % | 137 | 0.7 | % | 1,260 | 1.1 | % | 137 | 1.2 | % | ||||||||||||||||||||
| South Dakota | 1,119 | 0.6 | % | 54 | 0.3 | % | 1,119 | 1.0 | % | 54 | 0.5 | % | ||||||||||||||||||||
| Arizona | 982 | 0.5 | % | 159 | 0.8 | % | 982 | 0.9 | % | 159 | 1.4 | % | ||||||||||||||||||||
| North Dakota | 884 | 0.4 | % | 47 | 0.3 | % | 884 | 0.8 | % | 47 | 0.4 | % | ||||||||||||||||||||
| Colorado | 849 | 0.4 | % | 27 | 0.1 | % | 849 | 0.8 | % | 27 | 0.2 | % | ||||||||||||||||||||
| Mississippi | 800 | 0.4 | % | 81 | 0.4 | % | 800 | 0.7 | % | 81 | 0.7 | % | ||||||||||||||||||||
| Alabama | 791 | 0.4 | % | 74 | 0.4 | % | 791 | 0.7 | % | 74 | 0.6 | % | ||||||||||||||||||||
| Maryland | 785 | 0.4 | % | 120 | 0.6 | % | 785 | 0.7 | % | 120 | 1.0 | % | ||||||||||||||||||||
| Georgia | 670 | 0.3 | % | 48 | 0.3 | % | 670 | 0.6 | % | 48 | 0.4 | % | ||||||||||||||||||||
| Nebraska | 564 | 0.3 | % | 58 | 0.3 | % | 564 | 0.5 | % | 58 | 0.5 | % | ||||||||||||||||||||
| New Mexico | 468 | 0.2 | % | 46 | 0.2 | % | 468 | 0.4 | % | 46 | 0.4 | % | ||||||||||||||||||||
| Utah | 395 | 0.2 | % | 20 | 0.1 | % | 395 | 0.4 | % | 20 | 0.2 | % | ||||||||||||||||||||
| Iowa | 296 | 0.1 | % | 32 | 0.2 | % | 296 | 0.3 | % | 32 | 0.3 | % | ||||||||||||||||||||
| Delaware | 270 | 0.1 | % | 10 | 0.1 | % | 270 | 0.2 | % | 10 | 0.1 | % | ||||||||||||||||||||
| Idaho | 201 | 0.1 | % | 16 | 0.1 | % | 201 | 0.2 | % | 16 | 0.1 | % | ||||||||||||||||||||
| Arkansas | 89 | 0.0 | % | 8 | 0.0 | % | 89 | 0.1 | % | 8 | 0.1 | % | ||||||||||||||||||||
| Virginia | 76 | 0.0 | % | 8 | 0.0 | % | 76 | 0.1 | % | 8 | 0.1 | % | ||||||||||||||||||||
| United Kingdom | 39,530 | 19.6 | % | 2,708 | 14.5 | % | - | - | - | - | ||||||||||||||||||||||
| Germany | 18,607 | 9.2 | % | 1,870 | 10.0 | % | - | - | - | - | ||||||||||||||||||||||
| Finland | 14,163 | 7.0 | % | 1,457 | 7.8 | % | - | - | - | - | ||||||||||||||||||||||
| The Netherlands | 8,599 | 4.3 | % | 554 | 3.0 | % | 8,599 | 7.6 | % | 554 | 4.7 | % | ||||||||||||||||||||
| US Province | 3,212 | 1.6 | % | 65 | 0.3 | % | - | - | - | - | ||||||||||||||||||||||
| Total | $ | 201,236 | 100 | % | 18,740 | 100 | % | $ | 112,516 | 100 | % | 11,727 | 100 | % | ||||||||||||||||||
Footnotes:
[1] GAAP NOI is on an annualized basis and is based on foreign currency exchange rates as of December 31, 2015.
| 17 |
| Global Net Lease, Inc. | |||||||||
| Supplemental Information | |||||||||
| Quarter ended December 31, 2015 (unaudited) | |||||||||
| Lease Expirations | |||||||||
| As of December 31, 2015 | |||||||||
| Amounts in thousands, except per share data, ratios and percentages | |||||||||
| Year of Expiration | Number of Leases Expiring | GAAP NOI[1] | GAAP NOI Percent | Leased Rentable Square Feet | Percent of Rentable Square Feet Expiring | |||||||||||||||
| 2016 | - | $ | - | - | - | - | ||||||||||||||
| 2017 | - | - | - | - | - | |||||||||||||||
| 2018 | - | - | - | - | - | |||||||||||||||
| 2019 | - | - | - | - | - | |||||||||||||||
| 2020 | 2 | 3,482 | 1.7 | % | 386 | 2.1 | % | |||||||||||||
| 2021 | 2 | 5,003 | 2.5 | % | 323 | 1.7 | % | |||||||||||||
| 2022 | 16 | 20,260 | 10.1 | % | 1,553 | 8.3 | % | |||||||||||||
| 2023 | 25 | 17,760 | 8.8 | % | 1,891 | 10.1 | % | |||||||||||||
| 2024 | 39 | 45,312 | 22.5 | % | 3,868 | 20.6 | % | |||||||||||||
| 2025 | 35 | 20,667 | 10.3 | % | 1,758 | 9.4 | % | |||||||||||||
| 2026 | 17 | 26,964 | 13.4 | % | 2,035 | 10.9 | % | |||||||||||||
| 2027 | 10 | 2,385 | 1.2 | % | 163 | 0.9 | % | |||||||||||||
| 2028 | 47 | 8,861 | 4.4 | % | 1,058 | 5.6 | % | |||||||||||||
| 2029 | 118 | 27,182 | 13.5 | % | 2,732 | 14.6 | % | |||||||||||||
| 2030 | 9 | 4,278 | 2.1 | % | 312 | 1.7 | % | |||||||||||||
| 2031 | - | - | - | - | - | |||||||||||||||
| Thereafter (>2031) | 9 | 19,080 | 9.5 | % | 2,661 | 14.1 | % | |||||||||||||
| Total | 329 | $ | 201,236 | 100 | % | 18,740 | 100 | % | ||||||||||||
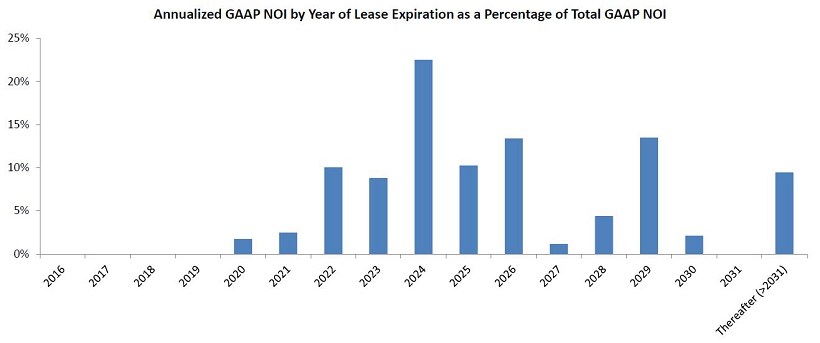
Footnotes:
[1] GAAP NOI is on an annualized basis and is based on foreign currency exchange rates as of December 31, 2015.
| 18 |