
Form 8-K Genesis Healthcare, Inc. For: Nov 05
UNITED STATES
SECURITIES AND EXCHANGE COMMISSION
Washington, D.C. 20549
Form 8-K
CURRENT REPORT
Pursuant to Section 13 or 15(d) of the
Securities Exchange Act of 1934
Date of Report (Date of earliest event reported): November 5, 2015
Genesis Healthcare, Inc.
(Exact name of registrant as specified in its charter)
|
Delaware |
|
001-33459 |
|
20-3934755 |
|
(State or Other Jurisdiction |
|
(Commission |
|
(IRS Employer |
|
101 East State Street |
|
|
|
(Address of Principal Executive Offices) |
|
(Zip Code) |
(610) 444-6350
(Registrant’s telephone number, including area code)
Not Applicable
(Former Name or Former Address, if Changed Since Last Report)
Check the appropriate box below if the Form 8-K filing is intended to simultaneously satisfy the filing obligation of the registrant under any of the following provisions:
o Written communications pursuant to Rule 425 under the Securities Act (17 CFR 230.425)
o Soliciting material pursuant to Rule 14a-12 under the Exchange Act (17 CFR 240.14a-12)
o Pre-commencement communications pursuant to Rule 14d-2(b) under the Exchange Act (17 CFR 240.14d-2(b))
o Pre-commencement communications pursuant to Rule 13e-4(c) under the Exchange Act (17 CFR 240.13e-4(c))
Item 2.02 Results of Operations and Financial Condition.
On November 5, 2015, Genesis Healthcare, Inc. (“Genesis”) issued the press release furnished herewith as Exhibit 99.1 reporting its operating results for the quarter ended September 30, 2015.
Certain information contained in the press release furnished as Exhibit 99.1 with this Current Report on Form 8-K refers to Non-GAAP measures and other definitions specific to Genesis’ businesses.
Definitions of key performance indicators and Non-GAAP measures used in the press release:
The following is a glossary of terms for some key performance indicators and Non-GAAP measures used in reference to Genesis:
“Actual Patient Days” is defined as the number of residents occupying a bed (or units in the case of an assisted living center) for one qualifying day in that period.
“Adjusted EBITDA” is defined as EBITDA adjusted for (1) the conversion to cash basis leases (2) newly acquired or constructed businesses with start-up losses and (3) other adjustments. See “Reasons for Non-GAAP Financial Disclosure” for an explanation of the adjustments and a description of Genesis’ uses of, and the limitations associated with non-GAAP measures.
“Adjusted EBITDAR” is defined as EBITDAR adjusted for (1) the conversion to cash basis leases (2) newly acquired or constructed businesses with start-up losses and (3) other adjustments. See “Reasons for Non-GAAP Financial Disclosure” for an explanation of the adjustments and a description of Genesis’ uses of, and the limitations associated with non-GAAP measures.
“Available Patient Days” is defined as the number of available beds (or units in the case of an assisted living center) multiplied by the number of days in that period.
“Average Daily Census” or “ADC” is the number of residents occupying a bed (or units in the case of an assisted living center) over a period of time, divided by the number of calendar days in that period; “EBITDA” is defined as EBITDAR less lease expense. See “Reasons for Non-GAAP Financial Disclosure” for an explanation of the adjustments and a description of Genesis’ uses of, and the limitations associated with non-GAAP measures.
“EBITDA” is defined as EBITDAR less lease expense. See “Reasons for Non-GAAP Financial Disclosure” for an explanation of the adjustments and a description of our uses of, and the limitations associated with non-GAAP measures.
“EBITDAR” is defined as net income or loss before depreciation and amortization expense, interest expense, lease expense, loss (gain) on extinguishment of debt, other (income) loss, transaction costs, long-lived asset impairment, income tax expense (benefit) and loss from discontinued operations. See “Reasons for Non-GAAP Financial Disclosure” for an explanation of the adjustments and a description of Genesis’ uses of, and the limitations associated with non-GAAP measures.
“Insurance” refers collectively to commercial insurance and managed care payor sources, but does not include managed care payers serving Medicaid residents, which are included in the Medicaid category.
“Occupancy Percentage” is measured as the percentage of Actual Patient Days relative to the Available Patient Days.
“Pro Forma Adjusted EBITDA” is defined as Adjusted EBITDA further adjusted to assume on a pro forma basis that Genesis and Skilled Healthcare Group, Inc. are combined for all periods presented. See “Reasons for Non-GAAP Financial Disclosure” for an explanation of the adjustments and a description of our uses of, and the limitations associated with non-GAAP measures.
“Pro Forma Adjusted EBITDAR” is defined as Adjusted EBITDAR further adjusted to assume on a pro forma basis that Genesis and Skilled Healthcare Group, Inc. are combined for all periods presented. See “Reasons for Non-GAAP Financial Disclosure” for an explanation of the adjustments and a description of our uses of, and the limitations associated with non-GAAP measures.
“Skilled Mix” refers collectively to Medicare and Insurance payor sources.
“Therapist Efficiency” is computed by dividing billable labor minutes related to patient care by total labor minutes for the period.
Reasons for Non-GAAP Financial Disclosure:
The press release includes references to EBITDAR, Adjusted EBITDAR, Pro Forma Adjusted EBITDAR, EBITDA, Adjusted EBITDA and Pro Forma Adjusted EBITDA which are non-GAAP financial measures (collectively, the Non-GAAP Financial Measures). For purposes of SEC Regulation G, a non-GAAP financial measure is a numerical measure of a registrant’s historical or future financial performance, financial position and cash flows that excludes amounts, or is subject to adjustments that have the effect of excluding amounts, that are included in the most directly comparable financial measure calculated and presented in accordance with GAAP in the statement of operations, balance sheet or statement of cash flows (or equivalent statements) of the registrant; or includes amounts, or is subject to adjustments that have the effect of including amounts, that are excluded from the most directly comparable financial measure so calculated and presented. In this regard, GAAP refers to generally accepted accounting principles in the United States. Pursuant to the requirements of Regulation G, Genesis has provided reconciliations of the Non-GAAP Financial Measures to the most directly comparable GAAP financial measures.
Genesis’ management believes that the presentation of these Non-GAAP Financial Measures provides useful information to investors regarding Genesis’ results of operations because these financial measures are useful for trending, analyzing and benchmarking the performance and value of its business. By excluding certain expenses and other items that may not be indicative of its core business operating results, these Non-GAAP Financial Measures:
· allow investors to evaluate its performance from management’s perspective, resulting in greater transparency with respect to supplemental information used by Genesis in its financial and operational decision making;
· facilitate comparisons with prior periods and reflect the principal basis on which management monitors financial performance;
· facilitate comparisons with the performance of others in the post-acute industry;
· provide better transparency as to the relationship each reporting period between Genesis’ cash basis lease expense and the level of operating earnings available to fund its lease expense; and
· allow investors to view Genesis’ financial performance and condition in the same manner its significant landlords and lenders require it to report financial information to them in connection with determining its compliance with financial covenants.
Genesis uses the Non-GAAP Financial Measures primarily as performance measures and believes that the GAAP financial measure most directly comparable to them is net income (loss). Genesis uses the Non-GAAP Financial Measures as measures to assess the relative performance of its operating businesses, as well as the employees responsible for operating such businesses. The Non-GAAP Financial Measures are useful in this regard because they do not include such costs as interest expense, income taxes and depreciation and amortization expense which may vary from business unit to business unit depending upon such factors as the method used to finance the original purchase of the business unit or the tax law in the state in which a business unit operates. By excluding such factors when measuring financial performance, many of which are outside of the control of the employees responsible for operating Genesis’ business units, management is better able to evaluate the operating performance of the business unit and the employees responsible for business unit performance. Consequently, management uses these non-GAAP measures to determine the extent to which Genesis’ employees have met performance goals, and therefore may or may not be eligible for incentive compensation awards.
Genesis also uses the Non-GAAP Financial Measures in its annual budget process. Genesis believes these non-GAAP measures facilitate internal comparisons to historical operating performance of prior periods and external comparisons to competitors’ historical operating performance. The presentation of these Non-GAAP Financial Measures is consistent with Genesis’ past practice and Genesis believes these measures further enable investors and analysts to compare current non-GAAP measures with non-GAAP measures presented in prior periods.
Although Genesis uses the Non-GAAP Financial Measures as financial measures to assess the performance of Genesis’ business, the use of these non-GAAP measures is limited because they do not consider certain material costs necessary to operate its business. These costs include Genesis’ lease expense (only in the case of EBITDAR, Adjusted EBITDAR and Pro Forma Adjusted EBITDAR), the cost to service its debt, the depreciation and amortization associated with its long-lived assets, losses (gains) on extinguishment of debt, transaction costs, long-lived asset impairment charges, federal and state income tax expenses, the operating results of its discontinued businesses and the income or loss attributed to non-controlling interests. Because the Non-GAAP Financial Measures do not consider these important elements of Genesis’ cost structure, a user of Genesis’ financial information who relies on the Non-GAAP Financial Measures as the only measures of Genesis’ performance could draw an incomplete or misleading conclusion regarding Genesis’ financial performance. Consequently, a user of Genesis’ financial information should consider net income (loss) as an important measure of its financial performance because it provides the most complete measure of Genesis’ performance.
Other companies may define the Non-GAAP Financial Measures differently and, as a result, Genesis’ non-GAAP measures may not be directly comparable to those of other companies. The Non-GAAP Financial Measures do not represent net income (loss), as defined by GAAP. The Non-GAAP Financial Measures should be considered in addition to, not a substitute for, or superior to, GAAP financial measures.
This information and the information contained in the press release shall not be deemed “filed” for purposes of Section 18 of the Securities Exchange Act of 1934, as amended, or otherwise subject to the liabilities of that Section. The information in this Current Report on Form 8-K is not incorporated by reference into any filings of the Company made under the Securities Act of 1933, as amended, whether made before or after the date of this Current Report on Form 8-K, regardless of any general incorporation language in the filing, unless specifically stated so therein.
Item 7.01. Regulation FD Disclosure
On or before November 10, 2015, Genesis Healthcare, Inc. (“Genesis”) will make available on its web site the investor presentation materials attached to this report as Exhibit 99.2. This information and the information contained in the presentation materials shall not be deemed “filed” for purposes of Section 18 of the Securities Exchange Act of 1934, as amended, or otherwise subject to the liabilities of that Section. The information in this Current Report on Form 8-K is not incorporated by reference into any filings of the Company made under the Securities Act of 1933, as amended, whether made before or after the date of this Current Report on Form 8-K, regardless of any general incorporation language in the filing, unless specifically stated so therein. The furnishing of these materials is not intended to constitute a representation that such furnishing is required by Regulation FD or other securities laws, or that the investor presentation materials include material information regarding Genesis that is not otherwise publicly available. In addition, Genesis does not assume any obligation to update such information in the future.
Item 9.01 Financial Statements and Exhibits.
(d) Exhibits.
|
Exhibit |
|
Description |
|
|
|
|
|
99.1 |
|
Earnings Release dated November 5, 2015 |
|
|
|
|
|
99.2 |
|
Investor presentation materials dated November 2015 |
SIGNATURES
Pursuant to the requirements of the Securities Exchange Act of 1934, the registrant has duly caused this report to be signed on its behalf by the undersigned hereunto duly authorized.
|
Date: November 5, 2015 |
GENESIS HEALTHCARE, INC. |
|
|
|
|
|
/s/ Michael S. Sherman |
|
|
Michael S. Sherman |
|
|
Senior Vice President, General Counsel, |
EXHIBIT INDEX
|
Exhibit |
|
Description |
|
|
|
|
|
99.1 |
|
Earnings Release dated November 5, 2015 |
|
|
|
|
|
99.2 |
|
Investor presentation materials dated November 2015 |
Exhibit 99.1
FOR IMMEDIATE RELEASE
Genesis HealthCare Contact:
Investor Relations
610-925-2000
GENESIS HEALTHCARE
REPORTS THIRD QUARTER 2015 RESULTS
· Strong Third Quarter Performance and Growth With Pro Forma(1) Adjusted:
· EBITDAR of $188.8 Million, up 6.3% from Prior Year Quarter
· EBITDA of $67.2 Million, up 13.1% from Prior Year Quarter
· Diluted EPS of $0.07
· Recent HUD Financing Approval Advances Balance Sheet Restructuring Initiatives; Expected to Improve Annual Free Cash Flow $25 - $30 Million
KENNETT SQUARE, PA — (November 5, 2015) — Genesis HealthCare (Genesis, or the Company) (NYSE: GEN), one of the largest post-acute care providers in the United States, today announced operating results for the quarter and nine month periods ended September 30, 2015.
Highlights
· Previously announced expense reductions yield $10.2 million of savings in the third quarter and $25.7 million of savings through the first nine months of 2015; on track to realize $35 million in 2015;
· Skilled Healthcare integration continues as planned; approximately $4.1 million of transaction synergies realized in the third quarter and $8.1 million through the first nine months of 2015; on track to realize $13 million in 2015;
· Pro forma EBITDAR margins of approximately 13.4% grew 60 bps over the prior year quarter;
· Genesis received formal portfolio credit approval from the U.S. Department of Housing and Urban Development Program (HUD);
· Genesis’ planned acquisition of Revera Inc.’s 24 skilled nursing facilities and contract rehabilitation business is on track to close by year end, subject to regulatory and licensing approvals and other customary conditions.
“We are pleased to report EBITDA growth in excess of 10% for the third consecutive quarter, exceeding our own expectations,” comments George V. Hager, Jr., Chief Executive Officer of Genesis. “Our success managing costs and leveraging our scale through acquisition were the drivers behind our 60 basis points of year-over-year EBITDAR margin expansion. Our focus remains on areas of the business where we can position Genesis for growth, including operational execution, expansion of our rehabilitation therapy segment, and integration of newly acquired and developed inpatient facilities. In the near term, we expect our M&A pipeline, incremental realization of Skilled Healthcare synergies and execution on our other strategic initiatives to position us to sustain our earnings growth rate.”
Third Quarter 2015 Results
(Unaudited)
|
|
|
Three months ended |
|
Three months ended |
|
Pro Forma(1) Non-GAAP |
| |||||||||||
|
|
|
|
|
Pro Forma(1) |
|
|
|
Pro Forma(1) |
|
|
|
|
| |||||
|
(IN THOUSANDS, EXCEPT PER SHARE DATA) |
|
GAAP |
|
Non-GAAP |
|
GAAP |
|
Non-GAAP |
|
Dollars |
|
Percentage |
| |||||
|
Net Revenues / Adjusted Net Revenues |
|
$ |
1,416,027 |
|
$ |
1,405,277 |
|
$ |
1,187,618 |
|
$ |
1,391,925 |
|
$ |
13,352 |
|
1.0 |
% |
|
EBITDAR / Adjusted EBITDAR |
|
181,231 |
|
188,779 |
|
146,384 |
|
177,571 |
|
11,208 |
|
6.3 |
% | |||||
|
EBITDA / Adjusted EBITDA |
|
143,576 |
|
67,205 |
|
113,463 |
|
59,407 |
|
7,798 |
|
13.1 |
% | |||||
|
Fully Diluted EPS / Adjusted Fully Diluted EPS |
|
(0.32 |
) |
0.07 |
|
Not applicable as Genesis was privately held |
| |||||||||||
|
|
|
Nine months ended |
|
Nine months ended |
|
Pro Forma(1) Non-GAAP |
| |||||||||||
|
|
|
|
|
Pro Forma(1) |
|
|
|
Pro Forma(1) |
|
|
|
|
| |||||
|
(IN THOUSANDS, EXCEPT PER SHARE DATA) |
|
GAAP |
|
Non-GAAP |
|
GAAP |
|
Non-GAAP |
|
Dollars |
|
Percentage |
| |||||
|
Net Revenues / Adjusted Net Revenues |
|
$ |
4,178,503 |
|
$ |
4,218,064 |
|
$ |
3,574,813 |
|
$ |
4,187,411 |
|
$ |
30,653 |
|
0.7 |
% |
|
EBITDAR / Adjusted EBITDAR |
|
542,086 |
|
572,118 |
|
456,235 |
|
539,338 |
|
32,780 |
|
6.1 |
% | |||||
|
EBITDA / Adjusted EBITDA |
|
429,053 |
|
209,983 |
|
357,606 |
|
188,975 |
|
21,008 |
|
11.1 |
% | |||||
|
Fully Diluted EPS / Adjusted Fully Diluted EPS |
|
(1.88 |
) |
0.27 |
|
Not applicable as Genesis was privately held |
| |||||||||||
(1) - To facilitate comparisons, pro forma results for the three and nine months ended September 30, 2015 and 2014 were prepared on a basis assuming the combination of Skilled Healthcare and Genesis HealthCare occurred at the beginning of the respective period presented rather than as of February 2, 2015, which is the actual date of the combination. See reconcilition of pro forma results to GAAP results in the tables in this release.
Assuming Genesis and Skilled Healthcare were fully combined in all periods presented, Genesis’ adjusted revenue of $1,405.3 million in the third quarter of 2015 would have increased $13.4 million or 1.0% over the prior year quarter. Revenue growth in the third quarter of 2015 was negatively impacted $14.0 million by the divestiture of six facilities and $8.0 million due to the loss of certain therapy contracts. As reported GAAP basis revenue of $1,416.0 million in the third quarter of 2015 increased $228.4 million or 19.2% over the prior year quarter, principally due to the combination with Skilled Healthcare in February 2015.
Assuming Genesis and Skilled Healthcare were fully combined in all periods presented, Genesis’ adjusted revenue of $4,218.1 million in the nine months ended September 30, 2015 would have increased $30.7 million or 0.7% over the prior year period. Revenue growth in the nine months ended September 30, 2015 was negatively impacted $32.0 million by the divestiture of six facilities and by $24.6 million due to the loss of therapy contacts. As reported GAAP basis revenue of $4,178.5 million in the nine months ended September 30, 2015 increased $603.7 million or 16.9% over the prior year period, principally due to the combination with Skilled Healthcare in February 2015.
Assuming Genesis and Skilled Healthcare were combined in all periods presented, adjusted EBITDAR of $188.8 million in the third quarter of 2015 would have increased $11.2 million or 6.3% over the prior year quarter. Adjusted EBITDAR growth in the third quarter of 2015 was driven by $10.2 million of planned cost reductions and approximately $4.1 million of Skilled Healthcare transaction synergies. GAAP basis loss from continuing operations of $61.0 million in the third quarter of 2015 increased $18.4 million or 43% over the prior year quarter.
Assuming Genesis and Skilled Healthcare were combined in all periods presented, adjusted EBITDAR of $572.1 million in the nine months ended September 30, 2015 would have increased $32.8 million or 6.1% over the prior year period. Adjusted EBITDAR growth in the nine months ended September 30, 2015 was driven by $25.7 million of planned cost reductions and approximately $8.1 million of Skilled
Healthcare transaction synergies. GAAP basis loss from continuing operations of $212.6 million in the nine months ended September 30, 2015 increased $98.3 million over the prior year period principally due to transaction costs incurred in the Skilled combination and other transactions, offset by the incremental earnings generated by the combined business.
Business Development, Acquisitions and Divestitures
Effective July 1, 2015, as previously announced, Genesis Rehab Services (GRS) signed 91 new therapy contracts with four key customers and acquired 22 outpatient sites. GRS now provides contract therapy services for more than 1,700 locations across 46 states, the District of Columbia and China. The integration of these new contracts is running smoothly and is on target to contribute an additional $7.5 million in annual EBITDAR.
Genesis previously announced its planned acquisition of Revera Inc.’s 24 skilled nursing facilities and contract rehabilitation business for $240 million. The acquisition is on track to close by year end, subject to regulatory and licensing approvals and other customary conditions. The acquisition is expected to contribute $34.0 million in annual EBITDAR.
Genesis continues to look strategically to monetize non-strategic assets and either redeploy the capital to investments providing greater return to shareholders or to repay Genesis’ most expensive debt. Over the next nine months, Genesis looks to sell certain non-strategic assets having the potential to produce $100 million to $150 million of net cash proceeds.
Balance Sheet Restructuring
Genesis received formal portfolio credit approval from the U.S. Department of Housing and Urban Development Program (HUD) in October 2015. Genesis received approval to finance $360 million in HUD insured loans secured by certain facilities previously owned by Skilled Healthcare and $400 million of additional HUD insured loans conditioned upon the submission to and acceptance by HUD of additional qualifying assets. Proceeds from the initial $360 million of HUD insured loan borrowings will be used to refinance a real estate bridge loan at an estimated 400 basis point per annum savings. Individual HUD guaranteed mortgages are expected to close over the course of the first and second quarters of 2016. The Company intends to utilize the additional $400 million of HUD insured loan capacity to refinance 20 properties to be acquired in the previously announced Revera transaction, 20 facility buybacks with its REIT partners and future unidentified transactions.
“We are keenly focused on increasing our facility ownership and reducing our overall cost of capital,” notes Genesis Chief Financial Officer, Tom DiVittorio. “Our ability to access HUD guaranteed financing, having attractive fixed rates of approximately 4% and 30 year maturities, is a key milestone in this repositioning strategy. Combined with our announced transactions with our REIT partners, we expect it will increase annual after-tax free cash flow between $25 million and $30 million, a nearly 40% increase off the midpoint of our 2015 guidance.”
Skilled Healthcare Loss Contingency Reserve
The Company is engaged in discussions with representatives of the Department of Justice in an effort to reach mutually acceptable resolution of two investigations involving therapy matters and staffing matters related to the former Skilled Healthcare business that combined with the Company effective February 2, 2015. Discussions have progressed to a point where Genesis believes it is appropriate to accrue an estimated loss contingency reserve of $30.0 million. Recognition of the loss contingency reserve is not an admission of liability or fault by the Company or any of its subsidiaries. Because these discussions are ongoing, there can be no certainty about the timing or likelihood of a definitive resolution. As these discussions proceed and additional information becomes available, the amount of the estimated loss contingency reserve may need to be increased or decreased to reflect this new information.
2015 Guidance
The Company reaffirms its previously announced 2015 adjusted EBITDAR guidance of $755.0 million to $770.0 million, adjusted EBITDA of $267.6 million to $282.6 million, and net income from continuing operations on a diluted basis of $0.34 to $0.39 per share.
The 2015 guidance is based on 154.6 million diluted weighted average common shares outstanding and common stock equivalents on a fully exchanged basis. The Company’s earnings guidance was prepared on a pro forma basis to reflect full year estimates assuming the operations of Skilled Healthcare were combined with those of Genesis HealthCare as of January 1, 2015.
Genesis also reaffirms its 2015 recurring free cash flow guidance of approximately $70.0 million. Projected recurring free cash flow is derived from the mid-point of the Company’s 2015 adjusted EBITDA guidance of $275.0 million further adjusted for projected cash interest of $72.0 million, recurring capital expenditures of $76.0 million and recurring cash income taxes of $56.0 million. Cash income taxes assume tax depreciation and amortization expense of approximately $62.0 million and a tax rate of 40%.
Conference Call
Genesis HealthCare will hold a conference call at 8:30 a.m. Eastern Time on Friday, November 6, 2015 to discuss financial results for the first quarter. Investors can access the conference call by calling (855) 849-2198 or live via a listen-only webcast through the Genesis web site at http://www.genesishcc.com/investor-relations/, where a replay of the call will also be posted for one year.
About Genesis HealthCare
Genesis HealthCare (NYSE: GEN) is a holding company with subsidiaries that, on a combined basis, comprise one of the nation’s largest post-acute care providers with more than 500 skilled nursing centers and assisted/senior living communities in 34 states nationwide. Genesis subsidiaries also supply rehabilitation and respiratory therapy to more than 1,700 healthcare providers in 45 states, the District of Columbia and China. References made in this release to “Genesis,” “the Company,” “we,” “us” and “our” refer to Genesis HealthCare and each of its wholly-owned companies. Visit our website at www.genesishcc.com.
Forward-Looking Statements
This release includes “forward-looking statements” within the meaning of the federal securities laws, including the Private Securities Litigation Reform Act of 1995. You can identify these statements by the fact that they do not relate strictly to historical or current facts. These statements contain words such as “may,” “will,” “project,” “might,” “expect,” “believe,” “anticipate,” “intend,” “could,” “would,” “estimate,” “continue,” “pursue, “plans” or “prospect,” or the negative or other variations thereof or comparable terminology. They include, but are not limited to, statements about Genesis’ expectations and beliefs regarding its future financial performance, its anticipated synergy cost savings from the Skilled Healthcare combination, anticipated operating expense reductions, anticipated acquisitions, anticipated divestitures, anticipated development opportunities, anticipated deleveraging opportunities, anticipated balance sheet restructuring and resolution of government investigations. These forward-looking statements are based on current expectations and projections about future events, including the assumptions stated in this release, and there can be no assurance that they will be achieved or occur, in whole or in part, in the timeframes anticipated by the Company or at all.
Investors are cautioned that forward-looking statements are not guarantees of future performance or results and involve risks and uncertainties that cannot be predicted or quantified and, consequently, the actual performance of Genesis may differ materially from that expressed or implied by such forward-looking statements.
These risks and uncertainties include, but are not limited to the following:
· reductions in Medicare reimbursement rates, or changes in the rules governing the Medicare program could have a material adverse effect on our revenue, financial condition and results of operations;
· continued efforts of federal and state governments to contain growth in Medicaid expenditures could adversely affect our revenue and profitability;
· recent federal government proposals could limit the states’ use of provider tax programs to generate revenue for their Medicaid expenditures, which could result in a reduction in our reimbursement rates under Medicaid;
· revenue we receive from Medicare and Medicaid is subject to potential retroactive reduction;
· our success is dependent upon retaining key executive and personnel;
· health reform legislation could adversely affect our revenue and financial condition;
· annual caps that limit the amounts that can be paid for outpatient therapy services rendered to any Medicare beneficiary may negatively affect our results of operations;
· we are subject to a Medicare cap amount for our hospice business. Our net patient service revenue and profitability could be adversely affected by limitations on Medicare payments;
· we are subject to extensive and complex laws and government regulations. If we are not operating in compliance with these laws and regulations or if these laws and regulations change, we could be required to make significant expenditures or change our operations in order to bring our facilities and operations into compliance;
· we face inspections, reviews, audits and investigations under federal and state government programs, such as the Department of Justice, and contracts. These investigations and audits could have adverse findings that may negatively affect our business;
· significant legal actions, which are commonplace in our professions, could subject us to increased operating costs and substantial uninsured liabilities, which would materially and adversely affect our results of operations, liquidity and financial condition;
· insurance coverage may become increasingly expensive and difficult to obtain for health care companies, and our self-insurance may expose us to significant losses;
· we may be unable to reduce costs to offset decreases in our patient census levels or other expenses completely;
· future acquisitions may use significant resources, may be unsuccessful and could expose us to unforeseen liabilities;
· we lease a significant number of our facilities and may experience risks relating to lease termination, lease extensions and special charges;
· our substantial indebtedness could adversely affect our financial health and prevent us from fulfilling our financial obligations;
· following the combination of FC-GEN Operations Investment LLC and Skilled Healthcare Group, Inc., we may not be able to continue to successfully integrate our operations, which could adversely affect us and the market price of our common stock;
· we have incurred substantial costs and expect to incur additional transaction and integration costs in connection with the combination of FC-GEN Operations Investment LLC and Skilled Healthcare Group, Inc;
· the holders of a majority of the voting power of Genesis’ common stock have entered into a voting agreement, and the control group’s interests may conflict with yours;
· some of our directors are significant stockholders or representatives of significant stockholders, which may result in the diversion of corporate opportunities and other potential conflicts; and
· we are a “controlled company” within the meaning of NYSE rules and, as a result, qualify for and rely on exemptions from certain corporate governance requirements.
The Company’s Annual Report on Form 10-K for the year ended December 31, 2014, Quarterly Reports on Form 10-Q, Current Reports on Form 8-K, and other filings with the U.S. Securities and Exchange Commission, including the Company’s Quarterly Report on Form 10-Q for the quarterly period ended September 30, 2015 when it is filed, discuss the foregoing risks as well as other important risks and uncertainties of which investors should be aware. Any forward-looking statements contained herein are made only as of the date of this release. Genesis disclaims any obligation to update the forward-looking statements. Investors are cautioned not to place undue reliance on these forward-looking statements.
Note Regarding Use of Non-GAAP Financial Measures
For a discussion of the reasons why the Company utilizes non-GAAP financial measures and believes that the presentation of such measures provides useful information to investors regarding the Company’s financial condition and results of operations, see the Current Report on Form 8-K furnished to the U.S. Securities and Exchange Commission on November 5, 2015.
###
GENESIS HEALTHCARE, INC.
CONDENSED CONSOLIDATED STATEMENTS OF OPERATIONS
(UNAUDITED)
(IN THOUSANDS, EXCEPT PER SHARE DATA)
|
|
|
Three months ended September 30, |
|
Nine months ended September 30, |
| ||||||||
|
|
|
2015 |
|
2014 |
|
2015 |
|
2014 |
| ||||
|
|
|
|
|
|
|
|
|
|
| ||||
|
Net revenues |
|
$ |
1,416,027 |
|
$ |
1,187,618 |
|
$ |
4,178,503 |
|
$ |
3,574,813 |
|
|
|
|
|
|
|
|
|
|
|
| ||||
|
Salaries, wages and benefits |
|
833,415 |
|
723,586 |
|
2,445,074 |
|
2,162,064 |
| ||||
|
Other operating expenses |
|
332,918 |
|
265,283 |
|
993,715 |
|
798,432 |
| ||||
|
General and administrative costs |
|
46,110 |
|
36,341 |
|
131,126 |
|
108,187 |
| ||||
|
Provision for losses on accounts receivable |
|
23,346 |
|
17,285 |
|
68,855 |
|
52,881 |
| ||||
|
Lease expense |
|
37,655 |
|
32,921 |
|
113,033 |
|
98,629 |
| ||||
|
Depreciation and amortization expense |
|
62,505 |
|
48,701 |
|
176,043 |
|
145,131 |
| ||||
|
Interest expense |
|
128,538 |
|
112,121 |
|
376,236 |
|
330,771 |
| ||||
|
(Gain) loss on extinguishment of debt |
|
(3,104 |
) |
— |
|
130 |
|
679 |
| ||||
|
Investment income |
|
(353 |
) |
(1,468 |
) |
(1,200 |
) |
(2,847 |
) | ||||
|
Other loss (income) |
|
38 |
|
30 |
|
(7,522 |
) |
(637 |
) | ||||
|
Transaction costs |
|
3,306 |
|
1,736 |
|
92,016 |
|
5,283 |
| ||||
|
Skilled Healthcare loss contingency expense |
|
30,000 |
|
— |
|
31,500 |
|
— |
| ||||
|
Equity in net (income) loss of unconsolidated affiliates |
|
(640 |
) |
207 |
|
(1,153 |
) |
(139 |
) | ||||
|
|
|
|
|
|
|
|
|
|
| ||||
|
Loss before income tax benefit |
|
(77,707 |
) |
(49,125 |
) |
(239,350 |
) |
(123,621 |
) | ||||
|
Income tax benefit |
|
(16,726 |
) |
(6,518 |
) |
(26,793 |
) |
(9,368 |
) | ||||
|
Loss from continuing operations |
|
(60,981 |
) |
(42,607 |
) |
(212,557 |
) |
(114,253 |
) | ||||
|
Income (loss) from discontinued operations, net of taxes |
|
39 |
|
(1,191 |
) |
(1,571 |
) |
(5,561 |
) | ||||
|
|
|
|
|
|
|
|
|
|
| ||||
|
Net loss |
|
(60,942 |
) |
(43,798 |
) |
(214,128 |
) |
(119,814 |
) | ||||
|
Less net loss (income) attributable to noncontrolling interests |
|
31,990 |
|
(961 |
) |
53,424 |
|
(1,370 |
) | ||||
|
|
|
|
|
|
|
|
|
|
| ||||
|
Net loss attributable to Genesis Healthcare, Inc. |
|
$ |
(28,952 |
) |
$ |
(44,759 |
) |
$ |
(160,704 |
) |
$ |
(121,184 |
) |
|
|
|
|
|
|
|
|
|
|
| ||||
|
Loss per common share: |
|
|
|
|
|
|
|
|
| ||||
|
|
|
|
|
|
|
|
|
|
| ||||
|
Basic and diluted: |
|
|
|
|
|
|
|
|
| ||||
|
|
|
|
|
|
|
|
|
|
| ||||
|
Weighted average shares outstanding for basic and diluted loss from continuing operations per share |
|
89,213 |
|
49,865 |
|
84,615 |
|
49,865 |
| ||||
|
|
|
|
|
|
|
|
|
|
| ||||
|
Basic and diluted net loss per common share: |
|
|
|
|
|
|
|
|
| ||||
|
Loss from continuing operations attributable to Genesis Healthcare, Inc. |
|
$ |
(0.32 |
) |
$ |
(0.88 |
) |
$ |
(1.88 |
) |
$ |
(2.32 |
) |
|
Loss from discontinued operations |
|
0.00 |
|
(0.02 |
) |
(0.02 |
) |
(0.11 |
) | ||||
|
Net loss attributable to Genesis Healthcare, Inc. |
|
$ |
(0.32 |
) |
$ |
(0.90 |
) |
$ |
(1.90 |
) |
$ |
(2.43 |
) |
GENESIS HEALTHCARE, INC.
CONDENSED CONSOLIDATED BALANCE SHEETS
(UNAUDITED)
(IN THOUSANDS)
|
|
|
September 30, 2015 |
|
December 31, 2014 |
| ||
|
|
|
|
|
|
| ||
|
Assets: |
|
|
|
|
| ||
|
Current assets: |
|
|
|
|
| ||
|
Cash and equivalents |
|
$ |
59,671 |
|
$ |
87,548 |
|
|
Accounts receivable, net of allowances for doubtful accounts |
|
759,305 |
|
605,830 |
| ||
|
Other current assets |
|
185,184 |
|
202,808 |
| ||
|
Total current assets |
|
1,004,160 |
|
896,186 |
| ||
|
Property and equipment, net of accumulated depreciation |
|
3,965,527 |
|
3,493,250 |
| ||
|
Identifiable intangible assets, net of accumulated amortization |
|
219,028 |
|
173,112 |
| ||
|
Goodwill |
|
444,446 |
|
169,681 |
| ||
|
Other long-term assets |
|
488,200 |
|
409,179 |
| ||
|
Total assets |
|
$ |
6,121,361 |
|
$ |
5,141,408 |
|
|
|
|
|
|
|
| ||
|
Liabilities and Stockholders’ Deficit: |
|
|
|
|
| ||
|
Current liabilities: |
|
|
|
|
| ||
|
Accounts payable and accrued expenses |
|
$ |
395,468 |
|
$ |
320,339 |
|
|
Accrued compensation |
|
222,689 |
|
192,838 |
| ||
|
Other current liabilities |
|
162,206 |
|
147,405 |
| ||
|
Total current liabilities |
|
780,363 |
|
660,582 |
| ||
|
|
|
|
|
|
| ||
|
Long-term debt |
|
1,036,882 |
|
525,728 |
| ||
|
Capital lease obligations |
|
1,053,547 |
|
1,002,762 |
| ||
|
Financing obligations |
|
2,993,670 |
|
2,911,200 |
| ||
|
Other long-term liabilities |
|
563,295 |
|
498,626 |
| ||
|
Stockholders’ deficit |
|
(306,396 |
) |
(457,490 |
) | ||
|
Total liabilities and stockholders’ deficit |
|
$ |
6,121,361 |
|
$ |
5,141,408 |
|
GENESIS HEALTHCARE, INC.
CONDENSED CONSOLIDATED STATEMENTS OF CASH FLOWS
(UNAUDITED)
(IN THOUSANDS)
|
|
|
Nine months ended September 30, |
| ||||
|
|
|
2015 |
|
2014 |
| ||
|
|
|
|
|
|
| ||
|
Net cash (used in) provided by operating activities |
|
$ |
(4,949 |
) |
$ |
85,364 |
|
|
Net cash used in investing activities |
|
(67,933 |
) |
(67,635 |
) | ||
|
Net cash provided by (used in) financing activities |
|
45,005 |
|
(5,575 |
) | ||
|
|
|
|
|
|
| ||
|
Net (decrease) increase in cash and equivalents |
|
(27,877 |
) |
12,154 |
| ||
|
Beginning of period |
|
87,548 |
|
61,413 |
| ||
|
|
|
|
|
|
| ||
|
End of period |
|
$ |
59,671 |
|
$ |
73,567 |
|
GENESIS HEALTHCARE, INC.
RECONCILIATION OF NET (LOSS) INCOME TO EBITDA, EBITDAR, ADJUSTED EBITDA AND ADJUSTED EBITDAR
(UNAUDITED)
(IN THOUSANDS, EXCEPT PER SHARE DATA)
|
|
|
As reported |
|
Adjustments |
|
As adjusted |
| |||||||||
|
|
|
Three months |
|
Conversion to |
|
Newly acquired or |
|
Other |
|
Three months |
| |||||
|
|
|
|
|
|
|
|
|
|
|
|
| |||||
|
Net revenues |
|
$ |
1,416,027 |
|
$ |
— |
|
$ |
(10,750 |
) |
$ |
— |
|
$ |
1,405,277 |
|
|
|
|
|
|
|
|
|
|
|
|
|
| |||||
|
Salaries, wages and benefits |
|
833,415 |
|
— |
|
(6,616 |
) |
(477 |
) |
826,322 |
| |||||
|
Other operating expenses |
|
332,918 |
|
— |
|
(6,340 |
) |
686 |
|
327,264 |
| |||||
|
General and administrative costs |
|
46,110 |
|
— |
|
— |
|
(5,194 |
) |
40,916 |
| |||||
|
Provision for losses on accounts receivable |
|
23,346 |
|
— |
|
(357 |
) |
— |
|
22,989 |
| |||||
|
Lease expense |
|
37,655 |
|
86,221 |
|
(2,302 |
) |
— |
|
121,574 |
| |||||
|
Depreciation and amortization expense |
|
62,505 |
|
(33,502 |
) |
(3,020 |
) |
— |
|
25,983 |
| |||||
|
Interest expense |
|
128,538 |
|
(105,057 |
) |
— |
|
— |
|
23,481 |
| |||||
|
Gain on extinguishment of debt |
|
(3,104 |
) |
— |
|
— |
|
3,104 |
|
— |
| |||||
|
Other income |
|
38 |
|
— |
|
(38 |
) |
— |
|
— |
| |||||
|
Investment income |
|
(353 |
) |
— |
|
— |
|
— |
|
(353 |
) | |||||
|
Transaction costs |
|
3,306 |
|
— |
|
(63 |
) |
(3,243 |
) |
— |
| |||||
|
Skilled Healthcare loss contingency expense |
|
30,000 |
|
— |
|
— |
|
(30,000 |
) |
— |
| |||||
|
Equity in net income of unconsolidated affiliates |
|
(640 |
) |
— |
|
— |
|
— |
|
(640 |
) | |||||
|
(Loss) income before income tax benefit |
|
$ |
(77,707 |
) |
$ |
52,338 |
|
$ |
7,986 |
|
$ |
35,124 |
|
$ |
17,741 |
|
|
Income tax (benefit) expense |
|
(16,726 |
) |
12,149 |
|
1,854 |
|
8,153 |
|
5,430 |
| |||||
|
(Loss) income from continuing operations |
|
$ |
(60,981 |
) |
$ |
40,189 |
|
$ |
6,132 |
|
$ |
26,971 |
|
$ |
12,311 |
|
|
Income from discontinued operations, net of taxes |
|
(39 |
) |
162 |
|
— |
|
— |
|
123 |
| |||||
|
Net (loss) income attributable to noncontrolling interests |
|
(31,990 |
) |
21,966 |
|
(351 |
) |
14,629 |
|
4,254 |
| |||||
|
|
|
|
|
|
|
|
|
|
|
|
| |||||
|
Net (loss) income attributable to Genesis Healthcare, Inc. |
|
$ |
(28,952 |
) |
$ |
18,061 |
|
$ |
6,483 |
|
$ |
12,342 |
|
$ |
7,934 |
|
|
|
|
|
|
|
|
|
|
|
|
|
| |||||
|
Depreciation and amortization expense |
|
62,505 |
|
(33,502 |
) |
(3,020 |
) |
— |
|
25,983 |
| |||||
|
Interest expense |
|
128,538 |
|
(105,057 |
) |
— |
|
— |
|
23,481 |
| |||||
|
Gain on extinguishment of debt |
|
(3,104 |
) |
— |
|
— |
|
3,104 |
|
— |
| |||||
|
Other income |
|
38 |
|
— |
|
(38 |
) |
— |
|
— |
| |||||
|
Transaction costs |
|
3,306 |
|
— |
|
(63 |
) |
(3,243 |
) |
— |
| |||||
|
Skilled Healthcare loss contingency expense |
|
30,000 |
|
— |
|
— |
|
(30,000 |
) |
— |
| |||||
|
Income tax (benefit) expense |
|
(16,726 |
) |
12,149 |
|
1,854 |
|
8,153 |
|
5,430 |
| |||||
|
Loss from discontinued operations, net of taxes |
|
(39 |
) |
162 |
|
— |
|
— |
|
123 |
| |||||
|
Net (loss) income attributable to noncontrolling interests |
|
(31,990 |
) |
21,966 |
|
(351 |
) |
14,629 |
|
4,254 |
| |||||
|
EBITDA / Adjusted EBITDA |
|
$ |
143,576 |
|
$ |
(86,221 |
) |
$ |
4,865 |
|
$ |
4,985 |
|
$ |
67,205 |
|
|
Lease expense |
|
37,655 |
|
86,221 |
|
(2,302 |
) |
— |
|
121,574 |
| |||||
|
|
|
|
|
|
|
|
|
|
|
|
| |||||
|
EBITDAR / Adjusted EBITDAR |
|
$ |
181,231 |
|
$ |
— |
|
$ |
2,563 |
|
$ |
4,985 |
|
$ |
188,779 |
|
|
|
|
|
|
|
|
|
|
|
|
|
| |||||
|
(Loss) income per common share: |
|
|
|
|
|
|
|
|
|
|
| |||||
|
|
|
|
|
|
|
|
|
|
|
|
| |||||
|
Diluted: |
|
|
|
|
|
|
|
|
|
|
| |||||
|
|
|
|
|
|
|
|
|
|
|
|
| |||||
|
Weighted average shares outstanding for diluted (loss) income from continuing operations per share (d) |
|
89,213 |
|
|
|
|
|
|
|
153,671 |
| |||||
|
|
|
|
|
|
|
|
|
|
|
|
| |||||
|
Diluted net (loss) income from continuing operations per share (e) |
|
$ |
(0.32 |
) |
|
|
|
|
|
|
$ |
0.07 |
| |||
See (a), (b), (c), (d) and (e) footnote references contained herein.
GENESIS HEALTHCARE, INC.
RECONCILIATION OF NET (LOSS) INCOME TO EBITDA, EBITDAR, ADJUSTED EBITDA AND ADJUSTED EBITDAR
(UNAUDITED)
(IN THOUSANDS, EXCEPT PER SHARE DATA)
|
|
|
As reported |
|
Adjustments |
|
As adjusted |
|
Non-GAAP as |
|
Pro forma adjusted |
| |||||||||||
|
|
|
Nine months |
|
Conversion to |
|
Newly acquired or |
|
Other |
|
Nine months |
|
Skilled Healthcare |
|
Nine months ended |
| |||||||
|
|
|
|
|
|
|
|
|
|
|
|
|
|
|
|
| |||||||
|
Net revenues |
|
$ |
4,178,503 |
|
$ |
— |
|
$ |
(32,115 |
) |
$ |
388 |
|
$ |
4,146,776 |
|
$ |
71,288 |
|
$ |
4,218,064 |
|
|
|
|
|
|
|
|
|
|
|
|
|
|
|
|
|
| |||||||
|
Salaries, wages and benefits |
|
2,445,074 |
|
— |
|
(19,129 |
) |
(477 |
) |
2,425,468 |
|
43,926 |
|
2,469,394 |
| |||||||
|
Other operating expenses |
|
993,715 |
|
— |
|
(15,993 |
) |
(10,534 |
) |
967,188 |
|
17,141 |
|
984,329 |
| |||||||
|
General and administrative costs |
|
131,126 |
|
— |
|
— |
|
(7,456 |
) |
123,670 |
|
1,516 |
|
125,186 |
| |||||||
|
Provision for losses on accounts receivable |
|
68,855 |
|
— |
|
(608 |
) |
— |
|
68,247 |
|
1,289 |
|
69,536 |
| |||||||
|
Lease expense |
|
113,033 |
|
254,566 |
|
(7,230 |
) |
— |
|
360,369 |
|
1,766 |
|
362,135 |
| |||||||
|
Depreciation and amortization expense |
|
176,043 |
|
(101,291 |
) |
(4,463 |
) |
— |
|
70,289 |
|
1,998 |
|
72,287 |
| |||||||
|
Interest expense |
|
376,236 |
|
(311,371 |
) |
(40 |
) |
— |
|
64,825 |
|
2,521 |
|
67,346 |
| |||||||
|
Loss on extinguishment of debt |
|
130 |
|
— |
|
— |
|
(130 |
) |
— |
|
— |
|
— |
| |||||||
|
Other income |
|
(7,522 |
) |
— |
|
(38 |
) |
7,560 |
|
— |
|
11 |
|
11 |
| |||||||
|
Investment income |
|
(1,200 |
) |
— |
|
— |
|
— |
|
(1,200 |
) |
— |
|
(1,200 |
) | |||||||
|
Transaction costs |
|
92,016 |
|
— |
|
(63 |
) |
(91,953 |
) |
— |
|
— |
|
— |
| |||||||
|
Skilled Healthcare loss contingency expense |
|
31,500 |
|
— |
|
— |
|
(31,500 |
) |
— |
|
|
|
— |
| |||||||
|
Equity in net income of unconsolidated affiliates |
|
(1,153 |
) |
— |
|
— |
|
— |
|
(1,153 |
) |
(146 |
) |
(1,299 |
) | |||||||
|
(Loss) income before income tax benefit |
|
$ |
(239,350 |
) |
$ |
158,096 |
|
$ |
15,449 |
|
$ |
134,878 |
|
$ |
69,073 |
|
$ |
1,266 |
|
$ |
70,339 |
|
|
Income tax (benefit) expense |
|
(26,793 |
) |
36,697 |
|
3,586 |
|
31,308 |
|
44,798 |
|
494 |
|
45,292 |
| |||||||
|
(Loss) income from continuing operations |
|
$ |
(212,557 |
) |
$ |
121,399 |
|
$ |
11,863 |
|
$ |
103,570 |
|
$ |
24,275 |
|
$ |
772 |
|
$ |
25,047 |
|
|
Loss from discontinued operations, net of taxes |
|
1,571 |
|
1,082 |
|
— |
|
— |
|
2,653 |
|
— |
|
2,653 |
| |||||||
|
Net (loss) income attributable to noncontrolling interests |
|
(53,424 |
) |
29,591 |
|
2,088 |
|
27,911 |
|
6,166 |
|
531 |
|
6,697 |
| |||||||
|
Net (loss) income attributable to Genesis Healthcare, Inc. |
|
$ |
(160,704 |
) |
$ |
90,726 |
|
$ |
9,775 |
|
$ |
75,659 |
|
$ |
15,456 |
|
$ |
241 |
|
$ |
15,697 |
|
|
|
|
|
|
|
|
|
|
|
|
|
|
|
|
|
| |||||||
|
Depreciation and amortization expense |
|
176,043 |
|
(101,291 |
) |
(4,463 |
) |
— |
|
70,289 |
|
1,998 |
|
72,287 |
| |||||||
|
Interest expense |
|
376,236 |
|
(311,371 |
) |
(40 |
) |
— |
|
64,825 |
|
2,521 |
|
67,346 |
| |||||||
|
Loss on extinguishment of debt |
|
130 |
|
— |
|
— |
|
(130 |
) |
— |
|
— |
|
— |
| |||||||
|
Other income |
|
(7,522 |
) |
— |
|
(38 |
) |
7,560 |
|
— |
|
11 |
|
11 |
| |||||||
|
Transaction costs |
|
92,016 |
|
— |
|
(63 |
) |
(91,953 |
) |
— |
|
— |
|
— |
| |||||||
|
Skilled Healthcare loss contingency expense |
|
31,500 |
|
— |
|
— |
|
(31,500 |
) |
— |
|
— |
|
— |
| |||||||
|
Income tax (benefit) expense |
|
(26,793 |
) |
36,697 |
|
3,586 |
|
31,308 |
|
44,798 |
|
494 |
|
45,292 |
| |||||||
|
Loss from discontinued operations, net of taxes |
|
1,571 |
|
1,082 |
|
— |
|
— |
|
2,653 |
|
— |
|
2,653 |
| |||||||
|
Net (loss) income attributable to noncontrolling interests |
|
(53,424 |
) |
29,591 |
|
2,088 |
|
27,911 |
|
6,166 |
|
531 |
|
6,697 |
| |||||||
|
EBITDA / Adjusted EBITDA |
|
$ |
429,053 |
|
$ |
(254,566 |
) |
$ |
10,845 |
|
$ |
18,855 |
|
$ |
204,187 |
|
$ |
5,796 |
|
$ |
209,983 |
|
|
Lease expense |
|
113,033 |
|
254,566 |
|
(7,230 |
) |
— |
|
360,369 |
|
1,766 |
|
362,135 |
| |||||||
|
|
|
|
|
|
|
|
|
|
|
|
|
|
|
|
| |||||||
|
EBITDAR / Adjusted EBITDAR |
|
$ |
542,086 |
|
$ |
— |
|
$ |
3,615 |
|
$ |
18,855 |
|
$ |
564,556 |
|
$ |
7,562 |
|
$ |
572,118 |
|
|
|
|
|
|
|
|
|
|
|
|
|
|
|
|
|
| |||||||
|
(Loss) income per common share: |
|
|
|
|
|
|
|
|
|
|
|
|
|
|
| |||||||
|
|
|
|
|
|
|
|
|
|
|
|
|
|
|
|
| |||||||
|
Diluted: |
|
|
|
|
|
|
|
|
|
|
|
|
|
|
| |||||||
|
|
|
|
|
|
|
|
|
|
|
|
|
|
|
|
| |||||||
|
Weighted average shares outstanding for diluted (loss) income from continuing operations per share (d) |
|
84,615 |
|
|
|
|
|
|
|
|
|
|
|
153,671 |
| |||||||
|
|
|
|
|
|
|
|
|
|
|
|
|
|
|
|
| |||||||
|
Diluted net (loss) income from continuing operations per share (e) |
|
$ |
(1.88 |
) |
|
|
|
|
|
|
|
|
|
|
$ |
0.27 |
| |||||
See (a), (b), (c), (d) and (e) footnote references contained herein.
GENESIS HEALTHCARE, INC.
RECONCILIATION OF NET (LOSS) INCOME TO EBITDA, EBITDAR, ADJUSTED EBITDA AND ADJUSTED EBITDAR
(UNAUDITED)
(IN THOUSANDS, EXCEPT PER SHARE DATA)
|
|
|
As reported |
|
Adjustments |
|
As adjusted |
|
Non-GAAP as |
|
Pro forma adjusted |
| |||||||||||
|
|
|
Three months ended |
|
Conversion to |
|
Newly acquired or |
|
Other |
|
Three months ended |
|
Skilled Healthcare |
|
Three months ended |
| |||||||
|
|
|
|
|
|
|
|
|
|
|
|
|
|
|
|
| |||||||
|
Net revenues |
|
$ |
1,187,618 |
|
$ |
— |
|
$ |
(3,533 |
) |
$ |
— |
|
$ |
1,184,085 |
|
$ |
207,840 |
|
$ |
1,391,925 |
|
|
|
|
— |
|
|
|
|
|
|
|
|
|
|
|
|
| |||||||
|
Salaries, wages and benefits |
|
723,586 |
|
— |
|
(3,444 |
) |
(308 |
) |
719,834 |
|
128,793 |
|
848,627 |
| |||||||
|
Other operating expenses |
|
265,283 |
|
— |
|
(1,744 |
) |
(1,290 |
) |
262,249 |
|
36,122 |
|
298,371 |
| |||||||
|
General and administrative costs |
|
36,341 |
|
— |
|
— |
|
— |
|
36,341 |
|
11,789 |
|
48,130 |
| |||||||
|
Provision for losses on accounts receivable |
|
17,285 |
|
— |
|
— |
|
— |
|
17,285 |
|
3,737 |
|
21,022 |
| |||||||
|
Lease expense |
|
32,921 |
|
80,625 |
|
(528 |
) |
— |
|
113,018 |
|
5,146 |
|
118,164 |
| |||||||
|
Depreciation and amortization expense |
|
48,701 |
|
(33,232 |
) |
(41 |
) |
— |
|
15,428 |
|
6,120 |
|
21,548 |
| |||||||
|
Interest expense |
|
112,121 |
|
(99,188 |
) |
— |
|
— |
|
12,933 |
|
7,836 |
|
20,769 |
| |||||||
|
Other (income) loss |
|
30 |
|
— |
|
— |
|
(30 |
) |
— |
|
26 |
|
26 |
| |||||||
|
Investment income |
|
(1,468 |
) |
— |
|
— |
|
— |
|
(1,468 |
) |
— |
|
(1,468 |
) | |||||||
|
Transaction costs |
|
1,736 |
|
— |
|
— |
|
(1,736 |
) |
— |
|
— |
|
— |
| |||||||
|
Equity in net loss of unconsolidated affiliates |
|
207 |
|
— |
|
— |
|
— |
|
207 |
|
(568 |
) |
(361 |
) | |||||||
|
(Loss) income before income tax benefit |
|
$ |
(49,125 |
) |
$ |
51,795 |
|
$ |
2,224 |
|
$ |
3,364 |
|
$ |
8,258 |
|
$ |
8,839 |
|
$ |
17,097 |
|
|
Income tax (benefit) expense |
|
(6,518 |
) |
5,190 |
|
194 |
|
345 |
|
(789 |
) |
3,105 |
|
2,316 |
| |||||||
|
(Loss) income from continuing operations |
|
$ |
(42,607 |
) |
$ |
46,605 |
|
$ |
2,030 |
|
$ |
3,019 |
|
$ |
9,047 |
|
$ |
5,734 |
|
$ |
14,781 |
|
|
Loss (income) from discontinued operations, net of taxes |
|
1,191 |
|
(621 |
) |
— |
|
— |
|
570 |
|
— |
|
570 |
| |||||||
|
Net loss attributable to noncontrolling interests |
|
961 |
|
— |
|
— |
|
— |
|
961 |
|
— |
|
961 |
| |||||||
|
Net (loss) income attributable to Genesis Healthcare, Inc. |
|
$ |
(44,759 |
) |
$ |
47,226 |
|
$ |
2,030 |
|
$ |
3,019 |
|
$ |
7,516 |
|
$ |
5,734 |
|
$ |
13,250 |
|
|
|
|
|
|
|
|
|
|
|
|
|
|
|
|
|
| |||||||
|
Depreciation and amortization expense |
|
48,701 |
|
(33,232 |
) |
(41 |
) |
— |
|
15,428 |
|
6,120 |
|
21,548 |
| |||||||
|
Interest expense |
|
112,121 |
|
(99,188 |
) |
— |
|
— |
|
12,933 |
|
7,836 |
|
20,769 |
| |||||||
|
Other (income) loss |
|
30 |
|
— |
|
— |
|
(30 |
) |
— |
|
(7 |
) |
(7 |
) | |||||||
|
Transaction costs |
|
1,736 |
|
— |
|
— |
|
(1,736 |
) |
— |
|
— |
|
— |
| |||||||
|
Income tax (benefit) expense |
|
(6,518 |
) |
5,190 |
|
194 |
|
345 |
|
(789 |
) |
3,105 |
|
2,316 |
| |||||||
|
Loss (income) from discontinued operations, net of taxes |
|
1,191 |
|
(621 |
) |
— |
|
— |
|
570 |
|
— |
|
570 |
| |||||||
|
Net income attributable to noncontrolling interests |
|
961 |
|
— |
|
— |
|
— |
|
961 |
|
— |
|
961 |
| |||||||
|
|
|
|
|
|
|
|
|
|
|
|
|
|
|
|
| |||||||
|
EBITDA / Adjusted EBITDA |
|
$ |
113,463 |
|
$ |
(80,625 |
) |
$ |
2,183 |
|
$ |
1,598 |
|
$ |
36,619 |
|
$ |
22,788 |
|
$ |
59,407 |
|
|
Lease expense |
|
32,921 |
|
80,625 |
|
(528 |
) |
— |
|
113,018 |
|
5,146 |
|
118,164 |
| |||||||
|
|
|
|
|
|
|
|
|
|
|
|
|
|
|
|
| |||||||
|
EBITDAR / Adjusted EBITDAR |
|
$ |
146,384 |
|
$ |
— |
|
$ |
1,655 |
|
$ |
1,598 |
|
$ |
149,637 |
|
$ |
27,934 |
|
$ |
177,571 |
|
|
|
|
|
|
|
|
|
|
|
|
|
|
|
|
|
| |||||||
|
Loss per common share: |
|
|
|
|
|
|
|
|
|
|
|
|
|
|
| |||||||
|
|
|
|
|
|
|
|
|
|
|
|
|
|
|
|
| |||||||
|
Diluted: |
|
|
|
|
|
|
|
|
|
|
|
|
|
|
| |||||||
|
|
|
|
|
|
|
|
|
|
|
|
|
|
|
|
| |||||||
|
Weighted average shares outstanding for diluted (loss) income from continuing operations per share (d) |
|
49,865 |
|
|
|
|
|
|
|
|
|
|
|
|
| |||||||
|
|
|
|
|
|
|
|
|
|
|
|
|
|
|
|
| |||||||
|
Diluted net (loss) income from continuing operations per share (e) |
|
$ |
(0.88 |
) |
|
|
|
|
|
|
|
|
|
|
Not calculated |
| ||||||
See (a), (b), (c), (d) and (e) footnote references contained herein.
GENESIS HEALTHCARE, INC.
RECONCILIATION OF NET (LOSS) INCOME TO EBITDA, EBITDAR, ADJUSTED EBITDA AND ADJUSTED EBITDAR
(UNAUDITED)
(IN THOUSANDS, EXCEPT PER SHARE DATA)
|
|
|
As reported |
|
Adjustments |
|
As adjusted |
|
Non-GAAP as |
|
Pro forma adjusted |
| |||||||||||
|
|
|
Nine months ended |
|
Conversion to |
|
Newly acquired or |
|
Other |
|
Nine months ended |
|
Skilled Healthcare |
|
Nine months ended |
| |||||||
|
|
|
|
|
|
|
|
|
|
|
|
|
|
|
|
| |||||||
|
Net revenues |
|
$ |
3,574,813 |
|
$ |
— |
|
$ |
(10,711 |
) |
$ |
1,166 |
|
$ |
3,565,268 |
|
$ |
622,143 |
|
$ |
4,187,411 |
|
|
|
|
— |
|
|
|
|
|
|
|
|
|
|
|
|
| |||||||
|
Salaries, wages and benefits |
|
2,162,064 |
|
— |
|
(8,488 |
) |
(2,014 |
) |
2,151,562 |
|
388,727 |
|
2,540,289 |
| |||||||
|
Other operating expenses |
|
798,432 |
|
— |
|
(4,796 |
) |
(2,123 |
) |
791,513 |
|
125,134 |
|
916,647 |
| |||||||
|
General and administrative costs |
|
108,187 |
|
— |
|
— |
|
— |
|
108,187 |
|
24,089 |
|
132,276 |
| |||||||
|
Provision for losses on accounts receivable |
|
52,881 |
|
— |
|
— |
|
— |
|
52,881 |
|
10,215 |
|
63,096 |
| |||||||
|
Lease expense |
|
98,629 |
|
238,505 |
|
(1,613 |
) |
— |
|
335,521 |
|
14,842 |
|
350,363 |
| |||||||
|
Depreciation and amortization expense |
|
145,131 |
|
(98,625 |
) |
(114 |
) |
— |
|
46,392 |
|
18,240 |
|
64,632 |
| |||||||
|
Interest expense |
|
330,771 |
|
(292,256 |
) |
— |
|
— |
|
38,515 |
|
23,475 |
|
61,990 |
| |||||||
|
Loss on extinguishment of debt |
|
679 |
|
— |
|
— |
|
(679 |
) |
— |
|
— |
|
— |
| |||||||
|
Other (income) loss |
|
(637 |
) |
— |
|
— |
|
637 |
|
— |
|
(136 |
) |
(136 |
) | |||||||
|
Investment income |
|
(2,847 |
) |
— |
|
— |
|
— |
|
(2,847 |
) |
— |
|
(2,847 |
) | |||||||
|
Transaction costs |
|
5,283 |
|
— |
|
— |
|
(5,283 |
) |
— |
|
— |
|
— |
| |||||||
|
Equity in net income of unconsolidated affiliates |
|
(139 |
) |
— |
|
— |
|
— |
|
(139 |
) |
(1,206 |
) |
(1,345 |
) | |||||||
|
(Loss) income before income tax benefit |
|
$ |
(123,621 |
) |
$ |
152,376 |
|
$ |
4,300 |
|
$ |
10,628 |
|
$ |
43,683 |
|
$ |
18,763 |
|
$ |
62,446 |
|
|
Income tax (benefit) expense |
|
(9,368 |
) |
11,547 |
|
326 |
|
805 |
|
3,310 |
|
7,553 |
|
10,863 |
| |||||||
|
(Loss) income from continuing operations |
|
$ |
(114,253 |
) |
$ |
140,829 |
|
$ |
3,974 |
|
$ |
9,823 |
|
$ |
40,373 |
|
$ |
11,210 |
|
$ |
51,583 |
|
|
Loss from discontinued operations, net of taxes |
|
5,561 |
|
(2,585 |
) |
— |
|
— |
|
2,976 |
|
— |
|
2,976 |
| |||||||
|
Net loss attributable to noncontrolling interests |
|
1,370 |
|
— |
|
— |
|
— |
|
1,370 |
|
— |
|
1,370 |
| |||||||
|
Net (loss) income attributable to Genesis Healthcare, Inc. |
|
$ |
(121,184 |
) |
$ |
143,414 |
|
$ |
3,974 |
|
$ |
9,823 |
|
$ |
36,027 |
|
$ |
11,210 |
|
$ |
47,237 |
|
|
|
|
|
|
|
|
|
|
|
|
|
|
|
|
|
| |||||||
|
Depreciation and amortization expense |
|
145,131 |
|
(98,625 |
) |
(114 |
) |
— |
|
46,392 |
|
18,240 |
|
64,632 |
| |||||||
|
Interest expense |
|
330,771 |
|
(292,256 |
) |
— |
|
— |
|
38,515 |
|
23,475 |
|
61,990 |
| |||||||
|
Loss on extinguishment of debt |
|
679 |
|
— |
|
— |
|
(679 |
) |
— |
|
21 |
|
21 |
| |||||||
|
Other (income) loss |
|
(637 |
) |
— |
|
— |
|
637 |
|
— |
|
(114 |
) |
(114 |
) | |||||||
|
Transaction costs |
|
5,283 |
|
— |
|
— |
|
(5,283 |
) |
— |
|
— |
|
— |
| |||||||
|
Income tax (benefit) expense |
|
(9,368 |
) |
11,547 |
|
326 |
|
805 |
|
3,310 |
|
7,553 |
|
10,863 |
| |||||||
|
Loss (income) from discontinued operations, net of taxes |
|
5,561 |
|
(2,585 |
) |
— |
|
— |
|
2,976 |
|
— |
|
2,976 |
| |||||||
|
Net income attributable to noncontrolling interests |
|
1,370 |
|
— |
|
— |
|
— |
|
1,370 |
|
— |
|
1,370 |
| |||||||
|
|
|
|
|
|
|
|
|
|
|
|
|
|
|
|
| |||||||
|
EBITDA / Adjusted EBITDA |
|
$ |
357,606 |
|
$ |
(238,505 |
) |
$ |
4,186 |
|
$ |
5,303 |
|
$ |
128,590 |
|
$ |
60,385 |
|
$ |
188,975 |
|
|
Lease expense |
|
98,629 |
|
238,505 |
|
(1,613 |
) |
— |
|
335,521 |
|
14,842 |
|
350,363 |
| |||||||
|
|
|
|
|
|
|
|
|
|
|
|
|
|
|
|
| |||||||
|
EBITDAR / Adjusted EBITDAR |
|
$ |
456,235 |
|
$ |
— |
|
$ |
2,573 |
|
$ |
5,303 |
|
$ |
464,111 |
|
$ |
75,227 |
|
$ |
539,338 |
|
|
|
|
|
|
|
|
|
|
|
|
|
|
|
|
|
| |||||||
|
Loss per common share: |
|
|
|
|
|
|
|
|
|
|
|
|
|
|
| |||||||
|
|
|
|
|
|
|
|
|
|
|
|
|
|
|
|
| |||||||
|
Diluted: |
|
|
|
|
|
|
|
|
|
|
|
|
|
|
| |||||||
|
|
|
|
|
|
|
|
|
|
|
|
|
|
|
|
| |||||||
|
Weighted average shares outstanding for diluted (loss) income from continuing operations per share (d) |
|
49,865 |
|
|
|
|
|
|
|
|
|
|
|
|
| |||||||
|
|
|
|
|
|
|
|
|
|
|
|
|
|
|
|
| |||||||
|
Diluted net (loss) income from continuing operations per share (e) |
|
$ |
(2.32 |
) |
|
|
|
|
|
|
|
|
|
|
Not calculated |
| ||||||
See (a), (b), (c), (d) and (e) footnote references contained herein.
(a) Our leases are classified as either operating leases, capital leases or financing obligations pursuant to applicable guidance under U.S. GAAP. We view the primary provisions and economics of these leases, regardless of their accounting treatment, as being nearly identical. Virtually all of our leases are structured with triple net terms, have fixed annual rent escalators and have long-term initial maturities with renewal options. Accordingly, in connection with our evaluation of the financial performance of the Company, we reclassify all of our leases to operating lease treatment and reflect lease expense on a cash basis. This approach allows us to better understand the relationship in each reporting period of our operating performance, as measured by EBITDAR and Adjusted EBITDAR, to the cash basis obligations to our landlords in that reporting period, regardless of the lease accounting treatment. This presentation and approach is also consistent with the financial reporting and covenant compliance requirements contained in all of our major lease and loan agreements. The following table summarizes the reclassification adjustments necessary to present all leases as operating leases on a cash basis.
|
|
|
Three months ended September 30, |
|
Nine months ended September 30, |
| ||||||||
|
|
|
2015 |
|
2014 |
|
2015 |
|
2014 |
| ||||
|
|
|
(in thousands) |
| ||||||||||
|
Lease expense: |
|
|
|
|
|
|
|
|
| ||||
|
Cash rent - capital leases |
|
$ |
23,062 |
|
$ |
22,374 |
|
$ |
68,910 |
|
$ |
66,768 |
|
|
Cash rent - financing obligations |
|
64,736 |
|
61,375 |
|
191,571 |
|
181,007 |
| ||||
|
Non-cash - operating lease arrangements |
|
(1,577 |
) |
(3,124 |
) |
(5,915 |
) |
(9,270 |
) | ||||
|
Lease expense adjustments |
|
$ |
86,221 |
|
$ |
80,625 |
|
$ |
254,566 |
|
$ |
238,505 |
|
|
|
|
|
|
|
|
|
|
|
| ||||
|
Depreciation and amortization expense: |
|
|
|
|
|
|
|
|
| ||||
|
Capital lease accounting |
|
$ |
(8,495 |
) |
$ |
(8,848 |
) |
$ |
(26,570 |
) |
$ |
(27,128 |
) |
|
Financing obligation accounting |
|
(25,007 |
) |
(24,384 |
) |
(74,721 |
) |
(71,497 |
) | ||||
|
Depreciation and amortization expense adjustments |
|
$ |
(33,502 |
) |
$ |
(33,232 |
) |
$ |
(101,291 |
) |
$ |
(98,625 |
) |
|
|
|
|
|
|
|
|
|
|
| ||||
|
Interest expense: |
|
|
|
|
|
|
|
|
| ||||
|
Capital lease accounting |
|
$ |
(26,503 |
) |
$ |
(25,287 |
) |
$ |
(78,146 |
) |
$ |
(74,496 |
) |
|
Financing obligation accounting |
|
(78,554 |
) |
(73,901 |
) |
(233,225 |
) |
(217,760 |
) | ||||
|
Interest expense adjustments |
|
$ |
(105,057 |
) |
$ |
(99,188 |
) |
$ |
(311,371 |
) |
$ |
(292,256 |
) |
|
|
|
|
|
|
|
|
|
|
| ||||
|
Total pre-tax lease accounting adjustments |
|
$ |
(52,338 |
) |
$ |
(51,795 |
) |
$ |
(158,096 |
) |
$ |
(152,376 |
) |
(b) The acquisition and construction of new businesses has become an important element of our growth strategy. Many of the businesses we acquire have a history of operating losses and continue to generate operating losses in the months that follow our acquisition. Newly constructed or developed businesses also generate losses while in their start-up phase. We view these losses as both temporary and an expected component of our long-term investment in the new venture. We adjust these losses when computing Adjusted EBITDAR and Adjusted EBITDA in order to better evaluate the performance of our core business. The activities of such businesses are adjusted when computing Adjusted EBITDAR and Adjusted EBITDA until such time as a new business generates positive Adjusted EBITDA. The operating performance of new businesses are no longer adjusted when computing Adjusted EBITDAR and Adjusted EBITDA beginning the period in which a new business generates positive Adjusted EBITDA and all periods thereafter. The divestiture of underperforming or non-strategic facilities has also become an important element of our earnings optimization strategy. We eliminate the results of divested facilities beginning in the quarter in which they become divested. We view the losses associated with the wind down of such divested facilities as non-recurring and not indicative of the performance of our core business.
(c) Other adjustments represent costs or gains associated with transactions or events that we do not believe are reflective of our core recurring operating business. Other adjustments also include the effect of expensing non-cash stock-based compensation related to restricted stock units. The following items were realized in the periods presented.
|
|
|
Three months ended September 30, |
|
Nine months ended September 30, |
| ||||||||
|
|
|
2015 |
|
2014 |
|
2015 |
|
2014 |
| ||||
|
|
|
(in thousands) |
|
|
|
|
| ||||||
|
Severance and restructuring (1) |
|
$ |
742 |
|
$ |
507 |
|
$ |
3,121 |
|
$ |
2,213 |
|
|
Regulatory defense and related costs (2) |
|
2,293 |
|
460 |
|
2,755 |
|
1,960 |
| ||||
|
New business development costs (3) |
|
— |
|
631 |
|
— |
|
1,130 |
| ||||
|
Self insurance adjustment (4) |
|
— |
|
— |
|
10,500 |
|
— |
| ||||
|
Transaction costs (5) |
|
3,243 |
|
1,736 |
|
91,953 |
|
5,283 |
| ||||
|
Skilled Healthcare loss contingency expense (8) |
|
30,000 |
|
— |
|
31,500 |
|
— |
| ||||
|
Loss on early extinguishment of debt |
|
(3,104 |
) |
— |
|
130 |
|
679 |
| ||||
|
Other income (6) |
|
— |
|
30 |
|
(7,560 |
) |
(637 |
) | ||||
|
Stock based compensation (7) |
|
1,950 |
|
— |
|
2,479 |
|
— |
| ||||
|
Tax benefit from total adjustments |
|
(8,153 |
) |
(345 |
) |
(31,308 |
) |
(805 |
) | ||||
|
Total other adjustments |
|
$ |
26,971 |
|
$ |
3,019 |
|
$ |
103,570 |
|
$ |
9,823 |
|
(1) We incurred costs related to the termination, severance and restructuring of certain components of the Company’s business.
(2) We incurred legal defense and other related costs in connection with certain matters in dispute or under appeal with regulatory agencies.
(3) We incurred business development costs in connection with the evaluation and start-up of services outside our existing service offerings.
(4) We incurred a self-insured program adjustment for the actuarially developed GLPL and worker’s compensation claims related to policy periods 2014 and prior. The Company also recorded approximately $6 million of incremental development related to the first nine months of 2015, which has not been excluded from our non-GAAP results.
(5) We incurred costs associated with transactions including the combination with Skilled Healthcare Group, Inc. and other transactions.
(6) We realized a net gain on the sale of certain assets in the nine months ended September 30, 2015.
(7) We incurred $2.0 million of non-cash stock-based compensation related to restricted stock units.
(8) We recognized $31.5 million of loss contingency expense associated with three Skilled Healthcare regulatory matters.
(d) Assumes 153.7 million diluted weighted average common shares outstanding and common stock equivalents on a fully exchanged basis.
(e) Pro forma adjusted income from continuing operations per share assumes a calculated tax rate of 40%, and is computed as follows: Pro forma adjusted income before income taxes x (1 - 40% tax rate) / diluted weighted average shares on a fully exchanged basis.
GENESIS HEALTHCARE, INC.
KEY FINANCIAL PERFORMANCE INDICATORS
(UNAUDITED)
|
|
|
Three months ended September 30, |
|
Nine months ended September 30, |
| ||||||||
|
|
|
2015 |
|
2014 |
|
2015 |
|
2014 |
| ||||
|
|
|
(In thousands) |
|
(In thousands) |
| ||||||||
|
|
|
|
|
|
|
|
|
|
| ||||
|
Financial Results |
|
|
|
|
|
|
|
|
| ||||
|
Net revenues |
|
$ |
1,416,027 |
|
$ |
1,187,618 |
|
$ |
4,178,503 |
|
$ |
3,574,813 |
|
|
EBITDAR |
|
181,231 |
|
146,384 |
|
542,086 |
|
456,235 |
| ||||
|
EBITDA |
|
143,576 |
|
113,463 |
|
429,053 |
|
357,606 |
| ||||
|
Adjusted EBITDAR |
|
188,779 |
|
149,637 |
|
564,556 |
|
464,111 |
| ||||
|
Adjusted EBITDA |
|
67,205 |
|
36,619 |
|
204,187 |
|
128,590 |
| ||||
|
Pro forma adjusted EBITDAR |
|
188,779 |
|
177,571 |
|
572,118 |
|
539,338 |
| ||||
|
Pro forma adjusted EBITDA |
|
67,205 |
|
59,407 |
|
209,983 |
|
188,975 |
| ||||
INPATIENT SEGMENT:
|
|
|
Three months ended September 30, |
|
Nine months ended September 30, |
| ||||||||
|
|
|
2015 |
|
2014 |
|
2015 |
|
2014 |
| ||||
|
Occupancy Statistics - Inpatient |
|
|
|
|
|
|
|
|
| ||||
|
Available licensed beds in service at end of period |
|
56,499 |
|
46,817 |
|
56,499 |
|
46,817 |
| ||||
|
Available operating beds in service at end of period |
|
55,036 |
|
45,454 |
|
55,036 |
|
45,454 |
| ||||
|
Available patient days based on licensed beds |
|
5,164,465 |
|
4,290,770 |
|
15,095,406 |
|
12,711,149 |
| ||||
|
Available patient days based on operating beds |
|
5,027,803 |
|
4,164,658 |
|
14,652,995 |
|
12,328,771 |
| ||||
|
Actual patient days |
|
4,324,403 |
|
3,706,574 |
|
12,751,587 |
|
11,014,125 |
| ||||
|
Occupancy percentage - licensed beds |
|
83.7 |
% |
86.4 |
% |
84.5 |
% |
86.6 |
% | ||||
|
Occupancy percentage - operating beds |
|
86.0 |
% |
89.0 |
% |
87.0 |
% |
89.3 |
% | ||||
|
Skilled mix |
|
20.6 |
% |
21.1 |
% |
21.8 |
% |
21.8 |
% | ||||
|
Average daily census |
|
47,004 |
|
40,289 |
|
46,709 |
|
40,345 |
| ||||
|
Days in period |
|
92 |
|
92 |
|
273 |
|
273 |
| ||||
|
|
|
|
|
|
|
|
|
|
| ||||
|
Revenue per patient day (skilled nursing facilities) |
|
|
|
|
|
|
|
|
| ||||
|
Medicare Part A |
|
$ |
503 |
|
$ |
490 |
|
$ |
502 |
|
$ |
491 |
|
|
Medicare total (including Part B) |
|
545 |
|
528 |
|
540 |
|
529 |
| ||||
|
Insurance |
|
451 |
|
457 |
|
448 |
|
450 |
| ||||
|
Private and other |
|
263 |
|
314 |
|
295 |
|
318 |
| ||||
|
Medicaid |
|
216 |
|
213 |
|
216 |
|
213 |
| ||||
|
Medicaid (net of provider taxes) |
|
195 |
|
192 |
|
195 |
|
193 |
| ||||
|
Weighted average (net of provider taxes) |
|
$ |
266 |
|
$ |
267 |
|
$ |
270 |
|
$ |
270 |
|
|
|
|
|
|
|
|
|
|
|
| ||||
|
Patient days by payor (skilled nursing facilities) |
|
|
|
|
|
|
|
|
| ||||
|
Medicare |
|
538,503 |
|
507,110 |
|
1,691,696 |
|
1,575,033 |
| ||||
|
Insurance |
|
288,314 |
|
221,984 |
|
883,236 |
|
670,590 |
| ||||
|
Total skilled mix days |
|
826,817 |
|
729,094 |
|
2,574,932 |
|
2,245,623 |
| ||||
|
Private and other |
|
299,153 |
|
247,528 |
|
862,777 |
|
728,496 |
| ||||
|
Medicaid |
|
2,879,447 |
|
2,480,315 |
|
8,392,143 |
|
7,314,657 |
| ||||
|
Total Days |
|
4,005,417 |
|
3,456,937 |
|
11,829,852 |
|
10,288,776 |
| ||||
|
|
|
|
|
|
|
|
|
|
| ||||
|
Patient days as a percentage of total patient days (skilled nursing facilities) |
|
|
|
|
|
|
|
|
| ||||
|
Medicare |
|
13.4 |
% |
14.7 |
% |
14.3 |
% |
15.3 |
% | ||||
|
Insurance |
|
7.2 |
% |
6.4 |
% |
7.5 |
% |
6.5 |
% | ||||
|
Skilled mix |
|
20.6 |
% |
21.1 |
% |
21.8 |
% |
21.8 |
% | ||||
|
Private and other |
|
7.5 |
% |
7.2 |
% |
7.3 |
% |
7.1 |
% | ||||
|
Medicaid |
|
71.9 |
% |
71.7 |
% |
70.9 |
% |
71.1 |
% | ||||
|
Total |
|
100.0 |
% |
100.0 |
% |
100.0 |
% |
100.0 |
% | ||||
|
|
|
|
|
|
|
|
|
|
| ||||
|
Facilities at end of period |
|
|
|
|
|
|
|
|
| ||||
|
Skilled nursing facilities |
|
|
|
|
|
|
|
|
| ||||
|
Leased |
|
383 |
|
358 |
|
383 |
|
358 |
| ||||
|
Owned |
|
33 |
|
2 |
|
33 |
|
2 |
| ||||
|
Joint Venture |
|
5 |
|
5 |
|
5 |
|
5 |
| ||||
|
Managed * |
|
32 |
|
14 |
|
32 |
|
14 |
| ||||
|
Total skilled nursing facilities |
|
453 |
|
379 |
|
453 |
|
379 |
| ||||
|
Total licensed beds |
|
54,545 |
|
46,160 |
|
54,545 |
|
46,160 |
| ||||
|
|
|
|
|
|
|
|
|
|
| ||||
|
Assisted living facilities: |
|
|
|
|
|
|
|
|
| ||||
|
Leased |
|
30 |
|
28 |
|
30 |
|
28 |
| ||||
|
Owned |
|
22 |
|
1 |
|
22 |
|
1 |
| ||||
|
Joint Venture |
|
1 |
|
1 |
|
1 |
|
1 |
| ||||
|
Managed |
|
3 |
|
4 |
|
3 |
|
4 |
| ||||
|
Total assisted living facilities |
|
56 |
|
34 |
|
56 |
|
34 |
| ||||
|
Total licensed beds |
|
4,437 |
|
2,762 |
|
4,437 |
|
2,762 |
| ||||
|
Total facilities |
|
509 |
|
413 |
|
509 |
|
413 |
| ||||
|
|
|
|
|
|
|
|
|
|
| ||||
|
Total Jointly Owned and Managed— (Unconsolidated) |
|
16 |
|
17 |
|
16 |
|
17 |
| ||||
REHABILITATION THERAPY SEGMENT:
|
|
|
Three months ended September 30, |
|
Nine months ended September 30, |
| ||||||||
|
|
|
2015 |
|
2014 |
|
2015 |
|
2014 |
| ||||
|
Revenue mix %: |
|
|
|
|
|
|
|
|
| ||||
|
Company-operated |
|
37 |
% |
37 |
% |
38 |
% |
37 |
% | ||||
|
Non-affiliated |
|
63 |
% |
63 |
% |
62 |
% |
63 |
% | ||||
|
Sites of service (at end of period) |
|
1,602 |
|
1,379 |
|
1,602 |
|
1,379 |
| ||||
|
Revenue per site |
|
$ |
168,797 |
|
$ |
170,912 |
|
$ |
497,731 |
|
$ |
521,110 |
|
|
Therapist efficiency % |
|
68 |
% |
66 |
% |
69 |
% |
69 |
% | ||||
* In 2015, includes 20 facilities located in Texas for which the real estate is owned by Genesis.
SKILLED HEALTHCARE GROUP, INC.
RECONCILIATION OF NET (LOSS) INCOME TO EBITDA, EBITDAR, ADJUSTED EBITDA AND ADJUSTED EBITDAR
(UNAUDITED)
(IN THOUSANDS)
|
|
|
GAAP as |
|
|
|
Non-GAAP as |
|
|
GAAP as |
|
|
|
Non-GAAP as |
|
|
GAAP as |
|
|
|
Non-GAAP as |
| |||||||||
|
|
|
One month |
|
Adjust |
|
One month |
|
|
Three months |
|
Adjust |
|
Three months |
|
|
Nine months |
|
Adjust |
|
Nine months |
| |||||||||
|
|
|
|
|
|
|
|
|
|
|
|
|
|
|
|
|
|
|
|
|
|
| |||||||||
|
Net revenues |
|
$ |
71,288 |
|
$ |
— |
|
$ |
71,288 |
|
|
$ |
208,618 |
|
$ |
(778 |
) |
$ |
207,840 |
|
|
$ |
622,897 |
|
$ |
(754 |
) |
$ |
622,143 |
|
|
Salaries, wages and benefits |
|
44,842 |
|
(916 |
) |
43,926 |
|
|
129,198 |
|
(405 |
) |
128,793 |
|
|
389,444 |
|
(717 |
) |
388,727 |
| |||||||||
|
Other operating expenses |
|
17,486 |
|
(345 |
) |
17,141 |
|
|
43,829 |
|
(7,707 |
) |
36,122 |
|
|
141,796 |
|
(16,662 |
) |
125,134 |
| |||||||||
|
General and administrative costs |
|
1,516 |
|
— |
|
1,516 |
|
|
12,780 |
|
(991 |
) |
11,789 |
|
|
26,151 |
|
(2,062 |
) |
24,089 |
| |||||||||
|
Provision for losses on accounts receivable |
|
1,289 |
|
— |
|
1,289 |
|
|
3,737 |
|
— |
|
3,737 |
|
|
10,362 |
|
(147 |
) |
10,215 |
| |||||||||
|
Lease expense |
|
1,766 |
|
— |
|
1,766 |
|
|
5,146 |
|
— |
|
5,146 |
|
|
14,842 |
|
— |
|
14,842 |
| |||||||||
|
Depreciation and amortization expense |
|
1,998 |
|
— |
|
1,998 |
|
|
6,120 |
|
— |
|
6,120 |
|
|
18,240 |
|
— |
|
18,240 |
| |||||||||
|
Interest expense |
|
2,521 |
|
— |
|
2,521 |
|
|
7,836 |
|
— |
|
7,836 |
|
|
23,475 |
|
— |
|
23,475 |
| |||||||||
|
Loss on extinguishment of debt |
|
— |
|
— |
|
— |
|
|
21 |
|
(21 |
) |
— |
|
|
843 |
|
(843 |
) |
— |
| |||||||||
|
Impairment of long-lived assets |
|
— |
|
— |
|
— |
|
|
— |
|
— |
|
— |
|
|
82 |
|
(82 |
) |
— |
| |||||||||
|
Other (income) loss |
|
11 |
|
— |
|
11 |
|
|
26 |
|
|
|
26 |
|
|
(136 |
) |
— |
|
(136 |
) | |||||||||
|
Transaction costs |
|
4,638 |
|
(4,638 |
) |
— |
|
|
|
|
|
|
|
|
|
— |
|
— |
|
|
| |||||||||
|
Equity in net income of unconsolidated affiliates |
|
(146 |
) |
— |
|
(146 |
) |
|
(568 |
) |
— |
|
(568 |
) |
|
(1,206 |
) |
— |
|
(1,206 |
) | |||||||||
|
Income tax (benefit) expense |
|
(1,807 |
) |
2,301 |
|
494 |
|
|
(150 |
) |
3,255 |
|
3,105 |
|
|
(153 |
) |
7,706 |
|
7,553 |
| |||||||||
|
|
|
|
|
|
|
|
|
|
|
|
|
|
|
|
|
|
|
|
|
|
| |||||||||
|
Depreciation and amortization expense |
|
1,998 |
|
— |
|
1,998 |
|
|
6,120 |
|
— |
|
6,120 |
|
|
18,240 |
|
— |
|
18,240 |
| |||||||||
|
Interest expense |
|
2,521 |
|
— |
|
2,521 |
|
|
7,836 |
|
— |
|
7,836 |
|
|
23,475 |
|
— |
|
23,475 |
| |||||||||
|
Loss on extinguishment of debt |
|
— |
|
— |
|
— |
|
|
— |
|
— |
|
— |
|
|
843 |
|
(822 |
) |
21 |
| |||||||||
|
Transaction costs |
|
4,638 |
|
(4,638 |
) |
|
|
|
|
|
|
|
|
|
|
|
|
— |
|
|
| |||||||||
|
Impairment of long-lived assets |
|
— |
|
— |
|
— |
|
|
— |
|
— |
|
— |
|
|
82 |
|
(82 |
) |
— |
| |||||||||
|
Other (income) loss |
|
11 |
|
— |
|
11 |
|
|
(7 |
) |
|
|
(7 |
) |
|
(114 |
) |
— |
|
(114 |
) | |||||||||
|
Income tax (benefit) expense |
|
(1,807 |
) |
2,301 |
|
494 |
|
|
(150 |
) |
3,255 |
|
3,105 |
|
|
(153 |
) |
7,706 |
|
7,553 |
| |||||||||
|
|
|
|
|
|
|
|
|
|
|
|
|
|
|
|
|
|
|
|
|
|
| |||||||||
|
EBITDA / Adjusted EBITDA |
|
4,535 |
|
1,261 |
|
5,796 |
|
|
14,442 |
|
8,346 |
|
22,788 |
|
|
41,530 |
|
18,855 |
|
60,385 |
| |||||||||
|
Lease expense |
|
1,766 |
|
— |
|
1,766 |
|
|
5,146 |
|
— |
|
5,146 |
|
|
14,842 |
|
— |
|
14,842 |
| |||||||||
|
|
|
|
|
|
|
|
|
|
|
|
|
|
|
|
|
|
|
|
|
|
| |||||||||
|
EBITDAR / Adjusted EBITDAR |
|
$ |
6,301 |
|
$ |
1,261 |
|
$ |
7,562 |
|
|
$ |
19,588 |
|
$ |
8,346 |
|
$ |
27,934 |
|
|
$ |
56,372 |
|
$ |
18,855 |
|
$ |
75,227 |
|
The following adjustments represent costs or gains associated with transactions or events that we do not believe are reflective of Skilled Healthcare Group’s recurring operating business.
|
|
|
One month |
|
Three |
|
Nine months |
| |||
|
Severance and restructuring |
|
$ |
1,220 |
|
$ |
359 |
|
$ |
1,430 |
|
|
Regulatory defense and related costs |
|
41 |
|
— |
|
— |
| |||
|
Exist costs of divested facilities |
|
— |
|
57 |
|
397 |
| |||
|
Professional fees related to non-routine matters |
|
— |
|
6,377 |
|
13,896 |
| |||
|
Losses at skilled nursing facility not at full operation |
|
— |
|
450 |
|
583 |
| |||
|
Loss on disposal of asset |
|
— |
|
68 |
|
68 |
| |||
|
Loss on extinguishment of debt |
|
— |
|
21 |
|
843 |
| |||
|
Non-cash stock compensation |
|
371 |
|
1,014 |
|
2,460 |
| |||
|
Impairment of long-lived assets |
|
— |
|
— |
|
82 |
| |||
|
Transaction costs |
|
4,267 |
|
— |
|
— |
| |||
|
Tax benefit of total adjustments |
|
(2,301 |
) |
(3,255 |
) |
(7,706 |
) | |||
|
Total adjustments |
|
$ |
3,598 |
|
$ |
5,091 |
|
$ |
12,053 |
|
GENESIS HEALTHCARE, INC.
RECONCILIATION OF NET (LOSS) INCOME TO EBITDA, EBITDAR, ADJUSTED EBITDA AND ADJUSTED EBITDAR
2015 GUIDANCE - LOW END OF RANGE
(IN THOUSANDS, EXCEPT EPS)
|
|
|
|
|
Adjustments |
|
As adjusted |
| |||||||||
|
|
|
Twelve months |
|
Conversion to |
|
Newly acquired or |
|
Other adjustments |
|
Twelve months |
| |||||
|
|
|
|
|
|
|
|
|
|
|
|
| |||||
|
Net revenues |
|
$ |
5,660,915 |
|
$ |
— |
|
$ |
(42,865 |
) |
$ |
388 |
|
$ |
5,618,438 |
|
|
|
|
|
|
|
|
|
|
|
|
|
| |||||
|
Salaries, wages and benefits |
|
3,315,945 |
|
— |
|
(25,745 |
) |
(1,393 |
) |
3,288,807 |
| |||||
|
Other operating expenses |
|
1,347,860 |
|
— |
|
(22,333 |
) |
(13,914 |
) |
1,311,613 |
| |||||
|
General and administrative costs |
|
177,340 |
|
— |
|
— |
|
(9,406 |
) |
167,934 |
| |||||
|
Provision for losses on accounts receivable |
|
99,049 |
|
— |
|
(965 |
) |
— |
|
98,084 |
| |||||
|
Lease expense |
|
159,721 |
|
334,941 |
|
(7,230 |
) |
— |
|
487,432 |
| |||||
|
Depreciation and amortization expense |
|
236,299 |
|
(137,324 |
) |
(4,463 |
) |
— |
|
94,512 |
| |||||
|
Interest expense |
|
507,243 |
|
(421,251 |
) |
(40 |
) |
— |
|
85,952 |
| |||||
|
Loss (gain) on extinguishment of debt |
|
130 |
|
— |
|
— |
|
(130 |
) |
— |
| |||||
|
Other (income) loss |
|
(7,522 |
) |
— |
|
(38 |
) |
7,560 |
|
— |
| |||||
|
Investment income |
|
(2,000 |
) |
— |
|
— |
|
— |
|
(2,000 |
) | |||||
|
Transaction costs |
|
96,654 |
|
— |
|
(63 |
) |
(96,591 |
) |
— |
| |||||
|
Skilled Healthcare loss contingency expense |
|
31,500 |
|
— |
|
— |
|
(31,500 |
) |
— |
| |||||
|
Equity in net income of unconsolidated affiliates |
|
(1,050 |
) |
— |
|
— |
|
— |
|
(1,050 |
) | |||||
|
(Loss) income before income tax expense |
|
(300,254 |
) |
223,634 |
|
18,012 |
|
145,762 |
|
87,154 |
| |||||
|
Income tax expense (benefit) |
|
(120,102 |
) |
89,454 |
|
7,205 |
|
58,305 |
|
34,862 |
| |||||
|
Income (loss) from continuing operations |
|
(180,152 |
) |
134,180 |
|
10,807 |
|
87,457 |
|
52,292 |
| |||||
|
|
|
|
|
|
|
|
|
|
|
|
| |||||
|
Earnings (loss) per share, diluted: |
|
$ |
(1.17 |
) |
|
|
|
|
|
|
$ |
0.34 |
| |||
|
Weighted-average common shares outstanding, diluted, on a fully exchanged basis |
|
154,603 |
|
|
|
|
|
|
|
154,603 |
| |||||
|
|
|
|
|
|
|
|
|
|
|
|
| |||||
|
Adjustments to Compute EBITDA/Adjusted EBITDA and EBITDAR / Adjusted EBITDAR |
|
|
|
|
|
|
|
|
|
|
| |||||
|
Depreciation and amortization expense |
|
236,299 |
|
(137,324 |
) |
(4,463 |
) |
— |
|
94,512 |
| |||||
|
Interest expense |
|
507,243 |
|
(421,251 |
) |
(40 |
) |
— |
|
85,952 |
| |||||
|
Loss (gain) on extinguishment of debt |
|
130 |
|
— |
|
— |
|
(130 |
) |
— |
| |||||
|
Other (income) loss |
|
(7,522 |
) |
— |
|
(38 |
) |
7,560 |
|
— |
| |||||
|
Transaction costs |
|
96,654 |
|
— |
|
(63 |
) |
(96,591 |
) |
— |
| |||||
|
Skilled Healthcare loss contingency expense |
|
31,500 |
|
— |
|
— |
|
(31,500 |
) |
— |
| |||||
|
Income tax expense (benefit) |
|
(120,102 |
) |
89,454 |
|
7,205 |
|
58,305 |
|
34,862 |
| |||||
|
|
|
|
|
|
|
|
|
|
|
|
| |||||
|
EBITDA / Adjusted EBITDA |
|
$ |
564,050 |
|
$ |
(334,941 |
) |
$ |
13,408 |
|
$ |
25,101 |
|
$ |
267,618 |
|
|
Lease expense |
|
159,721 |
|
334,941 |
|
(7,230 |
) |
— |
|
487,432 |
| |||||
|
EBITDAR / Adjusted EBITDAR |
|
$ |
723,771 |
|
$ |
— |
|
$ |
6,178 |
|
$ |
25,101 |
|
$ |
755,050 |
|
GENESIS HEALTHCARE, INC.
RECONCILIATION OF NET (LOSS) INCOME TO EBITDA, EBITDAR, ADJUSTED EBITDA AND ADJUSTED EBITDAR
2015 GUIDANCE - HIGH END OF RANGE
(IN THOUSANDS, EXCEPT EPS)
|
|
|
|
|
Adjustments |
|
As adjusted |
| |||||||||
|
|
|
Twelve months |
|
Conversion to |
|
Newly acquired or |
|
Other adjustments |
|
Twelve months |
| |||||
|
|
|
|
|
|
|
|
|
|
|
|
| |||||
|
Net revenues |
|
$ |
5,740,915 |
|
$ |
— |
|
$ |
(42,865 |
) |
$ |
388 |
|
$ |
5,698,438 |
|
|
|
|
|
|
|
|
|
|
|
|
|
| |||||
|
Salaries, wages and benefits |
|
3,363,604 |
|
— |
|
(25,745 |
) |
(1,393 |
) |
3,336,466 |
| |||||
|
Other operating expenses |
|
1,365,422 |
|
— |
|
(22,333 |
) |
(13,914 |
) |
1,329,175 |
| |||||
|
General and administrative costs |
|
177,340 |
|
— |
|
— |
|
(9,406 |
) |
167,934 |
| |||||
|
Provision for losses on accounts receivable |
|
100,791 |
|
— |
|
(965 |
) |
— |
|
99,826 |
| |||||
|
Lease expense |
|
159,721 |
|
334,941 |
|
(7,230 |
) |
— |
|
487,432 |
| |||||
|
Depreciation and amortization expense |
|
237,303 |
|
(137,324 |
) |
(4,463 |
) |
— |
|
95,516 |
| |||||
|
Interest expense |
|
508,043 |
|
(421,251 |
) |
(40 |
) |
— |
|
86,752 |
| |||||
|
Loss (gain) on extinguishment of debt |
|
130 |
|
–– |
|
–– |
|
(130 |
) |
–– |
| |||||
|
Other (income) loss |
|
(7,522 |
) |
— |
|
(38 |
) |
7,560 |
|
— |
| |||||
|
Investment income |
|
(3,000 |
) |
— |
|
— |
|
— |
|
(3,000 |
) | |||||
|
Transaction costs |
|
96,654 |
|
— |
|
(63 |
) |
(96,591 |
) |
— |
| |||||
|
Skilled Healthcare loss contingency expense |
|
31,500 |
|
— |
|
— |
|
(31,500 |
) |
— |
| |||||
|
Equity in net income of unconsolidated affiliates |
|
(2,000 |
) |
— |
|
— |
|
— |
|
(2,000 |
) | |||||
|
(Loss) income before income tax expense |
|
(287,071 |
) |
223,634 |
|
18,012 |
|
145,762 |
|
100,337 |
| |||||
|
Income tax (benefit) expense |
|
(114,828 |
) |
89,454 |
|
7,205 |
|
58,305 |
|
40,136 |
| |||||
|
Income (loss) from continuing operations |
|
(172,243 |
) |
134,180 |
|
10,807 |
|
87,457 |
|
60,201 |
| |||||
|
|
|
|
|
|
|
|
|
|
|
|
| |||||
|
Earnings (loss) per share, diluted: |
|
$ |
(1.11 |
) |
|
|
|
|
|
|
$ |
0.39 |
| |||
|
Weighted-average common shares outstanding, diluted, on a fully exchanged basis |
|
154,603 |
|
|
|
|
|
|
|
154,603 |
| |||||
|
|
|
|
|
|
|
|
|
|
|
|
| |||||
|
Adjustments to Compute EBITDA/Adjusted EBITDA and EBITDAR / Adjusted EBITDAR |
|
|
|
|
|
|
|
|
|
|
| |||||
|
Depreciation and amortization expense |
|
237,303 |
|
(137,324 |
) |
(4,463 |
) |
— |
|
95,516 |
| |||||
|
Interest expense |
|
508,043 |
|
(421,251 |
) |
(40 |
) |
— |
|
86,752 |
| |||||
|
Loss (gain) on extinguishment of debt |
|
130 |
|
— |
|
— |
|
(130 |
) |
— |
| |||||
|
Other (income) loss |
|
(7,522 |
) |
— |
|
(38 |
) |
7,560 |
|
— |
| |||||
|
Transaction costs |
|
96,654 |
|
— |
|
(63 |
) |
(96,591 |
) |
— |
| |||||
|
Skilled Healthcare loss contingency expense |
|
31,500 |
|
— |
|
— |
|
(31,500 |
) |
— |
| |||||
|
Income tax (benefit) expense |
|
(114,828 |
) |
89,454 |
|
7,205 |
|
58,305 |
|
40,136 |
| |||||
|
|
|
|
|
|
|
|
|
|
|
|
| |||||
|
EBITDA / Adjusted EBITDA |
|
$ |
579,037 |
|
$ |
(334,941 |
) |
$ |
13,408 |
|
$ |
25,101 |
|
$ |
282,605 |
|
|
Lease expense |
|
159,721 |
|
334,941 |
|
(7,230 |
) |
— |
|
487,432 |
| |||||
|
EBITDAR / Adjusted EBITDAR |
|
$ |
738,758 |
|
$ |
— |
|
$ |
6,178 |
|
$ |
25,101 |
|
$ |
770,037 |
|
Exhibit 99.2
November 2015 A Leading National Provider of Post-Acute Services

Safe Harbor Statement Certain statements in this presentation regarding the expected benefits of the Skilled Healthcare transaction, future opportunities for the Company and any other statements regarding the Company’s future expectations, beliefs, goals, strategies or prospects contained in this presentation constitute “forward-looking statements” under Section 27A of the Securities Act of 1933 and Section 21E of the Securities Exchange Act of 1934. Forward-looking statements may be preceded by, followed by or include the words “may,” “will,” “believe,” “expect,” “anticipate,” “intend,” “plan,” “estimate,” “could,” “might,” or “continue” or the negative or other variations thereof or comparable terminology. A number of important factors could cause actual events or results to differ materially from those indicated by such forward-looking statements, including changes in the Company’s reimbursement rates; healthcare reform legislation; the impact of government investigations and legal actions against the Company’s centers and other factors described in the most recent Annual Report on Form 10-K of the Company and elsewhere in the Company’s filings with the Securities and Exchange Commission. You should not place undue reliance on any of these forward- looking statements. Any forward-looking statement speaks only as of the date on which it is made, and the Company undertakes no obligation to update any such statement to reflect new information, or the occurrence of future events or changes in circumstances. References made in this presentation to "Genesis," "the Company," "we," "us" and "our" refer to Genesis HealthCare, Inc. and each of its wholly-owned companies. 1

AGENDA Genesis’ Growth Strategy Financial Summary Genesis HealthCare Overview

Genesis HealthCare 3 Genesis HealthCare is now one of the largest providers of post-acute care services in the nation. Competitive Strengths 199 clinical specialty units. More than 350 Genesis physicians and nurse practitioners. Strong referral network with hospitals. Genesis also supplies contract rehabilitation services across 45 states. ~100,000 dedicated teammates 500+ facilities 34 States

Revenue: $1,414 507 Facilities + 24 Facilities 428 Facilities 234 Facilities 214 Facilities 214 Facilities December 2003: GHC spun off as a separate publicly traded company February 2015: Acquired Skilled Healthcare; publicly traded NYSE:GEN Long Track Record of Growth July 2007: LBO by Formation Capital and JER Partners April 2011: Sale/leaseback with Health Care REIT for $2.4B December 2012: Acquired Sun Healthcare for $300M $ in millions 4 2003 2007 2011 2012 2015 Revenue: $1,973 Revenue: $2,746 Revenue: $3,081 Est. Revenue: $5,658
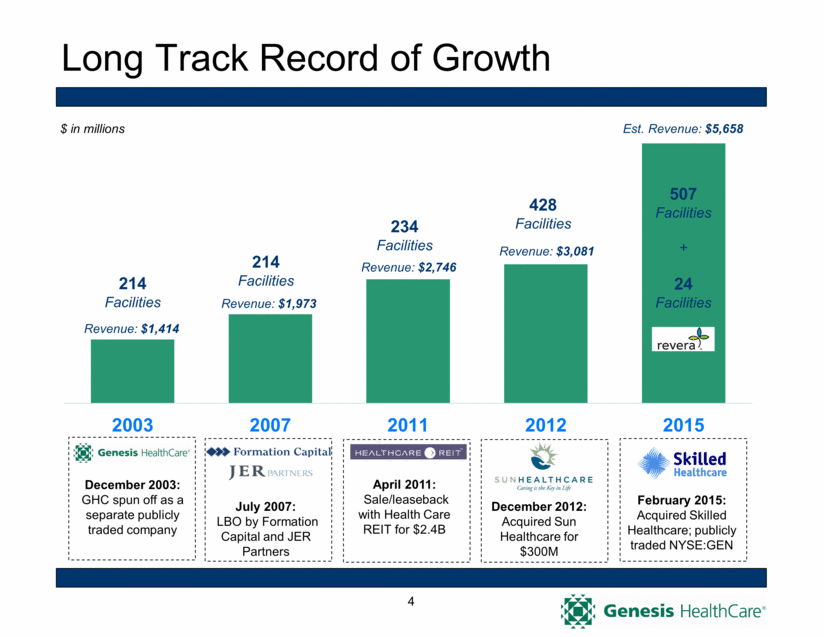
Broad Combined Geographic Scale Over 500 SNF and ALF facilities across 34 states Top 5 states by licensed beds: PA: 10.8% NJ: 9.0% MD: 7.5% CA: 7.3% MA: 7.0% Source: Company information, October 2015 5
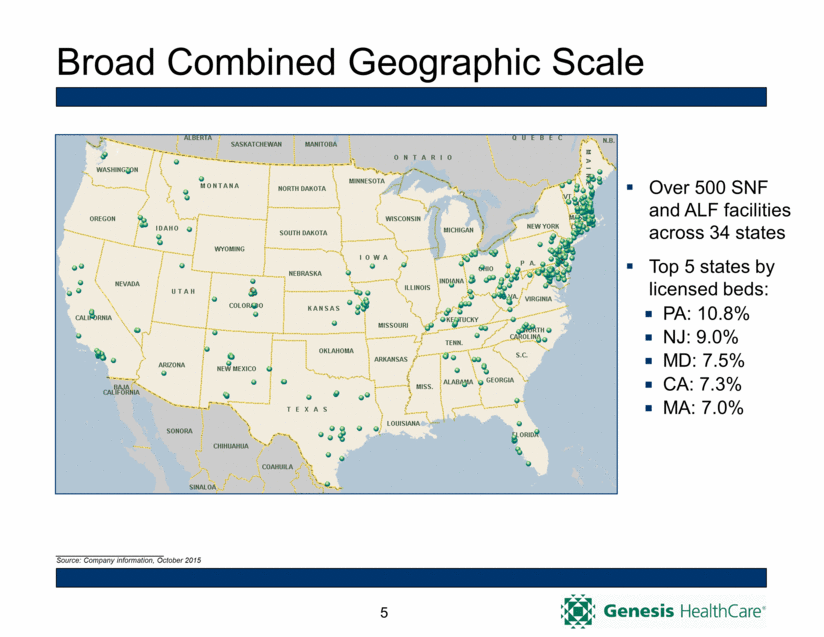
104 207 Genesis Rehabilitation & Respiratory Services 8 21 1 15 16 7 15 6 15 34 81 140 6 4 2 19 6 40 20 9 40 58 102 81 92 90 14 22 7 48 15 42 54 28 105 12 8 55 8 Current Operations (w/number of locations) DC 4 Hawaii 5 Expansive Service Contract Footprint 4 3 64 6

AGENDA Genesis’ Growth Strategy Financial Summary Genesis HealthCare Overview

Track record of creating value Genesis Growth Strategy Organic Growth Genesis Rehab Services Acquisition & Development Specialty Units Genesis Physician Services Managed Care BPCI Contract Growth Vitality to You PowerBack Development Small Scale Acquisitions Estimated Annual EBITDAR ~6% 1-2% 1-2%+ 2%+ 8

Organic Growth: Enhancing Skilled Mix through Focus on High Acuity Patients As of November 2015 # of Specialty Units Short-Term Specialties PowerBack Rehabilitation 11 Transitional Care Units 108 Progression Orthopedic Units 4 Long-Term Specialties Alzheimer’s Units 59 Ventilator Care Units 8 Dialysis Units 9 9 Transitional Care Units A rapid recovery option for patients requiring post-acute rehab and medical services due to illness, surgery or injury. Offers enhanced clinical services in a designated unit with higher licensed clinical staffing Homestead (Alzheimer’s) Offers a safe, secure, home-like environment with consistent staff to promote relationships and stable family atmosphere Progression Unit A short stay option for patients requiring orthopedic rehabilitation after hospital discharge, but before going home Ventilator Care Designed for patients who need short-term or continuous ventilator care or rehab Dialysis On-site services for patients requiring treatment for end-stage renal disease along with skilled care PowerBack Aggressive, highly personalized care plans designed to get patients home sooner Specialty Care Units

Organic Growth: Genesis Physician Services (“GPS”) 10 Group practice specializing in sub-acute, skilled nursing & long-term care Dedicated Medical Directors & full-/ part-time Attending Physicians, NPs and PAs Clinical care partners for the entire Genesis care team 70% of facility admissions are seen by GPS providers (where a GPS presence exists) 525,000 patient visits annually Full & Part-Time Provider Growth 74 95 128 160 197 208 101 115 122 150 162 160 175 210 250 310 359 368 0 50 100 150 200 250 300 350 400 Sep-10 Sep-11 Sep-12 Sep-13 Sep-14 Jun-15 Nurse Practitioners Physicians

Organic Growth: Post-Healthcare Reform Environment Managed Care Strategy Build upon strong relationships with national and regional managed care plans Reduces readmissions Improves quality outcomes Creates efficiency in the healthcare delivery system Capture additional patient referrals resulting from expanded coverage through healthcare reform Readmission Incentive programs 11

3 Episode Initiating Skilled Nursing Facilities 4/1/15 7/1/15 10/1/15 3/31/18 6/30/18 9/30/18 3-Year Demonstration Period Organic Growth: Genesis Bundled Payment Participation $13MM Medicare Costs Under Management $35MM Medicare Costs Under Management $80MM Medicare Costs Under Management 12 10 Episode Initiating Skilled Nursing Facilities 19 Episode Initiating Skilled Nursing Facilities

Growth Strategies: Genesis Rehab Services 13 Organic net location growth – 100 per year On July 1, 2015, signed 91 new contract sites + 22 outpatients rehab sites; Genesis/Formation acquisition/development strategy Expand into new states post Skilled transaction Expansion of Outpatient Services Vitality to You Home Health collaboration Expansion to China - 200 400 600 800 1,000 1,200 1,400 1,600 1,800 2011 2012 2013 2014 2015 GRS Contract Growth

Acquisition & Development: Specialized Services & Buildings Aggressive, highly personalized rehabilitation designed to get patients home sooner 5 Reconfigured 3 New build, state-of-the art facilities 3 Acquired Accelerate growth in higher margin, higher skilled services 11 operational PowerBack facilities across 5 states 5 additional PowerBacks in the pipeline 100% Short-Stay / Post-Acute Facilities 14

Transformative Acquisitions Opportunities Pursue smaller, attractive M&A and development opportunities Small Scale Acquisitions 2013 - 2015 Development Projects Beds Type Facility State Opening Date 124 SNF PowerBack NJ January 2013 120 SNF Replacement MA February 2013 124 SNF PowerBack NJ December 2014 120 SNF Replacement MD December 2014 99 SNF PowerBack CO May 2015 130 SNF Replacement MD October 2015 124 SNF PowerBack NJ October 2015 15 Beds Type State Acquisition Date 108 PowerBack CO Mar-14 120 SNF NJ May-14 104 SNF DE Aug-14 125 SNF AL Sep-14 32 ALF AL Sep-14 68 SNF NH Nov-14 140 SNF TX Feb-15 90 PowerBack TX May-15 60 PowerBack TX May-15 Acquisition of 24 Revera facilities planned for end of year 2015 16 recent or planned smaller scale acquisitions / development projects $250 million of steady state total revenue $47 million of steady state EBITDAR Accretive Smaller Scale Opportunities Sun Healthcare – 2012 $1.9 Billion in Revenues Skilled Healthcare - 2015 $0.85 Billion in Revenues Acquisition & Development: Small Scale Opportunities

AGENDA Genesis’ Growth Strategy Financial Summary Genesis HealthCare Overview

Pro Forma Financial Summary – Nine Months Ended September 30, 2015 17 Consistent Quarterly EBITDAR & EBITDA Growth 1Q 2Q 3Q EBITDAR EBITDA 6.1% 5.8% 6.3% 10.5% 10.0% 13.1% YTD thru 9/30/15 6.1% 11.1%

2015 Guidance (As Included in Earnings Release Dated Nov. 5, 2015) 18 Mid-point of EBITDAR Guidance implies: 10.7% EBITDAR 25.4% EBITDA Growth vs. 2014 Guidance (in thousands, except EPS) Low End of Range High End of Range Net Revenues 5,618,438 $ 5,698,438 $ Adjusted EBITDAR 755,050 770,037 Adjusted EBITDA 267,618 282,605 Earnings per share, diluted 0.34 $ 0.39 $

Capital Strengthening Initiatives 19 Initiative Timing Impact HUD Refinancing $360 M Bridge Loan $400 M Add’l Capacity Requested Approved Closing through Q1 – Q2 2016 $14 M annual pre-tax interest savings Attractive financing for future acquisitions Non-Strategic Asset Sales $27M sales completed $100 to $150M potential over 6-9 months Proceeds redeployed at accretive return or pay down 10% term debt REIT Transactions 21 facility acquisitions 12 facility divestitures Rent pre-payments 4 divestures & 1 acquisition complete yielding $6.3M reduced rent Remainder to close in stages – majority 2016 Annual pre-tax rent reduced $35 M Facility ownership increased from 15% to 23% (pro forma for Revera) Reducing fixed charges, increasing facility ownership and reducing cost of capital

Projected Value Creation of Known Transactions Purpose: To illustrate the estimated the accretive impact of all significant transactions that have closed or are expected to close through 2016. This schedule excludes routine organic growth. * - Proceeds of non-strategic asset sales, if any, estimated between $100 M to $150 M will be used to finance the equity component of the Revera Acquisition and the REIT Transactions. 20 $ in millions Mid-point 2015 Guidance Incremental Skilled Transaction Synergies Year over Year Impact of Recently Added Therapy Contracts Completed New Builds & Acquisitions HUD Refi Revera Acquisition REIT Transactions Non- Strategic Asset Sales * $ % Revenue 5,658.4 $ 1.1 $ 35.0 $ 75.0 $ - $ 281.1 $ (46.8) $ (168.7) $ 176.8 $ 3.1% EBITDAR 762.5 11.2 3.8 17.6 - 34.3 (3.2) (15.8) 47.9 6.3% Cash Basis Rent 487.4 - 0.4 9.3 - 4.0 (30.7) (2.8) (19.8) EBITDA 275.1 11.2 3.4 8.3 - 30.3 27.5 (13.0) 67.7 24.6% Free Cash Flow 70.7 6.7 2.0 5.0 8.6 15.9 16.9 (7.8) 47.4 67.1% Net Debt 989.7 - - - - 167.0 175.0 - 342.0 Expected Timing Complete Complete Complete Expected completion by end of 2Q16 Expected closing by end of 2015 Expected to close over course of 2015 and 2016 Expected by mid 2016 2016 Impact If All Transactions Were in Place January 1, 2016 Total Impact

Recent Successes and Opportunities Integration of Skilled Healthcare going well Strong EBITDA growth quarter-over-quarter Expanding real estate ownership Consolidated rent coverage improvement Positive capital structure momentum Favorable industry fundamentals 21

APPENDIX

Use of Non-GAAP Measures This presentation includes references to EBITDAR, Adjusted EBITDAR, EBITDA and Adjusted EBITDA, which are non-GAAP financial measures. For purposes of SEC Regulation G, a non-GAAP financial measure is a numerical measure of a registrant’s historical or future financial performance, financial position and cash flows that excludes amounts, or is subject to adjustments that have the effect of excluding amounts, that are included in the most directly comparable financial measure calculated and presented in accordance with GAAP in the statement of operations, balance sheet or statement of cash flows (or equivalent statements) of the registrant; or includes amounts, or is subject to adjustments that have the effect of including amounts, that are excluded from the most directly comparable financial measure so calculated and presented. In this regard, GAAP refers to generally accepted accounting principles in the United States. Pursuant to the requirements of Regulation G, Genesis has provided reconciliations of the non-GAAP financial measures to the most directly comparable GAAP financial measures. We believe that the presentation of EBITDA, EBITDAR, Adjusted EBITDA and Adjusted EBITDAR provides consistency in our financial reporting and provides a basis for the comparison of results of core business operations between our current, past and future periods. EBITDA, EBITDAR, Adjusted EBITDA and Adjusted EBITDAR are primary indicators management uses for planning and forecasting in future periods, including trending and analyzing the core operating performance of our business from period-to-period without the effect of expenses, revenues and gains (losses) that are unrelated to the day-to-day performance of our consolidated and segmented business but are required to reported in accordance with accounting principles generally accepted in the United States of America ("U.S. GAAP"). We also use EBITDA, EBITDAR, Adjusted EBITDA and Adjusted EBITDAR to benchmark the performance of our consolidated and segmented business against expected results, analyzing year-over-year trends as described below and to compare our operating performance to that of our competitors. Management uses EBITDA, EBITDAR, Adjusted EBITDA and Adjusted EBITDAR to assess the performance of our core business operations, to prepare operating budgets and to measure our performance against those budgets on a consolidated and segment level. Segment management uses these metrics to measure performance on a business unit by business unit basis. We typically use Adjusted EBITDA and Adjusted EBITDAR for these purposes on a consolidated basis as the adjustments to EBITDA and EBITDAR are not generally allocable to any individual business unit and we typically use EBITDA and EBITDAR to compare the operating performance of each skilled nursing and assisted living facility, as well as to assess the performance of our operating segments. EBITDA, EBITDAR, Adjusted EBITDA and Adjusted EBITDAR are useful in this regard because they do not include such costs as interest expense (net of interest income), income taxes, depreciation and amortization expense, rent cost of revenue (in the case of EBITDAR and Adjusted EBITDAR) and special charges, which may vary from business unit to business unit and period-to-period depending upon various factors, including the method used to finance the business, the amount of debt that we have determined to incur, whether a facility is owned or leased, the date of acquisition of a facility or business, the original purchase price of a facility or business unit or the tax law of the state in which a business unit operates. These types of charges are dependent on factors unrelated to the underlying business unit performance. As a result, we believe that the use of adjusted net income per share, EBITDA, EBITDAR, Adjusted EBITDA and Adjusted EBITDAR provides a meaningful and consistent comparison of our underlying business units between periods by eliminating certain items required by U.S. GAAP which have little or no significance to their day-to-day operations. The use of EBITDA, EBITDAR, Adjusted EBITDA, Adjusted EBITDAR and other non-GAAP financial measures has certain limitations. Our presentation of EBITDA, EBITDAR, Adjusted EBITDA, Adjusted EBITDAR or other non-GAAP financial measures may be different from the presentation used by other companies and therefore comparability may be limited. Depreciation and amortization expense, interest expense, income taxes and other items have been and will be incurred and are not reflected in the presentation of EBITDA, EBITDAR, Adjusted EBITDA or Adjusted EBITDAR. Each of these items should also be considered in the overall evaluation of our results. Additionally, EBITDA, EBITDAR, Adjusted EBITDA, Adjusted EBITDAR do not consider capital expenditures and other investing activities and should not be considered as a measure of our liquidity. We compensate for these limitations by providing the relevant disclosure of our depreciation and amortization, interest and income taxes, capital expenditures and other items both in our reconciliations to the U.S. GAAP financial measures and in our consolidated financial statements, all of which should be considered when evaluating our performance. EBITDA, EBITDAR, Adjusted EBITDA, Adjusted EBITDAR and certain other non-GAAP financial measures are used in addition to and in conjunction with results presented in accordance with U.S. GAAP. EBITDA, EBITDAR, Adjusted EBITDA, Adjusted EBITDAR and other non-GAAP financial measures should not be considered as an alternative to net income, operating income, or any other operating performance measure prescribed by U.S. GAAP, nor should these measures be relied upon to the exclusion of U.S. GAAP financial measures. EBITDA, EBITDAR, Adjusted EBITDA, Adjusted EBITDAR and other non-GAAP financial measures reflect additional ways of viewing our operations that we believe, when viewed with our U.S. GAAP results and the reconciliations to the corresponding U.S. GAAP financial measures, provide a more complete understanding of factors and trends affecting our business than could be obtained absent this disclosure. You are strongly encouraged to review our financial information in its entirety and not to rely on any single financial measure.
CONDENSED CONSOLIDATED STATEMENTS OF OPERATIONS (UNAUDITED) (IN THOUSANDS, EXCEPT PER SHARE DATA) 2015 2014 2015 2014 Net revenues 1,416,027 $ 1,187,618 $ 4,178,503 $ 3,574,813 $ Salaries, wages and benefits 833,415 723,586 2,445,074 2,162,064 Other operating expenses 332,918 265,283 993,715 798,432 General and administrative costs 46,110 36,341 131,126 108,187 Provision for losses on accounts receivable 23,346 17,285 68,855 52,881 Lease expense 37,655 32,921 113,033 98,629 Depreciation and amortization expense 62,505 48,701 176,043 145,131 Interest expense 128,538 112,121 376,236 330,771 (Gain) loss on extinguishment of debt (3,104) - 130 679 Investment income (353) (1,468) (1,200) (2,847) Other loss (income) 38 30 (7,522) (637) Transaction costs 3,306 1,736 92,016 5,283 Skilled Healthcare loss contingency expense 30,000 - 31,500 - Equity in net (income) loss of unconsolidated affiliates (640) 207 (1,153) (139) Loss before income tax benefit (77,707) (49,125) (239,350) (123,621) Income tax benefit (16,726) (6,518) (26,793) (9,368) Loss from continuing operations (60,981) (42,607) (212,557) (114,253) Income (loss) from discontinued operations, net of taxes 39 (1,191) (1,571) (5,561) Net loss (60,942) (43,798) (214,128) (119,814) Less net loss (income) attributable to noncontrolling interests 31,990 (961) 53,424 (1,370) Net loss attributable to Genesis Healthcare, Inc. (28,952) $ (44,759) $ (160,704) $ (121,184) $ Loss per common share: Basic and diluted: Weighted average shares outstanding for basic and diluted loss from continuing operations per share 89,213 49,865 84,615 49,865 Basic and diluted net loss per common share: Loss from continuing operations attributable to Genesis Healthcare, Inc. (0.32) $ (0.88) $ (1.88) $ (2.32) $ Loss from discontinued operations 0.00 (0.02) (0.02) (0.11) Net loss attributable to Genesis Healthcare, Inc. (0.32) $ (0.90) $ (1.90) $ (2.43) $ Three months ended September 30, Nine months ended September 30,

CONDENSED CONSOLIDATED BALANCE SHEETS (UNAUDITED) (IN THOUSANDS September 30, 2015 December 31, 2014 Assets: Current assets: Cash and equivalents 59,671 $ 87,548 $ Accounts receivable, net of allowances for doubtful accounts 759,305 605,830 Other current assets 185,184 202,808 Total current assets 1,004,160 896,186 Property and equipment, net of accumulated depreciation 3,965,527 3,493,250 Identifiable intangible assets, net of accumulated amortization 219,028 173,112 Goodwill 444,446 169,681 Other long-term assets 488,200 409,179 Total assets 6,121,361 $ 5,141,408 $ Liabilities and Stockholders' Deficit: Current liabilities: Accounts payable and accrued expenses 395,468 $ 320,339 $ Accrued compensation 222,689 192,838 Other current liabilities 162,206 147,405 Total current liabilities 780,363 660,582 Long-term debt 1,036,882 525,728 Capital lease obligations 1,053,547 1,002,762 Financing obligations 2,993,670 2,911,200 Other long-term liabilities 563,295 498,626 Stockholders' deficit (306,396) (457,490) Total liabilities and stockholders' deficit 6,121,361 $ 5,141,408 $

CONDENSED CONSOLIDATED STATEMENTS OF CASH FLOWS (UNAUDITED) (IN THOUSANDS) 2015 2014 Net cash (used in) provided by operating activities (4,949) $ 85,364 $ Net cash used in investing activities (67,933) (67,635) Net cash provided by (used in) financing activities 45,005 (5,575) Net (decrease) increase in cash and equivalents (27,877) 12,154 Beginning of period 87,548 61,413 End of period 59,671 $ 73,567 $ Nine months ended September 30,

RECONCILIATION OF NET (LOSS) INCOME TO EBITDA, EBITDAR, ADJUSTED EBITDA AND ADJUSTED EBITDAR (UNAUDITED) (IN THOUSANDS, EXCEPT EARNINGS PER SHARE) As reported As adjusted Three months ended September 30, 2015 Conversion to cash basis leases (a) Newly acquired or constructed businesses with start- up losses and newly divested facilities (b) Other adjustments (c) Three months ended September 30, 2015 Net revenues 1,416,027 $ - $ (10,750) $ - $ 1,405,277 $ Salaries, wages and benefits 833,415 - (6,616) (477) 826,322 Other operating expenses 332,918 - (6,340) 686 327,264 General and administrative costs 46,110 - - (5,194) 40,916 Provision for losses on accounts receivable 23,346 - (357) - 22,989 Lease expense 37,655 86,221 (2,302) - 121,574 Depreciation and amortization expense 62,505 (33,502) (3,020) - 25,983 Interest expense 128,538 (105,057) - - 23,481 Gain on extinguishment of debt (3,104) - - 3,104 - Other income 38 - (38) - - Investment income (353) - - - (353) Transaction costs 3,306 - (63) (3,243) - Skilled Healthcare loss contingency expense 30,000 - - (30,000) - Equity in net income of unconsolidated affiliates (640) - - - (640) (Loss) income before income tax benefit (77,707) $ 52,338 $ 7,986 $ 35,124 $ 17,741 $ Income tax (benefit) expense (16,726) 12,149 1,854 8,153 5,430 (Loss) income from continuing operations (60,981) $ 40,189 $ 6,132 $ 26,971 $ 12,311 $ Income from discontinued operations, net of taxes (39) 162 - - 123 Net (loss) income attributable to noncontrolling interests (31,990) 21,966 (351) 14,629 4,254 Net (loss) income attributable to Genesis Healthcare, Inc. (28,952) $ 18,061 $ 6,483 $ 12,342 $ 7,934 $ Depreciation and amortization expense 62,505 (33,502) (3,020) - 25,983 Interest expense 128,538 (105,057) - - 23,481 Gain on extinguishment of debt (3,104) - - 3,104 - Other income 38 - (38) - - Transaction costs 3,306 - (63) (3,243) - Skilled Healthcare loss contingency expense 30,000 - - (30,000) - Income tax (benefit) expense (16,726) 12,149 1,854 8,153 5,430 Loss from discontinued operations, net of taxes (39) 162 - - 123 Net (loss) income attributable to noncontrolling interests (31,990) 21,966 (351) 14,629 4,254 EBITDA / Adjusted EBITDA 143,576 $ (86,221) $ 4,865 $ 4,985 $ 67,205 $ Lease expense 37,655 86,221 (2,302) - 121,574 EBITDAR / Adjusted EBITDAR 181,231 $ - $ 2,563 $ 4,985 $ 188,779 $ (Loss) income per common share: Diluted: Weighted average shares outstanding for diluted (loss) income from continuing operations per share (d) 89,213 153,671 Diluted net (loss) income from continuing operations per share (e) (0.32) $ 0.07 $ See (a), (b), (c), (d) and (e) footnote references contained herein. Adjustments

RECONCILIATION OF NET (LOSS) INCOME TO EBITDA, EBITDAR, ADJUSTED EBITDA AND ADJUSTED EBITDAR (UNAUDITED) (IN THOUSANDS, EXCEPT EARNINGS PER SHARE) As reported As adjusted Non-GAAP as adjusted Pro forma adjusted Nine months ended September 30, 2015 Conversion to cash basis leases (a) Newly acquired or constructed businesses with start-up losses and newly divested facilities (b) Other adjustments (c) Nine months ended September 30, 2015 Skilled Healthcare Group, Inc. one month ended January 31, 2015 Nine months ended September 30, 2015 Net revenues 4,178,503 $ - $ (32,115) $ 388 $ 4,146,776 $ 71,288 $ 4,218,064 $ Salaries, wages and benefits 2,445,074 - (19,129) (477) 2,425,468 43,926 2,469,394 Other operating expenses 993,715 - (15,993) (10,534) 967,188 17,141 984,329 General and administrative costs 131,126 - - (7,456) 123,670 1,516 125,186 Provision for losses on accounts receivable 68,855 - (608) - 68,247 1,289 69,536 Lease expense 113,033 254,566 (7,230) - 360,369 1,766 362,135 Depreciation and amortization expense 176,043 (101,291) (4,463) - 70,289 1,998 72,287 Interest expense 376,236 (311,371) (40) - 64,825 2,521 67,346 Loss on extinguishment of debt 130 - - (130) - - - Other income (7,522) - (38) 7,560 - 11 11 Investment income (1,200) - - - (1,200) - (1,200) Transaction costs 92,016 - (63) (91,953) - - - Skilled Healthcare loss contingency expense 31,500 - - (31,500) - - Equity in net income of unconsolidated affiliates (1,153) - - - (1,153) (146) (1,299) (Loss) income before income tax benefit (239,350) $ 158,096 $ 15,449 $ 134,878 $ 69,073 $ 1,266 $ 70,339 $ Income tax (benefit) expense (26,793) 36,697 3,586 31,308 44,798 494 45,292 (Loss) income from continuing operations (212,557) $ 121,399 $ 11,863 $ 103,570 $ 24,275 $ 772 $ 25,047 $ Loss from discontinued operations, net of taxes 1,571 1,082 - - 2,653 - 2,653 Net (loss) income attributable to noncontrolling interests (53,424) 29,591 2,088 27,911 6,166 531 6,697 Net (loss) income attributable to Genesis Healthcare, Inc. (160,704) $ 90,726 $ 9,775 $ 75,659 $ 15,456 $ 241 $ 15,697 $ Depreciation and amortization expense 176,043 (101,291) (4,463) - 70,289 1,998 72,287 Interest expense 376,236 (311,371) (40) - 64,825 2,521 67,346 Loss on extinguishment of debt 130 - - (130) - - - Other income (7,522) - (38) 7,560 - 11 11 Transaction costs 92,016 - (63) (91,953) - - - Skilled Healthcare loss contingency expense 31,500 - - (31,500) - - - Income tax (benefit) expense (26,793) 36,697 3,586 31,308 44,798 494 45,292 Loss from discontinued operations, net of taxes 1,571 1,082 - - 2,653 - 2,653 Net (loss) income attributable to noncontrolling interests (53,424) 29,591 2,088 27,911 6,166 531 6,697 EBITDA / Adjusted EBITDA 429,053 $ (254,566) $ 10,845 $ 18,855 $ 204,187 $ 5,796 $ 209,983 $ Lease expense 113,033 254,566 (7,230) - 360,369 1,766 362,135 EBITDAR / Adjusted EBITDAR 542,086 $ - $ 3,615 $ 18,855 $ 564,556 $ 7,562 $ 572,118 $ (Loss) income per common share: Diluted: Weighted average shares outstanding for diluted (loss) income from continuing operations per share (d) 84,615 153,671 Diluted net (loss) income from continuing operations per share (e) (1.88) $ 0.27 $ See (a), (b), (c), (d) and (e) footnote references contained herein. Adjustments

RECONCILIATION OF NET (LOSS) INCOME TO EBITDA, EBITDAR, ADJUSTED EBITDA AND ADJUSTED EBITDAR (UNAUDITED) (IN THOUSANDS, EXCEPT EARNINGS PER SHARE) As reported As adjusted Non-GAAP as adjusted Pro forma adjusted Three months ended September 30, 2014 Conversion to cash basis leases (a) Newly acquired or constructed businesses with start-up losses and newly divested facilities (b) Other adjustments (c) Three months ended September 30, 2014 Skilled Healthcare Group, Inc. three months ended September 30, 2014 Three months ended September 30, 2014 Net revenues 1,187,618 $ - $ (3,533) $ - $ 1,184,085 $ 207,840 $ 1,391,925 $ - Salaries, wages and benefits 723,586 - (3,444) (308) 719,834 128,793 848,627 Other operating expenses 265,283 - (1,744) (1,290) 262,249 36,122 298,371 General and administrative costs 36,341 - - - 36,341 11,789 48,130 Provision for losses on accounts receivable 17,285 - - - 17,285 3,737 21,022 Lease expense 32,921 80,625 (528) - 113,018 5,146 118,164 Depreciation and amortization expense 48,701 (33,232) (41) - 15,428 6,120 21,548 Interest expense 112,121 (99,188) - - 12,933 7,836 20,769 Other (income) loss 30 - - (30) - 26 26 Investment income (1,468) - - - (1,468) - (1,468) Transaction costs 1,736 - - (1,736) - - - Equity in net loss of unconsolidated affiliates 207 - - - 207 (568) (361) (Loss) income before income tax benefit (49,125) $ 51,795 $ 2,224 $ 3,364 $ 8,258 $ 8,839 $ 17,097 $ Income tax (benefit) expense (6,518) 5,190 194 345 (789) 3,105 2,316 (Loss) income from continuing operations (42,607) $ 46,605 $ 2,030 $ 3,019 $ 9,047 $ 5,734 $ 14,781 $ Loss (income) from discontinued operations, net of taxes 1,191 (621) - - 570 - 570 Net loss attributable to noncontrolling interests 961 - - - 961 - 961 Net (loss) income attributable to Genesis Healthcare, Inc. (44,759) $ 47,226 $ 2,030 $ 3,019 $ 7,516 $ 5,734 $ 13,250 $ Depreciation and amortization expense 48,701 (33,232) (41) - 15,428 6,120 21,548 Interest expense 112,121 (99,188) - - 12,933 7,836 20,769 Other (income) loss 30 - - (30) - (7) (7) Transaction costs 1,736 - - (1,736) - - - Income tax (benefit) expense (6,518) 5,190 194 345 (789) 3,105 2,316 Loss (income) from discontinued operations, net of taxes 1,191 (621) - - 570 - 570 Net income attributable to noncontrolling interests 961 - - - 961 - 961 EBITDA / Adjusted EBITDA 113,463 $ (80,625) $ 2,183 $ 1,598 $ 36,619 $ 22,788 $ 59,407 $ Lease expense 32,921 80,625 (528) - 113,018 5,146 118,164 EBITDAR / Adjusted EBITDAR 146,384 $ - $ 1,655 $ 1,598 $ 149,637 $ 27,934 $ 177,571 $ Loss per common share: Diluted: Weighted average shares outstanding for diluted (loss) income from continuing operations per share (d) 49,865 Diluted net (loss) income from continuing operations per share (e) (0.88) $ Not calculated See (a), (b), (c), (d) and (e) footnote references contained herein. Adjustments

RECONCILIATION OF NET (LOSS) INCOME TO EBITDA, EBITDAR, ADJUSTED EBITDA AND ADJUSTED EBITDAR (UNAUDITED) (IN THOUSANDS, EXCEPT EARNINGS PER SHARE) As reported As adjusted Non-GAAP as adjusted Pro forma adjusted Nine months ended September 30, 2014 Conversion to cash basis leases (a) Newly acquired or constructed businesses with start- up losses and newly divested facilities (b) Other adjustments (c) Nine months ended September 30, 2014 Skilled Healthcare Group, Inc. nine months ended September 30, 2014 Nine months ended September 30, 2014 Net revenues 3,574,813 $ - $ (10,711) $ 1,166 $ 3,565,268 $ 622,143 $ 4,187,411 $ - Salaries, wages and benefits 2,162,064 - (8,488) (2,014) 2,151,562 388,727 2,540,289 Other operating expenses 798,432 - (4,796) (2,123) 791,513 125,134 916,647 General and administrative costs 108,187 - - - 108,187 24,089 132,276 Provision for losses on accounts receivable 52,881 - - - 52,881 10,215 63,096 Lease expense 98,629 238,505 (1,613) - 335,521 14,842 350,363 Depreciation and amortization expense 145,131 (98,625) (114) - 46,392 18,240 64,632 Interest expense 330,771 (292,256) - - 38,515 23,475 61,990 Loss on extinguishment of debt 679 - - (679) - - - Other (income) loss (637) - - 637 - (136) (136) Investment income (2,847) - - - (2,847) - (2,847) Transaction costs 5,283 - - (5,283) - - - Equity in net income of unconsolidated affiliates (139) - - - (139) (1,206) (1,345) (Loss) income before income tax benefit (123,621) $ 152,376 $ 4,300 $ 10,628 $ 43,683 $ 18,763 $ 62,446 $ Income tax (benefit) expense (9,368) 11,547 326 805 3,310 7,553 10,863 (Loss) income from continuing operations (114,253) $ 140,829 $ 3,974 $ 9,823 $ 40,373 $ 11,210 $ 51,583 $ Loss from discontinued operations, net of taxes 5,561 (2,585) - - 2,976 - 2,976 Net loss attributable to noncontrolling interests 1,370 - - - 1,370 - 1,370 - Net (loss) income attributable to Genesis Healthcare, Inc. (121,184) $ 143,414 $ 3,974 $ 9,823 $ 36,027 $ 11,210 $ 47,237 $ Depreciation and amortization expense 145,131 (98,625) (114) - 46,392 18,240 64,632 Interest expense 330,771 (292,256) - - 38,515 23,475 61,990 Loss on extinguishment of debt 679 - - (679) - 21 21 Other (income) loss (637) - - 637 - (114) (114) Transaction costs 5,283 - - (5,283) - - - Income tax (benefit) expense (9,368) 11,547 326 805 3,310 7,553 10,863 Loss (income) from discontinued operations, net of taxes 5,561 (2,585) - - 2,976 - 2,976 Net income attributable to noncontrolling interests 1,370 - - - 1,370 - 1,370 EBITDA / Adjusted EBITDA 357,606 $ (238,505) $ 4,186 $ 5,303 $ 128,590 $ 60,385 $ 188,975 $ Lease expense 98,629 238,505 (1,613) - 335,521 14,842 350,363 EBITDAR / Adjusted EBITDAR 456,235 $ - $ 2,573 $ 5,303 $ 464,111 $ 75,227 $ 539,338 $ Loss per common share: Diluted: Weighted average shares outstanding for diluted (loss) income from continuing operations per share (d) 49,865 Diluted net (loss) income from continuing operations per share (e) (2.32) $ Not calculated See (a), (b), (c), (d) and (e) footnote references contained herein. Adjustments

Notes (a) Our leases are classified as either operating leases, capital leases or financing obligations pursuant to appl icable guidance under U.S. GAAP. We view the primary provisions and economics of these leases, regardless of their accounting treatment, as being nearly identical. Virtually all of our leases are structured with triple net terms, have fixe d annual rent e scalators and have long - term initial maturities with renewal options. Accordingly, in connection with our evaluation of the financial performance of the Company, we reclassify all of our leases to operating lease treatment and reflect lease expense on a c ash basis. This approach allows us to better understand the relationship in each reporting period of our operating performance, as measured by EBITDAR and Adjusted EBITDAR, to the cash basis obligations to our landlords in that reporting period, regardles s of the lease accounting treatment. This presentation and approach is also consistent with the financial reporting and covenant compliance requirements contained in all of our major lease and loan agreements. The following table summarizes the reclassif ication adjustments necessary to present all leases as operating leases on a cash basis. 2015 2014 2015 2014 Lease expense: Cash rent - capital leases 23,062 $ 22,374 $ 68,910 $ 66,768 $ Cash rent - financing obligations 64,736 61,375 191,571 181,007 Non-cash - operating lease arrangements (1,577) (3,124) (5,915) (9,270) Lease expense adjustments 86,221 $ 80,625 $ 254,566 $ 238,505 $ Depreciation and amortization expense: Capital lease accounting (8,495) $ (8,848) $ (26,570) $ (27,128) $ Financing obligation accounting (25,007) (24,384) (74,721) (71,497) Depreciation and amortization expense adjustments (33,502) $ (33,232) $ (101,291) $ (98,625) $ Interest expense: Capital lease accounting (26,503) $ (25,287) $ (78,146) $ (74,496) $ Financing obligation accounting (78,554) (73,901) (233,225) (217,760) Interest expense adjustments (105,057) $ (99,188) $ (311,371) $ (292,256) $ Total pre-tax lease accounting adjustments (52,338) $ (51,795) $ (158,096) $ (152,376) $ Three months ended September 30, Nine months ended September 30, (in thousands) (b) The acquisition and construction of new businesses has become an important element of our growth strategy. Many of the businesses we acquire have a history o f operating losses and continue to generate operating losses in the months that follow our acquisition. Newly constructed or developed businesses also generate losses while in their start - up phase. We view these losses as both temporary and an expected c omponent of our long - term investment in the new venture. We adjust these losses when computing Adjusted EBITDAR and Adjusted EBITDA in order to better evaluate the performance of our core business. The activities of such businesses are adjusted when comp uting Adjusted EBITDAR and Adjusted EBITDA until such time as a new business generates positive Adjusted EBITDA. The operating performance of new businesses are no longer adjusted when computing Adjusted EBITDAR and Adjusted EBITDA beginning the period in which a new business generates positive Adjusted EBITDA and all periods thereafter. The divestiture of underperforming or non - strategic facilities has also become an important element of our earnings optimization strategy. We eliminate the results of di vested facilities beginning in the quarter in which they become divested. We view the losses associated with the wind down of such divested facilities as non - recurring and not indicative of the performance of our core business. (c) Other adjustments rep resent costs or gains associated with transactions or events that we do not believe are reflective of our core recurring operating business. Other adjustments also include the effect of expensing non - cash stock - based compensation related to restricted sto ck units. The following items were realized in the periods presented.
Notes Three months ended September 30, Nine months ended September 30, 2015 2014 2015 2014 Severance and restructuring (1) $ 742 $ 507 $ 3,121 $ 2,213 Regulatory defense and related costs (2) 2,293 460 2,755 1,960 New business development costs (3) - 631 - 1,130 Self insurance adjustment (4) - - 10,500 - Transaction costs (5) 3,243 1,736 91,953 5,283 Skilled Healthcare loss contingency expense (8) 30,000 - 31,500 - Loss on early extinguishment of debt (3,104) - 130 679 Other income (6) - 30 (7,560) (637) Stockbased compensation (7) 1,950 - 2,479 - Tax benefit from total adjustments (8,153) (345) (31,308) (805) Total other adjustments $ 26,971 $ 3,019 $ 103,750 $ 9,823 (1) We incurred costs related to the termination, severance and restructuring of certain components of the Company’s business. (2) We incurred legal defense and other related costs in connection with cer tain matters in dispute or under appeal with regulatory agencies. (3) We incurred business development costs in connection with the evaluation and start - up of services outside our existing service offerings. (4) We incurred a self - insured program adjust ment for the actuarially developed GLPL and worker's compensation claims related to policy periods 2014 and prior. The Company also recorded approximately $6 million of incremental development related to the first nine months of 2015, which has not been e xcluded from our non - GAAP results. (5) We incurred costs associated with transactions including the combination with Skilled Healthcare Group, Inc. and other transactions. (6) We realized a net gain on the sale of certain assets in the nine months ende d September 30, 2015. (7) We incurred $2.0 million of non - cash stock - based compensation related to restricted stock units. (8) We recognized $31.5 million of loss contingency expense associated with three Skilled Healthcare regulatory matters. (d) Ass umes 153.7 million diluted weighted average common shares outstanding and common stock equivalents on a fully exchanged basis. (e) Pro forma adjusted income from continuing operations per share assumes a calculated tax rate of 40%, and is computed as fol lows: Pro forma adjusted income before income taxes x (1 - 40% tax rate) / diluted weighted average shares on a fully exchanged basis.
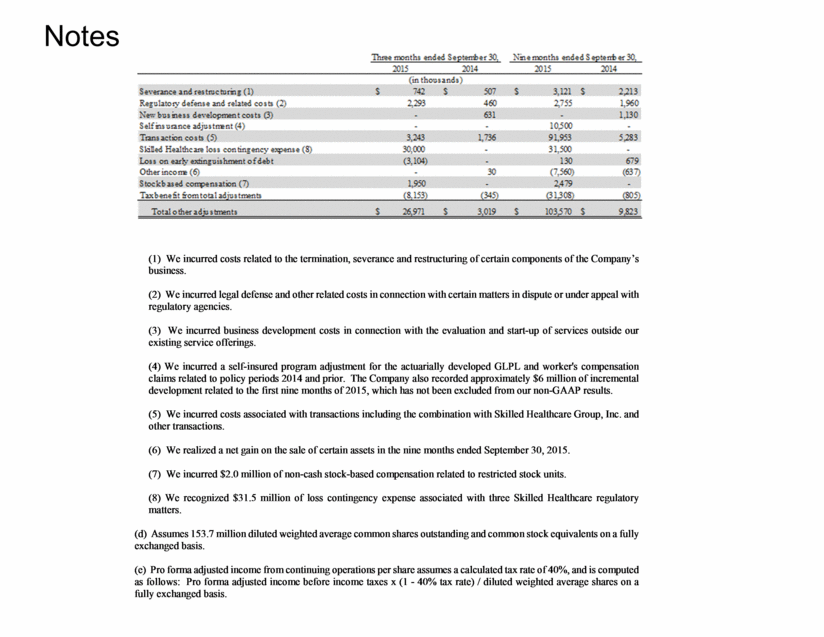
Skilled Healthcare: Reconciliation of Net (Loss) Income to EBITDA, EBITDAR, Adj. EBITDA & Adj. EBITDAR GAAP as reported Non-GAAP as adjusted GAAP as reported Non-GAAP as adjusted GAAP as reported Non-GAAP as adjusted One month ended January 31, 2015 Adjust One month ended January 31, 2015 Three months ended September 30, 2014 Adjust Three months ended September 30, 2014 Nine months ended September 30, 2014 Adjust Nine months ended September 30, 2014 Net revenues 71,288 $ - $ 71,288 $ 208,618 $ (778) $ 207,840 $ 622,897 $ (754) $ 622,143 $ - - - - - - Salaries, wages and benefits 44,842 (916) 43,926 129,198 (405) 128,793 389,444 (717) 388,727 Other operating expenses 17,486 (345) 17,141 43,829 (7,707) 36,122 141,796 (16,662) 125,134 General and administrative costs 1,516 - 1,516 12,780 (991) 11,789 26,151 (2,062) 24,089 Provision for losses on accounts receivable 1,289 - 1,289 3,737 - 3,737 10,362 (147) 10,215 Lease expense 1,766 - 1,766 5,146 - 5,146 14,842 - 14,842 Depreciation and amortization expense 1,998 - 1,998 6,120 - 6,120 18,240 - 18,240 Interest expense 2,521 - 2,521 7,836 - 7,836 23,475 - 23,475 Loss on extinguishment of debt - - - 21 (21) - 843 (843) - Impairment of long-lived assets - - - - - - 82 (82) - Other (income) loss 11 - 11 26 26 (136) - (136) Transaction costs 4,638 (4,638) - - - Equity in net income of unconsolidated affiliates (146) - (146) (568) - (568) (1,206) - (1,206) Income tax (benefit) expense (1,807) 2,301 494 (150) 3,255 3,105 (153) 7,706 7,553 Net (loss) income (2,826) 3,598 772 643 5,091 5,734 (843) 12,053 11,210 Depreciation and amortization expense 1,998 - 1,998 6,120 - 6,120 18,240 - 18,240 Interest expense 2,521 - 2,521 7,836 - 7,836 23,475 - 23,475 Loss on extinguishment of debt - - - - - - 843 (822) 21 Transaction costs 4,638 (4,638) - Impairment of long-lived assets - - - - - - 82 (82) - Other (income) loss 11 - 11 (7) (7) (114) - (114) Income tax (benefit) expense (1,807) 2,301 494 (150) 3,255 3,105 (153) 7,706 7,553 EBITDA / Adjusted EBITDA 4,535 1,261 5,796 14,442 8,346 22,788 41,530 18,855 60,385 Lease expense 1,766 - 1,766 5,146 - 5,146 14,842 - 14,842 EBITDAR / Adjusted EBITDAR 6,301 $ 1,261 $ 7,562 $ 19,588 $ 8,346 $ 27,934 $ 56,372 $ 18,855 $ 75,227 $ The following adjustments represent costs or gains associated with transactions or events that we do not believe are reflective of Skilled Healthcare Group's recurring operating business. One month ended January 31, 2015 Three months ended September 30, 2014 Nine months ended September 30, 2014 Severance and restructuring 1,220 $ 359 $ 1,430 $ Regulatory defense and related costs 41 - - Exist costs of divested facilities - 57 397 Professional fees related to non-routine matters - 6,377 13,896 Losses at skilled nursing facility not at full operation - 450 583 Loss on disposal of asset - 68 68 Loss on extinguishment of debt - 21 843 Non-cash stock compensation 371 1,014 2,460 Impairment of long-lived assets - - 82 Transaction costs 4,267 - - Tax benefit of total adjustments (2,301) (3,255) (7,706) Total adjustments 3,598 $ 5,091 $ 12,053 $ (UNAUDITED) (IN THOUSANDS)
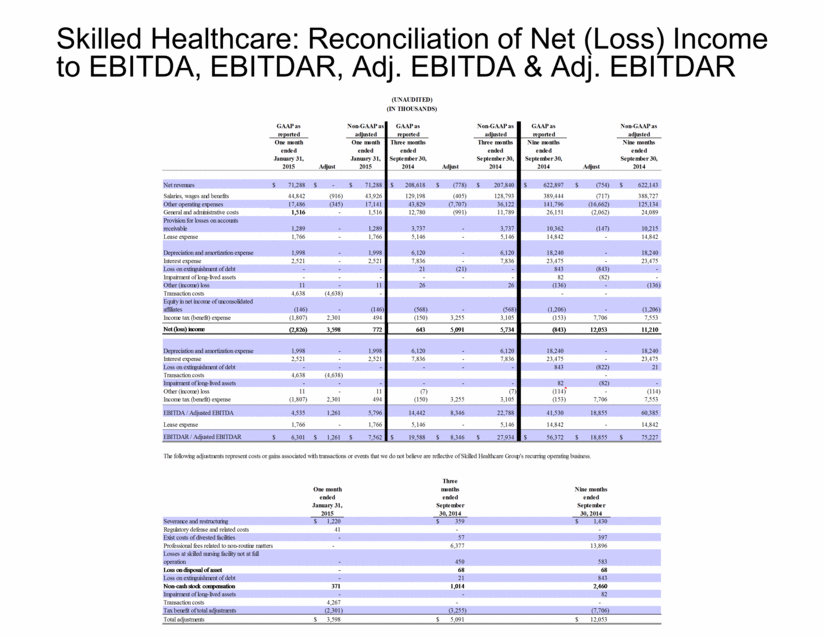
2015 Guidance – Low End of Range Reconciliation of Net (Loss) Income to EBITDA, EBITDAR, Adj. EBITDA & Adj. EBITDAR As adjusted Twelve months ended December 31, 2015 Conversion to cash basis leases (a) Newly acquired or constructed businesses with start-up losses and newly divested facilities (b) Other adjustments (c) Twelve months ended December 31, 2015 Net revenues 5,660,915 $ - $ (42,865) $ 388 $ 5,618,438 $ Salaries, wages and benefits 3,315,945 - (25,745) (1,393) 3,288,807 Other operating expenses 1,347,860 - (22,333) (13,914) 1,311,613 General and administrative costs 177,340 - - (9,406) 167,934 Provision for losses on accounts receivable 99,049 - (965) - 98,084 Lease expense 159,721 334,941 (7,230) - 487,432 Depreciation and amortization expense 236,299 (137,324) (4,463) - 94,512 Interest expense 507,243 (421,251) (40) - 85,952 Loss (gain) on extinguishment of debt 130 - - (130) - Other (income) loss (7,522) - (38) 7,560 - Investment income (2,000) - - - (2,000) Transaction costs 96,654 - (63) (96,591) - Skilled Healthcare loss contingency expense 31,500 - - (31,500) - Equity in net income of unconsolidated affiliates (1,050) - - - (1,050) (Loss) income before income tax expense (300,254) 223,634 18,012 145,762 87,154 Income tax expense (benefit) (120,102) 89,454 7,205 58,305 34,862 Income (loss) from continuing operations (180,152) 134,180 10,807 87,457 52,292 Earnings (loss) per share, diluted: (1.17) $ 0.34 $ Weighted-average common shares outstanding, diluted, on a fully exchanged basis 154,603 154,603 Adjustments to Compute EBITDA/Adjusted EBITDA and EBITDAR / Adjusted EBITDAR Depreciation and amortization expense 236,299 (137,324) (4,463) - 94,512 Interest expense 507,243 (421,251) (40) - 85,952 Loss (gain) on extinguishment of debt 130 - - (130) - Other (income) loss (7,522) - (38) 7,560 - Transaction costs 96,654 - (63) (96,591) - Skilled Healthcare loss contingency expense 31,500 - - (31,500) - Income tax expense (benefit) (120,102) 89,454 7,205 58,305 34,862 EBITDA / Adjusted EBITDA 564,050 $ (334,941) $ 13,408 $ 25,101 $ 267,618 $ Lease expense 159,721 334,941 (7,230) - 487,432 EBITDAR / Adjusted EBITDAR 723,771 $ - $ 6,178 $ 25,101 $ 755,050 $ (IN THOUSANDS, EXCEPT EPS) Adjustments

2015 Guidance – High End of Range Reconciliation of Net (Loss) Income to EBITDA, EBITDAR, Adj. EBITDA & Adj. EBITDAR As adjusted Twelve months ended December 31, 2015 Conversion to cash basis leases (a) Newly acquired or constructed businesses with start-up losses and newly divested facilities (b) Other adjustments (c) Twelve months ended December 31, 2015 Net revenues 5,740,915 $ - $ (42,865) $ 388 $ 5,698,438 Salaries, wages and benefits 3,363,604 - (25,745) (1,393) 3,336,466 Other operating expenses 1,365,422 - (22,333) (13,914) 1,329,175 General and administrative costs 177,340 - - (9,406) 167,934 Provision for losses on accounts receivable 100,791 - (965) - 99,826 Lease expense 159,721 334,941 (7,230) - 487,432 Depreciation and amortization expense 237,303 (137,324) (4,463) - 95,516 Interest expense 508,043 (421,251) (40) - 86,752 Loss (gain) on extinguishment of debt 130 - - (130) - Other (income) loss (7,522) - (38) 7,560 - Investment income (3,000) - - - (3,000) Transaction costs 96,654 - (63) (96,591) - Skilled Healthcare loss contingency expense 31,500 - - (31,500) - Equity in net income of unconsolidated affiliates (2,000) - - - (2,000) (Loss) income before income tax expense (287,071) 223,634 18,012 145,762 100,337 Income tax (benefit) expense (114,828) 89,454 7,205 58,305 40,136 Income (loss) from continuing operations (172,243) 134,180 10,807 87,457 60,201 Weighted-average common shares outstanding, diluted, on a fully exchanged basis 154,603 154,603 Adjustments to Compute EBITDA/Adjusted EBITDA and EBITDAR / Adjusted EBITDAR Depreciation and amortization expense 237,303 (137,324) (4,463) - 95,516 Interest expense 508,043 (421,251) (40) - 86,752 Loss (gain) on extinguishment of debt 130 - - (130) - Other (income) loss (7,522) - (38) 7,560 - Transaction costs 96,654 - (63) (96,591) - Skilled Healthcare loss contingency expense 31,500 - - (31,500) - Income tax (benefit) expense (114,828) 89,454 7,205 58,305 40,136 EBITDA / Adjusted EBITDA 579,037 $ (334,941) $ 13,408 $ 25,101 $ 282,605 Lease expense 159,721 334,941 (7,230) - 487,432 EBITDAR / Adjusted EBITDAR 738,758 $ - $ 6,178 $ 25,101 $ 770,037 Adjustments
