
Form 8-K ARROW ELECTRONICS INC For: Oct 28
UNITED STATES
SECURITIES
AND EXCHANGE COMMISSION
WASHINGTON,
D.C. 20549
FORM
8-K
CURRENT
REPORT
PURSUANT
TO SECTION 13 OR 15(D) OF THE SECURITIES EXCHANGE ACT OF 1934
Date of
Report (Date of earliest event reported): October
28, 2015
ARROW
ELECTRONICS, INC.
(Exact
Name of Registrant as Specified in Its Charter)
|
NEW YORK |
1-04482 |
11-1806155 |
|
(State or Other Jurisdiction of |
(Commission File Number) |
(IRS Employer Identification No.) |
|
9201 East Dry Creek Road, Centennial, CO 80112 |
|
(Address of Principal Executive Offices) |
Registrant’s
telephone number, including area code: (303) 824-4000
Not
Applicable
(Former Name or Former Address, if Changed Since Last
Report)
Check the
appropriate box below if the Form 8-K filing is intended to
simultaneously satisfy the filing obligation of the registrant under any
of the following provisions:
⃞ Written communications pursuant to Rule 425 under the Securities Act (17 CFR 230.425)
⃞ Soliciting material pursuant to Rule 14a-12 under the Exchange Act (17 CFR 240.14a-12)
⃞ Pre-commencement communications pursuant to Rule 14d-2(b) under the Exchange Act (17 CFR 240.14d-2(b))
⃞ Pre-commencement communications pursuant to Rule 13e-4(c) under the Exchange Act (17 CFR 240.13e-4(c))
ITEM 2.02 RESULTS OF OPERATIONS AND FINANCIAL CONDITION
On October 28, 2015, the Registrant issued a press release announcing its third quarter 2015 earnings. A copy of the press release is attached hereto as an Exhibit (99.1).
On October 28, 2015, the Registrant also issued a press release containing a third quarter 2015 CFO commentary related to its third quarter 2015 earnings. A copy of that press release is attached hereto as an Exhibit (99.2).
The information in this Current Report on Form 8-K and the Exhibits attached hereto is being furnished and shall not be deemed "filed" for purposes of Section 18 of the Securities Exchange Act of 1934 (the "Exchange Act") or otherwise subject to the liabilities of that section, nor shall it be deemed incorporated by reference in any filing under the Securities Act of 1933 or the Exchange Act, regardless of any general incorporation language in such filing.
ITEM 9.01 FINANCIAL STATEMENTS AND EXHIBITS
(c) EXHIBITS
99.1 Earnings press release dated October 28, 2015.
99.2 CFO commentary press release dated October 28, 2015.
SIGNATURES
Pursuant to the requirements of the Securities Exchange Act of 1934, the Company has duly caused this report to be signed on its behalf by the undersigned hereunto duly authorized.
|
Date: October 28, 2015 |
||
|
ARROW ELECTRONICS, INC. |
||
|
|
By: |
/s/ Gregory Tarpinian |
|
Name: |
Gregory Tarpinian |
|
|
Title: |
Senior Vice President, General Counsel and Secretary |
|
EXHIBIT INDEX
|
Exhibit |
Description |
|
99.1 |
Earnings press release issued by Arrow Electronics, Inc., dated October 28, 2015. |
|
99.2 |
CFO commentary press release issued by Arrow Electronics, Inc., dated October 28, 2015. |
Exhibit 99.1
Arrow Electronics Reports Third-Quarter Sales of $5.7 Billion
-- Non-GAAP Earnings Per Share of $1.40 --
-- 2015 Non-GAAP Earnings Per Share Expected to Be in Excess of $6.00 --
CENTENNIAL, Colo.--(BUSINESS WIRE)--October 28, 2015--Arrow Electronics, Inc. (NYSE: ARW) today reported third-quarter 2015 net income of $109.2 million, or $1.15 per share on a diluted basis, compared with net income of $146.9 million, or $1.47 per share on a diluted basis, in the third quarter of 2014. Excluding certain items1 in the third quarters of 2015 and 2014, net income would have been $133.4 million, or $1.40 per share on a diluted basis, in the third quarter of 2015, compared with net income of $140.2 million, or $1.40 per share on a diluted basis, in the third quarter of 2014. Third-quarter sales of $5.7 billion increased 2 percent from sales of $5.61 billion in the prior year. Third-quarter sales, adjusted for the impact of acquisitions and changes in foreign currencies, decreased 1 percent year over year. In the third quarter of 2015, changes in foreign currencies had negative impacts on growth of approximately $280 million on sales and $.07 or 5 percent on earnings per share on a diluted basis compared to the third quarter of 2014.
“Both our global components and enterprise computing solutions businesses continued to experience strong demand in Europe, while our Americas businesses broadly performed as we had anticipated. In Asia, the economic deterioration was worse than we expected,” said Michael J. Long, chairman, president, and chief executive officer. “We remain committed to continual productivity improvement, and have enhanced our ongoing efficiency initiatives to drive $40 million of expense savings on an annual basis. We are principally accelerating the integrations of some of our recent acquisitions, increasing automation across multiple functions enabled by our Unity enterprise resource planning tool, utilizing our enterprise strengths for greater purchasing leverage, and rationalizing our real estate footprint.”
Global components third-quarter sales of $3.69 billion declined 1 percent year over year. Third-quarter sales, as adjusted, declined 3 percent year over year. Americas components sales declined 4 percent year over year. Europe components sales grew 5 percent year over year. Sales in the region, as adjusted, grew 11 percent year over year. Asia-Pacific components sales declined 2 percent year over year. Core components sales in Asia declined 5 percent year over year.
Global enterprise computing solutions third-quarter sales of $2.01 billion grew 7 percent year over year. Sales, as adjusted, grew 1 percent year over year. Americas sales grew 11 percent year over year. Sales in the region, as adjusted, declined 4 percent year over year. Europe sales declined 3 percent year over year. Sales in the region, as adjusted, grew 15 percent year over year. “Enterprise computing solutions posted record third-quarter operating income and operating margins, with our software sales a greater percentage of our product mix,” added Mr. Long.
“Cash flow from operations on a trailing 12-month basis was $568 million as we continue to exceed our cash flow target,” said Paul J. Reilly, executive vice president, finance and operations, and chief financial officer. “During the quarter, we returned approximately $50 million to shareholders through our stock repurchase program, and approximately $307 million on a trailing 12-month basis. We had approximately $469 million of remaining authorization under our share repurchase programs at the end of the third quarter.”
1 A reconciliation of non-GAAP adjusted financial measures, including sales, as adjusted, operating income, as adjusted, net income attributable to shareholders, as adjusted, and net income per share, as adjusted, to GAAP financial measures is presented in the reconciliation tables included herein.
NINE-MONTH RESULTS
Arrow’s net income for the first nine months of 2015 was $339.2 million, or $3.52 per share on a diluted basis, compared with net income of $381.9 million, or $3.80 per share on a diluted basis in the first nine months of 2014. Excluding certain items1 in both the first nine months of 2015 and 2014, net income would have been $410.1 million, or $4.26 per share on a diluted basis, in the first nine months of 2015 compared with net income of $408.6 million, or $4.06 per share on a diluted basis, in the first nine months of 2014. In the first nine months of 2015, sales of $16.53 billion increased 1 percent from sales of $16.37 billion in the first nine months of 2014. Nine-month sales, adjusted for acquisitions and changes in foreign currencies, increased 2 percent year over year. For the first nine months of 2015, changes in foreign currencies had negative impacts on growth of approximately $950 million on sales and $.27 or 7 percent on earnings per share on a diluted basis compared to the first nine months of 2014.
GUIDANCE
“As we look to the fourth quarter, we believe that total sales will be between $6.15 billion and $6.55 billion, with global components sales between $3.45 billion and $3.65 billion, and global enterprise computing solutions sales between $2.7 billion and $2.9 billion. As a result of this outlook, we expect earnings per share on a diluted basis, excluding any charges, to be in the range of $1.75 to $1.91 per share. Our guidance assumes an average tax rate in the range of 27 to 29 percent and average diluted shares outstanding are expected to be 95 million. We are expecting the average USD-to-Euro exchange rate for the fourth quarter to be approximately $1.12 to €1. Based on this assumption, changes in foreign currencies will have a negative impact of approximately $215 million or 3 percent on sales and $.08 or 4 percent on earnings per share on a diluted basis, respectively, when compared with the fourth quarter of 2014. At the midpoint of our fourth-quarter guidance range, full-year 2015 earnings per share, on a diluted basis, excluding any charges, would total approximately $6.08 and grow 3 percent compared to full-year 2014. Adjusted for the impact of changes in foreign currencies, earnings per share would grow 9 percent compared to full-year 2014,” said Mr. Reilly.
Please refer to the CFO commentary, which can be found at www.arrow.com/investor, as a supplement to the company’s earnings release.
Arrow Electronics (www.arrow.com) is a global provider of products, services and solutions to industrial and commercial users of electronic components and enterprise computing solutions. Arrow serves as a supply channel partner for more than 100,000 original equipment manufacturers, contract manufacturers and commercial customers through a global network of more than 460 locations in 56 countries.
Information Relating to Forward-Looking Statements
This press release includes forward-looking statements that are subject to numerous assumptions, risks, and uncertainties, which could cause actual results or facts to differ materially from such statements for a variety of reasons, including, but not limited to: industry conditions, the company's implementation of its new enterprise resource planning system, changes in product supply, pricing and customer demand, competition, other vagaries in the global components and global enterprise computing solutions markets, changes in relationships with key suppliers, increased profit margin pressure, the effects of additional actions taken to become more efficient or lower costs, risks related to the integration of acquired businesses, changes in legal and regulatory matters, and the company’s ability to generate additional cash flow. Forward-looking statements are those statements which are not statements of historical fact. These forward-looking statements can be identified by forward-looking words such as "expects," "anticipates," "intends," "plans," "may," "will," "believes," "seeks," "estimates," and similar expressions. Shareholders and other readers are cautioned not to place undue reliance on these forward-looking statements, which speak only as of the date on which they are made. The company undertakes no obligation to update publicly or revise any of the forward-looking statements.
For a further discussion of factors to consider in connection with these forward-looking statements, investors should refer to Item 1A Risk Factors of the company’s Annual Report on Form 10-K for the year ended December 31, 2014.
Certain Non-GAAP Financial Information
In addition to disclosing financial results that are determined in accordance with accounting principles generally accepted in the United States (“GAAP”), the company also provides certain non-GAAP financial information relating to sales, operating income, net income attributable to shareholders, and net income per basic and diluted share. The company provides sales on a non-GAAP basis adjusted for the impact of changes in foreign currencies and the impact of acquisitions by adjusting the company's operating results for businesses acquired, including the amortization expense related to acquired intangible assets, as if the acquisitions had occurred at the beginning of the earliest period presented (referred to as "impact of acquisitions"). Operating income, net income attributable to shareholders, and net income per basic and diluted share are adjusted for certain charges, credits, gains, and losses that the company believes impact the comparability of its results of operations. These charges, credits, gains, and losses arise out of the company’s efficiency enhancement initiatives, acquisitions (including intangible assets amortization expense), loss on prepayment of debt, and (gain)/loss on investments. A reconciliation of the company’s non-GAAP financial information to GAAP is set forth in the tables below.
The company believes that such non-GAAP financial information is useful to investors to assist in assessing and understanding the company’s operating performance and underlying trends in the company’s business because management considers these items referred to above to be outside the company’s core operating results. This non-GAAP financial information is among the primary indicators management uses as a basis for evaluating the company’s financial and operating performance. In addition, the company’s Board of Directors may use this non-GAAP financial information in evaluating management performance and setting management compensation.
The presentation of this additional non-GAAP financial information is not meant to be considered in isolation or as a substitute for, or alternative to, sales, operating income, net income and net income per basic and diluted share determined in accordance with GAAP. Analysis of results and outlook on a non-GAAP basis should be used as a complement to, and in conjunction with, data presented in accordance with GAAP.
| ARROW ELECTRONICS, INC. | |||||||||||||||||||
|
CONSOLIDATED STATEMENTS OF OPERATIONS |
|||||||||||||||||||
| (In thousands except per share data) | |||||||||||||||||||
| (Unaudited) | |||||||||||||||||||
|
|
|||||||||||||||||||
| Quarter Ended | Nine Months Ended | ||||||||||||||||||
|
September 26, |
September 27, |
September 26, |
September 27, |
||||||||||||||||
|
Sales |
$ | 5,698,304 | $ | 5,613,216 | $ | 16,530,678 | $ | 16,371,795 | |||||||||||
|
Costs and expenses: |
|||||||||||||||||||
|
Cost of sales |
4,955,937 | 4,884,529 | 14,334,394 | 14,191,759 | |||||||||||||||
|
Selling, general, and administrative expenses |
497,876 | 485,864 | 1,457,160 | 1,453,675 | |||||||||||||||
|
Depreciation and amortization |
40,941 | 39,072 | 117,854 | 115,355 | |||||||||||||||
|
Restructuring, integration, and other charges |
17,756 | 3,935 | 51,099 | 25,181 | |||||||||||||||
| 5,512,510 | 5,413,400 | 15,960,507 | 15,785,970 | ||||||||||||||||
|
Operating income |
185,794 | 199,816 | 570,171 | 585,825 | |||||||||||||||
|
Equity in earnings of affiliated companies |
1,674 | 2,192 | 4,890 | 4,790 | |||||||||||||||
|
Gain on sale of investment |
- | 29,743 | 2,008 | 29,743 | |||||||||||||||
|
Interest and other financing expense, net |
35,409 | 27,522 | 100,959 | 86,079 | |||||||||||||||
| - | - | 4,443 | - | ||||||||||||||||
|
Income before income taxes |
152,059 | 204,229 | 471,667 | 534,279 | |||||||||||||||
|
Provision for income taxes |
41,755 | 57,377 | 130,589 | 152,175 | |||||||||||||||
|
Consolidated net income |
110,304 | 146,852 | 341,078 | 382,104 | |||||||||||||||
|
Noncontrolling interests |
1,060 | (12 | ) | 1,844 | 236 | ||||||||||||||
|
Net income attributable to shareholders |
$ | 109,244 | $ | 146,864 | $ | 339,234 | $ | 381,868 | |||||||||||
|
Net income per share: |
|||||||||||||||||||
|
Basic |
$ | 1.16 | $ | 1.49 | $ | 3.56 | $ | 3.84 | |||||||||||
|
Diluted |
$ | 1.15 | $ | 1.47 | $ | 3.52 | $ | 3.80 | |||||||||||
|
Weighted average shares outstanding: |
|||||||||||||||||||
|
Basic |
94,302 | 98,631 | 95,277 | 99,336 | |||||||||||||||
|
Diluted |
95,363 | 99,866 | 96,302 | 100,609 | |||||||||||||||
| ARROW ELECTRONICS, INC. | |||||||||
|
CONSOLIDATED BALANCE SHEETS |
|||||||||
| (In thousands except par value) | |||||||||
|
September 26, |
December 31, |
||||||||
| (Unaudited) | |||||||||
| ASSETS | |||||||||
| Current assets: | |||||||||
| Cash and cash equivalents | $ | 336,744 | $ | 400,355 | |||||
| Accounts receivable, net | 5,065,503 | 6,043,850 | |||||||
| Inventories | 2,478,907 | 2,335,257 | |||||||
| Other current assets | 300,647 | 253,145 | |||||||
| Total current assets | 8,181,801 | 9,032,607 | |||||||
| Property, plant, and equipment, at cost: | |||||||||
| Land | 23,595 | 23,770 | |||||||
| Buildings and improvements | 164,568 | 144,530 | |||||||
| Machinery and equipment | 1,234,206 | 1,146,045 | |||||||
| 1,422,369 | 1,314,345 | ||||||||
| Less: Accumulated depreciation and amortization | (732,374 | ) | (678,046 | ) | |||||
| Property, plant, and equipment, net | 689,995 | 636,299 | |||||||
| Investments in affiliated companies | 72,498 | 69,124 |
|
||||||
| Intangible assets, net | 414,428 | 335,711 | |||||||
| Cost in excess of net assets of companies acquired | 2,366,968 | 2,069,209 | |||||||
| Other assets | 280,508 | 292,351 | |||||||
| Total assets | $ | 12,006,198 | $ | 12,435,301 | |||||
| LIABILITIES AND EQUITY | |||||||||
| Current liabilities: | |||||||||
| Accounts payable | $ | 3,852,306 | $ | 5,027,103 | |||||
| Accrued expenses | 695,620 | 797,464 | |||||||
| Short-term borrowings, including current portion of long-term debt | 85,796 | 13,454 | |||||||
| Total current liabilities | 4,633,722 | 5,838,021 | |||||||
| Long-term debt | 2,748,283 | 2,067,898 | |||||||
| Other liabilities | 411,582 | 370,471 | |||||||
| Equity: | |||||||||
| Shareholders' equity: | |||||||||
| Common stock, par value $1: | |||||||||
|
Authorized – 160,000 shares in both 2015 and 2014 |
|||||||||
| Issued – 125,424 shares in both 2015 and 2014 | 125,424 | 125,424 | |||||||
| Capital in excess of par value | 1,094,859 | 1,086,082 | |||||||
| Treasury stock (31,895 and 29,529 shares in 2015 and 2014, respectively), at cost | (1,330,916 | ) | (1,169,673 | ) | |||||
| Retained earnings | 4,515,988 | 4,176,754 | |||||||
| Accumulated other comprehensive loss | (247,115 | ) | (64,617 | ) | |||||
| Total shareholders' equity | 4,158,240 | 4,153,970 | |||||||
| Noncontrolling interests | 54,371 | 4,941 | |||||||
| Total equity | 4,212,611 | 4,158,911 | |||||||
| Total liabilities and equity | $ | 12,006,198 | $ | 12,435,301 | |||||
| ARROW ELECTRONICS, INC. | ||||||||
|
CONSOLIDATED STATEMENTS OF CASH FLOWS |
||||||||
| (In thousands) | ||||||||
| (Unaudited) | ||||||||
| Quarter Ended | ||||||||
|
September 26, |
September 27, |
|||||||
| Cash flows from operating activities: | ||||||||
| Consolidated net income | $ | 110,304 | $ | $146,852 | ||||
| Adjustments to reconcile consolidated net income to net cash used for operations: | ||||||||
| Depreciation and amortization | 40,941 | 39,072 | ||||||
| Amortization of stock-based compensation | 11,777 | 11,116 | ||||||
| Equity in earnings of affiliated companies | (1,674 | ) | (2,192 | ) | ||||
| Deferred income taxes | 375 | (4,611 | ) | |||||
| Restructuring, integration, and other charges | 12,643 | 2,556 | ||||||
| Gain on sale of investment | - | (18,269 | ) | |||||
| Excess tax benefits from stock-based compensation arrangements | (21 | ) | (729 | ) | ||||
| Other | 1,475 | 657 | ||||||
| Change in assets and liabilities, net of effects of acquired businesses: | ||||||||
| Accounts receivable | (22,871 | ) | (41,481 | ) | ||||
| Inventories | 37,935 | 32,740 | ||||||
| Accounts payable | (298,552 | ) | (222,128 | ) | ||||
| Accrued expenses | 13,995 | (42,228 | ) | |||||
| Other assets and liabilities | (14,821 | ) | 31,421 | |||||
| Net cash used for operating activities | (108,494 | ) | (67,224 | ) | ||||
| Cash flows from investing activities: | ||||||||
| Cash consideration paid for acquired businesses | (42,236 | ) | (69,298 | ) | ||||
| Acquisition of property, plant, and equipment | (44,236 | ) | (25,878 | ) | ||||
| Proceeds from sale of investment | - | 40,542 | ||||||
| Net cash used for investing activities | (86,472 | ) | (54,634 | ) | ||||
| Cash flows from financing activities: | ||||||||
| Change in short-term and other borrowings | (252 | ) | 661 | |||||
| Proceeds from (repayment of)long-term bank borrowings, net | 204,300 | 109,800 | ||||||
| Proceeds from exercise of stock options | 248 | 2,692 | ||||||
| Excess tax benefits from stock-based compensation arrangements | 21 | 729 | ||||||
| Repurchases of common stock | (50,177 | ) | (50,600 | ) | ||||
| Other | (2,831 | ) | - | |||||
| Net cash provided by financing activities | 151,309 | 63,282 | ||||||
| Effect of exchange rate changes on cash | (19,320 | ) | 7,873 | |||||
| Net decrease in cash and cash equivalents | (62,977 | ) | (50,703 | ) | ||||
| Cash and cash equivalents at beginning of period | 399,721 | 308,936 | ||||||
| Cash and cash equivalents at end of period | $ | 336,744 | $ | $258,233 | ||||
| ARROW ELECTRONICS, INC. | ||||||||
|
CONSOLIDATED STATEMENTS OF CASH FLOWS |
||||||||
| (In thousands) | ||||||||
| (Unaudited) | ||||||||
| Nine Months Ended | ||||||||
|
September 26, |
September 27, |
|||||||
| Cash flows from operating activities: | ||||||||
| Consolidated net income | $ | 341,078 | $ | 382,104 | ||||
| Adjustments to reconcile consolidated net income to net cash provided by operations: | ||||||||
| Depreciation and amortization | 117,854 | 115,355 | ||||||
| Amortization of stock-based compensation | 33,783 | 31,283 | ||||||
| Equity in earnings of affiliated companies | (4,890 | ) | (4,790 | ) | ||||
| Deferred income taxes | 26,881 | 11,368 | ||||||
| Restructuring, integration, and other charges | 38,106 | 18,102 | ||||||
| Gain on sale of investment | (2,008 | ) | (18,269 | ) | ||||
| Excess tax benefits from stock-based compensation arrangements | (5,863 | ) | (6,977 | ) | ||||
| Other | 8,057 | 2,029 | ||||||
| Change in assets and liabilities, net of effects of acquired businesses: | ||||||||
| Accounts receivable | 1,056,282 | 556,445 | ||||||
| Inventories | (44,890 | ) | (97,929 | ) | ||||
| Accounts payable | (1,318,702 | ) | (632,191 | ) | ||||
| Accrued expenses | (110,834 | ) | (150,165 | ) | ||||
| Other assets and liabilities | (23,910 | ) | 9,883 | |||||
| Net cash provided by operating activities | 110,944 | 216,248 | ||||||
| Cash flows from investing activities: | ||||||||
| Cash consideration paid for acquired businesses | (512,910 | ) | (129,522 | ) | ||||
| Acquisition of property, plant, and equipment | (113,056 | ) | (87,881 | ) | ||||
| Proceeds from sale of investment | 2,008 | 40,542 | ||||||
| Net cash used for investing activities | (623,958 | ) | (176,861 | ) | ||||
| Cash flows from financing activities: | ||||||||
| Change in short-term and other borrowings | (4,069 | ) | (9,243 | ) | ||||
| Proceeds from (repayment of) long-term bank borrowings, net | 238,700 | (10,200 | ) | |||||
| Net proceeds from note offering | 688,162 | - | ||||||
| Redemption of notes | (254,313 | ) | - | |||||
| Proceeds from exercise of stock options | 14,722 | 21,013 | ||||||
| Excess tax benefits from stock-based compensation arrangements | 5,863 | 6,977 | ||||||
| Repurchases of common stock | (206,601 | ) | (189,411 | ) | ||||
| Other | (5,831 | ) | - | |||||
| Net cash provided by (used for) financing activities | 476,633 | (180,864 | ) | |||||
| Effect of exchange rate changes on cash | (27,230 | ) | 9,108 | |||||
| Net decrease in cash and cash equivalents | (63,611 | ) | (132,369 | ) | ||||
| Cash and cash equivalents at beginning of period | 400,355 | 390,602 | ||||||
| Cash and cash equivalents at end of period | $ | 336,744 | $ | $258,233 | ||||
| ARROW ELECTRONICS, INC. | |||||||||||||||||
| (In thousands except per share data) | |||||||||||||||||
| (Unaudited) | |||||||||||||||||
|
NON-GAAP SALES RECONCILIATION |
|||||||||||||||||
| Quarter Ended | |||||||||||||||||
|
September 26, |
September 27, |
% Change | |||||||||||||||
| Consolidated sales, as reported | $ | 5,698,304 | $ | 5,613,216 | 1.5% | ||||||||||||
| Impact of changes in foreign currencies | - | (278,778 | ) | ||||||||||||||
| Impact of acquisitions | 5,413 | 453,596 | |||||||||||||||
| Consolidated sales, as adjusted | $ | 5,703,717 | $ | 5,788,034 | (1.5)% | ||||||||||||
| Global components sales, as reported | $ | 3,692,051 | $ | 3,731,289 | (1.1)% | ||||||||||||
| Impact of changes in foreign currencies | - | (163,753 | ) | ||||||||||||||
| Impact of acquisitions | 5,413 | 240,618 | |||||||||||||||
| Global components sales, as adjusted | $ | 3,697,464 | $ | 3,808,154 | (2.9)% | ||||||||||||
| Europe components sales, as reported | $ | 992,623 | $ | 949,232 | 4.6% | ||||||||||||
| Impact of changes in foreign currencies | - | (145,742 | ) | ||||||||||||||
| Impact of acquisitions | 5,413 | 97,356 | |||||||||||||||
| Europe components sales, as adjusted | $ | 998,036 | $ | 900,846 | 10.8% | ||||||||||||
| Asia components sales, as reported | $ | 1,241,190 | $ | 1,269,792 | (2.3)% | ||||||||||||
| Impact of changes in foreign currencies | - | (12,524 | ) | ||||||||||||||
| Impact of acquisitions | - | 126,394 | |||||||||||||||
| Asia components sales, as adjusted | $ | 1,241,190 | $ | 1,383,662 | (10.3)% | ||||||||||||
| Global ECS sales, as reported | $ | 2,006,253 | $ | 1,881,927 | 6.6% | ||||||||||||
| Impact of changes in foreign currencies | - | (115,025 | ) | ||||||||||||||
| Impact of acquisitions | - | 212,978 | |||||||||||||||
| Global ECS sales, as adjusted | $ | 2,006,253 | $ | 1,979,880 | 1.3% | ||||||||||||
| Europe ECS sales, as reported | $ | 599,128 | $ | 619,045 | (3.2)% | ||||||||||||
| Impact of changes in foreign currencies | - | (98,803 | ) | ||||||||||||||
| Impact of acquisitions | - | - | |||||||||||||||
| Europe ECS sales, as adjusted | $ | 599,128 | $ | 520,242 | 15.2% | ||||||||||||
| Americas ECS sales, as reported | $ | 1,407,125 | $ | 1,262,882 | 11.4% | ||||||||||||
| Impact of changes in foreign currencies | - | (16,222 | ) | ||||||||||||||
| Impact of acquisitions | - | 212,978 | |||||||||||||||
| Americas ECS sales, as adjusted | $ | 1,407,125 | $ | 1,459,638 | (3.6)% | ||||||||||||
| ARROW ELECTRONICS, INC. | ||||||||||||
| (In thousands except per share data) | ||||||||||||
| (Unaudited) | ||||||||||||
|
NON-GAAP SALES RECONCILIATION |
||||||||||||
|
|
Nine Months Ended | |||||||||||
|
September 26, |
September 27, |
% Change | ||||||||||
| Consolidated sales, as reported | $ | 16,530,678 | $ | 16,371,795 | 1.0% | |||||||
| Impact of changes in foreign currencies | - | (949,150 | ) | |||||||||
| Impact of acquisitions | 369,133 | 1,212,245 | ||||||||||
| Consolidated sales, as adjusted | $ | 16,899,811 | $ | 16,634,890 | 1.6% | |||||||
| Global components sales, as reported | $ | 10,736,989 | $ | 10,721,814 | 0.1% | |||||||
| Impact of changes in foreign currencies | - | (538,462 | ) | |||||||||
| Impact of acquisitions | 286,132 | 752,783 | ||||||||||
| Global components sales, as adjusted | $ | 11,023,121 | $ | 10,936,135 | 0.8% | |||||||
| Europe components sales, as reported | $ | 2,902,619 | $ | 2,923,093 | (0.7)% | |||||||
| Impact of changes in foreign currencies | - | (498,741 | ) | |||||||||
| Impact of acquisitions | 95,087 | 295,666 | ||||||||||
| Europe components sales, as adjusted | $ | 2,997,706 | $ | 2,720,018 | 10.2% | |||||||
| Asia components sales, as reported | $ | 3,504,969 | $ | 3,412,441 | 2.7% | |||||||
| Impact of changes in foreign currencies | - | (28,114 | ) | |||||||||
| Impact of acquisitions | 187,699 | 377,493 | ||||||||||
| Asia components sales, as adjusted | $ | 3,692,668 | $ | 3,761,820 | (1.8)% | |||||||
| Global ECS sales, as reported | $ | 5,793,689 | $ | 5,649,981 | 2.5% | |||||||
| Impact of changes in foreign currencies | - | (410,688 | ) | |||||||||
| Impact of acquisitions | 83,001 | 459,462 | ||||||||||
| Global ECS sales, as adjusted | $ | 5,876,690 | $ | 5,698,755 | 3.1% | |||||||
| Europe ECS sales, as reported | $ | 1,859,069 | $ | 2,061,057 | (9.8)% | |||||||
| Impact of changes in foreign currencies | - | (371,032 | ) | |||||||||
| Impact of acquisitions | - | - | ||||||||||
| Europe ECS sales, as adjusted | $ | 1,859,069 | $ | 1,690,025 | 10.0 % | |||||||
|
|
||||||||||||
|
|
||||||||||||
| Americas ECS sales, as reported | $ | 3,934,620 | $ | 3,588,923 | 9.6% | |||||||
| Impact of changes in foreign currencies | - | (39,656 | ) | |||||||||
| Impact of acquisitions | 83,001 | 459,462 | ||||||||||
| Americas ECS sales, as adjusted | $ | 4,017,621 | $ | 4,008,729 | 0.2% | |||||||
| ARROW ELECTRONICS, INC. | |||||||||||||||||||
| (In thousands except per share data) | |||||||||||||||||||
| (Unaudited) | |||||||||||||||||||
|
NON-GAAP EARNINGS RECONCILIATION |
|||||||||||||||||||
|
|
Quarter Ended | Nine Months Ended | |||||||||||||||||
|
September 26, |
September 27, |
September 26, |
September 27, |
||||||||||||||||
| Operating income, as reported | $ | 185,794 | $ | 199,816 | $ | 570,171 | $ | 585,825 | |||||||||||
| Intangible assets amortization expense | 14,269 | 11,108 | 39,293 | 32,925 | |||||||||||||||
| Restructuring, integration, and other charges | 17,756 | 3,935 | 51,099 | 25,181 | |||||||||||||||
| Operating income, as adjusted | $ | 217,819 | $ | 214,859 | $ | 660,563 | $ | 643,931 | |||||||||||
| Net income attributable to shareholders, as reported | $ | 109,244 | $ | 146,864 | $ | 339,234 | $ | 381,868 | |||||||||||
| Intangible assets amortization expense | 11,521 | 9,086 | 31,719 | 26,860 | |||||||||||||||
| Restructuring, integration, and other charges | 12,642 | 2,556 | 38,106 | 18,102 | |||||||||||||||
| Loss on prepayment of debt |
- |
- |
1,808 |
- |
|||||||||||||||
| (Gain)/loss on investments | - | (18,269 | ) | (746 | ) | (18,269 | ) | ||||||||||||
| Net income attributable to shareholders, as adjusted | $ | 133,407 | $ | 140,237 | $ | 410,121 | $ | 408,561 | |||||||||||
| Net income per basic share, as reported | $ | 1.16 | $ | 1.49 | $ | 3.56 | $ | 3.84 | |||||||||||
| Intangible assets amortization expense | .12 |
.09 |
.33 |
.27 |
|||||||||||||||
| Restructuring, integration, and other charges | .13 |
.03 |
.40 |
.18 |
|||||||||||||||
| Loss on prepayment of debt | - |
- |
.02 |
- |
|||||||||||||||
| (Gain)/loss on investments | - |
(.19 |
) | (.01 | ) |
(.18 |
) | ||||||||||||
| Net income per basic share, as adjusted | $ | 1.41 | $ | 1.42 | $ | 4.30 | $ | 4.11 | |||||||||||
| Net income per diluted share, as reported | $ | 1.15 | $ | 1.47 | $ | 3.52 | $ | 3.80 | |||||||||||
| Intangible assets amortization expense | .12 |
.09 |
.33 |
.27 |
|||||||||||||||
| Restructuring, integration, and other charges | .13 |
.03 |
.40 |
.18 |
|||||||||||||||
| Loss on prepayment of debt | - |
- |
.02 |
- |
|||||||||||||||
| (Gain)/loss on investments | - |
(.18 |
) | (.01 | ) |
(.18 |
) | ||||||||||||
| Net income per diluted share, as adjusted | $ | 1.40 | $ | 1.40 | $ | 4.26 | $ | 4.06 | |||||||||||
|
The sum of the components for basic and diluted net income per share, as adjusted, may not agree to totals, as presented, due to rounding. |
|||||||||||||||||||
| ARROW ELECTRONICS, INC. | |||||||||||||||||||||
| (In thousands except per share data) | |||||||||||||||||||||
| (Unaudited) | |||||||||||||||||||||
|
SEGMENT INFORMATION |
|||||||||||||||||||||
| Quarter Ended |
Nine Months Ended |
||||||||||||||||||||
|
September 26, |
September 27, |
September 26, |
September 27, |
||||||||||||||||||
| Sales: | |||||||||||||||||||||
| Global components | $ | 3,692,051 | $ | 3,731,289 | $ | 10,736,989 | $ | 10,721,814 | |||||||||||||
| Global ECS | 2,006,253 | 1,881,927 | 5,793,689 | 5,649,981 | |||||||||||||||||
| Consolidated | $ | 5,698,304 | $ | 5,613,216 | $ | 16,530,678 | $ | 16,371,795 | |||||||||||||
| Operating income (loss): | |||||||||||||||||||||
| Global components | $ | 164,744 | $ | 179,451 | $ | 499,456 | $ | 500,239 | |||||||||||||
| Global ECS | 84,233 | 69,172 | 250,144 | 229,320 | |||||||||||||||||
| Corporate (a) | (63,183 | ) | (48,807 | ) | (179,429 | ) | (143,734 | ) | |||||||||||||
| Consolidated | $ | 185,794 | $ | 199,816 | $ | 570,171 | $ | 585,825 | |||||||||||||
|
(a) Includes restructuring, integration, and other charges of $17.8 million and $51.1 million for the third quarter and first nine months of 2015 and $3.9 million and $25.2 million for the third quarter and first nine months of 2014, respectively. |
|||||||||||||||||||||
|
NON-GAAP SEGMENT RECONCILIATION |
|||||||||||||||||||||
|
|
Quarter Ended | Nine Months Ended | |||||||||||||||||||
|
September 26, |
September 27, |
September 26, |
September 27, |
||||||||||||||||||
| Global components operating income, as reported | $ | 164,744 | $ | 179,451 | $ | 499,456 | $ | 500,239 | |||||||||||||
| Intangible assets amortization expense | 7,540 | 5,493 | 20,468 | 16,499 | |||||||||||||||||
| Global components operating income, as adjusted | $ | 172,284 | $ | 184,944 | $ | 519,924 | $ | 516,738 | |||||||||||||
| Global ECS operating income, as reported | $ | 84,233 | $ | 69,172 | $ | 250,144 | $ | 229,320 | |||||||||||||
| Intangible assets amortization expense | 6,729 | 5,615 | 18,825 | 16,426 | |||||||||||||||||
| Global ECS operating income, as adjusted | $ | 90,962 | $ | 74,787 | $ | 268,969 | $ | 245,746 | |||||||||||||
CONTACT:
Arrow Electronics, Inc.
Steven O’Brien
Director,
Investor Relations
303-824-4544
or
Paul J. Reilly
Executive
Vice President, Finance and Operations, and
Chief Financial Officer
631-847-1872
or
Media
Contact:
John Hourigan
Vice President, Global Communications
303-824-4586
Exhibit 99.2

2015 Non-GAAP earnings per
share expected to be in excess of $6.00. As reflected in our earnings
release, there are a number of items that impact the comparability of
our results with those in the trailing quarter and prior quarter of last
year. Any discussion of our results will exclude these items to give you
a better sense of our operating results. As always, the operating
information we provide to you should be used as a complement to GAAP
numbers. For a complete reconciliation between our GAAP and non-GAAP
results, please refer to our earnings release and the earnings
reconciliation found at the end of this document. The following reported
and adjusted information included in this CFO commentary is unaudited
and should be read in conjunction with the Form 10-Q for the quarterly
period ended September 26, 2015 and the company’s 2014 Annual Report on
Form 10-K as filed with the Securities and Exchange Commission. CFO
Commentary
Third-Quarter Summary In
the third quarter we delivered overall results that were within our
expectations. We experienced mixed demand trends. The performance by our
Europe components and Europe enterprise computing solutions businesses
were better than our expectations. Our Americas components and
enterprise computing solutions businesses were broadly in-line with our
expectations. Asia components fell short of our expectations as economic
conditions and demand trends deteriorated during the quarter.
Third-quarter sales were $5.7 billion advancing 2% year over year.
Sales, adjusted for the impact of acquisitions and changes in foreign
currencies, declined 1% year over year. Operating income was $218
million, a 6% increase year over year adjusted for changes in foreign
currencies. Operating margin was unchanged year over year. Trailing
12-month cash generated from operating activities was $568 million.
Global components sales were $3.69 billion. Sales increased 3% year over
year adjusted for the impact of changes in foreign currencies.
Third-quarter book-to-bill was 1.00. In the Americas, sales declined 4%
year over year. In Europe, sales increased 11% year over year adjusted
for the impact of acquisitions and changes in foreign currencies. In
Asia, sales decreased 2% year over year. Global components operating
margin of 4.7% decreased 30 basis points year over year principally due
to the consolidation of our recent acquisitions. In enterprise computing
solutions, sales of $2.01 billion increased 7% year over year. On a
nine-month basis, sales grew 3% year over year adjusted for the impact
of acquisitions and changes in foreign currencies. In the Americas,
sales increased 11% year over year. In Europe, sales increased 15% year
over year adjusted for the impact of changes in foreign currencies.
Global enterprise computing solutions achieved record third-quarter
operating income of $91 million and operating margin of 4.5%. In the
third quarter, both global components and enterprise computing solutions
sales were broadly in line with our expectations.
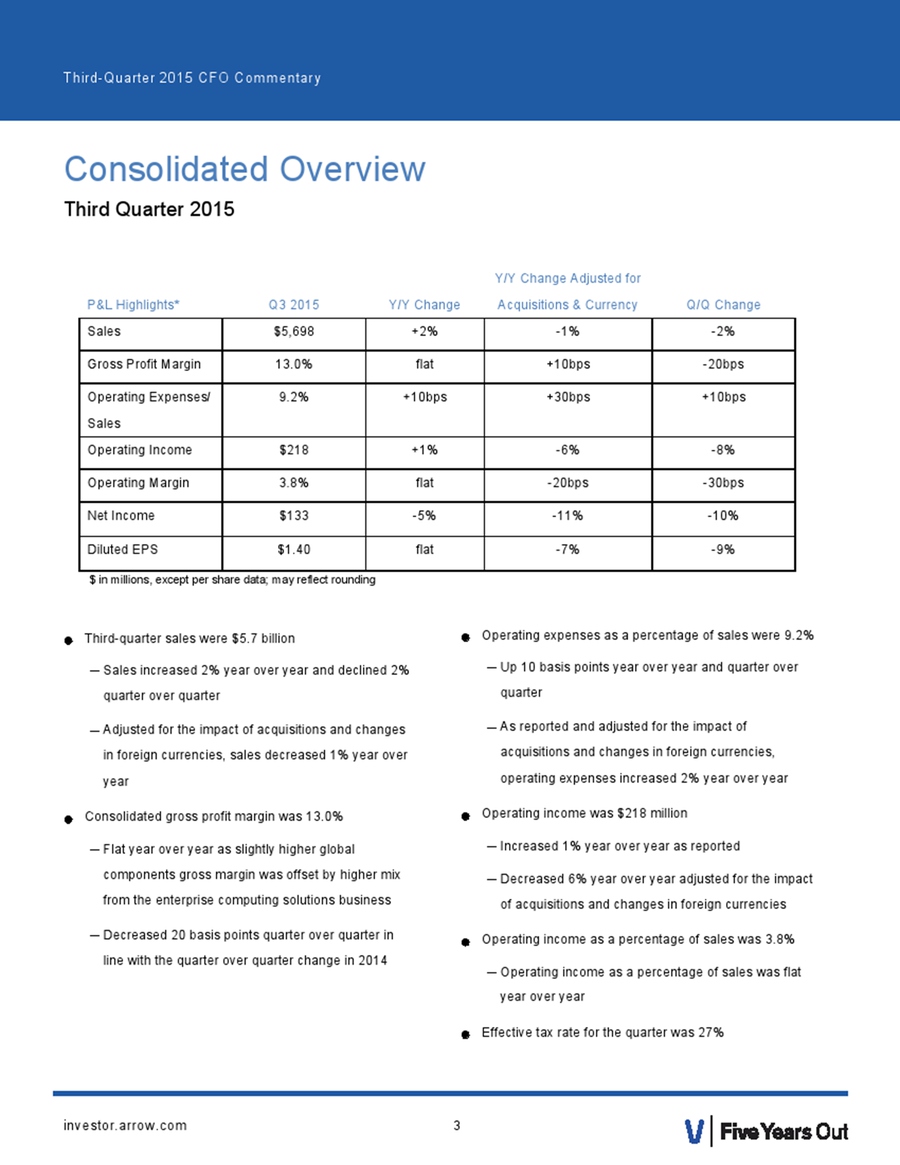
–Adjusted for the impact of
acquisitions and changes in foreign currencies, sales decreased 1% year
over year Consolidated gross profit margin was 13.0% – Flat year over
year as slightly higher global components gross margin was offset by
higher mix from the enterprise computing solutions business – Decreased
20 basis points quarter over quarter in line with the quarter over
quarter change in 2014Operating expenses as a percentage of sales were
9.2% – Up 10 basis points year over year and quarter over quarter – As
reported and adjusted for the impact of acquisitions and changes in
foreign currencies, operating expenses increased 2% year over year
Operating income was $218 million – Increased 1% year over year as
reported – Decreased 6% year over year adjusted for the impact of
acquisitions and changes in foreign currencies Operating income as a
percentage of sales was 3.8% – Operating income as a percentage of sales
was flat year over year Effective tax rate for the quarter was 27%
Net income was $133 million
– Decreased 5% year over year – Adjusted for the impact of acquisitions
and changes in foreign currencies, net income decreased by 11% year over
yearEarnings per share were $1.41 and $1.40 on a basic and diluted
basis, respectively – Diluted EPS was flat year over year – Adjusted for
the impact of acquisitions and changes in foreign currencies, diluted
EPS decreased by 7% year over year A
reconciliation of non-GAAP adjusted financial measures, including sales,
as adjusted, operating income, as adjusted, net income attributable to
shareholders, as adjusted, and net income per share, as adjusted, to
GAAP financial measures is presented in the reconciliation tables
included herein.
Third-Quarter 2015
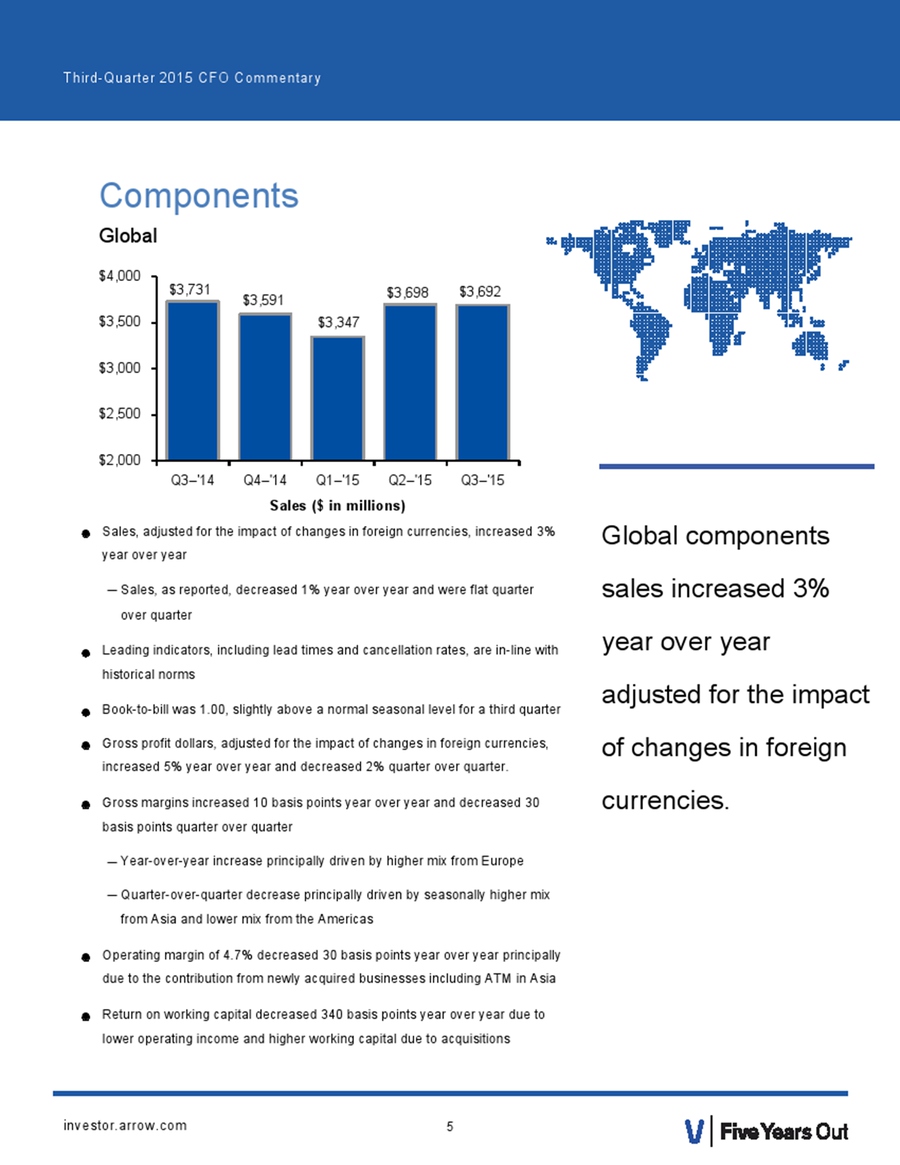
CFO Commentary Sales, adjusted for the impact of changes in foreign
currencies, increased 3% year over year – Sales, as reported, decreased
1% year over year and were flat quarter over quarter Leading indicators,
including lead times and cancellation rates, are in-line with historical
norms Book-to-bill was 1.00, slightly above a normal seasonal level for
a third quarter Gross profit dollars, adjusted for the impact of changes
in foreign currencies, increased 5% year over year and decreased 2%
quarter over quarter. Gross margins increased 10 basis points year over
year and decreased 30 basis points quarter over quarter – Year-over-year
increase principally driven by higher mix from Europe –
Quarter-over-quarter decrease principally driven by seasonally higher
mix from Asia and lower mix from the Americas Operating margin of 4.7%
decreased 30 basis points year over year principally due to the
contribution from newly acquired businesses including ATM in Asia Return
on working capital decreased 340 basis points year over year due to
lower operating income and higher working capital due to acquisitions
Global components sales increased 3% year over year adjusted for the
impact of changes in foreign currencies. Components Global
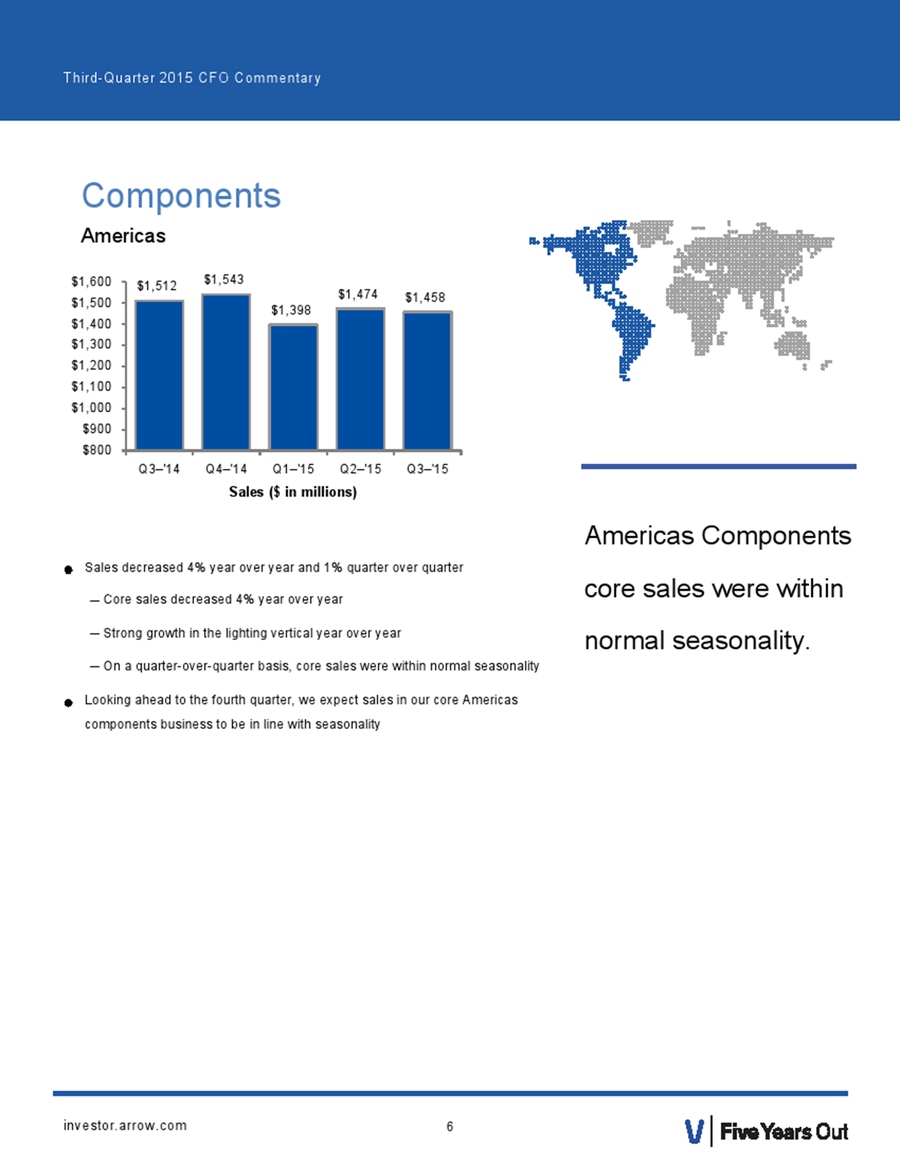
Americas Components core
sales were within normal seasonality. Sales decreased 4% year over year
and 1% quarter over quarter – Core sales decreased 4% year over year –
Strong growth in the lighting vertical year over year – On a
quarter-over-quarter basis, core sales were within normal seasonality
Looking ahead to the fourth quarter, we expect sales in our core
Americas components business to be in line with seasonality Components
Americas
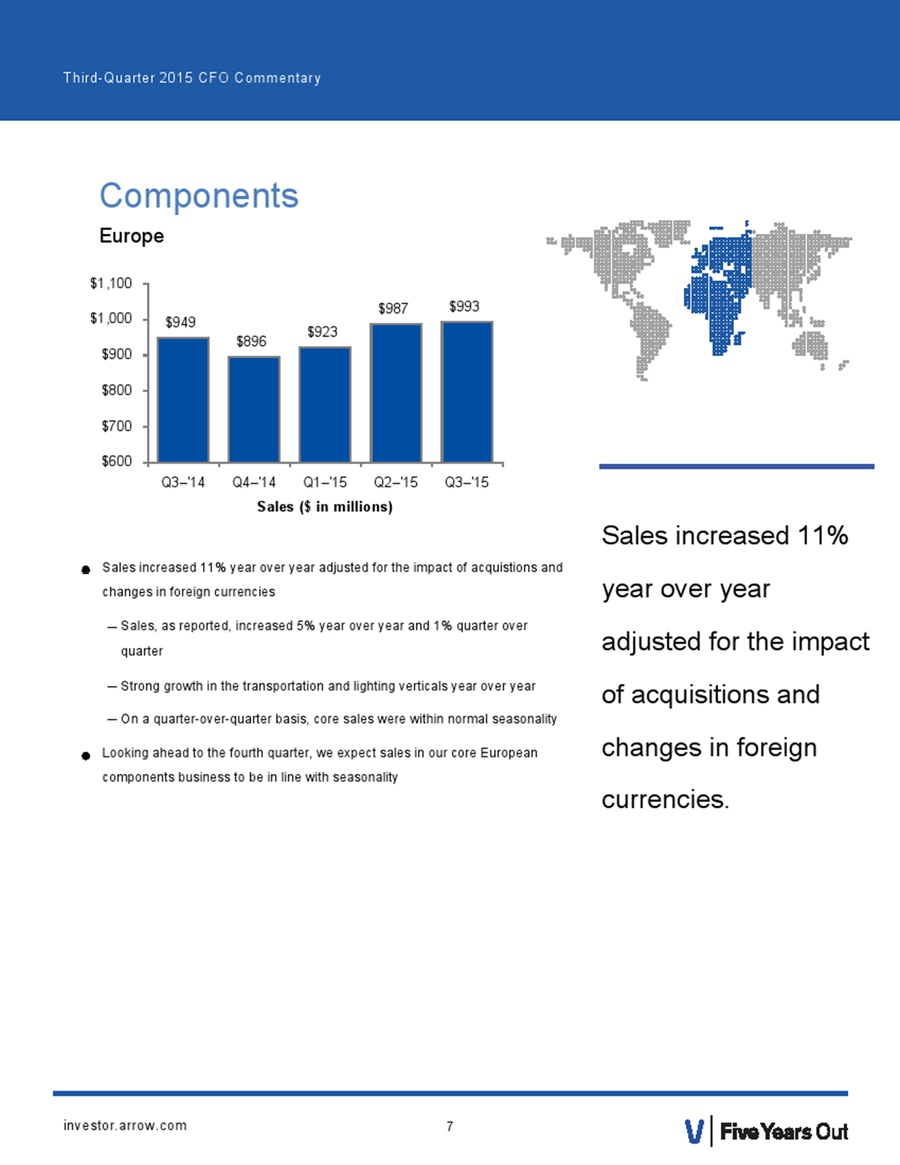
Third-Quarter 2015 CFO
Commentary Sales increased 11% year over year adjusted for the impact of
acquisitions and changes in foreign currencies. Components Europe$949
$896 $923 $987 $993 $600 $700 $800 $900 $1,000 $1,100 Q3–'14 Q4–'14
Q1–'15 Q2–'15 Q3–' Sales increased 11% year over year adjusted for the
impact of acquistions and changes in foreign currencies – Sales, as
reported, increased 5% year over year and 1% quarter over quarter –
Strong growth in the transportation and lighting verticals year over
year – On a quarter-over-quarter basis, core sales were within normal
seasonality Looking ahead to the fourth quarter, we expect sales in our
core European components business to be in line with seasonality
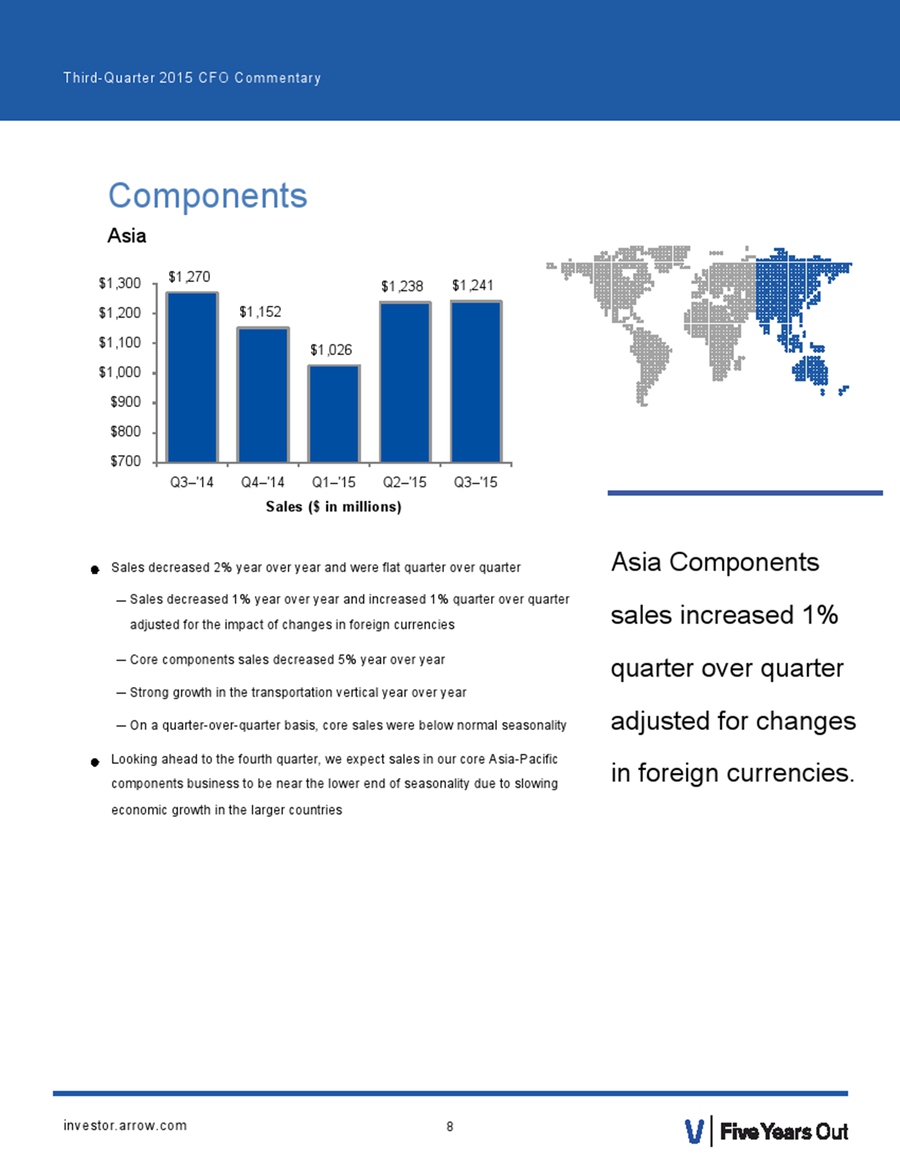
Third-Quarter 2015 CFO
Commentary Sales decreased 2% year over year and were flat quarter over
quarter – Sales decreased 1% year over year and increased 1% quarter
over quarter adjusted for the impact of changes in foreign currencies –
Core components sales decreased 5% year over year – Strong growth in the
transportation vertical year over year – On a quarter-over-quarter
basis, core sales were below normal seasonality Looking ahead to the
fourth quarter, we expect sales in our core Asia-Pacific components
business to be near the lower end of seasonality due to slowing economic
growth in the larger countries Asia Components sales increased 1%
quarter over quarter adjusted for changes in foreign currencies.
Components Asia$1,270 $1,152 $1,026 $1,238 $1,241
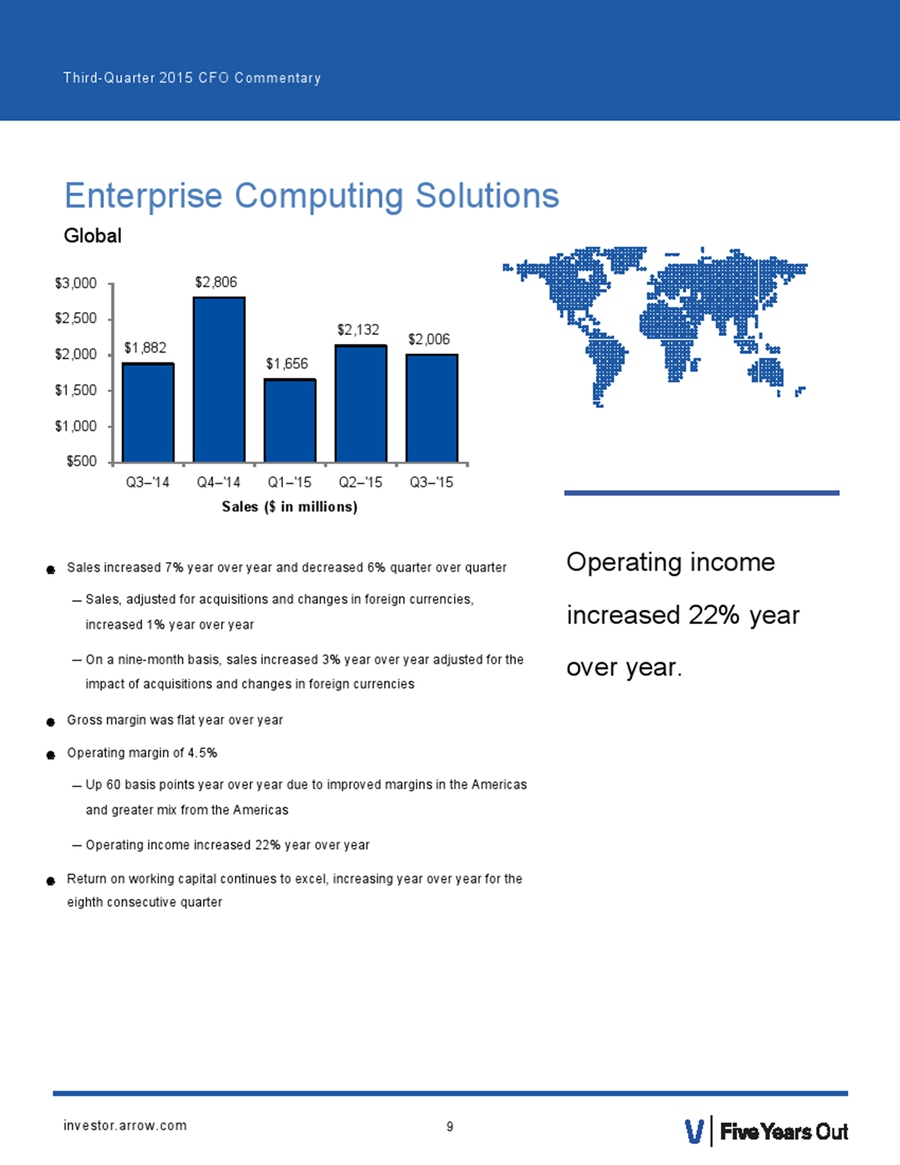
Third-Quarter 2015 CFO
Commentary Sales increased 7% year over year and decreased 6% quarter
over quarter – Sales, adjusted for acquisitions and changes in foreign
currencies, increased 1% year over year – On a nine-month basis, sales
increased 3% year over year adjusted for the impact of acquisitions and
changes in foreign currencies Gross margin was flat year over year
Operating margin of 4.5% – Up 60 basis points year over year due to
improved margins in the Americas and greater mix from the Americas –
Operating income increased 22% year over year Return on working capital
continues to excel, increasing year over year for the eighth consecutive
quarter $1,882 $2,806 $1,656 $2,132 $2,006 Operating income increased
22% year over year. Enterprise Computing Solutions
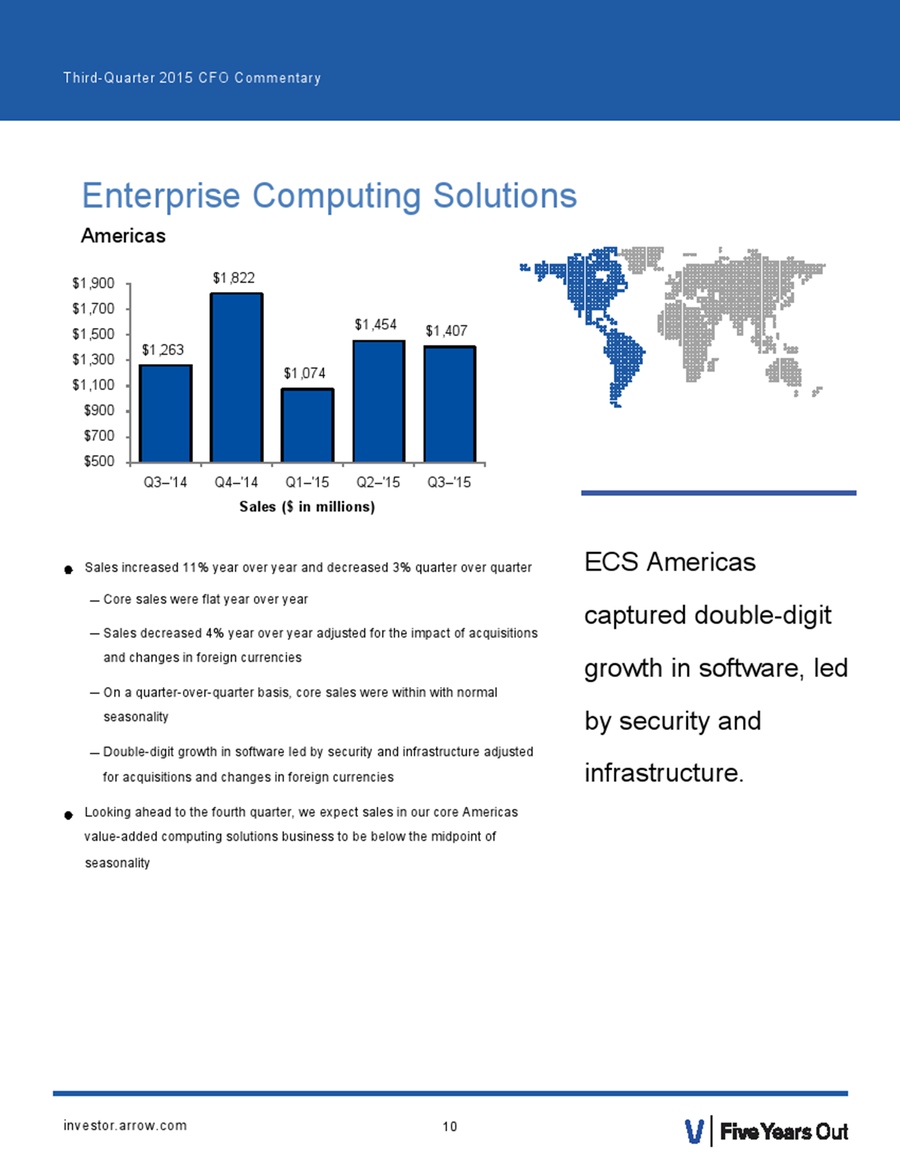
Third-Quarter 2015 CFO
Commentary Enterprise Computing Solutions Americas$1,263 $1,822 $1,074
$1,454 $1,407 $500 $700 $900 $1,100 $1,300 $1,500 $1,700 $1,900 Q3–'14
Q4–'14 Q1–'15 Q2–'15 Q3–'15 Sales increased 11% year over year and
decreased 3% quarter over quarter – Core sales were flat year over year
– Sales decreased 4% year over year adjusted for the impact of
acquisitions and changes in foreign currencies – On a
quarter-over-quarter basis, core sales were within with normal
seasonality – Double-digit growth in software led by security and
infrastructure adjusted for acquisitions and changes in foreign
currencies Looking ahead to the fourth quarter, we expect sales in our
core Americas value-added computing solutions business to be below the
midpoint of seasonality ECS Americas captured double-digit growth in
software, led by security and infrastructure.

Third-Quarter 2015 CFO
Commentary $619 $984 $582 $678 $599 $400 $500 $600 $700 $800 $900 $1,000
$1,100 Q3–'14 Q4–'14 Q1–'15 Q2–'15 Q3–'15 Sales increased 15% year over
year adjusted for the impact of changes in foreign currencies – Sales,
as reported, decreased 3% year over year – On a quarter-over-quarter
basis, sales were above normal seasonality – Strong growth in software,
networking, storage, services, and industry-standard servers on a
year-over-year basis adjusted for the impact of changes in foreign
currencies Looking ahead to the fourth quarter, we expect sales in our
core European value-added computing solutions business to be below
seasonality ECS Europe captured strong growth in nearly all portfolio
products during the third quarter. Enterprise Computing Solutions Europe
Third-Quarter 2015 CFO
Commentary Cash Flow and Balance Sheet Highlights We repurchased $50
million of our stock in the third quarter, bringing our total cash
returned to shareholders over the last 12 months to approximately $307
million. Cash Flow from Operations Cash from operating activities was
negative $108 million in the quarter and was positive $568 million on a
trailing 12-month basis. We converted approximately 125% of GAAP net
income to cash over the last 12 months, well in excess of our target.
Working Capital Working capital to sales was 16.2%. Return on working
capital was 23.6%. Return on Invested Capital Return on invested capital
was 9.5%. Share Buyback We repurchased $50 million of our stock,
bringing our total cash returned to shareholders over the last 12 months
to approximately $307 million. Debt and Liquidity
Net-debt-to-last-12-months EBITDA ratio of approximately 2.4x. Our total
liquidity is $2.2 billion when including our cash of $337 million.
Third-Quarter 2015 CFO
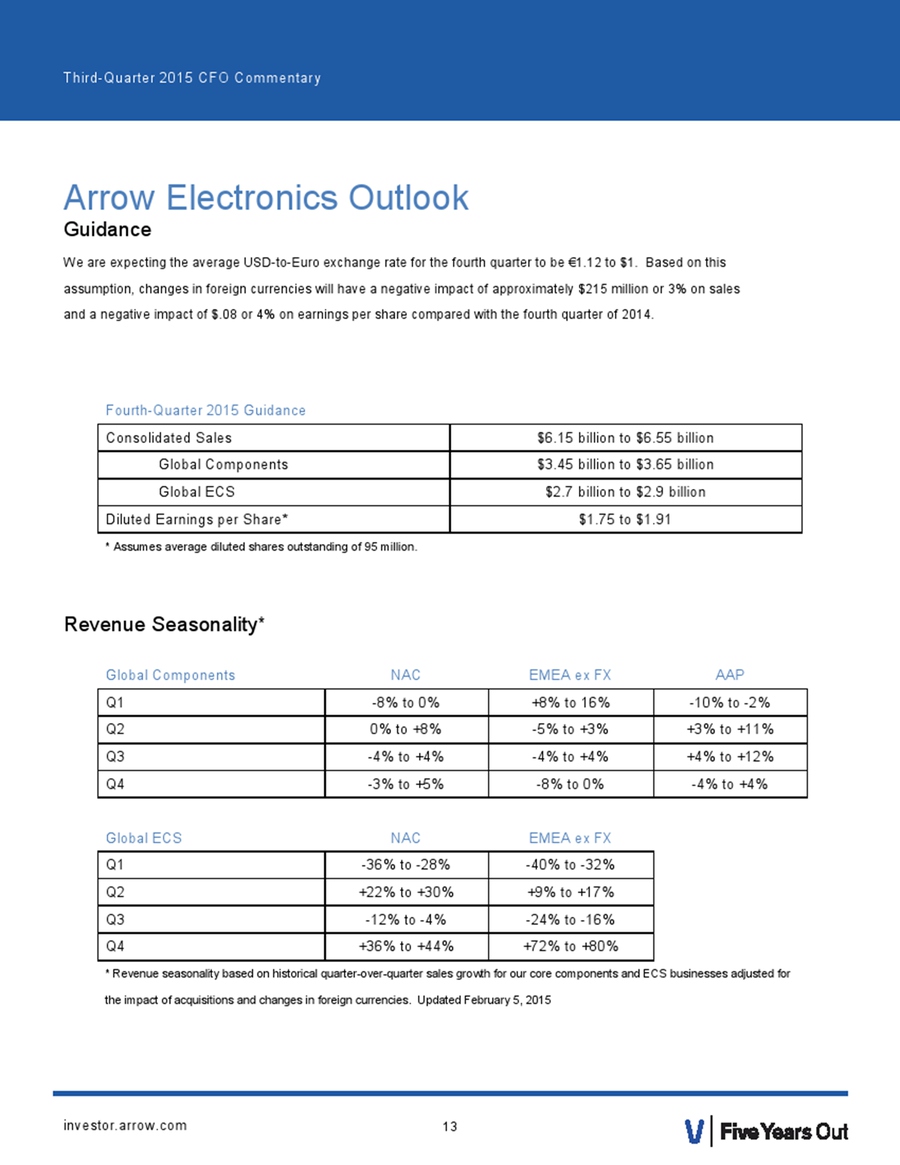
Commentary Arrow Electronics Outlook Guidance We are expecting the
average USD-to-Euro exchange rate for the fourth quarter to be €1.12 to
$1. Based on this assumption, changes in foreign currencies will have a
negative impact of approximately $215 million or 3% on sales and a
negative impact of $.08 or 4% on earnings per share compared with the
fourth quarter of 2014. Fourth-Quarter 2015 Guidance Consolidated Sales
$6.15 billion to $6.55 billion Global Components $3.45 billion to $3.65
billion Global ECS $2.7 billion to $2.9 billion Diluted Earnings per
Share* $1.75 to $1.91 * Assumes average diluted shares outstanding of 95
million.
Risk Factors The discussion
of the company’s business and operations should be read together with
the risk factors contained in Item 1A of its 2014 Annual Report on Form
10-K, filed with the Securities and Exchange Commission, which describe
various risks and uncertainties to which the company is or may become
subject. If any of the described events occur, the company’s business,
results of operations, financial condition, liquidity, or access to the
capital markets could be materially adversely affected. Information
Relating to Forward- Looking Statements This press release includes
forward-looking statements that are subject to numerous assumptions,
risks, and uncertainties, which could cause actual results or facts to
differ materially from such statements for a variety of reasons,
including, but not limited to: industry conditions, company’s
implementation of its new enterprise resource planning system, changes
in product supply, pricing and customer demand, competition, other
vagaries in the global components and global enterprise computing
solutions markets, changes in relationships with key suppliers,
increased profit margin pressure, effects of additional actions taken to
become more efficient or lower costs, risks related to the integration
of acquired businesses, changes in legal and regulatory matters, and the
company’s ability to generate additional cash flow. Forward-looking
statements are those statements which are not statements of historical
fact. These forward-looking statements can be identified by
forward-looking words such as “expects,” “anticipates,” “intends,”
“plans,” “may,” “will,” “believes,” “seeks,” “estimates,” and similar
expressions. Shareholders and other readers are cautioned not to place
undue reliance on these forward-looking statements, which speak only as
of the date on which they are made. The company undertakes no obligation
to update publicly or revise any of the forward-looking statements. For
a further discussion of factors to consider in connection with these
forward-looking statements, investors should refer to Item 1A Risk
Factors of the company’s Annual Report on Form 10-K for the year ended
December 31, 2014.

The company believes that
such non-GAAP financial information is useful to investors to assist in
assessing and understanding the company’s operating performance. In
addition to disclosing financial results that are determined in
accordance with accounting principles generally accepted in the United
States (“GAAP”), the company also provides certain non-GAAP financial
information relating to sales, operating income, net income attributable
to shareholders, and net income per basic and diluted share. The company
provides sales on a non-GAAP basis adjusted for the impact of changes in
foreign currencies and the impact of acquisitions by adjusting the
company’s operating results for businesses acquired, including the
amortization expense related to acquired intangible assets, as if the
acquisitions had occurred at the beginning of the earliest period
presented (referred to as “impact of acquisitions”). Operating income,
net income attributable to shareholders, and net income per basic and
diluted share are adjusted for certain charges, credits, gains, and
losses that the company believes impact the comparability of its results
of operations. These charges, credits, gains, and losses arise out of
the company’s efficiency enhancement initiatives, acquisitions
(including intangible assets amortization expense), loss on prepayment
of debt, and (gain)/loss on investments. A reconciliation of the
company’s non-GAAP financial information to GAAP is set forth in the
tables below. The company believes that such non-GAAP financial
information is useful to investors to assist in assessing and
understanding the company’s operating performance and underlying trends
in the company’s business because management considers these items
referred to above to be outside the company’s core operating results.
This non- GAAP financial information is among the primary indicators
management uses as a basis for evaluating the company’s financial and
operating performance. In addition, the company’s Board of Directors may
use this non-GAAP financial information in evaluating management
performance and setting management compensation. The presentation of
this additional non-GAAP financial information is not meant to be
considered in isolation or as a substitute for, or alternative to,
operating income, net income attributable to shareholders and net income
per basic and diluted share determined in accordance with GAAP. Analysis
of results and outlook on a non-GAAP basis should be used as a
complement to, and in conjunction with, data presented in accordance
with GAAP. Certain Non-GAAP Financial Information
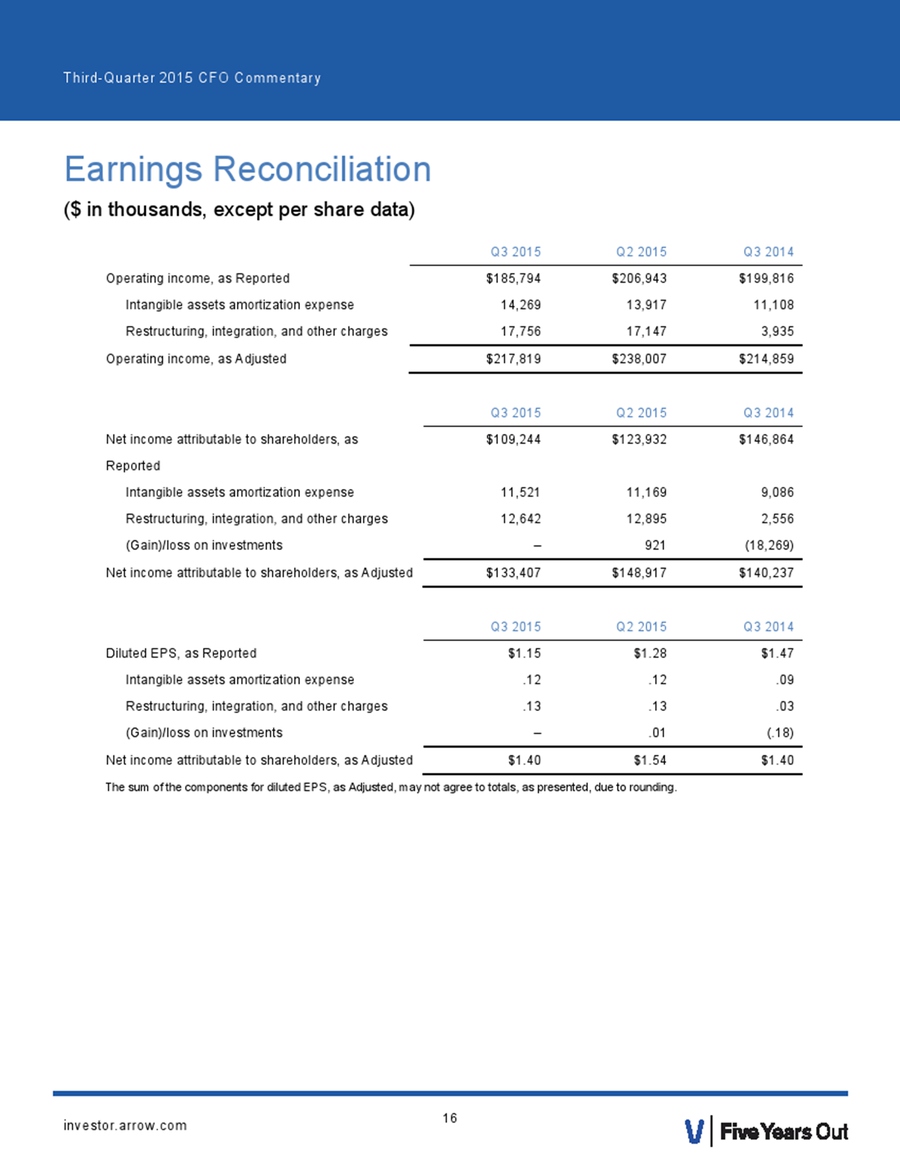
Third-Quarter 2015
Commentary Q3 2015 Q2 2015 Q3 2014 Operating income, as Reported
$185,794 $206,943 $199,816 Intangible assets amortization expense 14,269
C13,917 F11,108 Restructuring, integration, and other O charges17,756
17,147 3,935 Operating income, as Adjusted $217,819 $238,007 $214,859

Q3-15 Intangible Assets
Amortization Expense During the third quarter of 2015, the company
recorded intangible assets amortization expense of $14.3 million ($11.5
million net of related taxes or $.12 per share on both a basic and
diluted basis). Q3-15 Restructuring, Integration, and Other Charges
During the third quarter of 2015, the company recorded restructuring,
integration, and other charges of $17.8 million ($12.6 million net of
related taxes or $.13 per share on both a basic and diluted basis).
Q2-15 Intangible Assets Amortization Expense During the second quarter
of 2015, the company recorded intangible assets amortization expense of
$13.9 million ($11.2 million net of related taxes or $.12 per share on
both a basic and diluted basis). Q2-15 Restructuring, Integration, and
Other Charges During the second quarter of 2015, the company recorded
restructuring, integration, and other charges of $17.1 million ($12.9
million net of related taxes or $.13 per share on both a basic and
diluted basis). Q2-15 Loss on investment During the second quarter of
2015, the company recorded a loss on investment of $1.5 million ($0.9
million net of related taxes or $.01 per share on both a basic and
diluted basis). Q3-14 Intangible Assets Amortization Expense During the
third quarter of 2014, the company recorded intangible assets
amortization expense of $11.1 million ($9.1 million net of related taxes
or $.09 per share on both a basic and diluted basis). Q3-14
Restructuring, Integration, and Other Charges During the third quarter
of 2014, the company recorded restructuring, integration, and other
charges of $3.9 million ($2.6 million net of related taxes or $.03 per
share on both a basic and diluted basis). Q3-14 Gain on investment
During the third quarter of 2014, the company recorded a gain on
investment of $29.7 million ($18.3 million net of related taxes or $.19
and $.18 per share on a basic and diluted basis, respectively).