

Form 8-K UMB FINANCIAL CORP For: Oct 27
UNITED STATES
SECURITIES AND EXCHANGE COMMISSION
Washington, D.C. 20549
Form 8-K
CURRENT REPORT
Pursuant to Section 13 or 15(d)
of the Securities Exchange Act of 1934
Date of Report (Date of earliest event reported): 10/27/2015
UMB FINANCIAL CORPORATION
(Exact name of registrant as specified in its charter)
Commission File Number : 0-4887
| MO | 43-0903811 | |
| (State or other jurisdiction of incorporation) |
(IRS Employer Identification No.) |
1010 Grand Blvd., Kansas City, MO 64106
(Address of principal executive offices, including zip code)
(816) 860-7000
(Registrant’s telephone number, including area code)
(Former name or former address, if changed since last report)
Check the appropriate box below if the Form 8-K filing is intended to simultaneously satisfy the filing obligation of the registrant under any of the following provisions:
| ¨ | Written communications pursuant to Rule 425 under the Securities Act (17 CFR 230.425) |
| ¨ | Soliciting material pursuant to Rule 14a-12 under the Exchange Act (17 CFR 240.14a-12) |
| ¨ | Pre-commencement communications pursuant to Rule 14d-2(b) under the Exchange Act ( 17 CFR 240.14d-2(b)) |
| ¨ | Pre-commencement communications pursuant to Rule 13c-4(c) under the Exchange Act (17 CFR 240.13e-4(c)) |
| Item 2.02 | Results of Operations and Financial Condition |
On October 27, 2015, UMB Financial Corporation (the “Company”) issued a press release announcing the financial results for the Company for the quarter ending September 30, 2015. A copy of the press release is attached as Exhibit 99.1.
The information contained in Item 2.02 of this Current Report and in Exhibit 99.1 is being furnished and shall not be deemed to be “filed” with the SEC for the purposes of Section 18 of the Exchange Act of 1934, as amended or otherwise subject to the liabilities of that section.
| Item 7.01 | Regulation FD Disclosure |
The information provided under Item 7.01 of this Current Report on Form 8-K is being furnished and is not deemed to be “filed” with the SEC for the purposes of Section 18 of the Exchange Act of 1934, as amended or otherwise subject to the liabilities of that section.
The Company is furnishing a copy of materials that will be used in the Company’s shareholder conference call on October 28, 2015, at 9:30 a.m. (CDT). A copy of the materials is attached as Exhibit 99.2 and will be available on the Company’s website at www.umbfinancial.com. The materials are dated October 27, 2015, and the Company disclaims any obligation to correct or update any of the materials in the future.
The Company’s October 27, 2015, press release that is attached as Exhibit 99.1 also announced that the Board of Directors declared an increase in its regular quarterly dividend from $0.235 per share to $0.245 per share. The $0.245 per share dividend will be payable on January 4, 2016, to shareholders of record on December 10, 2015.
| Item 9.01 | Financial Statements and Exhibits |
| Exhibit 99.1 | Press Release announcing financial results for quarter ending September 30, 2015, and announcing dividend declaration | |
| Exhibit 99.2 | Investor Presentation Materials, dated October 27, 2015. | |
SIGNATURES
Pursuant to the requirements of the Securities Exchange Act of 1934, the registrant has duly caused this report to be signed on its behalf by the undersigned hereunto duly authorized.
| UMB FINANCIAL CORPORATION | ||
| By: | /s/ Brian J. Walker | |
| Brian J. Walker | ||
| EVP, Chief Financial Officer And Chief Accounting Officer | ||
Date: October 27, 2015
Exhibit 99.1
|
|
||
| UMB Financial Corporation | News Release | |
| 1010 Grand Boulevard | ||
| Kansas City, MO 64106 | ||
| 816.860.7000 umb.com |

//FOR IMMEDIATE RELEASE//
Media Contact: Kelli Christman: 816.860.5088
Investor Relations Contact: Kay Gregory: 816.860.7106
UMB Financial Corporation Reports Third Quarter 2015 Earnings of $22.5 million, or $0.46 per Diluted Share
Selected third quarter financial highlights:
| • | Loans at September 30, 2015, increased 27.4 percent to $9.0 billion with legacy UMB loans increasing 13.2 percent to $8.0 billion compared to September 30, 2014 |
| • | Total deposits at September 30, 2015, increased 18.1 percent to $15.1 billion with legacy UMB deposits increasing 11.2 percent to $14.2 billion compared to September 30, 2014 |
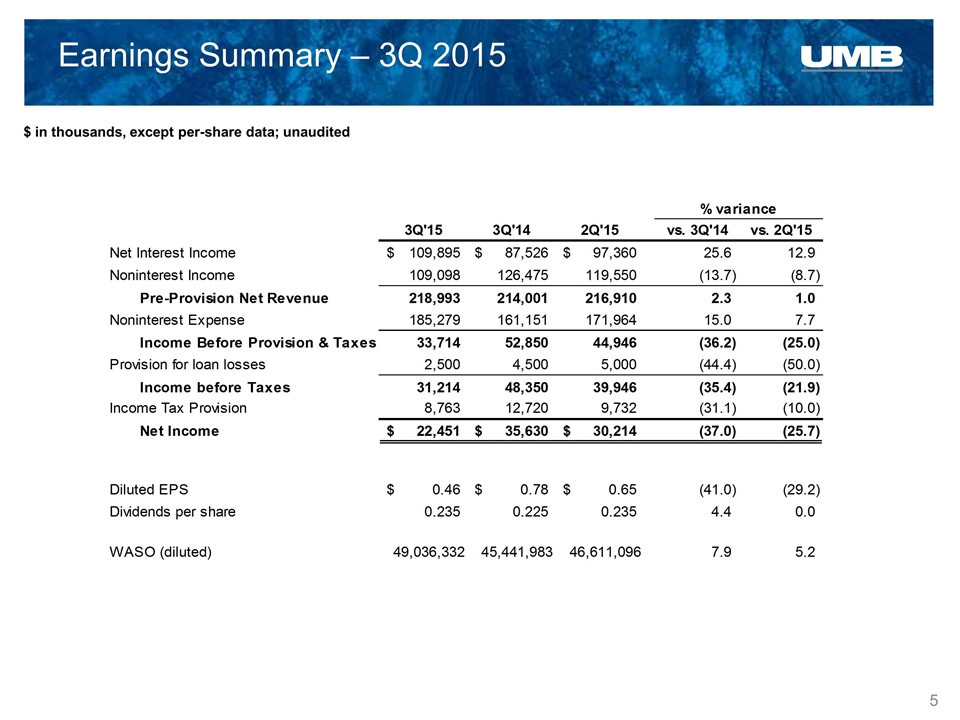
| • | Net interest income increased 25.6 percent to $109.9 million and net interest margin increased 20 basis points to 2.73 percent compared to the third quarter of 2014 |
| • | Noninterest income decreased 13.7 percent from the third quarter 2014 to $109.1 million, and was 49.8 percent of total revenue |
| • | Expenses related to the Marquette acquisition totaled $4.5 million for the third quarter 2015 |
| • | Equity earnings on alternative investments decreased $7.5 million compared to the third quarter 2014 |
| • | Announced additional corporate-wide efficiency actions with estimated cost savings of $29.3 million annualized |
| • | Total assets under management stood at $40.9 billion at September 30, 2015 |
| • | Common equity Tier 1 ratio remains strong at 12.39 percent |
KANSAS CITY, Mo. (Oct. 27, 2015) – UMB Financial Corporation (Nasdaq: UMBF), a diversified financial holding company, announced earnings for the three months ended September 30, 2015 of $22.5 million or $0.46 per share ($0.46 diluted). This is a decrease of $13.2 million, or 37.0 percent, compared to third quarter 2014 earnings of $35.6 million or $0.79 per share ($0.78 diluted). Earnings for the nine months ended September 30, 2015, were $86.4 million or $1.85 per share ($1.84 diluted). This is a decrease of $7.3 million, or 7.8 percent, compared to the earnings for the nine months ended September 30, 2014 of $93.7 million or $2.09 per share ($2.06 diluted).
“The third quarter results are driven by three primary factors — improved net interest income due to increased loan balances and yields, a decrease in noninterest income largely related to continued headwinds at Scout, and increased noninterest expense, which included Marquette integration expense of $4.5 million,” said Mariner Kemper, Chairman and Chief Executive Officer. “Loan balances increased year-over-year, both with the addition of the Marquette portfolio and our continued strategy to add higher-yielding earning assets. At quarter-end, loans stood at $9.0 billion, an increase of 27.4 percent or $1.9 billion compared to a year ago. Acquired loans plus production through legacy Marquette channels
comprised $1.0 billion of the increase. The remaining increase of $937.9 million was generated through legacy UMB lenders, for a year-over-year increase of 13.2 percent. I am pleased with the integration efforts and the value Marquette brings to our banking franchise.”
“In addition to the $3.6 million in annualized efficiencies we announced in July, we have identified another $29.3 million in cost savings, resulting in total estimated efficiencies of $32.9 million fully annualized beginning in 2017. While these initiatives involved difficult decisions, they are the right actions to take to get us closer to our efficiency goals and to operate in a leaner, healthier way. The total does not include efficiencies that may be identified through our normal course of business. These initiatives weren’t merely a project, but a continued focus on growing our businesses in the most efficient and profitable way possible,” added Kemper.
Net Interest Income and Margin
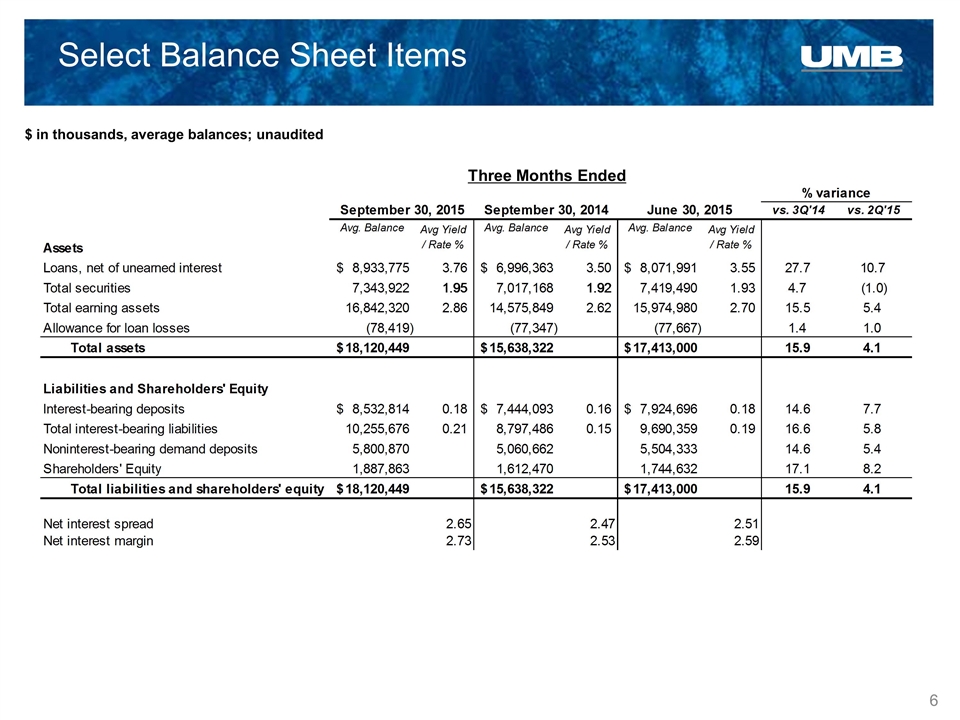
Net interest income for the third quarter of 2015 increased $22.4 million, or 25.6 percent, compared to the same period in 2014. Average earning assets increased $2.3 billion, or 15.5 percent, compared to the third quarter of 2014. This increase was primarily due to a $1.9 billion, or 27.7 percent, increase in average loans. Marquette added earning assets with an acquired value of $1.3 billion on May 31, 2015. Average loans from the legacy Marquette channel totaled $1.0 billion in the third quarter 2015. Net interest margin increased 20 basis points to 2.73 percent for the three months ended September 30, 2015, compared to the same quarter in 2014.
Noninterest Income and Expense
Noninterest income decreased $17.4 million, or 13.7 percent, for the three months ended September 30, 2015, compared to the same period in 2014. This decrease is largely attributable to decreased trust and securities processing income of $8.9 million, or 12.0 percent, for the three months ended September 30, 2015, compared to the same period in 2014. The decrease in trust and securities processing income was primarily due to a $10.4 million, or 44.7 percent, decrease in advisory fee income from the Scout Funds, partially offset by an increase in fees related to institutional and personal investment management services of $1.0 million, or 3.9 percent. Equity earnings on alternative investments had an unrealized loss of $5.0 million at September 30, 2015 compared to an unrealized gain of $2.5 million at September 30, 2014. This is a year-over-year decrease of $7.5 million.
Noninterest expense increased $24.1 million, or 15.0 percent, for the three months ended September 30, 2015, compared to the same period in 2014. Salary and benefits expense increased $14.7 million, or 16.3 percent, due to increases in salaries and wages of $10.9 million, or 19.2 percent, a $5.2 million, or 27.7 percent, increase in commissions and bonuses, offset by a decrease of $1.5 million, or 10.2 percent, in employee benefits expense. Included in the increase of salaries and benefits is $10.8 million of Marquette salaries and benefits, including $1.4 million in acquisition related severances, and $0.9 million of non-Marquette severances for the three months ended September 30, 2015. Equipment expense increased $3.8 million, or 28.5 percent, due to increased computer and hardware costs related to investments for regulatory requirements, cyber security and the ongoing modernization of our core systems. Legal and consulting expense increased by $4.2 million, or 92.3 percent for the third quarter of 2015 driven by $1.9 million of Marquette acquisition expenses incurred during the third quarter of 2015. These increases were offset by a decrease in processing fees of $1.3 million, or 9.2 percent, due to decreased fees paid to distributors of the Scout Funds.
Total acquisition expenses recognized in noninterest expense during the third quarter totaled $4.5 million primarily related to $1.4 million of severance expenses included in salaries and benefits and $1.9 million of consulting expense related to core system conversions projects.
Balance Sheet
Average total assets for the three months ended September 30, 2015 were $18.1 billion compared to $15.6 billion for the same period in 2014, an increase of $2.5 billion, or 15.9 percent. Average earning assets increased by $2.3 billion for the period, or 15.5 percent.
Average loan balances for the three months ended September 30, 2015, increased $1.9 billion, or 27.7 percent, to $8.9 billion compared to the same period in 2014. Actual loan balances on September 30, 2015, were $9.0 billion, an increase of $1.9 billion, or 27.4 percent, compared to September 30, 2014. The overall actual loan increase at September 30, 2015 was driven by a $685.0 million, or 37.9 percent, increase in commercial real estate loans, a $548.1 million, or 15.5 percent, increase in commercial loans, a $218.7 million, or 100.0 percent, increase in asset-based loans, a $157.6 million, or 49.7 percent, increase in residential real estate loans, a $121.3 million, or 49.4 percent, increase in construction real estate loans, and a $106.0 million, or 100.0 percent, increase in factoring loans.
A significant driver in the increase in loans was the acquisition of Marquette and its loan portfolio. These acquired Marquette loans and loans originated through the legacy Marquette channels had an actual balance at September 30, 2015 of $1.0 billion. This total includes $318.2 million in commercial real estate loans, $218.7 million in asset-based loans, $106.0 million in factoring loans, $111.7 million in commercial loans, and $107.8 million in residential real estate loans. The remaining increase in loans of $937.9 million compared to September 30, 2014 is comprised of loans originated through the legacy UMB channels. This increase was primarily driven by an increase in commercial loans of $436.5 million and a $366.8 million increase in commercial real estate loans.
Nonperforming loans increased to $50.0 million on September 30, 2015, from $32.7 million on September 30, 2014. Nonperforming loans are defined as nonaccrual loans and restructured loans. As a percentage of loans, nonperforming loans increased to 0.55 percent as of September 30, 2015, compared to 0.46 percent on September 30, 2014. The company’s allowance for loan losses totaled $78.0 million, or 0.86 percent of loans, as of September 30, 2015, compared to $77.3 million, or 1.09 percent of loans, as of September 30, 2014.
For the three months ended September 30, 2015, average securities, including trading securities, totaled $7.3 billion. This is an increase of $326.8 million, or 4.7 percent, from the same period in 2014.
Average total deposits increased $1.8 billion, or 14.6 percent, to $14.3 billion for the three months ended September 30, 2015, compared to the same period in 2014. Deposit balances from the legacy Marquette channels totaled $881.9 million at September 30, 2015. Average noninterest-bearing demand deposits increased $740.2 million, or 14.6 percent, compared to the same period in 2014. Average interest-bearing deposits increased by $1.1 billion, or 14.6 percent, in the third quarter of 2015 as compared to the same period in 2014. Total actual deposits as of September 30, 2015, were $15.1 billion, compared to $12.8 billion as of September 30, 2014, an 18.1 percent increase. Additionally, for the three months ended September 30, 2015, average noninterest-bearing demand deposits were 40.5 percent of average total deposits.
As of September 30, 2015, UMB had total shareholders’ equity of $1.9 billion, an increase of 17.7 percent as compared to September 30, 2014. This increase is primarily attributable to the common stock issuance associated with the acquisition of Marquette of $179.7 million at May 31, 2015.
Year-to-Date
Earnings for the nine months ended September 30, 2015, were $86.4 million or $1.85 per share ($1.84 diluted). This is a decrease of $7.3 million, or 7.8 percent, compared to earnings for the nine months ended September 30, 2014, of $93.7 million or $2.09 per share ($2.06 diluted).
Net interest income for the nine months ended September 30, 2015, increased $38.5 million, or 14.8 percent, compared to the same period in 2014. Net interest margin increased to 2.60 percent for the nine months ended September 30, 2015, as compared to 2.48 percent for the same period in 2014.
Noninterest income decreased $29.6 million, or 7.7 percent, to $353.9 million for the nine months ended September 30, 2015, as compared to the same period in 2014. The decrease in noninterest income is primarily driven by decreased trust and securities processing income of $19.1 million, or 8.7 percent. The decrease in trust and securities processing income was primarily due to a $27.8 million, or 38.2 percent, decrease in advisory fee income from the Scout Funds, partially offset by an increase of $4.7 million, or 6.6 percent, in fees related to institutional and personal investment management services and a $2.7 million, or 4.1 percent, increase in fund administration and custody services. Equity earnings on alternative investments decreased $15.5 million compared to the same period in 2014. Other noninterest income decreased $2.3 million, or 17.7 percent, primarily due to a $2.8 million gain on the sale of a branch property during the first nine months of 2014. Gains on securities available for sale of $8.4 million were recognized in the first nine months of 2015 compared to $4.1 million for the same period in 2014, a $4.3 million increase.
Noninterest expense increased $22.4 million, or 4.5 percent, for the nine months ended September 30, 2015, compared to the same period in 2014. Salaries and employee benefits increased $34.4 million, or 12.8 percent, compared to the same period in 2014, driven by an increase in salary and wage expense of $23.1 million, or 14.1 percent, and an increase in bonus and commission expense of $10.3 million, or 18.5 percent. Marquette salary and benefits expense, including $1.4 million of Marquette-related severance, totaled $14.2 million and non-Marquette severance totaled $1.3 million for the nine months ended September 30, 2015. The increase in salaries and benefits expense was partially offset by a $20.3 million contingency reserve expense recognized in 2014 in conjunction with the settlement agreement entered into on June 30, 2014, to resolve the PCM dispute.
Acquisition expenses recognized in noninterest expense during the first nine months of 2015 totaled $6.0 million including $1.4 million of severance and $2.8 million legal and consulting fees.
Efficiency Initiatives
In July 2015, the company announced an efficiency initiative that is expected to remove an estimated $3.6 million in annualized costs. During the third quarter, an in-depth review of the organization resulted in the identification of an estimated $29.3 million in additional efficiencies. We expect to recognize the combined savings as follows: $6.8 million in 2015, $22.6 million in 2016, and $32.9 million in annualized savings in 2017 and beyond. For more detail, please see the third quarter earnings call presentation on umbfinancial.com, or at the following link: UMB Financial Presentations
Dividend Declaration
The Board of Directors declared during the company’s quarterly board meeting a $0.245 quarterly cash dividend, which represents a 4.3 percent increase compared to the last quarterly dividend, payable on Jan. 4, 2016, to shareholders of record at the close of business on Dec. 10, 2015.
2016 Annual Meeting of Shareholders
As provided in the bylaws of the company, the 2016 annual meeting of the company’s shareholders will be held on April 26, 2016, at 9:00 a.m. CDT, at the principal executive offices of the company located at 1010 Grand Boulevard, Kansas City, Mo.
Conference Call
The company plans to host a conference call to discuss its 2015 third quarter earnings results on Oct. 28, 2015, at 9:30 a.m. (CT).
Interested parties may access the call by dialing (toll-free) 877-267-8760 or (U.S.) 412-542-4148 and requesting to join the UMB Financial call. The live call can also be accessed by visiting the investor relations area of umbfinancial.com or by using the following the link:
UMB Financial 3Q 2015 Conference Call
A replay of the conference call may be heard through Nov. 11, 2015, by calling (toll-free) 877-344-7529 or (U.S.) 412-317-0088. The replay pass code required for playback is 10073618. The call replay may also be accessed via the company’s website umbfinancial.com by visiting the investor relations area.
Forward-Looking Statements:
This release contains, and our other communications may contain, forward-looking statements within the meaning of the Private Securities Litigation Reform Act of 1995. These statements can be identified by the fact that they do not relate strictly to historical or current facts—such as our statements about expected cost savings and other results of efficiency initiatives and our statements about asset sensitivity. Forward-looking statements often use words such as “believe,” “expect,” “anticipate,” “intend,” “estimate,” “project,” “outlook,” “forecast,” “target,” “trend,” “plan,” “goal,” or other words of comparable meaning or future-tense or conditional verbs such as “may,” “will,” “should,” “would,” or “could.” Forward-looking statements convey our expectations, intentions, or forecasts about future events, circumstances, results, or aspirations. All forward-looking statements are subject to assumptions, risks, and uncertainties, which may change over time and many of which are beyond our control. You should not rely on any forward-looking statement as a prediction or guarantee about the future. Our actual future objectives, strategies, plans, prospects, performance, condition, or results may differ materially from those set forth in any forward-looking statement. Some of the factors that may cause actual results or other future events, circumstances, or aspirations to differ from those in forward-looking statements are described in our Annual Report on Form 10-K for the year ended December 31, 2014, our subsequent Quarterly Reports on Form 10-Q or Current Reports on Form 8-K, or other applicable documents that are filed or furnished with the SEC. Any forward-looking statement made by us or on our behalf speaks only as of the date that it was made. We do not undertake to update any forward-looking statement to reflect the impact of events, circumstances, or results that arise after the date that the statement was made. You, however, should consult further disclosures (including disclosures of a forward-looking nature) that we may make in any subsequent Annual Report on Form 10-K, Quarterly Report on Form 10-Q, Current Report on Form 8-K, or other applicable document that is filed or furnished with the SEC.
About UMB:
UMB Financial Corporation (Nasdaq: UMBF) is a diversified financial holding company headquartered in Kansas City, Mo., offering complete banking services, payment solutions, asset servicing and institutional investment management to customers. UMB operates banking and wealth management centers throughout Missouri, Illinois, Colorado, Kansas, Oklahoma, Nebraska, Arizona and Texas, as well as two national specialty-lending businesses. Subsidiaries of the holding company include companies that offer services to mutual funds and alternative-investment entities and registered investment advisors that offer equity and fixed income strategies to institutions and individual investors. For more information, visit umb.com, umbfinancial.com, blog.umb.com or follow us on Twitter at @UMBBank, Facebook at facebook.com/UMBBank and LinkedIn at linkedin.com/company/umb-bank.
| Consolidated Balance Sheets | UMB Financial Corporation |
| (unaudited, dollars in thousands) |
| September 30, | ||||||||
| 2015 | 2014 | |||||||
| Assets |
||||||||
| Loans |
$ | 9,046,126 | $ | 7,103,163 | ||||
| Allowance for loan losses |
(78,030 | ) | (77,316 | ) | ||||
|
|
|
|
|
|||||
| Net loans |
8,968,096 | 7,025,847 | ||||||
|
|
|
|
|
|||||
| Loans held for sale |
1,013 | 1,718 | ||||||
| Investment securities: |
||||||||
| Available for sale |
6,671,745 | 6,759,803 | ||||||
| Held to maturity |
588,478 | 237,961 | ||||||
| Trading securities |
23,699 | 31,790 | ||||||
| Other securities |
68,371 | 71,192 | ||||||
|
|
|
|
|
|||||
| Total investment securities |
7,352,293 | 7,100,746 | ||||||
|
|
|
|
|
|||||
| Federal funds and resell agreements |
98,762 | 65,255 | ||||||
| Interest-bearing due from banks |
847,077 | 986,428 | ||||||
| Cash and due from banks |
339,592 | 395,956 | ||||||
| Bank premises and equipment, net |
281,704 | 257,341 | ||||||
| Accrued income |
87,863 | 77,263 | ||||||
| Goodwill |
227,962 | 209,758 | ||||||
| Other intangibles |
50,065 | 46,966 | ||||||
| Other assets |
343,538 | 116,750 | ||||||
|
|
|
|
|
|||||
| Total assets |
$ | 18,597,965 | $ | 16,284,028 | ||||
|
|
|
|
|
|||||
| Liabilities |
||||||||
| Deposits: |
||||||||
| Noninterest-bearing demand |
$ | 6,257,944 | $ | 5,467,810 | ||||
| Interest-bearing demand and savings |
7,547,822 | 6,324,535 | ||||||
| Time deposits under $100,000 |
465,629 | 434,863 | ||||||
| Time deposits of $100,000 or more |
790,164 | 526,229 | ||||||
|
|
|
|
|
|||||
| Total deposits |
15,061,559 | 12,753,437 | ||||||
|
|
|
|
|
|||||
| Federal funds and repurchase agreements |
1,342,600 | 1,711,809 | ||||||
| Short-term debt |
5,000 | — | ||||||
| Long-term debt |
83,534 | 7,067 | ||||||
| Accrued expenses and taxes |
168,716 | 161,194 | ||||||
| Other liabilities |
35,699 | 35,172 | ||||||
|
|
|
|
|
|||||
| Total liabilities |
16,697,108 | 14,668,679 | ||||||
|
|
|
|
|
|||||
| Shareholders’ Equity |
||||||||
| Common stock |
55,057 | 55,057 | ||||||
| Capital surplus |
1,015,383 | 891,353 | ||||||
| Retained earnings |
1,016,206 | 947,664 | ||||||
| Accumulated other comprehensive income |
26,530 | 1,827 | ||||||
| Treasury stock |
(212,319 | ) | (280,552 | ) | ||||
|
|
|
|
|
|||||
| Total shareholders’ equity |
1,900,857 | 1,615,349 | ||||||
|
|
|
|
|
|||||
| Total liabilities and shareholders’ equity |
$ | 18,597,965 | $ | 16,284,028 | ||||
|
|
|
|
|
|||||
| Consolidated Statements of Income | UMB Financial Corporation |
| (unaudited, dollars in thousands except share and per share data) |
| Three Months Ended | Nine Months Ended | |||||||||||||||
| September 30, | September 30, | |||||||||||||||
| 2015 | 2014 | 2015 | 2014 | |||||||||||||
| Interest Income |
||||||||||||||||
| Loans |
$ | 84,686 | $ | 61,636 | $ | 220,314 | $ | 180,845 | ||||||||
| Securities: |
||||||||||||||||
| Taxable interest |
18,498 | 18,884 | 56,469 | 56,866 | ||||||||||||
| Tax-exempt interest |
11,320 | 9,745 | 31,842 | 29,450 | ||||||||||||
|
|
|
|
|
|
|
|
|
|||||||||
| Total securities income |
29,818 | 28,629 | 88,311 | 86,316 | ||||||||||||
| Federal funds and resell agreements |
175 | 87 | 377 | 166 | ||||||||||||
| Interest-bearing due from banks |
475 | 426 | 1,761 | 2,015 | ||||||||||||
| Trading securities |
75 | 39 | 303 | 311 | ||||||||||||
|
|
|
|
|
|
|
|
|
|||||||||
| Total interest income |
115,229 | 90,817 | 311,066 | 269,653 | ||||||||||||
|
|
|
|
|
|
|
|
|
|||||||||
| Interest Expense |
||||||||||||||||
| Deposits |
3,863 | 3,015 | 10,433 | 9,166 | ||||||||||||
| Federal funds and repurchase agreements |
427 | 358 | 1,389 | 1,293 | ||||||||||||
| Other |
1,044 | (82 | ) | 1,631 | 53 | |||||||||||
|
|
|
|
|
|
|
|
|
|||||||||
| Total interest expense |
5,334 | 3,291 | 13,453 | 10,512 | ||||||||||||
|
|
|
|
|
|
|
|
|
|||||||||
| Net interest income |
109,895 | 87,526 | 297,613 | 259,141 | ||||||||||||
| Provision for loan losses |
2,500 | 4,500 | 10,500 | 14,000 | ||||||||||||
|
|
|
|
|
|
|
|
|
|||||||||
| Net interest income after provision for loan losses |
107,395 | 83,026 | 287,113 | 245,141 | ||||||||||||
|
|
|
|
|
|
|
|
|
|||||||||
| Noninterest Income |
||||||||||||||||
| Trust and securities processing |
65,182 | 74,062 | 199,862 | 218,982 | ||||||||||||
| Trading and investment banking |
2,969 | 3,826 | 14,659 | 14,558 | ||||||||||||
| Service charges on deposits |
21,663 | 21,634 | 64,829 | 63,819 | ||||||||||||
| Insurance fees and commissions |
480 | 911 | 1,636 | 2,246 | ||||||||||||
| Brokerage fees |
2,958 | 3,276 | 8,748 | 8,166 | ||||||||||||
| Bankcard fees |
17,624 | 17,121 | 51,842 | 49,929 | ||||||||||||
| Gains on sale of securities available for sale, net |
101 | 26 | 8,404 | 4,065 | ||||||||||||
| Equity (loss) earnings on alternative investments |
(5,032 | ) | 2,470 | (6,999 | ) | 8,462 | ||||||||||
| Other |
3,153 | 3,149 | 10,874 | 13,213 | ||||||||||||
|
|
|
|
|
|
|
|
|
|||||||||
| Total noninterest income |
109,098 | 126,475 | 353,855 | 383,440 | ||||||||||||
|
|
|
|
|
|
|
|
|
|||||||||
| Noninterest Expense |
||||||||||||||||
| Salaries and employee benefits |
104,733 | 90,041 | 302,855 | 268,454 | ||||||||||||
| Occupancy, net |
11,748 | 10,475 | 32,070 | 29,885 | ||||||||||||
| Equipment |
17,228 | 13,408 | 46,810 | 38,991 | ||||||||||||
| Supplies, postage and telephone |
5,371 | 4,817 | 14,299 | 15,008 | ||||||||||||
| Marketing and business development |
5,766 | 6,057 | 16,914 | 16,966 | ||||||||||||
| Processing fees |
12,795 | 14,085 | 38,232 | 42,553 | ||||||||||||
| Legal and consulting |
8,648 | 4,496 | 18,943 | 12,500 | ||||||||||||
| Bankcard |
5,266 | 4,097 | 14,987 | 12,782 | ||||||||||||
| Amortization of other intangibles |
3,483 | 3,043 | 8,807 | 9,219 | ||||||||||||
| Regulatory fees |
3,176 | 2,577 | 8,805 | 7,802 | ||||||||||||
| Contingency reserve |
— | — | — | 20,272 | ||||||||||||
| Other |
7,065 | 8,055 | 18,934 | 24,851 | ||||||||||||
|
|
|
|
|
|
|
|
|
|||||||||
| Total noninterest expense |
185,279 | 161,151 | 521,656 | 499,283 | ||||||||||||
| Income before income taxes |
31,214 | 48,350 | 119,312 | 129,298 | ||||||||||||
| Income tax provision |
8,763 | 12,720 | 32,882 | 35,583 | ||||||||||||
|
|
|
|
|
|
|
|
|
|||||||||
| Net income |
$ | 22,451 | $ | 35,630 | $ | 86,430 | $ | 93,715 | ||||||||
|
|
|
|
|
|
|
|
|
|||||||||
| Per Share Data |
||||||||||||||||
| Net income - basic |
$ | 0.46 | $ | 0.79 | $ | 1.85 | $ | 2.09 | ||||||||
| Net income – diluted |
0.46 | 0.78 | 1.84 | 2.06 | ||||||||||||
| Dividends |
0.235 | 0.225 | 0.705 | 0.675 | ||||||||||||
| Weighted average shares outstanding - basic |
48,577,282 | 44,890,309 | 46,619,428 | 44,819,125 | ||||||||||||
| Weighted average shares outstanding - diluted |
49,036,332 | 45,441,983 | 47,080,009 | 45,420,385 | ||||||||||||
| Consolidated Statements of Comprehensive Income | UMB Financial Corporation |
| (unaudited, dollars in thousands, except per share data) |
| Three Months Ended September 30, |
Nine Months Ended September 30, |
|||||||||||||||
| 2015 | 2014 | 2015 | 2014 | |||||||||||||
| Net Income |
$ | 22,451 | $ | 35,630 | $ | 86,430 | $ | 93,715 | ||||||||
| Other comprehensive income, net of tax: |
||||||||||||||||
| Unrealized gains (losses) on securities: |
||||||||||||||||
| Change in unrealized holding gains (losses), net |
46,166 | (24,213 | ) | 33,289 | 59,156 | |||||||||||
| Less: Reclassifications adjustment for gains included in net income |
(101 | ) | (26 | ) | (8,404 | ) | (4,065 | ) | ||||||||
|
|
|
|
|
|
|
|
|
|||||||||
| Change in unrealized gains (losses) on securities during the period |
46,065 | (24,239 | ) | 24,885 | 55,091 | |||||||||||
| Income tax (expense) benefit |
(17,394 | ) | 9,165 | (9,361 | ) | (20,624 | ) | |||||||||
|
|
|
|
|
|
|
|
|
|||||||||
| Other comprehensive income (loss) |
28,671 | (15,074 | ) | 15,524 | 34,467 | |||||||||||
|
|
|
|
|
|
|
|
|
|||||||||
| Comprehensive income |
$ | 51,122 | $ | 20,556 | $ | 101,954 | $ | 128,182 | ||||||||
|
|
|
|
|
|
|
|
|
|||||||||
| Consolidated Statements of Shareholders’ Equity | UMB Financial Corporation |
| (unaudited, dollars in thousands, except per share data) |
| Common Stock |
Capital Surplus |
Retained Earnings |
Accumulated Other Comprehensive Income (Loss) |
Treasury Stock |
Total | |||||||||||||||||||
| Balance - January 1, 2014 |
$ | 55,057 | $ | 882,407 | $ | 884,630 | $ | (32,640 | ) | $ | (283,389 | ) | $ | 1,506,065 | ||||||||||
| Total comprehensive income |
— | — | 93,715 | 34,467 | — | 128,182 | ||||||||||||||||||
| Cash dividends ($0.675 per share) |
— | — | (30,681 | ) | — | — | (30,681 | ) | ||||||||||||||||
| Purchase of treasury stock |
— | — | — | — | (3,858 | ) | (3,858 | ) | ||||||||||||||||
| Issuance of equity awards |
— | (2,624 | ) | — | — | 3,114 | 490 | |||||||||||||||||
| Recognition of equity based compensation |
— | 7,224 | — | — | — | 7,224 | ||||||||||||||||||
| Net tax benefit related to equity compensation plans |
— | 1,507 | — | — | — | 1,507 | ||||||||||||||||||
| Sale of treasury stock |
— | 455 | — | — | 244 | 699 | ||||||||||||||||||
| Exercise of stock options |
— | 2,384 | — | — | 3,337 | 5,721 | ||||||||||||||||||
|
|
|
|
|
|
|
|
|
|
|
|
|
|||||||||||||
| Balance – September 30, 2014 |
$ | 55,057 | $ | 891,353 | $ | 947,664 | $ | 1,827 | $ | (280,552 | ) | $ | 1,615,349 | |||||||||||
|
|
|
|
|
|
|
|
|
|
|
|
|
|||||||||||||
| Balance - January 1, 2015 |
$ | 55,057 | $ | 894,602 | $ | 963,911 | $ | 11,006 | $ | (280,818 | ) | $ | 1,643,758 | |||||||||||
| Total comprehensive income |
— | — | 86,430 | 15,524 | — | 101,954 | ||||||||||||||||||
| Cash dividends ($0.705 per share) |
— | — | (34,135 | ) | — | — | (34,135 | ) | ||||||||||||||||
| Purchase of treasury stock |
— | — | — | — | (6,172 | ) | (6,172 | ) | ||||||||||||||||
| Issuance of equity awards |
— | (4,180 | ) | — | — | 4,639 | 459 | |||||||||||||||||
| Recognition of equity based compensation |
— | 9,030 | — | — | — | 9,030 | ||||||||||||||||||
| Net tax benefit related to equity compensation plans |
— | 732 | — | — | — | 732 | ||||||||||||||||||
| Sale of treasury stock |
— | 475 | — | — | 315 | 790 | ||||||||||||||||||
| Exercise of stock options |
— | 2,089 | — | — | 2,615 | 4,704 | ||||||||||||||||||
| Common stock issuance for acquisition |
— | 112,635 | — | — | 67,102 | 179,737 | ||||||||||||||||||
|
|
|
|
|
|
|
|
|
|
|
|
|
|||||||||||||
| Balance – September 30, 2015 |
$ | 55,057 | $ | 1,015,383 | $ | 1,016,206 | $ | 26,530 | $ | (212,319 | ) | $ | 1,900,857 | |||||||||||
|
|
|
|
|
|
|
|
|
|
|
|
|
|||||||||||||
| Average Balances / Yields and Rates | UMB Financial Corporation |
| (tax - equivalent basis) | ||
| (unaudited, dollars in thousands) |
| Three Months Ended September 30, | ||||||||||||||||
| 2015 | 2014 | |||||||||||||||
| Average | Average | Average | Average | |||||||||||||
| Balance | Yield/Rate | Balance | Yield/Rate | |||||||||||||
| Assets |
||||||||||||||||
| Loans, net of unearned interest |
$ | 8,933,775 | 3.76 | % | $ | 6,996,363 | 3.50 | % | ||||||||
| Securities: |
||||||||||||||||
| Taxable |
4,750,122 | 1.54 | 4,864,337 | 1.54 | ||||||||||||
| Tax-exempt |
2,557,629 | 2.70 | 2,128,281 | 2.80 | ||||||||||||
|
|
|
|
|
|
|
|
|
|||||||||
| Total securities |
7,307,751 | 1.95 | 6,992,618 | 1.92 | ||||||||||||
| Federal funds and resell agreements |
83,048 | 0.84 | 61,161 | 0.56 | ||||||||||||
| Interest-bearing due from banks |
481,575 | 0.39 | 501,157 | 0.34 | ||||||||||||
| Trading securities |
36,171 | 1.04 | 24,550 | 0.95 | ||||||||||||
|
|
|
|
|
|
|
|
|
|||||||||
| Total earning assets |
16,842,320 | 2.86 | 14,575,849 | 2.62 | ||||||||||||
| Allowance for loan losses |
(78,419 | ) | (77,347 | ) | ||||||||||||
| Other assets |
1,356,548 | 1,139,820 | ||||||||||||||
|
|
|
|
|
|||||||||||||
| Total assets |
$ | 18,120,449 | $ | 15,638,322 | ||||||||||||
|
|
|
|
|
|||||||||||||
| Liabilities and Shareholders’ Equity |
||||||||||||||||
| Interest-bearing deposits |
$ | 8,532,814 | 0.18 | % | $ | 7,444,093 | 0.16 | % | ||||||||
| Federal funds and repurchase agreements |
1,634,394 | 0.10 | 1,347,665 | 0.11 | ||||||||||||
| Borrowed funds |
88,468 | 4.68 | 5,728 | (5.68 | ) | |||||||||||
|
|
|
|
|
|
|
|
|
|||||||||
| Total interest-bearing liabilities |
10,255,676 | 0.21 | 8,797,486 | 0.15 | ||||||||||||
| Noninterest-bearing demand deposits |
5,800,870 | 5,060,662 | ||||||||||||||
| Other liabilities |
176,040 | 167,704 | ||||||||||||||
| Shareholders’ equity |
1,887,863 | 1,612,470 | ||||||||||||||
|
|
|
|
|
|||||||||||||
| Total liabilities and shareholders’ equity |
$ | 18,120,449 | $ | 15,638,322 | ||||||||||||
|
|
|
|
|
|||||||||||||
| Net interest spread |
2.65 | % | 2.47 | % | ||||||||||||
| Net interest margin |
2.73 | 2.53 | ||||||||||||||
| Nine Months Ended September 30, | ||||||||||||||||
| 2015 | 2014 | |||||||||||||||
| Average | Average | Average | Average | |||||||||||||
| Balance | Yield/Rate | Balance | Yield/Rate | |||||||||||||
| Assets |
||||||||||||||||
| Loans, net of unearned interest |
$ | 8,163,984 | 3.61 | % | $ | 6,858,874 | 3.53 | % | ||||||||
| Securities: |
||||||||||||||||
| Taxable |
4,864,016 | 1.55 | 4,862,439 | 1.56 | ||||||||||||
| Tax-exempt |
2,407,653 | 2.72 | 2,114,251 | 2.87 | ||||||||||||
|
|
|
|
|
|
|
|
|
|||||||||
| Total securities |
7,271,669 | 1.94 | 6,976,690 | 1.96 | ||||||||||||
| Federal funds and resell agreements |
62,326 | 0.81 | 40,461 | 0.55 | ||||||||||||
| Interest-bearing due from banks |
665,667 | 0.35 | 934,532 | 0.29 | ||||||||||||
| Trading securities |
34,507 | 1.51 | 33,257 | 1.46 | ||||||||||||
|
|
|
|
|
|
|
|
|
|||||||||
| Total earning assets |
16,198,153 | 2.71 | 14,843,814 | 2.57 | ||||||||||||
| Allowance for loan losses |
(77,560 | ) | (76,100 | ) | ||||||||||||
| Other assets |
1,339,262 | 1,153,074 | ||||||||||||||
|
|
|
|
|
|||||||||||||
| Total assets |
$ | 17,459,855 | $ | 15,920,788 | ||||||||||||
|
|
|
|
|
|||||||||||||
| Liabilities and Shareholders’ Equity |
||||||||||||||||
| Interest-bearing deposits |
$ | 8,023,331 | 0.17 | % | $ | 7,511,115 | 0.16 | % | ||||||||
| Federal funds and repurchase agreements |
1,686,766 | 0.11 | 1,534,966 | 0.11 | ||||||||||||
| Borrowed funds |
49,169 | 4.43 | 5,735 | 1.24 | ||||||||||||
|
|
|
|
|
|
|
|
|
|||||||||
| Total interest-bearing liabilities |
9,759,266 | 0.18 | 9,051,816 | 0.16 | ||||||||||||
| Noninterest-bearing demand deposits |
5,655,878 | 5,126,660 | ||||||||||||||
| Other liabilities |
274,845 | 160,140 | ||||||||||||||
| Shareholders’ equity |
1,769,866 | 1,582,172 | ||||||||||||||
|
|
|
|
|
|||||||||||||
| Total liabilities and shareholders’ equity |
$ | 17,459,855 | $ | 15,920,788 | ||||||||||||
|
|
|
|
|
|||||||||||||
| Net interest spread |
2.53 | % | 2.41 | % | ||||||||||||
| Net interest margin |
2.60 | 2.48 | ||||||||||||||
| THIRD QUARTER 2015 | ||
| FINANCIAL HIGHLIGHTS | UMB Financial Corporation | |
| (unaudited, dollars in thousands, except share and per share data) | ||
| Nine Months Ended September 30 |
2015 | 2014 | ||||||
| Net interest income |
$ | 297,613 | $ | 259,141 | ||||
| Provision for loan losses |
10,500 | 14,000 | ||||||
| Noninterest income |
353,855 | 383,440 | ||||||
| Noninterest expense |
521,656 | 499,283 | ||||||
| Income before income taxes |
119,312 | 129,298 | ||||||
| Net income |
86,430 | 93,715 | ||||||
| Net income per share - Basic |
1.85 | 2.09 | ||||||
| Net income per share - Diluted |
1.84 | 2.06 | ||||||
| Return on average assets |
0.66 | % | 0.79 | % | ||||
| Return on average equity |
6.53 | % | 7.92 | % | ||||
| Three Months Ended September 30 |
||||||||
| Net interest income |
$ | 109,895 | $ | 87,526 | ||||
| Provision for loan losses |
2,500 | 4,500 | ||||||
| Noninterest income |
109,098 | 126,475 | ||||||
| Noninterest expense |
185,279 | 161,151 | ||||||
| Income before income taxes |
31,214 | 48,350 | ||||||
| Net income |
22,451 | 35,630 | ||||||
| Net income per share - Basic |
0.46 | 0.79 | ||||||
| Net income per share - Diluted |
0.46 | 0.78 | ||||||
| Return on average assets |
0.49 | % | 0.90 | % | ||||
| Return on average equity |
4.72 | % | 8.77 | % | ||||
| At September 30 |
||||||||
| Assets |
$ | 18,597,965 | $ | 16,284,028 | ||||
| Loans, net of unearned interest |
9,046,126 | 7,103,163 | ||||||
| Securities |
7,352,293 | 7,100,746 | ||||||
| Deposits |
15,061,559 | 12,753,437 | ||||||
| Shareholders’ equity |
1,900,857 | 1,615,349 | ||||||
| Book value per share |
38.56 | 35.51 | ||||||
| Market price per share |
50.81 | 54.55 | ||||||
| Equity to assets |
10.22 | % | 9.92 | % | ||||
| Allowance for loan losses |
$ | 78,030 | $ | 77,316 | ||||
| As a % of loans |
0.86 | % | 1.09 | % | ||||
| Nonaccrual and restructured loans |
$ | 49,955 | $ | 32,662 | ||||
| As a % of loans |
0.55 | % | 0.46 | % | ||||
| Loans over 90 days past due |
$ | 2,552 | $ | 4,678 | ||||
| As a % of loans |
0.03 | % | 0.07 | % | ||||
| Other real estate owned |
$ | 2,586 | $ | 1,369 | ||||
| Net loan charge-offs quarter-to-date |
$ | 2,192 | $ | 3,985 | ||||
| As a % of average loans |
0.10 | % | 0.23 | % | ||||
| Net loan charge-offs year-to-date |
$ | 8,611 | $ | 11,434 | ||||
| As a % of average loans |
0.14 | % | 0.22 | % | ||||
| Common shares outstanding |
49,296,991 | 45,485,313 | ||||||
| Average Balances | ||||||||
| Nine Months Ended September 30 |
||||||||
| Assets |
$ | 17,459,855 | $ | 15,920,788 | ||||
| Loans, net of unearned interest |
8,163,984 | 6,858,874 | ||||||
| Securities |
7,306,176 | 7,009,947 | ||||||
| Deposits |
13,679,209 | 12,637,775 | ||||||
| Shareholders’ equity |
1,769,866 | 1,582,172 | ||||||
| Business Segment Information | UMB Financial Corporation | |
| (unaudited, dollars in thousands) |
| Three Months Ended September 30, 2015 | ||||||||||||||||||||
| Bank | Payment Solutions |
Institutional Investment Management |
Asset Servicing |
Total | ||||||||||||||||
| Net interest income |
$ | 93,960 | $ | 14,627 | $ | — | $ | 1,308 | $ | 109,895 | ||||||||||
| Provision for loan losses |
1,333 | 1,167 | — | — | 2,500 | |||||||||||||||
| Noninterest income |
42,999 | 22,038 | 21,449 | 22,612 | 109,098 | |||||||||||||||
| Noninterest expense |
122,165 | 27,053 | 16,512 | 19,549 | 185,279 | |||||||||||||||
|
|
|
|
|
|
|
|
|
|
|
|||||||||||
| Income before taxes |
13,461 | 8,445 | 4,937 | 4,371 | 31,214 | |||||||||||||||
| Income tax expense |
3,731 | 2,393 | 1,408 | 1,231 | 8,763 | |||||||||||||||
|
|
|
|
|
|
|
|
|
|
|
|||||||||||
| Net income |
$ | 9,730 | $ | 6,052 | $ | 3,529 | $ | 3,140 | $ | 22,451 | ||||||||||
|
|
|
|
|
|
|
|
|
|
|
|||||||||||
| Average assets |
$ | 14,120,000 | $ | 2,943,000 | $ | 66,000 | $ | 991,000 | $ | 18,120,000 | ||||||||||
| Three Months Ended September 30, 2014 | ||||||||||||||||||||
| Bank | Payment Solutions |
Institutional Investment Management |
Asset Servicing |
Total | ||||||||||||||||
| Net interest income |
$ | 72,893 | $ | 13,469 | $ | — | $ | 1,164 | $ | 87,526 | ||||||||||
| Provision for loan losses |
2,446 | 2,054 | — | — | 4,500 | |||||||||||||||
| Noninterest income |
48,385 | 21,579 | 33,919 | 22,592 | 126,475 | |||||||||||||||
| Noninterest expense |
99,084 | 21,995 | 20,913 | 19,159 | 161,151 | |||||||||||||||
|
|
|
|
|
|
|
|
|
|
|
|||||||||||
| Income before taxes |
19,748 | 10,999 | 13,006 | 4,597 | 48,350 | |||||||||||||||
| Income tax expense |
5,364 | 2,818 | 3,350 | 1,188 | 12,720 | |||||||||||||||
|
|
|
|
|
|
|
|
|
|
|
|||||||||||
| Net income |
$ | 14,384 | $ | 8,181 | $ | 9,656 | $ | 3,409 | $ | 35,630 | ||||||||||
|
|
|
|
|
|
|
|
|
|
|
|||||||||||
| Average assets |
$ | 11,752,000 | $ | 2,744,000 | $ | 72,000 | $ | 1,070,000 | $ | 15,638,000 | ||||||||||
| Nine Months Ended September 30, 2015 | ||||||||||||||||||||
| Bank | Payment Solutions |
Institutional Investment Management |
Asset Servicing |
Total | ||||||||||||||||
| Net interest income |
$ | 252,044 | $ | 42,260 | $ | 1 | $ | 3,308 | $ | 297,613 | ||||||||||
| Provision for loan losses |
5,545 | 4,955 | — | — | 10,500 | |||||||||||||||
| Noninterest income |
142,099 | 68,469 | 74,217 | 69,070 | 353,855 | |||||||||||||||
| Noninterest expense |
329,951 | 78,131 | 52,768 | 60,806 | 521,656 | |||||||||||||||
|
|
|
|
|
|
|
|
|
|
|
|||||||||||
| Income before taxes |
58,647 | 27,643 | 21,450 | 11,572 | 119,312 | |||||||||||||||
| Income tax expense |
16,037 | 7,770 | 5,921 | 3,154 | 32,882 | |||||||||||||||
|
|
|
|
|
|
|
|
|
|
|
|||||||||||
| Net income |
$ | 42,610 | $ | 19,873 | $ | 15,529 | $ | 8,418 | $ | 86,430 | ||||||||||
|
|
|
|
|
|
|
|
|
|
|
|||||||||||
| Average assets |
$ | 13,440,000 | $ | 2,998,000 | $ | 70,000 | $ | 952,000 | $ | 17,460,000 | ||||||||||
| Nine Months Ended September 30, 2014 | ||||||||||||||||||||
| Bank | Payment Solutions |
Institutional Investment Management |
Asset Servicing |
Total | ||||||||||||||||
| Net interest income |
$ | 216,495 | $ | 38,248 | $ | (3 | ) | $ | 4,401 | $ | 259,141 | |||||||||
| Provision for loan losses |
7,558 | 6,442 | — | — | 14,000 | |||||||||||||||
| Noninterest income |
151,843 | 62,999 | 102,014 | 66,584 | 383,440 | |||||||||||||||
| Noninterest expense |
307,400 | 67,451 | 68,862 | 55,570 | 499,283 | |||||||||||||||
|
|
|
|
|
|
|
|
|
|
|
|||||||||||
| Income before taxes |
53,380 | 27,354 | 33,149 | 15,415 | 129,298 | |||||||||||||||
| Income tax expense |
15,167 | 7,342 | 8,883 | 4,191 | 35,583 | |||||||||||||||
|
|
|
|
|
|
|
|
|
|
|
|||||||||||
| Net income |
$ | 38,213 | $ | 20,012 | $ | 24,266 | $ | 11,224 | $ | 93,715 | ||||||||||
|
|
|
|
|
|
|
|
|
|
|
|||||||||||
| Average assets |
$ | 12,023,000 | $ | 2,287,000 | $ | 72,000 | $ | 1,539,000 | $ | 15,921,000 | ||||||||||
Strength in Balance. Third Quarter 2015 UMB Financial October 27, 2015 Exhibit 99.2
Cautionary Notice about Forward-Looking Statements This presentation contains, and our other communications may contain, forward-looking statements within the meaning of the Private Securities Litigation Reform Act of 1995. These statements can be identified by the fact that they do not relate strictly to historical or current facts—such as our statements about expected cost savings and other results of efficiency initiatives and our statements about asset sensitivity. Forward-looking statements often use words such as “believe,” “expect,” “anticipate,” “intend,” “estimate,” “project,” “outlook,” “forecast,” “target,” “trend,” “plan,” “goal,” or other words of comparable meaning or future-tense or conditional verbs such as “may,” “will,” “should,” “would,” or “could.” Forward-looking statements convey our expectations, intentions, or forecasts about future events, circumstances, results, or aspirations. All forward-looking statements are subject to assumptions, risks, and uncertainties, which may change over time and many of which are beyond our control. You should not rely on any forward-looking statement as a prediction or guarantee about the future. Our actual future objectives, strategies, plans, prospects, performance, condition, or results may differ materially from those set forth in any forward-looking statement. Some of the factors that may cause actual results or other future events, circumstances, or aspirations to differ from those in forward-looking statements are described in our Annual Report on Form 10-K for the year ended December 31, 2014, our subsequent Quarterly Reports on Form 10-Q or Current Reports on Form 8-K, or other applicable documents that are filed or furnished with the Securities and Exchange Commission (SEC). Any forward-looking statement made by us or on our behalf speaks only as of the date that it was made. We do not undertake to update any forward-looking statement to reflect the impact of events, circumstances, or results that arise after the date that the statement was made. You, however, should consult further disclosures (including disclosures of a forward-looking nature) that we may make in any subsequent Annual Report on Form 10-K, Quarterly Report on Form 10-Q, Current Report on Form 8-K, or other applicable document that is filed or furnished with the SEC.

3Q 2015 Performance Highlights

Select Third Quarter Highlights Loans at September 30, 2015, increased 27.4 percent to $9.0 billion with legacy UMB loans increasing 13.2 percent to $8.0 billion compared to September 30, 2014 Total deposits at September 30, 2015, increased 18.1 percent to $15.1 billion with legacy UMB deposits increasing 11.2 percent to $14.2 billion compared to September 30, 2014 Net interest income increased 25.6 percent to $109.9 million and net interest margin increased 20 basis points to 2.73 percent compared to the third quarter of 2014 Noninterest income decreased 13.7 percent from the third quarter 2014 to $109.1 million, and was 49.8 percent of total revenue Expenses related to the Marquette acquisition totaled $4.5 million for the third quarter 2015 Equity earnings on alternative investments was a net loss of $5.0 million, a decrease of $7.5 million compared to the third quarter of 2014 Announced additional corporate-wide efficiency actions with estimated cost savings of $29.3 million, annualized Total assets under management stood at $40.9 billion at September 30, 2015 Common equity Tier 1 ratio remains strong at 12.39 percent
Earnings Summary – 3Q 2015 $ in thousands, except per-share data; unaudited
Select Balance Sheet Items $ in thousands, average balances; unaudited Three Months Ended
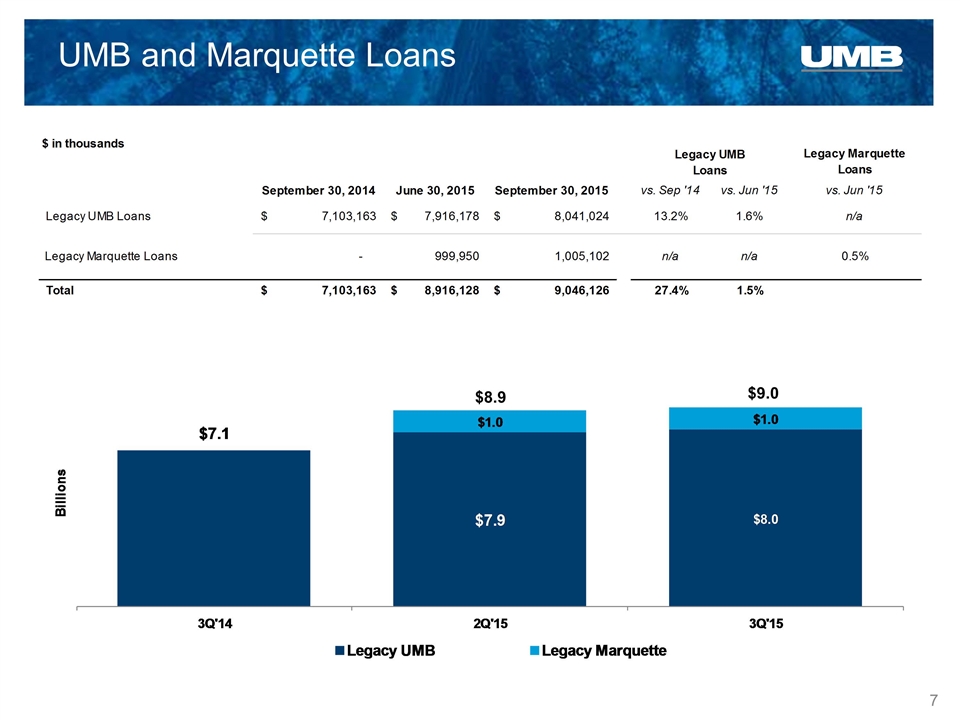
UMB and Marquette Loans $9.0 $8.9
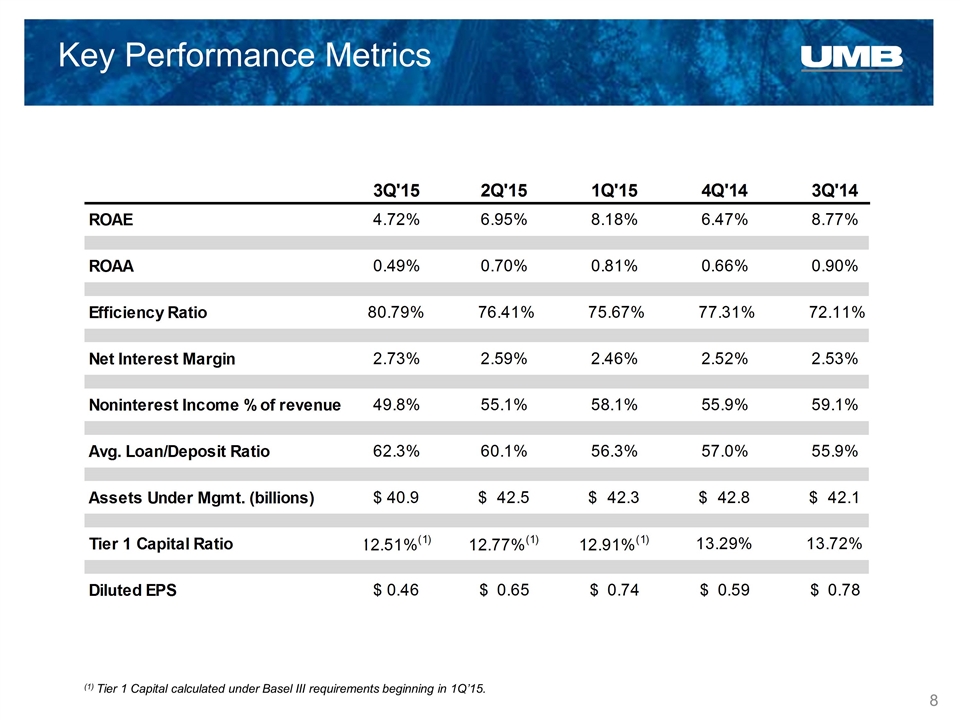
Key Performance Metrics (1) Tier 1 Capital calculated under Basel III requirements beginning in 1Q’15.

Efficiency Initiatives
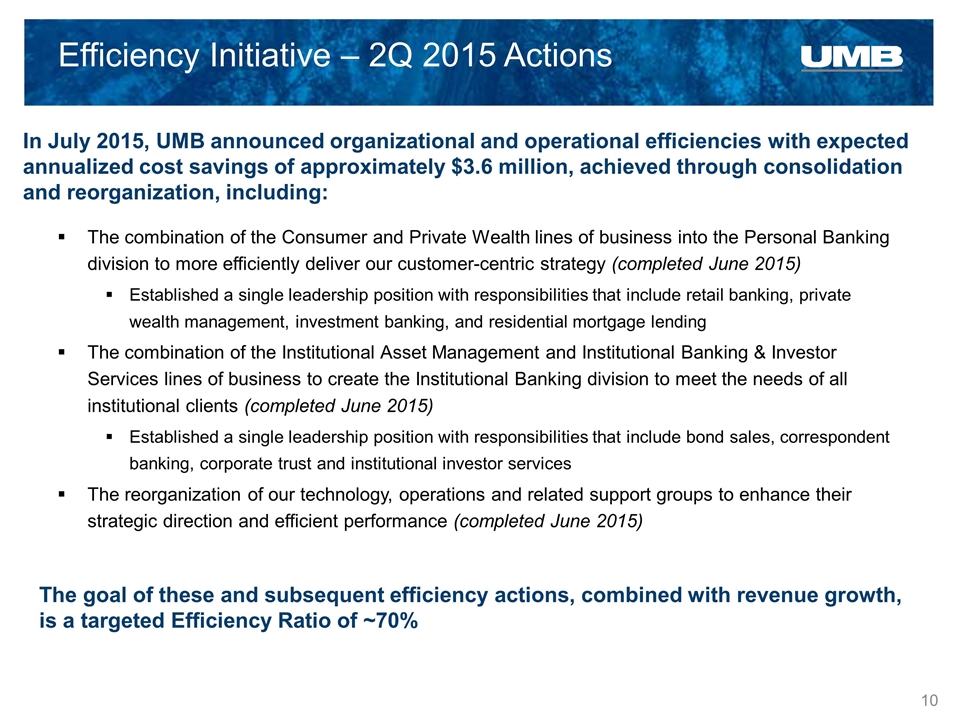
In July 2015, UMB announced organizational and operational efficiencies with expected annualized cost savings of approximately $3.6 million, achieved through consolidation and reorganization, including: Efficiency Initiative – 2Q 2015 Actions The combination of the Consumer and Private Wealth lines of business into the Personal Banking division to more efficiently deliver our customer-centric strategy (completed June 2015) Established a single leadership position with responsibilities that include retail banking, private wealth management, investment banking, and residential mortgage lending The combination of the Institutional Asset Management and Institutional Banking & Investor Services lines of business to create the Institutional Banking division to meet the needs of all institutional clients (completed June 2015) Established a single leadership position with responsibilities that include bond sales, correspondent banking, corporate trust and institutional investor services The reorganization of our technology, operations and related support groups to enhance their strategic direction and efficient performance (completed June 2015) The goal of these and subsequent efficiency actions, combined with revenue growth, is a targeted Efficiency Ratio of ~70%
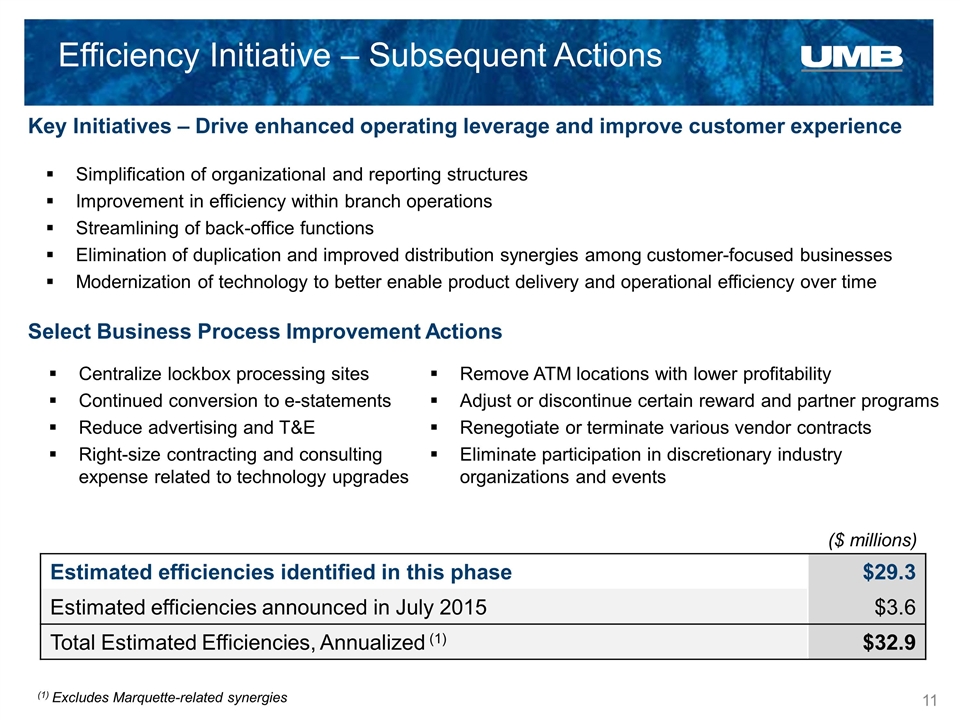
Efficiency Initiative – Subsequent Actions Key Initiatives – Drive enhanced operating leverage and improve customer experience Select Business Process Improvement Actions Estimated efficiencies identified in this phase $29.3 Estimated efficiencies announced in July 2015 $3.6 Total Estimated Efficiencies, Annualized (1) $32.9 Centralize lockbox processing sites Continued conversion to e-statements Reduce advertising and T&E Right-size contracting and consulting expense related to technology upgrades Remove ATM locations with lower profitability Adjust or discontinue certain reward and partner programs Renegotiate or terminate various vendor contracts Eliminate participation in discretionary industry organizations and events Simplification of organizational and reporting structures Improvement in efficiency within branch operations Streamlining of back-office functions Elimination of duplication and improved distribution synergies among customer-focused businesses Modernization of technology to better enable product delivery and operational efficiency over time (1) Excludes Marquette-related synergies ($ millions)
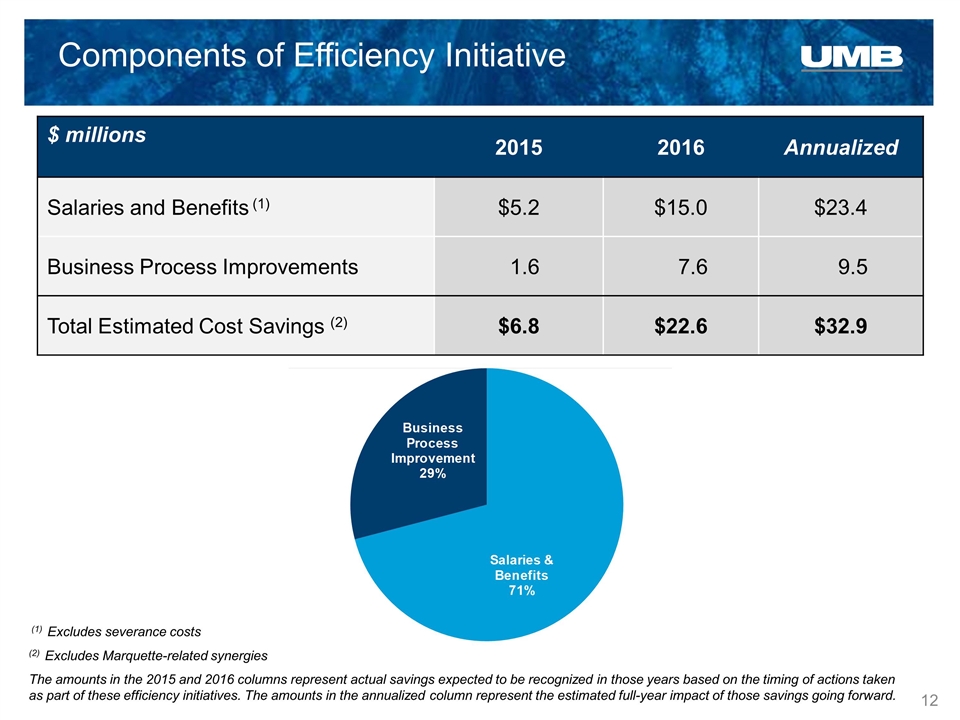
Components of Efficiency Initiative $ millions 2015 2016 Annualized Salaries and Benefits (1) $5.2 $15.0 $23.4 Business Process Improvements 1.6 7.6 9.5 Total Estimated Cost Savings (2) $6.8 $22.6 $32.9 (1) Excludes severance costs (2) Excludes Marquette-related synergies The amounts in the 2015 and 2016 columns represent actual savings expected to be recognized in those years based on the timing of actions taken as part of these efficiency initiatives. The amounts in the annualized column represent the estimated full-year impact of those savings going forward.
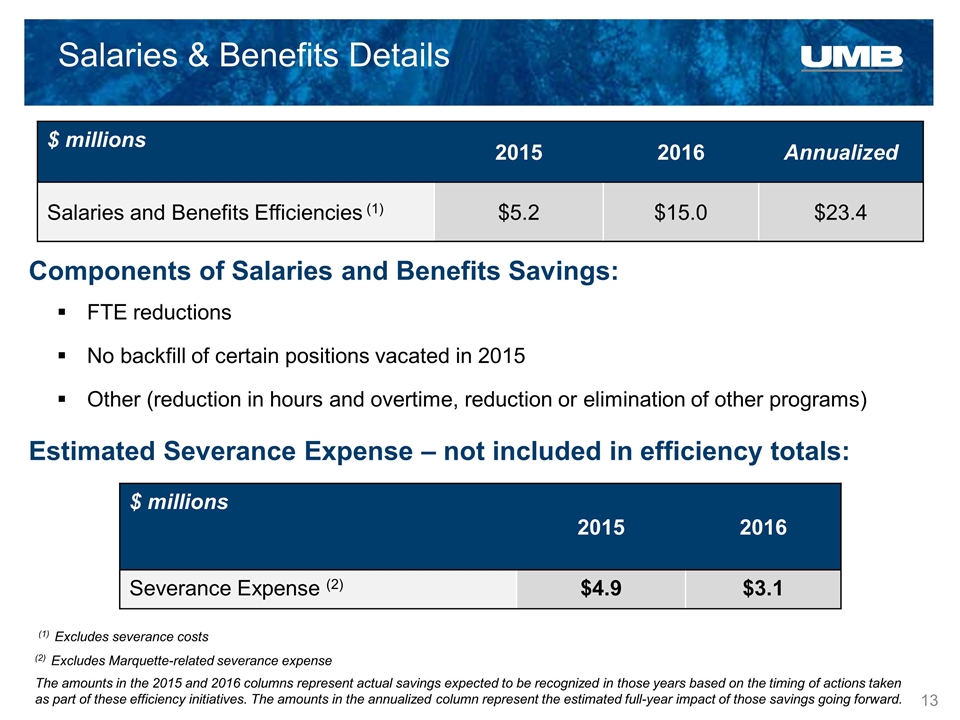
$ millions 2015 2016 Annualized Salaries and Benefits Efficiencies (1) $5.2 $15.0 $23.4 Salaries & Benefits Details FTE reductions No backfill of certain positions vacated in 2015 Other (reduction in hours and overtime, reduction or elimination of other programs) Components of Salaries and Benefits Savings: Estimated Severance Expense – not included in efficiency totals: $ millions 2015 2016 Severance Expense (2) $4.9 $3.1 (1) Excludes severance costs (2) Excludes Marquette-related severance expense The amounts in the 2015 and 2016 columns represent actual savings expected to be recognized in those years based on the timing of actions taken as part of these efficiency initiatives. The amounts in the annualized column represent the estimated full-year impact of those savings going forward.
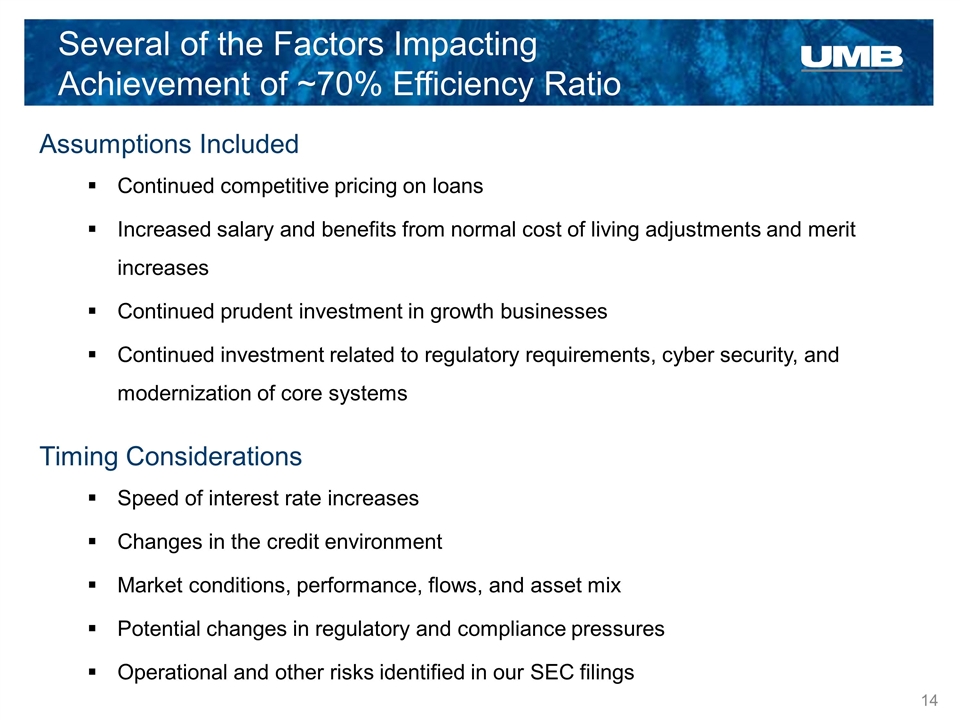
Assumptions Included Continued competitive pricing on loans Increased salary and benefits from normal cost of living adjustments and merit increases Continued prudent investment in growth businesses Continued investment related to regulatory requirements, cyber security, and modernization of core systems Timing Considerations Speed of interest rate increases Changes in the credit environment Market conditions, performance, flows, and asset mix Potential changes in regulatory and compliance pressures Operational and other risks identified in our SEC filings Several of the Factors Impacting Achievement of ~70% Efficiency Ratio
3Q 2015 Financials
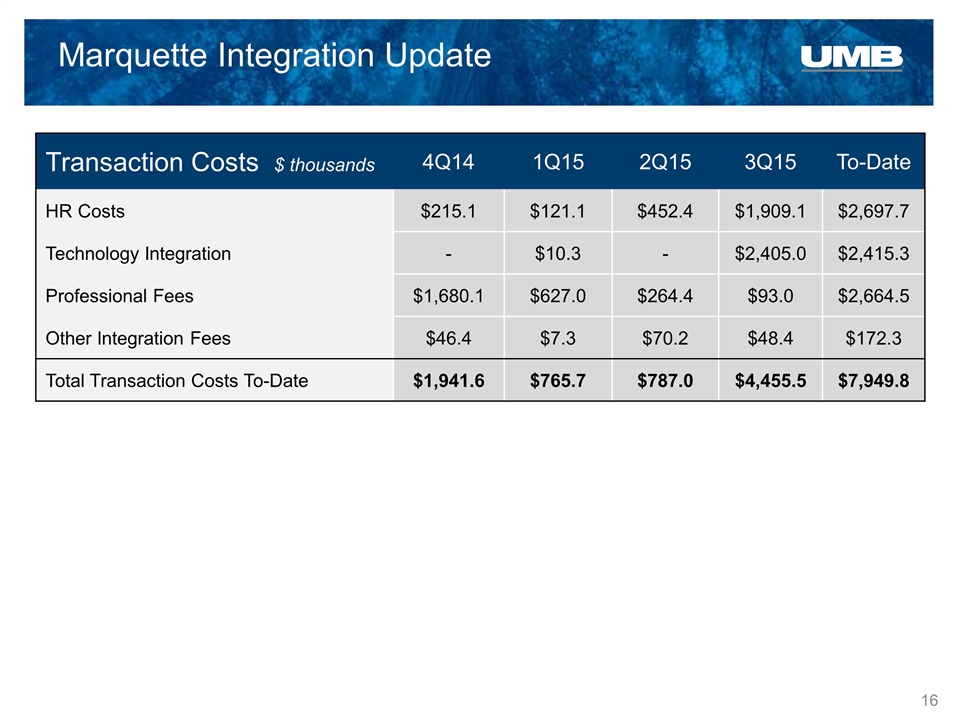
Marquette Integration Update Transaction Costs $ thousands 4Q14 1Q15 2Q15 3Q15 To-Date HR Costs $215.1 $121.1 $452.4 $1,909.1 $2,697.7 Technology Integration - $10.3 - $2,405.0 $2,415.3 Professional Fees $1,680.1 $627.0 $264.4 $93.0 $2,664.5 Other Integration Fees $46.4 $7.3 $70.2 $48.4 $172.3 Total Transaction Costs To-Date $1,941.6 $765.7 $787.0 $4,455.5 $7,949.8
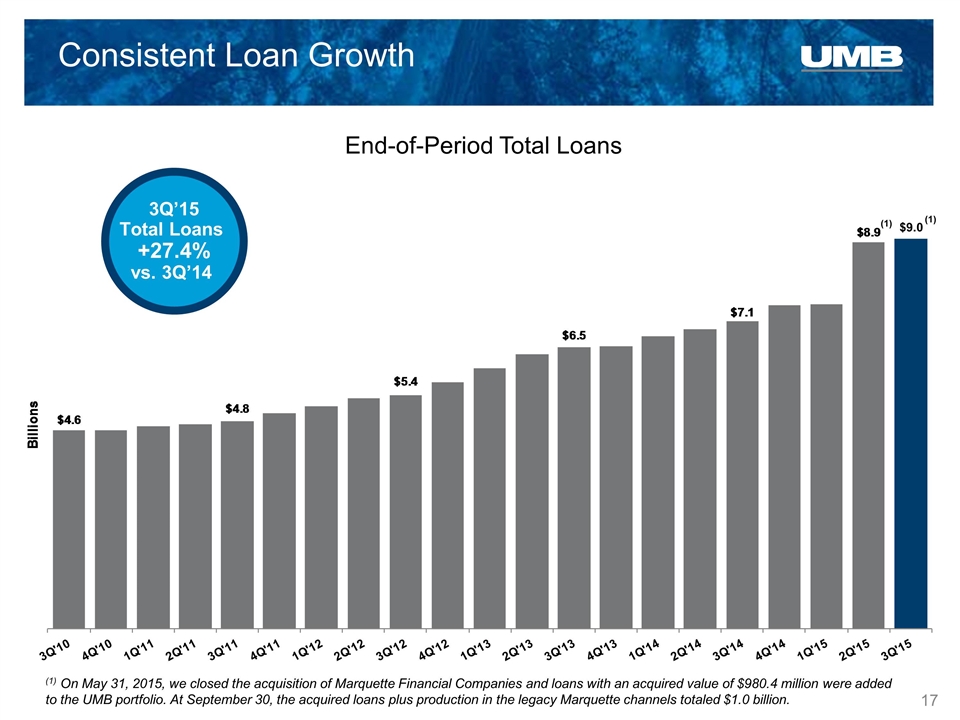
Consistent Loan Growth End-of-Period Total Loans 3Q’15 Total Loans +27.4% vs. 3Q’14 (1) On May 31, 2015, we closed the acquisition of Marquette Financial Companies and loans with an acquired value of $980.4 million were added to the UMB portfolio. At September 30, the acquired loans plus production in the legacy Marquette channels totaled $1.0 billion. $9.0 (1) (1)
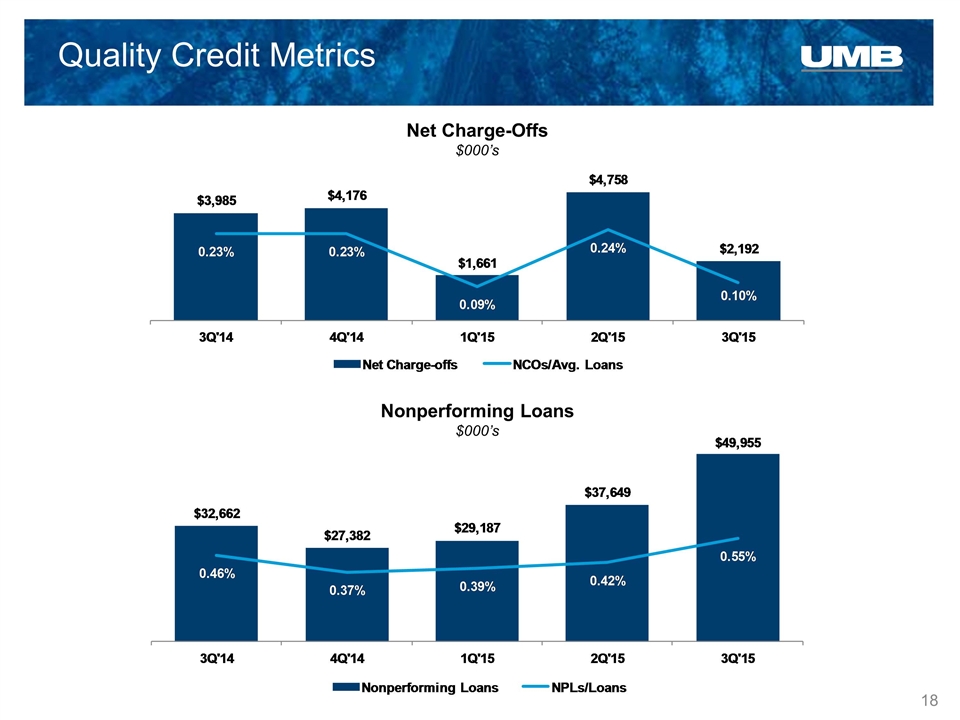
Quality Credit Metrics Net Charge-Offs $000’s Nonperforming Loans $000’s
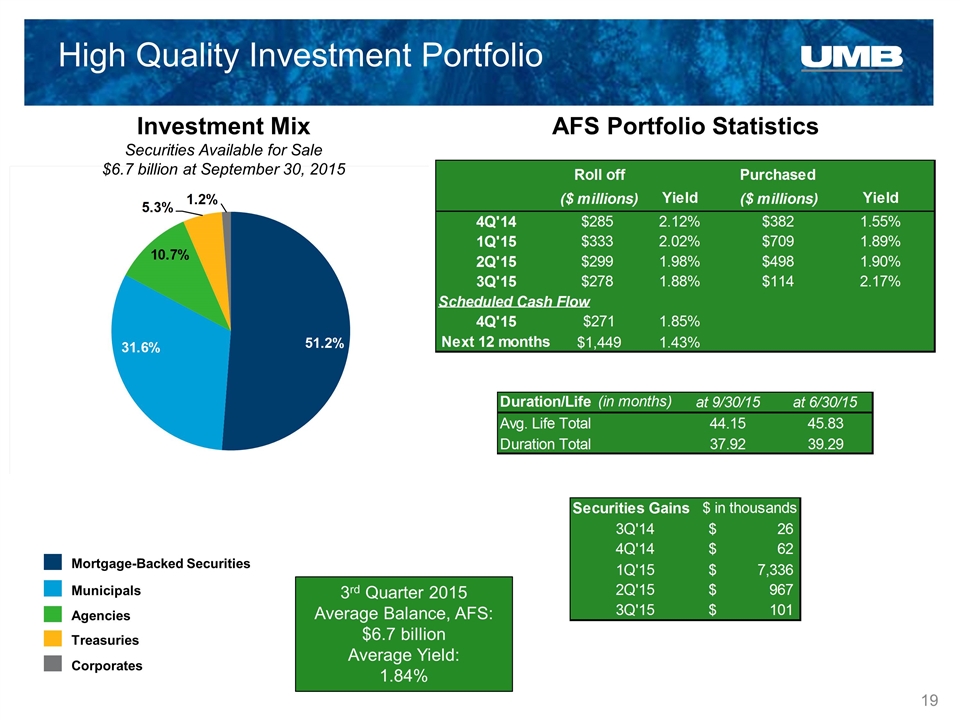
3rd Quarter 2015 Average Balance, AFS: $6.7 billion Average Yield: 1.84% Investment Mix Securities Available for Sale $6.7 billion at September 30, 2015 Agencies High Quality Investment Portfolio Corporates Municipals Mortgage-Backed Securities Treasuries AFS Portfolio Statistics
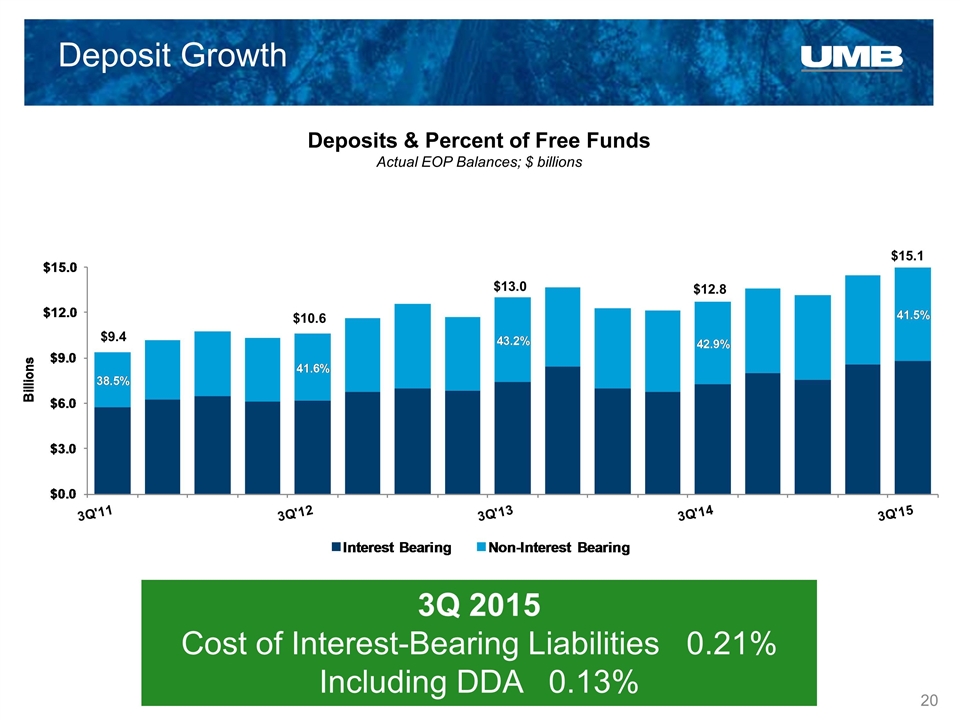
Deposit Growth Deposits & Percent of Free Funds Actual EOP Balances; $ billions 3Q 2015 Cost of Interest-Bearing Liabilities 0.21% Including DDA 0.13% $9.4 $13.0 $10.6 $12.8 $15.1
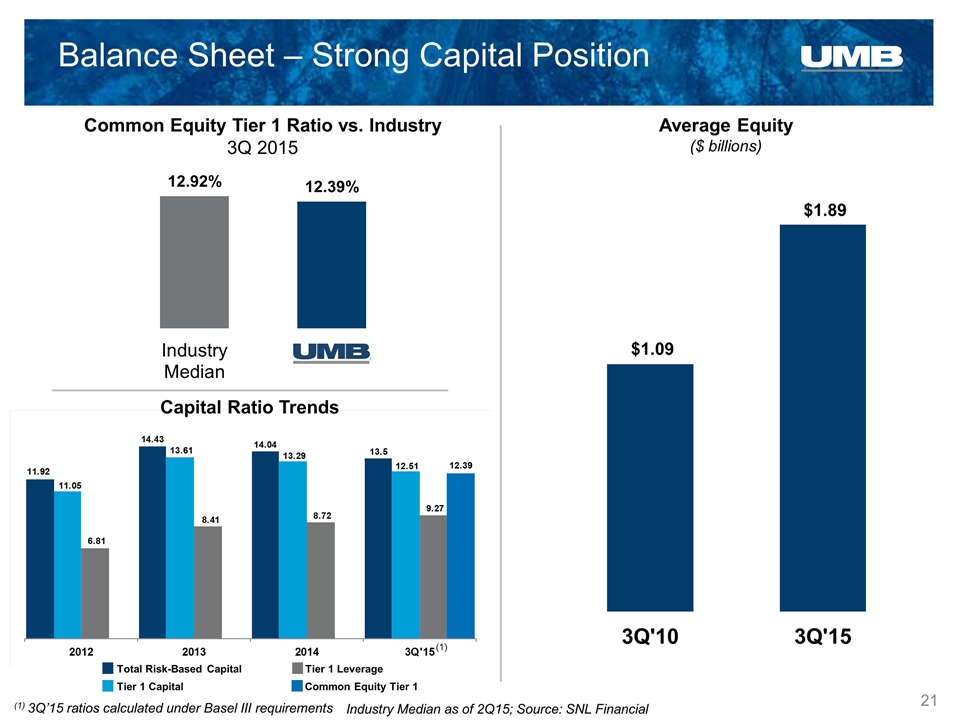
Balance Sheet – Strong Capital Position Common Equity Tier 1 Ratio vs. Industry 3Q 2015 Average Equity ($ billions) Capital Ratio Trends Industry Median as of 2Q15; Source: SNL Financial (1) 3Q’15 ratios calculated under Basel III requirements Total Risk-Based Capital Tier 1 Capital Tier 1 Leverage Common Equity Tier 1 (1)
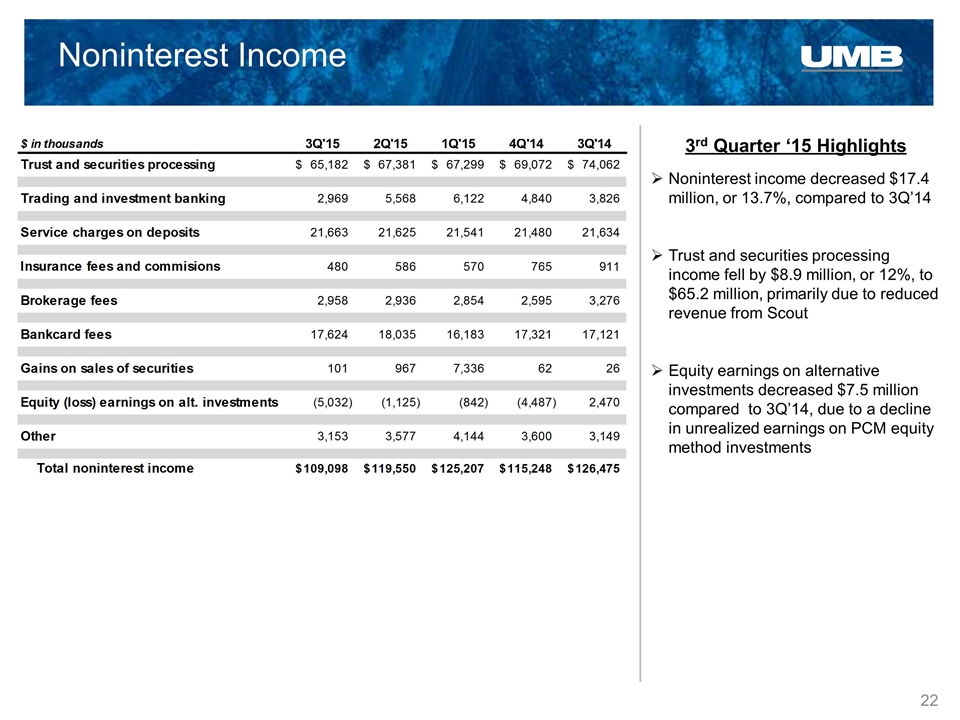
Noninterest Income Noninterest income decreased $17.4 million, or 13.7%, compared to 3Q’14 Trust and securities processing income fell by $8.9 million, or 12%, to $65.2 million, primarily due to reduced revenue from Scout Equity earnings on alternative investments decreased $7.5 million compared to 3Q’14, due to a decline in unrealized earnings on PCM equity method investments 3rd Quarter ‘15 Highlights
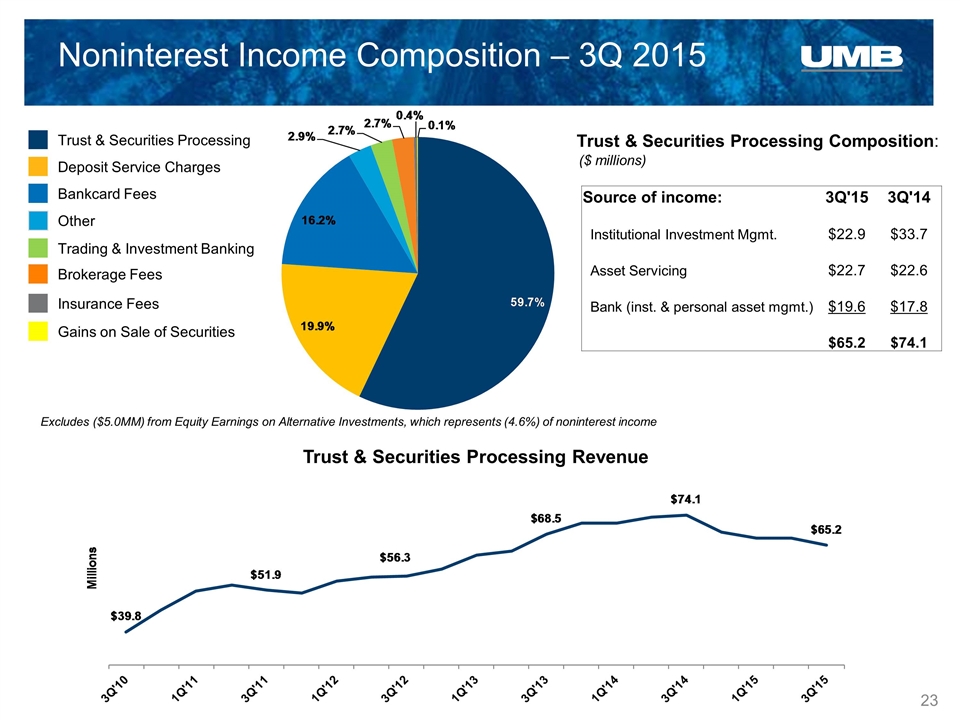
Bankcard Fees Noninterest Income Composition – 3Q 2015 Trust & Securities Processing Revenue Trust & Securities Processing Composition: Deposit Service Charges Trust & Securities Processing Insurance Fees Trading & Investment Banking Brokerage Fees Other ($ millions) Gains on Sale of Securities Source of income: 3Q'15 3Q'14 Institutional Investment Mgmt. $22.9 $33.7 Asset Servicing $22.7 $22.6 Bank (inst. & personal asset mgmt.) $19.6 $17.8 $65.2 $74.1 Excludes ($5.0MM) from Equity Earnings on Alternative Investments, which represents (4.6%) of noninterest income
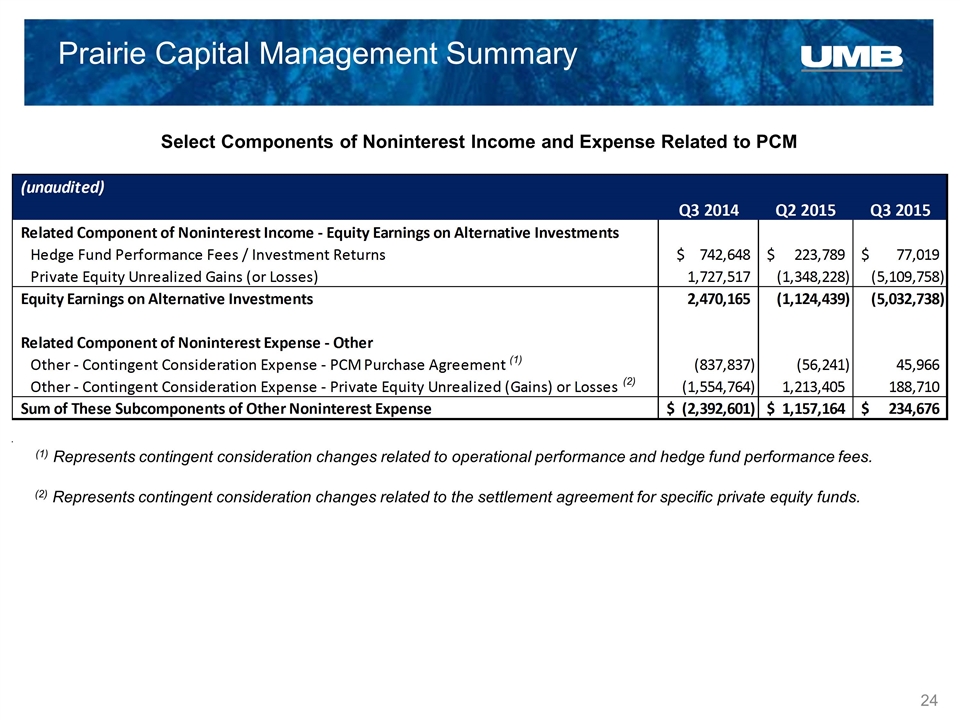
Prairie Capital Management Summary Select Components of Noninterest Income and Expense Related to PCM (2) Represents contingent consideration changes related to the settlement agreement for specific private equity funds. (1) Represents contingent consideration changes related to operational performance and hedge fund performance fees. (1) (2)
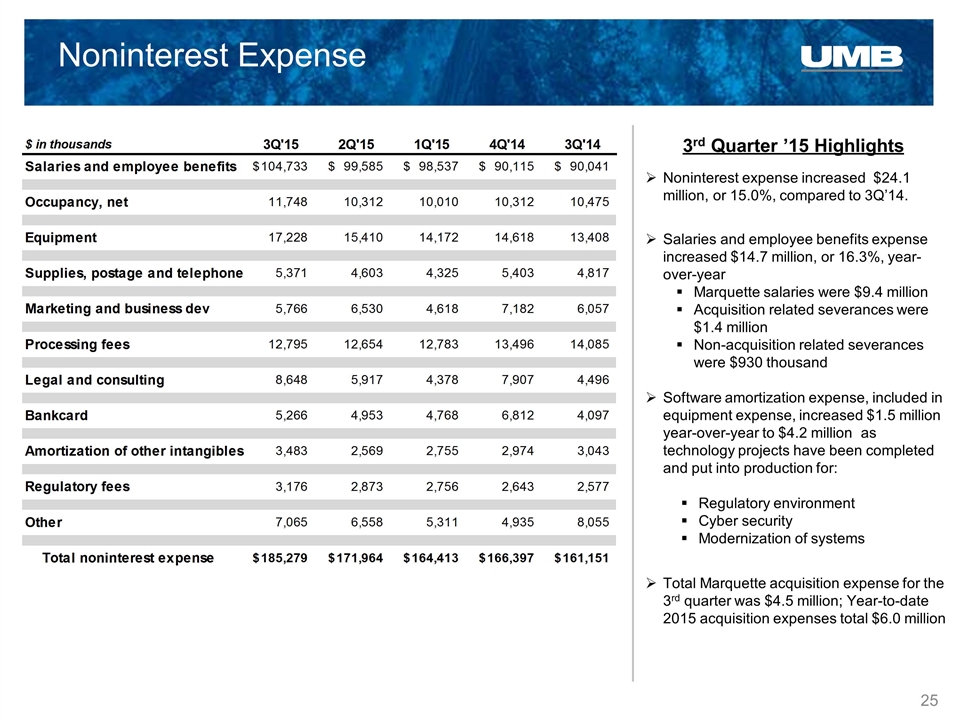
Noninterest Expense Noninterest expense increased $24.1 million, or 15.0%, compared to 3Q’14. Salaries and employee benefits expense increased $14.7 million, or 16.3%, year-over-year Marquette salaries were $9.4 million Acquisition related severances were $1.4 million Non-acquisition related severances were $930 thousand Software amortization expense, included in equipment expense, increased $1.5 million year-over-year to $4.2 million as technology projects have been completed and put into production for: Regulatory environment Cyber security Modernization of systems Total Marquette acquisition expense for the 3rd quarter was $4.5 million; Year-to-date 2015 acquisition expenses total $6.0 million 3rd Quarter ’15 Highlights

Business Segment Updates - 3Q 2015
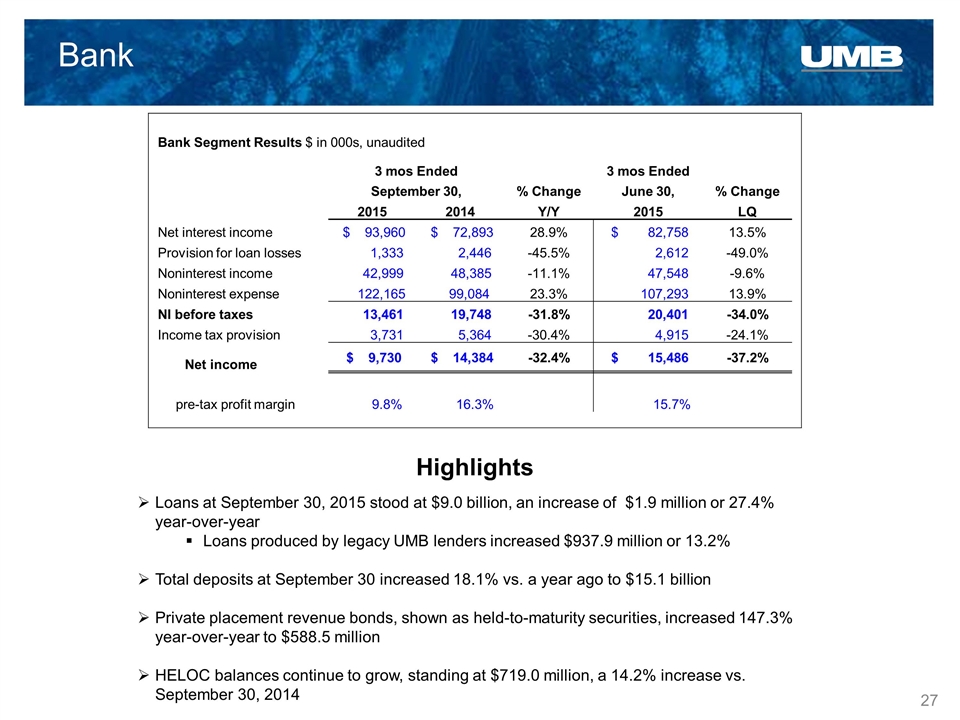
Bank Loans at September 30, 2015 stood at $9.0 billion, an increase of $1.9 million or 27.4% year-over-year Loans produced by legacy UMB lenders increased $937.9 million or 13.2% Total deposits at September 30 increased 18.1% vs. a year ago to $15.1 billion Private placement revenue bonds, shown as held-to-maturity securities, increased 147.3% year-over-year to $588.5 million HELOC balances continue to grow, standing at $719.0 million, a 14.2% increase vs. September 30, 2014 Highlights Bank Segment Results $ in 000s, unaudited 3 mos Ended 3 mos Ended September 30, % Change June 30, % Change 2015 2014 Y/Y 2015 LQ Net interest income $ 93,960 $ 72,893 28.9% $ 82,758 13.5% Provision for loan losses 1,333 2,446 -45.5% 2,612 -49.0% Noninterest income 42,999 48,385 -11.1% 47,548 -9.6% Noninterest expense 122,165 99,084 23.3% 107,293 13.9% NI before taxes 13,461 19,748 -31.8% 20,401 -34.0% Income tax provision 3,731 5,364 -30.4% 4,915 -24.1% Net income $ 9,730 $ 14,384 -32.4% $ 15,486 -37.2% pre-tax profit margin 9.8% 16.3% 15.7%
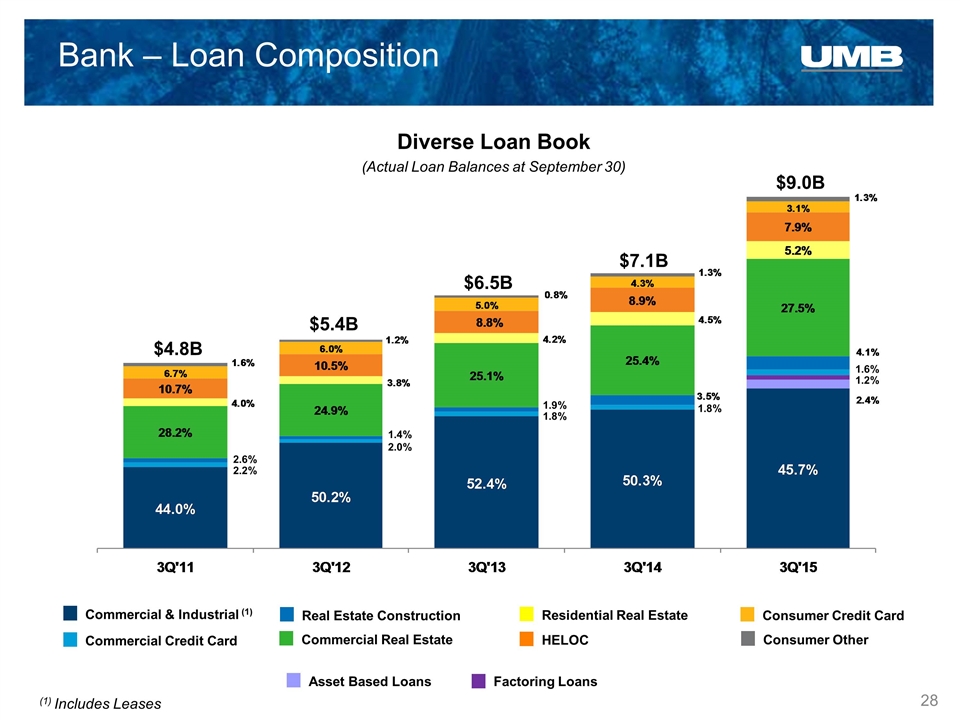
Bank – Loan Composition Diverse Loan Book (Actual Loan Balances at September 30) $4.8B $5.4B $6.5B $7.1B $9.0B Commercial Credit Card Commercial & Industrial (1) HELOC Residential Real Estate Real Estate Construction Commercial Real Estate Consumer Credit Card Consumer Other 1.6% 1.2% 1.8% 1.9% 1.8% 1.4% 2.0% 2.6% 2.2% Factoring Loans Asset Based Loans (1) Includes Leases
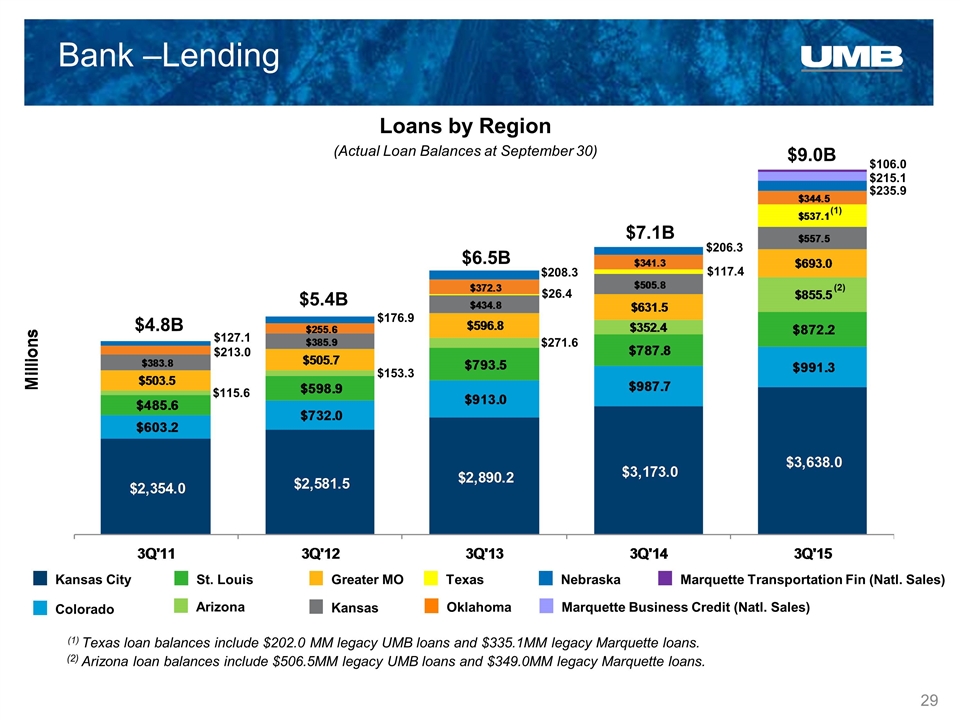
Bank –Lending Loans by Region (Actual Loan Balances at September 30) $127.1 $213.0 $115.6 $176.9 $153.3 $208.3 $271.6 $206.3 $117.4 $235.9 $4.8B $5.4B $6.5B $7.1B $9.0B Colorado Kansas City Kansas Greater MO St. Louis Arizona Texas Oklahoma Marquette Transportation Fin (Natl. Sales) Nebraska Marquette Business Credit (Natl. Sales) $215.1 $106.0 (2) Arizona loan balances include $506.5MM legacy UMB loans and $349.0MM legacy Marquette loans. (1) Texas loan balances include $202.0 MM legacy UMB loans and $335.1MM legacy Marquette loans. (1) (2) $26.4
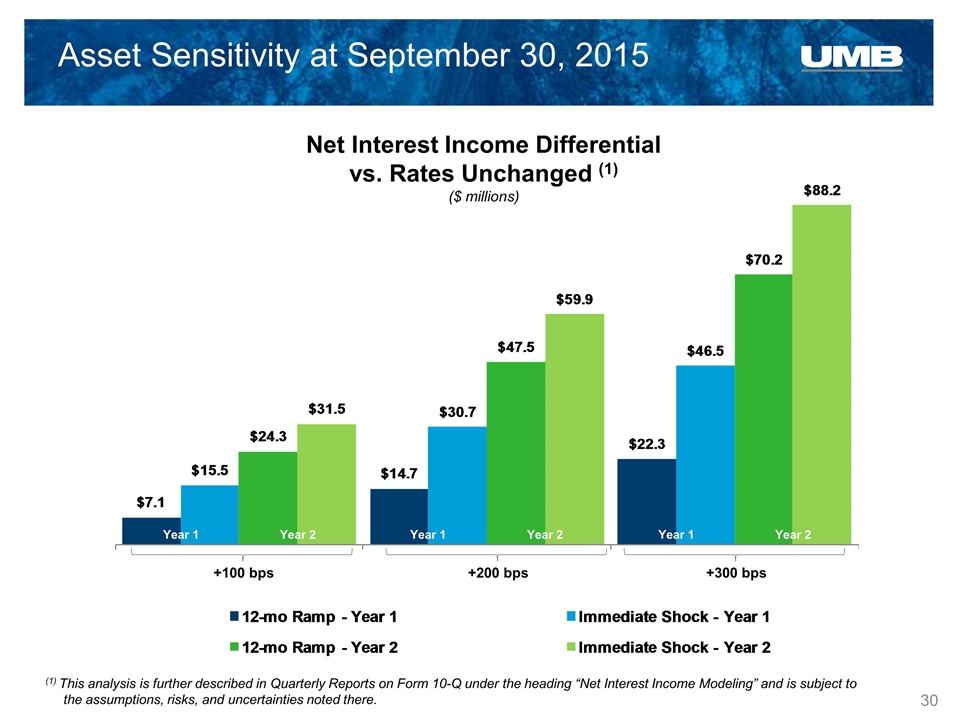
Asset Sensitivity at September 30, 2015 Net Interest Income Differential vs. Rates Unchanged (1) ($ millions) (1) This analysis is further described in Quarterly Reports on Form 10-Q under the heading “Net Interest Income Modeling” and is subject to the assumptions, risks, and uncertainties noted there. Year 1 Year 2 Year 1 Year 2 Year 1 Year 2 +100 bps +200 bps +300 bps
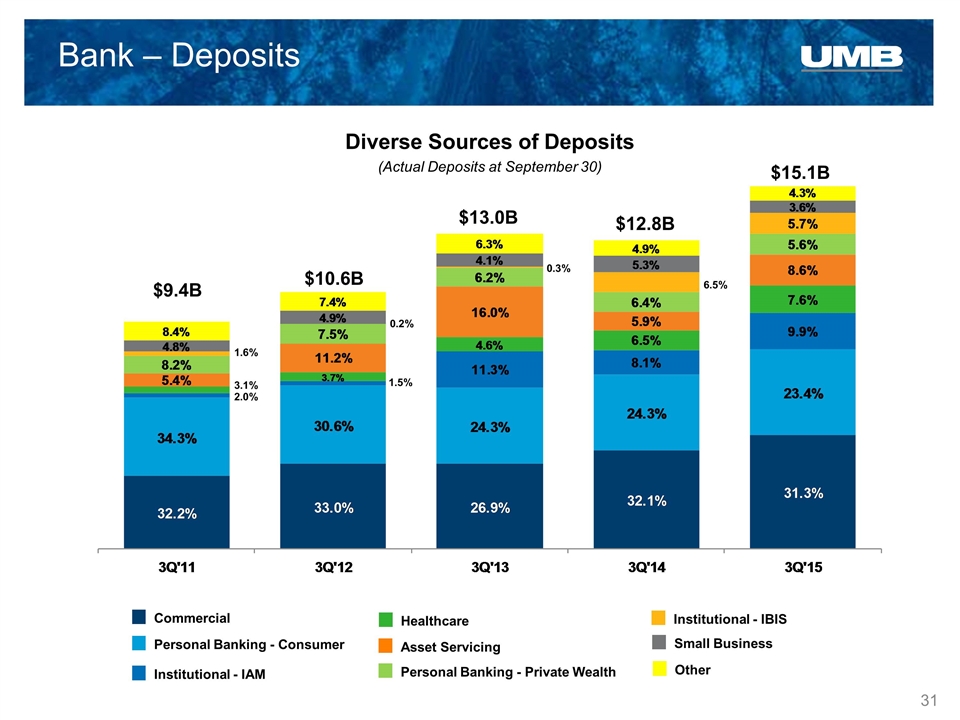
Bank – Deposits Diverse Sources of Deposits (Actual Deposits at September 30) $9.4B $10.6B $13.0B $12.8B $15.1B Personal Banking - Consumer Commercial Institutional - IAM Personal Banking - Private Wealth Asset Servicing Healthcare Institutional - IBIS Small Business Other 3.1% 1.5% 0.3% 6.5% 1.6% 0.2% 2.0%
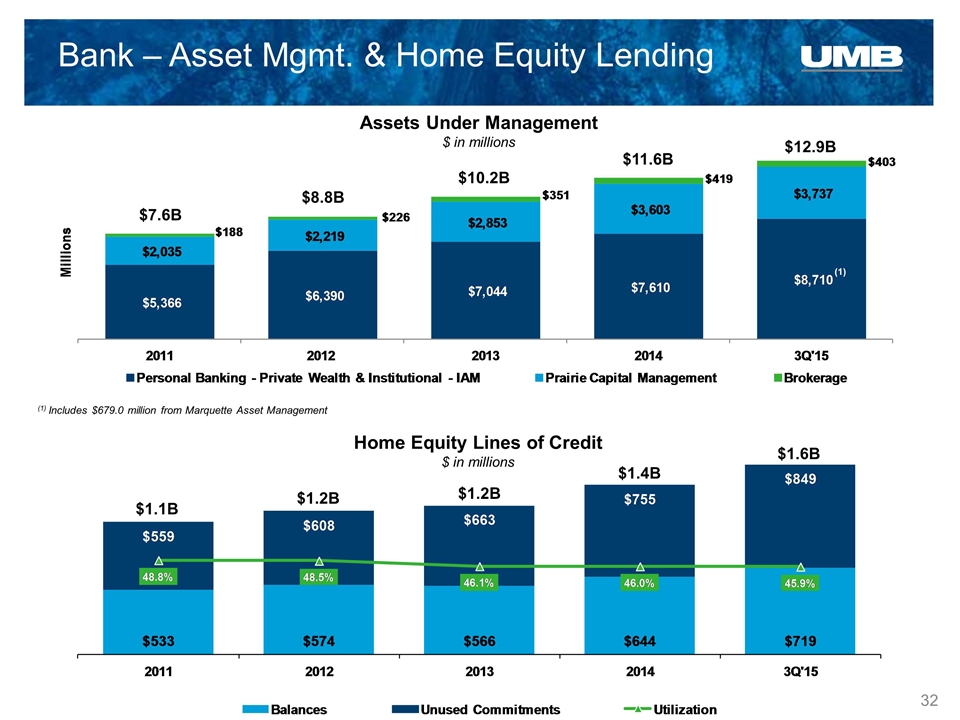
$7.6B $8.8B $10.2B $11.6B $12.9B $1.1B $1.2B $1.2B $1.4B $1.6B Home Equity Lines of Credit $ in millions Assets Under Management $ in millions Bank – Asset Mgmt. & Home Equity Lending (1) (1) Includes $679.0 million from Marquette Asset Management
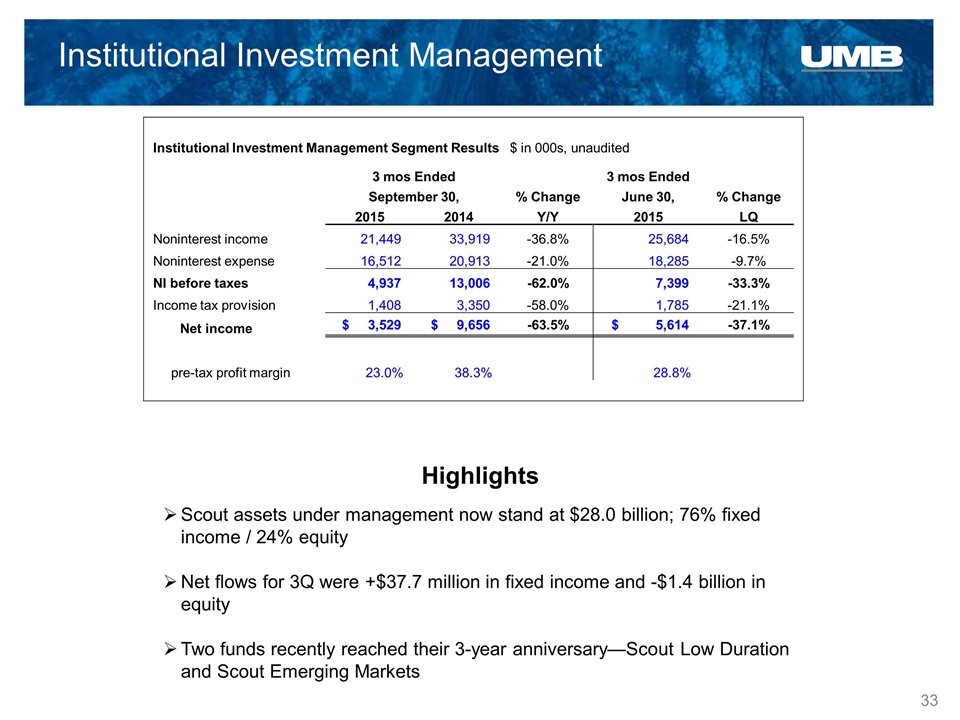
Institutional Investment Management Highlights Institutional Investment Management Segment Results $ in 000s, unaudited 3 mos Ended 3 mos Ended September 30, % Change June 30, % Change 2015 2014 Y/Y 2015 LQ Noninterest income 21,449 33,919 -36.8% 25,684 -16.5% Noninterest expense 16,512 20,913 -21.0% 18,285 -9.7% NI before taxes 4,937 13,006 -62.0% 7,399 -33.3% Income tax provision 1,408 3,350 -58.0% 1,785 -21.1% Net income $ 3,529 $ 9,656 -63.5% $ 5,614 -37.1% pre-tax profit margin 23.0% 38.3% 28.8% Scout assets under management now stand at $28.0 billion; 76% fixed income / 24% equity Net flows for 3Q were +$37.7 million in fixed income and -$1.4 billion in equity Two funds recently reached their 3-year anniversary—Scout Low Duration and Scout Emerging Markets
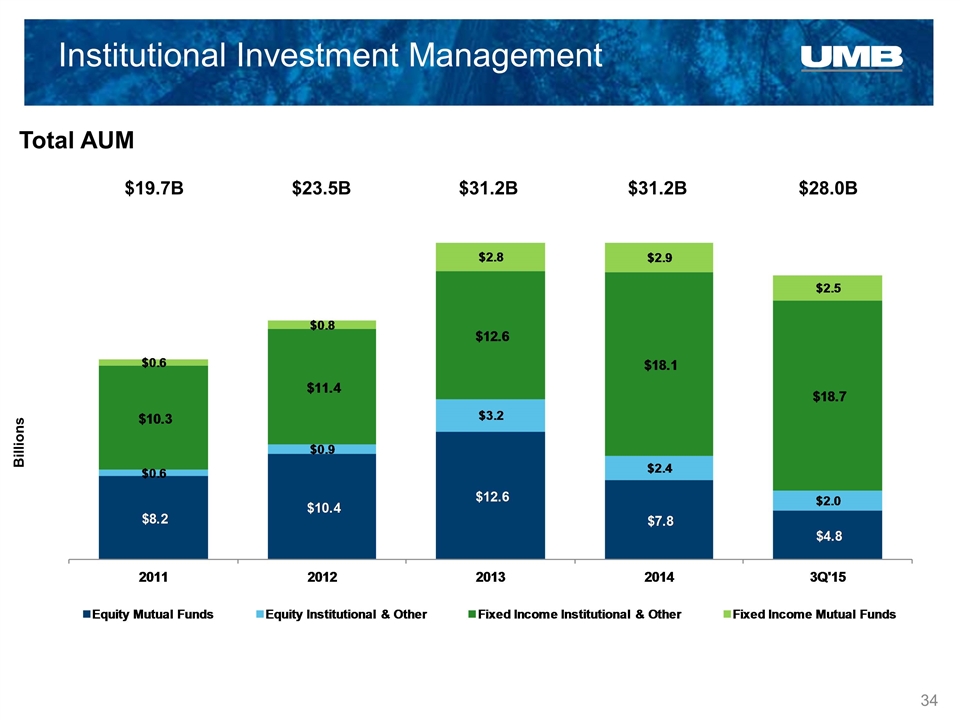
Total AUM $28.0B $19.7B $23.5B Institutional Investment Management $31.2B $31.2B Billions
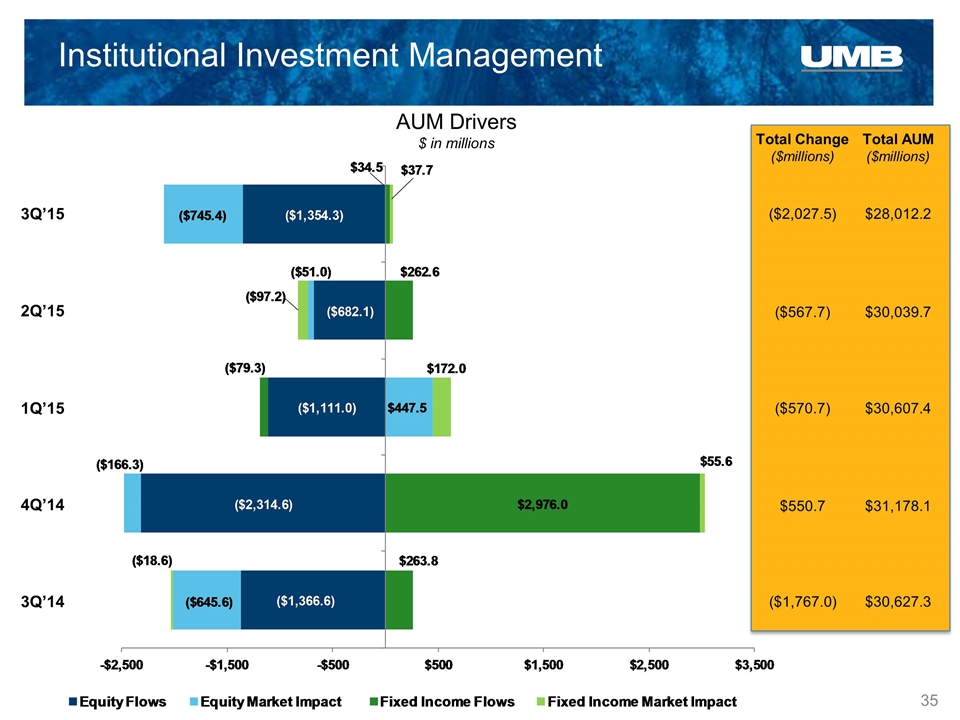
AUM Drivers $ in millions ($570.7) $550.7 Total Change ($millions) $30,607.4 $31,178.1 Total AUM ($millions) Institutional Investment Management ($1,767.0) $30,627.3 ($567.7) $30,039.7 ($2,027.5) $28,012.2 3Q’15 2Q’15 1Q’15 4Q’14 3Q’14
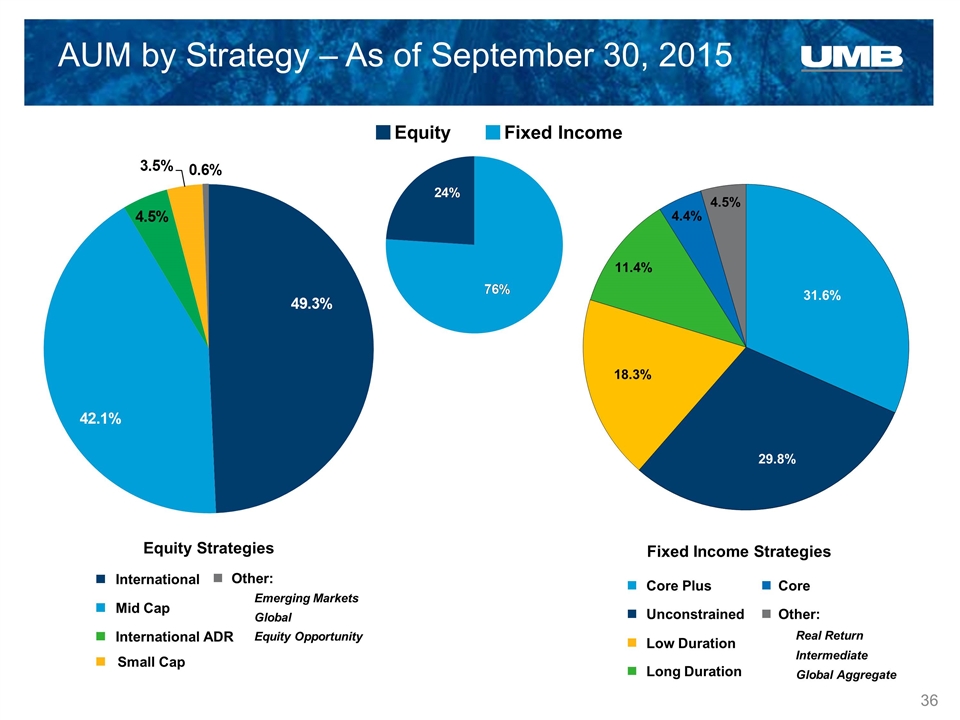
AUM by Strategy – As of September 30, 2015 Equity Strategies International Mid Cap International ADR Emerging Markets Global Small Cap Other: Fixed Income Strategies Core Plus Low Duration Long Duration Core Real Return Unconstrained Intermediate Equity Fixed Income Other: Equity Opportunity Global Aggregate 31.6% 29.8% 18.3% 11.4% 4.4% 4.5%
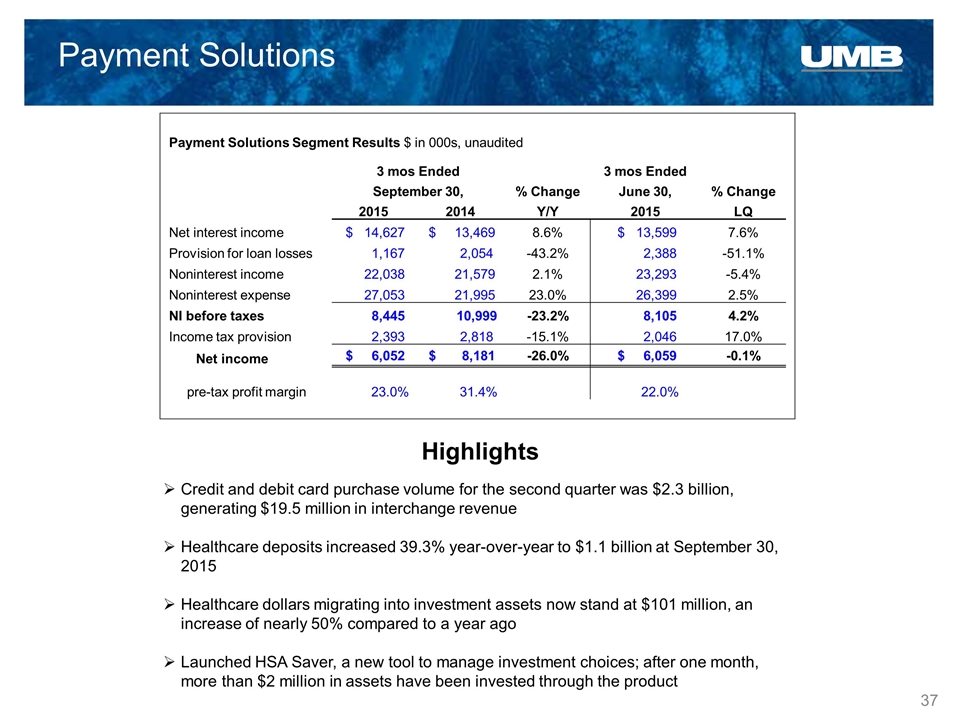
Payment Solutions Highlights Payment Solutions Segment Results $ in 000s, unaudited 3 mos Ended 3 mos Ended September 30, % Change June 30, % Change 2015 2014 Y/Y 2015 LQ Net interest income $ 14,627 $ 13,469 8.6% $ 13,599 7.6% Provision for loan losses 1,167 2,054 -43.2% 2,388 -51.1% Noninterest income 22,038 21,579 2.1% 23,293 -5.4% Noninterest expense 27,053 21,995 23.0% 26,399 2.5% NI before taxes 8,445 10,999 -23.2% 8,105 4.2% Income tax provision 2,393 2,818 -15.1% 2,046 17.0% Net income $ 6,052 $ 8,181 -26.0% $ 6,059 -0.1% pre-tax profit margin 23.0% 31.4% 22.0% Credit and debit card purchase volume for the second quarter was $2.3 billion, generating $19.5 million in interchange revenue Healthcare deposits increased 39.3% year-over-year to $1.1 billion at September 30, 2015 Healthcare dollars migrating into investment assets now stand at $101 million, an increase of nearly 50% compared to a year ago Launched HSA Saver, a new tool to manage investment choices; after one month, more than $2 million in assets have been invested through the product
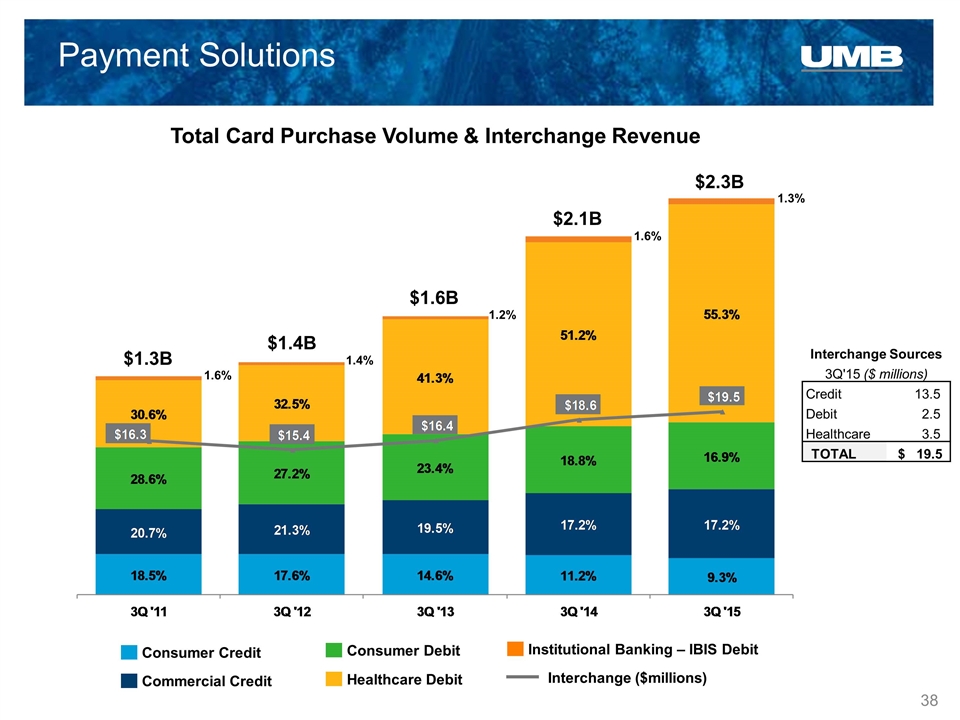
Payment Solutions Total Card Purchase Volume & Interchange Revenue Commercial Credit Consumer Credit Consumer Debit Healthcare Debit Institutional Banking – IBIS Debit Interchange ($millions) $2.3B $1.3B $1.4B $1.6B $2.1B 1.6% 1.4% 1.2% 1.6% 1.3% Interchange Sources 3Q'15 ($ millions) Credit 13.5 Debit 2.5 Healthcare 3.5 TOTAL $ 19.5
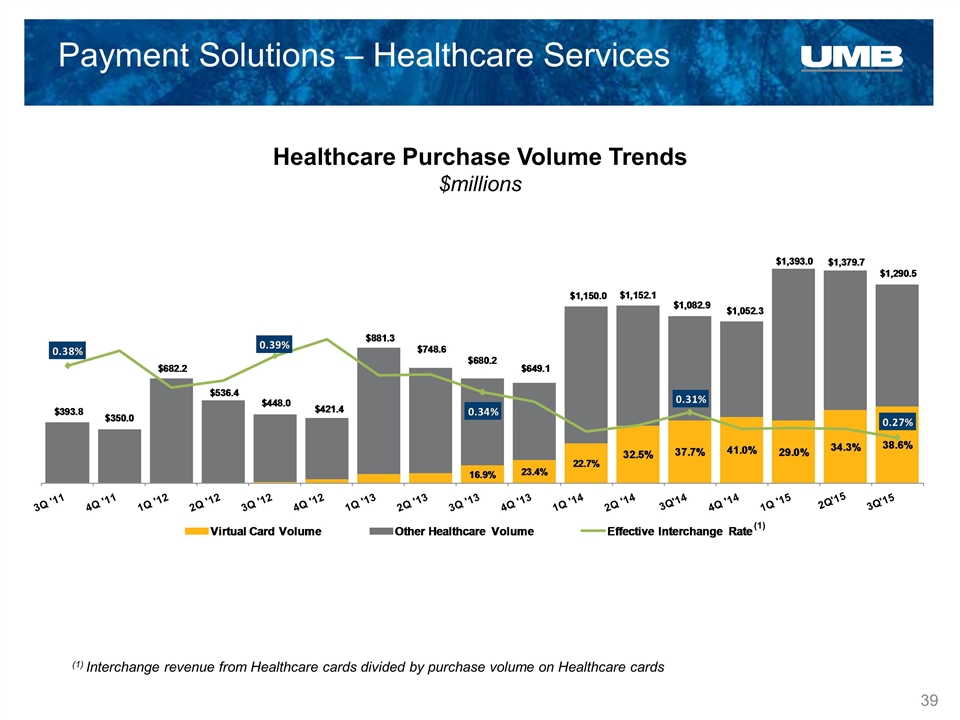
Payment Solutions – Healthcare Services Healthcare Purchase Volume Trends $millions (1) Interchange revenue from Healthcare cards divided by purchase volume on Healthcare cards (1)
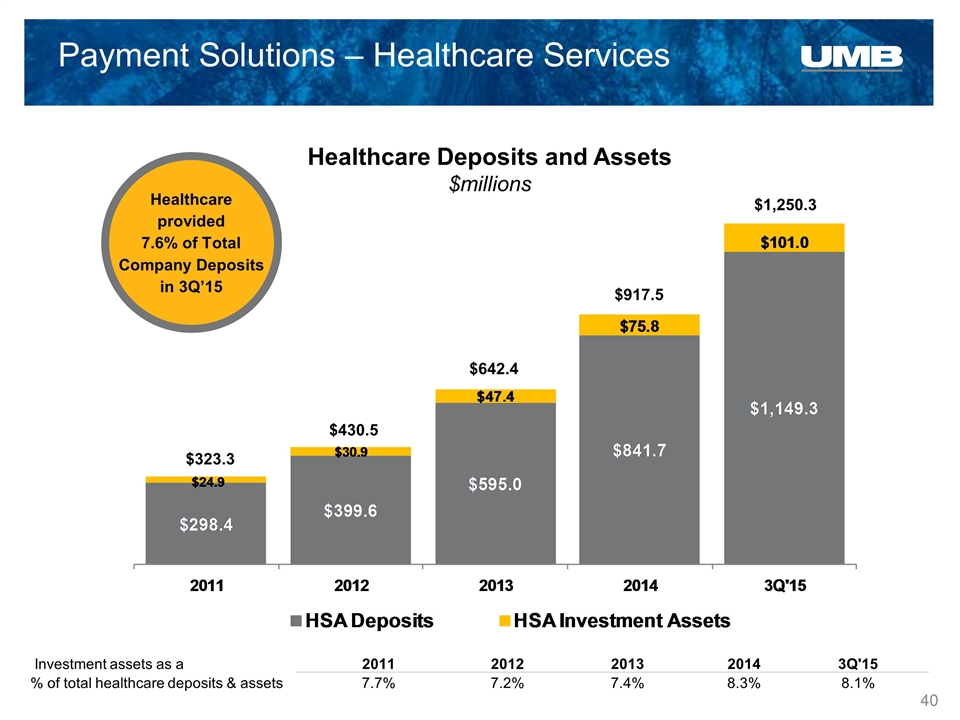
Payment Solutions – Healthcare Services Healthcare Deposits and Assets $millions $323.3 $430.5 $642.4 $917.5 $1,250.3 Healthcare provided 7.6% of Total Company Deposits in 3Q’15 Investment assets as a 2011 2012 2013 2014 3Q'15 % of total healthcare deposits & assets 7.7% 7.2% 7.4% 8.3% 8.1%

We offer a modular and configurable platform of applications and services that deliver the underlying core banking functionality to our healthcare partners. Broker/Employer TPAs Health Plans Tech Cos Payment Aggregators 401(k) Record Keeper Healthcare Partners HSA Applications SSO Web Services Contributions Enrollment BIN Sponsor HCS Saver Partner Portal Core Banking Systems Multi-Channel Healthcare Strategy
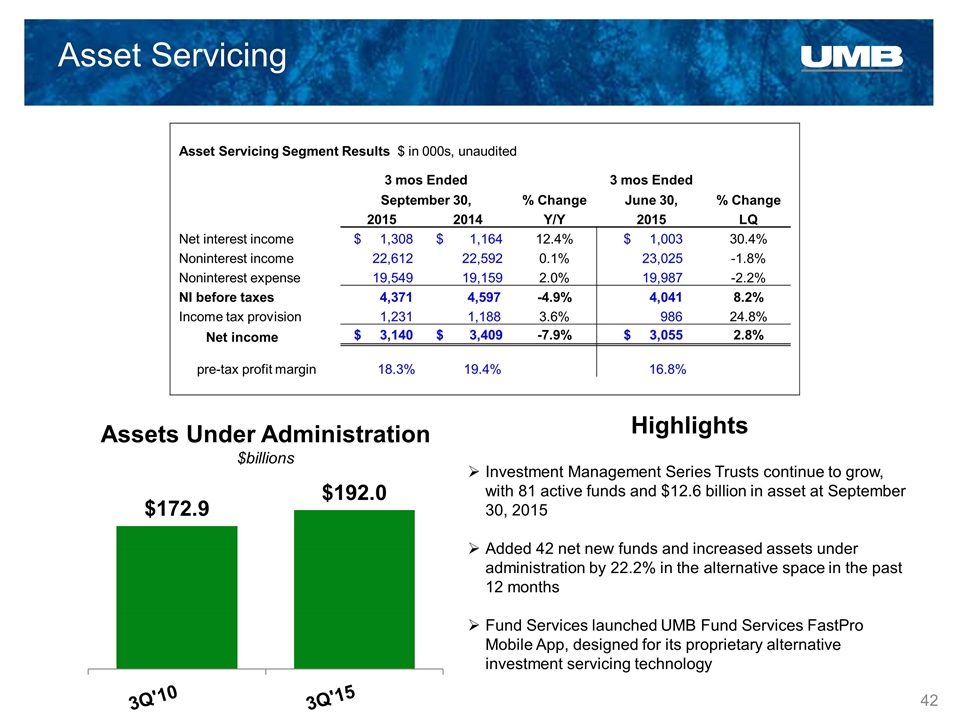
Asset Servicing Assets Under Administration $billions Investment Management Series Trusts continue to grow, with 81 active funds and $12.6 billion in asset at September 30, 2015 Added 42 net new funds and increased assets under administration by 22.2% in the alternative space in the past 12 months Fund Services launched UMB Fund Services FastPro Mobile App, designed for its proprietary alternative investment servicing technology Highlights Asset Servicing Segment Results $ in 000s, unaudited 3 mos Ended 3 mos Ended September 30, % Change June 30, % Change 2015 2014 Y/Y 2015 LQ Net interest income $ 1,308 $ 1,164 12.4% $ 1,003 30.4% Noninterest income 22,612 22,592 0.1% 23,025 -1.8% Noninterest expense 19,549 19,159 2.0% 19,987 -2.2% NI before taxes 4,371 4,597 -4.9% 4,041 8.2% Income tax provision 1,231 1,188 3.6% 986 24.8% Net income $ 3,140 $ 3,409 -7.9% $ 3,055 2.8% pre-tax profit margin 18.3% 19.4% 16.8%
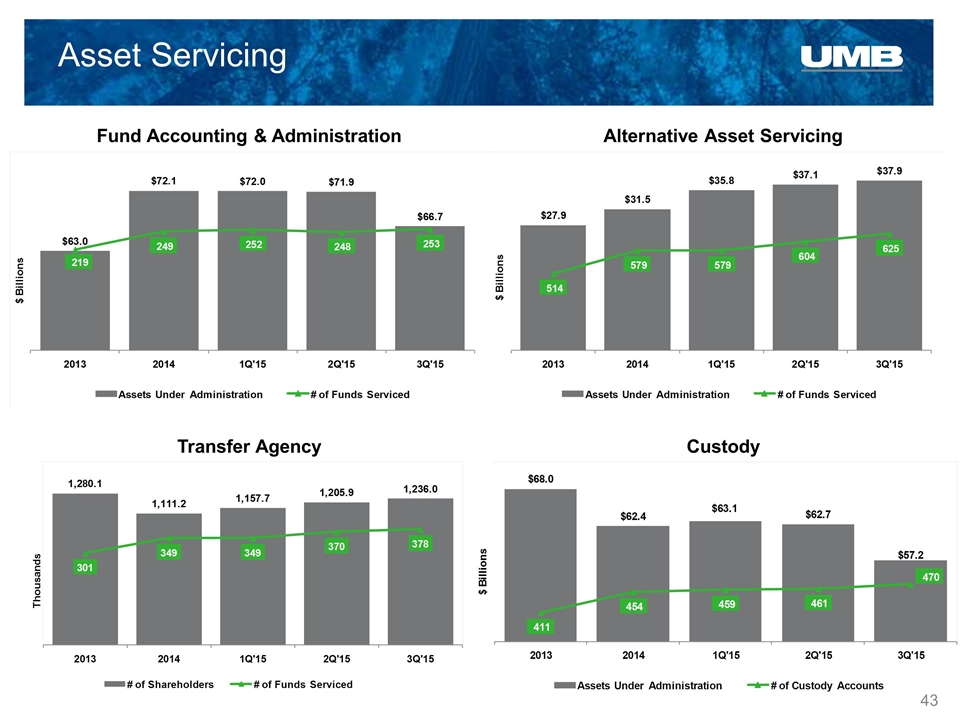
Asset Servicing Fund Accounting & Administration Alternative Asset Servicing Custody Transfer Agency

Strength in balance – today and tomorrow. Third Quarter 2015 UMB Financial