
Form 8-K MONMOUTH REAL ESTATE For: Aug 05
UNITED STATES
SECURITIES AND EXCHANGE COMMISSION
Washington, D.C. 20549
FORM 8-K
CURRENT REPORT
Pursuant to Section 13 or 15(d) of the Securities Exchange Act of 1934
Date of Report (Date of earliest event reported) August 5, 2015
MONMOUTH REAL ESTATE INVESTMENT CORPORATION
(Exact name of Registrant as specified in its charter)
MARYLAND 001-33177 22-1897375
(State or other jurisdiction (Commission (IRS Employer
of incorporation) File Number) Identification Number)
3499 Route 9N, Suite 3D, Freehold, NJ 07728
(Address of principal executive offices) (Zip Code)
Registrant's telephone number, including area code (732) 577-9996
(Former name or former address, if changed since last report.)
Check the appropriate box below if the Form 8-K filing is intended to simultaneously satisfy the filing obligation of the registrant under any of the following provisions (see General Instructions A.2. below):
[ ] Written communications pursuant to Rule 425 under Securities Act (17 CFR 230.425)
[ ] Soliciting material pursuant to Rule 142-12 under the Exchange Act (17 CFR 240.14a-12
[ ] Pre-commencement communications pursuant to rule 14d-2(b) under the Exchange Act (17 CFR 240.14d-2(b))
[ ] Pre-commencement communications pursuant to Rule 13e-4(c) under the Exchange Act (17 CFR 240.13e-4(c))
Item 2.02 Results of Operations and Financial Condition.
Item 7.01 Regulation FD Disclosure.
On August 5, 2015 Monmouth Real Estate Investment Corporation issued a press release announcing the results for the third quarter ended June 30, 2015 and disclosed a supplemental information package in connection with its earnings conference call for the third quarter ended June 30, 2015. A copy of the supplemental information package and press release is furnished with this report as Exhibit 99 and is incorporated herein by reference.
The information in this report and the exhibit attached hereto is being furnished, not filed, for the purposes of Section 18 of the Securities Exchange Act of 1934, as amended, and pursuant to Item 2.02 and Item 7.01 of Form 8-K will not be incorporated by reference into any filing under the Securities Act of 1933, as amended, unless specifically identified therein as being incorporated therein by reference.
Forward-Looking Statements
Statements contained in this report, including the documents that are incorporated by reference, that are not historical facts are forward-looking statements within the meaning of Section 27A of the Securities Act of 1933, as amended (the “Securities Act”), and Section 21E of the Securities Exchange Act of 1934, as amended and the Private Securities Litigation Reform Act of 1995 (the “Exchange Act”). All statements, other than statements of historical facts that address activities, events or developments where the Company uses any of the words “anticipates,” “assumes,” “believes,” “estimates,” “expects,” “intends,” or similar expressions, are forward-looking statements. These forward-looking statements are not guaranteed and are based on the Company’s current intentions and on the Company’s current expectations and assumptions. These statements, intentions, expectations and assumptions involve risks and uncertainties, some of which are beyond the Company’s control that could cause actual results or events to differ materially from those that the Company anticipates or projects, such as:
- the ability of the Company’s tenants to make payments under their respective leases, our reliance on certain major tenants and the Company’s ability to re-lease properties that are currently vacant or that become vacant;
- the Company’s ability to obtain suitable tenants for its properties;
- changes in real estate market conditions, economic conditions in the industrial sector and the market in which the Company’s properties are located and general economic conditions;
- the inherent risks associated with owning real estate, including local real estate market conditions, governing laws and regulations and illiquidity of real estate investments;
- the Company’s ability to sell properties at an attractive price;
- the Company’s ability to repay debt financing obligations;
- the Company’s ability to refinance amounts outstanding under its credit facilities at maturity on terms favorable to us;
- the loss of any member of the Company’s management team;
- the Company’s ability to comply with debt covenants;
- the Company’s ability to integrate acquired properties and operations into existing operations;
- continued availability of proceeds from issuances of the Company’s debt or equity securities;
- the availability of other debt and equity financing alternatives;
- market conditions affecting the Company’s debt and equity securities;
- changes in interest rates under the Company’s current credit facility and under any additional variable rate debt arrangements that the Company may enter into in the future;
- the Company’s ability to successfully implement the Company’s selective acquisition strategy;
- the Company’s ability to maintain internal controls and procedures to ensure all transactions are accounted for properly, all relevant disclosures and filings are timely made in accordance with all rules and regulations, and any potential fraud or embezzlement is thwarted or detected;
- changes in federal or state tax rules or regulations that could have adverse tax consequences;
- declines in the market value of the Company’s investment securities; and
- the Company’s ability to qualify as a REIT for federal income tax purposes.
Item 9.01 Financial Statements and Exhibits.
(d) Exhibits.
| 99 | Supplemental information package for the third quarter ended June 30, 2015 and press release dated August 5, 2015. |
SIGNATURES
Pursuant to the requirements of the Securities Exchange Act of 1934, the Registrant has duly caused this report to be signed on its behalf by the undersigned hereunto duly authorized.
MONMOUTH REAL ESTATE INVESTMENT CORPORATION
/s/ Kevin S. Miller
Kevin S. Miller
Chief Financial and Accounting Officer
Date August 5, 2015
 |
||||||||||||
| Table of Contents | ||||||||||||
| Page | ||||||||||||
| Consolidated Balance Sheets | 3 | |||||||||||
| Consolidated Statements of Income | 4 | |||||||||||
| NOI, EBITDA, FFO, Core FFO and AFFO Reconciliations | 5 | |||||||||||
| Financial Highlights | 6 | |||||||||||
| Same Property Statistics | 7 | |||||||||||
| Consolidated Statements of Cash Flows | 8 | |||||||||||
| Capital Structure and Leverage Ratios | 9 | |||||||||||
| Debt Maturity | 11 | |||||||||||
| Property Table by Tenant | 12 | |||||||||||
| Property Table by State | 13 | |||||||||||
| Lease Expirations | 14 | |||||||||||
| Recent Acquisitions | 15 | |||||||||||
| Property Table | 16 | |||||||||||
| Definitions | 18 | |||||||||||
| Press Release Dated August 5, 2015 | 19 | |||||||||||
| The statement of operations and supplemental statement of operations provided in this supplemental information package | ||||||||||||
| present funds from operations, core funds from operations, adjusted funds from operations, net operating income (NOI), Same Property | ||||||||||||
| NOI, Same Property cash NOI and EBITDA which are REIT industry financial measures that are not calculated in accordance with | ||||||||||||
| accounting principles generally accepted in the United States of America. Please see page 18 for a definition of these supplemental | ||||||||||||
| performance measures. Please see the supplemental statement of operations reconciliation for a reconciliation of certain captions | ||||||||||||
| in the supplemental statement of operations reported in this supplemental information package to the statement of operations | ||||||||||||
| as reported in the Company's filings with the SEC on Form 10-Q. | ||||||||||||
Third Quarter FY 2015 Supplemental of Monmouth Real Estate Investment Corp. Page 3 of 21
Third Quarter FY 2015 Supplemental of Monmouth Real Estate Investment Corp. Page 4 of 21
Third Quarter FY 2015 Supplemental of Monmouth Real Estate Investment Corp. Page 5 of 21
Third Quarter FY 2015 Supplemental of Monmouth Real Estate Investment Corp. Page 6 of 21
Same Property Statistics include all properties owned during the entire periods presented with the exclusion of properties expanded during the periods presented.
For the three months ended June 30, 2015, Same Property NOI and Number of Same Properties excludes $2,733,657 of NOI from nine properties acquired subsequent to April 1, 2014 and $1,647,862 of NOI from five properties that have been expanded subsequent to April 1, 2014.
For the three months ended June 30, 2014, Same Property NOI and Number of Same Properties excludes $1,211,108 of NOI from five properties that have been expanded subsequent to April 1, 2014.
| Same Property Statistics | ||||||||||||||||
| Nine Months Ended | ||||||||||||||||
| 6/30/2015 | 6/30/2014 | Change | Change % | |||||||||||||
| Total Square Feet / Total Properties | 13,623,971 | / | 90 | 10,764,456 | / | 81 | 2,859,515 | 26.6% | ||||||||
| Occupancy Percentage at Quarter End | 97.6% | 94.3% | 3.5% | |||||||||||||
| Same Property Square Feet / Number of Same Properties | 8,868,571 | / | 71 | |||||||||||||
| Same Property Occupancy Percentage at Quarter End | 96.3% | 94.8% | 1.6% | |||||||||||||
| Same Property Net Operating Income (NOI) | $ 32,883,299 | $ 31,958,935 | $ 924,364 | 2.9% | ||||||||||||
| Reversal of U.S. GAAP Straight-Line Rent Adjustment | (512,106) | 14,398 | (526,504) | |||||||||||||
| Same Property Cash NOI | $ 32,371,193 | $ 31,973,333 | $ 397,860 | 1.2% | ||||||||||||
Same Property Statistics include all properties owned during the entire periods presented with the exclusion of properties expanded during the periods presented.
For the nine months ended June 30, 2015, Same Property NOI and Number of Same Properties excludes $10,016,928 of NOI from fourteen properties acquired subsequent to October 1, 2013 and $4,653,744 of NOI from five properties that have been expanded subsequent to October 1, 2013.
For the nine months ended June 30, 2014, Same Property NOI and Number of Same Properties excludes $3,634,721 of NOI from five properties acquired subsequent to October 1, 2013 and $3,811,994 of NOI from five properties that have been expanded subsequent to October 1, 2013.
Third Quarter FY 2015 Supplemental of Monmouth Real Estate Investment Corp. Page 7 of 21
Third Quarter FY 2015 Supplemental of Monmouth Real Estate Investment Corp. Page 8 of 21
Third Quarter FY 2015 Supplemental of Monmouth Real Estate Investment Corp. Page 9 of 21
| Capital Structure and Leverage Ratios continued | ||||||||||||
| (unaudited) | ||||||||||||
| Fiscal Year | ||||||||||||
| Three Months Ended | Nine Months Ended | Ended | ||||||||||
| 6/30/15 | 6/30/14 | 6/30/15 | 6/30/14 | 9/30/14 | ||||||||
| Net Income | $5,175,858 | $5,593,548 | $15,418,190 | $14,640,988 | $19,845,294 | |||||||
| plus: Depreciation & Amortization | 5,803,932 | 4,640,068 | 16,475,295 | 13,660,791 | 18,445,326 | |||||||
| plus: Interest Expense | 4,805,681 | 4,170,104 | 13,429,179 | 12,230,617 | 16,104,678 | |||||||
| plus: Acquisition Costs | 440,705 | -0- | 1,303,389 | 462,864 | 481,880 | |||||||
|
plus: Net Amortization of Acquired Above and Below Market Lease Revenue |
25,492 | 10,650 | 34,258 | 31,950 | 10,650 | |||||||
| less: Gain on Sale of Securities Transactions, net | -0- | (907,171) | (377,087) | (1,483,245) | (2,166,766) | |||||||
| EBITDA | $16,251,668 | $13,507,199 | $46,283,224 | $39,543,965 | $52,721,062 | |||||||
| Interest Expense | $4,805,681 | $4,170,104 | $13,429,179 | $12,230,617 | $16,104,678 | |||||||
| Preferred Dividends Paid | 2,151,758 | 2,151,758 | 6,455,274 | 6,455,274 | 8,607,032 | |||||||
| Total Fixed Charges | $6,957,439 | $6,321,862 | $19,884,453 | $18,685,891 | $24,711,710 | |||||||
| Interest Coverage | 3.4 x | 3.2 x | 3.4 x | 3.2 x | 3.3 x | |||||||
| Fixed Charge Coverage | 2.3 x | 2.1 x | 2.3 x | 2.1 x | 2.1 x | |||||||
| Net Debt | $416,116,367 | $262,351,167 | $416,116,367 | $262,351,167 | $292,521,345 | |||||||
| Net Debt Less Securities | 367,261,767 | 201,709,014 | 367,261,767 | 201,709,014 | 233,209,942 | |||||||
| Annualized EBITDA | 65,006,672 | 54,028,796 | 61,710,966 | 52,725,287 | 52,721,062 | |||||||
| Net Debt / EBITDA | 6.4 x | 4.9 x | 6.7 x | 5.0 x | 5.5 x | |||||||
| Net Debt Less Securities / EBITDA | 5.6 x | 3.7 x | 6.0 x | 3.8 x | 4.4 x | |||||||
| Net Debt + Preferred / EBITDA | 8.1 x | 6.9 x | 8.5 x | 7.1 x | 7.7 x | |||||||
| Net Debt Less Securities + Preferred / EBITDA | 7.4 x | 5.8 x | 7.7 x | 5.9 x | 6.5 x | |||||||
Third Quarter FY 2015 Supplemental of Monmouth Real Estate Investment Corp. Page 10 of 21
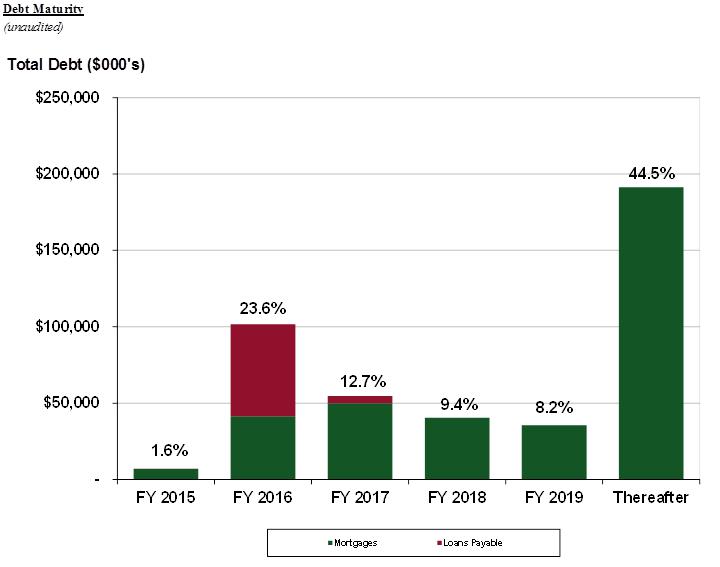
| Loans | % of | ||||||
| Fiscal Year Ended | Mortgages | Payable (1) | Total (1) | Total | |||
| 2015 | 6,818,165 | 60,514 | 6,878,679 | 1.6% | |||
| 2016 | 41,334,093 | 60,250,718 | (1) | 101,584,811 | 23.6% | ||
| 2017 | 49,815,025 | 4,790,660 | 54,605,685 | 12.7% | |||
| 2018 | 40,298,134 | -0- | 40,298,134 | 9.4% | |||
| 2019 | 35,357,757 | -0- | 35,357,757 | 8.2% | |||
| Thereafter | 191,443,080 | -0- | 191,443,080 | 44.5% | |||
| Total as of 6/30/15 | $365,066,254 | $65,101,892 | $430,168,146 | 100.0% | |||
Notes:
| (1) Includes a $60 million Line of Credit due June 2016, which has a one year extension option. |
Third Quarter FY 2015 Supplemental of Monmouth Real Estate Investment Corp. Page 11 of 21
(A) Does not include $776,916 of vacant land and corporate office leasehold improvements not associated with a specific tenant.
(B) NF&M International and Datatel Resources are located at one property and therefore are counted as one property in the Property Count total.
(C) Woodstream Corporation and Altec Industries, Inc. are located at one property and therefore are counted as one property in the Property Count total.
Third Quarter FY 2015 Supplemental of Monmouth Real Estate Investment Corp. Page 12 of 21
| (A) | Does not include $776,916 of vacant land and corporate office leasehold improvements not associated with a specific tenant. |
Third Quarter FY 2015 Supplemental of Monmouth Real Estate Investment Corp. Page 13 of 21
(A) Does not include $776,916 of vacant land and corporate office leasehold improvements not associated with a specific tenant.
(B) Included in 2016 is Datatel Resources and included in 2018 is NF&M International which both occupy one property. Included in 2017 is Woodstream Corporation and included in 2018 is
Altec Industries which both occupy one property.
Third Quarter FY 2015 Supplemental of Monmouth Real Estate Investment Corp. Page 14 of 21
Third Quarter FY 2015 Supplemental of Monmouth Real Estate Investment Corp. Page 15 of 21
Third Quarter FY 2015 Supplemental of Monmouth Real Estate Investment Corp. Page 16 of 21
| Property Table | ||||||||||||
| (unaudited) | Rent Per | Lease Exp. | ||||||||||
| Fiscal Year | Square | Annual | Sq. Ft. | Term in | Undepreciated | Mortgage | ||||||
| No | Tenant | City (MSA) | State | Acquisition | Occup. | Footage | Rent | Occup. | Years | Cost | Balance | |
| 52 | FedEx Corporation | Tampa | FL | 2006 | 100.0% | 95,662 | 603,000 | 6.30 | 2.3 | 7,565,717 | 4,188,527 | |
| 53 | FedEx Ground Package System, Inc. | Hanahan (Charleston) | SC | 2005 | 100.0% | 91,776 | 675,000 | 7.35 | 3.1 | 7,614,653 | 1,405,972 | |
| 54 | National Oilwell Varco, Inc. | Houston | TX | 2010 | 100.0% | 91,295 | 741,000 | 8.12 | 7.3 | 8,083,107 | 3,629,269 | |
| 55 | FedEx Corporation | Omaha | NE | 1999 | 100.0% | 89,115 | 446,000 | 5.00 | 8.3 | 5,929,890 | -0- | |
| 56 | Joseph T. Ryerson and Son, Inc. | Elgin (Chicago) | IL | 2002 | 100.0% | 89,052 | 506,000 | 5.68 | 1.6 | 6,926,956 | 963,165 | |
| 57 | FedEx Ground Package System, Inc. | Ft. Myers | FL | 2003 | 100.0% | 87,500 | 432,000 | 4.94 | 1.3 | 5,017,447 | -0- | |
| 58 | CHEP USA, Inc. | Roanoke | VA | 2007 | 100.0% | 83,000 | 473,000 | 5.70 | 9.7 | 7,467,055 | 2,891,930 | |
| 59 | FedEx Corporation | Bedford Heights (Cleveland) | OH | 2007 | 100.0% | 82,269 | 408,000 | 4.96 | 3.2 | 6,779,591 | 2,905,350 | |
| 60 | RGH Enterprises, Inc. | Halfmoon (Albany) | NY | 2012 | 100.0% | 75,000 | 590,000 | 7.87 | 6.4 | 5,525,600 | 3,910,286 | |
| 61 | FedEx Ground Package System, Inc. | Huntsville | AL | 2005 | 100.0% | 73,712 | 412,000 | 5.59 | 7.2 | 4,751,741 | 1,038,308 | |
| 62 | FedEx Corporation | Schaumburg (Chicago) | IL | 1997 | 100.0% | 73,500 | 515,000 | 7.01 | 1.8 | 4,967,639 | -0- | |
| 63 | FedEx Corporation | Romulus (Detroit) | MI | 1998 | 100.0% | 71,933 | 370,000 | 5.14 | 5.9 | 4,522,221 | 2,311,845 | |
| 64 | FedEx Ground Package System, Inc. | Denver | CO | 2005 | 100.0% | 69,865 | 564,000 | 8.07 | 3.1 | 6,354,051 | 1,425,198 | |
| 65 | Tampa Bay Grand Prix | Tampa | FL | 2005 | 100.0% | 68,385 | 285,000 | 4.17 | 5.3 | 5,651,066 | -0- | |
| 66 | FedEx Ground Package System, Inc. | Colorado Springs | CO | 2006 | 100.0% | 68,370 | 644,000 | 9.42 | 3.3 | 7,195,115 | 1,666,175 | |
| 67 | Sherwin-Williams Company | Rockford | IL | 2011 | 100.0% | 66,387 | 475,000 | 7.16 | 8.5 | 5,545,572 | -0- | |
| 68 | Kellogg Sales Company | Kansas City | MO | 2007 | 100.0% | 65,067 | 331,000 | 5.09 | 3.1 | 4,748,374 | 2,415,661 | |
| 69 | Various Tenants at Retail Shopping Center | Somerset | NJ | 1970 | 78.0% | 64,138 | 372,000 | 11.12 | 9.0 | 2,681,674 | -0- | |
| 70 | FedEx Corporation | Chattanooga | TN | 2007 | 100.0% | 60,637 | 311,000 | 5.13 | 2.3 | 4,971,161 | 1,828,394 | |
| 71 | SOFIVE, Inc. | Carlstadt (New York, NY) | NJ | 2001 | 100.0% | 60,400 | 512,000 | 8.48 | 9.6 | 4,889,712 | 2,080,689 | |
| 72 | FedEx Ground Package System, Inc. | Stewartsville (Rochester) | MN | 2013 | 100.0% | 60,398 | 372,000 | 6.16 | 7.9 | 5,220,000 | 2,903,745 | |
| 73 | United Technologies Corporation | Richmond | VA | 2004 | 100.0% | 60,000 | 312,000 | 5.20 | 0.9 | 4,760,769 | -0- | |
| 74 | Vacant | White Bear Lake (Minneapolis/St. Paul) | MN | 2001 | 0.0% | 59,425 | -0- | na | na | 5,157,127 | -0- | |
| 75 | FedEx Ground Package System, Inc. | Augusta | GA | 2005 | 100.0% | 59,358 | 477,000 | 8.04 | 3.0 | 5,328,874 | 1,022,709 | |
| 76 | Kellogg Sales Company | Newington (Hartford) | CT | 2001 | 100.0% | 54,812 | 329,000 | 6.00 | 1.7 | 3,463,824 | -0- | |
| 77 | Siemens Real Estate | Lebanon (Cincinnati) | OH | 2012 | 100.0% | 51,130 | 467,000 | 9.13 | 3.8 | 4,442,100 | 2,720,553 | |
| 78 | Kellogg Sales Company | Orangeburg (New York) | NY | 1993 | 100.0% | 50,400 | 331,000 | 6.57 | 2.7 | 3,895,675 | -0- | |
| 79 | FedEx Corporation | Charlottesville | VA | 1999 | 100.0% | 48,064 | 329,000 | 6.85 | 2.2 | 4,344,037 | -0- | |
| 80 | The American Bottling Company | Tulsa | OK | 2014 | 100.0% | 46,240 | 255,000 | 5.51 | 8.7 | 3,720,518 | 2,078,563 | |
| 81 | FedEx Ground Package System, Inc. | Corpus Christi | TX | 2012 | 100.0% | 46,253 | 458,000 | 9.90 | 6.2 | 4,764,500 | 2,507,246 | |
| 82 | The Coca-Cola Company | Topeka | KS | 2009 | 100.0% | 40,000 | 332,000 | 8.30 | 6.3 | 3,679,843 | 1,645,653 | |
| 83 | B/E Aerospace, Inc. | Rockford | IL | 2015 | 100.0% | 38,833 | 359,000 | 9.24 | 12.0 | 5,100,000 | -0- | |
| 84 | Keystone Automotive Industries MN, Inc. | Urbandale (Des Moines) | IA | 1994 | 100.0% | 36,270 | 139,000 | 3.83 | 1.8 | 2,161,895 | -0- | |
| 85 | FedEx Corporation | Richland (Jackson) | MS | 1994 | 100.0% | 36,000 | 120,000 | 3.33 | 8.8 | 1,900,691 | -0- | |
| 86 | FedEx Corporation | Punta Gorda | FL | 2007 | 100.0% | 34,624 | 304,000 | 8.78 | 2.0 | 4,104,915 | 2,140,264 | |
| 87 | FedEx Corporation | Lakeland | FL | 2006 | 100.0% | 32,105 | 155,000 | 4.83 | 2.4 | 1,966,211 | -0- | |
| 88 | FedEx Corporation | Augusta | GA | 2006 | 100.0% | 30,184 | 121,000 | 4.01 | 7.4 | 1,940,182 | -0- | |
| 89 | Graybar Electric Company | Ridgeland (Jackson) | MS | 1993 | 100.0% | 26,340 | 109,000 | 4.14 | 4.1 | 1,850,794 | -0- | |
| 90 | Sherwin-Williams Company | Burr Ridge (Chicago) | IL | 1997 | 100.0% | 12,500 | 160,000 | 12.80 | 6.3 | 1,684,201 | -0- | |
| Total as of 6/30/15 | 97.6% | 13,623,971 | $71,364,000 | $5.38 | 7.1 | (A) $902,554,588 | $365,066,254 | |||||
(A) Does not include $776,916 of vacant land and corporate office leasehold improvements not associated with a specific tenant.
(B) Both tenants occupy one property.
(C) Both tenants occupy one property.
Third Quarter FY 2015 Supplemental of Monmouth Real Estate Investment Corp. Page 17 of 21

Third Quarter FY 2015 Supplemental of Monmouth Real Estate Investment Corp. Page 18 of 21
FOR IMMEDIATE RELEASE August 5, 2015
Contact: Susan Jordan
732-577-9996
MONMOUTH REAL ESTATE INVESTMENT CORPORATION
REPORTS RESULTS FOR THE THIRD QUARTER ENDED JUNE 30, 2015
FREEHOLD, NJ, August 5, 2015........ Monmouth Real Estate Investment Corporation (NYSE: MNR) reported Core Funds from Operations (Core FFO) of $9,044,000 or $0.15 per diluted share for the three months ended June 30, 2015 as compared to $7,895,000 or $0.16 per diluted share for the three months ended June 30, 2014. Adjusted Funds from Operations (AFFO), for the three months ended June 30, 2015 was $8,884,000 or $0.15 per diluted share versus $5,934,000 or $0.12 per diluted share for the three months ended June 30, 2014.
A summary of significant financial information for the three and nine months ended June 30, 2015 and 2014 is as follows:
|
Three Months Ended June 30, | ||||
| 2015 | 2014 | |||
| Rental Revenue | $ | 17,256,000 | $ | 13,384,000 |
| Reimbursement Revenue | $ | 3,416,000 | $ | 2,356,000 |
| Lease Termination Income | $ | -0- | $ | 1,183,000 |
| Net Operating Income (NOI) (1) | $ | 16,960,000 | $ | 12,877,000 |
| Total Expenses | $ | 11,351,000 | $ | 8,811,000 |
| Interest and Dividend Income | $ | 873,000 | $ | 942,000 |
| Gain on Sale of Securities Transactions, net | $ | -0- | $ | 907,000 |
| Net Income | $ | 5,176,000 | $ | 5,594,000 |
| Net Income Attributable to Common Shareholders | $ | 3,024,000 | $ | 3,442,000 |
| Net Income Attributable to Common Shareholders Per Diluted Common Share | $ | 0.05 | $ | 0.07 |
| Core FFO (1) | $ | 9,044,000 | $ | 7,895,000 |
| Core FFO per Diluted Common Share (1) | $ | 0.15 | $ | 0.16 |
| AFFO (1) | $ | 8,884,000 | $ | 5,934,000 |
| AFFO per Diluted Common Share (1) | $ | 0.15 | $ | 0.12 |
| Weighted Avg. Diluted Common Shares Outstanding | 59,638,000 | 50,760,000 | ||
|
Nine Months Ended June 30, | ||||
| 2015 | 2014 | |||
| Rental Revenue | $ | 48,892,000 | $ | 41,039,000 |
| Reimbursement Revenue | $ | 8,317,000 | $ | 6,707,000 |
| Lease Termination Income | $ | 239,000 | $ | 1,183,000 |
| Net Operating Income (NOI) (1) | $ | 47,554,000 | $ | 39,406,000 |
| Total Expenses | $ | 31,240,000 | $ | 25,883,000 |
| Interest and Dividend Income | $ | 2,871,000 | $ | 2,877,000 |
| Gain on Sale of Securities Transactions, net | $ | 377,000 | $ | 1,483,000 |
| Net Income | $ | 15,418,000 | $ | 14,641,000 |
| Net Income Attributable to Common Shareholders | $ | 8,963,000 | $ | 8,186,000 |
| Net Income Attributable to Common Shareholders Per Diluted Common Share | $ | 0.15 | $ | 0.17 |
| Core FFO (1) | $ | 26,096,000 | $ | 21,806,000 |
| Core FFO per Diluted Common Share (1) | $ | 0.45 | $ | 0.46 |
| AFFO (1) | $ | 24,818,000 | $ | 19,112,000 |
| AFFO per Diluted Common Share (1) | $ | 0.42 | $ | 0.40 |
| Weighted Avg. Diluted Common Shares Outstanding | 58,504,000 | 47,634,000 | ||
A summary of significant balance sheet information as of June 30, 2015 and September 30, 2014 is as follows:
| June 30, 2015 | September 30, 2014 | |||
| Net Real Estate Investments | $ | 781,958,000 | $ | 636,923,000 |
| Securities Available for Sale at Fair Value | $ | 48,855,000 | $ | 59,311,000 |
| Total Assets | $ | 876,511,000 | $ | 743,757,000 |
| Mortgage Notes Payable | $ | 365,066,000 | $ | 287,796,000 |
| Loans Payable | $ | 65,102,000 | $ | 25,200,000 |
| Total Shareholders’ Equity | $ | 435,188,000 | $ | 420,631,000 |
Third Quarter FY 2015 Supplemental of Monmouth Real Estate Investment Corp. Page 19 of 21
Michael P. Landy, President and CEO, commented on the results for the third quarter of fiscal 2015,
“The recent quarter represented significant progress across multiple fronts:
| · | Increased AFFO per diluted share 25% year over year, to $0.15 for the current quarter. We anticipate continued growth in per share AFFO as we continue to expand our portfolio with high quality properties. |
| · | Increased Same Property NOI 7.8% on a U.S. GAAP basis and 5.6% on a cash basis. |
| · | Achieved 100% tenant retention rate on six leases for 780,000 square feet due to expire in fiscal 2015. These renewals resulted in a 6.3% increase in rents on a GAAP basis and an increase of 1.0% on a cash basis. The weighted average lease term for these six renewals was 3.8 years. |
| · | Acquired one brand new Class A built-to-suit property. This acquisition was 671,000 square feet, and was purchased at a cost of $37.5 million. This brings our total acquisitions for fiscal 2015 to 2.4 million square feet representing a 22% increase in our gross leasable area over the nine month period. Our current 13.6 million total square feet represents a 27% increase over the prior year period. |
| · | Entered into agreements to acquire eleven new Class A build-to-suit industrial properties, representing approximately 2.7 million square feet, for a total purchase price of approximately $290.7 million. In keeping with our business model, these high-quality properties are leased to investment grade tenants pursuant to long-term, net-leases and are strategically situated at major airports, major transportation hubs, and manufacturing plants that are integral to our tenants’ operations. These new properties are expected to generate annualized rental revenue of approximately $19.4 million and will benefit from an average lease term of approximately 13.4 years. Subject to satisfactory due diligence, we anticipate closing these transactions upon completion of construction and occupancy over the next several quarters. |
| · | Completed two expansion projects for approximately $5.8 million, consisting of one building expansion of 38,428 square feet and one parking lot expansion. These expansions result in an annual rent increase of $633,000 and a new ten year lease on the building expansion. We are currently working on two expansion projects, consisting of one building expansion of 48,116 square feet and one parking lot expansion. Expansion costs are expected to be $4.4 million. Upon completion these expansions will result in an annual rent increase of $447,000 and a new ten year lease for each property being expanded. |
| · | Increased our end of period occupancy to 97.6% as compared to 94.3% in the prior year period. Our weighted average lease maturity at quarter end was 7.1 years as compared with 6.8 years in the prior year period. |
Our 97.6% occupancy rate reflects the high caliber of our properties and our strong tenant base. We have already locked-in over $127 million in 15 year, fully self-amortizing financing, at a weighted average fixed interest rate of 3.77% to fund 64%, or six of the eleven future acquisitions in our pipeline. This very favorable financing, coupled with our strong balance sheet, provides us with excellent growth capacity. We look forward to building on the substantial growth that we have achieved to date by adding high quality properties and tenants to our portfolio while enhancing returns for our shareholders.”
Monmouth Real Estate Investment Corporation will host its Third Quarter 2015 Financial Results Webcast and Conference Call on Thursday, August 6, 2015 at 10:00 a.m. Eastern Time. Senior management will discuss the results, current market conditions and future outlook.
The Company’s Third Quarter 2015 financial results being released herein will be available on the Company’s website at www.mreic.com in the “Financial Filings” section.
To participate in the Webcast, select the microphone icon in the Webcast section of the Company’s homepage on the Company’s website at www.mreic.com. Interested parties can also participate via conference call by calling toll free 877-510-5852 (domestically) or 412-902-4138 (internationally).
The replay of the conference call will be available at 12:00 p.m. Eastern Time on Thursday, August 6, 2015. It will be available until November 30, 2015, and can be accessed by dialing toll free 877-344-7529 (domestically) and 412-317-0088 (internationally) and entering the passcode 10066693. A transcript of the call and the webcast replay will be available at the Company’s website, www.mreic.com.
Monmouth Real Estate Investment Corporation, founded in 1968 and one of the oldest public equity REITs in the U.S., specializes in net-leased industrial properties subject to long-term leases primarily to investment grade tenants. The Company is a fully integrated and self-managed real estate company, whose property portfolio consists of ninety properties located in twenty-eight states, containing a total of approximately 13.6 million rentable square feet. In addition, the Company owns a portfolio of REIT securities.
Third Quarter FY 2015 Supplemental of Monmouth Real Estate Investment Corp. Page 20 of 21
Certain statements included in this press release which are not historical facts may be deemed forward-looking statements within the meaning of the Private Securities Litigation Reform Act of 1995. Any such forward-looking statements are based on the Company’s current expectations and involve various risks and uncertainties. Although the Company believes the expectations reflected in any forward-looking statements are based on reasonable assumptions, the Company can provide no assurance those expectations will be achieved. The risks and uncertainties that could cause actual results or events to differ materially from expectations are contained in the Company’s annual report on Form 10-K and described from time to time in the Company’s other filings with the SEC. The Company undertakes no obligation to publicly update or revise any forward-looking statements whether as a result of new information, future events, or otherwise.
Notes:
(1) Non-U.S. GAAP Information: FFO is defined by the National Association of Real Estate Investment Trusts ("NAREIT") as net income applicable to common shareholders, excluding gains or losses from sales of depreciable assets, plus real estate-related depreciation and amortization. We define Core FFO as FFO plus acquisition costs. We define AFFO as Core FFO excluding lease termination income, gains or losses on securities transactions, stock based compensation expense, depreciation of corporate office tenant improvements, amortization of deferred financing costs, U.S. GAAP straight-line rent adjustments and less recurring capital expenditures. We define recurring capital expenditures as all capital expenditures, excluding capital expenditures related to expansions at our current locations or capital expenditures that are incurred in conjunction with obtaining a new lease or a lease renewal. We define NOI as recurring rental and reimbursement revenues less real estate and other operating expenses. FFO, Core FFO and AFFO per diluted common share are defined as FFO, Core FFO and AFFO divided by weighted average diluted common shares outstanding. FFO, Core FFO and AFFO per diluted common share, as well as NOI, should be considered as supplemental measures of operating performance used by real estate investment trusts (REITs). FFO, Core FFO and AFFO per diluted common share exclude historical cost depreciation as an expense and may facilitate the comparison of REITs which have different cost basis. The items excluded from FFO, Core FFO and AFFO per diluted common share are significant components in understanding the Company’s financial performance.
FFO, Core FFO and AFFO per diluted common share (A) do not represent cash flow from operations as defined by accounting principles generally accepted in the United States of America; (B) should not be considered as an alternative to net income as a measure of operating performance or to cash flows from operating, investing and financing activities; and (C) are not alternatives to cash flow as a measure of liquidity. FFO, Core FFO and AFFO per diluted common share, as well as NOI, as calculated by the Company, may not be comparable to similarly titled measures reported by other REITs.
The following is a reconciliation of the Company’s U.S. GAAP Net Income to the Company’s FFO, Core FFO and AFFO for the three and nine months ended June 30, 2015 and 2014:
| Three Months Ended | Nine Months Ended | ||||||
| 6/30/2015 | 6/30/2014 | 6/30/2015 | 6/30/2014 | ||||
| Net Income Attributable to Common Shareholders | $3,024,000 | $3,442,000 | $8,963,000 | $8,186,000 | |||
| Plus: Depreciation Expense | 5,061,000 | 3,991,000 | 14,298,000 | 11,779,000 | |||
| Plus: Amortization of Intangible Assets | 330,000 | 338,000 | 1,041,000 | 1,010,000 | |||
| Plus: Amortization of Capitalized Lease Costs (*) | 188,000 | 124,000 | 491,000 | 368,000 | |||
| FFO Attributable to Common Shareholders | 8,603,000 | 7,895,000 | 24,793,000 | 21,343,000 | |||
| Plus: Acquisition Costs | 441,000 | -0- | 1,303,000 | 463,000 | |||
| Core FFO Attributable to Common Shareholders | 9,044,000 | 7,895,000 | 26,096,000 | 21,806,000 | |||
| Less: Lease Termination Income | -0- | (1,183,000) | (239,000) | (1,183,000) | |||
| Less: Gain on Sale of Securities Transactions, net | -0- | (907,000) | (377,000) | (1,483,000) | |||
| Plus: Stock Compensation Expense | 97,000 | 85,000 | 284,000 | 257,000 | |||
| Plus: Depreciation of Corporate Office Tenant Improvements | 38,000 | -0- | 71,000 | -0- | |||
| Plus: Amortization of Financing Costs | 212,000 | 198,000 | 608,000 | 535,000 | |||
| Less: U.S. GAAP Straight-line Rent Adjustment | (301,000) | 65,000 | (1,164,000) | (309,000) | |||
| Less: Recurring Capital Expenditures | (206,000) | (219,000) | (461,000) | (511,000) | |||
| AFFO Attributable to Common Shareholders | $8,884,000 | $5,934,000 | $24,818,000 | $19,112,000 | |||
* In previous press releases, the Company has presented its calculation of FFO and Core FFO without excluding the effects of the amortization of Capitalized Lease Costs. FFO and Core FFO for the three and nine months ended June 30, 2015 and 2014 has been presented above reflecting the effects of excluding the amortization of Capitalized Lease Costs.
The following are the Cash Flows provided (used) by Operating, Investing and Financing Activities for the nine months ended June 30, 2015 and 2014:
| Nine Months Ended | |||
| 6/30/2015 | 6/30/2014 | ||
| Operating Activities | $28,282,000 | $28,866,000 | |
| Investing Activities | (151,750,000) | (101,146,000) | |
| Financing Activities | 117,045,000 | 102,591,000 | |
# # # # #
Third Quarter FY 2015 Supplemental of Monmouth Real Estate Investment Corp. Page 21 of 21