
Form 8-K POLARIS INDUSTRIES INC/M For: Jul 22
UNITED STATES
SECURITIES
AND EXCHANGE COMMISSION
Washington,
D.C. 20549
FORM
8-K
CURRENT
REPORT
Pursuant
to Section 13 OR 15(d) of the Securities Exchange Act of 1934
Date
of Report (Date of earliest event reported): July 22, 2015
POLARIS INDUSTRIES INC.
(Exact
name of Registrant as specified in its charter)
|
Minnesota |
1-11411 |
41-1790959 |
|
(State of Incorporation) |
(Commission File Number) |
(I.R.S. Employer Identification No.) |
2100 Highway 55
Medina, Minnesota 55340
(Address of
principal executive offices)
(Zip Code)
(763) 542-0500
(Registrant’s
telephone number, including area code)
Check the appropriate box below if the Form 8-K filing is intended to simultaneously satisfy the filing obligation of the registrant under any of the following provisions:
⃞ Written communications pursuant to Rule 425 under the Securities Act (17 CFR 230.425)
⃞ Soliciting material pursuant to Rule 14a-12 under the Exchange Act (17 CFR 240.14a-12)
⃞ Pre-commencement communications pursuant to Rule 14d-2(b) under the Exchange Act (17 CFR 240.14d-2(b))
⃞ Pre-commencement communications pursuant to Rule 13e-4(c) under the Exchange Act (17 CFR 240.13e-4(c))
Item 2.02 Results of Operations and Financial Condition.
On July 22, 2015, Polaris Industries Inc. (the “Company”) issued a press release announcing the Company’s second quarter 2015 financial results for the reporting period ended June 30, 2015. On July 22, 2015, the Company also hosted its quarterly earnings conference call, which was accessible to the public. A recording of the conference call will be available through the end of the business day on August 5, 2015 by dialing 855-859-2056 in the U.S. and Canada, or 404-537-3406 for international calls and entering passcode 61988068, and on the Company’s website, http://ir.polaris.com.
A copy of the Company’s press release is furnished as Exhibit 99.1 attached hereto and a copy of the presentation materials discussed during the conference call is being furnished as Exhibit 99.2 to this Current Report on Form 8-K.
Item 7.01 Regulation FD Disclosure.
The disclosures set forth in Item 2.02 above are hereby incorporated by reference into this Item 7.01.
Item 9.01 Financial Statements and Exhibits.
(d) Exhibits.
| 99.1 | Press Release dated July 22, 2015 of Polaris Industries Inc. | |
| 99.2 | Presentation materials dated July 22, 2015 of Polaris Industries Inc. |
The information contained in this Current Report is furnished and not deemed to be filed for purposes of Section 18 of the Securities and Exchange Act of 1934, as amended, or otherwise subject to the liabilities of that section. The information in this Current Report shall not be incorporated by reference into any filing or other document pursuant to the Securities Act of 1933, as amended, except as shall be expressly set forth by specific reference in such filing or document.
SIGNATURES
Pursuant to
the requirements of the Securities Exchange Act of 1934, the registrant
has duly caused this report to be signed on its behalf by the
undersigned thereunto duly authorized.
| Date: |
July 22, 2015 |
|
| POLARIS INDUSTRIES INC. | ||
|
/s/ Michael W. Malone |
||
|
Michael W. Malone |
||
|
Vice President – Finance and |
||
|
Chief Financial Officer of Polaris Industries Inc. |
EXHIBIT INDEX
|
Exhibit Number |
Description |
|
|
99.1 |
Press Release dated July 22, 2015 of Polaris Industries Inc. |
|
|
99.2 |
Presentation materials dated July 22, 2015 of Polaris Industries Inc. |
Exhibit 99.1
Polaris Reports Record Second Quarter 2015 Results
Sales, Net Income and Earnings per Diluted Share Increased Year-over-Year
Second Quarter Highlights:
- Sales increased 11% year-over-year to a record $1,124.3 million
- North American retail sales increased 11% year-over-year
- Net income increased 4% to $100.9 million. Gross profit margin declined 166 basis points due to currency impacts and incremental manufacturing costs of $9 million related to motorcycle paint constraints
- Motorcycle demand remained strong throughout the second quarter
- Maintaining and narrowing full year 2015 earnings guidance range to $7.32 to $7.42 per diluted share, an increase of 10% to 12% year-over-year based on full year 2015 sales growth guidance of 10% to 12%
MINNEAPOLIS--(BUSINESS WIRE)--July 22, 2015--Polaris Industries Inc. (NYSE: PII) today reported record second quarter net income of $100.9 million for the quarter ended June 30, 2015, an increase of four percent from the prior year’s second quarter net income of $96.9 million. Earnings per share were a record $1.49 per diluted share for the second quarter of 2015 compared to $1.42 per diluted share for the second quarter of 2014. Second quarter results included additional manufacturing costs and inefficiencies approximating $9.0 million, as the Company worked to scale-up production and add capacity to the paint system at the Company’s motorcycle facility in Spirit Lake, Iowa. Sales for the second quarter 2015 totaled a record $1,124.3 million, an increase of 11 percent over last year’s second quarter sales of $1,014.0 million.
“In addition to reporting record second quarter sales and earnings, there are numerous positive undertones to our results this quarter. Motorcycle demand, notably including Slingshot, remains exceptionally high. Our Asia Pacific/Latin America business continues to grow and we are encouraged by the favorable response to the Multix™ launch in India last month. Between ongoing improvements in our inventory management systems and North American retail sales growing 11 percent, dealer inventory growth moderately decelerated in the second quarter,” stated Scott Wine, Polaris’ Chairman and Chief Executive Officer. “However, earnings were dampened by significant cost pressures, and delayed shipments, related to continued difficulties with our new motorcycle paint system in Spirit Lake, Iowa. We pulled out all the stops to increase throughput in an effort to meet the growing demand for our Indian, Victory and Slingshot customers, accepting the substantial costs commensurate with that push. Although production still cannot keep pace with demand, we are confident in our plans to further increase our motorcycle throughput in the second half of the year, and as such, are maintaining and narrowing full year guidance for sales and earnings per share.”
Wine continued, “Innovation remains a cornerstone of Polaris’ success, and at our dealer show next week we will introduce our model year 2016 powersports lineup that will further extend our market leadership. In spite of the short-term headwinds we are facing, both external and of our own making, I am confident this strong and talented Polaris team can continue to deliver industry-leading returns for our shareholders.”
2015 Business Outlook
For the full year 2015, the Company is narrowing its earnings guidance range to $7.32 to $7.42 per diluted share, an increase of 10 to 12 percent over full year 2014 earnings of $6.65 per diluted share. Full year 2015 sales are now expected to grow in the range of 10 to 12 percent when compared to 2014, narrowed slightly from previously issued sales guidance.
|
Second Quarter Performance Summary (in thousands except per share data) |
|||||||||||||||||||||||
|
Three Months ended June 30, |
Six Months ended June 30, |
||||||||||||||||||||||
|
Sales Components |
2015 |
2014 |
Change |
2015 |
2014 |
Change |
|||||||||||||||||
| Off-Road Vehicles | $ | 688,761 | $ | 676,641 | 2 | % | $ | 1,334,174 | $ | 1,256,754 | 6 | % | |||||||||||
| Snowmobiles | 19,344 | 6,141 | 215 | % | 33,840 | 21,727 | 56 | % | |||||||||||||||
| Motorcycles | 162,122 | 103,128 | 57 | % | 299,539 | 181,995 | 65 | % | |||||||||||||||
| Global Adjacent Markets | 66,559 | 68,347 | -3 | % | 131,956 | 129,560 | 2 | % | |||||||||||||||
| Parts, Garments & Accessories | 187,541 | 159,702 | 17 | % | 358,163 | 312,269 | 15 | % | |||||||||||||||
| Total Sales | $ | 1,124,327 | $ | 1,013,959 | 11 | % | $ | 2,157,672 | $ | 1,902,305 | 13 | % | |||||||||||
| Gross Profit | $ | 319,414 | $ | 304,914 | 5 | % | $ | 613,145 | $ | 563,331 | 9 | % | |||||||||||
| Gross profit as a % of sales | 28.4 | % | 30.1 | % | -166 bps | 28.4 | % | 29.6 | % | -119 bps | |||||||||||||
| Operating Expenses | $ | 173,035 | $ | 164,104 | 5 | % | $ | 331,122 | $ | 306,479 | 8 | % | |||||||||||
| Operating expenses as a % of sales | 15.4 | % | 16.2 | % | -79 bps | 15.3 | % | 16.1 | % | -76 bps | |||||||||||||
| Operating Income | $ | 164,017 | $ | 155,435 | 6 | % | $ | 314,303 | $ | 282,117 | 11 | % | |||||||||||
| Operating Income as a % of sales | 14.6 | % | 15.3 | % | -74 bps | 14.6 | % | 14.8 | % | -26 bps | |||||||||||||
| Net Income | $ | 100,943 | $ | 96,905 | 4 | % | $ | 189,506 | $ | 177,806 | 7 | % | |||||||||||
| Net income as a % of sales | 9.0 | % | 9.6 | % | -58 bps | 8.8 | % | 9.3 | % | -57 bps | |||||||||||||
| Diluted Net Income per share | $ | 1.49 | $ | 1.42 | 5 | % | $ | 2.79 | $ | 2.61 | 7 | % | |||||||||||
Off-Road Vehicle (“ORV”) sales increased two percent to $688.8 million in the second quarter of 2015 compared to the second quarter of 2014. This increase reflects a combination of ongoing strong customer demand in North America for ORVs, offset by a planned deceleration of shipment growth to improve dealer inventory mix. Polaris North American ORV unit retail sales increased mid-single digits percent from the second quarter last year, with consumer purchases of side-by-side vehicles increasing high-single digits percent and ATV’s increasing mid-single digits percent. Consumer awareness of the Sportsman ACE™ category also continued to build during the quarter. The Company estimates North American industry ORV retail sales in the second quarter of 2015 increased mid-single-digits percent year-over-year, resulting in a modest market share gain for Polaris. Polaris North American ORV dealer inventories during the second quarter of 2015 increased mid-teens percent year-over-year and, as anticipated, the rate of increase improved sequentially from the first quarter of 2015.
Snowmobile sales increased 215 percent to $19.3 million for the second quarter of 2015 compared to $6.1 million for the second quarter of 2014. Snowmobile sales in the Company’s second quarter are historically low as they reflect the off-season for snowmobile retail sales and shipments. The increase in shipments during the second quarter of 2015 is related to the timing of snowmobile production and a higher mix of Polaris’s new premium snowmobiles with the Axys® chassis being shipped to dealers ahead of the upcoming snowmobile retail selling season.
Motorcycle sales increased 57 percent to $162.1 million for the second quarter of 2015 compared to same period last year due to continued strong demand for Indian motorcycles and the new Slingshot® roadster. Victory, Indian Motorcycle and Slingshot North American retail sales increased over 80 percent during the second quarter of 2015 driven by Indian Motorcycle and Slingshot retail sales, while North American industry midsize and heavyweight motorcycle retail sales were flat with the second quarter of 2014. Demand for the Indian Scout®, Roadmaster® and the new Indian Dark Horse® drove an over 100 percent increase in retail sales for Indian Motorcycle during the quarter. Victory retail sales in the second quarter of 2015 were lower than the prior year largely due to poor product availability of the new Victory Magnum® and Magnum X-1®, a result of the paint capacity constraints in the Spirit Lake facility. Slingshot retail sales continued to perform well ahead of expectations as consumer appeal for the new 3-wheeled roadster remained high. Polaris has increased production to meet the ongoing strong consumer demand for Slingshot.
Global Adjacent Markets sales decreased three percent to $66.6 million in the second quarter of 2015 compared to the same period last year. The Work and Transportation (“W&T”) group sales decreased during the second quarter of 2015 with higher unit shipments more than offset by negative currency impacts. The Company’s defense business experienced low-single digit percent sales growth year-over-year during the second quarter of 2015.
Parts, Garments, and Accessories (“PG&A”) sales increased 17 percent to $187.5 million during the second quarter of 2015 as compared to the same period last year. All product lines experienced double digits percent sales growth during the quarter.
International sales to customers outside of North America totaled $162.9 million for the second quarter of 2015, down four percent from the same period in 2014 driven by weak currencies. The EMEA regions’ sales declined 12 percent in the 2015 second quarter, partially offset by a 32 percent increase in Latin American sales and a 15 percent increase in sales in the Asia/Pacific region. International sales by component in the second quarter compared to last year were as follows: ORV sales were down 13 percent; motorcycles sales were up 41 percent; Global Adjacent Markets declined 16 percent; and PG&A sales increased four percent. Snowmobile sales to customers outside of North America were insignificant in the second quarter of 2015.
Gross profit increased five percent to $319.4 million in the second quarter of 2015, compared to $304.9 million in the second quarter of 2014. As a percentage of sales, gross profit margin declined 166 basis points to 28.4 percent of sales for the second quarter of 2015, compared to 30.1 percent of sales for the same period last year. As expected, currency movements from a year ago, primarily the Canadian dollar, along with higher sales promotion costs negatively impacted gross margins during the second quarter of 2015. However, gross margins were further pressured by approximately $9.0 million of incremental costs associated with the Company’s efforts to correct manufacturing inefficiencies and add capacity to the paint system at the Spirit Lake motorcycle facility. These increased costs were partially offset by lower product costs and lower commodity costs.
Operating expenses grew five percent to $173.0 million or 15.4 percent of sales for second quarter of 2015, compared to $164.1 million or 16.2 percent of sales for the second quarter of 2014. Ongoing research and development investments and higher long-term incentive compensation expenses were largely offset by operating expense leverage from prior year’s infrastructure investments.
Income from financial services was $17.6 million during second quarter 2015, an increase of 21 percent compared to $14.6 million in the second quarter of 2014 due to higher income from increased profitability of the retail credit portfolio as well as higher income from Polaris Acceptance’s dealer inventory financing.
Equity in loss of affiliates was $1.7 million for the second quarter 2015 compared to $1.0 million last year, which represents the Company’s portion of the start-up costs related to the Polaris/Eicher joint venture in India.
Non-operating other expense (income) net, which primarily relates to foreign currency exchange rate movements and the corresponding effects on foreign currency transactions related to the Company’s foreign subsidiaries, was $2.7 million of expense in the second quarter of 2015 compared to $1.9 million of income in the second quarter of 2014.
The provision for income taxes for the second quarter of 2015 was $55.7 million or 35.5 percent of pretax income compared to $56.4 million or 36.8 percent of pretax income for the second quarter of 2014. The lower income tax rate for the 2015 second quarter is primarily due to unfavorable outcomes of foreign income tax audits impacting the income tax rate in the second quarter of 2014.
Financial Position and Cash Flow
Net cash provided by operating activities was $89.9 million for the year-to-date period ended June 30, 2015 compared to $130.9 million for the same period in 2014. The decline in net cash provided by operating activities was the result of increased working capital requirements primarily from decreased accounts payables. The Company repurchased approximately 1.1 million shares of Polaris stock for $157.7 million during the first half of 2015. Total debt, including capital lease obligations and notes payable, at the end of the second quarter of 2015 was $403.5 million. The Company’s debt-to-total capital ratio was 31 percent at June 30, 2015, compared to 35 percent a year ago. Cash and cash equivalents were $118.8 million at June 30, 2015, similar to the same period in 2014.
Conference Call and Webcast Presentation
Today at 8:00 AM (CDT) Polaris Industries Inc. will host a conference call and webcast to discuss Polaris’ 2015 second quarter earnings results released this morning. The call will be hosted by Scott Wine, Chairman and CEO, Bennett Morgan, President and COO, and Mike Malone, Vice President – Finance and CFO. A slide presentation and link to the webcast will be posted on the Polaris Investor Relations website at http://ir.polaris.com.
To listen to the conference call by phone, dial 877-706-7543 in the U.S. and Canada, or 973-200-3967 internationally. The Conference ID is # 61988068.
A replay of the conference call will be available approximately two hours after the call for a one-week period by accessing the same link on our website, or by dialing 855-859-2056 in the U.S. and Canada, or 404-537-3406 internationally.
Polaris Industries Inc. to Host and Webcast Analyst & Investor Meeting
Polaris Industries Inc. also announced today that the executive management team of Polaris will host an Analyst/Investor Meeting in Las Vegas, Nevada in conjunction with its annual dealer meeting. The meeting will be held on Tuesday, July 28, 2015 from 8:00 AM to 12:00 PM pacific time. Management will be discussing its future strategy to drive growth and profitability, including a first look at several exciting new model year 2016 Polaris products.
Presenters at the Analyst/Investor meeting will include Scott Wine, Chairman and CEO; Bennett Morgan, President and COO and Ken Pucel, EVP Operations, Engineering and Lean along with other members of the Polaris executive team. The meeting agenda will be posted on the Polaris Investor Relations website at http://ir.polaris.com on the Events & Presentations page.
A live webcast of the meeting including audio and a slide presentation will be available by accessing the Polaris Investor Relations website at http://ir.polaris.com. A replay of the webcast will be available for one week following the event and will be accessible on the same website link.
For more information about the Analyst/Investor Meeting, please contact Peggy James at 763-542-0502.
About Polaris
Polaris is a recognized leader in the powersports industry with annual 2014 sales of $4.5 billion. Polaris designs, engineers, manufactures and markets innovative, high quality off-road consumer and military vehicles, including all-terrain vehicles (ATVs) and the Polaris RANGER® and RZR® side-by-side vehicles, snowmobiles, motorcycles and on-road electric/hybrid powered vehicles.
Polaris is among the global sales leaders for both snowmobiles and off-road vehicles and has established a presence in the heavyweight cruiser and touring motorcycle market with the Victory® and Indian Motorcycle® and Slingshot® brands. Additionally, Polaris continues to invest in the global Work and Transportation vehicle industry with Global Electric Motorcars (GEM), Goupil Industrie SA, Aixam Mega S.A.S., and internally developed vehicles. Polaris enhances the riding experience with a complete line of Polaris Engineered Parts, Accessories and Apparel, Klim branded apparel and ORV accessories under the Kolpin®, Cycle Country® and Pro Armor® brands.
Polaris Industries Inc. trades on the New York Stock Exchange under the symbol “PII”, and the Company is included in the S&P Mid-Cap 400 stock price index.
Information about the complete line of Polaris products, apparel and vehicle accessories are available from authorized Polaris dealers or anytime at www.polaris.com.
Except for historical information contained herein, the matters set forth in this news release, including management’s expectations regarding 2015 sales, shipments, net income, and net income per share are forward-looking statements that involve certain risks and uncertainties that could cause actual results to differ materially from those forward-looking statements. Potential risks and uncertainties include such factors as the Company’s ability to successfully implement its manufacturing operations expansion initiatives, product offerings, promotional activities and pricing strategies by competitors; acquisition integration costs; warranty expenses; impact of changes in Polaris stock price on incentive compensation plan costs; foreign currency exchange rate fluctuations; environmental and product safety regulatory activity; effects of weather; commodity costs; uninsured product liability claims; uncertainty in the retail and wholesale credit markets; performance of affiliate partners; changes in tax policy and overall economic conditions, including inflation, consumer confidence and spending and relationships with dealers and suppliers. Investors are also directed to consider other risks and uncertainties discussed in documents filed by the Company with the Securities and Exchange Commission. The Company does not undertake any duty to any person to provide updates to its forward-looking statements.
(summarized financial data follows)
| POLARIS INDUSTRIES INC. | ||||||||||||||||
| CONSOLIDATED STATEMENTS OF INCOME | ||||||||||||||||
| (In Thousands, Except Per Share Data) | ||||||||||||||||
| (Unaudited) | ||||||||||||||||
| Three months ended June 30, | Six months ended June 30, | |||||||||||||||
| 2015 | 2014 | 2015 | 2014 | |||||||||||||
| Sales | $ | 1,124,327 | $ | 1,013,959 | $ | 2,157,672 | $ | 1,902,305 | ||||||||
| Cost of sales | 804,913 | 709,045 | 1,544,527 | 1,338,974 | ||||||||||||
| Gross profit | 319,414 | 304,914 | 613,145 | 563,331 | ||||||||||||
| Operating expenses: | ||||||||||||||||
| Selling and marketing | 79,656 | 74,178 | 149,341 | 139,748 | ||||||||||||
| Research and development | 41,431 | 36,984 | 80,294 | 72,497 | ||||||||||||
| General and administrative | 51,948 | 52,942 | 101,487 | 94,234 | ||||||||||||
| Total operating expenses | 173,035 | 164,104 | 331,122 | 306,479 | ||||||||||||
| Income from financial services | 17,638 | 14,625 | 32,280 | 25,265 | ||||||||||||
| Operating income | 164,017 | 155,435 | 314,303 | 282,117 | ||||||||||||
| Non-operating expense (income): | ||||||||||||||||
| Interest expense | 2,972 | 3,039 | 5,882 | 5,851 | ||||||||||||
| Equity in loss of other affiliates | 1,748 | 967 | 3,371 | 1,863 | ||||||||||||
| Other expense (income), net | 2,681 | (1,883 | ) | 10,121 | (3,988 | ) | ||||||||||
| Income before income taxes | 156,616 | 153,312 | 294,929 | 278,391 | ||||||||||||
| Provision for income taxes | 55,673 | 56,407 | 105,423 | 100,585 | ||||||||||||
| Net income | $ | 100,943 | $ | 96,905 | $ | 189,506 | $ | 177,806 | ||||||||
| Basic net income per share | $ | 1.52 | $ | 1.47 | $ | 2.86 | $ | 2.70 | ||||||||
| Diluted net income per share | $ | 1.49 | $ | 1.42 | $ | 2.79 | $ | 2.61 | ||||||||
| Weighted average shares outstanding: | ||||||||||||||||
| Basic | 66,324 | 66,060 | 66,376 | 65,946 | ||||||||||||
| Diluted | 67,829 | 68,088 | 67,987 | 68,023 | ||||||||||||
| POLARIS INDUSTRIES INC. | |||||||
| CONSOLIDATED BALANCE SHEETS | |||||||
| (In Thousands) | |||||||
| (Unaudited) | |||||||
| June 30, 2015 | June 30, 2014 | ||||||
| Assets | |||||||
| Current Assets: | |||||||
| Cash and cash equivalents | $ | 118,819 | $ | 119,040 | |||
| Trade receivables, net | 151,495 | 135,411 | |||||
| Inventories, net | 708,269 | 559,876 | |||||
| Prepaid expenses and other | 66,497 | 60,002 | |||||
| Income taxes receivable | 15,183 | 24,890 | |||||
| Deferred tax assets | 113,656 | 94,228 | |||||
| Total current assets | 1,173,919 | 993,447 | |||||
| Property and equipment, net | 569,126 | 532,425 | |||||
| Investment in finance affiliate | 87,625 | 67,597 | |||||
| Deferred tax assets | 40,528 | 21,803 | |||||
| Goodwill and other intangible assets, net | 235,030 | 238,118 | |||||
| Other long-term assets | 75,326 | 65,659 | |||||
| Total assets | $ | 2,181,554 | $ | 1,919,049 | |||
| Liabilities and Shareholders' Equity | |||||||
| Current Liabilities: | |||||||
| Current portion of capital lease obligations and notes payable | $ | 4,948 | $ | 3,119 | |||
| Accounts payable | 300,639 | 289,423 | |||||
| Accrued expenses: | |||||||
| Compensation | 68,246 | 64,782 | |||||
| Warranties | 45,099 | 44,811 | |||||
| Sales promotions and incentives | 130,158 | 129,161 | |||||
| Dealer holdback | 120,258 | 102,890 | |||||
| Other | 72,758 | 86,656 | |||||
| Income taxes payable | 9,553 | 4,530 | |||||
| Total current liabilities | 751,659 | 725,372 | |||||
| Long-term income taxes payable | 10,429 | 13,377 | |||||
| Capital lease obligations and notes payable | 35,117 | 27,506 | |||||
| Long-term debt | 363,417 | 337,000 | |||||
| Deferred tax liabilities | 16,446 | 22,982 | |||||
| Other long-term liabilities | 102,997 | 86,301 | |||||
| Total liabilities | $ | 1,280,065 | $ | 1,212,538 | |||
| Deferred compensation | 16,743 | 12,091 | |||||
| Shareholders’ equity: | |||||||
| Total shareholders’ equity | 884,746 | 694,420 | |||||
| Total liabilities and shareholders’ equity | $ | 2,181,554 | $ | 1,919,049 | |||
| POLARIS INDUSTRIES INC. | ||||||||
| CONSOLIDATED STATEMENTS OF CASH FLOWS | ||||||||
| (In Thousands) | ||||||||
| (Unaudited) | ||||||||
| Six months ended June 30, | ||||||||
| 2015 | 2014 | |||||||
| Operating Activities: | ||||||||
| Net income | $ | 189,506 | $ | 177,806 | ||||
| Adjustments to reconcile net income to net cash provided by operating activities: | ||||||||
| Depreciation and amortization | 72,372 | 56,781 | ||||||
| Noncash compensation | 34,452 | 28,273 | ||||||
| Noncash income from financial services | (13,757 | ) | (4,503 | ) | ||||
| Deferred income taxes | (507 | ) | (7,790 | ) | ||||
| Tax effect of share-based compensation exercises | (32,863 | ) | (11,939 | ) | ||||
| Other, net | 3,371 | 1,863 | ||||||
| Changes in operating assets and liabilities: | ||||||||
| Trade receivables | 50,521 | 52,899 | ||||||
| Inventories | (137,362 | ) | (136,323 | ) | ||||
| Accounts payable | (46,766 | ) | 48,666 | |||||
| Accrued expenses | (45,769 | ) | (53,595 | ) | ||||
| Income taxes payable/receivable | 18,821 | (6,264 | ) | |||||
| Prepaid expenses and others, net | (2,110 | ) | (14,961 | ) | ||||
| Net cash provided by operating activities | 89,909 | 130,913 | ||||||
| Investing Activities: | ||||||||
| Purchase of property and equipment | (88,663 | ) | (101,607 | ) | ||||
| Investment in finance affiliate, net | 15,239 | 6,124 | ||||||
| Investment in other affiliates | (10,050 | ) | (4,158 | ) | ||||
| Acquisition of businesses, net of cash acquired | (27,019 | ) | (17,199 | ) | ||||
| Net cash used for investing activities | (110,493 | ) | (116,840 | ) | ||||
| Financing Activities: | ||||||||
| Borrowings under debt arrangements / capital lease obligations | 1,481,655 | 1,452,444 | ||||||
| Repayments under debt arrangements / capital lease obligations | (1,303,098 | ) | (1,397,210 | ) | ||||
| Repurchase and retirement of common shares | (157,739 | ) | (3,945 | ) | ||||
| Cash dividends to shareholders | (70,061 | ) | (63,415 | ) | ||||
| Proceeds from stock issuances under employee plans | 25,133 | 12,994 | ||||||
| Tax effect of proceeds from share-based compensation exercises | 32,863 | 11,939 | ||||||
| Net cash provided by financing activities | 8,753 | 12,807 | ||||||
| Impact of currency exchange rates on cash balances | (6,950 | ) | (88 | ) | ||||
| Net increase (decrease) in cash and cash equivalents | (18,781 | ) | 26,792 | |||||
| Cash and cash equivalents at beginning of period | 137,600 | 92,248 | ||||||
| Cash and cash equivalents at end of period | $ | 118,819 | $ | 119,040 | ||||
CONTACT:
Polaris Industries Inc.
Richard Edwards, 763-542-0500
Exhibit 99.2
Second Quarter 2015
Earnings Results July 22, 2015 POLARIS INDUSTRIES INC.
Except for historical information contained herein, the matters set forth in this document, including but not limited to management’s expectations regarding 2015 sales, shipments, margins, currencies, net income and cash flow, the opportunities for expansion and diversification of the Company’s business and the Company’s guidance on earnings per share are forward-looking statements that involve certain risks and uncertainties that could cause actual results to differ materially from those forward-looking statements. Potential risks and uncertainties include such factors as product offerings, promotional activities and pricing strategies by competitors; manufacturing operation expansion initiatives; acquisition integration costs; warranty expenses; foreign currency exchange rate fluctuations; environmental and product safety regulatory activity; effects of weather; commodity costs; uninsured product liability claims; uncertainty in the retail and wholesale credit markets; performance of affiliate partners; changes in tax policy and overall economic conditions, including inflation, consumer confidence and spending and relationships with dealers and suppliers. Investors are also directed to consider other risks and uncertainties discussed in our 2014 annual report and Form 10-K filed by the Company with the Securities and Exchange Commission. The Company does not undertake any duty to any person to provide updates to its forward-looking statements. The data source for retail sales figures included in this presentation is registration information provided by Polaris dealers in North America and compiled by the Company or Company estimates. The Company must rely on information that its dealers supply concerning retail sales, and other retail sales data sources and this information is subject to revision. Q2 7-22-15 2

Scott W. Wine Chairman &
CEO Second Quarter
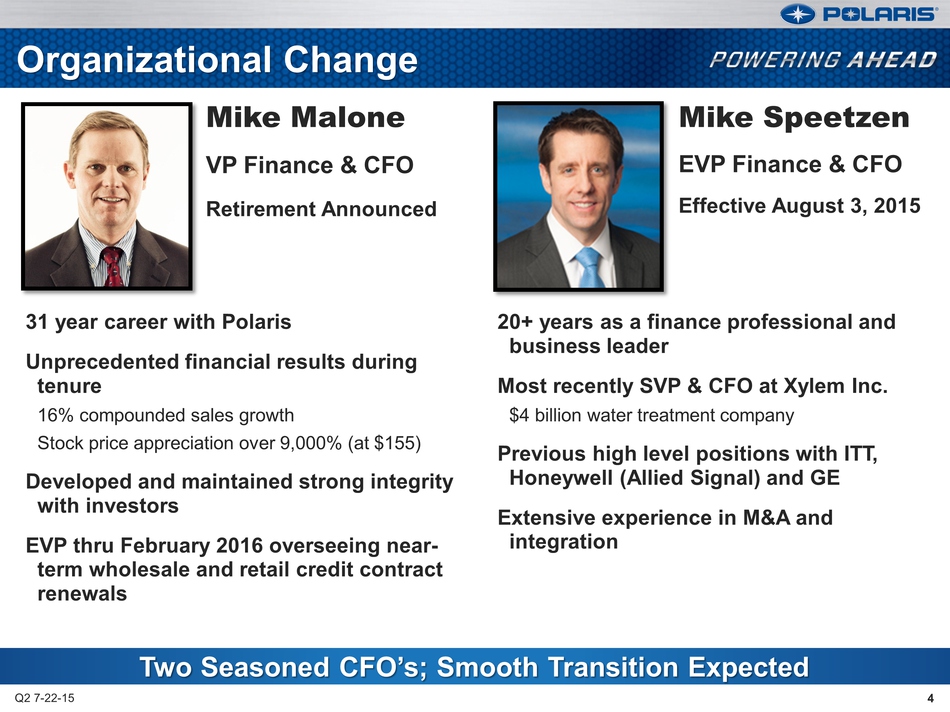
Organizational Change Q2 7-22-15 4 Two Seasoned CFO’s; Smooth Transition Expected Mike Malone VP Finance & CFO Retirement Announced Mike Speetzen EVP Finance & CFO Effective August 3, 2015 31 year career with Polaris Unprecedented financial results during tenure 16% compounded sales growth Stock price appreciation over 9,000% (at $155) Developed and maintained strong integrity with investors EVP thru February 2016 overseeing nearterm wholesale and retail credit contract renewals 20+ years as a finance professional and business leader Most recently SVP & CFO at Xylem Inc. $4 billion water treatment company Previous high level positions with ITT, Honeywell (Allied Signal) and GE Extensive experience in M&A and integration 4
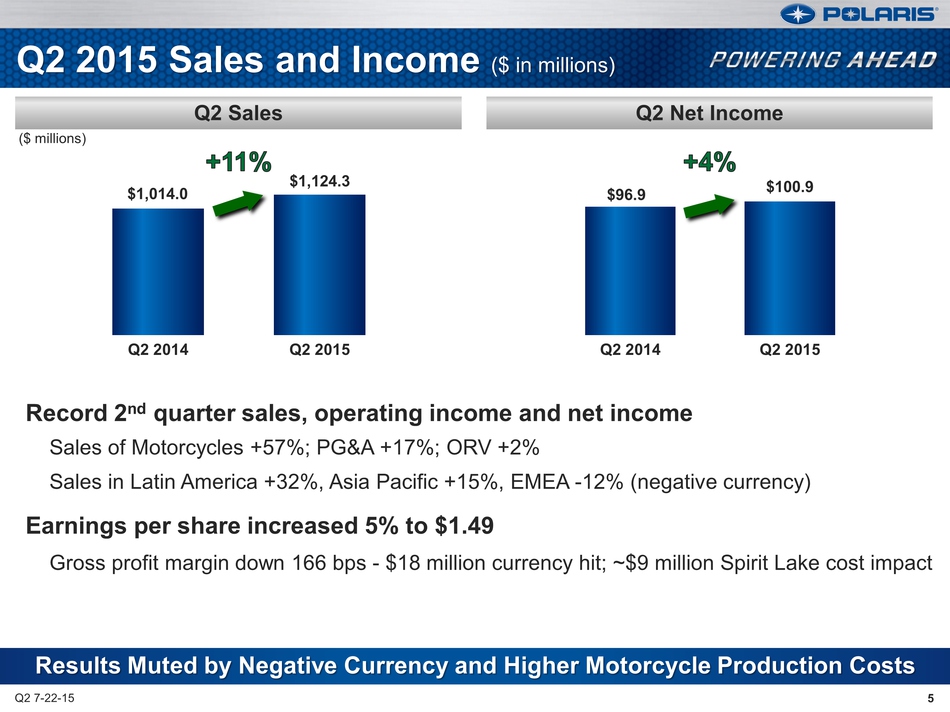
Q2 2015 Sales and Income ($
in millions) Record 2nd quarter sales, operating income and net income
Sales of Motorcycles +57%; PG&A +17%; ORV +2% Sales in Latin America
+32%, Asia Pacific +15%, EMEA -12% (negative currency) Earnings per
share increased 5% to $1.49 Gross profit margin down 166 bps - $18
million currency hit; ~$9 million Spirit Lake cost impact Q2 7-22-15 5
Results Muted by Negative Currency and Higher Motorcycle Production
Costs Q2 Sales Q2 Net Income ($ millions) Q2 2014 Q2 2015 $96.9 $100.9
Q2 2014 Q2 2015 $1,124.3 $1,014.0 2015 Earnings Results July 22, 2015
POLARIS INDUSTRIES INC. 5
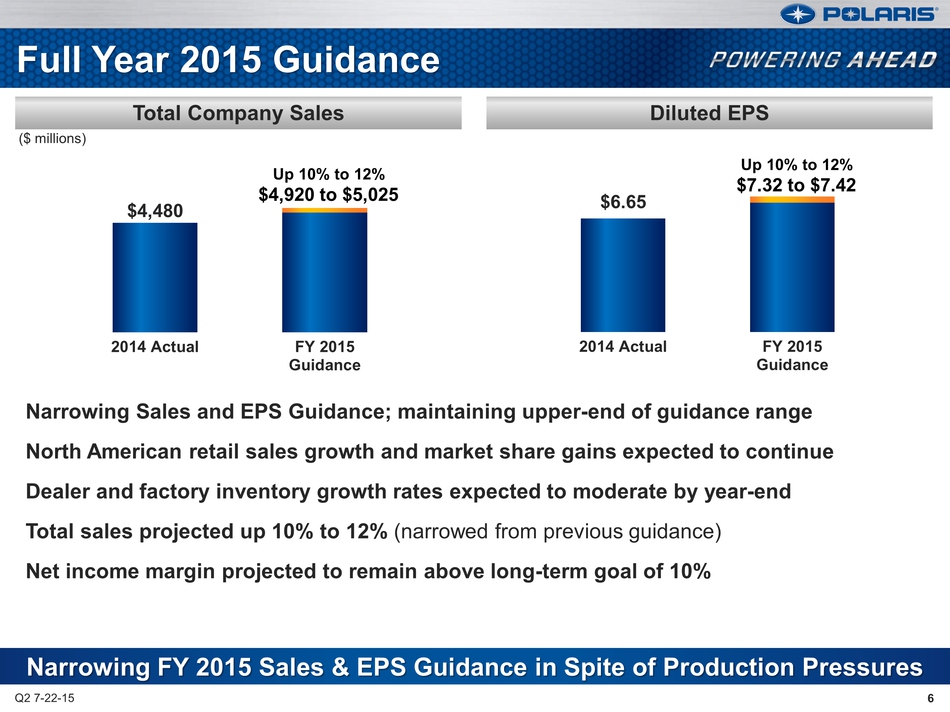
Full Year 2015 Guidance Narrowing Sales and EPS Guidance; maintaining upper-end of guidance range North American retail sales growth and market share gains expected to continue Dealer and factory inventory growth rates expected to moderate by year-end Total sales projected up 10% to 12% (narrowed from previous guidance) Net income margin projected to remain above long-term goal of 10% Q2 7-22-15 6 $4,480 2014 Actual FY 2015 Guidance $6.65 2014 Actual FY 2015 Guidance Narrowing FY 2015 Sales & EPS Guidance in Spite of Production Pressures Total Company Sales Diluted EPS Up 10% to 12% $4,920 to $5,025 Up 10% to 12% $7.32 to $7.42 ($ millions) 6
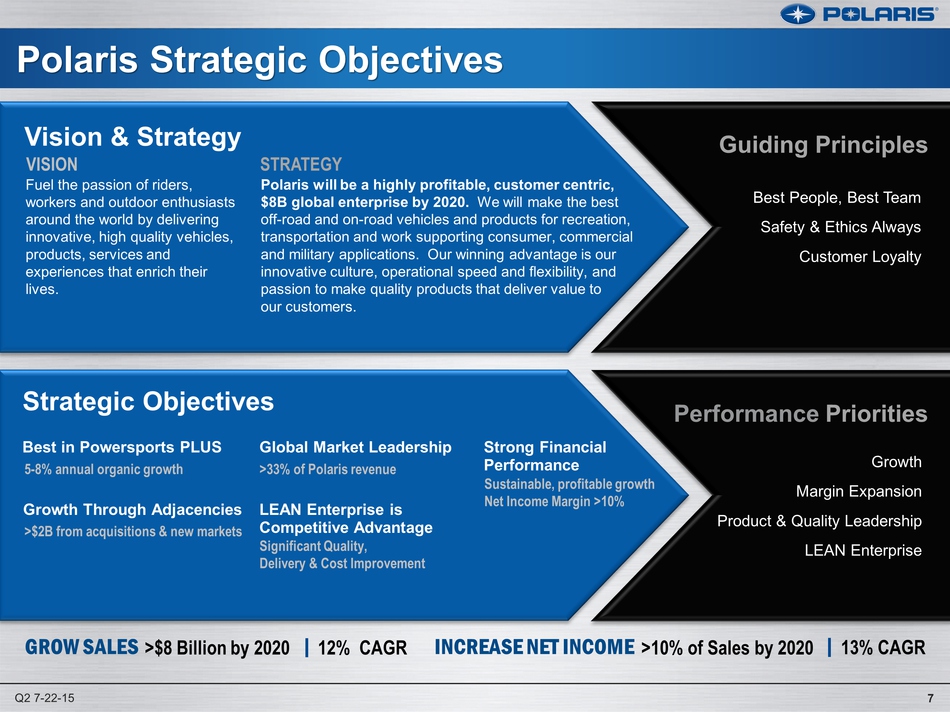
Polaris Strategic Objectives Vision & Strategy VISION STRATEGY Fuel the passion of riders, workers and outdoor enthusiasts around the world by delivering innovative, high quality vehicles, products, services and experiences that enrich their lives. Polaris will be a highly profitable, customer centric, $8B global enterprise by 2020. We will make the best off-road and on-road vehicles and products for recreation, transportation and work supporting consumer, commercial and military applications. Our winning advantage is our innovative culture, operational speed and flexibility, and passion to make quality products that deliver value to our customers. Strategic Objectives Best in Powersports PLUS Global Market Leadership Strong Financial Performance Growth Through Adjacencies LEAN Enterprise is Competitive Advantage 5-8% annual organic growth >33% of Polaris revenue >$2B from acquisitions & new markets Significant Quality, Delivery & Cost Improvement Sustainable, profitable growth Net Income Margin >10% Guiding Principles Performance Priorities Best People, Best Team Safety & Ethics Always Customer Loyalty Growth Margin Expansion Product & Quality Leadership LEAN Enterprise GROW SALES >$8 Billion by 2020 12% CAGR INCREASE NET INCOME >10% of Sales by 2020 13% CAGR Q2 7-22-15 7
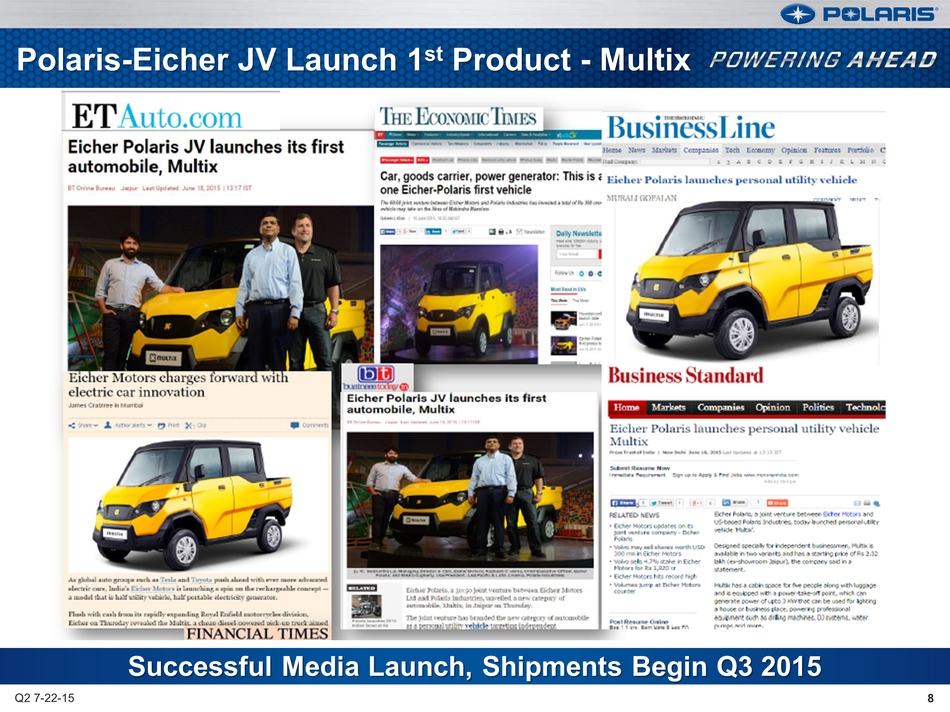
Successful Media Launch,
Shipments Begin Q3 2015 Q2 7-22-15 8 Polaris-Eicher JV Launch 1st
Product - Multix 8

Polaris Strategic
Objectives Vision & Strategy VISION STRATEGY Fuel the passion of riders,
workers and outdoor enthusiasts around the world by delivering
innovative, high quality vehicles, products, services and experiences
that enrich their lives. Polaris will be a highly profitable, customer
centric, $8B global enterprise by 2020. We will make the best off-road
and on-road vehicles and products for recreation, transportation and
work supporting consumer, commercial and military applications. Our
winning advantage is our innovative culture, operational speed and
flexibility, and passion to make quality products that deliver value to
our customers. Strategic Objectives Best in Powersports PLUS Global
Market Leadership Strong Financial Performance Growth Through
Adjacencies LEAN Enterprise is Competitive Advantage 5-8% annual organic
growth >33% of Polaris revenue >$2B from acquisitions & new markets
Significant Quality, Delivery & Cost Improvement Sustainable, profitable
growth Net Income Margin >10% Guiding Principles Performance Priorities
Best People, Best Team Safety & Ethics Always Customer Loyalty Growth
Margin Expansion Product & Quality Leadership LEAN Enterprise GROW SALES
>$8 Billion by 2020 12% CAGR INCREASE NET INCOME >10% of Sales by 2020
13% CAGR Q2 7-22-15 9
Bennett Morgan President &
COO Second Quarter 2015 Earnings Results July 22, 2015 POLARIS
INDUSTRIES INC.
Q2 7-22-15 11
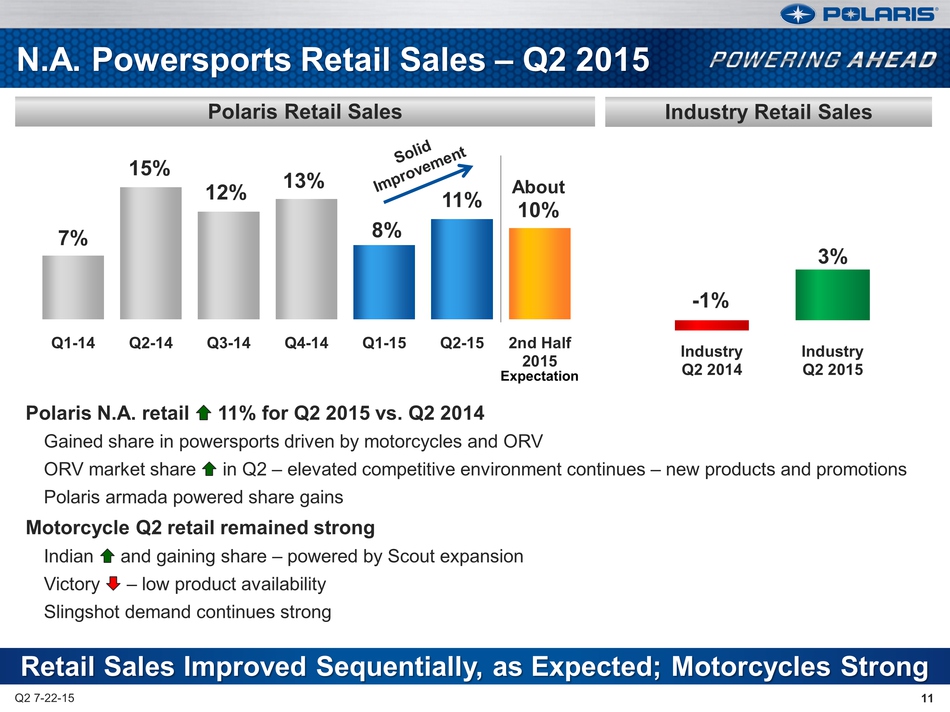
Polaris Retail Sales Retail Sales Improved Sequentially, as Expected;
Motorcycles Strong 7% 15% 12% 13% 8% 11% About 10% Q1-14 Q2-14 Q3-14
Q4-14 Q1-15 Q2-15 2nd Half 2015 Polaris N.A. retail 11% for Q2 2015 vs.
Q2 2014 Gained share in powersports driven by motorcycles and ORV ORV
market share in Q2 – elevated competitive environment continues – new
products and promotions Polaris armada powered share gains Motorcycle Q2
retail remained strong Indian and gaining share – powered by Scout
expansion Victory – low product availability Slingshot demand continues
strong N.A. Powersports Retail Sales – Q2 2015 Industry Retail Sales -1%
3% Industry Q2 2014 Industry Expectation Q2 2015 11
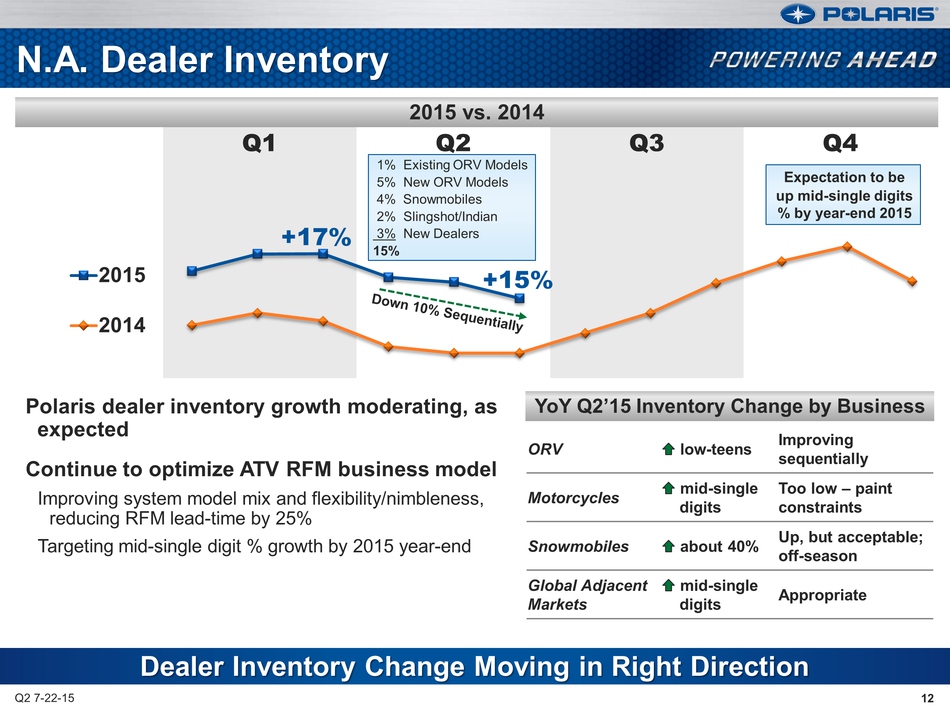
Q1 Q2 Q3 Q4 2015 2014 Q2
7-22-15 12 2015 vs. 2014 Dealer Inventory Change Moving in Right
Direction Polaris dealer inventory growth moderating, as expected
Continue to optimize ATV RFM business model Improving system model mix
and flexibility/nimbleness, reducing RFM lead-time by 25% Targeting
mid-single digit % growth by 2015 year-end N.A. Dealer Inventory ORV
low-teens Improving sequentially Motorcycles mid-single digits Too low –
paint constraints Snowmobiles about 40% Up, but acceptable; off-season
Global Adjacent Markets mid-single digits Appropriate YoY Q2’15
Inventory Change by Business 1% Existing ORV Models 5% New ORV Models 4%
Snowmobiles 2% Slingshot/Indian 3% New Dealers 15% +15% +17% Expectation
to be up mid-single digits % by year-end 2015 12
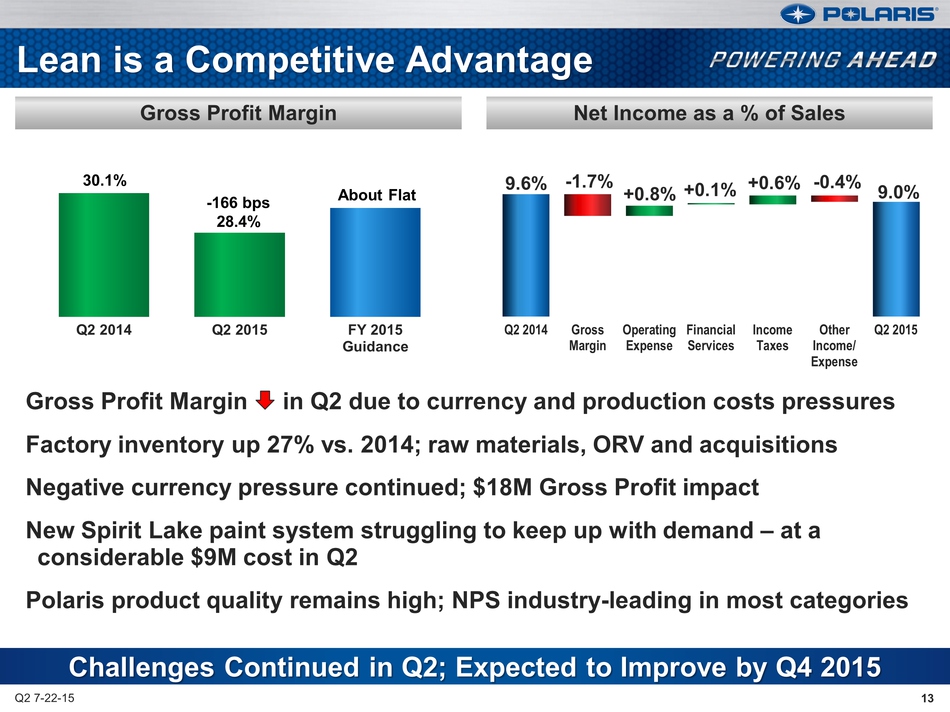
Gross Profit Margin in Q2
due to currency and production costs pressures Factory inventory up 27%
vs. 2014; raw materials, ORV and acquisitions Negative currency pressure
continued; $18M Gross Profit impact New Spirit Lake paint system
struggling to keep up with demand – at a considerable $9M cost in Q2
Polaris product quality remains high; NPS industry-leading in most
categories Q2 7-22-15 13 Q2 2014 Q2 2015 FY 2015 Guidance Gross Profit
Margin Net Income as a % of Sales Challenges Continued in Q2; Expected
to Improve by Q4 2015 Lean is a Competitive Advantage 30.1% -166 bps
28.4% About Flat Q2 2014 Gross Margin Operating Expense Financial
Services Income Taxes Other Income/ Expense Q2 2015 9.6% -1.7% +0.8%
+0.1% +0.6% -0.4% 9.0% 13
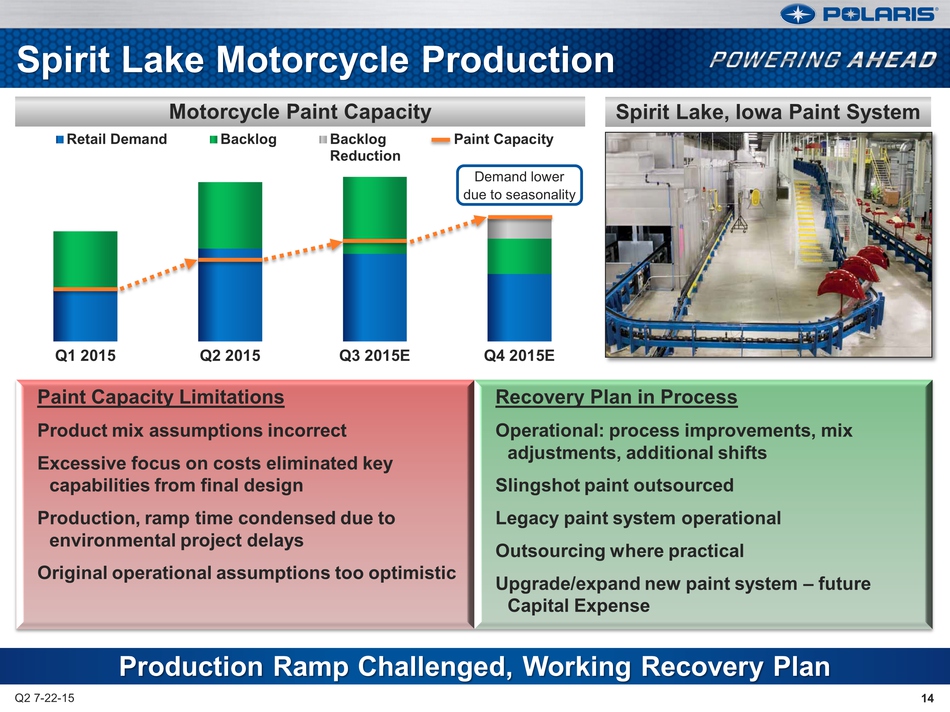
Q1 2015 Q2 2015 Q3
2015E Q4 2015E Retail Demand Backlog Backlog Reduction Paint Capacity Q2
7-22-15 14 Motorcycle Paint Capacity Production Ramp Challenged, Working
Recovery Plan Paint Capacity Limitations Product mix assumptions
incorrect Excessive focus on costs eliminated key capabilities from
final design Production, ramp time condensed due to environmental
project delays Original operational assumptions too optimistic Recovery
Plan in Process Operational: process improvements, mix adjustments,
additional shifts Slingshot paint outsourced Legacy paint system
operational Outsourcing where practical Upgrade/expand new paint system
– future Capital Expense Spirit Lake Motorcycle Production Spirit Lake,
Iowa Paint System Demand lower due to seasonality 14
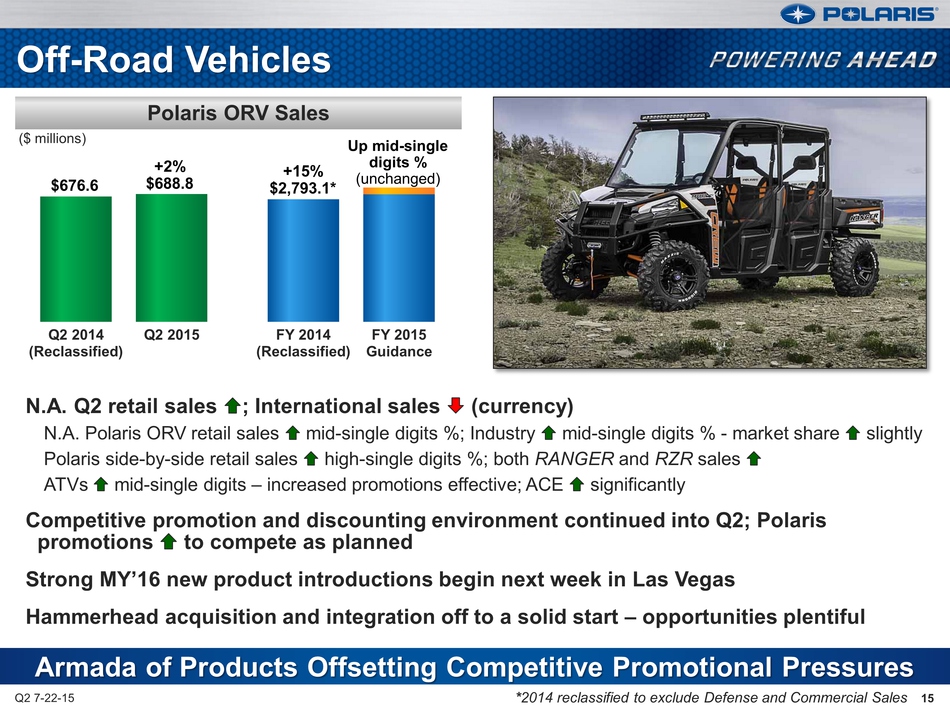
Q2 2014 (Reclassified) Q2
2015 FY 2014 (Reclassified) FY 2015 Guidance N.A. Q2 retail sales ;
International sales (currency) N.A. Polaris ORV retail sales mid-single
digits %; Industry mid-single digits % - market share slightly Polaris
side-by-side retail sales high-single digits %; both RANGER and RZR
sales ATVs mid-single digits – increased promotions effective; ACE
significantly Competitive promotion and discounting environment
continued into Q2; Polaris promotions to compete as planned Strong MY’16
new product introductions begin next week in Las Vegas Hammerhead
acquisition and integration off to a solid start – opportunities
plentiful Q2 7-22-15 15 Polaris ORV Sales Armada of Products Offsetting
Competitive Promotional Pressures Off-Road Vehicles Up mid-single digits
% (unchanged) +2% $676.6 $688.8 ($ millions) +15% $2,793.1* *2014
reclassified to exclude Defense and Commercial Sales 15
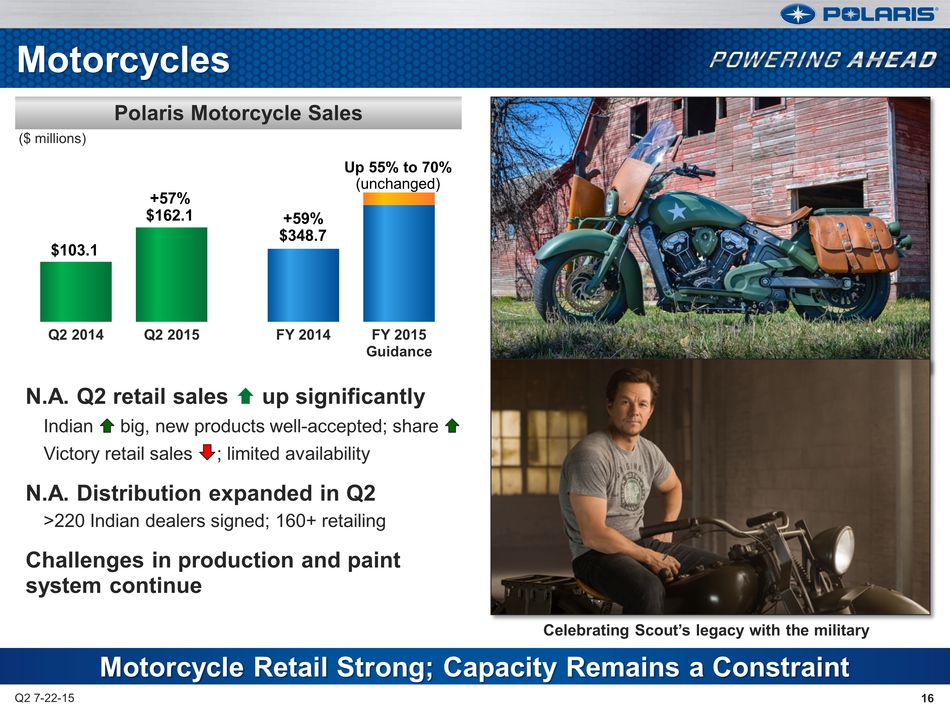
Q2 2014 Q2 2015 FY 2014 FY
2015 Guidance N.A. Q2 retail sales up significantly Indian big, new
products well-accepted; share Victory retail sales ; limited
availability N.A. Distribution expanded in Q2 >220 Indian dealers
signed; 160+ retailing Challenges in production and paint system
continue Q2 7-22-15 16 Polaris Motorcycle Sales Motorcycle Retail
Strong; Capacity Remains a Constraint Motorcycles Up 55% to 70%
(unchanged) +57% $162.1 $103.1 ($ millions) +59% $348.7 Retailing
Dealers Victory Motorcycle Indian Motorcycle Slingshot North America 440
150 370 (>200 Signed) International 150 140 0 WORLDWIDE 590 290 370
Celebrating Scout’s legacy with the military 16
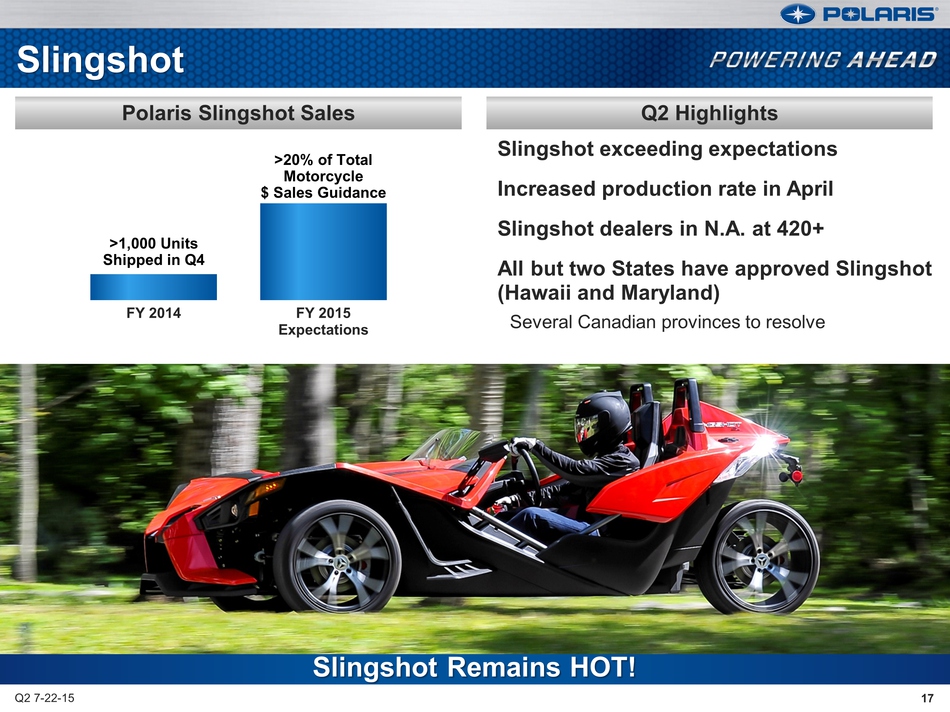
Q2 7-22-15 17 FY 2014 FY
2015 Expectations Slingshot exceeding expectations Increased production
rate in April Slingshot dealers in N.A. at 420+ All but two States have
approved Slingshot (Hawaii and Maryland) Several Canadian provinces to
resolve Polaris Slingshot Sales Q2 Highlights Slingshot Remains HOT!
Slingshot >1,000 Units Shipped in Q4 >20% of Total Motorcycle $ Sales
Guidance 17
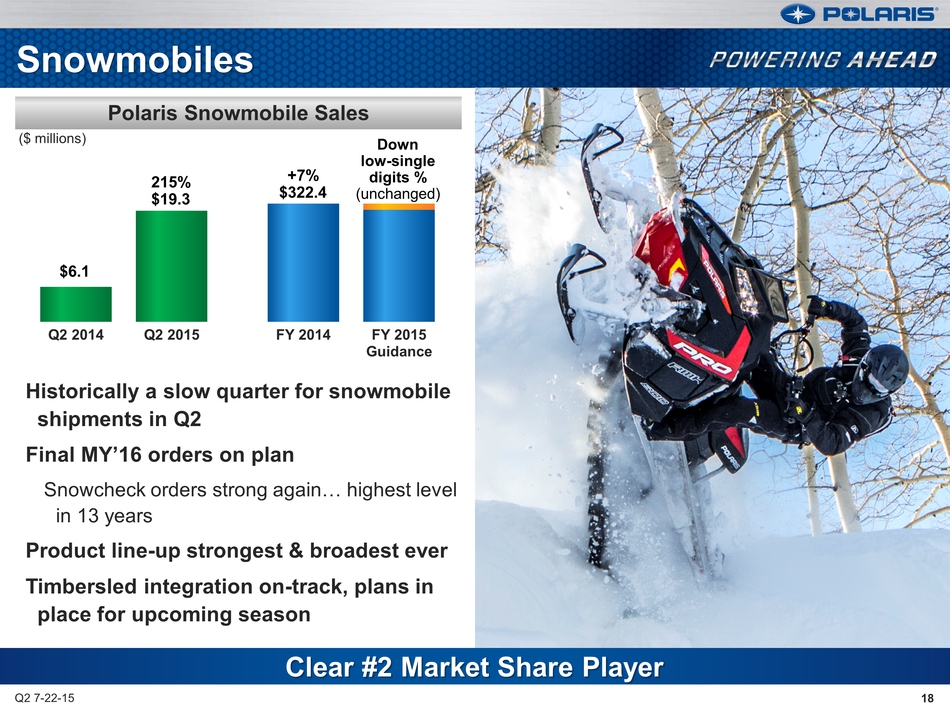
Historically a slow quarter
for snowmobile shipments in Q2 Final MY’16 orders on plan Snowcheck
orders strong again… highest level in 13 years Product line-up strongest
& broadest ever Timbersled integration on-track, plans in place for
upcoming season Q2 7-22-15 18 Polaris Snowmobile Sales Snowmobiles ($
millions) Q2 2014 Q2 2015 FY 2014 FY 2015 Guidance Down low-single
digits % (unchanged) 215% $19.3 $6.1 +7% $322.4 Clear #2 Market Share
Player 18
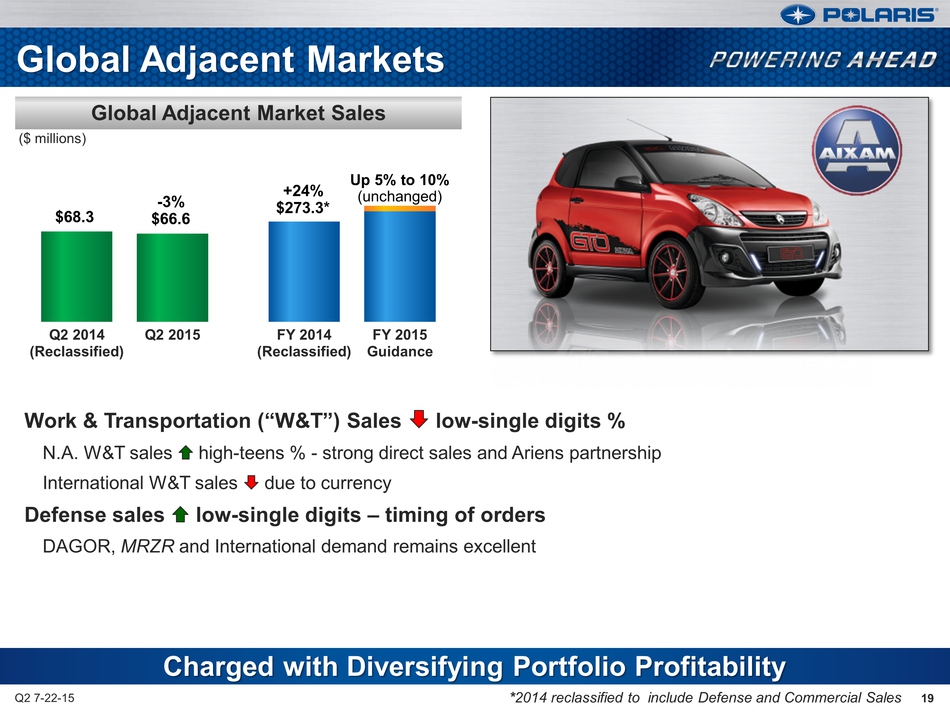
Global Adjacent Markets Q2
7-22-15 19 Global Adjacent Market Sales Charged with Diversifying
Portfolio Profitability ($ millions) *2014 reclassified to include
Defense and Commercial Sales Work & Transportation (“W&T”) Sales
low-single digits % N.A. W&T sales high-teens % - strong direct sales
and Ariens partnership International W&T sales due to currency Defense
sales low-single digits – timing of orders DAGOR, MRZR and International
demand remains excellent FY 2014 (Reclassified) FY 2015 Guidance Q2 2014
(Reclassified) Q2 2015 Up 5% to 10% -3% (unchanged) $68.3 $66.6 +24%
$273.3* 19
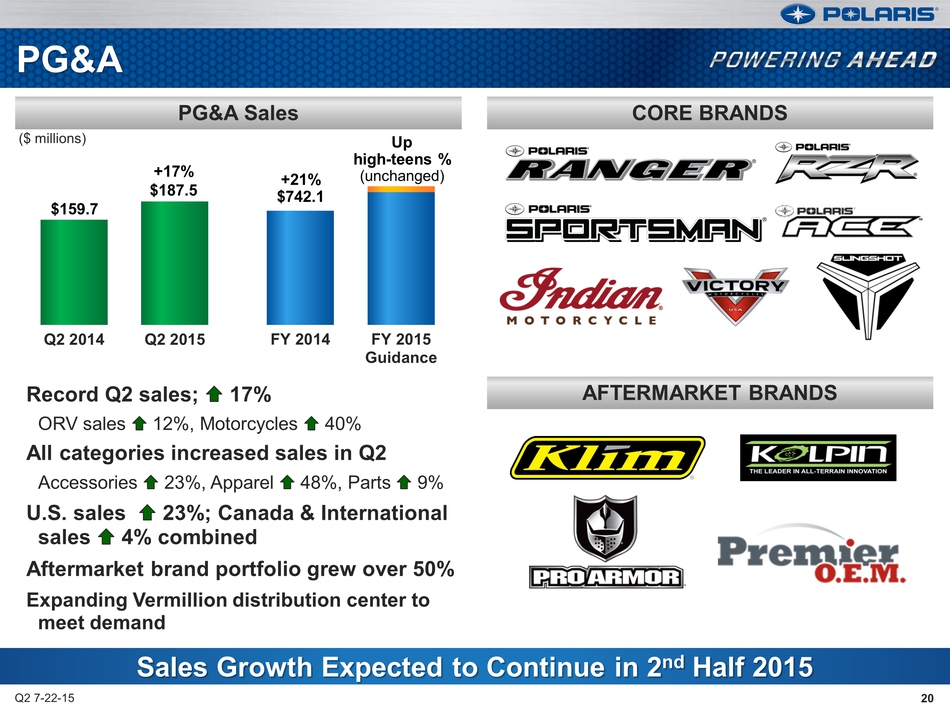
PG&A Q2 7-22-15 20 PG&A
Sales CORE BRANDS Record Q2 sales; 17% ORV sales 12%, Motorcycles 40%
All categories increased sales in Q2 Accessories 23%, Apparel 48%, Parts
9% U.S. sales 23%; Canada & International sales 4% combined Aftermarket
brand portfolio grew over 50% Expanding Vermillion distribution center
to meet demand AFTERMARKET BRANDS Sales Growth Expected to Continue in
2nd Half 2015 Q2 2014 Q2 2015 FY 2014 FY 2015 Guidance Up high-teens %
+21% (unchanged) $742.1 $159.7 ($ millions) +17% $187.5 20
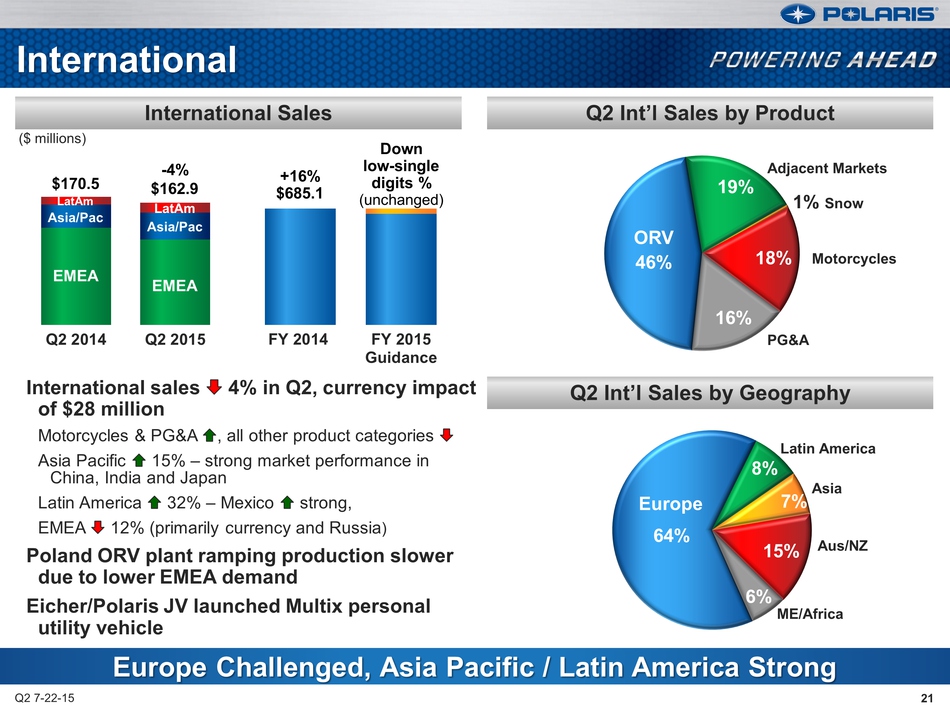
46% 19% 18% 16% 64% 8% 7%
15% 6% International Q2 7-22-15 21 International Sales Q2 Int’l Sales by
Product Q2 2014 Q2 2015 Q2 Int’l Sales by Geography Europe Challenged,
Asia Pacific / Latin America Strong Down low-single digits % (unchanged)
+16% $170.5 $685.1 ($ millions) -4% $162.9 EMEA Asia/Pac LatAm EMEA
Asia/Pac LatAm Motorcycles 1% Snow Adjacent Markets Latin America Asia
Aus/NZ ME/Africa FY 2014 FY 2015 PG&A Guidance International sales 4% in
Q2, currency impact of $28 million Motorcycles & PG&A , all other
product categories Asia Pacific 15% – strong market performance in
China, India and Japan Latin America 32% – Mexico strong, EMEA 12%
(primarily currency and Russia) Poland ORV plant ramping production
slower due to lower EMEA demand Eicher/Polaris JV launched Multix
personal utility vehicle Europe ORV 21
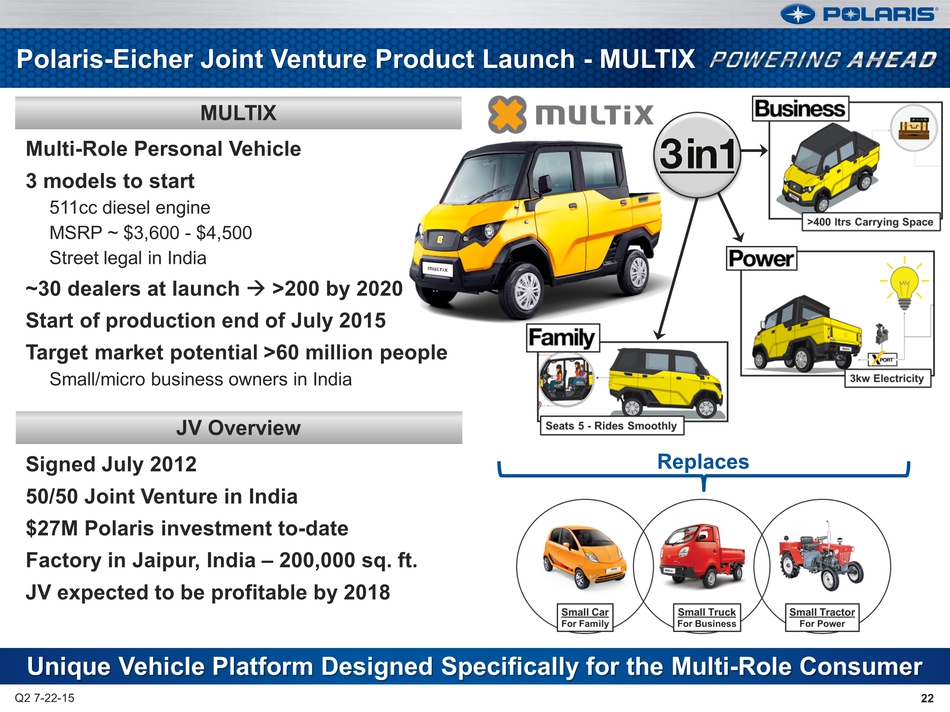
Polaris-Eicher Joint
Venture Product Launch - MULTIX Q2 7-22-15 MULTIX Multi-Role Personal
Vehicle 3 models to start 511cc diesel engine MSRP ~ $3,600 - $4,500
Street legal in India ~30 dealers at launch >200 by 2020 Start of
production end of July 2015 Target market potential >60 million people
Small/micro business owners in India Signed July 2012 50/50 Joint
Venture in India $27M Polaris investment to-date Factory in Jaipur,
India – 200,000 sq. ft. JV expected to be profitable by 2018 JV Overview
Unique Vehicle Platform Designed Specifically for the Multi-Role
Consumer Replaces 22

Mike Malone V.P. Finance &
CFO Second Quarter 2015 Earnings Results July 22, 2015 POLARIS
INDUSTRIES INC
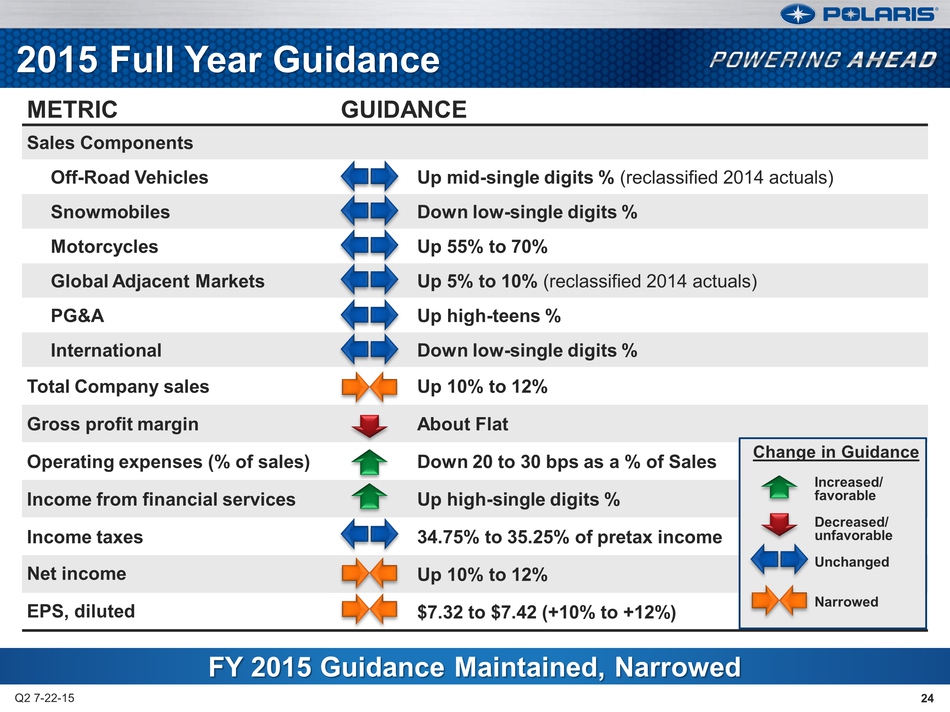
METRIC GUIDANCE Sales
Components Off-Road Vehicles Up mid-single digits % (reclassified 2014
actuals) Snowmobiles Down low-single digits % Motorcycles Up 55% to 70%
Global Adjacent Markets Up 5% to 10% (reclassified 2014 actuals) PG&A Up
high-teens % International Down low-single digits % Total Company sales
Up 10% to 12% Gross profit margin About Flat Operating expenses (% of
sales) Down 20 to 30 bps as a % of Sales Income from financial services
Up high-single digits % Income taxes 34.75% to 35.25% of pretax income
Net income Up 10% to 12% EPS, diluted $7.32 to $7.42 (+10% to +12%) FY
2015 Guidance Maintained, Narrowed 2015 Full Year Guidance Q2 7-22-15 24
Change in Guidance Increased/ favorable Decreased/ unfavorable Unchanged
Narrowed 24
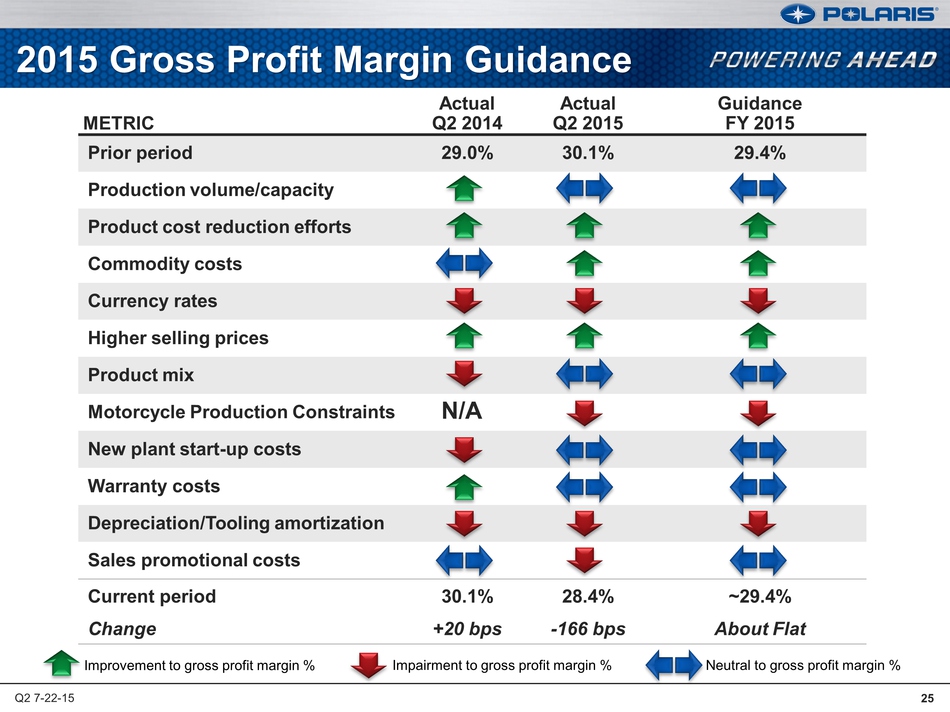
METRIC Actual Q2
2014 Actual Q2 2015 Guidance FY 2015 Prior period 29.0% 30.1% 29.4%
Production volume/capacity Product cost reduction efforts Commodity
costs Currency rates Higher selling prices Product mix Motorcycle
Production Constraints N/A New plant start-up costs Warranty costs
Depreciation/Tooling amortization Sales promotional costs Current period
30.1% 28.4% ~29.4% Change +20 bps -166 bps About Flat 2015 Gross Profit
Margin Guidance Improvement to gross profit margin % Impairment to gross
profit margin % Neutral to gross profit margin % Q2 7-22-15 25
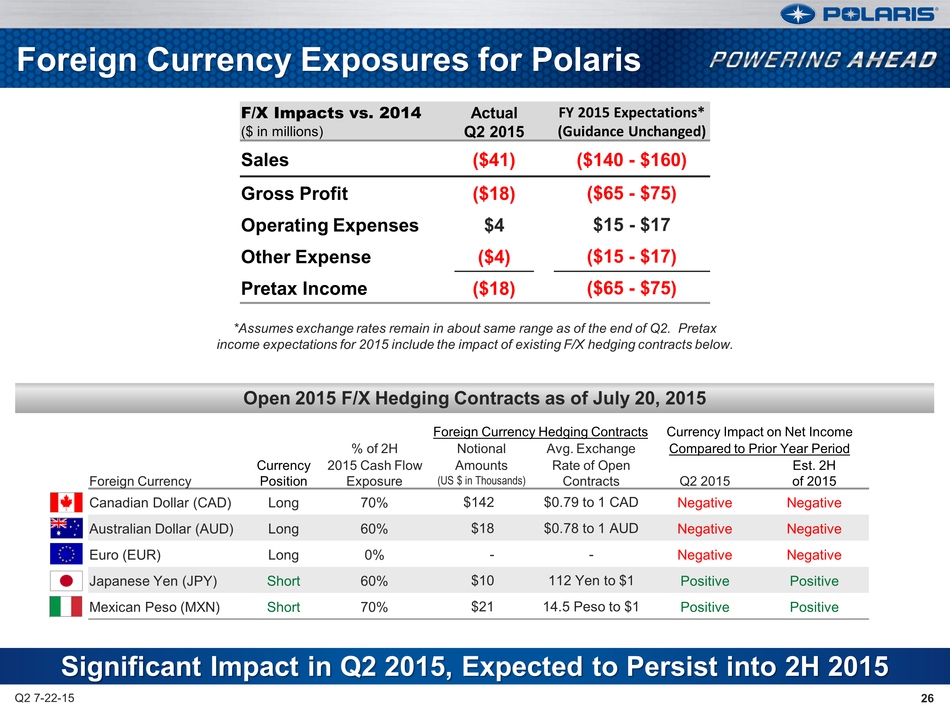
Significant Impact in Q2
2015, Expected to Persist into 2H 2015 26 Foreign Currency Exposures for
Polaris Q2 7-22-15 Foreign Currency Hedging Contracts Currency Impact on
Net Income % of 2H Notional Avg. Exchange Compared to Prior Year Period
Foreign Currency Currency Position 2015 Cash Flow Exposure Amounts (US $
in Thousands) Rate of Open Contracts Q2 2015 Est. 2H of 2015 Canadian
Dollar (CAD) Long 70% $142 $0.79 to 1 CAD Negative Negative Australian
Dollar (AUD) Long 60% $18 $0.78 to 1 AUD Negative Negative Euro (EUR)
Long 0% - - Negative Negative Japanese Yen (JPY) Short 60% $10 112 Yen
to $1 Positive Positive Mexican Peso (MXN) Short 70% $21 14.5 Peso to $1
Positive Positive F/X Impacts vs. 2014 ($ in millions) Actual Q2 2015 FY
2015 Expectations* (Guidance Unchanged) Sales ($41) ($140 - $160) Gross
Profit ($18) ($65 - $75) Operating Expenses $4 $15 - $17 Other Expense
($4) ($15 - $17) Pretax Income ($18) ($65 - $75) *Assumes exchange rates
remain in about same range as of the end of Q2. Pretax income
expectations for 2015 include the impact of existing F/X hedging
contracts below. Open 2015 F/X Hedging Contracts as of July 20, 2015 26
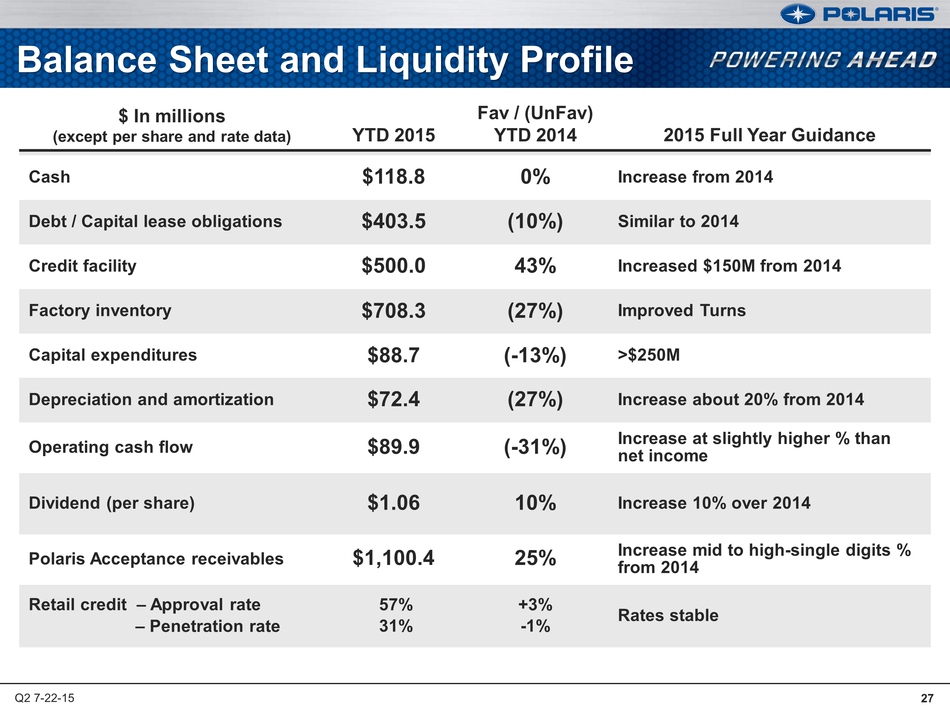
Balance Sheet and Liquidity
Profile $ In millions (except per share and rate data) YTD 2015 Fav /
(UnFav) YTD 2014 2015 Full Year Guidance Cash $118.8 0% Increase from
2014 Debt / Capital lease obligations $403.5 (10%) Similar to 2014
Credit facility $500.0 43% Increased $150M from 2014 Factory inventory
$708.3 (27%) Improved Turns Capital expenditures $88.7 (-13%) >$250M
Depreciation and amortization $72.4 (27%) Increase about 20% from 2014
Operating cash flow $89.9 (-31%) Increase at slightly higher % than net
income Dividend (per share) $1.06 10% Increase 10% over 2014 Polaris
Acceptance receivables $1,100.4 25% Increase mid to high-single digits %
from 2014 Retail credit – Approval rate – Penetration rate 57% 31% +3%
-1% Rates stable Q2 7-22-15 27

Scott W. Wine Chairman & CEO Second Quarter 2015 Earnings Results July 22, 2015 POLARIS INDUSTRIES INC.
29 Expectations for 2nd
Half 2015 Q2 7-22-15 Improved European economic environment anticipated
U.S. economic growth remains uninspiring, but up Oil & Ag weakness
impacting work/utility RANGER growth dampened RZR growth remains strong
Motorcycles and ORVs share gains continue MY’16 ORV strengthens armada
Spirit Lake plant execution improves 1st Half Performance Challenged;
2nd Half Execution Improving 29

POLARIS Thank you Questions?