
Form 8-K BB&T CORP For: Jul 16
UNITED STATES
SECURITIES AND EXCHANGE COMMISSION
Washington, D.C. 20549
______________
Form 8-K
Current Report
______________
Pursuant to Section 13 or 15(d)
of the Securities Exchange Act of 1934
July 16, 2015
Date of Report (Date of earliest event reported)
 |
BB&T Corporation
(Exact name of registrant as specified in its charter)
Commission file number : 1-10853
______________
| North Carolina | 56-0939887 |
| (State of incorporation) | (I.R.S. Employer Identification No.) |
| 200 West Second Street | |
| Winston-Salem, North Carolina | 27101 |
| (Address of principal executive offices) | (Zip Code) |
(336) 733-2000
(Registrant's telephone number, including area code)
______________
Check the appropriate box below if the Form 8-K filing is intended to simultaneously satisfy the filing obligation of the registrant under any of the following provisions:
[ ] Written communications pursuant to Rule 425 under the Securities Act (17 CFR 230.425)
[ ] Soliciting material pursuant to Rule 14a-12 under the Exchange Act (17 CFR 240.14a-12)
[ ] Pre-commencement communications pursuant to Rule
14d-2(b) under the Exchange Act (17 CFR 240.14d-2(b))
[ ] Pre-commencement communications pursuant to Rule 13e-4(c) under
the Exchange Act (17 CFR 240.13e-4(c))
| ITEM 2.02 | Results of Operations and Financial Condition |
On July 16, 2015, BB&T Corporation issued a press release reporting second quarter 2015 results and posted on its website its second quarter 2015 Earnings Release, Quarterly Performance Summary and Earnings Release Presentation. The release contains forward-looking statements regarding BB&T and includes a cautionary statement identifying important factors that could cause actual results to differ materially from those anticipated. The Earnings Release, Quarterly Performance Summary and Earnings Release Presentation are furnished as Exhibits 99.1, 99.2 and 99.3, respectively.
| ITEM 9.01 | Financial Statements and Exhibits |
| Exhibit No. | Description of Exhibit |
| 99.1 | BB&T Corporation's Earnings Release issued July 16, 2015. |
| 99.2 | BB&T Corporation's Quarterly Performance Summary issued July 16, 2015. |
| 99.3 | BB&T Corporation's Earnings Release Presentation issued July 16, 2015. |
S I G N A T U R E
Pursuant to the requirements of the Securities Exchange Act of 1934, the registrant has duly caused this report to be signed on its behalf by the undersigned hereunto duly authorized.
| BB&T CORPORATION | |
| (Registrant) | |
| By: /s/ Cynthia B. Powell | |
| Cynthia B. Powell | |
| Executive Vice President and Corporate Controller | |
| (Principal Accounting Officer) |
Date: July 16, 2015
Exhibit 99.1
July 16, 2015
FOR IMMEDIATE RELEASE
| Contacts: | ||||
| ANALYSTS | MEDIA | |||
| Alan Greer | Tamera Gjesdal | Cynthia A. Williams | ||
| Executive Vice President | Senior Vice President | Senior Executive Vice President | ||
| Investor Relations | Investor Relations | Corporate Communications | ||
| (336) 733-3021 | (336) 733-3058 | (336) 733-1470 |
BB&T reports second quarter results
Adjusted diluted EPS totals $0.69 per share
WINSTON-SALEM, N.C. -- BB&T Corporation (NYSE: BBT) today reported quarterly earnings for the second quarter of 2015. Net income available to common shareholders was $454 million, compared to $424 million earned in the second quarter of 2014, an increase of 7.1%. Earnings per diluted common share totaled $0.62 for the quarter, compared to $0.58 for the second quarter of last year, an increase of 6.9%. Net income available to common shareholders was affected by $25 million in pre-tax merger-related charges ($16 million after-tax), or $0.02 per diluted share, and a $34 million after-tax loss on the sale of American Coastal, or $0.05 per diluted share.
“We are pleased to report solid results for the quarter, led by improved loan growth and strong credit quality,” said Chairman and Chief Executive Officer Kelly S. King. “We completed several strategic transactions during the second quarter and reached an important milestone with the recent approval of the Susquehanna merger.
“Revenues were $2.4 billion, up $31 million, or 1.3% compared with the second quarter of 2014. These results were driven by continued strength in our fee-based businesses.
“We successfully completed our acquisition of The Bank of Kentucky,” said King. “This strategic transaction added $1.6 billion in deposits and boosted us to the No. 2 marketplace ranking in Kentucky, and we look forward to expanding on this solid base with our diverse product offerings and strong customer focus.
| - 1 - |
“We were very pleased to receive regulatory approval to acquire Susquehanna Bancshares, which we expect to close on August 1. This transaction is very important strategically and will drive improved growth and efficiency in coming quarters.
“We reported an income tax benefit of $107 million as a result of a decision by the U.S. Court of Appeals related to previously disallowed deductions in connection with a financing transaction. We also extinguished nearly $1 billion of higher cost FHLB borrowings resulting in a $172 million pre-tax loss, or $107 million after-tax. The debt extinguishment will modestly benefit our net interest margin going forward.
“We also completed the sale of American Coastal and the related purchase of additional ownership in AmRisc,” said King. “The sale resulted in an after-tax loss of $34 million due to the allocation of goodwill upon disposal. These transactions eliminate our exposure to future underwriting losses and significantly increase our share of a historically strong fee-based business.”
Second Quarter 2015 Performance Highlights
| · | Taxable equivalent revenues were $2.4 billion for the second quarter, up $23 million from the first quarter of 2015 |
| o | Net interest margin was 3.27%, down six basis points due to lower rates on new loans and runoff of loans acquired from the FDIC |
| o | Mortgage banking income was up $20 million, an annualized increase of 72.9% that reflects higher mortgage servicing income and higher commercial mortgage fee income due to increased volume |
| o | Fee income ratio was 46.3%, compared to 45.8% in the prior quarter, reflecting continued revenue diversification |
| · | Noninterest expense was $1.7 billion, up compared to the prior quarter primarily due to a $172 million loss on early extinguishment of debt |
| o | Personnel expense was up $34 million due to increased production-related incentives due to volume, seasonal increases in fringe benefits and approximately 500 additional full-time equivalent employees, which was primarily due to acquisitions |
| o | Merger-related and restructuring charges were $12 million higher as a result of increased activity related to The Bank of Kentucky, Susquehanna and AmRisc/American Coastal transactions |
| o | The adjusted efficiency ratio was 59.2% |
| · | Average loans and leases held for investment increased 3.9% on an annualized basis compared to the first quarter of 2015; up 7.8% excluding residential mortgage |
| o | Average C&I loans increased 10.6% |
| o | Average direct retail loans increased 12.6% |
| o | Average other lending subsidiaries loans increased 13.6% |
| o | Average residential mortgage loans decreased 7.4%, reflecting the strategic decision to continue to sell conforming mortgage loan production |
| - 2 - |
| · | Average deposits increased $2.3 billion, or 7.2% annualized, compared to the prior quarter |
| o | The Texas branch acquisition, completed in late March, contributed approximately $1.7 billion of the average deposit growth |
| o | The Bank of Kentucky acquisition added approximately $190 million in average deposits as a result of closing on June 19 |
| o | Excluding the impact of these acquisitions, average noninterest-bearing deposits increased $1.4 billion |
| o | Average interest-bearing deposit costs were 0.24%, down one basis point compared to the prior quarter |
| o | Deposit mix improved, with average noninterest-bearing deposits representing 31.5% of total deposits, compared to 30.6% in the prior quarter |
| · | Asset quality remained strong |
| o | Nonperforming assets decreased $36 million, or 4.7%, from March 31, 2015 |
| o | Delinquent loans increased $43 million, primarily due to seasonality |
| o | The allowance for loan loss coverage ratio was 2.55 times nonperforming loans held for investment at June 30, 2015, versus 2.45 times at March 31, 2015 |
| · | Capital levels remained strong across the board |
| o | Common equity tier 1 to risk-weighted assets was 10.4%, or 10.2% on a fully phased-in basis |
| o | Tier 1 risk-based capital was 12.1% |
| o | Total capital was 14.3% |
| o | Leverage capital was 10.2% |
| o | Tangible common equity to tangible assets was 8.1% |
| - 3 - |
| EARNINGS HIGHLIGHTS | Change | Change | ||||||||||||||
| (dollars in millions, except per share data) | Q2 | Q1 | Q2 | Q2 15 vs. | Q2 15 vs. | |||||||||||
| 2015 | 2015 | 2014 (2) | Q1 15 | Q2 14 | ||||||||||||
| Net income available to common shareholders | $ | 454 | $ | 488 | $ | 424 | $ | (34) | $ | 30 | ||||||
| Diluted earnings per common share | 0.62 | 0.67 | 0.58 | (0.05) | 0.04 | |||||||||||
| Net interest income - taxable equivalent | $ | 1,348 | $ | 1,347 | $ | 1,378 | $ | 1 | $ | (30) | ||||||
| Noninterest income | 1,019 | 997 | 958 | 22 | 61 | |||||||||||
| Total revenue | $ | 2,367 | $ | 2,344 | $ | 2,336 | $ | 23 | $ | 31 | ||||||
| Return on average assets (%) | 1.06 | 1.18 | 1.04 | (0.12) | 0.02 | |||||||||||
| Return on average risk-weighted assets (%) | 1.32 | 1.48 | 1.38 | (0.16) | (0.06) | |||||||||||
| Return on average common shareholders' equity (%) | 8.20 | 9.05 | 8.04 | (0.85) | 0.16 | |||||||||||
| Return on average tangible common shareholders' | ||||||||||||||||
| equity (%) | 12.76 | 14.00 | 12.77 | (1.24) | (0.01) | |||||||||||
| Net interest margin - taxable equivalent (%) | 3.27 | 3.33 | 3.43 | (0.06) | (0.16) | |||||||||||
| Efficiency ratio (1) (%) | 59.2 | 58.5 | 58.4 | 0.7 | 0.8 | |||||||||||
| (1) | Excludes certain items as detailed in the non-GAAP reconciliations in the Quarterly Performance Summary. |
| (2) | Applicable Q2 2014 amounts were revised as a result of the January 1, 2015 adoption of new guidance related to the accounting for investments in qualified affordable housing projects. |
Second Quarter 2015 compared to First Quarter 2015
Consolidated net income available to common shareholders for the second quarter of 2015 was $454 million, a decrease of $34 million compared to the first quarter of 2015. On a diluted per common share basis, earnings for the second quarter were $0.62, compared to $0.67 earned in the prior quarter. BB&T’s results of operations for the second quarter produced an annualized return on average assets of 1.06%, an annualized return on average risk-weighted assets of 1.32% and an annualized return on average common shareholders’ equity of 8.20%, compared to prior quarter ratios of 1.18%, 1.48% and 9.05%, respectively. BB&T’s return on average tangible common shareholders’ equity was 12.76% for the second quarter of 2015, compared to 14.00% for the prior quarter.
During May 2015, the U.S. Court of Appeals for the Federal Circuit rendered its decision on BB&T’s appeal of a prior ruling that disallowed foreign tax credits and other deductions claimed by a subsidiary in connection with a financing transaction. As a result of this decision, a portion of the earlier ruling was overturned and BB&T recognized net tax benefits of $107 million during the second quarter of 2015. Other aspects of the earlier ruling, which were adverse to BB&T, were affirmed by the Court of Appeals.
Results for the second quarter of 2015 included a loss on early extinguishment of higher cost FHLB advances of $172 million, or $107 million after-tax. The terminated advances totaled approximately $931 million and had a weighted average interest rate of 4.84% and a weighted average remaining life of approximately 6.6 years.
| - 4 - |
Effective May 31, 2015, BB&T completed the sale of American Coastal, which resulted in a pre-tax loss on sale of $26 million primarily due to the allocation of $49 million of goodwill. As a result of the goodwill being non-deductible for income tax purposes, the sale generated income tax expense of $8 million, resulting in a net after-tax loss of $34 million, or $0.05 per share.
Total revenues were $2.4 billion for the second quarter of 2015, an increase of $23 million compared to the prior quarter, which reflects an increase in noninterest income of $22 million and an increase in taxable-equivalent net interest income of $1 million.
The change in taxable-equivalent net interest income includes a $3 million decrease in interest income, driven by lower yields on new loans, and a $4 million decrease in interest expense. The net interest margin was 3.27% for the second quarter, a decrease of six basis points compared to the prior quarter. Average earning assets increased $2.1 billion, or 5.1% annualized, while average interest-bearing liabilities were down slightly to $116.1 billion. The annualized yield on the total loan portfolio for the second quarter was 4.18%, a five basis point decrease compared to the prior quarter, which primarily reflects lower yields on new loans and the continued runoff of higher yielding loans acquired from the FDIC. The annualized fully taxable-equivalent yield on the average securities portfolio for the second quarter was 2.41%, down six basis points compared to the prior quarter.
The average annualized cost of interest-bearing deposits was 0.24%, down one basis point compared to the prior quarter. The average annualized rate paid on long-term debt was 2.14%, a decrease of four basis points compared to the prior quarter, which primarily reflects the impact of the previously described extinguishment of FHLB advances.
The $22 million increase in noninterest income was primarily driven by higher mortgage banking income, FDIC loss share income and investment banking and brokerage fees and commissions, which increased $20 million, $15 million and $14 million, respectively. These increases were partially offset by a $25 million decline in other income primarily due to the $26 million pre-tax loss on the sale of American Coastal and $18 million in lower insurance income.
Excluding loans acquired from the FDIC, the provision for credit losses was $97 million and net charge-offs were $98 million for the second quarter, compared to $105 million and $100 million, respectively, for the prior quarter.
Noninterest expense was $1.7 billion for the second quarter, up $231 million compared to the prior quarter. This increase was driven by the previously discussed $172 million loss on early extinguishment of debt and a $34 million increase in personnel expense. The increase in personnel expense was primarily due to increased production-related incentives due to volume, annual raises, seasonal increases in fringe benefits and approximately 500 additional full-time equivalent employees, which largely resulted from the acquisitions.
The provision for income taxes was $80 million for the second quarter, compared to $241 million for the prior quarter. This produced an effective tax rate for the second quarter of 13.8%, compared to 30.6% for the prior quarter. The decrease is primarily attributable to the previously discussed $107 million tax benefit.
| - 5 - |
Second Quarter 2015 compared to Second Quarter 2014
Consolidated net income available to common shareholders for the second quarter of 2015 was $454 million, an increase of $30 million compared to the same quarter of 2014. On a diluted per common share basis, earnings for the second quarter of 2015 were $0.62, compared to $0.58 for the earlier quarter. BB&T’s results of operations for the second quarter of 2015 produced an annualized return on average assets of 1.06%, an annualized return on average risk-weighted assets of 1.32% and an annualized return on average common shareholders’ equity of 8.20%, compared to earlier quarter ratios of 1.04%, 1.38% and 8.04%, respectively. BB&T’s return on average tangible common shareholders’ equity was 12.76% for the second quarter of 2015, compared to 12.77% for the earlier quarter.
While the second quarter of 2015 included the tax benefit, loss on extinguishment of debt and loss on sale of American Coastal that, in the aggregate, totaled $34 million after-tax, or $0.05 per diluted share, the earlier quarter’s results were negatively impacted by after-tax adjustments totaling $88 million, or $0.12 per diluted share, that were recorded in connection with the identification of potential exposures related to residential mortgage loans originated by BB&T and insured by the Federal Housing Administration (“FHA”) and an adjustment to a previously recorded income tax reserve.
Total revenues were $2.4 billion for the second quarter of 2015, up $31 million compared to the earlier quarter as a $61 million increase in noninterest income was partially offset by a $30 million decrease in taxable-equivalent net interest income.
The change in taxable-equivalent net interest income includes a $47 million decrease in interest income, driven by lower yields on new loans and the continued run-off of loans acquired from the FDIC, and a $17 million decrease in interest expense. Net interest margin was 3.27%, compared to 3.43% for the earlier quarter. Average earning assets increased $4.3 billion, or 2.7%, while average interest-bearing liabilities decreased $2.1 billion, or 1.8%. The annualized yield on the total loan portfolio for the second quarter was 4.18%, a decrease of 27 basis points compared to the earlier quarter, which primarily reflects lower yields on new loans and continued runoff of higher yielding loans acquired from the FDIC. The annualized fully taxable-equivalent yield on the average securities portfolio for the second quarter was 2.41%, two basis points lower than the earlier period.
The average annualized cost of interest-bearing deposits was 0.24%, a decline of two basis points compared to the earlier quarter. The average annualized rate paid on long-term debt was 2.14%, a decrease of 24 basis points compared to the earlier quarter. This decrease was the result of lower rates on new issues during the last twelve months and early extinguishments of higher cost FHLB advances.
| - 6 - |
The $61 million increase in noninterest income was primarily driven by higher mortgage banking income, FDIC loss share income and investment banking and brokerage fees and commissions, which increased $44 million, $24 million and $16 million, respectively. These increases were partially offset by a $34 million decline in other income primarily due to the $26 million pre-tax loss on the sale of American Coastal.
Excluding loans acquired from the FDIC, the provision for credit losses was $97 million, compared to $83 million in the earlier quarter, primarily due to a reserve release in the earlier quarter. Net charge-offs for the second quarter of 2015, excluding loans acquired from the FDIC, totaled $98 million, down $19 million compared to the earlier quarter.
Noninterest expense was $1.7 billion for the second quarter of 2015, an increase of $119 million compared to the earlier quarter. This increase was driven by the $172 million loss on early extinguishment of debt and a $55 million increase in personnel expense, partially offset by a $77 million decrease in other expense and a $43 million decrease in loan-related expense that was primarily due to a charge related to FHA-insured mortgage loans in the earlier quarter.
The provision for income taxes was $80 million for the second quarter of 2015, compared to $216 million for the earlier quarter. This produced an effective tax rate for the second quarter of 2015 of 13.8%, compared to 31.2% for the earlier quarter. The current quarter included the tax benefit of $107 million discussed above and the earlier quarter included a $14 million tax provision related to the IRS’s change in stance related to an income tax position that was under examination.
| NONINTEREST INCOME | % Change | % Change | ||||||||||||||
| (dollars in millions) | Q2 | Q1 | Q2 | Q2 15 vs. | Q2 15 vs. | |||||||||||
| 2015 | 2015 | 2014 | Q1 15 | Q2 14 | ||||||||||||
| (annualized) | ||||||||||||||||
| Insurance income | $ | 422 | $ | 440 | $ | 422 | (16.4) | ― | ||||||||
| Service charges on deposits | 154 | 145 | 158 | 24.9 | (2.5) | |||||||||||
| Mortgage banking income | 130 | 110 | 86 | 72.9 | 51.2 | |||||||||||
| Investment banking and brokerage fees and | ||||||||||||||||
| commissions | 108 | 94 | 92 | 59.7 | 17.4 | |||||||||||
| Bankcard fees and merchant discounts | 55 | 50 | 54 | 40.1 | 1.9 | |||||||||||
| Trust and investment advisory revenues | 57 | 56 | 55 | 7.2 | 3.6 | |||||||||||
| Checkcard fees | 43 | 39 | 42 | 41.1 | 2.4 | |||||||||||
| Operating lease income | 30 | 29 | 20 | 13.8 | 50.0 | |||||||||||
| Income from bank-owned life insurance | 27 | 30 | 25 | (40.1) | 8.0 | |||||||||||
| FDIC loss share income, net | (64) | (79) | (88) | (76.2) | (27.3) | |||||||||||
| Securities gains (losses), net | (1) | ― | ― | NM | NM | |||||||||||
| Other income (1) | 58 | 83 | 92 | (120.8) | (37.0) | |||||||||||
| Total noninterest income | $ | 1,019 | $ | 997 | $ | 958 | 8.9 | 6.4 | ||||||||
| (1) | The Q2 2014 amount was revised as a result of the January 1, 2015 adoption of new guidance related to the accounting for investments in qualified affordable housing projects. | |||||||||||||||
| NM - not meaningful. | ||||||||||||||||
| - 7 - |
Second Quarter 2015 compared to First Quarter 2015
Noninterest income was $1.0 billion for the second quarter, up $22 million compared to the prior quarter. This increase was driven by higher mortgage banking income, FDIC loss share income and investment banking and brokerage fees and commissions, partially offset by lower other income and insurance income. Mortgage banking income was $20 million higher than the prior quarter, primarily reflecting higher net mortgage servicing rights income and higher commercial mortgage fee income due to increased volumes. FDIC loss share income was $15 million better primarily due to the loss share offsets on securities duration adjustments and lower negative accretion related to loans. Investment banking and brokerage fees and commissions were up $14 million, driven by increased capital markets activity. Other income was down $25 million primarily due to the sale of American Coastal, which generated a pre-tax loss of $26 million, and a $12 million reduction in income from private equity investments, which was partially offset by improvement in several other categories of other income. Insurance income declined $18 million with approximately $11 million of the reduction due to the sale of American Coastal.
Second Quarter 2015 compared to Second Quarter 2014
Noninterest income for the second quarter of 2015 increased $61 million, or 6.4%, compared to the earlier quarter. This increase was primarily driven by $44 million of higher mortgage banking income, which reflects higher net mortgage servicing rights income, higher gains on sales of loans and improvement in commercial mortgage fee income due to higher loan volume. In addition, FDIC loss share income was better $24 million primarily due to lower negative accretion related to loans, and investment banking and brokerage fees and commissions was $16 million higher primarily due to increased capital markets activity and investment commissions. Operating lease income increased $10 million primarily due to higher volumes. These increases were partially offset by a $34 million decrease in other income, which was primarily driven by the loss on sale of American Coastal.
| NONINTEREST EXPENSE | % Change | % Change | |||||||||||||
| (dollars in millions) | Q2 | Q1 | Q2 | Q2 15 vs. | Q2 15 vs. | ||||||||||
| 2015 | 2015 | 2014 | Q1 15 | Q2 14 | |||||||||||
| (annualized) | |||||||||||||||
| Personnel expense | $ | 864 | $ | 830 | $ | 809 | 16.4 | 6.8 | |||||||
| Occupancy and equipment expense | 166 | 167 | 168 | (2.4) | (1.2) | ||||||||||
| Loan-related expense | 37 | 38 | 80 | (10.6) | (53.8) | ||||||||||
| Software expense | 46 | 44 | 42 | 18.2 | 9.5 | ||||||||||
| Professional services | 35 | 24 | 34 | 183.8 | 2.9 | ||||||||||
| Outside IT services | 29 | 30 | 31 | (13.4) | (6.5) | ||||||||||
| Regulatory charges | 25 | 23 | 30 | 34.9 | (16.7) | ||||||||||
| Amortization of intangibles | 23 | 21 | 23 | 38.2 | ― | ||||||||||
| Foreclosed property expense | 14 | 13 | 10 | 30.9 | 40.0 | ||||||||||
| Merger-related and restructuring charges, net | 25 | 13 | 13 | NM | 92.3 | ||||||||||
| Loss on early extinguishment of debt | 172 | ― | ― | NM | NM | ||||||||||
| Other expense | 217 | 219 | 294 | (3.7) | (26.2) | ||||||||||
| Total noninterest expense | $ | 1,653 | $ | 1,422 | $ | 1,534 | 65.2 | 7.8 | |||||||
| - 8 - |
Second Quarter 2015 compared to First Quarter 2015
Noninterest expense was $1.7 billion for the second quarter, up $231 million compared to the prior quarter. As previously discussed, the current quarter included a loss on early extinguishment of debt totaling $172 million.
Personnel expense was up $34 million, reflecting $22 million in higher incentives that were largely the result of increased production. In addition, salary expense increased $18 million, primarily due to annual raises effective on April 1 and approximately 500 more full-time equivalent employees, which was largely the result of acquisitions. Equity-based compensation was up $12 million due to accelerated expense recognition as a result of retirement eligibility provisions. These increases were partially offset by a $13 million improvement in payroll taxes as a result of a seasonally high first quarter due to annual limit resets.
Merger-related and restructuring charges were $12 million higher than the prior quarter primarily due to activity related to The Bank of Kentucky and Susquehanna Bancshares as well as the AmRisc/American Coastal transactions. Professional services increased $11 million due to higher legal fees and other project related professional services.
Second Quarter 2015 compared to Second Quarter 2014
Noninterest expense for the second quarter of 2015 was $119 million higher than the same period of 2014. The increase was primarily driven by the loss on early extinguishment of debt, higher personnel expense and higher merger-related and restructuring charges. The increase in personnel expense of $55 million reflects a $19 million increase in qualified pension plan expense that was driven by higher amortization of net actuarial losses and higher service cost. Personnel expense was also higher due to a $14 million increase in production-related incentives due to strong performance at fee income-generating businesses and a $12 million increase in employee health costs. The annual raises effective April 1 were largely offset by approximately 1,000 fewer full-time equivalent employees. Other expense and loan-related expense decreased $77 million and $43 million, respectively, primarily due to charges recognized in the earlier period related to FHA-insured loan originations.
| - 9 - |
| LOANS AND LEASES - average balances | % Change | % Change | ||||||||||||
| (dollars in millions) | Q2 | Q1 | Q2 | Q2 15 vs. | Q2 15 vs. | |||||||||
| 2015 | 2015 | 2014 | Q1 15 | Q2 14 | ||||||||||
| (annualized) | ||||||||||||||
| Commercial and industrial | $ | 42,541 | $ | 41,448 | $ | 39,397 | 10.6 | 8.0 | ||||||
| CRE - income producing properties | 10,730 | 10,680 | 10,382 | 1.9 | 3.4 | |||||||||
| CRE - construction and development | 2,767 | 2,734 | 2,566 | 4.8 | 7.8 | |||||||||
| Direct retail lending | 8,449 | 8,191 | 7,666 | 12.6 | 10.2 | |||||||||
| Sales finance | 10,517 | 10,498 | 10,028 | 0.7 | 4.9 | |||||||||
| Revolving credit | 2,365 | 2,385 | 2,362 | (3.4) | 0.1 | |||||||||
| Residential mortgage | 29,862 | 30,427 | 32,421 | (7.4) | (7.9) | |||||||||
| Other lending subsidiaries | 11,701 | 11,318 | 10,553 | 13.6 | 10.9 | |||||||||
| Acquired from FDIC | 1,055 | 1,156 | 1,739 | (35.0) | (39.3) | |||||||||
| Total loans and leases held for investment | $ | 119,987 | $ | 118,837 | $ | 117,114 | 3.9 | 2.5 | ||||||
Average loans held for investment for the second quarter of 2015 were $120.0 billion, up $1.2 billion compared to the first quarter of 2015. The increase in average loans held for investment was primarily due to an increase of $1.1 billion in commercial and industrial average loans, a $383 million increase in average other lending subsidiaries loans and a $258 million increase in average direct retail lending loans. These increases were partially offset by a $565 million decline in average residential mortgage loans and continued run-off of loans acquired from the FDIC. The acquisition of The Bank of Kentucky, which added $1.2 billion of loans, contributed approximately $146 million in average loans for the quarter.
Average commercial and industrial loans increased an annualized 10.6%, which reflects growth from large corporate clients and increased mortgage warehouse lending. Average other lending subsidiaries loans were up an annualized 13.6% primarily due to seasonal activity. Average direct retail lending loans were up an annualized 12.6% primarily due to an increase in home equity line balances.
The decrease of $565 million, or 7.4% annualized, in the residential mortgage portfolio reflects the continued strategy to sell all conforming residential mortgage loan production.
| DEPOSITS - average balances | % Change | % Change | |||||||||||||
| (dollars in millions) | Q2 | Q1 | Q2 | Q2 15 vs. | Q2 15 vs. | ||||||||||
| 2015 | 2015 | 2014 | Q1 15 | Q2 14 | |||||||||||
| (annualized) | |||||||||||||||
| Noninterest-bearing deposits | $ | 41,502 | $ | 39,701 | $ | 36,634 | 18.2 | 13.3 | |||||||
| Interest checking | 20,950 | 20,623 | 18,406 | 6.4 | 13.8 | ||||||||||
| Money market and savings | 53,852 | 51,644 | 48,965 | 17.1 | 10.0 | ||||||||||
| Time deposits | 14,800 | 17,000 | 25,010 | (51.9) | (40.8) | ||||||||||
| Foreign office deposits - interest-bearing | 764 | 563 | 584 | 143.2 | 30.8 | ||||||||||
| Total deposits | $ | 131,868 | $ | 129,531 | $ | 129,599 | 7.2 | 1.8 | |||||||
| - 10 - |
Average deposits for the second quarter were $131.9 billion, an increase of $2.3 billion or 7.2% annualized compared to the prior quarter. The change in average deposits reflects improved mix, with noninterest-bearing deposits up $1.8 billion, or 18.2% annualized, while interest-bearing balances were up $536 million, or 2.4% annualized. The first quarter acquisition of 41 branches in Texas had an estimated $387 million favorable impact on average noninterest-bearing deposits and a $1.3 billion impact on average interest-bearing deposits, while the second quarter acquisition of The Bank of Kentucky had an estimated $190 million favorable impact on average deposits.
Noninterest-bearing deposits represented 31.5% of total average deposits for the second quarter, compared to 30.6% for the prior quarter and 28.3% a year ago.
The growth in average noninterest-bearing deposits includes an increase in average commercial accounts totaling $1.6 billion and an increase in average consumer accounts totaling $503 million, partially offset by a decrease in average public funds accounts totaling $369 million.
Excluding the Texas branch acquisition and The Bank of Kentucky acquisition, average noninterest bearing deposits increased $1.4 billion, average money market and savings increased $1.4 billion and average time deposits declined $2.4 billion.
The cost of interest-bearing deposits was 0.24% for the second quarter, down one basis point compared to the prior quarter.
| SEGMENT RESULTS | Change | Change | ||||||||||||||
| (dollars in millions) | Q2 | Q1 | Q2 | Q2 15 vs. | Q2 15 vs. | |||||||||||
| Segment Net Income | 2015 | 2015 | 2014 | Q1 15 | Q2 14 | |||||||||||
| Community Banking | $ | 234 | $ | 210 | $ | 219 | $ | 24 | $ | 15 | ||||||
| Residential Mortgage Banking | 72 | 64 | (21) | 8 | 93 | |||||||||||
| Dealer Financial Services | 49 | 45 | 63 | 4 | (14) | |||||||||||
| Specialized Lending | 70 | 57 | 60 | 13 | 10 | |||||||||||
| Insurance Services | 53 | 72 | 57 | (19) | (4) | |||||||||||
| Financial Services | 68 | 66 | 67 | 2 | 1 | |||||||||||
| Other, Treasury and Corporate | (45) | 33 | 32 | (78) | (77) | |||||||||||
| Total net income | $ | 501 | $ | 547 | $ | 477 | $ | (46) | $ | 24 | ||||||
Second Quarter 2015 compared to First Quarter 2015
Community Banking
Community Banking serves individual and business clients by offering a variety of loan and deposit products and other financial services. The segment is primarily responsible for acquiring and maintaining client relationships.
| - 11 - |
Community Banking net income was $234 million for the second quarter of 2015, an increase of $24 million compared to the prior quarter. Segment net interest income increased $26 million, primarily driven by deposit growth coupled with higher funding spreads on deposits, partially offset by lower interest rates on new loans. Noninterest income increased $20 million, primarily due to higher service charges on deposits, bankcard and merchant services fees, and checkcard fees. Noninterest expense increased $14 million driven by higher salary, equity-based compensation and employee benefit expense. The increase in noninterest expense was partially attributable to the acquisitions during the current and prior quarters. Average loans grew $309 million, or 2.5% on an annualized basis, while average transaction account deposits grew $1.9 billion, or 13.8% on an annualized basis.
Residential Mortgage Banking
Residential Mortgage Banking retains and services mortgage loans originated by BB&T as well as those purchased from various correspondent originators. Mortgage loan products include fixed and adjustable-rate government guaranteed and conventional loans for the purpose of constructing, purchasing or refinancing residential properties. Substantially all of the properties are owner-occupied.
Residential Mortgage Banking net income was $72 million for the second quarter of 2015, an increase of $8 million compared to the prior quarter. Segment net interest income increased $7 million, primarily the result of higher average loans held for sale balances and higher credit spreads on new loans held for investment, partially offset by lower average loans held for investment balances. Noninterest income increased $17 million driven by an increase in net mortgage servicing rights income. The allocated provision for credit losses was $3 million in the second quarter of 2015, compared to a benefit of $12 million in the prior quarter, primarily due to stabilization in the improvement in loss severity trends.
Dealer Financial Services
Dealer Financial Services primarily originates loans to consumers for the purchase of automobiles. These loans are originated on an indirect basis through approved franchised and independent automobile dealers throughout BB&T’s market area through BB&T Dealer Finance, and on a national basis through Regional Acceptance Corporation. Dealer Financial Services also originates loans for the purchase of recreational and marine vehicles and, in conjunction with the Community Bank, provides financing and servicing to dealers for their inventories.
Dealer Financial Services net income was $49 million for the second quarter of 2015, an increase of $4 million compared to the prior quarter. Segment net interest income increased $3 million, primarily driven by growth in the Regional Acceptance loan portfolio. The allocated provision for credit losses decreased $13 million, primarily due to seasonally lower net charge-offs in the Regional Acceptance loan portfolio. Dealer Financial Services’ average loans increased by $62 million, or 1.8%, on an annualized basis.
| - 12 - |
Specialized Lending
Specialized Lending consists of businesses that provide specialty finance alternatives to commercial and consumer clients including: commercial finance, mortgage warehouse lending, tax-exempt financing for local governments and special-purpose districts, equipment leasing, full-service commercial mortgage banking, commercial and retail insurance premium finance, and dealer-based financing of equipment for consumers and small businesses.
Specialized Lending net income was $70 million for the second quarter of 2015, an increase of $13 million compared to the prior quarter. Segment net interest income increased $6 million driven by strong growth in mortgage warehouse loans, small ticket consumer loans and commercial mortgage loans, partially offset by lower interest rates on new loans. Noninterest income increased $10 million driven by higher commercial mortgage income, higher gains on finance leases and higher operating lease income. The allocated provision for credit losses decreased $12 million primarily due to higher prior period charge-offs and revisions to loss estimates in the commercial finance loan portfolio. Specialized Lending grew average loans by $1.1 billion, or 26.0% on an annualized basis.
Insurance Services
BB&T’s insurance agency / brokerage network is the fifth largest in the United States and sixth largest in the world. Insurance Services provides property and casualty, life and health insurance to business and individual clients. It also provides small business and corporate products, such as workers compensation and professional liability, as well as surety coverage and title insurance.
During the second quarter of 2015, BB&T completed its sale of American Coastal Insurance Company and increased its partnership interest in AmRisc, LP, a managing general underwriter for commercial property risks. The sale of American Coastal Insurance Company eliminates BB&T's exposure to potential underwriting losses in the future.
Insurance Services net income was $53 million in the second quarter of 2015, a decrease of $19 million compared to the prior quarter. Insurance Service’s noninterest income decreased $17 million, which primarily reflects a seasonal decrease in employee benefits insurance commissions and lower direct commercial property and casualty insurance premiums due to the sale of American Coastal, partially offset by a seasonal increase in commercial property and casualty insurance business and higher performance-based insurance commissions. Noninterest expense increased $8 million driven by higher salary and incentive expense and merger-related charges.
| - 13 - |
Financial Services
Financial Services provides personal trust administration, estate planning, investment counseling, wealth management, asset management, employee benefits services, corporate banking and corporate trust services to individuals, corporations, institutions, foundations and government entities. In addition, Financial Services offers clients investment alternatives, including discount brokerage services, equities, fixed-rate and variable-rate annuities, mutual funds and governmental and municipal bonds through BB&T Investment Services, Inc. The segment also includes BB&T Securities, a full-service brokerage and investment banking firm, the Corporate Banking Division, which originates and services large corporate relationships, syndicated lending relationships and client derivatives, and BB&T Capital Partners, which manages the company’s SBIC private equity investments.
Financial Services net income was $68 million in the second quarter of 2015, an increase of $2 million compared to the prior quarter. Segment net interest income increased $6 million driven by Corporate Banking loan and deposit growth and higher interest rates on new loans. Noninterest income increased $10 million primarily due to higher capital market activity. Noninterest expense increased $15 million compared to the prior quarter, driven by higher incentive expense and operating charge-offs.
Financial Services generated significant loan growth with Corporate Banking’s average loan balances increasing $465 million, or an annualized 17.2%, over the prior quarter, while BB&T Wealth’s average loan balances increased $100 million, or 29.8% on an annualized basis. Corporate Banking’s average deposits grew $755 million, or 37.5% on an annualized basis.
Other, Treasury & Corporate
Net income in Other, Treasury & Corporate can vary due to the changing needs of the Corporation, including the size of the investment portfolio, the need for wholesale funding and income received from derivatives used to hedge the balance sheet.
In the second quarter of 2015, Other, Treasury & Corporate generated a net loss of $45 million, compared to net income of $33 million in the prior quarter. Segment net interest income decreased $46 million driven by the continued run-off of loans acquired from the FDIC, duration adjustments on securities acquired from the FDIC, lower deposit funding spreads and lower credit spreads on other earning assets. Noninterest income decreased $18 million, primarily due to the loss on the previously discussed sale of American Coastal. The allocated provision for credit losses increased $11 million primarily due to a reserve release in the loan portfolio acquired from the FDIC in the prior quarter. Noninterest expense increased $179 million driven by the previously discussed $172 million loss on early extinguishment of FLHB advances in the current quarter.
| - 14 - |
Second Quarter 2015 compared to Second Quarter 2014
Community Banking
Community Banking net income was $234 million for the second quarter of 2015, an increase of $15 million compared to the earlier quarter. Segment net interest income increased $8 million, primarily driven by deposit growth and commercial real estate and direct retail loan growth, partially offset by lower funding spreads on deposits and lower interest rates on new commercial loans. Noninterest income decreased $10 million, primarily due to lower service charges on deposits, letter of credit fees and commercial loan fees. Intersegment referral fee income increased $10 million driven by higher loan referrals to the Residential Mortgage Banking segment. The allocated provision for credit losses decreased $24 million as the result of lower commercial and direct retail net charge-offs.
Residential Mortgage Banking
Residential Mortgage Banking net income was $72 million for the second quarter of 2015, compared to a net loss of $21 million in the earlier quarter. Segment net interest income decreased $9 million, primarily the result of lower average loan balances due to the current strategy of selling substantially all conforming mortgage loan production and lower interest rates on new loans. Noninterest income increased $33 million driven by an increase in net mortgage servicing rights income and an increase in gains on mortgage loan production and sales driven by higher mortgage loan originations and margins. The improvement in gain on sale margins was the result of improved pricing and a higher mix of retail saleable production. Noninterest expense decreased $130 million compared to the prior quarter, which primarily reflects the impact of prior year adjustments totaling $118 million relating to FHA-insured loan exposures.
Dealer Financial Services
Dealer Financial Services net income was $49 million for the second quarter of 2015, a decrease of $14 million compared to the earlier quarter. Segment net interest income increased $10 million, primarily driven by growth in the Regional Acceptance loan portfolio and the inclusion of dealer floor plan loans in the segment in the current quarter, partially offset by lower interest rates on new loans. The allocated provision for credit losses increased $17 million, primarily due to higher net charge-offs and higher expectations of loss severity related to the nonprime automobile loan portfolio. Noninterest expense increased $13 million driven by higher personnel, professional services and other expenses. Adjusted for the inclusion of dealer floor plan loans, Dealer Financial Services grew average loans by $850 million, or 6.6% compared to the earlier quarter.
| - 15 - |
Specialized Lending
Specialized Lending net income was $70 million for the second quarter of 2015, an increase of $10 million compared to the earlier quarter. Segment net interest income increased $2 million driven by strong growth in mortgage warehouse loans, small ticket consumer loans and commercial mortgage loans, partially offset by lower interest rates on new loans. Noninterest income increased $23 million driven by higher commercial mortgage and operating lease income. The allocated provision for credit losses decreased $6 million primarily due to an improvement in credit trends in the commercial finance loan portfolio. Noninterest expense increased $15 million, primarily due to higher personnel expense, depreciation of property under operating leases and loan processing expense. Specialized Lending grew average loans $1.8 billion or 11.5% compared to the earlier quarter, led by Mortgage Warehouse Lending with $725 million or 64.4% loan growth and Grandbridge with $284 million or 64.8% loan growth.
Insurance Services
Insurance Services net income was $53 million in the second quarter of 2015, a decrease of $4 million compared to the earlier quarter. Insurance Service’s noninterest income increased $1 million, which primarily reflects higher new and renewal commercial property and casualty insurance business and higher performance-based commissions, partially offset by lower direct commercial property and casualty insurance premiums due to the previously discussed sale of American Coastal. Noninterest expense increased $2 million driven by higher employee insurance and pension expense and merger-related charges, partially offset by lower incentives and operating charge-offs and a reduction in certain actuarially determined loss reserves.
Financial Services
Financial Services net income was $68 million in the second quarter of 2015, an increase of $1 million compared to the earlier quarter. Segment net interest income increased $18 million driven by Corporate Banking and BB&T Wealth loan and deposit growth, partially offset by lower interest rates on new loans and lower funding spreads on deposits. Noninterest income increased $20 million due to higher capital market fees, investment commissions and brokerage fees and commercial loan fees. The allocated provision for credit losses increased $20 million as the result of portfolio mix and risk expectations related to the oil and energy sector. Noninterest expense increased $15 million compared to the earlier quarter, primarily driven by higher incentive and employee benefit expense.
| - 16 - |
Other, Treasury & Corporate
In the second quarter of 2015, Other, Treasury & Corporate generated a net loss of $45 million, compared to net income of $32 million in the earlier quarter. Segment net interest income decreased $58 million driven by lower acquired from FDIC loan balances and credit spreads, duration adjustments on securities acquired from the FDIC, and lower funding spreads on interest-bearing deposits. Noninterest income decreased $6 million, primarily due to the loss on the previously mentioned sale of American Coastal, partially offset by better FDIC loss share income. The allocated provision for credit losses was $5 million in the second quarter of 2015, compared to a benefit of $7 million in the earlier quarter, which primarily reflects changes in provision expense related to loans acquired from the FDIC and a provision benefit in the commercial finance loan portfolio shared by other segments. Noninterest expense increased $203 million, primarily due to the previously mentioned $172 million loss on early extinguishment of FLHB advances in the current quarter and higher personnel expense and merger-related charges. Intersegment referral fee expenses decreased $12 million driven by higher loan referrals to the Residential Mortgage Banking segment shared by other segments. Allocated corporate expense decreased by $19 million compared to the earlier quarter.
| CAPITAL RATIOS (1) | |||||||||||
| Basel III | Basel I | ||||||||||
| Q2 | Q1 | Q4 | Q3 | Q2 | |||||||
| 2015 | 2015 | 2014 | 2014 | 2014 | |||||||
| Risk-based: | |||||||||||
| Common equity Tier 1 (%) | 10.4 | 10.5 | N/A | N/A | N/A | ||||||
| Tier 1 (%) | 12.1 | 12.2 | 12.4 | 12.4 | 12.1 | ||||||
| Total (%) | 14.3 | 14.4 | 14.9 | 15.1 | 14.4 | ||||||
| Leverage (%) | 10.2 | 10.1 | 9.9 | 9.7 | 9.5 | ||||||
| Tangible common equity to tangible assets (%) (2) | 8.1 | 8.0 | 8.0 | 7.9 | 7.7 | ||||||
| (1) | Regulatory capital ratios are preliminary. |
| (2) | Tangible common equity and related ratios are non-GAAP measures. See the calculations and management's reasons for using these measures in the Capital Information – Five Quarter Trend of the Quarterly Performance Summary. |
Capital levels remained strong at June 30, 2015. BB&T declared total common dividends of $0.27 during the second quarter of 2015, which resulted in a dividend payout ratio of 42.9%. Risk-based capital ratios were down slightly from the prior quarter as The Bank of Kentucky and AmRisc/American Coastal transactions used approximately 0.2% of capital levels, partially offset by growth from earnings in excess of dividends.
BB&T’s estimated common equity Tier 1 ratio under Basel III, on a fully-phased in basis, was approximately 10.2% at June 30, 2015 and 10.3% at March 31, 2015.
BB&T’s liquidity coverage ratio was approximately 118% at June 30, 2015, compared to the regulatory minimum of 90%. In addition, the liquid asset buffer, which is defined as high quality unencumbered liquid assets as a percentage of total assets, was 13.3% at June 30, 2015.
| - 17 - |
| ASSET QUALITY (1) | Change | Change | |||||||||||||
| (dollars in millions) | Q2 | Q1 | Q2 | Q2 15 vs. | Q2 15 vs. | ||||||||||
| 2015 | 2015 | 2014 | Q1 15 | Q2 14 | |||||||||||
| Total nonperforming assets | $ | 729 | $ | 765 | $ | 972 | $ | (36) | $ | (243) | |||||
| Total performing TDRs | 1,027 | 996 | 1,686 | 31 | (659) | ||||||||||
| Total loans 90 days past due and still accruing | 361 | 392 | 605 | (31) | (244) | ||||||||||
| Total loans 30-89 days past due | 833 | 759 | 1,021 | 74 | (188) | ||||||||||
| Nonperforming loans and leases as a percentage of | |||||||||||||||
| loans and leases held for investment (%) | 0.47 | 0.50 | 0.70 | (0.03) | (0.23) | ||||||||||
| Nonperforming assets as a percentage of total assets (%) | 0.38 | 0.40 | 0.52 | (0.02) | (0.14) | ||||||||||
| Allowance for loan and lease losses as a percentage of | |||||||||||||||
| loans and leases held for investment (%) | 1.19 | 1.22 | 1.33 | (0.03) | (0.14) | ||||||||||
| Net charge-offs as a percentage of average loans and | |||||||||||||||
| leases (%) annualized | 0.33 | 0.34 | 0.41 | (0.01) | (0.08) | ||||||||||
| Ratio of allowance for loan and lease losses to net | |||||||||||||||
| charge-offs (times) annualized | 3.71 | 3.60 | 3.28 | 0.11 | 0.43 | ||||||||||
| Ratio of allowance for loan and lease losses to | |||||||||||||||
| nonperforming loans and leases held for | |||||||||||||||
| investment (times) | 2.55 | 2.45 | 1.89 | 0.10 | 0.66 | ||||||||||
| (1) | Excludes amounts related to government guaranteed GNMA mortgage loans that BB&T has the right but not the obligation to repurchase. See footnotes on the Credit Quality pages of the Quarterly Performance Summary for additional information. |
Nonperforming assets decreased $36 million, or 4.7%, during the quarter ended June 30, 2015. At June 30, 2015, nonperforming loans and leases represented 0.47% of loans and leases held for investment, compared to 0.50% at March 31, 2015.
Loans 30-89 days past due and still accruing, excluding government guaranteed GNMA mortgage loans that BB&T has the right but not the obligation to repurchase, totaled $833 million at June 30, 2015, an increase of $74 million compared to the prior quarter. This reflects an increase of $79 million for other lending subsidiaries, which primarily reflects seasonal trends.
Loans 90 days or more past due and still accruing totaled $361 million at June 30, 2015, a decrease of $31 million compared to the prior quarter. This decline is primarily attributable to a $30 million decrease in delinquent loans acquired from the FDIC as those balances continue to run-off. Excluding loans acquired from the FDIC, the ratio of loans 90 days or more past due and still accruing as a percentage of loans and leases was 0.19% at June 30, 2015, a decline of one basis point compared to the prior quarter.
Net charge-offs during the second quarter totaled $98 million, a decline of $3 million compared to the prior quarter. As a percentage of average loans and leases, annualized net charge-offs were 0.33%, compared to 0.34% in the prior quarter.
| - 18 - |
The allowance for loan and lease losses, excluding the allowance for loans acquired from the FDIC, was $1.4 billion, essentially flat compared to the prior quarter. The allowance for loans acquired from the FDIC was $57 million, flat compared to the prior quarter. As of June 30, 2015, the total allowance for loan and lease losses was 1.19% of loans and leases held for investment, compared to 1.22% at March 31, 2015. The allowance for loan and lease losses was 2.55 times nonperforming loans and leases held for investment, compared to 2.45 times at March 31, 2015. At June 30, 2015, the allowance for loan and lease losses was 3.71 times annualized net charge-offs, compared to 3.60 times at March 31, 2015.
Earnings presentation and Quarterly Performance Summary
To listen to BB&T’s live second quarter 2015 earnings conference call at 8 a.m. (ET) today, please call 1-888-632-5009 and enter the participant code 5184622. A presentation will be used during the earnings conference call and is available on our website at www.bbt.com. Replays of the conference call will be available for 30 days by dialing 888-203-1112 (access code 4313363).
The presentation, including an appendix reconciling non-GAAP disclosures, is available at www.bbt.com.
BB&T’s second quarter 2015 Quarterly Performance Summary, which contains detailed financial schedules, is available on BB&T’s website at www.bbt.com.
About BB&T
As of June 30, 2015, BB&T is one of the largest financial services holding companies in the U.S. with $191 billion in assets and market capitalization of $29.6 billion. Based in Winston-Salem, N.C., the company operates 1,903 financial centers in 13 states and Washington, D.C., and offers a full range of consumer and commercial banking, securities brokerage, asset management, mortgage and insurance products and services. A Fortune 500 company, BB&T is consistently recognized for outstanding client satisfaction by the U.S. Small Business Administration, Greenwich Associates and others. More information about BB&T and its full line of products and services is available at www.bbt.com.
#-#-#
Capital ratios are preliminary. Credit quality data excludes government guaranteed GNMA loans where applicable.
| - 19 - |
This news release contains financial information and performance measures determined by methods other than in accordance with accounting principles generally accepted in the United States of America (“GAAP”). BB&T’s management uses these “non-GAAP” measures in their analysis of the Corporation’s performance and the efficiency of its operations. Management believes that these non-GAAP measures provide a greater understanding of ongoing operations and enhance comparability of results with prior periods as well as demonstrating the effects of significant gains and charges in the current period. The company believes that a meaningful analysis of its financial performance requires an understanding of the factors underlying that performance. BB&T’s management believes that investors may use these non-GAAP financial measures to analyze financial performance without the impact of unusual items that may obscure trends in the company’s underlying performance. These disclosures should not be viewed as a substitute for financial measures determined in accordance with GAAP, nor are they necessarily comparable to non-GAAP performance measures that may be presented by other companies. Below is a listing of the types of non-GAAP measures used in this news release:
| · | Tangible common equity and related ratios are non-GAAP measures. The return on average risk-weighted assets is a non-GAAP measure. BB&T's management uses these measures to assess the quality of capital and believes that investors may find them useful in their analysis of the Corporation. |
| · | The ratio of loans greater than 90 days and still accruing interest as a percentage of loans held for investment has been adjusted to remove the impact of loans that are or were covered by FDIC loss sharing agreements. Management believes that their inclusion may result in distortion of these ratios such that they might not be comparable to other periods presented or to other portfolios that were not impacted by purchase accounting. |
| · | Fee income and efficiency ratios are non-GAAP in that they exclude securities gains (losses), foreclosed property expense, amortization of intangible assets, merger-related and restructuring charges, the impact of FDIC loss share accounting and other selected items. BB&T’s management uses these measures in their analysis of the Corporation’s performance. BB&T’s management believes these measures provide a greater understanding of ongoing operations and enhance comparability of results with prior periods, as well as demonstrating the effects of significant gains and charges. |
| · | Return on average tangible common shareholders’ equity is a non-GAAP measure that calculates the return on average common shareholders’ equity without the impact of intangible assets and their related amortization. This measure is useful for evaluating the performance of a business consistently, whether acquired or developed internally. |
| · | Core net interest margin is a non-GAAP measure that adjusts net interest margin to exclude the impact of interest income and funding costs associated with loans and securities acquired in the Colonial acquisition. BB&T’s management believes that the exclusion of the generally higher yielding assets acquired in the Colonial acquisition from the calculation of net interest margin provides investors with useful information related to the relative performance of the remainder of BB&T’s earning assets. |
A reconciliation of these non-GAAP measures to the most directly comparable GAAP measure is included in BB&T’s Second Quarter 2015 Quarterly Performance Summary, which is available on BB&T’s website at www.bbt.com.
| - 20 - |
This news release contains “forward-looking statements” within the meaning of the Private Securities Litigation Reform Act of 1995, regarding the financial condition, results of operations, business plans and the future performance of BB&T that are based on the beliefs and assumptions of the management of BB&T and the information available to management at the time that these disclosures were prepared. Words such as “anticipates,” “believes,” “estimates,” “expects,” “forecasts,” “intends,” “plans,” “projects,” “may,” “will,” “should,” “could,” and other similar expressions are intended to identify these forward-looking statements. Such statements are subject to factors that could cause actual results to differ materially from anticipated results. Such factors include, but are not limited to, the following:
| · | general economic or business conditions, either nationally or regionally, may be less favorable than expected, resulting in, among other things, a deterioration in credit quality and/or a reduced demand for credit, insurance or other services; |
| · | disruptions to the credit and financial markets, either nationally or globally, including the impact of a downgrade of U.S. government obligations by one of the credit ratings agencies and the adverse effects of recessionary conditions in Europe; |
| · | changes in the interest rate environment and cash flow reassessments may reduce NIM and/or the volumes and values of loans made or held as well as the value of other financial assets held; |
| · | competitive pressures among depository and other financial institutions may increase significantly; |
| · | legislative, regulatory or accounting changes, including changes resulting from the adoption and implementation of the Dodd-Frank Act may adversely affect the businesses in which BB&T is engaged; |
| · | local, state or federal taxing authorities may take tax positions that are adverse to BB&T; |
| · | a reduction may occur in BB&T’s credit ratings; |
| · | adverse changes may occur in the securities markets; |
| · | competitors of BB&T may have greater financial resources and develop products that enable them to compete more successfully than BB&T and may be subject to different regulatory standards than BB&T; |
| · | natural or other disasters could have an adverse effect on BB&T in that such events could materially disrupt BB&T’s operations or the ability or willingness of BB&T’s customers to access the financial services BB&T offers; |
| · | costs or difficulties related to the integration of the businesses of BB&T and its merger partners may be greater than expected; |
| · | expected cost savings or revenue growth associated with completed mergers and acquisitions may not be fully realized or realized within the expected time frames; |
| · | significant litigation could have a material adverse effect on BB&T; |
| · | deposit attrition, customer loss and/or revenue loss following completed mergers and acquisitions may be greater than expected; |
| · | cyber-security risks, including “denial of service,” “hacking” and “identity theft,” could adversely affect BB&T’s business, financial performance, or reputation; |
| - 21 - |
| · | failure to implement part or all of the Company’s new ERP system could result in impairment charges that adversely impact BB&T’s financial condition and results of operations and could result in significant additional costs to BB&T; and |
| · | failure to execute on the Company’s strategic or operational plans, including the ability to successfully complete and/or integrate mergers and acquisitions, could adversely impact BB&T’s financial condition and results of operations. |
Readers are cautioned not to place undue reliance on these forward-looking statements, which speak only as of the date of this report. Actual results may differ materially from those expressed in or implied by any forward-looking statement. Except to the extent required by applicable law or regulation, BB&T undertakes no obligation to revise or update publicly any forward-looking statements for any reason.
- 22 -
Exhibit 99.2

BB&T Corporation
Quarterly Performance Summary
Second Quarter 2015

| 1 |
| 2 |
| 3 |
| 4 |
| 5 |
| 6 |
| 7 |
| 8 |
| 9 |
| 10 |
| 11 |
| 12 |
| 13 |
| 14 |
| 15 |
| 16 |
| 17 |
| 18 |
| 19 |
20
Exhibit 99.3

Forward - Looking Information This presentation contains “forward - looking statements” within the meaning of the Private Securities Litigation Reform Act of 19 95, regarding the financial condition, results of operations, business plans and the future performance of BB&T that are based on the beliefs and assumptions of the management of BB&T and the information available to management at the time th at these disclosures were prepared. Words such as “anticipates,” “believes,” “estimates,” “expects,” “forecasts,” “intends,” “plans,” “projects,” “may,” “will,” “should,” “could,” and other similar expressions are intended to identify thes e f orward - looking statements. Such statements are subject to factors that could cause actual results to differ materially from anticipated results. Such factors include, but are not limited to, the following: general economic or business conditions, either nationally or regionally, may be less favorable than expected, resulting in, amo ng other things, a deterioration in credit quality and/or a reduced demand for credit, insurance or other services; disruptions to the credit and financial markets, either nationally or globally, including the impact of a downgrade of U.S. g ove rnment obligations by one of the credit ratings agencies and the adverse effects of recessionary conditions in Europe; changes in the interest rate environment and cash flow reassessments may reduce NIM and/or the volumes and values of loans ma de or held as well as the value of other financial assets held; competitive pressures among depository and other financial institutions may increase significantly; legislative, regulatory or accounting changes, including changes resulting from the adoption and implementation of the Dodd - Fran k Act may adversely affect the businesses in which BB&T is engaged; local, state or federal taxing authorities may take tax positions that are adverse to BB&T; a reduction may occur in BB&T’s credit ratings; adverse changes may occur in the securities markets; competitors of BB&T may have greater financial resources and develop products that enable them to compete more successfully t han BB&T and may be subject to different regulatory standards than BB&T; natural or other disasters could have an adverse effect on BB&T in that such events could materially disrupt BB&T’s operation s o r the ability or willingness of BB&T’s customers to access the financial services BB&T offers; costs or difficulties related to the integration of the businesses of BB&T and its merger partners may be greater than expect ed; expected cost savings or revenue growth associated with completed mergers and acquisitions may not be fully realized or reali zed within the expected time frames; significant litigation could have a material adverse effect on BB&T; deposit attrition, customer loss and/or revenue loss following completed mergers and acquisitions may be greater than expecte d ; cyber - security risks, including “denial of service,” “hacking” and “identity theft,” could adversely affect our business and fin ancial performance, or our reputation; and, failure to implement part or all of the Company’s new ERP system could result in impairment charges that adversely impact BB& T’s financial condition and results of operations and could result in significant additional costs to BB&T f ailure to execute on the Company’s strategic or operational plans, including the ability to successfully complete and/or inte gra te mergers and acquisitions, could adversely impact BB&T’s financial condition and results of operations. Readers are cautioned not to place undue reliance on these forward - looking statements, which speak only as of the date of this r eport. Actual results may differ materially from those expressed in or implied by any forward - looking statement. Except to the extent required by applicable law or regulation, BB&T undertakes no obligation to revise or update publicly any forwar d - l ooking statements for any reason. Non - GAAP Information This presentation contains financial information and performance measures determined by methods other than in accordance with ac counting principles generally accepted in the United States of America (“GAAP”). BB&T’s management uses these “non - GAAP” measures in their analysis of the Corporation’s performance and the efficiency of its operations. Management believes that these non - GAAP measures provide a greater understanding of ongoing operations and enhance comparability of results with prior periods as well as demonstrating the effects of significant gains and charges in the current period. The c omp any believes that a meaningful analysis of its financial performance requires an understanding of the factors underlying that performance. BB&T’s management believes that investors may use these non - GAAP financial measures to analyze financial performanc e without the impact of unusual items that may obscure trends in the company’s underlying performance. These disclosures should not be viewed as a substitute for financial measures determined in accordance with GAAP, nor are they nece ssa rily comparable to non - GAAP performance measures that may be presented by other companies. Below is a listing of the types of non - GAAP measures used in this presentation: Tangible common equity and related ratios are non - GAAP measures. The return on average risk - weighted assets is a non - GAAP measure . BB&T's management uses these measures to assess the quality of capital and believes that investors may find them useful in their analysis of the Corporation . The ratio of loans greater than 90 days and still accruing interest as a percentage of loans held for investment has been adj ust ed to remove the impact of loans that are or were covered by FDIC loss sharing agreements. Management believes that their inclusion may result in distortion of these ratios such that they might not be comparable to o the r periods presented or to other portfolios that were not impacted by purchase accounting. Fee income and efficiency ratios are non - GAAP in that they exclude securities gains (losses), foreclosed property expense, amortizat ion of intangible assets, merger - related and restructuring charges, the impact of FDIC loss share accounting and other selected items. BB&T’s management uses these measures in their analysis of the Corporation’s perfo rma nce. BB&T’s management believes these measures provide a greater understanding of ongoing operations and enhance comparability of results with prior periods, as well as demonstrating the effects of significa nt gains and charges. Return on average tangible common shareholders’ equity is a non - GAAP measure that calculates the return on average common shareholders’ equity without the impact of intangible assets and their related amortization . This measure is useful for evaluating the performance of a business consistently, whether acquired or developed internally. Core net interest margin is a non - GAAP measure that adjusts net interest margin to exclude the impact of interest income and fun ding costs associated with loans and securities acquired in the Colonial acquisition. BB&T’s management believes that the exclusion of the generally higher yielding assets acquired in the Colonial acquisition from the cal culation of net interest margin provides investors with useful information related to the relative performance of the remainder of BB&T’s earning assets . The adjusted ratio of net charge - offs to average loans is a non - GAAP measure that adjusts net charge - offs to exclude the impact of net charge - offs associated with certain loan sales during the quarter ended September 30, 2014. BB&T’s management believes this adjustment increases comparability of period - to - period results and believes that investors may f ind it useful in their analysis of the Corporation. The effective tax rate for the quarter ended June 30, 2015 has been adjusted to exclude the impact of certain adjustments. B B&T ’s management believes this adjustment increases comparability of period - to - period results and uses this measure to assess performance and believes investors may find it useful in their analysis of the Corporation. A reconciliation of these non - GAAP measures to the most directly comparable GAAP measure is included in BB&T’s Second Quarter 2015 Quarterly Performance Summary, which is available on BB&T’s website at www.bbt.com.
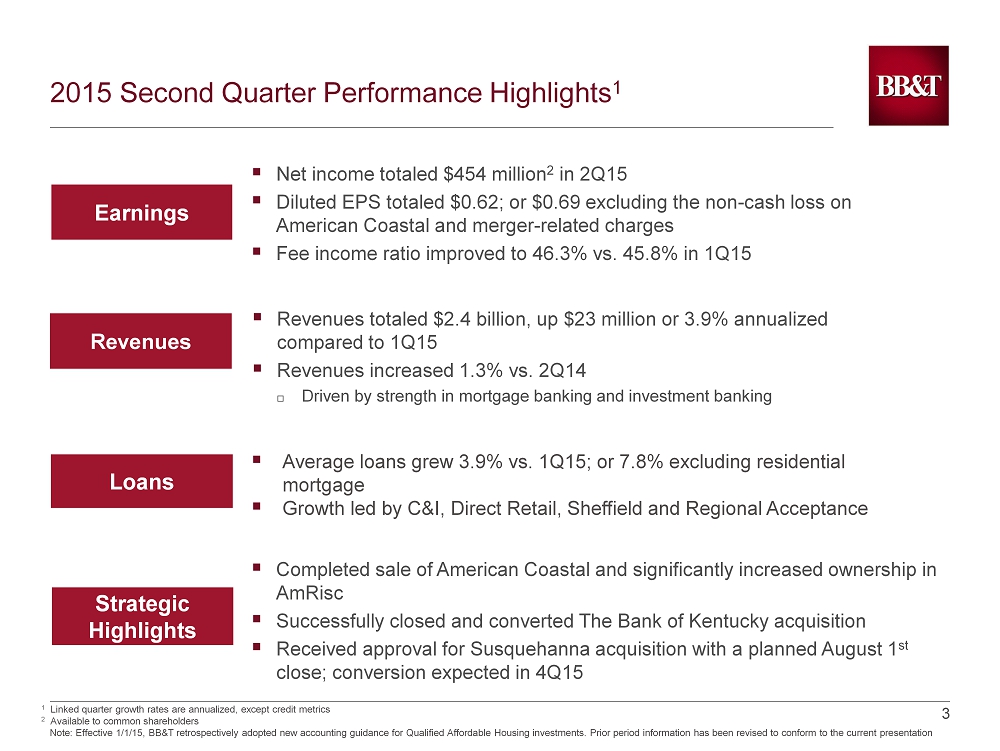
3 3 2015 Second Quarter Performance Highlights 1 ▪ Net income totaled $454 million 2 in 2Q15 ▪ Diluted EPS totaled $0.62; or $0.69 excluding the non - cash loss on American Coastal and merger - related charges ▪ Fee income ratio improved to 46.3% vs. 45.8% in 1Q15 Earnings Loans ▪ Average loans grew 3.9% vs. 1Q15; or 7.8% excluding residential mortgage ▪ Growth led by C&I, Direct Retail, Sheffield and Regional Acceptance Strategic Highlights 1 Linked quarter growth rates are annualized, except credit metrics 2 Available to common shareholders Note: Effective 1/1/15, BB&T retrospectively adopted new accounting guidance for Qualified Affordable Housing investments. Pr ior period information has been revised to conform to the current presentation ▪ Completed sale of American Coastal and significantly increased ownership in AmRisc ▪ Successfully closed and converted The Bank of Kentucky acquisition ▪ Received approval for Susquehanna acquisition with a planned August 1 st close; conversion expected in 4Q15 Revenues ▪ Revenues totaled $2.4 billion, up $23 million or 3.9% annualized compared to 1Q15 ▪ Revenues increased 1.3% vs. 2Q14 Driven by strength in mortgage banking and investment banking
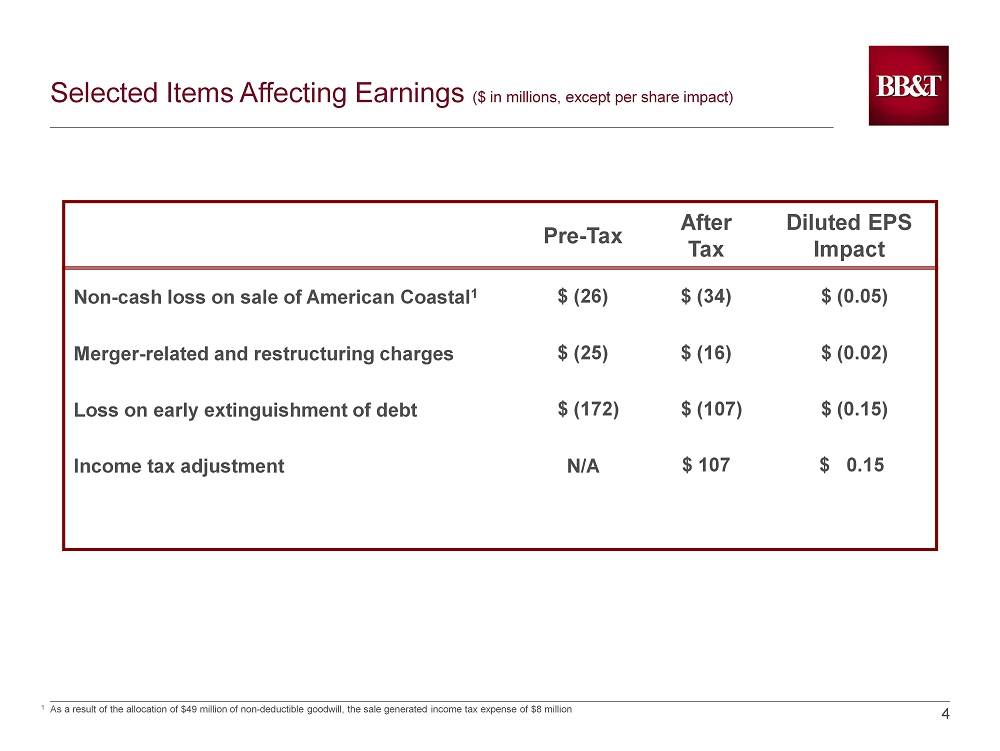
4 4 Pre - Tax After Tax Diluted EPS Impact Non - cash loss on sale of American Coastal 1 $ (26) $ (34) $ (0.05) Merger - related and restructuring charges $ (25) $ (16) $ (0.02) Loss on early extinguishment of debt $ (172) $ (107) $ (0.15) Income tax adjustment N/A $ 107 $ 0.15 Selected Items Affecting Earnings ($ in millions, except per share impact) 1 As a result of the allocation of $49 million of non - deductible goodwill, the sale generated income tax expense of $8 million
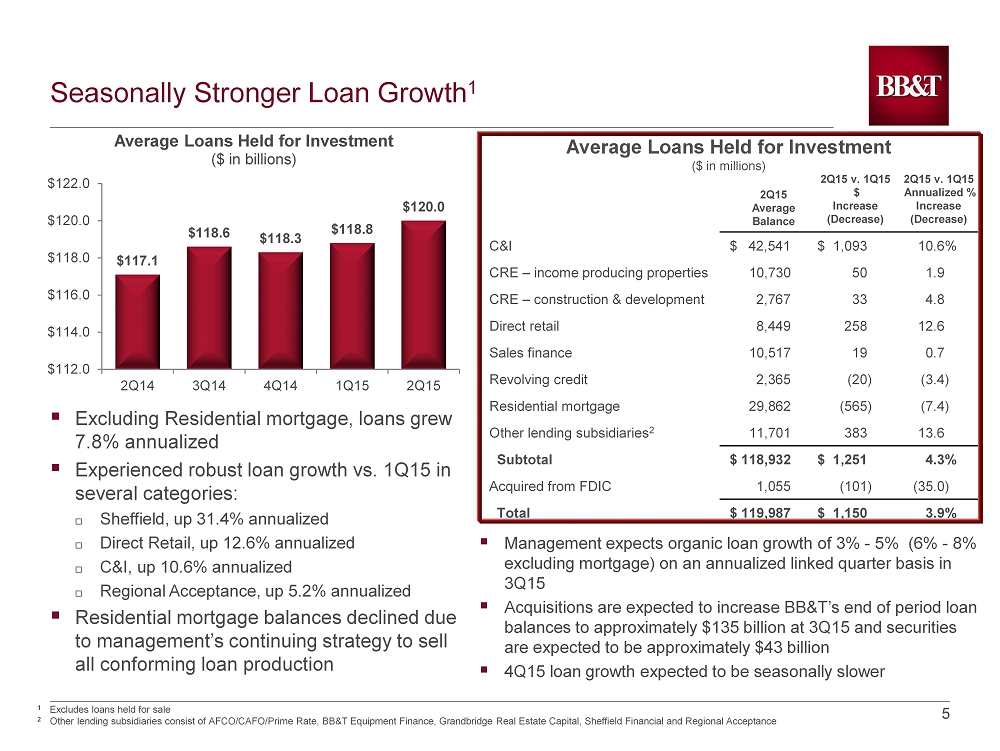
5 5 Seasonally Stronger Loan Growth 1 ▪ Excluding Residential mortgage, loans grew 7.8% annualized ▪ Experienced robust loan growth vs. 1Q15 in several categories: Sheffield, up 31.4% annualized Direct Retail, up 12.6% annualized C&I, up 10.6% annualized Regional Acceptance, up 5.2% annualized ▪ Residential mortgage balances declined due to management’s continuing strategy to sell all conforming loan production 1 Excludes loans held for sale 2 Other l ending s ubsidiaries consist of AFCO/CAFO/Prime Rate, BB&T Equipment Finance, Grandbridge Real Estate Capital, Sheffield Financial and Regional Acceptance $117.1 $118.6 $118.3 $118.8 $120.0 $112.0 $114.0 $116.0 $118.0 $120.0 $122.0 2Q14 3Q14 4Q14 1Q15 2Q15 Average Loans Held for Investment ($ in billions) C&I $ 42,541 $ 1,093 10.6% CRE – income producing properties 10,730 50 1.9 CRE – construction & development 2,767 33 4.8 Direct retail 8,449 258 12.6 Sales finance 10,517 19 0.7 Revolving credit 2,365 (20) (3.4) Residential mortgage 29,862 (565) (7.4) Other lending subsidiaries 2 11,701 383 13.6 Subtotal $ 118,932 $ 1,251 4.3% Acquired from FDIC 1,055 (101) (35.0) Total $ 119,987 $ 1,150 3.9% 2 Q15 Average Balance 2 Q15 v. 1Q15 $ Increase (Decrease) 2Q15 v. 1Q15 Annualized % Increase (Decrease) Average Loans Held for Investment ($ in millions) ▪ Management expects organic loan growth of 3% - 5% (6% - 8% excluding mortgage) on an annualized linked quarter basis in 3Q15 ▪ Acquisitions are expected to increase BB&T’s end of period loan balances to approximately $ 135 billion at 3Q15 and securities are expected to be approximately $43 billion ▪ 4Q15 loan growth expected to be seasonally slower
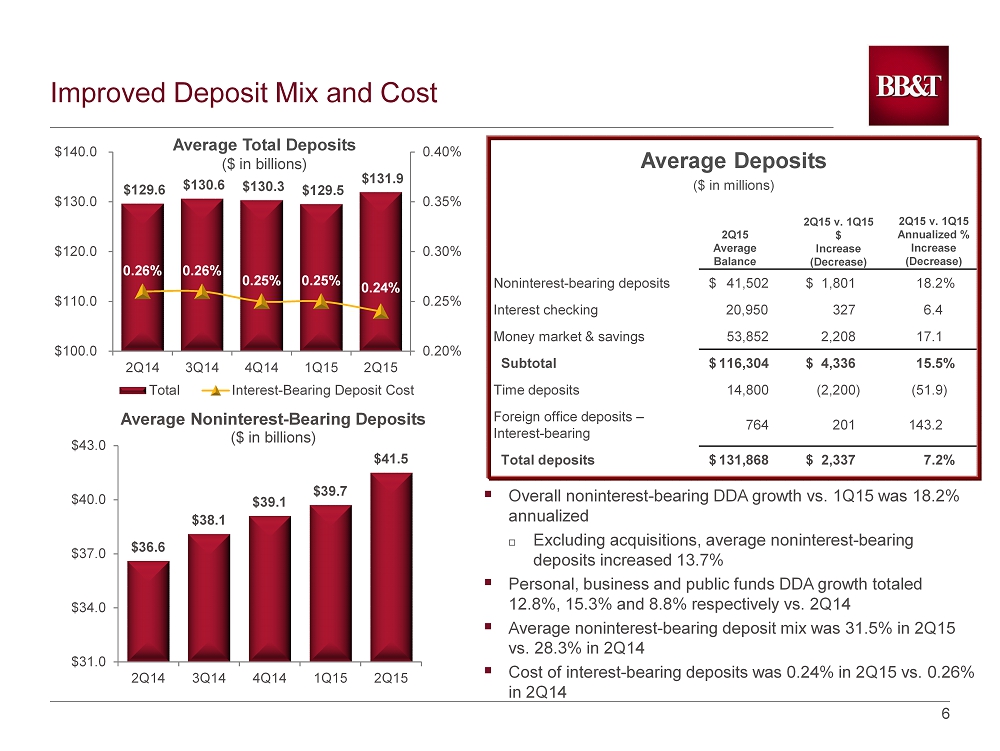
6 6 Improved Deposit Mix and Cost $129.6 $130.6 $130.3 $129.5 $131.9 0.26% 0.26% 0.25% 0.25% 0.24% 0.20% 0.25% 0.30% 0.35% 0.40% $100.0 $110.0 $120.0 $130.0 $140.0 2Q14 3Q14 4Q14 1Q15 2Q15 Total Interest-Bearing Deposit Cost ▪ Overall noninterest - bearing DDA growth vs. 1Q15 was 18.2% annualized Excluding acquisitions, average noninterest - bearing deposits increased 13.7% ▪ Personal, business and public funds DDA growth totaled 12.8%, 15.3% and 8.8% respectively vs. 2 Q14 ▪ Average noninterest - bearing deposit mix was 31.5% in 2Q15 vs. 28.3% in 2Q14 ▪ Cost of interest - bearing deposits was 0.24% in 2Q15 vs. 0.26% in 2Q14 Average Total Deposits ($ in billions) $36.6 $38.1 $39.1 $39.7 $41.5 $31.0 $34.0 $37.0 $40.0 $43.0 2Q14 3Q14 4Q14 1Q15 2Q15 Average Noninterest - Bearing Deposits ($ in billions) Noninterest - bearing deposits $ 41,502 $ 1,801 18.2% Interest checking 20,950 327 6.4 Money market & savings 53,852 2,208 17.1 Subtotal $ 116,304 $ 4,336 15.5% Time deposits 14,800 (2,200) (51.9) Foreign office deposits – Interest - bearing 764 201 143.2 Total deposits $ 131,868 $ 2,337 7.2% 2Q15 Average Balance 2Q15 v. 1Q15 $ Increase (Decrease) 2 Q15 v. 1Q15 Annualized % Increase (Decrease) Average Deposits ($ in millions)
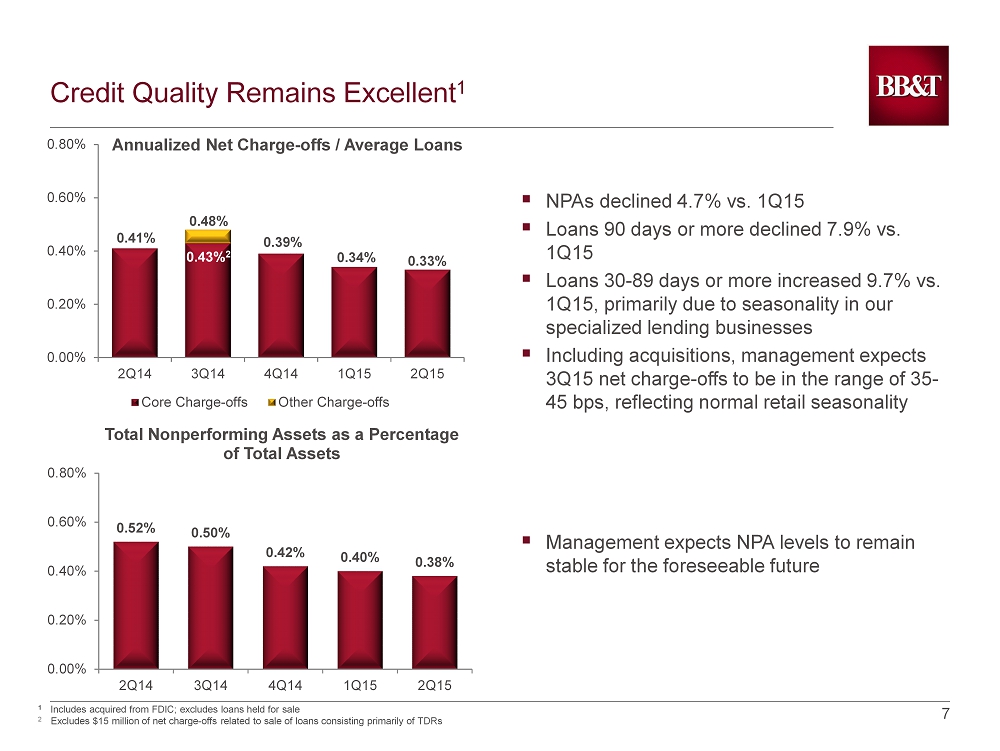
7 7 Credit Quality Remains Excellent 1 ▪ NPAs declined 4.7% vs. 1Q15 ▪ Loans 90 days or more declined 7.9% vs. 1Q15 ▪ Loans 30 - 89 days or more increased 9.7% vs. 1Q15, primarily due to seasonality in our specialized lending businesses ▪ Including acquisitions, management expects 3Q15 net charge - offs to be in the range of 35 - 45 bps, reflecting normal retail seasonality ▪ Management expects NPA levels to remain stable for the foreseeable future 0.52% 0.50% 0.42% 0.40% 0.38% 0.00% 0.20% 0.40% 0.60% 0.80% 2Q14 3Q14 4Q14 1Q15 2Q15 Total Nonperforming Assets as a Percentage of Total Assets Annualized Net Charge - offs / Average Loans 1 Includes acquired from FDIC; excludes loans held for sale 2 Excludes $15 million of net charge - offs related to sale of loans consisting primarily of TDRs 0.41% 0.34% 0.48% 0.43% 2 0.33% 0.39% 0.00% 0.20% 0.40% 0.60% 0.80% 2Q14 3Q14 4Q14 1Q15 2Q15 Core Charge-offs Other Charge-offs
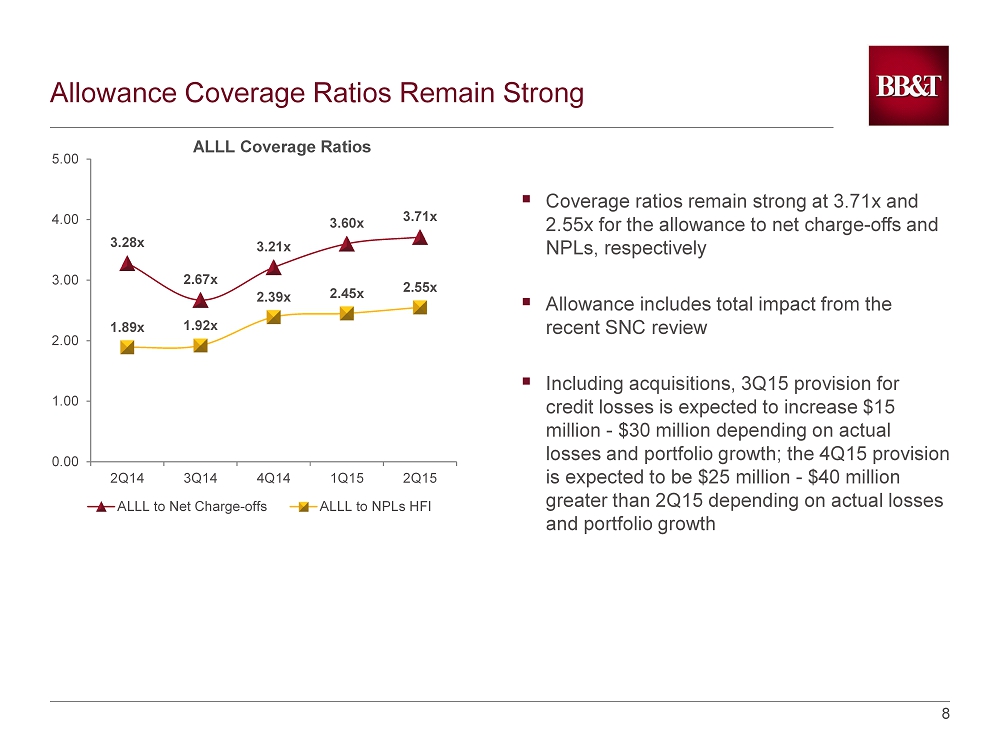
8 8 Allowance Coverage Ratios Remain Strong 3.28x 2.67x 3.21x 3.60x 3.71x 1.89x 1.92x 2.39x 2.45x 2.55x 0.00 1.00 2.00 3.00 4.00 5.00 2Q14 3Q14 4Q14 1Q15 2Q15 ALLL to Net Charge-offs ALLL to NPLs HFI ▪ Coverage ratios remain strong at 3.71x and 2.55x for the allowance to net charge - offs and NPLs, respectively ▪ Allowance includes total impact from the recent SNC review ▪ Including acquisitions, 3Q15 provision for credit losses is expected to increase $15 million - $ 30 million depending on actual losses and portfolio growth; the 4Q15 provision is expected to be $25 million - $40 million greater than 2Q15 depending on actual losses and portfolio growth ALLL Coverage Ratios
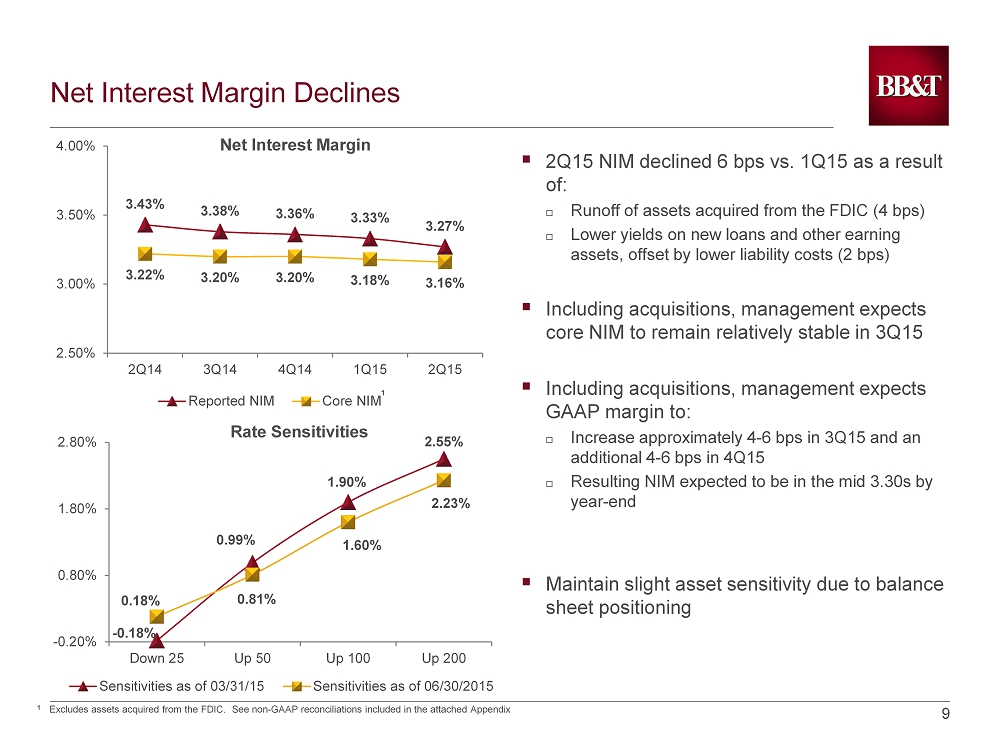
9 9 Net Interest Margin Declines 3.43% 3.38% 3.36% 3.33% 3.27% 3.22% 3.20% 3.20% 3.18% 3.16% 2.50% 3.00% 3.50% 4.00% 2Q14 3Q14 4Q14 1Q15 2Q15 Reported NIM Core NIM ▪ 2 Q15 NIM declined 6 bps vs. 1Q15 as a result of: Runoff of assets acquired from the FDIC (4 bps) Lower yields on new loans and other earning assets, offset by lower liability costs (2 bps) ▪ Including acquisitions, management expects core NIM to remain relatively stable in 3Q15 ▪ Including acquisitions, management expects GAAP margin to: Increase approximately 4 - 6 bps in 3Q15 and an additional 4 - 6 bps in 4Q15 Resulting NIM expected to be in the mid 3.30s by year - end ▪ Maintain slight asset sensitivity due to balance sheet positioning Net Interest Margin 1 - 0.18% 0.99% 1.90% 2.55% 0.18% 0.81% 1.60% 2.23% -0.20% 0.80% 1.80% 2.80% Down 25 Up 50 Up 100 Up 200 Sensitivities as of 03/31/15 Sensitivities as of 06/30/2015 Rate Sensitivities 1 Excludes assets acquired from the FDIC. See non - GAAP reconciliations included in the attached Appendix
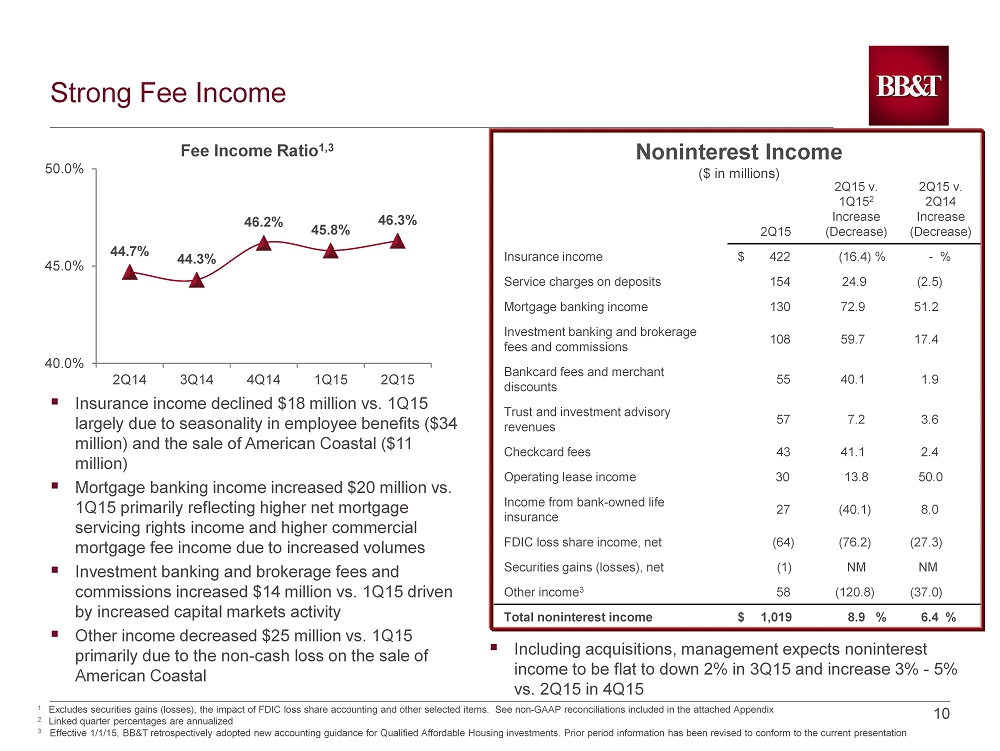
10 10 Strong Fee Income ▪ Insurance income declined $18 million vs. 1Q15 largely due to seasonality in employee benefits ($34 million) and the sale of American Coastal ($11 million) ▪ Mortgage banking income increased $20 million vs. 1Q15 primarily reflecting higher net mortgage servicing rights income and higher commercial mortgage fee income due to increased volumes ▪ Investment banking and brokerage fees and commissions increased $14 million vs. 1Q15 driven by increased capital markets activity ▪ Other income decreased $25 million vs. 1Q15 primarily due to the non - cash loss on the sale of American Coastal 44.7% 44.3% 46.2% 45.8% 46.3% 40.0% 45.0% 50.0% 2Q14 3Q14 4Q14 1Q15 2Q15 Fee Income Ratio 1,3 2Q15 2Q15 v. 1Q15 2 Increase (Decrease) 2Q15 v. 2Q14 Increase (Decrease) Insurance income $ 422 (16.4) % - % Service charges on deposits 154 24.9 (2.5) Mortgage banking income 130 72.9 51.2 Investment banking and brokerage fees and commissions 108 59.7 17.4 Bankcard fees and merchant discounts 55 40.1 1.9 Trust and investment advisory revenues 57 7.2 3.6 Checkcard fees 43 41.1 2.4 Operating lease income 30 13.8 50.0 Income from bank - owned life insurance 27 (40.1) 8.0 FDIC loss share income, net (64) (76.2) (27.3) Securities gains (losses), net (1) NM NM Other income 3 58 (120.8) (37.0) Total noninterest income $ 1,019 8.9 % 6.4 % Noninterest Income ($ in millions) 1 Excludes securities gains (losses), the impact of FDIC loss share accounting and other selected items. See non - GAAP reconciliations incl uded in the attached Appendix 2 Linked quarter percentages are annualized 3 Effective 1/1/15, BB&T retrospectively adopted new accounting guidance for Qualified Affordable Housing investments. Prior period infor mat ion has been revised to conform to the current presentation ▪ Including acquisitions, management expects noninterest income to be flat to down 2% in 3Q15 and increase 3% - 5% vs. 2Q15 in 4Q15
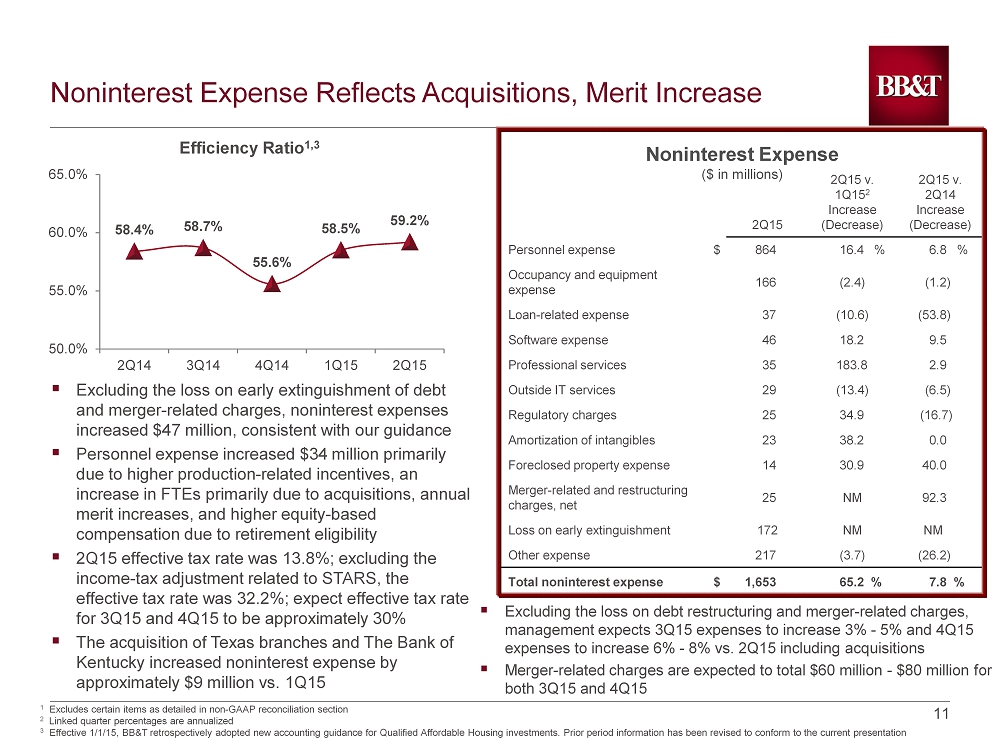
11 11 Noninterest Expense Reflects Acquisitions, Merit Increase 2Q15 2Q15 v. 1Q15 2 Increase (Decrease) 2Q15 v. 2Q14 Increase (Decrease) Personnel expense $ 864 16.4 % 6.8 % Occupancy and equipment expense 166 (2.4) (1.2) Loan - related expense 37 (10.6) (53.8) Software expense 46 18.2 9.5 Professional services 35 183.8 2.9 Outside IT services 29 (13.4) (6.5) Regulatory charges 25 34.9 (16.7) Amortization of intangibles 23 38.2 0.0 Foreclosed property expense 14 30.9 40.0 Merger - related and restructuring charges, net 25 NM 92.3 Loss on early extinguishment 172 NM NM Other expense 217 (3.7) (26.2) Total noninterest expense $ 1,653 65.2 % 7.8 % Noninterest Expense ($ in millions) 1 Excludes certain items as detailed in non - GAAP reconciliation section 2 Linked quarter percentages are annualized 3 Effective 1/1/15, BB&T retrospectively adopted new accounting guidance for Qualified Affordable Housing investments. Prior period infor mat ion has been revised to conform to the current presentation 58.4% 58.7% 55.6% 58.5% 59.2% 50.0% 55.0% 60.0% 65.0% 2Q14 3Q14 4Q14 1Q15 2Q15 Efficiency Ratio 1,3 ▪ Excluding the loss on early extinguishment of debt and merger - related charges, noninterest expenses increased $47 million, consistent with our guidance ▪ Personnel expense increased $34 million primarily due to higher production - related incentives, an increase in FTEs primarily due to acquisitions, annual merit increases, and higher equity - based compensation due to retirement eligibility ▪ 2Q15 effective tax rate was 13.8%; excluding the income - tax adjustment related to STARS, the effective tax rate was 32.2%; expect effective tax rate for 3Q15 and 4Q15 to be approximately 30% ▪ The acquisition of Texas branches and The Bank of Kentucky increased noninterest expense by approximately $9 million vs. 1Q15 ▪ Excluding the loss on debt restructuring and merger - related charges, management expects 3Q15 expenses to increase 3% - 5 % and 4Q15 expenses to increase 6% - 8% vs. 2Q15 including acquisitions ▪ Merger - related charges are expected to total $60 million - $80 million for both 3Q15 and 4Q15
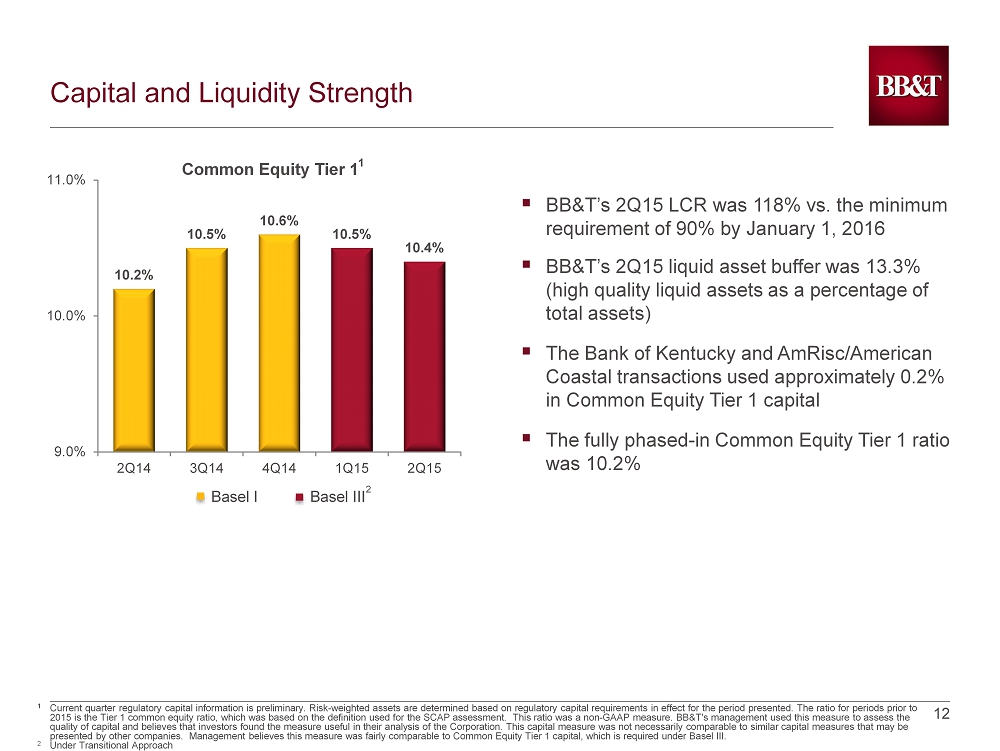
12 12 Capital and Liquidity Strength 10.2% 10.5% 10.6% 10.5% 10.4% 9.0% 10.0% 11.0% 2Q14 3Q14 4Q14 1Q15 2Q15 ▪ BB&T’s 2Q15 LCR was 118% vs. the minimum requirement of 90% by January 1, 2016 ▪ BB&T’s 2Q15 liquid asset buffer was 13.3% (high quality liquid assets as a percentage of total assets) ▪ The Bank of Kentucky and AmRisc/American Coastal transactions used approximately 0.2% in Common Equity Tier 1 capital ▪ The fully phased - in Common Equity Tier 1 ratio was 10.2% 1 C urrent quarter regulatory capital information is preliminary. Risk - weighted assets are determined based on regulatory capital requirements in effect for the period presented. The ratio for periods prior to 2015 is the Tier 1 common equity ratio, which was based on the definition used for the SCAP assessment. This ratio was a non - GA AP measure. BB&T's management used this measure to assess the quality of capital and believes that investors found the measure useful in their analysis of the Corporation. This capital measure was not necessarily comparable to similar capital measures that may be presented by other companies. Management believes this measure was fairly comparable to Common Equity Tier 1 capital, which is required under Basel III . 2 Under Transitional Approach Common Equity Tier 1 1 Basel I Basel III 2
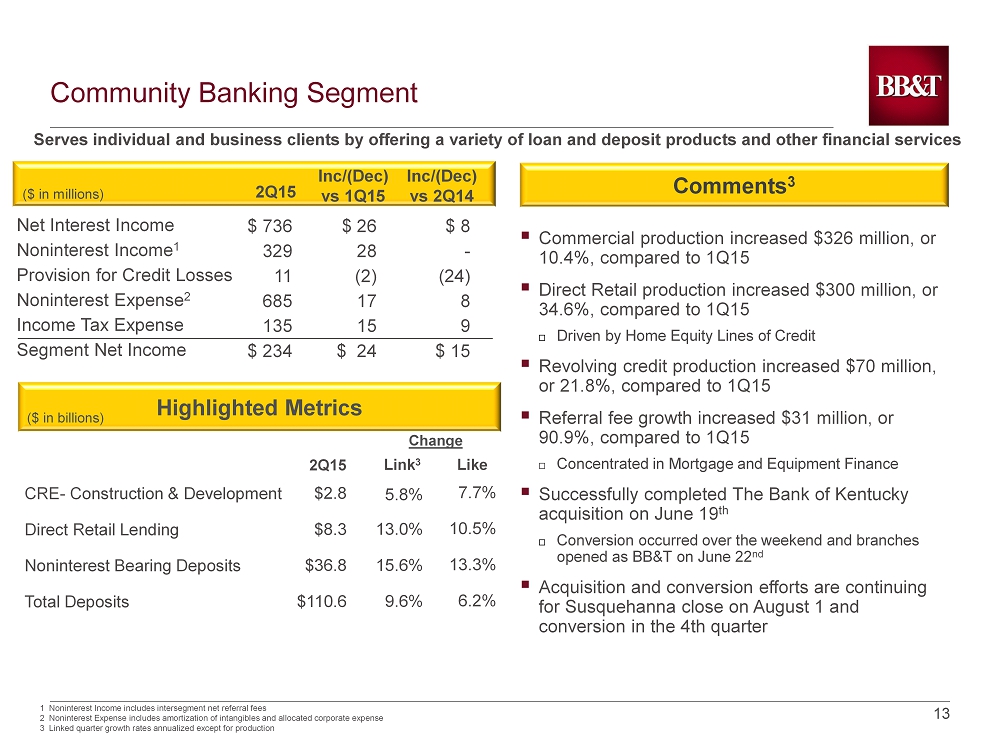
13 13 ($ in millions) Inc/(Dec) vs 1Q15 Inc/(Dec) vs 2Q14 2Q15 Comments 3 Net Interest Income Noninterest Income 1 Provision for Credit Losses Noninterest Expense 2 Income Tax Expense Segment Net Income Highlighted Metrics $ 736 329 11 685 135 $ 234 $ 26 28 (2) 17 15 $ 24 $ 8 - (24) 8 9 $ 15 ($ in billions) 1 Noninterest Income includes intersegment net referral fees 2 Noninterest Expense includes amortization of intangibles and allocated corporate expense 3 Linked quarter growth rates annualized except for production 2Q15 Like CRE - Construction & Development Direct Retail Lending Noninterest Bearing Deposits Total Deposits 7.7% 10.5% 13.3% 6.2% Link 3 5.8% 13.0% 15.6% 9.6% Change Community Banking Segment ▪ Commercial production increased $326 million, or 10.4%, compared to 1Q15 ▪ Direct Retail production increased $ 300 million, or 34.6%, compared to 1Q15 Driven by Home Equity Lines of Credit ▪ Revolving credit production increased $70 million, or 21.8%, compared to 1Q15 ▪ Referral fee growth increased $31 million, or 90.9%, compared to 1Q15 Concentrated in Mortgage and Equipment Finance ▪ Successfully completed The Bank of Kentucky acquisition on June 19 th Conversion occurred over the weekend and branches opened as BB&T on June 22 nd ▪ Acquisition and conversion efforts are continuing for Susquehanna close on August 1 and conversion in the 4th quarter Serves individual and business clients by offering a variety of loan and deposit products and other financial services $2.8 $8.3 $36.8 $110.6
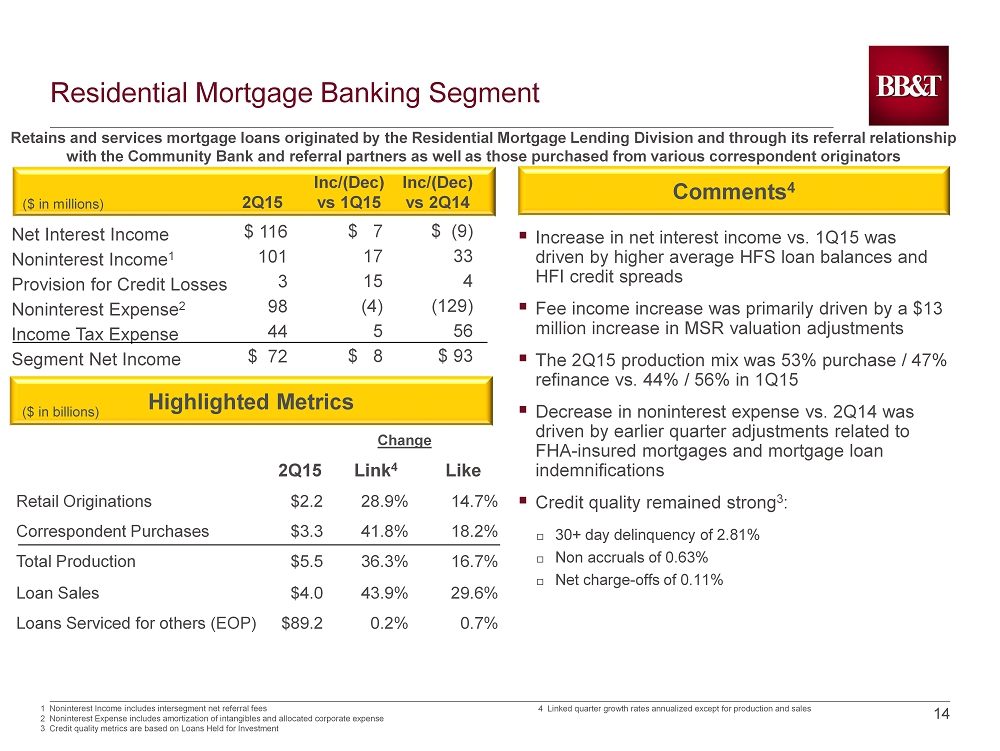
14 14 Retains and services mortgage loans originated by the Residential Mortgage Lending Division and through its referral relation shi p with the Community Bank and referral partners as well as those purchased from various correspondent originators ($ in millions) Inc /(Dec) vs 1Q15 Inc/(Dec) vs 2Q14 2Q15 Comments 4 Net Interest Income Noninterest Income 1 Provision for Credit Losses Noninterest Expense 2 Income Tax Expense Segment Net Income Highlighted Metrics $ 116 101 3 98 44 $ 72 $ (9) 33 4 (129) 56 $ 93 ($ in billions) 1 Noninterest Income includes intersegment net referral fees 2 Noninterest Expense includes amortization of intangibles and allocated corporate expense 3 Credit quality metrics are based on Loans Held for Investment Change 2Q15 Link 4 Like Retail Originations $2.2 28.9% 14.7% Correspondent Purchases $3.3 41.8% 18.2% Total Production $5.5 36.3% 16.7% Loan Sales $4.0 43.9% 29.6% Loans Serviced for others (EOP) $89.2 0.2% 0.7% Residential Mortgage Banking Segment ▪ Increase in net interest income vs. 1Q15 was driven by higher average HFS loan balances and HFI credit spreads ▪ Fee income increase was primarily driven by a $ 13 million increase in MSR valuation adjustments ▪ The 2Q15 production mix was 53% purchase / 47% refinance vs. 44% / 56% in 1Q15 ▪ Decrease in noninterest expense vs. 2Q14 was driven by earlier quarter adjustments related to FHA - insured mortgages and mortgage loan indemnifications ▪ Credit quality remained strong 3 : 30+ day delinquency of 2.81% Non accruals of 0.63% Net charge - offs of 0.11% $ 7 17 15 (4) 5 $ 8 4 Linked quarter growth rates annualized except for production and sales
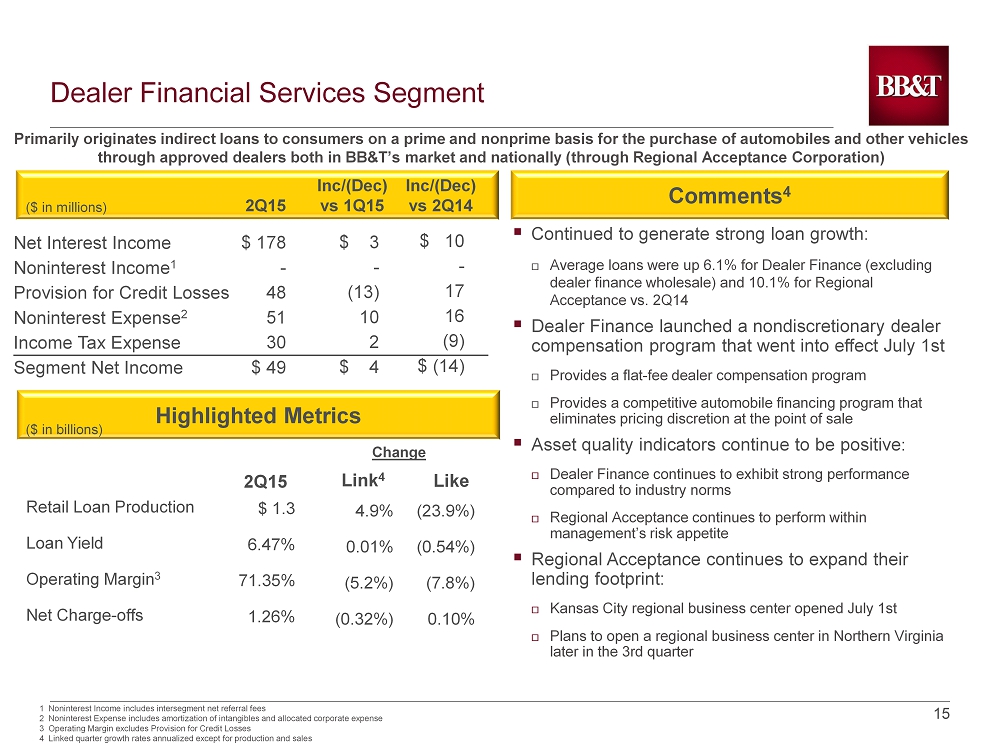
15 15 Primarily originates indirect loans to consumers on a prime and nonprime basis for the purchase of automobiles and other vehi cle s through approved dealers both in BB&T’s market and nationally (through Regional Acceptance Corporation) Comments 4 ($ in millions) Inc /(Dec) vs 1Q15 Inc /(Dec) v s 2Q14 2Q15 Net Interest Income Noninterest Income 1 Provision for Credit Losses Noninterest Expense 2 Income Tax Expense Segment Net Income Highlighted Metrics 2Q15 Like $ 178 - 48 51 30 $ 49 $ 3 - (13) 10 2 $ 4 $ 10 - 17 16 (9) $ (14) Retail Loan Production Loan Yield Operating Margin 3 Net Charge - offs $ 1.3 6.47% 71.35% 1.26% (23.9%) (0.54%) (7.8%) 0.10% 1 Noninterest Income includes intersegment net referral fees 2 Noninterest Expense includes amortization of intangibles and allocated corporate expense 3 Operating Margin excludes Provision for Credit Losses 4 Linked quarter growth rates annualized except for production and sales ($ in billions) Link 4 4.9% 0.01% (5.2%) (0.32%) Change Dealer Financial Services Segment ▪ C ontinued to generate strong loan growth: Average loans were up 6.1% for Dealer Finance (excluding dealer finance wholesale) and 10.1% for Regional Acceptance vs. 2Q14 ▪ Dealer Finance launched a nondiscretionary dealer compensation program that went into effect July 1st Provides a flat - fee dealer compensation program Provides a competitive automobile financing program that eliminates pricing discretion at the point of sale ▪ Asset quality indicators continue to be positive : Dealer Finance continues to exhibit strong performance compared to industry norms Regional Acceptance continues to perform within management’s risk appetite ▪ Regional Acceptance continues to expand their lending footprint: Kansas City regional business center opened July 1st Plans to open a regional business center in Northern Virginia later in the 3rd quarter
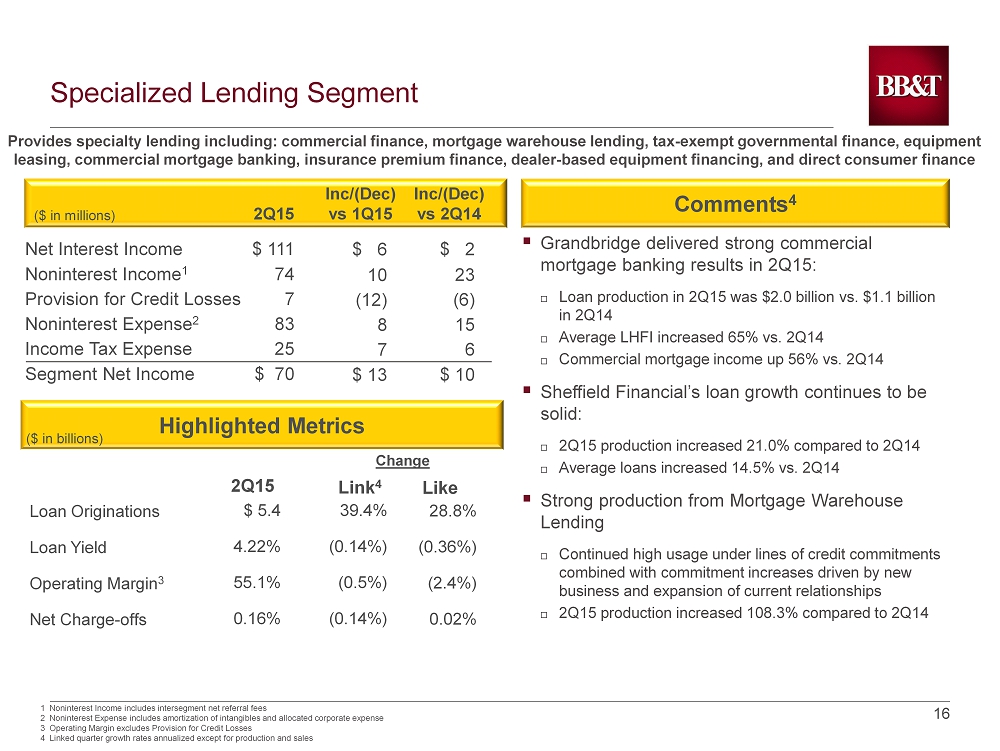
16 16 Provides specialty lending including: commercial finance, mortgage warehouse lending, tax - exempt governmental finance, equipment leasing, commercial mortgage banking, insurance premium finance, dealer - based equipment financing, and direct consumer finance Comments 4 ($ in millions) Inc/(Dec) vs 1Q15 Inc /(Dec) v s 2Q14 2Q15 Net Interest Income Noninterest Income 1 Provision for Credit Losses Noninterest Expense 2 Income Tax Expense Segment Net Income Highlighted Metrics 2Q15 Like $ 111 74 7 83 25 $ 70 $ 6 10 (12) 8 7 $ 13 $ 2 23 (6) 15 6 $ 10 ($ in billions) Loan Originations Loan Yield Operating Margin 3 Net Charge - offs $ 5.4 4.22% 55.1% 0.16% 28.8% (0.36%) (2.4%) 0.02% 1 Noninterest Income includes intersegment net referral fees 2 Noninterest Expense includes amortization of intangibles and allocated corporate expense 3 Operating Margin excludes Provision for Credit Losses 4 Linked quarter growth rates annualized except for production and sales 39.4% (0.14%) (0.5%) (0.14%) Link 4 Change Specialized Lending Segment ▪ Grandbridge delivered strong commercial mortgage banking results in 2Q15: Loan production in 2Q15 was $ 2.0 billion vs. $ 1.1 billion in 2Q14 Average LHFI increased 65% vs. 2Q14 Commercial mortgage income up 56% vs. 2Q14 ▪ Sheffield Financial’s loan growth continues to be solid: 2Q15 production increased 21.0% compared to 2Q14 Average loans increased 14.5% vs. 2Q14 ▪ Strong production from Mortgage Warehouse Lending Continued high usage under lines of credit commitments combined with commitment increases driven by new business and expansion of current relationships 2Q15 production increased 108.3% compared to 2Q14
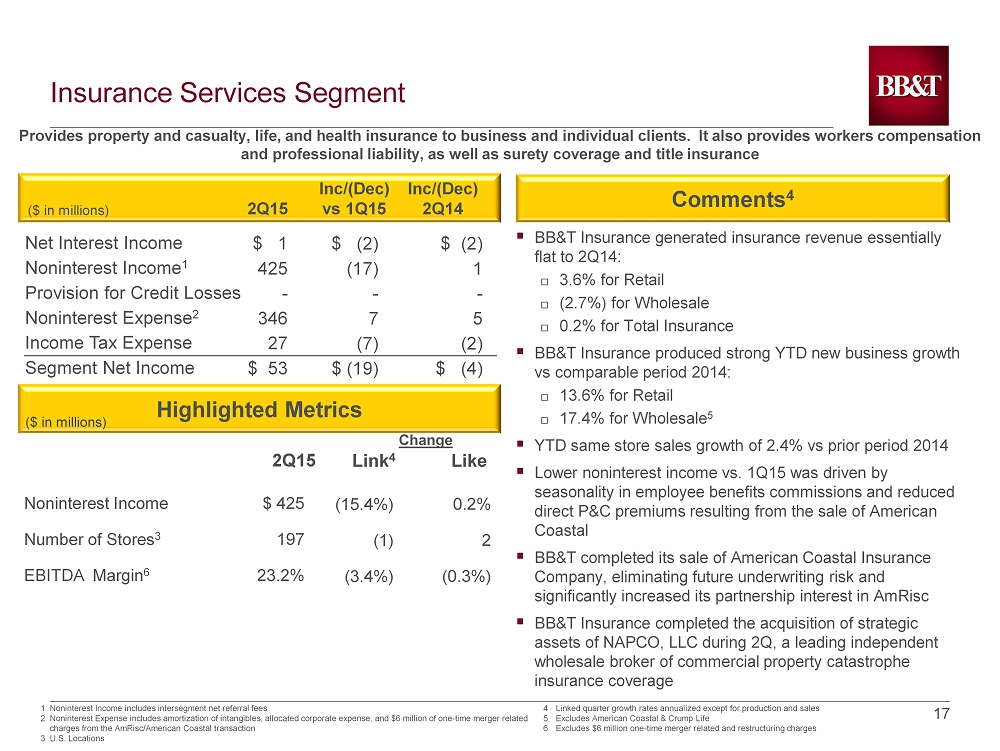
17 17 Comments 4 ($ in millions) Inc/(Dec) vs 1Q15 Inc/(Dec) 2Q14 2Q15 Net Interest Income Noninterest Income 1 Provision for Credit Losses Noninterest Expense 2 Income Tax Expense Segment Net Income Highlighted Metrics Noninterest Income Number of Stores 3 EBITDA Margin 6 2Q15 Like Provides property and casualty, life, and health insurance to business and individual clients. It also provides workers comp ens ation and professional liability, as well as surety coverage and title insurance $ 1 425 - 346 27 $ 53 $ (2) (17) - 7 (7) $ (19) $ (2) 1 - 5 (2) $ (4) $ 425 197 23.2% 0.2% 2 (0.3%) Change (15.4%) (1) (3.4%) Link 4 ($ in millions ) Insurance Services Segment 4 Linked quarter growth rates annualized except for production and sales 5 Excludes American Coastal & Crump Life 6 Excludes $6 million one - time merger related and restructuring charges ▪ BB&T Insurance generated insurance revenue essentially flat to 2Q14: 3.6 % for Retail (2.7%) for Wholesale 0.2% for Total Insurance ▪ BB&T Insurance produced strong YTD new business growth vs comparable period 2014: 13.6% for Retail 17.4% for Wholesale 5 ▪ YTD same store sales growth of 2.4% vs prior period 2014 ▪ Lower noninterest income vs. 1Q15 was driven by seasonality in employee benefits commissions and reduced direct P&C premiums resulting from the sale of American Coastal ▪ BB&T completed its sale of American Coastal Insurance Company, eliminating future underwriting risk and significantly increased its partnership interest in AmRisc ▪ BB&T Insurance completed the acquisition of strategic assets of NAPCO, LLC during 2Q, a leading independent wholesale broker of commercial property catastrophe insurance coverage 1 Noninterest Income includes intersegment net referral fees 2 Noninterest Expense includes amortization of intangibles, allocated corporate expense, and $6 million of one - time merger related charges from the AmRisc/American Coastal transaction 3 U.S . Locations
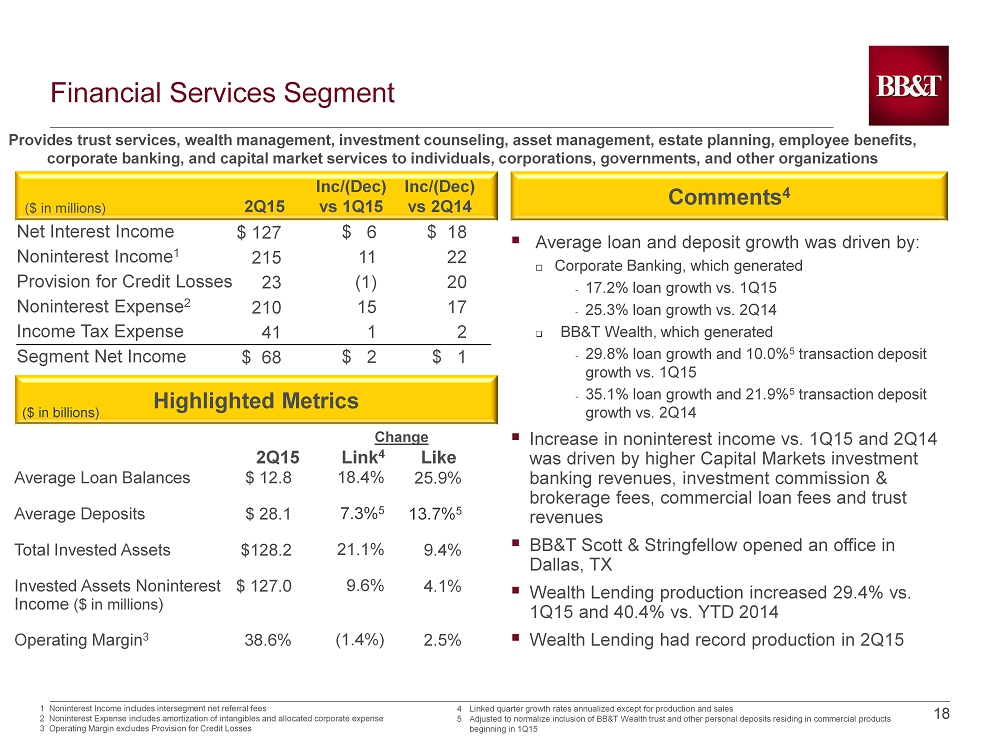
18 18 Provides trust services, wealth management, investment counseling, asset management, estate planning, employee benefits, corporate banking, and capital market services to individuals, corporations, governments, and other organizations Comments 4 ($ in millions) Inc/(Dec) vs 1Q15 Inc/(Dec) v s 2Q14 2Q15 Net Interest Income Noninterest Income 1 Provision for Credit Losses Noninterest Expense 2 Income Tax Expense Segment Net Income Highlighted Metrics Average Loan Balances Average Deposits Total Invested Assets Invested Assets Noninterest Income ($ in millions ) Operating Margin 3 2Q15 Like $ 127 215 23 210 41 $ 68 $ 6 11 (1) 15 1 $ 2 $ 18 22 20 17 2 $ 1 $ 12.8 $ 28.1 $128.2 $ 127.0 38.6% 1 Noninterest Income includes intersegment net referral fees 2 Noninterest Expense includes amortization of intangibles and allocated corporate expense 3 Operating Margin excludes Provision for Credit Losses ($ in billions) Link 4 18.4% 7.3% 5 21.1% 9.6% (1.4%) Change 25.9% 13.7% 5 9.4% 4.1% 2.5% Financial Services Segment ▪ Average loan and deposit growth was driven by : Corporate Banking, which generated - 17.2% loan growth vs. 1Q15 - 25.3% loan growth vs. 2Q14 □ BB&T Wealth, which generated - 29.8% loan growth and 10.0% 5 transaction deposit growth vs. 1Q15 - 35.1 % loan growth and 21.9% 5 transaction deposit growth vs. 2Q14 ▪ Increase in noninterest income vs. 1Q15 and 2Q14 was driven by higher Capital Markets investment banking revenues, investment commission & brokerage fees, commercial loan fees and trust revenues ▪ BB&T Scott & Stringfellow opened an office in Dallas, TX ▪ Wealth Lending production increased 29.4% vs . 1Q15 and 40.4% vs. YTD 2014 ▪ Wealth Lending had record production in 2Q15 4 Linked quarter growth rates annualized except for production and sales 5 Adjusted to normalize inclusion of BB&T Wealth trust and other personal deposits residing in commercial products beginning in 1Q15
19 19 Summary of Acquisition Impact Earning Assets Net Interest M argin Noninterest Income Credit Noninterest Expense ▪ Excluding the loss on debt restructuring and merger - related charges, management expects 3Q15 expenses to increase 3% - 5 % and 4Q15 expenses to increase 6% - 8% vs. 2Q15 ▪ Merger - related charges are expected to total $60 million - $80 million for both 3Q15 and 4Q15 ▪ Management expects expenses to decline throughout 2016 to achieve targeted cost savings of 32% ▪ Acquisitions are expected to increase BB&T’s 3Q15 end of period loan balances to approximately $135 billion and securities are expected to be approximately $43 billion ▪ 4Q15 loan growth will be seasonally slower ▪ Management expects 3Q15 net charge - offs to be in the range of 35 - 45 bps ▪ 3Q15 provision for credit losses is expected to increase $15 million - $30 million depending on actual losses and portfolio growth; the 4Q15 provision is expected to be $25 million - $40 million greater than 2Q15 depending on actual losses and portfolio growth ▪ Management expects GAAP margin to: I ncrease approximately 4 - 6 bps in 3Q15 and an additional 4 - 6 bps in 4Q15 Resulting NIM expected to be in the mid 3.30s by year - end ▪ Including acquisitions, management expects noninterest income to be flat to down 2% in 3Q15 and increase 3% - 5% vs. 2Q15 in 4Q15 Noncontrolling Interest ▪ The impact of the AmRisc investment will reduce noncontrolling interest expense in the range of $5 million to $15 million per quarter, depending on seasonality

20

21

Capital Measures 1 (Dollars in millions, except per share data) 1 2 Current quarter regulatory capital is preliminary Risk - weighted assets are determined based on regulatory capital requirements in effect for the period presented 3 4 Tangible common equity and related ratios are non - GAAP measures. BB&T's management uses these measures to assess the quality of capital and believes that investors may find them useful in their analysis of the Corporation. These capital measures are not necessarily comparable to similar capital measures that may be presented by othe r c ompanies . Under transitional approach 22 As of / Quarter Ended June 30 March 31 Dec. 31 Sept . 30 June 30 2015 2015 2014 2014 2014 Selected Capital Information Risk - based capital: Basel III 4 Basel I Common equity tier 1 $ 16,031 $ 15,755 N/A N/A N/A Tier 1 18,633 18,320 $ 17,840 $ 17,402 $ 16,984 Total 21,905 21,654 21,381 21,281 20,270 Risk - weighted assets 2 153,512 150,092 143,675 140,499 140,829 Average quarterly tangible assets 182,444 180,790 179,785 179,268 177,983 Risk - based capital ratios: Common equity tier 1 10.4% 10.5% N/A N/A N/A Tier 1 2.1 12.2 12.4% 12.4% 12.1% Total 14.3 14.4 14.9 15.1 14.4 Leverage capital ratio 10.2 10.1 9.9 9.7 9.5 Equity as a percentage of total assets 13.2 13.1 13.0 13.0 12.7 Common equity per common share $ 30.64 $ 30.48 $ 30.09 $ 29.98 $ 29.52 Selected non - GAAP Capital Information 3 Tangible common equity as a percentage of tangible assets 8.1% 8.0% 8.0% 7.9% 7.7% Tangible common equity per common share $ 20.21 $ 20.13 $ 19.86 $ 19.71 $ 19.21
Non - GAAP Reconciliations 1 23 (Dollars in millions, except per share data) 1 2 Current quarter regulatory capital is preliminary Tangible common equity and related ratios are non - GAAP measures. BB&T's management uses these measures to assess the quality of capital and believes that investors may find them useful in their analysis of the Corporation. These capital measures are not necessarily comparable to similar capital measures that may be presented by oth er companies. Calculations of tangible common equity, tangible assets and related measures 2 : Total shareholders' equity $ 25,132 $ 24,738 $ 24,377 $ 24,271 $ 23,931 Less: Preferred stock 2,603 2,603 2,603 2,603 2,603 Noncontrolling interests 52 96 88 76 85 Intangible assets 7,655 7,480 7,374 7,396 7,420 Tangible common equity $ 14,822 $ 14,559 $ 14,312 $ 14,196 $ 13,823 Total assets $ 191,017 $ 189,228 $ 186,834 $ 187,045 $ 188,043 Less: Intangible assets 7,655 7,480 7,374 7,396 7,420 Tangible assets $ 183,362 $ 181,748 $ 179,460 $ 179,649 $ 180,623 Tangible common equity as a percentage of tangible assets 8.1% 8.0% 8.0% 7.9% 7.7% Tangible common equity $ 14,822 $ 14,559 $ 14,312 $ 14,196 $ 13,823 Outstanding shares at end of period (in thousands) 733,481 723,159 720,698 720,298 719,584 Tangible common equity per common share $ 20.21 $ 20.13 $ 19.86 $ 19.71 $ 19.21 As of / Quarter Ended June 30 March 31 Dec. 31 Sept. 30 June 30 2015 2015 2014 2014 2014
Non - GAAP Reconciliations 1 24 1 BB&T’s management uses these measures in their analysis of the Corporation’s performance and believes these measures provide a greater understanding of ongoing operations and enhance comparability of results with prior periods, as well as demonstrating the effects of significant gains and charges. Quarter Ended June 30 March 31 Dec. 31 Sept. 30 June 30 Efficiency and Fee Income Ratios 1 2015 2015 2014 2014 2014 Efficiency ratio - GAAP 69.8% 60.7% 58.3% 66.0% 65.6% Effect of securities gains (losses), net - - - (0.1) - Effect of merger - related and restructuring charges, net (1.1) (0.5) ( 0.7) ( 0.3) ( 0.6) Effect of mortgage loan indemnification reserves - - - - ( 1.4) Effect of loss on sale of American Coastal (0.8) - - - - Effect of mortgage reserve adjustments - - ( 1.1) - - Effect of loss on early extinguishment of debt (7.1) - - ( 5.1) - Effect of franchise tax adjustment - - 0.6 - - Effect of FDIC loss share accounting (0.1) (0.1) ( 0.1) ( 0.3) ( 0.2) Effect of foreclosed property expense (0.6) (0.6) ( 0.4) ( 0.5) (0.4 ) Effect of FHA - insured mortgage loan reserve adjustment - - - - ( 3.6) Effect of amortization of intangibles (0.9) ( 1.0) ( 1.0) ( 1.0) ( 1.0) Efficiency ratio - reported 59.2% 58.5% 55.6% 58.7% 58.4% Fee income ratio - GAAP 43.0% 42.5% 42.7% 40.7% 41.0% Effect of loss on sale of American Coastal 0.6 - - - - Effect of securities gains (losses), net - - - 0.1 - Effect of FDIC loss share accounting 2.7 3.3 3.5 3.5 3.7 Fee income ratio - reported 46.3% 45.8% 46.2% 44.3% 44.7% Note: Effective 1/1/15, BB&T retrospectively adopted new accounting guidance for Qualified Affordable Housing investments. Pr io r period information has been revised to conform to the current presentation
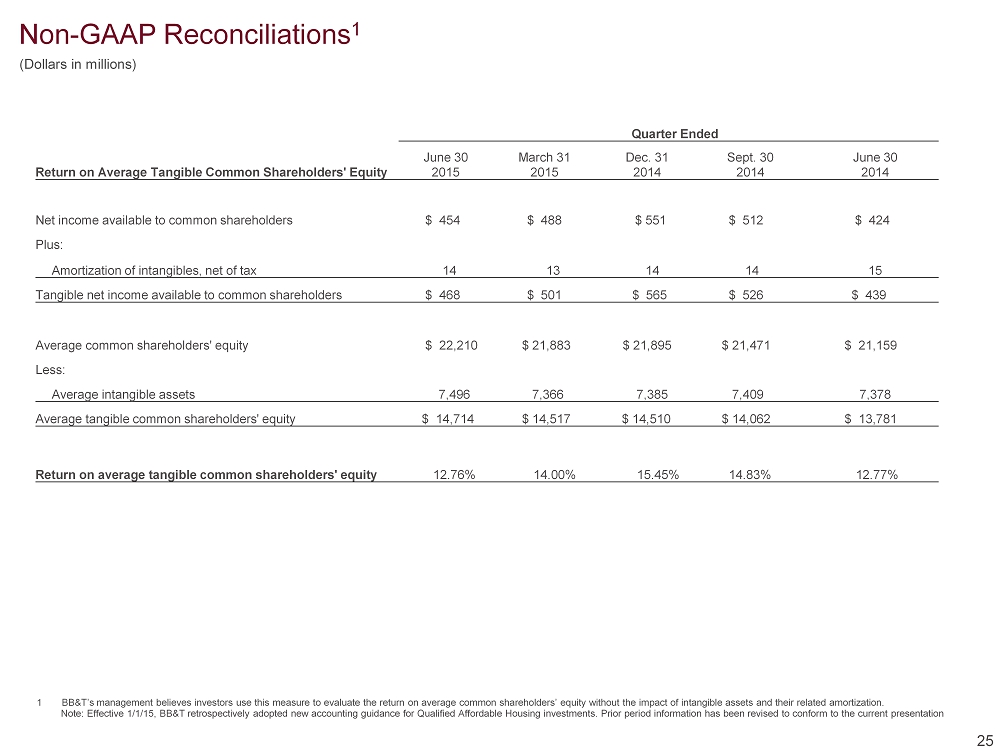
25 1 BB&T’s management believes investors use this measure to evaluate the return on average common shareholders’ equity without t h e impact of intangible assets and their related amortization. Non - GAAP Reconciliations 1 (Dollars in millions) Quarter Ended June 30 March 31 2015 Dec. 31 2014 Sept. 30 2014 June 30 2014 Return on Average Tangible Common Shareholders' Equity 2015 Net income available to common shareholders $ 454 $ 488 $ 551 $ 512 $ 424 Plus: Amortization of intangibles, net of tax 14 13 14 14 15 Tangible net income available to common shareholders $ 468 $ 501 $ 565 $ 526 $ 439 Average common shareholders' equity $ 22,210 $ 21,883 $ 21,895 $ 21,471 $ 21,159 Less: Average intangible assets 7,496 7,366 7,385 7,409 7,378 Average tangible common shareholders' equity $ 14,714 $ 14,517 $ 14,510 $ 14,062 $ 13,781 Return on average tangible common shareholders' equity 12.76% 14.00% 15.45% 14.83% 12.77% Note: Effective 1/1/15, BB&T retrospectively adopted new accounting guidance for Qualified Affordable Housing investments. Pr io r period information has been revised to conform to the current presentation
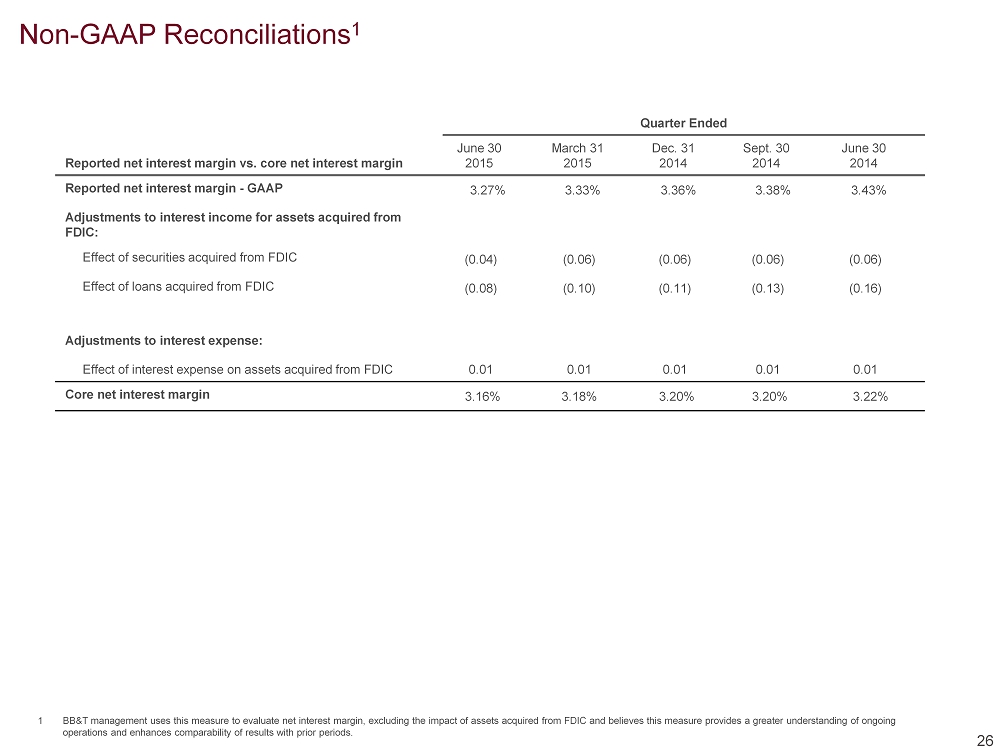
Non - GAAP Reconciliations 1 Quarter Ended Reported net interest margin vs. core net interest margin June 30 2015 March 31 2015 Dec. 31 2014 Sept. 30 2014 June 30 2014 Reported net interest margin - GAAP 3.27% 3.33% 3.36% 3.38% 3.43% Adjustments to interest income for assets acquired from FDIC: Effect of securities acquired from FDIC (0.04) (0.06) (0.06) (0.06) (0.06) Effect of loans acquired from FDIC (0.08) (0.10) (0.11) (0.13) (0.16) Adjustments to interest expense: Effect of interest expense on assets acquired from FDIC 0.01 0.01 0.01 0.01 0.01 Core net interest margin 3.16% 3.18% 3.20% 3.20% 3.22% 26 1 BB&T management uses this measure to evaluate net interest margin, excluding the impact of assets acquired from FDIC and beli e ves this measure provides a greater understanding of ongoing operations and enhances comparability of results with prior periods.
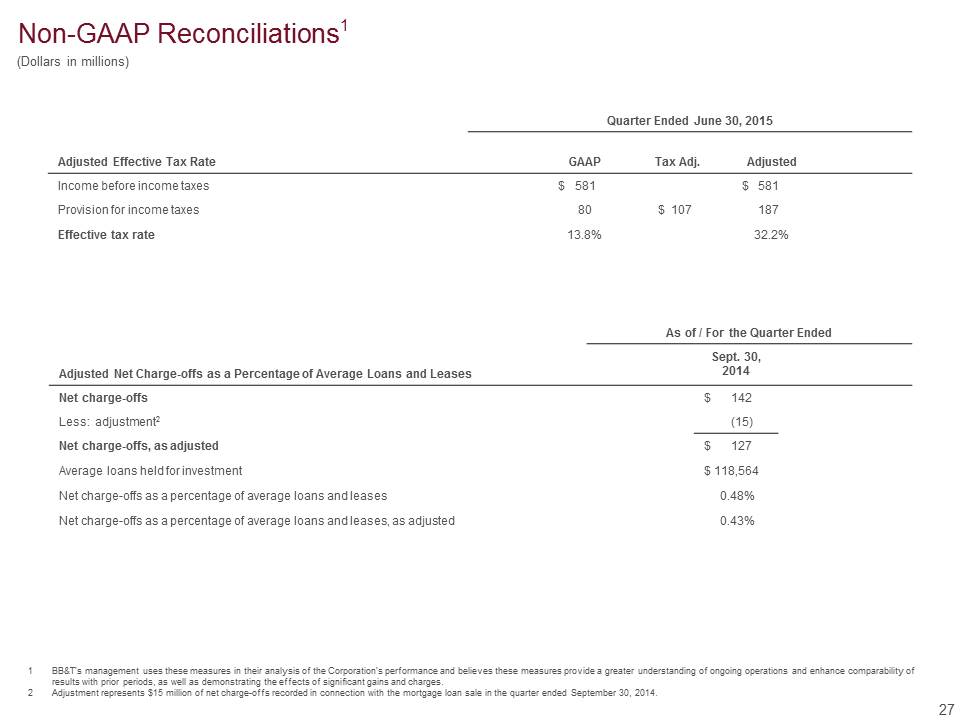
Non - GAAP Reconciliations 1 Quarter Ended June 30, 2015 Adjusted Effective Tax Rate GAAP Tax Adj. Adjusted Income before income taxes $ 581 $ 581 Provision for income taxes 80 $ 107 187 Effective tax rate 13.8% 32.2% 27 1 BB&T’s management uses these measures in their analysis of the Corporation’s performance and believes these measures provide a g reater understanding of ongoing operations and enhance comparability of results with prior periods, as well as demonstrating the effects of significant gains and charges. 2 Adjustment represents $15 million of net charge - offs recorded in connection with the mortgage loan sale in the quarter ended Sep tember 30, 2014. (Dollars in millions) As of / For the Quarter Ended Adjusted ALLL to Net Charge - offs Sept. 30, 2014 Net charge - offs (excluding covered) $ 142 Less: adjustment 2 (15) Net charge - offs, as adjusted $ 127 Average loans held for investment $ 118,564 Ratio of allowance for loan and lease losses to net charge - offs (excluding covered) 0.48% Ratio of allowance for loan and lease losses to net charge - offs, (excluding covered) as adjusted 0.43%