
Form 6-K TASEKO MINES LTD For: Mar 31
UNITED STATES
SECURITIES AND EXCHANGE COMMISSION
Washington, D.C. 20549
FORM 6-K
REPORT OF FOREIGN PRIVATE ISSUER PURSUANT TO RULE 13a-16
OR 15d-16
UNDER THE SECURITIES EXCHANGE ACT OF 1934
As at May 11, 2015
Commission File Number: 001-31965
TASEKO MINES LIMITED.
(Translation of registrant's name into English)
Suite 1500 – 1040 West Georgia St.
Vancouver, British Columbia
Canada V6E 4H1
(Address of principal executive offices)
Indicate by check mark whether the registrant files or will file annual reports under cover Form 20-F or Form 40-F.
[ ] Form 20-F [ x ] Form 40-F
Indicate by check mark if the registrant is submitting the Form 6-K in paper as permitted by Regulation S-T Rule 101(b)(1): [ ]
Indicate by check mark if the registrant is submitting the Form 6-K in paper as permitted by Regulation S-T Rule 101(b)(7): [ ]

SUBMITTED HEREWITH
Exhibits
| 99.1 | Condensed Consolidated Interim Financial Statements March 31, 2015 (Unaudited) | |
| 99.2 | Management’s Discussion and Analysis |
SIGNATURES
Pursuant to the requirements of the Securities Exchange Act of 1934, the registrant has duly caused this report to be signed on its behalf by the undersigned, thereunto duly authorized.
| Taseko Mines Ltd. | ||
| (Registrant) | ||
| Date: May 13, 2015 | By: | /s/ Stuart McDonald |
| Stuart McDonald | ||
| Title: | Chief Financial Officer | |
![]()
Condensed Consolidated Interim Financial Statements
March
31, 2015
(Unaudited)
| TASEKO MINES LIMITED |
| Condensed Consolidated Interim Statements of Comprehensive Income (Loss) |
| (Cdn$ in thousands, except share and per share amounts) |
| (Unaudited) |
| Three months ended March 31 | |||||||||
| 2015 | 2014 | ||||||||
| Note | |||||||||
| Revenues | 3 | 61,835 | 104,996 | ||||||
| Cost of sales | 4 | ||||||||
| Production costs | (59,506 | ) | (85,557 | ) | |||||
| Depletion and amortization | (10,308 | ) | (10,652 | ) | |||||
| Earnings (loss) from mining operations | (7,979 | ) | 8,787 | ||||||
| General and administrative | (4,743 | ) | (5,074 | ) | |||||
| Exploration and evaluation | (264 | ) | (1,748 | ) | |||||
| Gain on derivatives | 5 | 11,785 | 1,082 | ||||||
| Other income (expenses) | 271 | 1,085 | |||||||
| Income (loss) before financing costs and income taxes | (930 | ) | 4,132 | ||||||
| Finance expenses | 6 | (6,362 | ) | (6,647 | ) | ||||
| Finance income | 657 | 1,122 | |||||||
| Foreign exchange loss | (21,606 | ) | (8,092 | ) | |||||
| Income (loss) before income taxes | (28,241 | ) | (9,485 | ) | |||||
| Income tax recovery (expense) | 7 | 3,035 | 337 | ||||||
| Net income (loss) for the period | (25,206 | ) | (9,148 | ) | |||||
| Other comprehensive income (loss), net of tax: | |||||||||
| Unrealized gain (loss) on available-for-sale financial assets | 222 | 3,509 | |||||||
| Foreign currency translation reserve | 5,078 | - | |||||||
| Total other comprehensive income (loss) for the period | 5,300 | 3,509 | |||||||
| Total comprehensive income (loss) for the period | (19,906 | ) | (5,639 | ) | |||||
| Earnings (loss) per share | |||||||||
| Basic | (0.11 | ) | (0.05 | ) | |||||
| Diluted | (0.11 | ) | (0.05 | ) | |||||
| Weighted average shares outstanding (thousands) | |||||||||
| Basic | 221,809 | 193,708 | |||||||
| Diluted | 221,809 | 193,708 | |||||||
The accompanying notes are an integral part of these consolidated interim financial statements.
| TASEKO MINES LIMITED |
| Condensed Consolidated Interim Statements of Cash Flows |
| (Cdn$ in thousands) |
| (Unaudited) |
| Three months ended March 31 | |||||||||
| 2015 | 2014 | ||||||||
| Note | |||||||||
| Operating activities | |||||||||
| Net income (loss) for the period | (25,206 | ) | (9,148 | ) | |||||
| Adjustments for: | |||||||||
| Depletion and amortization | 10,334 | 10,735 | |||||||
| Income tax expense (recovery) | 7 | (3,035 | ) | (337 | ) | ||||
| Share-based compensation expense | 206 | 2,083 | |||||||
| Gain on derivatives | 5 | (11,785 | ) | (1,082 | ) | ||||
| Finance expenses (income) | 5,704 | 5,525 | |||||||
| Unrealized foreign exchange loss | 21,469 | 8,480 | |||||||
| Other operating activities | (4 | ) | (18 | ) | |||||
| Net change in non-cash working capital | 14 | (1,011 | ) | 7,063 | |||||
| Cash provided by (used for) operating activities | (3,328 | ) | 23,301 | ||||||
| Investing activities | |||||||||
| Investment in property, plant and equipment | (5,870 | ) | (5,644 | ) | |||||
| Proceeds from the sale/settlement of derivatives | 5 | 17,362 | - | ||||||
| Investment in financial assets | - | (8,109 | ) | ||||||
| Interest received | 178 | 92 | |||||||
| Cash provided by (used for) investing activities | 11,670 | (13,661 | ) | ||||||
| Financing activities | |||||||||
| Repayment of debt | (4,368 | ) | (6,142 | ) | |||||
| Interest paid | (654 | ) | (1,006 | ) | |||||
| Common shares issued for cash | - | 480 | |||||||
| Cash provided by (used for) financing activities | (5,022 | ) | (6,668 | ) | |||||
| Effect of exchange rate changes on cash and equivalents | 1,641 | 863 | |||||||
| Increase (decrease) in cash and equivalents | 4,961 | 3,835 | |||||||
| Cash and equivalents, beginning of year | 53,299 | 82,865 | |||||||
| Cash and equivalents, end of period | 58,260 | 86,700 | |||||||
The accompanying notes are an integral part of these consolidated interim financial statements.
| TASEKO MINES LIMITED |
| Condensed Consolidated Interim Balance Sheets |
| (Cdn$ in thousands) |
| (Unaudited) |
| March 31, | December 31, | ||||||||
| 2015 | 2014 | ||||||||
| Note | |||||||||
| ASSETS | |||||||||
| Current assets | |||||||||
| Cash and equivalents | 58,260 | 53,299 | |||||||
| Accounts receivable | 18,332 | 12,618 | |||||||
| Other financial assets | 8 | 977 | 6,554 | ||||||
| Inventories | 9 | 44,673 | 36,094 | ||||||
| Current tax receivable | 9,072 | 27,153 | |||||||
| Prepaids | 514 | 913 | |||||||
| 131,828 | 136,631 | ||||||||
| Other financial assets | 8 | 42,388 | 41,484 | ||||||
| Property, plant and equipment | 10 | 820,456 | 793,659 | ||||||
| Other receivables | 15,985 | 15,985 | |||||||
| Goodwill | 5,222 | 4,783 | |||||||
| 1,015,879 | 992,542 | ||||||||
| LIABILITIES | |||||||||
| Current liabilities | |||||||||
| Accounts payable and accrued liabilities | 35,167 | 42,541 | |||||||
| Current portion of long-term debt | 11 | 11,423 | 20,157 | ||||||
| Interest payable | 8,998 | 3,746 | |||||||
| 55,588 | 66,444 | ||||||||
| Long-term debt | 11 | 325,142 | 293,506 | ||||||
| Other financial liabilities | 78 | 110 | |||||||
| Provision for environmental rehabilitation ("PER") | 135,100 | 110,136 | |||||||
| Deferred tax liabilities | 97,363 | 100,071 | |||||||
| 613,271 | 570,267 | ||||||||
| EQUITY | |||||||||
| Share capital | 12 | 417,944 | 417,944 | ||||||
| Contributed surplus | 41,129 | 40,890 | |||||||
| Accumulated other comprehensive income (loss) ("AOCI") | 12,133 | 6,833 | |||||||
| Retained earnings (deficit) | (68,598 | ) | (43,392 | ) | |||||
| 402,608 | 422,275 | ||||||||
| 1,015,879 | 992,542 |
The accompanying notes are an integral part of these consolidated interim financial statements.
| TASEKO MINES LIMITED |
| Condensed Consolidated Interim Statements of Changes in Equity |
| (Cdn$ in thousands) |
| (Unaudited) |
| Share | Contributed | Retained | |||||||||||||
| capital | surplus | AOCI | earnings | Total | |||||||||||
| (deficit) | |||||||||||||||
| Balance at January 1, 2014 | 372,274 | 38,507 | 4,943 | 10,492 | 426,216 | ||||||||||
| Exercise of options | 687 | (207 | ) | - | - | 480 | |||||||||
| Share-based compensation | - | 1,938 | - | - | 1,938 | ||||||||||
| Total comprehensive income (loss) for the period | - | - | 3,509 | (9,148 | ) | (5,639 | ) | ||||||||
| Balance at March 31, 2014 | 372,961 | 40,238 | 8,452 | 1,344 | 422,995 | ||||||||||
| Balance at January 1, 2015 | 417,944 | 40,890 | 6,833 | (43,392 | ) | 422,275 | |||||||||
| Share-based compensation | - | 239 | - | - | 239 | ||||||||||
| Total comprehensive income (loss) for the period | - | - | 5,300 | (25,206 | ) | (19,906 | ) | ||||||||
| Balance at March 31, 2015 | 417,944 | 41,129 | 12,133 | (68,598 | ) | 402,608 |
The accompanying notes are an integral part of these consolidated interim financial statements.
| TASEKO MINES LIMITED |
| Notes to Condensed Consolidated Interim Financial Statements |
| (Cdn$ in thousands - unaudited) |
| 1. |
REPORTING ENTITY |
Taseko Mines Limited (the Company) is a corporation governed by the British Columbia Business Corporations Act. The unaudited consolidated interim financial statements of the Company as at and for the three month period ended March 31, 2015 comprise the Company, its subsidiaries and its 75% interest in the Gibraltar joint arrangement since its formation on March 31, 2010. The Company is principally engaged in the production and sale of metals, as well as related activities including exploration and mine development, within the province of British Columbia, Canada and the state of Arizona, USA. Seasonality does not have a significant impact on the Company’s operations.
|
2. |
SIGNIFICANT ACCOUNTING POLICIES |
|
|
|
|
(a) |
Statement of compliance |
These condensed consolidated interim financial statements have been prepared in accordance with IAS 34, Interim Financial Reporting and follow the same accounting policies and methods of application as the Company’s most recent annual financial statements. These condensed consolidated interim financial statements do not include all of the information required for full consolidated annual financial statements and should be read in conjunction with the consolidated financial statements of the Company as at and for the year ended December 31, 2014 prepared in accordance with International Financial Reporting Standards (IFRS) as issued by the International Accounting Standards Board (IASB).
These condensed consolidated interim financial statements were authorized for issue by the Audit and Risk Committee of the Board on May 11, 2015.
|
(b) |
Changes in accounting policies and disclosures |
IFRS 2, Share-based Payments (effective for annual periods beginning on or after July 1, 2014) clarifies the definition of a vesting condition and separately defines performance and service conditions. Based on the Company’s analysis, this clarification did not have an impact on the consolidated financial statements for the current or prior periods presented.
IFRS 3, Business Combinations (effective for annual periods beginning on or after July 1, 2014) requires that an obligation to pay contingent consideration that meets the definition of a financial instrument is classified as a financial liability or as equity on the basis of the definitions of IAS 32. Additionally, it clarifies that IFRS 3 does not apply to the formation of any joint arrangement and that the scope exemption only applies in the financial statements of the joint arrangement itself. Based on the Company’s analysis, this standard did not have an impact on the consolidated financial statements for the current or prior periods presented.
IAS 24 Related Party Disclosures (effective for annual periods beginning on or after July 1, 2014) requires a reporting entity to include as a related party, an entity that provides key management personnel services to the reporting entity or to the parent of the reporting entity. Based on the Company’s analysis, this standard did not have an impact on the consolidated financial statements for the current or prior periods presented.
1
| TASEKO MINES LIMITED |
| Notes to Condensed Consolidated Interim Financial Statements |
| (Cdn$ in thousands - unaudited) |
| 3. |
REVENUE |
| Three months ended March 31, | ||||||
| 2015 | 2014 | |||||
| Copper concentrate | 58,663 | 98,894 | ||||
| Copper cathode | (130 | ) | - | |||
| Total copper sales | 58,533 | 98,894 | ||||
| Molybdenum concentrate | 2,598 | 5,090 | ||||
| Silver contained in copper concentrate | 704 | 1,012 | ||||
| 61,835 | 104,996 | |||||
| 4. |
COST OF SALES |
| Three months ended March 31, | ||||||
| 2015 | 2014 | |||||
| Direct mining costs | 56,180 | 62,720 | ||||
| Treatment and refining costs | 6,770 | 7,702 | ||||
| Transportation costs | 3,617 | 6,513 | ||||
| Changes in inventories of finished goods and work in process | (7,061 | ) | 8,622 | |||
| Production costs | 59,506 | 85,557 | ||||
| Depletion and amortization | 10,308 | 10,652 | ||||
| Cost of sales | 69,814 | 96,209 | ||||
Cost of sales consists of direct mining costs, which include personnel costs, mine site supervisory costs, non-capitalized stripping costs, repair & maintenance costs, depletion and amortization, operating supplies and external services.
| 5. |
DERIVATIVE INSTRUMENTS |
| Three months ended March 31, | ||||||
| 2015 | 2014 | |||||
| Realized gain (loss) on copper put options | 13,536 | (1,662 | ) | |||
| Unrealized gain (loss) on copper put options | (1,751 | ) | 2,744 | |||
| 11,785 | 1,082 | |||||
During the first quarter, the Company received proceeds of $17,362 on the settlement and sale of the copper put option contracts. Of this, $2,244 related to the settlement of contracts that matured in-the-money in January, 2015 and $15,118 related to the sale of the contracts with maturities from February to June, 2015. The Company recognized a realized gain of $13,536 on these settlements in the three month period ended March 31, 2015.
Subsequent to the quarter end, the Company purchased additional copper put option contracts for 30 million pounds of copper spread evenly over the second and third quarter of 2015 at a strike price of US$2.50 per pound. The total cost of these put options was $1,413.
2
| TASEKO MINES LIMITED |
| Notes to Condensed Consolidated Interim Financial Statements |
| (Cdn$ in thousands - unaudited) |
| 6. |
FINANCE EXPENSES |
| Three months ended March 31, | ||||||
| 2015 | 2014 | |||||
| Interest expense | 5,705 | 6,176 | ||||
| Accretion on PER | 657 | 471 | ||||
| 6,362 | 6,647 | |||||
| 7. |
INCOME TAX |
| Three months ended March 31, | ||||||
| 2015 | 2014 | |||||
| Current expense (recovery) | - | (234 | ) | |||
| Deferred expense (recovery) | (3,035 | ) | (103 | ) | ||
| (3,035 | ) | (337 | ) | |||
| 8. |
OTHER FINANCIAL ASSETS |
| March 31, | December 31, | |||||
| 2015 | 2014 | |||||
| Current: | ||||||
| Copper put option contracts | - | 5,577 | ||||
| Marketable securities – available for sale | 977 | 977 | ||||
| 977 | 6,554 | |||||
| Long-term: | ||||||
| Subscription receipts – available for sale | 12,400 | 12,400 | ||||
| Reclamation deposits | 29,988 | 29,084 | ||||
| 42,388 | 41,484 |
| 9. |
INVENTORIES |
| March 31, | December 31, | |||||
| 2015 | 2014 | |||||
| Work in process | 3,482 | 2,095 | ||||
| Finished goods: | ||||||
| Copper contained in concentrate | 12,858 | 7,328 | ||||
| Molybdenum concentrate | 458 | 314 | ||||
| Materials and supplies | 27,875 | 26,357 | ||||
| 44,673 | 36,094 |
3
| TASEKO MINES LIMITED |
| Notes to Condensed Consolidated Interim Financial Statements |
| (Cdn$ in thousands - unaudited) |
| 10. |
PROPERTY, PLANT & EQUIPMENT |
During the three month period ended March 31, 2015, the Company capitalized stripping costs of $2,497 and incurred other capital expenditures for Gibraltar of $535. In addition, the Company capitalized development costs of $2,218 for the Florence Copper Project and $305 for the Aley Niobium Project. The rehabilitation cost asset increased by $24,113 for the three month period ended March 31, 2015, as a result of changes in estimates during the period including market driven discount rate changes. The Company incurred depletion and amortization in mining operations of $10,546 for the three month period ended March 31, 2015.
| 11. |
DEBT |
| March 31, 2015 | December 31, 2014 | |||||||||||
| Carrying Value | Fair Value | Carrying Value | Fair Value | |||||||||
| Current: | ||||||||||||
| Capital leases | 4,175 | 4,347 | 13,603 | 13,566 | ||||||||
| Secured equipment loans | 7,248 | 7,234 | 6,554 | 6,540 | ||||||||
| 11,423 | 11,581 | 20,157 | 20,106 | |||||||||
| Long-term: | ||||||||||||
| Senior notes | 249,826 | 182,443 | 228,343 | 206,127 | ||||||||
| Long-term loan | 36,159 | 36,159 | 32,245 | 32,245 | ||||||||
| Capital leases | 26,580 | 27,674 | 19,723 | 19,670 | ||||||||
| Secured equipment loans | 12,577 | 12,553 | 13,195 | 13,168 | ||||||||
| 325,142 | 258,829 | 293,506 | 271,210 | |||||||||
All debt instruments are classified as a level 2 financial instrument (note 16).
| 12. |
EQUITY |
| (a) |
Share capital |
| (thousands of shares) | Common shares | ||
| Common shares outstanding at January 1, 2015 | 221,809 | ||
| Exercise of share options | - | ||
| Common shares outstanding at March 31, 2015 | 221,809 |
The Company’s authorized share capital consists of an unlimited number of common shares with no par value.
4
| TASEKO MINES LIMITED |
| Notes to Condensed Consolidated Interim Financial Statements |
| (Cdn$ in thousands - unaudited) |
| (b) |
Share-Based Compensation |
| Three Months Ended | Three Months Ended | |||||||||||
| March 31, 2015 | March 31, 2014 | |||||||||||
| Average | Average | |||||||||||
| (thousands of options) | Options | price | Options | price | ||||||||
| Outstanding beginning of period | 11,908 | 3.28 | 9,746 | 3.43 | ||||||||
| Granted | 40 | 1.07 | 3,838 | 2.27 | ||||||||
| Exercised | - | - | (350 | ) | 1.15 | |||||||
| Forfeited | (2 | ) | 2.27 | (7 | ) | 2.94 | ||||||
| Expired | (2,424 | ) | 4.31 | (256 | ) | 3.58 | ||||||
| Outstanding at period ended | 9,522 | 3.01 | 12,971 | 3.15 | ||||||||
The weighted-average fair value of the share options issued in the three month period ended March 31, 2015 was estimated at $0.31 per share option (2014: $1.07), using the Black Scholes Option Pricing Model with the following assumptions:
| Three Months Ended | Three Months Ended | |||||
| March 31, 2015 | March 31, 2014 | |||||
| Weighted Average Forfeiture Rate (%) | - | - | ||||
| Weighted Average Market Price | 1.05 | 2.26 | ||||
| Weighted Average Volatility (%) | 44.49 | 55.63 | ||||
| Weighted Average Risk Free Interest Rate (%) | 0.45 | 1.64 | ||||
| Weighted Average Dividend Yield (%) | - | - | ||||
| Weighted Average Expected Life (years) | 3 | 4.7 |
The Company has adopted a Deferred Share Unit (“DSU”) Plan (the “DSU Plan”) for non-employee directors, effective February 15, 2013. The DSU Plan provides for an annual grant to each non-employee director of the Company, or an equivalent cash payment in lieu thereof, which participants have agreed would in first instance be used to assist in complying with the Company’s share ownership guidelines. DSUs vest immediately upon grant and are paid out in cash when a participant ceases to be a director of the Company.
During the three month period ended March 31, 2015, the Company did not issue any DSUs to directors (2014: 66,079). The total number of deferred and restricted share units outstanding at March 31, 2015 was 99,371 units (2013: 199,412).
| 13. | COMMITMENTS AND CONTINGENCIES |
| (a) | Commitments |
At March 31, 2015, capital commitments totaled $984 on a 100% basis, of which the Company’s share was $909. At March 31, 2015, the Company’s share of operating commitments totaled $10,046.
| (b) |
Contingencies |
The Company has guaranteed 100% of certain capital lease and equipment loans entered into by the Gibraltar joint venture in which it holds a 75% interest. As at March 31, 2015, this debt totaled $41,005 on a 100% basis.
5
| TASEKO MINES LIMITED |
| Notes to Condensed Consolidated Interim Financial Statements |
| (Cdn$ in thousands - unaudited) |
The Company has also guaranteed its share of additional capital lease and equipment loans totaling $19,914 on a 75% basis.
The Company is party to various contracts in respect of its operations, of which certain contracts were terminated by the Company during the prior year. The Company accrues its best estimate of the final settlement amount to be paid in respect of terminated contracts, however the actual settlement amount could differ when negotiations are finalized and any changes in cost estimates will be reflected in future periods.
| 14. |
SUPPLEMENTARY CASH FLOW INFORMATION |
| Three months ended | ||||||
| March 31, | ||||||
| 2015 | 2014 | |||||
| Change in non-cash working capital items | ||||||
| Accounts receivable | (5,715 | ) | (13,060 | ) | ||
| Inventories | (8,579 | ) | 8,695 | |||
| Prepaids | 399 | 1,724 | ||||
| Accounts payable and accrued liabilities | (5,640 | ) | 10,012 | |||
| Interest payable | 443 | 142 | ||||
| Income tax (paid)/received | 18,081 | (450 | ) | |||
| (1,011 | ) | 7,063 | ||||
| Non-cash investing and financing activities | ||||||
| Assets acquired under capital lease | - | 11,106 | ||||
| Interest earned on promissory note | - | (790 | ) | |||
| Interest expense on royalty obligation | - | 731 | ||||
| Royalty obligation settled by promissory note | - | (16,784 | ) | |||
| 15. |
RELATED PARTIES |
| Transaction value for the | ||||||||||||
| three months ended | Due from (to) related parties | |||||||||||
| March 31, | as at March 31, | |||||||||||
| 2015 | 2014 | 2015 | 2014 | |||||||||
| Hunter Dickinson Services Inc.: | ||||||||||||
| General and administrative expenses | 1,131 | 600 | ||||||||||
| Exploration and evaluation expenses | 101 | 226 | ||||||||||
| 1,232 | 826 | (593 | ) | (106 | ) | |||||||
| Gibraltar joint venture: | ||||||||||||
| Other operating income (management fee) | 281 | 281 | ||||||||||
| Reimburseable expenses | 29 | 50 | ||||||||||
| 310 | 331 | 574 | 60 | |||||||||
Hunter Dickinson Services Inc. (HDSI) is a private company, which employs some members of the executive management of the Company and invoices the Company for their executive services as well as other services. During the first quarter of 2015, the Company incurred total costs of $1,232 (Q1 2014: $826) in transactions with HDSI. Of these, $367 (Q1 2014: $389) related to legal, tax, exploration, and business development services, $147 related to reimbursements of office rent costs (Q1 2014: $151), and $718 (Q1 2014: $286) related to compensation paid for Taseko directors and the Chief Executive Officer, who are also directors of HDSI.
6
| TASEKO MINES LIMITED |
| Notes to Condensed Consolidated Interim Financial Statements |
| (Cdn$ in thousands - unaudited) |
Under the terms of the joint venture operating agreement, the Gibraltar Joint Venture pays the Company a management fee for services rendered by the Company as operator of the Gibraltar mine. In addition, the Company pays certain expenses on behalf of the Gibraltar Joint Venture and invoices the Joint Venture for these expenses.
| 16. |
FAIR VALUE MEASUREMENTS |
Fair value is the price that would be received to sell an asset or paid to transfer a liability in an orderly transaction between market participants at the measurement date. The fair value hierarchy establishes three levels to classify the inputs to valuation techniques used to measure fair value, by reference to the reliability of the inputs used to estimate the fair values.
Level 1 – quoted prices (unadjusted) in active markets for identical assets or liabilities;
Level 2 – inputs other than quoted prices included within Level 1 that are observable for the asset or liability, either directly (i.e., as prices) or indirectly (i.e., derived from prices); and
Level 3 – inputs for the asset or liability that are not based on observable market data (unobservable inputs).
The Company has certain financial assets and liabilities that are measured at fair value on a recurring basis and uses the fair value hierarchy that prioritizes the inputs to valuation techniques used to measure fair value, with Level 1 inputs having the highest priority.
| Level 1 | Level 2 | Level 3 | Total | |||||||||
| March 31, 2015 | ||||||||||||
| Concentrate receivables | - | 14,342 | - | 14,342 | ||||||||
| Available-for-sale financial assets | ||||||||||||
| Marketable Securities | 977 | - | - | 977 | ||||||||
| Subscription receipts | - | - | 12,400 | 12,400 | ||||||||
| Reclamation deposits | 29,988 | - | - | 29,988 | ||||||||
| 30,965 | 14,342 | 12,400 | 57,707 | |||||||||
| December 31, 2014 | ||||||||||||
| Concentrate receivables | - | 3,867 | - | 3,867 | ||||||||
| Financial assets designated at FVTPL | ||||||||||||
| Copper put option contracts | - | 5,577 | - | 5,577 | ||||||||
| Available-for-sale financial assets | ||||||||||||
| Marketable Securities | 977 | - | - | 977 | ||||||||
| Subscription receipts | - | - | 12,400 | 12,400 | ||||||||
| Reclamation deposits | 29,084 | - | - | 29,084 | ||||||||
| 30,061 | 9,444 | 12,400 | 51,905 |
There have been no transfers between fair value levels during the reporting period. The carrying value of cash and equivalents, accounts receivable and payable approximate their fair value as at March 31, 2015.
7
| TASEKO MINES LIMITED |
| Notes to Condensed Consolidated Interim Financial Statements |
| (Cdn$ in thousands - unaudited) |
The fair value of the senior notes, a level 1 instrument, is determined based upon publicly available information. The fair value of the capital leases and secured equipment loans, level 2 instruments, are determined through discounting future cash flows at an interest rate of 5.14% to 5.28% based on the relevant loans effective interest rate.
The fair values of the level 2 instruments, copper put option contracts are based on broker quotes. Similar contracts are traded in an active market and the broker quotes reflect the actual transactions in similar instruments.
The Company’s metal concentrate sales contracts are subject to provisional pricing with the selling price adjusted at the end of the quotational period. At each reporting date, the Company’s accounts receivable on these contracts are marked-to-market based on a quoted forward price for which there exists an active commodity market.
The subscription receipts, a level 3 instrument, are valued based on a third party transaction in the last twelve months or in the absence of a transaction, market comparison based on the average share value of comparable companies.
Commodity Price Risk
Provisional pricing mechanisms embedded within the Company’s sales arrangements have the character of a commodity derivative and are carried at fair value as part of accounts receivables. The table below summarizes the impact on revenue and equity for changes in commodity prices on the fair value of derivatives and the provisionally invoiced sales volumes.
| Three months ended March 31, | |||
| 2015 | |||
| Copper increase/decrease by US$0.25/lb (2014: US$0.31/lb) 1, 2 | 1,666 |
1The analysis is based on the assumption that the
period-end copper price increases 10% with all other variables held constant.
The closing exchange rate for the quarter ended March 31, 2015 of CAD/USD 1.2666
was used in the analysis.
2At March 31, 2015, 5.3 million pounds
of copper in concentrate were exposed to copper price movements.
8
| TASEKO MINES LIMITED |
| Management’s Discussion and Analysis |
This management’s discussion and analysis ("MD&A") is intended to help the reader understand Taseko Mines Limited (“Taseko”, “we”, “our” or the “Company”), our operations, financial performance, and current and future business environment. This MD&A is intended to supplement and complement the unaudited condensed consolidated interim financial statements and notes thereto, prepared in accordance with IAS 34 Interim Financial Reporting for the three month period ended March 31, 2015 (collectively, the “Financial Statements”). You are encouraged to review the Financial Statements in conjunction with your review of this MD&A and the most recent Form 40-F/Annual Information Form, which is available on the Canadian Securities Administrators’ website at www.sedar.com and on the EDGAR section of the United States Securities and Exchange Commission’s (“SEC”) website at www.sec.gov.
This MD&A is prepared as of May 11, 2015. All dollar figures stated herein are expressed in Canadian dollars, unless otherwise specified.
Cautionary Statement on Forward-Looking Information
This discussion includes certain statements that may be deemed "forward-looking statements". All statements in this discussion, other than statements of historical facts, that address future production, reserve potential, exploration drilling, exploitation activities, and events or developments that the Company expects are forward-looking statements. Although we believe the expectations expressed in such forward-looking statements are based on reasonable assumptions, such statements are not guarantees of future performance and actual results or developments may differ materially from those in the forward-looking statements. Factors that could cause actual results to differ materially from those in forward-looking statements include market prices, exploitation and exploration successes, continued availability of capital and financing and general economic, market or business conditions. Investors are cautioned that any such statements are not guarantees of future performance and actual results or developments may differ materially from those projected in the forward-looking statements. All of the forward-looking statements made in this MD&A are qualified by these cautionary statements. We disclaim any intention or obligation to update or revise any forward-looking statements whether as a result of new information, future events or otherwise, except to the extent required by applicable law. Further information concerning risks and uncertainties associated with these forward-looking statements and our business may be found in our most recent Form 40-F/Annual Information Form on file with the SEC and Canadian provincial securities regulatory authorities.
1
| TASEKO MINES LIMITED |
| Management’s Discussion and Analysis |
2
| TASEKO MINES LIMITED |
| Management’s Discussion and Analysis |
OVERVIEW
Taseko Mines Limited (“Taseko” or “Company”) is a mining company that seeks to create shareholder value by acquiring, developing, and operating large tonnage mineral deposits which, under conservative forward metal price assumptions, are potentially capable of supporting a mine for 10 years or longer. The Company’s sole operating asset is the 75% owned Gibraltar Mine, a large copper/molybdenum mine located in central British Columbia. The Gibraltar Mine has undergone a major expansion in recent years and is now one of the largest copper mines in North America. Taseko also owns the New Prosperity gold-copper, Aley niobium, Florence Copper and Harmony gold projects.
HIGHLIGHTS
| Financial Data | Three months ended March 31, | ||||||||
| (Cdn$ in thousands, except for per share amounts) | 2015 | 2014 | Change | ||||||
| Revenues | 61,835 | 104,996 | (43,161 | ) | |||||
| Earnings (loss) from mining operations before depletion and amortization* | 2,329 | 19,439 | (17,110 | ) | |||||
| Earnings (loss) from mining operations | (7,979 | ) | 8,787 | (16,766 | ) | ||||
| Net earnings (loss) | (25,206 | ) | (9,148 | ) | (16,058 | ) | |||
| Per share - basic (“EPS”) | (0.11 | ) | (0.05 | ) | (0.06 | ) | |||
| Adjusted net earnings (loss)* | (2,434 | ) | (2,710 | ) | 275 | ||||
| Per share - basic (“adjusted EPS”) * | (0.01 | ) | (0.01 | ) | - | ||||
| EBITDA * | (11,996 | ) | 8,858 | (20,854 | ) | ||||
| Adjusted EBITDA * | 11,224 | 14,594 | (3,370 | ) | |||||
| Cash flows provided by (used for) operations | (3,328 | ) | 23,301 | (26,629 | ) | ||||
| Operating Data (Gibraltar - 100% basis) | Three months ended March 31, | ||||||||
| 2015 | 2014 | Change | |||||||
| Tons mined (millions) | 21.0 | 25.9 | (4.9 | ) | |||||
| Tons milled (millions) | 7.8 | 7.0 | 0.8 | ||||||
| Production (million pounds Cu) | 28.4 | 34.5 | (6.1 | ) | |||||
| Sales (million pounds Cu) | 25.4 | 40.0 | (14.6 | ) | |||||
*Non-GAAP performance measure. See page 19 of this MD&A.
3
| TASEKO MINES LIMITED |
| Management’s Discussion and Analysis |
HIGHLIGHTS - CONTINUED
-
Earnings from mining operations before depletion and amortization were $2.3 million;
-
Copper production at Gibraltar was 28.4 million pounds (100% basis), and was impacted by lower head grades. Grade is steadily increasing and is expected to fluctuate between 0.25% and 0.28% for the remainder of 2015;
-
Site operating cost per ton milled* decreased to $9.66 in the first quarter of 2015, approximately 19% lower than the first quarter of 2014 due to an overall reduction in spending;
-
Total operating costs* were US$2.39 per pound produced, lower than the previous two quarters as a result of lower site operating costs and weakening Canadian dollar exchange rate;
-
At March 31, 2015 the Company had a cash balance of $58 million;
-
In May 2015, an updated mine plan and reserve for Gibraltar was announced. The new plan reduces the overall strip ratio and increases profitability of the mine;
-
In January 2015, when the copper price dropped to a recent low of US$2.45 per pound, the Company sold all outstanding copper put options for cash proceeds of $17.4 million. The Company’s hedging strategy is designed to mitigate a short term decline in copper price; and
-
In April 2015, the Company acquired copper put options for 30 million pounds over the second and third quarters of 2015 at a strike price of US$2.50 per pound.
*Non-GAAP performance measure. See page 19 of this MD&A
4
| TASEKO MINES LIMITED |
| Management’s Discussion and Analysis |
REVIEW OF OPERATIONS
Gibraltar mine (75% Owned)
Operating results in the following table are presented on a 100% basis.
| Operating Data (100% basis) | Q1 2015 | Q4 2014 | Q3 2014 | Q2 2014 | Q1 2014 | ||||||||||
| Tons mined (millions) | 21.0 | 25.1 | 32.5 | 30.2 | 25.9 | ||||||||||
| Tons milled (millions) | 7.8 | 7.6 | 7.8 | 7.7 | 7.0 | ||||||||||
| Strip ratio | 2.4 | 3.1 | 3.0 | 3.1 | 2.8 | ||||||||||
| Site operating cost per ton milled (CAD) * | $ | 9.66 | $ | 10.13 | $ | 12.10 | $ | 11.42 | $ | 11.91 | |||||
| Copper concentrate | |||||||||||||||
| Grade (%) | 0.225 | 0.222 | 0.267 | 0.285 | 0.290 | ||||||||||
| Recovery (%) | 81.4 | 81.3 | 83.3 | 85.3 | 84.6 | ||||||||||
| Production (million pounds Cu) | 28.4 | 27.7 | 34.5 | 37.6 | 34.5 | ||||||||||
| Sales (million pounds Cu) | 25.4 | 26.0 | 37.1 | 38.1 | 40.0 | ||||||||||
| Inventory (million pounds Cu) | 6.2 | 3.2 | 1.4 | 3.9 | 4.4 | ||||||||||
| Copper cathode | |||||||||||||||
| Production (million pounds) | - | 0.4 | 0.9 | 0.9 | - | ||||||||||
| Sales (million pounds) | - | 0.5 | 1.0 | 0.6 | - | ||||||||||
| Molybdenum concentrate | |||||||||||||||
| Grade (%) | 0.006 | 0.008 | 0.011 | 0.011 | 0.009 | ||||||||||
| Recovery (%) | 40.0 | 38.8 | 38.0 | 41.4 | 42.5 | ||||||||||
| Production (thousand pounds Mo) | 404 | 445 | 654 | 667 | 566 | ||||||||||
| Sales (thousand pounds Mo) | 379 | 481 | 708 | 731 | 589 | ||||||||||
| Per unit data (US$ per pound) * | |||||||||||||||
| Site operating costs* | $ | 2.12 | $ | 2.43 | $ | 2.60 | $ | 2.11 | $ | 2.19 | |||||
| By-product credits * | (0.12 | ) | (0.11 | ) | (0.25 | ) | (0.35 | ) | (0.21 | ) | |||||
| Site operating costs, net of by-product credits * | $ | 2.00 | $ | 2.32 | $ | 2.35 | $ | 1.76 | $ | 1.98 | |||||
| Off-property costs | 0.39 | 0.45 | 0.40 | 0.36 | 0.50 | ||||||||||
| Total operating costs (C1) * | $ | 2.39 | $ | 2.77 | $ | 2.75 | $ | 2.12 | $ | 2.48 |
*Non-GAAP performance measure. See page 19 of this MD&A
5
| TASEKO MINES LIMITED |
| Management’s Discussion and Analysis |
OPERATIONS ANALYSIS
During the first quarter of 2015, Gibraltar milled 7.8 million tons of ore, slightly over the design capacity of 85,000 tons per day. Gibraltar mined 21.0 million tons of material which was lower than recent quarters due to the idling of mine equipment to reduce expenditures in the face of temporary lower grade to the mill.
Average head grade for the first quarter of 2015 was 0.225% compared to 0.29% in the first quarter of 2014. Head grades are expected to fluctuate between 0.25% and 0.28% for the remainder of 2015. Lower head grades also negatively impacted copper recoveries in the first quarter of 2015. As grade improves recoveries are expected to improve as well.
Copper in concentrate production in the first quarter of 2015 was 28.4 million pounds, a decrease of 18% from copper production in the first quarter of 2014 of 34.5 million pounds. Molybdenum production during the first quarter of 2015 was 0.4 million pounds, a decrease of 29% over the first quarter of 2014. The decrease in molybdenum production is due to lower molybdenum grade.
Gibraltar’s SX/EW plant was seasonally idle in in the first quarter but was restarted in April 2015.
Site operating costs, net of by-product
credits,* per pound
(Q1 2014 compared to Q1 2015)
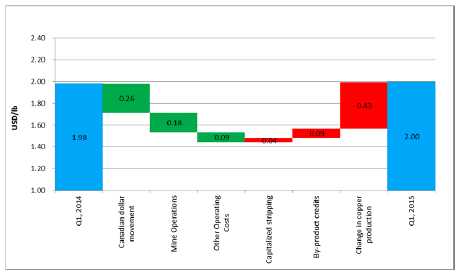
*Non-GAAP performance measure. See page 19 on this MD&A
In the first quarter of 2015, site operating costs, net of by-product credits per pound of copper produced was US$2.00, compared to US$1.98 during the first quarter of 2014. Site operating cost per ton milled decreased by approximately 19% to $9.66 in the first quarter of 2015 as a result of a reduction in waste mining, declining diesel prices and lower maintenance costs. The weakening Canadian dollar is also having a positive impact on our reported US dollar unit cost. The increase in per pound unit costs is being driven by the lower copper production as a result of lower head grades, which has offset the impact of operating cost reductions.
Off-property costs, including transportation, treatment and refining charges, for the first quarter of 2015 were US$0.39 per pound produced, compared to US$0.50 per pound produced in the first quarter of 2014. Off-property costs are driven by sales volumes, and therefore off-property cost per pound produced fluctuates based on differences between production and sales volumes.
6
| TASEKO MINES LIMITED |
| Management’s Discussion and Analysis |
The total operating costs, including off-property costs, for the first quarter of 2015 were US$2.39 per pound produced, compared to US$2.48 per pound in the first quarter of 2014.
GIBRALTAR OUTLOOK
For the balance of 2015, copper grades are forecasted to fluctuate between 0.25% and 0.28% . Based on forecasted grades and subsequent improved recoveries, the Gibraltar Mine is expected to produce 130-140 million pounds of copper in 2015 (100% basis). Increases in copper grades and production are expected to reduce total operating costs per pound over the remainder of this year. There are a number of cost control initiatives underway including mine plan modifications to reduce waste stripping requirements, a workforce reduction effective in January 2015, and initiatives with vendors to reduce costs of supplies and consumables. The mine is also benefiting from continued declines in the price of diesel, which is a significant input cost. Diesel prices have fallen by approximately 23% since the beginning of this year. The Canadian dollar has fallen approximately 15% since the beginning of 2014 and with approximately 80% of Gibraltar’s operating costs denominated in Canadian dollars, the weakening dollar has a significant impact on total operating costs per pound reported in US dollars.
The cumulative effects of these factors are expected to result in reduced operating costs at the Gibraltar Mine going forward.
REVIEW OF PROJECTS
Florence Copper project
The Florence Copper Project is currently in the final stages of permitting for the Phase 1 Production Test Facility ("PTF").
The Temporary Aquifer Protection Permit (“APP”) for the PTF issued in July 2013 by the Arizona Department of Environmental Quality (“ADEQ”) was subject to an appeal. As a result of the appeal an amendment was submitted in March 2015 and issuance of the amended APP is now anticipated during the third quarter of 2015. In December, 2014, the Company announced the receipt of a draft Underground Injection Control (UIC) permit from the U.S. Environmental Protection Agency (EPA). The UIC permit regulates the construction and operation of Florence Copper's injection wells at the site and is the final regulatory milestone required by the Company to construct and operate the PTF. The public hearing for the draft permit was held on January 22, 2015 and the public comment period expired in April, 2015. The Company expects the UIC permit to be issued by mid-2015.
Aley project
On September 19, 2014 the BC Environmental Assessment Office (EAO) issued a Section 10 Order under the BC Environmental Assessment Act, initiating the BC environmental assessment process for the Aley Niobium Project.
New Prosperity project
On February 26, 2014 the Government of Canada announced its decision to not issue the authorizations necessary for the New Prosperity project to proceed. In the wake of this decision, Taseko initiated legal proceedings in the form of two separate judicial reviews which challenge the decision and the process by which the decision was reached. In August 2014, the Company applied to the Federal Court to convert both judicial reviews into a civil action. The motion was dismissed as the court felt that the judicial review process is the correct vehicle to pursue the remedies that the Company seeks.
7
| TASEKO MINES LIMITED |
| Management’s Discussion and Analysis |
On January 14, 2015 the British Columbia Minister of Environment granted the Company a five-year extension to the Environmental Assessment Certificate.
MARKET REVIEW
Prices (USD per pound for Commodities) (Source: Bloomberg)
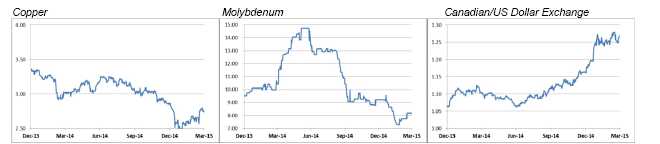
While the US dollar price of copper slipped over the course of the first quarter 2015, there was a recovery from the lows experienced in late January. While the US dollar price of copper declined to US$2.45 in January 2015 and was US$2.74 at the end of the first quarter, 4% lower than the end of 2014, the Canadian dollar price increased by 5% to C$3.48 per pound, due to a weakened Canadian dollar. At the end of March 2015, heavy rains in northern Chile caused severe flooding in the region and shut down a number of copper mines. For most of the impacted mines the shutdowns were short-term, but a number of the mines sustained a significant amount of damage and remained idled into April 2015.
Continued weakness in the iron ore and steel sectors put downward pressure on molybdenum pricing in the first quarter although the declining Canadian dollar partially offset the drop. At the end of the quarter the price was C$10.30 per pound, down approximately 4% since the end of 2014.
In the first quarter of 2015, the Canadian dollar sank to its lowest level in over six years. In March, the Canadian dollar hit a low of 0.78 to the US dollar before slightly rebounding to 0.79 at the end of the quarter. A significant factor that is driving the decline in the Canadian dollar is the price of oil which has fallen by approximately 50% in the last year.
Fluctuations in the Canadian dollar/US dollar exchange rate can have a significant effect on our operating results and the net operating costs of production is reported in US dollars per pound.
8
| TASEKO MINES LIMITED |
| Management’s Discussion and Analysis |
FINANCIAL PERFORMANCE
Earnings
Earnings from mining operations decreased to a loss of $8.0 million in the first quarter of 2015 from earnings of $8.8 million in the first quarter of 2014, primarily due to decreased copper production driven by lower grade, offset by lower production costs.
Revenues decreased by 41% from the first quarter of 2014 primarily due to decreased sales volumes of copper and molybdenum at the Gibraltar mine. Although the average realized US dollar copper price declined in the first quarter of 2015, the impact of this was largely offset by a weakening Canadian dollar.
The Company realized a net loss of $25.2 million ($0.11 per share), compared to a net loss of $9.1 million ($0.05 per share) in 2014.
Included in net earnings (loss) are a number of items that management believes require adjustment in order to better measure the underlying performance of the business. These items are in the table below:
| Three months ended | |||||||||
| March 31, | |||||||||
| (Cdn$ in thousands) | 2015 | 2014 | Change | ||||||
| Net (loss) earnings | (25,206 | ) | (9,148 | ) | (16,058 | ) | |||
| Unrealized loss (gain) on derivatives | 1,751 | (2,744 | ) | 4,495 | |||||
| Unrealized foreign exchange (gain) loss | 21,469 | 8,480 | 12,989 | ||||||
| Estimated tax effect of adjustments | (448 | ) | 702 | (1,151 | ) | ||||
| Adjusted net earnings (loss) * | (2,434 | ) | (2,710 | ) | 275 | ||||
*Non-GAAP performance measure. See page 19 of this MD&A
Unrealized gains/losses on derivatives can vary materially each period and have a significant impact on earnings. These amounts represent the change in fair value of copper put options during the period.
The Canadian dollar weakened during the first quarter of 2015 which resulted in an unrealized foreign exchange loss of $22.0 million.
The unrealized foreign exchange (gain) loss and the unrealized gains and losses on the derivative instruments are removed from the adjusted net earnings (loss) measure as they are not indicative of a realized economic gain/loss or the underlying performance of the business in the period.
9
| TASEKO MINES LIMITED |
| Management’s Discussion and Analysis |
| Revenues | |||||||||
| Three months ended | |||||||||
| March 31, | |||||||||
| (Cdn$ in thousands) | 2015 | 2014 | Change | ||||||
| Copper in concentrate | 58,663 | 98,894 | (40,231 | ) | |||||
| Copper cathode | (130 | ) | - | (130 | ) | ||||
| Total copper sales | 58,533 | 98,894 | (40,361 | ) | |||||
| Molybdenum concentrate | 2,598 | 5,090 | (2,492 | ) | |||||
| Silver contained in copper concentrate | 704 | 1,012 | (308 | ) | |||||
| 61,835 | 104,996 | (43,161 | ) | ||||||
| (thousands of pounds, unless otherwise noted) | |||||||||
| Copper in concentrate * | 18,375 | 28,914 | (10,539 | ) | |||||
| Copper cathode | - | - | - | ||||||
| Total copper sales | 18,375 | 28,914 | (10,539 | ) | |||||
| Average realized copper price (US$ per pound) | 2.57 | 3.10 | (0.53 | ) | |||||
| Average LME copper price (US$ per pound) | 2.63 | 3.19 | (0.56 | ) | |||||
*This amount includes a net smelter payable deduction of approximately 3.5% to derive net pounds of copper sold.
Copper revenues for the first quarter of 2015 decreased by $40.2 million, or 41%, over the first quarter of 2014, primarily due to a decrease in copper sales volumes with a lower US dollar realized copper price, partially offset by the strengthening US dollar.
As copper sales are denominated in US dollars, the strengthening of the US dollar translates into increased Canadian dollar revenues. Comparing the average foreign exchange of the first quarters of 2014 and 2015 the US dollar strengthened by 12% in 2015, partially offsetting the weakening average realized copper price, which declined by 17% over the same period. The Company’s average realized copper price for the first quarter of 2015 was US$2.57 per pound, compared to US$3.10 for the first quarter of 2014. London Metals Exchange (LME) copper prices averaged US$2.63 in the first quarter of 2015. The Company’s average realized copper price is lower than the LME’s average due to a portion of the Company’s receivables being revalued in a decreasing copper price environment.
Molybdenum revenues for the first quarter of 2015 totaled $2.6 million, down from $5.1 million in the corresponding last year’s quarter. The decrease in revenues was due to a decrease in sales volumes as a result of lower production driven by grade, and the declining molybdenum price.
10
| TASEKO MINES LIMITED |
| Management’s Discussion and Analysis |
| Cost of sales | |||||||||
| Three months ended | |||||||||
| March 31, | |||||||||
| (Cdn$ in thousands) | 2015 | 2014 | Change | ||||||
| Direct mining and processing costs | 56,180 | 62,720 | (6,540 | ) | |||||
| Treatment and refining costs | 6,770 | 7,702 | (932 | ) | |||||
| Transportation costs | 3,617 | 6,513 | (2,896 | ) | |||||
| Changes in inventories of finished goods and WIP | (7,061 | ) | 8,622 | (15,683 | ) | ||||
| Production costs | 59,506 | 85,557 | (26,051 | ) | |||||
| Depletion and amortization | 10,308 | 10,652 | (344 | ) | |||||
| Cost of sales | 69,814 | 96,209 | (26,395 | ) | |||||
| Site operating costs per ton milled* | $ | 9.66 | $ | 11.91 | ($2.25 | ) | |||
*Non-GAAP performance measure. See page 19 of this MD&A
Direct mining and processing costs decreased by 10% compared to the first quarter of 2014 due to lower diesel prices, lower tons mined and decreased maintenance costs. Additionally, a grinding media recycling program is resulting in declining milling costs. Overall tons milled increased, cost per ton milled decreased 19% from the first quarter of 2014.
Total treatment and refining costs and transportation have decreased over the first quarter of 2014, mostly due to the 36% decrease in copper sales volumes offset by the strengthening of the US dollar.
Depletion and amortization for the first quarter of 2015 was $10.3 million, a 2% decrease from the prior years quarter.
| Other expenses (income) | |||||||||
| Three months ended | |||||||||
| March 31, | |||||||||
| (Cdn$ in thousands) | 2015 | 2014 | Change | ||||||
| General and administrative | 4,473 | 5,074 | (601 | ) | |||||
| Exploration and evaluation | 264 | 1,748 | (1,484 | ) | |||||
| Other expense (income) | (271 | ) | (1,085 | ) | 814 | ||||
General and administrative costs are relatively constant quarter-over-quarter as the Company is focusing on controlling general and administrative expenditures.
Exploration and evaluation costs represent all costs associated with the New Prosperity project. Project development costs for the Aley and Florence Copper projects have been capitalized.
Gain on derivatives
During the first quarter of 2015, the Company received $2.3 million on the settlement of the January copper put options that settled in-the-money and proceeds of $15.2 million from the sale of the copper put options that were scheduled to mature in February to June, 2015. The Company recognized a realized gain of $13.5 million on these settlements in the first quarter of 2015. In the first quarter of 2014 the Company recognized a $2.7 million unrealized gain on the copper derivative instruments due to increases in the fair value of the put options on the outstanding contracts. The Company’s hedging strategy is designed to mitigate short term declines in copper prices. In April 2015, the Company acquired copper put options for 30 million pounds over the second and third quarters of 2015 at a strike price of US$2.50 per pound.
11
| TASEKO MINES LIMITED |
| Management’s Discussion and Analysis |
Finance income & expenses
Finance expenses for the first quarter of 2015 decreased by $0.3 million compared to the first quarter of 2014 due to lower equipment lease liabilities.
Finance income is primarily comprised of income earned on reclamation deposits. For the first quarter of 2015, finance income is lower than the prior year’s quarter due to lower interest earned on the reclamation deposits.
Income tax
| Three months ended | |||||||||
| March 31, | |||||||||
| (Cdn$ in thousands) | 2015 | 2014 | |||||||
| Current expense (recovery) | - | 234 | (234 | ) | |||||
| Deferred expense (recovery) | (3,035 | ) | 103 | (3,138 | ) | ||||
| (3,035 | ) | 337 | (3,372 | ) | |||||
| Effective tax rate | 10.7% | 1.9% | 8.8% | ||||||
| Canadian statutory rate | 26.0% | 26.0% | - | ||||||
| BC Mineral tax rate | 9.62% | 9.62% | - | ||||||
The Company did not have a current tax expense or recovery in the quarter. The deferred income tax recovery for the quarter was mainly driven by an increase to certain deferred income tax assets such as non-capital losses and the temporary difference recognized on the reclamation obligation, offset by an increase in temporary differences on property, plant and equipment.
The effective tax rate for the first quarter of 2015 was 10.7%, which is lower than the statutory rate of 35.6% . The difference is a result of permanent differences related to non-deductible share-based compensation and expenditures incurred that are not deductible for BC Mineral tax, in addition to an increase in items not recognized for tax, such as unrealized foreign exchange losses on debt and other items.
12
| TASEKO MINES LIMITED |
| Management’s Discussion and Analysis |
FINANCIAL CONDITION REVIEW
Balance sheet review
| As at March 31, | As at December 31 | ||||||||
| (Cdn$ in thousands) | 2015 | 2014 | Change | ||||||
| Cash and equivalents | 58,260 | 53,299 | 4,961 | ||||||
| Other current assets | 73,568 | 83,332 | (9,764 | ) | |||||
| Non-current assets | 820,456 | 793,659 | 26,797 | ||||||
| Other assets | 63,595 | 62,252 | 1,343 | ||||||
| Total assets | 1,015,879 | 992,542 | 23,337 | ||||||
| Current liabilities | 55,588 | 66,444 | (10,856 | ) | |||||
| Long-term debt | 325,142 | 293,506 | 31,636 | ||||||
| Other liabilities | 232,541 | 210,317 | 22,224 | ||||||
| Total liabilities | 613,271 | 570,267 | 43,004 | ||||||
| Equity | 402,608 | 422,275 | (19,667 | ) | |||||
| Working capital | 76,240 | 70,187 | 6,053 | ||||||
| Net debt | 278,305 | 260,364 | 17,941 | ||||||
| Total common shares outstanding (millions) | 221.8 | 221.8 | - |
The Company’s asset base is comprised principally of non-current assets, including property, plant and equipment, reflecting the capital intensive nature of the mining business. The current assets include cash, accounts receivable, other financial assets and inventories (supplies and production inventories), along with prepaid expenses and deposits. Production inventories, accounts receivable and cash balances fluctuate in relation to shipping and cash settlement schedules.
Total liabilities increased from $570.3 million at December 31, 2014 to $616.3 million as at March 31, 2015. Current liabilities decreased by $10.9 million, primarily due to the settlement of the copper and molybdenum sales provisionally invoiced during a period of higher prices along with a reduction in contractor expenses. Long-term debt increased by $31.6 million mainly represented by the Company’s US dollar denominated debt being revalued.
Other long-term liabilities increased by $22.2 million mainly due to a $24 million increase in the provision for the environmental rehabilitation (PER) driven by changes in inflation and discounts rates. The Bank of Canada long-term benchmark bond rate used as a proxy for long-term discount rates decreased to 1.99% at March 31, 2015 from the 2.33% level at December 31, 2014. Given the long timeframe over which environmental rehabilitation expenditures are expected to be incurred (over 100 years), the carrying value of the provision and asset are very sensitive to changes in discount rates.
As at May 11, 2015, there were 221,808,638 common shares outstanding. In addition, there were 9,422,000 director and employee stock options outstanding at May 11, 2015. More information on these instruments and the terms of their exercise is set out in note 21 of our 2014 annual financial statements.
13
| TASEKO MINES LIMITED |
| Management’s Discussion and Analysis |
Liquidity, cash flow and capital resources
At March 31, 2015, the Company had cash and equivalents of $58.3 million, a $5 million increase over the $53.3 million reported at December 31, 2014. The Company maintained a strategy of retaining significant liquidity to fund operations and to reflect the capital intensive nature of the business.
Cash used for operations was $3.4 million for the first quarter of 2015 compared with $23.3 million cash provided for the first quarter of 2014. Operating cash flow decreased due to lower production resulting in lower sales accentuated by a declining copper price market. These factors were partially offset by lower operating costs and a strengthening US dollar.
Changes in non-cash working capital items resulted in cash used of $1.0 million compared with $7.1 million provided in the first quarter of 2014, mostly due to the higher levels of copper inventories and higher accounts receivable balances and lower accounts payable, offset by a reduction in tax receivables. During the first quarter of 2015, rock slides caused rail disruptions which reduced the Company’s ability to transport copper concentrate to the port, that lead to a higher inventory balance at quarter end.
Cash provided by investing activities for the first quarter of 2015 was $11.7 million compared to $13.7 million used in the prior period’s quarter. Cash flow provided by investing activities in the first quarter of 2015 primarily related to the sale of copper put options which resulted in an inflow of $17.4 million, partially offset by $5.8 million property, plant and equipment expenditure. Included in property plant and equipment expenditure was $2.5 million of capitalized stripping, $0.5 million of capital expenditures at Gibraltar, $0.3 million for the Aley project and $2.2 million for the Florence Copper Project. The prior period’s quarter major components were an outflow of $5.7 million invested in property, plant and equipment and $8.1 million invested in financial assets.
Cash used for financing activities for the first quarter of 2015 was $5.0 million, primarily due to debt repayment and interest paid. Cash used for financing activities for the prior period’s quarter was $6.7 million, debt repayment and interest paid were slightly higher for the first quarter of 2014 offset by $0.4 million received for share issuances.
Future changes in copper and molybdenum market prices could impact the timing and amount of cash available for future investment in capital projects and/or other uses of capital. To partially mitigate these risks, copper put options are entered into for a portion of our share of Gibraltar copper production. In addition to operating cash flows generated by the Gibraltar mine, alternate sources of funding for future capital or other liquidity needs may include, strategic partnerships, such as the Gibraltar joint venture and the Franco-Nevada gold stream transaction for the New Prosperity project, and debt or equity financings. These alternatives are regularly evaluated to determine the optimal mix of capital resources to address capital needs and to minimize the weighted average cost of capital.
Hedging strategy
The Company’s hedging strategy is to secure a minimum price for a portion of copper production using put options that are either purchased outright or funded by the sale of call options that are significantly out of the money. The amount and duration of the hedge position is based on an assessment of business-specific risk elements combined with the copper pricing outlook. Copper price and quantity exposure are reviewed at least quarterly to ensure that adequate revenue protection is in place. Hedge positions are typically extended adding incremental quarters at established put strike prices to provide the necessary price protection.
Considerations on the cost of the hedging program include an assessment of Gibraltar’s estimated production costs, anticipated copper prices and the Company’s capital requirements during the relevant period.
14
| TASEKO MINES LIMITED |
| Management’s Discussion and Analysis |
During the three month period ended March 31, 2015, the Company received $2.2 million on the settlement of the January copper put options that settled in-the-money and proceeds of $15.1 million from the sale of the copper put options that were scheduled to mature in February to June, 2015. The Company recognized a net gain of $11.8 million on these settlements. The Company’s hedging strategy is designed to mitigate short term declines in copper prices.
In April 2015, the Company acquired copper put options for 30 million pounds over the second and third quarters of 2015 at a strike price of US$2.50 per pound.
Commitments and contingencies
(a) Commitments
At March 31, 2015, capital commitments totaled $1.0 million on a 100% basis, of which the Company’s share was $0.9 million. At March 31, 2015, the Company’s share of operating commitments totaled $10.1 million.
(b) Contingencies
The Company has guaranteed 100% of certain capital lease and equipment loans entered into by the Gibraltar joint venture in which it holds a 75% interest. As at March 31, 2015, this debt totaled $41.0 million on a 100% basis. The Company has also guaranteed its share of additional capital lease and equipment loans totaling $19.8 million on a 75% basis.
The Company is party to various contracts in respect of its operations, of which certain contracts were terminated by the Company during the prior year. The Company accrues its best estimate of the final settlement amount to be paid in respect of terminated contracts, however the actual settlement amount could differ when negotiations are finalized and any changes in cost estimates will be reflected in future periods.
SUMMARY OF QUARTERLY RESULTS
| 2015 | 2014 | 2013 | ||||||||||||||||||||||
| (Cdn$ in thousands, | ||||||||||||||||||||||||
| except per share amounts) | Q1 | Q4 | Q3 | Q2 | Q1 | Q4 | Q3 | Q2 | ||||||||||||||||
| Revenues | 61,835 | 65,179 | 93,714 | 107,307 | 104,996 | 94,916 | 66,799 | 68,191 | ||||||||||||||||
| Net earnings (loss) | (25,206 | ) | (26,427 | ) | (20,937 | ) | 2,628 | (9,148 | ) | (9,756 | ) | 120 | (14,721 | ) | ||||||||||
| Basic EPS | (0.11 | ) | (0.13 | ) | (0.11 | ) | 0.01 | (0.05 | ) | (0.05 | ) | 0.00 | (0.08 | ) | ||||||||||
| Adjusted net earnings (loss) * | (2,434 | ) | (20,983 | ) | (11,221 | ) | (2,172 | ) | (2,710 | ) | 834 | (1,851 | ) | (10,177 | ) | |||||||||
| Adjusted basic EPS * | (0.01 | ) | (0.10 | ) | (0.06 | ) | (0.01 | ) | (0.01 | ) | (0.00 | ) | (0.01 | ) | (0.05 | ) | ||||||||
| EBITDA * | (11,996 | ) | (13,397 | ) | (7,148 | ) | 23,336 | 8,858 | 11,869 | 15,173 | (2,171 | ) | ||||||||||||
| Adjusted EBITDA * | 11,224 | (8,355 | ) | 2,385 | 19,217 | 14,594 | 17,716 | 12,545 | 3,888 | |||||||||||||||
| (US$ per pound, except where indicated) | ||||||||||||||||||||||||
| Realized copper price * | 2.57 | 2.82 | 3.07 | 3.16 | 3.10 | 3.18 | 3.33 | 3.52 | ||||||||||||||||
| Total operating costs * | 2.39 | 2.77 | 2.75 | 2.12 | 2.48 | 2.14 | 2.21 | 2.34 | ||||||||||||||||
| Copper sales (million pounds) | 19.1 | 19.6 | 26.0 | 28.4 | 28.9 | 27.0 | 18.9 | 20.1 | ||||||||||||||||
*Non-GAAP performance measure. See page 19 of this MD&A
15
| TASEKO MINES LIMITED |
| Management’s Discussion and Analysis |
Financial results for the last eight quarters reflect: volatile copper prices that impact realized sale prices; variability in the quarterly sales volumes due to timing of shipments which impacts revenue recognition; and a trend of increasing absolute production costs caused by increasing production volumes.
CRITICAL ACCOUNTING POLICIES AND ESTIMATES
The Company's significant accounting policies are presented in note 2.5 of the 2014 annual financial statements. The preparation of the financial statements in conformity with IFRS requires management to make judgments, estimates and assumptions that affect the application of accounting policies and the reported amounts of assets, liabilities, income and expenses. Actual results may differ from these estimates. Estimates and underlying assumptions are reviewed on an ongoing basis. Revisions to accounting estimates are recognized in the period in which the estimates are revised and in any future periods affected.
In the process of applying the Company’s accounting policies, significant areas where judgment is required include the determination of a joint arrangement and recovery of other receivables.
Other significant areas of estimation include reserve and resource estimation and asset valuations; finished and in-process inventory quantities; plant and equipment lives; tax provisions; provisions for environmental rehabilitation; valuation of financial instruments and derivatives; deferred stripping costs and share-based compensation. Key estimates and assumptions made by management with respect to these areas have been disclosed in the notes to these consolidated financial statements as appropriate.
The accuracy of reserve and resource estimates is a function of the quantity and quality of available data and the assumptions made and judgment used in the engineering and geological interpretation, and may be subject to revision based on various factors. Changes in reserve and resource estimates may impact the carrying value of property, plant and equipment; the calculation of depreciation expense; the capitalization of stripping costs incurred during production; and the timing of cash flows related to the provision for environmental rehabilitation.
Changes in forecast prices of commodities, exchange rates, production costs and recovery rates may change the economic status of reserves and resources. Forecast prices of commodities, exchange rates, production costs and recovery rates, and discount rates assumptions, either individually or collectively, may impact the carrying value of derivative financial instruments, inventories, property, plant and equipment, and intangibles, as well as the measurement of impairment charges or reversals.
CHANGE IN ACCOUNTING POLICIES
IFRS 2, Share-based Payments (effective for annual periods beginning on or after July 1, 2014) clarifies the definition of a vesting condition and separately defines performance and service conditions. Based on the Company’s analysis, this clarification did not have an impact on the consolidated financial statements for the current or prior periods presented.
IFRS 3, Business Combinations (effective for annual periods beginning on or after July 1, 2014) requires that an obligation to pay contingent consideration that meets the definition of a financial instrument is classified as a financial liability or as equity on the basis of the definitions of IAS 32. Additionally, it clarifies that IFRS 3 does not apply to the formation of any joint arrangement and that the scope exemption only applies in the financial statements of the joint arrangement itself. Based on the Company’s analysis, this standard did not have an impact on the consolidated financial statements for the current or prior periods presented.
IAS 24 Related Party Disclosures (effective for annual periods beginning on or after July 1, 2014) requires a reporting entity to include as a related party, an entity that provides key management personnel services to the reporting entity or to the parent of the reporting entity. Based on the Company’s analysis, this standard did not have an impact on the consolidated financial statements for the current or prior periods presented.
16
| TASEKO MINES LIMITED |
| Management’s Discussion and Analysis |
INTERNAL CONTROLS OVER FINANCIAL REPORTING AND DISCLOSURE CONTROLS AND PROCEDURES
The Company's management is responsible for establishing and maintaining adequate internal control over financial reporting and disclosure controls and procedures.
The Company’s internal control system over financial reporting is designed to provide reasonable assurance to management and the Board of Directors regarding the preparation and fair presentation of published financial statements. Internal control over financial reporting includes those policies and procedures that:
| (1) |
pertain to the maintenance of records that in reasonable detail accurately and fairly reflect the transactions and dispositions of the assets of the Company; |
| (2) |
provide reasonable assurance that transactions are recorded as necessary to permit preparation of financial statements in accordance with IFRS, and that receipts and expenditures of the Company are being made only in accordance with authorizations of management and directors of the Company; and |
| (3) |
provide reasonable assurance regarding prevention or timely detection of unauthorized acquisition, use or disposition of the Company’s assets that could have a material effect on the financial statements. |
The Company’s internal control system over disclosure controls and procedures is designed to provide reasonable assurance that material information relating to the Company is made known to management and disclosed to others and information required to be disclosed by the Company in its annual filings, interim filings or other reports filed or submitted by us under securities legislation is recorded, processed, summarized and reported within the time periods specified in the securities legislation.
All internal control systems, no matter how well designed, have inherent limitations. Therefore, even those systems determined effective can provide only reasonable assurance with respect to financial reporting and disclosure.
There have been no changes in our internal controls over financial reporting and disclosure controls and procedures during the period ended March 31, 2015 that have materially affected, or are reasonably likely to materially affect, internal control over financial reporting and disclosure.
RELATED PARTY TRANSACTIONS
Key management personnel
Key management personnel include the members of the Board of Directors and executive officers of the Company.
The Company contributes to a post-employment defined contribution pension plan on the behalf of certain key management personnel. This retirement compensation arrangement (RCA Trust) was established to provide benefits to certain executive officers on or after retirement in recognition of their long service. Upon retirement, the participant is entitled to the distribution of the accumulated value of the contributions under the RCA Trust. Obligations for contributions to the defined contribution pension plan are recognized as compensation expense in profit or loss in the periods during which services are rendered by the executive officers.
17
| TASEKO MINES LIMITED |
| Management’s Discussion and Analysis |
Certain executive officers are entitled to termination and change in control benefits. In the event of termination without cause, other than a change in control, these executive officers are entitled to an amount ranging from 9-month to 12-month’s salary. In the event of a change in control, if a termination without cause or a resignation occurs within 12 months following the change of control, these executive officers are entitled to receive, among other things, an amount ranging from 24-month to 32-months’ salary and accrued bonus, and all stock options held by these individuals will fully vest.
During the first quarter 2015, the Company incurred total compensation expenses of $2.4 million for its key management personnel compared to $3.2 million in the first quarter 2014.
The Company has adopted a Deferred Share Unit (“DSU”) Plan (the “DSU Plan”) for non-employee directors, effective February 15, 2013. The DSU Plan provides for an annual grant to each non-employee director of the Company, or an equivalent cash payment in lieu thereof, which participants have agreed would in first instance be used to assist in complying with the Company’s share ownership guidelines. DSUs vest immediately upon grant and are paid out in cash when a participant ceases to be a director of the Company.
During the three month period ended March 31, 2015, the Company did not issue DSUs to directors (2014: 66,079). The total number of deferred and restricted share units outstanding at March 31, 2015 was 99,371 units (2014: 199,412). Income of $33 has been recognized for the three month period ended March 31, 2015 (2014: $155).
Other related parties
Hunter Dickinson Services Inc. ("HDSI") is a private company which has certain directors in common with the Company. HDSI carries out geological, engineering, corporate development, administrative, financial management, investor relations, and other management activities for the Company. The terms and conditions of the transactions are similar to transactions conducted on an arm’s length basis.
During the first quarter of 2015, the Company incurred total costs of $1.2 million (Q1 2014: $0.8 million) in transactions with HDSI. Of these, $0.4 million (Q1 2014: $0.4 million) related to legal, tax, exploration, and business development services, $0.1 million related to reimbursements of office rent costs (Q1 2014: $0.1 million), and $ 0.7 million (Q1 2014: $0.3 million) related to compensation paid for Taseko directors and the Chief Executive Officer, who are also directors of HDSI.
The Gibraltar joint venture pays a management fee to Taseko for services rendered as operator of the Gibraltar mine. The first quarter of 2015, the Company earned $0.3 million of other operating income for these services rendered, which is comparable to the amounts earned in 2014.
18
| TASEKO MINES LIMITED |
| Management’s Discussion and Analysis |
NON-GAAP PERFORMANCE MEASURES
This document includes certain non-GAAP performance measures that do not have a standardized meaning prescribed by IFRS. These measures may differ from those used by, and may not be comparable to such measures as reported by, other issuers. The Company believes that these measures are commonly used by certain investors, in conjunction with conventional IFRS measures, to enhance their understanding of the Company’s performance. These measures have been derived from the Company’s financial statements and applied on a consistent basis. The following tables below provide a reconciliation of these non-GAAP measures to the most directly comparable IFRS measure.
Total operating costs & Site operating costs, net of by-product credits
Total costs of sales include all costs absorbed into inventory, as well as treatment and refining costs and transportation costs. Site operating costs is calculated by removing net changes in inventory, depletion and amortization and off-property costs from cost of sales. Site operating costs, net of by-product credits is calculated by removing by-product credits from the site operating costs. Site operating costs, net of by-product credits per pound are calculated by dividing the aggregate of the applicable costs by copper pounds produced. Total operating costs per pound is the sum of site operating costs, net of by-product credits and off-property costs divided by the copper pounds produced. By-product credits are calculated based on actual sales of molybdenum and silver during the period divided by the total pounds of copper produced during the period. These measures are calculated on a consistent basis for the periods presented.
| Three months ended | ||||||
| March 31, | ||||||
| (Cdn$ in thousands, unless otherwise indicated) – 75% basis | 2015 | 2014 | ||||
| Cost of sales | 69,814 | 96,209 | ||||
| Less Depletion and amortization | (10,308 | ) | (10,652 | ) | ||
| Net change in inventory | 7,061 | (8,622 | ) | |||
| Less off-property costs: | ||||||
| Treatment and refining costs | (6,770 | ) | (7,702 | ) | ||
| Transportation costs | (3,617 | ) | (6,513 | ) | ||
| Site operating costs | 56,180 | 62,720 | ||||
| Less by-product credits: | ||||||
| Molybdenum | (2,598 | ) | (5,090 | ) | ||
| Silver | (704 | ) | (1,012 | ) | ||
| Site operating costs, net of by-product credits | 52,878 | 56,618 | ||||
| Total copper produced (thousand pounds) | 21,273 | 25,906 | ||||
| Total costs per pound produced | 2.49 | 2.19 | ||||
| Average exchange rate for the period (CAD/USD) | 1.24 | 1.10 | ||||
| Site operating costs, net of by-product credits (US$ per pound) | 2.00 | 1.98 | ||||
| Site operating costs, net of by-product credits | 52,878 | 56,618 | ||||
| Add off-property costs: | ||||||
| Treatment and refining costs | 6,770 | 7,702 | ||||
| Transportation costs | 3,617 | 6,513 | ||||
| Total operating costs | 63,265 | 70,833 | ||||
| Total operating costs (C1) (US$ per pound) | 2.39 | 2.48 | ||||
19
| TASEKO MINES LIMITED |
| Management’s Discussion and Analysis |
Adjusted net earnings
Adjusted net earnings remove the effect of the following transactions from net earnings as reported under IFRS:
- Unrealized gains/losses on derivative instruments;
- Write down of marketable securities;
- Unrealized foreign currency gains/losses; and
- Non-recurring transactions, including non-recurring tax adjustments.
Management believes these transactions do not reflect the underlying operating performance of our core mining business and are not necessarily indicative of future operating results. Furthermore, unrealized gains/losses on derivative instruments, changes in the fair value of financial instruments, and unrealized foreign currency gains/losses are not necessarily reflective of the underlying operating results for the reporting periods presented.
| Three months ended March 31, | ||||||
| ($ in thousands, except per share amounts) | 2015 | 2014 | ||||
| Net earnings (loss) | (25,206 | ) | (9,148 | ) | ||
| Unrealized loss (gain) on derivatives | 1,751 | (2,744 | ) | |||
| Unrealized foreign exchange (gain) loss | 21,469 | 8,480 | ||||
| Estimated tax effect of adjustments | (448 | ) | 702 | |||
| Adjusted net earnings (loss) | (2,434 | ) | (2,710 | ) | ||
| Adjusted EPS | (0.01 | ) | (0.01 | ) | ||
EBITDA and adjusted EBITDA
EBITDA represents net earnings before interest, income taxes, and depreciation. EBITDA is presented because it is an important supplemental measure of our performance and is frequently used by securities analysts, investors and other interested parties in the evaluation of companies in the industry, many of which present EBITDA when reporting their results. Issuers of “high yield” securities also present EBITDA because investors, analysts and rating agencies consider it useful in measuring the ability of those issuers to meet debt service obligations. The Company believes EBITDA is an appropriate supplemental measure of debt service capacity, because cash expenditures on interest are, by definition, available to pay interest, and tax expense is inversely correlated to interest expense because tax expense goes down as deductible interest expense goes up; depreciation is a non-cash charge.
Adjusted EBITDA is presented as a further supplemental measure of the Company’s performance and ability to service debt. Adjusted EBITDA is prepared by adjusting EBITDA to eliminate the impact of a number of items that are not considered indicative of ongoing operating performance.
Adjusted EBITDA is calculated by adding to EBITDA certain items of expense and deducting from EBITDA certain items of income that are not likely to recur or are not indicative of the Company’s future operating performance consisting of:
- Unrealized gains/losses on derivative instruments;
- Write down of marketable securities;
- Unrealized foreign exchange (gain) loss; and
- Non-recurring transactions.
20
| TASEKO MINES LIMITED |
| Management’s Discussion and Analysis |
While some of the adjustments are recurring, gains/losses on the sale of marketable securities do not reflect the underlying performance of the Company’s core mining business and are not necessarily indicative of future results. Furthermore, unrealized gains/losses on derivative instruments, foreign currency translation gains/losses and changes in the fair value of financial instruments are not necessarily reflective of the underlying operating results for the reporting periods presented.
| Three months ended | ||||||
| March 31, | ||||||
| ($ in thousands, except per share amounts) | 2015 | 2014 | ||||
| Net earnings (loss) | (25,206 | ) | (9,148 | ) | ||
| Add: | ||||||
| Depletion and Amortization | 10,334 | 10,735 | ||||
| Amortization of stock-based compensation | 206 | 2,083 | ||||
| Interest expense | 6,362 | 6,647 | ||||
| Interest income | (657 | ) | (1,122 | ) | ||
| Income tax expense (recovery) | (3,035 | ) | (337 | ) | ||
| EBITDA | (11,996 | ) | 8,858 | |||
| Adjustments: | ||||||
| Unrealized (gain)/loss on derivative instruments | 1,751 | (2,744 | ) | |||
| Unrealized foreign exchange (gain) loss | 21,469 | 8,480 | ||||
| Adjusted EBITDA | 11,224 | 14,594 | ||||
21
| TASEKO MINES LIMITED |
| Management’s Discussion and Analysis |
Earnings from mining operations before depletion and amortization
Earnings from mining operations before depletion and amortization is earnings from mining operations with depletion and amortization added back. The Company discloses this measure, which has been derived from our financial statements and applied on a consistent basis, to provide assistance in understanding the results of the Company’s operations and financial position and it is meant to provide further information about the financial results to investors.
| Three months ended March 31, | ||||||
| (Cdn$ in thousands, except per share amounts) | 2015 | 2014 | ||||
| Earnings (loss) from mining operations | (7,979 | ) | 8,787 | |||
| Add: | ||||||
| Depletion and amortization | 10,308 | 10,652 | ||||
| Earnings from mining operations before depletion and amortization | 2,329 | 19,439 | ||||
Site operating costs per ton milled
| Three months ended March 31, | ||||||
| (Cdn$ in thousands, except per share amounts) | 2015 | 2014 | ||||
| Direct mining and processing costs (included in cost of sales) | 56,180 | 62,720 | ||||
| Tons milled (thousands) (75% basis) | 5,813 | 5,266 | ||||
| Site operating costs per ton milled | $ | 9.66 | $ | 11.91 | ||
22