
Form 8-K Axalta Coating Systems For: May 06
UNITED
STATES
SECURITIES
AND EXCHANGE COMMISSION
WASHINGTON,
D.C. 20549
FORM
8-K
CURRENT
REPORT
PURSUANT
TO SECTION 13 OR 15(d) OF THE
SECURITIES
EXCHANGE ACT OF 1934
Date of
Report (Date of earliest event reported)
May
6, 2015
AXALTA
COATING SYSTEMS LTD.
(Exact
name of registrant as specified in its charter)
|
Bermuda |
001-36733 |
98-1073028 |
|
(State or other jurisdiction of incorporation) |
(Commission File Number) |
(IRS Employer Identification No.) |
Two Commerce Square, 2001 Market Street, Suite 3600, Philadelphia,
Pennsylvania 19103
(Address of principal executive
offices) (Zip Code)
(855) 547-1461
Registrant’s
telephone number, including area code
Not Applicable
(Former
name or former address, if changed since last report.)
Check the appropriate box below if the Form 8-K filing is intended to simultaneously satisfy the filing obligation of the registrant under any of the following provisions (see General Instruction A.2. below):
⃞ Written communications pursuant to Rule 425 under the Securities Act (17 CFR 230.425)
⃞ Soliciting material pursuant to Rule 14a-12 under the Exchange Act (17 CFR 240.14a-12)
⃞ Pre-commencement communications pursuant to Rule 14d-2(b) under the Exchange Act (17 CFR 240.14d-2(b))
⃞ Pre-commencement communications pursuant to Rule 13e-4(c) under the Exchange Act (17 CFR 240.13e-4(c))
Item 2.02. Results of Operations and Financial Condition.
On May 6, 2015, Axalta Coating Systems Ltd. (“Axalta”) issued a press release reporting its financial results for the first quarter ended March 31, 2015. Axalta will host a conference call and webcast to discuss its financial results for the first quarter ended March 31, 2015 at 8:00 A.M. on May 6, 2015. Copies of the press release and the earnings call presentation are furnished as Exhibit 99.1 and Exhibit 99.2, respectively, to this Current Report on Form 8-K and are incorporated herein by reference. The information furnished with this Item 2.02, including Exhibits 99.1 and 99.2, shall not be deemed “filed” for purposes of Section 18 of the Securities Exchange Act of 1934, as amended, or otherwise subject to the liabilities of that section, nor shall it be deemed incorporated by reference into any other filing under the Securities Act of 1933, as amended, except as expressly set forth by specific reference in such a filing.
In the press release, the earnings call presentation and the conference call, Axalta presents, and will present, certain non-GAAP financial measures. Axalta management believes that presenting these non-GAAP financial measures provides meaningful information to investors in understanding operating results and may enhance investors’ ability to analyze financial and business trends. In addition, Axalta management believes that these non-GAAP financial measures allow investors to compare period to period more easily by excluding items that could have a disproportionately negative or positive impact on results in any particular period. Non-GAAP measures are not a substitute for GAAP measures and should be considered together with the GAAP financial measures. As calculated, our non-GAAP financial measures may not be comparable to other similarly titled measures of other companies.
Item 9.01. Financial Statements and Exhibits.
(d) Exhibits
|
Exhibit No. |
Description |
|
| 99.1 |
Press Release dated May 6, 2015 |
|
| 99.2 |
First Quarter Ended March 31, 2015 Earnings Call Presentation |
SIGNATURES
Pursuant to the requirements of the Securities Exchange Act of 1934, the registrant has duly caused this report to be signed on its behalf by the undersigned hereunto duly authorized.
|
AXALTA COATING SYSTEMS LTD. |
|||
|
|
|||
| Date: | May 6, 2015 | By: |
/s/ Robert W. Bryant |
|
Robert W. Bryant |
|||
|
Executive Vice President & Chief Financial Officer |
|||
EXHIBIT INDEX
|
Exhibit No. |
Description |
|
| 99.1 |
Press Release dated May 6, 2015 |
|
| 99.2 |
First Quarter Ended March 31, 2015 Earnings Call Presentation |
Exhibit 99.1
Axalta Releases First Quarter 2015 Results
- Net sales of $1.0 billion, an increase of 5.2% excluding negative currency translation versus Q1 2014
- Adjusted EBITDA of $182.0 million with an Adjusted EBITDA margin of 18.4%, an increase of 60 basis points versus 17.8% in Q1 2014
- Jiading, China expansion operational and ramping up with Light Vehicle volumes
- Successful completion by Carlyle of the sale of 66 million shares in two transactions (20 million via private placement to Berkshire Hathaway, Inc.), increasing our free float to approximately 55% of total market capitalization
PHILADELPHIA--(BUSINESS WIRE)--May 6, 2015--Axalta Coating Systems Ltd. (NYSE: AXTA) (“Axalta”), a leading global coatings company, announced its financial results for the first quarter ended March 31, 2015.
“We have started 2015 with a solid quarter that met our net sales and exceeded our Adjusted EBITDA expectations, in spite of significant currency headwinds on a sequential and year-over-year basis. The global automotive refinish markets remain stable and supportive, while growing global new vehicle production has offered us opportunities to expand our business rapidly in emerging economies. We remain focused on transforming Axalta into a growth platform while making solid progress on our existing and new cost and productivity initiatives,” said Charles Shaver, Axalta’s Chairman and Chief Executive Officer. “With a fundamentally stable economic backdrop, we look forward to meeting our financial goals for 2015 with the help of proactive and managed cost reductions and in spite of our expectation for ongoing currency headwinds.”
First Quarter Consolidated Financial Results
Net sales were $1.0 billion for the first quarter of 2015, an increase of 5.2% excluding negative foreign currency translation, or a decrease of 5.6% on an as-reported basis. Drivers of net sales growth included 4.8% volume increases, reflecting strong growth in all regions except EMEA, which saw a modest decline in the period largely from lower sales in Russia and Eastern Europe. Higher average selling prices contributed to a modest 0.4% net sales growth, while unfavorable currency translation reduced net sales by 10.8% primarily due to weakness of the Euro and certain currencies in Latin America compared to the U.S. dollar.
Adjusted EBITDA of $182 million for the first quarter of 2015 decreased 2.5% compared to the first quarter of 2014. The decline resulted from negative foreign currency translation and certain operating investments made to support future volumes across multiple regions, including the Jiading, China plant ramp-up. These factors were partially offset by strong volume and price effects. Adjusted EBITDA margin expanded 60 basis points to 18.4% from the year ago period, benefiting from cost reductions achieved over the last year and modest operating leverage.
Performance Coatings Results
The Performance Coatings segment generated net sales of $557.2 million during the first quarter of 2015, an increase of 2.5% excluding foreign currency impacts, and a decrease of 9.6% on an as-reported basis, compared to the first quarter of 2014. Increased volumes contributed 1.9% while higher average selling prices added 0.6% to net sales growth. These factors were more than offset by a 12.1% unfavorable currency translation impact. Net sales from our refinish end-market grew 2.7% on a constant currency basis compared to the first quarter of 2014, while our industrial end-market reported 1.9% growth excluding the impact of currency.
The Performance Coatings segment generated Adjusted EBITDA of $107.1 million, a decrease of 14.0% compared to the first quarter of 2014. This result reflected negative foreign currency translation on positive volumes and pricing growth contributions, offset by higher operating expenses from investments in growth initiatives. Performance Coatings segment Adjusted EBITDA margin of 19.2% reflected a 100 basis point decrease compared to the first quarter of 2014.
Transportation Coatings Results
The Transportation Coatings segment generated net sales of $432.0 million in the first quarter of 2015, an increase of 9.1% excluding foreign currency impacts, and essentially flat at 0.2% growth on an as-reported basis, compared to the first quarter of 2014. Volume and slightly higher average selling prices contributed 9.1% to net sales growth, while unfavorable currency translation reduced net sales by 8.9% compared to the prior year. Net sales from our light vehicle end-market grew by 7.4% on a constant currency basis compared to the first quarter of 2014. Our commercial vehicle end-market saw substantial net sales growth of 15.4% on a constant currency basis versus last year. Strong growth in light vehicle net sales in Asia Pacific and North America was offset in part by flatter performance in other regions. Strong heavy-duty truck volumes continue to drive solid double digit growth from all regions except EMEA, where a recovery has been slower to take shape to date.
The Transportation Coatings segment generated Adjusted EBITDA of $74.9 million, an increase of 20.4% compared to the first quarter of 2014. Adjusted EBITDA growth was driven by solid volume and price effects as well as productivity benefits from our operational improvement initiatives, partially offset by the negative impact of foreign currency translation. The Transportation Coatings segment generated an Adjusted EBITDA margin of 17.3%, an increase of 290 basis points compared to the first quarter of 2014.
Balance Sheet and Cash Flow Highlights
We ended the quarter with cash and cash equivalents of $222.9 million. Our net debt was $3,402.6 million as of March 31, 2015, which resulted in a first quarter Net Debt to Adjusted EBITDA ratio of 4.1x.
First quarter operating cash flow was a use of $98.7 million versus a use of $67.2 million in the year-ago quarter, reflecting normal seasonal working capital swings coupled with payments relating to transition-related activities incurred in 2014. We continue to expect solid operating cash flow for the full year 2015.
“Our financial flexibility remains excellent as of the end of the first quarter 2015,” said Robert Bryant, Axalta’s Executive Vice President and Chief Financial Officer. “We expect to generate solid free cash flow in 2015, while continuing to invest in high return productivity and expansion projects.”
2015 Outlook
We are reiterating our outlook for the full year 2015, including:
- Net sales growth of 5-7% in constant currency and flat to slightly down including the impact of currency;
- Adjusted EBITDA of $860-$900 million with an Adjusted EBITDA margin of approximately 20%; and
- Normalized effective tax rate of 27-29%, capital expenditures of approximately $150 million, and net working capital of 13-15% of net sales.
Conference Call Information
As previously announced, Axalta will hold a conference call to discuss its first quarter 2015 financial results on Wednesday May 6th, at 8:00 a.m. EDT. The U.S. dial-in phone number for the conference call is (877) 407-0784 and the international dial-in number is +1 (201) 689-8560. A live webcast of the conference call will also be available online at http://ir.axaltacs.com. For those unable to participate in the conference call, a replay will be available through May 20, 2015. The U.S. replay dial-in phone number is (877) 870-5176 and the international replay dial-in number is +1 (858) 384-5517. The replay passcode is 13607627.
Cautionary Statement Concerning Forward-Looking Statements
This release may contain certain forward-looking statements regarding Axalta and its subsidiaries including those relating to 2015 demand trends, net sales growth, Adjusted EBITDA, effective tax rate, free cash flow, capital expenditures and net working capital. All of these statements are based on management’s expectations as well as estimates and assumptions prepared by management that, although they believe to be reasonable, are inherently uncertain. These statements involve risks and uncertainties, including, but not limited to, economic, competitive, governmental and technological factors outside of Axalta’s control that may cause its business, industry, strategy, financing activities or actual results to differ materially. Axalta undertakes no obligation to update or revise any of the forward-looking statements contained herein, whether as a result of new information, future events or otherwise.
Non-GAAP Financial Measures
The historical financial information included in this presentation includes financial information that is not presented in accordance with generally accepted accounting principles in the United States (“GAAP”), including EBITDA, Adjusted EBITDA and Net Debt. Management uses these non-GAAP financial measures in the analysis of our financial and operating performance because they assist in the evaluation of underlying trends in our business. Our use of the terms EBITDA, Adjusted EBITDA and Net Debt may differ from that of others in our industry. EBITDA, Adjusted EBITDA and Net Debt should not be considered as alternatives to net income (loss), income (loss) before operations or any other performance measures derived in accordance with GAAP as measures of operating performance or operating cash flows or as measures of liquidity. EBITDA, Adjusted EBITDA and Net Debt have important limitations as analytical tools and should be considered in conjunction with, and not as substitutes for, our results as reported under GAAP. This presentation includes a reconciliation of certain non-GAAP financial measures with the most directly comparable financial measures calculated in accordance with GAAP.
About Axalta Coating Systems
Axalta is a leading global company focused solely on coatings and providing customers with innovative, colorful, beautiful and sustainable solutions. From light OEM vehicles, commercial vehicles and refinish applications to electric motors, buildings and pipelines, our coatings are designed to prevent corrosion, increase productivity and enable the materials we coat to last longer. With more than 150 years of experience in the coatings industry, the 12,600 people of Axalta continue to find ways to serve our more than 120,000 customers in 130 countries better every day with the finest coatings, application systems and technology. For more information visit axaltacoatingsystems.com and follow us @axalta on Twitter.
| Financial Statement Tables | |||||||
| AXALTA COATING SYSTEMS LTD. | |||||||
|
Condensed Consolidated Statements of Operations (Unaudited) |
|||||||
|
(In millions, except per share data) |
|||||||
| Three Months Ended March 31, | |||||||
| 2015 | 2014 | ||||||
| Net sales | $ | 989.2 | $ | 1,047.4 | |||
| Other revenue | 8.3 | 7.0 | |||||
| Total revenue | 997.5 | 1,054.4 | |||||
| Cost of goods sold | 649.8 | 703.5 | |||||
| Selling, general and administrative expenses | 213.0 | 246.7 | |||||
| Research and development expenses | 12.9 | 11.3 | |||||
| Amortization of acquired intangibles | 20.0 | 21.1 | |||||
| Income from operations | 101.8 | 71.8 | |||||
| Interest expense, net | 50.0 | 59.0 | |||||
| Other expense, net | 3.9 | 4.5 | |||||
| Income before income taxes | 47.9 | 8.3 | |||||
| Provision for income taxes | 1.2 | 12.0 | |||||
| Net income (loss) | 46.7 | (3.7 | ) | ||||
| Less: Net income attributable to noncontrolling interests | 1.6 | 0.6 | |||||
| Net income (loss) attributable to controlling interests | $ | 45.1 | $ | (4.3 | ) | ||
| Basic net income (loss) per share | $ | 0.20 | $ | (0.02 | ) | ||
| Diluted net income (loss) per share | $ | 0.19 | $ | (0.02 | ) | ||
| Basic weighted average shares outstanding | 229.8 | 229.1 | |||||
| Diluted weighted average shares outstanding | 237.0 | 229.1 | |||||
| AXALTA COATING SYSTEMS LTD. | ||||||||
|
Condensed Consolidated Balance Sheets (Unaudited) |
||||||||
|
(In millions, except per share data) |
||||||||
| March 31, 2015 | December 31, 2014 | |||||||
| Assets | ||||||||
| Current assets: | ||||||||
| Cash and cash equivalents | $ | 222.9 | $ | 382.1 | ||||
| Restricted cash | 2.8 | 4.7 | ||||||
| Accounts and notes receivable, net | 833.0 | 820.4 | ||||||
| Inventories | 541.3 | 538.3 | ||||||
| Prepaid expenses and other | 82.6 | 62.9 | ||||||
| Deferred income taxes | 68.2 | 64.5 | ||||||
| Total current assets | 1,750.8 | 1,872.9 | ||||||
| Property, plant and equipment, net | 1,411.7 | 1,514.1 | ||||||
| Goodwill | 916.8 | 1,001.1 | ||||||
| Identifiable intangibles, net | 1,246.8 | 1,300.0 | ||||||
| Deferred financing costs, net | 86.8 | 91.0 | ||||||
| Other assets | 485.5 | 473.7 | ||||||
| Total assets | $ | 5,898.4 | $ | 6,252.8 | ||||
| Liabilities, Shareholders’ Equity | ||||||||
| Current liabilities: | ||||||||
| Accounts payable | $ | 458.3 | $ | 494.5 | ||||
| Current portion of borrowings | 41.6 | 40.1 | ||||||
| Deferred income taxes | 6.4 | 7.3 | ||||||
| Other accrued liabilities | 291.7 | 404.8 | ||||||
| Total current liabilities | 798.0 | 946.7 | ||||||
| Long-term borrowings | 3,566.7 | 3,656.3 | ||||||
| Accrued pensions and other long-term employee benefits | 272.6 | 306.4 | ||||||
| Deferred income taxes | 190.6 | 208.2 | ||||||
| Other liabilities | 22.3 | 23.2 | ||||||
| Total liabilities | 4,850.2 | 5,140.8 | ||||||
| Shareholders’ equity | ||||||||
| Common shares, $1.00 par, 1,000.0 shares authorized, 229.8 shares issued and outstanding at March 31, 2015 and December 31, 2014, respectively | 229.8 | 229.8 | ||||||
| Capital in excess of par | 1,145.9 | 1,144.7 | ||||||
| Accumulated deficit | (181.4 | ) | (226.5 | ) | ||||
| Accumulated other comprehensive loss | (215.4 | ) | (103.3 | ) | ||||
| Total Axalta shareholders’ equity | 978.9 | 1,044.7 | ||||||
| Noncontrolling interests | 69.3 | 67.3 | ||||||
| Total shareholders’ equity | 1,048.2 | 1,112.0 | ||||||
| Total liabilities and shareholders’ equity | $ | 5,898.4 | $ | 6,252.8 | ||||
| AXALTA COATING SYSTEMS LTD. | ||||||||
|
Condensed Consolidated Statements of Cash Flows (Unaudited) |
||||||||
|
(In millions) |
||||||||
| Three Months Ended March 31, | ||||||||
| 2015 | 2014 | |||||||
| Operating activities: | ||||||||
| Net income (loss) | $ | 46.7 | $ | (3.7 | ) | |||
| Adjustment to reconcile net income (loss) to cash provided by operating activities: | ||||||||
| Depreciation and amortization | 72.6 | 81.1 | ||||||
| Amortization of financing costs and original issue discount | 5.0 | 5.2 | ||||||
| Debt modification costs | — | 3.1 | ||||||
| Deferred income taxes | (17.2 | ) | (15.1 | ) | ||||
| Unrealized loss on derivatives | 1.2 | 3.1 | ||||||
| Realized and unrealized foreign exchange losses, net | 4.8 | 3.4 | ||||||
| Stock-based compensation | 1.8 | 1.8 | ||||||
| Other non-cash, net | (1.1 | ) | (4.9 | ) | ||||
| Decrease (increase) in operating assets and liabilities: | ||||||||
| Trade accounts and notes receivable | (53.5 | ) | (65.3 | ) | ||||
| Inventories | (25.9 | ) | (28.3 | ) | ||||
| Prepaid expenses and other assets | (36.3 | ) | 1.9 | |||||
| Accounts payable | (1.0 | ) | 29.3 | |||||
| Other accrued liabilities | (91.1 | ) | (76.9 | ) | ||||
| Other liabilities | (4.7 | ) | (1.9 | ) | ||||
| Cash used for operating activities | (98.7 | ) | (67.2 | ) | ||||
| Investing activities: | ||||||||
| Acquisition of controlling interest in investment affiliate (net of cash acquired) | (3.2 | ) | — | |||||
| Purchase of property, plant and equipment | (31.5 | ) | (50.2 | ) | ||||
| Restricted cash | 1.8 | (2.0 | ) | |||||
| Purchase of intangibles | — | (0.2 | ) | |||||
| Proceeds from sale of intangible assets | 0.4 | — | ||||||
| Proceeds from sale of affiliate | 2.3 | — | ||||||
| Cash used for investing activities | (30.2 | ) | (52.4 | ) | ||||
| Financing activities: | ||||||||
| Proceeds from short-term borrowings | 1.5 | 16.7 | ||||||
| Payments on short-term borrowings | (10.7 | ) | (9.6 | ) | ||||
| Payments on long-term debt | (6.8 | ) | — | |||||
| Dividends paid to noncontrolling interests | (3.5 | ) | (0.9 | ) | ||||
| Debt modification fees | — | (3.0 | ) | |||||
| Other financing activities | (0.2 | ) | — | |||||
| Cash provided by (used for) financing activities | (19.7 | ) | 3.2 | |||||
| Decrease in cash and cash equivalents | (148.6 | ) | (116.4 | ) | ||||
| Effect of exchange rate changes on cash | (10.6 | ) | (3.3 | ) | ||||
| Cash and cash equivalents at beginning of period | 382.1 | 459.3 | ||||||
| Cash and cash equivalents at end of period | $ | 222.9 | $ | 339.6 | ||||
NON-GAAP FINANCIAL MEASURES
Reconciliation of Net Income (Loss) to EBITDA and Adjusted EBITDA
To supplement our financial information presented in accordance with U.S. GAAP, we use the following non-GAAP financial measures to clarify and enhance an understanding of past performance: EBITDA and Adjusted EBITDA. We believe that the presentation of these financial measures enhances an investor’s understanding of our financial performance. We further believe that these financial measures are useful financial metrics to assess our operating performance from period-to-period by excluding certain items that we believe are not representative of our core business. We use certain of these financial measures for business planning purposes and in measuring our performance relative to that of our competitors. We utilize Adjusted EBITDA as the primary measure of segment performance.
EBITDA consists of net income (loss) before interest, taxes, depreciation and amortization. Adjusted EBITDA consists of EBITDA adjusted for (i) non-operating income or expense, (ii) the impact of certain non-cash, nonrecurring or other items that are included in net income and EBITDA that we do not consider indicative of our ongoing operating performance and (iii) certain unusual or nonrecurring items impacting results in a particular period. We believe that making such adjustments provides investors meaningful information to understand our operating results and ability to analyze financial and business trends on a period-to-period basis.
We believe these financial measures are commonly used by investors to evaluate our performance and that of our competitors. However, our use of the terms EBITDA and Adjusted EBITDA may vary from that of others in our industry. These financial measures should not be considered as alternatives to income before income taxes, net income (loss), earnings (loss) per share or any other performance measures derived in accordance with U.S. GAAP as measures of operating performance.
EBITDA and Adjusted EBITDA have important limitations as analytical tools and you should not consider them in isolation or as substitutes for analysis of our results as reported under U.S. GAAP. Some of these limitations are:
-
EBITDA and Adjusted EBITDA:
- do not reflect the significant interest expense on our debt, including the Senior Secured Credit Facilities and the Senior Notes;
- eliminate the impact of income taxes on our results of operations; and
- contain certain estimates for periods prior to the Acquisition of standalone costs;
- although depreciation and amortization are non-cash charges, the assets being depreciated and amortized will often have to be replaced in the future, and EBITDA and Adjusted EBITDA do not reflect any expenditures for such replacements; and
- other companies in our industry may calculate EBITDA and Adjusted EBITDA differently than we do, limiting their usefulness as comparative measures.
We compensate for these limitations by using EBITDA and Adjusted EBITDA along with other comparative tools, together with U.S. GAAP measurements, to assist in the evaluation of operating performance. Such U.S. GAAP measurements include income before income taxes, net income (loss), earnings (loss) per share and other performance measures.
In evaluating these financial measures, you should be aware that in the future we may incur expenses similar to those eliminated in this presentation. Our presentation of EBITDA and Adjusted EBITDA should not be construed as an inference that our future results will be unaffected by unusual or nonrecurring items.
The following table reconciles the net income (loss) to EBITDA and Adjusted EBITDA calculations discussed above to net income (loss) for the periods presented:
| (Unaudited) | Three Months Ended March 31, | |||||||
| (In millions) | 2015 | 2014 | ||||||
| Net income (loss) | $ | 46.7 | $ | (3.7 | ) | |||
| Interest expense, net | 50.0 | 59.0 | ||||||
| Provision for income taxes | 1.2 | 12.0 | ||||||
| Depreciation and amortization | 72.6 | 81.1 | ||||||
| EBITDA | 170.5 | 148.4 | ||||||
| Financing costs (a) | — | 3.1 | ||||||
| Foreign exchange remeasurement losses (b) | 8.7 | 0.1 | ||||||
| Long-term employee benefit plan adjustments (c) | 0.2 | 2.3 | ||||||
| Termination benefits and other employee related costs (d) | 3.7 | 3.2 | ||||||
| Consulting and advisory fees (e) | 3.1 | 13.0 | ||||||
| Transition-related costs (f) | — | 13.9 | ||||||
| Secondary offering costs (g) | 1.4 | — | ||||||
| Other adjustments (h) | (2.1 | ) | 2.8 | |||||
| Dividends in respect of noncontrolling interest (i) | (3.5 | ) | (0.9 | ) | ||||
| Management fee expense (j) | — | 0.8 | ||||||
| Adjusted EBITDA | $ | 182.0 | $ | 186.7 | ||||
| (a) | In connection with an amendment to the Senior Secured Credit Facilities in February 2014, we recognized $3.1 million of costs during the three months ended March 31, 2014. | |
| (b) | Eliminates foreign exchange gains and losses resulting from the remeasurement of assets and liabilities denominated in foreign currencies. | |
| (c) | Eliminates the non-service cost components of long-term employee benefit costs. | |
| (d) | Represents expenses primarily related to employee termination benefits, including our initiative to improve the overall cost structure within the European region, and other employee-related costs. Termination benefits include the costs associated with our headcount initiatives associated with cost saving opportunities that were related to our transition to a standalone entity and our Axalta Way cost savings initiatives in 2015. | |
| (e) | Represents fees paid to consultants, advisors, and other third-party professional organizations for professional services rendered in conjunction with the transition from DuPont to a standalone entity during 2014. Amounts incurred for the three months ended March 31, 2015 primarily relate to our Axalta Way cost savings initiatives. | |
| (f) | Represents charges associated with the transition from DuPont to a standalone entity, including branding and marketing, information technology related costs, and facility transition costs. | |
| (g) | Represents costs associated with the Secondary Offering of our common shares by Carlyle that closed in April 2015. | |
| (h) | Represents costs for certain unusual or non-operational (gains) and losses, including a $5.4 million gain recognized in 2015 resulting from the remeasurement of our previously held interest in an equity method investee upon the acquisition of a controlling interest, stock-based compensation, equity investee dividends, indemnity losses associated with the DPC acquisition, and loss (gain) on sale and disposal of property, plant and equipment. | |
| (i) | Represents the payment of dividends to our joint venture partners by our consolidated entities that are not wholly owned. | |
| (j) | Pursuant to Axalta’s management agreement with Carlyle Investment, for management and financial advisory services and oversight provided to Axalta and its subsidiaries, Axalta was required to pay an annual management fee of $3.0 million and out-of-pocket expenses. This agreement terminated upon completion of the IPO in November 2014. | |
CONTACT:
Axalta Coating Systems
Christopher Mecray, +1 215-255-7970
[email protected]
Exhibit 99.2
 Axalta Coating Systems Ltd.
Q1 2015 Conference Call May 6, 2015
Axalta Coating Systems Ltd.
Q1 2015 Conference Call May 6, 2015
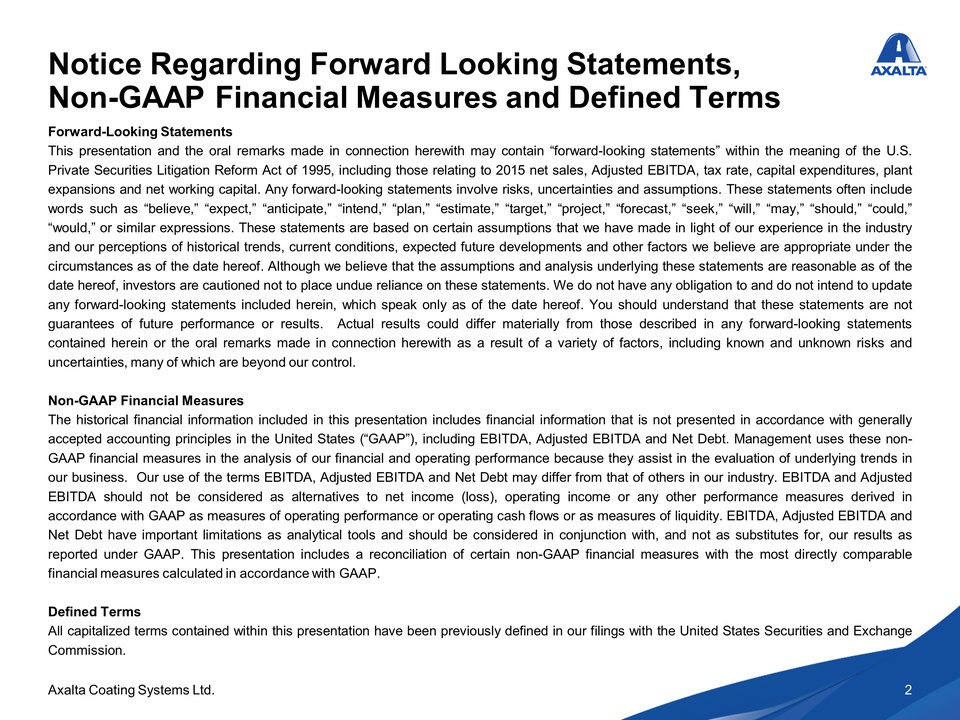 Notice Regarding Forward
Looking Statements, Non-GAAP Financial Measures and Defined Terms
Forward-Looking Statements This presentation and the oral remarks made
in connection herewith may contain “forward-looking statements” within
the meaning of the U.S. Private Securities Litigation Reform Act of
1995, including those relating to 2015 net sales, Adjusted EBITDA, tax
rate, capital expenditures, plant expansions and net working capital.
Any forward-looking statements involve risks, uncertainties and
assumptions. These statements often include words such as “believe,”
“expect,” “anticipate,” “intend,” “plan,” “estimate,” “target,”
“project,” “forecast,” “seek,” “will,” “may,” “should,” “could,”
“would,” or similar expressions. These statements are based on certain
assumptions that we have made in light of our experience in the industry
and our perceptions of historical trends, current conditions, expected
future developments and other factors we believe are appropriate under
the circumstances as of the date hereof. Although we believe that the
assumptions and analysis underlying these statements are reasonable as
of the date hereof, investors are cautioned not to place undue reliance
on these statements. We do not have any obligation to and do not intend
to update any forward-looking statements included herein, which speak
only as of the date hereof. You should understand that these statements
are not guarantees of future performance or results. Actual results
could differ materially from those described in any forward-looking
statements contained herein or the oral remarks made in connection
herewith as a result of a variety of factors, including known and
unknown risks and uncertainties, many of which are beyond our control.
Non-GAAP Financial Measures The historical financial information
included in this presentation includes financial information that is not
presented in accordance with generally accepted accounting principles in
the United States (“GAAP”), including EBITDA, Adjusted EBITDA and Net
Debt. Management uses these non-GAAP financial measures in the analysis
of our financial and operating performance because they assist in the
evaluation of underlying trends in our business. Our use of the terms
EBITDA, Adjusted EBITDA and Net Debt may differ from that of others in
our industry. EBITDA and Adjusted EBITDA should not be considered as
alternatives to net income (loss), operating income or any other
performance measures derived in accordance with GAAP as measures of
operating performance or operating cash flows or as measures of
liquidity. EBITDA, Adjusted EBITDA and Net Debt have important
limitations as analytical tools and should be considered in conjunction
with, and not as substitutes for, our results as reported under GAAP.
This presentation includes a reconciliation of certain non-GAAP
financial measures with the most directly comparable financial measures
calculated in accordance with GAAP. Defined Terms All capitalized terms
contained within this presentation have been previously defined in our
filings with the United States Securities and Exchange Commission.
Axalta Coating Systems Ltd. 2
Notice Regarding Forward
Looking Statements, Non-GAAP Financial Measures and Defined Terms
Forward-Looking Statements This presentation and the oral remarks made
in connection herewith may contain “forward-looking statements” within
the meaning of the U.S. Private Securities Litigation Reform Act of
1995, including those relating to 2015 net sales, Adjusted EBITDA, tax
rate, capital expenditures, plant expansions and net working capital.
Any forward-looking statements involve risks, uncertainties and
assumptions. These statements often include words such as “believe,”
“expect,” “anticipate,” “intend,” “plan,” “estimate,” “target,”
“project,” “forecast,” “seek,” “will,” “may,” “should,” “could,”
“would,” or similar expressions. These statements are based on certain
assumptions that we have made in light of our experience in the industry
and our perceptions of historical trends, current conditions, expected
future developments and other factors we believe are appropriate under
the circumstances as of the date hereof. Although we believe that the
assumptions and analysis underlying these statements are reasonable as
of the date hereof, investors are cautioned not to place undue reliance
on these statements. We do not have any obligation to and do not intend
to update any forward-looking statements included herein, which speak
only as of the date hereof. You should understand that these statements
are not guarantees of future performance or results. Actual results
could differ materially from those described in any forward-looking
statements contained herein or the oral remarks made in connection
herewith as a result of a variety of factors, including known and
unknown risks and uncertainties, many of which are beyond our control.
Non-GAAP Financial Measures The historical financial information
included in this presentation includes financial information that is not
presented in accordance with generally accepted accounting principles in
the United States (“GAAP”), including EBITDA, Adjusted EBITDA and Net
Debt. Management uses these non-GAAP financial measures in the analysis
of our financial and operating performance because they assist in the
evaluation of underlying trends in our business. Our use of the terms
EBITDA, Adjusted EBITDA and Net Debt may differ from that of others in
our industry. EBITDA and Adjusted EBITDA should not be considered as
alternatives to net income (loss), operating income or any other
performance measures derived in accordance with GAAP as measures of
operating performance or operating cash flows or as measures of
liquidity. EBITDA, Adjusted EBITDA and Net Debt have important
limitations as analytical tools and should be considered in conjunction
with, and not as substitutes for, our results as reported under GAAP.
This presentation includes a reconciliation of certain non-GAAP
financial measures with the most directly comparable financial measures
calculated in accordance with GAAP. Defined Terms All capitalized terms
contained within this presentation have been previously defined in our
filings with the United States Securities and Exchange Commission.
Axalta Coating Systems Ltd. 2
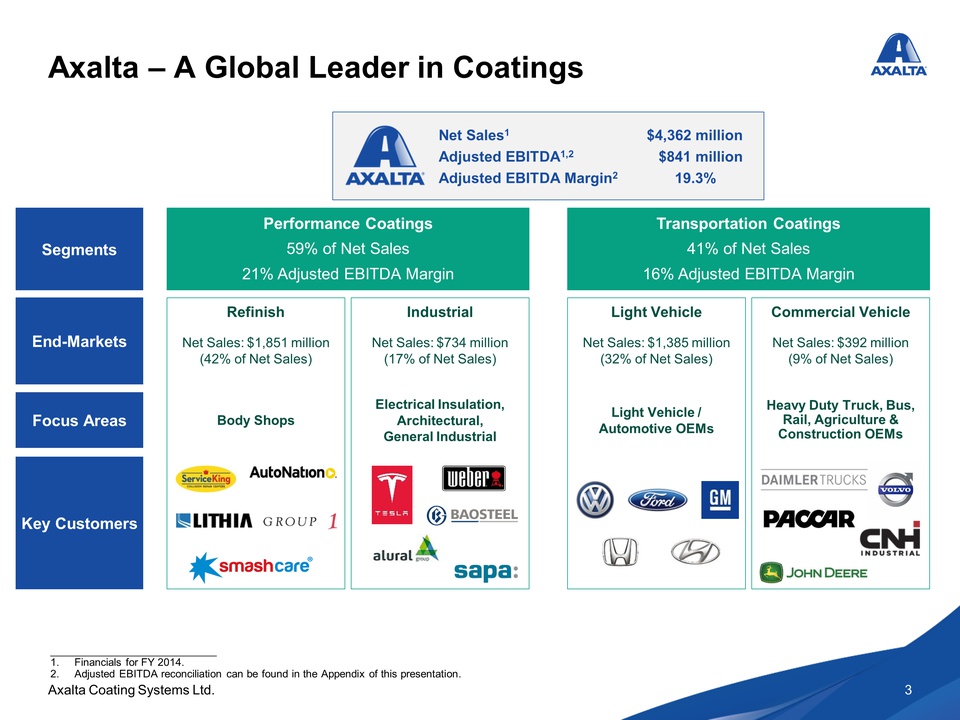 Axalta – A Global Leader in
Coatings Net Sales 1 $4,362 million Adjusted EBITDA 1,2 $841 million
Adjusted EBITDA Margin 2 19.3% Segments Performance Coatings 59% of Net
Sales 21% Adjusted EBITDA Margin Transportation Coatings 41% of Net
Sales 16% Adjusted EBITDA Margin End-Markets Focus Areas Key Customers
Body Shops Electrical Insulation, Architectural, General Industrial
Light Vehicle / Automotive OEMs Heavy Duty Truck, Bus, Rail, Agriculture
& Construction OEMs Net Sales: $1,851 million (42% of Net Sales) Net
Sales: $734 million (17% of Net Sales) Net Sales: $1,385 million (32% of
Net Sales) Net Sales: $392 million (9% of Net Sales) Refinish Industrial
Light Vehicle Commercial Vehicle 1. Financials for FY 2014. 2. Adjusted
EBITDA reconciliation can be found in the Appendix of this presentation.
Axalta Coating Systems Ltd. 3
Axalta – A Global Leader in
Coatings Net Sales 1 $4,362 million Adjusted EBITDA 1,2 $841 million
Adjusted EBITDA Margin 2 19.3% Segments Performance Coatings 59% of Net
Sales 21% Adjusted EBITDA Margin Transportation Coatings 41% of Net
Sales 16% Adjusted EBITDA Margin End-Markets Focus Areas Key Customers
Body Shops Electrical Insulation, Architectural, General Industrial
Light Vehicle / Automotive OEMs Heavy Duty Truck, Bus, Rail, Agriculture
& Construction OEMs Net Sales: $1,851 million (42% of Net Sales) Net
Sales: $734 million (17% of Net Sales) Net Sales: $1,385 million (32% of
Net Sales) Net Sales: $392 million (9% of Net Sales) Refinish Industrial
Light Vehicle Commercial Vehicle 1. Financials for FY 2014. 2. Adjusted
EBITDA reconciliation can be found in the Appendix of this presentation.
Axalta Coating Systems Ltd. 3
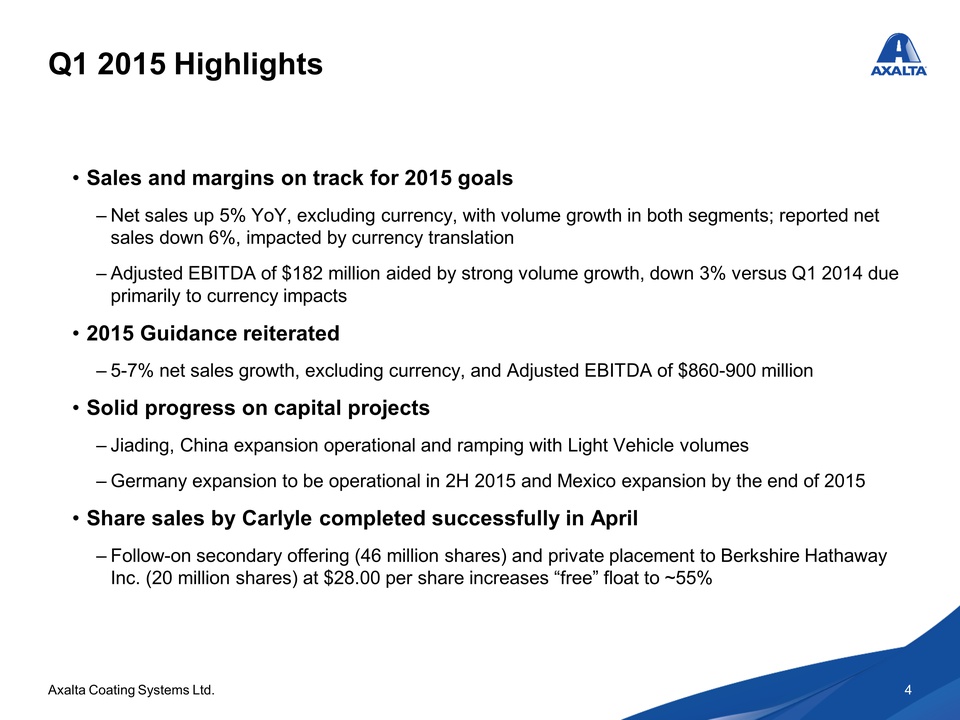 Q1 2015 Highlights Sales
and margins on track for 2015 goals – Net sales up 5% YoY, excluding
currency, with volume growth in both segments; reported net sales down
6%, impacted by currency translation – Adjusted EBITDA of $182 million
aided by strong volume growth, down 3% versus Q1 2014 due primarily to
currency impacts 2015 Guidance reiterated – 5-7% net sales growth,
excluding currency, and Adjusted EBITDA of $860-900 million Solid
progress on capital projects – Jiading, China expansion operational and
ramping with Light Vehicle volumes – Germany expansion to be operational
in 2H 2015 and Mexico expansion by the end of 2015 Share sales by
Carlyle completed successfully in April – Follow-on secondary offering
(46 million shares) and private placement to Berkshire Hathaway Inc. (20
million shares) at $28.00 per share increases “free” float to ~55%
Axalta Coating Systems Ltd. 4
Q1 2015 Highlights Sales
and margins on track for 2015 goals – Net sales up 5% YoY, excluding
currency, with volume growth in both segments; reported net sales down
6%, impacted by currency translation – Adjusted EBITDA of $182 million
aided by strong volume growth, down 3% versus Q1 2014 due primarily to
currency impacts 2015 Guidance reiterated – 5-7% net sales growth,
excluding currency, and Adjusted EBITDA of $860-900 million Solid
progress on capital projects – Jiading, China expansion operational and
ramping with Light Vehicle volumes – Germany expansion to be operational
in 2H 2015 and Mexico expansion by the end of 2015 Share sales by
Carlyle completed successfully in April – Follow-on secondary offering
(46 million shares) and private placement to Berkshire Hathaway Inc. (20
million shares) at $28.00 per share increases “free” float to ~55%
Axalta Coating Systems Ltd. 4
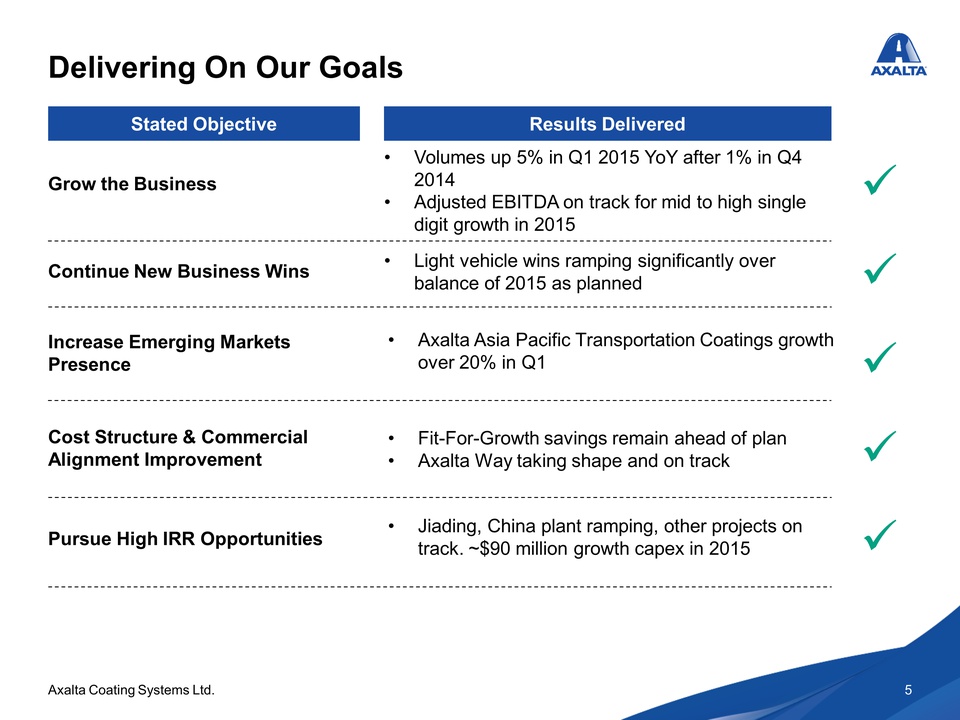 Delivering On Our Goals
Stated Objective Results Delivered Grow the Business Continue New
Business Wins Increase Emerging Markets Presence Cost Structure &
Commercial Alignment Improvement Pursue High IRR Opportunities Volumes
up 5% in Q1 2015 YoY after 1% in Q4 2014 Adjusted EBITDA on track for
mid to high single digit growth in 2015 Light vehicle wins ramping
significantly over balance of 2015 as planned Axalta Asia Pacific
Transportation Coatings growth over 20% in Q1 Fit-For-Growth savings
remain ahead of plan Axalta Way taking shape and on track Axalta Coating
Systems Ltd . 5 Jiading, China plant ramping, other projects on track.
~$90 million growth capex in 2015 Axalta Coating Systems Ltd. 5
Delivering On Our Goals
Stated Objective Results Delivered Grow the Business Continue New
Business Wins Increase Emerging Markets Presence Cost Structure &
Commercial Alignment Improvement Pursue High IRR Opportunities Volumes
up 5% in Q1 2015 YoY after 1% in Q4 2014 Adjusted EBITDA on track for
mid to high single digit growth in 2015 Light vehicle wins ramping
significantly over balance of 2015 as planned Axalta Asia Pacific
Transportation Coatings growth over 20% in Q1 Fit-For-Growth savings
remain ahead of plan Axalta Way taking shape and on track Axalta Coating
Systems Ltd . 5 Jiading, China plant ramping, other projects on track.
~$90 million growth capex in 2015 Axalta Coating Systems Ltd. 5
 Q1 2015 Consolidated
Results Financial Performance Q1 % Change ($ in millions) 2015 2014
Incl. F/X Excl. F/X Performance 557 616 (9.6%) 2.5% Transportation 432
431 0.2% 9.1% Net Sales 989 1,047 (5.6%) 5.2% Adjusted EBITDA 182 187
(2.5%) % margin 18.4% 17.8% Commentary Net sales increased 5.2%
excluding currency Volume growth led by North America and Asia-Pacific
Moderate price increases in select regions 10.8% unfavorable currency
impact Adjusted EBITDA margin up 60 bps Improvement driven by volume
growth and cost reduction initiatives Dividend to Industrial JV partner
and unabsorbed overhead associated with Jiading startup negatively
impacted Q1 by $4 million Net Sales Variance $1,047 +4.8% +0.4% (10.8%)
(5.6%) $989 Q1 2014 Volume Price FX Q1 2015 Axalta Coating Systems Ltd. 6
Q1 2015 Consolidated
Results Financial Performance Q1 % Change ($ in millions) 2015 2014
Incl. F/X Excl. F/X Performance 557 616 (9.6%) 2.5% Transportation 432
431 0.2% 9.1% Net Sales 989 1,047 (5.6%) 5.2% Adjusted EBITDA 182 187
(2.5%) % margin 18.4% 17.8% Commentary Net sales increased 5.2%
excluding currency Volume growth led by North America and Asia-Pacific
Moderate price increases in select regions 10.8% unfavorable currency
impact Adjusted EBITDA margin up 60 bps Improvement driven by volume
growth and cost reduction initiatives Dividend to Industrial JV partner
and unabsorbed overhead associated with Jiading startup negatively
impacted Q1 by $4 million Net Sales Variance $1,047 +4.8% +0.4% (10.8%)
(5.6%) $989 Q1 2014 Volume Price FX Q1 2015 Axalta Coating Systems Ltd. 6
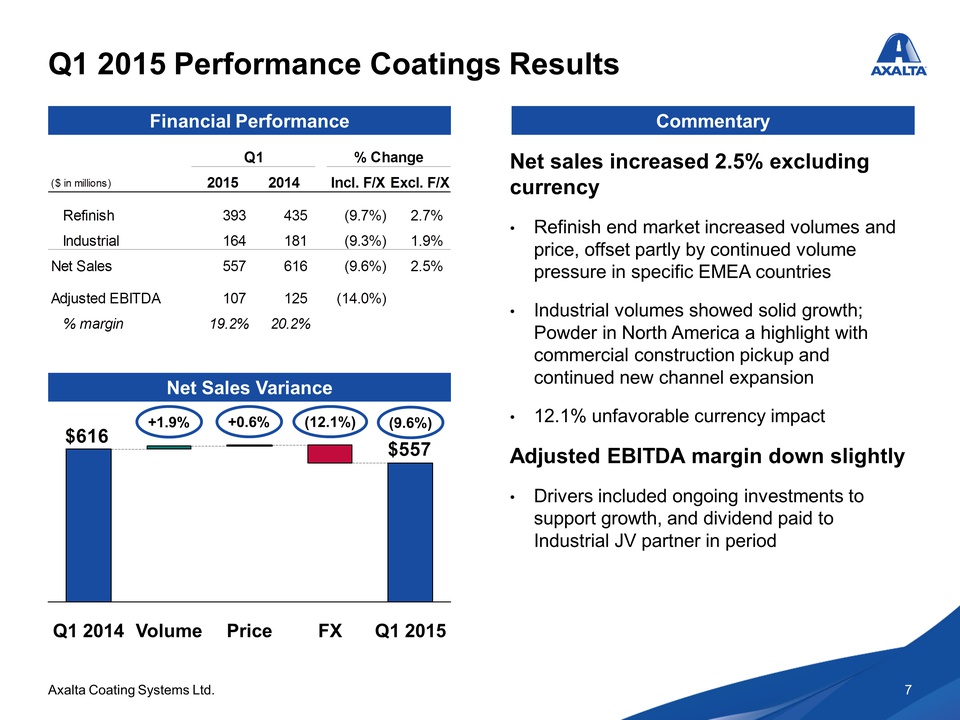 Q1 2015 Performance
Coatings Results Financial Performance Q1 % Change ($ in millions) 2015
2014 Incl. F/X Excl. F/X Refinish 393 435 (9.7%) 2.7% Industrial 164 181
(9.3%) 1.9% Net Sales 557 616 (9.6%) 2.5% Adjusted EBITDA 107 125
(14.0%) % margin 19.2% 20.2% Commentary Net sales increased 2.5%
excluding currency Refinish end market increased volumes and price,
offset partly by continued volume pressure in specific EMEA countries
Industrial volumes showed solid growth; Powder in North America a
highlight with commercial construction pickup and continued new channel
expansion 12.1% unfavorable currency impact Adjusted EBITDA margin down
slightly Drivers included ongoing investments to support growth, and
dividend paid to Industrial JV partner in period Net Sales Variance $616
+1.9% +0.6% (12.1%) (9.6%) $557 Q1 2014 Volume Price FX Q1 2015 Axalta
Coating Systems Ltd. 7
Q1 2015 Performance
Coatings Results Financial Performance Q1 % Change ($ in millions) 2015
2014 Incl. F/X Excl. F/X Refinish 393 435 (9.7%) 2.7% Industrial 164 181
(9.3%) 1.9% Net Sales 557 616 (9.6%) 2.5% Adjusted EBITDA 107 125
(14.0%) % margin 19.2% 20.2% Commentary Net sales increased 2.5%
excluding currency Refinish end market increased volumes and price,
offset partly by continued volume pressure in specific EMEA countries
Industrial volumes showed solid growth; Powder in North America a
highlight with commercial construction pickup and continued new channel
expansion 12.1% unfavorable currency impact Adjusted EBITDA margin down
slightly Drivers included ongoing investments to support growth, and
dividend paid to Industrial JV partner in period Net Sales Variance $616
+1.9% +0.6% (12.1%) (9.6%) $557 Q1 2014 Volume Price FX Q1 2015 Axalta
Coating Systems Ltd. 7

Q1 2015 Transportation Coatings Results Financial Performance Q1 % Change ($ in millions) 2015 2014 Incl. F/X Excl. F/X Light Vehicle 333 340 (1.9%) 7.4% Commercial Vehicle 99 92 7.6% 15.4% Net Sales 432 431 0.2% 9.1% Adjusted EBITDA 75 62 20.4% % margin 17.3% 14.4% Commentary Net sales increased 9.1% excluding currency Light Vehicle net sales increases led by Asia Pacific and North America from new business and strong car builds. Asia Pacific volumes up over 20% Commercial Vehicle net sales growing strongly in most regions, driven by heavy duty truck sales 8.9% unfavorable currency impact Adjusted EBITDA margin up 290 bps 20% Adjusted EBITDA growth driven by positive volume effect and benefits from cost initiatives. Some offsetting drag from unabsorbed growth investments in Asia Pacific Net Sales Variance $431 +9.0% +0.1% (8.9%) +0.2% $432 Q1 2014 Volume Price FX Q1 2015 Axalta Coating Systems Ltd. 8

Cost Optimization Initiatives Progressing Well Fit-For-Growth: $100 million savings plan is on budget – Methodically tracking progress towards remainder of program – Expect $60 million cumulative savings to be realized by the end of 2015 Axalta Way: $100 million savings targeted – Detailed planning and execution began in Q1 – Opportunities in procurement, operations, commercial practices, and SG&A One Time Costs: Minor with independent company transition costs now complete – Q1 saw $4 million for termination benefits, $3 million for consulting and advisory fees Axalta Coating Systems Ltd. 9

Debt and Liquidity Summary Net Leverage 5.6x 5.2x 5.0x 4.7x 4.7x 4.5x 4.2x 4.0x 4.1x At LBO Q2 '13 Q3 '13 Q4 '13 Q1 '14 Q2 '14 Q3 '14 Q4 '14 Q1 '15 Capitalization ($ in millions) @ 3/31/2015 Maturity Cash and Cash Equivalents $223 Debt: Revolver ($400 capacity) - 2018 First Lien Term Loan (USD) 2,160 2020 First Lien Term Loan (EUR) (1) 425 2020 Senior Secured Notes (EUR) (1) 270 2021 Total Senior Secured Debt $2,855 Senior Unsecured Notes (USD) 750 2021 Other Borrowings 20 Total Debt $3,626 Total Net Debt $3,403 LTM Adjusted EBITDA $836 Credit Statistics: Total Net Leverage 4.1x (1) Assumes exchange rate of $1.08 USD/Euro. Note: Excludes unamortized original issue discount. Axalta Coating Systems Ltd. 10

Full Year 2015 Guidance Reiterated Net Sales Growth: + 5-7% excluding F/X; flat to slightly down on an as-reported basis – Growth across all regions and end-markets, excluding F/X impact, which is a significant headwind, though primarily translational with production and sales fairly balanced by region – Performance Coatings Drivers: Increased volumes, selective price increases – Transportation Coatings Drivers: Light Vehicle ramp from recent “wins”; continued strong truck production Adjusted EBITDA: $860-900 million – Adjusted EBITDA margin of approximately 20% – Drivers: Ramping sales growth and savings from our optimization initiatives – 2H 2015 ramps with new capacity coming online to serve Light Vehicle plant wins Tax Rate: Normalized effective @ 27-29% CapEx: $150 million, ~60% for growth & productivity projects Net working capital: 13-15% of net sales, excluding previously expensed transition-related items Axalta Coating Systems Ltd. 11

Appendix

Full Year 2015 Assumptions Currency Assumptions Currency % Axalta Net Sales 2014 Avg. Rate 2015 Avg. Guidance Rate % Change in F/X Rate US$ per Euro ~30% 1.33 1.10 (17.3%) Chinese Yuan per US$ ~11% 6.17 6.25 (1.3%) Mexican Peso per US$ ~6% 13.33 15.00 (12.5%) Brazilian Real per US$ ~5% 2.36 2.90 (22.9%) Venezuelan Bolivar per US$ ~3% 8.91 25.00 (180.6%) Russian Ruble per US$ ~2% 38.48 65.00 (68.9%) Macroeconomic Assumptions Global GDP growth of approximately 3% Global industrial production growth of approximately 4% Global auto build growth of approximately 3% Modest benefit from lower oil prices given the extended supply chain in key raw materials and category-specific supply and demand dynamics Axalta Coating Systems Ltd. 13

Adjusted EBITDA Reconciliation ($ in millions) FY 2014 Q1 2014 Q1 2015 LTM 3/31/2015 Net Income (Loss) $35 (4) $47 $86 Interest Expense 217 59 50 208 Provision (Benefit) for Income Taxes 2 12 1 (9) Depreciation & Amortization 309 81 73 301 Reported EBITDA $563 $148 $171 $586 A Financing Costs and Extinguishment 6 3 - 3 B Foreign exchange remeasurement losses 81 - 9 90 C Long-term employee benefit plan adjustments (1) 3 - (4) D Termination benefits and other employee related costs 18 3 4 19 E Consulting and advisory fees 36 13 3 26 F Transition-related costs 102 14 - 88 G IPO-related and Secondary offering costs 22 - 1 23 H Other adjustments 11 3 (2) 6 I Dividends in respect of noncontrolling interest (2) (1) (4) (5) J Management fee expense 3 1 - 2 Total Adjustments $278 $39 $11 $250 Adjusted EBITDA $841 $187 $182 $836 Note: Numbers might not foot due to rounding. Axalta Coating Systems Ltd. 14

Adjusted EBITDA Reconciliation (cont’d) A. In connection with an amendment to the Senior Secured Credit Facilities in February 2014, we recognized $3 million of costs during the three months ended March 31, 2014. In addition to the credit facility amendment, we also incurred a $3 million loss on extinguishment of debt recognized during the year ended December 31, 2014, which resulted directly from the pro-rata write off of unamortized deferred financing costs and original issue discounts associated with the pay-down of $100 million of principal on the New Dollar Term Loan. B. Eliminates foreign exchange gains and losses resulting from the remeasurement of assets and liabilities denominated in foreign currencies. C. Eliminates the non-service cost components of employee benefit costs. Additionally, we deducted a pension curtailment gain of $7 million recorded during the year ended December 31, 2014. D. Represents expenses primarily related to employee termination benefits, including our initiative to improve the overall cost structure within the European region, and other employee-related costs. Termination benefits include the costs associated with our headcount initiatives associated with cost saving opportunities that were related to our transition to a standalone entity and our Axalta Way cost savings initiatives in 2015. E. Represents fees paid to consultants, advisors, and other third-party professional organizations for professional services rendered in conjunction with the transition from DuPont to a standalone entity during 2014. Amounts incurred for the three months ended March 31, 2015 primarily relate to the Axalta Way cost savings initiatives. F. Represents charges associated with the transition from DuPont to a standalone entity, including branding and marketing, information technology related costs, and facility transition costs. G. Represents costs associated with the secondary offering of our common shares by Carlyle that closed in April 2015 (the "Secondary Offering") and costs associated with the IPO including a $13 million payment to terminate a consulting agreement. H. Represents costs for certain unusual or non-operational (gains) and losses, including a $5.4 million gain recognized in 2015 resulting from the remeasurement of our previously held interest in an equity method investee upon the acquisition of a controlling interest, stock-based compensation, equity investee dividends, indemnity losses associated with the Acquisition, and loss (gain) on sale and disposal of property, plant and equipment. I. Represents the payment of dividends to our joint venture partners by our consolidated entities that are not wholly owned. J. Pursuant to Axalta’s management agreement with Carlyle Investment for management and financial advisory services and oversight provided to Axalta and its subsidiaries, Axalta was required to pay an annual management fee of $3.0 million and out-of-pocket expenses. This agreement terminated upon completion of the IPO in November 2014. Axalta Coating Systems Ltd. 15