
Form 6-K DELHAIZE GROUP For: Apr 13
UNITED STATES
SECURITIES AND EXCHANGE COMMISSION
Washington, D.C. 20549
FORM 6-K
REPORT OF FOREIGN PRIVATE ISSUER
Pursuant to Rule 13a-16 or 15d-16
under the Securities Exchange Act of 1934
For the month of April, 2015
Commission File Number: 333-13302
ETABLISSEMENTS DELHAIZE FRÈRES
ET CIE “LE LION” (GROUPE DELHAIZE)
(Exact name of registrant as specified in its charter)*
DELHAIZE BROTHERS AND CO.
“THE LION” (DELHAIZE GROUP)
(Translation of registrant’s name into English)*
SQUARE MARIE CURIE 40
1070 BRUSSELS, BELGIUM
(Address of principal executive offices)
| * | The registrant’s charter (articles of association) specifies the registrant’s name in French, Dutch and English. |
Indicate by check mark whether the registrant files or will file annual reports under cover of Form 20-F or Form 40-F.
Form 20-F x Form 40-F ¨
Indicate by check mark if the registrant is submitting the Form 6-K in paper as permitted by Regulation S-T Rule 101(b)(1): ¨
Indicate by check mark if the registrant is submitting the Form 6-K in paper as permitted by Regulation S-T Rule 101(b)(7): ¨
ANNUAL REPORT 2014
DELHAIZE GROUP
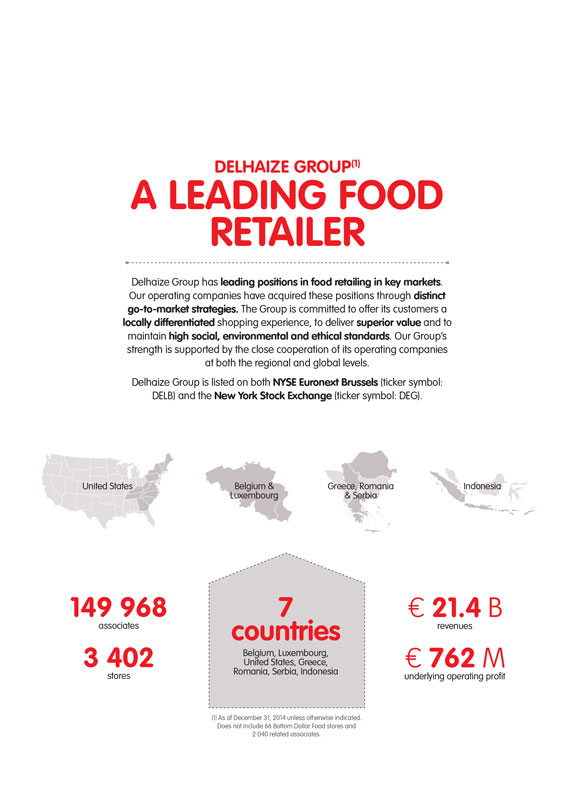
DELHAIZE GROUP(1)
A LEADING FOOD
RETAILER
Delhaize Group has leading positions in food retailing in key markets. Our operating
companies have acquired these positions through distinct go-to-market strategies. The Group is committed to offer its customers a locally differentiated shopping experience, to deliver superior value and to maintain high social, environmental and
ethical standards. Our Group’s strength is supported by the close cooperation of its operating companies at both the regional and global levels.
Delhaize
Group is listed on both NYSE Euronext Brussels (ticker symbol: DELB) and the New York Stock Exchange (ticker symbol: DEG).
United States
Belgium & Luxembourg
Greece, Romania & Serbia
Indonesia
149 968
associates
3 402
stores
7
countries
Belgium, Luxembourg,
United States, Greece,
Romania, Serbia, Indonesia
€ 21.4B
revenues
€ 762 M
underlying operating profit
(1) As of December 31, 2014 unless otherwise indicated. Does not include 66 Bottom Dollar Food stores and 2 040 related associates.
02 Overview
02 Key figures
04 Interview with the Chairman of the Board of Directors and the Chief Executive Officer
08
Strategy
08 Retail Context and 2015 priorities
10 Strategic Framework
11 Our Purpose
12 Keeping our promises
14 Customers
18 Associates
21 Our Values
22 Communities
26 Shareholders
28 Shareholder Information
32 Performance(2)
32 Segment Overview
34 Financial Review
37 United States
40 Belgium
42 Southeastern Europe
46 Governance(2)
46 Corporate Governance
58 Remuneration Report
64 Risk Factors(2)
71 Financial Statements(2)
168 Glossary
(2) These chapters contain the information
required by the Belgian Companies Code to
be included in the Management Report on the
consolidated financial statements
and constitute
in the aggregate such Management Report.
OVERVIEW
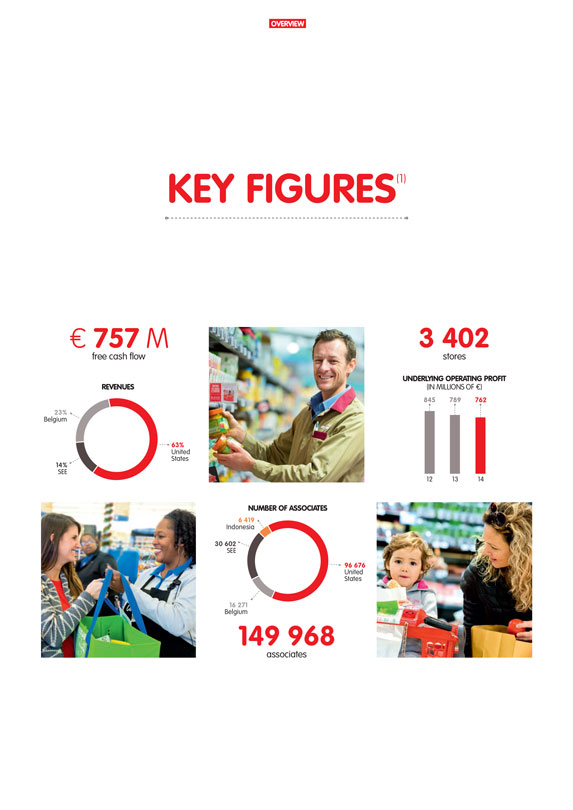
KEY FIGURES(1)
€ 757 M
free cash flow
REVENUES
23%
Belgium
63%
United
States
14%
SEE
3 402
stores
UNDERLYING OPERATING PROFIT
(IN MILLIONS OF €)
845 789 762
12 13 14
NUMBER OF ASSOCIATES
6 419
Indonesia
30 602
SEE
96 676
United
States
16 271
Belgium
149 968
associates
Delhaize Group Annual Report 2014 • 3
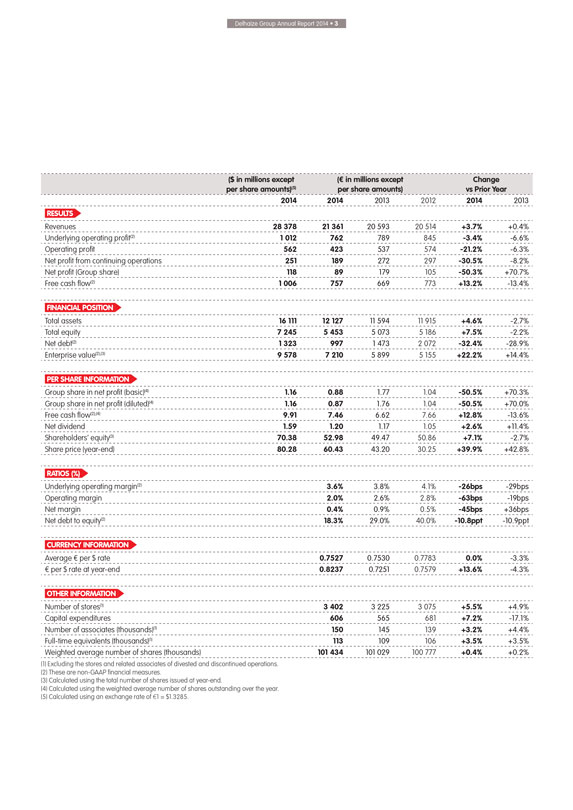
($ in
millions except per share amounts)(5) (€ in millions except per share amounts) Change vs Prior Year
2014 2014 2013 2012 2014 2013
RESULTS
Revenues 28 378 21 361 20 593 20 514 +3.7% +0.4%
Underlying operating profit(2) 1 012 762 789 845 -3.4% -6.6%
Operating profit 562 423 537 574
-21.2% -6.3%
Net profit from continuing operations 251 189 272 297 -30.5% -8.2%
Net profit (Group share) 118 89 179 105 -50.3% +70.7%
Free cash flow(2) 1 006
757 669 773 +13.2% -13.4%
FINANCIAL POSITION
Total assets 16 111 12 127 11
594 11 915 +4.6% -2.7%
Total equity 7 245 5 453 5 073 5 186 +7.5% -2.2%
Net
debt(2) 1 323 997 1 473 2 072 -32.4% -28.9%
Enterprise value(2),(3) 9 578 7 210 5 899 5 155 +22.2% +14.4%
PER SHARE INFORMATION
Group share in net profit (basic)(4) 1.16 0.88 1.77 1.04 -50.5% +70.3%
Group share in net profit (diluted)(4) 1.16 0.87 1.76 1.04 -50.5% +70.0%
Free
cash flow(2),(4) 9.91 7.46 6.62 7.66 +12.8% -13.6%
Net dividend 1.59 1.20 1.17 1.05 +2.6% +11.4%
Shareholders’ equity(3) 70.38 52.98 49.47 50.86 +7.1% -2.7%
Share price (year-end) 80.28
60.43 43.20 30.25 +39.9% +42.8%
RATIOS (%)
Underlying operating margin(2)
3.6% 3.8% 4.1% -26bps -29bps
Operating margin 2.0% 2.6% 2.8% -63bps -19bps
Net margin 0.4% 0.9% 0.5% -45bps +36bps
Net debt to equity(2) 18.3% 29.0%
40.0% -10.8ppt -10.9ppt
CURRENCY INFORMATION
Average € per $ rate 0.7527
0.7530 0.7783 0.0% -3.3%
€ per $ rate at year-end 0.8237 0.7251 0.7579 +13.6% -4.3%
OTHER INFORMATION
Number of stores(1) 3 402 3 225 3 075 +5.5% +4.9%
Capital expenditures 606 565 681 +7.2% -17.1%
Number of associates (thousands)(1) 150 145 139
+3.2% +4.4%
Full-time equivalents (thousands)(1) 113 109 106 +3.5% +3.5%
Weighted average number of shares (thousands) 101 434 101 029 100 777 +0.4% +0.2%
(1) Excluding the stores and related associates of divested and discontinued operations.
(2)
These are non-GAAP financial measures.
(3) Calculated using the total number of shares issued at year-end.
(4) Calculated using the weighted average number of shares outstanding over the year.
(5)
Calculated using an exchange rate of €1 = $1.3285.

OVERVIEW
WORKING TOGETHER TO BE PREFERRED BY OUR
CUSTOMERS
INTERVIEW WITH THE CHAIRMAN OF THE BOARD OF DIRECTORS AND THE CHIEF
EXECUTIVE OFFICER
In 2014 we introduced our new Strategic Framework. As a result, we are simpler, more transparent, and focused on providing a great, local
shopping experience.
What would you describe as the most important accomplishments at Delhaize Group in 2014?
Mats Jansson For me, 2014 was about Frans’ first year as CEO, developing the new strategy, and realizing continued progress in our U.S. operations. With Frans in place, the
Executive Committee took the opportunity to review our strategy and develop a new Strategic Framework. We felt it was critical to put our customers at the center of everything we do. In the U.S., where we have now seen nine consecutive quarters of
growth, we continue to be pleased by our efforts to maintain relevance. We did take the difficult decisions to announce the Transformation Plan in Belgium and in the fourth quarter of 2014 we agreed to the
Watch the interview of Frans Muller on annualreport.delhaizegroup.com
sale of our Bottom
Dollar Food locations in the U.S. We also exited from Bulgaria and Bosnia
& Herzegovina in 2014. These decisions are never easy, but we felt these decisions
were important in order to improve our focus. Frans Muller In March 2014, we developed, introduced and began to implement our new Strategic Framework across the Group. This Framework articulates our company’s Purpose. It also outlines the
Promise we make to all our stakeholders, the Principles we use to make decisions, our Sustainability Ambition as an organization, and the Values that embody who we are. Together, these elements function as the framework to serve our customers,
ensuring that we provide them with a great local shopping experience in stores and online.
Delhaize Group Annual Report 2014 • 5
Why did
the Board and the Executive Committee find it important to review Delhaize Group’s strategy?
MJ I believe that we have an obligation to review the strategy
every year and, with Frans on board, this represented a unique opportunity to do a deeper review of our strategy. It is important to look at our strategy from a commercial perspective to ensure its continued relevance, to understand the areas where
we can improve, and to ensure our business is sustainable. One of the benefits of having worked in the retail industry for many years is that I have seen strategic plans discussed and put into action. Putting a new strategy in place is an ambitious
process and with our new, clear, and transparent strategy, we are well positioned in 2015 to further implement it successfully and to pursue profitable growth in all our markets.
FM As the new CEO I took the opportunity to lead our in-depth strategic review in order for us to understand the facts, assess the current situation, and to build on our strengths,
such as our store network, our people, our fresh food competence and our private brands. It also allowed us to identify and further focus on our core businesses. We had to make some tough decisions in 2014, but our new Strategic Framework has helped
us to remain focused on attractive markets in terms of size, growth, and profitability and be competitive in markets where we have the capabilities and strengths to win.
How does the strategy influence day-to-day management and priorities of the different operating companies within Delhaize Group?
MJ By refining our strategy, we are focusing our execution efforts to deliver our core promises to our stakeholders. We have four key stakeholders – customers, associates,
communities, and shareholders - and we use our new strategy to deliver value to each in a profitable, respectful and sustainable way. FM Our Promise to our
customers is to provide a great local shopping experience, in stores and online. With the customer as our primary focus, we are re-defining the words used in our Strategic Framework: “preferred”, “local” and “working
together”. We want to ensure that, by providing excellent products at reasonable prices in a compelling and logical store environment, customers choose us as their preferred supermarket. We also understand that local is important. Customers
want stores that are conveniently located. They want the store staffed with people from their community – people they know and who reflect the local culture and values. Finally, working together means that we want to work as teams in the
stores, across functions within operating companies, and across the Group as a whole. We want to continuously share best practices to ensure that we are operating our customers’ preferred local supermarket. “Customer focus” is just a
buzzword if we do not measure whether we are delivering on our Promise. For this reason, we are putting specific performance metrics in place to measure our success and understand how we are delivering on our promises. For example, to measure how
our customers perceive us we will use a Net Promoter Score, which is determined by asking our customers if they would recommend us to their friends and family. And we can’t deliver for our customers without the engagement of our associates.
Therefore, we will also be using a new Associate Engagement Survey to measure with our associates how rewarding their work is, because we believe that engaged associates will, in turn, delight customers.
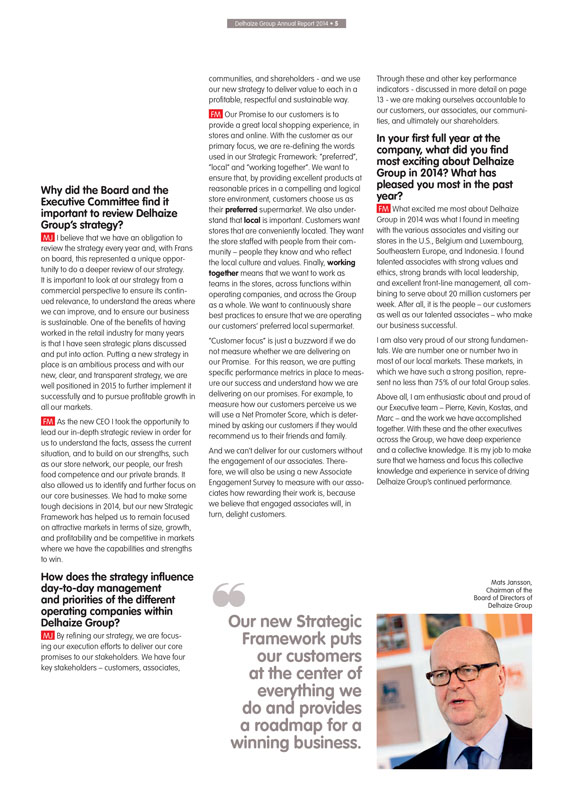
“Our new Strategic Framework puts our customers at the center of everything we do and provides a roadmap for a winning business.
Through these and other key performance indicators - discussed in more detail on page
13 - we
are making ourselves accountable to our customers, our associates, our communities, and ultimately our shareholders.
In your first full year at the company, what
did you find most exciting about Delhaize Group in 2014? What has pleased you most in the past year?
FM What excited me most about Delhaize Group in 2014 was what
I found in meeting with the various associates and visiting our stores in the U.S., Belgium and Luxembourg, Southeastern Europe, and Indonesia. I found talented associates with strong values and ethics, strong brands with local leadership, and
excellent front-line management, all combining to serve about 20 million customers per week. After all, it is the people – our customers as well as our talented associates – who make our business successful.
I am also very proud of our strong fundamentals. We are number one or number two in most of our local markets. These markets, in which we have such a strong position, represent no
less than 75% of our total Group sales. Above all, I am enthusiastic about and proud of our Executive team – Pierre, Kevin, Kostas, and Marc – and the work we have accomplished together. With these and the other executives across the
Group, we have deep experience and a collective knowledge. It is my job to make sure that we harness and focus this collective knowledge and experience in service of driving Delhaize Group’s continued performance.
Mats Jansson,
Chairman of the
Board of Directors of
Delhaize Group
OVERVIEW
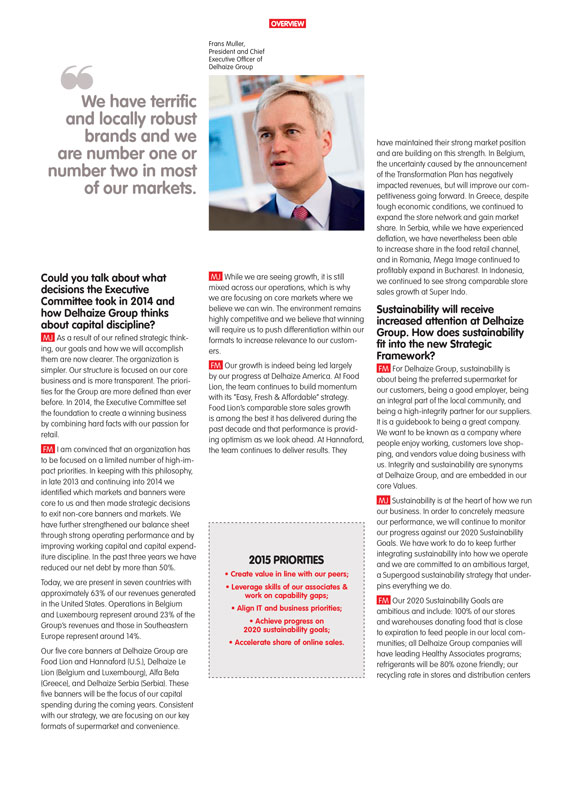
“We have terrific and locally robust
brands and we are number one or number two in most of our markets.
Could you talk about what decisions the Executive Committee took in 2014 and how Delhaize Group
thinks about capital discipline?
MJ As a result of our refined strategic thinking, our goals and how we will accomplish them are now clearer. The organization is
simpler. Our structure is focused on our core business and is more transparent. The priorities for the Group are more defined than ever before. In 2014, the Executive Committee set the foundation to create a winning business by combining hard facts
with our passion for retail.
FM I am convinced that an organization has to be focused on a limited number of high-impact priorities. In keeping with this
philosophy, in late 2013 and continuing into 2014 we identified which markets and banners were core to us and then made strategic decisions to exit non-core banners and markets. We have further strengthened our balance sheet through strong operating
performance and by improving working capital and capital expenditure discipline. In the past three years we have reduced our net debt by more than 50%. Today, we are present in seven countries with approximately 63% of our revenues generated in the
United States. Operations in Belgium and Luxembourg represent around 23% of the Group’s revenues and those in Southeastern Europe represent around 14%.
Our
five core banners at Delhaize Group are Food Lion and Hannaford (U.S.), Delhaize Le Lion (Belgium and Luxembourg), Alfa Beta (Greece), and Delhaize Serbia (Serbia). These five banners will be the focus of our capital spending during the coming
years. Consistent with our strategy, we are focusing on our key formats of supermarket and convenience.
Frans Muller, President and Chief Executive Officer of
Delhaize Group
MJ While we are seeing growth, it is still mixed across our operations, which is why we are focusing on core markets where we believe we can win.
The environment remains highly competitive and we believe that winning will require us to push differentiation within our formats to increase relevance to our customers.
FM Our growth is indeed being led largely by our progress at Delhaize America. At Food Lion, the team continues to build momentum with its “Easy, Fresh &
Affordable” strategy. Food Lion’s comparable store sales growth is among the best it has delivered during the past decade and that performance is providing optimism as we look ahead. At Hannaford, the team continues to deliver results.
They
2015 PRIORITIES
Create value in line with our peers;
Leverage skills of our associates & work on capability gaps;
Align IT and business
priorities;
Achieve progress on 2020 sustainability goals;
Accelerate share
of online sales.
have maintained their strong market position and are building on this strength. In Belgium, the uncertainty caused by the announcement of the
Transformation Plan has negatively impacted revenues, but will improve our competitiveness going forward. In Greece, despite tough economic conditions, we continued to expand the store network and gain market share. In Serbia, while we have
experienced deflation, we have nevertheless been able to increase share in the food retail channel, and in Romania, Mega Image continued to profitably expand in Bucharest. In Indonesia, we continued to see strong comparable store sales growth at
Super Indo.
Sustainability will receive increased attention at Delhaize Group. How does sustainability fit into the new Strategic Framework?
FM For Delhaize Group, sustainability is about being the preferred supermarket for our customers, being a good employer, being an integral part of the local community, and being a
high-integrity partner for our suppliers. It is a guidebook to being a great company. We want to be known as a company where people enjoy working, customers love shopping, and vendors value doing business with us. Integrity and sustainability are
synonyms at Delhaize Group, and are embedded in our core Values.
MJ Sustainability is at the heart of how we run our business. In order to concretely measure our
performance, we will continue to monitor our progress against our 2020 Sustainability Goals. We have work to do to keep further integrating sustainability into how we operate and we are committed to an ambitious target, a Supergood sustainability
strategy that underpins everything we do.
FM Our 2020 Sustainability Goals are ambitious and include: 100% of our stores and warehouses donating food that is close
to expiration to feed people in our local communities; all Delhaize Group companies will have leading Healthy Associates programs; refrigerants will be 80% ozone friendly; our recycling rate in stores and distribution centers
Delhaize Group Annual Report 2014 • 7
increasing from 54% currently to 80% by 2020; achieving a 20% reduction in greenhouse gas emissions by 2020 against a 2008 baseline through continued energy
reduction use and better refrigerants; employing a more diverse and inclusive team of associates to better serve our local neighborhoods; and offering the most sustainable private brands.
Looking forward, what is the outlook for 2015 and how does this fit into your strategic thinking?
FM I see opportunities in making our banners more competitive and being more cost-conscious as a Group, with the overall goal of creating value in line with our peers. At the same
time we will never compromise on our focus on the customers: providing them with a great local shopping experience at a reasonable price.
Following the
streamlining of our portfolio in 2013 and 2014, we aim in 2015 to support growth opportunities at all our banners. At Food Lion, we will further refine and deploy our Easy, Fresh & Affordable strategy in 160 additional stores, and at
Hannaford, we have the ambition to accelerate growth. In Belgium, we are looking to implement the Transformation Plan, improving our customer offer, modernizing our network and further developing our online channel. In Southeastern Europe and
Indonesia we will continue to expand. Across Europe we intend to maximize the potential benefits of Coopernic, our new European buying alliance. Finally, we remain disciplined with respect to capital allocation.
What is the largest opportunity for 2015 and beyond?
FM I believe the company has a solid base
from which I have had the good fortune to start. We have terrific and locally robust brands, and we are number one or number two in most of our local markets. However, in order to build on these positions, we need to continue to focus on our core
markets in order to further differentiate our value proposition. We will also be more commercially aggressive in 2015, as we aim to better communicate our offer and our strengths to our customers. I am convinced these efforts, coupled with our push
into digital and omni-channel food retailing provide us with a positive outlook for Delhaize Group.
MJ We are facing challenges, including slow growth and
increasing consolidation in the markets where we operate. In order to remain relevant in our markets and pursue growth, we need to continue to bring cost levels down while at the same time maximizing the potential of our assets and refusing to
compromise in terms of delivering an excellent product to our customers. We need to mobilize the energy of our associates. Our biggest asset as a company is our people and their energy. We need to work harder to engage them, capture their creativity
and innovation while at the same time work to support their personal development.
What will Delhaize Group look like in five years’ time?
MJ In all our markets we want to look back in five years’ time having gained market share, being recognized as a top employer, and having reached or exceeded our 2020
sustainability targets. We expect to have high operating efficiency, at all steps in the supply chain and
to have increased return on invested capital (ROIC).
FM We want to be in a leadership position in all of our core markets. We want to have delighted customers. But to do this we have work to do on our IT systems and
infrastructure to ensure that they are up to date and can support future growth. We want to be able to deliver on customer expectations with our digital and online platform, and accelerate our share of online sales. Above all we want to be in
sustainable leading positions vis-à-vis our customers, our associates, and our suppliers. We want to lead in creating value for our shareholders.
The focus
we apply to the segments and markets in which we want to compete will be applied to everything we do, by everyone in our company and will be integrated company-wide into the incentive targets for our officers. We believe this focus will benefit all
our stakeholders. Because our focus is our customer and we will operate our customers’ preferred local supermarkets!
STRATEGY
RETAIL CONTEXT
AND 2015 PRIORITIES
In 2014 we reformulated our strategy (see page 10) to face a retail
marketplace that today is more competitive than ever. We see three main external competitive trends that impact and shape the food retail industry today. These trends and our response are discussed on the following pages.
Delhaize Group Annual Report 2014 • 9
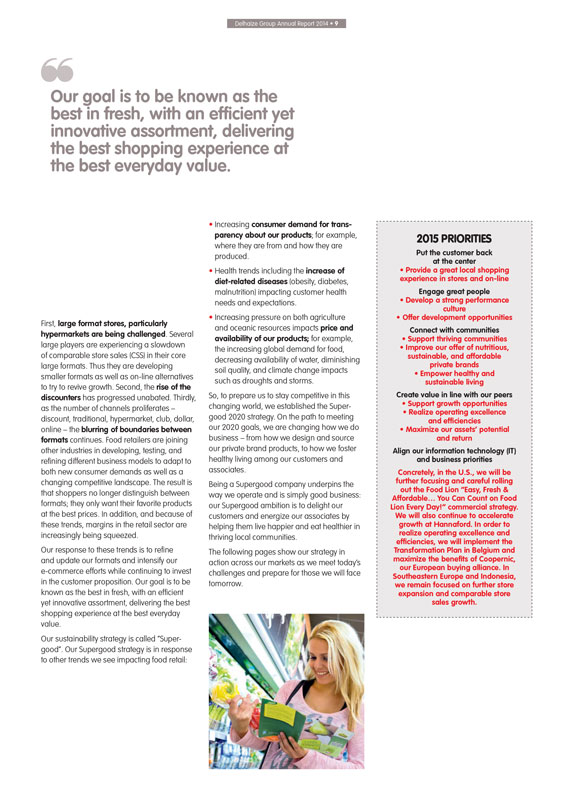
“Our goal is to be known as the best in fresh, with an efficient yet innovative assortment, delivering the best shopping experience at the best everyday
value.
First, large format stores, particularly hypermarkets are being challenged. Several large players are experiencing a slowdown of comparable store sales
(CSS) in their core large formats. Thus they are developing smaller formats as well as on-line alternatives to try to revive growth. Second, the rise of the discounters has progressed unabated. Thirdly, as the number of channels proliferates –
discount, traditional, hypermarket, club, dollar, online – the blurring of boundaries between formats continues. Food retailers are joining other industries in developing, testing, and refining different business models to adapt to both new
consumer demands as well as a changing competitive landscape. The result is that shoppers no longer distinguish between formats; they only want their favorite products at the best prices. In addition, and because of these trends, margins in the
retail sector are increasingly being squeezed.
Our response to these trends is to refine and update our formats and intensify our e-commerce efforts while
continuing to invest in the customer proposition. Our goal is to be known as the best in fresh, with an efficient yet innovative assortment, delivering the best shopping experience at the best everyday value.
Our sustainability strategy is called “Supergood”. Our Supergood strategy is in response to other trends we see impacting food retail:
Increasing consumer demand for transparency about our products; for example, where they are from and how they are produced.
Health trends including the increase of diet-related diseases (obesity, diabetes, malnutrition) impacting customer health needs and expectations.
Increasing pressure on both agriculture and oceanic resources impacts price and availability of our products; for example, the increasing global demand for food, decreasing
availability of water, diminishing soil quality, and climate change impacts such as droughts and storms.
So, to prepare us to stay competitive in this changing
world, we established the Supergood 2020 strategy. On the path to meeting our 2020 goals, we are changing how we do business – from how we design and source our private brand products, to how we foster healthy living among our customers and
associates.
Being a Supergood company underpins the way we operate and is simply good business: our Supergood ambition is to delight our customers and energize our
associates by helping them live happier and eat healthier in thriving local communities.
The following pages show our strategy in action across our markets as we
meet today’s challenges and prepare for those we will face tomorrow.
2015 PRIORITIES
Put the customer back at the center
Provide a great local shopping experience in stores and
on-line
Engage great people
Develop a strong performance culture
Offer development opportunities
Connect with communities
Support thriving communities
Improve our offer of nutritious, sustainable, and affordable
private brands
Empower healthy and sustainable living
Create value in line with our peers
Support growth opportunities
Realize operating excellence
and efficiencies
Maximize our assets’ potential and return
Align our information technology (IT) and
business priorities
Concretely, in the U.S., we will be further focusing and careful rolling out the Food Lion “Easy, Fresh & Affordable... You Can
Count on Food Lion Every Day!” commercial strategy.
We will also continue to accelerate growth at Hannaford. In order to realize operating excellence and
efficiencies, we will implement the Transformation Plan in Belgium and maximize the benefits of Coopernic, our European buying alliance. In Southeastern Europe and Indonesia, we remain focused on further store expansion and comparable store sales
growth.
STRATEGY
OUR STRATEGIC
FRAMEWORK
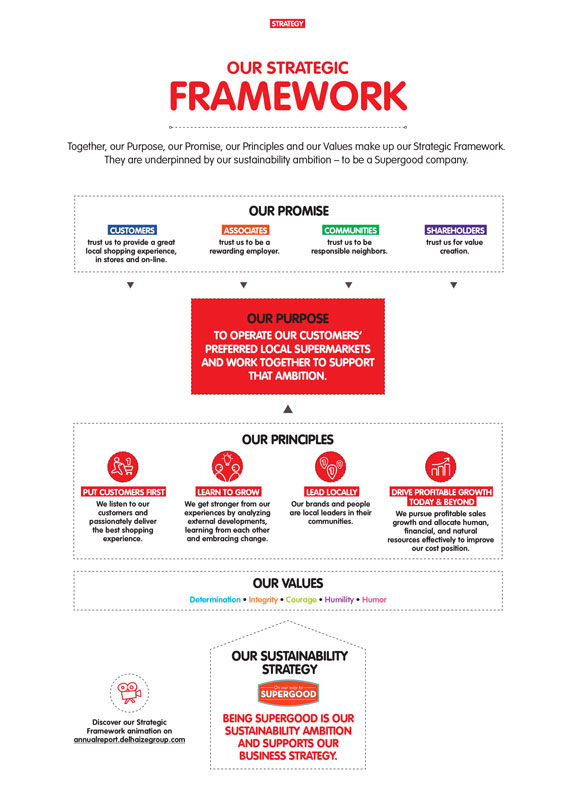
Together, our Purpose, our Promise, our Principles and our Values make up our
Strategic Framework. They are underpinned by our sustainability ambition – to be a Supergood company.
OUR PROMISE
CUSTOMERS
trust us to provide a great local shopping experience, in stores and on-line.
ASSOCIATES
trust us to be a rewarding employer.
COMMUNITIES
trust us to be responsible neighbors.
SHAREHOLDERS
trust us for value creation.
OUR PURPOSE
TO OPERATE OUR CUSTOMERS’
PREFERRED LOCAL SUPERMARKETS
AND WORK TOGETHER TO SUPPORT
THAT AMBITION.
OUR PRINCIPLES
PUT CUSTOMERS FIRST
We listen to our customers and passionately deliver the best shopping
experience.
LEARN TO GROW
We get stronger from our experiences by analyzing
external developments, learning from each other and embracing change.
LEAD LOCALLY
Our brands and people are local leaders in their communities.
DRIVE PROFITABLE GROWTH TODAY
& BEYOND
We pursue profitable sales growth and allocate human, financial, and natural resources effectively to improve our cost position.
OUR VALUES
Determination • Integrity • Courage • Humility • Humor
Discover our Strategic Framework animation on annualreport.delhaizegroup.com
OUR SUSTAINABILITY STRATEGY
On our way to
SUPERGOOD
BEING SUPERGOOD IS OUR SUSTAINABILITY AMBITION AND SUPPORTS OUR BUSINESS STRATEGY.
Delhaize Group Annual Report 2014 • 11
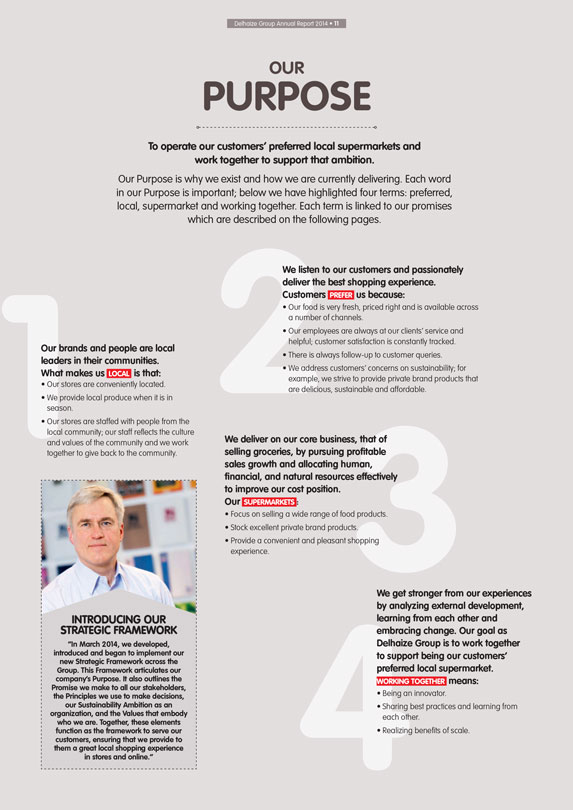
OUR
PURPOSE
To operate our customers’ preferred local supermarkets and work
together to support that ambition.
Our Purpose is why we exist and how we are currently delivering. Each word in our Purpose is important; below we have
highlighted four terms: preferred, local, supermarket and working together. Each term is linked to our promises which are described on the following pages.
Our
brands and people are local leaders in their communities. What makes us LOCAL is that:
Our stores are conveniently located.
We provide local produce when it is in season.
Our stores are staffed with people from the
local community; our staff reflects the culture and values of the community and we work together to give back to the community.
INTRODUCING OUR STRATEGIC FRAMEWORK
“In March 2014, we developed, introduced and began to implement our new Strategic Framework across the Group. This Framework articulates our company’s
Purpose. It also outlines the Promise we make to all our stakeholders, the Principles we use to make decisions, our Sustainability Ambition as an organization, and the Values that embody who we are. Together, these elements function as the framework
to serve our customers, ensuring that we provide to them a great local shopping experience in stores and online.”
We listen to our customers and passionately
deliver the best shopping experience. Customers PREFER us because:
Our food is very fresh, priced right and is available across a number of channels.
Our employees are always at our clients’ service and helpful; customer satisfaction is constantly tracked.
There is always follow-up to customer queries.
We address customers’ concerns on
sustainability; for example, we strive to provide private brand products that are delicious, sustainable and affordable.
We deliver on our core business, that of
selling groceries, by pursuing profitable sales growth and allocating human, financial, and natural resources effectively to improve our cost position.
Our
SUPERMARKETS :
Focus on selling a wide range of food products.
Stock
excellent private brand products.
Provide a convenient and pleasant shopping experience.
We get stronger from our experiences by analyzing external development, learning from each other and
embracing change. Our goal as
Delhaize Group is to work together
to support being our customers’
preferred local supermarket.
WORKING TOGETHER means:
Being an innovator.
Sharing best practices and learning from each other.
Realizing benefits of scale.

STRATEGY
KEEPING OUR
PROMISES
Our Promise is what we are doing as Delhaize Group to achieve our Purpose. In this
section, we show how we are keeping our promises to our stakeholders and how we are measuring them.
The Delhaize Group team passionately serves local customers
tasty, nutritious, and affordable foods. We operate friendly, neighborhood supermarkets in diverse local markets, living shared values, enriching thriving communities, and growing profitably as a Group.
We skillfully balance the needs of our customers, associates, communities and shareholders in a respectful, sustainable, and profitable way. This results in being the preferred
local supermarket.
Discover more about our Strategic Framework on annualreport.delhaizegroup.com
CUSTOMERS
ASSOCIATES
COMMUNITIES
SHAREHOLDERS
Delhaize Group Annual Report 2014 • 13
OUR
PROMISES
Our Customers trust us to provide a great local shopping experience, in stores and online.
They expect an experience that delivers value for them, meets their grocery needs, and delights them with innovations in taste and convenience. Customers prefer us because we
consistently deliver well-stocked stores that are conveniently located. We offer food that is fresh, nutritious and affordable. We employ friendly people and we deliver an efficient experience.
Read more on p. 14
Our Associates trust us to be a rewarding employer.
We not only provide the paycheck that allows them to do the things they need and want to do, we also invest in providing a safe, respectful and inclusive working environment,
opportunities for growth and development, and a sense of accomplishment and pride in working for a company that is built on core values of determination, integrity, courage, humility and humor.
Read more on p. 18
Our Communities trust us to be responsible neighbors.
They expect us to support thriving communities by employing local people, partnering with local suppliers, respecting the environment and reducing food waste, and empowering
customers and associates to lead healthy and sustainable lives.
Read more on p. 22
Our Shareholders trust us for value creation.
They expect us to deliver on our commitments and
future ambitions. They have numerous opportunities to invest their money elsewhere, so they need to see and believe that their money delivers what they expect it to deliver.
Read more on p. 26
KEY PERFORMANCE INDICATORS
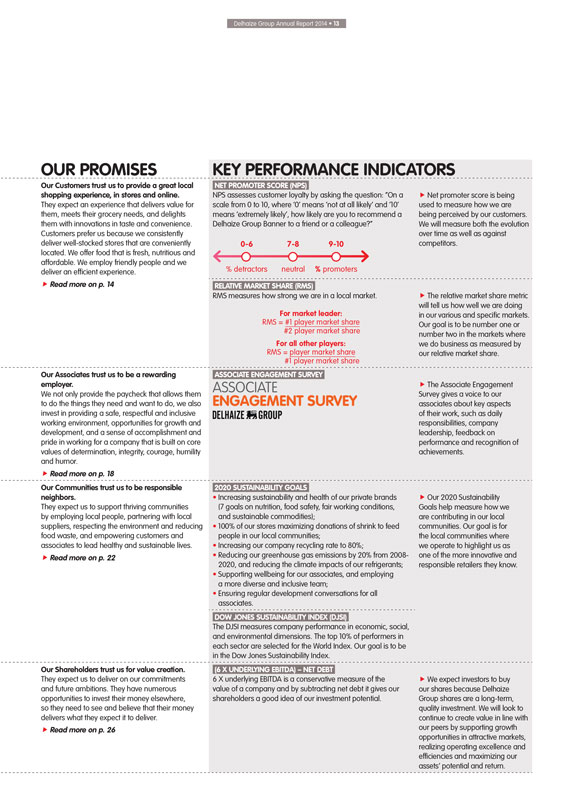
NET PROMOTER SCORE (NPS)
NPS assesses customer loyalty by asking the question: “On a
scale from 0 to 10, where ‘0’ means ‘not at all likely’ and ‘10’ means ‘extremely likely’, how likely are you to recommend a Delhaize Group Banner to a friend or a colleague?”
0-6 7-8 9-10
% detractors neutral % promoters
RELATIVE MARKET SHARE (RMS)
RMS measures how strong we are in a local market.
For market leader:
RMS = #1 player market share
#2 player market share
For all other players:
RMS = player market share
#1 player market share
ASSOCIATE ENGAGEMENT SURVEY
ASSOCIATE
ENGAGEMENT SURVEY
DELHAIZE GROUP
2020 SUSTAINABILITY GOALS
Increasing sustainability and health of our private brands (7 goals
on nutrition, food safety, fair working conditions, and sustainable commodities);
100% of our stores maximizing donations of shrink to feed people in our local
communities;
Increasing our company recycling rate to 80%;
Reducing our
greenhouse gas emissions by 20% from 2008-2020, and reducing the climate impacts of our refrigerants;
Supporting wellbeing for our associates, and employing a more
diverse and inclusive team;
Ensuring regular development conversations for all associates.
DOW JONES SUSTAINABILITY INDEX (DJSI)
The DJSI measures company performance in economic,
social, and environmental dimensions. The top 10% of performers in each sector are selected for the World Index. Our goal is to be in the Dow Jones Sustainability Index.
(6 X UNDERLYING EBITDA) – NET DEBT
6 X underlying EBITDA is a conservative measure of the
value of a company and by subtracting net debt it gives our shareholders a good idea of our investment potential.
Net promoter score is being used to measure how
we are being perceived by our customers. We will measure both the evolution over time as well as against competitors.
The relative market share metric will tell us
how well we are doing in our various and specific markets. Our goal is to be number one or number two in the markets where we do business as measured by our relative market share.
The Associate Engagement Survey gives a voice to our associates about key aspects of their work, such as daily responsibilities, company leadership, feedback on performance and
recognition of achievements.
Our 2020 Sustainability Goals help measure how we are contributing in our local communities. Our goal is for the local communities
where we operate to highlight us as one of the more innovative and responsible retailers they know.
We expect investors to buy our shares because Delhaize Group
shares are a long-term, quality investment. We will look to continue to create value in line with our peers by supporting growth opportunities in attractive markets, realizing operating excellence and efficiencies and maximizing our assets’
potential and return.

STRATEGY
CUSTOMERS
TRUST US TO PROVIDE A GREAT LOCAL SHOPPING EXPERIENCE
IN STORES AND ONLINE
Customers choose to shop at our local banners because they feel warmly welcomed and are delighted to find tasty products that are affordable, healthy and sustainable.
more than
20 M
customers served
weekly in our stores
around the world
REVENUES BY
SEGMENT
23%
Belgium
14%
SEE
63%
United
States
As we move forward into 2015, our aim is to continue to provide our customers with a delightful shopping experience. Our stores are conveniently located. Shopping is efficient and
technology is used to make shopping easier, not only at the point of sale but also to ensure that stores are well-stocked with both high-quality good-value food and non-food products. The following pages illustrate how we keep our Promise to our
customers.
Delhaize Group Annual Report 2014 • 15
PUT
CUSTOMERS FIRST
Our customers trust us to provide a range of tasty, fresh, nutritious and affordable food products, available at their convenience, in stores and
online. Delivering this Promise depends on managing a complex value chain to consistently provide thousands of quality products at good value. This is critical to our success as a business to deliver on our Purpose of operating customers’
preferred local supermarkets.
Alfa Beta (AB, Greece) launches “The joy from giving only the best”
Alfa Beta’s new fresh strategy aims to further improve customers’ experience in Greece and reinforce AB’s established position as the every day food expert. As part
of the fresh strategy, AB aims to further differentiate offerings, with the main focus on three pillars: freshness and variety; guaranteed quality; and fresh ideas.
More specifically:
New products from local and well known bakeries have been
introduced in-store to further strengthen the already appealing assortment in the bakery department;
“Fish Day” every Wednesday has introduced customers
already familiar with the quality of the fresh fish offered to great, new offers in both specific products and whole categories;
The fresh strategy has contributed
to Alfa Beta’s overall positive sales growth and market share gain.
Together, Mega Image’s “Wine Gallery” and a new on-line wine platform offer
a specialized service around wine to better meet customer needs
In 2014, Mega Image opened the Wine Gallery, its first wine “shop-in-a-shop” concept
store, in Bucharest. The concept wine store offers around 900 different wines as well as a choice of spirits and gourmet products associated with wine consumption. Mega Image is also launching an online platform that aims to build a community of
people interested in wines and delicacies, through direct interaction between Mega Image specialists and users in the online forum.
Mega Image is launching an
online platform that aims to build a community of people interested in wines and delicacies:
http://www.stamdevorba.ro
±900
different wines offered by Mega Image’s concept wine store
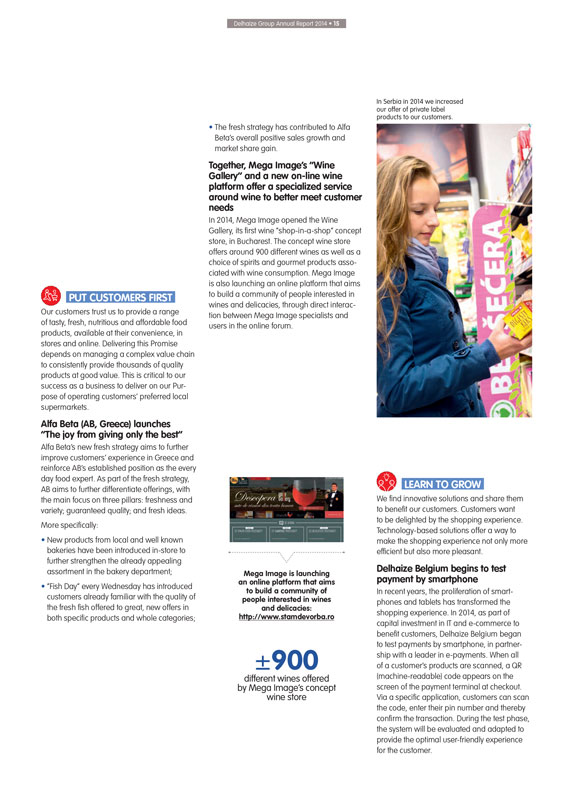
In Serbia in 2014 we increased our offer of private label products to our customers.
LEARN TO
GROW
We find innovative solutions and share them to benefit our customers. Customers want to be delighted by the shopping experience. Technology-based solutions
offer a way to make the shopping experience not only more efficient but also more pleasant.
Delhaize Belgium begins to test payment by smartphone
In recent years, the proliferation of smartphones and tablets has transformed the shopping experience. In 2014, as part of capital investment in IT and e-commerce to benefit
customers, Delhaize Belgium began to test payments by smartphone, in partnership with a leader in e-payments. When all of a customer’s products are scanned, a QR (machine-readable) code appears on the screen of the payment terminal at checkout.
Via a specific application, customers can scan the code, enter their pin number and thereby confirm the transaction. During the test phase, the system will be evaluated and adapted to provide the optimal user-friendly experience for the customer.
STRATEGY
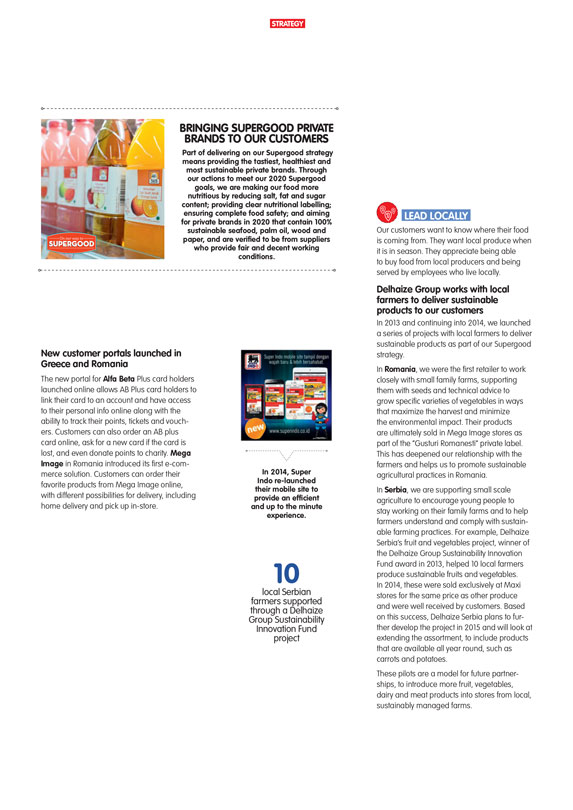
BRINGING SUPERGOOD PRIVATE BRANDS TO OUR
CUSTOMERS
Part of delivering on our Supergood strategy means providing the tastiest, healthiest and most sustainable private brands. Through our actions to meet
our 2020 Supergood goals, we are making our food more nutritious by reducing salt, fat and sugar content; providing clear nutritional labelling; ensuring complete food safety; and aiming for private brands in 2020 that contain 100% sustainable
seafood, palm oil, wood and paper, and are verified to be from suppliers who provide fair and decent working conditions.
New customer portals launched in Greece
and Romania
The new portal for Alfa Beta Plus card holders launched online allows AB Plus card holders to link their card to an account and have access to their
personal info online along with the ability to track their points, tickets and vouchers. Customers can also order an AB plus card online, ask for a new card if the card is lost, and even donate points to charity. Mega Image in Romania introduced its
first e-commerce solution. Customers can order their favorite products from Mega Image online, with different possibilities for delivery, including home delivery and pick up in-store.
Super Indo mobile site tampil dengan wajah baru & lebih bersahabat.
new
www.superindo.co.id
In 2014, Super Indo re-launched their mobile site to provide an efficient
and up to the minute experience.
10
local Serbian
farmers supported
through a Delhaize
Group Sustainability
Innovation Fund
project
LEAD LOCALLY
Our customers want to know where their food is coming from. They want local produce when it is in season. They appreciate being able to buy food from local producers and being
served by employees who live locally.
Delhaize Group works with local farmers to deliver sustainable products to our customers
In 2013 and continuing into 2014, we launched a series of projects with local farmers to deliver sustainable products as part of our Supergood strategy.
In Romania, we were the first retailer to work closely with small family farms, supporting them with seeds and technical advice to grow specific varieties of vegetables in ways
that maximize the harvest and minimize the environmental impact. Their products are ultimately sold in Mega Image stores as part of the “Gusturi Romanesti” private label. This has deepened our relationship with the farmers and helps us to
promote sustainable agricultural practices in Romania.
In Serbia, we are supporting small scale agriculture to encourage young people to stay working on their
family farms and to help farmers understand and comply with sustainable farming practices. For example, Delhaize Serbia’s fruit and vegetables project, winner of the Delhaize Group Sustainability Innovation Fund award in 2013, helped 10 local
farmers produce sustainable fruits and vegetables. In 2014, these were sold exclusively at Maxi stores for the same price as other produce and were well received by customers. Based on this success, Delhaize Serbia plans to further develop the
project in 2015 and will look at extending the assortment, to include products that are available all year round, such as carrots and potatoes.
These pilots are a
model for future partnerships, to introduce more fruit, vegetables, dairy and meat products into stores from local, sustainably managed farms.
Delhaize Group Annual Report 2014 • 17
DRIVE
PROFITABLE GROWTH TODAY AND BEYOND
We are always looking to innovate and respond to industry dynamics and trends to ensure that our business remains profitable
while we provide the best in fresh to our customers.
Food Lion’s “Easy, Fresh & Affordable…You Can Count on Food Lion Every Day!” Strategy
During the course of 2014, Food Lion began deploying a new, easier shopping experience for customers. In all Food Lion stores, the company enhanced its assortment
offering to customers. In addition, all associates were provided with new customer-centric training to enable customers to count on Food Lion for great service every day.
Seventy-six stores so far have been remodeled as part of our “Easy, Fresh & Affordable…You Can Count on Food Lion Every Day!” strategy. In its remodeled stores,
Food Lion further expanded its assortment to include items such as a new Taste of Inspirations premium line of deli meats and cheeses along with some grab and go items, which make it easy for customers to figure out what items to purchase. In
addition, Food Lion changed the customer check-out process by making it easy for the customer to move quickly through check-out. Also, the company enhanced its meat and produce departments. Customer feedback about the remodeled stores has been
positive; as a result this strategy will be further evaluated and carefully rolled out across approximately 160 Food Lion stores in 2015.
Delhaize Belgium and
Luxembourg launched the “Buy well/Eat well” campaign
The launch in 2014 by Delhaize Belgium and Luxembourg of the new commercial strategy “Buy
well/Eat well” throughout the store network was accompanied by the launch of two pilot stores in April and two pilot stores in October of 2014 centered around this new concept. The stores are particularly focused on offering fresh foods from
the company’s private brands and providing customers with an efficient checkout experience. There have been marked customer satisfaction improvements. In 2015, Delhaize Belgium will continue to invest in its commercial strategy, focusing on
providing fresh products, a varied assortment, and a seamless and easy shopping experience while continuing to offer the best price and quality products to our customers.
In 2014, Delhaize Belgium and Luxembourg launched the new commercial strategy “Buy well/Eat well”.
Discover more on http://fr.delhaize.be/action/bien-acheter-bien-manger
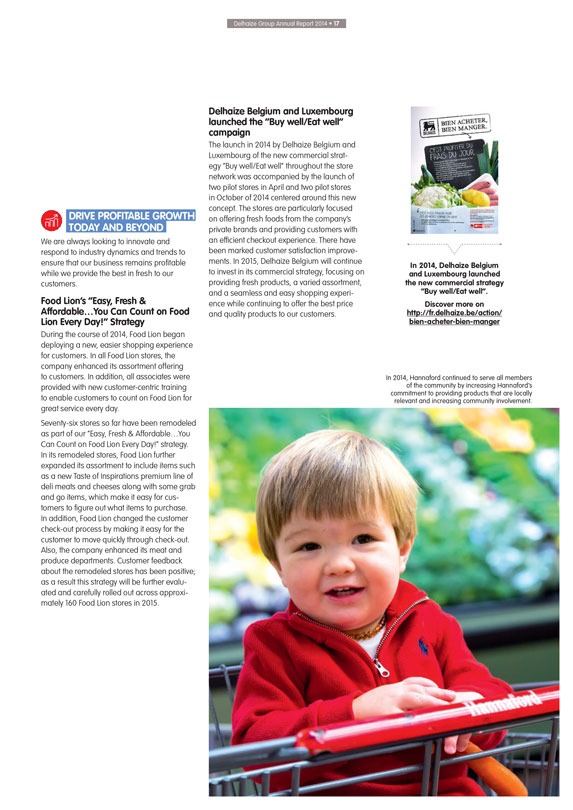
In 2014, Hannaford
continued to serve all members of the community by increasing Hannaford’s commitment to providing products that are locally relevant and increasing community involvement.

STRATEGY
ASSOCIATES
TRUST US TO BE A REWARDING EMPLOYER
Our stores employ diverse associates; we pay our
associates a fair wage and we provide an environment that is much more than just about money.
3 402(1) stores
7 countries
149 968(1) associates
We have 149 968 associates across Delhaize Group companies. We provide a safe environment that is respectful and inclusive, one that offers associates development opportunities and
a sense of accomplishment in a job well done. The following pages illustrate how we keep our Promise to our associates and include a discussion of our Values which outline who we are as a Group and who we want to be – to our customers, to our
communities, and to each other.
Delhaize Group Annual Report 2014 • 19
PUT
CUSTOMERS FIRST
Healthy lifestyles are an important part of our Supergood ambition to help our customers and associates live happier and eat healthier. We realize
that health and wellness cover areas from fitness and nutrition to managing chronic disease and that there is no “one-size-fits-all” approach. Alongside our nutritional innovations in our private brands, we continually test approaches to
changing behavior towards adopting healthy habits, launch pilot programs in partnership with health experts, and experiment with new tools.
Providing health and
wellness support online and in-store
At Hannaford in the U.S., we continue to offer free in-store and online dietician classes, consultations, and nutrition
demonstrations to help customers better understand nutrition. Delhaize Belgium provides online food coaching, monthly nutrition tips and answers to frequently asked questions on healthy eating topics including salt, gluten, lactose-intolerance,
diabetes, weight-loss plans and recommended daily quantities of staple foods.
“Our stores welcome diverse customers and associates; we work hard to ensure our
associate diversity reflects our local communities.
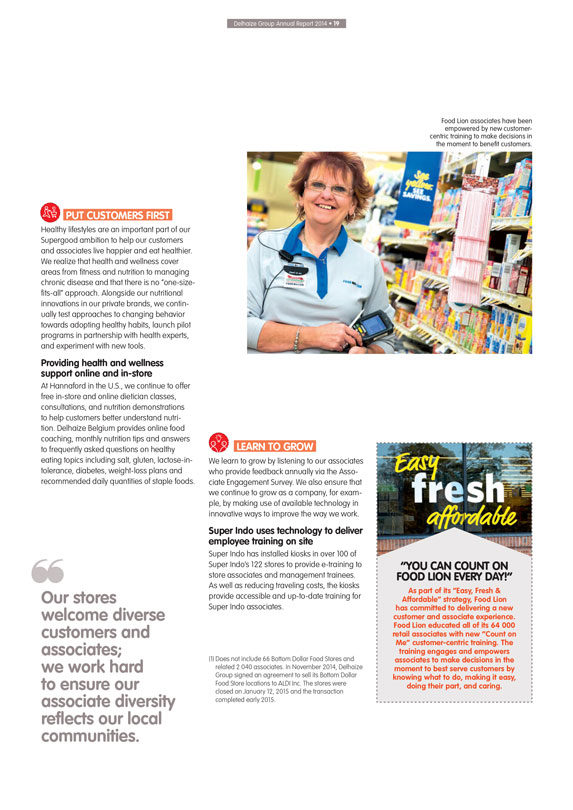
Food Lion associates have been empowered by new customer-centric training to make decisions in the moment to
benefit customers.
LEARN TO GROW
We learn to grow by listening to our
associates who provide feedback annually via the Associate Engagement Survey. We also ensure that we continue to grow as a company, for example, by making use of available technology in innovative ways to improve the way we work.
Super Indo uses technology to deliver employee training on site
Super Indo has installed
kiosks in over 100 of Super Indo’s 122 stores to provide e-training to store associates and management trainees. As well as reducing traveling costs, the kiosks provide accessible and up-to-date training for Super Indo associates.
(1) Does not include 66 Bottom Dollar Food Stores and related 2 040 associates. In November 2014, Delhaize Group signed an agreement to sell its Bottom Dollar Food Store locations
to ALDI Inc. The stores were closed on January 12, 2015 and the transaction completed early 2015.
“YOU CAN COUNT ON FOOD LION EVERY DAY!”
As part of its “Easy, Fresh & Affordable” strategy, Food Lion has committed to delivering a new customer and associate experience. Food Lion
educated all of its 64 000 retail associates with new “Count on Me” customer-centric training. The training engages and empowers associates to make decisions in the moment to best serve customers by knowing what to do, making it easy,
doing their part, and caring.
STRATEGY
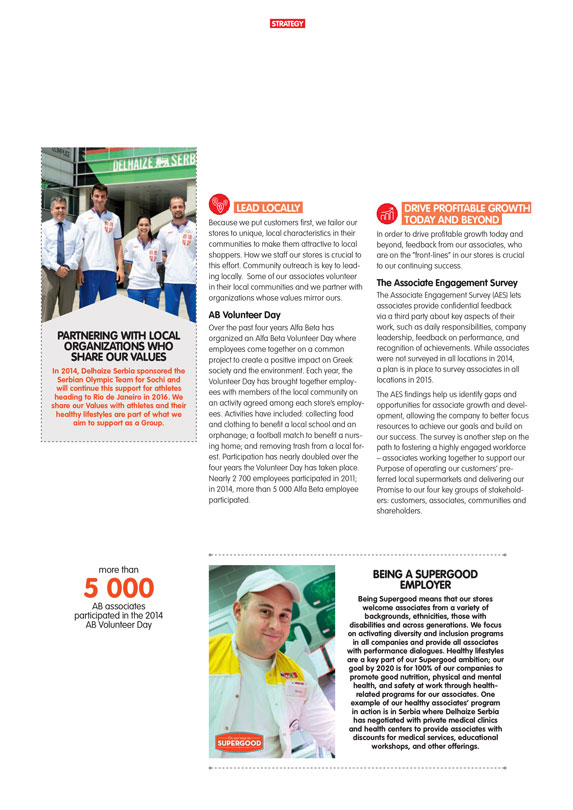
PARTNERING WITH LOCAL ORGANIZATIONS WHO
SHARE OUR VALUES
In 2014, Delhaize Serbia sponsored the Serbian Olympic Team for Sochi and will continue this support for athletes heading to Rio de Janeiro in
2016. We share our Values with athletes and their healthy lifestyles are part of what we aim to support as a Group.
LEAD LOCALLY
Because we put customers first, we tailor our stores to unique, local characteristics in their communities to make them attractive to local shoppers. How we staff our stores is
crucial to this effort. Community outreach is key to leading locally. Some of our associates volunteer in their local communities and we partner with organizations whose values mirror ours.
AB Volunteer Day
Over the past four years Alfa Beta has organized an Alfa Beta Volunteer Day
where employees come together on a common project to create a positive impact on Greek society and the environment. Each year, the Volunteer Day has brought together employees with members of the local community on an activity agreed among each
store’s employees. Activities have included: collecting food and clothing to benefit a local school and an orphanage; a football match to benefit a nursing home; and removing trash from a local forest. Participation has nearly doubled over the
four years the Volunteer Day has taken place. Nearly 2 700 employees participated in 2011; in 2014, more than 5 000 Alfa Beta employee participated.
DRIVE
PROFITABLE GROWTH TODAY AND BEYOND
In order to drive profitable growth today and beyond, feedback from our associates, who are on the “front-lines” in
our stores is crucial to our continuing success.
The Associate Engagement Survey
The Associate Engagement Survey (AES) lets associates provide confidential feedback via a third party about key aspects of their work, such as daily responsibilities, company
leadership, feedback on performance, and recognition of achievements. While associates were not surveyed in all locations in 2014, a plan is in place to survey associates in all locations in 2015.
The AES findings help us identify gaps and opportunities for associate growth and development, allowing the company to better focus resources to achieve our goals and build on our
success. The survey is another step on the path to fostering a highly engaged workforce – associates working together to support our Purpose of operating our customers’ preferred local supermarkets and delivering our Promise to our four
key groups of stakeholders: customers, associates, communities and shareholders.
more than 5 000
AB associates participated in the 2014 AB Volunteer Day
BEING A SUPERGOOD EMPLOYER
Being Supergood means that our stores welcome associates from a variety of backgrounds, ethnicities, those with disabilities and across generations. We focus on activating
diversity and inclusion programs in all companies and provide all associates with performance dialogues. Healthy lifestyles are a key part of our Supergood ambition; our goal by 2020 is for 100% of our companies to promote good nutrition, physical
and mental health, and safety at work through health-related programs for our associates. One example of our healthy associates’ program in action is in Serbia where Delhaize Serbia has negotiated with private medical clinics and health centers
to provide associates with discounts for medical services, educational workshops, and other offerings.

Delhaize Group Annual Report 2014 • 21
OUR
VALUES
Our Values represent “who” we are and want to be –
for
our customers and for each other.
DETERMINATION
When we talk about
determination, we are talking about a commitment to perform, even if barriers stand in our way. We know we can count on each other to perform his or her role to achieve our goals together. We are accountable and we deliver.
INTEGRITY
Integrity means that we are authentic. We are honest with ourselves and with others.
We are fair and principled towards our colleagues, our suppliers, our customers, and our communities. We stick to our word. We do things the right way, every day.
COURAGE
Courage is required to take the road less traveled. We dare to
challenge ourselves, each other and our competitors. We are commercially aggressive.
HUMILITY
If we are going to Learn to Grow, we should better be humble. Because the humble person is inspired to teach and to learn from others, as well as to be alert to external
developments. We always look for ways to serve others and respect the role each of us plays in delivering on our commitments.
HUMOR
Finally, finding the humor of the situation helps to put things in perspective and enables us to appreciate both our successes and our setbacks. And while work is serious, humor
keeps us from taking ourselves too seriously. Humor makes work enjoyable while sparking creativity and innovation. Humor makes us different.

STRATEGY
COMMUNITIES
TRUST US TO BE RESPONSIBLE NEIGHBORS
In each community where we operate, we aim to serve our
local communities by being an attractive local employer, engaging local suppliers, respecting the environment, reducing food waste and empowering healthy and sustainable living.
3 402(1) stores in 7 countries
EVOLUTION OF CAPEX
(IN MILLIONS OF €)
565 606
13 14
We serve the communities where we operate stores by striving to provide products and
services that are clearly linked to their local communities. Our stores employ local people and also support their local neighborhoods to be healthier, greener and thriving.
Delhaize Group Annual Report 2014 • 23
PUT
CUSTOMERS FIRST
We work hard to be local at every step of the purchasing process for our customers. Our stores are staffed with associates from the local community
and aim to reflect the culture and values of the community. Our local community engagement is a key way we differentiate ourselves from our competitors.
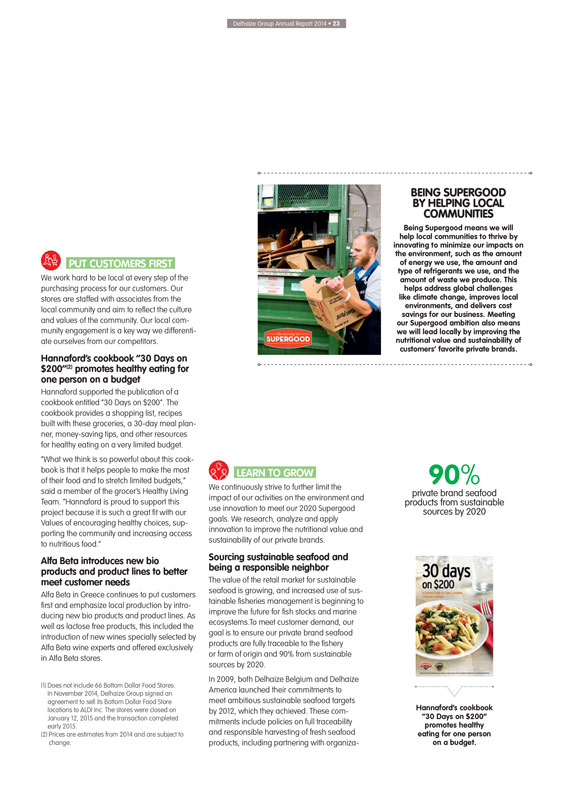
Hannaford’s cookbook “30 Days on $200”(2) promotes healthy eating for one person on a budget
Hannaford supported the publication of a cookbook entitled “30 Days on $200”. The cookbook provides a shopping list, recipes built with these groceries, a 30-day meal
planner, money-saving tips, and other resources for healthy eating on a very limited budget.
“What we think is so powerful about this cookbook is that it
helps people to make the most of their food and to stretch limited budgets,” said a member of the grocer’s Healthy Living Team. “Hannaford is proud to support this project because it is such a great fit with our Values of encouraging
healthy choices, supporting the community and increasing access to nutritious food.”
Alfa Beta introduces new bio products and product lines to better meet
customer needs
Alfa Beta in Greece continues to put customers first and emphasize local production by introducing new bio products and product lines. As well as
lactose free products, this included the introduction of new wines specially selected by Alfa Beta wine experts and offered exclusively in Alfa Beta stores.
(1)
Does not include 66 Bottom Dollar Food Stores. In November 2014, Delhaize Group signed an agreement to sell its Bottom Dollar Food Store locations to ALDI Inc. The stores were closed on January 12, 2015 and the transaction completed early 2015.
(2) Prices are estimates from 2014 and are subject to change.
LEARN TO GROW
We continuously strive to further limit the impact of our activities on the environment and use innovation to meet our 2020 Supergood goals. We research, analyze
and apply innovation to improve the nutritional value and sustainability of our private brands.
Sourcing sustainable seafood and being a responsible neighbor
The value of the retail market for sustainable seafood is growing, and increased use of sustainable fisheries management is beginning to improve the future for
fish stocks and marine ecosystems. To meet customer demand, our goal is to ensure our private brand seafood products are fully traceable to the fishery or farm of origin and 90% from sustainable sources by 2020.
In 2009, both Delhaize Belgium and Delhaize America launched their commitments to meet ambitious sustainable seafood targets by 2012, which they achieved. These commitments include
policies on full traceability and responsible harvesting of fresh seafood products, including partnering with organiza-
BEING SUPERGOOD BY HELPING LOCAL
COMMUNITIES
Being Supergood means we will help local communities to thrive by innovating to minimize our impacts on the environment, such as the amount of energy
we use, the amount and type of refrigerants we use, and the amount of waste we produce. This helps address global challenges like climate change, improves local environments, and delivers cost savings for our business. Meeting our Supergood ambition
also means we will lead locally by improving the nutritional value and sustainability of customers’ favorite private brands.
90%
private brand seafood products from sustainable sources by 2020
Hannaford’s cookbook
“30 Days on $200” promotes healthy eating for one person on a budget.
STRATEGY
tions to improve fisheries. In
collaboration with fishermen in northern Greece and WWF, Alfa Beta launched its commitment to sustainable fishing practices in 2013. This is the first time this kind of program is being implemented in the Mediterranean Sea. Super Indo in Indonesia
also launched in 2014 its sustainable seafood sourcing guidelines and plan for 2020.
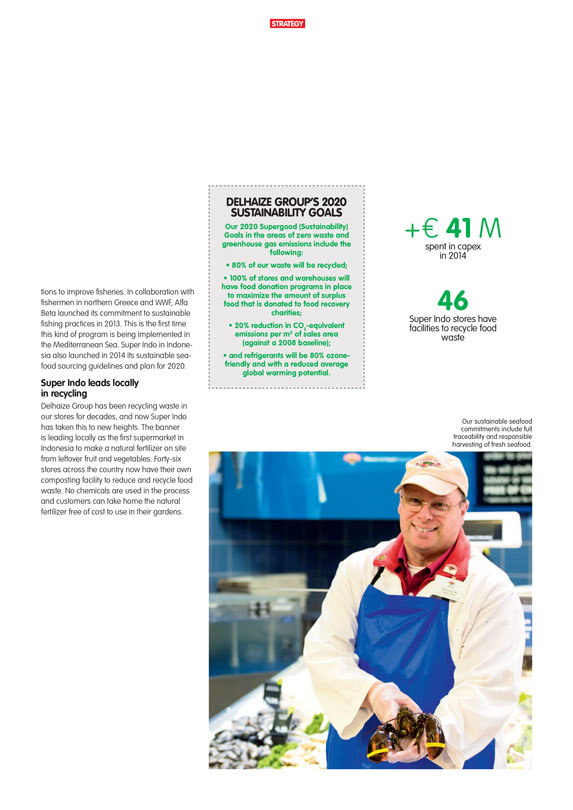
Super Indo leads locally in recycling
Delhaize Group has been recycling waste in our stores for decades, and now Super Indo has taken this to new heights. The banner is leading locally as the first supermarket in
Indonesia to make a natural fertilizer on site from leftover fruit and vegetables. Forty-six stores across the country now have their own composting facility to reduce and recycle food waste. No chemicals are used in the process and customers can
take home the natural fertilizer free of cost to use in their gardens.
DELHAIZE GROUP’S 2020 SUSTAINABILITY GOALS
Our 2020 Supergood (Sustainability) Goals in the areas of zero waste and greenhouse gas emissions include the following:
80% of our waste will be recycled;
100% of stores and warehouses will have food donation
programs in place to maximize the amount of surplus food that is donated to food recovery charities;
20% reduction in CO2 -equivalent emissions per m2 of sales
area (against a 2008 baseline);
and refrigerants will be 80% ozone-friendly and with a reduced average global warming potential.
+ € 41 M
spent in capex in 2014
46
Super Indo stores have facilities to recycle food waste
Our sustainable seafood commitments include full traceability and responsible harvesting of fresh seafood.
Delhaize Group Annual Report 2014 • 25
LEAD
LOCALLY
Being an integral part of our local communities is central to who we are as a company and giving back is important for all of our stakeholders.
Innovative projects from Delhaize Group associates propose local and sustainable solutions to everyday problems
In July 2013, the jury of Delhaize Group’s Sustainability Innovation Fund selected eight sustainability projects that began implementation in 2014. The project highlighted
below is only one example of the projects implemented through the Sustainability Innovation Fund in 2014.
Delhaize America (DA) develops a sustainable strategy
around the Nature’s Place product range
Proposed by members of Delhaize America’s “Our Brands” team this project aims to identify consumer
needs, purchasing habits and concerns about sustainable grocery products. In 2014, Delhaize America’s “Our Brands” department ran a survey with different groups of customers (DA and non-DA consumers) to identify expectations in terms
of sustainability for the Nature’s Place brand and made changes to meet customer expectations where possible. For example, the survey showed that customers expect packaging to be made from recycled material and/or to be easily recyclable. As a
result, the team decided to partner with GreenBlue, an organization that will help identify peers’ practices, advise on packaging redesign, and clarify the environmental impact of the current packaging material.
DRIVE PROFITABLE GROWTH TODAY AND BEYOND
We invest locally. In 2013 we spent
€565 million in capex and we increased this spend to €606 million in 2014. And, as neighborhoods evolve, we drive growth by providing stores that meet the needs of those who live there.
Proxy Delhaize goes urban to meet local needs
Proxy Urban Delhaize is a new store format
concept introduced in Belgium in 2014 which grew out of the successful Proxy Delhaize.
Proxy Delhaize is a neighborhood store, independently owned and often open
on Sundays but with access to Delhaize’s operational expertise. Proxy Urban Delhaize stocks about 50% of Delhaize brands with a focus on fresh products and speedy checkout. It attracts two types of customers, both office workers who work in the
area, and local residents who use it when they need a few items quickly.
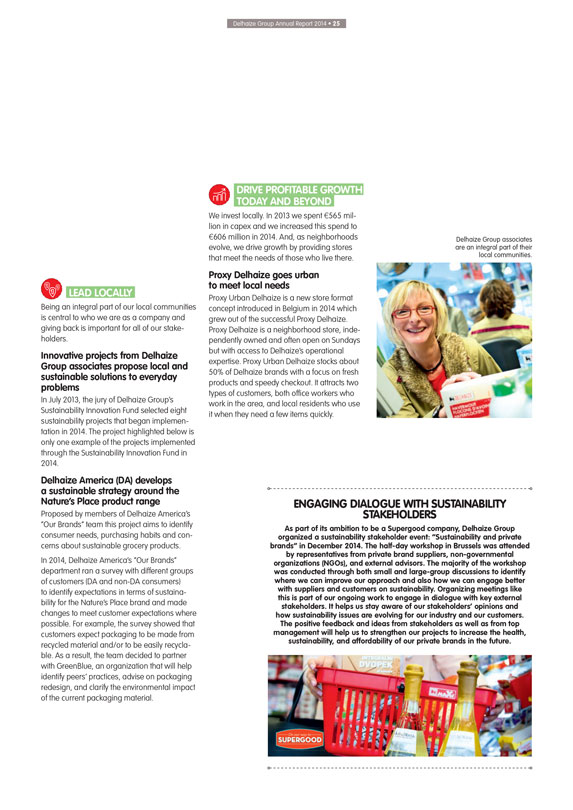
Delhaize Group associates are an integral part of their local communities.
ENGAGING DIALOGUE WITH SUSTAINABILITY STAKEHOLDERS
As part of its ambition to be a Supergood
company, Delhaize Group organized a sustainability stakeholder event: “Sustainability and private brands” in December 2014. The half-day workshop in Brussels was attended by representatives from private brand suppliers, non-governmental
organizations (NGOs), and external advisors. The majority of the workshop was conducted through both small and large-group discussions to identify where we can improve our approach and also how we can engage better with suppliers and customers on
sustainability. Organizing meetings like this is part of our ongoing work to engage in dialogue with key external stakeholders. It helps us stay aware of our stakeholders’ opinions and how sustainability issues are evolving for our industry and
our customers.
The positive feedback and ideas from stakeholders as well as from top management will help us to strengthen our projects to increase the health,
sustainability, and affordability of our private brands in the future.

STRATEGY
SHAREHOLDERS
TRUST US FOR VALUE CREATION
We pursue profitable sales growth and allocate human, financial,
and natural resources effectively to improve our cost position.
REVENUES(1) (IN BILLIONS OF €)
20.5 20.6 21.4
12 13 14(1)
UNDERLYING OPERATING PROFIT(1) (IN MILLIONS OF €)
845 789 762
12 13 14(1)
(1) Including 53rd week in the United States.
We meet this Promise by delivering on commitments to our shareholders, creating value by growing and expanding our business. We exercise discipline in resource allocation and use
our scale to reduce our costs in order to ensure profitable and sustainable growth. By doing so, we expect our shares to earn an attractive return for our shareholders. The following pages illustrate how we keep this Promise to our shareholders and
ensure that they are confident that Delhaize Group shares are a good investment.
PUT CUSTOMERS FIRST
Putting customers first is at the heart of our business and the way we accelerate organic growth, while improving our price position and perception. Our approach to e-commerce is
how we differentiate ourselves from our competitors and provide our customers with an easy and convenient way to shop using new and innovative tools.
Hannaford-to-Go
Hannaford focused in 2014 on expanding its e-commerce
capabilities by taking its successful Hannaford-to-Go online ordering system from the pilot stage to roll-out. In 2014, this curbside pick-up service expanded from two stores to 11 in three states. The growth in this service lays a foundation for
further growth in the service across Hannaford’s market area in 2015.
LEARN TO GROW
Joining Coopernic to generate cost savings
We have joined Coopernic, the European buying
alliance, to generate additional cost savings beginning in January 2015. This is expected to lead to further efficiencies in the areas of private brand innovation and development; improved commercial terms with international suppliers; and synergies
in non-food procurement. Our customers will benefit from the cost savings we generate.
Delhaize Group Annual Report 2014 • 27
LEAD
LOCALLY
Renovation of Alfa Beta flagship store
In 2014, there has been a vast
rethinking of product categories with Alfa Beta introducing new concepts as well as new product lines. More specifically, the renovation of our Elliniko store (Athens), one of the largest Alfa Beta stores, established a whole new store concept:
Products in bulk such as dry nuts, premium chocolate, coffee and tea as well as the usual categories of products, adding a significant competitive advantage;
A newly developed special beverage area in the same store accommodates an extensive assortment from Greek and international vineyards and even has a controlled
temperature room to store premium wines as well as a vending machine for testing wines;
An on-site bakery and an in-store pastry shop that offers a wide range of
custom recipes and extremely fresh products;
Unprecedented varieties of local and imported cheese, various deli products as well as marinated fresh fish and meat
with a strong relationship between quality and price.
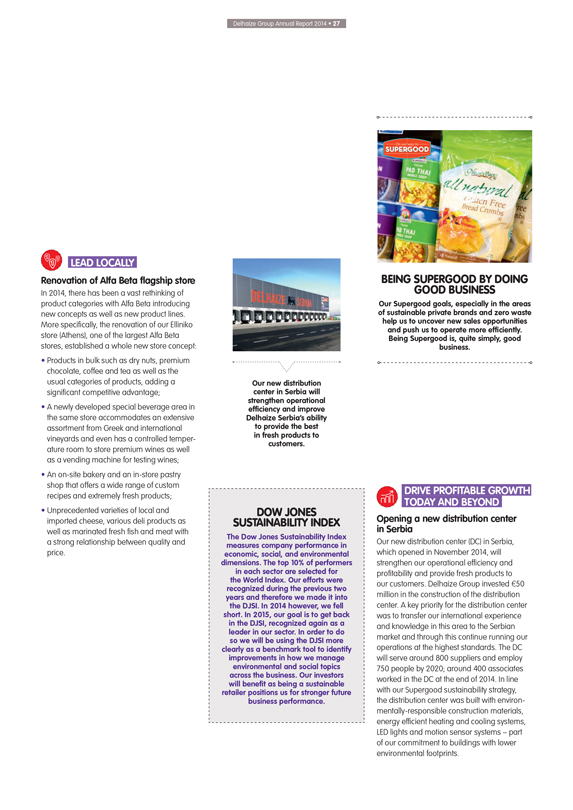
Our new distribution center in Serbia will strengthen operational efficiency and improve Delhaize
Serbia’s ability to provide the best in fresh products to customers.
DOW JONES SUSTAINABILITY INDEX
The Dow Jones Sustainability Index measures company performance in economic, social, and environmental dimensions. The top 10% of performers in each sector are selected for the
World Index. Our efforts were recognized during the previous two years and therefore we made it into the DJSI. In 2014 however, we fell short. In 2015, our goal is to get back in the DJSI, recognized again as a leader in our sector. In order to do
so we will be using the DJSI more clearly as a benchmark tool to identify improvements in how we manage environmental and social topics across the business. Our investors will benefit as being a sustainable retailer positions us for stronger future
business performance.
BEING SUPERGOOD BY DOING GOOD BUSINESS
Our Supergood
goals, especially in the areas of sustainable private brands and zero waste help us to uncover new sales opportunities and push us to operate more efficiently. Being Supergood is, quite simply, good business.
DRIVE PROFITABLE GROWTH TODAY AND BEYOND
Opening a new distribution center in Serbia
Our new distribution center (DC) in Serbia, which opened in November 2014, will strengthen our operational efficiency and profitability and provide fresh products
to our customers. Delhaize Group invested €50 million in the construction of the distribution center. A key priority for the distribution center was to transfer our international experience and knowledge in this area to the Serbian market
and through this continue running our operations at the highest standards. The DC will serve around 800 suppliers and employ 750 people by 2020; around 400 associates worked in the DC at the end of 2014. In line with our Supergood sustainability
strategy, the distribution center was built with environmentally-responsible construction materials, energy efficient heating and cooling systems, LED lights and motion sensor systems – part of our commitment to buildings with lower
environmental footprints.
STRATEGY
SHAREHOLDER
INFORMATION
Delhaize Group shares trade on NYSE Euronext Brussels under the symbol DELB.
American Depositary Shares (ADS) are traded on the New York Stock Exchange under the symbol DEG.
ADSs are evidenced by American Depositary Receipts (ADRs).
Information on delhaize group’s share price can be found on the websites of Delhaize Group (www.delhaizegroup.com), NYSE Euronext Brussels (www. euronext.com)
and the New York Stock Exchange (www.nyse.com). Detailed information on trading activity and share prices can also be found in the financial section of many newspapers.
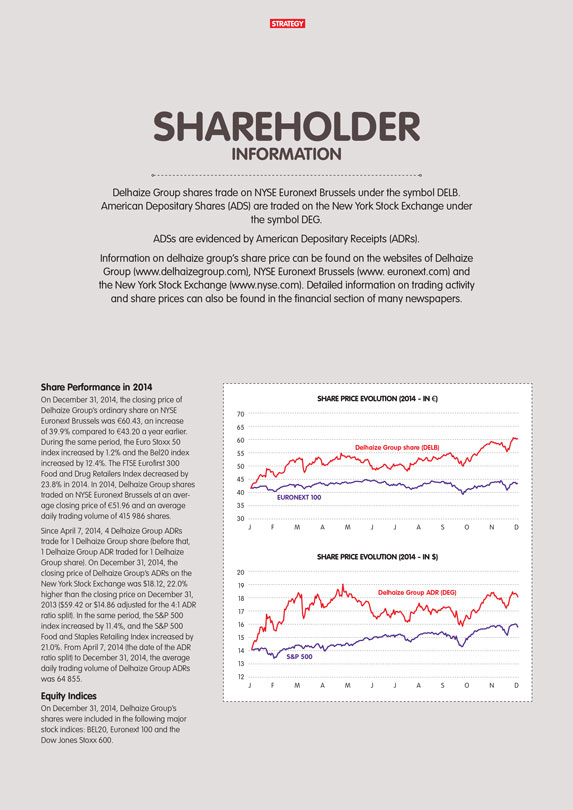
Share Performance in 2014
On December 31, 2014, the closing price of Delhaize
Group’s ordinary share on NYSE Euronext Brussels was €60.43, an increase of 39.9% compared to €43.20 a year earlier. During the same period, the Euro Stoxx 50 index increased by 1.2% and the Bel20 index increased by 12.4%. The FTSE
Eurofirst 300 Food and Drug Retailers Index decreased by 23.8% in 2014. In 2014, Delhaize Group shares traded on NYSE Euronext Brussels at an average closing price of €51.96 and an average daily trading volume of 415 986 shares.
Since April 7, 2014, 4 Delhaize Group ADRs trade for 1 Delhaize Group share (before that, 1 Delhaize Group ADR traded for 1 Delhaize Group share). On December 31, 2014,
the closing price of Delhaize Group’s ADRs on the New York Stock Exchange was $18.12, 22.0% higher than the closing price on December 31, 2013 ($59.42 or $14.86 adjusted for the 4:1 ADR ratio split). In the same period, the S&P 500
index increased by 11.4%, and the S&P 500 Food and Staples Retailing Index increased by 21.0%. From April 7, 2014 (the date of the ADR ratio split) to December 31, 2014, the average daily trading volume of Delhaize Group ADRs was 64
855.
Equity Indices
On December 31, 2014, Delhaize Group’s shares
were included in the following major stock indices: BEL20, Euronext 100 and the Dow Jones Stoxx 600.
SHARE PRICE EVOLUTION (2014 - IN €)
Delhaize Group share (DELB) EURONEXT 100
70 65 60 55 50 45 40 35 30
J F M A M J J A S O N D
SHARE PRICE EVOLUTION (2014 - IN $)
Delhaize Group ADR (DEG) S&P 500
20 19 18 17 16 15 14 13 12
J F M A M J J A S O N D
Delhaize Group Annual Report 2014 • 29
On
December 31, 2014, the weight of Delhaize Group shares in the BEL20 index was 6.5%. Delhaize Group shares represented the 7th largest constituent in the index.
On December 31, 2014, the weight of Delhaize Group in the Euronext 100 index was 0.31%. Delhaize Group represented the 76th largest constituent in the index.
Dividend
The dividend policy of Delhaize Group is to pay out approximately
35% of underlying Group share in net profit from continuing operations.
At the Ordinary Shareholders’ Meeting to be held on May 28, 2015, the Board of
Directors will therefore propose the payment of a gross dividend of €1.60 per share, compared to €1.56 the previous year. After deduction of 25% Belgian withholding tax, this will result in a net dividend of €1.20 per share
(€1.17 the prior year).
The net dividend of €1.20 per share will be payable to owners of ordinary shares against coupon no. 53. The Delhaize Group
shares will start trading ex-coupon on June 2, 2015 (opening of the market). The record date (i.e. the date at which shareholders are entitled to the dividend) is June 3, 2015 (closing of the market) and the payment date is June 4,
2015. The payment will be made at the registered office of the Company (rue Osseghem / Osseghemstraat 53, 1080 Brussels, Belgium) as well as through all Belgian financial institutions.
For shares held through a share account, the bank or broker will automatically handle the dividend payment.
The payment of the dividend to the ADR holders will be made through Citibank.
Type of Delhaize
Group Shares
Delhaize shares can be held in two different forms: dematerialized form or registered shares. Dematerialized shares are shares that can only be
represented by entries into an account in the book of a depositary institution. Registered shares are shares that can only
FINANCIAL CALENDAR
Press release - 2015 first quarter results April 29, 2015(1)
Shareholders’ record date
May 14, 2015
Final date for notifying intent to participate in the Ordinary Shareholders’ Meeting May 22, 2015(1)
Ordinary Shareholders’ Meeting May 28, 2015
ADR and ordinary share dividend record date
June 3, 2015
Dividend for the financial year 2014 becomes payable to owners of ordinary shares June 4, 2015
Dividend for the financial year 2014 becomes payable to ADR holders June 9, 2015
Press release
- 2015 second quarter results July 30, 2015(1)
Press release - 2015 third quarter results October 29, 2015(1)
(1) You are kindly invited to listen to the related conference call. See www.delhaizegroup.com for further details on the conference call and the webcast.
be represented by entries into a shareholder register held by the Company. On request, shareholders may convert their shares into another form at their own expense. The ownership
of registered shares can be transferred by informing the Company and returning the certificate of record in the shareholder register to the Company.
Information
for ADR Holders
ADSs (American Depositary Shares) are traded on the New York Stock Exchange under the symbol DEG. ADSs are evidenced by American Depositary
Receipts (ADRs). As from April 7th 2014, 4 ADRs trade for 1 Delhaize Group share. The Delhaize Group ADR program is administrated by:
Citibank Shareholder
Services
P.O. Box 43077
Providence, RI 02940-3077
U.S.A.
Toll free telephone number for U.S. callers:
1-877-853-2191
International Call Number:
1-781-575-4555
E-mail: [email protected]
Website: www.citi.com/dr
Citibank has put in place an International Direct Investment Plan for
Delhaize Group, which is a dividend reinvestment and direct purchase plan sponsored and administered by Citibank. The program enables existing holders and first time purchasers the opportunity to make purchases, reinvest dividends, deposit
certificates for safekeeping and sell shares. For further information on Citibank’s International Direct Investment Program for Delhaize Group, please visit www.citi.com/dr or contact Citibank Shareholder Services at 1-877-248-4237
(1-877-CITIADR).
Taxation of Dividends of Delhaize Group Shares
It is assumed
that, for the application of domestic Belgian tax legislation and the U.S.-Belgian tax treaty, owners of Delhaize Group ADRs are treated the same as owners of Delhaize Group shares and that the ADRs are treated as Delhaize Group shares. However, it
must be noted that this assumption has not been confirmed or verified with the Belgian Tax Authorities.
For Belgian income tax purposes, the gross amount of all
distributions made by Delhaize Group to its shareholders (other than repay-
STRATEGY
€ 1.60 gross dividend for 2014
ment of paid-up capital in accordance with the Belgian Companies Code) is generally taxed as dividends. Dividends that are attributed or paid on the shares are in
principle subject to a 25% Belgian withholding tax.
For non-Belgian residents - individuals and corporations - Belgian withholding tax is retained also at the rate
of 25% subject to the reductions or exemptions provided by Belgian tax law or by the tax treaty concluded between Belgium and the country of which the non-Belgian beneficiary of the dividend is a resident. Such withholding tax is normally the final
tax in Belgium.
For dividends paid by Delhaize Group to a U.S. holder of ADRs, beneficial owner of the dividends, who is not holding the shares through a permanent
establishment in Belgium and is entitled to claim benefits under the U.S.- Belgian tax treaty, the withholding tax is reduced from 25% to 15%. If the beneficial owner is a company that owns directly at least 10% of the voting stock of Delhaize
Group, a reduced withholding tax rate of 5% is applicable. No withholding tax is however applicable if the beneficial owner of the dividends is (i) a company, resident of the U.S. that has owned directly shares representing at least 10% of the
capital of Delhaize Group for a 12-month period ending on the date the dividend is declared, or (ii) a pension fund, resident of the U.S., provided that the dividends are not derived from carrying on a business by the pension fund or through an
associated enterprise.
Although there are exceptions, in general the full 25% Belgian withholding tax must be withheld by Delhaize Group or the paying agent, and
the non-Belgian holder of Delhaize Group shares or ADRs may file a claim for reimbursement for amounts withheld in excess of the treaty rate. The reimbursement claim form (Form 276 Div.- Aut.) can be obtained from the Bureau Central de Taxation
Etranger, Boulevard du Jardin Botanique 50 (18th floor P), PO Box 3429, B-1000 Brussels, Belgium (phone: +32 2 576 90 09, fax: +32 2 579 68 42, e-mail: [email protected]). The form should be completed in duplicate and sent to the
relevant Tax Office in the residence country of the non-Belgian holder with the request that one copy be appropriately stamped and returned to the sender.
The
non-Belgian holder can then obtain reimbursement from the Bureau Central de Taxation, at the same address, upon presentation of the stamped form and a document proving that the dividend has been cashed. The request for reimbursement must be filed
with the Bureau Central de Taxation within five years from January 1 of the year following the year in which the dividend was declared payable.
Prospective
holders should consult their tax advisors as to whether they qualify for the reduced withholding tax upon attribution or payment of dividends, and as to the procedural requirements for obtaining the reduced withholding tax immediately upon the
attribution or payment of the dividends or through the filing of a claim for reimbursement.
Annual Report
This annual report is available in English, French and Dutch. It can be downloaded from Delhaize Group’s website: www.delhaizegroup.com.
Delhaize Group is subject to the reporting requirements of the U.S. Securities and Exchange Commission (SEC) governing foreign companies listed in the U.S. An annual report will be
filed with the SEC on Form 20-F. The Form
20-F will be available from the SEC’s EDGAR database at www.sec.gov/edgarhp.htm and on the Company’s website.
Consultation of Documents
The public documents concerning Delhaize Group can
be consulted at the registered office (rue Osseghem/Osseghemtraat 53, 1080 Brussels - Belgium) or at the Group Support Office (Square Marie Curie 40, 1070 Brussels - Belgium).
In the United States, Delhaize Group is subject to the informational requirements of the U.S. Securities Exchange Act of 1934, as amended (the “Exchange Act”), and in
accordance with the Exchange Act Delhaize Group files reports and other information with the SEC. The reports and other information Delhaize Group files with the SEC can be inspected at the SEC’s public reference room located at 100 F Street,
N.E., Washington, D.C., U.S. 20549. You may obtain information on the operation of the SEC’s public reference room by calling the SEC at +1 (800) SEC-0330. Also, the SEC maintains a website at www.sec.gov that contains reports and other
information that registrants have filed electronically with the SEC.
Delhaize Group makes available free of charge, through the shareholder information section of
Delhaize Group’s website (www.delhaizegroup.com), the Company’s reports filed electronically with the SEC pursuant to the Exchange Act as soon as reasonably practicable after the Company electronically files such material with the SEC.
Delhaize Group’s reports and other information can also be inspected and copied at the offices of the New York Stock Exchange, Inc.,
20 Broad Street, New York, NY 10005, U.S.A.
Ordinary Shareholders’ Meeting
The next Ordinary Shareholders’ Meeting will take place on Thursday, May 28, 2015. Detailed information about the Ordinary Shareholders’ Meeting will be published in
the Belgian newspapers L’Echo and De Tijd, as well as in the Belgian Official Gazette and on the Company website.
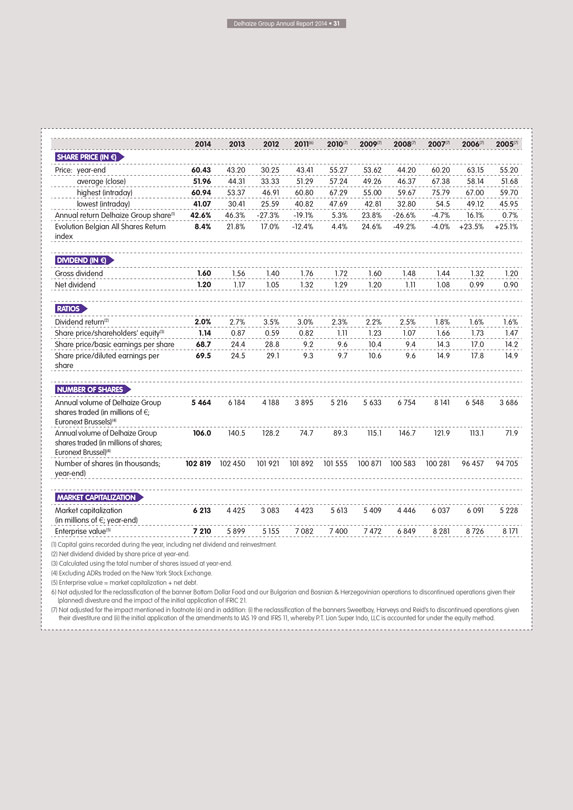
Delhaize Group Annual Report 2014 • 31
2014
2013 2012 2011(6) 2010(7) 2009(7) 2008(7) 2007(7) 2006(7) 2005(7)
SHARE PRICE (IN €)
Price: year-end 60.43 43.20 30.25 43.41 55.27 53.62 44.20 60.20 63.15 55.20
average (close)
51.96 44.31 33.33 51.29 57.24 49.26 46.37 67.38 58.14 51.68
highest (intraday) 60.94 53.37 46.91 60.80 67.29 55.00 59.67 75.79 67.00 59.70
lowest (intraday) 41.07 30.41 25.59 40.82 47.69 42.81 32.80 54.5 49.12 45.95
Annual return
Delhaize Group share(1) 42.6% 46.3% -27.3% -19.1% 5.3% 23.8% -26.6% -4.7% 16.1% 0.7%
Evolution Belgian All Shares Return index 8.4% 21.8% 17.0% -12.4% 4.4% 24.6%
-49.2% -4.0% +23.5% +25.1%
DIVIDEND (IN €)
Gross dividend 1.60 1.56 1.40
1.76 1.72 1.60 1.48 1.44 1.32 1.20
Net dividend 1.20 1.17 1.05 1.32 1.29 1.20 1.11 1.08 0.99 0.90
RATIOS
Dividend return(2) 2.0% 2.7% 3.5% 3.0% 2.3% 2.2% 2.5% 1.8% 1.6% 1.6%
Share price/shareholders’ equity(3) 1.14 0.87 0.59 0.82 1.11 1.23 1.07 1.66 1.73 1.47
Share price/basic earnings per share 68.7 24.4 28.8 9.2 9.6 10.4 9.4 14.3 17.0 14.2
Share price/diluted earnings per share 69.5 24.5 29.1 9.3 9.7 10.6 9.6 14.9 17.8 14.9
NUMBER
OF SHARES
Annual volume of Delhaize Group shares traded (in millions of €; Euronext Brussels)(4) 5 464 6 184 4 188 3 895 5 216 5 633 6 754 8 141 6 548 3 686
Annual volume of Delhaize Group shares traded (in millions of shares; Euronext Brussel)(4) 106.0 140.5 128.2 74.7 89.3 115.1 146.7 121.9 113.1 71.9
Number of shares (in thousands; year-end) 102 819 102 450 101 921 101 892 101 555 100 871 100 583 100 281 96 457 94 705
MARKET CAPITALIZATION
Market capitalization (in millions of €; year-end) 6 213 4 425 3
083 4 423 5 613 5 409 4 446 6 037 6 091 5 228
Enterprise value(5) 7 210 5 899 5 155 7 082 7 400 7 472 6 849 8 281 8 726 8 171
(1) Capital gains recorded during the year, including net dividend and reinvestment.
(2) Net
dividend divided by share price at year-end.
(3) Calculated using the total number of shares issued at year-end.
(4) Excluding ADRs traded on the New York Stock Exchange.
(5) Enterprise value = market
capitalization + net debt.
6) Not adjusted for the reclassification of the banner Bottom Dollar Food and our Bulgarian and Bosnian & Herzegovinian
operations to discontinued operations given their (planned) divesture and the impact of the initial application of IFRIC 21.
(7) Not adjusted for the impact
mentioned in footnote (6) and in addition: (i) the reclassification of the banners Sweetbay, Harveys and Reid’s to discontinued operations given their divestiture and (ii) the initial application of the amendments to IAS 19 and
IFRS 11, whereby P.T. Lion Super Indo, LLC is accounted for under the equity method.
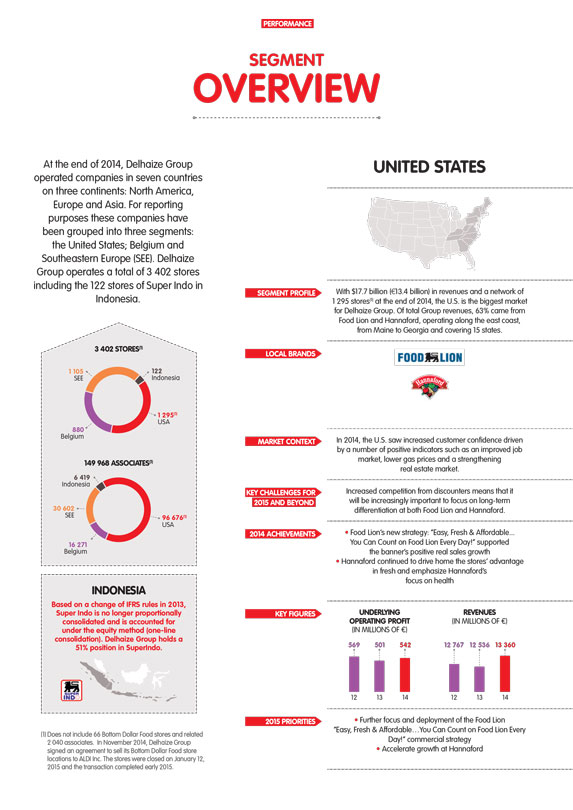
PERFORMANCE
SEGMENT
OVERVIEW
At the end of 2014, Delhaize Group operated companies in seven countries on three
continents: North America, Europe and Asia. For reporting purposes these companies have been grouped into three segments: the United States; Belgium and Southeastern Europe (SEE). Delhaize Group operates a total of 3 402 stores including the 122
stores of Super Indo in Indonesia.
3 402 STORES(1) 1 105 SEE 122 Indonesia 1 295(1) USA 880 Belgium
149 968 ASSOCIATES(1) 6 419 Indonesia 30 602 SEE 96 676(1) USA 16 271 Belgium
INDONESIA
Based on a change of IFRS rules in 2013, Super Indo is no longer proportionally consolidated and is accounted for under the equity method (one-line consolidation).
Delhaize Group holds a 51% position in SuperIndo.
(1) Does not include 66 Bottom Dollar Food stores and related 2 040 associates. In November 2014, Delhaize Group
signed an agreement to sell its Bottom Dollar Food store locations to ALDI Inc. The stores were closed on January 12, 2015 and the transaction completed early 2015.
UNITED STATES
SEGMENT PROFILE
With $17.7 billion (€13.4 billion) in revenues and a network of 1 295 stores(1) at the end of 2014, the U.S. is the biggest market for Delhaize Group. Of total Group revenues,
63% came from Food Lion and Hannaford, operating along the east coast, from Maine to Georgia and covering 15 states.
LOCAL BRANDS
MARKET CONTEXT
In 2014, the U.S. saw increased customer confidence driven by a number of
positive indicators such as an improved job market, lower gas prices and a strengthening real estate market.
KEY CHALLENGES FOR 2015 AND BEYOND
Increased competition from discounters means that it will be increasingly important to focus on long-term differentiation at both Food Lion and Hannaford.
2014 ACHIEVEMENTS
Food Lion’s new strategy: “Easy, Fresh & Affordable… You
Can Count on Food Lion Every Day!” supported the banner’s positive real sales growth
Hannaford continued to drive home the stores’ advantage in
fresh and emphasize Hannaford’s focus on health
KEY FIGURES
UNDERLYING
OPERATING PROFIT (IN MILLIONS OF €)
569 501 542 12 13 14
REVENUES (IN
MILLIONS OF €)
12 767 12 536 13 360 12 13 14
2015 PRIORITIES
Further focus and deployment of the Food Lion
“Easy, Fresh & Affordable…You Can
Count on Food Lion Every Day!” commercial strategy
Accelerate growth at Hannaford
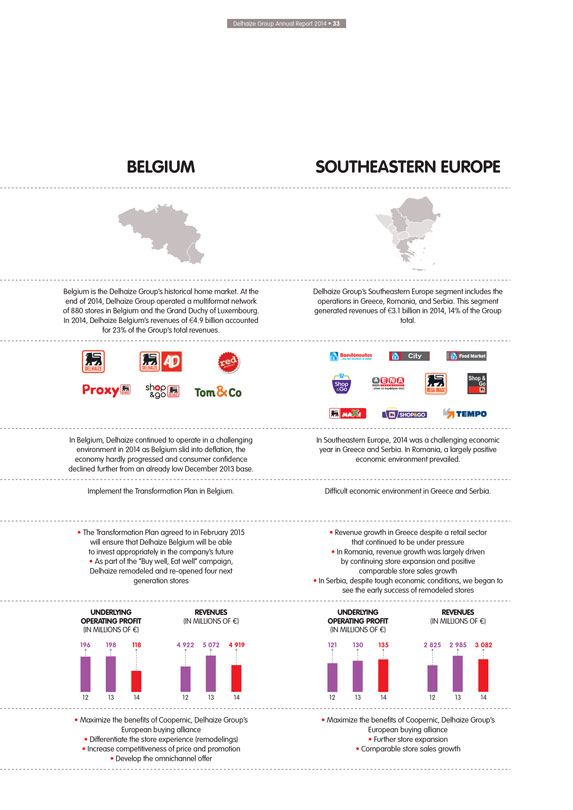
Delhaize Group Annual Report 2014 • 33
BELGIUM
Belgium is the Delhaize Group’s historical home market. At the
end of 2014, Delhaize Group operated a multiformat network of 880 stores in Belgium and the Grand Duchy of Luxembourg. In 2014, Delhaize Belgium’s revenues of €4.9 billion accounted for 23% of the Group’s total revenues.
In Belgium, Delhaize continued to operate in a challenging environment in 2014 as Belgium slid into deflation, the economy hardly progressed and consumer confidence declined
further from an already low December 2013 base.
Implement the Transformation Plan in Belgium.
The Transformation Plan agreed to in February 2015 will ensure that Delhaize Belgium will be able to invest appropriately in the company’s future
As part of the “Buy well, Eat well” campaign, Delhaize remodeled and re-opened four next generation stores
UNDERLYING OPERATING PROFIT (IN MILLIONS OF €) 196 198 118 12 13 14
REVENUES (IN MILLIONS
OF €) 4 922 5 072 4 919 12 13 14
Maximize the benefits of Coopernic, Delhaize Group’s European buying alliance
Differentiate the store experience (remodelings)
Increase competitiveness of price and
promotion
Develop the omnichannel offer
SOUTHEASTERN EUROPE
Delhaize Group’s Southeastern Europe segment includes the operations in Greece, Romania, and Serbia. This segment generated revenues of €3.1 billion in 2014, 14% of the
Group total.
In Southeastern Europe, 2014 was a challenging economic year in Greece and Serbia. In Romania, a largely positive economic environment prevailed.
Difficult economic environment in Greece and Serbia.
Revenue growth in Greece
despite a retail sector that continued to be under pressure
In Romania, revenue growth was largely driven by continuing store expansion and positive comparable
store sales growth
In Serbia, despite tough economic conditions, we began to see the early success of remodeled stores
UNDERLYING OPERATING PROFIT (IN MILLIONS OF €)121 130 135 12 13 14
REVENUES (IN MILLIONS
OF €) 2 825 2 985 3 082 12 13 14
Maximize the benefits of Coopernic, Delhaize Group’s European buying alliance
Further store expansion
Comparable store sales growth
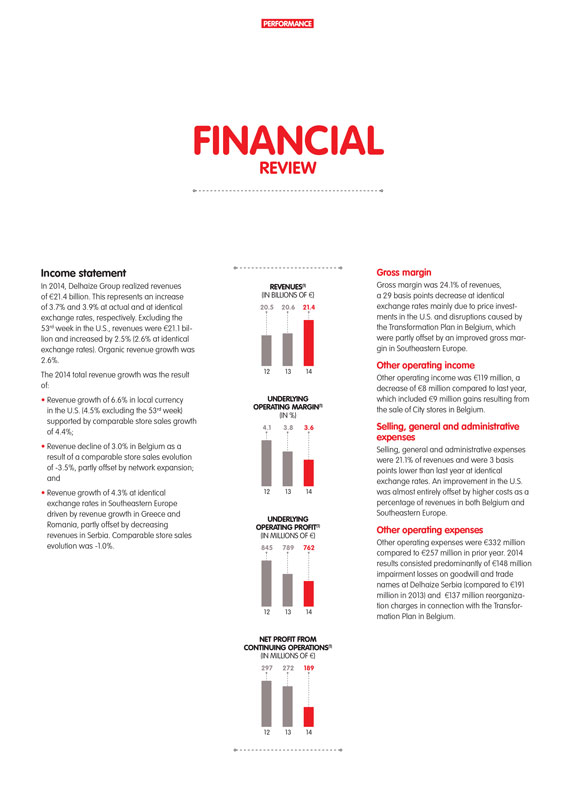
PERFORMANCE
FINANCIAL
REVIEW
Income statement
In 2014, Delhaize Group realized revenues of €21.4 billion. This represents an increase of 3.7% and 3.9% at actual and at identical exchange rates, respectively. Excluding the
53rd week in the U.S., revenues were €21.1 billion and increased by 2.5% (2.6% at identical exchange rates). Organic revenue growth was 2.6%.
The 2014 total
revenue growth was the result of:
Revenue growth of 6.6% in local currency in the U.S. (4.5% excluding the 53rd week) supported by comparable store sales growth of
4.4%;
Revenue decline of 3.0% in Belgium as a result of a comparable store sales evolution of -3.5%, partly offset by network expansion; and
Revenue growth of 4.3% at identical exchange rates in Southeastern Europe driven by revenue growth in Greece and Romania, partly offset by decreasing revenues in Serbia. Comparable
store sales evolution was -1.0%.
REVENUES(1) (IN BILLIONS OF €) 20.5 20.6 21.4 12 13 14
UNDERLYING OPERATING MARGIN(1) (IN %) 4.1 3.8 3.6 12 13 14
UNDERLYING OPERATING PROFIT(1) (IN
MILLIONS OF €) 845 789 762 12 13 14
NET PROFIT FROM CONTINUING OPERATIONS(1) (IN MILLIONS OF €) 297 272 189 12 13 14
Gross margin
Gross margin was 24.1% of revenues, a 29 basis points decrease at identical
exchange rates mainly due to price investments in the U.S. and disruptions caused by the Transformation Plan in Belgium, which were partly offset by an improved gross margin in Southeastern Europe.
Other operating income
Other operating income was €119 million, a decrease of
€8 million compared to last year, which included €9 million gains resulting from the sale of City stores in Belgium.
Selling, general and
administrative expenses
Selling, general and administrative expenses were 21.1% of revenues and were 3 basis points lower than last year at identical exchange
rates. An improvement in the U.S. was almost entirely offset by higher costs as a percentage of revenues in both Belgium and Southeastern Europe.
Other operating
expenses
Other operating expenses were €332 million compared to €257 million in prior year. 2014 results consisted predominantly of
€148 million impairment losses on goodwill and trade names at Delhaize Serbia (compared to €191 million in 2013) and €137 million reorganization charges in connection with the Transformation Plan in Belgium.
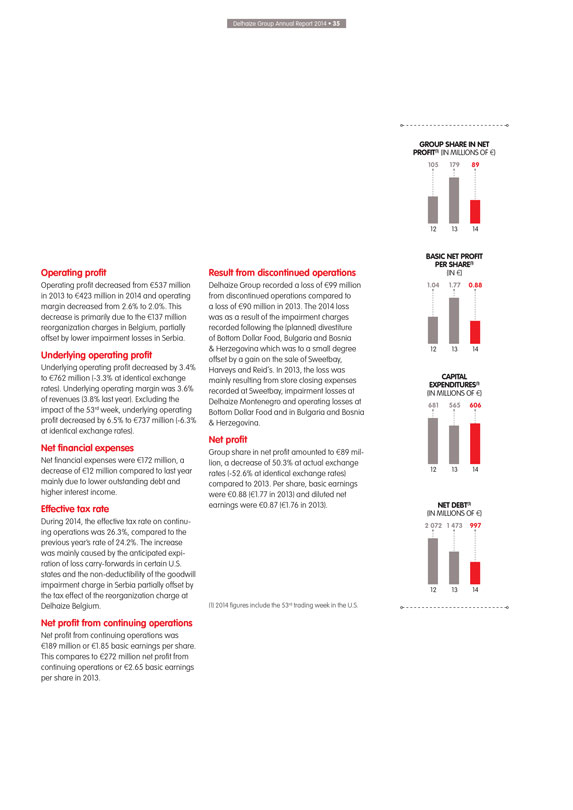
Delhaize Group Annual Report 2014 • 35
Operating profit
Operating profit decreased from €537 million in
2013 to €423 million in 2014 and operating margin decreased from 2.6% to 2.0%. This decrease is primarily due to the €137 million reorganization charges in Belgium, partially offset by lower impairment losses in Serbia.
Underlying operating profit
Underlying operating profit decreased by 3.4% to
€762 million (-3.3% at identical exchange rates). Underlying operating margin was 3.6% of revenues (3.8% last year). Excluding the impact of the 53rd week, underlying operating profit decreased by 6.5% to €737 million (-6.3% at
identical exchange rates).
Net financial expenses
Net financial expenses were
€172 million, a decrease of €12 million compared to last year mainly due to lower outstanding debt and higher interest income.
Effective tax
rate
During 2014, the effective tax rate on continuing operations was 26.3%, compared to the previous year’s rate of 24.2%. The increase was mainly caused by
the anticipated expiration of loss carry-forwards in certain U.S. states and the non-deductibility of the goodwill impairment charge in Serbia partially offset by the tax effect of the reorganization charge at Delhaize Belgium.
Net profit from continuing operations
Net profit from continuing operations was
€189 million or €1.85 basic earnings per share. This compares to €272 million net profit from continuing operations or €2.65 basic earnings per share in 2013.
Result from discontinued operations
Delhaize Group recorded a loss of €99 million
from discontinued operations compared to a loss of €90 million in 2013. The 2014 loss was as a result of the impairment charges recorded following the (planned) divestiture of Bottom Dollar Food, Bulgaria and Bosnia
& Herzegovina which was to a small degree offset by a gain on the sale of Sweetbay, Harveys and Reid’s. In 2013, the loss was mainly resulting from store closing expenses
recorded at Sweetbay, impairment losses at Delhaize Montenegro and operating losses at Bottom Dollar Food and in Bulgaria and Bosnia & Herzegovina.
Net profit
Group share in net profit amounted to €89 million, a decrease of 50.3% at actual exchange rates (-52.6% at identical exchange rates) compared to 2013.
Per share, basic earnings were €0.88 (€1.77 in 2013) and diluted net earnings were €0.87 (€1.76 in 2013).
(1) 2014 figures include the 53rd
trading week in the U.S.
GROUP SHARE IN NET PROFIT(1) (IN MILLIONS OF €) 105 179 89 12 13 14
BASIC NET PROFIT PER SHARE(1) (IN €) 1.04 1.77 0.88 12 13 14
CAPITAL EXPENDITURES(1) (IN
MILLIONS OF €) 681 565 606 12 13 14
NET DEBT(1) (IN MILLIONS OF €) 2 072 1 473 997 12 13 14
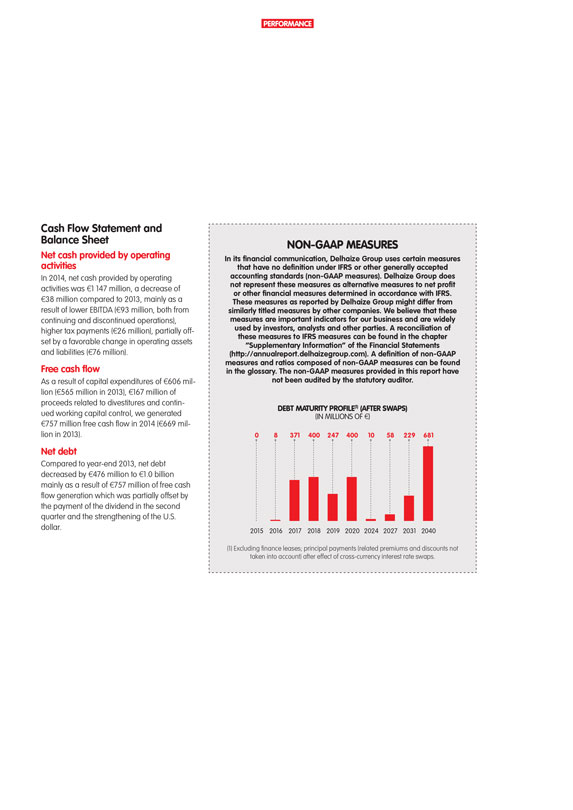
PERFORMANCE
Cash Flow Statement and Balance Sheet
Net cash provided by operating activities
In 2014, net cash provided by
operating activities was €1 147 million, a decrease of €38 million compared to 2013, mainly as a result of lower EBITDA (€93 million, both from continuing and discontinued operations), higher tax payments (€26 million),
partially offset by a favorable change in operating assets and liabilities (€76 million).
Free cash flow
As a result of capital expenditures of €606 million (€565 million in 2013), €167 million of proceeds related to divestitures and continued working capital
control, we generated €757 million free cash flow in 2014 (€669 million in 2013).
Net debt
Compared to year-end 2013, net debt decreased by €476 million to €1.0 billion mainly as a result of €757 million of free cash flow generation which was
partially offset by the payment of the dividend in the second quarter and the strengthening of the U.S. dollar.
NON-GAAP MEASURES
In its financial communication, Delhaize Group uses certain measures that have no definition under IFRS or other generally accepted accounting standards (non-GAAP measures).
Delhaize Group does not represent these measures as alternative measures to net profit or other financial measures determined in accordance with IFRS.
These
measures as reported by Delhaize Group might differ from similarly titled measures by other companies. We believe that these measures are important indicators for our business and are widely used by investors, analysts and other parties. A
reconciliation of these measures to IFRS measures can be found in the chapter “Supplementary Information” of the Financial Statements (http://annualreport.delhaizegroup.com). A definition of non-GAAP measures and ratios composed of
non-GAAP measures can be found in the glossary. The non-GAAP measures provided in this report have not been audited by the statutory auditor.
DEBT MATURITY
PROFILE(1) (AFTER SWAPS) (IN MILLIONS OF €) 0 8 371 400 247 400 10 58 229 681 2015 2016 2017 2018 2019 2020 2024 2027 2031 2040
(1) Excluding finance leases;
principal payments (related premiums and discounts not taken into account) after effect of cross-currency interest rate swaps.
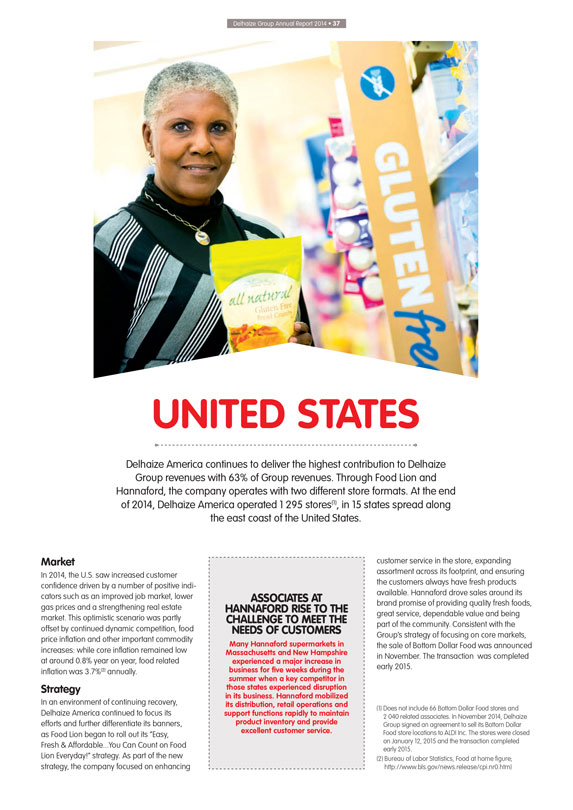
Delhaize Group Annual Report 2014 • 37
UNITED
STATES
Delhaize America continues to deliver the highest contribution to Delhaize Group revenues with 63% of Group revenues. Through Food Lion and Hannaford, the
company operates with two different store formats. At the end of 2014, Delhaize America operated 1 295 stores(1), in 15 states spread along the east coast of the United States.
Market
In 2014, the U.S. saw increased customer confidence driven by a number of positive
indicators such as an improved job market, lower gas prices and a strengthening real estate market. This optimistic scenario was partly offset by continued dynamic competition, food price inflation and other important commodity increases: while core
inflation remained low at around 0.8% year on year, food related inflation was 3.7%(2) annually.
Strategy
In an environment of continuing recovery, Delhaize America continued to focus its efforts and further differentiate its banners, as Food Lion began to roll out its “Easy,
Fresh & Affordable...You Can Count on Food Lion Everyday!” strategy. As part of the new strategy, the company focused on enhancing
ASSOCIATES AT HANNAFORD
RISE TO THE CHALLENGE TO MEET THE NEEDS OF CUSTOMERS
Many Hannaford supermarkets in Massachusetts and New Hampshire experienced a major increase in business for
five weeks during the summer when a key competitor in those states experienced disruption in its business. Hannaford mobilized its distribution, retail operations and support functions rapidly to maintain product inventory and provide excellent
customer service.
customer service in the store, expanding assortment across its footprint, and ensuring the customers always have fresh products available.
Hannaford drove sales around its brand promise of providing quality fresh foods, great service, dependable value and being part of the community. Consistent with the Group’s strategy of focusing on core markets, the sale of Bottom Dollar Food
was announced in November. The transaction was completed early 2015.
(1) Does not include 66 Bottom Dollar Food stores and 2 040 related associates. In November
2014, Delhaize Group signed an agreement to sell its Bottom Dollar Food store locations to ALDI Inc. The stores were closed on January 12, 2015 and the transaction completed early 2015.
(2) Bureau of Labor Statistics, Food at home figure; http://www.bls.gov/news.release/cpi.nr0.htm)
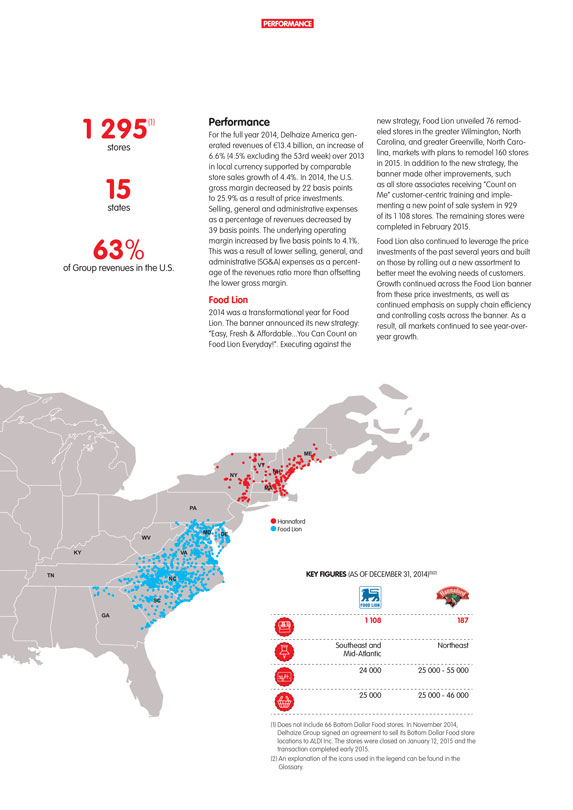
PERFORMANCE
1 295(1)
stores
15
states
63%
of Group revenues in the U.S.
Performance
For the full year 2014, Delhaize America generated revenues of €13.4 billion, an increase of 6.6% (4.5% excluding the 53rd week) over 2013 in local currency supported by
comparable store sales growth of 4.4%. In 2014, the U.S. gross margin decreased by 22 basis points to 25.9% as a result of price investments. Selling, general and administrative expenses as a percentage of revenues decreased by 39 basis points. The
underlying operating margin increased by five basis points to 4.1%. This was a result of lower selling, general, and administrative (SG&A) expenses as a percentage of the revenues ratio more than offsetting the lower gross margin.
Food Lion
2014 was a transformational year for Food Lion. The banner announced its new
strategy: “Easy, Fresh & Affordable...You Can Count on Food Lion Everyday!”. Executing against the new strategy, Food Lion unveiled 76 remodeled stores in the greater Wilmington, North Carolina, and greater Greenville, North Carolina,
markets with plans to remodel 160 stores in 2015. In addition to the new strategy, the banner made other improvements, such as all store associates receiving “Count on Me” customer-centric training and implementing a new point of sale
system in 929 of its 1 108 stores. The remaining stores were completed in February 2015.
Food Lion also continued to leverage the price investments of the past
several years and built on those by rolling out a new assortment to better meet the evolving needs of customers. Growth continued across the Food Lion banner from these price investments, as well as continued emphasis on supply chain efficiency and
controlling costs across the banner. As a result, all markets continued to see year-over-year growth.
TN KY GA WV SC NC VA PA MD DE NY VT MA NH ME
Hannaford
Food Lion
KEY FIGURES (AS OF DECEMBER 31, 2014)(1)(2)
FOOD LION Hannaford
1 108 187
Southeast and Mid-Atlantic Northeast
sq.ft. 24 000 25 000 - 55 000
25 000 25 000 - 46 000
(1) Does not include 66 Bottom Dollar Food stores. In November 2014, Delhaize Group signed an agreement to sell its Bottom Dollar Food store locations to ALDI Inc. The stores were
closed on January 12, 2015 and the transaction completed early 2015.
(2) An explanation of the icons used in the legend can be found in the Glossary.
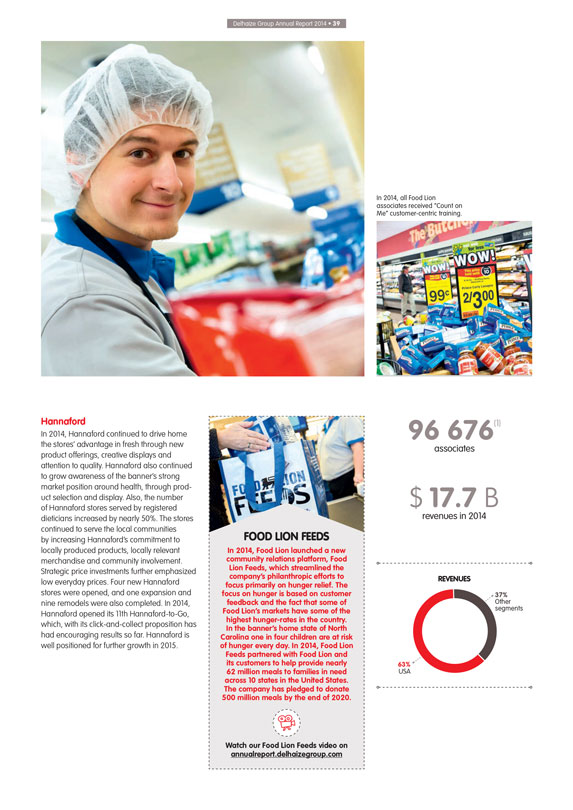
Delhaize Group Annual Report 2014 • 39
In
2014, all Food Lion associates received “Count on Me” customer-centric training.
Hannaford
In 2014, Hannaford continued to drive home the stores’ advantage in fresh through new product offerings, creative displays and attention to quality. Hannaford also continued
to grow awareness of the banner’s strong market position around health, through product selection and display. Also, the number of Hannaford stores served by registered dieticians increased by nearly 50%. The stores continued to serve the local
communities by increasing Hannaford’s commitment to locally produced products, locally relevant merchandise and community involvement. Strategic price investments further emphasized low everyday prices. Four new Hannaford stores were opened,
and one expansion and nine remodels were also completed. In 2014, Hannaford opened its 11th Hannaford-to-Go, which, with its click-and-collect proposition has had encouraging results so far. Hannaford is well positioned for further growth in 2015.
FOOD LION FEEDS
In 2014, Food Lion launched a new community relations
platform, Food Lion Feeds, which streamlined the company’s philanthropic efforts to focus primarily on hunger relief. The focus on hunger is based on customer feedback and the fact that some of Food Lion’s markets have some of the highest
hunger-rates in the country.
In the banner’s home state of North Carolina one in four children are at risk of hunger every day. In 2014, Food Lion Feeds
partnered with Food Lion and its customers to help provide nearly 62 million meals to families in need across 10 states in the United States.
The company has
pledged to donate 500 million meals by the end of 2020.
Watch our Food Lion Feeds video on annualreport.delhaizegroup.com
96 676(1)
associates
$ 17.7 B
revenues in 2014
REVENUES
37%
Other
segments
63%
USA
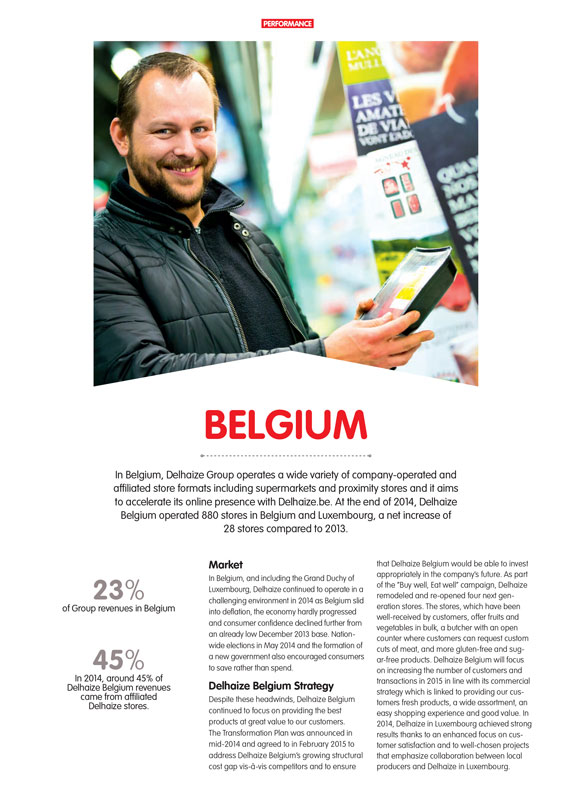
PERFORMANCE
BELGIUM
In Belgium, Delhaize Group operates a wide variety of company-operated and affiliated store formats including supermarkets and proximity stores and it aims to accelerate its online
presence with Delhaize.be. At the end of 2014, Delhaize Belgium operated 880 stores in Belgium and Luxembourg, a net increase of 28 stores compared to 2013.
23%
of Group revenues in Belgium
45%
In 2014, around 45% of Delhaize Belgium revenues came from affiliated Delhaize stores.
Market
In Belgium, and including the Grand Duchy of Luxembourg, Delhaize continued to operate in a challenging environment in 2014 as Belgium slid into deflation, the
economy hardly progressed and consumer confidence declined further from an already low December 2013 base. Nationwide elections in May 2014 and the formation of a new government also encouraged consumers to save rather than spend.
Delhaize Belgium Strategy
Despite these headwinds, Delhaize Belgium continued to focus on
providing the best products at great value to our customers. The Transformation Plan was announced in mid-2014 and agreed to in February 2015 to address Delhaize Belgium’s growing structural cost gap vis-à-vis competitors and to ensure
that Delhaize Belgium would be able to invest appropriately in the company’s future. As part of the “Buy well, Eat well” campaign, Delhaize remodeled and re-opened four next generation stores. The stores, which have been well-received
by customers, offer fruits and vegetables in bulk, a butcher with an open counter where customers can request custom cuts of meat, and more gluten-free and sugar-free products. Delhaize Belgium will focus on increasing the number of customers and
transactions in 2015 in line with its commercial strategy which is linked to providing our customers fresh products, a wide assortment, an easy shopping experience and good value. In 2014, Delhaize in Luxembourg achieved strong results thanks to an
enhanced focus on customer satisfaction and to well-chosen projects that emphasize collaboration between local producers and Delhaize in Luxembourg.
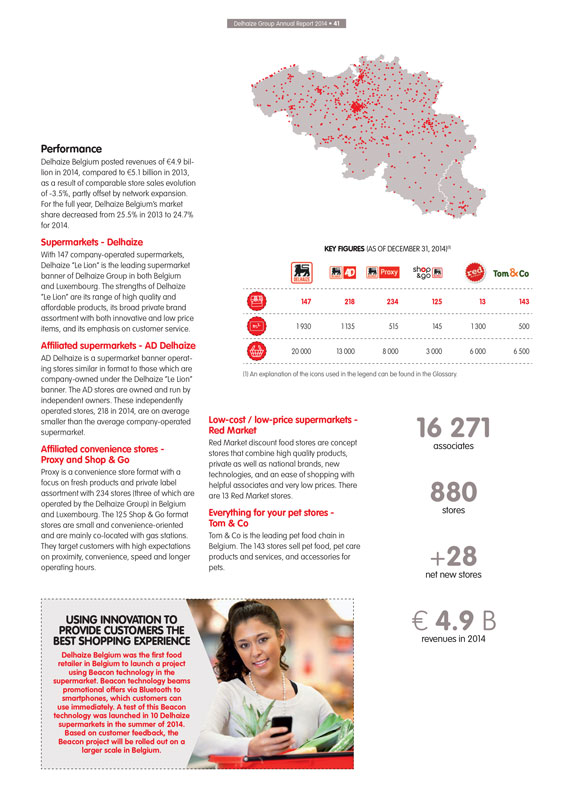
Delhaize Group Annual Report 2014 • 41
Performance
Delhaize Belgium posted revenues of €4.9 billion in 2014,
compared to €5.1 billion in 2013, as a result of comparable store sales evolution of -3.5%, partly offset by network expansion. For the full year, Delhaize Belgium’s market share decreased from 25.5% in 2013 to 24.7% for 2014.
Supermarkets - Delhaize
With 147 company-operated supermarkets, Delhaize “Le Lion”
is the leading supermarket banner of Delhaize Group in both Belgium and Luxembourg. The strengths of Delhaize “Le Lion” are its range of high quality and affordable products, its broad private brand assortment with both innovative and low
price items, and its emphasis on customer service.
Affiliated supermarkets - AD Delhaize
AD Delhaize is a supermarket banner operating stores similar in format to those which are company-owned under the Delhaize “Le Lion” banner. The AD stores are owned and
run by independent owners. These independently operated stores, 218 in 2014, are on average smaller than the average company-operated supermarket.
Affiliated
convenience stores - Proxy and Shop & Go
Proxy is a convenience store format with a focus on fresh products and private label assortment with 234 stores (three
of which are operated by the Delhaize Group) in Belgium and Luxembourg. The 125 Shop & Go format stores are small and convenience-oriented and are mainly co-located with gas stations. They target customers with high expectations on proximity,
convenience, speed and longer operating hours.
KEY FIGURES (AS OF DECEMBER 31, 2014)(1)
DELHAIZE Proxy shop&go DELHAIZE red Tom&Co
147 218 234 125 13 143
m2 1 930 1 135 515 145 1 300 500
20 000 13 000 8 000 3 000 6 000 6 500
(1) An explanation of the icons used in the legend can be found in the Glossary.
Low-cost /
low-price supermarkets - Red Market
Red Market discount food stores are concept stores that combine high quality products, private as well as national brands, new
technologies, and an ease of shopping with helpful associates and very low prices. There are 13 Red Market stores.
Everything for your pet stores - Tom & Co
Tom & Co is the leading pet food chain in Belgium. The 143 stores sell pet food, pet care products and services, and accessories for pets.
16 271
associates
880
stores
+28
net new stores
€ 4.9 B
revenues in 2014
USING INNOVATION TO PROVIDE CUSTOMERS THE BEST SHOPPING EXPERIENCE
Delhaize Belgium was the
first food retailer in Belgium to launch a project using Beacon technology in the supermarket. Beacon technology beams promotional offers via Bluetooth to smartphones, which customers can use immediately. A test of this Beacon technology was
launched in 10 Delhaize supermarkets in the summer of 2014. Based on customer feedback, the Beacon project will be rolled out on a larger scale in Belgium.
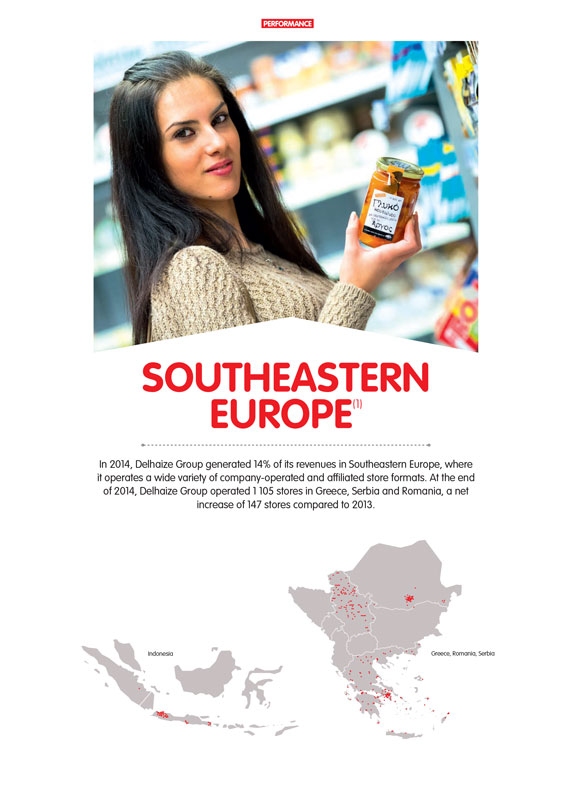
PERFORMANCE
SOUTHEASTERN EUROPE(1)
In 2014, Delhaize Group generated 14% of its revenues in Southeastern Europe, where it operates a wide variety of company-operated and affiliated store formats. At the end of 2014,
Delhaize Group operated 1 105 stores in Greece, Serbia and Romania, a net increase of 147 stores compared to 2013.
Indonesia Greece, Romania, Serbia
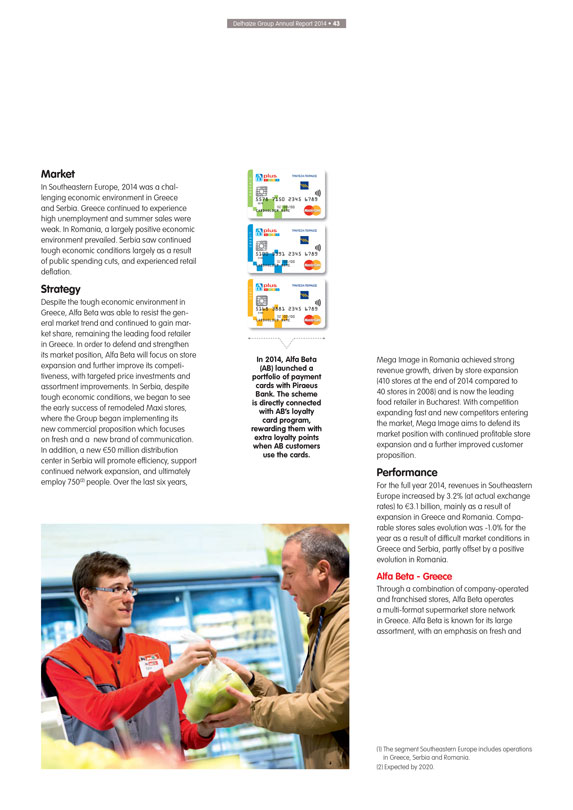
Delhaize Group Annual Report 2014 • 43
Market
In Southeastern Europe, 2014 was a challenging economic environment in Greece and Serbia. Greece continued to experience high unemployment and summer sales were
weak. In Romania, a largely positive economic environment prevailed. Serbia saw continued tough economic conditions largely as a result of public spending cuts, and experienced retail deflation.
Strategy
Despite the tough economic environment in Greece, Alfa Beta was able to resist the
general market trend and continued to gain market share, remaining the leading food retailer in Greece. In order to defend and strengthen its market position, Alfa Beta will focus on store expansion and further improve its competitiveness, with
targeted price investments and assortment improvements. In Serbia, despite tough economic conditions, we began to see the early success of remodeled Maxi stores, where the Group began implementing its new commercial proposition which focuses on
fresh and a new brand of communication. In addition, a new €50 million distribution center in Serbia will promote efficiency, support continued network expansion, and ultimately employ 750(2) people. Over the last six years,
PREPAID AB Plus TPANEZA 5578 7150 2345 6789 5578 VALID THRU 00/00 CARDHOLDER NAME MasterCard
CREDIT AB Plus TPANEZA 5100 5391 2345 6789 5100 VALID THRU 00/00 CARDHOLDER NAME MasterCard
DEBIT AB Plus TPANEZA 5168 3881 2345 6789 5168 VALID THRU 00/00 CARDHOLDER NAME MasterCard
In
2014, Alfa Beta (AB) launched a portfolio of payment cards with Piraeus Bank. The scheme is directly connected with AB’s loyalty card program, rewarding them with extra loyalty points when AB customers use the cards.
Mega Image in Romania achieved strong revenue growth, driven by store expansion (410 stores at the end of 2014 compared to 40 stores in 2008) and is now the leading food retailer
in Bucharest. With competition expanding fast and new competitors entering the market, Mega Image aims to defend its market position with continued profitable store expansion and a further improved customer proposition.
Performance
For the full year 2014, revenues in Southeastern Europe increased by 3.2% (at
actual exchange rates) to €3.1 billion, mainly as a result of expansion in Greece and Romania. Comparable stores sales evolution was -1.0% for the year as a result of difficult market conditions in Greece and Serbia, partly offset by a positive
evolution in Romania.
Alfa Beta - Greece
Through a combination of
company-operated and franchised stores, Alfa Beta operates a multi-format supermarket store network in Greece. Alfa Beta is known for its large assortment, with an emphasis on fresh and
(1) The segment Southeastern Europe includes operations in Greece, Serbia and Romania.
(2)
Expected by 2020.
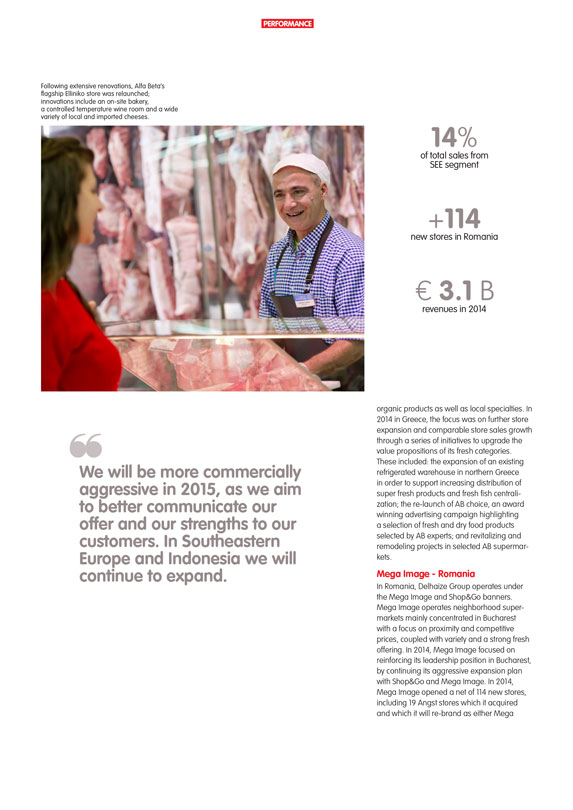
PERFORMANCE
Following extensive renovations, Alfa
Beta’s flagship Elliniko store was relaunched; innovations include an on-site bakery, a controlled temperature wine room and a wide variety of local and imported cheeses.
14%
of total sales from SEE segment
+114
new stores in Romania
€ 3.1 B
revenues in 2014
“We will be more commercially aggressive in 2015, as we aim to better communicate our offer and our strengths to our customers. In Southeastern Europe and Indonesia we will
continue to expand.
organic products as well as local specialties. In 2014 in Greece, the focus was on further store expansion and comparable store sales growth
through a series of initiatives to upgrade the value propositions of its fresh categories. These included: the expansion of an existing refrigerated warehouse in northern Greece in order to support increasing distribution of super fresh products and
fresh fish centralization; the re-launch of AB choice, an award winning advertising campaign highlighting a selection of fresh and dry food products selected by AB experts; and revitalizing and remodeling projects in selected AB supermarkets.
Mega Image - Romania
In Romania, Delhaize Group operates under the Mega Image
and Shop&Go banners. Mega Image operates neighborhood supermarkets mainly concentrated in Bucharest with a focus on proximity and competitive prices, coupled with variety and a strong fresh offering. In 2014, Mega Image focused on reinforcing
its leadership position in Bucharest, by continuing its aggressive expansion plan with Shop&Go and Mega Image. In 2014, Mega Image opened a net of 114 new stores, including 19 Angst stores which it acquired and which it will re-brand as either
Mega
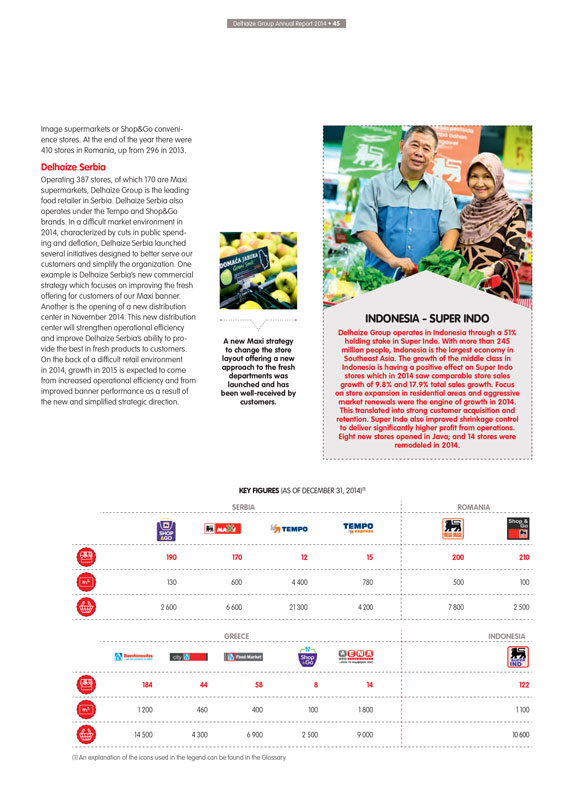
Delhaize Group Annual Report 2014 • 45
Image
supermarkets or Shop&Go convenience stores. At the end of the year there were 410 stores in Romania, up from 296 in 2013.
Delhaize Serbia
Operating 387 stores, of which 170 are Maxi supermarkets, Delhaize Group is the leading food retailer in Serbia. Delhaize Serbia also operates under the Tempo and Shop&Go
brands. In a difficult market environment in 2014, characterized by cuts in public spending and deflation, Delhaize Serbia launched several initiatives designed to better serve our customers and simplify the organization. One example is Delhaize
Serbia’s new commercial strategy which focuses on improving the fresh offering for customers of our Maxi banner. Another is the opening of a new distribution center in November 2014. This new distribution center will strengthen operational
efficiency and improve Delhaize Serbia’s ability to provide the best in fresh products to customers. On the back of a difficult retail environment in 2014, growth in 2015 is expected to come from increased operational efficiency and from
improved banner performance as a result of the new and simplified strategic direction.
A new Maxi strategy to change the store layout offering a new approach to
the fresh departments was launched and has been well-received by customers.
INDONESIA - SUPER INDO
Delhaize Group operates in Indonesia through a 51% holding stake in Super Indo. With more than 245 million people, Indonesia is the largest economy in Southeast Asia. The growth of
the middle class in Indonesia is having a positive effect on Super Indo stores which in 2014 saw comparable store sales growth of 9.8% and 17.9% total sales growth. Focus on store expansion in residential areas and aggressive market renewals were
the engine of growth in 2014.
This translated into strong customer acquisition and retention. Super Indo also improved shrinkage control to deliver significantly
higher profit from operations. Eight new stores opened in Java; and 14 stores were remodeled in 2014.
KEY FIGURES (AS OF DECEMBER 31, 2014)(1)
SERBIA ROMANIA
190 170 12 15 200 210
m2 130 600 4 400 780 500 100
2 600 6 600 21 300 4 200 7 800 2 500
GREECE INDONESIA
184 44 58 8 14 122
m2 1 200 460 400 100 1 800 1 100
14 500 4 300 6 900 2 500 9 000 10 600
(1) An explanation of the icons used in the legend can be found in the Glossary.

GOVERNANCE
CORPORATE
GOVERNANCE
BOARD OF DIRECTORS (AS OF DECEMBER 31, 2014)
The Board of Directors of Delhaize Group and its management are committed to serving the interests of its shareholders and other key stakeholders with the highest standards of
responsibility, integrity and compliance with applicable laws and regulations. Delhaize Group strives to continually earn investor confidence by being a leader in good corporate governance, fostering a culture of performance and accountability,
complying with the law and providing stakeholders with transparent communications about its strategy and performance. Upholding this commitment is in line with our high ethical standards and is important for our continued success.
1. MATS JANSSON (1951)
Chairman since 2012
Director since 2011
Board Member of TeliaSonera
Member of JP Morgan European Advisory Council
Former President of ICA Detaljhandel and Deputy
CEO and Chairman of the Group
Former CEO of Catena/Bilia, Karl Fazor Oy, Axfood
Former President and CEO of Axel Johnson AB and SAS
Former Board member of
Axfood, Mekonomen, Swedish Match, Hufvudstaden and Danske Bank
Studies in Economics and Sociology from the University of Orebro, Sweden
2. CLAIRE H. BABROWSKI (1957)
Director since 2006
Board member of Pier 1 Imports
Former EVP and COO of Toys’R’Us
Former COO and CEO of RadioShack
Former Senior EVP and Chief Restaurant Operations Officer of
McDonald’s Corp.
MBA from the Keenan Flagler Business School at the University of North Carolina
3. SHARI L. BALLARD (1966)
Director since 2012
President, U.S. Retail & Chief Human Resources Officer Best Buy Co., Inc.
Bachelors Degree
in Social Work from the University of Flint – Michigan, USA
4. PIERRE-OLIVIER BECKERS-VIEUJANT (1960)
Director since 1995
President and CEO of Delhaize Group from 1999 - 2013
Board member of D’Ieteren and Aramark, Inc.
Board member of Guberna
Vice-Chairman Federation of Belgian Companies
President of the Belgian Olympic and
Interfederal Committee
Member of the International Olympic Committee
Former
Co-Chairman and Board member of The Consumer Goods Forum
Master in Business Administration from the Harvard Business School, USA
5. JACQUES DE VAUCLEROY (1961)
Director since 2005
Member of the AXA Management Committee, CEO for the Northern, Central and Eastern Europe business Unit. CEO AXA Life & Saving and Health business line.
Former Member Executive Board ING Group and CEO of ING Insurance Europe
Degree in Law from
Catholic University of Louvain (UCL), Belgium and Master of Business Law from Vrije Universiteit van Brussel (VUB), Belgium
1 2 3 4 5
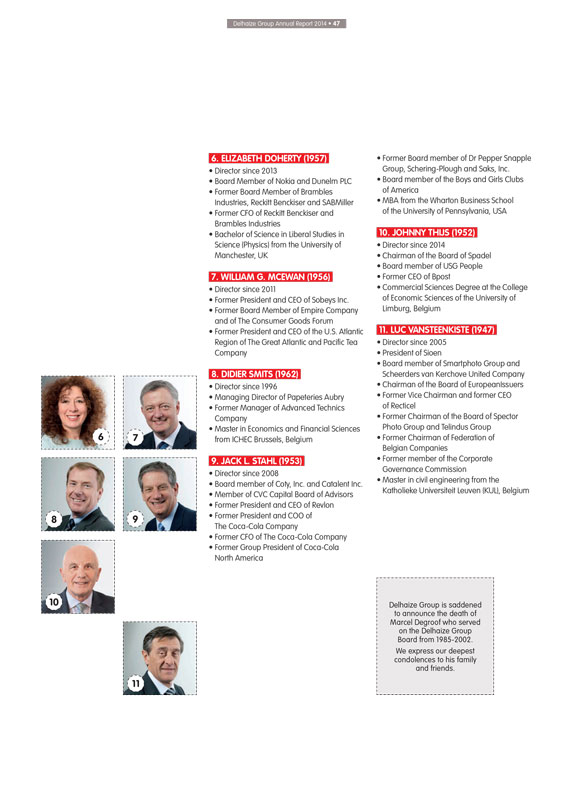
Delhaize Group Annual Report 2014 • 47
6 7 8
9 10 11
6. ELIZABETH DOHERTY (1957)
Director since 2013
Board Member of Nokia and Dunelm PLC
Former Board Member of Brambles Industries, Reckitt
Benckiser and SABMiller
Former CFO of Reckitt Benckiser and Brambles Industries
Bachelor of Science in Liberal Studies in Science (Physics) from the University of Manchester, UK
7. WILLIAM G. MCEWAN (1956)
Director since 2011
Former President and CEO of Sobeys Inc.
Former Board Member of Empire Company and of The
Consumer Goods Forum
Former President and CEO of the U.S. Atlantic Region of The Great Atlantic and Pacific Tea Company
8. DIDIER SMITS (1962)
Director since 1996
Managing Director of Papeteries Aubry
Former Manager of Advanced Technics Company
Master in Economics and Financial Sciences from ICHEC Brussels, Belgium
9. JACK L. STAHL
(1953)
Director since 2008
Board member of Coty, Inc. and Catalent Inc.
Member of CVC Capital Board of Advisors
Former President and CEO of Revlon
Former President and COO of The Coca-Cola Company
Former CFO of The Coca-Cola
Company
Former Group President of Coca-Cola North America
Former Board member
of Dr Pepper Snapple Group, Schering-Plough and Saks, Inc.
Board member of the Boys and Girls Clubs of America
MBA from the Wharton Business School of the University of Pennsylvania, USA
10. JOHNNY THIJS
(1952)
Director since 2014
Chairman of the Board of Spadel
Board member of USG People
Former CEO of Bpost
Commercial Sciences Degree at the College of Economic Sciences of the University of Limburg, Belgium
11. LUC VANSTEENKISTE (1947)
Director since 2005
President of Sioen
Board member of Smartphoto Group and Scheerders van Kerchove United Company
Chairman of the Board of EuropeanIssuers
Former Vice Chairman and former CEO
of Recticel
Former Chairman of the Board of Spector Photo Group and Telindus Group
Former Chairman of Federation of Belgian Companies
Former member of the Corporate Governance
Commission
Master in civil engineering from the
Katholieke Universiteit
Leuven (KUL), Belgium
Delhaize Group is saddened to announce the death of Marcel Degroof who served on the Delhaize Group Board from 1985-2002.
We express our deepest condolences to his family and friends.
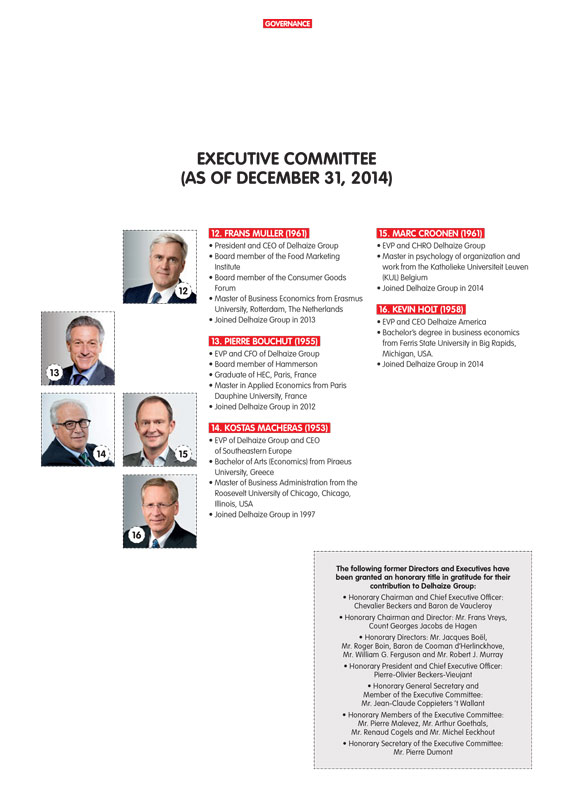
GOVERNANCE
EXECUTIVE COMMITTEE (AS OF DECEMBER 31,
2014)
12 13 14 15 16
12. FRANS MULLER (1961)
President and CEO of Delhaize Group
Board member of the Food Marketing Institute
Board member of the Consumer Goods Forum
Master of Business Economics from Erasmus University,
Rotterdam, The Netherlands
Joined Delhaize Group in 2013
13. PIERRE BOUCHUT
(1955)
EVP and CFO of Delhaize Group
Board member of Hammerson
Graduate of HEC, Paris, France
Master in Applied Economics from Paris Dauphine University,
France
Joined Delhaize Group in 2012
14. KOSTAS MACHERAS (1953)
EVP of Delhaize Group and CEO of Southeastern Europe
Bachelor of Arts (Economics) from Piraeus
University, Greece
Master of Business Administration from the Roosevelt University of Chicago, Chicago, Illinois, USA
Joined Delhaize Group in 1997
15. MARC CROONEN (1961)
EVP and CHRO Delhaize Group
Master in psychology of organization and work from the Katholieke
Universiteit Leuven (KUL) Belgium
Joined Delhaize Group in 2014
16. KEVIN
HOLT (1958)
EVP and CEO Delhaize America
Bachelor’s degree in business
economics from Ferris State University in Big Rapids, Michigan, USA.
Joined Delhaize Group in 2014
The following former Directors and Executives have been granted an honorary title in gratitude for their contribution to Delhaize Group:
Honorary Chairman and Chief Executive Officer: Chevalier Beckers and Baron de Vaucleroy
Honorary Chairman and Director: Mr. Frans Vreys, Count Georges Jacobs de Hagen
Honorary Directors: Mr. Jacques Boël, Mr. Roger Boin, Baron de Cooman d’Herlinckhove, Mr. William G. Ferguson and Mr. Robert J. Murray
Honorary President and Chief Executive Officer: Pierre-Olivier Beckers-Vieujant
Honorary
General Secretary and Member of the Executive Committee: Mr. Jean-Claude Coppieters ‘t Wallant
Honorary Members of the Executive Committee: Mr. Pierre
Malevez, Mr. Arthur Goethals, Mr. Renaud Cogels and Mr. Michel Eeckhout
Honorary Secretary of the Executive Committee: Mr. Pierre Dumont
Delhaize Group Annual Report 2014 • 49
Delhaize Group Corporate Governance Charter
Delhaize Group SA, a Belgian
public company (“société anonyme”) follows the corporate governance principles described in the 2009 Belgian Code on Corporate Governance (the “Belgian Governance Code”),which the Company adopted as its reference
code in 2009. The Belgian Governance Code is available at: www.corporategovernancecommittee.be.
In accordance with the recommendations and guidelines described in
the Belgian Governance Code, the corporate governance framework of the Company is outlined in Delhaize Group’s Corporate Governance Charter (the “Charter”).
The Board of Directors reviews and updates the Charter from time to time to reflect changes in the Company’s corporate governance framework. The current version of the Charter
is available on the Company’s website at: www. delhaizegroup.com under the “Corporate Governance” tab. The Charter includes the Terms of Reference of the Board of Directors, the Terms of Reference of each Committee of the Board, the
Terms of Reference of Executive Management, the Remuneration Policy, and the Related Party Transactions Policy. The Company’s Articles of Association and the Charter, together with the policies attached as exhibits thereto, and applicable
Belgian law, including the Belgian and U.S. securities exchange rules to which the Company is subject, govern the manner in which the Company operates.
As
recommended by the Belgian Governance Code, this Corporate Governance Statement focuses on factual information relating to the Company’s corporate governance, including changes and other events that occurred in 2014 that impact the
Company’s corporate governance framework.
The Board of Directors
Mission
of the Board of Directors
The Board of Directors of Delhaize Group (the “Board”), as the Company’s ultimate decision-making body, is entrusted with
all powers that are not reserved by law to the Shareholders’ Meeting. The Board is responsible for the Company’s strategy, for succession planning, and for providing direction and oversight to Executive Management who are responsible for
operating the Company. The Board is committed to creating shareholder value by pursuing sustainable, profitable growth based on the contributions of the Company’s associates, its global network of suppliers, and the continued loyalty of
customers and the communities where it operates.
Composition of the Board of Directors
On December 31, 2014, the Board of Directors of Delhaize Group consisted of 11 directors and included three standing Committees: the Audit & Finance Committee, the Governance
& Nomination Committee and the Remuneration Committee. As indicated in the Terms of Reference of the Board of Directors, the Board periodically reviews its membership criteria and considers these criteria in the context of the current and future
composition of the Board and its committees. This assessment is made on the basis of a director or director-candidate’s knowledge, experience, independence, integrity, diversity, and relevant skills as well as his or her willingness to devote
adequate time to Board duties.
The Governance & Nomination Committee has given particular attention to the composition of the Board of Directors, including
director independence requirements, the ongoing need for financial and remuneration expertise and other qualification criteria, such as gender diversity (discussed below).
On December 31, 2014, a majority of the Board, and all members of the Governance & Nomination Committee, the Audit & Finance Committee and the Remuneration Committee were
“independent” as such term is defined under the Belgian Companies Code (the “Companies Code”), the Belgian Governance Code, and the New York Stock Exchange Listing Manual (“NYSE Rules”). In addition, at least one member
of the Board and the Audit & Finance Committee must be an “audit committee financial expert” as defined by U.S. federal securities laws, and all Audit & Finance Committee members must be financially literate. In addition, the
Companies Code requires that at least one member of the Audit & Finance Committee must be competent in accounting and audit matters. With respect to the Remuneration Committee, the Companies Code requires that members have remuneration
expertise.
In 2014, the Board considered its director qualification criteria in the context of the retirement of one of its directors as well as the recruitment of
a new member to the Board of Directors.
A recent Belgian law requires that boards of directors take gender diversity into account, and by the beginning of the
financial year starting on January 1, 2017, that at least one-third of their members is of another gender than the other members of the Board of Directors. As of December 31, 2014, the Delhaize Group Board of Directors is comprised of 11 members, of
whom three are women. Ms. Claire H. Babrowski has been a member of the Company’s Board of Directors since May 2006, Ms. Shari L. Ballard since May 2012, and Ms. Elizabeth Doherty since May 2013. The Board of Directors is committed to gender
diversity because it is convinced that diversity strengthens the Board’s deliberative process and decisions.
Assessments of Board, Committee and Individual
Director Performance
The Board annually evaluates its overall performance, the performance of its committees, and its members.
The purpose of these assessments is to enhance the overall effectiveness of the Board. In the Board’s view, this is best accomplished by the establishment of a confidential
assessment process, approved by the Board. The results of the Board and Committee assessments are discussed with the full Board. Individual director assessments are shared only with the Chairman of the Board who meets with each director to discuss
his or her performance.
In connection with the process for nominating directors to stand for election by shareholders at the annual meeting, each director is
assessed in relation to the director qualification criteria. If, at any time, the Board determines that an individual director is not meeting the established performance standards or no longer satisfies the director qualification criteria and
independence standards, or his or her actions reflect poorly upon the Board and the Company, the Board may request the resignation of such director. Pursuant to the Company’s Articles of Association, directors may be removed from office at any
time by a majority vote at any meeting of shareholders.
GOVERNANCE
Name (Year of Birth) Position Director
Since Term Expires Member of Audit & Finance Committee Member of Governance & Nomination Committee Member of the Remuneration Committee
Mats Jansson (1951)
Chairman(1) May 2011 2018 X
Shari L. Ballard (1966) Director(1) May 2012 2015 X
Claire H. Babrowski (1957) Director(1) May 2006 2016 X X
Pierre-Olivier
Beckers-Vieujant (1960) Director May 1995 2015
Elizabeth Doherty (1957) Director(1) May 2013 2016 X
Jacques de Vaucleroy (1961) Director(1) May 2005 2015 Chair X
Hugh G. Farrington (1945)
(mandate expired on May 22, 2014) Director May 2005 2014 Chair (Remuneration & Nomination Committee)
William G. McEwan (1956) Director(1) May 2011 2018 Chair
Didier Smits (1962) Director May 1996 2015
Jack L. Stahl (1953) Director(1)
August 2008 2018 Chair
Johnny Thijs (1951) Director(1) May 2014 2017 X
Luc
Vansteenkiste (1947) Director(1) May 2005 2015 X X
(1) Independent director under the Companies Code, the Belgian Code on Corporate Governance and the NYSE rules.
Activity Report of the Board in 2014
In 2014, the Board of Directors met nine
times (six regularly scheduled meetings and three special meetings). All directors were present at those meetings with the following exceptions: Messrs. Jacques de Vaucleroy and Johnny Thijs and Ms. Elizabeth Doherty were each excused at one
meeting, and Ms. Shari Ballard was excused at two meetings.
In 2014, the Board’s activities included, among others:
Regular sessions with the CEO without other members of management;
An annual strategic session
on key strategic issues;
Review of the Company’s enterprise risk management report;
Succession planning for the role of CEO and other members of Executive Committee;
Review of
the Company’s financial performance compared to the approved 2014 budget, and review of the 2015 annual budget and the three-year financial plan (approved in January 2015);
Regular business reviews;
Review and approval of quarterly, half-yearly and annual financial
statements, including proposed allocation of profits and dividend proposal, the consolidated financial statements, the Board report on the annual accounts and the consolidated financial statements, and the annual report;
Approval of revenues and earnings press releases;
Approval of the publication of the
Sustainability Progress Report for the year 2013;
Nomination of director, nomination of directors for renewal of their directors’ mandate and assessment of
their independence;
Review and decision on possible acquisitions and divestitures;
Regular review and update on treasury matters;
Reports of Committee Chairmen and decisions on
Committee recommendations;
Call and adoption of the agenda of the Ordinary Shareholders’ Meeting;
Approval of the Delhaize Group 2014 European Performance Stock Unit Plan.
Nomination and
Tenure of Directors
Under Belgian law, directors are elected by majority vote at the ordinary shareholders’ meeting for a term of up to six years. Pursuant to
Belgian law, a director is not independent if such person is elected to more than three successive terms or serves more than twelve years as a director.
In August
2014, the Board of Directors established a four year term for the mandates of independent directors. This would permit a non-executive director who is otherwise independent to serve a total of twelve years before such director would no longer be
considered independent under Belgian law. The term of mandates for directors who are not considered independent by the Board of Directors at the time of their election has been set by the Board at three years. Unless otherwise decided by the Board,
a person who may be considered for election to the Board and who will turn age 72 during his or her next mandate may instead be elected to a term that would expire at the ordinary shareholders’ meeting occurring in the year in which such
director turns 72.
At the Ordinary Shareholders’ Meeting held on May 22, 2014, Mr. Johnny Thijs was appointed as a director for a term of three years. The
mandates of Mr. Mats Jansson, Mr. William G. McEwan and Mr. Jack Stahl were renewed each for a term of four years. Mr. Farrington decided not to stand for renewal of his mandate at the Ordinary Shareholders’ Meeting on May 22, 2014.
Proposed Renewal of Director Mandates
The Board of Directors has considered all criteria
applicable to the assessment of independence of directors under the Companies Code, the Belgian Governance Code and the NYSE Rules and determined that, based on the information provided by Ms. Shari Ballard, she qualifies as independent under all of
these criteria. At the Ordinary Shareholders’ Meeting of May 28, 2015, the Board will propose that the shareholders acknowledge that Ms. Shari Ballard is independent within the meaning of the Companies Code, and will propose the renewal of the
mandates of Ms. Ballard for a term of four years and Messrs. Jacques de Vaucleroy and Luc Vansteenkiste each for a term of three years, to the shareholders for approval. Messrs. Jacques de Vaucleroy and Luc Vansteenkiste will no longer be considered
independent under the above-referenced criteria. Messrs. Pierre-Olivier Beckers-Vieujant and Didier Smits have informed the Board that they will not stand for renewal when their mandates expire at the shareholders’ meeting to be held on May 28,
2015
Delhaize Group Annual Report 2014 • 51
Proposed Appointment of New Directors
Upon recommendation of the Governance
and Nomination Committee, the Board will propose the appointment of Ms. Leroy and Mr. Patrick De Maeseneire as directors for a term of four years to the shareholders at the Ordinary Shareholders’ Meeting to be held on May 28, 2015.
Ms. Leroy has been Chief Executive Officer of Belgacom SA and member of the Board of Directors of Belgacom SA since January 2014. She began working at Belgacom as Vice President
Sales for the Consumer division in October 2011. In June, 2012, Ms. Dominique Leroy held the position of Executive Vice President of the Consumer Business Unit of Belgacom and member of the Management Committee of Belgacom Group. Prior to Belgacom,
Ms. Leroy worked for 24 years at Unilever. She was Managing Director of Unilever Belux and member of Unilever’s Benelux management committee. She previously held various positions in marketing, finance and customer development.
Ms. Leroy is an independent Board Member at Lotus Bakeries. Mrs. Leroy holds a degree in Business Engineering from the Solvay Business School of Brussels University (ULB).
Mr. De Maeseneire has been Chief Executive Officer of Adecco S.A. since June 1, 2009. Between 1998 and 2002, Mr. De Maeseneire held leading positions within the
Adecco Group, starting as country manager for the Benelux region before leading the Adecco Group’s worldwide professional staffing business from New York. Mr. De Maeseneire started his professional carrier in 1980 at Arthur Andersen
(Consulting). Between 1980 and 1997, he held executive positions at Wang, Apple Computer, Sun International and at the Belgian TV station VTM. In 2002, Mr. De Maeseneire joined the chocolate manufacturer Barry Callebaut where he served as CEO until
2009, when he returned to Adecco as CEO.
Mr. De Maeseneire earned a Master’s degree in commercial engineering at the Solvay Business School of Brussels
University (VUB), Belgium and a special license in marketing management at the Vlerick Leuven Gent Management School, Belgium. Mr. De Maeseneire also completed studies in business management at the London Business School and INSEAD, Fontainebleau,
France. In 2007, Mr. De Maeseneire was granted the title of Baron by King Albert II of Belgium.
Independence of Directors
In March 2015, the Board of Directors considered all criteria applicable to the assessment of independence of directors under the Companies Code, the Belgian Governance Code and
the rules set forth in the NYSE Rules. Based on the information provided by all directors regarding their relationships with Delhaize Group, the Board of Directors determined that all directors, with the exception of Mr. Pierre-Olivier
Beckers-Vieujant and Mr. Didier Smits, are independent under the criteria of the Companies Code, the Belgian Governance Code and the NYSE rules.
Mr. Pierre-Olivier
Beckers-Vieujant is not independent under the criteria of the Companies Code because he was an executive of the Company until December 31, 2013. Mr. Didier Smits is no longer independent under the criteria of the Companies Code (effective May 2009)
because he has served on the Board of Directors as a non-executive director for more than three consecutive terms.
Based on the determinations made at the Ordinary
Shareholders’ Meeting of 2011, 2012, 2013, and 2014, the shareholders have determined that all current directors are independent under the criteria of the Companies Code, with the exception of the directors mentioned above. Such determinations
have been made upon a director’s election or re-election to the Delhaize Group Board of Directors at an ordinary shareholders’ meeting.
Committees of the
Board of Directors
In March 2014 the Board decided to restructure the functions of its two standing committees (i.e., the Remuneration & Nomination Committee
and the Audit Committee) into three standing committees, effective May 21, 2014: (i) the Remuneration Committee, (ii) the Governance & Nomination Committee, and (iii) the Audit & Finance Committee. The table on page 50 provides an overview
of the membership of the standing committees of the Board of Directors. The committees annually review their Terms of Reference and recommend any proposed changes to the Board of Directors for approval.
The Terms of Reference for the three Board committees, and their respective specific responsibilities, are attached as Exhibits to the Corporate Governance Charter and can be found
on the Company’s website at www.delhaizegroup.com under the Corporate Governance tab.
Remuneration & Nomination Committee
The Remuneration & Nomination Committee (the “RNC”) was established by the Board of Directors to assist it in all matters related to performance evaluations,
compensation and succession planning for directors and executives of the Company, in addition to monitoring compliance with governance rules and regulations. It was responsible for making recommendations to the Board for its consideration and
approval on these and related topics. As noted above, the functions of the RNC were split into two committees effective May 21, 2014. Further descriptions of the Remuneration Committee and the Governance & Nomination Committee activities are
included below.
In 2014, the RNC was composed solely of non-executive directors, and a majority of the members of the RNC were independent pursuant to the
Companies Code, the Belgian Governance Code, and the NYSE rules.
The members of the RNC were appointed by the Board on the recommendation of the Chairman of the
Board and members of the RNC (without participating in consideration of their own appointment). The RNC and the Board of Directors adequately considered the competence and the skills of the members of the RNC on an individual as well as on a
collective basis and considered that such members met all the required competencies and skills to exercise the functions pertaining to the RNC.
The composition of
the RNC in 2014 can be found in the table on page 50.
The RNC met three times until May 21, 2014. All RNC members attended all meetings with the exception of
Messrs. Jacques de Vaucleroy and Mats Jansson, each of whom were excused at one meeting.
The activities of the RNC in 2014, included among others:
Evaluation of the CEO and other Executive Committee member performance;
CEO and Executive
Committee succession planning;
Review of the Remuneration Policy;
Review and
approval of the Company’s Remuneration Report;
Review of senior management performance and compensation, including short and long-term incentive awards;
Review of variable remuneration for other levels of management in the aggregate;
Review of compliance with senior management share ownership guidelines;
Review of Board
governance and policies;
Review of director nominations and directors compensation;
Review of director mandates and qualifications;
Committee self-assessment of performance;
Review of the Terms of Reference of each Committee.
GOVERNANCE
Governance & Nomination Committee
The Governance & Nomination Committee (the “GNC”), the functions of which previously were performed in the Remuneration & Nomination Committee,
was established by the Board of Directors in May 2014 to assist it in all matters related to succession planning for directors and the Chief Executive Officer of the Company, in addition to monitoring compliance with governance rules and
regulations. It is responsible for making recommendations to the Board for its consideration and approval on these and related topics.
In 2014, the GNC was
composed solely of non-executive directors, and all of the members of the GNC were independent pursuant to the Companies Code, the Belgian Governance Code, and the NYSE rules.
The members of the GNC are appointed by the Board on the recommendation of the Chairman of the Board and other members of the GNC (without participating in consideration of their
own appointment). The GNC and the Board of Directors adequately considered the competence and the skills of the members of the GNC on an individual as well as on a collective basis and considered that such members met all the required competencies
and skills to exercise the functions pertaining to the GNC.
The composition of the GNC in 2014 can be found in the table on page 50.
In 2014, the GNC met three times. All GNC members attended all meetings.
The activities of the
GNC in 2014 included, among others:
Review of director nominations;
Review of
director mandates and qualifications;
Review of the Corporate Governance Charter;
Review of the Committee Terms of Reference.
Audit & Finance Committee
The Audit & Finance Committee (the “AFC”), previously the Audit Committee, was established by the Board of Directors to assist it in monitoring the integrity of the
financial statements of the Company, the Company’s compliance with legal and regulatory requirements, the Statutory Auditor’s qualification and independence, the performance of the Company’s internal audit function and Statutory
Auditor, the Company’s internal controls and risk management, and (effective May 2014) the areas of corporate finance, treasury and tax activities, including the financial impact of significant transactions proposed by the Company management.
In 2014, the AFC was composed solely of independent directors, who are qualified to serve on such committee pursuant to the Companies Code, the Belgian Governance
Code, the SEC rules and the NYSE rules.
The members of the AFC are appointed by the Board on the recommendation of the GNC. The GNC and the Board of Directors
adequately considered the competence and the skills of the members of the AFC on an individual as well as on a collective basis and considered that such members met all the required competencies and skills to exercise the functions pertaining to the
AFC.
In 2014, the Board of Directors determined that Ms. Claire H. Babrowski, Ms. Elizabeth Doherty, Mr. Jack L. Stahl and Mr. Luc Vansteenkiste were “audit
committee financial experts” as defined under applicable U.S. law. All members of the AFC are considered to be experts in accounting and auditing for Belgian law purposes.
The composition of the AFC can be found in the table on page 50.
In 2014, the AFC met five
times. All members of the AFC attended all of those meetings. The activities of the AFC in 2014 included, among others:
Review of financial statements and related
revenues and earnings press releases;
Review of the effect of regulatory and accounting initiatives and any off-balance sheet structures on the financial
statements;
Review of changes, as applicable, in accounting principles and valuation rules;
Review of the Internal Audit Plan;
Review of major financial risk exposures and the steps
taken by management to monitor, control and disclose such exposures;
Review of Management’s Representation Letter;
Review of the Audit and Finance Committee Charter Required Actions Checklist;
Review of
reports concerning the policy on complaints (SOX 301 Reports Policy/I-Share line);
Review of SOX 404 compliance plan for the year 2013;
Review of reports provided by the General Counsel;
Review of reports provided by the Chief
Information Security Officer;
Review and evaluation of the lead partner of the independent auditor;
Holding closed sessions (without the presence of management) with the independent external auditor, the Company’s Chief Internal Audit Officer, and the Company’s General
Counsel;
Review and approval of the Policy for Audit Committee Pre-Approval of Independent Auditor Services (as described below);
Review of required communications from the independent auditor;
Review and approval of the
Statutory Auditor’s global audit plan for 2014;
Supervision of the performance of external auditor and supervision of internal audit function;
Committee self-assessment of performance;
Review of the Committee Terms of Reference;
Review of Finance and Treasury Updates.
Remuneration Committee
The Remuneration Committee, the functions of which previously were performed in the Remuneration and Nomination Committee, was established by the Board of Directors in May 2014 to
(i) recommend to the Board the compensation of the members of Executive Management, which consists of the Chief Executive Officer and other members of the Company’s Executive Committee; (ii) recommend to the Board any incentive compensation
plans and equity-based plans, and awards thereunder, and profit-sharing plans for the Company’s associates; (iii) evaluate the performance of the Executive Management; and (iv) advise the Board on other compensation issues.
In 2014, the Remuneration Committee was composed solely of independent directors, who are qualified to serve on such committee pursuant to the Companies Code, the Belgian
Governance Code, the SEC rules and the NYSE rules.
The members of the Remuneration Committee are appointed by the Board on the recommendation of the GNC. The GNC
and the Board of Directors adequately considered the competence and the skills of the members of the Remuneration Committee on an individual as well as on a collective basis and considered that such members met all the required competencies and
skills to exercise the functions pertaining to the Remuneration Committee.
The composition of the Remuneration Committee can be found in the table on page 50.
In 2014, the Remuneration Committee met two times. All members of the Remuneration Committee attended all of those meetings.
The activities of the Remuneration Committee in 2014 included, among others:
Review of senior
management compensation structure, including short and long-term incentive components;
Review of the Committee Terms of Reference.
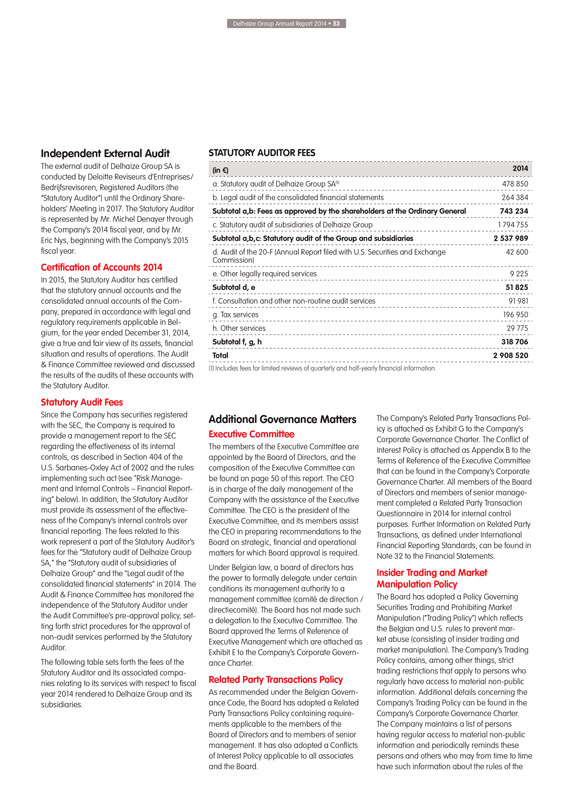
Delhaize Group Annual Report 2014 • 53
Independent External Audit
The external audit of Delhaize Group SA is
conducted by Deloitte Reviseurs d’Entreprises/Bedrijfsrevisoren, Registered Auditors (the “Statutory Auditor”) until the Ordinary Shareholders’ Meeting in 2017. The Statutory Auditor is represented by Mr. Michel Denayer through
the Company’s 2014 fiscal year, and by Mr. Eric Nys, beginning with the Company’s 2015 fiscal year.
Certification of Accounts 2014
In 2015, the Statutory Auditor has certified that the statutory annual accounts and the consolidated annual accounts of the Company, prepared in accordance with legal and
regulatory requirements applicable in Belgium, for the year ended December 31, 2014, give a true and fair view of its assets, financial situation and results of operations. The Audit & Finance Committee reviewed and discussed the results of the
audits of these accounts with the Statutory Auditor.
Statutory Audit Fees
Since the Company has securities registered with the SEC, the Company is required to provide a management report to the SEC regarding the effectiveness of its
internal controls, as described in Section 404 of the U.S. Sarbanes-Oxley Act of 2002 and the rules implementing such act (see “Risk Management and Internal Controls – Financial Reporting” below). In addition, the Statutory Auditor
must provide its assessment of the effectiveness of the Company’s internal controls over financial reporting. The fees related to this work represent a part of the Statutory Auditor’s fees for the “Statutory audit of Delhaize Group
SA,” the “Statutory audit of subsidiaries of Delhaize Group” and the “Legal audit of the consolidated financial statements” in 2014. The Audit & Finance Committee has monitored the independence of the Statutory Auditor
under the Audit Committee’s pre-approval policy, setting forth strict procedures for the approval of non-audit services performed by the Statutory Auditor.
The following table sets forth the fees of the Statutory Auditor and its associated companies relating to its services with respect to fiscal year 2014 rendered to
Delhaize Group and its subsidiaries.
STATUTORY AUDITOR FEES
(in €) 2014
a. Statutory audit of Delhaize Group SA(1) 478 850
b. Legal audit of the
consolidated financial statements 264 384
Subtotal a,b: Fees as approved by the shareholders at the Ordinary General 743 234
c. Statutory audit of subsidiaries of Delhaize Group 1 794 755
Subtotal a,b,c: Statutory audit
of the Group and subsidiaries 2 537 989
d. Audit of the 20-F (Annual Report filed with U.S. Securities and Exchange Commission) 42 600
e. Other legally required services 9 225
Subtotal d, e 51 825
f. Consultation and other non-routine audit services 91 981
g. Tax services 196 950
h. Other services 29 775
Subtotal f, g, h 318 706
Total 2 908 520
(1) Includes fees for limited reviews of quarterly and half-yearly financial
information.
Additional Governance Matters
Executive Committee
The members of the Executive Committee are appointed by the Board of Directors, and the composition of the Executive Committee can be found on page 50 of this report. The CEO is in
charge of the daily management of the Company with the assistance of the Executive Committee. The CEO is the president of the Executive Committee, and its members assist the CEO in preparing recommendations to the Board on strategic, financial and
operational matters for which Board approval is required.
Under Belgian law, a board of directors has the power to formally delegate under certain conditions its
management authority to a management committee (comité de direction / directiecomité). The Board has not made such a delegation to the Executive Committee. The Board approved the Terms of Reference of Executive Management which are
attached as Exhibit E to the Company’s Corporate Governance Charter.
Related Party Transactions Policy
As recommended under the Belgian Governance Code, the Board has adopted a Related Party Transactions Policy containing requirements applicable to the members of the Board of
Directors and to members of senior management. It has also adopted a Conflicts of Interest Policy applicable to all associates and the Board.
The Company’s
Related Party Transactions Policy is attached as Exhibit G to the Company’s Corporate Governance Charter. The Conflict of Interest Policy is attached as Appendix B to the Terms of Reference of the Executive Committee that can be found in the
Company’s Corporate Governance Charter. All members of the Board of Directors and members of senior management completed a Related Party Transaction Questionnaire in 2014 for internal control purposes. Further Information on Related Party
Transactions, as defined under International Financial Reporting Standards, can be found in Note 32 to the Financial Statements.
Insider Trading and Market
Manipulation Policy
The Board has adopted a Policy Governing Securities Trading and Prohibiting Market Manipulation (“Trading Policy”) which reflects the
Belgian and U.S. rules to prevent market abuse (consisting of insider trading and market manipulation). The Company’s Trading Policy contains, among other things, strict trading restrictions that apply to persons who regularly have access to
material non-public information. Additional details concerning the Company’s Trading Policy can be found in the Company’s Corporate Governance Charter. The Company maintains a list of persons having regular access to material non-public
information and periodically reminds these persons and others who may from time to time have such information about the rules of the
GOVERNANCE
Trading Policy. The Company has also
established regular periods during each calendar year prior to and immediately following the release of the Company’s financial information, during which directors and certain members of management are restricted from trading in Company
securities.
Disclosure Policy
As recommended by the Belgian Governance Code,
the Company has adopted a Disclosure Policy that sets out the framework and the guiding principles that the Company applies when disclosing information. This policy is available at www.delhaizegroup.com.
Compliance with the Belgian Governance Code
In 2014, the Company was fully compliant with the
provisions of the Belgian Governance Code.
Undertakings upon Change of Control of the Company, as of December 31, 2014
Management associates of non-U.S. operating companies received stock options issued by the Board of Directors under the Delhaize Group 2007 stock option plan for associates of
non-U.S. companies, granting to the beneficiaries the right to acquire ordinary shares of the Company. Management associates of U.S. operating companies received options, which qualify as warrants under Belgian law, issued by the Board of Directors
under the Delhaize Group 2002 Stock Incentive Plan, as amended, and under the Delhaize Group U.S. 2012 Stock Incentive Plan, granting to the beneficiaries the right to subscribe to new American Depositary Receipts of the Company. The
Shareholders’ Meetings of May 23, 2002, May 24, 2007 and May 24, 2012, respectively, approved a provision of these plans that provide that in the event of a change of control over the Company the beneficiaries will have the right to exercise
their options and warrants, regardless of their vesting period. The number of options and warrants outstanding under those plans as of December 31, 2014 can be found under Note 21.3 to the Financial Statements.
Management associates of U.S. operating companies received restricted stock units and performance stock units under the Delhaize America, LLC 2002 and 2012 Restricted Stock Unit
Plans, as amended, granting to beneficiaries the right to receive existing shares of the Company upon vesting and achievement of performance conditions, as the case may be. The Shareholders’ Meetings of May 23, 2002 and May 24, 2012,
respectively, approved a provision of these plans that provide that in the event of a change in control over the Company the beneficiary will receive existing shares regardless of the vesting period.
In 2003, the Company adopted a global long-term incentive program which incorporates a Performance Cash Plan. The grants under the Performance Cash Plan provide for cash payments
to the beneficiaries at the end of a three-year period that are dependent on Company performance against Board-approved financial targets that are closely correlated to building long-term shareholder value. The Shareholders’ Meeting of May 26,
2005 approved a provision of the Performance Cash Plan that provides that the beneficiaries are entitled to receive the full cash payment with respect to any outstanding grant in the event of a change of control over the Company.
The Ordinary Shareholders’ Meeting held on May 24, 2007, May 22, 2008, May 28, 2009, May 27, 2010, May 26, 2011, May 24, 2012, May 23, 2013 and May 22, 2014, respectively,
approved the inclusion of a provision granting to the holders of the bonds, convertible bonds or medium-term notes that the Company may issue within the 12 months following the respective ordinary shareholders’ meeting, in one or several
offerings and tranches, denominated either in U.S. Dollars or in Euros, with a maturity or maturities not exceeding 30 years, for a maximum aggregate amount of €1.5 billion, the right to obtain the redemption, or the right to require the
repurchase, of such bonds or notes for an amount not in excess of 101% of the outstanding principal amount plus accrued and unpaid interest of such bonds or notes, in the event of a change of control over the Company, as would be provided in the
terms and conditions relating to such bonds and/or notes.
On June 27, 2007 the Company issued $450 million 6.50% notes due 2017 in a private placement to qualified
investors. Pursuant to an exchange offer registered under the U.S Securities Act, the notes were subsequently exchanged for notes that are freely transferable in the U.S. The notes contain a change of control provision granting its holders the right
to early repayment for an amount not in excess of 101% of the outstanding principal amount thereof in the event of a change of control over the Company and downgrading by Moody’s and Standard & Poor’s.
On October 6, 2010, the Company announced the issuance of new $827 million 5.70% Notes due 2040 (the “New Notes”) pursuant to a private offer to exchange 9.00% Debentures
due 2031 and 8.05% Notes due 2027 issued by its wholly-owned subsidiary Delhaize America, LLC held by eligible holders. The New Notes contain a change of control provision granting their holders the right to early repayment for an amount not in
excess of 101% of the outstanding principal amount thereof in the event of a change of control over the Company and downgrading by Moody’s and Standard & Poor’s.
On October 5, 2011 the Company announced the successful completion on October 4, 2011 of its public offering of €400 million 7 year 4.25% retail bonds in Belgium and in the
Grand Duchy of Luxembourg listed on NYSE Euronext Brussels pursuant to a prospectus filed by the Company with the Financial Services and Markets Authority of Belgium (FSMA). The bonds contain a change of control provision granting their holders the
right to early repayment for an amount not in excess of 101% of the outstanding principal amount thereof in the event of a change of control over the Company and downgrading by Moody’s and Standard & Poor’s.
On April 10, 2012 the Company issued $300 million 4.125% senior notes due 2019 to qualified investors pursuant to a registration statement filed by the Company with the SEC. The
notes contain a change of control provision granting their holders the right to early repayment for an amount not in excess of 101% of the outstanding principal amount thereof in the event of a change of control over the Company and downgrading by
Moody’s and Standard & Poor’s.
On November 27, 2012 the Company issued €400 million 3.125% senior notes due 2020 listed on NYSE Euronext
Brussels to qualified investors pursuant to a prospectus filed by the Company with the FSMA. The notes contain a change of control provision granting their holders the right to early repayment for an amount not in excess of 101% of the outstanding
principal amount thereof in the event of a change of control over the Company and downgrading by Moody’s and Standard & Poor’s.
The Ordinary
Shareholders Meeting held on May 22, 2014 approved a change in control clause set out in the € 400 million five-year (with potentially two additional one-year extensions) revolving credit facility dated April 14, 2014 entered into among inter
alios the Company, Delhaize America, LLC, Delhaize Griffin SA, Delhaize The Lion Coordination
Delhaize Group Annual Report 2014 • 55
Center
SA, as Borrowers and Guarantors, the subsidiary guarantors party thereto, the lenders party thereto, and Bank of America Merrill Lynch International Limited, BNP Paribas Fortis SA/NV and J.P. Morgan Limited, as Bookrunning Mandated Lead Arrangers.
The “Change of Control” clause provides that, in case any person (or group of persons acting in concert) gains control over the Company, i.e. becomes the owner of more than 50 per cent of the issued share capital of the Company or is able
to exercise a decisive influence on the designation of a majority of the directors or managers of the Company or the direction of management and policies of the Company, this may lead to a mandatory prepayment and cancellation under the credit
facility.
Risk Management and Internal Controls
Overview
The Company’s Board of Directors has ultimate responsibility for monitoring the performance of the Company and its internal controls. It is assisted by Board committees,
described herein, which monitor various aspects of the Company’s performance and make recommendations to the Board for decisions and approval.
The Board of
Directors relies on management for establishing and maintaining adequate internal controls. Internal control is broadly defined as a process implemented by the Board and management, designed to provide reasonable assurance regarding achievement of
objectives related to:
effectiveness and efficiency of operations;
reliability of financial reporting; and
compliance with applicable laws and
regulations.
The Audit & Finance Committee ultimately oversees major business and financial risk management and discusses the process by which management of
the Company assesses and manages the Company’s exposure to those risks and the steps taken to monitor and control such exposures.
Management of the Company
has established and operates its internal control and risk management systems in a manner that is consistent with guidelines issued by the Committee of Sponsoring Organizations of the Treadway Commission (“COSO”). The internal control
system is based upon COSO’s Internal Control – Integrated Framework, and its risk management system is based on COSO’s Enterprise Risk Management Framework.
Financial Reporting
The Company’s internal controls over financial reporting are a subset
of internal controls and include those policies and procedures that:
pertain to the maintenance of records that, in reasonable detail, accurately and fairly
reflect the transactions and dispositions of the assets of the Company;
provide reasonable assurance that transactions are recorded as necessary to permit
preparation of financial statements in accordance with IFRS as adopted by the EU, and that receipts and expenditures of the Company are being made only in accordance with authorizations of management and directors of the Company; and
provide reasonable assurance regarding prevention or timely detection of unauthorized acquisition, use or disposition of the Company’s assets that could have a material effect
on the financial statements.
Since the Company has securities registered with the SEC, the Company must provide (i) a management report on the effectiveness of the
Company’s internal control over financial reporting, and (ii) the Statutory Auditor’s assessment of the effectiveness of internal control over financial reporting, as described in Section 404 of the U.S. Sarbanes-Oxley Act of 2002 and the
rules implementing such act. The Statutory Auditor’s related opinion regarding the Company’s year ended December 31, 2014 will be included in the Company’s Annual Report on Form 20-F for such year, which is required to be filed with
the SEC by April 30, 2015. The Company’s 2013 annual report filed on Form 20-F includes management’s conclusion that the Company’s internal control over financial reporting was effective as of December 31, 2013.
The Statutory Auditor concluded that the Group maintained, in all material respects, effective internal control over financial reporting as of December 31, 2014.
Control Environment
The Company operates in seven countries on three continents. The
management of the Company is organized around strong banner and regional management teams, and the chief executives or chief operating officers of each operating banner report to the Chief Executive Officer of Delhaize Group or to a member of the
Executive Committee.
The Company provides support and coordination functions to all members of the Group and monitors selected activities group-wide. Our operating
companies have acquired leading positions in food retailing through a distinct go-to-market strategy, benefiting from support functions at the global or regional level, whichever makes the most sense in terms of efficiency.
Delhaize Group also has implemented policies and procedures that determine the governance of the Company to ensure that strategies and overall business objectives are pursued under
a controlled and well-defined decision-making authority.
The Company’s Guide for Ethical Business Conduct provides a statement of our position on various
ethical and compliance issues that could impact our business and summarizes a number of Company policies that must guide our actions. The Company has also adopted policies related to specific areas of compliance and a reporting mechanism, referred
to as IShare, for associates and others to report compliance concerns.
We also expect our independent store operators, franchisees, vendors and outside
consultants, such as business, financial, technical or legal advisors, to be guided by these standards and policies.
A copy of the Guide for Ethical Business
Conduct is available on the Company website at: www.delhaizegroup.com.
Risk Management Program
Executive Management is responsible for establishing a risk management program that is implemented at all levels of the organization for identifying, assessing, and mitigating
risks that could, if they occur, impede the organization’s ability to achieve its objectives and create value for its stakeholders. Business leaders are responsible for identifying, assessing and managing risks within their assigned areas of
oversight and responsibility. They are also responsible for integrating identified risks into their financial plans.
The Audit & Finance Committee reviews
management’s process for identifying, assessing and mitigating such risks. The Board of Directors considers risks identified by management in evaluating the Company’s strategy, three-year business plan and annual budget, and related
funding and allocation of capital, as well as in assessing the Company’s talent and capabilities to deliver performance.
GOVERNANCE
Information and Communication
The Chief Executive Officer and the Executive Committee have established a clear tone at the top that they expect associates to adhere to high ethical standards as
described in the Guide for Ethical Business Conduct, and to exercise due care in their assigned responsibilities. This includes a duty to ensure that information is properly collected and communicated, consistent with applicable regulations and data
privacy laws and directives, concerning all aspects of the Company’s operations, including associates, customers, vendors, and all related financial reports.
The Company has established a system of uniform reporting of financial information that is performed both upstream and downstream and allows the Company to detect
potential anomalies in its internal control framework. A detailed financial calendar for this reporting is established every year in consultation with the Board of Directors and is designed to allow for information to be prepared accurately, and
reported timely, in accordance with legal and other requirements.
Control Activities
Control activities include policies and procedures to help monitor and manage risk. Control activities occur throughout the organization, at all levels and in all functions. They
include a range of activities as diverse as approvals, authorizations, verifications, reconciliations, reviews of operating performance, security of assets and segregation of duties.
The Company has designed control activities for all relevant business processes across each operating company as well as its group support offices. Significant policies and
procedures are published on the Company’s public websites, intranet sites and other communication portals as well as being periodically circulated throughout the Company.
Monitoring
Monitoring, as defined in the COSO’s Internal Control Framework, has been
implemented to help ensure “that internal control continues to operate effectively.” The Company had designed its monitoring procedures to ensure that:
Internal control deficiencies are identified and corrected on a timely basis;
Information used in decision-making is reliable and accurate;
Financial
statements are prepared accurately and timely; and
Periodic certifications or assertions on the effectiveness of internal control can be made.
The Company’s monitoring procedures consist of a combination of management oversight activities and independent objective assessments of those activities by internal audit or
other third parties.
Management’s monitoring of internal control is performed on a continuous basis. Operating company performance is measured and compared to
budgets and long-term plans and key performance indicators that may identify anomalies indicative of a control failure. In addition, the Company has implemented a group-wide performance management system to monitor and measure performance
consistently across the organization.
The Company has a professional internal audit department that reports directly to the Chief Internal Audit Officer. The Chief
Internal Audit Officer reports functionally to the Audit & Finance Committee and administratively to the Chief Financial Officer of the Company. The Audit & Finance Committee reviews Internal Audit’s risk assessment and audit
plan, and regularly receives internal audit reports for review and discussion.
The internal audit department identifies internal control deficiencies, communicates
timely to management and periodically follows up to ensure that the appropriate corrective action has been taken.
Shareholder Matters
Each holder of Delhaize Group ordinary shares is entitled to attend any shareholders’ meeting and to vote on all matters on the agenda of such meeting, provided that such
holder complies with the formalities specified in the notice for the meeting.
The rights of a shareholder to attend the shareholders’ meeting and to vote are
subject to the registration of these shares in the name of this shareholder by 11:59 pm (European Central Time) on the record date, which is the fourteenth day before the meeting, either by registration of registered shares in the register of
registered shares of the Company, or by registration of dematerialized shares in the accounts of an authorized securities account keeper or clearing institution. Shareholders must notify the Company (or the person designated by the Company for this
purpose) of their intent to participate in the shareholders’ meeting, no later than six days before the date of the meeting.
Similarly, a holder of Delhaize
Group American Depositary Shares (“ADSs”) who gives voting instructions to the depositary must arrange for having those ADSs registered by 11:59 pm
(Central European Time) on the record date set by the Company, which is the fourteenth day before the meeting.
Each share or four ADSs is entitled to one vote. The Company’s Articles of Association do not contain any restriction on the exercise of voting rights by the shareholders,
provided that the shareholders are admitted to the Shareholders’ Meeting and their rights are not suspended. The relevant provisions governing the admission of shareholders to the Shareholders’ Meeting are set out in Article 545 of the
Companies Code and Article 31 of the Articles of Association. According to Article 6 of the Articles of Association, the Company may suspend the exercise of the rights vested in a share in the event there are joint owners of a share until one person
has been appointed in writing by all such co-owners to exercise those rights. Article 10 of the Articles of Association provides that the voting rights pertaining to unpaid shares are automatically suspended as long as called payments, duly made and
claimable, have not been made. Finally, voting rights attached to treasury shares held by the Company are suspended (please see page 88 of this Annual Report as to treasury shares).
The Articles of Association of the Company do not contain any restrictions on the transfer of shares or ADSs, except for the prohibition set out in Article 10 of the Articles of
Association that provides the shares that have not been fully paid up may not be transferred unless the Board of Directors has previously approved the transferee.
Belgian law does not require a quorum for the ordinary shareholders’ meetings. Decisions are taken by a simple majority of votes cast at the meeting,
irrespective of the number of Delhaize Group ordinary shares present or represented at the meeting.
Resolutions to amend any provision of the Articles of
Association, including any decision to increase the capital or an amendment which would create an additional class of shares, require a quorum of 50% of the issued capital at an extraordinary shareholders’ meeting. If this quorum requirement is
not achieved at the extraordinary shareholders’ meeting, the Board may convene a second extraordinary shareholders’ meeting for which no quorum is required. Decisions at an extraordinary shareholders’ meeting are taken by the
affirmative vote of at least 75% of the shares present or represented and voting at such meeting, or 80% of such shares if the amendment would change Delhaize Group’s corporate purpose or authorize the Board to repurchase Delhaize Group
ordinary shares.
The Board of Directors has been authorized by the Company’s shareholders to increase the share capital of the Company in one or more
transactions in the aggregate amount of
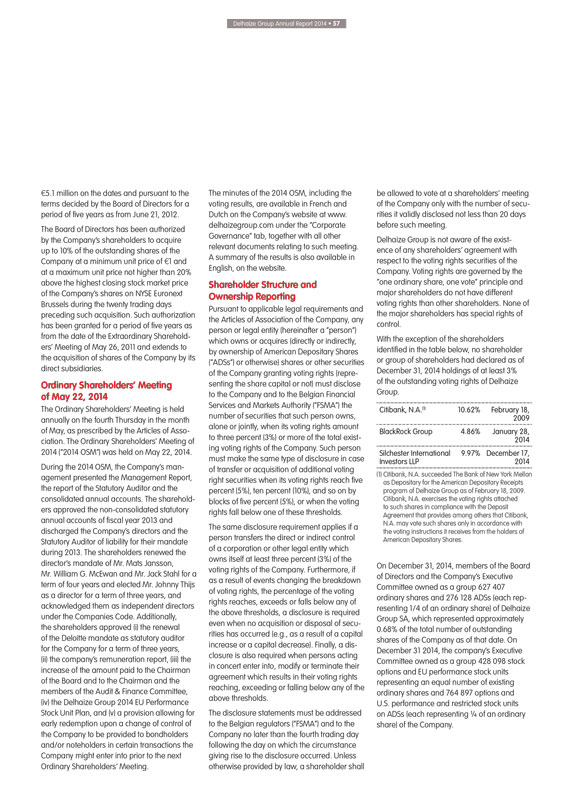
Delhaize Group Annual Report 2014 • 57
€5.1 million on the dates and pursuant to the terms decided by the Board of Directors for a period of five years as from June 21, 2012.
The Board of Directors has been authorized by the Company’s shareholders to acquire up to 10% of the outstanding shares of the Company at a minimum unit price of €1 and
at a maximum unit price not higher than 20% above the highest closing stock market price of the Company’s shares on NYSE Euronext Brussels during the twenty trading days preceding such acquisition. Such authorization has been granted for a
period of five years as from the date of the Extraordinary Shareholders’ Meeting of May 26, 2011 and extends to the acquisition of shares of the Company by its direct subsidiaries.
Ordinary Shareholders’ Meeting of May 22, 2014
The Ordinary Shareholders’
Meeting is held annually on the fourth Thursday in the month of May, as prescribed by the Articles of Association. The Ordinary Shareholders’ Meeting of 2014 (“2014 OSM”) was held on May 22, 2014.
During the 2014 OSM, the Company’s management presented the Management Report, the report of the Statutory Auditor and the consolidated annual accounts. The shareholders
approved the non-consolidated statutory annual accounts of fiscal year 2013 and discharged the Company’s directors and the Statutory Auditor of liability for their mandate during 2013. The shareholders renewed the director’s mandate of
Mr. Mats Jansson, Mr. William G. McEwan and Mr. Jack Stahl for a term of four years and elected Mr. Johnny Thijs as a director for a term of three years, and acknowledged them as independent directors under the Companies
Code. Additionally, the shareholders approved (i) the renewal of the Deloitte mandate as statutory auditor for the Company for a term of three years, (ii) the company’s remuneration report, (iii) the increase of the amount paid
to the Chairman of the Board and to the Chairman and the members of the Audit & Finance Committee, (iv) the Delhaize Group 2014 EU Performance Stock Unit Plan, and (v) a provision allowing for early redemption upon a change of
control of the Company to be provided to bondholders and/or noteholders in certain transactions the Company might enter into prior to the next Ordinary Shareholders’ Meeting.
The minutes of the 2014 OSM, including the voting results, are available in French and Dutch on the Company’s website at www. delhaizegroup.com under the “Corporate
Governance” tab, together with all other relevant documents relating to such meeting. A summary of the results is also available in English, on the website.
Shareholder Structure and Ownership Reporting
Pursuant to applicable legal
requirements and the Articles of Association of the Company, any person or legal entity (hereinafter a “person”) which owns or acquires (directly or indirectly, by ownership of American Depositary Shares (“ADSs”) or otherwise)
shares or other securities of the Company granting voting rights (representing the share capital or not) must disclose to the Company and to the Belgian Financial Services and Markets Authority (“FSMA”) the number of securities that such
person owns, alone or jointly, when its voting rights amount to three percent (3%) or more of the total existing voting rights of the Company. Such person must make the same type of disclosure in case of transfer or acquisition of additional
voting right securities when its voting rights reach five percent (5%), ten percent (10%), and so on by blocks of five percent (5%), or when the voting rights fall below one of these thresholds.
The same disclosure requirement applies if a person transfers the direct or indirect control of a corporation or other legal entity which owns itself at least three percent
(3%) of the voting rights of the Company. Furthermore, if as a result of events changing the breakdown of voting rights, the percentage of the voting rights reaches, exceeds or falls below any of the above thresholds, a disclosure is required
even when no acquisition or disposal of securities has occurred (e.g., as a result of a capital increase or a capital decrease). Finally, a disclosure is also required when persons acting in concert enter into, modify or terminate their agreement
which results in their voting rights reaching, exceeding or falling below any of the above thresholds.
The disclosure statements must be addressed to the Belgian
regulators (“FSMA”) and to the Company no later than the fourth trading day following the day on which the circumstance giving rise to the disclosure occurred. Unless otherwise provided by law, a shareholder shall be allowed to vote at a
shareholders’ meeting of the Company only with the number of securities it validly disclosed not less than 20 days before such meeting.
Delhaize Group is not
aware of the existence of any shareholders’ agreement with respect to the voting rights securities of the Company. Voting rights are governed by the “one ordinary share, one vote” principle and major shareholders do not have different
voting rights than other shareholders. None of the major shareholders has special rights of control.
With the exception of the shareholders identified in the table
below, no shareholder or group of shareholders had declared as of December 31, 2014 holdings of at least 3% of the outstanding voting rights of Delhaize Group.
Citibank, N.A.(1) 10.62% February 18, 2009
BlackRock Group 4.86% January
28, 2014
Silchester International Investors LLP 9.97% December 17, 2014
(1)
Citibank, N.A. succeeded The Bank of New York Mellon as Depositary for the American Depositary Receipts program of Delhaize Group as of February 18, 2009. Citibank, N.A. exercises the voting rights attached to such shares in compliance with the
Deposit Agreement that provides among others that Citibank, N.A. may vote such shares only in accordance with the voting instructions it receives from the holders of American Depositary Shares.
On December 31, 2014, members of the Board of Directors and the Company’s Executive Committee owned as a group 627 407 ordinary shares and 276 128 ADSs (each representing
1/4 of an ordinary share) of Delhaize Group SA, which represented approximately 0.68% of the total number of outstanding shares of the Company as of that date. On December 31 2014, the company’s Executive Committee owned as a group 428 098
stock options and EU performance stock units representing an equal number of existing ordinary shares and 764 897 options and U.S. performance and restricted stock units on ADSs (each representing 1⁄4 of an ordinary share) of the Company.
GOVERNANCE
REMUNERATION REPORT
Executive Compensation Philosophy
The Delhaize Group Remuneration Report is intended to
provide its shareholders and other stakeholders with consistent and transparent information on executive compensation. The Delhaize Group executive compensation program is designed to attract, retain, and motivate our leaders to deliver Company
performance that builds long-term shareholder value. To achieve these objectives, our program is designed around one guiding principle, “Pay for Performance,” which is discussed in more detail below.
Pay for Performance: Delhaize Group rewards achievement of (i) Board-approved financial metrics and (ii) individual goals that are designed to improve our financial
performance and to ensure sustainable long-term profitability, consistent with our Company values.
Delhaize Group believes that an executive’s compensation
should be specifically tied to Company and individual performance.
In this remuneration report, we include information on the following topics:
Changes in the Executive Committee of Delhaize Group;
Delhaize Group’s Remuneration
Policy;
Executive Compensation roles and analysis;
Executive Management
compensation;
Executive Committee Share ownership guidelines;
Main
contractual terms of hiring and termination of Executive Management;
Overview of Director remuneration.
The term “Executive Management” includes the individuals who are members of the Delhaize Group Executive Committee.
Changes in the Executive Committee of Delhaize Group
In 2014, Delhaize Group announced the
following changes in the Executive Committee:
1) The departure of Mr. Nicolas Hollanders, Executive Vice President HR, IT and Sustainability effective
March 13, 2014.
2) The appointment of Mr. Dirk Van den Berghe, CEO Delhaize Belgium and Luxembourg to the Executive Committee effective April 1,
2014.
3) The appointment of Mr. Marc Croonen, Executive Vice President HR, Internal Communications and Sustainability to the Executive Committee effective
May 1, 2014.
4) The appointment of Mr. Kevin Holt to the Executive Committee as CEO Delhaize America effective July 7, 2014.
5) The departure of Mr. Dirk Van den Berghe, CEO Delhaize Belgium and Luxembourg effective August 1, 2014.
6) The departure of Ms. Maura Abeln Smith, Executive Vice President, General Counsel and General Secretary for Delhaize Group effective November 1, 2014.
The related compensation arrangements are discussed below.
Delhaize Group’s Remuneration
Policy
The Board of Directors of Delhaize Group (“the Board”) determines the remuneration of directors and the members of Executive Management, based on
recommendations of the Board’s Remuneration Committee (the “Committee” or “RC”). The Board has adopted a Remuneration Policy that sets forth the principles that guide the Committee and the Board in its decision-making
regarding compensation matters. The Board updates its Remuneration Policy from time to time to reflect changes in its programs or approach. As noted in the Remuneration Policy, the compensation of Executive Management is designed to:
Attract, motivate and retain talented and high-potential executives;
Promote the achievement
of Board-approved performance targets that are aligned with building shareholder value over the short, medium and long-term; and
Recognize and reward both strong
individual contribution and solid team performance.
A copy of the Remuneration Policy may be found on the Company’s website at www.delhaizegroup.com under the
Corporate Governance tab, as an exhibit to the Company’s Corporate Governance Charter.
The Company’s Remuneration Policy reflects its desire to reward
individual and Company performance in a manner that aligns the interests of the Company’s executives, directors and shareholders while also taking into account market practices and the differences between the Group’s operating companies.
As stated in its Remuneration Policy, the Board of Directors has established financial targets for Company performance and individual targets aligned with the
Company’s strategy. Both the structure and the amount of compensation paid to Executive Management are reviewed on an annual basis, and the Board’s compensation decisions take into account both Company and individual performance.
Each member of Executive Management receives compensation in the form of an annual base salary, an annual short-term incentive award and an annual long-term
incentive award. These elements are collectively referred to as “total direct compensation.”
In determining the compensation of Executive Management, the
Committee considers the compensation paid to executives in comparable positions at other companies, and relies on data and analysis provided to the Committee by an external compensation consultant. The objective is to establish target compensation
levels that, as a general rule, are at or around the median market level. The reference companies include comparable retailers in Europe and the United States, as well as other comparably-sized companies in both Europe and the United States, where
benchmarking more broadly is appropriate for the position of an executive. This market-based information, together with the experience and scope of responsibilities are taken into account, along with internal equity factors, to determine each
executive’s target total direct compensation.
The variable performance-based components of the total compensation package are the most significant portion of
total direct compensation.
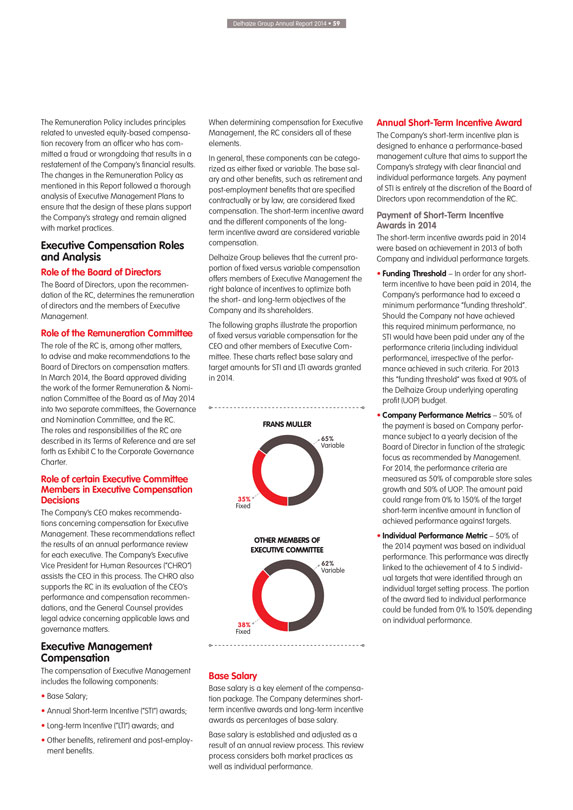
Delhaize Group Annual Report 2014 • 59
The
Remuneration Policy includes principles related to unvested equity-based compensation recovery from an officer who has committed a fraud or wrongdoing that results in a restatement of the Company’s financial results. The changes in the
Remuneration Policy as mentioned in this Report followed a thorough analysis of Executive Management Plans to ensure that the design of these plans support the Company’s strategy and remain aligned with market practices.
Executive Compensation Roles and Analysis
Role of the Board of Directors
The Board of Directors, upon the recommendation of the RC, determines the remuneration of directors and the members of Executive Management.
Role of the Remuneration Committee
The role of the RC is, among other matters, to advise and
make recommendations to the Board of Directors on compensation matters. In March 2014, the Board approved dividing the work of the former Remuneration & Nomination Committee of the Board as of May 2014 into two separate committees, the
Governance and Nomination Committee, and the RC. The roles and responsibilities of the RC are described in its Terms of Reference and are set forth as Exhibit C to the Corporate Governance Charter.
Role of certain Executive Committee Members in Executive Compensation Decisions
The
Company’s CEO makes recommendations concerning compensation for Executive Management. These recommendations reflect the results of an annual performance review for each executive. The Company’s Executive Vice President for Human Resources
(“CHRO”) assists the CEO in this process. The CHRO also supports the RC in its evaluation of the CEO’s performance and compensation recommendations, and the General Counsel provides legal advice concerning applicable laws and
governance matters.
Executive Management Compensation
The compensation of
Executive Management includes the following components:
Base Salary;
Annual
Short-term Incentive (“STI”) awards;
Long-term Incentive (“LTI”) awards; and
Other benefits, retirement and post-employment benefits.
When determining compensation for
Executive Management, the RC considers all of these elements.
In general, these components can be categorized as either fixed or variable. The base salary and
other benefits, such as retirement and post-employment benefits that are specified contractually or by law, are considered fixed compensation. The short-term incentive award and the different components of the long-term incentive award are
considered variable compensation.
Delhaize Group believes that the current proportion of fixed versus variable compensation offers members of Executive Management
the right balance of incentives to optimize both the short- and long-term objectives of the Company and its shareholders.
The following graphs illustrate the
proportion of fixed versus variable compensation for the CEO and other members of Executive Committee. These charts reflect base salary and target amounts for STI and LTI awards granted in 2014.
FRANS MULLER
65% Variable
35% Fixed
OTHER MEMBERS OF EXECUTIVE COMMITTEE
62% Variable
38% Fixed
Base Salary
Base salary is a key element of the compensation package. The Company determines
short-term incentive awards and long-term incentive awards as percentages of base salary.
Base salary is established and adjusted as a result of an annual review
process. This review process considers both market practices as well as individual performance.
Annual Short-Term Incentive Award
The Company’s short-term incentive plan is designed to enhance a performance-based management culture that aims to support the Company’s strategy with clear financial and
individual performance targets. Any payment of STI is entirely at the discretion of the Board of Directors upon recommendation of the RC.
Payment of Short-Term
Incentive Awards in 2014
The short-term incentive awards paid in 2014 were based on achievement in 2013 of both Company and individual performance targets.
Funding Threshold – In order for any short-term incentive to have been paid in 2014, the Company’s performance had to exceed a minimum performance
“funding threshold”.
Should the Company not have achieved this required minimum performance, no STI would have been paid under any of the performance
criteria (including individual performance), irrespective of the performance achieved in such criteria. For 2013 this “funding threshold” was fixed at 90% of the Delhaize Group underlying operating profit (UOP) budget.
Company Performance Metrics – 50% of the payment is based on Company performance subject to a yearly decision of the Board of Director in function of the strategic focus as
recommended by Management.
For 2014, the performance criteria are measured as 50% of comparable store sales growth and 50% of UOP. The amount paid could range from
0% to 150% of the target short-term incentive amount in function of achieved performance against targets.
Individual Performance Metric – 50% of the 2014
payment was based on individual performance. This performance was directly linked to the achievement of 4 to 5 individual targets that were identified through an individual target setting process. The portion of the award tied to individual
performance could be funded from 0% to 150% depending on individual performance.
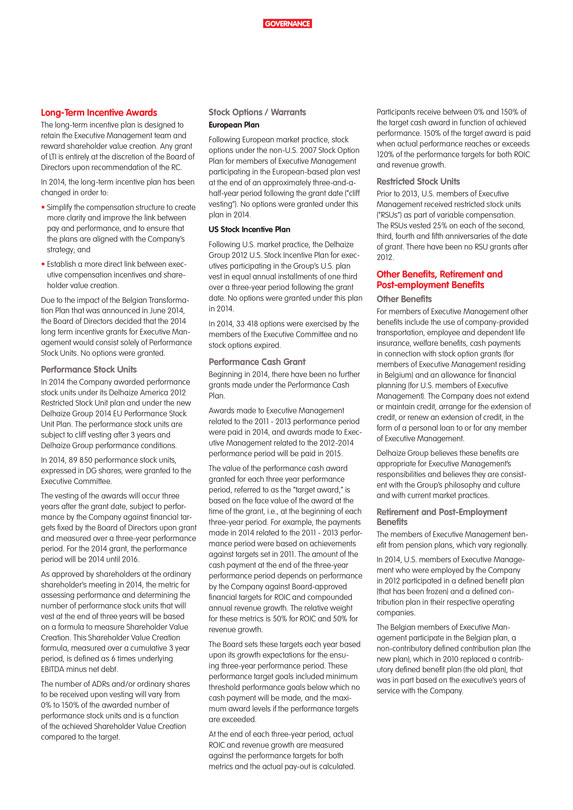
GOVERNANCE
Long-Term Incentive Awards
The long-term incentive plan is designed to retain the Executive Management team and reward shareholder value creation. Any grant of LTI is entirely at the discretion of the Board
of Directors upon recommendation of the RC.
In 2014, the long-term incentive plan has been changed in order to:
Simplify the compensation structure to create more clarity and improve the link between pay and performance, and to ensure that the plans are aligned with the Company’s
strategy; and
Establish a more direct link between executive compensation incentives and shareholder value creation.
Due to the impact of the Belgian Transformation Plan that was announced in June 2014, the Board of Directors decided that the 2014 long term incentive grants for Executive
Management would consist solely of Performance Stock Units. No options were granted.
Performance Stock Units
In 2014 the Company awarded performance stock units under its Delhaize America 2012 Restricted Stock Unit plan and under the new Delhaize Group 2014 EU Performance Stock Unit Plan.
The performance stock units are subject to cliff vesting after 3 years and Delhaize Group performance conditions.
In 2014, 89 850 performance stock units,
expressed in DG shares, were granted to the Executive Committee.
The vesting of the awards will occur three years after the grant date, subject to performance by
the Company against financial targets fixed by the Board of Directors upon grant and measured over a three-year performance period. For the 2014 grant, the performance period will be 2014 until 2016.
As approved by shareholders at the ordinary shareholder’s meeting in 2014, the metric for assessing performance and determining the number of performance stock units that will
vest at the end of three years will be based on a formula to measure Shareholder Value Creation. This Shareholder Value Creation formula, measured over a cumulative 3 year period, is defined as 6 times underlying EBITDA minus net debt.
The number of ADRs and/or ordinary shares to be received upon vesting will vary from 0% to 150% of the awarded number of performance stock units and is a function of the achieved
Shareholder Value Creation compared to the target.
Stock Options / Warrants
European Plan
Following European market practice, stock options under the
non-U.S. 2007 Stock Option Plan for members of Executive Management participating in the European-based plan vest at the end of an approximately three-and-a-half-year period following the grant date (“cliff vesting”). No options were
granted under this plan in 2014.
US Stock Incentive Plan
Following U.S.
market practice, the Delhaize Group 2012 U.S. Stock Incentive Plan for executives participating in the Group’s U.S. plan vest in equal annual installments of one third over a three-year period following the grant date. No options were granted
under this plan in 2014.
In 2014, 33 418 options were exercised by the members of the Executive Committee and no stock options expired.
Performance Cash Grant
Beginning in 2014, there have been no further grants made under the
Performance Cash Plan.
Awards made to Executive Management related to the 2011 - 2013 performance period were paid in 2014, and awards made to Executive Management
related to the 2012-2014 performance period will be paid in 2015.
The value of the performance cash award granted for each three year performance period, referred
to as the “target award,” is based on the face value of the award at the time of the grant, i.e., at the beginning of each three-year period. For example, the payments made in 2014 related to the 2011 - 2013 performance period were based
on achievements against targets set in 2011. The amount of the cash payment at the end of the three-year performance period depends on performance by the Company against Board-approved financial targets for ROIC and compounded annual revenue growth.
The relative weight for these metrics is 50% for ROIC and 50% for revenue growth.
The Board sets these targets each year based upon its growth expectations for the
ensuing three-year performance period. These performance target goals included minimum threshold performance goals below which no cash payment will be made, and the maximum award levels if the performance targets are exceeded.
At the end of each three-year period, actual ROIC and revenue growth are measured against the performance targets for both metrics and the actual pay-out is calculated.
Participants receive between 0% and 150% of the target cash award in function of achieved performance. 150% of the target award is paid when actual performance reaches or exceeds
120% of the performance targets for both ROIC and revenue growth.
Restricted Stock Units
Prior to 2013, U.S. members of Executive Management received restricted stock units (“RSUs”) as part of variable compensation. The RSUs vested 25% on each of the second,
third, fourth and fifth anniversaries of the date of grant. There have been no RSU grants after 2012.
Other Benefits, Retirement and Post-employment Benefits
Other Benefits
For members of Executive Management other benefits include the
use of company-provided transportation, employee and dependent life insurance, welfare benefits, cash payments in connection with stock option grants (for members of Executive Management residing in Belgium) and an allowance for financial planning
(for U.S. members of Executive Management). The Company does not extend or maintain credit, arrange for the extension of credit, or renew an extension of credit, in the form of a personal loan to or for any member of Executive Management.
Delhaize Group believes these benefits are appropriate for Executive Management’s responsibilities and believes they are consistent with the Group’s
philosophy and culture and with current market practices.
Retirement and Post-Employment Benefits
The members of Executive Management benefit from pension plans, which vary regionally.
In
2014, U.S. members of Executive Management who were employed by the Company in 2012 participated in a defined benefit plan (that has been frozen) and a defined contribution plan in their respective operating companies.
The Belgian members of Executive Management participate in the Belgian plan, a non-contributory defined contribution plan (the new plan), which in 2010 replaced a contributory
defined benefit plan (the old plan), that was in part based on the executive’s years of service with the Company.
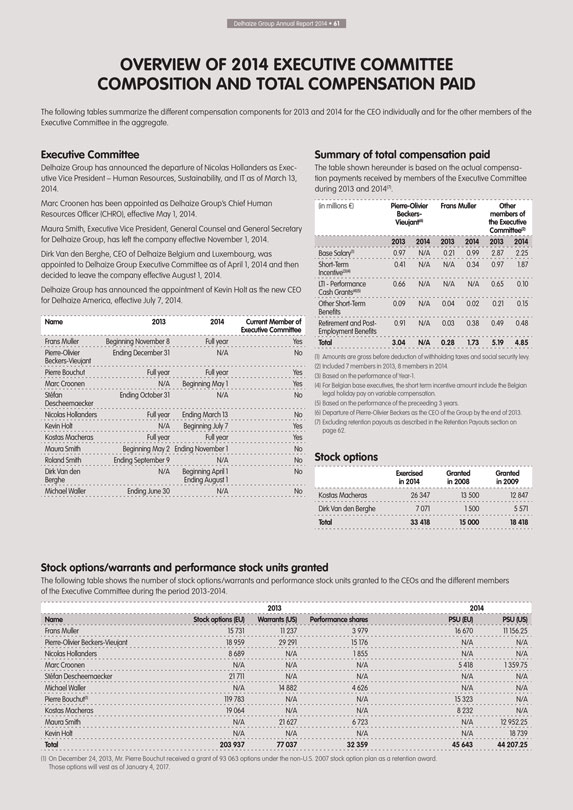
Delhaize Group Annual Report 2014 • 61
OVERVIEW OF 2014 EXECUTIVE COMMITTEE COMPOSITION AND TOTAL COMPENSATION PAID
The following tables summarize the different compensation components for 2013 and 2014 for the CEO individually and for the other members of the Executive
Committee in the aggregate.
Executive Committee
Delhaize Group has announced
the departure of Nicolas Hollanders as Executive Vice President – Human Resources, Sustainability, and IT as of March 13, 2014.
Marc Croonen has been
appointed as Delhaize Group’s Chief Human Resources Officer (CHRO), effective May 1, 2014.
Maura Smith, Executive Vice President, General Counsel and
General Secretary for Delhaize Group, has left the company effective November 1, 2014.
Dirk Van den Berghe, CEO of Delhaize Belgium and Luxembourg, was
appointed to Delhaize Group Executive Committee as of April 1, 2014 and then decided to leave the company effective August 1, 2014.
Delhaize Group has
announced the appointment of Kevin Holt as the new CEO for Delhaize America, effective July 7, 2014.
Name
Frans Muller
Pierre-Olivier
Beckers-Vieujant
Pierre Bouchut
Marc Croonen
Stéfan Descheemaecker
Nicolas Hollanders
Kevin Holt
Kostas Macheras
Maura Smith
Roland Smith
Dirk Van den Berghe
Michael Waller
2013
Beginning November 8
Ending December 31
Full year
N/A
Ending October 31
Full year
N/A
Full year
Beginning May 2
Ending September 9
N/A
Ending June 30
2014
Full year
N/A
Full year
Beginning May 1
N/A
Ending March 13
Beginning July 7
Full year
Ending November 1
N/A
Beginning April 1
Ending August 1 N/A
Current Member of Executive Committee
Yes
No
Yes
Yes
No
No
Yes
Yes
No
No
No
No
Summary of total compensation paid
The table shown hereunder is based on the actual compensation payments received by members of the Executive Committee during 2013 and 2014(7).
(in millions €)
Base Salary(1)
Short-Term Incentive(3)(4)
LTI - Performance Cash Grants(4)(5)
Other Short-Term Benefits
Retirement and Post-Employment Benefits
Total
Pierre-Olivier Beckers-Vieujant(6)
2013
2014
0.97
N/A
0.41
N/A
0.66
N/A
0.09
N/A
0.91
N/A
3.04
N/A
Frans Muller
2013
2014
0.21
0.99
N/A
0.34
N/A
N/A
0.04
0.02
0.03
0.38
0.28
1.73
Other members of the Executive Committee(2)
2013
2014
2.87
2.25
0.97
1.87
0.65
0.10
0.21
0.15
0.49
0.48
5.19
4.85
(1) Amounts are gross before deduction of withholding taxes and social security levy.
(2) Included 7 members in 2013, 8 members in 2014.
(3) Based on the performance of Year-1.
(4) For Belgian base executives, the short term incentive amount include the Belgian legal holiday pay on variable compensation.
(5) Based on the performance of the preceeding 3 years.
(6) Departure of Pierre-Olivier
Beckers as the CEO of the Group by the end of 2013.
(7) Excluding retention payouts as described in the Retention Payouts section on page 62.
Stock options
Kostas Macheras
Dirk Van den Berghe
Total
Exercised in 2014
26 347
7 071
33 418
Granted in 2008
13 500
1 500
15 000
Granted in 2009
12 847
5 571
18 418
Stock options/warrants and performance stock units granted
The following table shows the
number of stock options/warrants and performance stock units granted to the CEOs and the different members of the Executive Committee during the period 2013-2014.
Name
Frans Muller
Pierre-Olivier Beckers-Vieujant
Nicolas Hollanders
Marc Croonen
Stéfan Descheemaecker
Michael Waller
Pierre Bouchut(1)
Kostas Macheras
Maura Smith
Kevin Holt
Total
Stock options (EU)
15 731
18 959
8 689
N/A
21 711
N/A
119 783
19 064
N/A
N/A
203 937
2013
Warrants (US)
11 237
29 291
N/A
N/A
N/A
14 882
N/A
N/A
21 627
N/A
77 037
Performance shares
3 979
15 176
1 855
N/A
N/A
4 626
N/A
N/A
6 723
N/A
32 359
2014
PSU (EU)
16 670
N/A
N/A
5 418
N/A
N/A
15 323
8 232
N/A
N/A
45 643
PSU (US)
11 156.25
N/A
N/A
1 359.75
N/A
N/A
N/A
N/A
12 952.25
18 739
44 207.25
(1) On December 24, 2013, Mr. Pierre Bouchut received a grant of 93 063 options under the non-U.S. 2007 stock option plan as a retention award. Those options will vest as
of January 4, 2017.
GOVERNANCE
All current Executive Management
members participate in the new plan.
One member of Executive Management participates in a Greek defined contribution plan.
Retention Payouts
Following the announcement of the departure of the Delhaize Group CEO by the
end of 2013, the Company established a retention program in August 2013 to maintain management stability and focus on the company’s business plans, with cash awards paid to participants, including certain members of the Executive Committee, if
they were still employed on July 31, 2014.
In execution of this program a total amount of €1.9 million has been paid to the Executive Committee
members who benefited from this program.
Executive Committee Share Ownership Guidelines
Delhaize Group believes that the Executive Committee should be encouraged to maintain a minimum level of share ownership in order to align the interests of the shareholders and the
Executive Committee. In 2008, the Board of Directors adopted share ownership guidelines based on the recommendation of the RC.
Under these guidelines and during
their active employment, the CEO and the other members of the Executive Committee are expected to acquire and maintain ownership of Delhaize Group stock equal to a multiple of the annual base salary. These multiples were set as follows:
CEO
Executive Committee $ payroll
Executive Committee € payroll
300%
200%
100%
The difference between U.S.-based and European-based Executive Committee members is due to the different market practices in these regions and the differences
between the instruments available for Executive Committee members’ remuneration.
New members of the Executive Committee will be allowed a period of five years
to achieve the recommended share ownership levels.
The RC will monitor the compliance with these Guidelines at least once a year. The Board of Directors is
currently satisfied with the progress that has been made thus far.
Main Contractual Terms of Hiring and Termination of Executive Management
The Company’s Executive Management is compensated in accordance with the Company’s Remuneration Policy. Each member of Executive Management has an employment agreement or
management contract that has been approved by the Board of Directors, with total direct compensation determined by reference to data provided by a compensation consultant for similar positions in Europe and/or the US, and taking into account each
person’s experience, skills and expected contributions.
Executive Management is required to abide by the Company’s policies and procedures, including the
Company’s Guide for Ethical Business Conduct. Executive Management is also subject to clauses which are typically included in employment agreements or management contracts for executives.
In October 2013, the Company entered into a management agreement with Frans Muller, who assumed the role of President and CEO of the Group. The management agreement provides for a
termination indemnity of 18 months of total cash compensation and benefits in the event the Company terminates his management contract without cause or if terminated by Mr. Muller for good reason. The termination would not alter the terms
related to vesting, or result in the cancelation, of his outstanding long-term equity incentive awards.
The Company entered into an amended employment agreement
with Pierre Bouchut, CFO of the Group, on October 31, 2013. The amended agreement provides him with termination benefits equal to a maximum of 18 months of total direct compensation and benefits in the event the Company terminates his
employment agreement without cause or if terminated by Mr. Bouchut for good reason. The termination would also result in the forward vesting of previously awarded long-term incentive awards.
Effective July 7, 2014, Kevin Holt joined the Group and was appointed to the Executive Committee, as the new Executive Vice President and Chief Executive Officer of Delhaize
America. His employment agreement provides for a payment of up to 16 months of total cash compensation and benefits, in the event the Company terminates his employment agreement without cause or if terminated by Mr. Holt for good reason. The
termination would also result in the accelerated vesting of all of his outstanding long-term equity incentive awards.
For sake of completeness, the Greek
employment agreement of Kostas Macheras provides for a payment equal to 24 months of total cash compensation in the event the Company terminates his employment without cause in specific circumstances, in case of retirement or, if terminated by
Mr. Macheras for good reason. The termination would also result in forward vesting of all of his outstanding long-term equity incentive awards. The above-mentioned Greek employment relates to the activities of Kostas Macheras as CEO of the
relevant Greek subsidiary.
On March 13, 2014, Nicolas Hollanders, Executive Vice President HR, IT and Sustainability, and the Company entered into a mutually
satisfactory separation agreement that provided Mr. Hollanders with ten months of total direct compensation and benefits, and accelerated or forward vesting of his previously awarded long-term incentive grants.
Effective May 1, 2014, Marc Croonen joined the Group and was appointed to the Executive Committee, as the new Executive Vice President HR, Internal Communications and
Sustainability. His employment agreement provides for a payment equal to twelve months of total cash compensation and benefits, in the event the Company terminates his employment agreement without cause or if terminated by Mr. Croonen for good
reason. The termination would also result in the forward vesting of all of his outstanding long-term equity incentive awards.
In May 2013, the Company entered into
a U.S. employment agreement and an international assignment agreement with Maura Abeln Smith, who was appointed Executive Vice President, General Counsel and General Secretary. Following the termination of her employment contract effective
November 1, 2014, she was provided with a payment equal to twelve months of total cash compensation and benefits. The termination also resulted in accelerated vesting of all of her outstanding long-term equity incentive awards.
Effective April 1, 2014, Dirk Van den Berghe was appointed to the Executive Committee. Mr. Van den Berghe was the CEO of Delhaize Belgium and Luxembourg. Mr. van den
Berghe decided to leave the Company effective August 1, 2014. His employment agreement did not provide for a severance payment in case of resignation.
Overview of Director Remuneration
The Company’s directors are
remunerated for their services with a fixed annual amount, decided by the Board of Directors, which is not to exceed the maximum amounts set by the Company’s shareholders. The maximum amount approved by the shareholders at the Ordinary
Shareholders’ Meeting of May 26,
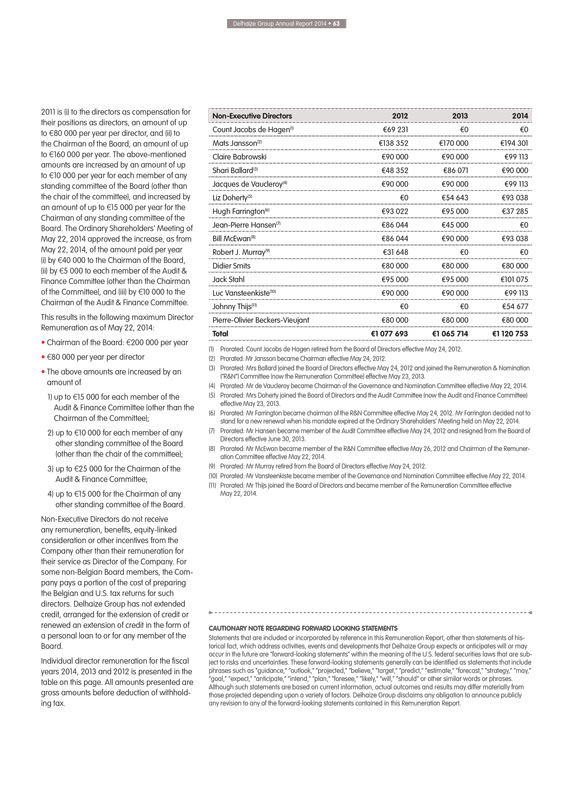
Delhaize Group Annual Report 2014 • 63
2011
is (i) to the directors as compensation for their positions as directors, an amount of up to €80 000 per year per director, and (ii) to the Chairman of the Board, an amount of up to €160 000 per year. The above-mentioned amounts
are increased by an amount of up to €10 000 per year for each member of any standing committee of the Board (other than the chair of the committee), and increased by an amount of up to €15 000 per year for the Chairman of any standing
committee of the Board. The Ordinary Shareholders’ Meeting of May 22, 2014 approved the increase, as from May 22, 2014, of the amount paid per year (i) by €40 000 to the Chairman of the Board, (ii) by €5 000 to
each member of the Audit & Finance Committee (other than the Chairman of the Committee), and (iii) by €10 000 to the Chairman of the Audit & Finance Committee.
This results in the following maximum Director Remuneration as of May 22, 2014:
Chairman
of the Board: €200 000 per year
€80 000 per year per director
The
above amounts are increased by an amount of
1) up to €15 000 for each member of the Audit & Finance Committee (other than the Chairman of the
Committee);
2) up to €10 000 for each member of any other standing committee of the Board (other than the chair of the committee);
3) up to €25 000 for the Chairman of the Audit & Finance Committee;
4) up to
€15 000 for the Chairman of any other standing committee of the Board.
Non-Executive Directors do not receive any remuneration, benefits, equity-linked
consideration or other incentives from the Company other than their remuneration for their service as Director of the Company. For some non-Belgian Board members, the Company pays a portion of the cost of preparing the Belgian and U.S. tax returns
for such directors. Delhaize Group has not extended credit, arranged for the extension of credit or renewed an extension of credit in the form of a personal loan to or for any member of the Board.
Individual director remuneration for the fiscal years 2014, 2013 and 2012 is presented in the table on this page. All amounts presented are gross amounts before deduction of
withholding tax.
Non-Executive Directors
Count Jacobs de Hagen(1)
Mats Jansson(2)
Claire Babrowski
Shari Ballard(3)
Jacques de Vaucleroy(4)
Liz Doherty(5)
Hugh Farrington(6)
Jean-Pierre Hansen(7)
Bill McEwan(8)
Robert J. Murray(9)
Didier Smits
Jack Stahl
Luc Vansteenkiste(10)
Johnny Thijs(11)
Pierre-Olivier Beckers-Vieujant
Total
2012
€69 231
€138 352
€90 000
€48 352
€90 000
€0
€93 022
€86 044
€86 044
€31 648
€80 000
€95 000
€90 000
€0
€80 000
€1 077 693
2013
€0
€170 000
€90 000
€86 071
€90 000
€54 643
€95 000
€45 000
€90 000
€0
€80 000
€95 000
€90 000
€0
€80 000
€1 065 714
2014
€0
€194 301
€99 113
€90 000
€99 113
€93 038
€37 285
€0
€93 038
€0
€80 000
€101 075
€99 113
€54 677
€80 000
€1 120 753
(1) Prorated: Count Jacobs de Hagen retired from the Board of Directors effective May 24, 2012.
(2) Prorated: Mr Jansson became Chairman effective May 24, 2012.
(3) Prorated: Mrs
Ballard joined the Board of Directors effective May 24, 2012 and joined the Remuneration & Nomination (“R&N”) Committee (now the Remuneration Committee) effective May 23, 2013.
(4) Prorated: Mr de Vaucleroy became Chairman of the Governance and Nomination Committee effective May 22, 2014.
(5) Prorated: Mrs Doherty joined the Board of Directors and the Audit Committee (now the Audit and Finance Committee) effective May 23, 2013.
(6) Prorated: Mr Farrington became chairman of the R&N Committee effective May 24, 2012. Mr Farrington decided not to stand for a new renewal when his mandate expired at
the Ordinary Shareholders’ Meeting held on May 22, 2014.
(7) Prorated: Mr Hansen became member of the Audit Committee effective May 24, 2012 and
resigned from the Board of Directors effective June 30, 2013.
(8) Prorated: Mr McEwan became member of the R&N Committee effective May 26, 2012 and
Chairman of the Remuneration Committee effective May 22, 2014.
(9) Prorated: Mr Murray retired from the Board of Directors effective May 24, 2012.
(10) Prorated: Mr Vansteenkiste became member of the Governance and Nomination Committee effective May 22, 2014.
(11) Prorated: Mr Thijs joined the Board of Directors and became member of the Remuneration Committee effective May 22, 2014.
CAUTIONARY NOTE REGARDING FORWARD LOOKING STATEMENTS
Statements that are included or
incorporated by reference in this Remuneration Report, other than statements of historical fact, which address activities, events and developments that Delhaize Group expects or anticipates will or may occur in the future are “forward-looking
statements” within the meaning of the U.S. federal securities laws that are subject to risks and uncertainties. These forward-looking statements generally can be identified as statements that include phrases such as “guidance,”
“outlook,” “projected,” “believe,” “target,” “predict,” “estimate,” “forecast,” “strategy,” “may,” “goal,” “expect,”
“anticipate,” “intend,” “plan,” “foresee,” “likely,” “will,” “should” or other similar words or phrases. Although such statements are based on current information, actual outcomes
and results may differ materially from those projected depending upon a variety of factors. Delhaize Group disclaims any obligation to announce publicly any revision to any of the forward-looking statements contained in this Remuneration Report.
RISK FACTORS
RISK FACTORS
The following discussion reflects business risks that are evaluated by Delhaize Group’s management and the Board of Directors. This section should be read carefully in
relation to Delhaize Group prospects and the forward-looking statements contained in this Annual Report. Any of the following risks could have a material adverse effect on the Group’s financial condition, results of operations or liquidity and
could lead to impairment losses on goodwill, intangible assets and other assets. There may be additional risks of which the Group is unaware. There may also be risks the Group now believes to be immaterial, but which could evolve to have a material
adverse effect.
Strategic Risks
Macro-economic Risk
Potential macro-economic risks facing Delhaize Group include a reduction in consumer spending, cost inflation or retail price deflation, and possible consequences of public
spending cuts in Europe.
General economic conditions such as unemployment rates, business conditions, interest rates, energy and fuel costs and tax rates could
reduce consumer spending or change consumer purchasing habits. Weaker consumer spending can negatively impact profitability due to pressure on sales and margins. If labor costs and the cost of goods sold, which are the Group’s primary operating
costs, increase above retail inflation rates, this could have an adverse effect on the Group’s profitability. Where possible, cost increases are recovered through retail price adjustments and increased operating efficiencies.
Delhaize Group is particularly susceptible to macroeconomic conditions in the U.S. In 2014, 63% of the Group’s revenues were generated in the U.S. (2013: 61%), where its
stores are located on the East Coast. Consequently, the Group’s operations depend significantly upon the economic conditions in this area.
In Europe, core and
retail inflation are particularly low, which may in turn result in a slide into a deflationary environment. This could impact consumers and suppliers resulting in reduced consumer spending. In Greece and Serbia, public spending cuts could put
additional pressure on consumer spending. Furthermore, in Greece, Delhaize Group is exposed to the possible aftermath of the sovereign debt crisis. This will likely continue to have an adverse impact on consumer spending and may cause the company to
impair assets and record lower contribution in operating results.
Expansion Risk
Delhaize Group’s ability to open new stores is dependent on purchasing or entering into leases on commercially reasonable terms, for properties that are suitable for its
needs. If the Group fails to secure such properties on a timely basis, its growth may be impaired. Similarly, its business may be harmed if it is unable to renew leases on its existing stores on commercially acceptable terms.
Acquisition and Integration Risk
Delhaize Group may pursue acquisition opportunities in the
food retail industry. Delhaize Group generally focuses on the acquisition of businesses operating the same or similar store formats in geographical areas where it currently operates or in adjacent areas. By acquiring other businesses, the Group will
face risks related to the integration of these businesses. These risks include, but are not limited to, incurring significantly higher than anticipated financing costs and operating expenses, failing to assimilate the operations and personnel of
acquired businesses, failing to install and integrate all necessary systems and controls, the loss of customers, entering markets where Delhaize Group has no or limited experience, the disruption of the Group’s ongoing business and the
overburdening of Delhaize Group’s management resources. In addition, the realization of the anticipated benefits of an acquisition, store renovation, market
renewal or store opening may take several years or may not occur at all. The above risks may also have a negative impact on goodwill recognized in the financial
statements in connection with such acquisitions (see also Note 6 “Goodwill” in the Financial Statements). Acquisitions may, in general, place a significant strain on Delhaize Group’s management, operational, financial and other
resources. The lack of suitable acquisition targets at acceptable prices also may limit the Group’s growth opportunities.
Divestiture Risk
Delhaize Group regularly evaluates the potential disposition of assets and businesses that may no longer help meet the Group’s objectives. When selling or disposing of assets
or businesses, the Group may encounter difficulty in finding suitable buyers or developing alternative exit strategies on acceptable terms in a timely manner. Delhaize Group may also dispose of a business at a price or on terms that are less
desirable than anticipated. In addition, the Group may experience greater dis-synergies than expected. After reaching an agreement with a buyer for the disposition of assets or a business, Delhaize Group is subject to the risk of reaching
satisfactory closing conditions as well as to the risk of failing to obtain necessary regulatory and governmental approvals on acceptable terms, which, if not satisfied or obtained, may prevent the completion of the transaction. Dispositions may
also involve continued financial commitments related to the divested business, such as through continuing service agreements, equity ownership, guarantees, indemnities
Delhaize Group Annual Report 2014 • 65
or
other financial obligations. The Company’s business or financial results may be negatively affected if divestitures are not successfully completed.
Risk
Related to Competitive Activity
The food retail industry is competitive and characterized by narrow profit margins. Delhaize Group faces heavy competition from
traditional supermarkets as well as hypermarkets, club stores, and other alternative formats. The Group’s profitability could be impacted by the pricing, purchasing, financing, advertising or promotional decisions made by these competitors. To
the extent Delhaize Group reduces prices or increases expenses to support sales in the face of competition, its net income and cash generated from operations could be negatively impacted.
Operational Risks
Risk Related to Events of Exceptional Nature
Delhaize Group’s operations, assets and staff can be exposed to risks related to events of an exceptional nature including, but not limited to, severe weather, natural
disasters, floods, terrorist attacks, hostage taking, political unrest, fire, power outages, information technology failures, food poisoning, health epidemics, and accidents. Such events could have a significant effect on the Group’s employees,
its supply chain, stores and relationships with its customers, all of which can affect the Group’s financial condition, results of operations and cash flows. The Group continuously evaluates and addresses possible threats linked to external
events and has taken measures, such as business continuity plans, where appropriate to plan for such events. The effectiveness of the Group’s preventive measures in limiting financial losses will vary according to the nature and severity of any
exceptional event, and the extent to which such losses may be recovered through the Group’s insurance coverage discussed below in “Insurance Risk.”
Risk Related to Social Actions
At the end of 2014, Delhaize Group had union
representation in its operations in Belgium, the Grand-Duchy of Luxembourg, Romania, Greece and Serbia. In its U.S. operations, the Group has union representation in one of its nine distribution centers for which a collective bargaining agreement
with the union was in effect until February 2015.
Delhaize Group’s operations and results could be negatively affected by social actions initiated by trade
unions or other parts of its workforce, in which event the Group cannot ensure that it would be able to adequately meet the needs of its customers, trading affiliates, and suppliers. This risk applies particularly to Belgium, where operational
results have been impacted by the announcement of the Transformation Plan in June 2014.
Risk Related to Information Technology Systems
Delhaize Group’s operations are dependent on IT systems for many functions and processes. These systems have been developed and are maintained and operated by internal experts
and/or external suppliers. Failure of these systems may cause disruptions in Delhaize Group’s operations, affecting sales, purchases and profitability. On a regular basis, Delhaize Group endeavors to update systems by industry leading standard
packages and technologies. In addition, there are ongoing efforts to stabilize these “legacy” systems in order to ensure the continuity of business operations.
Delhaize Group’s information systems, including back-up systems, can be subject to damage or interruption from power outages, computer and telecommunications failures, and
security breaches. If the Group’s information systems cease to function properly, a significant investment to repair or replace them may be required, and interruptions in operations may be experienced in the interim. Any material interruption
in the Group’s information systems and back-up systems may have a material adverse effect on the Delhaize Group’s financial condition, results of operations and cash flows.
If third parties are able to penetrate Delhaize Group’s network security or otherwise misappropriate customers’ personal information or credit or debit card information,
or if third parties are given improper access to such customers’ information, the Group could be subject to claims from customers and other parties. This liability could, for instance, include fines, reimbursement of costs for re-issuing
replacement cards and credit monitoring services as well as claims related to unauthorized purchases with credit card information, identity theft and other fraud-related claims. The Group’s information security measures are designed to minimize
exposure to security breaches, but failure to prevent such breaches could subject the Group to liability, damage its reputation, and diminish the value of Delhaize Group’s brands.
Risk Related to Delhaize Group Affiliated Stores and Franchisees
Approximately 20% of the
stores in the Delhaize Group’s sales network are affiliated or franchised. The operators of affiliated and franchised stores operate their stores as independent third parties. Although the Group attempts to properly select, train and support
the operators of affiliated and franchised stores, the ultimate success and quality of any affiliated or franchised store rests with its operator. If the operators of the Group’s affiliated and franchised stores do not operate in a manner
consistent with the Group’s standards, Delhaize Group’s image and reputation could be harmed, which could adversely affect the Group’s business and operating results. Also, failure to maintain a profitable business relationship or the
eventual loss of a significant number of affiliated or franchised partners could have a negative impact on Delhaize Group’s financial results.
Risk Related to
Delhaize Group Suppliers
Significant disruptions in the operations of, or in relationships with, vendors and suppliers could materially impact operations by
disrupting store-level product availability or costs, resulting in reduced sales. The products that Delhaize Group sells are sourced from a wide variety of international and local suppliers in each of the regions where the Delhaize Group operates.
The Group has committed to achieve certain goals related to the sustainable sourcing of products, and this sourcing may be impacted by elements outside of Delhaize Group’s control and may include political and economic instability in the
countries in which suppliers are located, their financial situation and any other condition that may
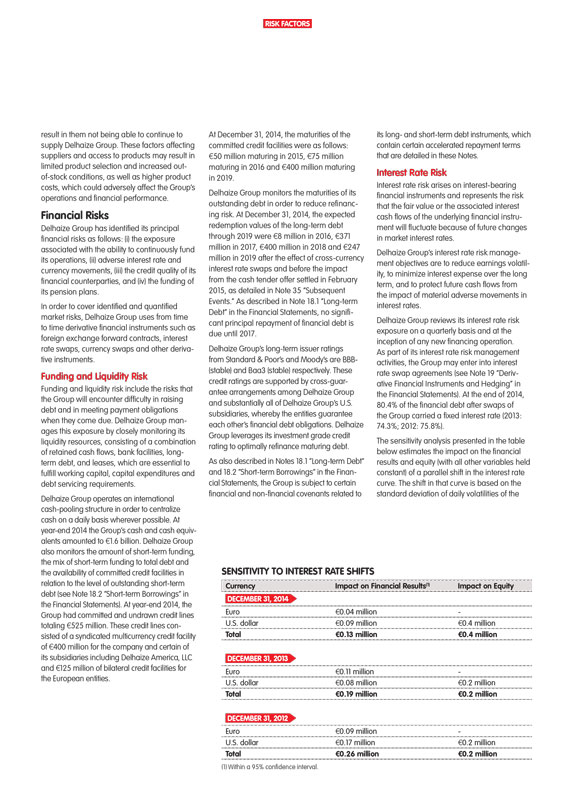
RISK FACTORS
result in them not being able to
continue to supply Delhaize Group. These factors affecting suppliers and access to products may result in limited product selection and increased out-of-stock conditions, as well as higher product costs, which could adversely affect the Group’s
operations and financial performance.
Financial Risks
Delhaize Group has
identified its principal financial risks as follows: (i) the exposure associated with the ability to continuously fund its operations, (ii) adverse interest rate and currency movements, (iii) the credit quality of its financial
counterparties, and (iv) the funding of its pension plans.
In order to cover identified and quantified market risks, Delhaize Group uses from time to time
derivative financial instruments such as foreign exchange forward contracts, interest rate swaps, currency swaps and other derivative instruments.
Funding and
Liquidity Risk
Funding and liquidity risk include the risks that the Group will encounter difficulty in raising debt and in meeting payment obligations when they
come due. Delhaize Group manages this exposure by closely monitoring its liquidity resources, consisting of a combination of retained cash flows, bank facilities, long-term debt, and leases, which are essential to fulfill working capital, capital
expenditures and debt servicing requirements.
Delhaize Group operates an international cash-pooling structure in order to centralize cash on a daily basis wherever
possible. At year-end 2014 the Group’s cash and cash equivalents amounted to €1.6 billion. Delhaize Group also monitors the amount of short-term funding, the mix of short-term funding to total debt and the availability of committed credit
facilities in relation to the level of outstanding short-term debt (see Note 18.2 “Short-term Borrowings” in the Financial Statements). At year-end 2014, the Group had committed and undrawn credit lines totaling €525 million. These
credit lines consisted of a syndicated multicurrency credit facility of €400 million for the company and certain of its subsidiaries including Delhaize America, LLC and €125 million of bilateral credit facilities for the European
entities.
At December 31, 2014, the maturities of the committed credit facilities were as follows: €50 million maturing in 2015,
€75 million maturing in 2016 and €400 million maturing in 2019.
Delhaize Group monitors the maturities of its outstanding debt in order to
reduce refinancing risk. At December 31, 2014, the expected redemption values of the long-term debt through 2019 were €8 million in 2016, €371 million in 2017, €400 million in 2018 and €247 million in
2019 after the effect of cross-currency interest rate swaps and before the impact from the cash tender offer settled in February 2015, as detailed in Note 35 “Subsequent Events.” As described in Note 18.1 “Long-term Debt” in
the Financial Statements, no significant principal repayment of financial debt is due until 2017.
Delhaize Group’s long-term issuer ratings from
Standard & Poor’s and Moody’s are BBB (stable) and Baa3 (stable) respectively. These credit ratings are supported by cross-guarantee arrangements among Delhaize Group and substantially all of Delhaize Group’s U.S.
subsidiaries, whereby the entities guarantee each other’s financial debt obligations. Delhaize Group leverages its investment grade credit rating to optimally refinance maturing debt.
As also described in Notes 18.1 “Long-term Debt” and 18.2 “Short-term Borrowings” in the Financial Statements, the Group is subject to certain financial and
non-financial covenants related to its long- and short-term debt instruments, which contain certain accelerated repayment terms that are detailed in these Notes.
Interest Rate Risk
Interest rate risk arises on interest-bearing financial
instruments and represents the risk that the fair value or the associated interest cash flows of the underlying financial instrument will fluctuate because of future changes in market interest rates.
Delhaize Group’s interest rate risk management objectives are to reduce earnings volatility, to minimize interest expense over the long term, and to protect future cash flows
from the impact of material adverse movements in interest rates.
Delhaize Group reviews its interest rate risk exposure on a quarterly basis and at the inception
of any new financing operation. As part of its interest rate risk management activities, the Group may enter into interest rate swap agreements (see Note 19 “Derivative Financial Instruments and Hedging” in the Financial Statements). At
the end of 2014, 80.4% of the financial debt after swaps of the Group carried a fixed interest rate (2013: 74.3%; 2012: 75.8%).
The sensitivity analysis presented
in the table below estimates the impact on the financial results and equity (with all other variables held constant) of a parallel shift in the interest rate curve. The shift in that curve is based on the standard deviation of daily volatilities of
the
SENSITIVITY TO INTEREST RATE SHIFTS
Currency Impact on Financial
Results(1) Impact on Equity
DECEMBER 31, 2014
Euro €0.04 million -
U.S. dollar €0.09 million €0.4 million
Total €0.13 million
€0.4 million
DECEMBER 31, 2013
Euro €0.11 million -
U.S. dollar €0.08 million €0.2 million
Total €0.19 million €0.2 million
DECEMBER 31, 2012
Euro €0.09 million -
U.S. dollar €0.17 million €0.2 million
Total €0.26 million €0.2 million
(1) Within a 95% confidence interval.
Delhaize Group Annual Report 2014 • 67
“Reference Interest Rates” (Euribor 3 months and Libor 3 months) during the year, within a 95% confidence interval.
Currency Risk
Delhaize Group’s foreign currency risk management objectives are to
minimize the impact of currency fluctuations on the Group’s income statement, cash flows and balance sheet, using foreign exchange contracts, including derivative financial instruments such as currency swaps and forward instruments (see Note 19
“Derivative Financial Instruments and Hedging” in the Financial Statements).
Translation exposure
Delhaize Group’s consolidated financial statements are presented in euros. The results of operations and the financial position of each of Delhaize Group’s entities whose
functional currency is not the euro must be translated into euros at the applicable foreign currency exchange rate for inclusion in the Group’s consolidated financial statements (see also Note 2.3 “Summary of Significant Accounting
Policies” in the Financial Statements with respect to translation of foreign currencies).
Delhaize Group does not hedge this “translation exposure”.
However, the Group aims to minimize this exposure by funding the operations of Delhaize Group’s entities in their functional currency, wherever feasible.
If
the average U.S. dollar exchange rate had been 1 cent higher/lower and all other variables were held constant, the Group’s net profit would have increased/decreased by €2 million in 2014 (€1 million in 2013 and
€2 million in 2012), solely due to the translation of the financial statements denominated in U.S. dollars. The effect from the translation of the functional currency to the reporting currency of the Group does not affect the cash flows in
local currencies.
In 2014, 77% of the Group’s EBITDA was generated in U.S. dollars (64% and 63% in 2013 and 2012, respectively). At December 31, 2014,
66% of the Group’s financial debt after cross-currency swaps was denominated in U.S. dollars (69% and 65% in 2013 and 2012, respectively).
Transaction
exposure
The Group’s exposure to fluctuations in foreign currency in its business operations is limited as operating companies’ purchases and sales are
primarily denominated in their functional currency.
The Group is exposed to foreign currency risks only on monetary items not denominated in the functional
currency of the respective reporting entities, such as trade receivables and payables denominated in a foreign currency, financial assets classified as available for sale, derivatives, financial instruments not designated as hedge relationships and
borrowings denominated in a foreign currency. If at December 31, 2014, the U.S. dollar had strengthened/weakened by 12% (estimate based on the standard deviation of daily volatilities of the Euro/U.S. dollar exchange rate during 2014 using a
95% confidence interval), the Group’s net profit (all other variables held constant) would have been €5 million higher/lower (2013 and 2012: also €4 million higher/lower with a rate shift of 14% and 17%, respectively).
Credit and Counterparty Risks
Credit risk is the risk that one party to an
agreement will cause a financial loss to another party by failing to discharge its obligation. Credit risk covers trade receivables, cash and cash equivalents, short term deposits and derivative instruments.
In order to reduce its counterparty risk, Delhaize Group enters from time to time into netting agreements with counterparties whereby the amounts owed by the parties can and will
be offset if certain conditions are met (see Note 10.2 “Offsetting of Financial Instruments” in the Financial Statements).
The credit risk on trade
receivables relates mainly to the wholesale activity in Belgium. Although the company covers part of this risk by entering into credit insurance policies with external insurers, most of the exposure is self-insured. In connection with the cash and
cash equivalents, short term deposits, and derivative instruments, Delhaize Group requires a minimum credit quality for its financial investments (see Notes 11 “Investments in Securities” and 14 “Receivables” in the Financial
Statements for further details).
Delhaize Group requires a minimum short term rating of A1/P1 and a minimum long term rating of A2/A for its deposit and investment
transactions. Delhaize Group may deviate from this requirement from time to time for operational reasons.
The Group’s exposure to changes in credit ratings of
its counterparties is continuously monitored and the aggregate value of transactions concluded is spread amongst approved counterparties. Counterparty risk is always assessed with reference to the aggregate exposure to a single counterparty or group
of related parties to minimize concentration of risk.
Pension Plan Risk
Most
operating companies of Delhaize Group have pension plans, the structures and benefits of which vary with conditions and practices in the countries where these companies operate. Pension benefits may be provided through defined contribution plans or
defined benefit plans.
A defined contribution plan is a post-employment benefit plan under which Delhaize Group and/or the associate pays fixed contributions
usually to a separate entity. Under such a plan, there are no legal or constructive obligations to pay further contributions, regardless of the performance of the funds held to satisfy future benefit payments. The actual retirement benefits are
determined by the value of the contributions paid and the subsequent performance of investments made with these funds. In Belgium, the defined contribution plans include a minimum guaranteed return, which is substantially guaranteed by an external
insurance company that receives and manages the contributions. These plans have some defined benefit plan features (as discussed further below) which may result in a limited level of underfunding due to the declining return of long-term low risk
investments. Delhaize Group monitors to which extent a potential liability can arise from these plans and recognizes material exposures in its balance sheet, if any.
RISK FACTORS
A defined benefit plan is a
post-employment benefit plan which normally defines an amount of benefit that an employee will receive upon retirement, usually dependent on one or more factors such as age, years of service, compensation and/or guaranteed returns on contributions.
Delhaize Group operates defined benefit plans at several of its companies and approximately 24% of Delhaize Group’s associates were covered by defined benefit
plans at the end of 2014.
If, at the balance sheet date, the fair value of the plan assets of a defined benefit plan, are lower than the defined benefit
obligations (determined based on actuarial assumptions), the Group would bear a theoretical “underfunding risk” at that moment in time. At the end of 2014, Delhaize Group recognized a net liability of €135 million (2013:
€117 million; 2012: €136 million) to cover such underfunding.
Details on pension plans at Delhaize Group and its subsidiaries can be found in Note 21.1
“Pension Plans” in the Financial Statements.
Insurance Risk
The
Group manages its insurable risk through a combination of external insurance coverage and self-insurance. Delhaize Group uses captive self-insurance program to provide flexibility and optimize costs. In deciding whether to purchase external
insurance or self-insure, the Group considers the frequency and severity of losses, its experience in mitigating risk through safety and other internal risk prevention programs, the cost and terms of external insurance, and whether external
insurance coverage is mandatory.
The main risks covered by Delhaize Group’s insurance programs are property, liability and healthcare. Delhaize America uses a
captive structure for its self-insured retention programs for its workers’ compensation, general liability, automotive accident, and pharmacy claims.
In the
event of a substantial loss there is a risk that external insurance coverage or self-insurance reserves may not be sufficient to cover the loss. Although the Group assesses an external insurer’s financial strength at the time we purchase
insurance coverage, it is possible that the financial condition of the insurer may deteriorate over time in which case it may be unable to meet its obligation to pay a loss. It is possible that Delhaize Group, due to changes in financial or
insurance markets, will be unable to continue to purchase certain insurance coverages on commercially reasonable terms.
Reserves for self-insured retentions are
based upon actuarial estimates of claims reported and claims incurred but not reported. Delhaize Group believes these estimates are reasonable, however these estimates are subject to a high degree of variability and uncertainty caused by such
factors as future interest and inflation rates, future economic conditions, litigation and claims settlement trends, legislative and regulatory changes, changes in benefit levels and the frequency and severity of incurred but not reported claims. It
is possible that the final resolution of some claims may require Delhaize Group to make significant expenditures in excess of existing reserves.
Self-insurance
provisions of €152 million are included as a liability on the balance sheet as of December 31, 2014. More information on self-insurance can be found in Note 20.2 “Self Insurance Provisions” and related investments held to
cover the self-insurance exposure are included in Note 11 “Investments in Securities” to the Financial Statements.
If external insurance is not
sufficient to cover losses or is not collectable, or if self-insurance expenditures exceed existing reserves, the Group’s financial condition and results of operation may be adversely affected.
Compliance and Regulatory Risks
Litigation Risk
From time to time, Delhaize Group is involved in legal actions, including matters involving personnel and employment issues, personal injury, antitrust claims, product liability
claims, environment liability claims, contract claims and other proceedings arising in the ordinary course of business. The Group regularly reviews its exposure to the claims and litigation arising in the normal course of operations. It recognizes a
provision when it has a present obligation as a result of a past event, it is probable that an outflow of economic resources will be required to settle the obligation, and the amount of such obligation can be reliably estimated. As of
December 31, 2014 the Group believes that it has made adequate provisions for such exposures. Any litigation, however, involves risk and unexpected outcomes could result in an adverse effect on the Group’s financial statements. More
information on pending litigation can be found in Note 34 “Contingencies” in the Financial Statements.
Regulatory Risk
Delhaize Group is subject to federal, regional, state, and local laws and regulations in each country in which it operates relating to, among others, zoning, land use, antitrust
restrictions, work place safety, public health and safety, environmental protection, community right-to-know, information security and data protection, alcoholic beverage and tobacco sales, and pharmaceutical sales. A number of jurisdictions
regulate the licensing of supermarkets, including retail alcoholic beverage licenses. In certain jurisdictions, Delhaize Group is prohibited from selling alcoholic beverages in its stores. Employers are also subject to laws governing their
relationship with associates, including minimum wage requirements, overtime, working conditions, disabled access and work permit requirements. Compliance with, or changes in, these laws could reduce the revenues and profitability of the Group’s
stores and could affect its business, financial condition, or results of operations.
The Group is subject to a variety of antitrust and similar legislation in the
countries in which it operates. In a number of geographies, the Group has a large number of stores which may make future significant acquisitions more difficult. In addition, Delhaize Group is subject to legislation in many of the jurisdictions in
which it operates relating to unfair competitive practices and similar behavior. Delhaize Group has been subject to and may in the future be subject to allegations of, or further regulatory investigations or proceedings into, such practices. Such
allegations, investigations or proceedings (irrespective of merit), may require the Group to devote significant management resources to defending itself against such allegations. In the event that such allegations are proven, Delhaize Group may be
subject to significant fines, damages, awards and other expenses, and its reputation may be harmed.
Delhaize Group Annual Report 2014 • 69
For
information on pending antitrust matters, see Note 34 “Contingencies” in the Financial Statements.
Delhaize Group actively strives to ensure compliance
with all laws and regulations to which it is subject. The Guide for Ethical Business Conduct that replaced the former Code of Conduct was implemented in 2010 and revised in January 2015. Policies have been adopted to further support its compliance
program. In addition anti-fraud and other appropriate training is being implemented throughout the Group.
Product Liability Risk
The packaging, marketing, distribution and sale of food products entail an inherent risk of exposure to claims for product liability and product recall. Such products may contain
contaminants that may be inadvertently distributed by Delhaize Group. These contaminants may, in certain cases, result in illness, injury or death. As a consequence, Delhaize Group has an exposure to product liability claims. The Group purchases
insurance to cover such risk. However, if a product liability claim is successful, the Group’s insurance may not be adequate to cover all liabilities it may incur, and it may not be able to continue to maintain such insurance or obtain
comparable insurance at a reasonable cost.
In addition, even if a product liability claim is not successful or is not fully pursued, the negative publicity
surrounding any assertion that the Group’s products caused illness or injury could affect the Group’s reputation, its business, financial condition and results of operations.
Delhaize Group is committed to providing its customers with safe food products. The Group has food safety guidelines and policies in place in each country where it operates, and
they are vigorously followed.
Risk of Environmental Liability
Delhaize Group
is subject to laws and regulations that govern activities that may have adverse environmental effects. Delhaize Group may be responsible for the remediation of such environmental conditions and may be subject to associated liabilities relating to
its stores and the land on which its stores, warehouses and offices are located, regardless of whether the Group leases, subleases or owns the stores, warehouses or land in question and regardless of whether such environmental conditions were
created by the Group or by a prior owner or tenant. The Group has put in place control procedures at its operating companies to identify, prioritize and resolve adverse environmental conditions.
Risk Related to Internal Controls
Delhaize Group routinely assesses the quality and
effectiveness of its internal controls. Because of its inherent limitations, internal control over financial reporting may not prevent or detect misstatements. Therefore, even effective internal controls can provide only reasonable assurance with
respect to the preparation and fair presentation of financial statements. If the Group fails to maintain the adequacy of its internal controls, including any failure to implement required new or improved controls, or if it experiences difficulties
in the implementation of internal controls, the Group’s business and operating results could be harmed, and it could fail to meet its reporting obligations.
As a company filing financial reports under U.S. law, Delhaize Group is required to meet the requirements of Section 404 of the Sarbanes-Oxley Act of 2002,
which requires management and the Statutory Auditor to report on their assessment of the effectiveness of the Group’s internal control over financial reporting.
The Group’s 2013 annual report filed on Form 20-F includes management’s conclusion that the Group’s internal control over financial reporting is
effective as of December 31, 2013. In the same Form 20-F, the Statutory Auditor concluded that the Group maintained, in all material respects, effective control over financial reporting as of December 31, 2013.
Tax Audit Risk
Delhaize Group is regularly audited in the various jurisdictions in which it
does business, which it considers to be part of its ongoing business activity. While the ultimate outcome of these audits is not certain, Delhaize Group has considered the merits of its filing positions in its overall evaluation of potential tax
liabilities and believes it has adequate liabilities recorded in its consolidated financial statements for potential exposures. Unexpected outcomes as a result of these audits could adversely affect Delhaize Group’s financial statements. For
more information on tax audits in jurisdictions where we conduct business, see Note 34 “Contingencies” in the Financial Statements.

FINANCIAL STATEMENTS
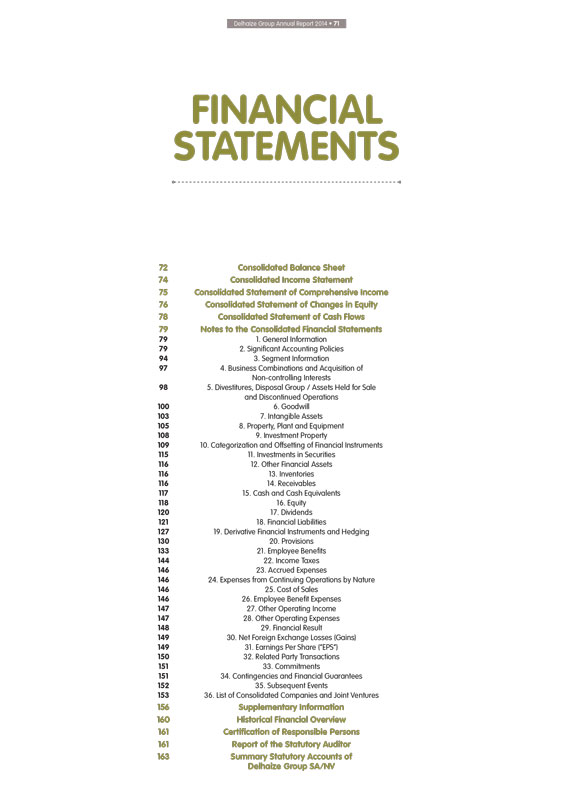
Delhaize Group Annual Report 2014 • 71
FINANCIAL STATEMENTS
72 Consolidated Balance Sheet
74 Consolidated Income Statement
75 Consolidated Statement of Comprehensive Income
76 Consolidated Statement of Changes in Equity
78 Consolidated Statement of Cash Flows
79 Notes to the Consolidated Financial Statements
79 1. General Information
79 2. Significant Accounting Policies
94 3. Segment Information
97 4. Business Combinations and Acquisition of Non-controlling Interests
98 5. Divestitures,
Disposal Group / Assets Held for Sale and Discontinued Operations
100 6. Goodwill
103 7. Intangible Assets
105 8. Property, Plant and Equipment
108 9. Investment Property
109 10. Categorization and Offsetting of Financial Instruments
115 11. Investments in Securities
116 12. Other Financial Assets
116 13. Inventories
116 14. Receivables
117 15. Cash and Cash Equivalents
118 16. Equity
120 17. Dividends
121 18. Financial Liabilities
127 19. Derivative Financial Instruments and Hedging
130 20. Provisions
133 21. Employee Benefits
144 22. Income Taxes
146 23. Accrued Expenses
146 24. Expenses from Continuing Operations by Nature
146 25. Cost of Sales
146 26. Employee Benefit Expenses
147 27. Other Operating Income
147 28. Other Operating Expenses
148 29. Financial Result
149 30. Net Foreign Exchange Losses (Gains)
149 31. Earnings Per Share (“EPS”)
150 32. Related Party Transactions
151 33. Commitments
151 34. Contingencies and Financial Guarantees
152 35. Subsequent Events
153 36. List of Consolidated Companies and Joint Ventures
156 Supplementary Information
160 Historical Financial Overview
161 Certification of Responsible Persons
161 Report of the Statutory Auditor
163 Summary Statutory Accounts of Delhaize Group SA/NV
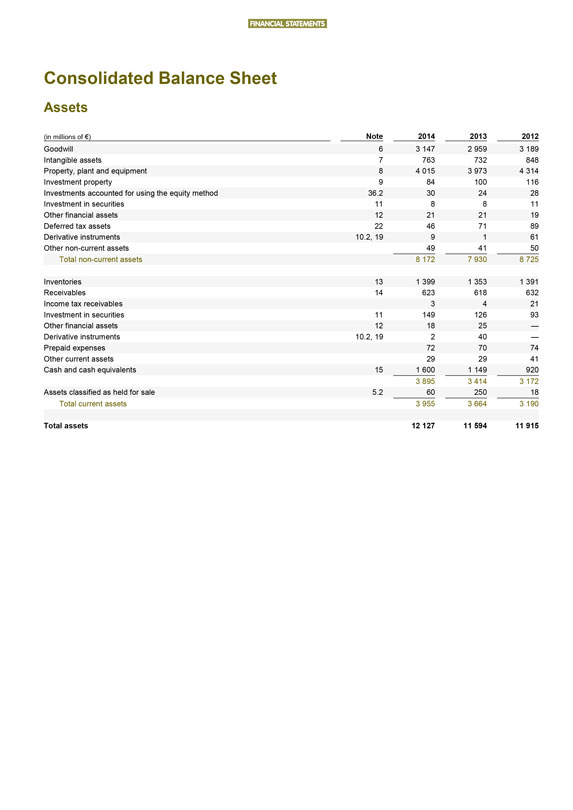
FINANCIAL STATEMENTS
Consolidated Balance Sheet
Assets
(in millions of €) Note 2014 2013 2012
Goodwill 6 3 147 2 959 3 189
Intangible assets 7 763 732 848
Property, plant and equipment 8 4 015 3 973 4 314
Investment property 9 84 100 116
Investments accounted for using the equity method 36.2 30 24 28
Investment in securities 11 8
8 11
Other financial assets 12 21 21 19
Deferred tax assets 22 46 71 89
Derivative instruments 10.2, 19 9 1 61
Other non-current assets 49 41 50
Total non-current assets 8 172 7 930 8 725
Inventories 13 1 399 1 353 1 391
Receivables 14 623 618 632
Income tax receivables 3 4 21
Investment in securities 11 149 126 93
Other financial assets 12 18 25 —
Derivative instruments 10.2, 19 2 40 —
Prepaid expenses 72 70 74
Other current assets 29 29 41
Cash and cash equivalents 15 1 600 1 149 920
3 895 3 414 3 172
Assets classified as held for sale 5.2 60 250 18
Total current assets 3 955 3 664 3 190
Total assets 12 127 11 594 11 915
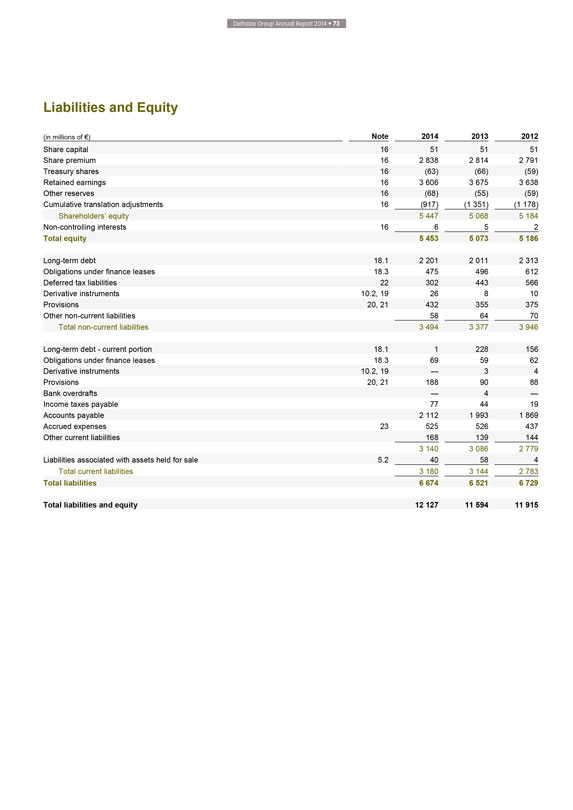
Delhaize Group Annual Report 2014 • 73
Liabilities and Equity
(in millions of €) Note 2014 2013 2012
Share capital 16 51 51 51
Share premium 16 2 838 2 814 2 791
Treasury shares 16 (63) (66) (59)
Retained earnings 16 3 606 3 675 3 638
Other reserves 16 (68) (55) (59)
Cumulative translation adjustments 16 (917) (1 351) (1 178)
Shareholders’ equity 5 447 5 068 5 184
Non-controlling interests 16 6 5
2
Total equity 5 453 5 073 5 186
Long-term debt 18.1 2 201 2 011 2 313
Obligations under finance leases 18.3 475 496 612
Deferred tax liabilities 22
302 443 566
Derivative instruments 10.2, 19 26 8 10
Provisions 20, 21 432 355
375
Other non-current liabilities 58 64 70
Total non-current liabilities 3
494 3 377 3 946
Long-term debt - current portion 18.1 1 228 156
Obligations
under finance leases 18.3 69 59 62
Derivative instruments 10.2, 19 — 3 4
Provisions 20, 21 188 90 88
Bank overdrafts — 4 —
Income taxes payable 77 44 19
Accounts payable 2 112 1 993 1 869
Accrued expenses 23 525 526 437
Other current liabilities 168 139 144
3 140 3 086 2 779
Liabilities associated with assets held for sale 5.2 40 58 4
Total current liabilities 3 180 3 144 2 783
Total liabilities 6 674 6 521 6 729
Total liabilities and equity 12 127 11 594 11 915
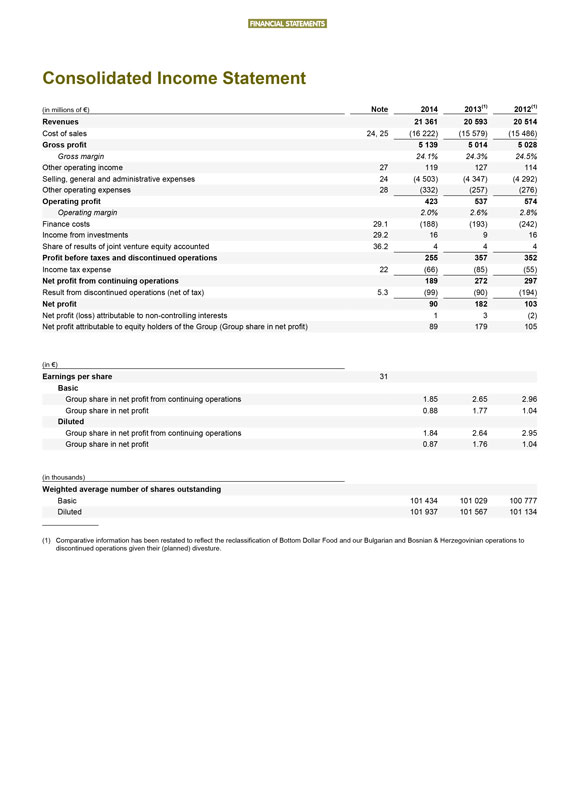
FINANCIAL STATEMENTS
Consolidated Income Statement
(in millions of €)
Note
2014
2013(1)
2012(1)
Revenues
21 361
20 593
20 514
Cost of sales
24, 25
(16 222)
(15 579)
(15 486)
Gross profit
5 139
5 014
5 028
Gross margin
24.1%
24.3%
24.5%
Other operating income
27
119
127
114
Selling, general and administrative expenses
24
(4 503)
(4 347)
(4 292)
Other operating expenses
28
(332)
(257)
(276)
Operating profit
423
537
574
Operating margin
2.0%
2.6%
2.8%
Finance costs
29.1
(188)
(193)
(242)
Income from investments
29.2
16
9
16
Share of results of joint venture equity accounted
36.2
4
4
4
Profit before taxes and discontinued operations
255
357
352
Income tax expense
22
(66)
(85)
(55)
Net profit from continuing operations
189
272
297
Result from discontinued operations (net of tax)
5.3
(99)
(90)
(194)
Net profit
90
182
103
Net profit (loss) attributable to non-controlling interests
1
3
(2)
Net profit attributable to equity holders of the Group (Group share in net profit)
89
179
105
(in €)
Earnings per share
31
Basic
Group share in net profit from continuing operations
1.85
2.65
2.96
Group share in net profit
0.88
1.77
1.04
Diluted
Group share in net profit from continuing operations
1.84
2.64
2.95
Group share in net profit
0.87
1.76
1.04
(in thousands)
Weighted average number of shares outstanding
Basic
101 434
101 029
100 777
Diluted
101 937
101 567
101 134
(1) Comparative information has been restated to reflect the reclassification of Bottom Dollar Food and our Bulgarian and Bosnian & Herzegovinian operations to
discontinued operations given their (planned) divesture.
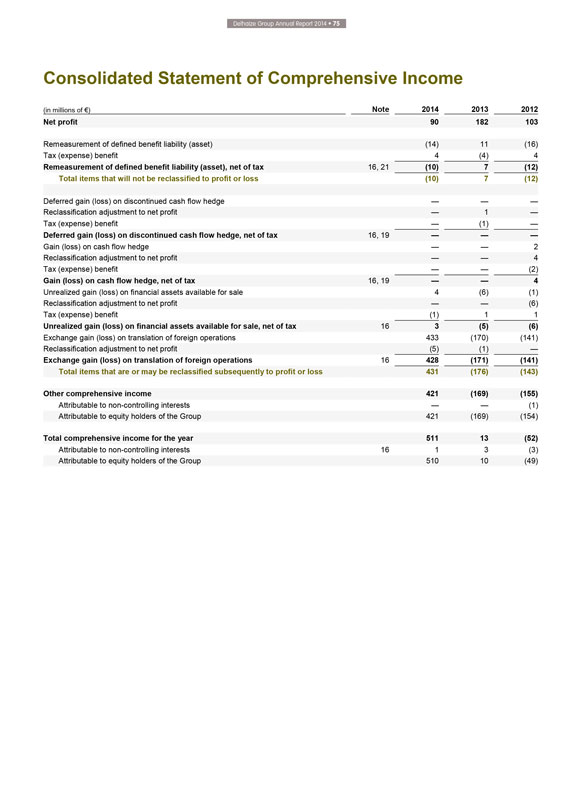
Delhaize Group Annual Report 2014 • 75
Consolidated Statement of Comprehensive Income
(in millions of €) Note
2014 2013 2012
Net profit 90 182 103
Remeasurement of defined benefit
liability (asset) (14) 11 (16)
Tax (expense) benefit 4 (4) 4
Remeasurement of
defined benefit liability (asset), net of tax 16, 21 (10) 7 (12)
Total items that will not be reclassified to profit or loss (10) 7 (12)
Deferred gain (loss) on discontinued cash flow hedge — — —
Reclassification
adjustment to net profit — 1 —
Tax (expense) benefit — (1) —
Deferred gain (loss) on discontinued cash flow hedge, net of tax 16, 19 — — —
Gain (loss) on cash flow hedge — — 2
Reclassification adjustment to
net profit — — 4
Tax (expense) benefit — — (2)
Gain
(loss) on cash flow hedge, net of tax 16, 19 — — 4
Unrealized gain (loss) on financial assets available for sale 4 (6) (1)
Reclassification adjustment to net profit — — (6)
Tax (expense) benefit (1) 1 1
Unrealized gain (loss) on financial assets available for sale, net of tax 16 3 (5) (6)
Exchange gain (loss) on translation of foreign operations 433 (170) (141)
Reclassification
adjustment to net profit (5) (1) —
Exchange gain (loss) on translation of foreign operations 16 428 (171) (141)
Total items that are or may be reclassified subsequently to profit or loss 431 (176) (143)
Other comprehensive income 421 (169) (155)
Attributable to non-controlling
interests — — (1)
Attributable to equity holders of the Group 421 (169) (154)
Total comprehensive income for the year 511 13 (52)
Attributable to non-controlling interests
16 1 3 (3)
Attributable to equity holders of the Group 510 10 (49)
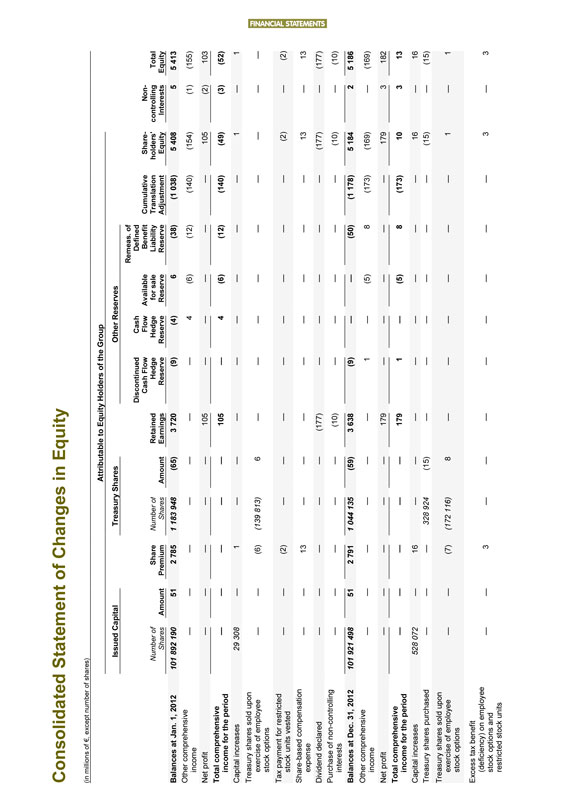
FINANCIAL STATEMENTS
Consolidated Statement of
Changes in Equity
(in millions of €, except number of shares)
Attributable to Equity Holders of the Group
Issued Capital Treasury Shares
Other Reserves
Number of Shares Amount Share Premium Number of Shares Amount Retained Earnings Discontinued Cash Flow Hedge Reserve Cash Flow Hedge Reserve
Available for sale Reserve Remeas. of Defined Benefit Liability Reserve Cumulative Translation Adjustment Shareholders’ Equity Non-controlling Interests Total Equity
Balances at Jan. 1, 2012 101 892 190 51 2 785 1 183 948 (65) 3 720 (9) (4) 6 (38) (1 038) 5 408 5 5 413
Other comprehensive income — — — — — — — 4 (6) (12) (140) (154) (1) (155)
Net profit — — — — — 105 — — — — — 105 (2) 103
Total comprehensive income for the period — — — — — 105 — 4 (6) (12) (140) (49) (3) (52)
Capital increases 29 308 — 1 — — — — — — — — 1 — 1
Treasury shares sold upon exercise of employee stock options — — (6) (139 813) 6 — — — — — — — — —
Tax payment for restricted stock units vested — — (2) — — — — — — — — (2) — (2)
Share-based compensation expense — — 13 — — — — — — — — 13 — 13
Dividend declared — — — — — (177) — — — — — (177) — (177)
Purchase of non-controlling interests — — — — — (10) — — — — — (10) — (10)
Balances at Dec. 31, 2012 101 921 498 51 2 791 1 044 135 (59) 3 638 (9) — — (50) (1 178) 5 184 2 5 186
Other comprehensive income — — — — — — 1 — (5) 8 (173) (169) — (169)
Net profit — — — — — 179 — — — — — 179 3 182
Total comprehensive income for the period — — — — — 179 1 — (5) 8 (173) 10 3 13
Capital increases 528 072 — 16 — — — — — — — — 16 — 16
Treasury shares purchased — — — 328 924 (15) — — — — — — (15) — (15)
Treasury shares sold upon exercise of employee stock options — — (7) (172 116) 8 — — — — — — 1 — 1
Excess tax benefit (deficiency) on employee stock options and restricted stock units — — 3 — — — — — — — — 3 — 3
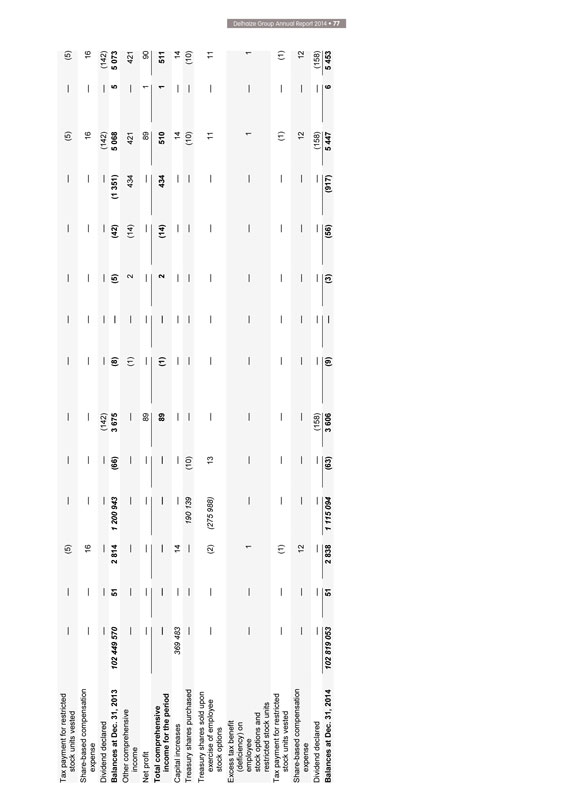
Delhaize Group Annual Report 2014 • 77
Tax
payment for restricted stock units vested — — (5) — — — — — — — — (5) — (5)
Share-based compensation expense
— — 16 — — — — — — — — 16 — 16
Dividend declared — — — — — (142) — —
— — — (142) — (142)
Balances at Dec. 31, 2013 102 449 570 51 2 814 1 200 943 (66) 3 675 (8) — (5) (42) (1 351) 5 068 5 5 073
Other comprehensive income — — — — — — (1) — 2 (14) 434 421 — 421
Net profit — — — — — 89 — — — — — 89 1 90
Total comprehensive income for the period — — — — — 89 (1) — 2 (14) 434 510 1 511
Capital increases 369 483 — 14 — — — — — — — — 14 — 14
Treasury shares purchased — — — 190 139 (10) — — — — — — (10) — (10)
Treasury shares sold upon exercise of employee stock options — — (2) (275 988) 13 — — — — — — 11 — 11
Excess tax benefit (deficiency) on employee stock options and restricted stock units — — 1 — — — — — — — — 1 — 1
Tax payment for restricted stock units vested — — (1) — — — — — — — — (1) — (1)
Share-based compensation expense — — 12 — — — — — — — — 12 — 12
Dividend declared — — — — — (158) — — — — — (158) — (158)
Balances at Dec. 31, 2014 102 819 053 51 2 838 1 115 094 (63) 3 606 (9) — (3) (56) (917) 5 447 6 5 453
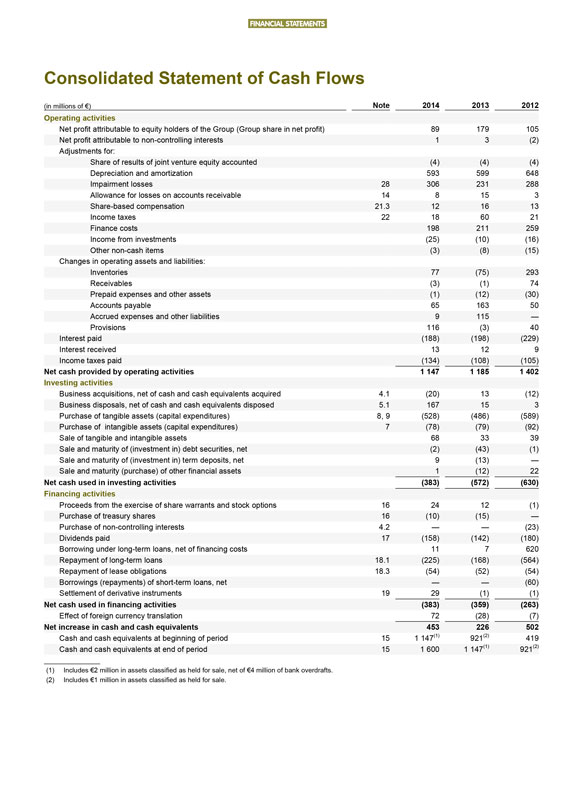
FINANCIAL STATEMENTS
Consolidated Statement of
Cash Flows
(in millions of €) Note 2014 2013 2012
Operating activities
Net profit attributable to equity holders of the Group (Group share in net profit) 89 179 105
Net profit attributable to non-controlling interests 1 3 (2)
Adjustments for:
Share of results of joint venture equity accounted (4) (4) (4)
Depreciation and amortization
593 599 648
Impairment losses 28 306 231 288
Allowance for losses on accounts
receivable 14 8 15 3
Share-based compensation 21.3 12 16 13
Income taxes 22
18 60 21
Finance costs 198 211 259
Income from investments (25) (10) (16)
Other non-cash items (3) (8) (15)
Changes in operating assets and
liabilities:
Inventories 77 (75) 293
Receivables (3) (1) 74
Prepaid expenses and other assets (1) (12) (30)
Accounts payable 65 163 50
Accrued expenses and other liabilities 9 115 —
Provisions 116 (3) 40
Interest paid (188) (198) (229)
Interest received 13 12 9
Income taxes paid (134) (108) (105)
Net cash provided by operating activities 1 147 1 185 1
402
Investing activities
Business acquisitions, net of cash and cash
equivalents acquired 4.1 (20) 13 (12)
Business disposals, net of cash and cash equivalents disposed 5.1 167 15 3
Purchase of tangible assets (capital expenditures) 8, 9 (528) (486) (589)
Purchase of
intangible assets (capital expenditures) 7 (78) (79) (92)
Sale of tangible and intangible assets 68 33 39
Sale and maturity of (investment in) debt securities, net (2) (43) (1)
Sale and maturity of
(investment in) term deposits, net 9 (13) —
Sale and maturity (purchase) of other financial assets 1 (12) 22
Net cash used in investing activities (383) (572) (630)
Financing activities
Proceeds from the exercise of share warrants and stock options 16 24 12 (1)
Purchase of
treasury shares 16 (10) (15) —
Purchase of non-controlling interests 4.2 — — (23)
Dividends paid 17 (158) (142) (180)
Borrowing under long-term loans, net of financing costs 11
7 620
Repayment of long-term loans 18.1 (225) (168) (564)
Repayment of lease
obligations 18.3 (54) (52) (54)
Borrowings (repayments) of short-term loans, net — — (60)
Settlement of derivative instruments 19 29 (1) (1)
Net cash used in financing activities (383)
(359) (263)
Effect of foreign currency translation 72 (28) (7)
Net increase
in cash and cash equivalents 453 226 502
Cash and cash equivalents at beginning of period 15 1 147(1) 921(2) 419
Cash and cash equivalents at end of period 15 1 600 1 147(1) 921(2)
(1) Includes
€2 million in assets classified as held for sale, net of €4 million of bank overdrafts.
(2) Includes €1 million in assets classified
as held for sale.
Delhaize Group Annual Report 2014 • 79
Notes
to the Consolidated Financial Statements
1. General Information
The principal
activity of Delhaize Group (also referred to, with its consolidated entities, except where the context otherwise requires, as “we”, “us”, “our”, “the Group” and “the Company”) is the operation of
food supermarkets through company-operated, affiliated and franchised stores. Affiliated stores are stores with a Delhaize Group banner that are operated by independent third parties to whom we sell our products at wholesale prices. The Group’s
store network also includes other store formats such as proximity, cash and carry and specialty stores. The Company is present in seven countries on three continents.
The Company is a limited liability company incorporated and domiciled in Belgium, with its shares listed on NYSE Euronext
Brussels and on the New York Stock Exchange (“NYSE”), under the symbols “DELB” and “DEG”, respectively.
The consolidated financial statements for the year ended December 31, 2014, as presented in this annual report, were prepared under the responsibility of the Board of
Directors and authorized for issue by the Board of Directors on March 4, 2015, subject to approval of the statutory non-consolidated financial statements by the shareholders at the Ordinary General Meeting to be held on May 28, 2015. In
compliance with Belgian law, the consolidated financial statements will be presented for information purposes to the shareholders of Delhaize Group at the same meeting. The consolidated financial statements are not subject to amendment except
conforming changes to reflect decisions, if any, of the shareholders with respect to the statutory non-consolidated financial statements affecting the consolidated financial statements.
2. Significant Accounting Policies
2.1 Basis of Preparation
The consolidated financial statements comprise the financial statements of Delhaize Group and its subsidiaries as of December 31, 2014 except for the U.S. subsidiaries for
which the fiscal year ends the Saturday closest to December 31. Consequently, the consolidated results of Delhaize Group for 2014, 2013 and 2012 include the results of operations of its U.S. subsidiaries for the 53 weeks ended January 3,
2015, 52 weeks ended December 28, 2013 and 52 weeks ended December 29, 2012.
Delhaize Group’s consolidated financial statements are prepared in
accordance with International Financial Reporting Standards (IFRS) as issued by the International Accounting Standards Board (IASB), and as adopted by the European Union (EU). Currently, the only difference between the effective IFRS as issued by
the IASB and as adopted by the EU relates to certain paragraphs of IAS 39 Financial Instruments: Recognition and Measurement, which are not mandatorily applicable in the EU (so-called “carve-out”). Delhaize Group is not affected by the
carve-out and therefore for the Group there is no difference between the effective IFRS as issued by the IASB and adopted by the EU. We further refer to the disclosures made in connection with the “Initial Application of New, Revised or Amended
IASB Pronouncements” in Note 2.2 and “Standards and Interpretations Issued but not yet Effective” in Note 2.5.
The preparation of financial
statements in conformity with IFRS requires the use of certain critical accounting estimates. It also requires management to exercise its judgment in the process of applying the Group’s accounting policies. The areas involving a higher degree
of judgment or complexity, or areas where assumptions and estimates are significant to the consolidated financial statements are disclosed in Note 2.4.
These
financial statements have been prepared under the historical cost convention except for derivative financial instruments, available for sale financial assets and financial liabilities being part of a designated fair value hedge relationship that
have been measured at fair value, as disclosed in the corresponding notes. Assets and disposal groups classified as held for sale have been measured at the lower of carrying amount and fair value less costs to sell.
Fair value is the price that would be received to sell an asset or paid to transfer a liability in an orderly transaction between market participants, at the measurement date, in
the principal (or in the absence thereof most advantageous) market. The fair value of an asset or a liability is measured using the assumptions that market participants would use when pricing the asset or liability, assuming that market participants
act in their economic best interest.
A fair value measurement of a non-financial asset takes into account a market participant’s ability to generate economic
benefits by using the asset in its highest and best use or by selling it to another market participant that would use the asset in its highest and best use.
The
Group uses valuation techniques that are appropriate for the relevant circumstances and for which sufficient data are available to measure fair value, maximizing the use of relevant observable inputs and minimizing the use of unobservable inputs.
FINANCIAL STATEMENTS
All assets and liabilities
for which fair value is measured or disclosed in the financial statements are categorized within the fair value hierarchy, described as follows, based on the lowest level input that is significant to their fair value measurement as a whole:
Level 1 – Quoted (unadjusted) market prices in active markets for identical assets or liabilities;
Level 2 – Valuation techniques for which the lowest level input that is significant to the fair value measurement is directly or indirectly observable;
Level 3 – Valuation techniques for which the lowest level input that is significant to the fair value measurement is unobservable.
For assets and liabilities that are recognized in the financial statements on a recurring basis, the Group determines whether transfers have occurred between levels in the
hierarchy by re-assessing categorization (based on the lowest level input that is significant to the fair value measurement as a whole) at the end of each reporting period.
The Group has established detailed procedures in connection with acquisition or disposal of non-financial assets and related valuations. Above a certain threshold, the valuation
process is centrally led by the Group’s internal valuation teams, with the final valuation requiring Group CEO and in certain cases Board of Directors approval. In this process, external experts can be appointed to support the valuation, which
is decided on a case-by-case basis. The Group gives prominence to using valuation techniques based on the income approach (e.g.: discounted cash-flow) and uses other techniques, like market approach, as supporting or benchmarking tools.
Fair value related disclosures for financial instruments and non-financial assets that are measured at fair value or where fair values are disclosed are summarized in the
respective individual notes.
2.2 Initial Application of New, Revised or Amended IASB Pronouncements
The accounting policies adopted are consistent with those of the previous financial year except for the following new, amended or revised IASB pronouncements that have been adopted
as of January 1, 2014:
Amendments to IFRS 10, IFRS 12 and IAS 27 Investment Entities;
Amendments to IFRS 13 Short-term Receivables and Payables issued as part of Annual Improvements 2010 – 2012 Cycle;
Amendments to IAS 32 Offsetting Financial Assets and Financial Liabilities;
Amendments to IAS
39 Novation of Derivatives and Continuation of Hedge Accounting; and
· IFRIC 21 Levies.
Where the adoption of a new, amended or revised pronouncement has a significant impact on the presentation of the financial statements or performance of the Group, its impact is
described below.
IFRIC 21 Levies
The interpretation clarifies the accounting
for an obligation to pay a levy that is not income tax. In doing so, IFRIC 21 defines a levy very widely as an outflow of resources embodying economic benefits that is imposed by governments on entities in accordance with legislation and are
(i) not included within the scope of other IFRS and (ii) not fines or penalties imposed for breaches of legislation. The interpretation then addresses what the obligating event is that gives rise to pay a levy and when a liability should
be recognized, i.e. at after which point of time the Group can no longer avoid the outflow of economic benefit by its own actions. IFRIC 21 had no impact on the 2014 full year financial statements.
2.3 Summary of Significant Accounting Policies
The principal accounting policies applied in
the preparation of these consolidated financial statements are described below. These policies have been consistently applied for all financial years presented except as explained in Note 2.2.
In the event of the presentation of discontinued operations, the comparative income statement is re-presented as if the operation presented as discontinued operations during the
period had been discontinued from the start of the comparative period (see Note 5.3).
Principles of Consolidation
The consolidated financial statements are prepared using uniform accounting policies for like transactions and other events in similar circumstances. Subsidiaries are fully
consolidated, while investments in joint ventures are accounted for using the equity method. Accounting policies of subsidiaries and joint ventures have been adjusted, where necessary, to ensure consistency with the Group policies.
Investments in subsidiaries: Subsidiaries are all entities - including structured entities - over which the Group has control. The Group controls an entity when the Group is
exposed to, or has rights to, variable returns from its involvement with the entity and has the ability to affect those returns through its power over the entity. Subsidiaries are fully consolidated from the date of acquisition, being the date on
which the Group obtains control, and continue to be consolidated until the date such
Delhaize Group Annual Report 2014 • 81
control ceases. All intra-group assets and liabilities, equity, income, expenses and cash flows relating to transactions between members of the Group are
eliminated in full.
Non-controlling interests represent the portion of profit or loss and net assets that is not held by the Group and are presented separately in
the consolidated income statement and within equity in the consolidated balance sheet, separately from the parent shareholders’ equity.
Transactions with
non-controlling interests that do not result in loss of control are accounted for as transactions between shareholders and therefore have no impact on profit or loss (this applies also to related acquisition costs) nor on goodwill. The difference
between fair value of any consideration received or paid and the relevant share acquired or disposed of the carrying value of net assets of the subsidiary is recorded directly in retained earnings.
The list of all subsidiaries of the Group is presented in Note 36.
Investments in joint
ventures: A joint venture is a type of joint arrangement whereby the parties that have joint control of the arrangement have rights to the net assets of the joint venture. Joint control is the contractually agreed sharing of control of an
arrangement, which exists only when decisions about the relevant activities require unanimous consent.
Investments in joint ventures are accounted for using the
equity method. Under this method, interests in joint ventures are initially recognized at cost. The carrying amount of the investment is adjusted to recognize changes in the Group’s share of net assets of the joint ventures following the
acquisition date. Goodwill relating to the joint venture is included in the carrying amount of the investment and is neither amortized nor individually tested for impairment.
The consolidated income statement reflects the Group’s share of the results of operations of the joint venture. Any change in other comprehensive income of the joint venture
is presented as part of the Group’s other comprehensive income. In addition, when there has been a change recognized directly in the equity of a joint venture, the Group recognizes its share of any changes, when applicable, in the statement of
changes in equity. Unrealized gains and losses resulting from transactions between the Group and its joint ventures are eliminated to the extent of the interest in each joint venture.
The aggregate of the Group’s share of profit or loss of its joint ventures is shown on the face of the consolidated income statement outside operating profit.
After application of the equity method, the Group determines whether it is necessary to recognize an impairment loss on its investment in joint ventures. If there is an objective
evidence of impairment, the Group calculates the amount of impairment as the difference between the recoverable amount of a joint venture and its carrying amount and recognizes any loss as “Share of results of joint venture equity
accounted” in profit or loss.
Upon loss of joint control over a joint venture, the Group measures and recognizes any retained investment at its fair value.
Any difference between the carrying amount of a joint venture upon loss of joint control and the fair value of the retained investment and proceeds from disposal
is recognized in profit or loss.
The Group has assessed its rights and obligations in connection with its investment in Super Indo and has classified it as joint
venture (see Note 36).
Investments in associates: The Group currently holds no investments in entities over which Delhaize Group has significant influence, but no
control or joint control (“associates”).
Business Combinations and Goodwill
Business combinations are accounted for using the acquisition method. Under this method, the cost of an acquisition is measured as the aggregate of the consideration transferred,
measured at acquisition date fair value, and the amount of any non-controlling interest in the acquiree. For each business combination, the acquirer measures the non-controlling interest in the acquiree, either at fair value or at the proportionate
share of the acquiree’s identifiable net assets. Acquisition costs incurred are expensed and included in “Selling, general and administrative expenses”. When Delhaize Group acquires a business, it assesses the financial assets and
liabilities assumed for appropriate classification and designation based on the facts and circumstances at the acquisition date (except for lease and insurance agreements, which are classified on the basis of the contractual terms and other factors
at the inception of the respective contract). This includes the separation of embedded derivatives in host contracts by the acquiree. If the business combination is achieved in stages, the acquisition date fair value of the acquirer’s
previously held equity interest in the acquiree is remeasured to fair value at the acquisition date through profit or loss. Any contingent consideration to be transferred by the acquirer will be initially recognized and subsequently measured at fair
value except for contingent considerations classified as equity instrument that are not re-measured following initial measurement. Goodwill is initially measured at cost being the excess of the aggregate of the consideration transferred and the
amount recognized for non-controlling interests over the net identifiable assets acquired and liabilities assumed. If this consideration is lower than the fair value of the net assets of the subsidiary acquired, the difference is recognized in
profit or loss.
After initial recognition, goodwill is not amortized, but annually reviewed for impairment and whenever there is an indication that goodwill may be
impaired. For the purpose of testing goodwill for impairment, goodwill is allocated to each of the Group’s cash generating units that are expected to benefit from the synergies of the combination, irrespective of whether other assets or
liabilities of the acquiree are assigned to those units.
FINANCIAL STATEMENTS
Non-current Assets / Disposal
Groups Held for Sale and Discontinued Operations
Non-current assets and disposal groups are classified and presented in the balance sheet as held for sale if their
carrying amount will be recovered through a sale transaction rather than through continuing use.
This condition is regarded as met only when the sale is highly
probable and the asset (or disposal group) is available for immediate sale in its present condition. When a subsidiary is held for sale, all of its assets and liabilities are classified as held for sale when the conditions are met, even when the
Group retains a non-controlling interest. Non-current assets that will be abandoned are excluded from the scope of IFRS 5.
Immediately before classification as
held for sale, the assets (or components of a disposal group) are re-measured in accordance with the Group’s accounting policies. Thereafter, non-current assets (or disposal group) held for sale are measured at the lower of their carrying
amount or fair value less costs to sell. If the impairment exceeds the carrying value of the non-current assets within the scope of IFRS 5 Non-current Assets Held for Sale and Discontinued Operations measurement guidance, Delhaize Group recognizes a
separate provision to reflect the difference in its financial statements. Non-current assets are not depreciated or amortized once classified as held for sale. See further details in Note 5.2.
A discontinued operation is a component of a business that either has been disposed of, or is classified as held for sale, and:
represents a separate major line of business or geographical area of operations;
is part of a
single coordinated plan to dispose of a separate major line of business or geographical area of operations; or
is a subsidiary acquired exclusively with a view to
resale.
When an operation is classified as a discontinued operation, the comparative income statements are represented as if the operation had been discontinued
from the start of the comparative periods. The resulting profit or loss after taxes, including the impairment loss of the discontinued operation, is reported separately in the income statements in “Result from discontinued operations (net of
tax)” (see Note 5.3).
Translation of Foreign Currencies
Functional and
presentation currency: Items included in the financial statements of each of the Group’s entities are measured using the currency of the primary economic environment in which the entity operates (“functional currency”).
Delhaize Group’s financial statements are presented in (millions of) euros, the parent entity’s functional and the Group’s “presentation currency”, except
where stated otherwise.
Foreign currency transactions and balances: Foreign currency transactions of an entity are initially translated into its functional
currency and recognized in its financial records at the exchange rate prevailing at the date of the transaction.
Monetary assets and liabilities denominated in
foreign currencies are subsequently re-translated at the balance sheet date exchange rate into the functional currency of the entity. All gains and losses resulting from the settlement of foreign currency transactions and from the translation of
monetary assets and liabilities denominated in foreign currencies are included in the income statement, except for exchange differences arising on monetary items that form part of a net investment in a foreign operation (i.e., items that are
receivable from or payable to a foreign operation, for which settlement is neither planned, nor likely to occur in the foreseeable future), which are recognized in the “Cumulative translation adjustment” component of equity. Foreign
exchange gains and losses that relate to financial liabilities are presented in the income statement within “Finance costs” (see Note 29.1), while gains and losses on financial assets are shown as “Income from investments” (see
Note 29.2).
Non-monetary items that are measured at historical cost in a foreign currency are translated using the exchange rates as of the dates of the initial
transaction. Non-monetary items measured at fair value in a foreign currency are translated using the exchange rate at the date when the fair value is determined and gains or losses are included in the income statement except for differences arising
on the retranslation of non-monetary items in respect of which gains and losses are recognized directly in equity. For such non-monetary items, any exchange component of that gain or loss is also recognized directly in equity.
Foreign group entities: The results and balance sheets of all Group entities that have a functional currency different from the Group’s presentation currency are translated
into the presentation currency as follows:
a) the balance sheets of foreign subsidiaries are converted to euros at the year-end exchange rate (closing exchange
rate);
b) goodwill and fair value adjustments arising on the acquisition of a foreign entity are treated as assets and liabilities of the foreign entity and
translated at the closing exchange rate; and
c) the income statements are translated at the average daily exchange rate (i.e., the yearly average of exchange rates
on each working day).
The differences arising from the use of the average daily exchange rate for the income statement and the closing exchange rate for the
balance sheet are recorded in the “Cumulative translation adjustment” being part of “Other Comprehensive Income” (OCI). On disposal of a foreign operation, the component of OCI relating to that particular foreign operation is
recognized in the income statement (as a “reclassification adjustment”).
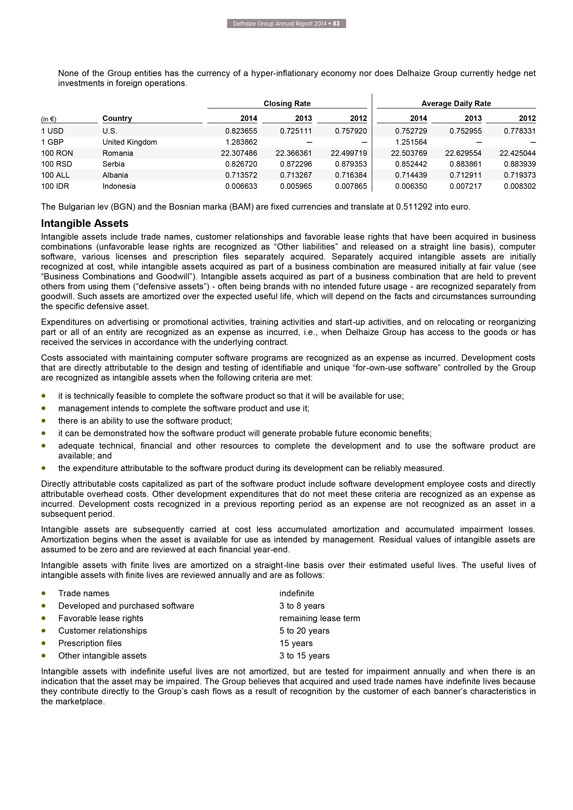
Delhaize Group Annual Report 2014 • 83
None
of the Group entities has the currency of a hyper-inflationary economy nor does Delhaize Group currently hedge net investments in foreign operations.
Closing Rate
Average Daily Rate
(in €) Country 2014 2013 2012 2014 2013 2012
1 USD
U.S. 0.823655 0.725111 0.757920 0.752729 0.752955 0.778331
1 GBP United Kingdom 1.283862 — — 1.251564 — —
100 RON Romania 22.307486 22.366361 22.499719 22.503769 22.629554 22.425044
100 RSD Serbia
0.826720 0.872296 0.879353 0.852442 0.883861 0.883939
100 ALL Albania 0.713572 0.713267 0.716384 0.714439 0.712911 0.719373
100 IDR Indonesia 0.006633 0.005965 0.007865 0.006350 0.007217 0.008302
The Bulgarian lev
(BGN) and the Bosnian marka (BAM) are fixed currencies and translate at 0.511292 into euro.
Intangible Assets
Intangible assets include trade names, customer relationships and favorable lease rights that have been acquired in business combinations (unfavorable lease rights are recognized
as “Other liabilities” and released on a straight line basis), computer software, various licenses and prescription files separately acquired. Separately acquired intangible assets are initially recognized at cost, while intangible assets
acquired as part of a business combination are measured initially at fair value (see “Business Combinations and Goodwill”). Intangible assets acquired as part of a business combination that are held to prevent others from using them
(“defensive assets”) - often being brands with no intended future usage - are recognized separately from goodwill. Such assets are amortized over the expected useful life, which will depend on the facts and circumstances surrounding the
specific defensive asset.
Expenditures on advertising or promotional activities, training activities and start-up activities, and on relocating or reorganizing
part or all of an entity are recognized as an expense as incurred, i.e., when Delhaize Group has access to the goods or has received the services in accordance with the underlying contract.
Costs associated with maintaining computer software programs are recognized as an expense as incurred. Development costs that are directly attributable to the design and testing of
identifiable and unique “for-own-use software” controlled by the Group are recognized as intangible assets when the following criteria are met:
it is
technically feasible to complete the software product so that it will be available for use;
management intends to complete the software product and use it;
there is an ability to use the software product;
it can be demonstrated how
the software product will generate probable future economic benefits;
adequate technical, financial and other resources to complete the development and to use the
software product are available; and
the expenditure attributable to the software product during its development can be reliably measured.
Directly attributable costs capitalized as part of the software product include software development employee costs and directly attributable overhead costs. Other development
expenditures that do not meet these criteria are recognized as an expense as incurred. Development costs recognized in a previous reporting period as an expense are not recognized as an asset in a subsequent period.
Intangible assets are subsequently carried at cost less accumulated amortization and accumulated impairment losses. Amortization begins when the asset is available for use as
intended by management. Residual values of intangible assets are assumed to be zero and are reviewed at each financial year-end.
Intangible assets with finite
lives are amortized on a straight-line basis over their estimated useful lives. The useful lives of intangible assets with finite lives are reviewed annually and are as follows:
Trade names indefinite
Developed and purchased software 3 to 8 years
Favorable lease rights remaining lease term
Customer relationships 5 to 20 years
Prescription files 15 years
Other intangible assets 3 to 15 years
Intangible assets with indefinite useful lives are not amortized, but are tested for impairment annually and when there is an indication that the asset may be impaired. The Group
believes that acquired and used trade names have indefinite lives because they contribute directly to the Group’s cash flows as a result of recognition by the customer of each banner’s characteristics in the marketplace.
FINANCIAL STATEMENTS
There are no legal,
regulatory, contractual, competitive, economic or other factors that limit the useful life of the trade names. The assessment of indefinite life is reviewed annually to determine whether the indefinite life assumption continues to be supportable.
Changes, if any, would result in prospective amortization.
Property, Plant and Equipment
Property, plant and equipment is stated at cost less accumulated depreciation and impairment, if any. Acquisition costs include expenditures that are directly attributable to the
acquisition of the asset. Such costs include the cost of replacing part of the asset and dismantling and restoring the site of an asset if there is a legal or constructive obligation and borrowing costs for long-term construction projects if the
recognition criteria are met. Major spare parts and servicing equipment that are used more than one period are recognized as property, plant and equipment.
Subsequent costs are included in the asset’s carrying amount or recognized as a separate asset, as appropriate, only when it is probable that future economic
benefits associated with the item will flow to the Group and the cost of the item can be measured reliably. Costs of day-to-day servicing of property, plant and equipment are recognized in the income statement as incurred.
Depreciation is calculated using the straight-line method based on the estimated useful lives of the related assets and starts when the asset is available for use as intended by
management. When significant parts of an item of property, plant and equipment have different useful lives, they are accounted for as separate components of property, plant and equipment. Land is not depreciated. The useful lives of tangible fixed
assets are as follows:
Buildings 33 to 50 years
Permanent installations 3 to
25 years
Furniture, fixtures, equipment and vehicles 3 to 14 years
Leasehold
improvements and property under finance lease shorter of lease terms and useful lives
Gains and losses on disposals are determined by comparing the proceeds with
the carrying amount and are recognized within “Other operating income” (see Note 27) or “Other operating expenses” (see Note 28) in the income statement.
Residual values, useful lives and methods of depreciation are reviewed at each financial year-end and adjusted prospectively, if appropriate.
Investment Property
Investment property is defined as property (land or building - or part of
a building - or both) held by Delhaize Group to earn rental income or for capital appreciation or both, including property held for a currently undetermined future use, rather than for sale in the ordinary course of business or for use in supply of
goods or services or for administrative purposes and includes investment property under construction. Delhaize Group recognizes any part of an owned (or leased under a finance lease) property that is leased to third parties as investment property,
unless it represents an insignificant portion of the property.
Investment property is measured initially at cost including transaction costs. Subsequent to initial
recognition, Delhaize Group elected to measure investment property at cost less accumulated depreciation and accumulated impairment losses, if any (i.e., applying the same accounting policies (including useful lives) as for property, plant and
equipment). The fair values, which reflect the market conditions at the balance sheet date, are disclosed in Note 9.
Leases
The determination of whether an agreement is, or contains, a lease is based on the substance of the agreement at inception date. Leases are classified as finance leases when the
terms of the lease agreement transfer substantially all the risks and rewards incidental to ownership to the Group. All other leases are classified as operating leases.
Assets held under finance leases are recognized as assets at the lower of fair value or present value of the minimum lease payments at the inception of the lease. The corresponding
liability to the lessor is included in the balance sheet as a finance lease obligation. Lease payments are allocated between finance costs and a reduction of the lease obligation to achieve a constant rate of interest over the lease term. Finance
lease assets and leasehold improvements are depreciated over the shorter of the expected useful life of similar owned assets or the relevant lease term.
Rents paid
on operating leases are recognized as an expense on a straight-line basis over the lease term. Benefits received and receivable as an incentive to enter into an operating lease are spread over the relevant lease term on a straight-line basis as a
reduction of rent expense.
In connection with investment property, where the Group is the lessor, leases where the Group does not transfer substantially all the
risk and rewards incident to the ownership of the investment property are classified as operating leases and are generating rental income. Contingent rents are recognized as “Other operating income” (see Note 27) in the period in which
they are earned.
Borrowing Costs
Borrowing costs directly attributable to the
acquisition, construction or production of an asset that necessarily takes a substantial period of time to get ready for its intended use (“qualifying assets”) are capitalized as part of the respective asset. All other borrowing costs are
expensed as incurred. Borrowing costs consist of interest and other costs that Delhaize Group incurs in connection with the borrowing of funds.
Delhaize Group Annual Report 2014 • 85
Government Grants
Government grants are recognized when there is reasonable
assurance that the grant will be received and the Group will comply with all attached conditions. When a grant relates to an expense item, it is recognized as income over the period necessary to match the grant on a systematic basis to the costs
that it is intended to compensate. When a grant relates to an asset, it is recognized as deferred income and recognized in the income statement as “Other operating income” (see Note 27) on a systematic basis over the expected useful life
of the related asset.
Inventories
Inventories are valued at the lower of cost
on a weighted average cost basis and net realizable value. Costs of inventory include all costs incurred to bring each product to its present location and condition. Inventories are regularly reviewed and written down on a case-by-case basis if the
anticipated net realizable value (anticipated selling price in the course of ordinary business less the estimated costs necessary to make the sale) declines below the carrying amount of the inventories. When the reason for a write-down of the
inventories has ceased to exist, the write-down is reversed.
Delhaize Group receives allowances and credits from suppliers primarily for in-store promotions,
cooperative advertising, new product introduction and volume incentives. The Group has a strict rebuttable presumptions that all of these “vendor allowances”, as well as other cash discounts, represent a reduction in the cost of inventory
and are therefore recognized in the income statement when the product is sold, unless they represent reimbursement of a specific, incremental and identifiable cost incurred by the Group to sell the vendor’s product. In this case they are
recorded immediately as a reduction of the corresponding selling, general and administrative expenses. Estimating rebates from suppliers requires in certain cases the use of assumptions and judgment regarding the achievement of specified purchase or
sales level and related inventory turnover.
Cash and Cash Equivalents
Cash
and cash equivalents include cash on call with banks and on hand, short-term deposits and other highly liquid investments with an original maturity of three months or less which are readily convertible to known amounts of cash and which are subject
to an insignificant risk of changes in value. Negative cash balances are reclassified on the balance sheet to “Bank overdrafts”.
Impairment of
Non-Financial Assets
At each reporting date, the Group assesses whether there is an indication that a non-financial asset (hereafter “asset”) may be
impaired. If such indications are identified, the asset’s recoverable amount is estimated. Further, goodwill and intangible assets with indefinite lives or that are not yet available for use are tested annually for impairment, which at Delhaize
Group is in the fourth quarter of the year and whenever there is an indication of impairment.
The recoverable amount of an asset or cash-generating unit (CGU) is
the greater of its value in use and its fair value less costs to sell. In assessing value in use, the estimated future cash flows are discounted to their present value using a discount rate that reflects current market assessments of the time value
of money and the risk specific to the asset. As independent cash flows are often not available for individual assets for the purpose of impairment testing, assets need to be grouped together into the smallest group of assets that generates cash
inflows from continuing use that are largely independent of the cash inflows of other assets or groups of assets (“cash generating unit” or CGU).
In
determining fair value less costs to sell for individual assets or CGUs, appropriate valuation models (see Note 2.1) are used.
Goodwill acquired in a business
combination is, for the purpose of impairment testing, allocated to the CGUs that are expected to benefit from the synergies of the combination and that represent the lowest level within the Group at which the goodwill is monitored for internal
management purposes and that are not larger than an operating segment before aggregation (see Note 6).
An impairment loss of a continuing operation is recognized
in the income statement in “Other operating expenses” (see Note 28) if the carrying amount of an asset or CGU exceeds its recoverable amount. Impairment losses recognized for CGUs are allocated first to reduce the carrying amount of any
goodwill allocated to the units and then to reduce the carrying amounts of the other assets in the CGU on a pro rata basis.
If the impairment of assets, other than
goodwill, is no longer justified in future periods due to a recovery in fair value or value in use of the asset, the impairment is reversed. An impairment loss is reversed only to the extent that the asset’s carrying amount does not exceed the
carrying amount that would have been determined, net of depreciation or amortization, if no impairment loss had been recognized. Goodwill impairment is never reversed.
Non-derivative Financial Assets
Delhaize Group classifies its non-derivative financial assets
(hereafter “financial assets”) within the scope of IAS 39 Financial Instruments: Recognition and Measurement into the following categories: loans and receivables and available for sale. Delhaize Group currently holds no financial assets
that would be classified as measured at fair value through profit or loss and held-to-maturity. The Group determines the classification of its financial assets at initial recognition.
These financial assets are initially recorded at fair value plus transaction costs that are directly attributable to the acquisition or issuance of the financial assets.
Loans and receivables: Financial assets with fixed or determinable payments that are not quoted in an active market are classified as loans and receivables. Such
financial assets are subsequent to initial recognition carried at amortized cost using the effective interest rate method. Gains and losses are recognized in the income statement when the loans and receivables are derecognized or impaired and
through the amortization process. The Group’s loans and receivables
FINANCIAL STATEMENTS
comprise “Other
financial assets” (see Note 12), “Receivables” (see Note 14) and “Cash and cash equivalents” (see Note 15).
Trade receivables are
subsequently measured at amortized cost less an impairment allowance. The allowance for impairment of trade receivables is established (on a separate allowance account) when there is objective evidence that the Group will not be able to collect all
amounts due according to the original terms of the receivables and the amount of the loss is recognized in the income statement within “Selling, general and administrative expenses”. Impaired trade receivables are derecognized when they
are determined to be uncollectible.
Available for sale investments: Available for sale investments are financial assets that are either designated in this category
or not classified in any of the other categories. After initial measurement, available for sale investments are measured at fair value with unrealized gains or losses recognized directly in OCI, until the investment is derecognized or impaired, at
which time the cumulative gain or loss recorded in the available for sale reserve is recognized in the income statement as a reclassification adjustment.
Delhaize
Group mainly holds quoted investments and the fair value of these is predominantly based on current bid prices (see Note 10.1). The Group monitors the liquidity of the quoted investments to identify inactive markets, if any. In a very limited number
of cases, e.g., if the market for a financial asset is not active (and for unlisted securities), the Group establishes fair value by using valuation techniques (see Note 2.1).
For available for sale financial assets, the Group assesses at each balance sheet date whether there is objective evidence that an investment or a group of investments is impaired.
For investments in debt instruments, the impairment is assessed based on the same criteria as financial assets carried at amortized cost (see above “Loans and receivables”). Interest continues to be accrued at the original effective
interest rate on the reduced carrying amount of the asset. If, in a subsequent year, the fair value of a debt instrument increases and the increase can be objectively related to an event occurring after the impairment loss was recognized in the
income statement, the impairment loss is reversed through the income statement. For investments in equity instruments the objective evidence for impairment includes a significant or prolonged decline in the fair value of the investment below its
costs. Where there is evidence of impairment, the cumulative loss – measured as the difference between the acquisition cost and the current fair value, less any impairment loss on that investment previously recognized in the income statement
– is removed from equity and recognized in the income statement. Impairment losses on equity investments are not reversed through the income statement. Increases in their fair value after impairment are recognized directly in OCI.
Available for sale financial assets are included in “Investments in securities” (see Note 11). They are classified as non-current assets except for investments with a
maturity date less than 12 months from the balance sheet date.
Financial assets are derecognized when the rights to receive cash flows from the financial assets
have expired, or if the Group transferred the financial asset to another party and does not retain control or substantially all risks and rewards of the financial asset.
Non-derivative Financial Liabilities
IAS 39 Financial Instruments: Recognition and Measurement
contains two categories for non-derivative financial liabilities (hereafter “financial liabilities”): financial liabilities at fair value through profit or loss and financial liabilities measured at amortized cost. Delhaize Group mainly
holds financial liabilities measured at amortized cost that are included in “Debts”, “Borrowings”, “Accounts payable” and “Other liabilities”. In addition, the Group issued financial liabilities, which are
part of a designated fair value hedge relationship (see Note 19).
All financial liabilities are recognized initially at fair value, plus, for instruments not at
fair value through profit or loss, any directly attributable transaction costs.
Financial liabilities measured at amortized cost are measured at amortized cost
after initial recognition. Amortized cost is computed using the effective interest method less principal repayment. Associated finance charges, including premiums and discounts are amortized or accreted to finance costs using the effective interest
method and are added to or subtracted from the carrying amount of the instrument. The fair values of these financial liabilities are disclosed in Note 18.1.
An
exchange between existing borrower and lenders or a modification in terms of a debt instrument is accounted for as a debt extinguishment of the original financial liability and the recognition of a new financial liability, if the terms are
substantially different. For the purpose of IAS 39, the terms are substantially different if the discounted presented value of the cash flows under the new terms, including any fees paid net of any fees received and discounted using the original
effective interest rate, is at least 10 percent different from the discounted present value of the remaining cash flows of the original financial liability. If the exchange or modification is not accounted for as an extinguishment, any costs or fees
incurred adjust the carrying amount of the liability and are amortized, together with the difference in present values, over the remaining term of the modified financial liability.
Financial liabilities are derecognized when the Group’s obligations specified in the contract expire or are discharged or cancelled.
Derivative Financial Instruments
While at recognition the initial measurement of derivative
contracts is at fair value, the subsequent accounting for derivative financial instruments depends on whether the derivative is designated as an effective hedging instrument and, if so, the nature of the item being hedged (see “Hedge
Accounting” below).
Delhaize Group Annual Report 2014 • 87
Economic hedges: Delhaize Group does not hold or issue derivatives for speculation/trading purposes. The Group uses derivative financial instruments - such as
foreign exchange forward contracts, interest rate swaps, currency swaps and other derivative instruments - solely to manage its exposure to interest rates and foreign currency exchange rates. Derivatives not being part of an effective designated
hedge relationship are therefore only entered into in order to achieve “economic hedging.” This means that, e.g., foreign exchange forward contracts and currency swaps are not designated as hedges and hedge accounting is not applied as the
gain or loss from re-measuring the derivative is recognized in profit or loss and naturally offsets the gain or loss arising on re-measuring the underlying instrument at the balance sheet exchange rate (see Note 19).
These derivatives are mandatorily classified as held-for-trading and initially recognized at fair value, with attributable transaction costs recognized in profit or loss when
incurred. Subsequently, they are re-measured at fair value. Derivatives are accounted for as assets when the fair value is positive and as liabilities when the fair value is negative (see Note 19).
The fair value of derivatives is determined in accordance with the fair value measurement framework (see “Note 2.1”). This is calculated on the basis of the contracting
parties’ relevant exchange rates, interest rates and credit ratings at the reporting date. In the case of interest-bearing derivatives, the fair value corresponds to the “dirty price” or “full fair value” (i.e., including
any interest accrued).
Any gains or losses arising from changes in fair value on these derivatives are taken directly to the income statement. As Delhaize Group
enters into derivative financial instruments contracts only for economic hedging purposes, the classification of the changes in fair value of the derivative follow the underlying (i.e., if the economically hedged item is a financial asset, the
changes in fair value of the derivative are classified as “Income from investment”, Note 29.2; if the underlying is a financial liability, the changes in fair value of the derivative are classified as “Finance costs”, Note 29.1).
Derivatives are classified as current or non-current or separated into a current or non-current portion based on an assessment of the facts and circumstances.
Embedded derivatives are components of hybrid instruments that include non-derivative host contracts. Such embedded derivatives are separated from the host
contract and accounted for separately, if (i) the economic characteristics and risks of the host contract and the embedded derivative are not closely related, (ii) a separate instrument with the same terms as the embedded derivative would
meet the definition of a derivative, and (iii) the combined instruments are not measured at fair value through profit or loss. The accounting for any separated derivative follows the general guidance described above.
Offsetting of Financial Instruments
Financial assets and financial liabilities are offset and
the net amount is reported in the consolidated balance sheet if there is a currently enforceable legal right to offset the recognized amounts and there is an intention to settle on a net basis or to realize the assets and settle the liabilities
simultaneously.
Hedge Accounting
At the inception of a hedge relationship,
the Group formally designates and documents the hedge relationship to which the Group intends to apply hedge accounting and the risk management objective and strategy for undertaking the hedge. The documentation includes identification of the
hedging instrument, the hedged item or (highly probable forecast) transaction, the nature of the risk being hedged and how the entity will assess the hedging instrument’s effectiveness in offsetting the exposure to changes in the hedged
item’s fair value or cash flows attributable to the hedged risk. Such hedges are expected to be highly effective in achieving offsetting changes in fair value or cash flows and are assessed on an ongoing basis to determine that they actually
have been highly effective throughout the financial reporting periods for which they were designated.
Hedges which meet the criteria for hedge accounting are
accounted for as follows:
Cash flow hedges are used to protect the Group against fluctuations in future cash flows of assets and liabilities recognized in the
balance sheet, from firm commitments (in the case of currency risk) or from highly probable forecast transactions. In such a cash flow hedge relationship, the changes in the fair value of the derivative hedging instrument are recognized directly in
OCI to the extent that the hedge is effective. To the extent that the hedge is ineffective, changes in fair value are recognized in profit or loss. Amounts accumulated in OCI are recycled in the income statement in the periods when the hedged item
affects profit or loss (e.g., when the forecast sale that is hedged takes place).
If the hedging instrument no longer meets the criteria for hedge accounting,
expires or is sold, terminated, exercised, or the designation is revoked, then hedge accounting is discontinued prospectively. The cumulative gain or loss previously recognized in OCI and presented in the discontinued cash flow hedge reserve in
equity remains in there until the hedged item affects profit or loss.
Fair value hedges are used to hedge the fair values of assets or liabilities recognized in
the balance sheet or firm commitments not yet recognized in the financial statements. When designated as such a fair value hedge, the gain or loss from remeasuring the hedging instrument at fair value is recognized in profit or loss. Additionally,
the gain or loss on the hedged item, attributable to the hedged risk, is recognized in profit or loss by adjusting the carrying amount of the hedged item. Delhaize Group usually hedges financial liabilities. As for economic hedges, the changes in
the hedging instrument follow the hedged item and, therefore, they are typically presented in the income statement as “Finance costs” (see Note 29.1).
FINANCIAL STATEMENTS
Hedges of a net investment:
Delhaize Group currently does not hedge any of its net investments in any of its foreign operations.
Share Capital and Treasury Shares
Ordinary shares: Delhaize Group’s ordinary shares are classified as equity. Incremental costs directly attributable to the issuance of ordinary shares and share options are
recognized as a deduction from equity, net of any tax effects.
Treasury shares: Shares of the Group purchased by the Group or companies within the Group are
included in equity at cost (including any costs directly attributable to the purchase of the shares) until the shares are cancelled, sold or otherwise disposed. Where such shares are subsequently reissued, any consideration received, net of any
directly attributable incremental transaction costs and the related income tax effects, is included in equity attributable to the company’s equity holders.
Income Taxes
The tax expense for the period comprises current and deferred
tax. Tax is recognized in the income statement except to the extent that it relates to items recognized directly in OCI or equity.
The current income tax expense
is calculated on the basis of the tax laws enacted or substantively enacted at the balance sheet date in the countries where the Group operates and generates taxable income. Provisions and receivables are established on the basis of amounts expected
to be paid to or recovered from the tax authorities.
Deferred tax liabilities and assets are recognized, using the liability method, on temporary differences
arising between the carrying amount in the consolidated financial statements and the tax basis of assets and liabilities. However, the deferred income tax is not accounted for if it arises from initial recognition of an asset or liability in a
transaction other than a business combination that at the time of the transaction affects neither accounting nor taxable profit or loss. Deferred income tax is determined considering (i) tax rates and laws that have been enacted or
substantively enacted at the balance sheet date that are expected to apply when the temporary differences reverse and (ii) the expected manner of realization or settlement of the carrying amount of assets and liabilities.
Deferred tax liabilities are recognized for temporary differences arising on investments in subsidiaries, associates and interests in joint ventures, if any, except where the Group
is able to control the timing of the reversal of the temporary difference and it is probable that the temporary difference will not reverse in the foreseeable future.
A deferred tax asset is recognized only to the extent that it is probable that future taxable profit will be available against which the temporary difference can be utilized.
Deferred tax assets are reviewed at each reporting date and are reduced to the extent that it is no longer probable that the related tax benefit will be realized.
Deferred tax assets and liabilities are only offset if there is a legally enforceable right to offset current tax liabilities and assets and the deferred income
taxes relate to the same taxable entity and the same taxation authority.
Uncertain tax positions, if any, are measured assuming that the tax authorities will
examine the amounts reported to them in full knowledge of all relevant information.
The Group elected to present interests and penalties relating to income taxes
in “Income tax expense” in the income statement.
Provisions
Provisions are recognized when the Group has a present legal or constructive obligation as a result of past events, it is more likely than not that an outflow of
resources will be required to settle the obligation, and the amount can be reliably estimated. Provisions are measured at balance sheet date at management’s best estimate of the expenditures expected to be required to settle the obligation,
discounted using a pre-tax discount rate that reflects the current market assessments of the time value of money and the risk specific to the liability, if material. Where discounting is used, the increase in the provision due to the passage of time
(“unwinding of the discount”) is recognized in “Finance costs” (see Note 29.1).
Closed store provisions: Delhaize Group regularly reviews its
stores operating performance and assesses the Group’s plans for certain store closures. Closing stores results in a number of activities required by IFRS in order to appropriately reflect the value of assets and liabilities and related store
closing costs, such as a review of net realizable value of inventory or review for impairment of assets or CGUs (for both activities see the accounting policies described above). In addition, Delhaize Group recognizes “Closed store
provisions”, which consist primarily of provisions for onerous contracts and severance (“termination”) costs (for both see further below). Costs recognized as part of store closings are included in “Other operating expenses”
(see Note 28), except for inventory write-downs, which are classified as “Cost of sales” (see Note 25). If appropriate (see also “Non-Current Assets / Disposal Groups and Discontinued Operations” above), closed stores are
accounted for as assets held for sale and / or discontinued operations.
Onerous contracts: A provision is recognized for a present obligation arising under an
onerous contract, which is defined as a contract in which the unavoidable costs of meeting the obligations under the contract exceed the economic benefits expected to be received under it. Judgment is required in determining if a present obligation
exists, taking into account all available evidence. Once the existence has been established, at the latest upon actual closing of a store, Delhaize Group recognizes provisions for the present value of the amount by which the unavoidable costs to
fulfill the agreements exceed the expected benefits from such agreements, which comprises the estimated non-cancellable lease payments, including contractually required real estate taxes, common area maintenance and insurance costs, net of
anticipated subtenant
Delhaize Group Annual Report 2014 • 89
income. The adequacy of the closed store provision is dependent upon the economic conditions in which stores are located which will impact the Group’s ability
to realize estimated sublease income. Owned and finance leased stores that are closed and rented to third parties are reclassified as investment property (see Note 9).
When termination costs are incurred in connection with a store closing, a liability for the termination benefits is recognized in accordance with IAS 19 Employee Benefits, at the
earlier of the following dates: (a) when the Group can no longer withdraw the offer of termination benefits and (b) when the entity recognizes costs for restructuring that is within the scope of IAS 37 Provisions and involves the payment
of termination benefits (see also “Restructuring provisions” and “Employee Benefits” below).
Closed store provisions are reviewed regularly to
ensure that amounts appropriately reflect management’s best estimate of the outstanding commitments and that additional expenses are provided for or amounts that are no longer needed for their originally intended purpose are released.
Self-insurance: Delhaize Group is self-insured for workers’ compensation, general liability, vehicle accidents, pharmacy claims, health care and property
insurance in the U.S. up to certain retentions and holds insurance contracts with external insurers for any costs in excess of these retentions. The self-insurance liability is determined actuarially, based on claims filed and an estimate of claims
incurred but not reported.
Restructuring provisions are recognized when the Group has approved a detailed formal restructuring plan, and the restructuring either
has commenced or has been announced to those affected by it. Any restructuring provision contains only those expenditures that are directly arising from the restructuring and are both necessarily entailed by the restructuring and not associated with
the ongoing activity of the Group. Future operating losses are therefore not provided for.
IFRIC 21 Levies, an interpretation of IAS 37 Provisions, requires the
recognition of a levy imposed under a legislation issued by a government (being a local, national or international government, government agencies and similar bodies) when the Group can no longer avoid the outflow of economic benefit by its own
action.
Employee Benefits
A defined contribution plan is a post-employment
benefit plan under which the Group pays fixed contributions and has no legal or constructive obligation to pay further contributions regardless of the performance of the funds held to satisfy future benefit payments. The Group makes contributions to
defined contribution plans on a mandatory, contractual or voluntary basis. The contributions are recognized as “Employee benefit expense” when they are due (see Note 21.1). Prepaid contributions are recognized as an asset to the extent
that a cash refund or a reduction in the future payments is available.
The defined contribution plans of the Group’s Belgian operations include a legally
guaranteed minimum return. This minimum return is usually insured by an external insurance company that receives and manages all plan contributions. As the return guaranteed by that third party can be below the legally required return, these plans
have also some defined benefit plan features, as the Group is exposed to the investment / funding risk relating to the difference in returns, if any.
A defined
benefit plan is a post-employment benefit plan other than a defined contribution plan (see above), which normally defines an amount of benefit that an employee will receive upon retirement, usually dependent on one or more factors such as age, years
of service and compensation. The Group’s net obligation recognized in the balance sheet for defined benefit plans is the present value of the defined benefit obligation at the balance sheet date less the fair value of plan assets, which in the
case of funded plans are usually held by a long-term employee benefit fund or qualifying insurance company and are not available to the creditors of the Group nor can they be paid directly to the Group.
The defined benefit obligation is calculated regularly by independent actuaries using the projected unit credit method. The present value of the defined benefit obligation is
determined by discounting the estimated future cash outflows using interest rates of high-quality corporate bonds that are denominated in the currency in which the benefits will be paid and that have maturity terms approximating the duration of the
related pension liability. For currencies where there is no deep market in such bonds, the market rates on government bonds are used. When the calculation results in a benefit to the Group, the recognized asset is limited to the present value of
economic benefits available in the form of any future refunds from the plan or reductions in future contributions to the plan. An economic benefit is available to the Group if it is realizable during the life of the plan or on settlement of the plan
liabilities.
The components of the defined benefit cost include (a) service cost (current and past), (b) net interest on the net defined benefit
liability (asset) and (c) remeasurements of the net defined benefit liability (asset). Past service costs are recognized immediately in the income statement at the earlier of (a) the date of the plan amendment or curtailment and
(b) the date the Group recognizes restructuring-related costs. Net interest on net defined benefit liability (asset) is calculated by applying the discount rate to the net defined benefit liability (asset).
Service cost and net interest are recognized in profit or loss in both “Cost of sales” and in “Selling, general and administrative expenses”.
The remeasurements comprise (a) actuarial gains and losses, (b) the effect of asset ceiling (if applicable) and (c) the return on plan assets (excluding interest)
and are recognized immediately in the period in which they occur in OCI. The recorded remeasurements are never recycled to profit or loss but they can be transferred within equity.
See Note 21.1 for details of Delhaize Group’s defined benefit plans.
FINANCIAL STATEMENTS
Other post-employment
benefits: Some Group entities provide post-retirement health care benefits to their retirees. The Group’s net obligation in respect of long-term employee benefit plans other than pension plans is the amount of future benefit that employees have
earned in return for their services in the current or prior periods. Such benefits are discounted to determine their present value and the fair value of any related asset is deducted. The calculation is performed using the projected unit credit
method and any actuarial gain or loss is recognized in OCI in the period in which it arises. These obligations are valued annually by independent qualified actuaries. For details, see Delhaize Group’s other post-employment benefit plans in Note
21.2.
Termination benefits: Are payable when employment is terminated before the normal retirement date, or when an employee accepts voluntary redundancy in
exchange for these benefits. Termination benefits are recognized at the earlier of when the entity can no longer withdraw the offer of those benefits and when the Group recognizes costs for a restructuring in accordance with IAS 37, involving the
payment of termination benefits. Benefits that are expected to be settled more than 12 months after the end of the annual reporting period are discounted to their present value.
Bonus plans: The Group recognizes a liability and an expense for short-term and long-term cash bonuses based on formulas that take into consideration the Company’s results.
The Group recognizes a provision if contractually obliged or if there is a past practice that has created a constructive obligation (see Note 20.3).
Share-based
payments: The Group operates various equity-settled share-based compensation plans, under which the entity receives services from employees as consideration for equity instruments (options, warrants, performance and restricted stock units) of the
Group. The fair value of the employee services received in exchange for the grant of the share-based awards is recognized as an expense. The total amount to be expensed is determined by reference to the grant date fair value of the share-based
awards and is calculated for stock options and warrants using the Black-Scholes-Merton valuation model (for details see Note 21.3). The options, warrants and restricted stock units compensation plans contain only service vesting conditions, while
the performance stock unit plan contains non-market performance conditions and service vesting conditions.
The total amount expensed is recognized in the income
statement - together with a corresponding increase in equity – over the vesting period of the share-based award, which is the period over which the vesting conditions have to be satisfied. The cumulative expense recognized for equity-settled
transactions at each reporting date until the vesting date reflects the extent to which the vesting period has expired and the Group’s best estimate of the number of equity instruments that will ultimately vest, including an assessment of the
non-market performance conditions. No expense is recognized for awards that do not ultimately vest.
In the event of a modification of the terms of an
equity-settled award, the minimum expense recognized is the expense as if the terms had not been modified. An additional expense would be recognized for any modification which increases the total fair value of the share-based payment arrangement or
is otherwise beneficial to the employee as measured at the date of modification.
Where an equity-settled award is cancelled, it is treated as if it had vested on
the date of cancellation, and any expense not yet recognized for the award is recognized immediately. However if a new award is substituted for the cancelled award and designated as a replacement award on the date that it is granted, the cancelled
and new awards are treated as if they were a modification of the original award.
Any proceeds received, net of any directly attributable transaction costs, are
credited to share capital (nominal value) and share premium when options are exercised. The dilutive effect of outstanding (vested and unvested) options is reflected as additional share dilution in the computation of diluted earnings per share (see
Note 31).
Revenue Recognition
Revenue is recognized to the extent that it is
probable that the economic benefits will flow to the Group and the revenue can be reliably measured. Revenue is measured at the fair value of the consideration received net of discounts, rebates, and sales taxes or duty. The Group assesses its
revenue arrangements against the criteria included in the appendix to IAS 18 Revenue to determine if it is acting as principal or agent.
Sales of products to the
Group’s retail customers are recognized at the point of sale and upon delivery of groceries to internet or telephone order customers. In addition, Delhaize Group generates revenue from sales to its wholesale customers, which are recognized upon
delivery to or pick-up by the wholesale customer.
As stated above, sales are recorded net of sales taxes, value-added taxes and discounts and incentives. These
include discounts from regular retail prices for specific items and “buy-one, get-one-free”-type incentives that are offered to retail customers through the Group’s customer loyalty programs. Discounts provided by vendors are recorded
as a receivable.
Revenue from the sale of gift cards and gift certificates is recognized when the gift card or gift certificate is redeemed by the retail customer.
The Group maintains various loyalty points programs whereby customers earn points for future purchases. These customer loyalty credits are accounted for as a
separate component of the sales transaction in which they are granted. A portion of the fair value of the consideration received is allocated to the award credits and deferred. This is recognized as revenue when the award credits are redeemed.
Delhaize Group Annual Report 2014 • 91
The
Group generates limited revenues from franchise fees, which are recognized in net sales when the services are provided or franchise rights used.
For certain
products or services, such as the sale of lottery tickets, third party prepaid phone cards, etc., Delhaize Group acts as an agent and consequently records the amount of commission income in its net sales.
Rental income from investment property is recognized in profit or loss on a straight-line basis over the term of the lease and included in “Other operating income” (see
Note 27).
Interest Income is recognized as interest accrues (using the effective interest method) and is included in “Income from investments” (see Note
29.2).
Dividend income is recognized when the Group’s right to receive the payment is established. The income is included in “Income from
investments” (see Note 29.2).
Cost of Sales
Cost of sales includes the
purchase cost of products sold and all costs associated with getting the products into the retail stores including buying, warehousing and transportation costs. Finally, cost of sales includes appropriate vendor allowances (see also accounting
policy for “Inventories” above).
Selling, General and Administrative Expenses
Selling, general and administrative expenses include store operating expenses, costs incurred for activities which serve securing sales, administrative and advertising expenses.
Segment Reporting
Operating segments are reported in a manner consistent with
the internal reporting provided to the chief operating decision maker (CODM), who is responsible for allocating resources and assessing performance of the operating segments (see Note 3).
Financial Guarantee
Financial guarantee contracts issued by the Group are those contracts that
require a payment to be made to reimburse the holder for a loss it incurs because the specified debtor fails to make a payment when due in accordance with the terms of a debt instrument. Financial guarantee contracts are recognized initially as a
liability at fair value that is likely to be the cash consideration received, less transaction costs that are directly attributable to the issuance of the guarantee, if any, and subsequently measured at the higher of the best estimate of the
expenditure required to settle the present obligation at the reporting date and the amount recognized less cumulative amortization.
2.4 Significant Use of
Estimates, Assumptions and Judgment
The preparation of financial statements in conformity with IFRS requires Delhaize Group to make judgments, estimates and
assumptions that affect the application of accounting policies and the reported amounts of assets, liabilities and income and expenses, which inherently contain some degree of uncertainty. These estimates are based on experience and assumptions
Delhaize Group believes to be reasonable under the circumstances. By definition, actual results could and will often differ from these estimates. In the past, the Group’s estimates generally have not deviated materially from actual results.
Revisions to accounting estimates are recognized in the period in which the estimates are revised and in any future periods affected.
Information about significant
areas of estimation uncertainty and critical judgments in applying accounting policies that have the most significant effect on the amounts in the consolidated financial statements is detailed in, but not limited to, the following notes:
Note 4.1 - Business combinations;
Notes 6, 7, 8, 11, 14, 19 - Assessing assets for impairment
and fair values of financial instruments;
Notes 13, 25 - Accounting for vendor allowances;
Note 20 - Provisions;
Note 21 - Employee Benefits; and
Note 22 - Income Taxes.
FINANCIAL STATEMENTS
2.5 Standards and
Interpretations Issued but not yet Effective
The following standards, amendments to or revisions of existing standards or interpretations have been published and
are mandatory applicable for the Group’s accounting periods beginning on January 1, 2015, or later. Unless otherwise indicated below, Delhaize Group is still in the process of assessing the impact of these new standards, interpretations,
or amendments to its consolidated financial statements and does not plan to early adopt them:
Improvements to IFRS 2010 – 2012 and 2011 – 2013 Cycles
(applicable for annual periods beginning after January 1, 2015 except for the Amendments to IFRS 13, as disclosed in Note 2.2): Late 2013, the IASB issued the final omnibus annual improvements standard for the 2010 – 2012 Cycle containing
eight changes to seven IASB pronouncements and the 2011 – 2013 Cycle containing four changes to four IASB pronouncements. On September 25, 2014 the IASB issued the Improvements to IFRS 2012 – 2014 Cycle (applicable for annual periods
beginning after January 1, 2016) containing five changes to four IASB pronouncements. The Group is still in process in analyzing these amendments, but does not believe that any of these amendments will have a significant impact on its
consolidated financial statements as most of the Group’s accounting policies were already in line with the clarifications included in these improvements.
Amendments to IAS 19 Defined Benefit Plans: Employee Contributions (applicable for annual periods beginning after January 1, 2015): The amendments were issued
in late 2013 and clarify how an entity should account for contributions made by employees or third parties to defined benefit plans, based on whether those contributions are dependent on the number of years of service provided by the employee.
For contributions that are independent of the number of years of service, the entity may either recognize the contributions as a reduction in the service cost in
the period in which the related service is rendered, or attribute them to the employees’ periods of service using the projected unit credit method. For contributions that are dependent on the number of years of service, the entity should
attribute the contributions to the employees’ periods of service. The Group expects that the new guidance will have little or no impact on its consolidated financial statements.
Amendments to IAS 16 and IAS 38 Clarification of Acceptable Methods of Depreciation and Amortisation (applicable for annual periods beginning after January 1, 2016): In 2014,
the IASB issued amendments to IAS 16 and IAS 38. The new IAS 16 pronouncements prohibit entities from using revenue-based depreciation method for items of property, plant and equipment while the amendments to IAS 38 introduce a presumption that
revenue is not an appropriate basis for amortization of an intangible asset, which is rebuttable only in two limited circumstances. The amendments will have no impact on the Group.
Amendments to IFRS 11 Accounting for Acquisitions of Interest in Joint Operations (applicable for annual periods beginning after January 1, 2016): The amendments to IFRS 11
provide guidance on how to account for the acquisition of a joint operation that constitutes a business as defined by IFRS 3 Business Combinations. Specifically, the amendments state that the relevant principles on accounting for business
combinations should be applied. The same requirements should be applied to the formation of a joint operation if and only if an existing business is contributed to the joint operation by one of the parties that participate in the joint operation.
The amendment has so far no impact on the consolidated financial statements of the Group.
Amendments to IFRS 10 and IAS 28 Sale or Contribution of Assets between
an Investor and its Associate or Joint Venture (applicable for annual periods beginning after January 1, 2016): During 2014, the IASB issued the amendments which address a conflict between the requirements of IAS 28 and IFRS 10 by clarifying
that in a transaction involving an associate or joint venture the extent of gain or loss recognition depends on whether the assets sold or contributed constitute a business. The amendment has so far no impact on the consolidated financial statements
of the Group.
Amendments to IAS 1 Disclosure Initiative (applicable for annual periods beginning after January 1, 2016): At the end of 2014, the IASB issued
amendments to IAS 1 which provide (a) clarification on materiality, (b) guidance on the list of line items to be presented in the statement of financial position and in the statement of profit or loss and other comprehensive income which
can be disaggregated and aggregated as relevant and on subtotals in these statements, (c) clarification that an entity’s share of OCI of equity-accounted associates and joint ventures should be presented in aggregate as single line items
based on whether or not it will subsequently be reclassified to profit or loss and (d) additional examples of possible ways of ordering the notes.
IFRS 9
Financial Instruments (applicable for annual periods beginning after January 1, 2018): During 2014, the IASB issued the complete version of IFRS 9 which will replace the guidance in IAS 39 upon the former’s effective date.
IFRS 9 retains, but simplifies the mixed measurement model and establishes three primary measurement categories for financial assets: (a) amortized cost, (b) fair value
through OCI and (c) fair value through P&L. The basis of classification depends on the entity’s business model and the contractual cash flow characteristics of the financial asset. Investments in equity instruments are required to be
measured at fair value through profit or loss with the irrevocable option at inception to present changes in fair value in OCI without any future recycling possibility.
The standard introduces the expected credit losses model and replaces the incurred credit loss impairment model used in IAS 39. The expected credit loss model requires an entity to
account for expected credit losses and changes in those expected credit losses at each reporting date to reflect changes in credit risk since initial recognition which effectively results that it will be no longer necessary for a credit event to
have occurred before credit losses are recognized.
Delhaize Group Annual Report 2014 • 93
For
financial liabilities there were no changes to classification and measurement except for the recognition of changes in own credit risk in other comprehensive income for liabilities that are designated in the measurement category at fair value
through profit or loss, which so far does not impact the Group.
Finally, IFRS 9 retains the three types of hedge accounting mechanisms, but introduces greater
flexibility to the types of transactions eligible for hedge accounting and relaxes, for example, the requirements for hedge effectiveness by replacing the bright line hedge effectiveness tests. It requires an economic relationship between the hedged
item and hedging instrument and for the “hedged ratio” to be the same as the one management actually uses for risk management purposes. Detailed documentation is still required but is different to that currently prepared under IAS 39,
including information about an entity’s risk management activities.
The Group expects that IFRS 9 will have some impact on the consolidated financial
statements, but is not practicable to provide a reasonable estimate until the full review has been finalized.
IFRS 15 Revenue from Contracts with Customers
(applicable for annual periods beginning after January 1, 2017): In 2014, the IASB issued the new revenue recognition standard which establishes a single comprehensive model for entities in accounting for revenue arising from contracts with
customers. The standard will supersede currently applicable guidance, amongst others and for Delhaize Group most relevant, IAS 18 Revenue and IFRIC 13 Customer Loyalty Programmes.
The single model’s core principle of IFRS 15 is that an entity should recognize revenue to depict the transfer of promised goods or services to customers in an amount that
reflects the consideration to which the entity expects to be entitled in exchange for those goods or services.
The standard introduces a five-step approach for the
revenue recognition process and the new term “performance obligation,” which represents a promise made by the entity in the contract to a customer which is either (a) a good or service (or a bundle of goods or services) that is
distinct, or (b) a series of distinct goods or services that are substantially the same and that have the same pattern of transfer to the customer. The standard requires that the entity shall recognize revenue when (or as) a performance
obligation is satisfied, i.e., when control of the goods or services underlying the particular performance obligation is transferred to the customer. The new guidance contains more detailed prescription on some specific scenarios, like principal vs.
agent consideration and adds significantly more extensive disclosure requirements.
Delhaize Group expects that IFRS 15 will have some impact on the consolidated
financial statements, but is not practicable to provide a reasonable estimate until the full review has been finalized.
2.6 Financial Risk Management, Objectives
and Policies
The Group’s activities expose it to a variety of financial risks: market risk (including currency risk, fair value interest rate risk, cash flow
interest rate risk and price risk), credit risk and liquidity risk. Delhaize Group’s principal financial liabilities, other than derivatives, comprise mainly debts and borrowings and trade and other payables. These financial liabilities are
mainly held in order to raise funds for the Group’s operations. On the other hand, the Group holds notes receivables, other receivables and cash and cash equivalents that result directly from the Group’s activities. The Group also holds
several available for sale investments. Delhaize Group exclusively uses derivative financial instruments to hedge certain risk exposures.
The risks to which the
Group is exposed are evaluated by Delhaize Group’s management and Board of Directors and discussed in the section “Risk Factors” in this annual report.
FINANCIAL STATEMENTS
3. Segment Information
IFRS 8 applies the so-called “management approach” to segment reporting and requires the Group to report financial and descriptive information about its
reportable segments. Such reportable segments are operating segments or aggregations of operating segments that meet specified criteria.
Operating segments are
components of an entity which engage in business activities from which they may earn revenues and incur expenses, including revenues and expenses that relate to transactions with any of the Group’s other components, about which discrete
financial information is available that is evaluated regularly by the chief operating decision maker (CODM) in deciding how to allocate resources and in assessing performance. The Group is required to report separate information about each operating
segment that:
has been identified as described above or results from aggregating two or more of those segments if they exhibit similar long-term financial
performance and have similar economic characteristics; and
exceeds certain quantitative thresholds.
Delhaize Group identified the Executive Committee as its CODM and defined operating segments based on the information provided to the Executive Committee. Subsequently, the Group
reviewed these operating segments in order to establish if any of these individual operating segments can be considered to have similar economic characteristics and exhibit similar long-term financial performance as described by IFRS 8, which are
then aggregated into one single operating segment. The Group reviewed its U.S. operating segments for similar economic characteristics and long-term financial performance using, for example, operating profit margin, gross margin and comparable store
sales development as quantitative benchmarks and concluded aggregating them into the segment “United States” meets the requirements of IFRS 8 and is consistent with the core principle of the standard. In a final step, reportable segments
have been identified, which represent (aggregated) operating segments that exceed the quantitative thresholds defined by IFRS 8 and require individual disclosure. Operating segments that do not pass these thresholds are by default combined into the
“All Other Segments” category of IFRS 8, which the Group has labeled as “Southeastern Europe”. P.T. Lion Super Indo, LLC (“Super Indo”), the Group’s equity accounted joint venture, does not meet the criteria of an
operating segment and is therefore not included in the segment information provided below.
Management concluded that the reader of the Group’s financial
statements would benefit from distinguishing operating from non-operating - other business activities - and, therefore, decided to disclose separately the corporate activities of the Group in the segment “Corporate”.
Overall, this results in a geographical segmentation of the Group’s business, based on the location of customers and stores, which matches the way Delhaize Group manages its
operations.
The Executive Committee internally reviews the performance of Delhaize Group’s segments against a number of measures, of which “underlying
operating profit” (UOP), represents the most important measure of profit or loss. UOP adjusts for a number of elements that the CODM considers as non-representative of the Group’s underlying operating performance. A reconciliation from
operating profit to UOP is included in the segment information. All other amounts of each segment items reported to the CODM equal consolidated IFRS financial information. Therefore, as the information provided to the CODM and disclosed as segment
information represents consolidated IFRS financial information, no further reconciling items need to be disclosed.
The operating segments information for 2014,
2013 and 2012 is as follows:
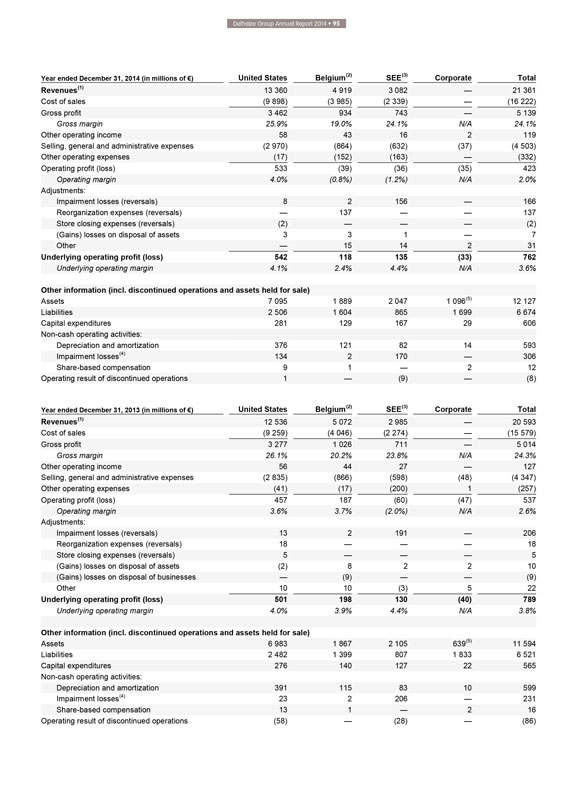
Delhaize Group Annual Report 2014 • 95
Year
ended December 31, 2014 (in millions of €) United States Belgium(2) SEE(3) Corporate Total
Revenues(1) 13 360 4 919 3 082 — 21 361
Cost of sales (9 898) (3 985) (2 339) — (16 222)
Gross profit 3 462 934 743 — 5 139
Gross margin 25.9% 19.0% 24.1% N/A 24.1%
Other operating income 58 43 16 2
119
Selling, general and administrative expenses (2 970) (864) (632) (37) (4 503)
Other operating expenses (17) (152) (163) — (332)
Operating profit (loss) 533 (39) (36)
(35) 423
Operating margin 4.0% (0.8%) (1.2%) N/A 2.0%
Adjustments:
Impairment losses (reversals) 8 2 156 — 166
Reorganization expenses
(reversals) — 137 — — 137
Store closing expenses (reversals) (2) — — — (2)
(Gains) losses on disposal of assets 3 3 1 — 7
Other — 15 14 2 31
Underlying operating profit (loss) 542 118 135 (33) 762
Underlying operating margin 4.1% 2.4%
4.4% N/A 3.6%
Other information (incl. discontinued operations and assets held for sale)
Assets 7 095 1 889 2 047 1 096(5) 12 127
Liabilities 2 506 1 604 865 1 699 6 674
Capital expenditures 281 129 167 29 606
Non-cash operating activities:
Depreciation and amortization 376 121 82 14 593
Impairment losses(4) 134 2 170 — 306
Share-based compensation 9 1 — 2 12
Operating result of discontinued
operations 1 — (9) — (8)
Year ended December 31, 2013 (in millions of €) United States Belgium(2) SEE(3) Corporate Total
Revenues(1) 12 536 5 072 2 985 — 20 593
Cost of sales (9 259) (4 046) (2 274) — (15
579)
Gross profit 3 277 1 026 711 — 5 014
Gross margin 26.1% 20.2% 23.8%
N/A 24.3%
Other operating income 56 44 27 — 127
Selling, general and
administrative expenses (2 835) (866) (598) (48) (4 347)
Other operating expenses (41) (17) (200) 1 (257)
Operating profit (loss) 457 187 (60) (47) 537
Operating margin 3.6% 3.7% (2.0%) N/A 2.6%
Adjustments:
Impairment losses (reversals) 13 2 191 — 206
Reorganization expenses (reversals) 18 — — — 18
Store closing expenses
(reversals) 5 — — — 5
(Gains) losses on disposal of assets (2) 8 2 2 10
(Gains) losses on disposal of businesses — (9) — — (9)
Other 10 10 (3) 5 22
Underlying operating profit (loss) 501 198 130 (40) 789
Underlying operating
margin 4.0% 3.9% 4.4% N/A 3.8%
Other information (incl. discontinued operations and assets held for sale)
Assets 6 983 1 867 2 105 639(5) 11 594
Liabilities 2 482 1 399 807 1 833 6 521
Capital expenditures 276 140 127 22 565
Non-cash operating activities:
Depreciation and amortization 391 115 83 10 599
Impairment losses(4) 23 2 206 — 231
Share-based compensation 13 1 — 2 16
Operating result of discontinued
operations (58) — (28) — (86)
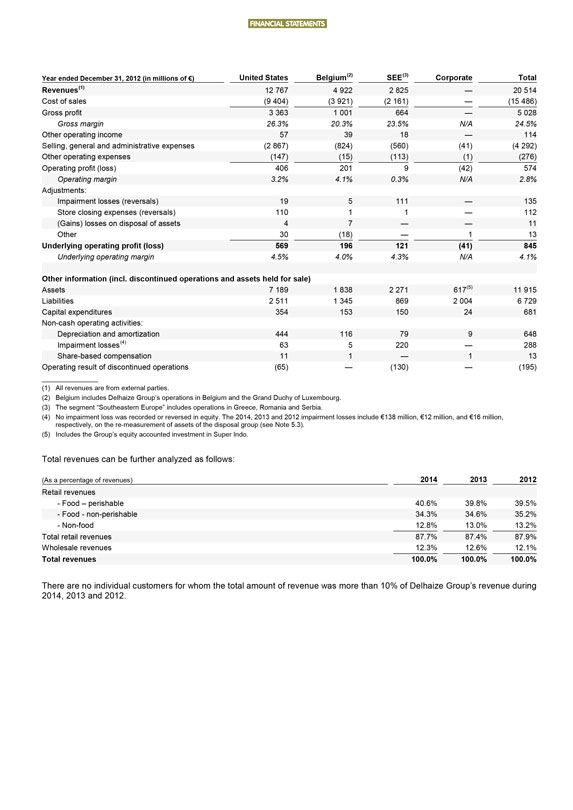
FINANCIAL STATEMENTS
Year ended December 31,
2012 (in millions of €) United States Belgium(2) SEE(3) Corporate Total
Revenues(1) 12 767 4 922 2 825 — 20 514
Cost of sales (9 404) (3 921) (2 161) — (15 486)
Gross profit 3 363 1 001 664 — 5
028
Gross margin 26.3% 20.3% 23.5% N/A 24.5%
Other operating income 57 39 18
— 114
Selling, general and administrative expenses (2 867) (824) (560) (41) (4 292)
Other operating expenses (147) (15) (113) (1) (276)
Operating profit (loss) 406 201 9 (42) 574
Operating margin 3.2% 4.1% 0.3% N/A 2.8%
Adjustments:
Impairment losses (reversals) 19 5 111 — 135
Store closing expenses (reversals) 110 1 1
— 112
(Gains) losses on disposal of assets 4 7 — — 11
Other 30
(18) — 1 13
Underlying operating profit (loss) 569 196 121 (41) 845
Underlying operating margin 4.5% 4.0% 4.3% N/A 4.1%
Other information (incl.
discontinued operations and assets held for sale)
Assets 7 189 1 838 2 271 617(5) 11 915
Liabilities 2 511 1 345 869 2 004 6 729
Capital expenditures 354 153 150 24 681
Non-cash operating activities:
Depreciation and amortization 444 116 79 9 648
Impairment losses(4) 63 5 220 — 288
Share-based compensation 11 1 — 1 13
Operating result of discontinued operations (65) — (130) — (195)
(1) All revenues
are from external parties.
(2) Belgium includes Delhaize Group’s operations in Belgium and the Grand Duchy of Luxembourg.
(3) The segment “Southeastern Europe” includes operations in Greece, Romania and Serbia.
(4) No impairment loss was recorded or reversed in equity. The 2014, 2013 and 2012 impairment losses include €138 million, €12 million, and
€16 million, respectively, on the re-measurement of assets of the disposal group (see Note 5.3).
(5) Includes the Group’s equity accounted
investment in Super Indo.
Total revenues can be further analyzed as follows:
(As a percentage of revenues) 2014 2013 2012
Retail revenues
- Food – perishable 40.6% 39.8% 39.5%
- Food - non-perishable 34.3% 34.6% 35.2%
- Non-food 12.8% 13.0% 13.2%
Total retail revenues 87.7% 87.4% 87.9%
Wholesale revenues 12.3% 12.6% 12.1%
Total revenues 100.0% 100.0% 100.0%
There are no individual customers for whom the total amount of revenue was more than 10% of Delhaize Group’s revenue during 2014, 2013 and 2012.
Delhaize Group Annual Report 2014 • 97
4.
Business Combinations and Acquisition of Non-controlling Interests
4.1 Business Combinations
Acquisitions during 2014
During 2014, Delhaize Group entered into several agreements in
Southeastern Europe and the U.S. that have resulted in the acquisition of businesses and were accounted for as business combinations. The total cash consideration transferred for these transactions was €20 million and the transactions
resulted in an increase of goodwill of €13 million.
Acquisitions during 2013
During 2013, Delhaize Group entered into several agreements in Southeastern Europe that have resulted in the acquisition of businesses and were accounted for as business
combinations. The total consideration transferred during the year for these transactions was €9 million and resulted in an increase of goodwill of €3 million.
In addition, Delhaize Group reached an agreement with the former owner of Delta Maxi to settle all remaining indemnification assets and received €22 million in cash.
Acquisitions during 2012
During 2012, Delhaize Group entered into several
agreements in Belgium and Romania that have resulted in the acquisition of businesses and were accounted for as business combinations. The total consideration transferred during the year for these transactions was €5 million and resulted
in an increase of goodwill of €3 million.
4.2 Acquisitions of Non-controlling Interests
Acquisitions during 2014 and 2013
During 2014 and 2013, Delhaize Group did not acquire
additional non-controlling interests.
In 2013, the Group launched a tender offer to acquire 16% non-controlling interests in C-Market (Serbian subsidiary), held by
the Serbian Privatization Agency, at a price of €300 per share (representing approximately €10 million). The Serbian Privatization Agency suspended twice the privatization procedures of C-Market, due to a probe into the entity’s
earlier privatization. Neither the Group nor the current privatization process are target of these investigations. Delhaize Group withdrew its offer after it expired later that year. A new privatization process was launched in the second part of
2014, but has not been open for tendering at year-end. Delhaize Group will consider its participation in the process in due time. Consequently, Delhaize Group continues to own 75.5% of C-Market.
Acquisitions during 2012
In 2012, the minority shareholder of Ela d.o.o. Kotor (Montenegrin
subsidiary) irrevocably and unconditionally exercised its put option selling to Delhaize Group its share of 49% in the subsidiary. The Group recognized, as part of the purchase price allocation, (i) a liability of approximately
€13 million in connection with the put option, representing its best estimate of the expected cash outflow, and (ii) an indemnification asset of approximately €6 million towards the former owner of Delta Maxi. The Group
reclassified the remaining non-controlling interest into retained earnings and recognized the subsequent immaterial changes in value of the liability and the indemnification asset in profit or loss.
During 2012, Delhaize Group acquired additional non-controlling interests for a total amount of €10 million, including transaction costs, recognized in equity, mainly
relating to Serbian subsidiaries.
FINANCIAL STATEMENTS
5. Divestitures, Disposal
Group / Assets Held for Sale and Discontinued Operations
5.1 Divestitures
During 2014, Delhaize Group only divested operations from its operating activities that met the definition of discontinued operations (see Note 5.3).
In 2013, Delhaize Group converted several of its Belgian company-operated City stores into affiliated Proxy stores, operated by independent third parties. Delhaize Group received a
total cash consideration of €12 million and recognized a gain on disposal of approximately €9 million, classified as “Other operating income”.
In 2012, Delhaize Group sold Wambacq & Peeters SA, a Belgian transport company, to Van Moer Group. This transaction did not meet the criteria of a “Discontinued
Operation” and was completed on April 30, 2012. Delhaize Group received €3 million in cash and recorded a gain on disposal of €1 million in 2012.
5.2 Disposal Group / Assets Classified as Held for Sale
Disposal of Bottom Dollar Food
In 2014, Delhaize Group signed an agreement with ALDI Inc. to sell its 66 Bottom Dollar Food locations for approximately $15 million (€12 million). The
estimated fair value of the disposal group has been classified as a Level 1 fair value, being the exit price in an orderly and binding transaction.
Assets and
liabilities relating to these operations (being part of the “United States” segment) are classified as a disposal group held for sale. The transaction also meets the definition of discontinued operations. Consequently, the relevant profit
or loss after tax has been classified as “Result from discontinued operations”, with comparative information being re-presented.
The transaction is
subject to customary closing conditions and is expected to be completed early 2015. In 2014, the 66 stores generated revenues of approximately $0.5 billion.
At
December 31, 2014, the carrying value of assets classified as held for sale and associated liabilities related to the disposal of Bottom Dollar Food to ALDI Inc. were as follows:
(in millions of €) 2014
Property, plant and equipment 52
Assets classified as held for sale 52
Less:
Obligations under finance lease (37)
Accounts payable, accrued expenses and other liabilities
(3)
Assets classified as held for sale, net of associated liabilities 12
In
addition, equipment relating to these stores (carrying amount of €2 million) has been classified as held for sale and is expected be sold to third parties.
The Group recognized a total impairment loss of €124 million (see also Note 5.3) to write down the carrying value of the Bottom Dollar Food operations to
its fair value less costs to sell.
Disposal of Sweetbay, Harveys and Reid’s
In 2013, Delhaize Group signed an agreement with Bi-Lo Holdings (Bi-Lo) to sell its Sweetbay, Harveys and Reid’s operations. The transaction closed in 2014 for a final sales
price of $234 million (€171 million) in cash.
Assets and liabilities relating to these operations (being part of the “United States” segment) were
classified as a disposal group held for sale in 2013 and the relevant profit or loss after tax classified as “Result from discontinued operations”, with comparative information being re-presented.
In 2013, the 164 stores included in the transaction generated revenues of approximately $1.7 billion.
A gain of €8 million realized on the sale was included in “Results from discontinued operations” during 2014.
Disposal of Bulgarian and Bosnian & Herzegovinian operations
In 2014, Delhaize Group
sold its Bulgarian operations to AP Mart and Delhaize Bosnia & Herzegovina to Tropic Group B.V., incurring insignificant settlement losses. Both activities were part of the “Southeastern Europe” segment and meet the requirements
of discontinued operations. Therefore, the profit and loss after tax relating to these operations are classified as
“Result from discontinued operations”
(see also Note 5.3) and comparative information has been re-presented.
The operations were transferred to the buyers, including cash and cash equivalents of
€3 million and €1 million, respectively.
Delhaize Group Annual Report 2014 • 99
Disposal of Delhaize Montenegro
In 2013, Delhaize Group sold its Montenegrin
operations (part of the “Southeastern Europe” segment) for a total sales price of €5 million to Expo Commerce and presented the profit and loss as discontinued operations (see also Note 5.3). Comparative information was
re-presented.
Disposal of Delhaize Albania SHPK
In 2013, Delhaize Group
completed the sale of its Albanian activities (“Delhaize Albania”) for a sales price of €1 million. The assets and liabilities of Delhaize Albania, that were part of the “Southeastern Europe” segment had been presented as
“held for sale” as of December 31, 2012 and the previous years’ operating results as well as the gain of €1 million realized on the sale were classified as “Results from discontinued operations” in the income
statement.
Disposal of individual properties
In 2014, Delhaize Group sold its
distribution center in Plant City, Florida (carrying amount of $23 million), which was supplying Sweetbay stores until their disposal, to C&S Wholesale Grocers for a total consideration of $28 million (€21 million).
Delhaize Group holds a number of individual properties, mainly small shops, office buildings, pharmacies or bank branches, which it considers not incremental to its retail
operations. The carrying value of these assets held for sale amounts to €6 million at December 31, 2014, of which €3 million relate to the U.S. and €3 million to the “Southeastern Europe” segment. At
December 31, 2013 and 2012, the carrying value of individual properties held for sale amounted to €7 million and €12 million, respectively.
These properties are measured at fair value less costs to sell. The fair values of these assets have been categorized in Level 2 in the fair value level hierarchy.
These fair values have been determined predominantly using a market approach based on sales transactions in the market of comparable property and signed non-binding sales agreements.
5.3 Discontinued Operations
As mentioned in Note 5.2, Bottom Dollar Food, Sweetbay, Harveys
and Reid’s (U.S.), the Bulgarian operations, Delhaize Bosnia & Herzegovina, Delhaize Montenegro and Delhaize Albania qualified as discontinued operations.
The overall “Result from discontinued operations” and corresponding net cash flows of the entities classified as discontinued operations are summarized as follows (no
adjustments to amounts previously presented in discontinued operations were made):
(in millions of €, except per share information) 2014 2013 2012
Revenues 864 1 868 2 103
Cost of sales (676) (1 415) (1 587)
Other operating income 7 12 9
Selling, general and administrative expenses (195) (462) (566)
Other operating expenses (8) (89) (154)
Net financial expenses (1) (17) (17)
Result before tax (9) (103) (212)
Income taxes (2) 25 34
Result of discontinued operations (net of tax) (11) (78) (178)
Pre-tax loss recognized on
re-measurement of assets of disposal groups (138) (12) (16)
Income taxes 50 — —
Result from discontinued operations (net of tax), fully attributable to equity holders of the Group (99) (90) (194)
Basic earnings per share from discontinued operations (0.97) (0.89) (1.92)
Diluted earnings
per share from discontinued operations (0.97) (0.88) (1.91)
Operating cash flows (29) 15 9
Investing cash flows 7 (43) (51)
Financing cash flows 9 43 20
Total cash flows (13) 15 (22)
In 2014, Delhaize Group recognized €138 million of
impairment losses to write down the carrying value of Bottom Dollar Food (€124 million), the Bulgarian operations (€11 million) and Delhaize Bosnia & Herzegovina (€3 million) to their estimated fair value less costs to sell.
In 2013, Delhaize Group recognized in “Other operating expenses” Sweetbay store closing charges of €46 million, onerous lease contract charges,
severance costs and impairment losses related to headquarter and distribution centers that were impacted by the planned sale to Bi-Lo for a total amount of €19 million and incurred cost to sell of €9 million. The Group recognized a
total
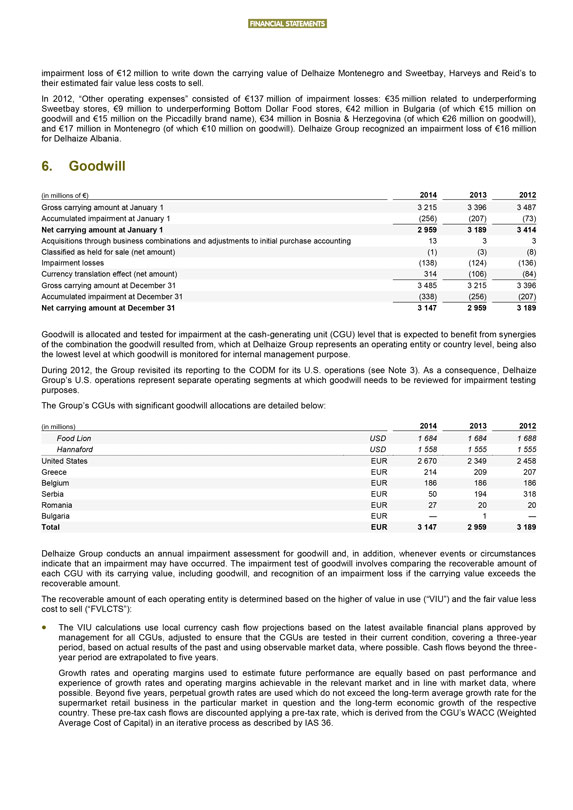
FINANCIAL STATEMENTS
impairment loss of
€12 million to write down the carrying value of Delhaize Montenegro and Sweetbay, Harveys and Reid’s to their estimated fair value less costs to sell.
In 2012, “Other operating expenses” consisted of €137 million of impairment losses: €35 million related to underperforming Sweetbay
stores, €9 million to underperforming Bottom Dollar Food stores, €42 million in Bulgaria (of which €15 million on goodwill and €15 million on the Piccadilly brand name), €34 million in
Bosnia & Herzegovina (of which €26 million on goodwill), and €17 million in Montenegro (of which €10 million on goodwill). Delhaize Group recognized an impairment loss of €16 million for Delhaize
Albania.
6. Goodwill
(in millions of €) 2014 2013 2012
Gross carrying amount at January 1 3 215 3 396 3 487
Accumulated impairment at
January 1 (256) (207) (73)
Net carrying amount at January 1 2 959 3 189 3 414
Acquisitions through business combinations and adjustments to initial purchase accounting 13 3 3
Classified as held for sale (net amount) (1) (3) (8)
Impairment losses (138)
(124) (136)
Currency translation effect (net amount) 314 (106) (84)
Gross
carrying amount at December 31 3 485 3 215 3 396
Accumulated impairment at December 31 (338) (256) (207)
Net carrying amount at December 31 3 147 2 959 3 189
Goodwill is allocated and tested for
impairment at the cash-generating unit (CGU) level that is expected to benefit from synergies of the combination the goodwill resulted from, which at Delhaize Group represents an operating entity or country level, being also the lowest level at
which goodwill is monitored for internal management purpose.
During 2012, the Group revisited its reporting to the CODM for its U.S. operations (see Note 3). As a
consequence, Delhaize Group’s U.S. operations represent separate operating segments at which goodwill needs to be reviewed for impairment testing purposes.
The Group’s CGUs with significant goodwill allocations are detailed below:
(in millions) 2014 2013 2012
Food Lion USD 1 684 1 684 1 688
Hannaford USD 1 558 1 555 1 555
United States EUR 2 670 2 349 2 458
Greece EUR 214 209 207
Belgium EUR 186 186 186
Serbia EUR 50 194 318
Romania EUR 27 20 20
Bulgaria EUR — 1 —
Total EUR 3 147 2 959 3 189
Delhaize Group conducts an annual impairment assessment for goodwill and, in addition, whenever events or circumstances indicate that an impairment may have occurred. The
impairment test of goodwill involves comparing the recoverable amount of each CGU with its carrying value, including goodwill, and recognition of an impairment loss if the carrying value exceeds the recoverable amount.
The recoverable amount of each operating entity is determined based on the higher of value in use (“VIU”) and the fair value less cost to sell (“FVLCTS”):
The VIU calculations use local currency cash flow projections based on the latest available financial plans approved by management for all CGUs, adjusted to ensure
that the CGUs are tested in their current condition, covering a three-year period, based on actual results of the past and using observable market data, where possible. Cash flows beyond the three-year period are extrapolated to five years.
Growth rates and operating margins used to estimate future performance are equally based on past performance and experience of growth rates and operating margins
achievable in the relevant market and in line with market data, where possible. Beyond five years, perpetual growth rates are used which do not exceed the long-term average growth rate for the supermarket retail business in the particular market in
question and the long-term economic growth of the respective country. These pre-tax cash flows are discounted applying a pre-tax rate, which is derived from the CGU’s WACC (Weighted Average Cost of Capital) in an iterative process as described
by IAS 36.
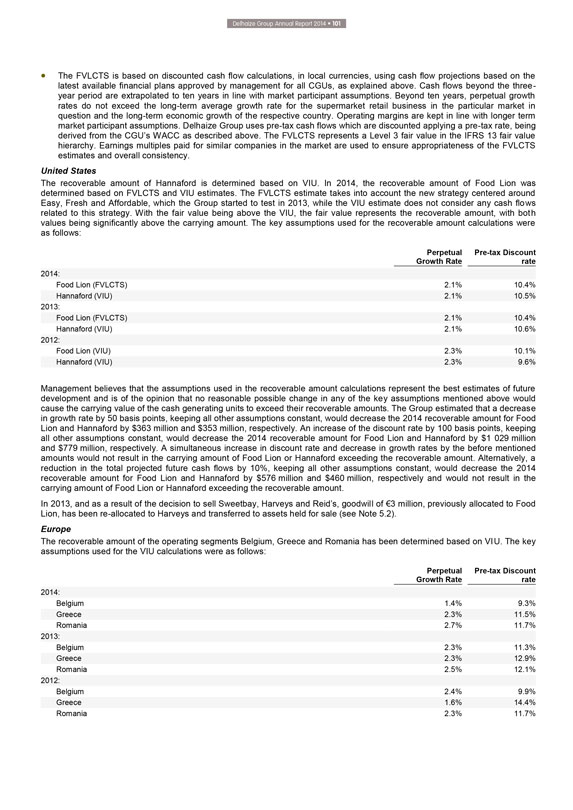
Delhaize Group Annual Report 2014 • 101
The
FVLCTS is based on discounted cash flow calculations, in local currencies, using cash flow projections based on the latest available financial plans approved by management for all CGUs, as explained above. Cash flows beyond the three-year period are
extrapolated to ten years in line with market participant assumptions. Beyond ten years, perpetual growth rates do not exceed the long-term average growth rate for the supermarket retail business in the particular market in question and the
long-term economic growth of the respective country. Operating margins are kept in line with longer term market participant assumptions. Delhaize Group uses pre-tax cash flows which are discounted applying a pre-tax rate, being derived from the
CGU’s WACC as described above. The FVLCTS represents a Level 3 fair value in the IFRS 13 fair value hierarchy. Earnings multiples paid for similar companies in the market are used to ensure appropriateness of the FVLCTS estimates and overall
consistency.
United States
The recoverable amount of Hannaford is determined
based on VIU. In 2014, the recoverable amount of Food Lion was determined based on FVLCTS and VIU estimates. The FVLCTS estimate takes into account the new strategy centered around Easy, Fresh and Affordable, which the Group started to test in 2013,
while the VIU estimate does not consider any cash flows related to this strategy. With the fair value being above the VIU, the fair value represents the recoverable amount, with both values being significantly above the carrying amount. The key
assumptions used for the recoverable amount calculations were as follows:
Perpetual Pre-tax Discount
Growth Rate rate
2014:
Food Lion (FVLCTS) 2.1% 10.4%
Hannaford (VIU) 2.1% 10.5%
2013:
Food Lion (FVLCTS) 2.1% 10.4%
Hannaford (VIU) 2.1% 10.6%
2012:
Food Lion (VIU) 2.3% 10.1%
Hannaford (VIU) 2.3% 9.6%
Management believes that the assumptions used in the recoverable amount calculations represent the best estimates of future development and is of the opinion that no reasonable
possible change in any of the key assumptions mentioned above would cause the carrying value of the cash generating units to exceed their recoverable amounts. The Group estimated that a decrease in growth rate by 50 basis points, keeping all other
assumptions constant, would decrease the 2014 recoverable amount for Food Lion and Hannaford by $363 million and $353 million, respectively. An increase of the discount rate by 100 basis points, keeping all other assumptions constant, would decrease
the 2014 recoverable amount for Food Lion and Hannaford by $1 029 million and $779 million, respectively. A simultaneous increase in discount rate and decrease in growth rates by the before mentioned amounts would not result in the carrying
amount of Food Lion or Hannaford exceeding the recoverable amount. Alternatively, a reduction in the total projected future cash flows by 10%, keeping all other assumptions constant, would decrease the 2014 recoverable amount for Food Lion and
Hannaford by $576 million and $460 million, respectively and would not result in the carrying amount of Food Lion or Hannaford exceeding the recoverable amount.
In
2013, and as a result of the decision to sell Sweetbay, Harveys and Reid’s, goodwill of €3 million, previously allocated to Food Lion, has been re-allocated to Harveys and transferred to assets held for sale (see Note 5.2).
Europe
The recoverable amount of the operating segments Belgium, Greece and
Romania has been determined based on VIU. The key assumptions used for the VIU calculations were as follows:
Perpetual Pre-tax Discount
Growth Rate rate
2014:
Belgium 1.4% 9.3%
Greece 2.3% 11.5%
Romania 2.7% 11.7%
2013:
Belgium 2.3% 11.3%
Greece 2.3% 12.9%
Romania 2.5% 12.1%
2012:
Belgium 2.4% 9.9%
Greece 1.6% 14.4%
Romania 2.3% 11.7%
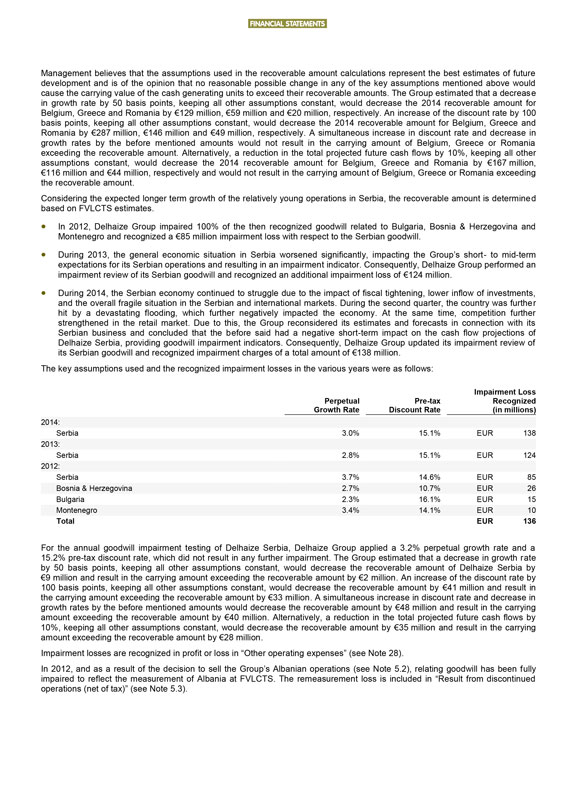
FINANCIAL STATEMENTS
Management believes that the
assumptions used in the recoverable amount calculations represent the best estimates of future development and is of the opinion that no reasonable possible change in any of the key assumptions mentioned above would cause the carrying value of the
cash generating units to exceed their recoverable amounts. The Group estimated that a decrease in growth rate by 50 basis points, keeping all other assumptions constant, would decrease the 2014 recoverable amount for Belgium, Greece and Romania by
€129 million, €59 million and €20 million, respectively. An increase of the discount rate by 100 basis points, keeping all other assumptions constant, would decrease the 2014 recoverable amount for Belgium, Greece and
Romania by €287 million, €146 million and €49 million, respectively. A simultaneous increase in discount rate and decrease in growth rates by the before mentioned amounts would not result in the carrying amount of
Belgium, Greece or Romania exceeding the recoverable amount. Alternatively, a reduction in the total projected future cash flows by 10%, keeping all other assumptions constant, would decrease the 2014 recoverable amount for Belgium, Greece and
Romania by €167 million, €116 million and €44 million, respectively and would not result in the carrying amount of Belgium, Greece or Romania exceeding the recoverable amount.
Considering the expected longer term growth of the relatively young operations in Serbia, the recoverable amount is determined based on FVLCTS estimates.
In 2012, Delhaize Group impaired 100% of the then recognized goodwill related to Bulgaria, Bosnia & Herzegovina and Montenegro and recognized a €85 million
impairment loss with respect to the Serbian goodwill.
During 2013, the general economic situation in Serbia worsened significantly, impacting the Group’s
short- to mid-term expectations for its Serbian operations and resulting in an impairment indicator. Consequently, Delhaize Group performed an impairment review of its Serbian goodwill and recognized an additional impairment loss of €124
million.
During 2014, the Serbian economy continued to struggle due to the impact of fiscal tightening, lower inflow of investments, and the overall fragile
situation in the Serbian and international markets. During the second quarter, the country was further hit by a devastating flooding, which further negatively impacted the economy. At the same time, competition further strengthened in the retail
market. Due to this, the Group reconsidered its estimates and forecasts in connection with its Serbian business and concluded that the before said had a negative short-term impact on the cash flow projections of Delhaize Serbia, providing goodwill
impairment indicators. Consequently, Delhaize Group updated its impairment review of its Serbian goodwill and recognized impairment charges of a total amount of €138 million.
The key assumptions used and the recognized impairment losses in the various years were as follows:
Impairment Loss
Perpetual Pre-tax Recognized
Growth Rate Discount Rate (in millions)
2014:
Serbia 3.0% 15.1% EUR 138
2013:
Serbia 2.8% 15.1% EUR 124
2012:
Serbia 3.7% 14.6% EUR 85
Bosnia & Herzegovina 2.7% 10.7% EUR 26
Bulgaria 2.3% 16.1% EUR 15
Montenegro 3.4% 14.1% EUR 10
Total EUR 136
For the annual goodwill impairment testing of Delhaize Serbia, Delhaize Group
applied a 3.2% perpetual growth rate and a 15.2% pre-tax discount rate, which did not result in any further impairment. The Group estimated that a decrease in growth rate by 50 basis points, keeping all other assumptions constant, would decrease the
recoverable amount of Delhaize Serbia by €9 million and result in the carrying amount exceeding the recoverable amount by €2 million. An increase of the discount rate by 100 basis points, keeping all other assumptions constant, would
decrease the recoverable amount by €41 million and result in the carrying amount exceeding the recoverable amount by €33 million. A simultaneous increase in discount rate and decrease in growth rates by the before mentioned amounts
would decrease the recoverable amount by €48 million and result in the carrying amount exceeding the recoverable amount by €40 million. Alternatively, a reduction in the total projected future cash flows by 10%, keeping all other
assumptions constant, would decrease the recoverable amount by €35 million and result in the carrying amount exceeding the recoverable amount by €28 million.
Impairment losses are recognized in profit or loss in “Other operating expenses” (see Note 28).
In 2012, and as a result of the decision to sell the Group’s Albanian operations (see Note 5.2), relating goodwill has been fully impaired to reflect the measurement of
Albania at FVLCTS. The remeasurement loss is included in “Result from discontinued operations (net of tax)” (see Note 5.3).
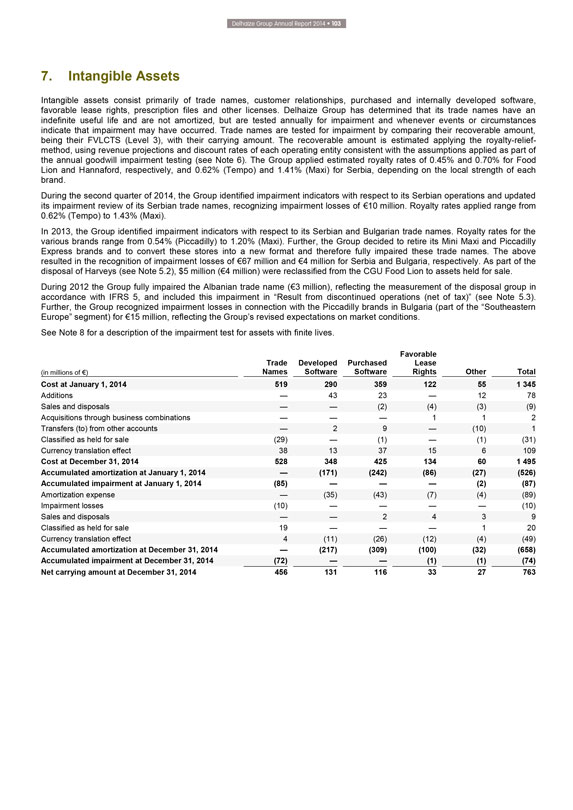
Delhaize Group Annual Report 2014 • 103
7.
Intangible Assets
Intangible assets consist primarily of trade names, customer relationships, purchased and internally developed software, favorable lease rights,
prescription files and other licenses. Delhaize Group has determined that its trade names have an indefinite useful life and are not amortized, but are tested annually for impairment and whenever events or circumstances indicate that impairment may
have occurred. Trade names are tested for impairment by comparing their recoverable amount, being their FVLCTS (Level 3), with their carrying amount. The recoverable amount is estimated applying the royalty-relief-method, using revenue projections
and discount rates of each operating entity consistent with the assumptions applied as part of the annual goodwill impairment testing (see Note 6). The Group applied estimated royalty rates of 0.45% and 0.70% for Food Lion and Hannaford,
respectively, and 0.62% (Tempo) and 1.41% (Maxi) for Serbia, depending on the local strength of each brand.
During the second quarter of 2014, the Group identified
impairment indicators with respect to its Serbian operations and updated its impairment review of its Serbian trade names, recognizing impairment losses of €10 million. Royalty rates applied range from 0.62% (Tempo) to 1.43% (Maxi).
In 2013, the Group identified impairment indicators with respect to its Serbian and Bulgarian trade names. Royalty rates for the various brands range from 0.54% (Piccadilly) to
1.20% (Maxi). Further, the Group decided to retire its Mini Maxi and Piccadilly Express brands and to convert these stores into a new format and therefore fully impaired these trade names. The above resulted in the recognition of impairment losses
of €67 million and €4 million for Serbia and Bulgaria, respectively. As part of the disposal of Harveys (see Note 5.2), $5 million (€4 million) were reclassified from the CGU Food Lion to assets held for sale.
During 2012 the Group fully impaired the Albanian trade name (€3 million), reflecting the measurement of the disposal group in accordance with IFRS 5, and included this
impairment in “Result from discontinued operations (net of tax)” (see Note 5.3). Further, the Group recognized impairment losses in connection with the Piccadilly brands in Bulgaria (part of the “Southeastern Europe” segment) for
€15 million, reflecting the Group’s revised expectations on market conditions.
See Note 8 for a description of the impairment test for assets with
finite lives.
(in millions of €) Trade Names Developed Software Purchased Software Favorable Lease Rights Other Total
Cost at January 1, 2014 519 290 359 122 55 1 345
Additions — 43 23 — 12 78
Sales and disposals — — (2) (4) (3) (9)
Acquisitions through
business combinations — — — 1 1 2
Transfers (to) from other accounts — 2 9 — (10) 1
Classified as held for sale (29) — (1) — (1) (31)
Currency translation effect 38 13
37 15 6 109
Cost at December 31, 2014 528 348 425 134 60 1 495
Accumulated amortization at January 1, 2014 — (171) (242) (86) (27) (526)
Accumulated impairment at January 1, 2014 (85) — — — (2) (87)
Amortization
expense — (35) (43) (7) (4) (89)
Impairment losses (10) — — — — (10)
Sales and disposals — — 2 4 3 9
Classified as held for sale 19 — — —
1 20
Currency translation effect 4 (11) (26) (12) (4) (49)
Accumulated
amortization at December 31, 2014 — (217) (309) (100) (32) (658)
Accumulated impairment at December 31, 2014 (72) — — (1) (1) (74)
Net carrying amount at December 31, 2014 456 131 116 33 27 763
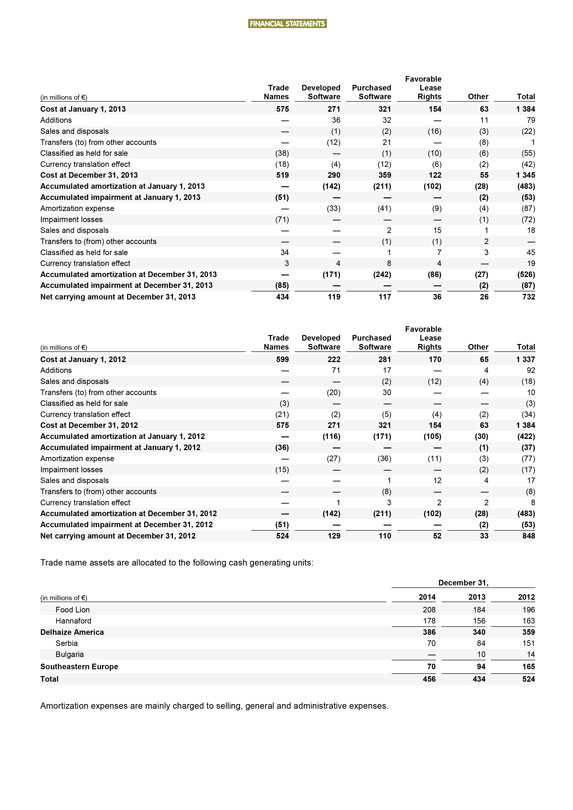
FINANCIAL STATEMENTS
(in millions of €) Trade
Names Developed Software Purchased Software Favorable Lease Rights Other Total
Cost at January 1, 2013 575 271 321 154 63 1 384
Additions — 36 32 — 11 79
Sales and disposals — (1) (2) (16) (3) (22)
Transfers (to) from other accounts — (12) 21 — (8) 1
Classified as
held for sale (38) — (1) (10) (6) (55)
Currency translation effect (18) (4) (12) (6) (2) (42)
Cost at December 31, 2013 519 290 359 122 55 1 345
Accumulated amortization at
January 1, 2013 — (142) (211) (102) (28) (483)
Accumulated impairment at January 1, 2013 (51) — — — (2) (53)
Amortization expense — (33) (41) (9) (4) (87)
Impairment losses (71) — — —
(1) (72)
Sales and disposals — — 2 15 1 18
Transfers to (from)
other accounts — — (1) (1) 2 —
Classified as held for sale 34 — 1 7 3 45
Currency translation effect 3 4 8 4 — 19
Accumulated amortization at December 31,
2013 — (171) (242) (86) (27) (526)
Accumulated impairment at December 31, 2013 (85) — — — (2) (87)
Net carrying amount at December 31, 2013 434 119 117 36 26 732
(in millions of €)
Trade Names Developed Software Purchased Software Favorable Lease Rights Other Total
Cost at January 1, 2012 599 222 281 170 65 1 337
Additions — 71 17 — 4 92
Sales and disposals — — (2) (12) (4) (18)
Transfers (to) from other accounts — (20) 30 — — 10
Classified
as held for sale (3) — — — — (3)
Currency translation effect (21) (2) (5) (4) (2) (34)
Cost at December 31, 2012 575 271 321 154 63 1 384
Accumulated amortization at
January 1, 2012 — (116) (171) (105) (30) (422)
Accumulated impairment at January 1, 2012 (36) — — — (1) (37)
Amortization expense — (27) (36) (11) (3) (77)
Impairment losses (15) — —
— (2) (17)
Sales and disposals — — 1 12 4 17
Transfers to
(from) other accounts — — (8) — — (8)
Currency translation effect — 1 3 2 2 8
Accumulated amortization at December 31, 2012 — (142) (211) (102) (28) (483)
Accumulated impairment at December 31, 2012 (51) — — — (2) (53)
Net carrying amount at December 31, 2012 524 129 110 52 33 848
Trade name assets are
allocated to the following cash generating units:
December 31,
(in
millions of €) 2014 2013 2012
Food Lion 208 184 196
Hannaford 178 156
163
Delhaize America 386 340 359
Serbia 70 84 151
Bulgaria — 10 14
Southeastern Europe 70 94 165
Total 456 434 524
Amortization expenses are mainly charged to selling, general and
administrative expenses.
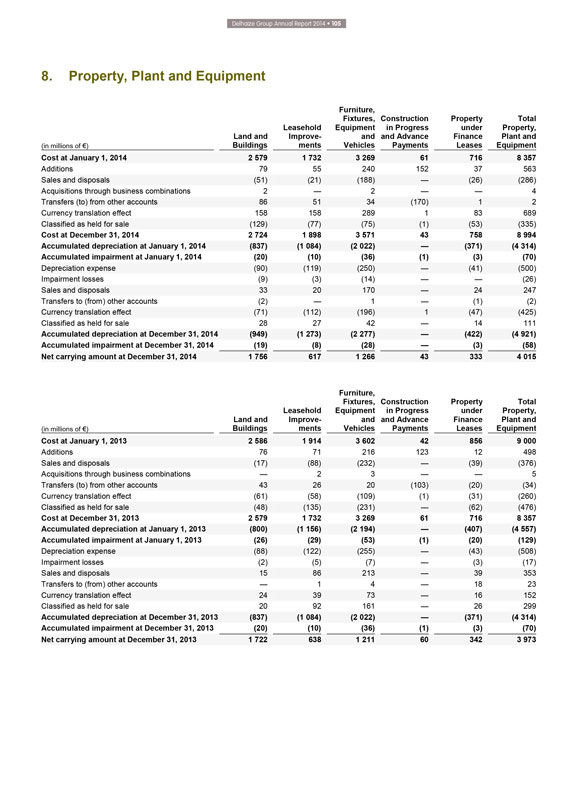
Delhaize Group Annual Report 2014 • 105
8.
Property, Plant and Equipment
(in millions of €) Land and Buildings Leasehold Improvements Furniture, Fixtures, Equipment and Vehicles Construction in
Progress and Advance Payments Property under Finance Leases Total Property, Plant and Equipment
Cost at January 1, 2014 2 579 1 732 3 269 61 716 8 357
Additions 79 55 240 152 37 563
Sales and disposals (51) (21) (188) —
(26) (286)
Acquisitions through business combinations 2 — 2 — — 4
Transfers (to) from other accounts 86 51 34 (170) 1 2
Currency translation effect 158 158 289
1 83 689
Classified as held for sale (129) (77) (75) (1) (53) (335)
Cost at
December 31, 2014 2 724 1 898 3 571 43 758 8 994
Accumulated depreciation at January 1, 2014 (837) (1 084) (2 022) — (371) (4 314)
Accumulated impairment at January 1, 2014 (20) (10) (36) (1) (3) (70)
Depreciation
expense (90) (119) (250) — (41) (500)
Impairment losses (9) (3) (14) — — (26)
Sales and disposals 33 20 170 — 24 247
Transfers to (from) other accounts (2) — 1
— (1) (2)
Currency translation effect (71) (112) (196) 1 (47) (425)
Classified as held for sale 28 27 42 — 14 111
Accumulated depreciation
at December 31, 2014 (949) (1 273) (2 277) — (422) (4 921)
Accumulated impairment at December 31, 2014 (19) (8) (28) — (3) (58)
Net carrying amount at December 31, 2014 1 756 617 1 266 43 333 4 015
(in millions of
€) Land and Buildings Leasehold Improvements Furniture, Fixtures, Equipment and Vehicles Construction in Progress and Advance Payments Property under Finance Leases Total Property, Plant and Equipment
Cost at January 1, 2013 2 586 1 914 3 602 42 856 9 000
Additions 76 71 216 123 12 498
Sales and disposals (17) (88) (232) — (39) (376)
Acquisitions through
business combinations — 2 3 — — 5
Transfers (to) from other accounts 43 26 20 (103) (20) (34)
Currency translation effect (61) (58) (109) (1) (31) (260)
Classified as held for sale (48)
(135) (231) — (62) (476)
Cost at December 31, 2013 2 579 1 732 3 269 61 716 8 357
Accumulated depreciation at January 1, 2013 (800) (1 156) (2 194) — (407) (4 557)
Accumulated impairment at January 1, 2013 (26) (29) (53) (1) (20) (129)
Depreciation expense (88) (122) (255) — (43) (508)
Impairment losses (2)
(5) (7) — (3) (17)
Sales and disposals 15 86 213 — 39 353
Transfers
to (from) other accounts — 1 4 — 18 23
Currency translation effect 24 39 73 — 16 152
Classified as held for sale 20 92 161 — 26 299
Accumulated depreciation at
December 31, 2013 (837) (1 084) (2 022) — (371) (4 314)
Accumulated impairment at December 31, 2013 (20) (10) (36) (1) (3) (70)
Net carrying amount at December 31, 2013 1 722 638 1 211 60 342 3 973
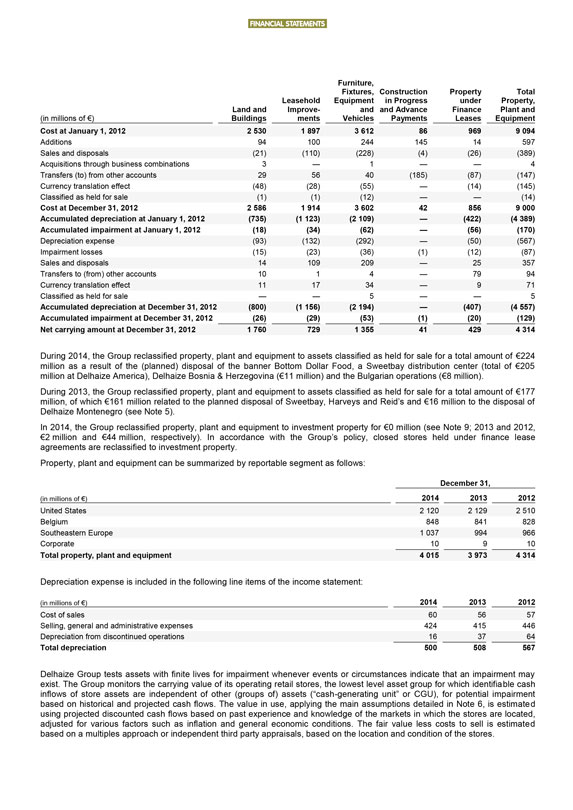
FINANCIAL STATEMENTS
(in millions of €) Land
and Buildings Leasehold Improvements Furniture, Fixtures, Equipment and Vehicles Construction in Progress and Advance Payments Property under Finance Leases Total Property, Plant and Equipment
Cost at January 1, 2012 2 530 1 897 3 612 86 969 9 094
Additions 94 100 244 145 14 597
Sales and disposals (21) (110) (228) (4) (26) (389)
Acquisitions through
business combinations 3 — 1 — — 4
Transfers (to) from other accounts 29 56 40 (185) (87) (147)
Currency translation effect (48) (28) (55) — (14) (145)
Classified as held for sale (1)
(1) (12) — — (14)
Cost at December 31, 2012 2 586 1 914 3 602 42 856 9 000
Accumulated depreciation at January 1, 2012 (735) (1 123) (2 109) — (422) (4 389)
Accumulated impairment at January 1, 2012 (18) (34) (62) — (56) (170)
Depreciation expense (93) (132) (292) — (50) (567)
Impairment losses
(15) (23) (36) (1) (12) (87)
Sales and disposals 14 109 209 — 25 357
Transfers to (from) other accounts 10 1 4 — 79 94
Currency translation
effect 11 17 34 — 9 71
Classified as held for sale — — 5 — — 5
Accumulated depreciation at December 31, 2012 (800) (1 156) (2 194) — (407) (4 557)
Accumulated impairment at December 31, 2012 (26) (29) (53) (1) (20) (129)
Net carrying amount at December 31, 2012 1 760 729 1 355 41 429 4 314
During 2014, the Group reclassified property, plant and equipment to assets classified as held for sale for a total amount of €224 million as a result of
the (planned) disposal of the banner Bottom Dollar Food, a Sweetbay distribution center (total of €205 million at Delhaize America), Delhaize Bosnia & Herzegovina (€11 million) and the Bulgarian operations (€8 million).
During 2013, the Group reclassified property, plant and equipment to assets classified as held for sale for a total amount of €177 million, of which
€161 million related to the planned disposal of Sweetbay, Harveys and Reid’s and €16 million to the disposal of Delhaize Montenegro (see Note 5).
In 2014, the Group reclassified property, plant and equipment to investment property for €0 million (see Note 9; 2013 and 2012, €2 million and €44 million,
respectively). In accordance with the Group’s policy, closed stores held under finance lease agreements are reclassified to investment property.
Property,
plant and equipment can be summarized by reportable segment as follows:
December 31,
(in millions of €) 2014 2013 2012
United States 2 120 2 129 2 510
Belgium 848 841 828
Southeastern Europe 1 037 994 966
Corporate 10 9 10
Total property, plant and equipment 4 015 3 973 4 314
Depreciation expense is included in the following line items of the income statement:
(in
millions of €) 2014 2013 2012
Cost of sales 60 56 57
Selling, general
and administrative expenses 424 415 446
Depreciation from discontinued operations 16 37 64
Total depreciation 500 508 567
Delhaize Group tests assets with finite lives for impairment
whenever events or circumstances indicate that an impairment may exist. The Group monitors the carrying value of its operating retail stores, the lowest level asset group for which identifiable cash inflows of store assets are independent of other
(groups of) assets (“cash-generating unit” or CGU), for potential impairment based on historical and projected cash flows. The value in use, applying the main assumptions detailed in Note 6, is estimated using projected discounted cash
flows based on past experience and knowledge of the markets in which the stores are located, adjusted for various factors such as inflation and general economic conditions. The fair value less costs to sell is estimated based on a multiples approach
or independent third party appraisals, based on the location and condition of the stores.
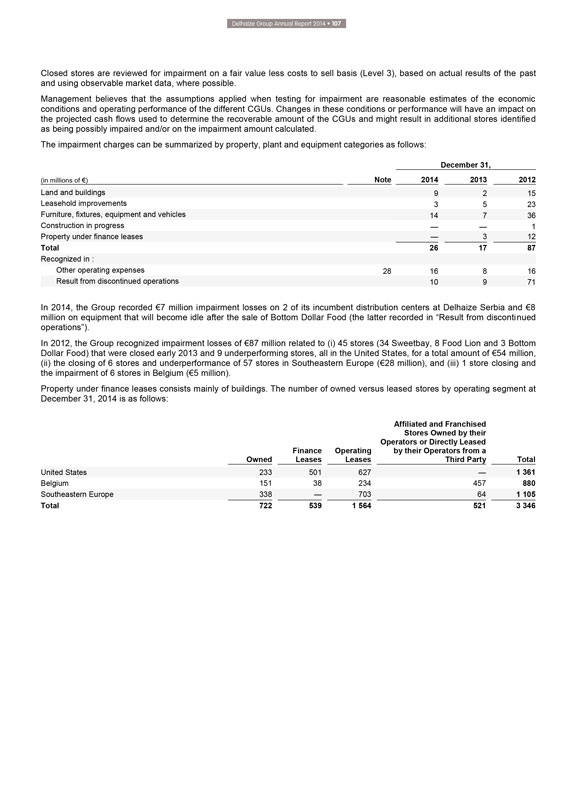
Delhaize Group Annual Report 2014 • 107
Closed stores are reviewed for impairment on a fair value less costs to sell basis (Level 3), based on actual results of the past and using observable market data,
where possible.
Management believes that the assumptions applied when testing for impairment are reasonable estimates of the economic conditions and operating
performance of the different CGUs. Changes in these conditions or performance will have an impact on the projected cash flows used to determine the recoverable amount of the CGUs and might result in additional stores identified as being possibly
impaired and/or on the impairment amount calculated.
The impairment charges can be summarized by property, plant and equipment categories as follows:
December 31,
(in millions of €) Note 2014 2013 2012
Land and buildings 9 2 15
Leasehold improvements 3 5 23
Furniture, fixtures, equipment and vehicles 14 7 36
Construction in progress — — 1
Property under finance leases — 3 12
Total 26 17 87
Recognized in :
Other operating expenses 28 16 8 16
Result from discontinued operations 10 9 71
In 2014, the Group recorded €7 million
impairment losses on 2 of its incumbent distribution centers at Delhaize Serbia and €8 million on equipment that will become idle after the sale of Bottom Dollar Food (the latter recorded in “Result from discontinued
operations”).
In 2012, the Group recognized impairment losses of €87 million related to (i) 45 stores (34 Sweetbay, 8 Food Lion and 3 Bottom
Dollar Food) that were closed early 2013 and 9 underperforming stores, all in the United States, for a total amount of €54 million, (ii) the closing of 6 stores and underperformance of 57 stores in Southeastern Europe (€28
million), and (iii) 1 store closing and the impairment of 6 stores in Belgium (€5 million).
Property under finance leases consists mainly of buildings.
The number of owned versus leased stores by operating segment at December 31, 2014 is as follows:
Owned Finance Leases Operating Leases Affiliated and
Franchised Stores Owned by their Operators or Directly Leased by their Operators from a Third Party Total
United States 233 501 627 — 1 361
Belgium 151 38 234 457 880
Southeastern Europe 338 — 703 64 1 105
Total 722 539 1 564 521 3 346
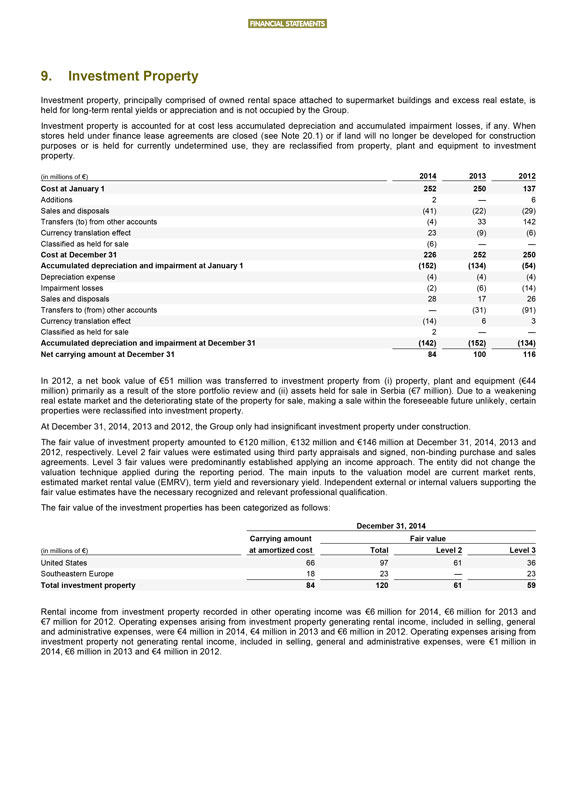
FINANCIAL STATEMENTS
9. Investment Property
Investment property, principally comprised of owned rental space attached to supermarket buildings and excess real estate, is held for long-term rental yields or
appreciation and is not occupied by the Group.
Investment property is accounted for at cost less accumulated depreciation and accumulated impairment losses, if
any. When stores held under finance lease agreements are closed (see Note 20.1) or if land will no longer be developed for construction purposes or is held for currently undetermined use, they are reclassified from property, plant and equipment to
investment property.
(in millions of €) 2014 2013 2012
Cost at
January 1 252 250 137
Additions 2 — 6
Sales and disposals (41) (22)
(29)
Transfers (to) from other accounts (4) 33 142
Currency translation
effect 23 (9) (6)
Classified as held for sale (6) — —
Cost at
December 31 226 252 250
Accumulated depreciation and impairment at January 1 (152) (134) (54)
Depreciation expense (4) (4) (4)
Impairment losses (2) (6) (14)
Sales and disposals 28 17 26
Transfers to (from) other accounts — (31) (91)
Currency translation effect (14) 6 3
Classified as held for sale 2 — —
Accumulated depreciation and impairment at December 31 (142) (152) (134)
Net carrying
amount at December 31 84 100 116
In 2012, a net book value of €51 million was transferred to investment property from (i) property, plant and
equipment (€44 million) primarily as a result of the store portfolio review and (ii) assets held for sale in Serbia (€7 million). Due to a weakening real estate market and the deteriorating state of the property for sale, making a
sale within the foreseeable future unlikely, certain properties were reclassified into investment property.
At December 31, 2014, 2013 and 2012, the Group
only had insignificant investment property under construction.
The fair value of investment property amounted to €120 million, €132 million and
€146 million at December 31, 2014, 2013 and 2012, respectively. Level 2 fair values were estimated using third party appraisals and signed, non-binding purchase and sales agreements. Level 3 fair values were predominantly established
applying an income approach. The entity did not change the valuation technique applied during the reporting period. The main inputs to the valuation model are current market rents, estimated market rental value (EMRV), term yield and reversionary
yield. Independent external or internal valuers supporting the fair value estimates have the necessary recognized and relevant professional qualification.
The fair
value of the investment properties has been categorized as follows:
December 31, 2014
(in millions of €) Carrying amount at amortized cost Fair value Total Level 2 Level 3
United States 66 97 61 36
Southeastern Europe 18 23 — 23
Total investment property 84 120 61 59
Rental income from investment property recorded in
other operating income was €6 million for 2014, €6 million for 2013 and €7 million for 2012. Operating expenses arising from investment property generating rental income, included in selling, general and administrative
expenses, were €4 million in 2014, €4 million in 2013 and €6 million in 2012. Operating expenses arising from investment property not generating rental income, included in selling, general and administrative expenses,
were €1 million in 2014, €6 million in 2013 and €4 million in 2012.
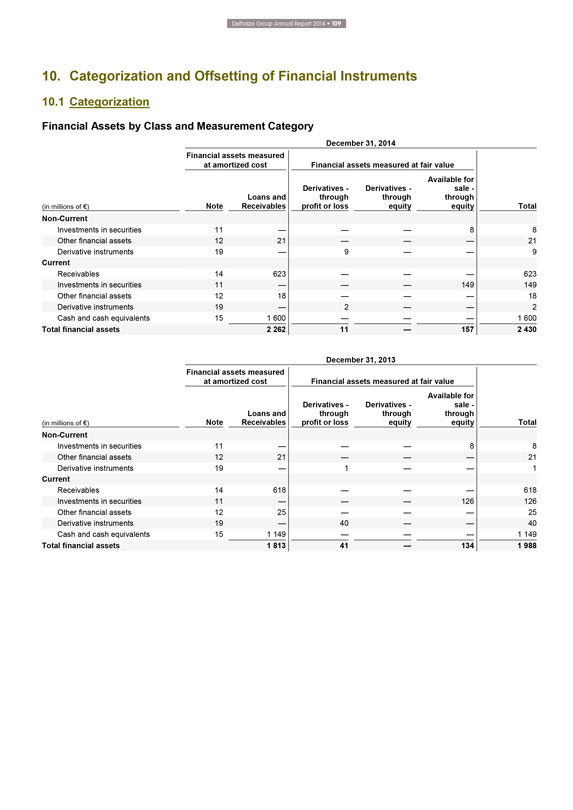
Delhaize Group Annual Report 2014 • 109
10.
Categorization and Offsetting of Financial Instruments
10.1 Categorization
Financial Assets by Class and Measurement Category
December 31, 2014
Financial assets measured at amortized cost Financial assets measured at fair value
(in millions of €) Note Loans and Receivables Derivatives - through profit or loss Derivatives - through equity Available for sale - through equity Total
Non-Current
Investments in securities 11 — — — 8 8
Other financial assets 12 21 — — — 21
Derivative instruments 19 — 9 —
— 9
Current
Receivables 14 623 — — — 623
Investments in securities 11 — — — 149 149
Other financial assets 12 18 —
— — 18
Derivative instruments 19 — 2 — — 2
Cash and
cash equivalents 15 1 600 — — — 1 600
Total financial assets 2 262 11 — 157 2 430
December 31, 2013
Financial assets measured at amortized cost Financial assets measured
at fair value
(in millions of €) Note Loans and Receivables Derivatives - through profit or loss Derivatives - through equity Available for sale - through
equity Total
Non-Current
Investments in securities 11 — — — 8
8
Other financial assets 12 21 — — — 21
Derivative instruments
19 — 1 — — 1
Current
Receivables 14 618 — — —
618
Investments in securities 11 — — — 126 126
Other financial
assets 12 25 — — — 25
Derivative instruments 19 — 40 — — 40
Cash and cash equivalents 15 1 149 — — — 1 149
Total financial assets 1 813 41
— 134 1 988
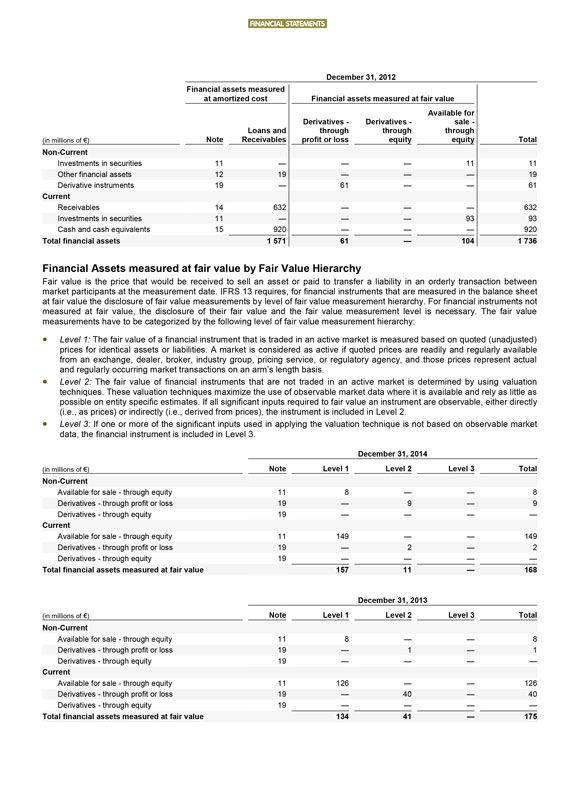
FINANCIAL STATEMENTS
December 31, 2012
Financial assets measured at amortized cost Financial assets measured at fair value
(in millions of €) Note Loans and Receivables Derivatives - through profit or loss Derivatives - through equity Available for sale - through equity Total
Non-Current
Investments in securities 11 — — — 11 11
Other financial assets 12 19 — — — 19
Derivative instruments 19 — 61
— — 61
Current
Receivables 14 632 — — — 632
Investments in securities 11 — — — 93 93
Cash and cash
equivalents 15 920 — — — 920
Total financial assets 1 571 61 — 104 1 736
Financial Assets measured at fair value by Fair Value Hierarchy
Fair value is the price that
would be received to sell an asset or paid to transfer a liability in an orderly transaction between market participants at the measurement date. IFRS 13 requires, for financial instruments that are measured in the balance sheet at fair value the
disclosure of fair value measurements by level of fair value measurement hierarchy. For financial instruments not measured at fair value, the disclosure of their fair value and the fair value measurement level is necessary. The fair value
measurements have to be categorized by the following level of fair value measurement hierarchy:
Level 1: The fair value of a financial instrument that is traded in
an active market is measured based on quoted (unadjusted) prices for identical assets or liabilities. A market is considered as active if quoted prices are readily and regularly available from an exchange, dealer, broker, industry group, pricing
service, or regulatory agency, and those prices represent actual and regularly occurring market transactions on an arm’s length basis.
Level 2: The fair value
of financial instruments that are not traded in an active market is determined by using valuation techniques. These valuation techniques maximize the use of observable market data where it is available and rely as little as possible on entity
specific estimates. If all significant inputs required to fair value an instrument are observable, either directly (i.e., as prices) or indirectly (i.e., derived from prices), the instrument is included in Level 2.
Level 3: If one or more of the significant inputs used in applying the valuation technique is not based on observable market data, the financial instrument is included in Level 3.
December 31, 2014
(in millions of €) Note Level 1 Level 2 Level 3
Total
Non-Current
Available for sale - through equity 11 8 — — 8
Derivatives - through profit or loss 19 — 9 — 9
Derivatives -
through equity 19 — — — —
Current
Available for sale -
through equity 11 149 — — 149
Derivatives - through profit or loss 19 — 2 — 2
Derivatives - through equity 19 — — — —
Total financial assets measured at
fair value 157 11 — 168
December 31, 2013
(in millions of €)
Note Level 1 Level 2 Level 3 Total
Non-Current
Available for sale - through
equity 11 8 — — 8
Derivatives - through profit or loss 19 — 1 — 1
Derivatives - through equity 19 — — — —
Current
Available for sale - through equity 11 126 — — 126
Derivatives - through profit or
loss 19 — 40 — 40
Derivatives - through equity 19 — — — —
Total financial assets measured at fair value 134 41 — 175
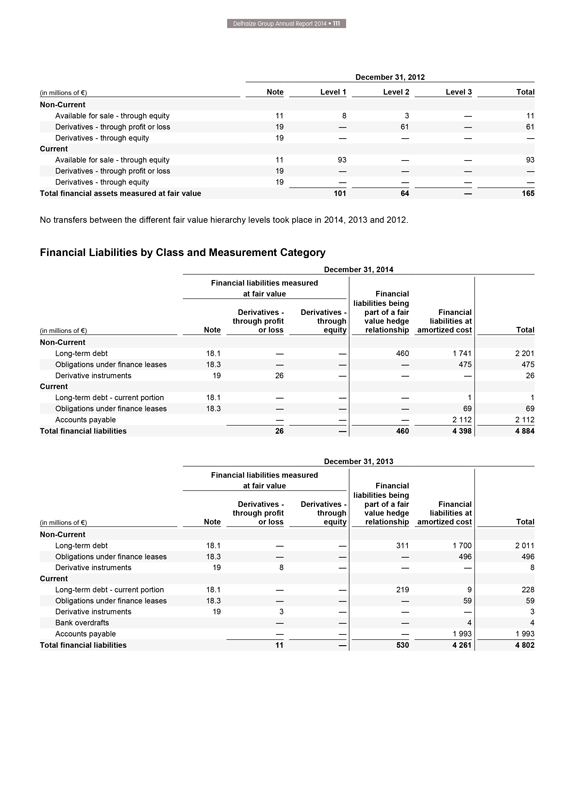
Delhaize Group Annual Report 2014 • 111
December 31, 2012
(in millions of €) Note Level 1 Level 2 Level 3
Total
Non-Current
Available for sale - through equity 11 8 3 — 11
Derivatives - through profit or loss 19 — 61 — 61
Derivatives -
through equity 19 — — — —
Current
Available for sale -
through equity 11 93 — — 93
Derivatives - through profit or loss 19 — — — —
Derivatives - through equity 19 — — — —
Total financial assets measured at
fair value 101 64 — 165
No transfers between the different fair value hierarchy levels took place in 2014, 2013 and 2012.
Financial Liabilities by Class and Measurement Category
December 31, 2014
(in millions of €) Financial liabilities measured at fair value Note Derivatives - through profit or loss Derivatives - through equity Financial liabilities being part of a
fair value hedge relationship Financial liabilities at amortized cost Total
Non-Current
Long-term debt 18.1 — — 460 1 741 2 201
Obligations under finance leases 18.3 —
— — 475 475
Derivative instruments 19 26 — — — 26
Current
Long-term debt - current portion 18.1 — — — 1 1
Obligations under finance leases 18.3 — — — 69 69
Accounts
payable — — — 2 112 2 112
Total financial liabilities 26 — 460 4 398 4 884
December 31, 2013
(in millions of €) Financial liabilities measured at fair value
Note Derivatives - through profit or loss Derivatives - through equity Financial liabilities being part of a fair value hedge relationship Financial liabilities at amortized cost Total
Non-Current
Long-term debt 18.1 — — 311 1 700 2 011
Obligations under finance leases 18.3 — — — 496 496
Derivative instruments 19 8
— — — 8
Current
Long-term debt - current portion 18.1 —
— 219 9 228
Obligations under finance leases 18.3 — — — 59 59
Derivative instruments 19 3 — — — 3
Bank overdrafts — — — 4 4
Accounts payable — — — 1 993 1 993
Total financial liabilities
11 — 530 4 261 4 802
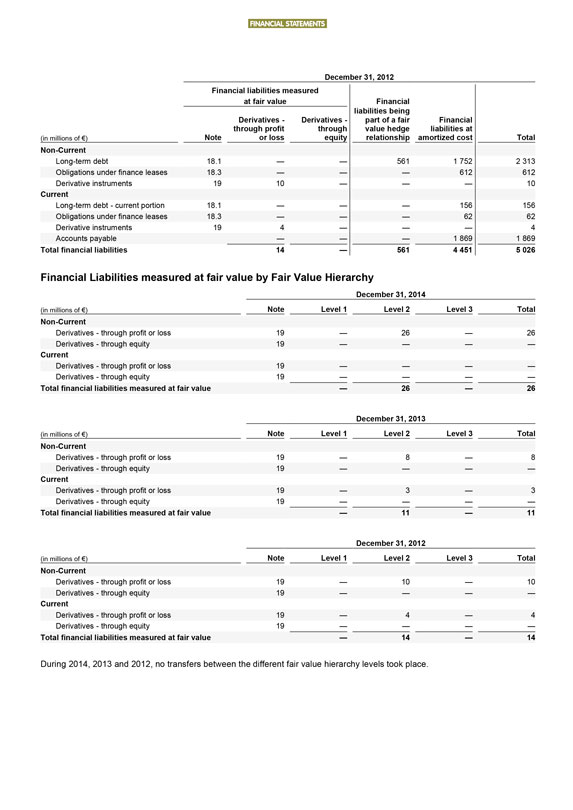
FINANCIAL STATEMENTS
December 31, 2012
Financial liabilities measured at fair value
(in millions of €) Note
Derivatives - through profit or loss Derivatives - through equity Financial liabilities being part of a fair value hedge relationship Financial liabilities at amortized cost Total
Non-Current
Long-term debt 18.1 — — 561 1 752 2 313
Obligations under finance leases 18.3 — — — 612 612
Derivative instruments 19
10 — — — 10
Current
Long-term debt - current portion 18.1
— — — 156 156
Obligations under finance leases 18.3 — — — 62 62
Derivative instruments 19 4 — — — 4
Accounts payable — — — 1 869
1 869
Total financial liabilities 14 — 561 4 451 5 026
Financial
Liabilities measured at fair value by Fair Value Hierarchy
December 31, 2014
(in millions of €) Note Level 1 Level 2 Level 3 Total
Non-Current
Derivatives - through profit or loss 19 — 26 — 26
Derivatives - through equity 19
— — — —
Current
Derivatives - through profit or loss 19
— — — —
Derivatives - through equity 19 — — — —
Total financial liabilities measured at fair value — 26 — 26
December 31, 2013
(in millions of €) Note Level 1 Level 2 Level 3 Total
Non-Current
Derivatives - through profit or loss 19 — 8 — 8
Derivatives -
through equity 19 — — — —
Current
Derivatives - through
profit or loss 19 — 3 — 3
Derivatives - through equity 19 — — — —
Total financial liabilities measured at fair value — 11 — 11
December 31, 2012
(in millions of €) Note Level 1 Level 2 Level 3 Total
Non-Current
Derivatives - through profit or loss 19 — 10 — 10
Derivatives -
through equity 19 — — — —
Current
Derivatives - through
profit or loss 19 — 4 — 4
Derivatives - through equity 19 — — — —
Total financial liabilities measured at fair value — 14 — 14
During 2014, 2013 and
2012, no transfers between the different fair value hierarchy levels took place.
Delhaize Group Annual Report 2014 • 113
Valuation techniques
The available for sale – through equity instruments
are mainly categorized as Level 1, when the fair value of these instruments is determined based on their quoted prices in active markets. When the market is not active, the fair value of these instruments is determined based on market approach
valuation techniques and the Group uses prices and other relevant information generated by market transactions involving identical or comparable assets.
The
derivative financial instruments contracted by the Group are used for hedging purposes to manage its exposure to various financial risks (see Note 19) and they are over-the-counter derivatives (interest rate, currency swaps and foreign exchange
forwards) that are not traded in active markets. The fair value of these instruments is determined with present value calculations, using as inputs, besides others, foreign exchange spot rates, interest rate curves or implicit forward rate curves of
the underlying. The contractual arrangements of these instruments also include cash collateral (pledged or received) that are payable / receivable if the value of a derivate exceeds a threshold defined in the contractual provisions. Such cash
collaterals materially reduce the impact of both the counterparty and the Group’s own non-performance risk on the value of the instrument.
10.2 Offsetting of
Financial Instruments
The Group has several financial assets and financial liabilities that are subject to offsetting or enforceable master netting arrangements
and similar agreements.
Cash Pool
The Group has implemented a cash pool
system, allowing a more efficient management of the daily working capital needs of the participating operating entities. The settlement mechanism of the cash pool is provided by an external financial counterparty. The cash pool system provides that
the Group is exposed to a single net amount with that financial counterparty rather than the gross amount of several current accounts and bank overdraft balances with multiple financial counterparties. Settlement on a net basis is intended by both
parties and an actual netting is performed recurrently. The right to offset is enforceable in all circumstances, meeting the offsetting criteria and as a result only a net position is presented in the balance sheet.
Offsetting of trade receivables and accounts payables
When local legislations allow and the
economic environment requires it, commercial contracts with non-financial counterparties include clauses and terms that provide the legal enforceable right to offset in all circumstances outstanding balances between the parties. The parties intend
to settle on a net basis and actual netting is performed recurrently. In Greece, the Group aims to have such terms with most of its suppliers, in order to reduce the liquidity risk. In 2014, the Group started to revise its general agreement with its
Serbian suppliers, implementing offsetting conditions in the agreements between the parties. As in both countries the offsetting criteria are met, balances with these suppliers have been presented as such in the consolidated financial statements.
ISDA Master Agreements for Derivatives
The Group has several ISDA
(“International Swaps and Derivatives Association”) agreements in connection with its derivative transactions. In general, under such agreements the amounts owed by each counterparty on a single day in respect of all outstanding
transactions in the same currency are aggregated into a single net amount that is payable by one party to the other. Under certain circumstances, e.g., when a credit event such as default occurs, all outstanding transactions under the agreement are
terminated, the termination value is assessed and only a single net amount is payable in settlement of all transactions.
The ISDA agreements do not meet the
criteria for offsetting in the balance sheet. This is because the Group does not have a currently legally enforceable right to offset recognized amounts, because the right to offset is enforceable only on the occurrence of future event such as a
default. ISDAs are considered as master netting arrangements for IFRS 7 disclosure purposes.
The following table shows the maximum exposure of the Group’s
financial assets and financial liabilities that are subject to offset or enforceable master netting arrangements and similar agreements.
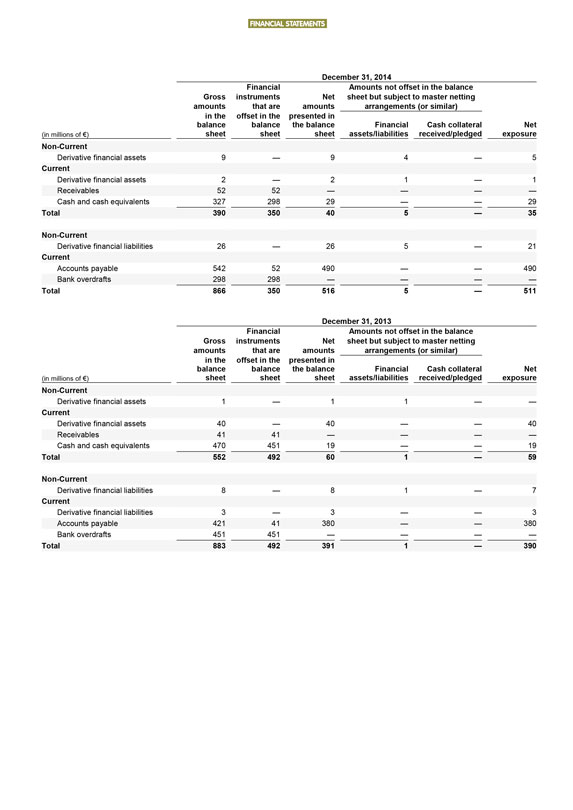
FINANCIAL STATEMENTS
December 31, 2014
(in millions of €)
Gross amounts in the balance sheet
Financial instruments that are offset in the balance sheet
Net amounts presented in the
balance sheet
Amounts not offset in the balance sheet but subject to master netting arrangements (or similar)
Financial assets/liabilities
Cash collateral received/pledged
Net exposure
Non-Current
Derivative financial assets 9 — 9 4 — 5
Current
Derivative financial assets 2 — 2 1 — 1
Receivables 52 52 — — —
—
Cash and cash equivalents 327 298 29 — — 29
Total 390 350 40
5 — 35
Non-Current
Derivative financial liabilities 26 — 26 5
— 21
Current
Accounts payable 542 52 490 — — 490
Bank overdrafts 298 298 — — — —
Total 866 350 516 5 — 511
December 31, 2013
(in millions of €)
Gross amounts in the balance sheet
Financial instruments that are offset in the balance sheet
Net amounts presented in the balance sheet
Amounts not offset in the balance
sheet but subject to master netting arrangements (or similar)
Financial assets/liabilities
Cash collateral received/pledged
Net exposure
Non-Current
Derivative financial assets 1 — 1 1 — —
Current
Derivative financial assets 40 — 40 — — 40
Receivables 41 41 — — — —
Cash and cash equivalents 470 451 19 —
— 19
Total 552 492 60 1 — 59
Non-Current
Derivative financial liabilities 8 — 8 1 — 7
Current
Derivative financial liabilities 3 — 3 — — 3
Accounts payable 421 41 380 —
— 380
Bank overdrafts 451 451 — — — —
Total 883 492
391 1 — 390
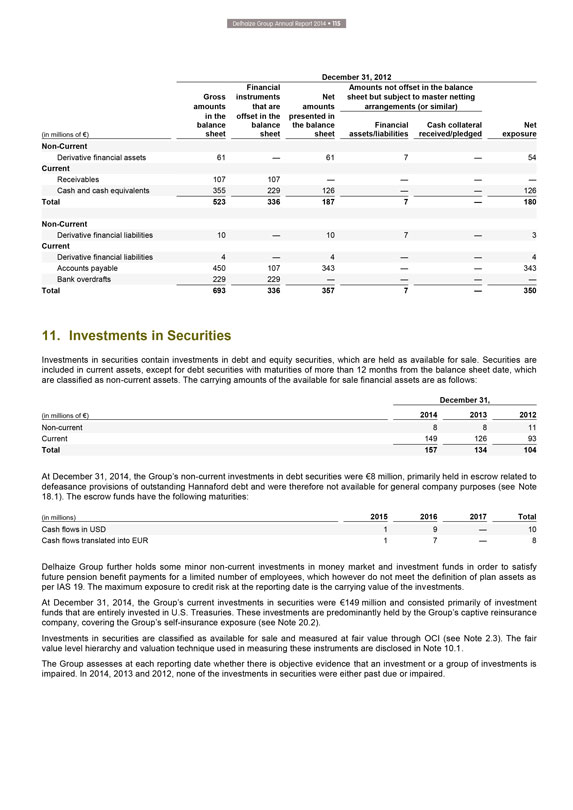
Delhaize Group Annual Report 2014 • 115
December 31, 2012
(in millions of €)
Gross amounts in the balance sheet
Financial instruments that are offset in the balance sheet
Net amounts presented in the balance sheet
Amounts not offset in the balance
sheet but subject to master netting arrangements (or similar)
Financial assets/liabilities
Cash collateral received/pledged
Net exposure
Non-Current
Derivative financial assets 61 — 61 7 — 54
Current
Receivables 107 107 — — — —
Cash and cash equivalents 355 229 126 — — 126
Total 523 336 187 7 — 180
Non-Current
Derivative financial liabilities 10 — 10 7 — 3
Current
Derivative financial liabilities 4 — 4 — — 4
Accounts payable 450 107 343 — — 343
Bank overdrafts 229 229 —
— — —
Total 693 336 357 7 — 350
11. Investments in
Securities
Investments in securities contain investments in debt and equity securities, which are held as available for sale. Securities are included in current
assets, except for debt securities with maturities of more than 12 months from the balance sheet date, which are classified as non-current assets. The carrying amounts of the available for sale financial assets are as follows:
December 31,
(in millions of €)
2014 2013 2012
Non-current 8 8 11
Current 149 126 93
Total 157 134 104
At December 31, 2014, the Group’s non-current investments in debt securities were €8 million, primarily held in escrow related to defeasance provisions of
outstanding Hannaford debt and were therefore not available for general company purposes (see Note
18.1). The escrow funds have the following maturities:
(in millions)
2015
2016
2017
Total Cash flows in USD 1 9 — 10
Cash flows translated into EUR 1 7
— 8
Delhaize Group further holds some minor non-current investments in money market and investment funds in order to satisfy future pension benefit payments
for a limited number of employees, which however do not meet the definition of plan assets as per IAS 19. The maximum exposure to credit risk at the reporting date is the carrying value of the investments.
At December 31, 2014, the Group’s current investments in securities were €149 million and consisted primarily of investment funds that are entirely invested in U.S.
Treasuries. These investments are predominantly held by the Group’s captive reinsurance company, covering the Group’s self-insurance exposure (see Note 20.2).
Investments in securities are classified as available for sale and measured at fair value through OCI (see Note 2.3). The fair value level hierarchy and valuation technique used in
measuring these instruments are disclosed in Note 10.1.
The Group assesses at each reporting date whether there is objective evidence that an investment or a group
of investments is impaired. In 2014, 2013 and 2012, none of the investments in securities were either past due or impaired.
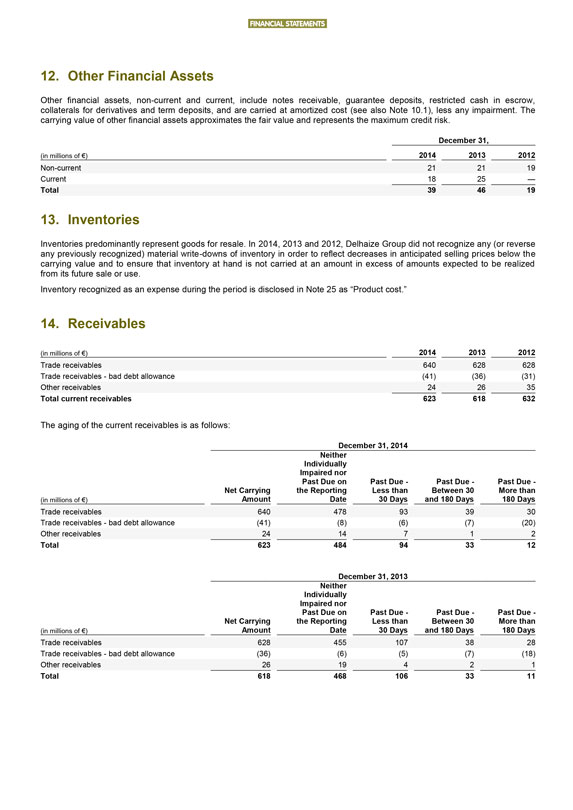
FINANCIAL STATEMENTS
12. Other Financial Assets
Other financial assets, non-current and current, include notes receivable, guarantee deposits, restricted cash in escrow, collaterals for derivatives and term
deposits, and are carried at amortized cost (see also Note 10.1), less any impairment. The carrying value of other financial assets approximates the fair value and represents the maximum credit risk.
December 31,
(in millions of €)
2014 2013 2012
Non-current 21 21 19
Current 18 25 —
Total 39 46 19
13. Inventories
Inventories predominantly represent goods for resale. In 2014, 2013 and 2012,
Delhaize Group did not recognize any (or reverse any previously recognized) material write-downs of inventory in order to reflect decreases in anticipated selling prices below the carrying value and to ensure that inventory at hand is not carried at
an amount in excess of amounts expected to be realized from its future sale or use.
Inventory recognized as an expense during the period is disclosed in Note 25 as
“Product cost.”
14. Receivables
(in millions of €)
2014 2013 2012
Trade receivables 640 628 628
Trade receivables - bad debt allowance (41) (36) (31)
Other receivables 24 26 35
Total current receivables 623 618 632
The aging of the current receivables is as follows:
December 31, 2014
(in millions of €)
Net Carrying Amount
Neither Individually Impaired nor Past Due on the Reporting Date
Past Due - Less than 30 Days
Past Due - Between 30 and 180 Days
Past Due - More than 180 Days
Trade receivables 640 478 93 39 30
Trade receivables - bad debt allowance (41) (8) (6) (7) (20)
Other receivables 24 14 7 1 2
Total 623 484 94 33 12
December 31, 2013
(in millions of €)
Net Carrying Amount
Neither Individually Impaired nor Past Due on the Reporting Date
Past Due - Less than 30 Days
Past Due - Between 30 and 180 Days
Past Due - More than 180 Days
Trade receivables 628 455 107 38 28
Trade receivables - bad debt allowance (36) (6) (5) (7)
(18)
Other receivables 26 19 4 2 1
Total 618 468 106 33 11
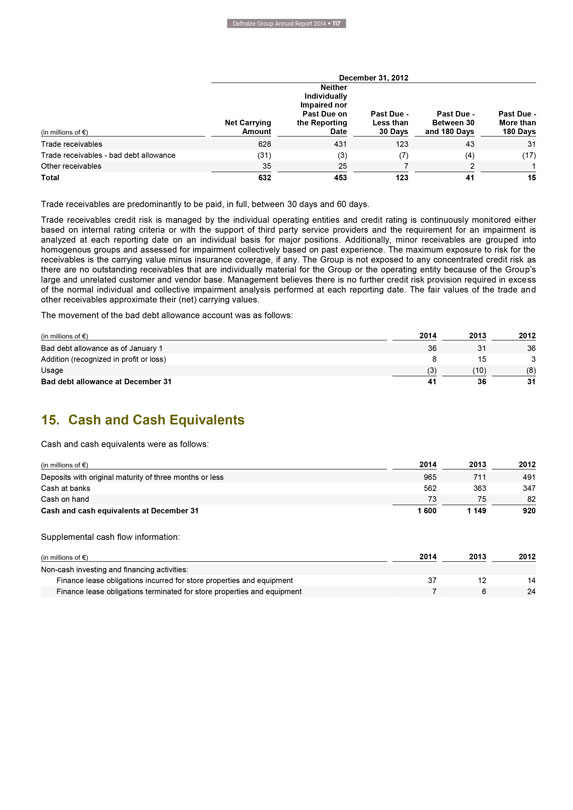
Delhaize Group Annual Report 2014 • 117
December 31, 2012
(in millions of €)
Net Carrying Amount
Neither Individually Impaired nor Past Due on the Reporting Date
Past Due - Less than 30 Days
Past Due - Between 30 and 180 Days
Past Due - More than 180 Days
Trade receivables 628 431 123 43 31
Trade receivables - bad debt allowance (31) (3) (7) (4) (17)
Other receivables 35 25 7 2 1
Total 632 453 123 41 15
Trade receivables are predominantly to be paid, in
full, between 30 days and 60 days.
Trade receivables credit risk is managed by the individual operating entities and credit rating is continuously monitored either
based on internal rating criteria or with the support of third party service providers and the requirement for an impairment is analyzed at each reporting date on an individual basis for major positions. Additionally, minor receivables are grouped
into homogenous groups and assessed for impairment collectively based on past experience. The maximum exposure to risk for the receivables is the carrying value minus insurance coverage, if any. The Group is not exposed to any concentrated credit
risk as there are no outstanding receivables that are individually material for the Group or the operating entity because of the Group’s large and unrelated customer and vendor base. Management believes there is no further credit risk provision
required in excess of the normal individual and collective impairment analysis performed at each reporting date. The fair values of the trade and other receivables approximate their (net) carrying values.
The movement of the bad debt allowance account was as follows:
(in millions of €)
2014 2013 2012
Bad debt allowance as of January 1 36 31 36
Addition (recognized in profit or loss) 8 15 3
Usage (3) (10) (8)
Bad debt allowance at December 31 41 36 31
15. Cash and Cash Equivalents
Cash and cash equivalents were as follows:
(in millions of €)
2014 2013 2012
Deposits with original maturity of three months or less 965 711 491
Cash at banks 562 363 347
Cash on hand 73 75 82
Cash and cash equivalents at December 31 1 600 1 149 920
Supplemental cash flow information:
(in millions of €)
2014 2013 2012
Non-cash investing and financing activities:
Finance lease obligations incurred for store
properties and equipment 37 12 14
Finance lease obligations terminated for store properties and equipment 7 6 24
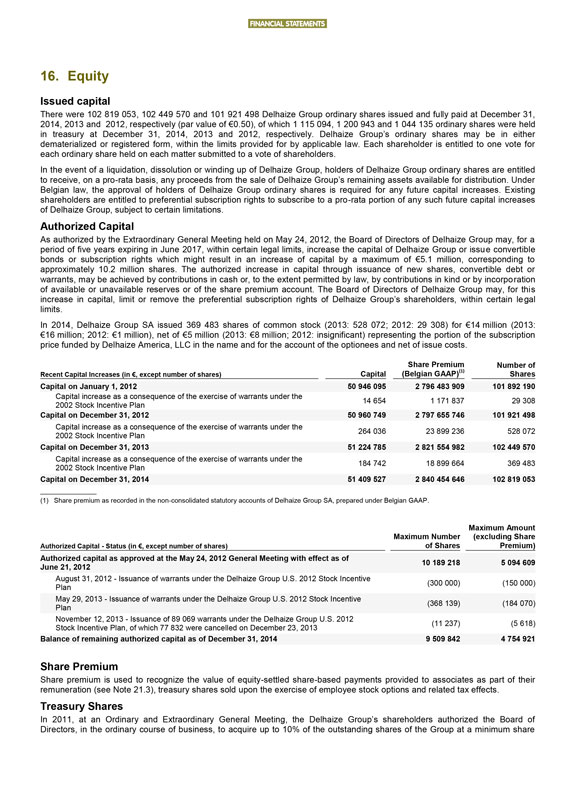
FINANCIAL STATEMENTS
16. Equity
Issued capital
There were 102 819 053, 102 449 570 and 101 921 498 Delhaize Group ordinary
shares issued and fully paid at December 31, 2014, 2013 and 2012, respectively (par value of €0.50), of which 1 115 094, 1 200 943 and 1 044 135 ordinary shares were held in treasury at December 31, 2014, 2013 and 2012, respectively. Delhaize
Group’s ordinary shares may be in either dematerialized or registered form, within the limits provided for by applicable law. Each shareholder is entitled to one vote for each ordinary share held on each matter submitted to a vote of
shareholders.
In the event of a liquidation, dissolution or winding up of Delhaize Group, holders of Delhaize Group ordinary shares are entitled to receive, on a
pro-rata basis, any proceeds from the sale of Delhaize Group’s remaining assets available for distribution. Under
Belgian law, the approval of holders of
Delhaize Group ordinary shares is required for any future capital increases. Existing shareholders are entitled to preferential subscription rights to subscribe to a pro-rata portion of any such future capital increases of Delhaize Group, subject to
certain limitations.
Authorized Capital
As authorized by the Extraordinary
General Meeting held on May 24, 2012, the Board of Directors of Delhaize Group may, for a period of five years expiring in June 2017, within certain legal limits, increase the capital of Delhaize Group or issue convertible bonds or subscription
rights which might result in an increase of capital by a maximum of €5.1 million, corresponding to approximately 10.2 million shares. The authorized increase in capital through issuance of new shares, convertible debt or warrants, may be
achieved by contributions in cash or, to the extent permitted by law, by contributions in kind or by incorporation of available or unavailable reserves or of the share premium account. The Board of Directors of Delhaize Group may, for this increase
in capital, limit or remove the preferential subscription rights of Delhaize Group’s shareholders, within certain legal limits.
In 2014, Delhaize Group SA
issued 369 483 shares of common stock (2013: 528 072; 2012: 29 308) for €14 million (2013: €16 million; 2012: €1 million), net of €5 million (2013: €8 million; 2012: insignificant) representing the portion of the
subscription price funded by Delhaize America, LLC in the name and for the account of the optionees and net of issue costs.
Recent Capital Increases (in €,
except number of shares)
Capital
Share Premium (Belgian GAAP)(1)
Number of Shares
Capital on January 1, 2012 50 946 095 2 796 483 909 101 892 190
Capital increase as a consequence of the exercise of warrants under the 2002 Stock Incentive Plan 14 654 1 171 837 29 308
Capital on December 31, 2012 50 960 749 2 797 655 746 101 921 498
Capital increase as a
consequence of the exercise of warrants under the 2002 Stock Incentive Plan 264 036 23 899 236 528 072
Capital on December 31, 2013 51 224 785 2 821 554 982 102
449 570
Capital increase as a consequence of the exercise of warrants under the 2002 Stock Incentive Plan 184 742 18 899 664 369 483
Capital on December 31, 2014 51 409 527 2 840 454 646 102 819 053
(1) Share premium as
recorded in the non-consolidated statutory accounts of Delhaize Group SA, prepared under Belgian GAAP.
Authorized Capital - Status (in €, except number of
shares)
Maximum Number of Shares
Maximum Amount (excluding Share Premium)
Authorized capital as approved at the May 24, 2012 General Meeting with effect as of June 21, 2012 10 189 218 5 094 609
August 31, 2012 - Issuance of warrants under the Delhaize Group U.S. 2012 Stock Incentive Plan (300 000) (150 000)
May 29, 2013 - Issuance of warrants under the Delhaize Group U.S. 2012 Stock Incentive Plan (368 139) (184 070)
November 12, 2013 - Issuance of 89 069 warrants under the Delhaize Group U.S. 2012 Stock Incentive Plan, of which 77 832 were cancelled on December 23, 2013 (11 237) (5 618)
Balance of remaining authorized capital as of December 31, 2014 9 509 842 4 754 921
Share Premium
Share premium is used to recognize the value of equity-settled share-based
payments provided to associates as part of their remuneration (see Note 21.3), treasury shares sold upon the exercise of employee stock options and related tax effects.
Treasury Shares
In 2011, at an Ordinary and Extraordinary General Meeting, the Delhaize
Group’s shareholders authorized the Board of Directors, in the ordinary course of business, to acquire up to 10% of the outstanding shares of the Group at a minimum share
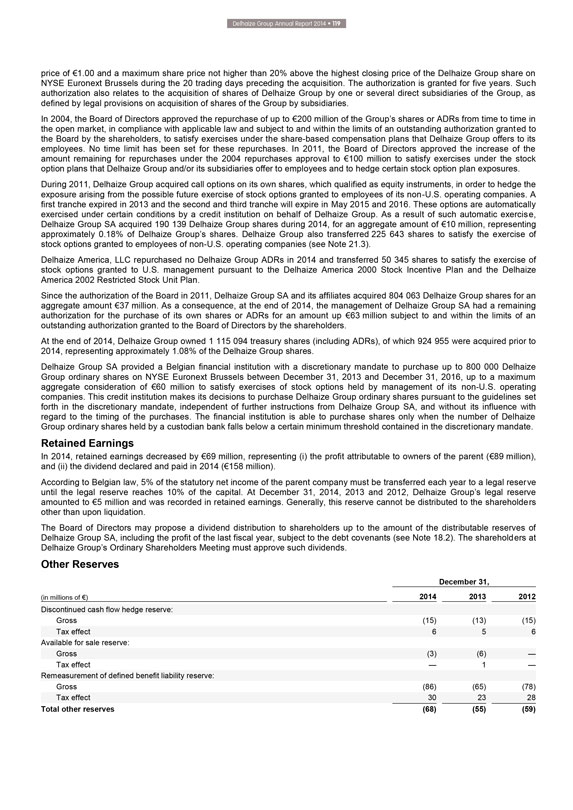
Delhaize Group Annual Report 2014 • 119
price
of €1.00 and a maximum share price not higher than 20% above the highest closing price of the Delhaize Group share on NYSE Euronext Brussels during the 20 trading days preceding the acquisition. The authorization is granted for five years. Such
authorization also relates to the acquisition of shares of Delhaize Group by one or several direct subsidiaries of the Group, as defined by legal provisions on acquisition of shares of the Group by subsidiaries.
In 2004, the Board of Directors approved the repurchase of up to €200 million of the Group’s shares or ADRs from time to time in the open market, in compliance with
applicable law and subject to and within the limits of an outstanding authorization granted to the Board by the shareholders, to satisfy exercises under the share-based compensation plans that Delhaize Group offers to its employees. No time limit
has been set for these repurchases. In 2011, the Board of Directors approved the increase of the amount remaining for repurchases under the 2004 repurchases approval to €100 million to satisfy exercises under the stock option plans that
Delhaize Group and/or its subsidiaries offer to employees and to hedge certain stock option plan exposures.
During 2011, Delhaize Group acquired call options on
its own shares, which qualified as equity instruments, in order to hedge the exposure arising from the possible future exercise of stock options granted to employees of its non-U.S. operating companies. A first tranche expired in 2013 and the second
and third tranche will expire in May 2015 and 2016. These options are automatically exercised under certain conditions by a credit institution on behalf of Delhaize Group. As a result of such automatic exercise, Delhaize Group SA acquired 190 139
Delhaize Group shares during 2014, for an aggregate amount of €10 million, representing approximately 0.18% of Delhaize Group’s shares. Delhaize Group also transferred 225 643 shares to satisfy the exercise of stock options granted to
employees of non-U.S. operating companies (see Note 21.3).
Delhaize America, LLC repurchased no Delhaize Group ADRs in 2014 and transferred 50 345 shares to
satisfy the exercise of stock options granted to U.S. management pursuant to the Delhaize America 2000 Stock Incentive Plan and the Delhaize America 2002 Restricted Stock Unit Plan.
Since the authorization of the Board in 2011, Delhaize Group SA and its affiliates acquired 804 063 Delhaize Group shares for an aggregate amount €37 million. As a
consequence, at the end of 2014, the management of Delhaize Group SA had a remaining authorization for the purchase of its own shares or ADRs for an amount up €63 million subject to and within the limits of an outstanding authorization granted
to the Board of Directors by the shareholders.
At the end of 2014, Delhaize Group owned 1 115 094 treasury shares (including ADRs), of which 924 955 were acquired
prior to 2014, representing approximately 1.08% of the Delhaize Group shares.
Delhaize Group SA provided a Belgian financial institution with a discretionary
mandate to purchase up to 800 000 Delhaize Group ordinary shares on NYSE Euronext Brussels between December 31, 2013 and December 31, 2016, up to a maximum aggregate consideration of €60 million to satisfy exercises of stock options held by
management of its non-U.S. operating companies. This credit institution makes its decisions to purchase Delhaize Group ordinary shares pursuant to the guidelines set forth in the discretionary mandate, independent of further instructions from
Delhaize Group SA, and without its influence with regard to the timing of the purchases. The financial institution is able to purchase shares only when the number of Delhaize Group ordinary shares held by a custodian bank falls below a certain
minimum threshold contained in the discretionary mandate.
Retained Earnings
In 2014, retained earnings decreased by €69 million, representing (i) the profit attributable to owners of the parent (€89 million), and (ii) the
dividend declared and paid in 2014 (€158 million).
According to Belgian law, 5% of the statutory net income of the parent company must be transferred each
year to a legal reserve until the legal reserve reaches 10% of the capital. At December 31, 2014, 2013 and 2012, Delhaize Group’s legal reserve amounted to €5 million and was recorded in retained earnings. Generally, this reserve cannot be
distributed to the shareholders other than upon liquidation.
The Board of Directors may propose a dividend distribution to shareholders up to the amount of the
distributable reserves of Delhaize Group SA, including the profit of the last fiscal year, subject to the debt covenants (see Note 18.2). The shareholders at
Delhaize Group’s Ordinary Shareholders Meeting must approve such dividends.
Other Reserves
December 31,
(in millions of €)
2014 2013 2012
Discontinued cash flow hedge reserve:
Gross (15) (13) (15)
Tax effect 6 5 6
Available for sale reserve:
Gross (3) (6) —
Tax effect — 1 —
Remeasurement of defined benefit liability reserve:
Gross (86) (65) (78)
Tax effect 30 23 28
Total other reserves (68) (55) (59)
FINANCIAL STATEMENTS
Discontinued cash flow hedge
reserve: This represents a deferred loss on the settlement of a hedge agreement in 2001 related to securing financing for the Hannaford acquisition by Delhaize America, and a deferred gain related to the 2007 debt refinancing (see Note 19). Both the
deferred loss and gain are amortized over the life of the underlying debt instruments.
Cash flow hedge reserve: This reserve contains the effective portion of the
cumulative net change in the fair value of cash flow hedge instruments related to hedged transactions that have not yet occurred (see Note 19). The cumulative gain or loss will be reclassified to profit or loss when the hedged transaction affects
profit or loss or is included as a basis adjustment to a non-financial hedged item. Currently, the Group has no cash flow hedge relationships in place.
Available
for sale reserve: The Group recognizes in this reserve unrealized fair value changes on financial assets classified as available for sale.
Remeasurement of defined
benefit liability reserve: Remeasurements comprise (i) actuarial gains and losses, (ii) the return on plan assets, excluding amounts included in net interest on the net defined benefit liability (asset) and (iii) any change in the effect of the
asset ceiling, excluding amounts included in net interest on the net defined benefit liability (asset). They are recognized immediately in OCI in the period in which they occur (see Note 21.1) and never reclassified into profit or loss.
The reserve includes an insignificant amount in relation to the Group’s equity accounted joint venture.
Cumulative Translation Adjustment
The cumulative translation adjustment relates to changes in
the balance of assets and liabilities due to changes in the functional currency of the Group’s subsidiaries relative to the Group’s reporting currency. The balance in cumulative translation adjustment is mainly impacted by the appreciation
or depreciation of the U.S. dollar and the Serbian dinar to the euro. Exchange differences previously accumulated are reclassified to profit or loss on the disposal of the foreign operation.
Non-controlling Interests
Non-controlling interests represent third party interests in the
equity of fully consolidated companies that are not wholly owned by Delhaize Group. These non-controlling interests are held by the Southeastern Europe segment and amounted to €6 million at the end of 2014 (2013: €5 million; 2012: €2
million).
Capital Management
Delhaize Group’s objectives for managing
capital are to safeguard the Group’s ability to continue as a going concern and to maximize shareholder value, while maintaining investment grade credit rating, keeping sufficient flexibility to execute strategic projects and reduce the cost of
capital.
In order to maintain or adjust the capital structure and optimize the cost of capital, the Group may, among other things, return capital to shareholders,
issue new shares and / or debt or refinance / exchange existing debt. Further, Delhaize Group’s new dividend policy, as adopted by the Board of Directors in March 2014, is to pay out approximately 35% of the group share in underlying net profit
from continued operations.
Consistent with the objectives noted, the Group monitors its capital structure, by using (i) the equity vs liability classifications as
applied in its consolidated financial statements, (ii) debt capacity, (iii) its net debt and (iv) “Net debt to equity” ratio (see Note
18.4).
17. Dividends
On May 22, 2014, the shareholders approved the payment of a gross dividend of
€1.56 per share (€1.17 per share after deduction of the 25% Belgian withholding tax) or a total gross dividend of €160 million (including the dividend on treasury shares). On May 24, 2013, the shareholders approved the payment of a
gross dividend of €1.40 per share (€1.05 per share after deduction of the 25% Belgian withholding tax) or a total gross dividend of €143 million.
With respect to the financial year 2014, the Board of Directors proposes a gross dividend of €1.60 per share to be paid to owners of ordinary shares against
coupon no. 53 on June 4, 2015. This dividend is subject to approval by shareholders at the Ordinary
Shareholders’ Meeting of May 28, 2015 and, therefore, has
not been included as a liability in Delhaize Group’s consolidated financial statements prepared under IFRS. The financial year 2014 dividend, based on the number of shares issued at March 4, 2015, is €165 million. The payment of this
dividend will not have income tax consequences for the Group.
As a result of the potential exercise of warrants issued under the Delhaize Group 2002 and 2012 Stock
Incentive Plans, the Group may have to issue new ordinary shares, to which payment in 2015 of the 2014 dividend is entitled, between the date of adoption of the annual accounts by the Board of Directors and the date of their approval by the Ordinary
Shareholders’ Meeting of May 28, 2015. The Board of Directors will communicate at this Ordinary Shareholders’ Meeting the aggregate number of shares entitled to the 2014 dividend and will submit at this meeting the aggregate final amount
of the dividend for approval. The annual statutory accounts of Delhaize Group SA for 2014 will be modified accordingly.
The maximum number of shares which could be
issued between March 4, 2015, and May 28, 2015, assuming that all vested warrants were to be exercised, is 1 935 730. This would result in an increase in the total amount to be distributed as dividends to a total of €3 million. Total
outstanding non-vested warrants at March 4, 2015 amounted to 198 746, representing a maximum additional dividend to be distributed of less than €1 million.
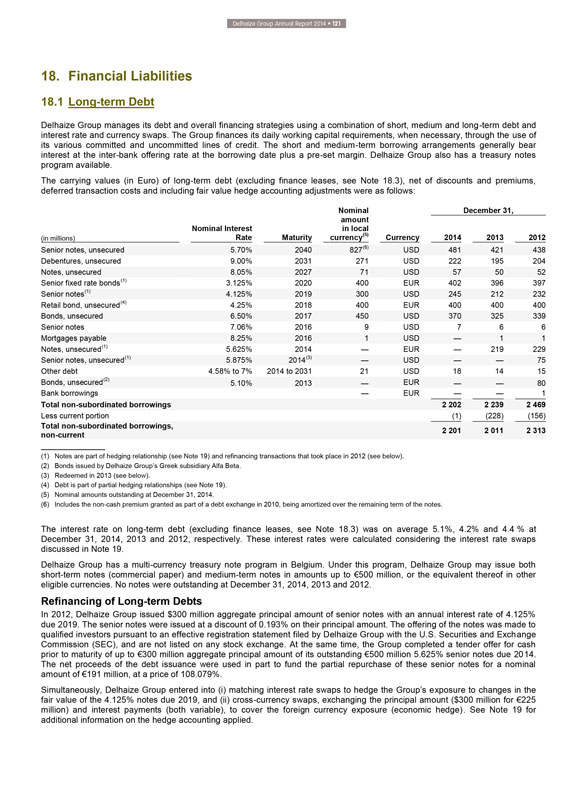
Delhaize Group Annual Report 2014 • 121
18.
Financial Liabilities
18.1 Long-term Debt
Delhaize Group manages its debt and
overall financing strategies using a combination of short, medium and long-term debt and interest rate and currency swaps. The Group finances its daily working capital requirements, when necessary, through the use of its various committed and
uncommitted lines of credit. The short and medium-term borrowing arrangements generally bear interest at the inter-bank offering rate at the borrowing date plus a pre-set margin. Delhaize Group also has a treasury notes program available.
The carrying values (in Euro) of long-term debt (excluding finance leases, see Note 18.3), net of discounts and premiums, deferred transaction costs and including
fair value hedge accounting adjustments were as follows:
(in millions)
Nominal Interest Rate
Maturity
Nominal amount in local currency(5)
December 31,
Currency
2014 2013 2012
Senior notes, unsecured 5.70% 2040 827(6) USD 481 421 438
Debentures, unsecured 9.00% 2031 271
USD 222 195 204
Notes, unsecured 8.05% 2027 71 USD 57 50 52
Senior fixed rate
bonds(1) 3.125% 2020 400 EUR 402 396 397
Senior notes(1) 4.125% 2019 300 USD 245 212 232
Retail bond, unsecured(4) 4.25% 2018 400 EUR 400 400 400
Bonds, unsecured 6.50% 2017 450 USD
370 325 339
Senior notes 7.06% 2016 9 USD 7 6 6
Mortgages payable 8.25% 2016
1 USD — 1 1
Notes, unsecured(1) 5.625% 2014 — EUR — 219 229
Senior notes, unsecured(1) 5.875% 2014(3) — USD — — 75
Other
debt 4.58% to 7% 2014 to 2031 21 USD 18 14 15
Bonds, unsecured(2) 5.10% 2013 — EUR — — 80
Bank borrowings — EUR — — 1
Total non-subordinated borrowings 2 202 2 239 2 469
Less current portion (1) (228) (156)
Total non-subordinated borrowings,
non-current 2 201 2 011 2 313
(1) Notes are part of hedging relationship (see Note 19) and refinancing transactions that took place in 2012 (see below).
(2) Bonds issued by Delhaize Group’s Greek subsidiary Alfa Beta.
(3)
Redeemed in 2013 (see below).
(4) Debt is part of partial hedging relationships (see Note 19).
(5) Nominal amounts outstanding at December 31, 2014.
(6) Includes the non-cash premium
granted as part of a debt exchange in 2010, being amortized over the remaining term of the notes.
The interest rate on long-term debt (excluding finance leases,
see Note 18.3) was on average 5.1%, 4.2% and 4.4 % at December 31, 2014, 2013 and 2012, respectively. These interest rates were calculated considering the interest rate swaps discussed in Note 19.
Delhaize Group has a multi-currency treasury note program in Belgium. Under this program, Delhaize Group may issue both short-term notes (commercial paper) and medium-term notes in
amounts up to €500 million, or the equivalent thereof in other eligible currencies. No notes were outstanding at December 31, 2014, 2013 and 2012.
Refinancing
of Long-term Debts
In 2012, Delhaize Group issued $300 million aggregate principal amount of senior notes with an annual interest rate of 4.125% due 2019. The
senior notes were issued at a discount of 0.193% on their principal amount. The offering of the notes was made to qualified investors pursuant to an effective registration statement filed by Delhaize Group with the U.S. Securities and Exchange
Commission (SEC), and are not listed on any stock exchange. At the same time, the Group completed a tender offer for cash prior to maturity of up to €300 million aggregate principal amount of its outstanding €500 million 5.625% senior
notes due 2014. The net proceeds of the debt issuance were used in part to fund the partial repurchase of these senior notes for a nominal amount of €191 million, at a price of 108.079%.
Simultaneously, Delhaize Group entered into (i) matching interest rate swaps to hedge the Group’s exposure to changes in the fair value of the 4.125% notes due 2019, and (ii)
cross-currency swaps, exchanging the principal amount ($300 million for €225 million) and interest payments (both variable), to cover the foreign currency exposure (economic hedge). See Note 19 for additional information on the hedge accounting
applied.
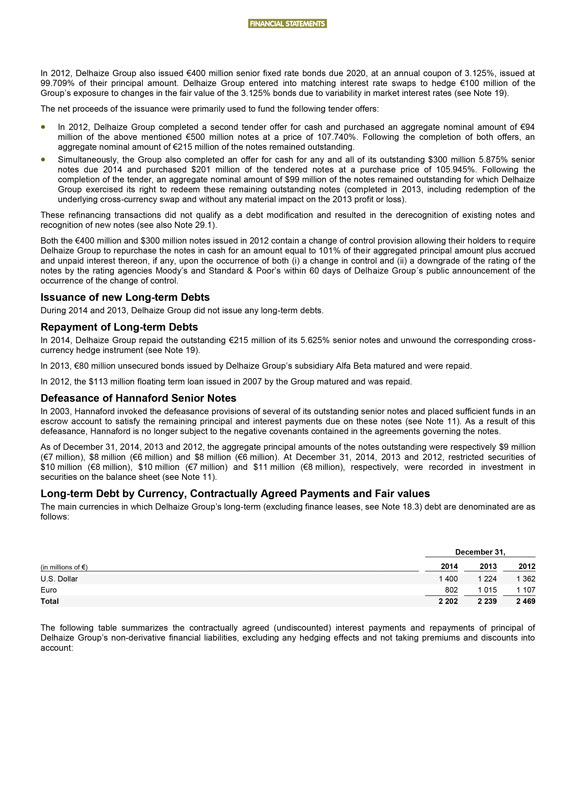
FINANCIAL STATEMENTS
In 2012, Delhaize Group also
issued €400 million senior fixed rate bonds due 2020, at an annual coupon of 3.125%, issued at
99.709% of their principal amount. Delhaize Group entered into
matching interest rate swaps to hedge €100 million of the Group’s exposure to changes in the fair value of the 3.125% bonds due to variability in market interest rates (see Note 19).
The net proceeds of the issuance were primarily used to fund the following tender offers:
In
2012, Delhaize Group completed a second tender offer for cash and purchased an aggregate nominal amount of €94 million of the above mentioned €500 million notes at a price of 107.740%. Following the completion of both offers, an aggregate
nominal amount of €215 million of the notes remained outstanding.
Simultaneously, the Group also completed an offer for cash for any and all of its
outstanding $300 million 5.875% senior notes due 2014 and purchased $201 million of the tendered notes at a purchase price of 105.945%. Following the completion of the tender, an aggregate nominal amount of $99 million of the notes remained
outstanding for which Delhaize Group exercised its right to redeem these remaining outstanding notes (completed in 2013, including redemption of the underlying cross-currency swap and without any material impact on the 2013 profit or loss).
These refinancing transactions did not qualify as a debt modification and resulted in the derecognition of existing notes and recognition of new notes (see also
Note 29.1).
Both the €400 million and $300 million notes issued in 2012 contain a change of control provision allowing their holders to require Delhaize Group
to repurchase the notes in cash for an amount equal to 101% of their aggregated principal amount plus accrued and unpaid interest thereon, if any, upon the occurrence of both (i) a change in control and (ii) a downgrade of the rating of the notes by
the rating agencies Moody’s and Standard & Poor’s within 60 days of Delhaize Group´s public announcement of the occurrence of the change of control.
Issuance of new Long-term Debts
During 2014 and 2013, Delhaize Group did not issue any
long-term debts.
Repayment of Long-term Debts
In 2014, Delhaize Group repaid
the outstanding €215 million of its 5.625% senior notes and unwound the corresponding cross-currency hedge instrument (see Note 19).
In 2013, €80 million
unsecured bonds issued by Delhaize Group’s subsidiary Alfa Beta matured and were repaid.
In 2012, the $113 million floating term loan issued in 2007 by the
Group matured and was repaid.
Defeasance of Hannaford Senior Notes
In 2003,
Hannaford invoked the defeasance provisions of several of its outstanding senior notes and placed sufficient funds in an escrow account to satisfy the remaining principal and interest payments due on these notes (see Note 11). As a result of this
defeasance, Hannaford is no longer subject to the negative covenants contained in the agreements governing the notes.
As of December 31, 2014, 2013 and 2012, the
aggregate principal amounts of the notes outstanding were respectively $9 million
(€7 million), $8 million (€6 million) and $8 million (€6 million).
At December 31, 2014, 2013 and 2012, restricted securities of $10 million (€8 million), $10 million (€7 million) and $11 million (€8 million), respectively, were recorded in investment in securities on the balance sheet (see Note 11).
Long-term Debt by Currency, Contractually Agreed Payments and Fair values
The
main currencies in which Delhaize Group’s long-term (excluding finance leases, see Note 18.3) debt are denominated are as follows:
December 31,
(in millions of €)
2014 2013 2012
U.S. Dollar 1 400 1 224 1 362
Euro 802 1 015 1 107
Total 2 202 2 239 2 469
The following table summarizes the contractually agreed (undiscounted)
interest payments and repayments of principal of Delhaize Group’s non-derivative financial liabilities, excluding any hedging effects and not taking premiums and discounts into account:
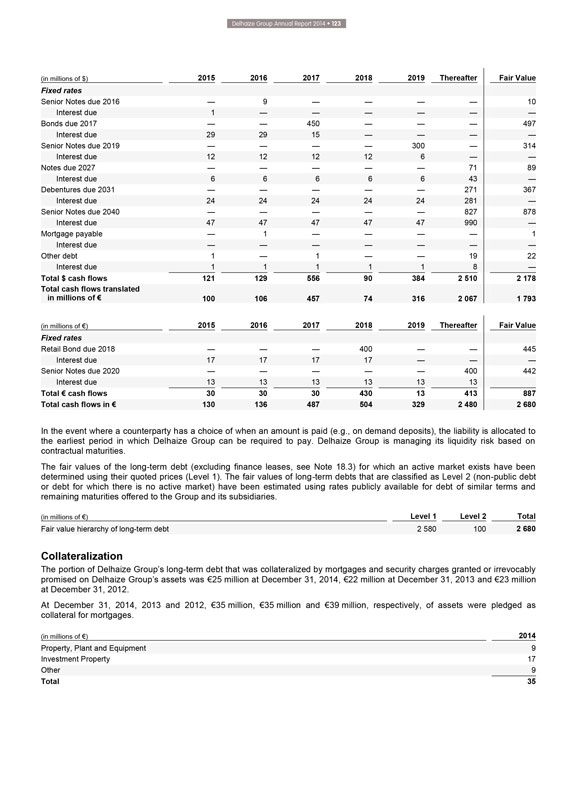
Delhaize Group Annual Report 2014 • 123
(in
millions of $)
2015 2016 2017 2018 2019
Thereafter
Fair Value
Fixed rates
Senior Notes due 2016 — 9 — — — — 10
Interest due 1 — —
— — — —
Bonds due 2017 — — 450 — — — 497
Interest due 29 29 15 — — — —
Senior Notes due 2019 — — —
— 300 — 314
Interest due 12 12 12 12 6 — —
Notes due 2027
— — — — — 71 89
Interest due 6 6 6 6 6 43 —
Debentures due 2031 — — — — — 271 367
Interest due
24 24 24 24 24 281 —
Senior Notes due 2040 — — — — — 827 878
Interest due 47 47 47 47 47 990 —
Mortgage payable — 1 — — — — 1
Interest due — — — — — — —
Other debt 1
— 1 — — 19 22
Interest due 1 1 1 1 1 8 —
Total $ cash
flows 121 129 556 90 384 2 510 2 178
Total cash flows translated in millions of € 100 106 457 74 316 2 067 1 793
(in millions of €)
2015 2016 2017 2018 2019
Thereafter
Fair Value
Fixed rates
Retail Bond due 2018 — — — 400 — — 445
Interest due 17 17 17 17 — — —
Senior Notes due 2020 — — —
— — 400 442
Interest due 13 13 13 13 13 13
Total € cash flows
30 30 30 430 13 413 887
Total cash flows in € 130 136 487 504 329 2 480 2 680
In the event where a counterparty has a choice of when an amount is paid (e.g., on demand deposits), the liability is allocated to the earliest period in which Delhaize Group can
be required to pay. Delhaize Group is managing its liquidity risk based on contractual maturities.
The fair values of the long-term debt (excluding finance leases,
see Note 18.3) for which an active market exists have been determined using their quoted prices (Level 1). The fair values of long-term debts that are classified as Level 2 (non-public debt or debt for which there is no active market) have been
estimated using rates publicly available for debt of similar terms and remaining maturities offered to the Group and its subsidiaries.
(in millions of €)
Level 1
Level 2
Total
Fair value hierarchy of long-term debt 2 580 100 2 680
Collateralization
The portion of Delhaize Group’s long-term debt that was collateralized
by mortgages and security charges granted or irrevocably promised on Delhaize Group’s assets was €25 million at December 31, 2014, €22 million at December 31, 2013 and €23 million at December 31, 2012.
At December 31, 2014, 2013 and 2012, €35 million, €35 million and €39 million, respectively, of assets were pledged as collateral for mortgages.
(in millions of €)
2014 Property, Plant and Equipment 9
Investment Property 17
Other 9
Total 35
FINANCIAL STATEMENTS
Debt Covenants for Long-term
Debt
Delhaize Group is subject to certain financial and non-financial covenants related to the long-term debt instruments indicated above. While these long-term
debt instruments contain certain accelerated repayment terms, as further described below, none contain accelerated repayment clauses that are subject solely to changes in the Group’s credit rating (“rating event”). Further, none of
the debt covenants restrict the ability of subsidiaries of Delhaize Group to transfer funds to the parent.
Indentures covering the notes due in 2017 ($), 2019 ($),
2020 (€), 2027 ($) and 2040 ($), the debentures due in 2031 ($) and the retail bond due in 2018 (€) contain customary provisions related to events of default as well as restrictions in terms of negative pledge, liens, sale and leaseback,
merger, transfer of assets and divestiture. The 2017 ($), 2019 ($), 2020 (€) and 2040 ($) notes and the 2018 (€) bonds also contain a provision granting their holders the right to early repayment for an amount not in excess of 101% of the
outstanding principal amount thereof in the event of a change of control in combination with a rating event.
At December 31, 2014, 2013 and 2012, Delhaize Group
was in compliance with all covenants for long-term debt.
18.2 Short-term Borrowings
Short-term credit facilities
In 2014, Delhaize Group and certain of its subsidiaries,
including Delhaize America, LLC, entered into a new €400 million five-year multi-currency, unsecured revolving credit facility agreement (the “€400 million RCF Agreement”), replacing the 2011 €600 million, five-year
multi-currency, unsecured revolving credit facility agreement (the “€600 million RCF Agreement”).
U.S. Entities
Delhaize America, LLC had no outstanding borrowings under these agreements as of December 31, 2014, 2013 and 2012.
Under the RCF Agreements, Delhaize America, LLC had no average daily borrowings during 2014, none during 2013 and $1 million (€1 million) during 2012. In addition to the RCF
Agreement, Delhaize America, LLC had a committed credit facility available until November 2014 to exclusively fund letters of credit of $35 million (€29 million) of which approximately $13 million (€9 million) and $12 million (€9
million) was drawn for issued letters of credit as of December 31, 2013 and 2012, respectively.
Further, Delhaize America, LLC has periodic short-term borrowings
under uncommitted credit facilities that are available at the lenders’ discretion. These facilities are also available to fund letters of credit were $50 million (€41 million) at December 31,
2014. As of December 31, 2014, 2013 and 2012, Delhaize America, LLC had no borrowings outstanding under such arrangements but used $10 million (€8 million) in 2014, none in
2013 and $5 million (€4 million) in 2012 to fund letters of credit.
European Entities
At December 31, 2014, 2013 and 2012, the Group’s European entities together had credit facilities (committed and uncommitted) of €683 million (of which €525 million
of committed credit facilities and including the €400 million RCF Agreement, see above),
€895 million and €846 million, respectively.
Borrowings under these facilities generally bear interest at the inter-bank offering rate at the borrowing date plus a pre-set margin, or based on market quotes from banks. In
Europe, Delhaize Group had no outstanding short-term bank borrowings at the end of 2014, 2013 and 2012. During 2014, the Group’s European entities had insignificant average daily borrowings at an average interest rate of 9.61%.
An amount of €41 million uncommitted credit facilities was exclusively available to issue bank guarantees, of which approximately €29 million was outstanding as of
December 31, 2014 (€34 million and €11 million at December 31, 2013 and 2012, respectively).
Debt Covenants for Short-term Borrowings
The €400 million RCF Agreement and the €125 million committed European bilateral credit facilities require maintenance of various financial and non-financial covenants.
The agreements contain customary provisions related to events of default and affirmative and negative covenants applicable to Delhaize Group. The negative covenants contain restrictions in terms of negative pledge, liens, indebtedness of
subsidiaries, sale of assets and mergers, as well as minimum fixed charge coverage ratios and maximum leverage ratios based on non-GAAP measures. None of the debt covenants restrict the abilities of subsidiaries of Delhaize Group to transfer funds
to the parent.
At December 31, 2014, 2013 and 2012, Delhaize Group was in compliance with all covenants conditions for short-term bank borrowings.
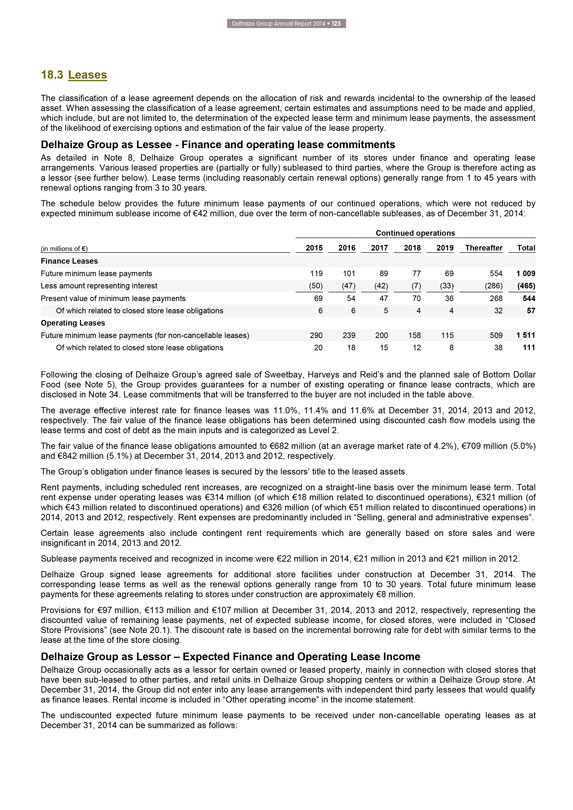
Delhaize Group Annual Report 2014 • 125
18.3
Leases
The classification of a lease agreement depends on the allocation of risk and rewards incidental to the ownership of the leased asset. When assessing the
classification of a lease agreement, certain estimates and assumptions need to be made and applied, which include, but are not limited to, the determination of the expected lease term and minimum lease payments, the assessment of the likelihood of
exercising options and estimation of the fair value of the lease property.
Delhaize Group as Lessee - Finance and operating lease commitments
As detailed in Note 8, Delhaize Group operates a significant number of its stores under finance and operating lease arrangements. Various leased properties are (partially or fully)
subleased to third parties, where the Group is therefore acting as a lessor (see further below). Lease terms (including reasonably certain renewal options) generally range from 1 to 45 years with renewal options ranging from 3 to 30 years.
The schedule below provides the future minimum lease payments of our continued operations, which were not reduced by expected minimum sublease income of €42
million, due over the term of non-cancellable subleases, as of December 31, 2014:
Continued operations
(in millions of €)
2015 2016 2017 2018 2019
Thereafter
Total
Finance Leases
Future minimum lease payments 119 101 89 77 69 554 1 009
Less amount representing interest (50) (47) (42) (7) (33) (286) (465)
Present value of minimum
lease payments 69 54 47 70 36 268 544
Of which related to closed store lease obligations 6 6 5 4 4 32 57
Operating Leases
Future minimum lease payments (for non-cancellable leases) 290 239 200 158
115 509 1 511
Of which related to closed store lease obligations 20 18 15 12 8 38 111
Following the closing of Delhaize Group’s agreed sale of Sweetbay, Harveys and Reid’s and the planned sale of Bottom Dollar
Food (see Note 5), the Group provides guarantees for a number of existing operating or finance lease contracts, which are disclosed in Note 34. Lease commitments that will be
transferred to the buyer are not included in the table above.
The average effective interest rate for finance leases was 11.0%, 11.4% and 11.6% at December 31,
2014, 2013 and 2012, respectively. The fair value of the finance lease obligations has been determined using discounted cash flow models using the lease terms and cost of debt as the main inputs and is categorized as Level 2.
The fair value of the finance lease obligations amounted to €682 million (at an average market rate of 4.2%), €709 million (5.0%) and €842 million (5.1%) at December
31, 2014, 2013 and 2012, respectively.
The Group’s obligation under finance leases is secured by the lessors’ title to the leased assets.
Rent payments, including scheduled rent increases, are recognized on a straight-line basis over the minimum lease term. Total rent expense under operating leases was €314
million (of which €18 million related to discontinued operations), €321 million (of which €43 million related to discontinued operations) and €326 million (of which €51 million related to discontinued operations) in
2014, 2013 and 2012, respectively. Rent expenses are predominantly included in “Selling, general and administrative expenses”.
Certain lease agreements also include contingent rent requirements which are generally based on store sales and were insignificant in 2014, 2013 and 2012.
Sublease payments received and recognized in income were €22 million in 2014, €21 million in 2013 and €21 million in 2012. Delhaize Group signed lease agreements for
additional store facilities under construction at December 31, 2014. The corresponding lease terms as well as the renewal options generally range from 10 to 30 years. Total future minimum lease payments for these agreements relating to stores under
construction are approximately €8 million.
Provisions for €97 million, €113 million and €107 million at December 31, 2014, 2013 and 2012,
respectively, representing the discounted value of remaining lease payments, net of expected sublease income, for closed stores, were included in “Closed Store Provisions” (see Note 20.1). The discount rate is based on the incremental
borrowing rate for debt with similar terms to the lease at the time of the store closing.
Delhaize Group as Lessor – Expected Finance and Operating Lease
Income
Delhaize Group occasionally acts as a lessor for certain owned or leased property, mainly in connection with closed stores that have been sub-leased to
other parties, and retail units in Delhaize Group shopping centers or within a Delhaize Group store. At December 31, 2014, the Group did not enter into any lease arrangements with independent third party lessees that would qualify as finance leases.
Rental income is included in “Other operating income” in the income statement.
The undiscounted expected future minimum lease payments to be received
under non-cancellable operating leases as at December 31, 2014 can be summarized as follows:
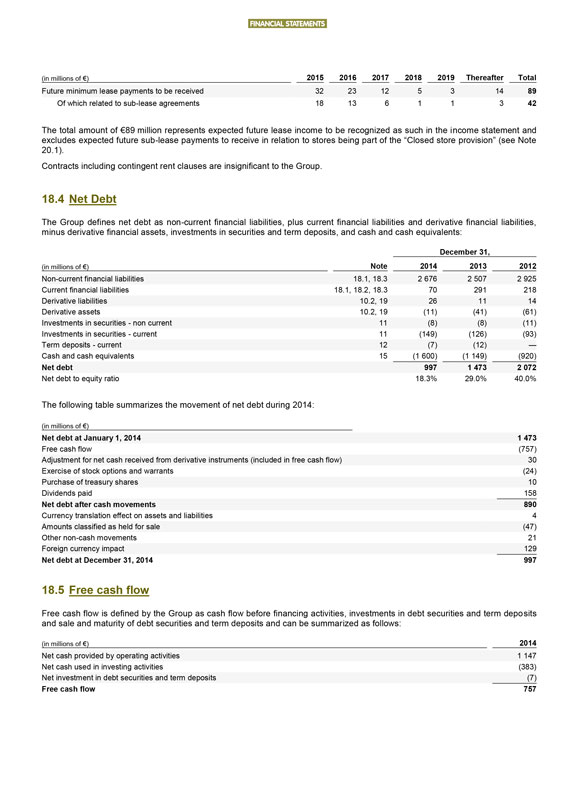
FINANCIAL STATEMENTS
(in millions of €)
2015 2016 2017 2018 2019
Thereafter
Total
Future minimum lease payments to be received 32 23 12 5 3 14 89
Of which related to sub-lease agreements 18 13 6 1 1 3 42
The total amount of €89 million
represents expected future lease income to be recognized as such in the income statement and excludes expected future sub-lease payments to receive in relation to stores being part of the “Closed store provision” (see Note
20.1).
Contracts including contingent rent clauses are insignificant to the Group.
18.4 Net Debt
The Group defines net debt as non-current financial liabilities, plus current
financial liabilities and derivative financial liabilities, minus derivative financial assets, investments in securities and term deposits, and cash and cash equivalents:
December 31,
(in millions of €)
Note
2014 2013 2012
Non-current financial liabilities 18.1, 18.3 2 676 2 507 2 925
Current financial liabilities
18.1, 18.2, 18.3 70 291 218
Derivative liabilities 10.2, 19 26 11 14
Derivative assets 10.2, 19 (11) (41) (61)
Investments in securities - non
current 11 (8) (8) (11)
Investments in securities - current 11 (149) (126) (93)
Term deposits - current 12 (7) (12) —
Cash and cash equivalents 15 (1
600) (1 149) (920)
Net debt 997 1 473 2 072
Net debt to equity ratio 18.3%
29.0% 40.0%
The following table summarizes the movement of net debt during 2014:
(in millions of €)
Net debt at January 1, 2014 1 473
Free cash flow (757)
Adjustment for net cash received from derivative instruments (included in
free cash flow) 30
Exercise of stock options and warrants (24)
Purchase of
treasury shares 10
Dividends paid 158
Net debt after cash movements 890
Currency translation effect on assets and liabilities 4
Amounts classified as
held for sale (47)
Other non-cash movements 21
Foreign currency impact 129
Net debt at December 31, 2014 997
18.5 Free cash flow
Free cash flow is defined by the Group as cash flow before financing activities, investments in debt securities and term deposits and sale and maturity of debt securities and term
deposits and can be summarized as follows:
(in millions of €)
2014
Net cash provided by operating activities 1 147
Net cash used in investing
activities (383)
Net investment in debt securities and term deposits (7)
Free
cash flow 757
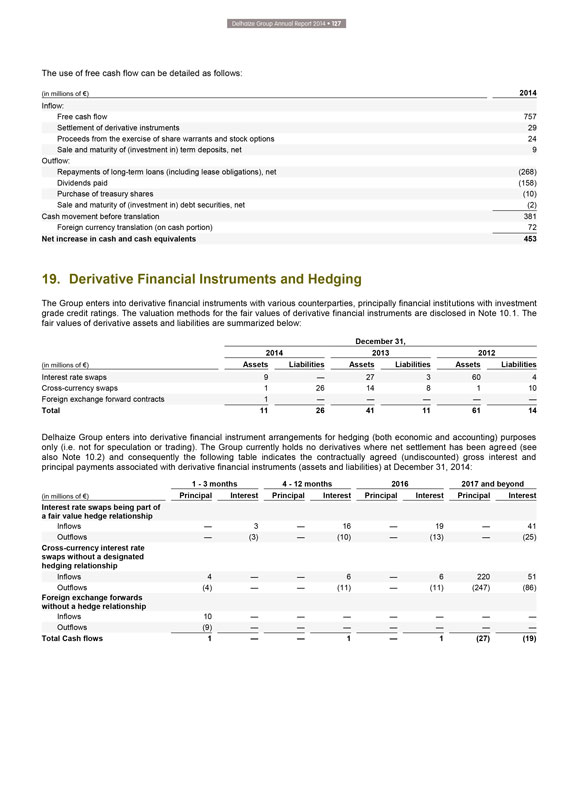
Delhaize Group Annual Report 2014 • 127
The
use of free cash flow can be detailed as follows:
(in millions of €)
2014
Inflow:
Free cash flow 757
Settlement of derivative instruments 29
Proceeds from the exercise of share warrants and stock options 24
Sale and maturity of
(investment in) term deposits, net 9
Outflow:
Repayments of long-term loans
(including lease obligations), net (268)
Dividends paid (158)
Purchase of
treasury shares (10)
Sale and maturity of (investment in) debt securities, net (2)
Cash movement before translation 381
Foreign currency translation (on cash portion) 72
Net increase in cash and cash equivalents 453
19. Derivative Financial
Instruments and Hedging
The Group enters into derivative financial instruments with various counterparties, principally financial institutions with investment
grade credit ratings. The valuation methods for the fair values of derivative financial instruments are disclosed in Note 10.1. The fair values of derivative assets and liabilities are summarized below:
December 31,
2014 2013 2012
(in millions of €)
Assets Liabilities
Assets Liabilities
Assets Liabilities
Interest rate swaps 9 — 27 3 60 4
Cross-currency swaps 1 26 14 8 1 10
Foreign exchange forward contracts 1 — — — — —
Total 11 26 41 11 61
14
Delhaize Group enters into derivative financial instrument arrangements for hedging (both economic and accounting) purposes only (i.e. not for speculation or
trading). The Group currently holds no derivatives where net settlement has been agreed (see also Note 10.2) and consequently the following table indicates the contractually agreed (undiscounted) gross interest and principal payments associated with
derivative financial instruments (assets and liabilities) at December 31, 2014:
1 - 3 months 4 - 12 months 2016 2017 and beyond
(in millions of €)
Principal Interest
Principal Interest
Principal Interest
Principal Interest
Interest rate swaps being part of a fair value hedge relationship
Inflows — 3 — 16 — 19 — 41
Outflows — (3) —
(10) — (13) — (25)
Cross-currency interest rate swaps without a designated hedging relationship
Inflows 4 — — 6 — 6 220 51
Outflows (4) — — (11) — (11) (247)
(86)
Foreign exchange forwards without a hedge relationship
Inflows 10 —
— — — — — —
Outflows (9) — — — — — — —
Total Cash flows 1 — — 1 — 1 (27) (19)
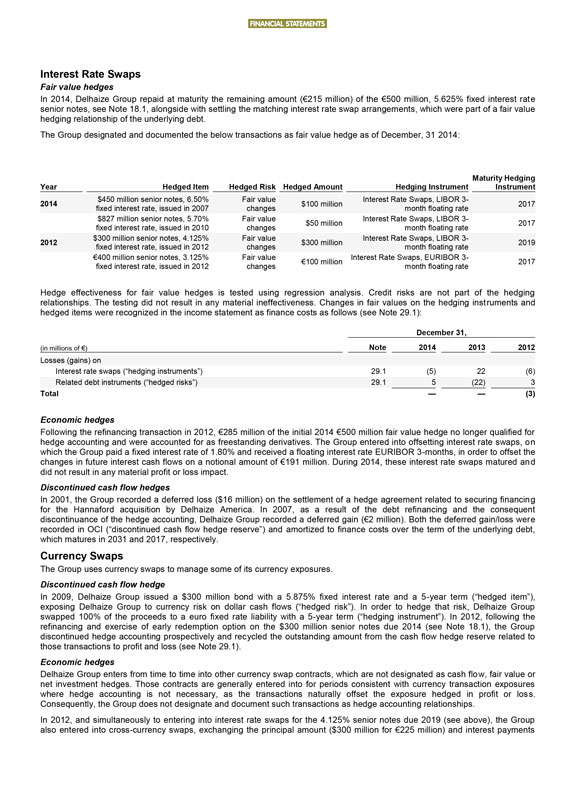
FINANCIAL STATEMENTS
Interest Rate Swaps
Fair value hedges
In 2014, Delhaize Group repaid at maturity the remaining
amount (€215 million) of the €500 million, 5.625% fixed interest rate senior notes, see Note 18.1, alongside with settling the matching interest rate swap arrangements, which were part of a fair value hedging relationship of the underlying
debt.
The Group designated and documented the below transactions as fair value hedge as of December, 31 2014:
Year
Hedged Item Hedged Risk Hedged Amount Hedging Instrument Maturity Hedging Instrument
2014
$450 million senior notes, 6.50% fixed interest rate, issued in 2007
Fair value changes
$100 million
Interest Rate Swaps, LIBOR 3-month floating rate
2017
$827 million senior notes, 5.70% fixed interest rate, issued in 2010
Fair value changes
$50 million
Interest Rate Swaps, LIBOR 3-month floating rate
2017
2012
$300 million senior notes, 4.125% fixed interest rate, issued in 2012
Fair
value changes
$300 million
Interest Rate Swaps, LIBOR 3-month floating rate
2019
€400 million senior notes, 3.125% fixed interest rate, issued in
2012
Fair value changes
€100 million
Interest Rate Swaps, EURIBOR 3-month floating rate
2017
Hedge effectiveness for fair value hedges is tested using regression analysis. Credit risks are not part of the hedging relationships. The testing did not result in any material
ineffectiveness. Changes in fair values on the hedging instruments and hedged items were recognized in the income statement as finance costs as follows (see Note 29.1):
December 31,
(in millions of €)
Note
2014 2013 2012
Losses (gains) on
Interest rate swaps (“hedging instruments”) 29.1 (5) 22 (6)
Related debt instruments (“hedged risks”) 29.1 5 (22) 3
Total
— — (3)
Economic hedges
Following the refinancing transaction in
2012, €285 million of the initial 2014 €500 million fair value hedge no longer qualified for hedge accounting and were accounted for as freestanding derivatives. The Group entered into offsetting interest rate swaps, on which the Group
paid a fixed interest rate of 1.80% and received a floating interest rate EURIBOR 3-months, in order to offset the changes in future interest cash flows on a notional amount of €191 million. During 2014, these interest rate swaps matured and
did not result in any material profit or loss impact.
Discontinued cash flow hedges
In 2001, the Group recorded a deferred loss ($16 million) on the settlement of a hedge agreement related to securing financing for the Hannaford acquisition by Delhaize America. In
2007, as a result of the debt refinancing and the consequent discontinuance of the hedge accounting, Delhaize Group recorded a deferred gain (€2 million). Both the deferred gain/loss were recorded in OCI (“discontinued cash flow hedge
reserve”) and amortized to finance costs over the term of the underlying debt, which matures in 2031 and 2017, respectively.
Currency Swaps
The Group uses currency swaps to manage some of its currency exposures.
Discontinued cash flow
hedge
In 2009, Delhaize Group issued a $300 million bond with a 5.875% fixed interest rate and a 5-year term (“hedged item”), exposing Delhaize Group to
currency risk on dollar cash flows (“hedged risk”). In order to hedge that risk, Delhaize Group swapped 100% of the proceeds to a euro fixed rate liability with a 5-year term (“hedging instrument”). In 2012, following the
refinancing and exercise of early redemption option on the $300 million senior notes due 2014 (see Note 18.1), the Group discontinued hedge accounting prospectively and recycled the outstanding amount from the cash flow hedge reserve related to
those transactions to profit and loss (see Note 29.1).
Economic hedges
Delhaize Group enters from time to time into other currency swap contracts, which are not designated as cash flow, fair value or net investment hedges. Those
contracts are generally entered into for periods consistent with currency transaction exposures where hedge accounting is not necessary, as the transactions naturally offset the exposure hedged in profit or loss. Consequently, the Group does not
designate and document such transactions as hedge accounting relationships.
In 2012, and simultaneously to entering into interest rate swaps for the 4.125% senior
notes due 2019 (see above), the Group also entered into cross-currency swaps, exchanging the principal amount ($300 million for €225 million) and interest payments
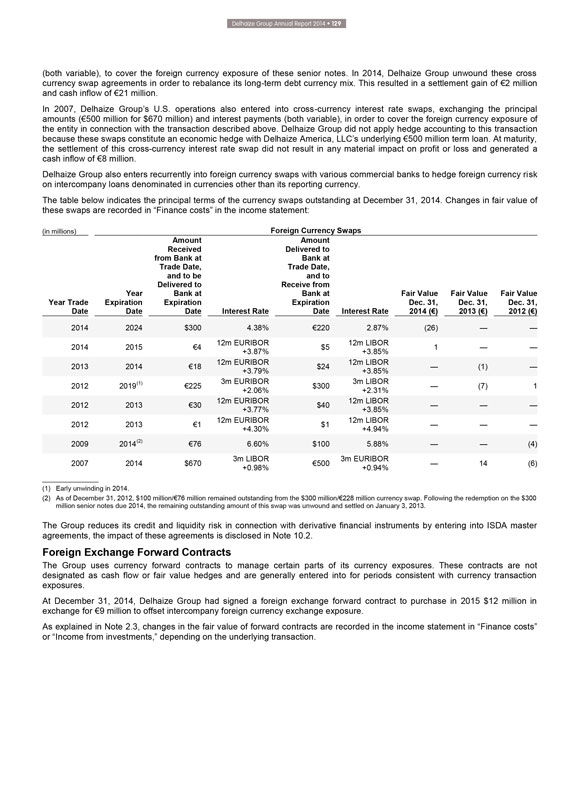
Delhaize Group Annual Report 2014 • 129
(both
variable), to cover the foreign currency exposure of these senior notes. In 2014, Delhaize Group unwound these cross currency swap agreements in order to rebalance its long-term debt currency mix. This resulted in a settlement gain of €2
million and cash inflow of €21 million.
In 2007, Delhaize Group’s U.S. operations also entered into cross-currency interest rate swaps, exchanging the
principal amounts (€500 million for $670 million) and interest payments (both variable), in order to cover the foreign currency exposure of the entity in connection with the transaction described above. Delhaize Group did not apply hedge
accounting to this transaction because these swaps constitute an economic hedge with Delhaize America, LLC’s underlying €500 million term loan. At maturity, the settlement of this cross-currency interest rate swap did not result in any
material impact on profit or loss and generated a cash inflow of €8 million.
Delhaize Group also enters recurrently into foreign currency swaps with various
commercial banks to hedge foreign currency risk on intercompany loans denominated in currencies other than its reporting currency.
The table below indicates the
principal terms of the currency swaps outstanding at December 31, 2014. Changes in fair value of these swaps are recorded in “Finance costs” in the income statement:
(in millions)
Foreign Currency Swaps
Year Trade Date
Year Expiration Date
Amount Received from Bank at Trade Date, and to be Delivered to Bank at Expiration Date
Interest Rate
Amount Delivered to Bank at Trade Date, and to Receive from
Bank at Expiration Date
Interest Rate
Fair Value Dec. 31, 2014(€)
Fair Value Dec. 31, 2013(€)
Fair Value Dec. 31, 2012(€)
2014 2024 $300 4.38% €220 2.87% (26) — —
2014 2015 €4 12m EURIBOR +3.87%
$5 12m LIBOR +3.85% 1 — —
2013 2014 €18 12m EURIBOR +3.79% $24 12m LIBOR +3.85% — (1) —
2012 2019(1) €225 3m EURIBOR +2.06% $300 3m LIBOR +2.31% — (7) 1
2012 2013 €30
12m EURIBOR +3.77% $40 12m LIBOR +3.85% — — —
2012 2013 €1 12m EURIBOR +4.30% $1 12m LIBOR +4.94% — — —
2009 2014(2) €76 6.60% $100 5.88% — — (4)
2007 2014 $670 3m LIBOR +0.98%
€500 3m EURIBOR +0.94% — 14 (6)
(1) Early unwinding in 2014.
(2) As
of December 31, 2012, $100 million/€76 million remained outstanding from the $300 million/€228 million currency swap. Following the redemption on the $300 million senior notes due 2014, the remaining outstanding amount of this swap was
unwound and settled on January 3, 2013.
The Group reduces its credit and liquidity risk in connection with derivative financial instruments by entering into ISDA
master agreements, the impact of these agreements is disclosed in Note 10.2.
Foreign Exchange Forward Contracts
The Group uses currency forward contracts to manage certain parts of its currency exposures. These contracts are not designated as cash flow or fair value hedges and are generally
entered into for periods consistent with currency transaction exposures.
At December 31, 2014, Delhaize Group had signed a foreign exchange forward contract to
purchase in 2015 $12 million in exchange for €9 million to offset intercompany foreign currency exchange exposure.
As explained in Note 2.3, changes in the
fair value of forward contracts are recorded in the income statement in “Finance costs” or “Income from investments,” depending on the underlying transaction.
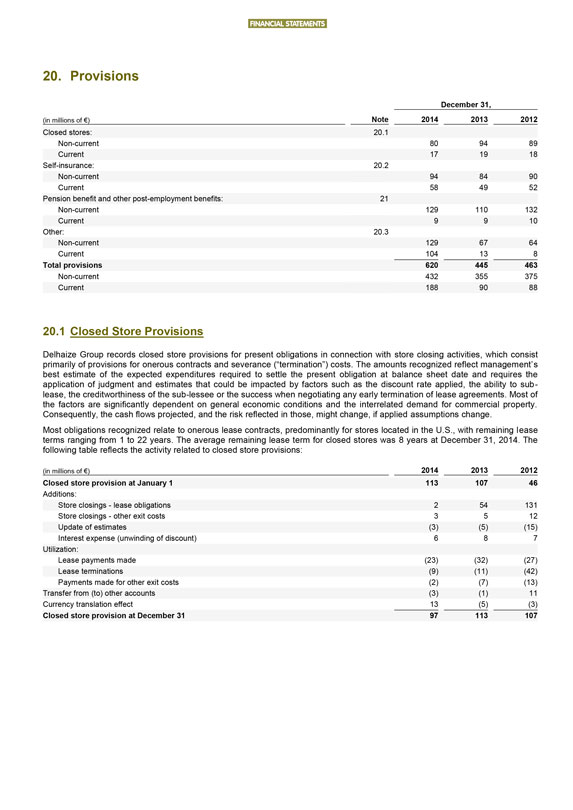
FINANCIAL STATEMENTS
20. Provisions
December 31,
(in millions of €)
Note
2014 2013 2012
Closed stores: 20.1
Non-current 80 94 89
Current 17 19 18
Self-insurance: 20.2
Non-current 94 84 90
Current 58 49 52
Pension benefit and other post-employment benefits: 21
Non-current 129 110 132
Current 9 9 10
Other: 20.3
Non-current 129 67 64
Current 104 13 8
Total provisions 620 445 463
Non-current 432 355 375
Current 188 90 88
20.1 Closed Store Provisions
Delhaize Group records closed store provisions for present obligations in connection with store closing activities, which consist primarily of provisions for onerous contracts and
severance (“termination”) costs. The amounts recognized reflect management’s best estimate of the expected expenditures required to settle the present obligation at balance sheet date and requires the application of judgment and
estimates that could be impacted by factors such as the discount rate applied, the ability to sublease, the creditworthiness of the sub-lessee or the success when negotiating any early termination of lease agreements. Most of the factors are
significantly dependent on general economic conditions and the interrelated demand for commercial property. Consequently, the cash flows projected, and the risk reflected in those, might change, if applied assumptions change.
Most obligations recognized relate to onerous lease contracts, predominantly for stores located in the U.S., with remaining lease terms ranging from 1 to 22 years. The average
remaining lease term for closed stores was 8 years at December 31, 2014. The following table reflects the activity related to closed store provisions:
(in millions
of €)
2014 2013 2012
Closed store provision at January 1 113 107 46
Additions:
Store closings - lease obligations 2 54 131
Store closings - other exit costs 3 5 12
Update of estimates (3) (5) (15)
Interest expense (unwinding of discount) 6 8 7
Utilization:
Lease payments made (23) (32) (27)
Lease terminations (9) (11) (42)
Payments made for other exit costs (2) (7) (13)
Transfer from (to) other accounts (3) (1) 11
Currency translation effect 13 (5) (3)
Closed store provision at December 31
97 113 107
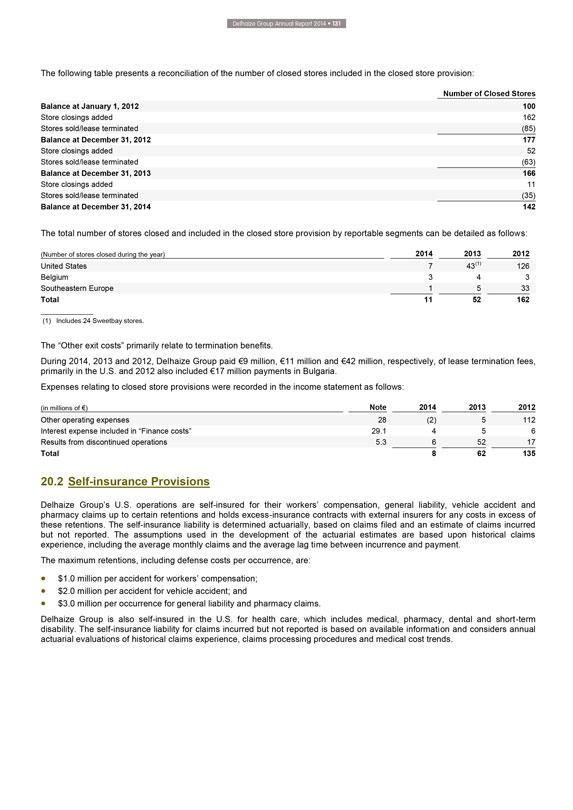
Delhaize Group Annual Report 2014 • 131
The
following table presents a reconciliation of the number of closed stores included in the closed store provision:
Number of Closed Stores
Balance at January 1, 2012 100
Store closings added 162
Stores sold/lease terminated (85)
Balance at December 31, 2012 177
Store closings added 52
Stores sold/lease terminated (63)
Balance at December 31, 2013 166
Store closings added 11
Stores sold/lease terminated (35)
Balance at December 31, 2014 142
The total number of stores closed and included in the closed store provision by reportable segments can be detailed as follows:
(Number of stores closed during the year)
2014 2013 2012
United States 7 43(1) 126
Belgium 3 4 3
Southeastern Europe 1 5 33
Total 11 52 162
(1) Includes 24 Sweetbay stores.
The “Other exit costs” primarily relate to
termination benefits.
During 2014, 2013 and 2012, Delhaize Group paid €9 million, €11 million and €42 million, respectively, of lease termination
fees, primarily in the U.S. and 2012 also included €17 million payments in Bulgaria.
Expenses relating to closed store provisions were recorded in the income
statement as follows:
(in millions of €)
Note
2014 2013 2012
Other operating expenses 28 (2) 5 112
Interest expense included in “Finance costs” 29.1 4 5 6
Results from discontinued
operations 5.3 6 52 17
Total 8 62 135
20.2 Self-insurance Provisions
Delhaize Group’s U.S. operations are self-insured for their workers’ compensation, general liability, vehicle accident and pharmacy claims up to certain
retentions and holds excess-insurance contracts with external insurers for any costs in excess of these retentions. The self-insurance liability is determined actuarially, based on claims filed and an estimate of claims incurred but not reported.
The assumptions used in the development of the actuarial estimates are based upon historical claims experience, including the average monthly claims and the average lag time between incurrence and payment.
The maximum retentions, including defense costs per occurrence, are:
$1.0 million per accident
for workers’ compensation;
$2.0 million per accident for vehicle accident; and
$3.0 million per occurrence for general liability and pharmacy claims.
Delhaize Group is also
self-insured in the U.S. for health care, which includes medical, pharmacy, dental and short-term disability. The self-insurance liability for claims incurred but not reported is based on available information and considers annual actuarial
evaluations of historical claims experience, claims processing procedures and medical cost trends.
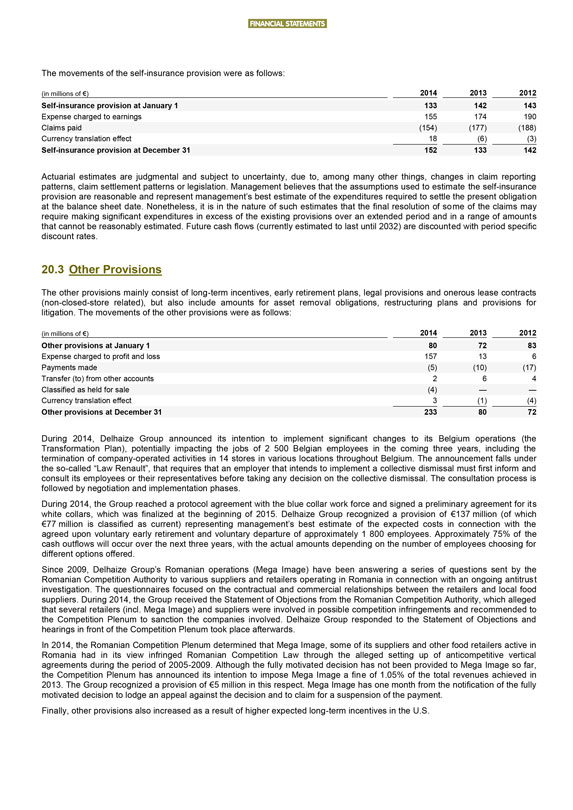
FINANCIAL STATEMENTS
The movements of the
self-insurance provision were as follows:
(in millions of €)
2014
2013
2012
Self-insurance provision at January 1 133 142 143
Expense charged to earnings 155 174 190
Claims paid (154) (177) (188)
Currency translation effect 18 (6) (3)
Self-insurance provision at December 31 152 133 142
Actuarial estimates are
judgmental and subject to uncertainty, due to, among many other things, changes in claim reporting patterns, claim settlement patterns or legislation. Management believes that the assumptions used to estimate the self-insurance provision are
reasonable and represent management’s best estimate of the expenditures required to settle the present obligation at the balance sheet date. Nonetheless, it is in the nature of such estimates that the final resolution of some of the claims may
require making significant expenditures in excess of the existing provisions over an extended period and in a range of amounts that cannot be reasonably estimated. Future cash flows (currently estimated to last until 2032) are discounted with period
specific discount rates.
20.3 Other Provisions
The other provisions mainly
consist of long-term incentives, early retirement plans, legal provisions and onerous lease contracts (non-closed-store related), but also include amounts for asset removal obligations, restructuring plans and provisions for litigation. The
movements of the other provisions were as follows:
(in millions of €)
2014
2013
2012
Other provisions at January 1 80 72 83
Expense charged to profit and loss 157 13 6
Payments made (5) (10) (17)
Transfer (to) from other accounts 2 6 4
Classified as held for sale (4) — —
Currency translation effect 3 (1) (4)
Other provisions at December 31 233 80
72
During 2014, Delhaize Group announced its intention to implement significant changes to its Belgium operations (the Transformation Plan), potentially impacting
the jobs of 2 500 Belgian employees in the coming three years, including the termination of company-operated activities in 14 stores in various locations throughout Belgium. The announcement falls under the so-called “Law Renault”, that
requires that an employer that intends to implement a collective dismissal must first inform and consult its employees or their representatives before taking any decision on the collective dismissal. The consultation process is followed by
negotiation and implementation phases.
During 2014, the Group reached a protocol agreement with the blue collar work force and signed a preliminary agreement for
its white collars, which was finalized at the beginning of 2015. Delhaize Group recognized a provision of €137 million (of which
€77 million is
classified as current) representing management’s best estimate of the expected costs in connection with the agreed upon voluntary early retirement and voluntary departure of approximately 1 800 employees. Approximately 75% of the cash outflows
will occur over the next three years, with the actual amounts depending on the number of employees choosing for different options offered.
Since 2009, Delhaize
Group’s Romanian operations (Mega Image) have been answering a series of questions sent by the Romanian Competition Authority to various suppliers and retailers operating in Romania in connection with an ongoing antitrust investigation. The
questionnaires focused on the contractual and commercial relationships between the retailers and local food suppliers. During 2014, the Group received the Statement of Objections from the Romanian Competition Authority, which alleged that several
retailers (incl. Mega Image) and suppliers were involved in possible competition infringements and recommended to the Competition Plenum to sanction the companies involved. Delhaize Group responded to the Statement of Objections and hearings in
front of the Competition Plenum took place afterwards.
In 2014, the Romanian Competition Plenum determined that Mega Image, some of its suppliers and other food
retailers active in Romania had in its view infringed Romanian Competition Law through the alleged setting up of anticompetitive vertical agreements during the period of 2005-2009. Although the fully motivated decision has not been provided to Mega
Image so far, the Competition Plenum has announced its intention to impose Mega Image a fine of 1.05% of the total revenues achieved in 2013. The Group recognized a provision of €5 million in this respect. Mega Image has one month from the
notification of the fully motivated decision to lodge an appeal against the decision and to claim for a suspension of the payment.
Finally, other provisions also
increased as a result of higher expected long-term incentives in the U.S.
Delhaize Group Annual Report 2014 • 133
21.
Employee Benefits
21.1 Pension Plans
A substantial number of Delhaize
Group’s employees are covered by defined contribution and defined benefit pension plans, mainly in the U.S., Belgium, Greece and Serbia. In addition, the Group has also other post-employment defined benefit arrangements, being principally
health care arrangements in the U.S.
The actuarial valuations performed on the defined benefit plans require making a number of assumptions about, besides others,
discount rates, inflation, interest crediting rate and future salary increases or mortality rates. For example, in determining the appropriate discount rate, management considers the interest rate of high-quality corporate bonds (at least AA rating)
in the respective currency in which the benefits will be paid and with the appropriate maturity; mortality rates are based on publicly available mortality tables for the specific country. Any changes in the assumptions applied will impact the
carrying amount of the pension obligations, but will not necessarily have an immediate impact on future contributions. All significant assumptions are reviewed periodically. Plan assets are measured at fair value, using readily available market
prices. Actuarial gains and losses (i.e., experience adjustments and effects of changes in financial and demographic actuarial assumptions) and the return on the plan assets, excluding amounts included in net interest on the net defined benefit
liability (asset), are directly recognized in OCI. The major assumptions applied in connection with defined benefit plans are summarized below.
Defined
Contribution Plans
In Belgium, Delhaize Group sponsors for substantially all of its employees a defined contribution plan, under which the Group and the employees
(starting in 2005) also, contribute a fixed monthly amount. The contributions are adjusted annually according to the Belgian consumer price index. Employees that were employed before implementation of the plan were able to choose not to participate
in the employee contribution part of the plan. The plan assures the employee a lump-sum payment at retirement based on the contributions made. The Group also sponsors an additional defined contribution plan, without employee contribution, for a
limited number of employees. The plans also provide with death in service benefits.
Belgian law prescribes a minimum guaranteed rate of return (currently 3.75% and
3.25% for employee and employer contributions, respectively) over the career of the employee for defined contribution plans, which the Group substantially insured with an external insurance company that receives and manages the contributions to the
plan. The weighted average years to pension of the plan participants at December 31, 2014 is 26 years (assuming retirement at the age of 65). At the end of 2014, the minimum guaranteed reserves, the plan assets and the net liabilities were as
follows:
(in millions of €)
2014
Plan Assets (69)
Minimum guaranteed reserves 66
Sum of individual deficits —
As the application of defined benefit accounting to such
plans has been recognized by the IASB to be conceptually problematic, the Group accounts for these plans as defined contribution plans, but acknowledges that these plans have some defined benefit features, as the return provided by the insurance
company can be below the legally required minimum return, in which case the employer has to cover the gap with additional contributions.
In order to monitor this
potential exposure, Delhaize Group calculated the discounted value of the positive differences between the minimum reserves, increased with the currently applicable minimum guaranteed rates of return up to the date of retirement, and the paid-up
insured benefits. At December 31, 2014, this would not have resulted in a net liability position for the Group. Decreasing the discount rate applied to the defined benefit obligation by 50 basis points, would also not have resulted in a net
liability position.
The expenses related to these plans were €11 million in 2014, €11 million in 2013 and €10 million in 2012, respectively. In
2015, the Group expects to contribute approximately €9 million to these plans.
In the U.S., Delhaize Group sponsors profit-sharing retirement plans covering
all employees at Food Lion and Hannaford with one or more years of service. Profit-sharing contributions substantially vest after three years of service. Forfeitures of profit-sharing contributions are used to reduce future employer contributions or
offset plan expenses. The profit-sharing contributions to the retirement plan are discretionary and determined by Delhaize America, LLC’s Board of Directors. The profit-sharing plans also include a 401(k) feature that permits participating
employees to make elective deferrals of their compensation and requires that the employer makes matching contributions.
The defined contribution plans generally
provide benefits to participants upon death, retirement or termination of employment.
The expenses related to these U.S. defined contribution retirement plans were
€26 million in 2014 (out of which €1 million presented as part of discontinued operations following the disposal of Sweetbay, Harveys and Reid’s), €44 million in 2013 (€5 million in discontinued operations) and €46
million in 2012 (€5 million in discontinued operations), respectively.
In addition, Delhaize Group operates defined contribution plans in Greece to which only
a limited number of employees are entitled and where the total expense is insignificant to the Group as a whole.
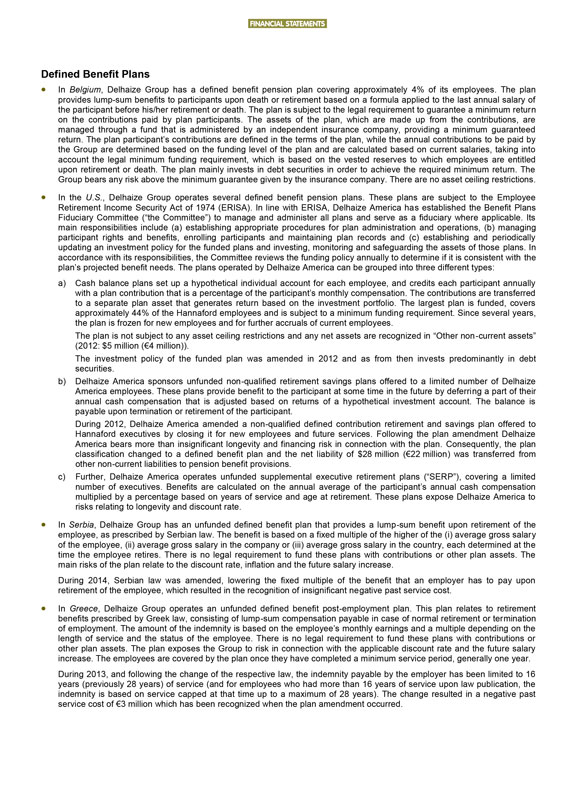
FINANCIAL STATEMENTS
Defined Benefit Plans
In Belgium, Delhaize Group has a defined benefit pension plan covering approximately 4% of its employees. The plan provides lump-sum benefits to participants upon
death or retirement based on a formula applied to the last annual salary of the participant before his/her retirement or death. The plan is subject to the legal requirement to guarantee a minimum return on the contributions paid by plan
participants. The assets of the plan, which are made up from the contributions, are managed through a fund that is administered by an independent insurance company, providing a minimum guaranteed return. The plan participant’s contributions are
defined in the terms of the plan, while the annual contributions to be paid by the Group are determined based on the funding level of the plan and are calculated based on current salaries, taking into account the legal minimum funding requirement,
which is based on the vested reserves to which employees are entitled upon retirement or death. The plan mainly invests in debt securities in order to achieve the required minimum return. The Group bears any risk above the minimum guarantee given by
the insurance company. There are no asset ceiling restrictions.
In the U.S., Delhaize Group operates several defined benefit pension plans. These plans are subject
to the Employee Retirement Income Security Act of 1974 (ERISA). In line with ERISA, Delhaize America has established the Benefit Plans Fiduciary Committee (“the Committee”) to manage and administer all plans and serve as a fiduciary where
applicable. Its main responsibilities include (a) establishing appropriate procedures for plan administration and operations, (b) managing participant rights and benefits, enrolling participants and maintaining plan records and (c) establishing and
periodically updating an investment policy for the funded plans and investing, monitoring and safeguarding the assets of those plans. In accordance with its responsibilities, the Committee reviews the funding policy annually to determine if it is
consistent with the plan’s projected benefit needs. The plans operated by Delhaize America can be grouped into three different types:
a) Cash balance plans
set up a hypothetical individual account for each employee, and credits each participant annually with a plan contribution that is a percentage of the participant’s monthly compensation. The contributions are transferred to a separate plan
asset that generates return based on the investment portfolio. The largest plan is funded, covers approximately 44% of the Hannaford employees and is subject to a minimum funding requirement. Since several years, the plan is frozen for new employees
and for further accruals of current employees.
The plan is not subject to any asset ceiling restrictions and any net assets are recognized in “Other
non-current assets” (2012: $5 million (€4 million)).
The investment policy of the funded plan was amended in 2012 and as from then invests predominantly
in debt securities.
b) Delhaize America sponsors unfunded non-qualified retirement savings plans offered to a limited number of Delhaize America employees. These
plans provide benefit to the participant at some time in the future by deferring a part of their annual cash compensation that is adjusted based on returns of a hypothetical investment account. The balance is payable upon termination or retirement
of the participant.
During 2012, Delhaize America amended a non-qualified defined contribution retirement and savings plan offered to Hannaford executives by
closing it for new employees and future services. Following the plan amendment Delhaize America bears more than insignificant longevity and financing risk in connection with the plan. Consequently, the plan classification changed to a defined
benefit plan and the net liability of $28 million (€22 million) was transferred from other non-current liabilities to pension benefit provisions.
c) Further,
Delhaize America operates unfunded supplemental executive retirement plans (“SERP”), covering a limited number of executives. Benefits are calculated on the annual average of the participant’s annual cash compensation multiplied by a
percentage based on years of service and age at retirement. These plans expose Delhaize America to risks relating to longevity and discount rate.
In Serbia,
Delhaize Group has an unfunded defined benefit plan that provides a lump-sum benefit upon retirement of the employee, as prescribed by Serbian law. The benefit is based on a fixed multiple of the higher of the (i) average gross salary of the
employee, (ii) average gross salary in the company or (iii) average gross salary in the country, each determined at the time the employee retires. There is no legal requirement to fund these plans with contributions or other plan assets. The main
risks of the plan relate to the discount rate, inflation and the future salary increase.
During 2014, Serbian law was amended, lowering the fixed multiple of the
benefit that an employer has to pay upon retirement of the employee, which resulted in the recognition of insignificant negative past service cost.
In Greece,
Delhaize Group operates an unfunded defined benefit post-employment plan. This plan relates to retirement benefits prescribed by Greek law, consisting of lump-sum compensation payable in case of normal retirement or termination of employment. The
amount of the indemnity is based on the employee’s monthly earnings and a multiple depending on the length of service and the status of the employee. There is no legal requirement to fund these plans with contributions or other plan assets. The
plan exposes the Group to risk in connection with the applicable discount rate and the future salary increase. The employees are covered by the plan once they have completed a minimum service period, generally one year.
During 2013, and following the change of the respective law, the indemnity payable by the employer has been limited to 16 years (previously 28 years) of service (and for employees
who had more than 16 years of service upon law publication, the indemnity is based on service capped at that time up to a maximum of 28 years). The change resulted in a negative past service cost of €3 million which has been recognized when the
plan amendment occurred.
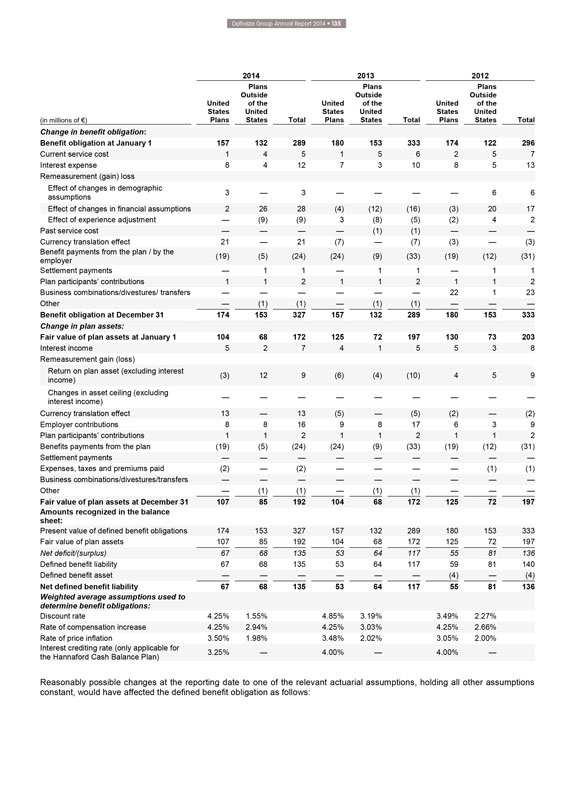
Delhaize Group Annual Report 2014 • 135
| 2014 | 2013 | 2012 | ||||||||||||||||
| (in millions of €) | United States Plans |
Plans Outside of the United States |
Total | United States Plans |
Plans Outside of the United States |
Total | United States Plans |
Plans Outside of the United States |
Total | |||||||||
| Change in benefit obligation: | ||||||||||||||||||
| Benefit obligation at January 1 | 157 | 132 | 289 | 180 | 153 | 333 | 174 | 122 | 296 | |||||||||
| Current service cost | 1 | 4 | 5 | 1 | 5 | 6 | 2 | 5 | 7 | |||||||||
| Interest expense | 8 | 4 | 12 | 7 | 3 | 10 | 8 | 5 | 13 | |||||||||
| Remeasurement (gain) loss | ||||||||||||||||||
| Effect of changes in demographic assumptions | 3 | — | 3 | — | — | — | — | 6 | 6 | |||||||||
| Effect of changes in financial assumptions | 2 | 26 | 28 | (4) | (12) | (16) | (3) | 20 | 17 | |||||||||
| Effect of experience adjustment | — | (9) | (9) | 3 | (8) | (5) | (2) | 4 | 2 | |||||||||
| Past service cost | — | — | — | — | (1) | (1) | — | — | — | |||||||||
| Currency translation effect | 21 | — | 21 | (7) | — | (7) | (3) | — | (3) | |||||||||
| Benefit payments from the plan / by the employer | (19) | (5) | (24) | (24) | (9) | (33) | (19) | (12) | (31) | |||||||||
| Settlement payments | — | 1 | 1 | — | 1 | 1 | — | 1 | 1 | |||||||||
| Plan participants’ contributions | 1 | 1 | 2 | 1 | 1 | 2 | 1 | 1 | 2 | |||||||||
| Business combinations/divestures/ transfers | — | — | — | — | — | — | 22 | 1 | 23 | |||||||||
| Other | — | (1) | (1) | — | (1) | (1) | — | — | — | |||||||||
| Benefit obligation at December 31 | 174 | 153 | 327 | 157 | 132 | 289 | 180 | 153 | 333 | |||||||||
| Change in plan assets: | ||||||||||||||||||
| Fair value of plan assets at January 1 | 104 | 68 | 172 | 125 | 72 | 197 | 130 | 73 | 203 | |||||||||
| Interest income | 5 | 2 | 7 | 4 | 1 | 5 | 5 | 3 | 8 | |||||||||
| Remeasurement gain (loss) | ||||||||||||||||||
| Return on plan asset (excluding interest income) | (3) | 12 | 9 | (6) | (4) | (10) | 4 | 5 | 9 | |||||||||
| Changes in asset ceiling (excluding interest income) | — | — | — | — | — | — | — | — | — | |||||||||
| Currency translation effect | 13 | — | 13 | (5) | — | (5) | (2) | — | (2) | |||||||||
| Employer contributions | 8 | 8 | 16 | 9 | 8 | 17 | 6 | 3 | 9 | |||||||||
| Plan participants’ contributions | 1 | 1 | 2 | 1 | 1 | 2 | 1 | 1 | 2 | |||||||||
| Benefits payments from the plan | (19) | (5) | (24) | (24) | (9) | (33) | (19) | (12) | (31) | |||||||||
| Settlement payments | — | — | — | — | — | — | — | — | — | |||||||||
| Expenses, taxes and premiums paid | (2) | — | (2) | — | — | — | — | (1) | (1) | |||||||||
| Business combinations/divestures/transfers | — | — | — | — | — | — | — | — | — | |||||||||
| Other | — | (1) | (1) | — | (1) | (1) | — | — | — | |||||||||
| Fair value of plan assets at December 31 | 107 | 85 | 192 | 104 | 68 | 172 | 125 | 72 | 197 | |||||||||
| Amounts recognized in the balance sheet: | ||||||||||||||||||
| Present value of defined benefit obligations | 174 | 153 | 327 | 157 | 132 | 289 | 180 | 153 | 333 | |||||||||
| Fair value of plan assets | 107 | 85 | 192 | 104 | 68 | 172 | 125 | 72 | 197 | |||||||||
| Net deficit/(surplus) | 67 | 68 | 135 | 53 | 64 | 117 | 55 | 81 | 136 | |||||||||
| Defined benefit liability | 67 | 68 | 135 | 53 | 64 | 117 | 59 | 81 | 140 | |||||||||
| Defined benefit asset | — | — | — | — | — | — | (4) | — | (4) | |||||||||
| Net defined benefit liability | 67 | 68 | 135 | 53 | 64 | 117 | 55 | 81 | 136 | |||||||||
| Weighted average assumptions used to determine benefit obligations: | ||||||||||||||||||
| Discount rate | 4.25% | 1.55% | 4.85% | 3.19% | 3.49% | 2.27% | ||||||||||||
| Rate of compensation increase | 4.25% | 2.94% | 4.25% | 3.03% | 4.25% | 2.66% | ||||||||||||
| Rate of price inflation | 3.50% | 1.98% | 3.48% | 2.02% | 3.05% | 2.00% | ||||||||||||
| Interest crediting rate (only applicable for the Hannaford Cash Balance Plan) | 3.25% | — | 4.00% | — | 4.00% | — | ||||||||||||
Reasonably possible changes at the reporting date to one of the relevant actuarial assumptions, holding all other assumptions constant, would have affected the defined benefit obligation as follows:
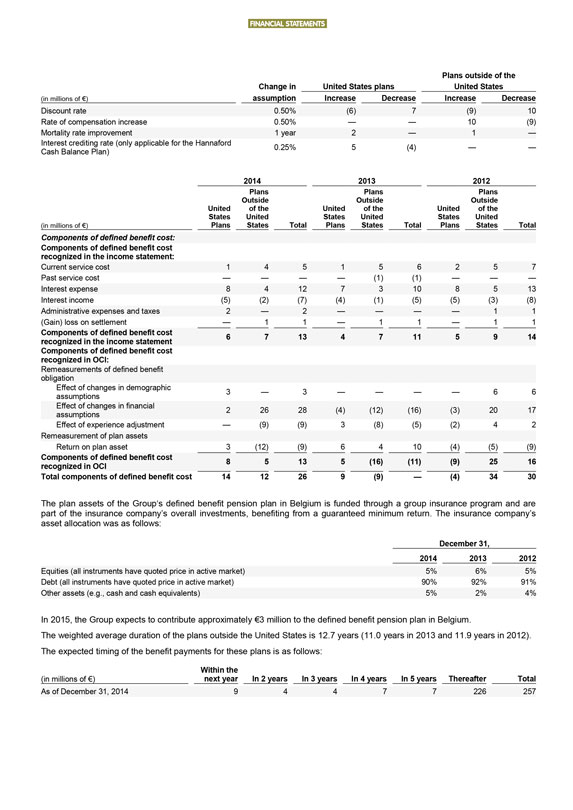
FINANCIAL STATEMENTS
(in millions of €)
Change in assumption United States plans Increase Decrease Plans outside of the United States Increase Decrease
Discount rate 0.50% (6) 7 (9) 10
Rate of compensation increase 0.50% — — 10 (9)
Mortality rate improvement 1 year 2
— 1 —
Interest crediting rate (only applicable for the Hannaford 0.25% 5 (4) — —
Cash Balance Plan)
2014 2013 2012
(in millions of €) United States Plans Plans Outside of the United States Total United States Plans Plans Outside of the United States Total United States Plans Plans Outside
of the United States Total
Components of defined benefit cost:
Components of
defined benefit cost recognized in the income statement:
Current service cost 1 4 5 1 5 6 2 5 7
Past service cost — — — — (1) (1) — — —
Interest expense 8
4 12 7 3 10 8 5 13
Interest income (5) (2) (7) (4) (1) (5) (5) (3) (8)
Administrative expenses and taxes 2 — 2 — — — — 1 1
(Gain) loss on settlement — 1 1 — 1 1 — 1 1
Components of
defined benefit cost recognized in the income statement 6 7 13 4 7 11 5 9 14
Components of defined benefit cost recognized in OCI:
Remeasurements of defined benefit obligation
Effect of changes in demographic assumptions 3
— 3 — — — — 6 6
Effect of changes in financial assumptions 2 26 28 (4) (12) (16) (3) 20 17
Effect of experience adjustment — (9) (9) 3 (8) (5) (2) 4 2
Remeasurement of plan assets
Return on plan asset 3 (12) (9) 6 4 10 (4) (5) (9)
Components of defined
benefit cost recognized in OCI 8 5 13 5 (16) (11) (9) 25 16
Total components of defined benefit cost 14 12 26 9 (9) — (4) 34 30
The plan assets of the Group’s defined benefit pension plan in Belgium is funded through a group insurance program and are part of the insurance company’s overall
investments, benefiting from a guaranteed minimum return. The insurance company’s asset allocation was as follows:
December 31,
2014 2013 2012
Equities (all instruments have quoted price in active market) 5% 6% 5%
Debt (all instruments have quoted price in active market) 90% 92% 91%
Other
assets (e.g., cash and cash equivalents) 5% 2% 4%
In 2015, the Group expects to contribute approximately €3 million to the defined benefit pension plan in
Belgium.
The weighted average duration of the plans outside the United States is 12.7 years (11.0 years in 2013 and 11.9 years in 2012).
The expected timing of the benefit payments for these plans is as follows:
| (in millions of €) Within the next year In 2 years In 3 years In 4 years In 5 years Thereafter Total |
| As of December 31, 2014 9 4 4 7 7 226 257 |
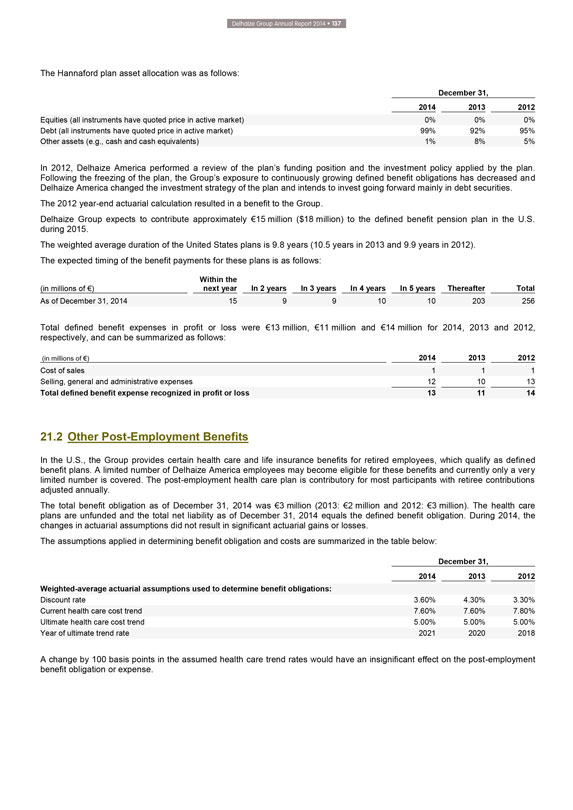
Delhaize Group Annual Report 2014 • 137
The
Hannaford plan asset allocation was as follows:
December 31,
2014 2013 2012
Equities (all instruments have quoted price in active market) 0% 0% 0%
Debt
(all instruments have quoted price in active market) 99% 92% 95%
Other assets (e.g., cash and cash equivalents) 1% 8% 5%
In 2012, Delhaize America performed a review of the plan’s funding position and the investment policy applied by the plan. Following the freezing of the plan, the Group’s
exposure to continuously growing defined benefit obligations has decreased and Delhaize America changed the investment strategy of the plan and intends to invest going forward mainly in debt securities. The 2012 year-end actuarial calculation
resulted in a benefit to the Group.
Delhaize Group expects to contribute approximately €15 million ($18 million) to the defined benefit pension plan in the
U.S. during 2015.
The weighted average duration of the United States plans is 9.8 years (10.5 years in 2013 and 9.9 years in 2012).
The expected timing of the benefit payments for these plans is as follows:
(in millions of
€) Within the next year In 2 years In 3 years In 4 years In 5 years Thereafter Total
As of December 31, 2014 15 9 9 10 10 203 256
Total defined benefit expenses in profit or loss were €13 million, €11 million and €14 million for 2014, 2013 and 2012, respectively, and can be summarized as
follows:
(in millions of €) 2014 2013 2012
Cost of sales 1 1 1
Selling, general and administrative expenses 12 10 13
Total defined benefit
expense recognized in profit or loss 13 11 14
21.2 Other Post-Employment Benefits
In the U.S., the Group provides certain health care and life insurance benefits for retired employees, which qualify as defined benefit plans. A limited number of Delhaize America
employees may become eligible for these benefits and currently only a very limited number is covered. The post-employment health care plan is contributory for most participants with retiree contributions adjusted annually. The total benefit
obligation as of December 31, 2014 was €3 million (2013: €2 million and 2012: €3 million). The health care plans are unfunded and the total net liability as of December 31, 2014 equals the defined benefit obligation. During 2014, the
changes in actuarial assumptions did not result in significant actuarial gains or losses.
The assumptions applied in determining benefit obligation and costs are
summarized in the table below:
December 31,
2014 2013
2012
Weighted-average actuarial assumptions used to determine benefit obligations:
Discount rate 3.60% 4.30% 3.30% Current health care cost trend 7.60% 7.60% 7.80%
Ultimate
health care cost trend 5.00% 5.00% 5.00%
Year of ultimate trend rate 2021 2020 2018
A change by 100 basis points in the assumed health care trend rates would have an insignificant effect on the post-employment benefit obligation or expense.
FINANCIAL STATEMENTS
21.3 Share-Based Compensation
Delhaize Group offers share-based incentives to certain members of its senior management: stock option and performance stock unit plans for employees of its
non-U.S. operating companies; warrant, restricted and performance stock unit plans for employees of its U.S. based companies.
Under a warrant plan the exercise by
the employee of warrants results in the issuance of new shares, while stock options, restricted and performance stock units are based on existing shares. Due to the sizeable administrative requirements that Belgian law imposes on capital increases,
a certain amount of time passes between the moment warrants have been exercised and the capital increase is formally performed. In case when the capital increase occurs after year-end for warrants exercised before year-end, which usually relates to
a limited number of warrants, Delhaize Group accounts for the actual exercise of the warrants at the date of the following capital increase. Consequently, no movement occurs in equity due to warrants exercised pending a subsequent capital increase,
until such a capital increase takes place. If assessed to be dilutive, such exercised warrants pending a subsequent capital increase are included in the diluted earnings per share calculation.
Restricted and performance stock unit awards represent the right to receive the number of shares or American Depositary Shares (“ADS”) set forth in the award at the
vesting date at no cost to plan participants and free of any restrictions.
During 2014, the ratio of Delhaize Group ADS to Delhaize Group ordinary shares changed
from one ADS for every one ordinary share to four ADS for every one ordinary share. Information on all compensation plans provided in this note is in number of (underlying) Delhaize Group ordinary shares.
The remuneration policy of Delhaize Group can be found as Exhibit F to the Delhaize Group’s Corporate Governance Charter available on the Group’s website
(www.delhaizegroup.com).
The share-based compensation plans operated by Delhaize Group are equity-settled share-based payment transactions, do not contain cash
settlement alternatives and the Group has no past practice of cash settlement. The cost of such transactions with employees is measured by reference to the fair value of the equity instruments at grant date and is expensed over the applicable
vesting period. All share-based compensation plans contain service conditions. In addition, the performance stock unit plans also contain performance conditions, whereby the (cliff-)vesting is linked to the achievement of non-market financial
performance conditions, such as the cumulative shareholder value creation over the service period. Neither service conditions nor non-market performance condition are reflected in the grant-date fair value, but result in a true-up for changes in the
number of equity instruments that are expected to vest. The period of achieving the performance targets does not extend beyond the end of the service period and does not start substantially before the commencement of the service period.
The grant date fair value of restricted and performance stock unit is determined based on the share price at the grant date. To estimate the fair value of warrants and options
underlying the share-based compensation, Delhaize Group uses the Black-Scholes-Merton valuation model. This requires the selection of certain assumptions, including the expected life of the option, the expected volatility, the risk-free rate and the
expected dividend yield:
The expected life of the option is based on management’s best estimate and based on historical option activity.
The expected volatility is determined by calculating the historical volatility of the Group’s share price over the expected option term.
The risk-free rate is determined using a generic price of government bonds with corresponding maturity terms.
The expected dividend yield is determined by calculating a historical average of dividend payments made by the Group.
The exercise price associated with stock options is dependent on the rules applicable to the relevant stock option plan. The exercise price is either the Delhaize Group ADR price
on the date of the grant (U.S. plans) or the Delhaize Group share price on the working day preceding the offering of the option (non-U.S. plans).
The usage of
historical data over a period similar to the life of the options assumes that the past is indicative of future trends, and - as with all assumptions - may not necessarily be the actual outcome. The assumptions used for estimating fair values for
various share-based payment plans are given further below.
Total share-based compensation expenses recorded - primarily in selling, general and administrative
expenses - were €12 million in 2014, €16 million in 2013 and €13 million in 2012.
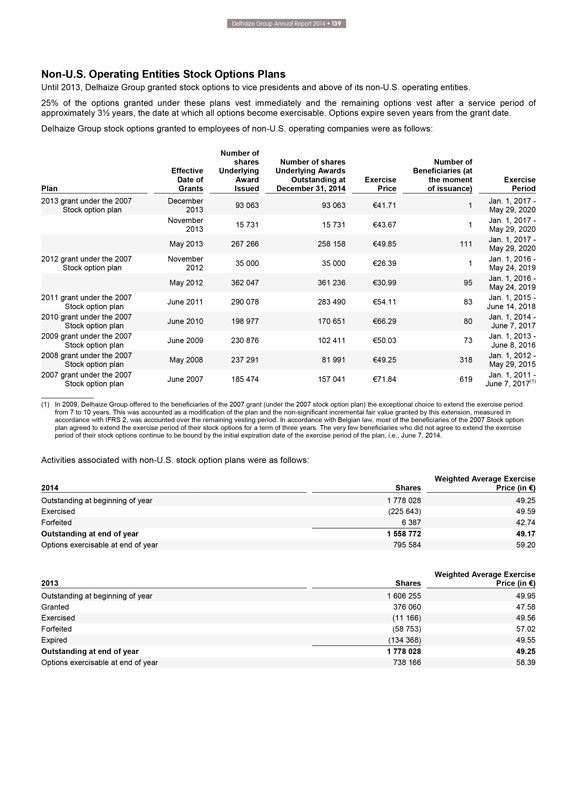
Delhaize Group Annual Report 2014 • 139
Non-U.S. Operating Entities Stock Options Plans
Until 2013, Delhaize Group
granted stock options to vice presidents and above of its non-U.S. operating entities.
25% of the options granted under these plans vest immediately and the
remaining options vest after a service period of approximately 3 1⁄2 years, the date at which all options become exercisable. Options expire seven years from
the grant date.
Delhaize Group stock options granted to employees of non-U.S. operating companies were as follows:
Plan Effective Date of Grants Number of shares Underlying Award Issued Number of shares Underlying Awards Outstanding at December 31, 2014 Exercise Price Number of
Beneficiaries (at the moment of issuance) Exercise Period
2013 grant under the 2007 Stock option plan December 2013 93 063 93 063 €41.71 1 Jan. 1, 2017 - May
29, 2020
November 2013 15 731 15 731 €43.67 1 Jan. 1, 2017 - May 29, 2020
May 2013 267 266 258 158 €49.85 111 Jan. 1, 2017 - May 29, 2020
2012
grant under the 2007 Stock option plan November 2012 35 000 35 000 €26.39 1 Jan. 1, 2016 - May 24, 2019
May 2012 362 047 361 236 €30.99 95 Jan. 1, 2016 -
May 24, 2019
2011 grant under the 2007 Stock option plan June 2011 290 078 283 490 €54.11 83 Jan. 1, 2015 - June 14, 2018
2010 grant under the 2007 Stock option plan June 2010 198 977 170 651 €66.29 80 Jan. 1, 2014 - June 7, 2017
2009 grant under the 2007 Stock option plan June 2009 230 876 102 411 €50.03 73 Jan. 1, 2013 - June 8, 2016
2008 grant under the 2007 Stock option plan May 2008 237 291 81 991 €49.25 318 Jan. 1, 2012 - May 29, 2015
2007 grant under the 2007 Stock option plan June 2007 185 474 157 041 €71.84 619 Jan. 1, 2011 - June 7, 2017(1)
(1) In 2009, Delhaize Group offered to the beneficiaries of the 2007 grant (under the 2007 stock option plan) the exceptional choice to extend the exercise period from 7 to 10
years. This was accounted as a modification of the plan and the non-significant incremental fair value granted by this extension, measured in accordance with IFRS 2, was accounted over the remaining vesting period. In accordance with Belgian law,
most of the beneficiaries of the 2007 Stock option plan agreed to extend the exercise period of their stock options for a term of three years. The very few beneficiaries who did not agree to extend the exercise period of their stock options continue
to be bound by the initial expiration date of the exercise period of the plan, i.e., June 7, 2014.
Activities associated with non-U.S. stock option plans were as
follows:
2014 Shares Weighted Average Exercise Price (in €)
Outstanding
at beginning of year 1 778 028 49.25
Exercised (225 643) 49.59
Forfeited 6
387 42.74
Outstanding at end of year 1 558 772 49.17
Options exercisable at
end of year 795 584 59.20
2013 Shares Weighted Average Exercise Price (in €)
Outstanding at beginning of year 1 606 255 49.95
Granted 376 060 47.58
Exercised (11 166) 49.56
Forfeited (58 753) 57.02
Expired (134 368) 49.55
Outstanding at end of year 1 778 028 49.25
Options exercisable at end of year 738 166 58.39
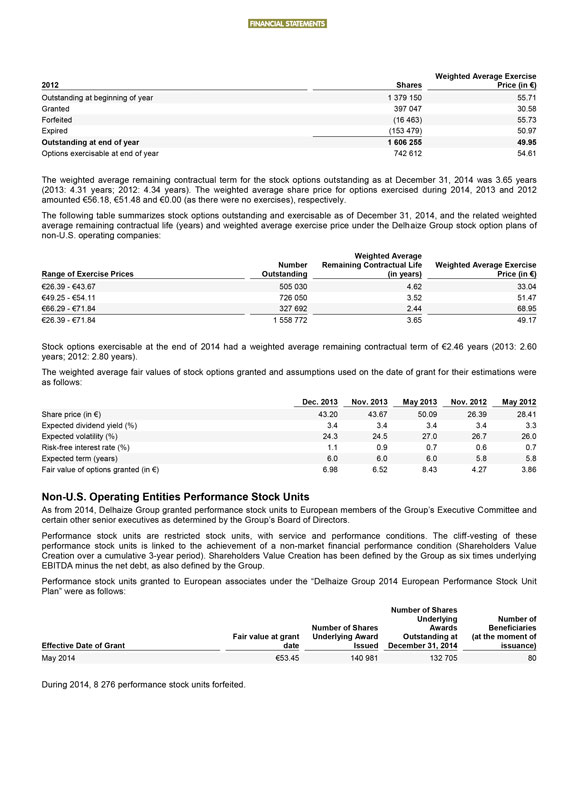
FINANCIAL STATEMENTS
2012 Shares Weighted Average
Exercise Price (in €)
Outstanding at beginning of year 1 379 150 55.71
Granted 397 047 30.58
Forfeited (16 463) 55.73
Expired (153 479) 50.97
Outstanding at end of year 1 606 255 49.95
Options exercisable at end of year 742 612 54.61
The weighted average remaining contractual
term for the stock options outstanding as at December 31, 2014 was 3.65 years (2013: 4.31 years; 2012: 4.34 years). The weighted average share price for options exercised during 2014, 2013 and 2012 amounted €56.18, €51.48 and €0.00
(as there were no exercises), respectively.
The following table summarizes stock options outstanding and exercisable as of December 31, 2014, and the related
weighted average remaining contractual life (years) and weighted average exercise price under the Delhaize Group stock option plans of non-U.S. operating companies:
Range of Exercise Prices Number Outstanding Weighted Average Remaining Contractual Life (in years) Weighted Average Exercise Price (in €)
€26.39 - €43.67 505 030 4.62 33.04
€49.25 - €54.11 726 050 3.52 51.47
€66.29 - €71.84 327 692 2.44 68.95
€26.39 - €71.84 1 558
772 3.65 49.17
Stock options exercisable at the end of 2014 had a weighted average remaining contractual term of €2.46 years (2013: 2.60 years; 2012: 2.80
years).
The weighted average fair values of stock options granted and assumptions used on the date of grant for their estimations were as follows:
Dec. 2013 Nov. 2013 May 2013 Nov. 2012 May 2012
Share price (in €) 43.20 43.67 50.09
26.39 28.41
Expected dividend yield (%) 3.4 3.4 3.4 3.4 3.3
Expected
volatility (%) 24.3 24.5 27.0 26.7 26.0
Risk-free interest rate (%) 1.1 0.9 0.7 0.6 0.7
Expected term (years) 6.0 6.0 6.0 5.8 5.8
Fair value of options granted (in €) 6.98 6.52
8.43 4.27 3.86
Non-U.S. Operating Entities Performance Stock Units
As from
2014, Delhaize Group granted performance stock units to European members of the Group’s Executive Committee and certain other senior executives as determined by the Group’s Board of Directors.
Performance stock units are restricted stock units, with service and performance conditions. The cliff-vesting of these performance stock units is linked to the achievement of a
non-market financial performance condition (Shareholders Value Creation over a cumulative 3-year period). Shareholders Value Creation has been defined by the Group as six times underlying EBITDA minus the net debt, as also defined by the Group.
Performance stock units granted to European associates under the “Delhaize Group 2014 European Performance Stock Unit Plan” were as follows:
Effective Date of Grant Fair value at grant date Number of Shares Underlying Award Issued Number of Shares Underlying Awards Outstanding at December 31, 2014 Number of
Beneficiaries (at the moment of issuance)
May 2014 €53.45 140 981 132 705 80
During 2014, 8 276 performance stock units forfeited.
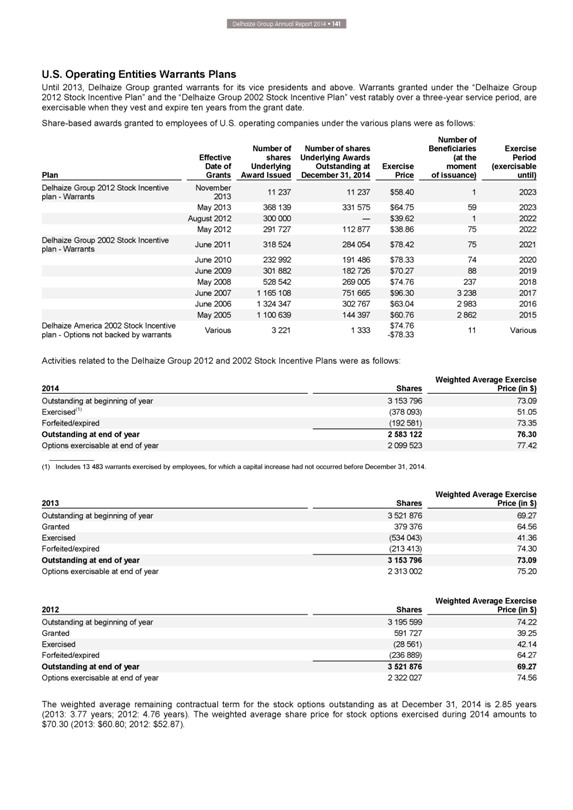
Delhaize Group Annual Report 2014 • 141
U.S.
Operating Entities Warrants Plans
Until 2013, Delhaize Group granted warrants for its vice presidents and above. Warrants granted under the “Delhaize Group
2012 Stock Incentive Plan” and the “Delhaize Group 2002 Stock Incentive Plan” vest ratably over a three-year service period, are exercisable when they vest and expire ten years from the grant date.
Share-based awards granted to employees of U.S. operating companies under the various plans were as follows:
| Plan Effective Date of Grants Number of shares Underlying Award Issued Number of shares Underlying Awards Outstanding at December 31, 2014 Exercise Price Number of Beneficiaries (at the moment of issuance) Exercise Period (exercisable until) |
| Delhaize Group 2012 Stock Incentive plan - Warrants November 2013 11 237 11 237 $58.40 1 2023 |
| May 2013 368 139 331 575 $64.75 59 2023 |
| August 2012 300 000 — $39.62 1 2022 |
| May 2012 291 727 112 877 $38.86 75 2022 |
| Delhaize Group 2002 Stock Incentive plan - Warrants June 2011 318 524 284 054 $78.42 75 2021 |
| June 2010 232 992 191 486 $78.33 74 2020 |
| June 2009 301 882 182 726 $70.27 88 2019 |
| May 2008 528 542 269 005 $74.76 237 2018 |
| June 2007 1 165 108 751 665 $96.30 3 238 2017 |
| June 2006 1 324 347 302 767 $63.04 2 983 2016 |
| May 2005 1 100 639 144 397 $60.76 2 862 2015 |
| Delhaize America 2002 Stock Incentive plan - Options not backed by warrants Various 3 221 1 333 $74.76-$78.33 11 Various |
Activities related to the Delhaize Group 2012 and 2002 Stock Incentive Plans were as follows:
| Weighted Average Exercise | ||||
| 2014 | Shares | Price (in $) | ||
| Outstanding at beginning of year | 3 153 796 | 73.09 | ||
| Exercised(1) | (378 093) | 51.05 | ||
| Forfeited/expired | (192 581) | 73.35 | ||
| Outstanding at end of year | 2 583 122 | 76.30 | ||
| Options exercisable at end of year | 2 099 523 | 77.42 | ||
(1) Includes 13 483 warrants exercised by employees, for which a capital increase had not occurred before December 31, 2014.
| Weighted Average Exercise | ||||
| 2013 | Shares | Price (in $) | ||
| Outstanding at beginning of year | 3 521 876 | 69.27 | ||
| Granted | 379 376 | 64.56 | ||
| Exercised | (534 043) | 41.36 | ||
| Forfeited/expired | (213 413) | 74.30 | ||
| Outstanding at end of year | 3 153 796 | 73.09 | ||
| Options exercisable at end of year | 2 313 002 | 75.20 | ||
| Weighted Average Exercise | ||||
| 2012 | Shares | Price (in $) | ||
| Outstanding at beginning of year | 3 195 599 | 74.22 | ||
| Granted | 591 727 | 39.25 | ||
| Exercised | (28 561) | 42.14 | ||
| Forfeited/expired | (236 889) | 64.27 | ||
| Outstanding at end of year | 3 521 876 | 69.27 | ||
| Options exercisable at end of year | 2 322 027 | 74.56 | ||
The weighted average remaining contractual term for the stock options outstanding as at December 31, 2014 is 2.85 years (2013: 3.77 years; 2012: 4.76 years). The weighted average share price for stock options exercised during 2014 amounts to $70.30 (2013: $60.80; 2012: $52.87).
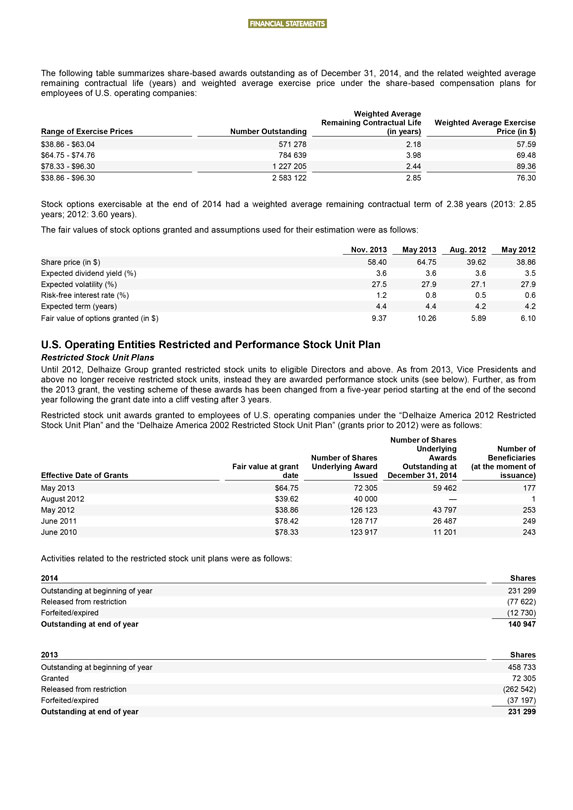
FINANCIAL STATEMENTS
The following table
summarizes share-based awards outstanding as of December 31, 2014, and the related weighted average remaining contractual life (years) and weighted average exercise price under the share-based compensation plans for employees of U.S. operating
companies:
Range of Exercise Prices Number Outstanding Weighted Average Remaining Contractual Life (in years) Weighted Average Exercise Price (in $)
$38.86 - $63.04 571 278 2.18 57.59
$64.75 - $74.76 784 639 3.98 69.48
$78.33 - $96.30 1 227 205 2.44 89.36
$38.86 - $96.30 2 583 122 2.85 76.30
Stock options exercisable at the end of 2014 had a weighted average remaining contractual term of 2.38 years (2013: 2.85 years; 2012: 3.60 years).
The fair values of stock options granted and assumptions used for their estimation were as follows:
Nov. 2013 May 2013 Aug. 2012 May 2012
Share price (in $) 58.40 64.75 39.62 38.86
Expected dividend yield (%) 3.6 3.6 3.6 3.5
Expected volatility (%) 27.5 27.9 27.1 27.9
Risk-free interest rate (%) 1.2 0.8 0.5 0.6
Expected term (years) 4.4 4.4 4.2
4.2
Fair value of options granted (in $) 9.37 10.26 5.89 6.10
U.S. Operating
Entities Restricted and Performance Stock Unit Plan
Restricted Stock Unit Plans
Until 2012, Delhaize Group granted restricted stock units to eligible Directors and above. As from 2013, Vice Presidents and above no longer receive restricted
stock units, instead they are awarded performance stock units (see below). Further, as from the 2013 grant, the vesting scheme of these awards has been changed from a five-year period starting at the end of the second year following the grant date
into a cliff vesting after 3 years.
Restricted stock unit awards granted to employees of U.S. operating companies under the “Delhaize America 2012 Restricted
Stock Unit Plan” and the “Delhaize America 2002 Restricted Stock Unit Plan” (grants prior to 2012) were as follows:
Effective Date of Grants Fair
value at grant date Number of Shares Underlying Award Issued Number of Shares Underlying Awards Outstanding at December 31, 2014 Number of Beneficiaries (at the moment of issuance)
May 2013 $64.75 72 305 59 462 177
August 2012 $39.62 40 000 — 1
May 2012 $38.86 126 123 43 797 253
June 2011 $78.42 128 717 26 487 249
June 2010 $78.33 123 917 11 201 243
Activities related to the restricted stock unit plans were
as follows:
2014 Shares
Outstanding at beginning of year 231 299
Released from restriction (77 622)
Forfeited/expired (12 730)
Outstanding at end of year 140 947
2013 Shares
Outstanding at beginning of year 458 733
Granted 72 305
Released from restriction (262 542)
Forfeited/expired (37 197)
Outstanding at end of year 231 299
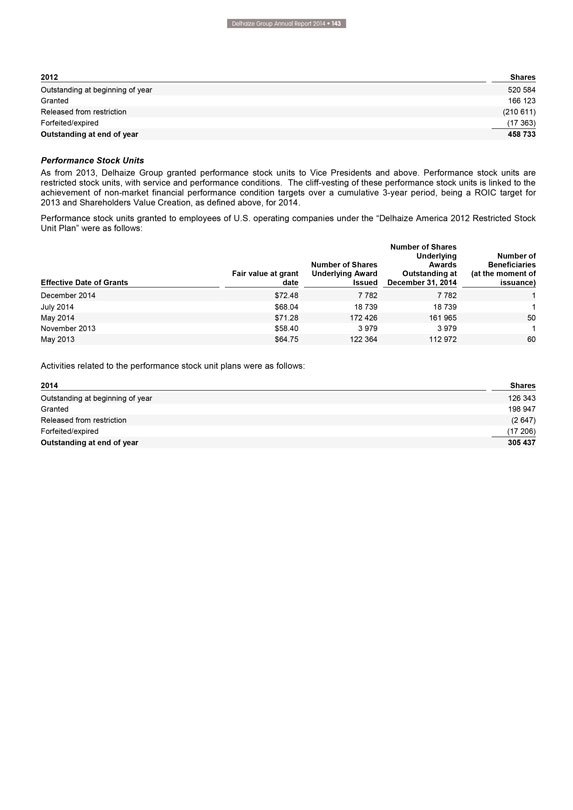
Delhaize Group Annual Report 2014 • 143
2012
Shares
Outstanding at beginning of year 520 584
Granted 166 123
Released from restriction (210 611)
Forfeited/expired (17 363)
Outstanding at end of year 458 733
Performance Stock Units
As from 2013, Delhaize Group granted performance stock units to Vice Presidents and above. Performance stock units are restricted stock units, with service and performance
conditions. The cliff-vesting of these performance stock units is linked to the achievement of non-market financial performance condition targets over a cumulative 3-year period, being a ROIC target for 2013 and Shareholders Value Creation, as
defined above, for 2014.
Performance stock units granted to employees of U.S. operating companies under the “Delhaize America 2012 Restricted Stock Unit
Plan” were as follows:
Effective Date of Grants Fair value at grant date Number of Shares Underlying Award Issued Number of Shares Underlying Awards
Outstanding at December 31, 2014 Number of Beneficiaries (at the moment of issuance)
December 2014 $72.48 7 782 7 782 1
July 2014 $68.04 18 739 18 739 1
May 2014 $71.28 172 426 161 965 50
November 2013 $58.40 3 979 3 979 1
May 2013 $64.75 122 364 112 972 60
Activities related to the performance stock unit plans were as follows:
2014 Shares
Outstanding at beginning of year 126 343
Granted 198 947
Released from restriction (2 647)
Forfeited/expired (17 206)
Outstanding at end of year 305 437
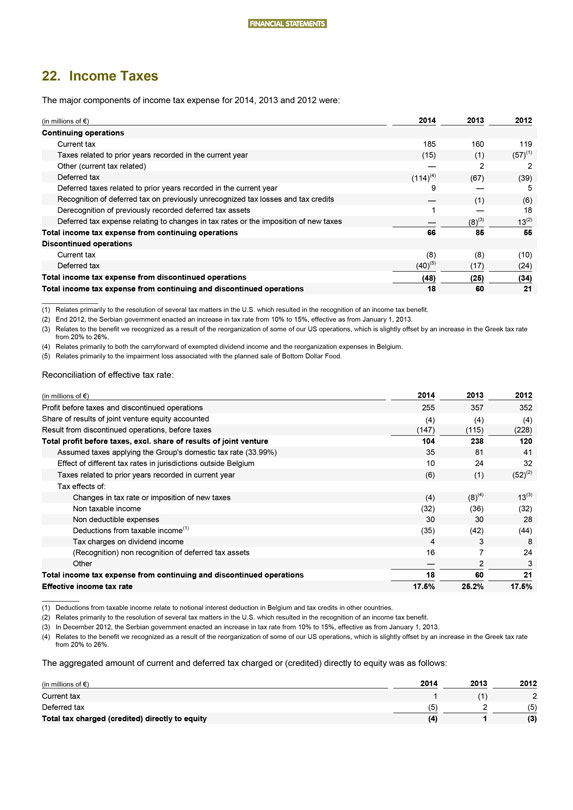
FINANCIAL STATEMENTS
22. Income Taxes
The major components of income tax expense for 2014, 2013 and 2012 were:
(in millions of
€) 2014 2013 2012
Continuing operations
Current tax 185 160 119
Taxes related to prior years recorded in the current year (15) (1) (57)(1)
Other (current tax related) — 2 2
Deferred tax (114)(4) (67) (39)
Deferred taxes related to prior years recorded in the current year 9 — 5
Recognition of deferred tax on previously unrecognized tax losses and tax credits — (1) (6)
Derecognition of previously recorded deferred tax assets 1 — 18
Deferred tax expense
relating to changes in tax rates or the imposition of new taxes — (8)(3) 13(2)
Total income tax expense from continuing operations 66 85 55
Discontinued operations
Current tax (8) (8) (10)
Deferred tax (40)(5) (17) (24)
Total income tax expense from discontinued operations (48) (25)
(34)
Total income tax expense from continuing and discontinued operations 18 60 21
(1) Relates primarily to the resolution of several tax matters in the U.S. which resulted in the recognition of an income tax benefit.
(2) End 2012, the Serbian government enacted an increase in tax rate from 10% to 15%, effective as from January 1, 2013.
(3) Relates to the benefit we recognized as a result of the reorganization of some of our US operations, which is slightly offset by an increase in the Greek tax rate from 20% to
26%.
(4) Relates primarily to both the carryforward of exempted dividend income and the reorganization expenses in Belgium.
(5) Relates primarily to the impairment loss associated with the planned sale of Bottom Dollar Food.
Reconciliation of effective tax rate:
(in millions of €) 2014 2013 2012
Profit before taxes and discontinued operations 255 357 352
Share of results of joint venture
equity accounted (4) (4) (4)
Result from discontinued operations, before taxes (147) (115) (228)
Total profit before taxes, excl. share of results of joint venture 104 238 120
Assumed taxes
applying the Group’s domestic tax rate (33.99%) 35 81 41
Effect of different tax rates in jurisdictions outside Belgium 10 24 32
Taxes related to prior years recorded in current year (6) (1) (52)(2)
Tax effects of:
Changes in tax rate or imposition of new taxes (4) (8)(4) 13(3)
Non taxable
income (32) (36) (32)
Non deductible expenses 30 30 28
Deductions from
taxable income(1) (35) (42) (44)
Tax charges on dividend income 4 3 8
(Recognition) non recognition of deferred tax assets 16 7 24
Other — 2 3
Total income tax expense from continuing and discontinued operations 18 60 21
Effective income tax rate 17.5% 25.2% 17.5%
(1) Deductions from taxable
income relate to notional interest deduction in Belgium and tax credits in other countries.
(2) Relates primarily to the resolution of several tax matters in the
U.S. which resulted in the recognition of an income tax benefit.
(3) In December 2012, the Serbian government enacted an increase in tax rate from 10% to 15%,
effective as from January 1, 2013.
(4) Relates to the benefit we recognized as a result of the reorganization of some of our US operations, which is slightly
offset by an increase in the Greek tax rate from 20% to 26%.
The aggregated amount of current and deferred tax charged or (credited) directly to equity was as
follows:
| (in millions of €) 2014 2013 2012 |
| Current tax 1 (1) 2 |
| Deferred tax (5) 2 (5) |
| Total tax charged (credited) directly to equity (4) 1 (3) |
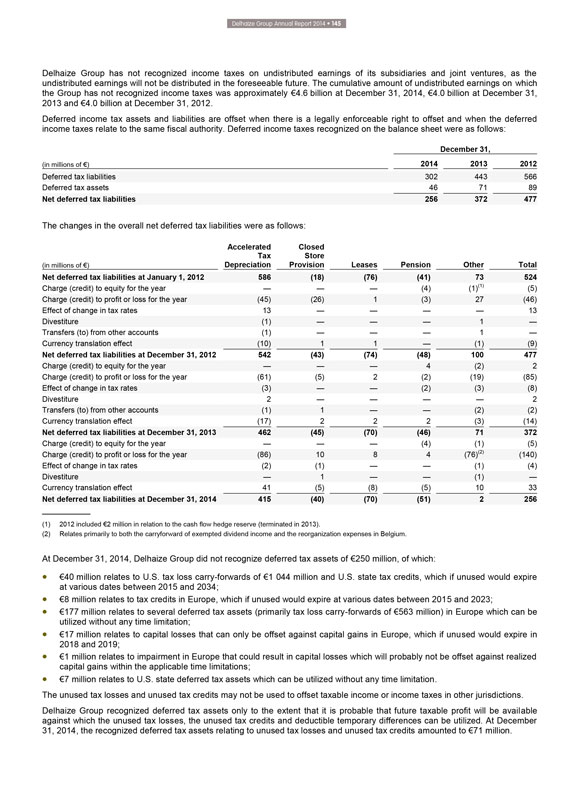
Delhaize Group Annual Report 2014 • 145
Delhaize Group has not recognized income taxes on undistributed earnings of its subsidiaries and joint ventures, as the undistributed earnings will not be
distributed in the foreseeable future. The cumulative amount of undistributed earnings on which the Group has not recognized income taxes was approximately €4.6 billion at December 31, 2014, €4.0 billion at December 31, 2013 and €4.0
billion at December 31, 2012.
Deferred income tax assets and liabilities are offset when there is a legally enforceable right to offset and when the deferred
income taxes relate to the same fiscal authority. Deferred income taxes recognized on the balance sheet were as follows:
| December 31, | ||||||
| (in millions of €) | 2014 | 2013 | 2012 | |||
| Deferred tax liabilities | 302 | 443 | 566 | |||
| Deferred tax assets | 46 | 71 | 89 | |||
| Net deferred tax liabilities | 256 | 372 | 477 | |||
The changes in the overall net deferred tax liabilities were as follows:
| (in millions of €) | Accelerated Tax Depreciation |
Closed Store Provision |
Leases | Pension | Other | Total | ||||||
| Net deferred tax liabilities at January 1, 2012 | 586 | (18) | (76) | (41) | 73 | 524 | ||||||
| Charge (credit) to equity for the year | — | — | — | (4) | (1)(1) | (5) | ||||||
| Charge (credit) to profit or loss for the year | (45) | (26) | 1 | (3) | 27 | (46) | ||||||
| Effect of change in tax rates | 13 | — | — | — | — | 13 | ||||||
| Divestiture | (1) | — | — | — | 1 | — | ||||||
| Transfers (to) from other accounts | (1) | — | — | — | 1 | — | ||||||
| Currency translation effect | (10) | 1 | 1 | — | (1) | (9) | ||||||
| Net deferred tax liabilities at December 31, 2012 | 542 | (43) | (74) | (48) | 100 | 477 | ||||||
| Charge (credit) to equity for the year | — | — | — | 4 | (2) | 2 | ||||||
| Charge (credit) to profit or loss for the year | (61) | (5) | 2 | (2) | (19) | (85) | ||||||
| Effect of change in tax rates | (3) | — | — | (2) | (3) | (8) | ||||||
| Divestiture | 2 | — | — | — | — | 2 | ||||||
| Transfers (to) from other accounts | (1) | 1 | — | — | (2) | (2) | ||||||
| Currency translation effect | (17) | 2 | 2 | 2 | (3) | (14) | ||||||
| Net deferred tax liabilities at December 31, 2013 | 462 | (45) | (70) | (46) | 71 | 372 | ||||||
| Charge (credit) to equity for the year | — | — | — | (4) | (1) | (5) | ||||||
| Charge (credit) to profit or loss for the year | (86) | 10 | 8 | 4 | (76)(2) | (140) | ||||||
| Effect of change in tax rates | (2) | (1) | — | — | (1) | (4) | ||||||
| Divestiture | — | 1 | — | — | (1) | — | ||||||
| Currency translation effect | 41 | (5) | (8) | (5) | 10 | 33 | ||||||
| Net deferred tax liabilities at December 31, 2014 | 415 | (40) | (70) | (51) | 2 | 256 |
(1) 2012 included €2 million in relation to the cash flow hedge reserve (terminated in 2013).
(2) Relates primarily to both the carryforward of exempted dividend income and the reorganization expenses in Belgium.
At December 31, 2014, Delhaize Group did not recognize deferred tax assets of €250 million, of which:
€40 million relates to U.S. tax loss carry-forwards of €1 044 million and U.S. state tax credits, which if unused would expire at various dates between 2015 and 2034;
€8 million relates to tax credits in Europe, which if unused would expire at various dates between 2015 and 2023;
€177 million relates to several deferred tax assets (primarily tax loss carry-forwards of €563 million) in Europe which can be utilized without any time limitation;
€17 million relates to capital losses that can only be offset against capital gains in Europe, which if unused would expire in 2018 and 2019;
€1 million relates to impairment in Europe that could result in capital losses which will probably not be offset against realized capital gains within the applicable time
limitations;
€7 million relates to U.S. state deferred tax assets which can be utilized without any time limitation.
The unused tax losses and unused tax credits may not be used to offset taxable income or income taxes in other jurisdictions. Delhaize Group recognized deferred tax assets only to
the extent that it is probable that future taxable profit will be available against which the unused tax losses, the unused tax credits and deductible temporary differences can be utilized. At December 31, 2014, the recognized deferred tax assets
relating to unused tax losses and unused tax credits amounted to €71 million.
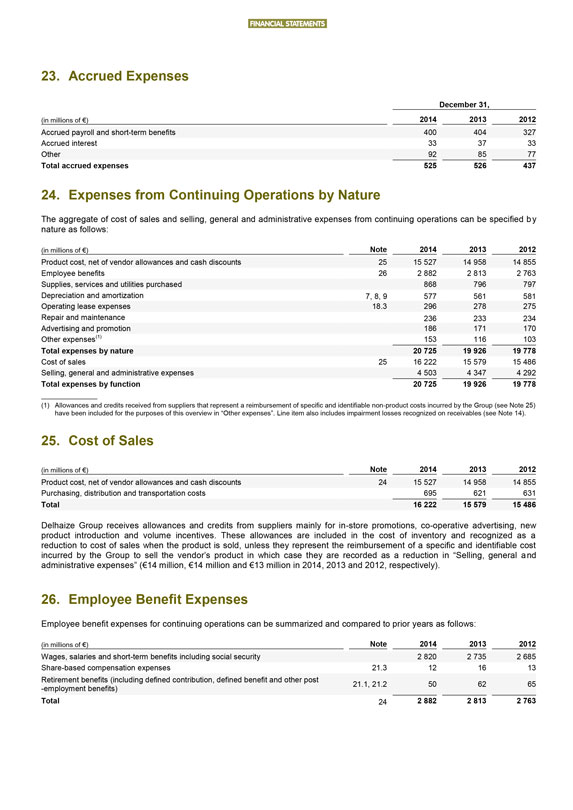
FINANCIAL STATEMENTS
23. Accrued Expenses
December 31,
(in millions of €) 2014 2013 2012
Accrued payroll and short-term benefits 400 404 327
Accrued interest 33 37 33
Other 92 85 77
Total accrued expenses 525 526 437
24. Expenses from Continuing Operations by Nature
The aggregate of cost of sales and selling,
general and administrative expenses from continuing operations can be specified by nature as follows:
(in millions of €) Note 2014 2013 2012
Product cost, net of vendor allowances and cash discounts 25 15 527 14 958 14 855
Employee
benefits 26 2 882 2 813 2 763
Supplies, services and utilities purchased 868 796 797
Depreciation and amortization 7, 8, 9 577 561 581
Operating lease expenses 18.3 296 278 275
Repair and maintenance 236 233 234
Advertising and promotion 186 171 170
Other expenses(1) 153 116 103
Total expenses by nature 20 725 19 926 19 778
Cost of sales 25 16 222 15 579 15 486
Selling, general and administrative
expenses 4 503 4 347 4 292
Total expenses by function 20 725 19 926 19 778
(1) Allowances and credits received from suppliers that represent a reimbursement of specific and identifiable non-product costs incurred by the Group (see Note
25) have been included for the purposes of this overview in “Other expenses”. Line item also includes impairment losses recognized on receivables (see Note 14).
25. Cost of Sales
(in millions of €) Note 2014 2013 2012
Product cost, net of vendor allowances and cash discounts 24 15 527 14 958 14 855
Purchasing,
distribution and transportation costs 695 621 631
Total 16 222 15 579 15 486
Delhaize Group receives allowances and credits from suppliers mainly for in-store promotions, co-operative advertising, new product introduction and volume
incentives. These allowances are included in the cost of inventory and recognized as a reduction to cost of sales when the product is sold, unless they represent the reimbursement of a specific and identifiable cost incurred by the Group to sell the
vendor’s product in which case they are recorded as a reduction in “Selling, general and administrative expenses” (€14 million, €14 million and €13 million in 2014, 2013 and 2012, respectively).
26. Employee Benefit Expenses
Employee benefit expenses for continuing operations can be
summarized and compared to prior years as follows:
(in millions of €) Note 2014 2013 2012
Wages, salaries and short-term benefits including social security 2 820 2 735 2 685
Share-based compensation expenses 21.3 12 16 13
Retirement benefits
(including defined contribution, defined benefit and other post-employment benefits) 21.1, 21.2 50 62 65
Total 24 2 882 2 813 2 763
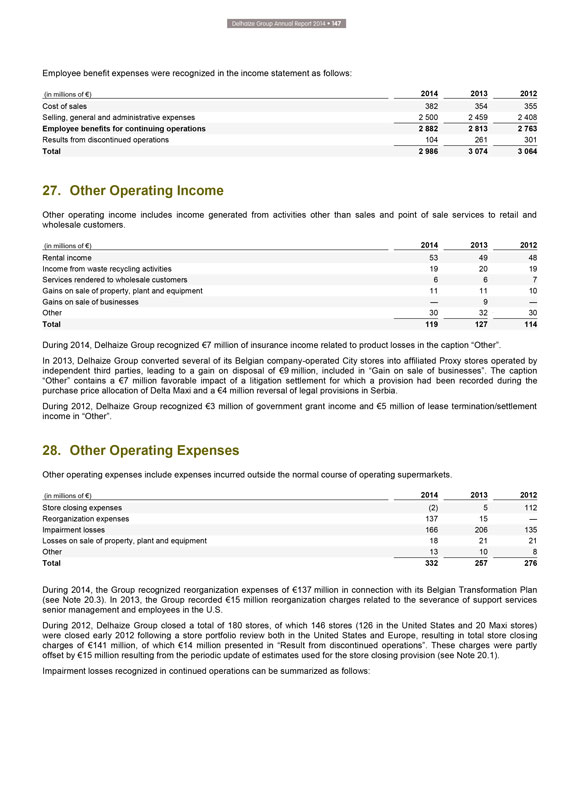
Delhaize Group Annual Report 2014 • 147
Employee benefit expenses were recognized in the income statement as follows:
| (in millions of €) | 2014 | 2013 | 2012 | |||
| Cost of sales | 382 | 354 | 355 | |||
| Selling, general and administrative expenses | 2 500 |
2 459 |
2 408 | |||
| Employee benefits for continuing operations | 2 882 |
2 813 |
2 763 | |||
| Results from discontinued operations | 104 | 261 | 301 | |||
| Total | 2 986 |
3 074 |
3 064 |
27. Other Operating Income
Other operating income
includes income generated from activities other than sales and point of sale services to retail and wholesale customers.
| (in millions of €) | 2014 | 2013 | 2012 | |||
| Rental income | 53 | 49 | 48 | |||
| Income from waste recycling activities | 19 | 20 | 19 | |||
| Services rendered to wholesale customers | 6 | 6 | 7 | |||
| Gains on sale of property, plant and equipment | 11 | 11 | 10 | |||
| Gains on sale of businesses | — | 9 | — | |||
| Other | 30 | 32 | 30 | |||
| Total | 119 | 127 | 114 |
During 2014, Delhaize Group recognized €7 million of insurance income related to product losses in the caption “Other”.
In 2013, Delhaize Group converted several of its Belgian company-operated City stores into affiliated Proxy stores operated by independent third parties, leading
to a gain on disposal of €9 million, included in “Gain on sale of businesses”. The caption “Other” contains a €7 million favorable impact of a litigation settlement for which a provision had been recorded during the
purchase price allocation of Delta Maxi and a €4 million reversal of legal provisions in Serbia.
During 2012, Delhaize Group recognized €3 million of
government grant income and €5 million of lease termination/settlement income in “Other”.
28. Other Operating Expenses
Other operating expenses include expenses incurred outside the normal course of operating supermarkets.
| (in millions of €) | 2014 | 2013 | 2012 | |||
| Store closing expenses | (2) | 5 | 112 | |||
| Reorganization expenses | 137 | 15 | — | |||
| Impairment losses | 166 | 206 | 135 | |||
| Losses on sale of property, plant and equipment | 18 | 21 | 21 | |||
| Other | 13 | 10 | 8 | |||
| Total | 332 | 257 | 276 |
During 2014, the Group recognized reorganization expenses of €137 million in connection with its Belgian Transformation Plan
(see Note 20.3). In 2013, the Group recorded €15 million reorganization charges related to the severance of support services senior management and employees
in the U.S.
During 2012, Delhaize Group closed a total of 180 stores, of which 146 stores (126 in the United States and 20 Maxi stores) were closed early 2012
following a store portfolio review both in the United States and Europe, resulting in total store closing charges of €141 million, of which €14 million presented in “Result from discontinued operations”. These charges were partly
offset by €15 million resulting from the periodic update of estimates used for the store closing provision (see Note 20.1).
Impairment losses recognized in
continued operations can be summarized as follows:
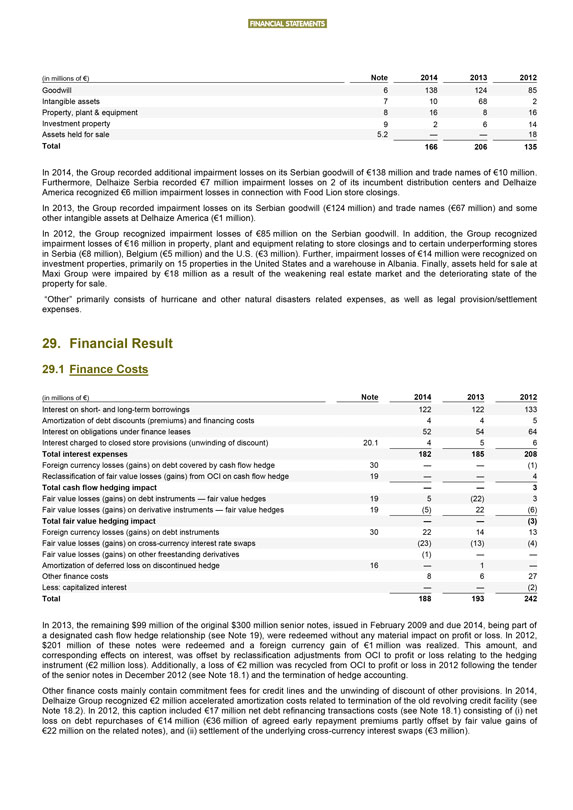
FINANCIAL STATEMENTS
| (in millions of €) | Note | 2014 | 2013 | 2012 | ||||
| Goodwill | 6 | 138 | 124 | 85 | ||||
| Intangible assets | 7 | 10 | 68 | 2 | ||||
| Property, plant & equipment | 8 | 16 | 8 | 16 | ||||
| Investment property | 9 | 2 | 6 | 14 | ||||
| Assets held for sale | 5.2 | — | — | 18 | ||||
| Total | 166 | 206 | 135 |
In 2014, the Group recorded additional impairment losses on its Serbian goodwill of €138 million and trade names of €10 million.
Furthermore, Delhaize Serbia recorded €7 million impairment losses on 2 of its incumbent distribution centers and Delhaize America recognized €6 million impairment losses in connection with Food Lion store closings.
In 2013, the Group recorded impairment losses on its Serbian goodwill (€124 million) and trade names (€67 million) and some other intangible assets at Delhaize America
(€1 million).
In 2012, the Group recognized impairment losses of €85 million on the Serbian goodwill. In addition, the Group recognized impairment losses
of €16 million in property, plant and equipment relating to store closings and to certain underperforming stores in Serbia (€8 million), Belgium (€5 million) and the U.S. (€3 million). Further, impairment losses of €14
million were recognized on investment properties, primarily on 15 properties in the United States and a warehouse in Albania. Finally, assets held for sale at Maxi Group were impaired by €18 million as a result of the weakening real estate
market and the deteriorating state of the property for sale.
“Other” primarily consists of hurricane and other natural disasters related expenses, as
well as legal provision/settlement expenses.
29. Financial Result
29.1
Finance Costs
| (in millions of €) | Note | 2014 | 2013 | 2012 | ||||
| Interest on short- and long-term borrowings | 122 | 122 | 133 | |||||
| Amortization of debt discounts (premiums) and financing costs | 4 | 4 | 5 | |||||
| Interest on obligations under finance leases | 52 | 54 | 64 | |||||
| Interest charged to closed store provisions (unwinding of discount) | 20.1 | 4 | 5 | 6 | ||||
| Total interest expenses | 182 | 185 | 208 | |||||
| Foreign currency losses (gains) on debt covered by cash flow hedge | 30 | — | — | (1) | ||||
| Reclassification of fair value losses (gains) from OCI on cash flow hedge | 19 | — | — | 4 | ||||
| Total cash flow hedging impact | — | — | 3 | |||||
| Fair value losses (gains) on debt instruments — fair value hedges | 19 | 5 | (22) | 3 | ||||
| Fair value losses (gains) on derivative instruments — fair value hedges | 19 | (5) | 22 | (6) | ||||
| Total fair value hedging impact | — | — | (3) | |||||
| Foreign currency losses (gains) on debt instruments | 30 | 22 | 14 | 13 | ||||
| Fair value losses (gains) on cross-currency interest rate swaps | (23) | (13) | (4) | |||||
| Fair value losses (gains) on other freestanding derivatives | (1) | — | — | |||||
| Amortization of deferred loss on discontinued hedge | 16 | — | 1 | — | ||||
| Other finance costs | 8 | 6 | 27 | |||||
| Less: capitalized interest | — | — | (2) | |||||
| Total | 188 | 193 | 242 |
In 2013, the remaining $99 million of the original $300 million senior notes, issued in February 2009 and due 2014, being part of a
designated cash flow hedge relationship (see Note 19), were redeemed without any material impact on profit or loss. In 2012, $201 million of these notes were redeemed and a foreign currency gain of €1 million was realized. This amount, and
corresponding effects on interest, was offset by reclassification adjustments from OCI to profit or loss relating to the hedging instrument (€2 million loss). Additionally, a loss of €2 million was recycled from OCI to profit or loss in
2012 following the tender of the senior notes in December 2012 (see Note 18.1) and the termination of hedge accounting.
Other finance costs mainly contain
commitment fees for credit lines and the unwinding of discount of other provisions. In 2014,
Delhaize Group recognized €2 million accelerated
amortization costs related to termination of the old revolving credit facility (see
Note 18.2). In 2012, this caption included €17 million net debt
refinancing transactions costs (see Note 18.1) consisting of (i) net loss on debt repurchases of €14 million (€36 million of agreed early repayment premiums partly offset by fair value gains of €22 million on the related notes), and
(ii) settlement of the underlying cross-currency interest swaps (€3 million).
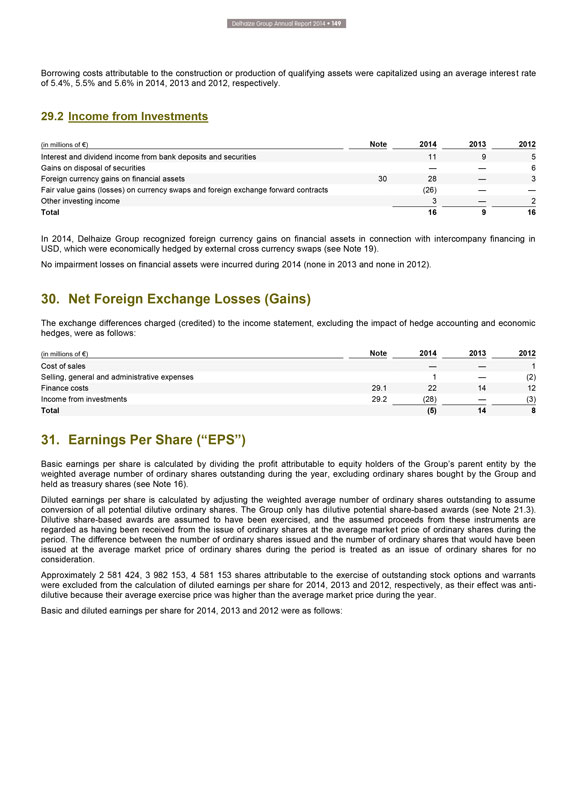
Delhaize Group Annual Report 2014 • 149
Borrowing costs attributable to the construction or production of qualifying assets were capitalized using an average interest rate of 5.4%, 5.5% and 5.6% in 2014,
2013 and 2012, respectively.
29.2 Income from Investments
| (in millions of €) | Note | 2014 | 2013 | 2012 | ||||
| Interest and dividend income from bank deposits and securities | 11 | 9 | 5 | |||||
| Gains on disposal of securities | — | — | 6 | |||||
| Foreign currency gains on financial assets | 30 | 28 | — | 3 | ||||
| Fair value gains (losses) on currency swaps and foreign exchange forward contracts | (26) | — | — | |||||
| Other investing income | 3 | — | 2 | |||||
| Total | 16 | 9 | 16 |
In 2014, Delhaize Group recognized foreign currency gains on financial assets in connection with intercompany financing in USD, which were
economically hedged by external cross currency swaps (see Note 19).
No impairment losses on financial assets were incurred during 2014 (none in 2013 and none in
2012).
30. Net Foreign Exchange Losses (Gains)
The exchange differences
charged (credited) to the income statement, excluding the impact of hedge accounting and economic hedges, were as follows:
| (in millions of €) | Note | 2014 | 2013 | 2012 | ||||
| Cost of sales | — | — | 1 | |||||
| Selling, general and administrative expenses | 1 | — | (2) | |||||
| Finance costs | 29.1 | 22 | 14 | 12 | ||||
| Income from investments | 29.2 | (28) | — | (3) | ||||
| Total | (5) | 14 | 8 |
31. Earnings Per Share (“EPS”)
Basic
earnings per share is calculated by dividing the profit attributable to equity holders of the Group’s parent entity by the weighted average number of ordinary shares outstanding during the year, excluding ordinary shares bought by the Group and
held as treasury shares (see Note 16).
Diluted earnings per share is calculated by adjusting the weighted average number of ordinary shares outstanding to assume
conversion of all potential dilutive ordinary shares. The Group only has dilutive potential share-based awards (see Note 21.3). Dilutive share-based awards are assumed to have been exercised, and the assumed proceeds from these instruments are
regarded as having been received from the issue of ordinary shares at the average market price of ordinary shares during the period. The difference between the number of ordinary shares issued and the number of ordinary shares that would have been
issued at the average market price of ordinary shares during the period is treated as an issue of ordinary shares for no consideration.
Approximately 2 581 424, 3
982 153, 4 581 153 shares attributable to the exercise of outstanding stock options and warrants were excluded from the calculation of diluted earnings per share for 2014, 2013 and 2012, respectively, as their effect was anti-dilutive because their
average exercise price was higher than the average market price during the year.
Basic and diluted earnings per share for 2014, 2013 and 2012 were as follows:
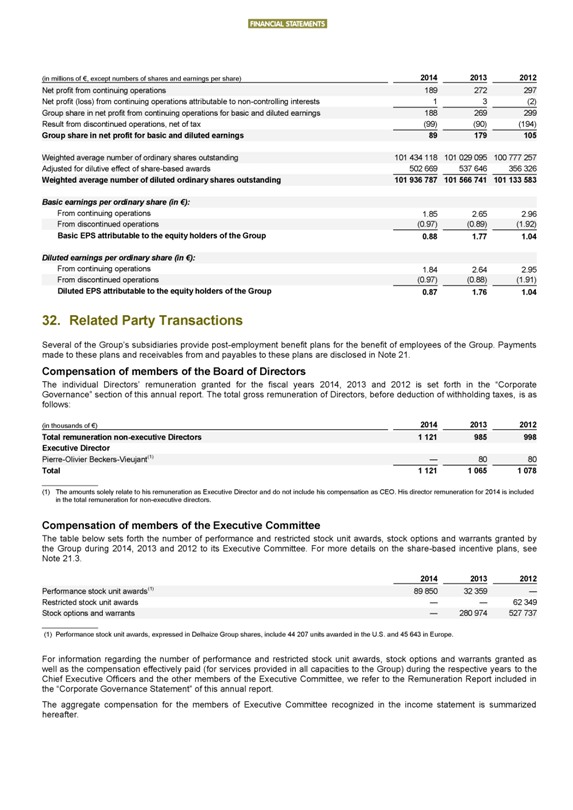
FINANCIAL STATEMENTS
| (in millions of €, except numbers of shares and earnings per share) | 2014 | 2013 | 2012 | |||
| Net profit from continuing operations | 189 | 272 | 297 | |||
| Net profit (loss) from continuing operations attributable to non-controlling interests | 1 | 3 | (2) | |||
| Group share in net profit from continuing operations for basic and diluted earnings | 188 | 269 | 299 | |||
| Result from discontinued operations, net of tax | (99) | (90) | (194) | |||
| Group share in net profit for basic and diluted earnings | 89 | 179 | 105 | |||
| Weighted average number of ordinary shares outstanding | 101 434 118 |
101 029 095 |
100 777 257 | |||
| Adjusted for dilutive effect of share-based awards | 502 669 |
537 646 |
356 326 | |||
| Weighted average number of diluted ordinary shares outstanding | 101 936 787 |
101 566 741 |
101 133 583 | |||
| Basic earnings per ordinary share (in €): | ||||||
| From continuing operations | 1.85 | 2.65 | 2.96 | |||
| From discontinued operations | (0.97) | (0.89) | (1.92) | |||
| Basic EPS attributable to the equity holders of the Group | 0.88 | 1.77 | 1.04 | |||
| Diluted earnings per ordinary share (in €): | ||||||
| From continuing operations | 1.84 | 2.64 | 2.95 | |||
| From discontinued operations | (0.97) | (0.88) | (1.91) | |||
| Diluted EPS attributable to the equity holders of the Group | 0.87 | 1.76 | 1.04 |
32. Related Party Transactions
Several of the
Group’s subsidiaries provide post-employment benefit plans for the benefit of employees of the Group. Payments made to these plans and receivables from and payables to these plans are disclosed in Note 21.
Compensation of members of the Board of Directors
The individual Directors’ remuneration
granted for the fiscal years 2014, 2013 and 2012 is set forth in the “Corporate Governance” section of this annual report. The total gross remuneration of Directors, before deduction of withholding taxes, is as follows:
| (in thousands of €) | 2014 | 2013 | 2012 | |||
| Total remuneration non-executive Directors | 1 121 |
985 | 998 | |||
| Executive Director | ||||||
| Pierre-Olivier Beckers-Vieujant(1) | — | 80 | 80 | |||
| Total | 1 121 |
1 065 |
1 078 |
(1) The amounts solely relate to his remuneration as Executive Director and do not include his compensation as CEO. His director
remuneration for 2014 is included in the total remuneration for non-executive directors.
Compensation of members of the Executive Committee
The table below sets forth the number of performance and restricted stock unit awards, stock options and warrants granted by the Group during 2014, 2013 and 2012 to its Executive
Committee. For more details on the share-based incentive plans, see Note 21.3.
| 2014 | 2013 | 2012 | ||||
| Performance stock unit awards(1) | 89 850 |
32 359 |
— | |||
| Restricted stock unit awards | — | — | 62 349 | |||
| Stock options and warrants | — | 280 974 |
527 737 |
(1) Performance stock unit awards, expressed in Delhaize Group shares, include 44 207 units awarded in the U.S. and 45 643 in Europe.
For information regarding the number of performance and restricted stock unit awards, stock options and warrants granted as well as the compensation effectively
paid (for services provided in all capacities to the Group) during the respective years to the Chief Executive Officers and the other members of the Executive Committee, we refer to the Remuneration Report included in the “Corporate Governance
Statement” of this annual report.
The aggregate compensation for the members of Executive Committee recognized in the income statement is summarized
hereafter.
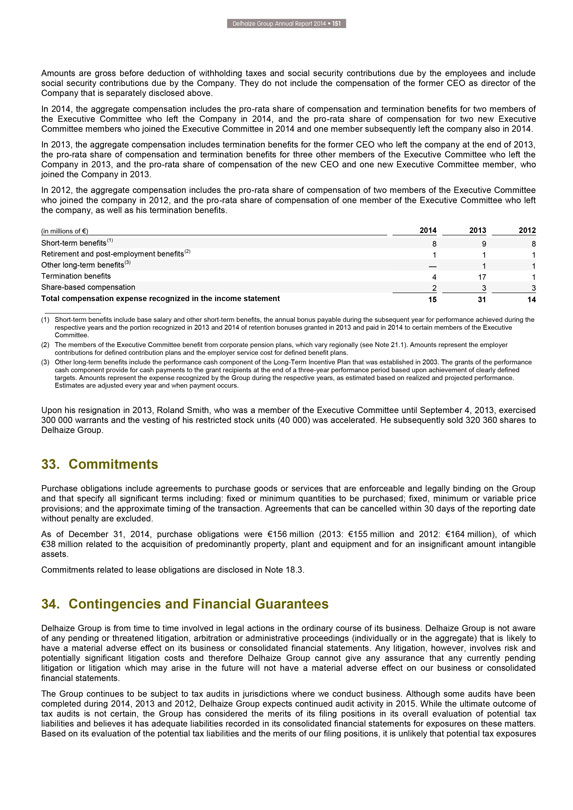
Delhaize Group Annual Report 2014 • 151
Amounts are gross before deduction of withholding taxes and social security contributions due by the employees and include social security contributions due by the
Company. They do not include the compensation of the former CEO as director of the Company that is separately disclosed above.
In 2014, the aggregate compensation
includes the pro-rata share of compensation and termination benefits for two members of the Executive Committee who left the Company in 2014, and the pro-rata share of compensation for two new Executive Committee members who joined the Executive
Committee in 2014 and one member subsequently left the company also in 2014.
In 2013, the aggregate compensation includes termination benefits for the former CEO
who left the company at the end of 2013, the pro-rata share of compensation and termination benefits for three other members of the Executive Committee who left the Company in 2013, and the pro-rata share of compensation of the new CEO and one new
Executive Committee member, who joined the Company in 2013.
In 2012, the aggregate compensation includes the pro-rata share of compensation of two members of the
Executive Committee who joined the company in 2012, and the pro-rata share of compensation of one member of the Executive Committee who left the company, as well as his termination benefits.
| (in millions of €) | 2014 | 2013 | 2012 | |||
| Short-term benefits(1) | 8 | 9 | 8 | |||
| Retirement and post-employment benefits(2) | 1 | 1 | 1 | |||
| Other long-term benefits(3) | — | 1 | 1 | |||
| Termination benefits | 4 | 17 | 1 | |||
| Share-based compensation | 2 | 3 | 3 | |||
| Total compensation expense recognized in the income statement | 15 | 31 | 14 |
(1) Short-term benefits include base salary and other short-term benefits, the annual bonus payable during the subsequent year for
performance achieved during the respective years and the portion recognized in 2013 and 2014 of retention bonuses granted in 2013 and paid in 2014 to certain members of the Executive Committee.
(2) The members of the Executive Committee benefit from corporate pension plans, which vary regionally (see Note 21.1). Amounts represent the employer contributions for defined
contribution plans and the employer service cost for defined benefit plans.
(3) Other long-term benefits include the performance cash component of the Long-Term
Incentive Plan that was established in 2003. The grants of the performance cash component provide for cash payments to the grant recipients at the end of a three-year performance period based upon achievement of clearly defined targets. Amounts
represent the expense recognized by the Group during the respective years, as estimated based on realized and projected performance. Estimates are adjusted every year and when payment occurs.
Upon his resignation in 2013, Roland Smith, who was a member of the Executive Committee until September 4, 2013, exercised 300 000 warrants and the vesting of his restricted
stock units (40 000) was accelerated. He subsequently sold 320 360 shares to Delhaize Group.
33. Commitments
Purchase obligations include agreements to purchase goods or services that are enforceable and legally binding on the Group and that specify all significant terms including: fixed
or minimum quantities to be purchased; fixed, minimum or variable price provisions; and the approximate timing of the transaction. Agreements that can be cancelled within 30 days of the reporting date without penalty are excluded.
As of December 31, 2014, purchase obligations were €156 million (2013: €155 million and 2012: €164 million), of which €38 million related to the acquisition of
predominantly property, plant and equipment and for an insignificant amount intangible assets.
Commitments related to lease obligations are disclosed in Note 18.3.
34. Contingencies and Financial Guarantees
Delhaize Group is from time to
time involved in legal actions in the ordinary course of its business. Delhaize Group is not aware of any pending or threatened litigation, arbitration or administrative proceedings (individually or in the aggregate) that is likely to have a
material adverse effect on its business or consolidated financial statements. Any litigation, however, involves risk and potentially significant litigation costs and therefore Delhaize Group cannot give any assurance that any currently pending
litigation or litigation which may arise in the future will not have a material adverse effect on our business or consolidated financial statements.
The Group
continues to be subject to tax audits in jurisdictions where we conduct business. Although some audits have been completed during 2014, 2013 and 2012, Delhaize Group expects continued audit activity in 2015. While the ultimate outcome of tax audits
is not certain, the Group has considered the merits of its filing positions in its overall evaluation of potential tax liabilities and believes it has adequate liabilities recorded in its consolidated financial statements for exposures on these
matters. Based on its evaluation of the potential tax liabilities and the merits of our filing positions, it is unlikely that potential tax exposures
FINANCIAL STATEMENTS
over and above the amounts
currently recorded as liabilities in its consolidated financial statements will be material to its financial condition or future results of operations.
Delhaize
Group is from time to time subject to investigations or inquiries by the competition authorities related to potential violations of competition laws in jurisdictions where we conduct business.
In this context, in 2007, representatives of the Belgian Competition Authority visited Delhaize Belgium’s procurement department in Zellik, Belgium, and requested the
provision of certain documents. This visit was part of a national investigation affecting several companies active in Belgium in the supply and retail sale of health and beauty products and other household goods. In 2012, the Auditor to the Belgian
Competition Authority issued its investigation report. The investigation involves 11 suppliers and 7 retailers, including Delhaize Belgium, alleging coordination of price increases for certain health and beauty products sold in Belgium from 2002 to
2007. In 2013, Delhaize Belgium and other retailers lodged an appeal against the decision of the Auditor to utilize certain documents seized during the visits to Zellik and other companies’ facilities. The decision of the Court of Appeal of
Brussels is pending. According to Belgian legislation, fines for competition law infringements are calculated on the revenues of the products affected by the
alleged infringement in the last full year of the alleged coordination activities, capped at 10% of the Group’s annual Belgian revenues in the year preceding the decision of the Competition Authority. There are many variables and uncertainties
associated with the application of the relevant legislation to the facts and circumstances of this investigation, regardless of the outcome of the procedural appeal pending before the Court of Appeal. A decision on the merits of the matter by the
Authority would likely not occur before the end of 2015, and, under current Belgian legislation, the parties have the right to appeal an adverse decision of the Authority in court. Consequently, the Group currently does not have sufficient
information available to make a reliable estimate of any possible financial impact or the timing thereof.
In a shareholders’ matter related to the
Group’s wholly-owned subsidiary in Greece, Delhaize Group was notified in 2011 that some former shareholders of Alfa Beta Vassilopoulos S.A., who together held 7% of Alfa Beta shares, have filed a claim in front of the Court of First Instance
of Athens challenging the price paid by the Group during the squeeze-out process that was approved by the Hellenic Capital Markets Commission. Delhaize Group believes that the squeeze-out transaction has been executed and completed in compliance
with all legal and regulatory requirements. Delhaize Group continues to assess the merits and any potential exposure of this claim and to vigorously defend itself. The first hearing took place in 2013 and the Court of First Instance of Athens
appointed a financial expert to assist the Court in assessing the value of the Alfa Beta shares when the squeeze-out was launched. A decision on the merits of the matter by the Court of First Instance of Athens is not expected to occur before 2016,
and the parties have the right to appeal an adverse decision of such Court.
Following the closing of Delhaize Group’s agreed sale of Sweetbay, Harveys and
Reid’s and the planned sale of Bottom Dollar Food, the Group provides guarantees for a number of existing operating or finance lease contracts, which extend through 2037. In the event of a future default of the buyer, Delhaize Group will be
obligated under the terms of the contract to the landlords. The schedule below provides the future minimum lease payments over the non-cancellable lease term of the guaranteed leases, excluding other direct costs such as common area maintenance
expenses and real estate taxes, as of December 31, 2014. Currently, the Group does not expect to be required to pay any amounts under these guarantees.
| (in millions of €) | 2015 | 2016 | 2017 | 2018 | 2019 | Thereafter | Total | |||||||
| Finance leases | ||||||||||||||
| Future minimum lease payments | 14 | 14 | 14 | 14 | 14 | 120 | 190 | |||||||
| Less amount representing interest | (10) | (10) | (10) | (9) | (9) | (47) | (95) | |||||||
| Present value of minimum lease payments | 4 | 4 | 4 | 5 | 5 | 73 | 95 | |||||||
| Operating leases | ||||||||||||||
| Future minimum lease payments (for non-cancellable leases) | 20 | 20 | 19 | 17 | 15 | 109 | 200 |
In addition, at December 31, 2014, Delhaize Group issued other financial guarantees for a total amount of €2 million.
35. Subsequent Events
In February 2015, Delhaize Group issued 266 852 new shares for a
consideration of €19 million to satisfy the exercise of warrants.
During the first quarter of 2015, Delhaize Group completed a tender offer for cash and
purchased (i) $278 million on the 6.50% bonds due 2017 at a price of 111.66% and (ii) $170 million on the 4.125% senior notes due 2019 at a price of 107.07%. During 2015, this transaction results in a one-time charge to profit and loss of
approximately €40 million. Existing hedge relationships relating to these notes, if any, were adjusted prospectively.
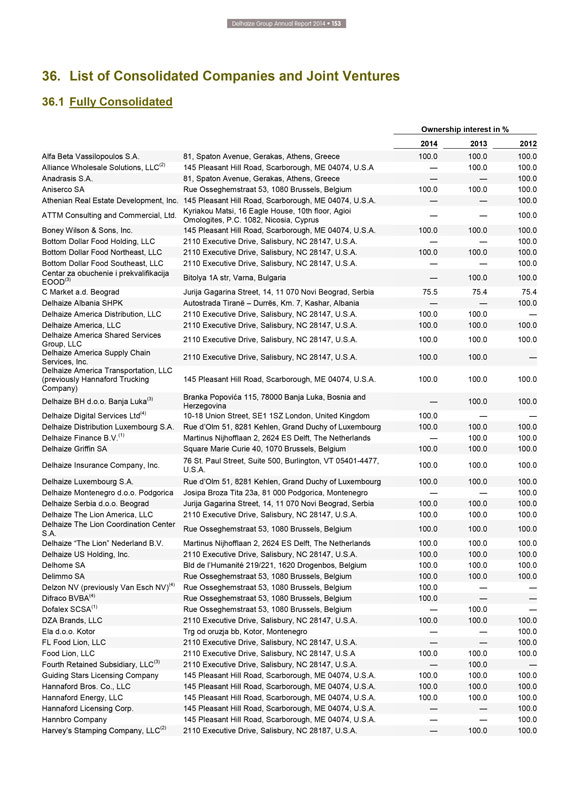
Delhaize Group Annual Report 2014 • 153
36.
List of Consolidated Companies and Joint Ventures
36.1 Fully Consolidated
Alfa Beta Vassilopoulos S.A.
Alliance Wholesale Solutions, LLC(2)
Anadrasis S.A.
Aniserco SA
Athenian Real Estate Development, Inc.
ATTM Consulting and Commercial, Ltd.
Boney Wilson & Sons, Inc.
Bottom Dollar Food Holding, LLC
Bottom Dollar Food Northeast, LLC
Bottom Dollar Food Southeast, LLC
Centar za obuchenie i prekvalifikacija
EOOD(3)
C Market a.d. Beograd
Delhaize Albania SHPK
Delhaize America Distribution, LLC
Delhaize America, LLC
Delhaize America Shared Services
Group, LLC
Delhaize America Supply Chain
Services, Inc.
Delhaize America Transportation, LLC
(previously Hannaford Trucking
Company)
Delhaize BH d.o.o. Banja Luka(3)
Delhaize Digital Services Ltd(4)
Delhaize Distribution Luxembourg S.A.
Delhaize Finance B.V.(1)
Delhaize Griffin SA
Delhaize Insurance Company, Inc.
Delhaize Luxembourg S.A.
Delhaize Montenegro d.o.o. Podgorica
Delhaize Serbia d.o.o. Beograd
Delhaize The Lion America, LLC
Delhaize The Lion Coordination Center
S.A.
Delhaize “The Lion” Nederland B.V.
Delhaize US Holding, Inc.
Delhome SA
Delimmo SA
Delzon NV (previously Van Esch NV)(4)
Difraco BVBA(4)
Dofalex SCSA(1)
DZA Brands, LLC
Ela d.o.o. Kotor
FL Food Lion, LLC
Food Lion, LLC
Fourth Retained Subsidiary, LLC(3)
Guiding Stars Licensing Company
Hannaford Bros. Co., LLC
Hannaford Energy, LLC
Hannaford Licensing Corp.
Hannbro Company
Harvey’s Stamping Company, LLC(2)
81, Spaton Avenue, Gerakas, Athens, Greece
145 Pleasant Hill Road, Scarborough, ME 04074, U.S.A
81, Spaton Avenue, Gerakas, Athens,
Greece
Rue Osseghemstraat 53, 1080 Brussels, Belgium
145 Pleasant Hill Road,
Scarborough, ME 04074, U.S.A.
Kyriakou Matsi, 16 Eagle House, 10th floor, Agioi
Omologites, P.C. 1082, Nicosia, Cyprus
145 Pleasant Hill Road, Scarborough,
ME 04074, U.S.A.
2110 Executive Drive, Salisbury, NC 28147, U.S.A.
2110
Executive Drive, Salisbury, NC 28147, U.S.A.
2110 Executive Drive, Salisbury, NC 28147, U.S.A.
Bitolya 1A str, Varna, Bulgaria
Jurija Gagarina Street, 14, 11 070 Novi Beograd, Serbia
Autostrada Tiranë – Durrës, Km. 7, Kashar, Albania
2110
Executive Drive, Salisbury, NC 28147, U.S.A.
2110 Executive Drive, Salisbury, NC 28147, U.S.A.
2110 Executive Drive, Salisbury, NC 28147, U.S.A.
2110 Executive Drive, Salisbury, NC 28147,
U.S.A.
145 Pleasant Hill Road, Scarborough, ME 04074, U.S.A.
Branka Popovica
115, 78000 Banja Luka, Bosnia and
Herzegovina
10-18 Union Street, SE1 1SZ
London, United Kingdom
Rue d’Olm 51, 8281 Kehlen, Grand Duchy of Luxembourg
Martinus Nijhofflaan 2, 2624 ES Delft, The Netherlands
Square Marie Curie 40, 1070 Brussels,
Belgium
76 St. Paul Street, Suite 500, Burlington, VT 05401-4477,
U.S.A.
Rue d’Olm 51, 8281 Kehlen, Grand Duchy of Luxembourg
Josipa Broza Tita
23a, 81 000 Podgorica, Montenegro
Jurija Gagarina Street, 14, 11 070 Novi Beograd, Serbia
2110 Executive Drive, Salisbury, NC 28147, U.S.A.
Rue Osseghemstraat 53, 1080 Brussels,
Belgium
Martinus Nijhofflaan 2, 2624 ES Delft, The Netherlands
2110 Executive
Drive, Salisbury, NC 28147, U.S.A.
Bld de l’Humanité 219/221, 1620 Drogenbos, Belgium
Rue Osseghemstraat 53, 1080 Brussels, Belgium
Rue Osseghemstraat 53, 1080 Brussels, Belgium
Rue Osseghemstraat 53, 1080 Brussels, Belgium
Rue Osseghemstraat 53, 1080
Brussels, Belgium
2110 Executive Drive, Salisbury, NC 28147, U.S.A.
Trg od
oruzja bb, Kotor, Montenegro
2110 Executive Drive, Salisbury, NC 28147, U.S.A.
2110 Executive Drive, Salisbury, NC 28147, U.S.A
2110 Executive Drive,
Salisbury, NC 28147, U.S.A.
145 Pleasant Hill Road, Scarborough, ME 04074, U.S.A.
145 Pleasant Hill Road, Scarborough, ME 04074, U.S.A.
145 Pleasant Hill Road, Scarborough, ME
04074, U.S.A.
145 Pleasant Hill Road, Scarborough, ME 04074, U.S.A.
145
Pleasant Hill Road, Scarborough, ME 04074, U.S.A.
2110 Executive Drive, Salisbury, NC 28187, U.S.A.
Ownership interest in %
2014 2013 2012
100.0 100.0 100.0
— 100.0 100.0
— — 100.0
100.0 100.0 100.0
— — 100.0
— — 100.0
100.0 100.0 100.0
— — 100.0
100.0 100.0 100.0
— — 100.0
— 100.0 100.0
75.5 75.4 75.4
— — 100.0
100.0 100.0 —
100.0 100.0 100.0
100.0 100.0 100.0
100.0 100.0 —
100.0 100.0 100.0
— 100.0 100.0
100.0 — —
100.0 100.0 100.0
— 100.0 100.0
100.0 100.0 100.0
100.0 100.0 100.0
100.0 100.0 100.0
— — 100.0
100.0 100.0 100.0
100.0 100.0 100.0
100.0 100.0 100.0
100.0 100.0 100.0
100.0 100.0 100.0
100.0 100.0 100.0
100.0 100.0 100.0
100.0 — —
100.0 — —
— 100.0 —
100.0 100.0 100.0
— — 100.0
— — 100.0
100.0 100.0 100.0
— 100.0 —
100.0 100.0 100.0
100.0 100.0 100.0
100.0 100.0 100.0
— — 100.0
— — 100.0
— 100.0 100.0
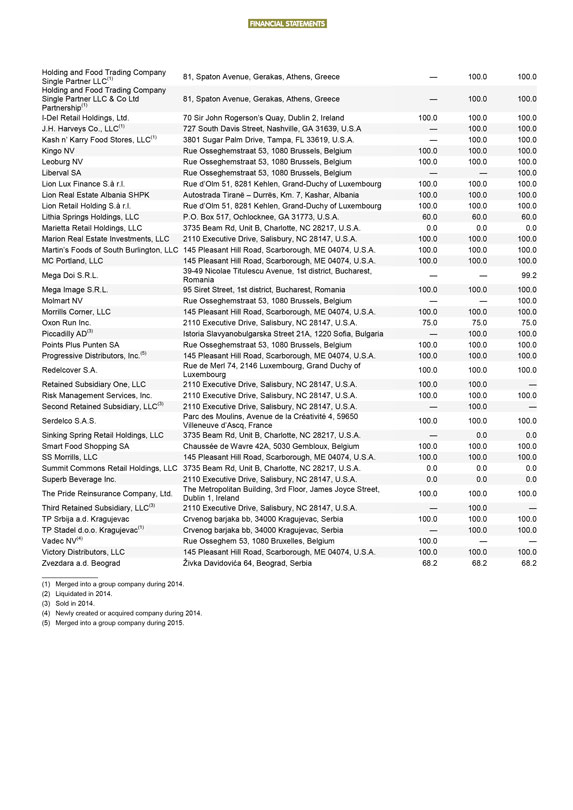
FINANCIAL STATEMENTS
Holding and Food Trading
Company
Single Partner LLC(1)
Holding and Food Trading Company
Single Partner LLC & Co Ltd
Partnership(1)
I-Del Retail Holdings, Ltd.
J.H. Harveys Co., LLC(1)
Kash n’ Karry Food Stores, LLC(1)
Kingo NV
Leoburg NV
Liberval SA
Lion Lux Finance S.à r.l.
Lion Real Estate Albania SHPK
Lion Retail Holding S.à r.l.
Lithia Springs Holdings, LLC
Marietta Retail Holdings, LLC
Marion Real Estate Investments, LLC
Martin’s Foods of South Burlington, LLC
MC Portland, LLC
Mega Doi S.R.L.
Mega Image S.R.L.
Molmart NV
Morrills Corner, LLC
Oxon Run Inc.
Piccadilly AD(3)
Points Plus Punten SA
Progressive Distributors, Inc.(5)
Redelcover S.A.
Retained Subsidiary One, LLC
Risk Management Services, Inc.
Second Retained Subsidiary, LLC(3)
Serdelco S.A.S.
Sinking Spring Retail Holdings, LLC
Smart Food Shopping SA
SS Morrills, LLC
Summit Commons Retail Holdings, LLC
Superb Beverage Inc.
The Pride Reinsurance Company, Ltd.
Third Retained Subsidiary, LLC(3)
TP Srbija a.d. Kragujevac
TP Stadel d.o.o. Kragujevac(1)
Vadec NV(4)
Victory Distributors, LLC
Zvezdara a.d. Beograd
81, Spaton Avenue, Gerakas, Athens, Greece
81, Spaton Avenue, Gerakas, Athens, Greece
70 Sir John Rogerson’s Quay, Dublin 2, Ireland
727 South Davis Street, Nashville, GA 31639, U.S.A
3801 Sugar Palm Drive,
Tampa, FL 33619, U.S.A.
Rue Osseghemstraat 53, 1080 Brussels, Belgium
Rue
Osseghemstraat 53, 1080 Brussels, Belgium
Rue Osseghemstraat 53, 1080 Brussels, Belgium
Rue d’Olm 51, 8281 Kehlen, Grand-Duchy of Luxembourg
Autostrada Tiranë –
Durrës, Km. 7, Kashar, Albania
Rue d’Olm 51, 8281 Kehlen, Grand-Duchy of Luxembourg
P.O. Box 517, Ochlocknee, GA 31773, U.S.A.
3735 Beam Rd, Unit B, Charlotte, NC 28217, U.S.A.
2110 Executive Drive, Salisbury, NC 28147, U.S.A.
145 Pleasant Hill Road,
Scarborough, ME 04074, U.S.A.
145 Pleasant Hill Road, Scarborough, ME 04074, U.S.A.
39-49 Nicolae Titulescu Avenue, 1st district, Bucharest,
Romania
95 Siret Street, 1st district, Bucharest, Romania
Rue Osseghemstraat 53, 1080 Brussels,
Belgium
145 Pleasant Hill Road, Scarborough, ME 04074, U.S.A.
2110 Executive
Drive, Salisbury, NC 28147, U.S.A.
Istoria Slavyanobulgarska Street 21A, 1220 Sofia, Bulgaria
Rue Osseghemstraat 53, 1080 Brussels, Belgium
145 Pleasant Hill Road, Scarborough, ME 04074,
U.S.A.
Rue de Merl 74, 2146 Luxembourg, Grand Duchy of
Luxembourg
2110 Executive Drive, Salisbury, NC 28147, U.S.A.
2110 Executive Drive, Salisbury, NC 28147,
U.S.A.
2110 Executive Drive, Salisbury, NC 28147, U.S.A.
Parc des Moulins,
Avenue de la Créativité 4, 59650
Villeneuve d’Ascq, France
3735 Beam Rd, Unit B, Charlotte, NC 28217, U.S.A.
Chaussée de Wavre
42A, 5030 Gembloux, Belgium
145 Pleasant Hill Road, Scarborough, ME 04074, U.S.A.
3735 Beam Rd, Unit B, Charlotte, NC 28217, U.S.A.
2110 Executive Drive, Salisbury, NC 28147,
U.S.A.
The Metropolitan Building, 3rd Floor, James Joyce Street,
Dublin 1,
Ireland
2110 Executive Drive, Salisbury, NC 28147, U.S.A.
Crvenog barjaka bb,
34000 Kragujevac, Serbia
Crvenog barjaka bb, 34000 Kragujevac, Serbia
Rue
Osseghem 53, 1080 Bruxelles, Belgium
145 Pleasant Hill Road, Scarborough, ME 04074, U.S.A.
Živka Davidovica 64, Beograd, Serbia
— 100.0 100.0
— 100.0 100.0
100.0 100.0 100.0
— 100.0 100.0
— 100.0 100.0
100.0 100.0 100.0
100.0 100.0 100.0
— — 100.0
100.0 100.0 100.0
100.0 100.0 100.0
100.0 100.0 100.0
60.0 60.0 60.0
0.0 0.0 0.0
100.0 100.0 100.0
100.0 100.0 100.0
100.0 100.0 100.0
— — 99.2
100.0 100.0 100.0
— — 100.0
100.0 100.0 100.0
75.0 75.0 75.0
— 100.0 100.0
100.0 100.0 100.0
100.0 100.0 100.0
100.0 100.0 100.0
100.0 100.0 —
100.0 100.0 100.0
— 100.0 —
100.0 100.0 100.0
— 0.0 0.0
100.0 100.0 100.0
100.0 100.0 100.0
0.0 0.0 0.0
0.0 0.0 0.0
100.0 100.0 100.0
— 100.0 —
100.0 100.0 100.0
— 100.0 100.0
100.0 — —
100.0 100.0 100.0
68.2 68.2 68.2
(1) Merged into a group company during 2014.
(2) Liquidated in 2014.
(3) Sold in 2014.
(4) Newly created or acquired company during 2014.
(5) Merged into a group company during 2015.
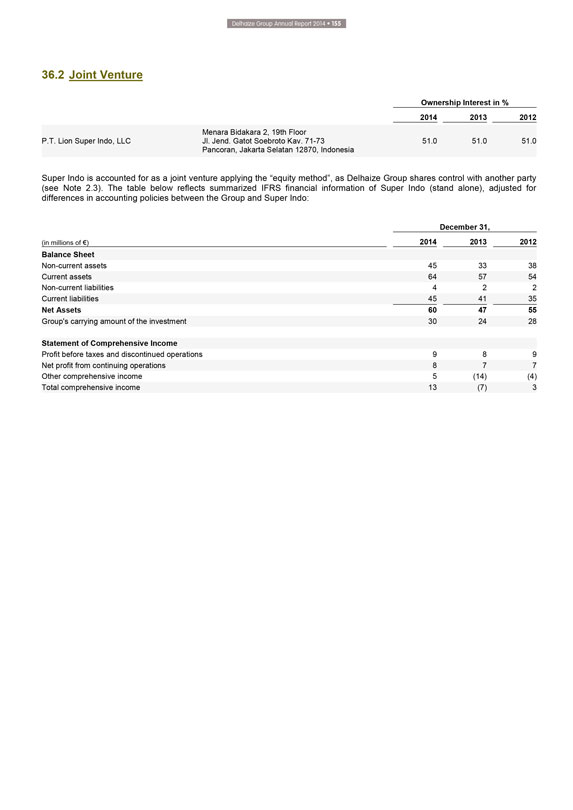
Delhaize Group Annual Report 2014 • 155
36.2
Joint Venture
Ownership Interest in %
2014 2013 2012
P.T. Lion Super Indo, LLC Menara Bidakara 2, 19th Floor Jl. Jend. Gatot Soebroto Kav. 71-73 Pancoran, Jakarta Selatan 12870, Indonesia 51.0 51.0 51.0
Super Indo is accounted for as a joint venture applying the “equity method”, as Delhaize Group shares control with another party
(see Note 2.3). The table below reflects summarized IFRS financial information of Super Indo (stand alone), adjusted for differences in accounting policies between the Group and
Super Indo:
December 31,
(in millions of €) 2014 2013 2012
Balance Sheet
Non-current assets 45 33 38
Current assets 64 57 54
Non-current liabilities 4 2 2
Current liabilities 45 41 35
Net Assets 60 47 55
Group’s carrying amount of the investment 30 24 28
Statement of Comprehensive Income
Profit before taxes and discontinued operations 9 8 9
Net profit from
continuing operations 8 7 7
Other comprehensive income 5 (14) (4)
Total
comprehensive income 13 (7) 3
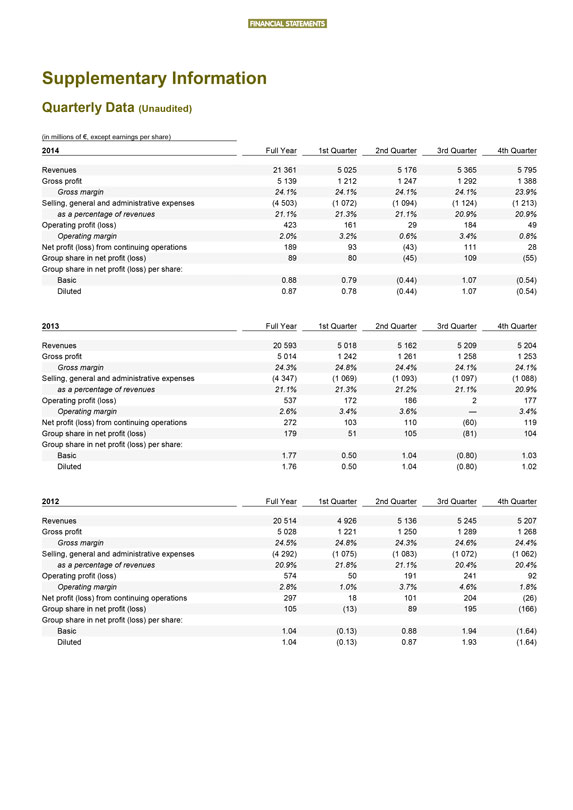
FINANCIAL STATEMENTS
Supplementary Information
Quarterly Data (Unaudited)
(in millions of €, except earnings per share)
2014 Full Year 1st Quarter 2nd Quarter 3rd Quarter 4th Quarter
Revenues 21
361 5 025 5 176 5 365 5 795
Gross profit 5 139 1 212 1 247 1 292 1 388
Gross
margin 24.1% 24.1% 24.1% 24.1% 23.9%
Selling, general and administrative expenses (4 503) (1 072) (1 094) (1 124) (1 213)
as a percentage of revenues 21.1% 21.3% 21.1% 20.9% 20.9%
Operating profit (loss) 423 161 29
184 49
Operating margin 2.0% 3.2% 0.6% 3.4% 0.8%
Net profit (loss) from
continuing operations 189 93 (43) 111 28
Group share in net profit (loss) 89 80 (45) 109 (55)
Group share in net profit (loss) per share:
Basic 0.88 0.79 (0.44) 1.07 (0.54)
Diluted 0.87 0.78 (0.44) 1.07 (0.54)
2013 Full Year 1st Quarter 2nd Quarter 3rd Quarter 4th
Quarter
Revenues 20 593 5 018 5 162 5 209 5 204
Gross profit 5 014 1 242 1
261 1 258 1 253
Gross margin 24.3% 24.8% 24.4% 24.1% 24.1%
Selling, general
and administrative expenses (4 347) (1 069) (1 093) (1 097) (1 088)
as a percentage of revenues 21.1% 21.3% 21.2% 21.1% 20.9%
Operating profit (loss) 537 172 186 2 177
Operating margin 2.6% 3.4% 3.6% — 3.4%
Net profit (loss) from continuing operations 272 103 110 (60) 119
Group share
in net profit (loss) 179 51 105 (81) 104
Group share in net profit (loss) per share:
Basic 1.77 0.50 1.04 (0.80) 1.03
Diluted 1.76 0.50 1.04 (0.80) 1.02
2012 Full Year 1st Quarter 2nd Quarter 3rd Quarter 4th Quarter
Revenues 20 514 4 926 5 136 5
245 5 207
Gross profit 5 028 1 221 1 250 1 289 1 268
Gross margin 24.5% 24.8%
24.3% 24.6% 24.4%
Selling, general and administrative expenses (4 292) (1 075) (1 083) (1 072) (1 062)
as a percentage of revenues 20.9% 21.8% 21.1% 20.4% 20.4%
Operating profit (loss) 574 50 191
241 92
Operating margin 2.8% 1.0% 3.7% 4.6% 1.8%
Net profit (loss) from
continuing operations 297 18 101 204 (26)
Group share in net profit (loss) 105 (13) 89 195 (166)
Group share in net profit (loss) per share:
Basic 1.04 (0.13) 0.88 1.94 (1.64)
Diluted 1.04 (0.13) 0.87 1.93 (1.64)
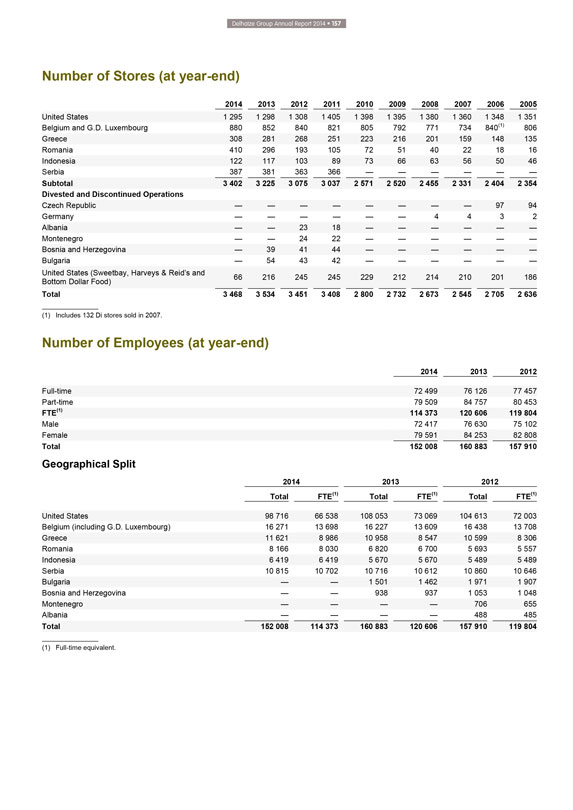
Delhaize Group Annual Report 2014 • 157
Number of Stores (at year-end)
2014 2013 2012 2011 2010 2009 2008 2007 2006
2005
United States 1 295 1 298 1 308 1 405 1 398 1 395 1 380 1 360 1 348 1 351
Belgium and G.D. Luxembourg 880 852 840 821 805 792 771 734 840(1) 806
Greece
308 281 268 251 223 216 201 159 148 135
Romania 410 296 193 105 72 51 40 22 18 16
Indonesia 122 117 103 89 73 66 63 56 50 46
Serbia 387 381 363 366 — — — —
— —
Subtotal 3 402 3 225 3 075 3 037 2 571 2 520 2 455 2 331 2 404 2 354
Divested and Discontinued Operations
Czech Republic — — — — — —
— — 97 94
Germany — — — — — — 4 4 3 2
Albania — — 23 18 — — — — — —
Montenegro — — 24 22 — — — — — —
Bosnia and Herzegovina — 39 41 44 — — — — — —
Bulgaria — 54 43 42 — — — — — —
United States (Sweetbay,
Harveys & Reid’s and 66 216 245 245 229 212 214 210 201 186
Bottom Dollar Food)
Total 3 468 3 534 3 451 3 408 2 800 2 732 2 673 2 545 2 705 2 636
(1) Includes 132 Di stores
sold in 2007.
Number of Employees (at year-end)
2014 2013 2012
Full-time 72 499 76 126 77 457
Part-time 79 509 84 757 80 453
FTE(1) 114 373 120 606 119 804
Male 72 417 76 630 75 102
Female 79 591 84 253 82 808
Total 152 008 160 883 157 910
Geographical Split
2014 2013 2012
Total FTE(1) Total FTE(1) Total FTE(1)
United States 98 716 66 538 108 053 73 069 104 613 72
003
Belgium (including G.D. Luxembourg) 16 271 13 698 16 227 13 609 16 438 13 708
Greece 11 621 8 986 10 958 8 547 10 599 8 306
Romania 8 166 8 030 6 820 6 700 5 693 5 557
Indonesia 6 419 6 419 5 670 5 670 5 489 5 489
Serbia 10 815 10 702 10 716 10
612 10 860 10 646
Bulgaria — — 1 501 1 462 1 971 1 907
Bosnia and
Herzegovina — — 938 937 1 053 1 048
Montenegro — — — — 706 655
Albania — — — — 488 485
Total 152 008 114 373 160 883 120 606 157 910 119
804
(1) Full-time equivalent.
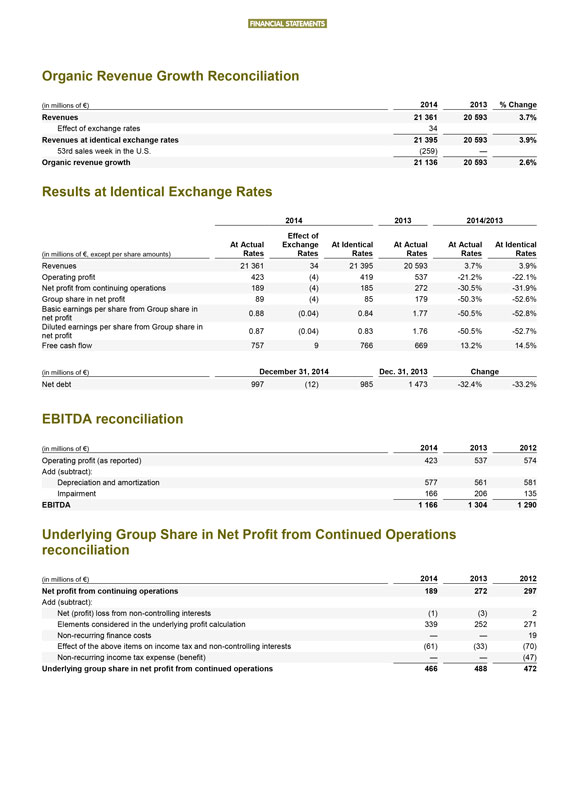
FINANCIAL STATEMENTS
Organic Revenue Growth
Reconciliation
(in millions of €) 2014 2013 % Change
Revenues 21 361 20
593 3.7%
Effect of exchange rates 34
Revenues at identical exchange rates 21
395 20 593 3.9%
53rd sales week in the U.S. (259) —
Organic revenue
growth 21 136 20 593 2.6%
Results at Identical Exchange Rates
2014 2013
2014/2013
(in millions of €, except per share amounts) At Actual Rates Effect of Exchange Rates At Identical Rates At Actual Rates At Actual Rates At
Identical Rates
Revenues 21 361 34 21 395 20 593 3.7% 3.9%
Operating profit
423 (4) 419 537 -21.2% -22.1%
Net profit from continuing operations 189 (4) 185 272 -30.5% -31.9%
Group share in net profit 89 (4) 85 179 -50.3% -52.6%
Basic earnings per share from Group
share in 0.88 (0.04) 0.84 1.77 -50.5% -52.8%
net profit
Diluted earnings per
share from Group share in 0.87 (0.04) 0.83 1.76 -50.5% -52.7%
net profit
Free
cash flow 757 9 766 669 13.2% 14.5%
(in millions of €) December 31, 2014 Dec. 31, 2013 Change
Net debt 997 (12) 985 1 473 -32.4% -33.2%
EBITDA reconciliation
(in millions of €) 2014 2013 2012
Operating profit (as reported) 423 537 574
Add (subtract):
Depreciation and amortization 577 561 581
Impairment 166 206 135
EBITDA 1 166 1 304 1 290
Underlying Group Share in Net Profit from Continued Operations reconciliation
(in millions of
€) 2014 2013 2012
Net profit from continuing operations 189 272 297
Add
(subtract):
Net (profit) loss from non-controlling interests (1) (3) 2
Elements considered in the underlying profit calculation 339 252 271
Non-recurring finance costs — — 19
Effect of the above items on
income tax and non-controlling interests (61) (33) (70)
Non-recurring income tax expense (benefit) — — (47)
Underlying group share in net profit from continued operations 466 488 472
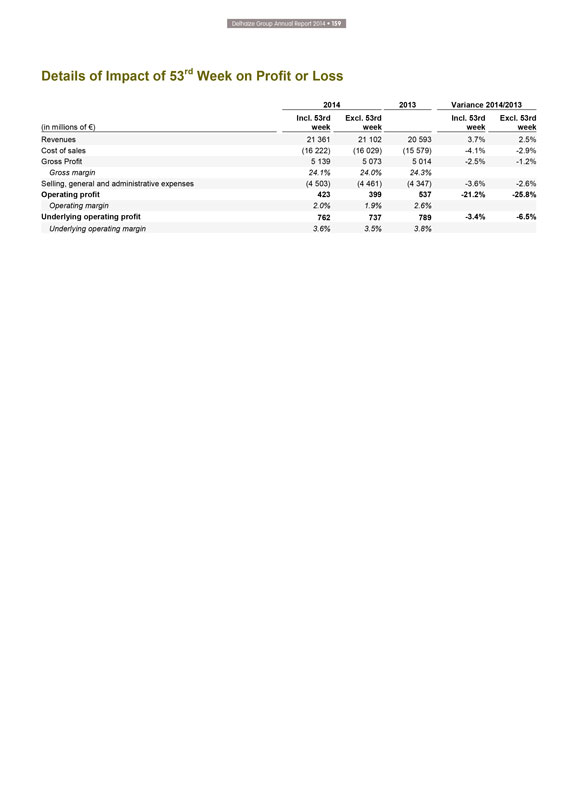
Delhaize Group Annual Report 2014 • 159
Details of Impact of 53rd Week on Profit or Loss
2014 2013 Variance 2014/2013
(in millions of €) Incl. 53rd week Excl. 53rd week Incl. 53rd week Excl. 53rd week
Revenues 21 361 21 102 20 593 3.7% 2.5%
Cost of sales (16 222) (16 029) (15 579) -4.1% -2.9%
Gross Profit 5 139 5 073 5 014 -2.5% -1.2%
Gross margin 24.1% 24.0% 24.3%
Selling, general and administrative expenses (4 503) (4 461) (4 347) -3.6% -2.6%
Operating profit 423 399 537 -21.2% -25.8%
Operating margin 2.0% 1.9% 2.6%
Underlying operating profit 762 737 789 -3.4% -6.5%
Underlying operating margin 3.6% 3.5% 3.8%
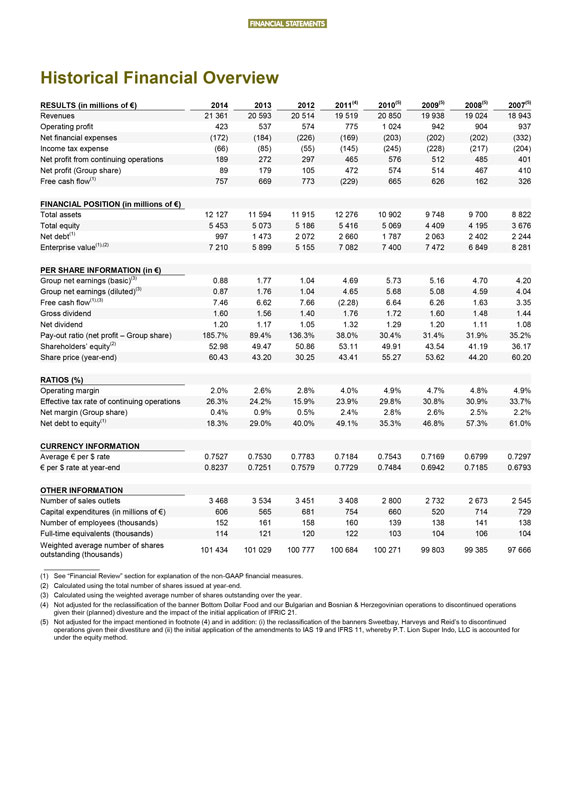
FINANCIAL STATEMENTS
Historical Financial Overview
RESULTS (in millions of €) 2014 2013 2012 2011(4) 2010(5) 2009(5) 2008(5) 2007(5)
Revenues 21 361 20 593 20 514 19 519 20 850 19 938 19 024 18 943
Operating profit 423 537 574
775 1 024 942 904 937
Net financial expenses (172) (184) (226) (169) (203) (202) (202) (332)
Income tax expense (66) (85) (55) (145) (245) (228) (217) (204)
Net profit from continuing
operations 189 272 297 465 576 512 485 401
Net profit (Group share) 89 179 105 472 574 514 467 410
Free cash flow(1) 757 669 773 (229) 665 626 162 326
FINANCIAL POSITION (in millions of €)
Total assets 12 127 11 594 11 915 12 276 10 902 9 748 9 700 8 822
Total
equity 5 453 5 073 5 186 5 416 5 069 4 409 4 195 3 676
Net debt(1) 997 1 473 2 072 2 660 1 787 2 063 2 402 2 244
Enterprise value(1),(2) 7 210 5 899 5 155 7 082 7 400 7 472 6 849 8 281
PER SHARE INFORMATION
(in €)
Group net earnings (basic)(3) 0.88 1.77 1.04 4.69 5.73 5.16 4.70 4.20
Group net earnings (diluted)(3) 0.87 1.76 1.04 4.65 5.68 5.08 4.59 4.04
Free cash flow(1),(3)
7.46 6.62 7.66 (2.28) 6.64 6.26 1.63 3.35
Gross dividend 1.60 1.56 1.40 1.76 1.72 1.60 1.48 1.44
Net dividend 1.20 1.17 1.05 1.32 1.29 1.20 1.11 1.08
Pay-out ratio (net profit – Group
share) 185.7% 89.4% 136.3% 38.0% 30.4% 31.4% 31.9% 35.2%
Shareholders’ equity(2) 52.98 49.47 50.86 53.11 49.91 43.54 41.19 36.17
Share price (year-end) 60.43 43.20 30.25 43.41 55.27 53.62 44.20 60.20
RATIOS (%)
Operating margin 2.0% 2.6% 2.8% 4.0% 4.9% 4.7% 4.8% 4.9%
Effective tax rate of continuing
operations 26.3% 24.2% 15.9% 23.9% 29.8% 30.8% 30.9% 33.7%
Net margin (Group share) 0.4% 0.9% 0.5% 2.4% 2.8% 2.6% 2.5% 2.2%
Net debt to equity(1) 18.3% 29.0% 40.0% 49.1% 35.3% 46.8% 57.3% 61.0%
CURRENCY INFORMATION
Average € per $ rate 0.7527 0.7530 0.7783 0.7184 0.7543 0.7169 0.6799 0.7297
€ per $ rate at year-end 0.8237 0.7251 0.7579 0.7729 0.7484 0.6942 0.7185 0.6793
OTHER
INFORMATION
Number of sales outlets 3 468 3 534 3 451 3 408 2 800 2 732 2 673 2 545
Capital expenditures (in millions of €) 606 565 681 754 660 520 714 729
Number of
employees (thousands) 152 161 158 160 139 138 141 138
Full-time equivalents (thousands) 114 121 120 122 103 104 106 104
Weighted average number of shares outstanding (thousands) 101 434 101 029 100 777 100 684 100 271 99 803 99 385 97 666
(1) See “Financial Review” section for explanation of the non-GAAP financial measures.
(2) Calculated using the total number of shares issued at year-end.
(3)
Calculated using the weighted average number of shares outstanding over the year.
(4) Not adjusted for the reclassification of the banner Bottom Dollar Food and
our Bulgarian and Bosnian & Herzegovinian operations to discontinued operations given their (planned) divesture and the impact of the initial application of IFRIC 21.
(5) Not adjusted for the impact mentioned in footnote (4) and in addition: (i) the reclassification of the banners Sweetbay, Harveys and Reid’s to discontinued
operations given their divestiture and (ii) the initial application of the amendments to IAS 19 and IFRS 11, whereby P.T. Lion Super Indo, LLC is accounted for under the equity method.
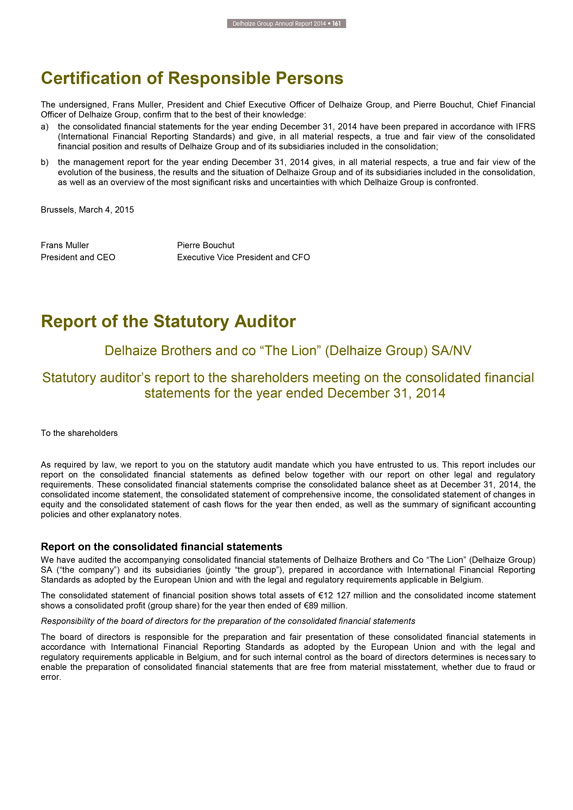
Delhaize Group Annual Report 2014 • 161
Certification of Responsible Persons
The undersigned, Frans Muller, President
and Chief Executive Officer of Delhaize Group, and Pierre Bouchut, Chief Financial Officer of Delhaize Group, confirm that to the best of their knowledge:
a) the
consolidated financial statements for the year ending December 31, 2014 have been prepared in accordance with IFRS (International Financial Reporting Standards) and give, in all material respects, a true and fair view of the consolidated
financial position and results of Delhaize Group and of its subsidiaries included in the consolidation;
b) the management report for the year ending
December 31, 2014 gives, in all material respects, a true and fair view of the evolution of the business, the results and the situation of Delhaize Group and of its subsidiaries included in the consolidation, as well as an overview of the most
significant risks and uncertainties with which Delhaize Group is confronted.
Brussels, March 4, 2015
Frans Muller Pierre Bouchut
President and CEO Executive Vice President and CFO
Report of the Statutory Auditor
Delhaize Brothers and co “The Lion” (Delhaize Group)
SA/NV
Statutory auditor’s report to the shareholders meeting on the consolidated financial statements for the year ended December 31, 2014
To the shareholders
As required by law, we report to you on the statutory audit mandate which
you have entrusted to us. This report includes our report on the consolidated financial statements as defined below together with our report on other legal and regulatory requirements. These consolidated financial statements comprise the
consolidated balance sheet as at December 31, 2014, the consolidated income statement, the consolidated statement of comprehensive income, the consolidated statement of changes in equity and the consolidated statement of cash flows for the year
then ended, as well as the summary of significant accounting policies and other explanatory notes.
Report on the consolidated financial statements
We have audited the accompanying consolidated financial statements of Delhaize Brothers and Co “The Lion” (Delhaize Group) SA (“the company”) and its
subsidiaries (jointly “the group”), prepared in accordance with International Financial Reporting
Standards as adopted by the European Union and with the
legal and regulatory requirements applicable in Belgium.
The consolidated statement of financial position shows total assets of €12 127 million and the
consolidated income statement shows a consolidated profit (group share) for the year then ended of €89 million.
Responsibility of the board of directors for
the preparation of the consolidated financial statements
The board of directors is responsible for the preparation and fair presentation of these consolidated
financial statements in accordance with International Financial Reporting Standards as adopted by the European Union and with the legal and regulatory requirements applicable in Belgium, and for such internal control as the board of directors
determines is necessary to enable the preparation of consolidated financial statements that are free from material misstatement, whether due to fraud or error.
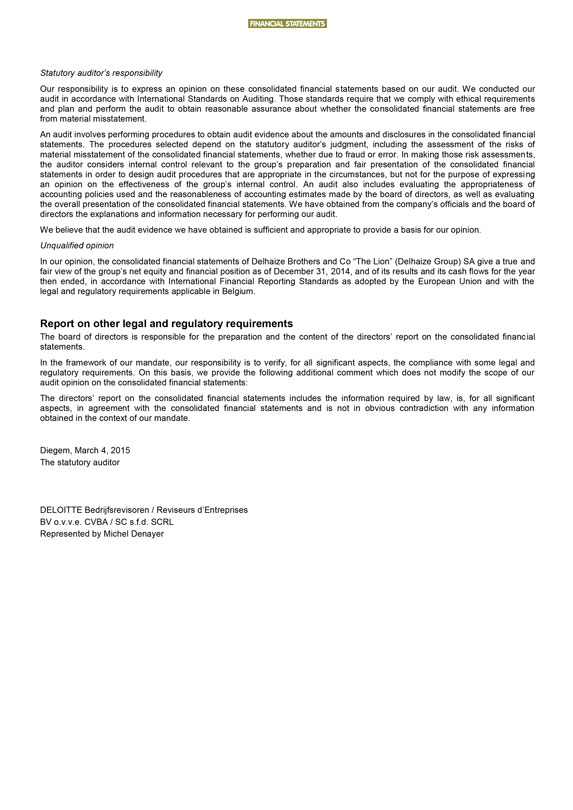
FINANCIAL STATEMENTS
Statutory auditor’s
responsibility
Our responsibility is to express an opinion on these consolidated financial statements based on our audit. We conducted our audit in accordance with
International Standards on Auditing. Those standards require that we comply with ethical requirements and plan and perform the audit to obtain reasonable assurance about whether the consolidated financial statements are free from material
misstatement.
An audit involves performing procedures to obtain audit evidence about the amounts and disclosures in the consolidated financial statements. The
procedures selected depend on the statutory auditor’s judgment, including the assessment of the risks of material misstatement of the consolidated financial statements, whether due to fraud or error. In making those risk assessments, the
auditor considers internal control relevant to the group’s preparation and fair presentation of the consolidated financial statements in order to design audit procedures that are appropriate in the circumstances, but not for the purpose of
expressing an opinion on the effectiveness of the group’s internal control. An audit also includes evaluating the appropriateness of accounting policies used and the reasonableness of accounting estimates made by the board of directors, as well
as evaluating the overall presentation of the consolidated financial statements. We have obtained from the company’s officials and the board of directors the explanations and information necessary for performing our audit.
We believe that the audit evidence we have obtained is sufficient and appropriate to provide a basis for our opinion.
Unqualified opinion
In our opinion, the consolidated financial statements of Delhaize Brothers
and Co “The Lion” (Delhaize Group) SA give a true and fair view of the group’s net equity and financial position as of December 31, 2014, and of its results and its cash flows for the year then ended, in accordance with
International Financial Reporting Standards as adopted by the European Union and with the legal and regulatory requirements applicable in Belgium.
Report on other
legal and regulatory requirements
The board of directors is responsible for the preparation and the content of the directors’ report on the consolidated
financial statements.
In the framework of our mandate, our responsibility is to verify, for all significant aspects, the compliance with some legal and regulatory
requirements. On this basis, we provide the following additional comment which does not modify the scope of our audit opinion on the consolidated financial statements:
The directors’ report on the consolidated financial statements includes the information required by law, is, for all significant aspects, in agreement with the consolidated
financial statements and is not in obvious contradiction with any information obtained in the context of our mandate.
Diegem, March 4, 2015 The statutory
auditor
DELOITTE Bedrijfsrevisoren / Reviseurs d’Entreprises
BV o.v.v.e.
CVBA / SC s.f.d. SCRL Represented by Michel Denayer
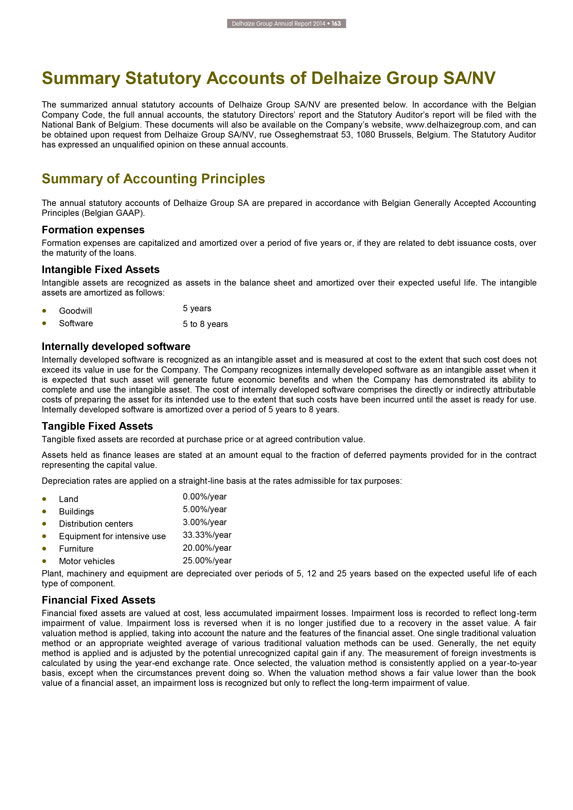
Delhaize Group Annual Report 2014 • 163
Summary Statutory Accounts of Delhaize Group SA/NV
The summarized annual
statutory accounts of Delhaize Group SA/NV are presented below. In accordance with the Belgian
Company Code, the full annual accounts, the statutory
Directors’ report and the Statutory Auditor’s report will be filed with the National Bank of Belgium. These documents will also be available on the Company’s website, www.delhaizegroup.com, and can be obtained upon request from
Delhaize Group SA/NV, rue Osseghemstraat 53, 1080 Brussels, Belgium. The Statutory Auditor has expressed an unqualified opinion on these annual accounts.
Summary
of Accounting Principles
The annual statutory accounts of Delhaize Group SA are prepared in accordance with Belgian Generally Accepted Accounting Principles
(Belgian GAAP).
Formation expenses
Formation expenses are capitalized and
amortized over a period of five years or, if they are related to debt issuance costs, over the maturity of the loans.
Intangible Fixed Assets
Intangible assets are recognized as assets in the balance sheet and amortized over their expected useful life. The intangible assets are amortized as follows:
Goodwill 5 years
Software 5 to 8 years
Internally developed software
Internally developed software is recognized as an intangible
asset and is measured at cost to the extent that such cost does not exceed its value in use for the Company. The Company recognizes internally developed software as an intangible asset when it is expected that such asset will generate future
economic benefits and when the Company has demonstrated its ability to complete and use the intangible asset. The cost of internally developed software comprises the directly or indirectly attributable costs of preparing the asset for its intended
use to the extent that such costs have been incurred until the asset is ready for use. Internally developed software is amortized over a period of 5 years to 8 years.
Tangible Fixed Assets
Tangible fixed assets are recorded at purchase price or at agreed
contribution value.
Assets held as finance leases are stated at an amount equal to the fraction of deferred payments provided for in the contract representing the
capital value.
Depreciation rates are applied on a straight-line basis at the rates admissible for tax purposes:
Land
0.00%/year
Buildings
5.00%/year
Distribution centers
3.00%/year
Equipment for intensive use
33.33%/year
Furniture
20.00%/year
Motor vehicles
25.00%/year
Plant, machinery and equipment are depreciated over periods of 5, 12 and 25 years based on the expected useful life of each type of component.
Financial Fixed Assets
Financial fixed assets are valued at cost, less accumulated impairment
losses. Impairment loss is recorded to reflect long-term impairment of value. Impairment loss is reversed when it is no longer justified due to a recovery in the asset value. A fair valuation method is applied, taking into account the nature and the
features of the financial asset. One single traditional valuation method or an appropriate weighted average of various traditional valuation methods can be used. Generally, the net equity method is applied and is adjusted by the potential
unrecognized capital gain if any. The measurement of foreign investments is calculated by using the year-end exchange rate. Once selected, the valuation method is consistently applied on a year-to-year basis, except when the circumstances prevent
doing so. When the valuation method shows a fair value lower than the book value of a financial asset, an impairment loss is recognized but only to reflect the long-term impairment of value.
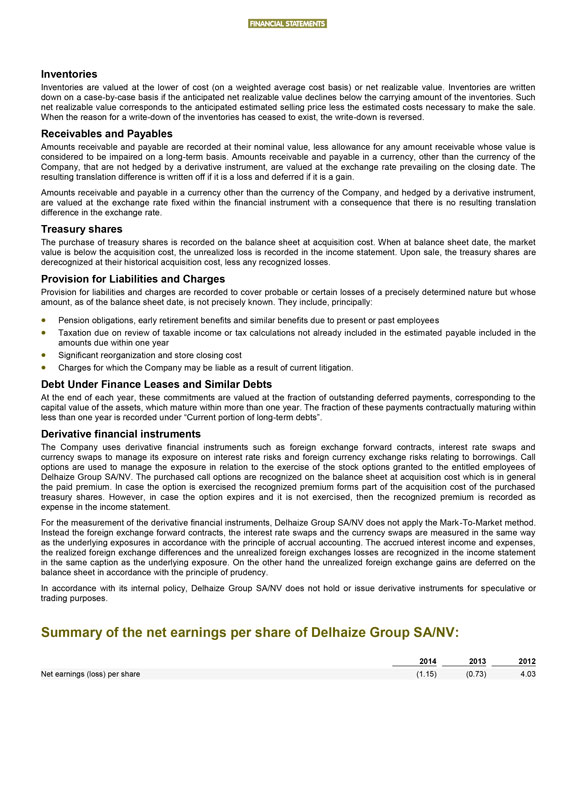
FINANCIAL STATEMENTS
Inventories
Inventories are valued at the lower of cost (on a weighted average cost basis) or net realizable value. Inventories are written down on a case-by-case basis if the anticipated net
realizable value declines below the carrying amount of the inventories. Such net realizable value corresponds to the anticipated estimated selling price less the estimated costs necessary to make the sale. When the reason for a write-down of the
inventories has ceased to exist, the write-down is reversed.
Receivables and Payables
Amounts receivable and payable are recorded at their nominal value, less allowance for any amount receivable whose value is considered to be impaired on a long-term basis. Amounts
receivable and payable in a currency, other than the currency of the Company, that are not hedged by a derivative instrument, are valued at the exchange rate prevailing on the closing date. The resulting translation difference is written off if it
is a loss and deferred if it is a gain.
Amounts receivable and payable in a currency other than the currency of the Company, and hedged by a derivative instrument,
are valued at the exchange rate fixed within the financial instrument with a consequence that there is no resulting translation difference in the exchange rate.
Treasury shares
The purchase of treasury shares is recorded on the balance
sheet at acquisition cost. When at balance sheet date, the market value is below the acquisition cost, the unrealized loss is recorded in the income statement. Upon sale, the treasury shares are derecognized at their historical acquisition cost,
less any recognized losses.
Provision for Liabilities and Charges
Provision
for liabilities and charges are recorded to cover probable or certain losses of a precisely determined nature but whose amount, as of the balance sheet date, is not precisely known. They include, principally:
Pension obligations, early retirement benefits and similar benefits due to present or past employees
Taxation due on review of taxable income or tax calculations not already included in the estimated payable included in the amounts due within one year
Significant reorganization and store closing cost
Charges for which the Company may be liable
as a result of current litigation.
Debt Under Finance Leases and Similar Debts
At the end of each year, these commitments are valued at the fraction of outstanding deferred payments, corresponding to the capital value of the assets, which
mature within more than one year. The fraction of these payments contractually maturing within less than one year is recorded under “Current portion of long-term debts”.
Derivative financial instruments
The Company uses derivative financial instruments such as
foreign exchange forward contracts, interest rate swaps and currency swaps to manage its exposure on interest rate risks and foreign currency exchange risks relating to borrowings. Call options are used to manage the exposure in relation to the
exercise of the stock options granted to the entitled employees of Delhaize Group SA/NV. The purchased call options are recognized on the balance sheet at acquisition cost which is in general the paid premium. In case the option is exercised the
recognized premium forms part of the acquisition cost of the purchased treasury shares. However, in case the option expires and it is not exercised, then the recognized premium is recorded as expense in the income statement.
For the measurement of the derivative financial instruments, Delhaize Group SA/NV does not apply the Mark-To-Market method. Instead the foreign exchange forward contracts, the
interest rate swaps and the currency swaps are measured in the same way as the underlying exposures in accordance with the principle of accrual accounting. The accrued interest income and expenses, the realized foreign exchange differences and the
unrealized foreign exchanges losses are recognized in the income statement in the same caption as the underlying exposure. On the other hand the unrealized foreign exchange gains are deferred on the balance sheet in accordance with the principle of
prudency.
In accordance with its internal policy, Delhaize Group SA/NV does not hold or issue derivative instruments for speculative or trading purposes.
Summary of the net earnings per share of Delhaize Group SA/NV:
2014 2013 2012
Net earnings (loss) per share (1.15) (0.73) 4.03
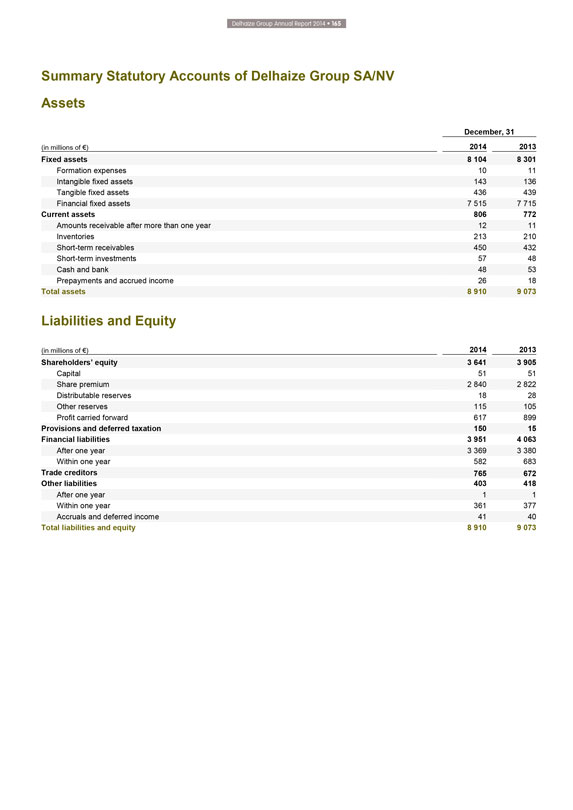
Delhaize Group Annual Report 2014 • 165
Summary Statutory Accounts of Delhaize Group SA/NV Assets
December, 31
(in millions of €) 2014 2013
Fixed assets 8 104 8 301
Formation expenses 10 11
Intangible fixed assets 143 136
Tangible fixed assets 436 439
Financial fixed assets 7 515 7 715
Current assets 806 772
Amounts receivable after more than one year 12 11
Inventories 213 210
Short-term receivables 450 432
Short-term investments 57 48
Cash and bank 48 53
Prepayments and accrued income 26 18
Total assets 8 910 9 073
Liabilities and Equity
(in millions of €) 2014 2013
Shareholders’ equity 3 641 3 905
Capital 51 51
Share premium 2 840 2 822
Distributable reserves 18 28
Other reserves 115 105
Profit carried forward 617 899
Provisions and deferred taxation 150 15
Financial liabilities 3 951 4 063
After one year 3 369 3 380
Within one year 582 683
Trade creditors 765 672
Other liabilities 403 418
After one year 1 1
Within one year 361 377
Accruals and deferred income 41 40
Total liabilities and equity 8 910 9 073
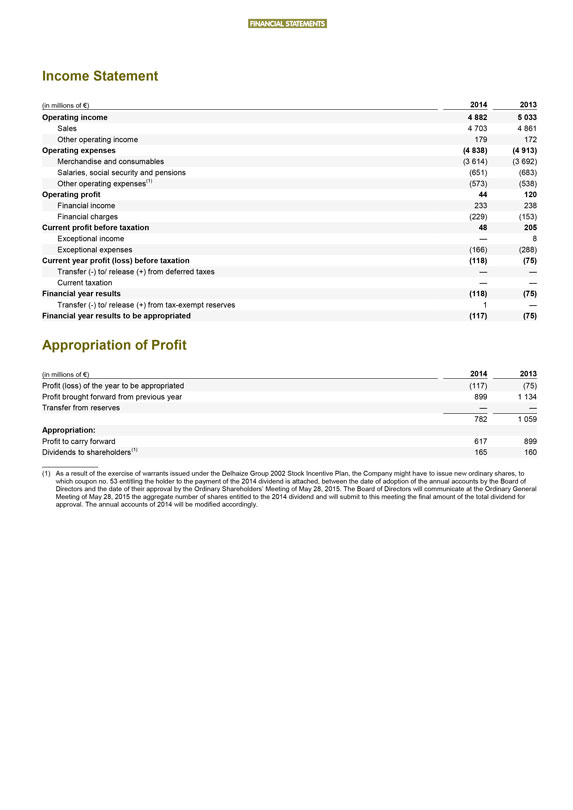
FINANCIAL STATEMENTS
Income Statement
(in millions of €) 2014 2013
Operating income 4 882 5 033
Sales 4 703 4 861
Other operating income 179 172
Operating expenses (4 838) (4 913)
Merchandise and consumables (3 614) (3 692)
Salaries, social security and pensions (651) (683)
Other operating expenses(1) (573) (538)
Operating profit 44 120
Financial income 233 238
Financial charges (229) (153)
Current profit before taxation 48 205
Exceptional income — 8
Exceptional expenses (166) (288)
Current year profit (loss) before taxation (118) (75)
Transfer (-) to/ release (+) from
deferred taxes — —
Current taxation — —
Financial year
results (118) (75)
Transfer (-) to/ release (+) from tax-exempt reserves 1 —
Financial year results to be appropriated (117) (75)
Appropriation of Profit
(in millions of €) 2014 2013
Profit (loss) of the year to be appropriated (117) (75)
Profit brought forward from previous year 899 1 134
Transfer from reserves
— —
782 1 059
Appropriation:
Profit to carry forward 617 899
Dividends to shareholders(1) 165 160
(1) As a result of the exercise of warrants issued under the Delhaize Group 2002 Stock Incentive Plan, the Company might have to issue new ordinary shares, to which coupon no. 53
entitling the holder to the payment of the 2014 dividend is attached, between the date of adoption of the annual accounts by the Board of Directors and the date of their approval by the Ordinary Shareholders’ Meeting of May 28, 2015. The
Board of Directors will communicate at the Ordinary General Meeting of May 28, 2015 the aggregate number of shares entitled to the 2014 dividend and will submit to this meeting the final amount of the total dividend for approval. The annual
accounts of 2014 will be modified accordingly.
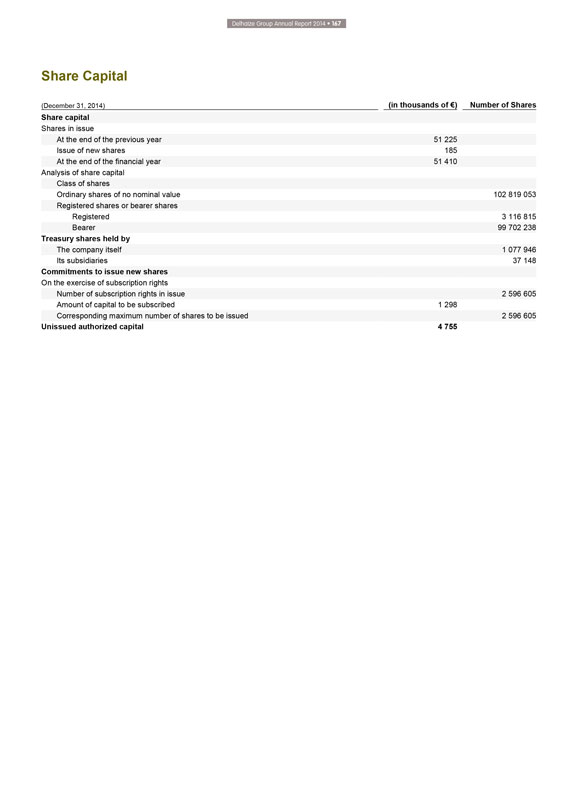
Delhaize Group Annual Report 2014 • 167
Share
Capital
(December 31, 2014) (in thousands of €) Number of Shares
Share
capital
Shares in issue
At the end of the previous year 51 225
Issue of new shares 185
At the end of the financial year 51 410
Analysis of share capital
Class of shares
Ordinary shares of no nominal value 102 819 053
Registered shares or bearer shares
Registered 3 116 815
Bearer 99 702 238
Treasury shares held by
The company itself 1 077 946
Its subsidiaries 37 148
Commitments to issue new shares
On the exercise of subscription rights
Number of subscription rights in issue 2 596 605
Amount of capital to be subscribed 1 298
Corresponding maximum number of
shares to be issued 2 596 605
Unissued authorized capital 4 755
GLOSSARY
GLOSSARY
Affiliated store
A store operated by an independent retailer to whom Delhaize Group sells its
products at wholesale prices and who benefits from the trade name and knowhow of Delhaize Group.
American Depositary Receipt (ADR)
An American Depositary Receipt evidences an American Depositary Share (ADS).
American
Depositary Share (ADS)
An American Depositary Share represents ownership in the common shares of a non-U.S. corporation. The underlying common shares are held by a
U.S. bank as depositary agent. The holder of an ADS benefits from dividend and voting rights pertaining to the underlying common share through the bank that issued the ADS. Four Delhaize ADSs represent one share of Delhaize Group common stock and
are traded on the New York Stock Exchange.
Average shareholders’ equity
Shareholders’ equity at the beginning of the year plus shareholders’ equity at the end of the year, divided by two.
Basic earnings per share
Profit or loss attributable to ordinary equity holders of the parent
entity divided by the weighted average number of ordinary shares outstanding during the period. Basic earnings per share are calculated on profit from continuing operations less minority interests attributable to continuing operations, and on the
Group share in net profit.
Company-operated store
A store operated directly
by Delhaize Group.
Comparable store sales
Sales from the same stores,
including relocations and expansions, and adjusted for calendar effects.
Cost of sales
Cost of sales includes purchases of products sold and all costs associated with getting the products into the retail stores, including buying, warehousing and transportation costs.
Finally, Cost of Sales includes appropriate vendor allowances.
Delhaize Belgium
Delhaize Belgium is not a separate legal entity. In the consolidated financial statements, any reference to “Delhaize Belgium” is a reference to the
consolidation of the statutory accounts of the Belgian companies, of which the major ones are Delhaize Group SA, Delimmo SA, Del-home SA, Aniserco SA, Points Plus Punten SA and Smart Food Shopping SA (see Note 36 to the Financial Statements),
excluding corporate expenses. In the remainder of the document, “Delhaize Belgium” refers to the operations of Delhaize Group in Belgium and the Grand-Duchy of Luxembourg.
Diluted earnings per share
Calculated by adjusting the profit or loss attributable to ordinary
equity shareholders and the weighted average number of shares outstanding for the effects of all dilutive potential ordinary shares, including those related to convertible instruments, options or warrants or shares issued upon the satisfaction of
specified conditions. Diluted earnings per share are calculated on profit from continuing operations less minority interests attributable to continuing operations, and on the Group share in net profit.
Direct goods
Goods sold to customers.
EBITDA
Operating profit plus depreciation, amortization and impairment.
Enterprise value
Market capitalization plus net debt.
Free cash flow
Cash flow before financing activities, investment in debt securities and term
deposits and sale and maturity of debt securities and term deposits.
Global warming potential
Global warming potential is an index that attempts to integrate the overall climate impacts of a specific action (e.g., emissions of CH4, NOx or aerosols). It relates the impact of
emissions of a gas to that of emission of an equivalent mass of CO2 . For example, if methane has a global warming potential of 21, it means that 1 kg of methane has the same impact on climate change as 21 kg of carbon dioxide.
Gross margin
Gross profit divided by revenues.
Gross profit
Revenues minus cost of sales.
Indirect goods
Goods necessary to operate the business, but which are not sold to customers,
such as office and store equipment.
Net debt
Non-current financial
liabilities, plus current financial liabilities and derivatives liabilities, minus derivative assets, investments in securities and term deposits, and cash and cash equivalents.
Net debt to equity ratio
Net debt divided by total equity.
Net financial expenses
Finance costs less income from investments.
Net margin
Net profit attributed to equity holders of the Group divided by revenues.
Operating leases
A lease that does not qualify as a finance lease and
therefore is not recorded on the balance sheet. Operating lease costs are classified in rent expense in cost of sales and in selling, general and administrative expenses.
Operating margin
Operating profit divided by revenues.
Organic revenue growth
Sales growth excluding sales from acquisitions and divestitures, and
from the 53rd week in the U.S., if any, at identical currency exchange rates.
Delhaize Group Annual Report 2014 • 169
Other
operating expenses
Primarily store closing expenses, impairment losses, reorganization expenses, and losses on the sale of fixed assets.
Other operating income
Primarily rental income on investment property, gains on sale of fixed
assets, recycling income and services rendered to wholesale customers.
Outstanding shares
The number of shares issued by the Company, excluding treasury shares.
Pay-out ratio (net
earnings)
Proposed dividends on current year earnings divided by current year Group share in net profit.
Return on equity
Group share in net result divided by average shareholders’ equity.
Revenues
Revenues include the sale of goods and point of sale services to
customers, including wholesale and affiliated customers, relating to the normal activity of the Company (the sale of groceries and pet products), net of discounts, allowances and rebates granted to those customers.
Selling, general and administrative expenses
Selling, general and administrative expenses
include store operating expenses, costs incurred for activities which serve securing sales, administrative and advertising expenses.
SKU
Stock Keeping Unit.
Total debt
Long-term financial liabilities, including current portion and obligations under finance leases, plus short-term financial liabilities net of derivative instruments related to
financial liabilities.
Treasury shares
Shares repurchased by one of the
Group’s legal entities and that are not cancelled as of year-end date. Treasury shares are excluded from the number of shares outstanding and excluded from the calculation of the weighted average number of shares for the purpose of calculating
earnings per share.
Underlying EBITDA
Underlying operating profit plus
depreciation and amortization less any depreciation or amortization that has been excluded from underlying operating profit.
Underlying Group share in net profit
from continued operations
Net profit from continuing operations minus non-controlling interests (from continuing operations) and excluding (i) the elements
excluded from operating profit to determine underlying operating profit (see separate definition), (ii) material non-recurring finance costs (e.g. debt refinancing costs) and income tax expense (e.g. tax settlements), and (iii) the
potential effect of all these items on income tax and non-controlling interests.
Underlying operating profit
Operating profit (as reported) excluding fixed assets impairment charges, restructuring charges, store closing expenses, gains/losses on disposal of fixed assets and other items
that management considers as not being representative of the Group’s operating performance of the period.
Weighted average number of shares outstanding
Number of shares outstanding at the beginning of the period less treasury shares, adjusted by the number of shares cancelled, repurchased or issued during the
period multiplied by a time-weighting factor.
Withholding tax
Withholding by
a corporation or financial institution of a certain percentage of dividend payments due to tax legislation.
Number of stores Location Surface Number of products
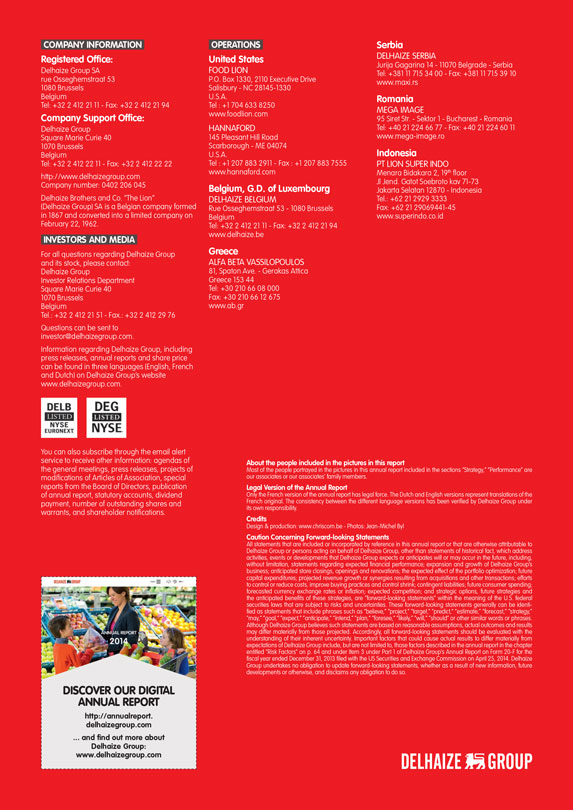
COMPANY INFORMATION
Registered Office:
Delhaize Group SA rue Osseghemstraat 53 1080 Brussels Belgium
Tel: +32 2 412 21 11 - Fax: +32
2 412 21 94
Company Support Office:
Delhaize Group Square Marie Curie 40 1070
Brussels Belgium
Tel: +32 2 412 22 11 - Fax: +32 2 412 22 22 http://www.delhaizegroup.com Company number: 0402 206 045 Delhaize Brothers and Co. “The
Lion”
(Delhaize Group) SA is a Belgian company formed in 1867 and converted into a limited company on February 22, 1962.
INVESTORS AND MEDIA
For all questions regarding Delhaize Group and its stock, please contact:
Delhaize Group Investor Relations Department Square Marie Curie 40 1070 Brussels Belgium Tel.: +32 2 412 21 51 - Fax.: +32 2 412 29 76 Questions can be sent to [email protected].
Information regarding Delhaize Group, including press releases, annual reports and share price can be found in three languages (English, French and Dutch) on Delhaize Group’s
website www.delhaizegroup.com.
OPERATIONS
United States
FOOD LION
P.O. Box 1330, 2110 Executive Drive Salisbury - NC 28145-1330 U.S.A.
Tel : +1 704 633 8250 www.foodlion.com
HANNAFORD
145 Pleasant Hill Road Scarborough - ME 04074 U.S.A.
Tel : +1 207 883 2911 - Fax : +1 207 883
7555 www.hannaford.com
Belgium, G.D. of Luxembourg
DELHAIZE BELGIUM
Rue Osseghemstraat 53 - 1080 Brussels Belgium Tel: +32 2 412 21 11 - Fax: +32 2 412 21 94 www.delhaize.be
Greece
ALFA BETA VASSILOPOULOS
81, Spaton Ave. - Gerakas Attica Greece 153 44 Tel: +30 210 66 08 000 Fax: +30 210 66 12 675 www.ab.gr
Serbia
DELHAIZE SERBIA
Jurija Gagarina 14 - 11070 Belgrade - Serbia Tel: +381 11 715 34 00 - Fax: +381 11 715 39 10 www.maxi.rs
Romania
MEGA IMAGE
95 Siret Str. - Sektor 1 - Bucharest - Romania Tel: +40 21 224 66 77 - Fax: +40 21 224 60 11 www.mega-image.ro
Indonesia
PT LION SUPER INDO
Menara Bidakara 2, 19th floor Jl Jend. Gatot Soebroto kav 71-73 Jakarta Selatan 12870 - Indonesia Tel.: +62 21 2929 3333 Fax: +62 21 29069441-45 www.superindo.co.id
You can also subscribe through the email alert service to receive other information: agendas of the general meetings, press releases, projects of modifications of Articles of
Association, special reports from the Board of Directors, publication of annual report, statutory accounts, dividend payment, number of outstanding shares and warrants, and shareholder notifications.
About the people included in the pictures in this report
Most of the people portrayed in the
pictures in this annual report included in the sections “Strategy,” “Performance” are our associates or our associates’ family members.
Legal Version of the Annual Report
Only the French version of the annual
report has legal force. The Dutch and English versions represent translations of the French original. The consistency between the different language versions has been verified by Delhaize Group under its own responsibility.
Credits
Design & production: www.chriscom.be - Photos: Jean-Michel Byl
Caution Concerning Forward-looking Statements
All statements that are included or incorporated
by reference in this annual report or that are otherwise attributable to Delhaize Group or persons acting on behalf of Delhaize Group, other than statements of historical fact, which address activities, events or developments that Delhaize Group
expects or anticipates will or may occur in the future, including, without limitation, statements regarding expected financial performance; expansion and growth of Delhaize Group’s business; anticipated store closings, openings and renovations;
the expected effect of the portfolio optimization; future capital expenditures; projected revenue growth or synergies resulting from acquisitions and other transactions; efforts to control or reduce costs, improve buying practices and control
shrink; contingent liabilities; future consumer spending; forecasted currency exchange rates or inflation; expected competition; and strategic options, future strategies and the anticipated benefits of these strategies, are “forward-looking
statements” within the meaning of the U.S. federal securities laws that are subject to risks and uncertainties. These forward-looking statements generally can be identified as statements that include phrases such as “believe,”
“project,” “target,” “predict,” “estimate,” “forecast,” “strategy,” “may,” “goal,” “expect,” “anticipate,” “intend,” “plan,”
“foresee,” “likely,” “will,” “should” or other similar words or phrases. Although Delhaize Group believes such statements are based on reasonable assumptions, actual outcomes and results may differ materially
from those projected. Accordingly, all forward-looking statements should be evaluated with the understanding of their inherent uncertainty. Important factors that could cause actual results to differ materially from expectations of Delhaize Group
include, but are not limited to, those factors described in the annual report in the chapter entitled “Risk Factors” on p. 64 and under Item 3 under Part 1 of Delhaize Group’s Annual Report on Form 20-F for the fiscal year ended
December 31, 2013 filed with the US Securities and Exchange Commission on April 25, 2014. Delhaize Group undertakes no obligation to update forward-looking statements, whether as a result of new information, future developments or
otherwise, and disclaims any obligation to do so.
DISCOVER OUR DIGITAL ANNUAL REPORT
http://annualreport. delhaizegroup.com … and find out more about Delhaize Group: www.delhaizegroup.com
DELHAIZE GROUP
SIGNATURES
Pursuant to the requirements of the Securities Exchange Act of 1934, the registrant has duly caused this report to be signed on its behalf by the undersigned hereunto duly authorized.
| ETABLISSEMENTS DELHAIZE FRÈRES ET CIE “LE LION” (GROUPE DELHAIZE) | ||||||||
| Date: | April 13, 2015 |
By: | /s/ G. Linn Evans | |||||
| G. Linn Evans | ||||||||
| Senior Vice President | ||||||||