Form SC 13E3/A Antero Midstream Partner Filed by: Antero Midstream GP LP
UNITED STATES
SECURITIES AND EXCHANGE COMMISSION
Washington, D.C. 20549
Amendment No. 3
to
SCHEDULE 13E-3
RULE 13e-3 TRANSACTION STATEMENT
(Under Section 13(e) of the Securities Exchange Act of 1934)
ANTERO MIDSTREAM PARTNERS LP
(Name of the Issuer)
Antero Midstream Partners GP LLC
Antero Midstream GP LP
AMGP GP LLC
Antero IDR Holdings LLC
Arkrose Midstream Preferred Co LLC
Arkrose Midstream Newco Inc.
Arkrose Midstream Merger Sub LLC
Antero Resources Corporation
Warburg Pincus Private Equity VIII, L.P.
Warburg Pincus Netherlands Private Equity VIII C.V. I
WP-WPVIII Investors, L.P.
Warburg Pincus Private Equity X O&G, L.P.
Warburg Pincus X Partners, L.P.
WP-WPVIII Investors GP L.P.
Warburg Pincus X, L.P.
Warburg Pincus X GP L.P.
WPP GP LLC
Warburg Pincus Partners, L.P.
Warburg Pincus Partners GP LLC
Warburg Pincus & Co.
Warburg Pincus LLC
Charles R. Kaye
Joseph P. Landy
Yorktown Energy Partners V, L.P.
Yorktown Energy Partners VI, L.P.
Yorktown Energy Partners VII, L.P.
Yorktown Energy Partners VIII, L.P.
Paul Rady
Mockingbird Investments LLC
Glen C. Warren, Jr.
Canton Investment Holdings LLC
(Name of Person(s) Filing Statement)
Common Units Representing Limited Partner Interests
(Title of Class of Securities)
03673L 103
(CUSIP Number of Class of Securities)
Glen C. Warren, Jr.
1615 Wynkoop Street
Denver, Colorado 80202
(303) 357-7310
(Name, Address and Telephone Number of Person Authorized to Receive Notices and Communications on Behalf of the
Person(s) Filing Statement)
Copies to:
Douglas E. McWilliams
Lande A. Spottswood
Vinson & Elkins L.L.P.
1001 Fannin Street, Suite 2500
Houston, Texas 77002-6760
713-758-2222
This statement is filed in connection with (check the appropriate box):
(a) x The filing of solicitation materials or an information statement subject to Regulation 14A, Regulation 14C or Rule 13e-3(c) under the Securities Exchange Act of 1934.
(b) x The filing of a registration statement under the Securities Act of 1933.
(c) o A tender offer.
(d) o None of the above.
Check the following box if the soliciting materials or information statement referred to in checking box (a) are preliminary copies: x
Check the following box if the filing is a final amendment reporting the results of the transaction: o
Calculation of Filing Fee
|
Transaction Valuation* |
|
Amount of Filing Fee** |
|
$5,561,008,451.46 |
|
$673,995 |
* Calculated solely for the purpose of determining the filing fee. The Transaction Value was calculated as follows: the product of (a) $29.73, the average of the high and low prices of the common units of Antero Midstream Partners LP (“AM”) as reported on the New York Stock Exchange on November 1, 2018 and (b) 187,050,402, the estimated maximum number of common units of AM that may be exchanged for the merger consideration in the merger of AM with a wholly owned subsidiary of Antero Midstream GP LP (“AMGP”).
** In accordance with Rule 0-11(c)(1), the filing fee was calculated by multiplying 0.0001212 by the Transaction Valuation.
x Check box if any part of the fee is offset as provided by Exchange Act Rule 0-11(a)(2) and identify the filing with which the offsetting fee was previously paid. Identify the previous filing by registration statement number, or the Form or Schedule and date of its filing.
|
Amount Previously Paid: $673,995 |
Filing Party: Antero Midstream GP LP |
|
Form or Registration No.: Form S-4 (Registration No. 333-228156) |
Date Filed: November 5, 2018 |
INTRODUCTION
This Amendment No. 3 (this “Amendment”) to Rule 13e-3 Transaction Statement on Schedule 13E-3 (this “Schedule”) is being filed by: (1) (a) Antero Midstream Partners LP (“AM”), the issuer of common units representing limited partner interests in AM that are the subject of the Rule 13e-3 transaction, (b) Antero Midstream Partners GP LLC, the general partner of AM (“AMP GP,” and, together with AM, the “AM Parties”), (2) (a) Antero Midstream GP LP (“AMGP”), (b) AMGP GP LLC, the general partner of AMGP (“AMGP GP”), (c) Antero IDR Holdings LLC (“IDR Holdings”), (d) Arkrose Midstream Preferred Co LLC (“Preferred Co”), (e) Arkrose Midstream Newco Inc. (“NewCo”), (f) Arkrose Midstream Merger Sub LLC (“Merger Sub,” and together with AMGP, AMGP GP, IDR Holdings, Preferred Co and NewCo, the “AMGP Parties”), (3) Antero Resources Corporation (“Antero Resources”), (4) (a) Warburg Pincus Private Equity VIII, L.P. (“WPPE”), (b) Warburg Pincus Netherlands Private Equity VIII C.V. I (“WPNPE”), (c) WP-WPVIII Investors, L.P. (“WPWP”), (d) Warburg Pincus Private Equity X O&G, L.P.(“WPPEX”), (e) Warburg Pincus X Partners, L.P. (“WPXP”), (f) WP-WPVIII Investors GP L.P. (“WPWP GP”), (g) Warburg Pincus X, L.P. (“WPX”), (h) Warburg Pincus X GP L.P. (“WPX GP”), (i) WPP GP LLC (“WPP GP”), (j) Warburg Pincus Partners, L.P. (“WPP LP”), (k) Warburg Pincus Partners GP LLC (“WPP GP LLC”), (l) Warburg Pincus & Co. (“WP”), (m) Warburg Pincus LLC (“WP LLC”), (n) Charles R. Kaye, and (o) Joseph P. Landy ( together with WPPE, WPNPE, WPWP, WPPEX, WPXP, WPWP GP, WPX, WPX GP, WPP GP, WPP LP, WPP GP LLC, WP, WP LLC and Mr. Kaye, “Warburg”), (5) (a) Yorktown Energy Partners V, L.P. (“YEP V”), (b) Yorktown Energy Partners VI, L.P. (“YEP VI”), (c) Yorktown Energy Partners VII, L.P. (“YEP VII”), and (d) Yorktown Energy Partners VIII, L.P. (“YEP VII,” and together with YEP V, YEP VI, YEP VII, and YEP VII, “Yorktown,” and together with Warburg, the “Sponsor Holders”), (6) Paul Rady, Mockingbird Investments LLC (“Mockingbird”), Glen C. Warren, Jr. and Canton Investment Holdings LLC (“Canton,” and together with Paul Rady, Mockingbird and Glen C. Warren, Jr., the “Management Holders”). This Schedule relates to the Simplification Agreement, dated as of October 9, 2018, by and among AMGP GP, AMGP, IDR Holdings, Preferred Co, NewCo, Merger Sub, AMP GP, and AM (the “Simplification Agreement”).
AMGP has filed with Securities and Exchange Commission a registration statement on Form S-4 (the “Form S-4”), which contains a joint proxy statement and a prospectus (the “proxy statement/prospectus”) and constitutes (i) a prospectus of AMGP under Section 5 of the Securities Act of 1933, as amended (the “Securities Act”), with respect to AMGP (or its successor entity) securities to be issued pursuant to the Simplification Agreement, (ii) a notice of meeting and a proxy statement of AMGP under Section 14(a) of the Securities Exchange Act of 1934, as amended (the “Exchange Act”), with respect to the special meeting of AMGP shareholders, at which AMGP shareholders will be asked to consider and vote on, among other matters, a proposal to approve the Simplification Agreement and the transactions contemplated thereby and (iii) a notice of meeting and a proxy statement of AM under Section 14(a) of the Exchange Act with respect to the special meeting of AM unitholders, at which AM unitholders will be asked to consider and vote on a proposal to approve the Simplification Agreement and the transactions contemplated thereby. A copy of the Form S-4 is attached hereto as Exhibit (a)(3) and a copy of the Simplification Agreement is attached as Annex A to the proxy statement/prospectus. All references in this Schedule to Items numbered 1001 to 1016 are references to Items contained in Regulation M-A under the Exchange Act.
The cross-references below are being supplied pursuant to General Instruction G to Schedule 13E-3 and show the location in the proxy statement/prospectus of the information required to be included in response to the items of Schedule 13E-3. The information contained in the proxy statement/prospectus, including all annexes thereto and documents incorporated by reference therein, is hereby expressly incorporated herein by reference. As of the date hereof, the proxy statement/prospectus is in preliminary form and is subject to completion. Terms used but not defined in this Schedule shall have the meanings given to them in the proxy statement/prospectus.
The Rule 13e-3 Transaction Statement on Schedule 13E-3 (together with the exhibits and annexes thereto and as amended and supplemented from time to time, the “Schedule 13E-3”), was originally filed with the Securities and Exchange Commission (the “SEC”) on November 5, 2018 by AMGP. Due to the large number of exhibits to be filed with the Schedule 13E-3, this Amendment is being filed to file electronically Exhibits (c)(62) through (c)(66) to Item 16 herein which were not filed with the original Schedule 13E-3. Unless set forth below, all previous Items of the Schedule 13E-3 are unchanged.
Item 16. Exhibits.
Regulation M-A Item 1016
|
(a)(1) |
|
Letter to Common Unitholders of Antero Midstream Partners LP, incorporated herein by reference to the proxy statement/prospectus included in the Registration Statement on Form S-4 filed by Antero Midstream GP LP with the Securities and Exchange Commission on November 5, 2018. |
|
|
|
|
|
(a)(2) |
|
Notice of Special Meeting of Common Unitholders of Antero Midstream Partners LP, incorporated herein by reference to the proxy statement/prospectus included in the Registration Statement on Form S-4 filed by Antero Midstream GP LP with the Securities and Exchange Commission on November 5, 2018. |
|
|
|
|
|
(a)(3) |
|
Joint Proxy Statement/Prospectus of Antero Midstream Partners LP and Antero Midstream GP LP, incorporated herein by reference to the Registration Statement on Form S-4 filed by Antero Midstream GP LP with the Securities and Exchange Commission on November 5, 2018 |
|
|
|
|
|
(b)(1) |
|
Amended and Restated Credit Agreement, dated as of October 26, 2017, among Antero Midstream Partners LP and certain of its subsidiaries, certain lenders party thereto, Wells Fargo Bank, National Association, as administrative agent, l/c issuer and swingline lender and the other parties thereto (incorporated by reference to Exhibit 10.1 to Quarterly Report on Form 10-Q filed on November 1, 2017). |
|
|
|
|
|
(b)(2) |
|
First Amendment and Joinder Agreement, dated as of October 31, 2018, among Antero Midstream Partners LP and certain of its subsidiaries, certain lenders party thereto, Wells Fargo Bank, National Association, as administrative agent, l/c issuer and swingline lender and the other parties thereto (incorporated by reference to Exhibit 10.5 to the proxy statement/prospectus included in the Registration Statement on Form S-4 filed by Antero Midstream GP LP with the Securities and Exchange Commission on November 5, 2018). |
|
|
|
|
|
(c)(1) |
|
Fairness Opinion of the AM Conflicts Committee’s Financial Advisor, dated October 8, 2018, incorporated herein by reference to the proxy statement/prospectus included in the Registration Statement on Form S-4 filed by Antero Midstream GP LP with the Securities and Exchange Commission on November 5, 2018. |
|
|
|
|
|
(c)(2) |
|
Fairness Opinion of the AMGP Conflicts Committee’s Financial Advisor, dated October 9, 2018, incorporated herein by reference to the proxy statement/prospectus included in the Registration Statement on Form S-4 filed by Antero Midstream GP LP with the Securities and Exchange Commission on November 5, 2018. |
|
|
|
|
|
(c)(3) |
|
Fairness Opinion of the AR Special Committee’s Financial Advisor, dated October 8, 2018, incorporated herein by reference to the proxy statement/prospectus included in the Registration Statement on Form S-4 filed by Antero Midstream GP LP with the Securities and Exchange Commission on November 5, 2018. |
|
|
|
|
|
(c)(4)* |
|
Presentation prepared by Goldman Sachs & Co. LLC to the Conflicts Committee of the Board of Directors of AMGP GP LLC, dated March 1, 2018. |
|
|
|
|
|
(c)(5)* |
|
Presentation prepared by Goldman Sachs & Co. LLC to the Conflicts Committee of the Board of Directors of AMGP GP LLC, dated March 22, 2018. |
|
|
|
|
|
(c)(6)* |
|
Presentation prepared by Goldman Sachs & Co. LLC to the Conflicts Committee of the Board of Directors of AMGP GP LLC, dated April 3, 2018. |
|
|
|
|
|
(c)(7)* |
|
Presentation prepared by Goldman Sachs & Co. LLC to the Board of Directors of AMGP GP LLC, dated April 7, 2018. |
|
|
|
|
|
(c)(8)* |
|
Presentation prepared by Goldman Sachs & Co. LLC to the Conflicts Committee of the Board of Directors of AMGP GP LLC, dated April 10, 2018. |
|
|
|
|
|
(c)(9)* |
|
Presentation prepared by Goldman Sachs & Co. LLC to the Conflicts Committee of the Board of Directors of AMGP GP LLC, dated April 10, 2018. |
|
(c)(10)* |
|
Presentation prepared by Goldman Sachs & Co. LLC to the Conflicts Committee of the Board of Directors of AMGP GP LLC, dated April 18, 2018. |
|
|
|
|
|
(c)(11)* |
|
Presentation prepared by Goldman Sachs & Co. LLC to the Conflicts Committee of the Board of Directors of AMGP GP LLC, dated April 20, 2018. |
|
|
|
|
|
(c)(12)* |
|
Presentation prepared by Goldman Sachs & Co. LLC to the Conflicts Committee of the Board of Directors of AMGP GP LLC, dated April 20, 2018. |
|
|
|
|
|
(c)(13)* |
|
Presentation prepared by Goldman Sachs & Co. LLC to the Conflicts Committee of the Board of Directors of AMGP GP LLC, dated April 23, 2018. |
|
|
|
|
|
(c)(14)* |
|
Presentation prepared by Goldman Sachs & Co. LLC to the Conflicts Committee of the Board of Directors of AMGP GP LLC, dated May 1, 2018. |
|
|
|
|
|
(c)(15)* |
|
Presentation prepared by Goldman Sachs & Co. LLC to the Conflicts Committee of the Board of Directors of AMGP GP LLC, dated May 3, 2018. |
|
|
|
|
|
(c)(16)* |
|
Presentation prepared by Goldman Sachs & Co. LLC to the Conflicts Committee of the Board of Directors of AMGP GP LLC, dated May 8, 2018. |
|
|
|
|
|
(c)(17)* |
|
Presentation prepared by Goldman Sachs & Co. LLC to the Conflicts Committee of the Board of Directors of AMGP GP LLC, dated May 9, 2018. |
|
|
|
|
|
(c)(18)* |
|
Presentation prepared by Goldman Sachs & Co. LLC to the Conflicts Committee of the Board of Directors of AMGP GP LLC, dated May 11, 2018. |
|
|
|
|
|
(c)(19)* |
|
Presentation prepared by Goldman Sachs & Co. LLC to the Conflicts Committee of the Board of Directors of AMGP GP LLC, dated May 18, 2018. |
|
|
|
|
|
(c)(20)* |
|
Presentation prepared by Goldman Sachs & Co. LLC to the Conflicts Committee of the Board of Directors of AMGP GP LLC, dated May 22, 2018. |
|
|
|
|
|
(c)(21)* |
|
Presentation prepared by Goldman Sachs & Co. LLC to the Conflicts Committee of the Board of Directors of AMGP GP LLC, dated June 1, 2018. |
|
|
|
|
|
(c)(22)* |
|
Presentation prepared by Goldman Sachs & Co. LLC to the Conflicts Committee of the Board of Directors of AMGP GP LLC, dated June 6, 2018. |
|
|
|
|
|
(c)(23)* |
|
Presentation prepared by Goldman Sachs & Co. LLC to the Conflicts Committee of the Board of Directors of AMGP GP LLC, dated June 6, 2018. |
|
|
|
|
|
(c)(24)* |
|
Presentation prepared by Goldman Sachs & Co. LLC to the Conflicts Committee of the Board of Directors of AMGP GP LLC, dated June 20, 2018. |
|
|
|
|
|
(c)(25)* |
|
Presentation prepared by Goldman Sachs & Co. LLC to the Conflicts Committee of the Board of Directors of AMGP GP LLC, dated June 29, 2018. |
|
|
|
|
|
(c)(26)* |
|
Presentation prepared by Goldman Sachs & Co. LLC to the Conflicts Committee of the Board of Directors of AMGP GP LLC, dated July 18, 2018. |
|
|
|
|
|
(c)(27)* |
|
Presentation prepared by Goldman Sachs & Co. LLC to the Conflicts Committee of the Board of Directors of AMGP GP LLC, dated August 3, 2018. |
|
|
|
|
|
(c)(28)* |
|
Presentation prepared by Goldman Sachs & Co. LLC to the Conflicts Committee of the Board of Directors of AMGP GP LLC, dated August 11, 2018. |
|
|
|
|
|
(c)(29)* |
|
Presentation prepared by Goldman Sachs & Co. LLC to the Conflicts Committee of the Board of Directors of AMGP GP LLC, dated August 20, 2018. |
|
|
|
|
|
(c)(30)* |
|
Presentation prepared by Goldman Sachs & Co. LLC to the Conflicts Committee of the Board of Directors of AMGP GP LLC, dated August 21, 2018. |
|
|
|
|
|
(c)(31)* |
|
Presentation prepared by Goldman Sachs & Co. LLC to the Conflicts Committee of the Board of Directors of AMGP GP LLC, dated August 23, 2018. |
|
|
|
|
|
(c)(32)* |
|
Presentation prepared by Goldman Sachs & Co. LLC to the Conflicts Committee of the Board of Directors of AMGP GP LLC, dated August 27, 2018. |
|
(c)(33)* |
|
Presentation prepared by Goldman Sachs & Co. LLC to the Conflicts Committee of the Board of Directors of AMGP GP LLC, dated August 30, 2018. |
|
|
|
|
|
(c)(34)* |
|
Presentation prepared by Goldman Sachs & Co. LLC to the Conflicts Committee of the Board of Directors of AMGP GP LLC, dated September 6, 2018. |
|
|
|
|
|
(c)(35)* |
|
Presentation prepared by Goldman Sachs & Co. LLC to the Conflicts Committee of the Board of Directors of AMGP GP LLC, dated September 13, 2018. |
|
|
|
|
|
(c)(36)* |
|
Presentation prepared by Goldman Sachs & Co. LLC to the Conflicts Committee of the Board of Directors of AMGP GP LLC, dated September 21, 2018. |
|
|
|
|
|
(c)(37)* |
|
Presentation prepared by Goldman Sachs & Co. LLC to the Conflicts Committee of the Board of Directors of AMGP GP LLC, dated September 24, 2018. |
|
|
|
|
|
(c)(38)* |
|
Presentation prepared by Goldman Sachs & Co. LLC to the Conflicts Committee of the Board of Directors of AMGP GP LLC, dated October 3, 2018. |
|
|
|
|
|
(c)(39)* |
|
Presentation prepared by Goldman Sachs & Co. LLC to the Conflicts Committee of the Board of Directors of AMGP GP LLC, dated October 6, 2018. |
|
|
|
|
|
(c)(40)* |
|
Presentation prepared by Goldman Sachs & Co. LLC to the Conflicts Committee of the Board of Directors of AMGP GP LLC, dated October 8, 2018. |
|
|
|
|
|
(c)(41)* |
|
Presentation prepared by Robert W. Baird & Co. Incorporated to the Special Committee of the Board of Directors of Antero Resources Corporation, dated March 22, 2018. |
|
|
|
|
|
(c)(42)* |
|
Presentation prepared by Robert W. Baird & Co. Incorporated to the Special Committee of the Board of Directors of Antero Resources Corporation, dated March 30, 2018. |
|
|
|
|
|
(c)(43)* |
|
Presentation prepared by Robert W. Baird & Co. Incorporated to the Special Committee of the Board of Directors of Antero Resources Corporation, dated April 10, 2018. |
|
|
|
|
|
(c)(44)* |
|
Presentation prepared by Robert W. Baird & Co. Incorporated to the Special Committee of the Board of Directors of Antero Resources Corporation, dated April 19, 2018. |
|
|
|
|
|
(c)(45)* |
|
Presentation prepared by Robert W. Baird & Co. Incorporated to the Special Committee of the Board of Directors of Antero Resources Corporation, dated June 12, 2018. |
|
|
|
|
|
(c)(46)* |
|
Presentation prepared by Robert W. Baird & Co. Incorporated to the Special Committee of the Board of Directors of Antero Resources Corporation, dated June 21, 2018. |
|
|
|
|
|
(c)(47)* |
|
Presentation prepared by Robert W. Baird & Co. Incorporated to the Special Committee of the Board of Directors of Antero Resources Corporation, dated July 3, 2018. |
|
|
|
|
|
(c)(48)* |
|
Presentation prepared by Robert W. Baird & Co. Incorporated to the Special Committee of the Board of Directors of Antero Resources Corporation, dated July 6, 2018. |
|
|
|
|
|
(c)(49)* |
|
Presentation prepared by Robert W. Baird & Co. Incorporated to the Special Committee of the Board of Directors of Antero Resources Corporation, dated July 8, 2018. |
|
|
|
|
|
(c)(50)* |
|
Presentation prepared by Robert W. Baird & Co. Incorporated to the Special Committee of the Board of Directors of Antero Resources Corporation, dated July 22, 2018. |
|
|
|
|
|
(c)(51)* |
|
Presentation prepared by Robert W. Baird & Co. Incorporated to the Special Committee of the Board of Directors of Antero Resources Corporation, dated August 1, 2018. |
|
|
|
|
|
(c)(52)* |
|
Presentation prepared by Robert W. Baird & Co. Incorporated to the Special Committee of the Board of Directors of Antero Resources Corporation, dated August 22, 2018. |
|
|
|
|
|
(c)(53)* |
|
Presentation prepared by Robert W. Baird & Co. Incorporated to the Special Committee of the Board of Directors of Antero Resources Corporation, dated August 28, 2018. |
|
|
|
|
|
(c)(54)* |
|
Presentation prepared by Robert W. Baird & Co. Incorporated to the Special Committee of the Board of Directors of Antero Resources Corporation, dated September 17, 2018. |
|
|
|
|
|
(c)(55)* |
|
Presentation prepared by Robert W. Baird & Co. Incorporated to the Special Committee of the Board of Directors of Antero Resources Corporation, dated September 23, 2018. |
|
(c)(56)* |
|
Presentation prepared by Robert W. Baird & Co. Incorporated to the Special Committee of the Board of Directors of Antero Resources Corporation, dated October 1, 2018. |
|
|
|
|
|
(c)(57)* |
|
Presentation prepared by Robert W. Baird & Co. Incorporated to the Special Committee of the Board of Directors of Antero Resources Corporation, dated October 5, 2018. |
|
|
|
|
|
(c)(58)* |
|
Presentation prepared by Robert W. Baird & Co. Incorporated to the Special Committee of the Board of Directors of Antero Resources Corporation, dated October 6, 2018. |
|
|
|
|
|
(c)(59)* |
|
Presentation prepared by Robert W. Baird & Co. Incorporated to the Special Committee of the Board of Directors of Antero Resources Corporation, dated October 7, 2018. |
|
|
|
|
|
(c)(60)* |
|
Supplemental Presentation prepared by Robert W. Baird & Co. Incorporated to the Special Committee of the Board of Directors of Antero Resources Corporation, dated October 7, 2018. |
|
|
|
|
|
(c)(61)* |
|
Presentation prepared by Robert W. Baird & Co. Incorporated to the Special Committee of the Board of Directors of Antero Resources Corporation, dated October 8, 2018. |
|
|
|
|
|
(c)(62)** |
|
Presentation prepared by Morgan Stanley & Co. LLC to the Board of Directors of Antero Midstream Partners GP LLC, dated March 20, 2018. |
|
|
|
|
|
(c)(63)** |
|
Presentation prepared by Morgan Stanley & Co. LLC to the Board of Directors of Antero Midstream Partners GP LLC, dated August 9, 2018. |
|
|
|
|
|
(c)(64)** |
|
Joint Presentation prepared by J.P. Morgan Securities LLC and Morgan Stanley & Co. LLC to the Board of Directors of Antero Resources Corporation, dated February 21, 2018. |
|
|
|
|
|
(c)(65)** |
|
Presentation prepared by J.P. Morgan Securities LLC to the Board of Directors of Antero Resources Corporation, dated March 22, 2018. |
|
|
|
|
|
(c)(66)** |
|
Presentation prepared by J.P. Morgan Securities LLC to the Board of Directors of Antero Resources Corporation, dated August 9, 2018. |
|
|
|
|
|
(c)(67)*** |
|
Presentation prepared by Tudor Pickering Holt & Co. Advisors LLP to the Conflicts Committee of Antero Midstream Partners LP, dated June 17, 2018. |
|
|
|
|
|
(c)(68)*** |
|
Presentation prepared by Tudor Pickering Holt & Co. Advisors LLP to the Conflicts Committee of Antero Midstream Partners LP, dated June 19, 2018. |
|
|
|
|
|
(c)(69)*** |
|
Presentation prepared by Tudor Pickering Holt & Co. Advisors LLP to the Conflicts Committee of Antero Midstream Partners LP, dated June 20, 2018. |
|
|
|
|
|
(c)(70)*** |
|
Presentation prepared by Tudor Pickering Holt & Co. Advisors LLP to the Conflicts Committee of Antero Midstream Partners LP, dated June 28, 2018. |
|
|
|
|
|
(c)(71)*** |
|
Presentation prepared by Tudor Pickering Holt & Co. Advisors LLP to the Conflicts Committee of Antero Midstream Partners LP, dated June 30, 2018. |
|
|
|
|
|
(c)(72)*** |
|
Presentation prepared by Tudor Pickering Holt & Co. Advisors LLP to the Conflicts Committee of Antero Midstream Partners LP, dated July 12, 2018. |
|
|
|
|
|
(c)(73)*** |
|
Presentation prepared by Tudor Pickering Holt & Co. Advisors LLP to the Conflicts Committee of Antero Midstream Partners LP, dated July 14, 2018. |
|
|
|
|
|
(c)(74)*** |
|
Presentation prepared by Tudor Pickering Holt & Co. Advisors LLP to the Conflicts Committee of Antero Midstream Partners LP, dated August 14, 2018. |
|
(c)(75)*** |
|
Presentation prepared by Tudor Pickering Holt & Co. Advisors LLP to the Conflicts Committee of Antero Midstream Partners LP, dated August 14-15, 2018. |
|
|
|
|
|
(c)(76)*** |
|
Presentation prepared by Tudor Pickering Holt & Co. Advisors LLP to the Conflicts Committee of Antero Midstream Partners LP, dated August 26, 2018. |
|
|
|
|
|
(c)(77)*** |
|
Presentation prepared by Tudor Pickering Holt & Co. Advisors LLP to the Conflicts Committee of Antero Midstream Partners LP, dated August 26, 2018. |
|
|
|
|
|
(c)(78)*** |
|
Presentation prepared by Tudor Pickering Holt & Co. Advisors LLP to the Conflicts Committee of Antero Midstream Partners LP, dated August 31, 2018. |
|
|
|
|
|
(c)(79)*** |
|
Presentation prepared by Tudor Pickering Holt & Co. Advisors LLP to the Conflicts Committee of Antero Midstream Partners LP, dated September 1, 2018. |
|
|
|
|
|
(c)(80)*** |
|
Presentation prepared by Tudor Pickering Holt & Co. Advisors LLP to the Conflicts Committee of Antero Midstream Partners LP, dated September 2, 2018. |
|
|
|
|
|
(c)(81)*** |
|
Presentation prepared by Tudor Pickering Holt & Co. Advisors LLP to the Conflicts Committee of Antero Midstream Partners LP, dated September 17, 2018. |
|
|
|
|
|
(c)(82)*** |
|
Presentation prepared by Tudor Pickering Holt & Co. Advisors LLP to the Conflicts Committee of Antero Midstream Partners LP, dated September 20, 2018. |
|
|
|
|
|
(c)(83)*** |
|
Presentation prepared by Tudor Pickering Holt & Co. Advisors LLP to the Conflicts Committee of Antero Midstream Partners LP, dated September 23, 2018. |
|
|
|
|
|
(c)(84)*** |
|
Presentation prepared by Tudor Pickering Holt & Co. Advisors LLP to the Conflicts Committee of Antero Midstream Partners LP, dated September 28, 2018. |
|
|
|
|
|
(c)(85)*** |
|
Presentation prepared by Tudor Pickering Holt & Co. Advisors LLP to the Conflicts Committee of Antero Midstream Partners LP, dated October 2, 2018. |
|
|
|
|
|
(c)(86)*** |
|
Presentation prepared by Tudor Pickering Holt & Co. Advisors LLP to the Conflicts Committee of Antero Midstream Partners LP, dated October 6, 2018. |
|
|
|
|
|
(c)(87)*** |
|
Presentation prepared by Tudor Pickering Holt & Co. Advisors LLP to the Conflicts Committee of Antero Midstream Partners LP, dated October 8, 2018. |
|
|
|
|
|
(c)(88)*** |
|
Presentation prepared by Tudor Pickering Holt & Co. Advisors LLP to the Conflicts Committee of Antero Midstream Partners LP, dated October 8, 2018. |
|
|
|
|
|
(c)(89)*** |
|
Discussion Materials of Citigroup Global Markets Inc. for the Sponsor Holders, dated September 10, 2018. |
|
|
|
|
|
(c)(90)*** |
|
Discussion Materials of Citigroup Global Markets Inc. for the Sponsor Holders affiliated with Warburg Pincus LLC, dated September 12, 2018. |
|
|
|
|
|
(c)(91)*** |
|
Discussion Materials of Citigroup Global Markets Inc. for the Sponsor Holders, dated September 13, 2018. |
|
|
|
|
|
(d)(1) |
|
Simplification Agreement, dated as of October 9, 2018, by and among AMGP GP LLC, Antero Midstream GP LP, Antero IDR Holdings LLC, Arkrose Midstream Preferred Co LLC, Arkrose Midstream NewCo Inc., Arkrose Midstream Merger Sub LLC, Antero Midstream Partners GP LLC and Antero Midstream Partners LP., incorporated herein by reference to the proxy statement/prospectus included in the Registration Statement on Form S-4 filed by Antero Midstream GP LP with the Securities and Exchange Commission on November 5, 2018 |
|
|
|
|
|
(f)(1) |
|
Agreement of Limited Partnership, dated as of November 10, 2014, by and between Antero Resources Midstream Management LLC, as the General Partner, and Antero Resources Corporation, as the Organizational Limited Partner (incorporated by reference to Exhibit 3.1 to Current Report on Form 8-K filed on November 17, 2014). |
|
|
|
|
|
(f)(2)*** |
|
Delaware Code Title 6 § 17-212. |
|
|
|
|
|
(g) |
|
None |
* Previously filed
** Filed herewith
*** To be filed by amendment
SIGNATURES
After due inquiry and to the best of my knowledge and belief, I certify that the information set forth in this statement is true, complete and correct.
|
Dated: November 5, 2018 |
| |
|
|
| |
|
|
ANTERO MIDSTREAM PARTNERS LP | |
|
|
| |
|
|
By: |
Antero Midstream Partners GP LLC, its general partner |
|
|
|
|
|
|
|
|
|
|
By: |
/s/ Alvyn A. Schopp |
|
|
Name: |
Alvyn A. Schopp |
|
|
Title: |
Chief Administrative Officer, Regional Senior Vice President and Treasurer |
|
|
| |
|
Dated: November 5, 2018 |
| |
|
|
| |
|
|
ANTERO MIDSTREAM PARTNERS GP LLC | |
|
|
| |
|
|
| |
|
|
By: |
/s/ Alvyn A. Schopp |
|
|
Name: |
Alvyn A. Schopp |
|
|
Title: |
Chief Administrative Officer, Regional Senior Vice President and Treasurer |
|
|
| |
|
Dated: November 5, 2018 |
| |
|
|
| |
|
|
ANTERO MIDSTREAM GP LP | |
|
|
| |
|
|
By: |
AMGP GP LLC, its general partner |
|
|
|
|
|
|
By: |
/s/ Alvyn A. Schopp |
|
|
Name: |
Alvyn A. Schopp |
|
|
Title: |
Chief Administrative Officer, Regional Senior Vice President and Treasurer |
|
|
| |
|
Dated: November 5, 2018 |
| |
|
|
| |
|
|
AMGP GP LLC | |
|
|
| |
|
|
| |
|
|
By: |
/s/ Alvyn A. Schopp |
|
|
Name: |
Alvyn A. Schopp |
|
|
Title: |
Chief Administrative Officer, Regional Senior Vice President and Treasurer |
|
Dated: November 5, 2018 |
| |
|
|
| |
|
|
ANTERO IDR HOLDINGS LLC | |
|
|
| |
|
|
By: |
Antero Midstream GP LP, its managing member |
|
|
By: |
AMGP GP LLC, its general partner |
|
|
|
|
|
|
By: |
/s/ Alvyn A. Schopp |
|
|
Name: |
Alvyn A. Schopp |
|
|
Title: |
Chief Administrative Officer, Regional Senior Vice President and Treasurer |
|
|
| |
|
Dated: November 5, 2018 |
| |
|
|
| |
|
|
ARKROSE MIDSTREAM PREFERRED CO LLC | |
|
|
| |
|
|
By: |
Antero Midstream GP LP,its sole member |
|
|
By: |
AMGP GP LLC, its general partner |
|
|
|
|
|
|
By: |
/s/ Alvyn A. Schopp |
|
|
Name: |
Alvyn A. Schopp |
|
|
Title: |
Chief Administrative Officer, Regional Senior Vice President and Treasurer |
|
|
| |
|
Dated: November 5, 2018 |
| |
|
|
| |
|
|
ARKROSE MIDSTREAM NEWCO INC. | |
|
|
| |
|
|
| |
|
|
By: |
/s/ Alvyn A. Schopp |
|
|
Name: |
Alvyn A. Schopp |
|
|
Title: |
Chief Administrative Officer, Regional Senior Vice President and Treasurer |
|
|
| |
|
Dated: November 5, 2018 |
| |
|
|
| |
|
|
ARKROSE MIDSTREAM MERGER SUB LLC | |
|
|
| |
|
|
By: |
Arkrose Midstream NewCo Inc., its sole member |
|
|
|
|
|
|
By: |
/s/ Alvyn A. Schopp |
|
|
Name: |
Alvyn A. Schopp |
|
|
Title: |
Chief Administrative Officer, Regional Senior Vice President and Treasurer |
|
|
| |
|
Dated: November 5, 2018 |
| |
|
|
| |
|
|
ANTERO RESOURCES CORPORATION | |
|
|
| |
|
|
| |
|
|
By: |
/s/ Alvyn A. Schopp |
|
|
Name: |
Alvyn A. Schopp |
|
|
Title: |
Chief Administrative Officer, Regional Senior Vice President and Treasurer |
|
Dated: November 5, 2018 |
| |
|
|
| |
|
|
WARBURG PINCUS PRIVATE EQUITY VIII, L.P. | |
|
|
| |
|
|
By: |
Warburg Pincus Partners, L.P., its general partner |
|
|
By: |
Warburg Pincus Partners GP LLC, its general partner |
|
|
By: |
Warburg Pincus & Co., its managing member |
|
|
|
|
|
|
|
|
|
|
By: |
/s/ Robert B. Knauss |
|
|
Name: |
Robert B. Knauss |
|
|
Title: |
Partner |
|
|
| |
|
Dated: November 5, 2018 |
| |
|
|
| |
|
|
WARBURG PINCUS NETHERLANDS PRIVATE EQUITY VIII C.V. I | |
|
|
| |
|
|
By: |
Warburg Pincus Partners, L.P., its general partner |
|
|
By: |
Warburg Pincus Partners GP LLC, its general partner |
|
|
By: |
Warburg Pincus & Co., its managing member |
|
|
|
|
|
|
|
|
|
|
By: |
/s/ Robert B. Knauss |
|
|
Name: |
Robert B. Knauss |
|
|
Title: |
Partner |
|
|
| |
|
Dated: November 5, 2018 |
| |
|
|
| |
|
|
WP-WPVIII INVESTORS, L.P. | |
|
|
| |
|
|
By: |
WP-WPVIII Investors GP L.P., its general partner |
|
|
By: |
WPP GP LLC, its general partner |
|
|
By: |
Warburg Pincus Partners, L.P., its managing member |
|
|
By: |
Warburg Pincus Partners GP LLC, its general partner |
|
|
By: |
Warburg Pincus & Co., its managing member |
|
|
|
|
|
|
|
|
|
|
By: |
/s/ Robert B. Knauss |
|
|
Name: |
Robert B. Knauss |
|
|
Title: |
Partner |
|
|
| |
|
Dated: November 5, 2018 |
| |
|
|
| |
|
|
WARBURG PINCUS PRIVATE EQUITY X O&G, L.P. | |
|
|
| |
|
|
By: |
Warburg Pincus X, L.P., its general partner |
|
|
By: |
Warburg Pincus X GP L.P., its general partner |
|
|
By: |
WPP GP LLC, its general partner |
|
|
By: |
Warburg Pincus Partners, L.P., its managing member |
|
|
By: |
Warburg Pincus Partners GP LLC, its general partner |
|
|
By: |
Warburg Pincus & Co., its managing member |
|
|
|
|
|
|
|
|
|
|
By: |
/s/ Robert B. Knauss |
|
|
Name: |
Robert B. Knauss |
|
|
Title: |
Partner |
|
Dated: November 5, 2018 |
| |
|
|
| |
|
|
WARBURG PINCUS X PARTNERS, L.P. | |
|
|
| |
|
|
By: |
Warburg Pincus X, L.P., its general partner |
|
|
By: |
Warburg Pincus X GP L.P., its general partner |
|
|
By: |
WPP GP LLC, its general partner |
|
|
By: |
Warburg Pincus Partners, L.P., its managing member |
|
|
By: |
Warburg Pincus Partners GP LLC, its general partner |
|
|
By: |
Warburg Pincus & Co., its managing member |
|
|
|
|
|
|
|
|
|
|
By: |
/s/ Robert B. Knauss |
|
|
Name: |
Robert B. Knauss |
|
|
Title: |
Partner |
|
|
| |
|
Dated: November 5, 2018 |
| |
|
|
| |
|
|
WP-WPVIII INVESTORS, GP L.P. | |
|
|
| |
|
|
By: |
WPP GP LLC, its general partner |
|
|
By: |
Warburg Pincus Partners, L.P., its managing member |
|
|
By: |
Warburg Pincus Partners GP LLC, its general partner |
|
|
By: |
Warburg Pincus & Co., its managing member |
|
|
|
|
|
|
|
|
|
|
By: |
/s/ Robert B. Knauss |
|
|
Name: |
Robert B. Knauss |
|
|
Title: |
Partner |
|
|
| |
|
Dated: November 5, 2018 |
| |
|
|
| |
|
|
WARBURG PINCUS X, L.P. | |
|
|
| |
|
|
By: |
Warburg Pincus X GP L.P., its general partner |
|
|
By: |
WPP GP LLC, its general partner |
|
|
By: |
Warburg Pincus Partners, L.P., its managing member |
|
|
By: |
Warburg Pincus Partners GP LLC, its general partner |
|
|
By: |
Warburg Pincus & Co., its managing member |
|
|
|
|
|
|
By: |
/s/ Robert B. Knauss |
|
|
Name: |
Robert B. Knauss |
|
|
Title: |
Partner |
|
Dated: November 5, 2018 |
| ||
|
|
| ||
|
|
WARBURG PINCUS X GP L.P. | ||
|
|
| ||
|
|
By: |
WPP GP LLC, its general partner | |
|
|
By: |
Warburg Pincus Partners, L.P., its managing member | |
|
|
By: |
Warburg Pincus Partners GP LLC, its general partner | |
|
|
By: |
Warburg Pincus & Co., its managing member | |
|
|
|
| |
|
|
|
| |
|
|
By: |
/s/ Robert B. Knauss | |
|
|
Name: |
Robert B. Knauss | |
|
|
Title: |
Partner | |
|
|
| ||
|
Dated: November 5, 2018 |
| ||
|
|
| ||
|
|
WPP GP LLC | ||
|
|
| ||
|
|
By: |
Warburg Pincus Partners, L.P., its managing member | |
|
|
By: |
Warburg Pincus Partners GP LLC, its general partner | |
|
|
By: |
Warburg Pincus & Co., its managing member | |
|
|
|
| |
|
|
|
| |
|
|
By: |
/s/ Robert B. Knauss | |
|
|
Name: |
Robert B. Knauss | |
|
|
Title: |
Partner | |
|
|
| ||
|
Dated: November 5, 2018 |
| ||
|
|
| ||
|
|
WARBURG PINCUS PARTNERS, L.P. | ||
|
|
| ||
|
|
By: |
Warburg Pincus Partners GP LLC, its general partner | |
|
|
By: |
Warburg Pincus & Co., its managing member | |
|
|
|
| |
|
|
|
| |
|
|
By: |
/s/ Robert B. Knauss | |
|
|
Name: |
Robert B. Knauss | |
|
|
Title: |
Partner | |
|
|
| ||
|
Dated: November 5, 2018 |
| ||
|
|
| ||
|
|
WARBURG PINCUS PARTNERS GP LLC | ||
|
|
| ||
|
|
By: |
Warburg Pincus & Co., its managing member | |
|
|
|
| |
|
|
|
| |
|
|
By: |
/s/ Robert B. Knauss | |
|
|
Name: |
Robert B. Knauss | |
|
|
Title: |
Partner | |
|
|
| ||
|
Dated: November 5, 2018 |
| ||
|
|
| ||
|
|
WARBURG PINCUS & CO. | ||
|
|
|
| |
|
|
By: |
/s/ Robert B. Knauss | |
|
|
Name: |
Robert B. Knauss | |
|
|
Title: |
Partner | |
|
|
|
| |
|
Dated: November 5, 2018 |
|
| |
|
|
|
| |
|
|
WARBURG PINCUS LLC | ||
|
|
|
| |
|
|
By: |
/s/ Robert B. Knauss | |
|
|
Name: |
Robert B. Knauss | |
|
|
Title: |
Managing Director | |
|
|
|
| |
|
Dated: November 5, 2018 |
|
| |
|
|
|
| |
|
|
CHARLES R. KAYE | ||
|
|
| ||
|
|
By: |
/s/ Charles R. Kaye | |
|
|
Name: |
Charles R. Kaye | |
|
|
By: |
Robert B. Knauss, Attorney-in-Fact* | |
|
|
|
| |
|
Dated: November 5, 2018 |
|
| |
|
|
| ||
|
|
JOSEPH P. LANDY | ||
|
|
| ||
|
|
By: |
/s/ Joseph P. Landy | |
|
|
Name: |
Joseph P. Landy | |
|
|
By: |
Robert B. Knauss, Attorney-in-Fact* | |
|
|
|
| |
|
Dated: November 5, 2018 |
| ||
|
|
| ||
|
|
YORKTOWN ENERGY PARTNERS V, L.P. | ||
|
|
| ||
|
|
By: |
Yorktown V Company LLC, its General Partner | |
|
|
|
| |
|
|
|
| |
|
|
By: |
/s/ W. Howard Keenan, Jr. | |
|
|
Name: |
W. Howard Keenan, Jr. | |
|
|
Title: |
Member | |
* The Power of Attorney given by each of Mr. Kaye and Mr. Landy was previously filed with the SEC on July 12, 2016 as an exhibit to a beneficial ownership report on Schedule 13D filed by Warburg Pincus LLC with respect to WEX Inc. and is hereby incorporated by reference.
|
Dated: November 5, 2018 |
| |
|
|
| |
|
|
YORKTOWN ENERGY PARTNERS VI, L.P. | |
|
|
| |
|
|
By: |
Yorktown VI Company LP, its General Partner |
|
|
By: |
Yorktown VI Associates LLC, its General Partner |
|
|
|
|
|
|
|
|
|
|
By: |
/s/ W. Howard Keenan, Jr. |
|
|
Name: |
W. Howard Keenan, Jr. |
|
|
Title: |
Member |
|
|
| |
|
Dated: November 5, 2018 |
| |
|
|
| |
|
|
YORKTOWN ENERGY PARTNERS VII, L.P. | |
|
|
| |
|
|
By: |
Yorktown VII Company LP, its General Partner |
|
|
By: |
Yorktown VII Associates LLC, its General Partner |
|
|
|
|
|
|
|
|
|
|
By: |
/s/ W. Howard Keenan, Jr. |
|
|
Name: |
W. Howard Keenan, Jr. |
|
|
Title: |
Member |
|
|
| |
|
Dated: November 5, 2018 |
| |
|
|
| |
|
|
YORKTOWN ENERGY PARTNERS VIII, L.P. | |
|
|
| |
|
|
By: |
Yorktown VIII Company LP, its General Partner |
|
|
By: |
Yorktown VIII Associates LLC, its General Partner |
|
|
|
|
|
|
|
|
|
|
By: |
/s/ W. Howard Keenan, Jr. |
|
|
Name: |
W. Howard Keenan, Jr. |
|
|
Title: |
Member |
|
|
| |
|
Dated: November 5, 2018 |
| |
|
|
| |
|
|
By: |
/s/ Paul M. Rady |
|
|
Name: |
Paul M. Rady |
|
|
| |
|
Dated: November 5, 2018 |
| |
|
|
| |
|
|
MOCKINGBIRD INVESTMENTS LLC | |
|
|
| |
|
|
| |
|
|
By: |
/s/ Paul M. Rady |
|
|
Name: |
Paul M. Rady |
|
|
Title: |
Manager |
|
Dated: November 5, 2018 |
| |
|
|
| |
|
|
By: |
/s/ Glen C. Warren, Jr. |
|
|
Name: |
Glen C. Warren, Jr. |
|
|
| |
|
Dated: November 5, 2018 |
| |
|
|
| |
|
|
CANTON INVESTMENT HOLDINGS LLC | |
|
|
| |
|
|
| |
|
|
By: |
/s/ Glen C. Warren, Jr. |
|
|
Name: |
Glen C. Warren, Jr. |
|
|
Title: |
Manager |
Confidential Working Draft Presentation to the Board of Directors Project Alpine Preliminary Review March 20, 2018
Confidential Working Draft Project Alpine Table of Contents Executive Summary Section 1 Valuation Benchmarking Section 2 Simplification Alternatives Section 3 AMGP Acquisition of AM Appendix A AMGP Acquisition of AM – Street Case Appendix B Supporting Materials Appendix C Precedent Transactions 2
Confidential Working Draft Project Alpine Executive Summary • We have evaluated selected “simplification” strategies which would combine AM and AMGP and/or eliminate the IDR mechanism • The optimal mechanism for combining AM and AMGP is via AMGP acquiring AM – Results in a simple C-Corp structure (for tax purposes only), increasingly the vehicle preferred by the market – Provides tax basis step-up and concomitant shelter and therefore improved distributions relative to other combination alternatives – Is however taxable to AM unitholders including AR, mitigated somewhat by public unitholders’ relatively high estimated average tax basis of $23.53 per unit and AR’s $3Bn of NOLs • In this presentation we will: – Benchmark AM and AMGP trading levels and performance – Review relative attributes and financial impact of selected simplification alternatives – Analyze financial impact of AMGP buying AM – Evaluate potential trading levels of the pro forma combined entity 3
Confidential Working Draft Project Alpine Section 1 Valuation Benchmarking 4
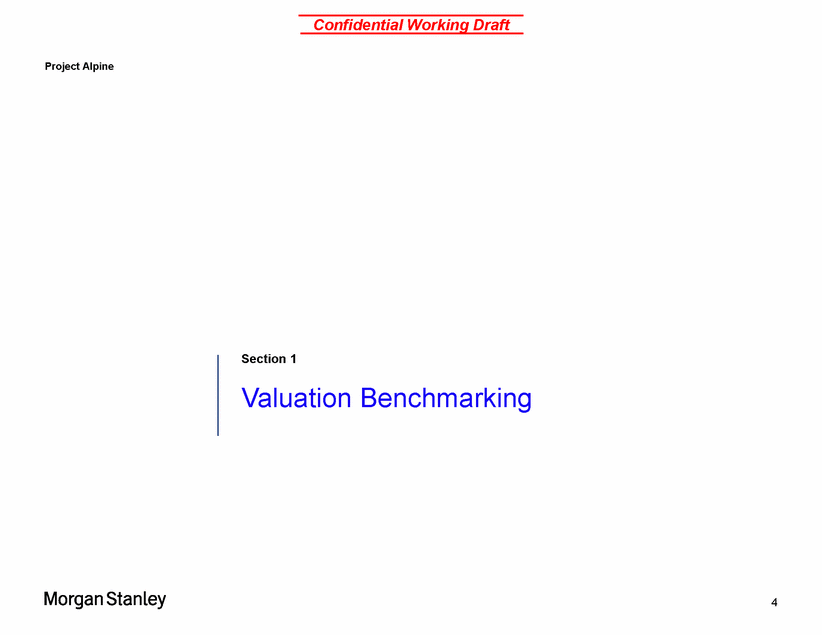
Confidential Working Draft Project Alpine Antero Family Structure Overview Sponsors(1) Public 5 Notes 1. Includes senior management, Warburg Pincus, Yorktown, and Series B units on a fully diluted basis Sr. Mgmt &Public 68%32% NYSE: AMGP EV: $3.2Bn AV: $3.2Bn Non-Economic GP interest 53%IDRs 47% NYSE: AM EV: $4.9Bn AV: $6.1Bn VALUATION BENCHMARKING
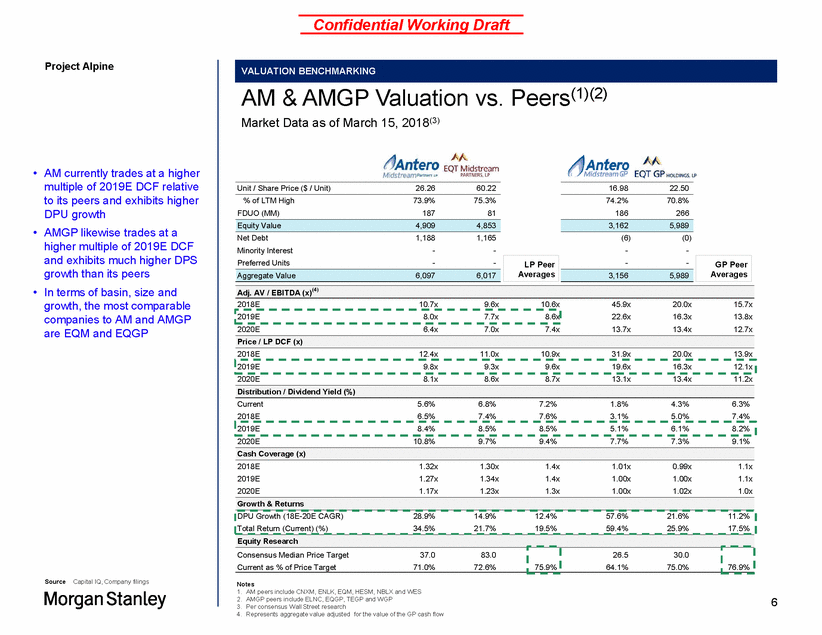
Confidential Working Draft Project Alpine Peers(1)(2) AM & AMGP Valuation vs. Market Data as of March 15, 2018(3) • AM currently trades at a higher multiple of 2019E DCF relative to its peers and exhibits higher DPU growth AMGP likewise trades at a higher multiple of 2019E DCF and exhibits much higher DPS growth than its peers In terms of basin, size and growth, the most comparable companies to AM and AMGP are EQM and EQGP Unit / Share Price ($ / Unit) 26.26 60.22 16.98 22.50 % of LTM High FDUO (MM) 73.9% 187 75.3% 81 74.2% 186 70.8% 266 • Net Debt Minority Interest 1,188 - 1,165 - (6) - (0) - • 2018E 10.7x 9.6x 10.6x 45.9x 22.6x 13.7x 20.0x 16.3x 13.4x 15.7x 13.8x 12.7x 2020E 6.4x 7.0x 7.4x 2018E 12.4x 11.0x 10.9x 31.9x 20.0x 13.9x 2020E 8.1x 8.6x 8.7x 13.1x 13.4x 11.2x Current 2018E 5.6% 6.5% 6.8% 7.4% 7.2% 7.6% 1.8% 3.1% 4.3% 5.0% 6.3% 7.4% 2020E 10.8% 9.7% 9.4% 7.7% 7.3% 9.1% 2018E 2019E 2020E 1.32x 1.27x 1.17x 1.30x 1.34x 1.23x 1.4x 1.4x 1.3x 1.01x 1.00x 1.00x 0.99x 1.00x 1.02x 1.1x 1.1x 1.0x Source Capital IQ, Company filings Notes 1. AM peers include CNXM, ENLK, EQM, HESM, NBLX and WES 2. AMGP peers include ELNC, EQGP, TEGP and WGP 3. Per consensus Wall Street research 4. Represents aggregate value adjusted for the value of the GP cash flow 6 Growth & Returns DPU Growth (18E-20E CAGR)28.9%14.9%12.4%57.6%21.6%11.2% Total Return (Current) (%)34.5%21.7%19.5%59.4%25.9%17.5% Equity Research Consensus Median Price Target37.083.0 Current as % of Price Target71.0%72.6% 75.9% 26.530.0 64.1%75.0% 76.9% Cash Coverage (x) 2019E8.4%8.5%8.5%5.1%6.1%8.2% Distribution / Dividend Yield (%) 2019E9.8x9.3x9.6x19.6x16.3x12.1x Price / LP DCF (x) 2019E8.0x7.7x8.6x Adj. AV / EBITDA (x)(4) Preferred Units--LP Peer Averages --GP Peer Averages Aggregate Value6,0976,017 3,1565,989 3,1625,989 Equity Value4,9094,853 VALUATION BENCHMARKING
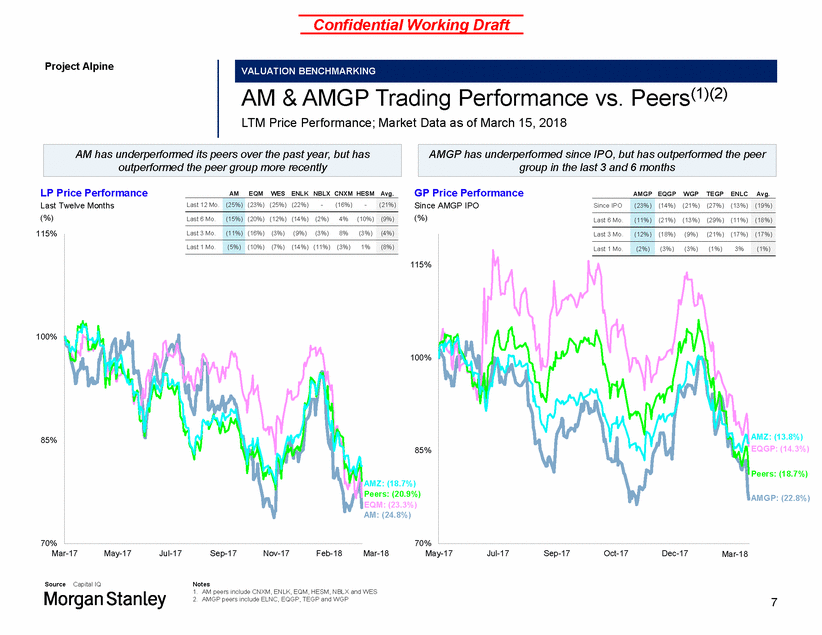
Confidential Working Draft Project Alpine Peers(1)(2) AM & AMGP Trading Performance LTM Price Performance; Market Data as of March 15, 2018 vs. LP Price Performance Last Twelve Months (%) GP Price Performance Since AMGP IPO (%) AM EQM WES ENLK NBLX CNXM HESM Avg. AMGP EQGP WGP TEGP ENLC Avg. 115% 115% 100% 100% AMZ: (13.8%) EQGP: (14.3%) 85% 85% Peers: (18.7%) AMZ: (18.7%) Peers: (20.9%) EQM: (23.3%) AM: (24.8%) AMGP: (22.8%) 70% 70% Mar-17 May-17 Jul-17 Sep-17 Nov-17 Feb-18 Mar-18 May-17 Jul-17 Sep-17 Oct-17 Dec-17 FMeabr-18 Source Capital IQ Notes 1. AM peers include CNXM, ENLK, EQM, HESM, NBLX and WES 2. AMGP peers include ELNC, EQGP, TEGP and WGP 7 Last 12 Mo. (25%) (23%) (25%) (22%)-(16%)-(21%) Last 6 Mo. (15%) (20%) (12%) (14%) (2%)4% (10%) (9%) Last 3 Mo. (11%) (16%) (3%) (9%) (3%)8%(3%) (4%) Last 1 Mo. (5%) (10%) (7%) (14%) (11%) (3%)1% (8%) Since IPO (23%) (14%) (21%) (27%) (13%) (19%) Last 6 Mo. (11%) (21%) (13%) (29%) (11%) (18%) Last 3 Mo. (12%) (18%) (9%) (21%) (17%) (17%) Last 1 Mo. (2%) (3%) (3%) (1%) 3% (1%) AMGP has underperformed since IPO, but has outperformed the peer group in the last 3 and 6 months AM has underperformed its peers over the past year, but has outperformed the peer group more recently VALUATION BENCHMARKING
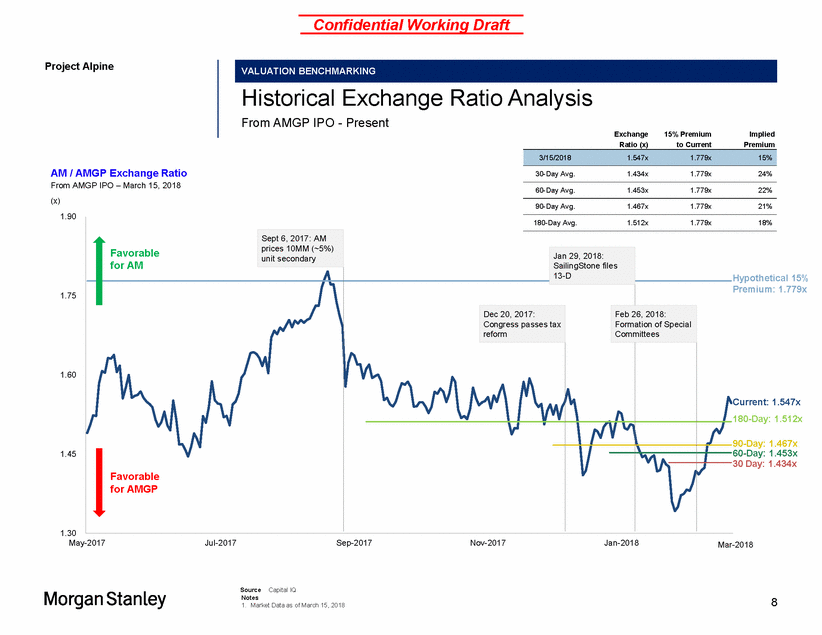
Confidential Working Draft Project Alpine Historical Exchange From AMGP IPO - Present Ratio Analysis Exchange Ratio (x) 15% Premium to Current Implied Premium AM / AMGP Exchange Ratio From AMGP IPO – March 15, 2018 (x) 30-Day Avg. 1.434x 1.779x 24% 60-Day Avg. 1.453x 1.779x 22% 90-Day Avg. 1.467x 1.779x 21% 1.90 18% for AM Hypothetical 15% Premium: 1.779x 1.75 1.60 Current: 1.547x 180-Day: 1.512x 90-Day: 1.467x 60-Day: 1.453x 30 Day: 1.434x 1.45 1.30 May-2017 Jul-2017 Sep-2017 Nov-2017 Jan-2018 Mar-2018 Source Capital IQ Notes 1. Market Data as of March 15, 2018 8 180-Day Avg.1.512x1.779x Favorable Sept 6, 2017: AM prices 10MM (~5%) unit secondary Jan 29, 2018: SailingStone files 13-D Favorable for AMGP Dec 20, 2017: Congress passes tax reform Feb 26, 2018: Formation of Special Committees 3/15/20181.547x1.779x15% VALUATION BENCHMARKING
Confidential Working Draft Project Alpine Section 2 Simplification Alternatives 9
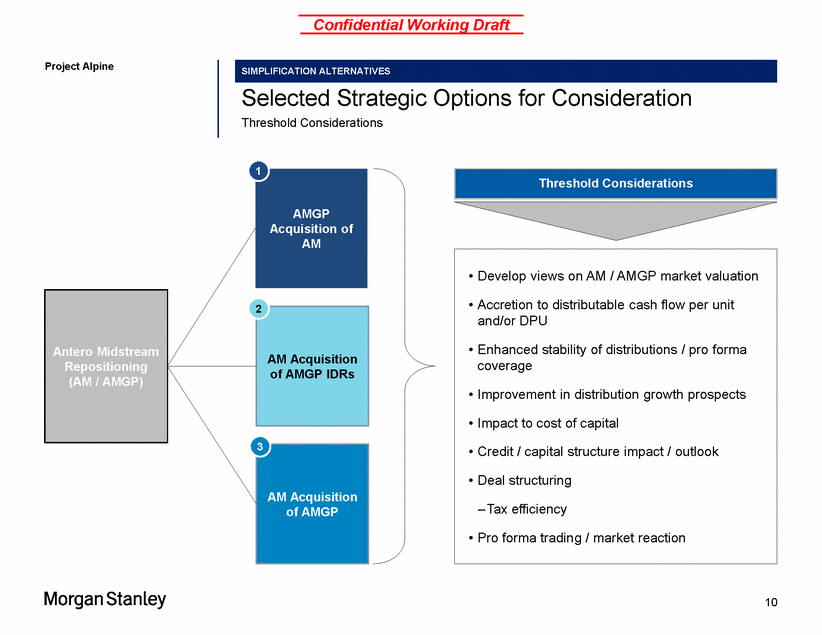
Confidential Working Draft Project Alpine Selected Strategic Threshold Considerations Options for Consideration of AMGP IDRs of AMGP 10 3 AM Acquisition Antero Midstream Repositioning (AM / AMGP) 2 AM Acquisition • Develop views on AM / AMGP market valuation • Accretion to distributable cash flow per unit and/or DPU • Enhanced stability of distributions / pro forma coverage • Improvement in distribution growth prospects • Impact to cost of capital • Credit / capital structure impact / outlook • Deal structuring – Tax efficiency • Pro forma trading / market reaction 1 AMGP Acquisition of AM Threshold Considerations SIMPLIFICATION ALTERNATIVES
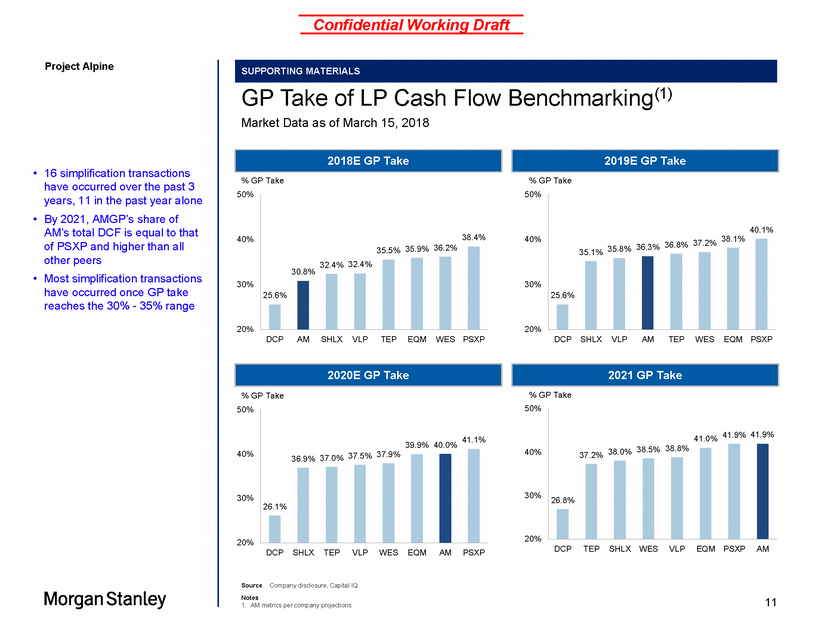
Confidential Working Draft Project Alpine Benchmarking(1) GP Take of LP Cash Market Data as of March 15, 2018 Flow • 16 simplification transactions have occurred over the past 3 years, 11 in the past year alone By 2021, AMGP’s share of AM’s total DCF is equal to that of PSXP and higher than all other peers Most simplification transactions have occurred once GP take reaches the 30% - 35% range % GP Take % GP Take 50% 50% • 40% 40% 35.1% 35.8% 36.3% 36.8% 6.2% 30.8% • 30% 30% 20% 20% DCP AM SHLX VLP TEP EQM WES PSXP DCP SHLX VLP AM TEP WES EQM PSXP % GP Take % GP Take 50% 50% 41.0% 38.5% 38.8% 40% 40% 30% 30% 20% 20% DCP TEP SHLX WESVLPEQM PSXP AM DCP SHLX TEP VLP WES EQM AM PSXP Source Company disclosure, Capital IQ Notes 1. AM metrics per company projections 11 39.9% 40.0% 41.1% 36.9% 37.0% 37.5% 37.9% 26.1% 41.9% 41.9% 37.2% 38.0% 26.8% 2020E GP Take 2021 GP Take 38.4% 35.5% 35.9% 3 32.4% 32.4% 25.6% 40.1% 37.2% 38.1% 25.6% 2018E GP Take 2019E GP Take SUPPORTING MATERIALS
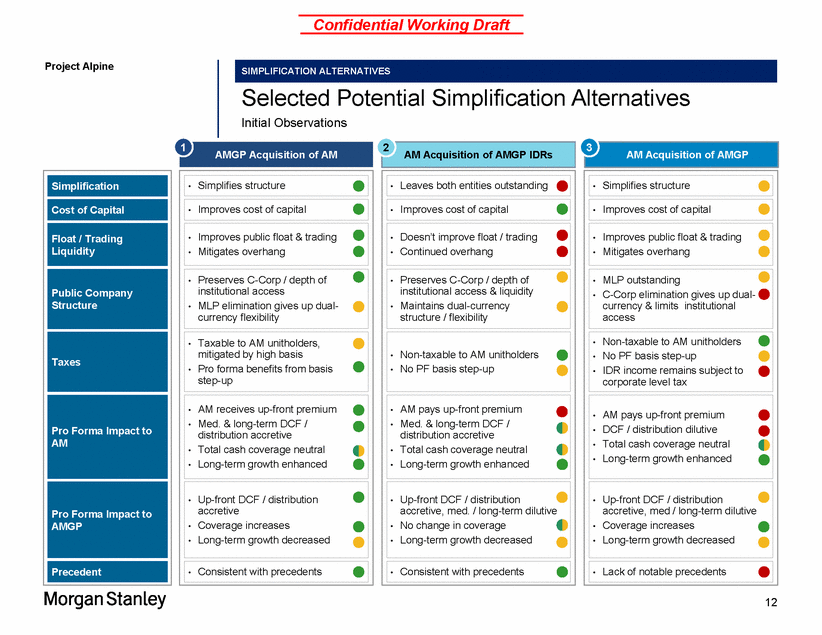
Confidential Working Draft Project Alpine Selected Potential Simplification Alternatives Initial Observations AM Acquisition of AMGP IDRs 12 AM Simplification Cost of Capital Float / Trading Liquidity Public Company Structure Taxes Pro Forma Impact to Pro Forma Impact to AMGP Precedent 2 • Long-term growth enhanced • Leaves both entities outstanding • Improves cost of capital • Doesn’t improve float / trading • Continued overhang • Preserves C-Corp / depth of institutional access & liquidity • Maintains dual-currency structure / flexibility • Non-taxable to AM unitholders • No PF basis step-up • AM pays up-front premium • Med. & long-term DCF / distribution accretive • Total cash coverage neutral • Up-front DCF / distribution accretive, med. / long-term dilutive • No change in coverage • Long-term growth decreased • Consistent with precedents 3 AM Acquisition of AMGP corporate level tax • Simplifies structure • Improves cost of capital • Improves public float & trading • Mitigates overhang • MLP outstanding • C-Corp elimination gives up dual-currency & limits institutional access • Non-taxable to AM unitholders • No PF basis step-up • IDR income remains subject to • AM pays up-front premium • DCF / distribution dilutive • Total cash coverage neutral • Long-term growth enhanced • Up-front DCF / distribution accretive, med / long-term dilutive • Coverage increases • Long-term growth decreased • Lack of notable precedents 1 AMGP Acquisition of AM • Simplifies structure • Improves cost of capital • Improves public float & trading • Mitigates overhang • Preserves C-Corp / depth of institutional access • MLP elimination gives up dual-currency flexibility • Taxable to AM unitholders, mitigated by high basis • Pro forma benefits from basis step-up • AM receives up-front premium • Med. & long-term DCF / distribution accretive • Total cash coverage neutral • Long-term growth enhanced • Up-front DCF / distribution accretive • Coverage increases • Long-term growth decreased • Consistent with precedents SIMPLIFICATION ALTERNATIVES
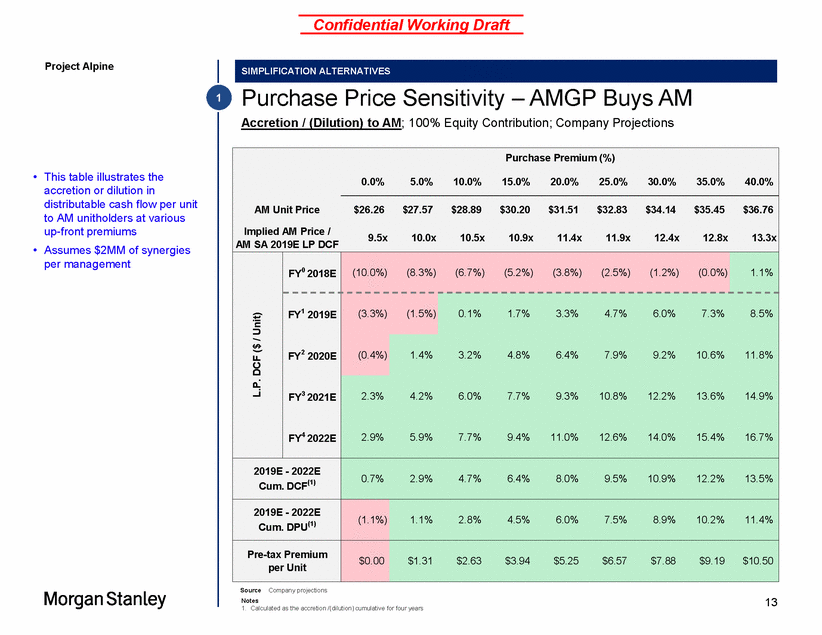
Confidential Working Draft Project Alpine Purchase Price Sensitivity – AMGP Buys AM Accretion / (Dilution) to AM; 100% Equity Contribution; Company Projections 1 • This table illustrates the accretion or dilution in distributable cash flow per unit to AM unitholders at various up-front premiums Assumes $2MM of synergies per management 9.5x 10.0x 10.5x 10.9x 11.4x 11.9x 12.4x 12.8x 13.3x AM SA 2019E LP DCF • Source Company projections Notes 1. Calculated as the accretion /(dilution) cumulative for four years 13 Purchase Premium (%) 0.0% 5.0% 10.0% 15.0% 20.0% 25.0% 30.0% 35.0% 40.0% AM Unit Price $26.26 $27.57 $28.89 $30.20 $31.51 $32.83 $34.14 $35.45 $36.76 Implied AM Price / FY0 2018E (10.0%) (8.3%) (6.7%) (5.2%) (3.8%) (2.5%) (1.2%) (0.0%) 1.1% Unit) FY1 2019E (3.3%) (1.5%) 0.1% 1.7% 3.3% 4.7% 6.0% 7.3% 8.5% DCF ($ / FY2 2020E (0.4%) 1.4% 3.2% 4.8% 6.4% 7.9% 9.2% 10.6% 11.8% L.P. FY3 2021E FY4 2022E 2.3% 4.2% 6.0% 7.7% 9.3% 10.8% 12.2% 13.6% 14.9% 2.9% 5.9% 7.7% 9.4% 11.0% 12.6% 14.0% 15.4% 16.7% 2019E - 2022E Cum. DCF(1) 0.7% 2.9% 4.7% 6.4% 8.0% 9.5% 10.9% 12.2% 13.5% 2019E - 2022E Cum. DPU(1) (1.1%) 1.1% 2.8% 4.5% 6.0% 7.5% 8.9% 10.2% 11.4% Pre-tax Premium per Unit $0.00 $1.31 $2.63 $3.94 $5.25 $6.57 $7.88 $9.19 $10.50 SIMPLIFICATION ALTERNATIVES
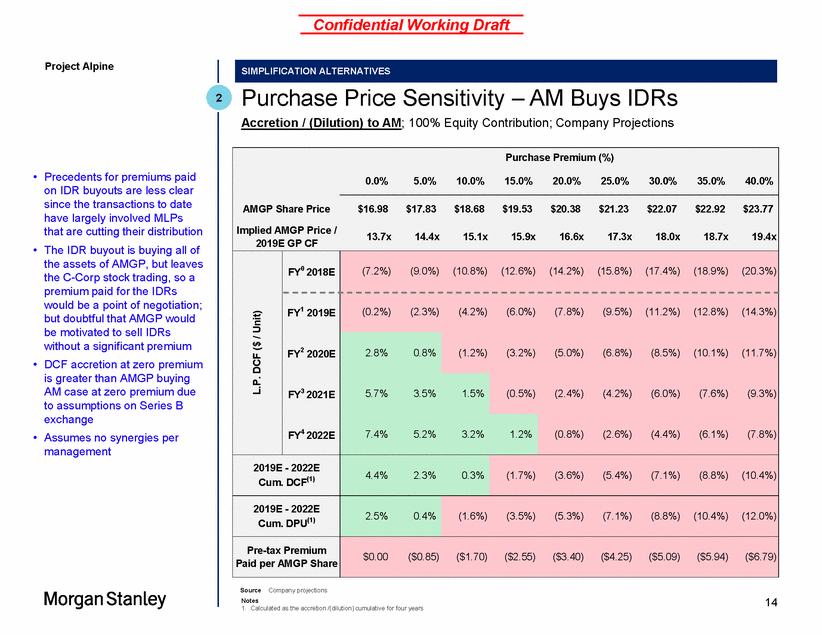
Confidential Working Draft Project Alpine Purchase Price Sensitivity – AM Buys IDRs Accretion / (Dilution) to AM; 100% Equity Contribution; Company Projections 2 • Precedents for premiums paid on IDR buyouts are less clear since the transactions to date have largely involved MLPs that are cutting their distribution The IDR buyout is buying all of the assets of AMGP, but leaves the C-Corp stock trading, so a premium paid for the IDRs would be a point of negotiation; but doubtful that AMGP would be motivated to sell IDRs without a significant premium DCF accretion at zero premium is greater than AMGP buying AM case at zero premium due to assumptions on Series B exchange Assumes no synergies per management 13.7x 14.4x 15.1x 15.9x 16.6x 17.3x 18.0x 18.7x 19.4x 2019E GP CF • • • Source Company projections Notes 1. Calculated as the accretion /(dilution) cumulative for four years 14 Purchase Premium (%) 0.0% 5.0% 10.0% 15.0% 20.0% 25.0% 30.0% 35.0% 40.0% AMGP Share Price $16.98 $17.83 $18.68 $19.53 $20.38 $21.23 $22.07 $22.92 $23.77 Implied AMGP Price / Unit) FY0 2018E (7.2%) (9.0%) (10.8%) (12.6%) (14.2%) (15.8%) (17.4%) (18.9%) (20.3%) FY1 2019E (0.2%) (2.3%) (4.2%) (6.0%) (7.8%) (9.5%) (11.2%) (12.8%) (14.3%) DCF ($ / FY2 2020E 2.8% 0.8% (1.2%) (3.2%) (5.0%) (6.8%) (8.5%) (10.1%) (11.7%) L.P. FY3 2021E 5.7% 3.5% 1.5% (0.5%) (2.4%) (4.2%) (6.0%) (7.6%) (9.3%) FY4 2022E 7.4% 5.2% 3.2% 1.2% (0.8%) (2.6%) (4.4%) (6.1%) (7.8%) 2019E - 2022E Cum. DCF(1) 4.4% 2.3% 0.3% (1.7%) (3.6%) (5.4%) (7.1%) (8.8%) (10.4%) 2019E - 2022E Cum. DPU(1) 2.5% 0.4% (1.6%) (3.5%) (5.3%) (7.1%) (8.8%) (10.4%) (12.0%) Pre-tax Premium Paid per AMGP Share $0.00 ($0.85) ($1.70) ($2.55) ($3.40) ($4.25) ($5.09) ($5.94) ($6.79) SIMPLIFICATION ALTERNATIVES
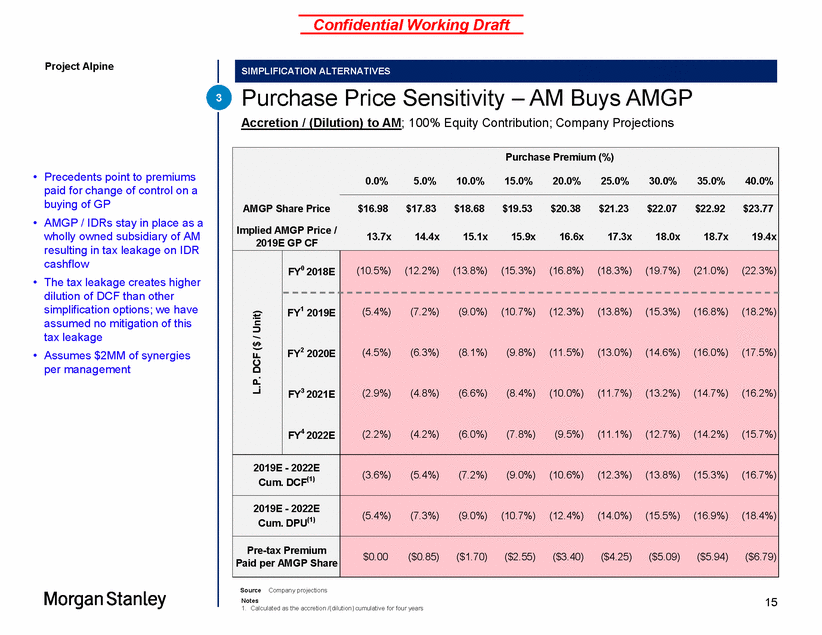
Confidential Working Draft Project Alpine Purchase Price Sensitivity – AM Buys AMGP Accretion / (Dilution) to AM; 100% Equity Contribution; Company Projections 3 • Precedents point to premiums paid for change of control on a buying of GP AMGP / IDRs stay in place as a wholly owned subsidiary of AM resulting in tax leakage on IDR cashflow The tax leakage creates higher dilution of DCF than other simplification options; we have assumed no mitigation of this tax leakage Assumes $2MM of synergies per management • • • Source Company projections Notes 1. Calculated as the accretion /(dilution) cumulative for four years 15 Purchase Premium (%) 0.0% 5.0% 10.0% 15.0% 20.0% 25.0% 30.0% 35.0% 40.0% AMGP Share Price $16.98 $17.83 $18.68 $19.53 $20.38 $21.23 $22.07 $22.92 $23.77 Implied AMGP Price / 2019E GP CF 13.7x 14.4x 15.1x 15.9x 16.6x 17.3x 18.0x 18.7x 19.4x L.P. DCF ($ / Unit) FY0 2018E (10.5%) (12.2%) (13.8%) (15.3%) (16.8%) (18.3%) (19.7%) (21.0%) (22.3%) FY1 2019E FY2 2020E FY3 2021E FY4 2022E (5.4%) (7.2%) (9.0%) (10.7%) (12.3%) (13.8%) (15.3%) (16.8%) (18.2%) (4.5%) (6.3%) (8.1%) (9.8%) (11.5%) (13.0%) (14.6%) (16.0%) (17.5%) (2.9%) (4.8%) (6.6%) (8.4%) (10.0%) (11.7%) (13.2%) (14.7%) (16.2%) (2.2%) (4.2%) (6.0%) (7.8%) (9.5%) (11.1%) (12.7%) (14.2%) (15.7%) 2019E - 2022E Cum. DCF(1) (3.6%) (5.4%) (7.2%) (9.0%) (10.6%) (12.3%) (13.8%) (15.3%) (16.7%) 2019E - 2022E Cum. DPU(1) (5.4%) (7.3%) (9.0%) (10.7%) (12.4%) (14.0%) (15.5%) (16.9%) (18.4%) Pre-tax Premium Paid per AMGP Share $0.00 ($0.85) ($1.70) ($2.55) ($3.40) ($4.25) ($5.09) ($5.94) ($6.79) SIMPLIFICATION ALTERNATIVES
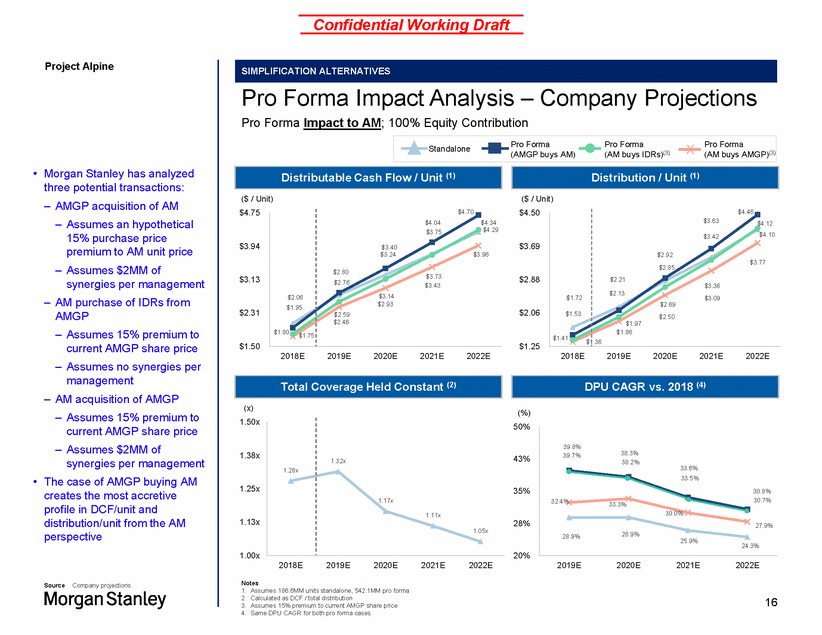
Confidential Working Draft Project Alpine Pro Forma Impact Analysis – Company Projections Pro Forma Impact to AM; 100% Equity Contribution (AM buys IDRs)(3) (AM buys AMGP)(3) • Morgan Stanley has analyzed three potential transactions: – AMGP acquisition of AM – Assumes an hypothetical 15% purchase price premium to AM unit price – Assumes $2MM of synergies per management – AM purchase of IDRs from AMGP – Assumes 15% premium to current AMGP share price – Assumes no synergies per management – AM acquisition of AMGP – Assumes 15% premium to current AMGP share price – Assumes $2MM of synergies per management The case of AMGP buying AM creates the most accretive profile in DCF/unit and distribution/unit from the AM perspective ($ / Unit) ($ / Unit) $4.75 $4.50 $3.75 $3.94 $3.69 $2.85 $3.13 $2.88 $3.43 $2.31 $2.06 .36 $1.50 $1.25 2018E 2019E 2020E 2021E 2022E 2018E 2019E 2020E 2021E 2022E (x) 1.50x (%) 50% 1.38x 43% 33.6% • 1.25x 35% 1.13x 28% 25.9% 1.00x 20% 2018E 2019E 2020E 2021E 2022E 2019E 2020E 2021E 2022E Notes 1. Assumes 186.6MM units standalone, 542.1MM pro forma 2. Calculated as DCF / total distribution 3. Assumes 15% premium to current AMGP share price 4. Same DPU CAGR for both pro forma cases Source Company projections 16 39.8% 39.7%38.3% 38.2% 33.5% 30.8% 32.4%33.3%30.7% 30.0% 27.9% 28.9%28.9% 24.3% 1.28x 1.32x 1.17x 1.11x 1.05x Total Coverage Held Constant (2) Text TitleDPU CAGR vs. 2018 (4) Text Subtitle $2.06 $1.95 $1.80 $1.75 $4.70 $4.04$4.34 $4.29 $3.40 $3.24$3.96 $2.80 $2.76$3.73 $3.14 $2.93 $2.59 $2.46 $1.72 $1.53 $1.41$1 $4.46 $3.63$4.12 $3.42$4.10 $2.92 $3.77 $2.21 $3.36 $2.13 $3.09 $2.69 $2.50 $1.97 $1.86 Standal onePro Forma (AMGP buys AM) Pro FormaX Pro Forma Distributable Cash Flow / Unit (1) Distribution / Unit (1) SIMPLIFICATION ALTERNATIVES
Confidential Working Draft Project Alpine Section 3 AMGP Acquisition of AM 17
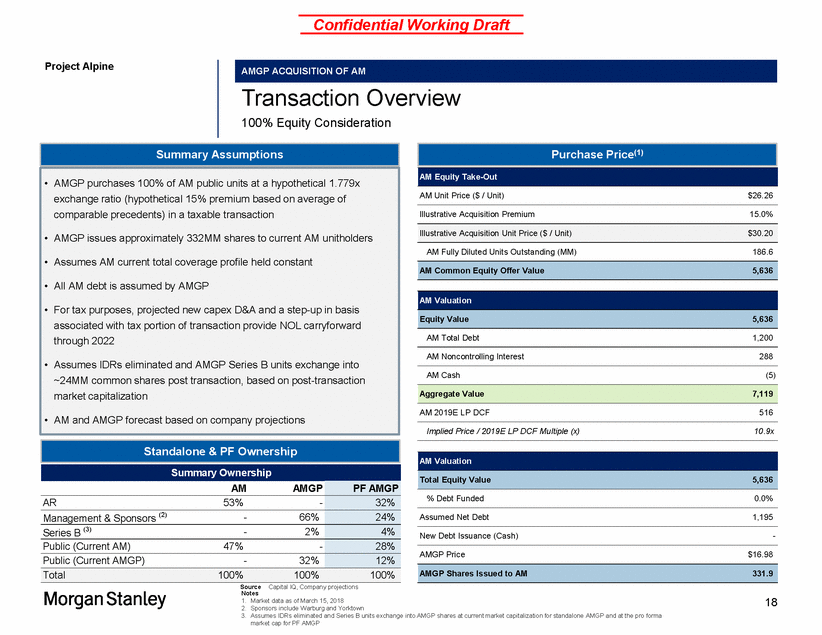
Confidential Working Draft Project Alpine Transaction Overview 100% Equity Consideration AM Unit Price ($ / Unit) $26.26 Illustrative Acquisition Premium 15.0% AM Fully Diluted Units Outstanding (MM) 186.6 AM Total Debt 1,200 AM Noncontrolling Interest 288 AM Cash (5) AM 2019E LP DCF 516 Implied Price / 2019E LP DCF Multiple (x) 10.9x % Debt Funded 0.0% Assumed Net Debt 1,195 New Debt Issuance (Cash) - AMGP Price $16.98 Source Capital IQ, Company projections Notes 1. Market data as of March 15, 2018 2. Sponsors include Warburg and Yorktown 3. Assumes IDRs eliminated and Series B units exchange into AMGP shares at current market capitalization for standalone AMGP and at the pro forma market cap for PF AMGP 18 AMGP Shares Issued to AM331.9 AM Valuation Total Equity Value5,636 Standalone & PF Ownership Summary Ownership AMAMGP PF AMGP AR 53% - 32% Management & Sponsors (2) - 66% 24% Series B (3) - 2% 4% Public (Current AM) 47% - 28% Public (Current AMGP) - 32% 12% Total 100% 100% 100% Aggregate Value7,119 AM Valuation Equity Value5,636 AM Common Equity Offer Value5,636 Illustrative Acquisition Unit Price ($ / Unit)$30.20 Summary Assumptions • AMGP purchases 100% of AM public units at a hypothetical 1.779x exchange ratio (hypothetical 15% premium based on average of comparable precedents) in a taxable transaction • AMGP issues approximately 332MM shares to current AM unitholders • Assumes AM current total coverage profile held constant • All AM debt is assumed by AMGP • For tax purposes, projected new capex D&A and a step-up in basis associated with tax portion of transaction provide NOL carryforward through 2022 • Assumes IDRs eliminated and AMGP Series B units exchange into ~24MM common shares post transaction, based on post-transaction market capitalization • AM and AMGP forecast based on company projections Purchase Price(1) AM Equity Take-Out AMGP ACQUISITION OF AM
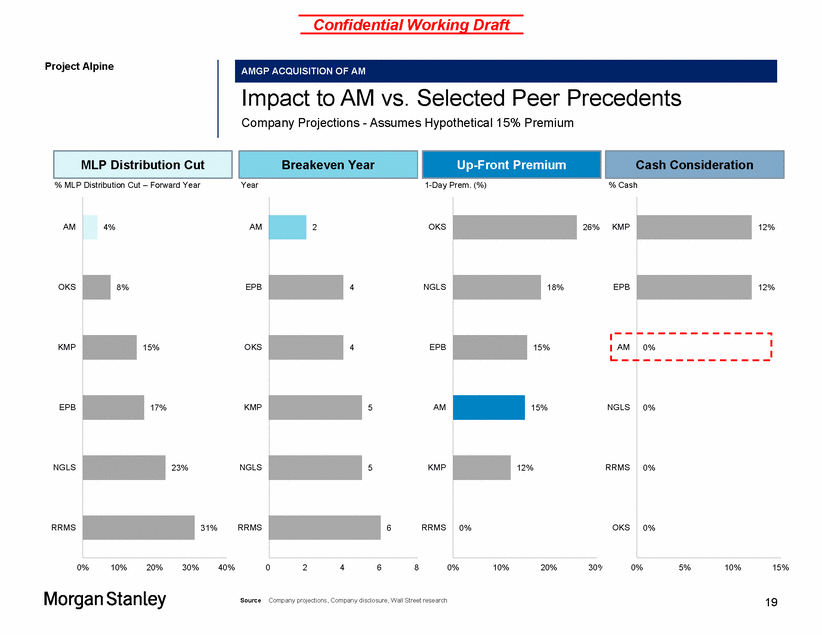
Confidential Working Draft Project Alpine Impact to AM vs. Selected Peer Precedents Company Projections - Assumes Hypothetical 15% Premium % MLP Distribution Cut – Forward Year Year 1-Day Prem. (%) % Cash AM AM OKS 26% OKS EPB NGLS KMP OKS EPB EPB KMP AM NGLS NGLS NGLS KMP RRMS RRMS RRMS RRMS 0% 10% 20% 30% 40% 0 2 4 6 8 0% 10% 20% 30% 0% 5% 10% 15% 19 Source Company projections, Company disclosure, Wall Street research KMP EPB 12% 12% AM 0% OKS 0% 0% 0% 18% 15% 15% 12% 0% 2 4 4 5 5 6 + 4% 8% 15% 17% 23% 31% Cash Consideration Up-Front Premium Breakeven Year MLP Distribution Cut AMGP ACQUISITION OF AM
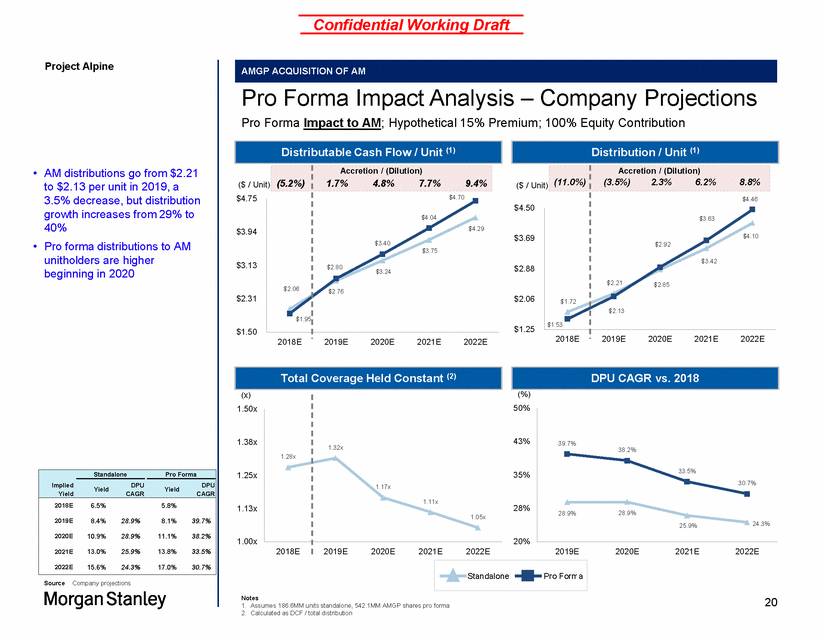
Confidential Working Draft Project Alpine Pro Forma Impact Analysis – Company Projections Pro Forma Impact to AM; Hypothetical 15% Premium; 100% Equity Contribution • AM distributions go from $2.21 to $2.13 per unit in 2019, a 3.5% decrease, but distribution growth increases from 29% to 40% Pro forma distributions to AM unitholders are higher beginning in 2020 $4.75 $4.50 • $1.25 $1.50 2018E2019E 2020E 2021E 2022E 2018E2019E 2020E 2021E 2022E (%) 50% (x) 1.50x 1.38x 43% 38.2% 1.25x 35% Yield Yield 1.13x 28% 24.3% 25.9% 1.00x 20% 2019E 2020E 2021E 2022E Source Company projections Notes 1. Assumes 186.6MM units standalone, 542.1MM AMGP shares pro forma 2. Calculated as DCF / total distribution 20 StandalonePro Forma 39.7% 33.5% 30.7% 28.9%28.9% 1.28x 1.32x 1.17x 1.11x 1.05x 2018E 2019E2020E2021E2022E Standalone Pro Forma ImpliedDPUDPU YieldCAGRCAGR 2018E6.5% 5.8% 2019E8.4% 28.9% 8.1% 39.7% 2020E10.9% 28.9% 11.1% 38.2% 2021E13.0% 25.9% 13.8% 33.5% 2022E15.6% 24.3% 17.0% 30.7% Total Coverage Held Constant (2) DPU CAGR vs. 2018 Distributable Cash Flow / Unit (1) ($ / Unit) (5.2%) Accretion / (Dilution) 1.7% 4.8% 7.7% 9.4% $4.70 $4.04 $4.29 $3.40 $3.75 $2.80$3.24 $2.76 $3.94 $3.13 $2.31 $2.06 $1.95 Distribution / Unit (1) ($ / Unit) (11.0%) Accretion / (Dilution) (3.5%)2.3%6.2%8.8% $4.46 $3.63 $4.10 $2.92 $3.42 $2.21$2.85 $2.13 $3.69 $2.88 $2.06 $1.72 $1.53 AMGP ACQUISITION OF AM
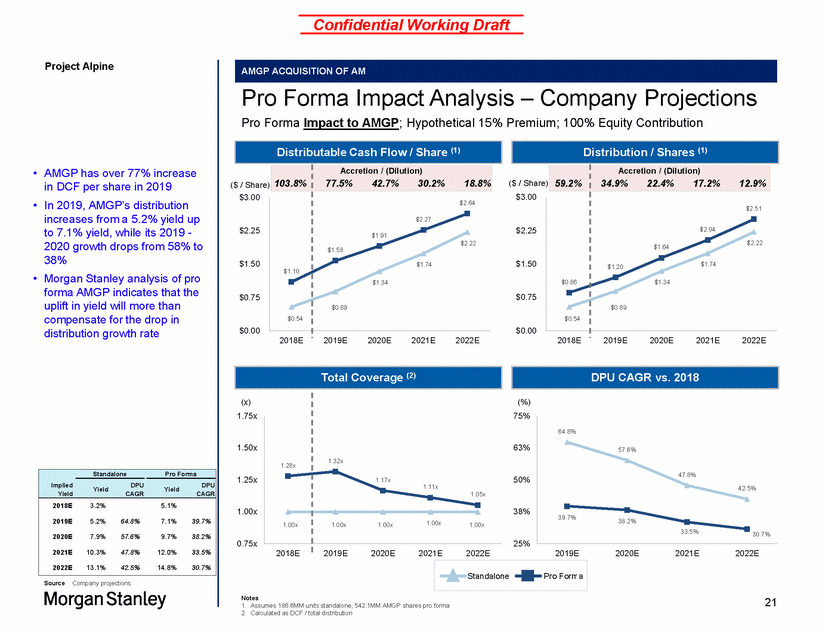
Confidential Working Draft Project Alpine Pro Forma Impact Analysis – Company Projections Pro Forma Impact to AMGP; Hypothetical 15% Premium; 100% Equity Contribution • AMGP has over 77% increase in DCF per share in 2019 In 2019, AMGP’s distribution increases from a 5.2% yield up to 7.1% yield, while its 2019 - 2020 growth drops from 58% to 38% Morgan Stanley analysis of pro forma AMGP indicates that the uplift in yield will more than compensate for the drop in distribution growth rate ($ / Share) 103.8% 18.8% ( $3.00 • • $0.00 $0.00 2018E2019E 2020E 2021E 2022E 2018E2019E 2020E 2021E 2022E (x) 1.75x (%) 75% 1.50x 63% 1.25x 50% 1.00x 38% .00x 0.75x 25% 2019E 2020E 2021E 2022E Source Company projections Notes 1. Assumes 186.6MM units standalone, 542.1MM AMGP shares pro forma 2. Calculated as DCF / total distribution 21 StandalonePro Forma 64.8% 57.6% 47.8% 42.5% 39.7%38.2% 33.5%30.7% 1.2 1 8x 1.32x 1.17x 1.11x 1.0 5x 0x 1.00x1.00x1.00x1.0 2018E 2019E2020E2021E2022E Standalone Pro Forma Implied Yield DPU Yield DPU Yield CAGR CAGR 2018E 3.2% 5.1% 2019E 5.2% 64.8% 7.1% 39.7% 2020E 7.9% 57.6% 9.7% 38.2% 2021E 10.3% 47.8% 12.0% 33.5% 2022E 13.1% 42.5% 14.8% 30.7% Total Coverage (2) DPU CAGR vs. 2018 Distributable Cash Flow / Share (1) Accretion / (Dilution) 77.5% 42.7% 30.2% $3.00 $2.25 $1.50 $0.75 $1.10 $0.54 $2.64 $2.27 $1.91 $2.22 $1.58 $1.74 $1.34 $0.89 Distribution / Shares (1) $ / Share) 59.2% Accretion / (Dilution) 34.9% 22.4% 17.2% 12.9% $2.51 $2.04 $2.22 $1.64 $1.20$1.74 $1.34 $0.89 $2.25 $1.50 $0.75 $0.86 $0.54 AMGP ACQUISITION OF AM
Confidential Working Draft Project Alpine Pro Forma AMGP Investment Highlights Market Data as of March 15, 2018 • Under the hypothetical exchange ratio, AM unitholders would have the largest pro forma ownership position in AMGP – AR would own 32% of AMGP – AM public holders would own 28% of AMGP – AR and AM public holders would own a combined 60% of AMGP As a result, it is critical to understand how AMGP would be expected to trade post the transaction to quantify the value implications for AM holders beyond the implied upfront premium – Pro forma AMGP will be extremely well positioned as a high-growth C-Corp with substantial current yield – Analysis of pro forma yield, growth and return attributes suggests higher trading levels for AMGP Post-transaction, AMGP to be positioned as a leading midstream C-Corp with a number of factors that distinguish it from its peers: Top 20 Midstream Companies Ranked by Market Capitalization $Bn, USD EPD 53.9 Fastest growing midstream C-Corp Distribution growth exceeding 30% through 2022 Highest total return midstream C-Corp Pro forma 3-year implied IRR of ~30% Organic growth driven by backlog of $2.7Bn of projects Strong balance sheet with 2.2x 2019E leverage Ability to grow without equity issuance Top-tier asset base, proven growth track record Top-tier Appalachian management team Depth of institutional access spanning traditional midstream investors and sector agnostic growth investors Mitigation of overhang on secondary sell-downs / offerings Significant enhancement of public float to ~$3.7Bn vs. standalone AM and AMGP of ~$2.3Bn and $1.0Bn, respectively 53.4 ENB - TRP KMI WPZ MPLX OKE • WMB ETP SEP PAA ETE CQP MMP LNG - TRGP ANDX - 22 Source Company projections MLPC-Corp 38.0 36.0 34.2 26.9 23.3 22.1 19.3 17.2 17.0 15.7 14.2 14.0 12.5 10.1 9.7 9.2PF AMGP WES WGP 7.7 7.6 AMGP ACQUISITION OF AM

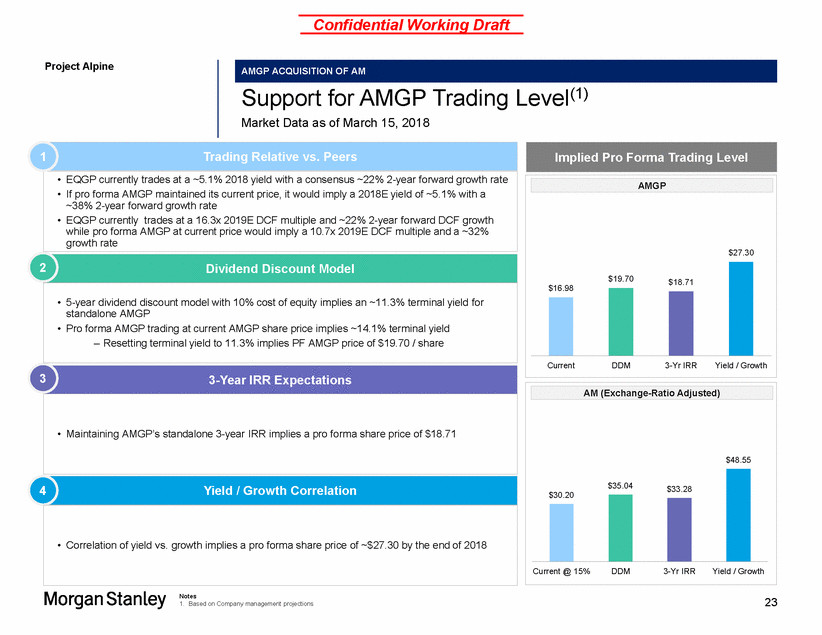
Confidential Working Draft Project Alpine Level(1) Support for AMGP Trading Market Data as of March 15, 2018 1 Trading Relative vs. Peers 2 Dividend Discount Model 3 3-Year IRR Expectations 4 Yield / Growth Correlation Notes 1. Based on Company management projections 23 $48.55 Current @ 15%DDM3-Yr IRRYield / Growth $35.04$33.28 $30.20 AM (Exchange-Ratio Adjusted) Implied Pro Forma Trading Level $27.30 $16.98 CurrentDDM3-Yr IRRYield / Growth $19.70$18.71 AMGP • EQGP currently trades at a ~5.1% 2018 yield with a consensus ~22% 2-year forward growth rate • If pro forma AMGP maintained its current price, it would imply a 2018E yield of ~5.1% with a ~38% 2-year forward growth rate • EQGP currently trades at a 16.3x 2019E DCF multiple and ~22% 2-year forward DCF growth while pro forma AMGP at current price would imply a 10.7x 2019E DCF multiple and a ~32% growth rate • 5-year dividend discount model with 10% cost of equity implies an ~11.3% terminal yield for standalone AMGP • Pro forma AMGP trading at current AMGP share price implies ~14.1% terminal yield – Resetting terminal yield to 11.3% implies PF AMGP price of $19.70 / share • Maintaining AMGP’s standalone 3-year IRR implies a pro forma share price of $18.71 • Correlation of yield vs. growth implies a pro forma share price of ~$27.30 by the end of 2018 AMGP ACQUISITION OF AM
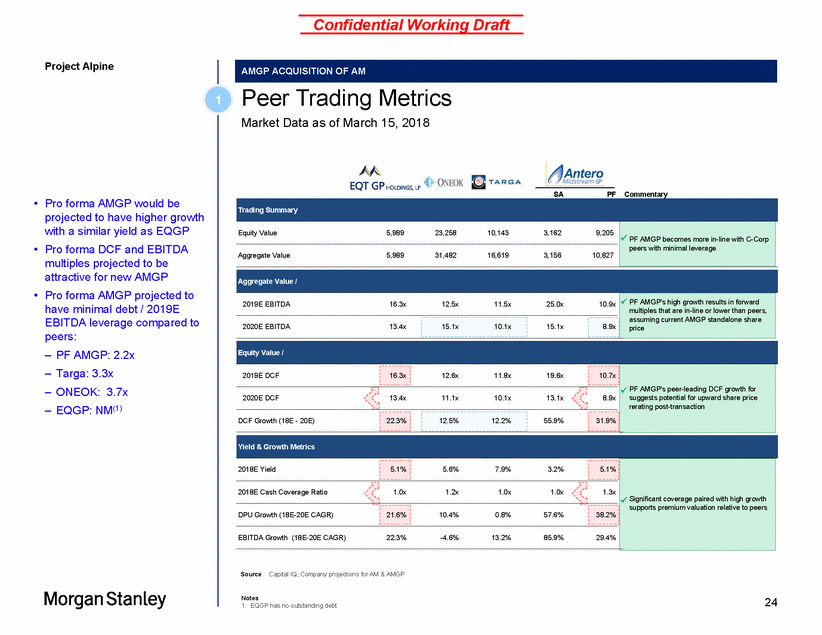
Confidential Working Draft Project Alpine Peer Trading Metrics Market Data as of March 15, 2018 1 SA PF Commentary • Pro forma AMGP would be projected to have higher growth with a similar yield as EQGP Pro forma DCF and EBITDA multiples projected to be attractive for new AMGP Pro forma AMGP projected to have minimal debt / 2019E EBITDA leverage compared to peers: – PF AMGP: 2.2x – Targa: 3.3x – ONEOK: 3.7x – EQGP: NM(1) • • supports premium valuation relative to peers Source Capital IQ, Company projections for AM & AMGP Notes 1. EQGP has no outstanding debt 24 Yield & Growth Metrics 2018E Yield 5.1% 5.6% 7.9% 3.2% 5.1% Significant coverage paired with high growth 2018E Cash Coverage Ratio 1.0x 1.2x 1.0x 1.0x 1.3x DPU Growth (18E-20E CAGR) 21.6% 10.4% 0.8% 57.6% 38.2% EBITDA Growth (18E-20E CAGR) 22.3% -4.6% 13.2% 85.9% 29.4% Equity Value / 2019E DCF 16.3x 12.6x 11.8x 19.6x 10.7x PF AMGP's peer-leading DCF growth for suggests potential for upward share price rerating post-transaction 2020E DCF 13.4x 11.1x 10.1x 13.1x 8.9x DCF Growth (18E - 20E) 22.3% 12.5% 12.2% 55.9% 31.9% Aggregate Value / 2019E EBITDA 16.3x 12.5x 11.5x 25.0x 10.9x PF AMGP's high growth results in forward multiples that are in-line or lower than peers, assuming current AMGP standalone share price 2020E EBITDA 13.4x 15.1x 10.1x 15.1x 8.9x Trading Summary Equity Value 5,989 23,258 10,143 3,162 9,205 PF AMGP becomes more in-line with C-Corp peers with minimal leverage Aggregate Value 5,989 31,482 16,619 3,156 10,827 AMGP ACQUISITION OF AM
Confidential Working Draft Project Alpine Dividend Discount Method Market Data as of March 15, 2018 – AMGP Buys AM 2 • Utilizing a 10% cost of equity and Wall Street research, the current share price implies a ~11.3% terminal yield after 2022 – Holding AMGP’s current terminal yield constant would imply a pro forma share price of $19.70 (~16% upside to current price) Pro forma for the transaction, AMGP would need a ~14.1% terminal yield to hold the current share price • 25 Source Capital IQ, Company Materials 20182019202020212022 Terminal Interest Expense(63)(90)(118)(136)(149) Cash Taxes ---- - Series B Payment ---- - Maint. Capex & Other(71)(43)(67) (48)(62) Coverage13020514812372 Period1.002.003.004.005.005.00 PV @ 10.0% Cost of Equity4235376687568445,977 Terminal Value Implied Terminal Yield 14.1% Undiscounted Terminal Value9,625 Total PV @ 10.0% Cost of Equity9,205 Current Share Price$16.98 Present Value AMGP Distributions465650889 1,107 1,360 Cash Flow Available596855 1,037 1,230 1,431 PF AMGP Distributions EBITDA730989 1,222 1,413 1,642 20182019202020212022 Terminal Interest Expense ---- - Cash Taxes(34)(56)(85)(110)(140) Series B Payment (7)(12)(20) (26)(34) Maint. Capex & Other ---- - Coverage-----Period1.002.003.004.005.005.00 PV @ 10.0% Cost of Equity911371872222572,268 Terminal Value Implied Terminal Yield 11.3% Undiscounted Terminal Value3,652 Total PV @ 10.0% Cost of Equity3,162 Current Share Price$16.98 Present Value AMGP Distributions100165249324414 Cash Flow Available100165249324414 Standalone AMGP Distributions EBITDA141234353460587 Pro Forma AMGP Standalone AMGP AMGP ACQUISITION OF AM
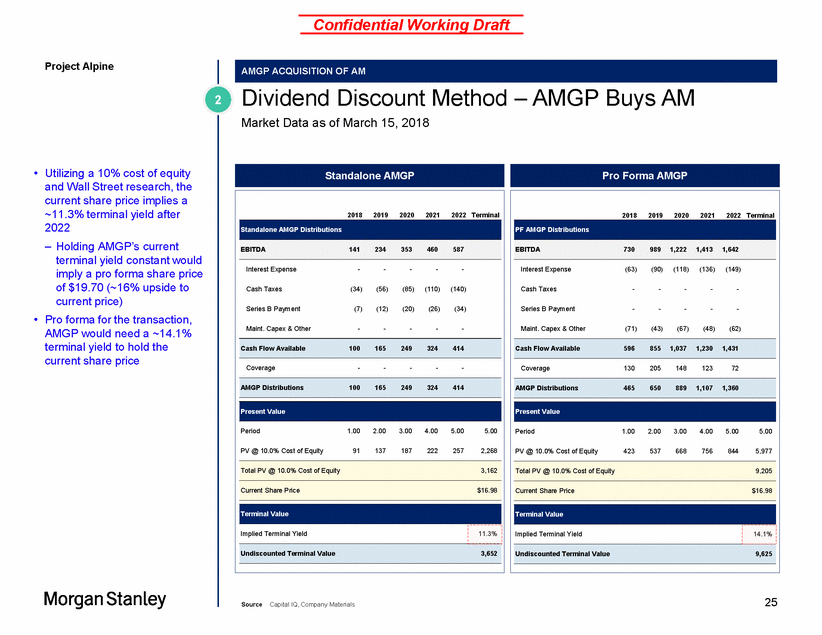
Confidential Working Draft Project Alpine IRR Method Analysis Market Data as of March 15, 2018 3 • Current implied 3-year IRR for standalone AMGP is ~29.9% – Maintaining the same AMGP IRR implies a pro forma share price of $18.71 (~10% upside to current price) 2018E Yield (%) Growth CAGR (%) Exit Growth (%) Predicted Exit Yield (%) 3 Year IRR Equity Value Price ($) Distributions per Share ($ / Share) WGP 7,628 $34.84 6.8% $2.36 $2.60 $2.94 11.6% 5.4% 7.4% 12.2% EQGP 5,989 $22.50 5.1% $1.15 $1.47 $1.70 21.6% 9.0% 6.7% 10.4% TEGP 3,509 $18.99 10.1% $1.91 $1.95 $2.13 5.6% 1.2% 8.2% 21.3% ENLC 2,704 $14.95 7.2% $1.08 $1.14 $1.21 6.0% 16.4% 5.5% 20.9% WES 7,672 $45.55 8.4% $3.83 $4.07 $4.26 5.5% 4.7% 7.5% 16.5% EQM 4,853 $60.22 7.4% $4.43 $5.09 $5.85 14.9% 7.3% 7.0% 19.7% NBLX 1,691 $47.05 4.6% $2.18 $2.61 $3.12 19.6% 19.8% 5.1% 14.8% CNXM 1,209 $19.01 7.2% $1.37 $1.58 $1.81 14.9% 7.5% 7.0% 19.0% HESM 1,061 $19.44 7.3% $1.42 $1.64 $1.89 15.4% 12.0% 6.2% 24.1% 26 Source Capital IQ, Company Materials Peer Mean 12.8% 9.2% 6.7% 17.6% Peer Median 14.9% 7.5% 7.0% 19.0% MLP Peers 2018E 2019E 2020E 2018 - 2020 2020 - 2022 Antero 2018E 2019E 2020E 2018 - 2020 2020 - 2022 AMGP SA 3,162 $16.98 3.2% $0.54 $0.89 $1.34 57.6% 28.8% 4.0% AMGP PF 10,144 4.6% $0.86 $1.20 $1.64 38.2% 23.7% 4.6% 29.9% 29.9% AM 4,909 $26.26 6.5% $1.71 $2.21 $2.80 27.8% 20.7% 5.0% 36.6% GP Peers 2018E 2019E 2020E 2018 - 2020 2020 - 2022 $18.71 3-Year IRR AMGP ACQUISITION OF AM
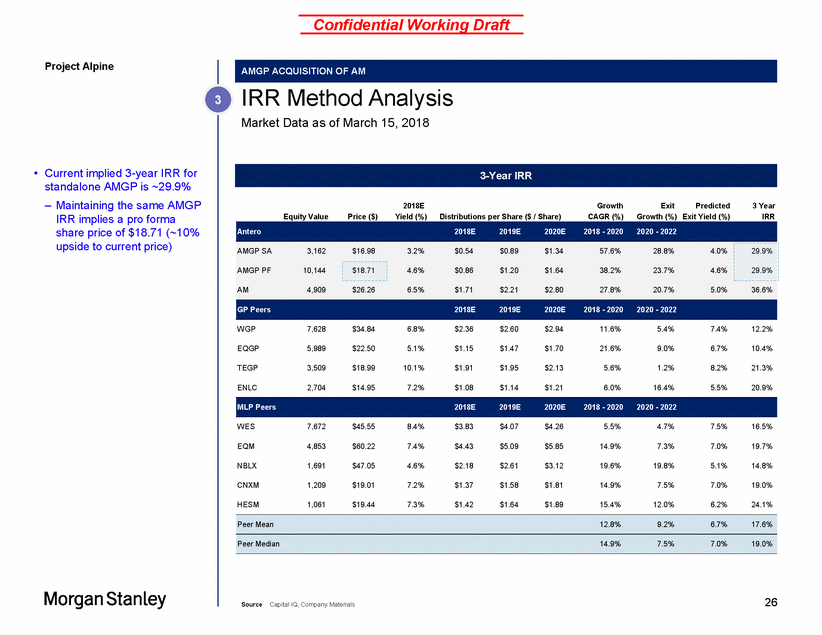
Confidential Working Draft Project Alpine Yield vs. Growth Correlation Market Data as of March 15, 2018 4 • Correlation of yield vs. growth implies a pro forma share price of $27.30 by the end of 2018 (~61% upside to current price) 2-Year DPS/DPU CAGR (2018E – 2020E) (1) 12.0 10.0 WES ETE TRGP 8.0 6.0 4.0 EQGP NBLX MGP PF 2.0 0.0 0.0 C-Corp 10.0 Non C-Corp 20.0 Antero 30.0 40.0 50.0 60.0 70.0 Source Capital IQ, Company projections Notes 1. Peer and standalone Antero represents 2-year 2018-2020 DPS/DPU CAGR 2. Peer and standalone Antero represents current yield; PF AMGP represents estimated current yield at 12/31/2018 27 Current Yield (2) AMGP Yield Sensitivity (YE2018) AssumedImplied YieldPrice Yield 4.1%$20.71 3.6%$23.55 2.6%$32.46 2.1%$40.03 Implied3.1%$27.30 Yield Breakeven 5.1%$16.98 ENBL DCP TEGP MPLXCNXM ENLCEQM PF AMGP Implied Price: $27.30(2) Implied Yield: 3.1% 2-Year Growth: 38.2% EPDWPZHESM WGPRMP OKE WMB AMGP PF Breakeven Yield 3.1% As of 12/31/18 A 38.2% AMGP SA Current Price: $16.98 Current Yield: 1.8% 2-Year Growth: 57.6% Current Price: $26.26 Current Yield: 5.6% 2-Year Growth: 27.8% AM SA R-Squared: 0.856 AMGP Yield vs. 2-Year DPS/DPU CAGR (G&P Peers) AMGP ACQUISITION OF AM
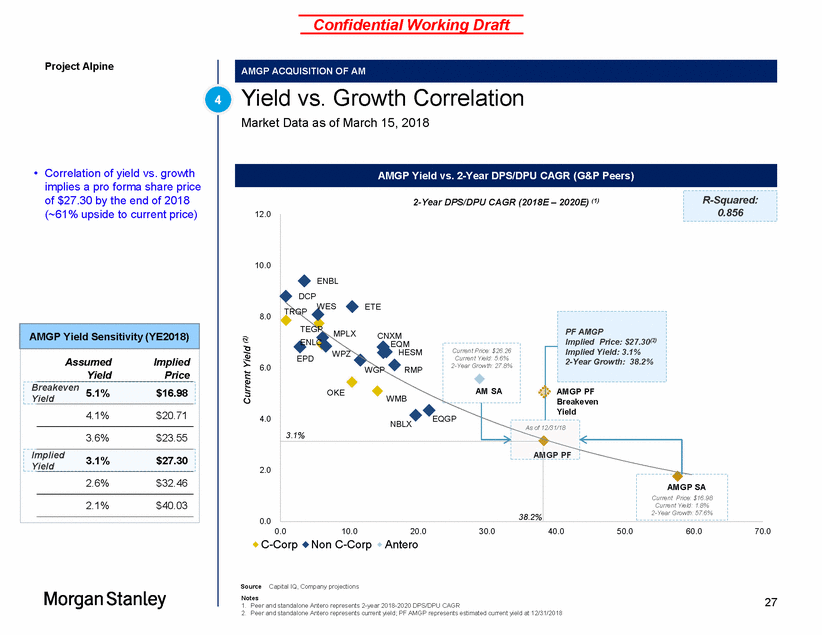
Confidential Working Draft Project Alpine C-Corp Trading Advantage to MLPs Wells Fargo Research 2016–2018 Midstream C-Corp. vs. Large-Cap Pipeline MLP Yield Spreads Basis Points Yield Spread (Premium / Discount) • Over the past 2 years (2016 - 2017), the median yield spread between midstream c-corps and large cap pipeline MLPs has been approximately 230 basis points – The median EV/EBITDA multiple spread has been 0.9x over the same time frame (400) (300) (200) (100) 0 100 200 Jan-16 Apr-16 Jul-16 Oct-16 Jan-17 Apr-17 Jul-17 Nov-17 Feb-18 28 Source Wells Fargo Research 2016-2017 Median AMGP ACQUISITION OF AM
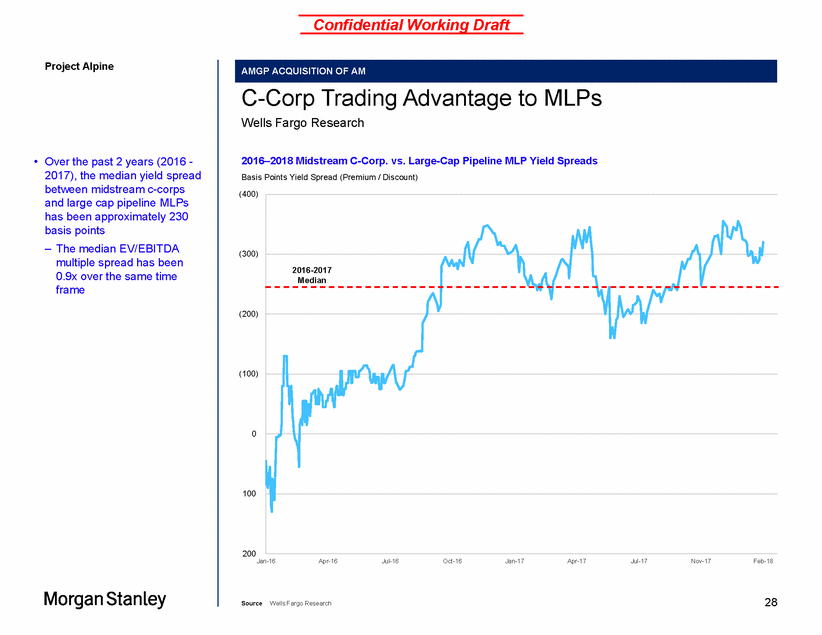
Confidential Working Draft Project Alpine Appendix A AMGP Acquisition of AM – Street Case 29
Confidential Working Draft Project Alpine AM & AMGP Projection Comparison Company vs. Street Projections • Company projections are marginally higher than Street projections for both AM and AMGP on an EBITDA and DCF basis 1,600 1,642 1,600 1,200 1,200 1,182 800 800 400 400 2018E 2019E 2020E 2021E 2022E 2018E 2019E 2020E 2021E 2022E 600 587 500 475 375 350 250 225 125 100 0 Source Company projections, Wall Street research 2018E 2019E 2020E 2021E 2022E 2018E 2019E 2020E 2021E 2022E 30 460 528 353429 234345 141231 139 414 324 372 249 303 165243 100 163 99 CompanyStreet ProjectionsProjections AMGP EBITDA $MM % Above / Below Street 1.1% 1.2% 2.5% 7.1% 11.1% DCF $MM % Above / Below Street 1.1% 1.2% 2.5% 7.1% 11.1% 1,4131,620 1,2221,407 989 732 952 730 1,428 1,225 1,351 1,036 1,170 854 985 608 791 594 AM EBITDA DCF $MM % Above / Below Street (0.3%) 3.9% 3.4% 0.4% 1.4% $MM % Above / Below Street (2.4%) 7.9% 5.2% 4.7% 5.6% AMGP ACQUISITION OF AM – STREET CASE
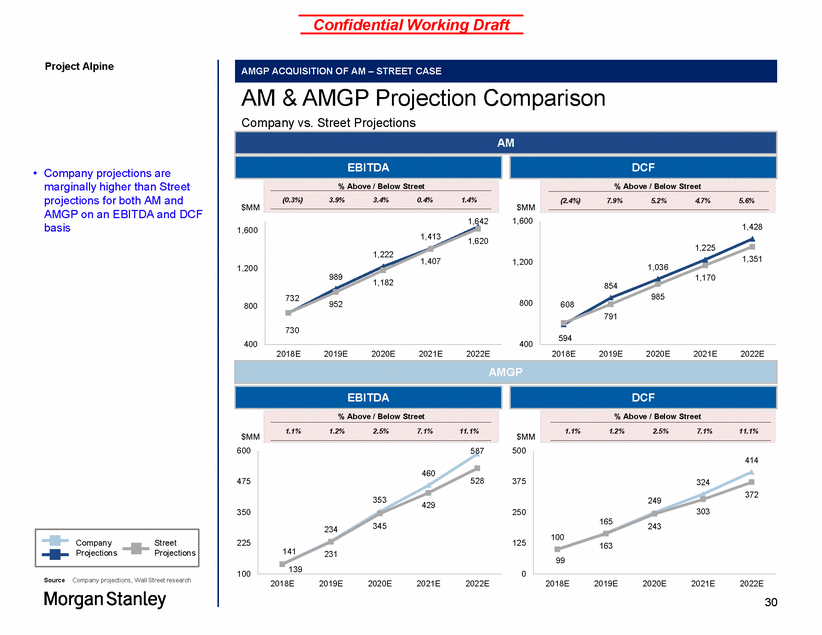
Confidential Working Draft Project Alpine AM Projection Comparison Company vs. Street Projections AM Company Projections $MM, Unless Otherwise Noted 2018E 2019E 2020E 2021E 2022E • Street vs. Company projections show modest differences, with Street numbers below Company projections Interest Expense (63) (90) (117) (139) (150) Maintenance Capex (67) (39) (63) (44) (58) Cash Taxes 0 0 0 0 0 Tax Witholding Reimbursement Paid to AR) (6) (6) (6) (6) (6) Acquisition Capex / Drop-Down / Earn-Out 0 (125) (125) 0 0 Growth Capex (579) (651) (531) (386) (294) Total Debt 1,648 2,219 2,727 2,982 3,205 Average Units Outstanding 187.13 187.13 187.13 187.13 187.13 DCF / Unit 3.17 4.56 5.54 6.54 7.63 Street Estimates(1) $MM, Unless Otherwise Noted 2018E 2019E 2020E 2021E 2022E Interest Expense (60) (79) (114) (144) (165) Maintenance Capex (65) (83) (85) (95) (105) Cash Taxes 0 0 0 0 0 Tax Witholding Reimbursement Paid to AR) 1 1 1 1 1 Acquisition Capex / Drop-Down / Earn-Out 0 (125) (125) 0 0 Growth Capex (593) (625) (563) (388) (343) Total Debt 1,757 2,289 2,788 3,064 3,293 Average Units Outstanding 186.91 186.91 186.91 186.91 186.91 DCF / Unit 3.25 4.23 5.27 6.26 7.23 Company vs. Street Source Wall Street research Notes 1. Consensus estimate comprised of February 16, 2018 Wells Fargo AM research and February 14, 2018 Morgan Stanley AM research 31 AM Distributions (%)0.7%0.9%2.0%5.9% 9.5% AMGP DCF (%)1.1%1.2%2.5%7.1%11.1% Distributable Cash Flow6087919851,1701,351 GP Distributions142232347431530 Distribution per L.P. Unit$1.71$2.20$2.81$3.26$3.79 Total EBITDA7329521,1821,4071,620 Distributable Cash Flow5948541,0361,2251,428 GP Distributions143236355462589 Distribution per L.P. Unit$1.72$2.21$2.85$3.42$4.10 Total EBITDA7309891,2221,4131,642 AMGP ACQUISITION OF AM – STREET CASE
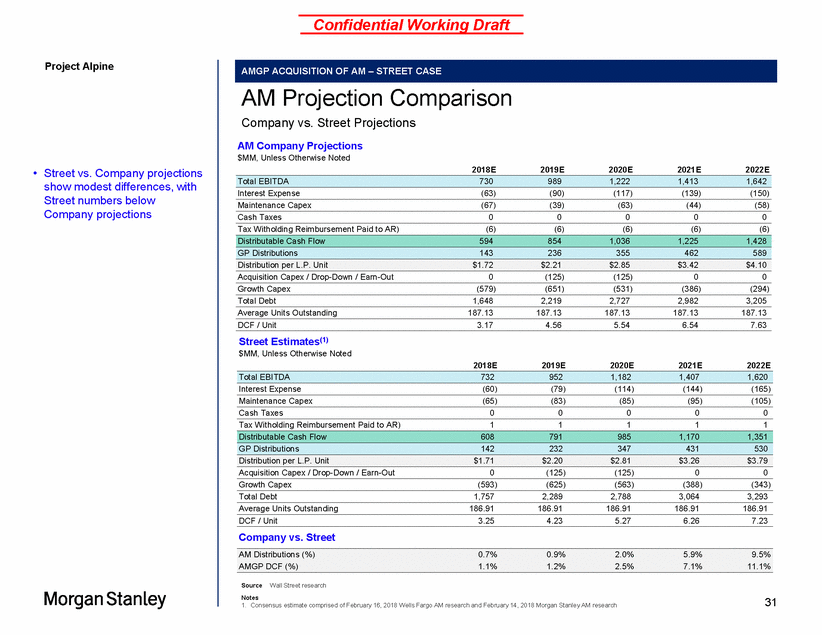
Confidential Working Draft Project Alpine Pro Forma Impact Analysis – Street Projections Pro Forma Impact to AM; Hypothetical 15% Premium; 100% Equity Contribution • Using Street vs. Company projections yields only modest differences in accretion outlook for distribution per unit $4.75 $1.25 $1.50 2018E2019E 2020E 2021E 2022E 2018E2019E 2020E 2021E 2022E (%) 50% 1.50x 43% 37.4% 35% CAGR CAGR 28% 1.00x 20% 2018E2019E 2020E 2021E 2022E 2019E 2020E 2021E 2022E Source Wall Street research Notes 1. Assumes 186.6MM units standalone, 542.1MM AMGP shares pro forma 2. Calculated as DCF / total distribution 32 StandalonePro Forma 38.4% 31.6% 28.5% 28.6%28.2% 24.0%22.1% Implied Yield StandalonePro Forma YieldDPUYieldDPU 2018E6.5% 5.7% 2019E8.4% 28.6% 7.9% 38.4% 2020E10.7% 28.2% 10.8% 37.4% 2021E12.4% 24.0% 13.1% 31.6% 2022E14.4% 22.1% 15.7% 28.5% Total Coverage Held Constant (2) (x) 1.23x 1.13x1.12x 1.09x 1.38x 1.25x 1.13x 1.32x DPU CAGR vs. 2018 Distributable Cash Flow / Unit (1) ($ / Unit) (5.3%) Accretion / (Dilution) (1.0%) 3.4% 7.2% 9.6% $4.48 $3.86 $4.09 $3.22$3.60 $2.59 $3.11 $2.56 $3.94 $3.13 $2.31 $2.10 $1.99 Distribution / Unit (1) ($ / Unit) (11.7%) Accretion / (Dilution) (5.1%) 1.4% 5.5% 8.5% $4.11 $3.44 $2.84 $3.79 $3.26 $2.20 $2.81 $2.09 $4.50 $3.69 $2.88 $2.06 $1.71 $1.51 AMGP ACQUISITION OF AM – STREET CASE
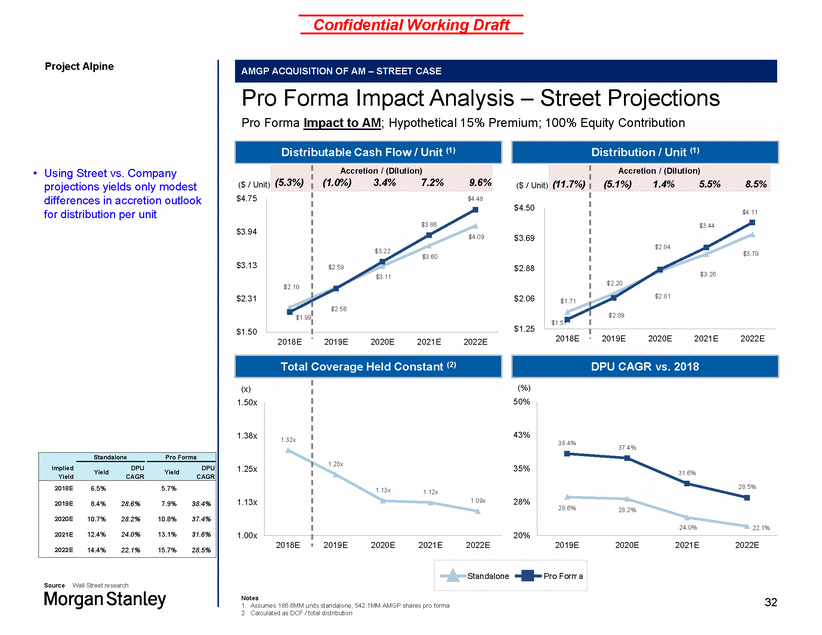
Confidential Working Draft Project Alpine Pro Forma Impact Analysis – Street Projections Pro Forma Impact to AMGP; Hypothetical 15% Premium; 100% Equity Contribution • Street numbers produce almost the same accretion outlook in AMGP distribution per share as Company projections ( ( $1.44 $0.00 $0.00 2018E2019E 2020E 2021E 2022E 2018E2019E 2020E 2021E 2022E (%) 75% 1.75x 63% 2x 50% Yield Yield CAGR CAGR 38% .00x 0.75x 25% 2018E2019E 2020E 2021E 2022E 2019E 2020E 2021E 2022E Source Wall Street research Notes 1. Assumes 186.6MM units standalone, 542.1MM AMGP shares pro forma 2. Calculated as DCF / total distribution 33 StandalonePro Forma 64.6% 56.6% 45.0% 39.2% 38.4%37.4% 31.6%28.5% Implied Yield Standalone Pro Forma DPU DPU 2018E 3.1% 5.0% 2019E 5.2% 64.6% 6.9% 38.4% 2020E 7.7% 56.6% 9.4% 37.4% 2021E 9.6% 45.0% 11.4% 31.6% 2022E 11.8% 39.2% 13.6% 28.5% Total Coverage (2) (x) 1.23x 1.13x1.12x 1.0 9x 0x 1.50x 1.25x 1.00x 1.3 1 1.00x1.00x1.00x1.0 DPU CAGR vs. 2018 Distributable Cash Flow / Share (1) $ / Share) 109.9% Accretion / (Dilution) 64.2%38.3%33.5%26.1% $2.52 $2.17 $1.81 $2.00 $1.63 $1.31 $0.88 $3.00 $2.25 $1.50 $0.75 $1.12 $0.53 Distribution / Shares (1) $ / Share) 58.9% Accretion / (Dilution) 33.6% 22.3% 18.8% 15.5% $2.31 $1.93 $1.60$2.00 $1.17$1.63 $1.31 $0.88 $3.00 $2.25 $1.50 $0.75 $0.85 $0.53 AMGP ACQUISITION OF AM – STREET CASE
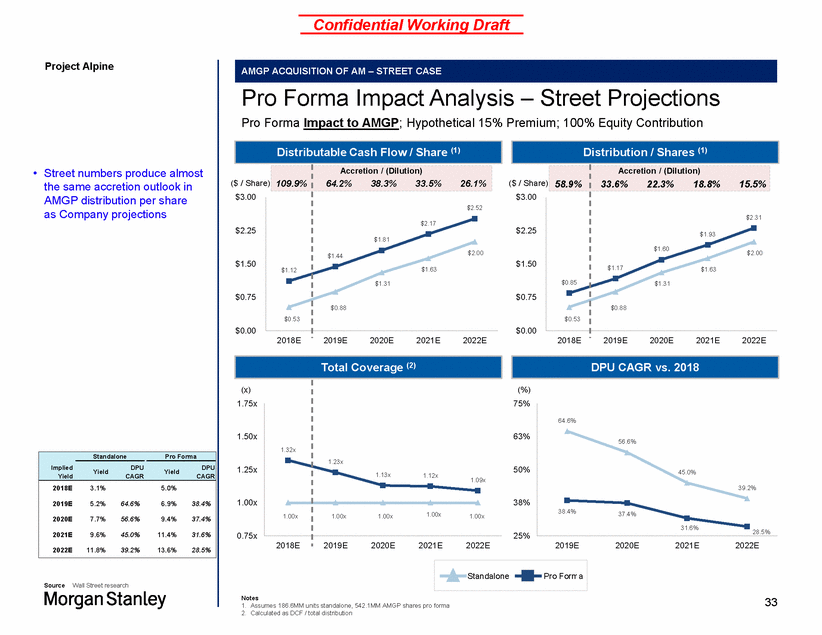
Confidential Working Draft Project Alpine Purchase Price Sensitivity – AMGP Buys AM Accretion / (Dilution) to AM; 100% Equity Contribution; Street Projections • Accretion to distributable cash flow per unit is slightly lower using Street numbers vs. Company projections Assumes $2MM of synergies per management • Source Wall Street Research Notes 1. Calculated as the accretion /(dilution) cumulative for four years 34 Purchase Premium (%) 0.0% 5.0% 10.0% 15.0% 20.0% 25.0% 30.0% 35.0% 40.0% AM Unit Price $26.26 $27.57 $28.89 $30.20 $31.51 $32.83 $34.14 $35.45 $36.76 Implied AM Price / AM SA 2019E LP DCF 10.1x 10.6x 11.1x 11.6x 12.1x 12.6x 13.2x 13.7x 14.2x FY0 2018E (10.1%) (8.4%) (6.8%) (5.3%) (3.9%) (2.6%) (1.3%) (0.1%) 1.0% Unit) FY1 2019E (6.0%) (4.2%) (2.6%) (1.0%) 0.4% 1.8% 3.1% 4.4% 5.6% DCF ($ / FY2 2020E (1.8%) 0.1% 1.8% 3.4% 4.9% 6.4% 7.8% 9.1% 10.3% L.P. FY3 2021E FY4 2022E 1.8% 3.7% 5.5% 7.2% 8.8% 10.3% 11.7% 13.1% 14.4% 4.1% 6.1% 7.9% 9.6% 11.2% 12.8% 14.2% 15.6% 17.0% 2019E - 2022E Cum. DCF(1) 0.2% 2.0% 3.8% 5.5% 7.0% 8.5% 9.9% 11.2% 12.5% 2019E - 2022E Cum. DPU(1) (1.6%) 0.2% 1.9% 3.5% 5.1% 6.5% 7.9% 9.2% 10.5% Pre-tax Premium per Unit $0.00 $1.31 $2.63 $3.94 $5.25 $6.57 $7.88 $9.19 $10.50 AMGP ACQUISITION OF AM – STREET CASE
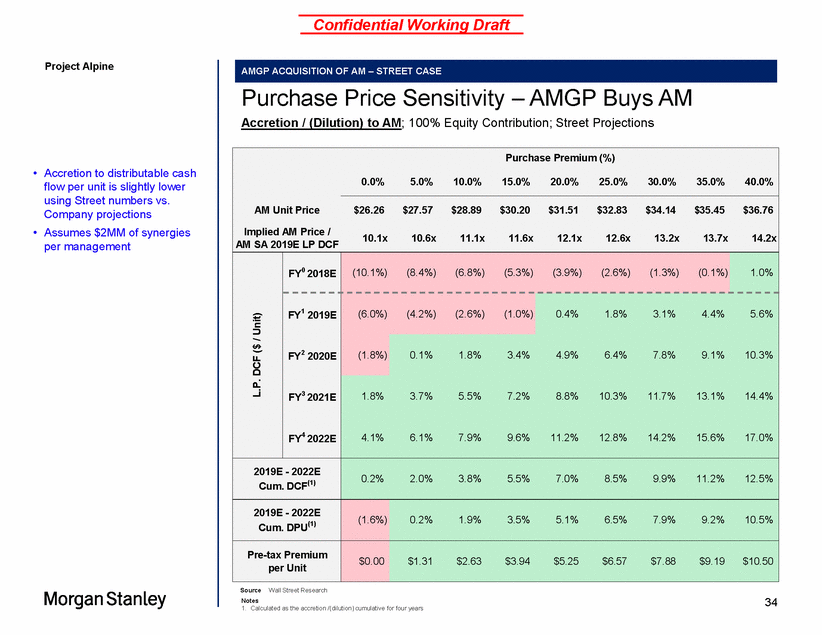
Confidential Working Draft Project Alpine Appendix B Supporting Materials 35
Confidential Working Draft Project Alpine Pro Forma Impact to AMGP 100% Equity Consideration; Hypothetical 15% Purchase Price Premium 2018E 2019E 2020E 2021E 2022E 2018E 2019E 2020E 2021E 2022E 2018E 2019E 2020E 2021E 2022E Synergies Interest Expense Maintenance Capex Cash Taxes Series B Payments Tax Witholding Reimbursement to AR - - - (34) (7) - - - - (56) (12) - - - - (85) (20) - - - - (110) (26) - - - - (140) (34) - 2 (63) (67) 34 7 (6) 2 (90) (39) 56 12 (6) 2 (118) (63) 85 20 (6) 2 (136) (44) 110 26 (6) 2 (149) (58) 140 34 (6) 2 (63) (67) - - (6) 2 (90) (39) - - (6) 2 (118) (63) - - (6) 2 (136) (44) - - (6) 2 (149) (58) - - (6) Coverage - - - - - 130 205 148 123 72 Coverage Ratio 1.00x 1.00x 1.00x 1.00x 1.00x 1.28x 1.32x 1.17x 1.11x 1.05x CAGR (vs. 2018) 64.8% 57.6% 47.8% 42.5% 122.3% 74.4% 55.8% 46.8% Average Shares Outstanding (1) 186.2 186.2 186.2 186.2 186.2 355.9 355.9 355.9 355.9 355.9 542.1 542.1 542.1 542.1 542.1 Series B Shares 24.0 24.0 24.0 24.0 24.0 (24.0) (24.0) (24.0) (24.0) (24.0) - - - - - Accretion / Dilution Growth Capex Acquisition Capex Maintenance Capex - - - - - - - - - - - - - - - (579) - (67) (651) (125) (39) (531) (125) (63) (386) - (44) (294) - (58) (579) - (67) (651) (125) (39) (531) (125) (63) (386) - (44) (294) - (58) YE Debt YE Debt / LTM EBITDA LTM EBITDA / Interest Expense - - - - - - - - - - - - - - - 1,650 2.3x 2,223 2.2x 2,733 2.2x 2,999 2.1x 3,223 2.0x 1,650 2.3x 11.6x 2,223 2.2x 10.9x 2,733 2.2x 10.3x 2,999 2.1x 10.4x 3,223 2.0x 11.0x Source Company projections Notes 1. Pro forma includes converted Series B shares of ~24MM 36 Credit Detail (646)(815)(719)(430)(352) (646)(815)(719)(430)(352) Total Capex-----Capex Detail Distribution ($ / Share)$0.32$0.31$0.30$0.30$0.29 Distribution (%)59.2%34.9%22.4%17.2%12.9% CAFD ($ / Share)$0.56$0.69$0.57$0.53$0.42 CAFD (%)103.8%77.5%42.7%30.2%18.8% $0.86$1.20$1.64$2.04$2.51 $0.32$0.31$0.30$0.30$0.29 Distribution / Share$0.54$0.89$1.34$1.74$2.22 $1.10$1.58$1.91$2.27$2.64 $0.56$0.69$0.57$0.53$0.42 CAFD / Share$0.54$0.89$1.34$1.74$2.22 4656508891,1071,360 365485639782946 Dividends100165249324414 5968551,0371,2301,431 4956897879061,017 Cash Flow Available for Dividends100165249324414 7309891,2221,4131,642 5897558699541,055 Total EBITDA141234353460587 AMGP Pro Forma Merger Adjustments AMGP Standalone SUPPORTING MATERIALS
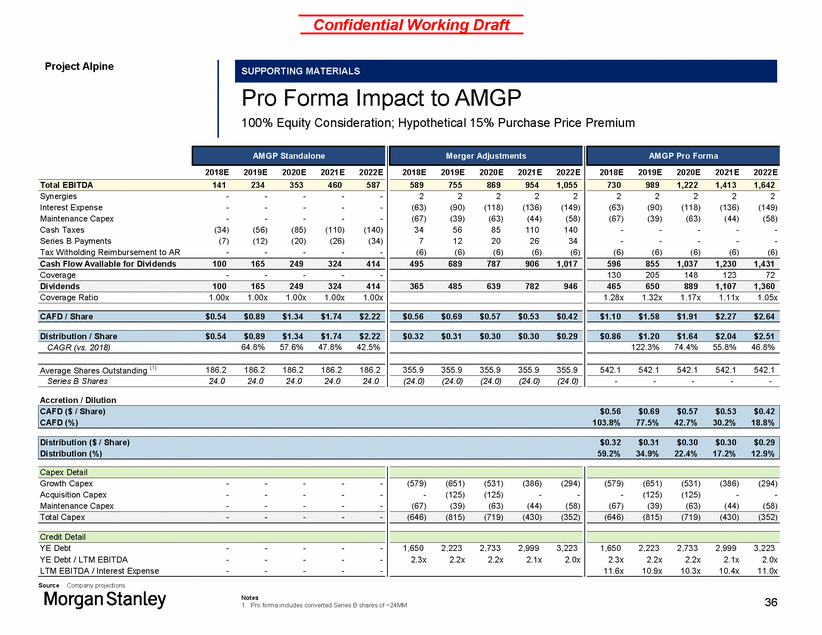
Confidential Working Draft Project Alpine Fully Burdened Tax Difference MLP vs. C-Corp Post-Tax Reform MLP vs. C-Corp Tax Status(1) $MM, Unless Otherwise Noted • Tax reform reduced tax liability for both C-Corp and MLP investors, however the relative tax advantage of the MLP structure declined slightly vs. C-Corp Income 1,000 1,000 Corporate Tax Rate (%) 35.0% 21.0% Income After Taxes 650 790 Qualified Dividend Rate (%) 20.0% 20.0% Income 1,000 1,000 Deduction (%) - 20.0% Income After Deduction 1000 800 Income Tax Rate (%) 39.6% 37.0% 37 Source Wells Fargo Research 1.2% Net Benefit MLP vs. C-Corp 8.4% 7.2% 10.0% Effective Tax Rate 39.6% 29.6% Income After Taxes & Dividend Rate 604 704 Net Benefit MLP Example Previous New 11.2% Effective Tax Rate 48.0% 36.8% Income After Taxes & Dividend Rate 520 632 Net Benefit C-Corp Example Previous New SUPPORTING MATERIALS
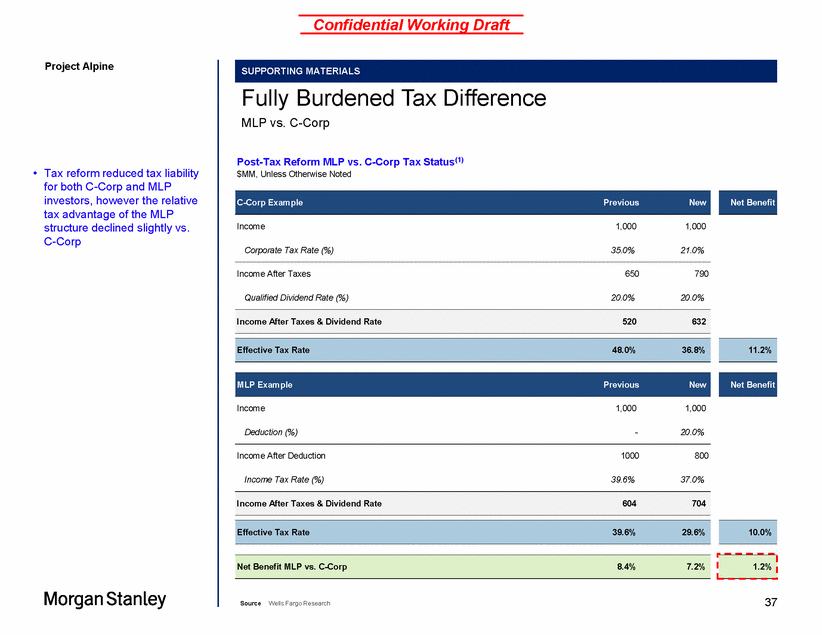
Confidential Working Draft Project Alpine Peer Trading Statistics Market Data as of March 15, 2018 38 Source Capital IQ Valuation Share Price as of 15-Mar-18 Diluted Units Outstanding $45.55 $14.09 $60.22 $47.05 $19.01 $19.44 168.4 350.0 80.6 35.9 63.6 54.6 $34.84 $22.50 $18.99 $14.95 218.9 266.2 184.8 180.9 Equity Value 7,672 4,932 4,853 1,691 1,209 1,061 7,628 5,989 3,509 2,704 Total Debt Non-Controlling Interest Cash and Equivalents 3,465 3,468 1,167 229 411 - 62 550 - 68 - - (792) (31) (3) (11) - (48) 28 0 146 74 - - - - (1) (0) (1) (0) Aggregate Value 10,407 10,178 6,017 1,977 1,620 1,013 7,655 5,989 3,654 2,778 Adj. Aggregate Value 14,617 10,732 8,566 2,022 2,272 1,013 7,655 5,989 3,654 2,778 Trading Metrics Adj. Aggregate Value / EBITDA (x) 2018E 2019E 12.2x 10.9x 9.6x 8.3x 13.0x 10.4x 10.5x 10.3x 7.7x 6.4x 10.3x 7.6x 14.6x 20.0x 9.6x 11.6x 13.3x 16.3x 8.8x 10.3x Price / LP DCF (x) 2018E 2019E 10.9x 8.6x 11.0x 12.1x 11.3x 11.7x 10.4x 8.4x 9.3x 10.5x 9.6x 9.9x 14.7x 20.0x 9.2x 11.6x 13.4x 16.3x 8.6x 10.2x Coverage Ratio (x) 2018E 2019E 1.1x 1.1x 1.2x 1.8x 1.2x 1.2x 1.1x 1.1x 1.3x 1.7x 1.3x 1.2x 1.0x 1.0x 1.1x 1.1x 1.0x 1.0x 1.1x 1.1x Yield & Growth Metrics Current Yield (%) 4-Year Distribution CAGR (2018E-2022E) (%) 8.1% 11.1% 6.8% 4.2% 6.6% 6.6% 5.1% 2.7% 11.0% 19.7% 11.1% 13.7% 6.3% 4.3% 7.7% 6.9% 8.5% 15.6% 3.4% 9.0% Total 4-Year Return (%) 13.2% 13.8% 17.8% 23.9% 17.7% 20.3% 14.8% 20.0% 11.1% 16.0% Equity Research 12-Month Median Price Target ($) Upside to Current Price (%) $58.00 $18.00 $83.00 $62.50 $24.00 $26.00 27.3% 27.8% 37.8% 32.8% 26.2% 33.7% $45.50 $30.00 $26.00 $18.00 30.6% 33.3% 36.9% 20.4% IDR Detail Current IDR Tier / Top Tier GP % of Distributed Cash 50% / 50% 48% / 48% 50% / 50% 25% / 50% 25% / 50% 0% / 50% 35% 10% 34% 3% 35% 0% 0% / 0% 0% / 0% 0% / 0% 0% / 0% 0% 0% 0% 0% Credit Debt / 2018E EBITDA (x) Debt Ratings (Moody's / S&P) 2.9x 3.5x 1.4x 1.0x 2.6x 0.0x Ba1 / BBB-Ba1 / BBB-Ba1 / BBB-NR / NR NR NR / NR 0.0x 0.0x 0.2x 0.1x NR / NR NR / NR NA / NA NR / NR LP Peers GP Peers SUPPORTING MATERIALS
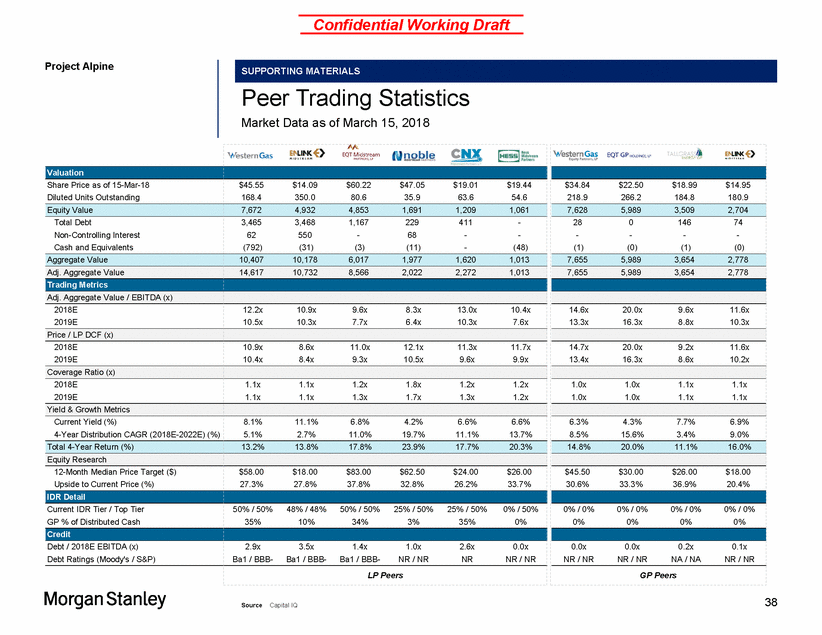
Confidential Working Draft Project Alpine Appendix C Precedent Transactions 39
Confidential Working Draft Project Alpine Premiums Paid Acquisitions of Public LPs Analysis on Selected Transactions KMP EPB • Averaging the premiums paid over the previous 1, 5, 10, and 30 day periods, an average acquisition premium of ~15% was paid Transactions since 2014 were analyzed and excluded the following non-comparable transactions: – Tesoro Logistics, Crestwood, TransOcean TransCanada, and Archrock • Avg. ~15% 40 Source Company disclosure, Wall Street research Date10-Aug-1410-Aug-142-Nov-1530-May-1631-Jan-17 Average Transaction StructureAcquisitionAcquisitionAcquisitionAcquisitionAcquisition of Public LP of Public LP of Public LP of Public LP of Public LP 1-Day Premium / (Discount)12.0%15.4%18.4%0.0%25.8% 14.3% 5-Day Premium / (Discount)10.8%13.8%19.8%0.4%22.6% 13.5% 10-Day Premium / (Discount)6.9%8.9%14.3%16.9%21.0% 13.6% 30-Day Premium / (Discount)9.5%7.1%8.5%60.0%20.9% 21.2% MLP Distribution Cut15.0%17.0%23.0%31.1%7.7% 18.8% MLP Distribution Breakeven YearYr. 5Yr. 4Yr. 5Yr. 6 +Yr. 4 Yr. 5 + PRECEDENT TRANSACTIONS
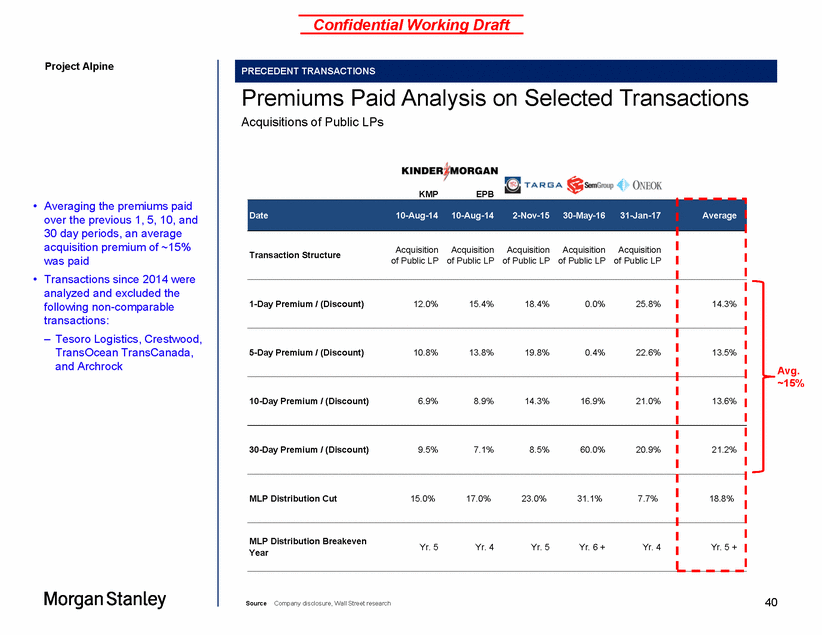
Confidential Working Draft Project Alpine Precedent Analysis IDR Buyout Transactions on Selected Transactions • Previous relevant transactions took place once GP take was >30% of the incremental cash flows Transactions since 2016 were analyzed and excluded the following non-comparable transactions: – TransMontaigne, Plains All American, USA • Compression, Energy and NuStar 41 Source Company disclosure, Wall Street research Date9-Jan-1714-Aug-1719-Oct-1715-Dec-1722-Jan-18 Average 100% of100% of 100% of100% of100% of Transaction StructureIDRs / GPIDRs / GPIDRs / GPIDRs / GPIDRs / GP Int.Int.Int.Int.Int. Purchase Price ($MM)11,4003,7681,25010,1007,200 6,744 Indicative GP CF at Purchase ($MM)74928876333459 381 GP Take of Cash Flow (%)31.2%34.3%31.5%27.8%30.2% 31.0% Implied Purchase Multiple of Current GP CF (x)15.2x13.1x16.4x30.3x15.7x 18.1x Implied Purchase Multiple of FY1 GP CF (x)12.7xNA10.0x16.6x13.3x 13.1x PRECEDENT TRANSACTIONS
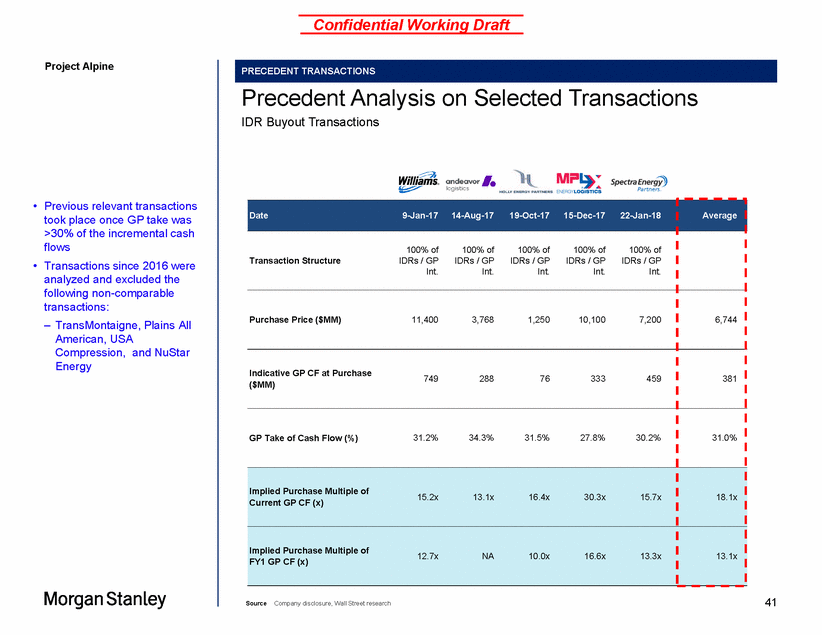
Confidential Working Draft Project Alpine Disclaimer We have prepared this document solely for informational purposes. You should not definitively rely upon it or use it to form the definitive basis for any decision, contract, commitment or action whatsoever, with respect to any proposed transaction or otherwise. You and your directors, officers, employees, agents and affiliates must hold this document and any oral information provided in connection with this document in strict confidence and may not communicate, reproduce, distribute or disclose it to any other person, or refer to it publicly, in whole or in part at any time except with our prior written consent. If you are not the intended recipient of this document, please delete and destroy all copies immediately. We have prepared this document and the analyses contained in it based, in part, on certain assumptions and information obtained by us from the recipient, its directors, officers, employees, agents, affiliates and/or from other sources. Our use of such assumptions and information does not imply that we have independently verified or necessarily agree with any of such assumptions or information, and we have assumed and relied upon the accuracy and completeness of such assumptions and information for purposes of this document. Neither we nor any of our affiliates, or our or their respective officers, employees or agents, make any representation or warranty, express or implied, in relation to the accuracy or completeness of the information contained in this document or any oral information provided in connection herewith, or any data it generates and accept no responsibility, obligation or liability (whether direct or indirect, in contract, tort or otherwise) in relation to any of such information. We and our affiliates and our and their respective officers, employees and agents expressly disclaim any and all liability which may be based on this document and any errors therein or omissions therefrom. Neither we nor any of our affiliates, or our or their respective officers, employees or agents, make any representation or warranty, express or implied, that any transaction has been or may be effected on the terms or in the manner stated in this document, or as to the achievement or reasonableness of future projections, management targets, estimates, prospects or returns, if any. Any views or terms contained herein are preliminary only, and are based on financial, economic, market and other conditions prevailing as of the date of this document and are therefore subject to change. We undertake no obligation or responsibility to update any of the information contained in this document. Past performance does not guarantee or predict future performance. This document and the information contained herein do not constitute an offer to sell or the solicitation of an offer to buy any security, commodity or instrument or related derivative, nor do they constitute an offer or commitment to lend, syndicate or arrange a financing, underwrite or purchase or act as an agent or advisor or in any other capacity with respect to any transaction, or commit capital, or to participate in any trading strategies, and do not constitute legal, regulatory, accounting or tax advice to the recipient. We recommend that the recipient seek independent third party legal, regulatory, accounting and tax advice regarding the contents of this document. This document does not constitute and should not be considered as any form of financial opinion or recommendation by us or any of our affiliates. This document is not a research report and was not prepared by the research department of Morgan Stanley or any of its affiliates. Notwithstanding anything herein to the contrary, each recipient hereof (and their employees, representatives, and other agents) may disclose to any and all persons, without limitation of any kind from the commencement of discussions, the U.S. federal and state income tax treatment and tax structure of the proposed transaction and all materials of any kind (including opinions or other tax analyses) that are provided relating to the tax treatment and tax structure. For this purpose, "tax structure" is limited to facts relevant to the U.S. federal and state income tax treatment of the proposed transaction and does not include information relating to the identity of the parties, their affiliates, agents or advisors. This document is provided by Morgan Stanley & Co. LLC and/or certain of its affiliates or other applicable entities, which may include Morgan Stanley Realty Incorporated, Morgan Stanley Senior Funding, Inc., Morgan Stanley Bank, N.A., Morgan Stanley & Co. International plc, Morgan Stanley Securities Limited, M organ Stanley Bank AG, Morgan Stanley MUFG Securities Co., Ltd., Mitsubishi UFJ Morgan Stanley Securities Co., Ltd., Morgan Stanley Asia Limited, Morgan Stanley Australia Securities Limited, Morgan Stanley Australia Limited, Morgan Stanley Asia (Singapore) Pte., Morgan Stanley Services Limited, Morgan Stanley & Co. International plc Seoul Branch and/or Morgan Stanley Canada Limited Unless governing law permits otherwise, you must contact an authorized Morgan Stanley entity in your jurisdiction regarding this document or any of the information contained herein. 42 © Morgan Stanley and/or certain of its affiliates. All rights reserved.
Table of Contents Section 1 Executive Summary 3 Section 2 Pro Forma Trading Considerations 15 PROJECT ALPINE 2
SECTION 1 Executive Summary 3
Executive Summary Project Alpine • We are pleased to present our thoughts on the potential combination of AMGP and AM • We evaluated a number of potential simplification strategies involving AR, AM and AMGP over the past 6+ months and have concluded that an acquisition of AM by AMGP appears to be the optimal restructuring strategy – Results in a simple C-Corp structure, increasingly the vehicle preferred by the market and larger long-only investment complexes, while paving a path to be an eligible entity for broader market indices over time (i.e., S&P 500) – Provides tax basis step-up and associated shelter, and therefore improved distributions relative to other combination alternatives – However, is taxable to AM unitholders including AR, mitigated somewhat by public unitholders’ relatively high estimated average tax basis of ~$23-$24 per unit, and AR’s ~$3Bn of NOLs oFurthermore,~95% of AM’s public float is held by institutions, who are generally less sensitive to gain taxes vis-à-vis retail holders • Additionally, we understand that pro forma AMGP will convert to a traditional C-Corp, which will further simplify its legal structure and enhance corporate governance of the entire midstream business • In this presentation we will: – Discuss current midstream market trends and investor sentiment – Compare the current midpoint between counterproposals to precedent simplification transactions in the midstream sector – Provide observations on the potential trading levels of the combined entity PROJECT ALPINE EXECUTIVE SUMMARY 4
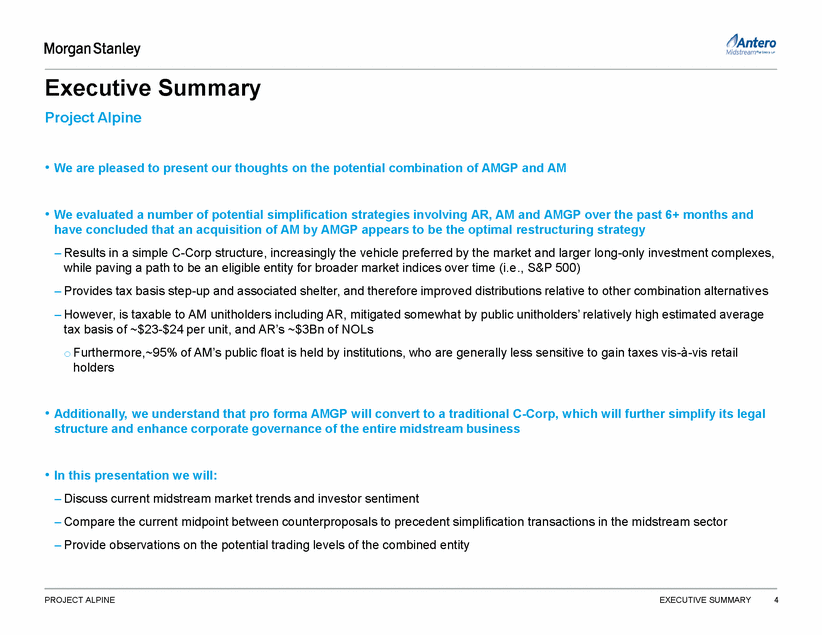
Investor Feedback to Morgan Stanley on “Midstream Model 2.0” • The 2.0 business model starts with eliminating the general partner/ limited partner structure, along with burdensome IDRs – Removing the IDR mechanism and the need to pay an ever greater share of distributions to general partners better aligns the interests of all shareholders and gives businesses more flexibility in how they allocate capital • Investors themselves are largely agnostic to base structure, though at the margin C-Corps have enjoyed enhanced liquidity and a broader addressable investor universe, which helps in markets where MLP fund flows are tight • Traditional LP structures will still have equity access in the right market backdrop, but depth and discount will continue to be beholden to MLP fund flows and sentiment PROJECT ALPINE EXECUTIVE SUMMARY 5 Other • Executives should be compensated based on normalized cash flow metrics • Coverage levels of ~1.2x viewed as generally appropriate dependent of the growth profile and a responsible balance sheet • Subordination is far less of a focus – focus is squarely on governance and IDR construct IDRs • Dedicated MLP and generalist investor community are universally opposed • Dedicated MLP investors have varying degrees of tolerance of when IDRs are addressed but feel structures that still have IDRs with a material burden will have a hard time finding new capital Governance • Governance is the primary structural grievance with the traditional MLP structure • GP / LP misalignment – sponsor history of favorable GP treatment at the expense of LP • LP board representation is a major issue and focus for new investors – investors like traditional corporate style board independence (even if a controlled company) Structural Form and Valuation Approach Zimmer • Generally indifferent to a C-Corp vs. MLP base structure, so long as IDR and governance issues addressed • At the margin, C-Corps enjoy enhanced liquidity and an expanded buyer universe • C-Corp valuation primarily AV / EBITDA focused; however the market is broadly moving to EBITDA and DCF multiples including for MLPs as generalist investors look at sector Investor Feedback
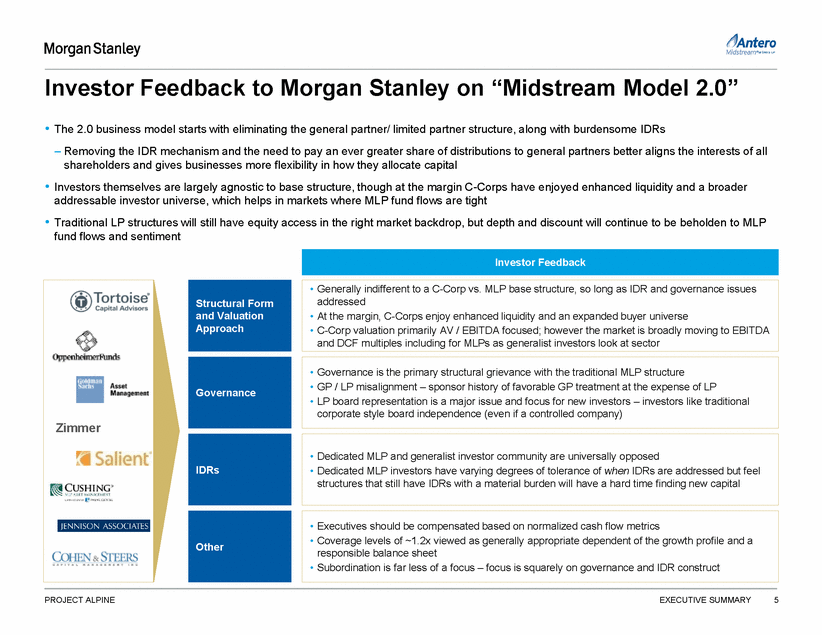
t.1Antero Midstream··•·.. Morgan Stanley What Investors are Saying Excerpts from a Recent Investor Letter in Their Own Shareholder Updates • • Has it removed its incentive distribution rights? Does it have high distribution coverage? Capital Appreciation MLP 1.0 MLP2.0 Source Cohen & Steers "Green Shoots for MLP 2 o· Investor Letter PROJECT ALPINE EXECUTIVE SUMMARY 6 Exhibit 5: The New Business Model MLP 1.0 MLP 2.0 Complex structure (GP/LP with IDRs) Simplified structure (no IDRs) Weak alignment of shareholder interests Greater shareholder alignment High leverageLower leverage Maximized distribution growth I greater risk of distribution cuts Higher distribution coverage /lower risk of distribution cuts Asset buying to drive IDR payouts Focus on core assets and return on invested capital Frequent, dilutive equity issuanceStock buybacks How to Identify a 2.0 Company: --·•Does it try to self-fund the majority of its capex? • Is the management team aligned with all investors? •Does it have an independent Board of Directors and best-in-class corporate governance? It doesn't matter if it's a corporation, an MLP or Canadian company-if it approaches its business in this way, it represents the new model of midstream. If it doesn't, it's version 1.0 and, in our view, could face significant challenges ahead. Capital Appreciation Exhibit 6: A Shifting Return Profile Focused on Total Return
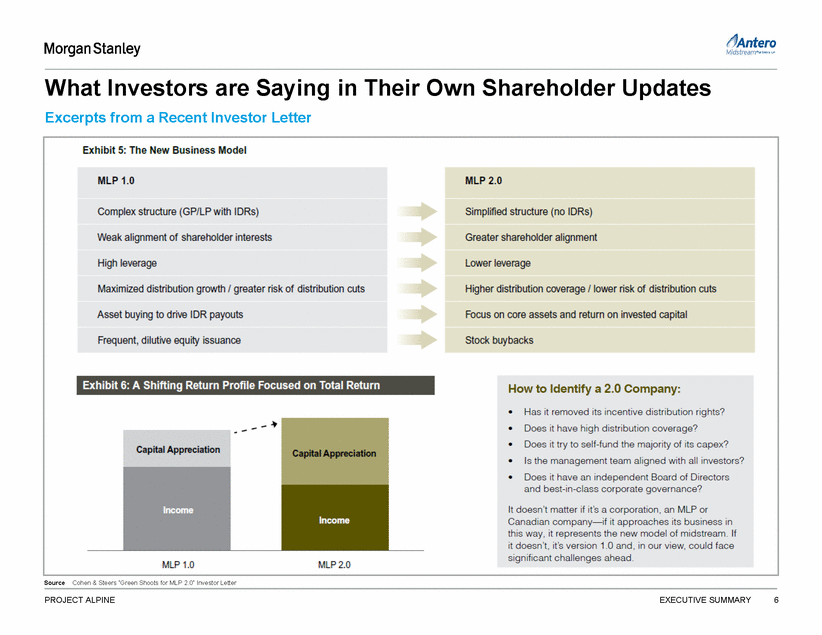
Recent Trends in C-Corp vs. LP Structures Liquidity Benchmarking (LTM) (1) Select Midstream “C-Corp” Follow-Ons (1) Select MLP Follow-Ons (1) 3Mo ADTV / Float 1.2% Discount (%) Performance (%) Discount (%) Performance (%) Pricing Date Size ($MM) All-In F/O Cost Offer / Offer / T + 1 Current Pricing Size All-In Offer / Offer / Issuer % TSO Date Issuer ($MM) % TSO F/O Cost T + 1 Current 06/26/18 CNX Midstream Partners LP 136.8 11.7 (11.9) (13.3) 2.7 11.5 1.0% 01/04/18 ONEOK Inc 1,190.8 5.6 (3.0) (4.1) 2.9 23.9 02/01/18 Shell Midstream Partners LP 680.0 13.3 (5.2) (6.1) (3.7) (20.3) LLC: 0.89% C-Corp: 0.87% LP: 0.68% 05/25/17 Targa Resources Corp 783.7 8.6 (4.9) (5.6) 2.7 12.0 09/06/17 Antero Midstream Partners LP 314.5 5.4 (6.4) (7.4) (0.7) 2.6 0.8% 02/23/17 Targa Resources Corp 400.1 3.7 (2.9) (4.3) 1.5 (6.8) 08/14/17 Energy Transfer Partners LP 1,007.1 4.9 (5.0) (5.9) (0.2) 29.2 02/23/17 Plains GP Holdings LP 1,497.3 20.0 (2.4) (3.8) 2.7 (19.5) 07/19/17 Western Gas Partners LP 726.7 8.9 0.4 (0.6) 6.9 (1.0) 01/23/17 Targa Resources Corp 530.4 5.0 (4.0) (5.1) 0.2 (10.4) 04/12/17 NuStar Energy LP 666.3 18.3 (10.0) (13.0) 3.2 (42.6) 0.6% 01/09/17 Williams Companies Inc 2,167.8 10.0 (9.2) (11.2) (1.7) 7.4 02/24/17 Hi-Crush Partners LP 424.4 37.0 (12.4) (14.8) (3.6) (26.4) 02/24/16 Enbridge Inc 1,674.4 6.5 (5.7) (9.0) 13.7 21.3 10/24/16 Buckeye Partners LP 588.7 6.8 (6.5) (7.7) 2.3 (45.0) 0.4% 03/12/15 Targa Resources Corp 340.1 8.9 (3.6) (4.5) 0.2 (43.3) 09/26/16 Sunoco Logistics Partners LP 652.1 8.1 (7.4) (8.4) 1.9 N/A 06/18/14 Enbridge Inc 368.5 0.9 (0.9) (4.9) 0.1 (23.5) 08/09/16 Phillips 66 Partners LP 301.3 6.2 (4.0) (4.9) (2.8) 6.2 06/17/14 Williams Companies Inc 3,474.2 8.9 1.8 (1.0) 0.6 (45.4) 05/18/16 Shell Midstream Partners LP 401.5 12.4 (8.6) (9.4) 0.0 (34.8) 0.2% Jun-17 Oct-17 Feb-18 Jun-18 C-Corp LLC LP Source: Bloomberg, Capital IQ Source: Dealogic Converted to “Check-The-Box” C-Corp in March 2018 Source: Dealogic Incremental C-Corp Investors (2) Monthly MLP Fund Flows Since 2014 3,500 3,000 2,500 2,000 1,500 1,000 500 0 (500) (1,000) (1,500) Jan-14 Jan-15 Jan-16 Monthly OE-Fund Flows Jan-17 Jan-18 Monthly MLP ETF / ETN Flows Monthly MLP CLEF Issuance Source: MLP Data Notes: 1. As of 8/3/18 2. Investors who don’t own AMGP or own Midstream C-Corps in materially bigger size PROJECT ALPINE EXECUTIVE SUMMARY 7 Fund Flows Weak Since January Mean 1,158.4 7.9 (3.4) (5.3) 3.0 (6.4) Median 783.7 8.6 (3.0) (4.9) 1.5 (6.8) Mean 536.3 12.1 (7.0) (8.3) 0.6 (12.1) Median 588.7 8.9 (6.5) (7.7) 0.0 (10.7) 07/31/18 Viper Energy Partners LP 315.0 8.9 (2.3) (5.1) 10.1 14.0
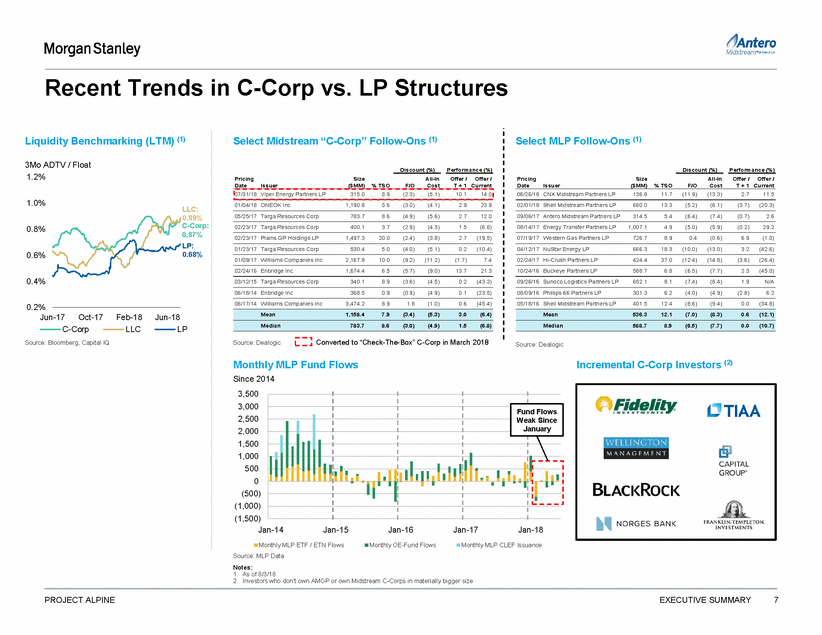
Recent Counterproposals Comparison AMGP & AM Counterproposals Dated July 20th & July 25th, Respectively • Cash consideration of $3.84 per AM common unit vesting schedule as the Series B units PROJECT ALPINE EXECUTIVE SUMMARY 8 AMGP Counterproposal (7/20) AM Counterproposal (7/25) Exchange Ratio / Cash Consideration •1.65x AMGP shares per AM unit •1.71x AMGP shares per AM unit; plus Series B Shares •All Series B units exchanged for an aggregate 18.5MM AMGP shares •Agreed, except for, new AMGP shares will be subject to the same Reorganization •AMGP will be reorganized as a Delaware corporation •Agreed •Governance terms are open IDR Treatment •All IDRs held in AM in will be canceled •Agreed Pro Forma Dividend •Expectation that AM Common Unit Holders will not realize a distribution cut from what they would have received for the first four quarters post transaction •Agreed, except for, expectation that concurrent with the announcement of the transaction, it is communicated to the public that there will be no “backdoor” distribution cut for existing AM unitholders AM Unitholder Vote •Approval by the majority of the non-affiliated AM unitholders •Agreed Other Terms •Willing to negotiate any potential Water Earn-Out separate and apart from this transaction •Agreed
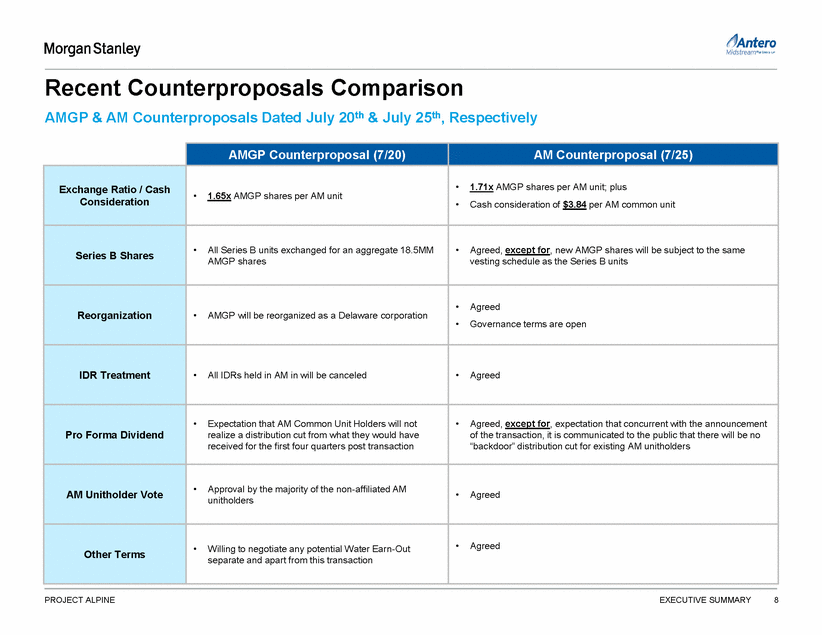
Historical Exchange Since AMGP IPO Ratio Analysis Exchange Adj. Ex. AMGP AM AM / AMGP Exchange Ratio As of 3 August 2018 2.00 Counter-Offer: 1.918x 1.90 Adj. Spot(1): 1.827x 1.80 Current: 1.745x 1.70 30 Day: 1.640x 60-Day: 1.626x 90-Day: 1.609x 1.60 180-Day: 1.558x 1.50 Spot at SailingStone Letter: 1.472x 1.40 Spot at Spec. Comm. Annouce: 1.380x 1.30 May-2017 Source: Capital IQ Notes: Jul-2017 Oct-2017 Dec-2017 Mar-2018 May-2018 Aug-2018 1. Adjusted AM / AMGP exchange ratio calculated as the AMGP unaffected market cap grossed up by the percentage of Series B 2018E distributions divided by pro forma AMGP share count (inclusive of 18.5MM share Series B conversion) 2. Implied counteroffer premium includes the stated 1.71x exchange ratio plus the $3.84 cash component (All -in exchange ratio of 1.918x) PROJECT ALPINE EXECUTIVE SUMMARY 9 Positive for AMGP Positive for AM Jan 29, 2018: SailingStone files 13-D Feb 24, 2018: Announce Special Committees (1)(2) Ratio (x) Ratio (x) Counteroffer Counteroffer Implied AMGP Offer Premium Implied Counteroffer Premium (2) Exchange Adj. Ex. Ratio (x)Ratio (x) Exchange Adj. Ex. Ratio (x)Ratio (x) 8/3/20181.745x1.827x1.650x1.918x (5%)(10%) 10%5% 30-Day Avg.1.640x1.717x1.650x1.918x 1%(4%) 17%12% 60-Day Avg.1.626x1.703x1.650x1.918x 1%(3%) 18%13% 90-Day Avg.1.609x1.685x1.650x1.918x 3%(2%) 19%14% 180-Day Avg.1.558x1.632x1.650x1.918x 6%1% 23%18% LTM1.565x1.639x1.650x1.918x 5%1% 22%17% Spot at SailingStone Letter1.472x1.541x1.650x1.918x 12%7% 28%23% Spot at Spec. Comm. Announce.1.380x1.446x1.650x1.918x 20%14% 38%33% 30 Day Avg at SailingStone Letter1.504x1.575x1.650x1.918x 10%5% 26%21%
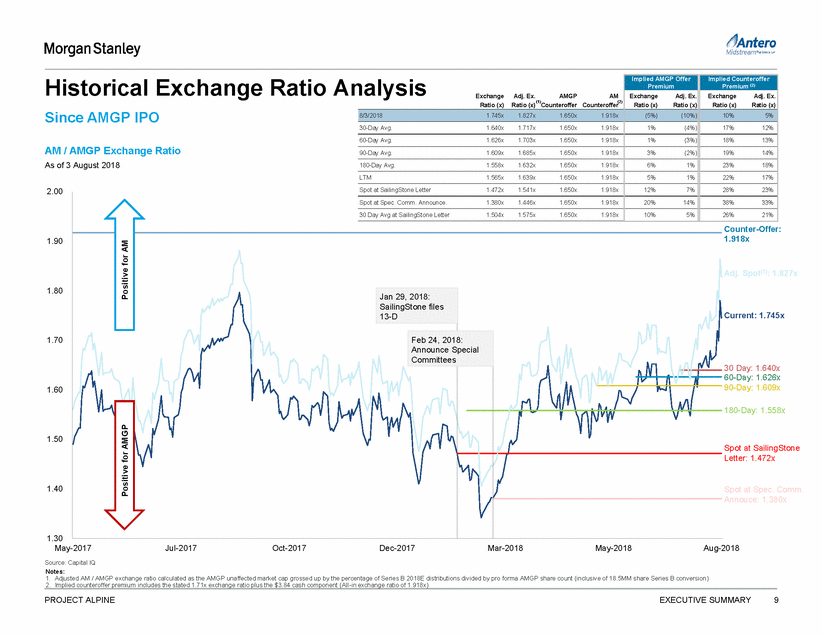
Illustrative Midpoint Offer Analysis AMGP & AM Counterproposals Dated July 20th & July 25th, Respectively Assumption • For the analysis herein, we have assumed an “illustrative midpoint” between the most recent AMGP and AM counterproposals Midpoint Offer Analysis Market data as of 3 August 2018 Pro Forma Ownership PF AM Ownership in AMGP Ratio (x)(3) Ratio (x) Adj. Series B AMGP Share Price AMGP Share Price (as of 2/23/18) ($ / share) $19.19 AMGP FDSO (MM) 186.20 '18E AM Distributions to Series B (%) 4.7% Proposed Series B Conversion (MM) 18.5 Pro Forma AMGP FDSO (MM) 204.7 Implied AMGP Share Price ($ / share) $18.32 Notes: 1. Excludes $225MM of cash funded accelerated water earn-out payment made to AM 2. Assumes cash and shares consistent with current ownership; election feature may provide a higher cash content for AR 3. Adjusted AM / AMGP exchange ratio calculated as the AMGP unaffected market cap grossed up by the percentage of Series B 2018E distributions divided by pro forma AMGP share count (inclusive of 18.5MM share Series B conversion) PROJECT ALPINE EXECUTIVE SUMMARY 10 Implied Share Price Impact (%) (4.5%) Implied AMGP Market Cap. ($MM) 3,751 AMGP Market Cap. ($MM) 3,573 Stock Exchange Ratio1.650x 1.680x 1.710x PF AM Ownership60.1% 60.6% 61.0% (2) 31.8% 32.1% 32.3% PF AMGP Public Float43.2% 43.2% 43.3% AMGP Counterproposal (7/20) Illustrative Midpoint AM Counterproposal (7/25) Spot Exchange Ratio (x) 1.65x Cash Consideration ($/Unit) - 1.68x $1.92 1.71x $3.84 All-in Exchange Ratio (x) 1.650x 1.784x 1.918x Illustrative Equity Purchase Price ($MM) 5,709 6,172 6,635 % Cash - Cash Consideration ($MM)(1) - Cash to AR ($MM) (1)(2) - AMGP Shares Issued to AM 308.6 5.8% 359 190 314.2 10.8% 718 380 319.8 Premiums Analysis: Exchange Adj. Exchange Ratio (x) Ratio (x)(3) Exchange Adj. Exchange Ratio (x) Ratio (x)(3) Exchange Adj. Exchange 8/3/2018 (5.4%) (9.7%) 30-Day Avg. 0.6% (3.9%) 60-Day Avg. 1.4% (3.1%) 90-Day Avg. 2.6% (2.1%) 180-Day Avg. 5.9% 1.1% Spot at Spec. Comm. Announce. 19.5% 14.1% 2.2% (2.1%) 8.6% 4.0% 9.5% 4.8% 10.8% 6.1% 14.6% 9.7% 29.0% 23.5% 9.9% 5.5% 16.5% 11.8% 17.5% 12.8% 19.0% 14.2% 23.3% 18.3% 38.4% 32.8%
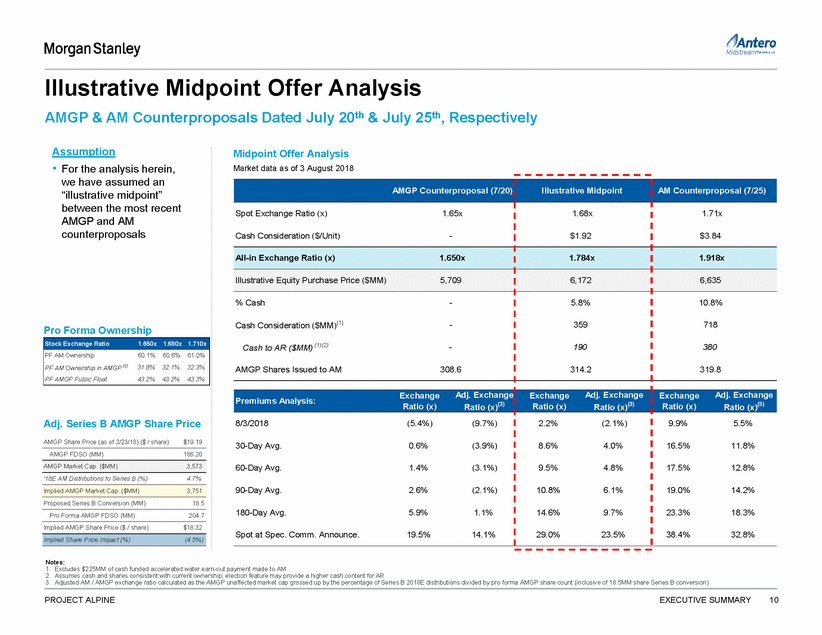
Impact to AM vs. Selected Peer Precedents Assumes Illustrative Midpoint 1.680x Exchange Ratio & $1.92 Cash Consideration Year 1-Day Prem. (%) % Cash % MLP Distribution Cut – Forward Year AM (3) EPB OKS KMP AM Adj. AM OKS NGLS NGLS KMP EPB RRMS WPZ KMP OKS NGLS ETP TEP N RRMS WPZ WPZ RRMS TEP ETP RRMS 0% 10% 20% 30% 40% 0 3 6 (10%) 5% 20% 35% 0% 5% 10% 15% Source Company projections, Company disclosure, Wall Street research Notes: 1. Represents a non-taxable LP-to-LP transaction 2. Distribution does not breakeven throughout the 5 year projection period provided by Wall Street research 3. AM – 1.680x exchange ratios plus $1.92 cash consideration per share for AM / AMGP as of 23 Feb 18 (Special Committee Announcement Date) represent a 29% spot premium to market value 4. AM (adjusted for AMGP share price reflected of Series B conversion as shown on page 10) – 1.680x exchange ratios plus $1.92 cash consideration per share for AM / AMGP as of 23 Feb 18 (Special Committee Announcement Date) represent a 23% spot premium to market value 5. WPZ – 1.500x exchange ratio for WPZ / WMB as of 8 May 18 represent a 7% spot premium to market value and an incremental 7% premium to the spot exchange ratio the day b efore FERC press release (3/15/18) 6. TEP – 10% premium to 30-day VWAP before 7 Feb 18 restructuring review announcement; premium on the day prior to 26 Mar 18 announcement was 0% PROJECT ALPINE EXECUTIVE SUMMARY 11 Premium to Unaffected 1-Day Premium 12% 12% 6% 0% 0% 0% 0% 0% 0%(1) AM 0% TEP EPB GLS ETP 0% 8% 15% 16% 17% 23% 31% 32%(1) AM 0 TEP OKS EPB KMP ETP WPZ 0 4 4 5 5 6 6+(1)(2) 6 +(2) 2% 29% 26% (2%) 23%(4) 18% 15% 12% 11% (1) 7% 14% (5) 0% 10% (6) 0% Cash Consideration Up-Front Premium DPU Breakeven Year MLP Distribution Cut
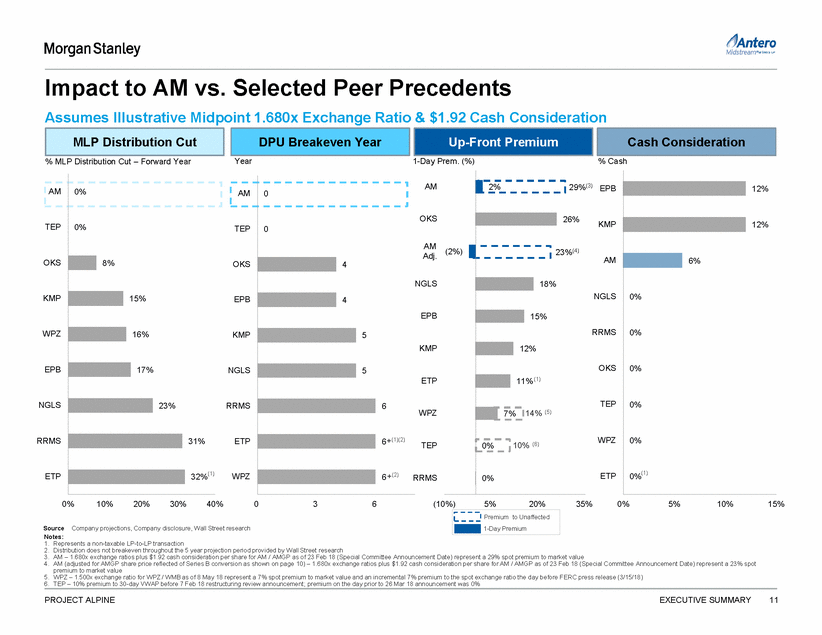
Pro Forma Impact Analysis Illustrative Pro Forma Impact to AM; 1.680x Exchange Ratio; $1.92 Cash Consideration Reinvested Assumptions • Company provided projections • Cash consideration ($1.92) reinvested into AMGP at 8/3/18 price of $18.50 • 2019E distribution set to match standalone AM distribution (on a 1.680x exchange ratio basis) – 2020E onwards assumes AM standalone total coverage profile held constant • Acceleration of water earn-out for $225MM of cash (if included in transaction) • Cash consideration funded with debt with a 5.375% interest rate $5.25 $5.25 $4.59 $4.25 $4.25 $3.25 $3.25 $2.25 $2.25 $1.25 $1.25 2019E 2020E 2021E 2022E 2019E 2020E 2021E 2022E 1.50x 40% 1.38x 35% 1.25x 30% 1.13x 25% 1.00x 20% 2019E 2020E 2021E 2022E 2020E 2021E 2022E YoY Growth Source Company projections Notes: 1. Assumes 187.0MM units standalone, 518.9MM AMGP shares pro forma 2. Calculated as DCF / total distribution SA 29.0% 20.0% 19.9% PF 26.7% 25.2% 23.2% 3. EQGP has no outstanding debt PROJECT ALPINE EXECUTIVE SUMMARY 12 StandalonePro Forma 31.7% 29.5% 27.9% 28.9% 25.9% 24.3% 1.32x 1.20x 1.17x 1.11x 1.05x Consolidated SA PF Total Debt 1,657 2,241 2018E EBITDA 730 730 Debt/'18E EBITDA 2.3x 3.1x OKE Debt/'18E EBITDA 3.4x TRGP Debt/'18E EBITDA 5.0x EQGP Debt/'18E EBITDA NM(3) Long-Term Coverage Held Constant (2) DPU CAGR vs. 2018 $3.72 $4.10 $2.97 $3.42 $2.35$2.85 $2.21 $4.83 $4.14 $4.29 $3.47 $3.75 $2.83 $3.24 $2.76 Distributable Cash Flow / Unit (1) Distribution / Unit (1) Accretion / (Dilution) 2.8% 6.9% 10.4% 12.5% Accretion / (Dilution) 6.2% 4.3% 8.9% 11.9%
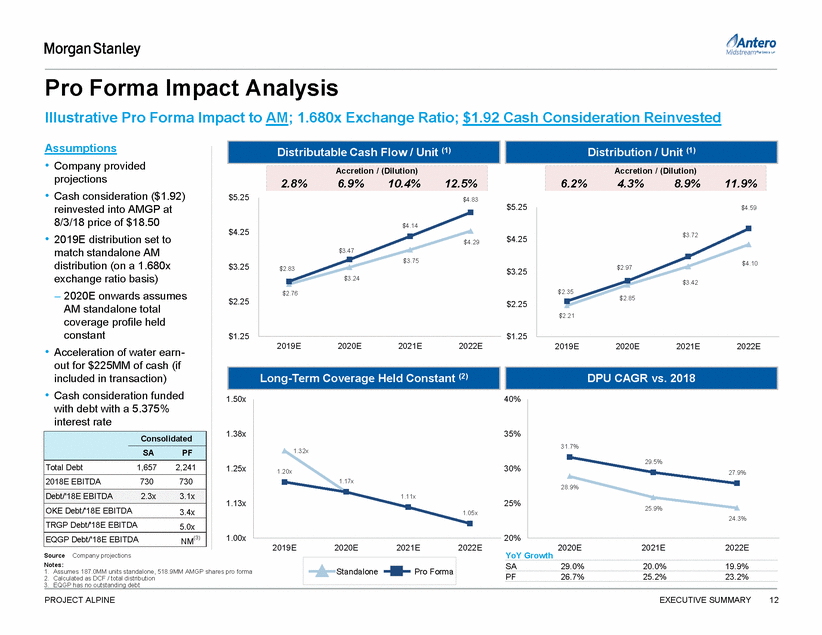
Pro Forma AMGP Investment Highlights Market Data as of August 3, 2018 • Top 20 Midstream Companies (1) Ranked by Market Capitalization Under the proposed exchange ratio, AM unitholders would have a larger pro forma ownership position than AMGP As a result, it is critical to understand how AMGP would be expected to trade post the transaction to quantify the value implications for AM holders beyond the implied upfront premium – Pro forma AMGP will be extremely well positioned as a high-growth C-Corp with substantial current yield – Analysis of pro forma yield, growth and return attributes suggests higher trading levels for AMGP Post-transaction, AMGP to be positioned as a leading midstream C-Corp with a number of factors that distinguish it from its peers: ENB EPD ETE TRP KMI WMB MPLX OKE PAA CQP MMP LNG TRGP ANDX Fastest growing midstream C-Corp • -Distribution growth exceeding 25% through 2021 Highest total return midstream C-Corp -Pro forma 3-year implied IRR of ~38% Organic growth driven by backlog of $2.7Bn of projects Strong balance sheet with 3.1x YE 2018E leverage (including accelerated water earn-out) Ability to grow without equity issuance Top-tier asset base, proven growth track record Top-tier Appalachian management team Depth of institutional access spanning traditional midstream investors and sector agnostic growth investors Hypothetical Index Re-Weighting Calculation (2): Net Buying = AUM Tracking Weightings - Mitigation of overhang on secondary sell-downs / offerings Significant enhancement of public float Path to being index eligible (i.e., S&P 500) once public float is >50% of outstanding shares (initially will be ~43%) C-Corp governance, including a majority of independent directors Net Changes to Index Weighting = $1.2Tn x 0.0195% - 0.0000% - - Post-Weight = $1.2Tn x 0.0195% Pre-Weight Source Company projections Notes: 1. Pro forma for all announced simplification transactions 2. Assumes inclusion to the S&P at 50% public float, based on PF TSO of 518.9MM shares and 8/3/18 price of $18.50 PROJECT ALPINE EXECUTIVE SUMMARY 13 = ~$233MM = ~12.6MM Shares (2) MLPC-Corp Total IndexNet Change Fund (Passive) xin Index Indices( x%) 87.7 63.5 50.9 40.5 38.9 37.7 29.4 27.8 20.4 17.9 16.1 15.6 11.3 10.0 9.6 PF AMGP WES WGP ENBL EQGP PSXP 8.7 8.0 7.9 6.7 6.5
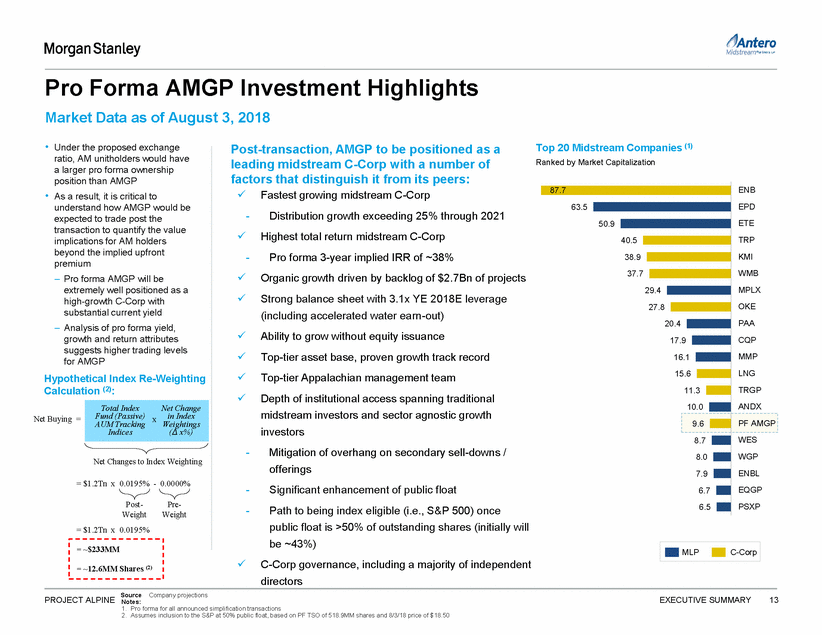
Support for AMGP Trading Market Data as of August 3, 2018 Level(1) 1 Trading Relative vs. Peers 2 Dividend Discount Model (“DDM”) $18.50 3 3-Year IRR Expectations 4 Yield / Growth Correlation $32.28 5 Investor Universe inclusion into S&P 500 provide potential incremental buyers of PF AMGP PROJECT ALPINE Notes: EXECUTIVE SUMMARY 14 1. Based on Company management projections • Multiple long-only Midstream C-Corp investors and possible future • Correlation of yield vs. growth implies a pro forma share price of $27.83 % Upside~21%~42%~13%~72%~54% $55.59 $45.71 $49.65 $38.99 $36.59 $33.00 Current @DDM -DDM -3-Yr IRR - 3-Yr IRR -Yield / 1.784xSA Yield Peer YieldSA IRR Peer IRRGrowth AM ( All-in Exchange-Ratio Adjusted) • Maintaining AMGP’s standalone 3-year IRR implies a pro forma share price of $20.51 • Maintaining a peer average 3-year IRR of 19.0% implies a pro forma share price of $31.16 • Dividend discount model with 10% cost of equity implies an ~11.8% terminal yield for standalone AMGP – Implies pro forma AMGP share price of $21.86 • Peer average DDM of ~9.5% implies a pro forma AMGP share price of $25.63 Implied Pro Forma Trading Level % Upside~18%~39%~11%~68%~50% $31.16 $25.63 $27.83 $21.86 $20.51 $18.50 CurrentDDM -DDM -3-Yr IRR - 3-Yr IRR - Yield / SA Yield Peer YieldSA IRR Peer IRRGrowth AMGP • OKE currently trades at a ~5.3% 2019E yield with a consensus ~11% 2-year forward growth rate, while PF AMGP (at current price) would imply a 2019E yield of ~7.1% with a ~26% 2-year forward growth rate • OKE currently trades at a 14.7x 2019E DCF multiple and ~11% 2-year forward DCF growth while pro forma AMGP at current price would imply a 11.8x 2019E DCF multiple and a ~21% growth rate
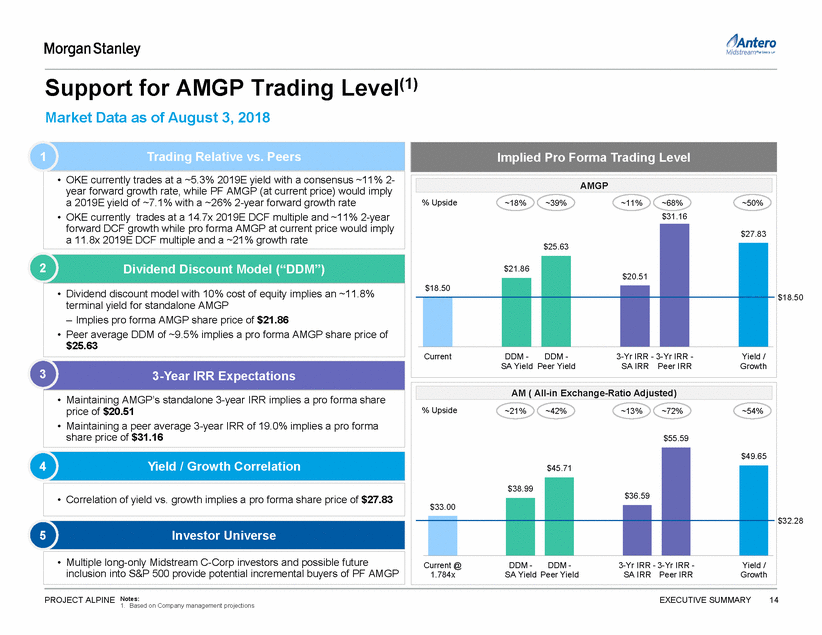
SECTION 2 Pro Forma Trading Considerations 15
Peer Trading Metrics 1 Market Data as of August 3, 2018 • Pro forma AMGP would be projected to have higher growth with a similar yield as OKE • Pro forma DCF and EBITDA multiples projected to be attractive for new AMGP • Assumes illustrative midpoint transaction structure and early settlement of water earn-out • Pro forma AMGP projected to have a healthy total debt / 2018E EBITDA leverage compared to peers: – PF AMGP: 3.1x(1) – Targa: 5.0x – ONEOK: 3.4x – EQGP: NM(2) peers with minimal leverage multiples that are in-line or lower than peers, uggests potential for upward share price supports premium valuation relative to peers metrics to support self-funding Source Capital IQ, Company projections for AM & AMGP Notes: 1. Assumes 2018E YE total debt inclusive of $584MM of debt used to fund the cash consideration and water earn -out 2. EQGP has no outstanding debt PROJECT ALPINE PRO FORMA TRADING CONSIDERATIONS 16 Trading Summary Equity Value6,68827,75211,3323,4459,599 Aggregate Value6,68735,92619,0603,43011,817 PF AMGP becomes more in-line with C-Corp Aggregate Value / 2019E EBITDA13.2x14.4x13.2x15.9x12.0x PF AMGP's high growth results in forward assuming current AMGP standalone share price 2020E EBITDA 10.8x12.9x11.6x 10.7x 9.7x Equity Value / 2019E DCF13.2x 14.7x 13.1x21.3x 11.8x PF AMGP's peer-leading DCF growth for s rerating post-transaction 2020E DCF10.8x13.5x11.2x14.3x9.7x DCF Growth (19E - 21E) 14.8% 10.5% 14.1% 33.1% 20.8% Yield & Growth Metrics 2019E Yield7.6% 5.3% 7.1%4.8% 7.1% Significant coverage paired with high growth 2019E Cash Coverage Ratio1.0x1.3x1.1x1.0x1.2x DPU Growth (19E-21E CAGR)14.7% 10.7% 1.4%40.1% 26.0% EBITDA Growth (19E-21E CAGR)14.8%11.1%12.1%33.1%19.6% Credit Metrics Debt / 2018E EBITDANM3.4x5.0x0.0x3.1x Healthy pro forma balance sheet / credit
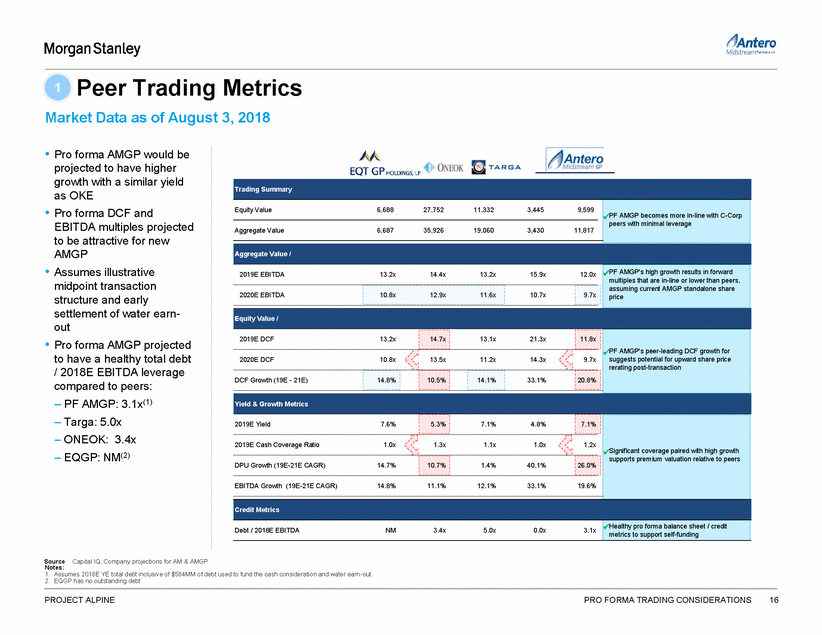
Dividend Discount Method – AMGP Buys AM 2 Market Data as of August 3, 2018 • Utilizing a 10% cost of equity and Wall Street research, the current share price implies a ~11.8% terminal yield after 2022 A• Pro forma for the transaction, AMGP would need a ~15.0% terminal yield to hold the current share price Source Capital IQ, Company Materials PROJECT ALPINE PRO FORMA TRADING CONSIDERATIONS 17 2019 2020 2021 2022 Terminal PF AMGP Distributions EBITDA 989 1,222 1,413 1,642 Interest Expense (121) (147) (162) (176) Cash Taxes - - - - Series B Payment - - - - Maint. Capex & Other (43) (67) (48) (62) Cash Flow Available 824 1,009 1,203 1,405 Coverage 142 144 120 70 AMGP Distributions 683 865 1,083 1,334 Present Value PV @ 10.0% Cost of Equity 651 750 853 956 6,389 Total PV @ 10.0% Cost of Equity 9,599 Current Share Price $18.50 Terminal Value Implied Terminal Yield 15.0% Undiscounted Terminal Value 8,919 2019 2020 2021 2022 Terminal Standalone AMGP Distributions EBITDA 234 353 460 587 Interest Expense - - - - Cash Taxes (56) (85) (110) (140) Series B Payment (12) (20) (26) (34) Maint. Capex & Other - - - - Cash Flow Available 165 249 324 413 Coverage - - - - AMGP Distributions 165 249 324 413 Present Value PV @ 10.0% Cost of Equity 157 216 255 296 2,520 Total PV @ 10.0% Cost of Equity 3,445 Current Share Price $18.50 Terminal Value Implied Terminal Yield 11.8% Undiscounted Terminal Value 3,517 A Pro Forma AMGP – Implied Terminal Yield Standalone AMGP
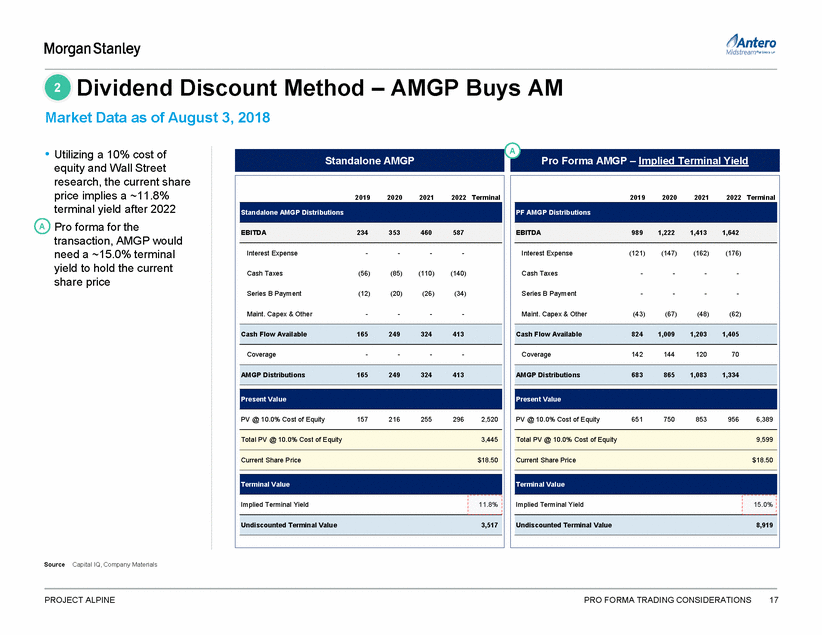
Dividend Discount Method – AMGP Buys AM (Cont’d) 2 Market Data as of August 3, 2018 B B• Holding AMGP’s current terminal yield constant would imply a pro forma share price of $21.86 (~18% upside to current price) C• Using peer average breakeven yield of 9.5%, implied pro forma AMGP would be $25.63 (~39% upside to current price) – Using OKE’s implied terminal yield of 6.4%, pro forma AMGP price would be $34.97 (~89% upside to current price) Source Capital IQ, Company Materials PROJECT ALPINE PRO FORMA TRADING CONSIDERATIONS 18 2019 2020 2021 2022 Terminal PF AMGP Distributions EBITDA 989 1,222 1,413 1,642 Interest Expense (121) (147) (162) (176) Cash Taxes - - - - Series B Payment - - - - Maint. Capex & Other (43) (67) (48) (62) Cash Flow Available 824 1,009 1,203 1,405 Coverage 142 144 120 70 AMGP Distributions 683 865 1,083 1,334 Present Value PV @ 10.0% Cost of Equity 651 750 853 956 10,088 Total PV @ 10.0% Cost of Equity 13,298 Current Share Price $25.63 Terminal Value Implied Terminal Yield 9.5% Undiscounted Terminal Value 14,083 2019 2020 2021 2022 Terminal PF AMGP Distributions EBITDA 989 1,222 1,413 1,642 Interest Expense (121) (147) (162) (176) Cash Taxes - - - - Series B Payment - - - - Maint. Capex & Other (43) (67) (48) (62) Cash Flow Available 824 1,009 1,203 1,405 Coverage 142 144 120 70 AMGP Distributions 683 865 1,083 1,334 Present Value PV @ 10.0% Cost of Equity 651 750 853 956 8,132 Total PV @ 10.0% Cost of Equity 11,342 Current Share Price $21.86 Terminal Value Implied Terminal Yield 11.8% Undiscounted Terminal Value 11,352 C Pro Forma AMGP – Assuming Avg. Peer Yield Pro Forma AMGP – Assuming Standalone Yield
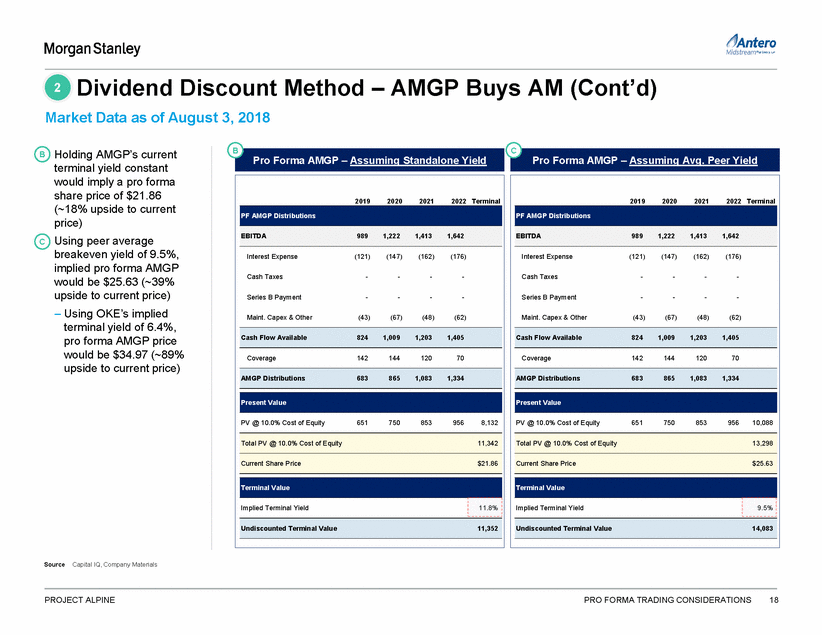
IRR Method Analysis 3 Market Data as of August 3, 2018 A• Current implied 3-year IRR for standalone AMGP is ~37.6% – Maintaining the same AMGP IRR implies a pro forma share price of $20.51 (~11% upside to current price) B• Current peer median 3-year IRR is 19.0% – Maintaining the same for AMGP implies a pro forma share price of $31.16 (~68% upside to current) C• Holding current AMGP price of $18.50 constant implies 3-year IRR of over 42% 2019E Yield (%) Growth CAGR (%) Exit Growth (%) Predicted Exit Yield (%) 3 Year IRR Equity Value Price ($) Distributions per Share ($ / Share) A B C WGP 7,984 $36.47 7.1% $2.60 $2.93 $3.16 10.2% 8.5% 6.3% 18.5% EQGP 6,688 $22.11 7.6% $1.68 $2.05 $2.20 14.7% 6.0% 6.7% 22.2% ENLC 3,159 $17.45 6.9% $1.20 $1.36 $1.52 12.5% 7.2% 6.5% 17.5% WES 8,714 $52.46 7.8% $4.07 $4.26 $4.46 4.7% 4.5% 6.9% 14.8% EQM 6,197 $51.46 10.1% $5.22 $6.00 $6.35 10.3% 4.4% 6.9% 30.8% NBLX 2,130 $53.70 4.9% $2.61 $3.12 $3.74 19.7% 19.8% 4.8% 18.0% CNXM 1,298 $20.40 7.7% $1.57 $1.81 $2.07 14.8% 15.0% 5.4% 30.5% HESM 1,239 $22.71 7.2% $1.63 $1.87 $2.11 13.8% 11.4% 5.9% 23.5% TRGP 11,332 $51.63 7.1% $3.64 $3.64 $3.74 1.4% 4.3% 6.9% 8.5% OKE 27,752 $67.51 5.3% $3.60 $3.95 $4.42 10.7% 6.7% 6.5% 5.8% PROJECT ALPINE PRO FORMA TRADING CONSIDERATIONS 19 Source Capital IQ, Company Materials Peer Mean 11.3% 8.8% 6.3% 19.0% Peer Median 11.6% 7.0% 6.5% 18.2% Operating C-Corp 2019E 2020E 2021E 2019 - 2021 2021 - 2022 MLP Peers 2019E 2020E 2021E 2019 - 2021 2021 - 2022 Antero 2019E 2020E 2021E 2019 - 2021 2021 - 2022 AMGP SA 3,445 $18.50 4.8% $0.89 $1.34 $1.74 40.1% 27.6% 4.1% 37.6% AMGP PF 10,644 6.4% $1.32 $1.67 $2.09 26.0% 23.2% 4.5% AMGP PF 16,170 4.2% $1.32 $1.67 $2.09 26.0% 23.2% 4.5% AMGP PF 9,599 7.1% $1.32 $1.67 $2.09 26.0% 23.2% 4.5% 37.6% 19.0% 42.7% AM 6,041 $32.28 6.8% $2.21 $2.85 $3.42 24.4% 19.9% 4.8% 36.5% GP Peers 2019E 2020E 2021E 2019 - 2021 2021 - 2022 $20.51 $31.16 $18.50 3-Year IRR
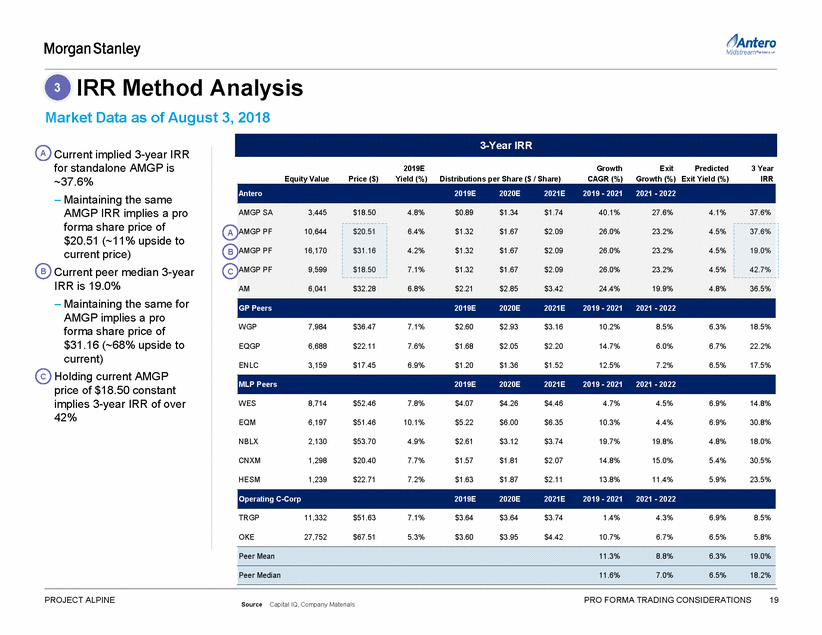
Yield vs. Growth Correlation 4 Market Data as of August 3, 2018 • Correlation of yield vs. growth implies a pro forma share price of $27.63 (~50% upside to current price) 2-Year DPS/DPU CAGR (2019E – 2021E) (1) 12.0 10.0 8.0 (2) CNXM ETE DCP 6.0 Current Price: $32.28AM SA P 6.3% $18.50 4.0 MGP PF 2.0 4.2% $27.83 Yield 0.0 0.0 5.0 10.0 15.0 20.0 25.0 30.0 35.0 Antero 40.0 45.0 C-Corp Non C-Corp Source Capital IQ, Company projections Notes: 1. Peer and standalone Antero represents 2-year 2019-2021 DPS/DPU CAGR 2. Peer and standalone Antero represents current yield; PF AMGP represents estimated current yield at 3/31/2019 PROJECT ALPINE PRO FORMA TRADING CONSIDERATIONS 20 Current Yield (2) AMGP Yield Sensitivity (At 3/31/2019 Annualized) Assumed Implied Yield Price Breakeven Yield 5.7% $20.51 5.2% $22.48 4.7% $24.87 Implied 3.7% $31.59 3.2% $36.52 TGE EQM WES ENBL PF AMGP Implied Price: $27.83 Implied Yield: 4.2% 2-Year Growth: 26.0% TRGPMPLXENLCAMGP PF WGPHESMBreakeven Yield EPDEQG WPZ Current Yield: 5.1% 2-Year Growth: 24.4% 4.2%OKE WMB NBLX A As of 3/31/2019 26.0% AMGP SA Current Price: $18.50 Current Yield: 2.7% 2-Year Growth: 40.1% R-Squared: 0.641 AMGP Yield vs. 2-Year DPS/DPU CAGR (G&P Peers)
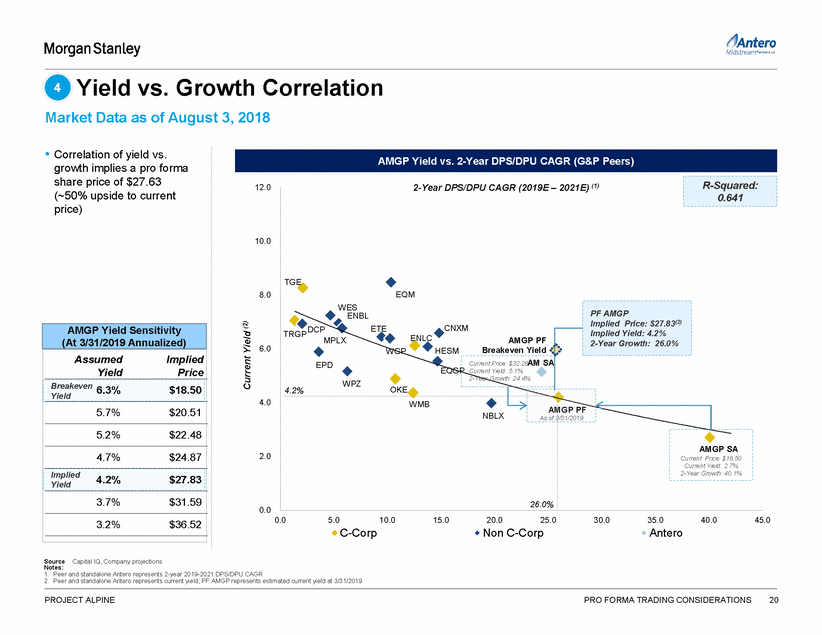
S&P 500 Index Eligibility Criteria 5 Based on Latest S&P Methodology – June 2018 (Pro-Forma) • The indices are maintained by the S&P Index Committee which meets on a regular basis • All changes to the indices are fully discretionary – A company that satisfies all of the criteria may not be added and the timing of any addition is up to the S&P’s discretion • Antero Midstream GP will likely not meet all requirements for the S&P 500 immediately after the simplification transaction, given its public float is expected to remain below 50% of total shares outstanding • Should AMGP improve its float over time, it could be added to the S&P at the discretion of the index committee – MS estimates an addition to the S&P 500 could result in at least 12.5MM shares of demand from index funds, which is ~$233MM based on current prices (3) Notes: 1. A U.S. company, for index purposes, should have the following characteristics: (1) files 10-K annual reports and should not be considered a foreign entity by the SEC; (2) the U.S. portion of fixed assets and revenues constitutes a plurality of the total, but need not exceed 50% (when these are in conflict, assets d etermine plurality whereas revenue determines plurality when asset information is incomplete; (3) the primary listing of the common stock is the NYSE (including NYSE Arca and NYSE MKT) or the NASDAQ (Global Select Market, Select Market, or Capital Market) (ADRs are not eligible for inclusion); (4) the corporate governance structure is consistent with U.S. practice. If criteria (2) is not met or ambiguous, S&P Dow Jones Indices may still deem it a U.S. company for index purposes if its primary listing, headquarters and incorporation are all in the U.S. and/or a “domicile of convenience” 2. In general, float is calculated off basic shares outstanding; however, there are instances where S&P looks at common stock eq uivalent securities on a fully diluted basis 3. Assumes inclusion to the S&P at 50% public float, based on PF TSO of 518.9MM shares and current price of $18.50 PROJECT ALPINE PRO FORMA TRADING CONSIDERATIONS 21 7 Eligible Securities and Organizational Structures P • Eligible securities are the common stock of U.S. companies with a primary listing on one of the accepted U.S. exchanges (NYSE, NASDAQ, Bats). Ineligible exchanges include OTCBB and Pink Sheets • Eligible organizational structures are Corporations, including equity and mortgage REITs (excluding) • Ineligible organizational structures and share types include but are not limited to: BDCs, LPs, MLPs, LLCs, CLEFs, ETFs, ETNS, ADRs 6 Sector Representation P • Companies’ industry classifications contribute to the maintenance of a sector balance that is in line with the sector composition of the universe of eligible companies within the defined market cap range 5 Public Float (2) O • Minimum of 50% required • AMGP Pro-Forma Public Float (%) = 224.3MM shares / 518.9MM shares = ~43% 4 Financial Viability P • The sum of the most recent 4 consecutive quarters’ as-reported earnings should be positive as should the most recent quarter; as-reported earnings are defined as GAAP net income excluding discontinued operations and extraordinary items 3Adequate Liquidity and Reasonable Price P • Ratio of annual dollar value traded to float-adjusted capitalization for the company should be 1.00x or greater, and the company should trade a minimum of 250,000 shares in each of the trailing six months 2Market Capitalization P • Minimum of $6.1Bn • Market cap minimum is reviewed from time to time 1 Geography & Listing P • U.S. Companies (1)
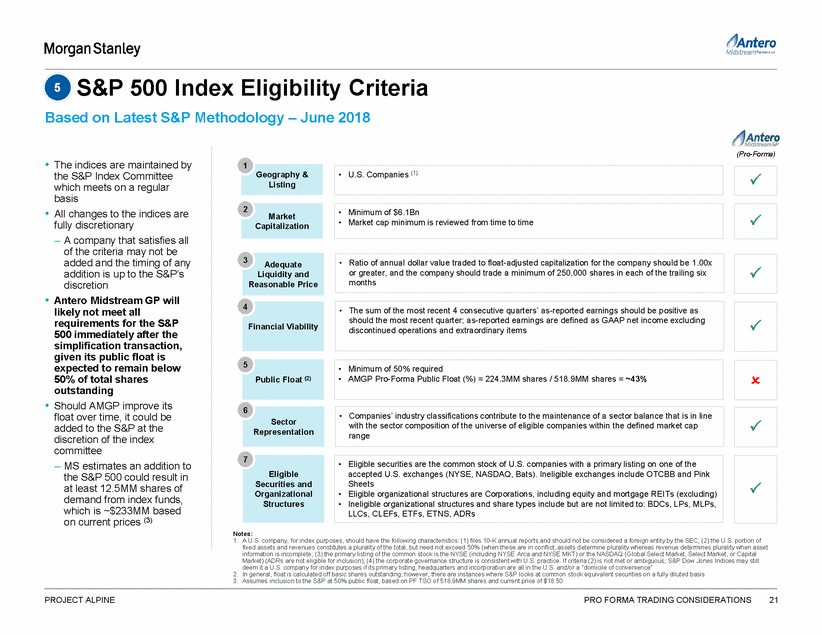
AMGP Style vs. Peers 5 Up-C Delaware C-Corp (1) Partnership LLC 2.8 Among C-3.6 Investor Style Breakdown as % of Institutional Reported Holdings Institutional vs. Retail Split as % of Float on Investor $MM % TSO % TSO OFI 9.1 FPR 2.4 Top Holders Tortois 2.3 GSAM 2.2 CIBC 1.8 Incremental C-Corp Investor Source: Thomson Notes: 1. As of most recent filings; excludes broker dealers 2. C-Corps generate demand from index funds – TRGP, OKE and WMB are all in the Russell 3000 and 1000, and OKE and WMB are in the S&P 500 PROJECT ALPINE PRO FORMA TRADING CONSIDERATIONS 22 Total 17.8 3.5 4.7 4.5 4.7 3.1 14.4 2.7 19.7 41.0 29.0 29.5 8.0 24.1 29.0 23.7 18.3 Larger Index Ownership Corps 47.6 44.1 56.3 3.3 21.3 22.1 31.8 23.3 12.2 2.9 12.4 30.2 28.1 17.5 19.0 23.0 27.0 21.3 22.6 19.5 17.9 15.2 18.0 18.6 9.4 11.7 8.0 9.0 8.7 7.3 4.6 4.3 AMGP 5 95 Position 111.93.8 96.73.3 e89.13.0 88.43.0 67.62.3 453.715.2 PAGP Income / Yield 14 86 Position Investor $MM % TSO Capital Re. 271.7 8.0 Scopie202.45.9 Tortoise189.55.6 Chickasaw175.35.1 Kayne127.83.7 TRGPOKEWMB GrowthValueHedge Fund ETEEQGP WGP OtherIndexIncome ENLC 35 65 Positi Investor $MM Chickasaw240.5 Tortoise63.4 Salient60.4 Advisory Re.59.0 Dimensional46.5 Total469.7 11 24 997689 Larger Institutional Ownership Among C-Corps 11 28 7210089 TRGP OKE WMB Investor $MM % TSO $MM % TSO $MM % TSO Tortoise 346.1 3.6 795.4 3.4 359.2 1.8 Fidelity16.00.27.40.0 1146.45.6 GSAM484.75.0 303.81.3 347.71.7 BlackRock29.80.380.30.3 494.62.4 Norges78.80.7 161.00.7 254.11.0 ETE EQGP WGP Investor $MM % TSO $MM % TSO $MM % TSO Neuberger 378.5 2.5 153.8 2.5 386.4 5.3 Chickasaw333.22.278.21.3 185.22.6 Tortoise454.63.039.40.638.80.5 Salient240.31.6--118.71.6 GSAM148.11.071.11.218.00.3 Total1554.810.1 342.65.6 747.110.3 Total966.828.3 Total955.39.8 1347.85.8 2602.012.4
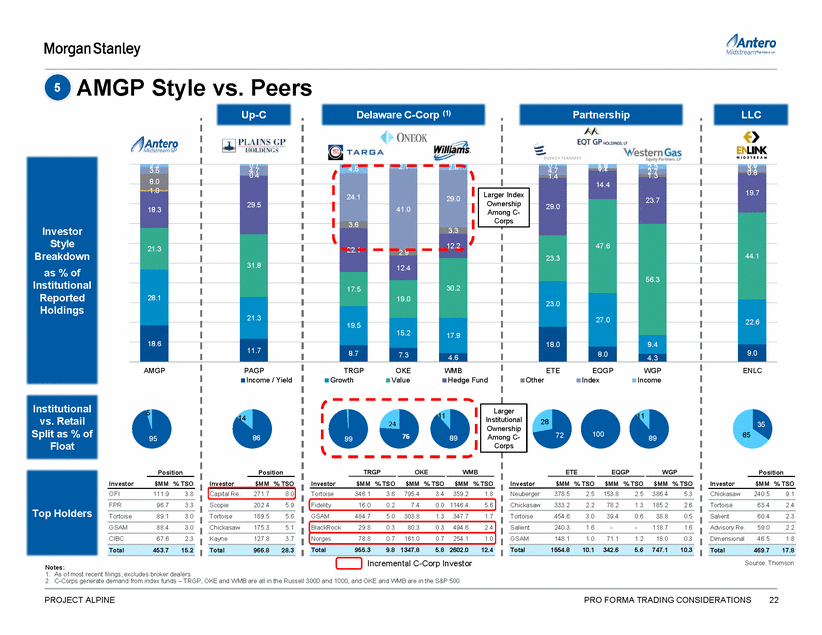
Identifying Incremental Midstream Up-C / C-Corp Investors 5 Top Holders of Midstream C-Corps (1)(2) AMGP Pos ($MM) Position Held in Midstream C-Corp Peers ($MM) • There are several quality long-only Midstream C-Corp investors who can be incremental buyers of AMGP, given they are currently materially underweight AMGP Investor KMI PAGP TRGP LNG OKE WMB ENLC TEGP Total Tortoise Capital Advisors, LLC 89.0 242.0 189.5 346.1 320.4 795.4 359.2 63.4 74.8 2,390.8 Fidelity Management & Research Company - 310.3 26.0 16.0 709.0 7.4 1,146.4 - 1.5 2,216.5 Goldman Sachs Asset Management (US) 88.4 111.1 96.5 484.7 146.6 303.8 347.7 0.4 - 1,490.8 Kayne Anderson Capital Advisors, L.P. - 152.2 127.8 333.9 15.7 591.1 113.4 7.2 86.7 1,428.0 Wellington Management Company, LLP 1.0 1,178.1 15.7 126.4 2.2 41.3 - - - 1,363.7 Deutsche Asset & Wealth Management 11.9 252.0 - 225.1 144.4 183.2 371.7 - - 1,176.5 Harvest Fund Advisors LLC 30.6 23.5 1.6 313.7 134.9 369.7 235.8 - 73.7 1,152.9 Salient Capital Advisor LLC 1.5 71.9 75.5 208.6 16.2 278.5 225.4 60.4 137.2 1,073.7 Franklin Mutual Advisers, LLC - 552.5 26.7 - - 0.3 478.8 - - 1,058.3 OFI SteelPath, Inc. 111.9 0.4 75.4 367.0 0.2 103.0 68.5 0.5 267.2 882.1 Neuberger Berman, LLC 27.6 4.6 3.9 189.6 107.4 500.8 143.2 - - 949.5 Chickasaw Capital Management, L.L.C. - - 175.3 357.6 - 1.7 194.4 240.5 - 969.6 Capital Research Global Investors - 117.0 271.7 - - 412.4 150.9 - - 952.0 ClearBridge Investments, LLC 0.8 192.0 24.9 154.4 0.7 225.1 265.1 0.8 50.8 913.9 Norges Bank Investment Management (NBIM) - 374.1 - 78.8 42.8 161.0 254.1 - - 910.6 Brookfield Investment Management Inc. - 147.9 - 294.9 50.7 142.7 127.9 - - 764.1 BlackRock Investment Management (UK) Ltd. 3.3 148.5 14.7 48.1 118.1 113.3 285.4 1.4 1.4 730.9 JP Morgan Asset Management 31.7 232.5 0.6 1.0 0.6 74.2 340.7 - - 649.4 Energy Income Partners LLC - 206.8 - 46.1 - 241.5 175.1 - - 669.4 BlackRock Financial Management, Inc. - 41.2 1.1 29.8 16.7 80.3 494.6 - 2.3 666.1 PointState Capital LP - - 75.0 202.6 366.0 - - - - 643.6 Nuveen LLC 0.1 127.3 44.5 41.9 60.0 94.4 253.8 - - 621.9 Cushing Asset Management, LP 44.4 75.5 64.6 161.4 62.2 123.7 48.7 33.3 1.0 570.3 Millennium Management LLC 7.4 30.5 92.9 65.4 105.7 120.4 109.2 16.1 18.7 558.9 Dimensional Fund Advisors, L.P. - 228.3 - 92.1 28.8 58.4 96.3 46.5 0.0 550.4 Advisory Research, Inc. 31.3 57.2 38.7 113.3 0.1 133.4 57.0 59.0 52.6 511.4 Cohen & Steers Capital Management, Inc. 54.9 171.1 7.1 27.3 128.0 146.1 7.7 - - 487.3 Jennison Associates LLC 5.0 13.4 - 147.5 74.0 94.4 121.0 6.5 50.9 507.5 Morgan Stanley Wealth Management 11.9 131.0 10.9 67.6 33.6 113.9 121.4 6.8 14.5 499.8 FPR Partners 96.7 414.7 - - - - - - - 414.7 Eagle Global Advisors, LLC 36.5 98.9 59.2 96.4 2.3 93.0 29.5 23.5 37.0 439.8 Capital International Investors - 161.6 - - - - 304.0 - - 465.6 MFS Investment Management - 36.0 110.2 48.9 172.1 14.2 56.5 - 13.0 450.8 CI Investments Inc. - 77.9 - - 171.6 - 179.6 - - 429.1 Manulife Asset Management (US) LLC - 41.7 - - 228.6 139.1 10.1 - - 419.5 CIBC Atlantic Trust Private Wealth Management 67.6 101.0 38.1 94.8 4.1 75.5 9.5 - 12.0 335.0 Commonwealth Bank of Australia - 360.0 0.0 0.0 0.0 2.0 2.2 - - 364.3 Center Coast Capital Advisors, LP - 0.0 42.3 232.8 - 88.8 0.0 - - 363.8 Franklin Advisers, Inc. - 95.0 - 12.8 - 51.7 173.7 - - 333.2 Steadfast Financial LLC - - - - 246.1 - 67.2 - - 313.4 Source: Wall Street Research, Company Filings, Capital IQ Denotes Key Incremental Midstream C-Corp Investor Notes: 1. As of most recent filings; excludes index funds and broker dealers 2. Midstream C-Corps include: KMI, PAGP, TRGP, LNG, OKE, WMB, ENLC, TEGP, AMGP; excludes holders of only 1 peer PROJECT ALPINE PRO FORMA TRADING CONSIDERATIONS 23
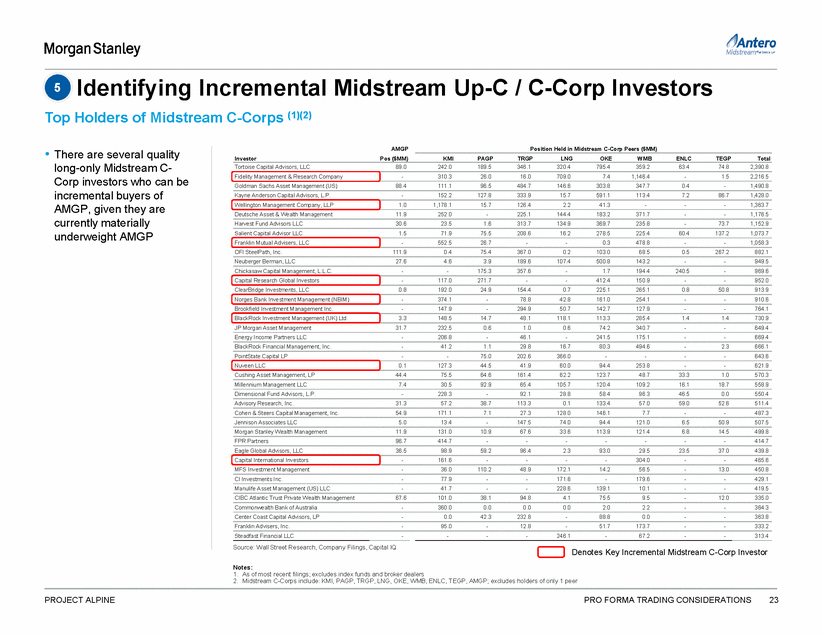
Legal Disclaimer We have prepared this document solely for informational purposes. You should not definitively rely upon it or use it to form the definitive basis for any decision, contract, commitment or action whatsoever, with respect to any proposed transaction or otherwise. You and your directors, officers, employees, agents and affiliates must hold this document and any oral information provided in connection with this document in strict confidence and may not communicate, reproduce, distribute or disclose it to any other person, or refer to it publicly, in whole or in part at any time except with our prior written consent. If you are not the intended recipient of this document, please delete and destroy all copies immediately. We have prepared this document and the analyses contained in it based, in part, on certain assumptions and information obtained by us from the recipient, its directors, officers, employees, agents, affiliates and/or from other sources. Our use of such assumptions and information does not imply that we have independently verified or necessarily agree with any of such assumptions or information, and we have assumed and relied upon the accuracy and completeness of such assumptions and information for purpos es of this document. Neither we nor any of our affiliates, or our or their respective officers, employees or agents, make any representation or warranty, express or implied, in relation to the accuracy or completeness of the information contained in this document or any oral information provided in connection herewith, or any data it generates and accept no responsibility, obligation or liability (whether direct or indirect, in contract, tort or otherwise) in relation to any of such information. We and our affiliates and our and their respective officers, employees and agents expressly disclaim any and all liability which may be based on this document and any errors therein or omissions therefrom. Neither we nor any of our affiliates, or our or their respective officers, employees or agents, make any representation or warranty, express or implied, that any transaction has been or may be effected on the terms or in the manner stated in this document, or as to the achievement or reasonableness of future projections, management targets, estimates, prospects or returns, if any. Any views or terms contained herein are preliminary only, and are based on financial, economic, market and other conditions prevailing as of the date of this document and are therefore subject to change. We undertake no obligation or responsibility to update any of the information contained in this document. Past performance does not guarantee or predict future performance. This document and the information contained herein do not constitute an offer to sell or the solicitation of an offer to buy any security, commodity or instrument or related derivative, nor do they constitute an offer or commitment to lend, syndicate or arrange a financing, underwrite or purchase or act as an agent or advisor or in any other capacity with respect to any transaction, or commit capital, or to participate in any trading strategies, and do not constitute legal, regulatory, accounting or tax advice to the recipient. We recommend that the recipient seek independent third party legal, regulatory, accounting and tax advice regarding the contents of this document. This document does not constitute and should not be considered as any form of financial opinion or recommendation by us or any of our affiliates. This document is not a research report and was not prepared by the research department of Morgan Stanley or any of its affiliates. Notwithstanding anything herein to the contrary, each recipient hereof (and their employees, representatives, and other agents) may disclose to any and all persons, without limitation of any kind from the commencement of discussions, the U.S. federal and state income tax treatment and tax structure of the proposed trans action and all materials of any kind (including opinions or other tax analyses) that are provided relating to the tax treatment and tax structure. For this purpose, "tax structure" is limited to facts relevant to the U.S. federal and state income tax treatment of the proposed transaction and does not include information relating to the identity of the parties, their affiliates, agents or advisors. This document is provided by Morgan Stanley & Co. LLC and/or certain of its affiliates or other applicable entities, which may include Morgan Stanley Realty Incorporated, Morgan Stanley Senior Funding, Inc., Morgan Stanley Bank, N.A., Morgan Stanley & Co. International plc, Morgan Stanley Securities Limited, Morgan Stanley Bank AG, Morgan Stanley MUFG Securities Co., Ltd., Mitsubishi UFJ Morgan Stanley Securities Co., Ltd., Morgan Stanley Asia Limited, Morgan Stanley Australia Securities Limited, Morgan Stanley Australia Limited, Morgan Stanley Asia (Singapore) Pte., Morgan Stanley Services Limited, Morgan Stanley & Co. International plc Seoul Branch and/or Morgan Stanley Canada Limited Unless governing law permits otherwise, you must contact an authorized Morgan Stanley entity in your jurisdiction regarding this document or any of the information contained herein. © Morgan Stanley and/or certain of its affiliates. All rights reserved. PROJECT ALPINE 24
Table of Contents Executive Summary Appendix A: AMGP Acquisition of AM Analysis Appendix B: AR Share Buyback Analysis 2
ExecutiveSummary M O R G A N S TA N L E Y & J . P. M O R G A N
Executive Summary 4 Executive Summary • Shareholders of Antero have made requests for management and the Board to consider and evaluate potential measures to remedy two perceived issues: –Perceived valuation discount and relative underperformance of AR versus its Appalachian peers –Shareholder “mis-alignment”, primarily referring to the IDR value stream being held outside of the AR family • JPM and MS have been working with management to analyze potential actions through the lenses of: –Potential benefits to shareholders of AR, AMGP and AM –Potential to address shareholder concerns • Though our analysis is ongoing, we want to highlight two potential actions which, in combination, appear to meet these criteria –Consolidation of midstream entities via AMGP buying AM –Appears financially attractive to AMGP and AM shareholders and solves a key mis-alignment issue for AR shareholders –AR share buyback of $500MM+, effected over two years –Sizable enough to be meaningful while preserving leverage at 2.0x for 2019 and beyond –Potential use of proceeds to fund buyback from early monetization of water earn-out payments
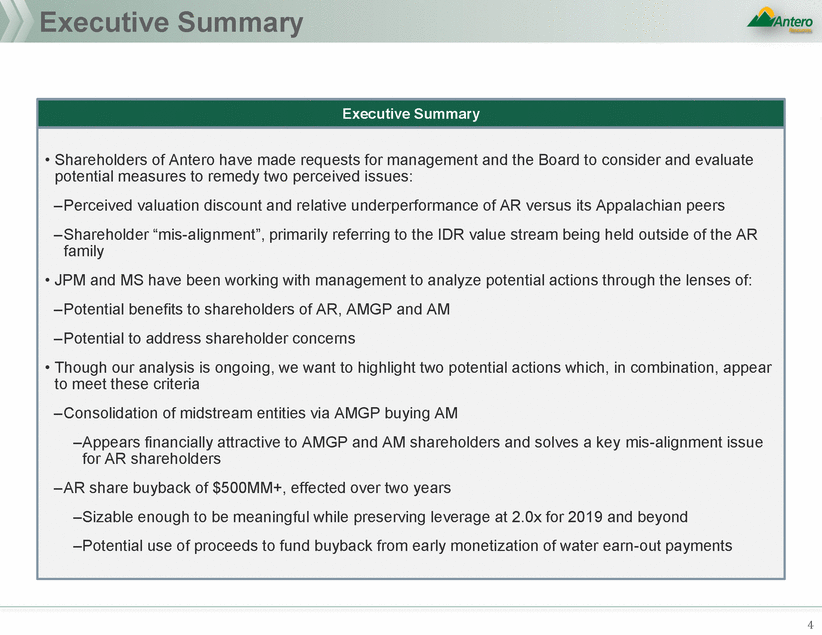
Upstream and Midstream Sector Trends 5 Midstream • Lower commodity prices, slowing growth, and slowing producer activity have generally resulted in distribution cuts, lower MLP unit prices, and materially higher yields over the past 3 years • In response, many investors (particularly retail) have exited the space in search of other yield-oriented investments (REITs, utilities, etc.), materially reducing equity capital market access for even the largest MLPs • Institutional investors in the midstream space have become increasingly focused on distribution stability, ability to self-fund the business plan, elimination of IDRs / simpler structures, and more conventional valuation metrics (i.e. EV / EBITDA vs yield plus growth) – MLPs have responded by reducing distribution growth to build coverage and reduce capital markets reliance as well as by simplifying corporate structures (repurchasing IDRs or intra-family mergers) Upstream • Recovery in oil prices not matched by natural gas, and investors are generally skeptical regarding a catalyst for gas-levered operators • Frustrated investors clamoring for free cash flow, shareholder returns and capital discipline over production growth – In the last six months, 6 firms have announced share repurchase programs and 5 have added or increased dividend programs • Increased scrutiny of executive compensation and to some degree governance – All topics directly addressed by Antero at its Analyst Day • Operational execution increasingly separating winners and losers in the eyes of investors • Investors also expressing belief in value of intra-basin consolidation, although social issues and bid / ask on premia still impede activity
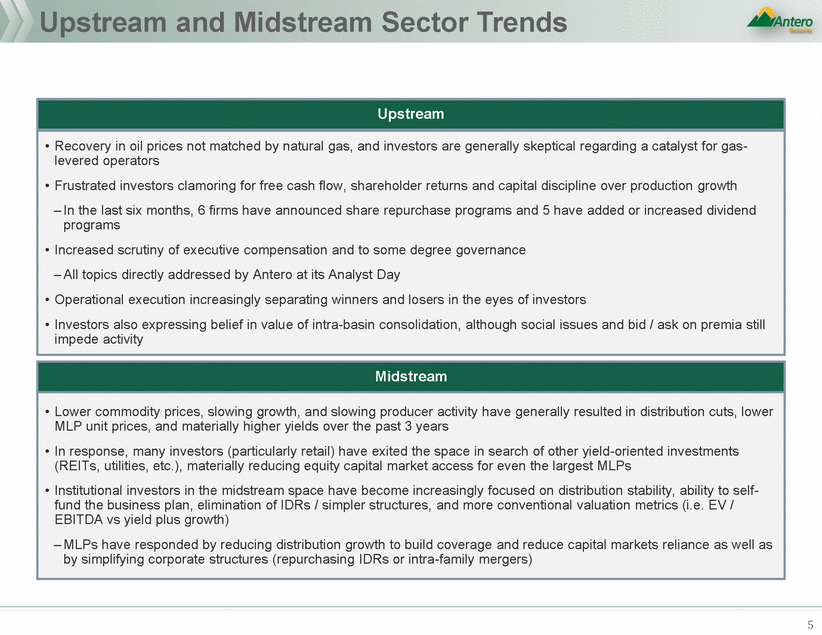
Heightened Shareholder Activism Across Oil & Gas 01/26/18 $0.7 Monarch / Fir Tree 9.2% / 9.0% 12/14/17 14.0 Elliott Management 6.7 11/20/17 0.6 Icahn Associates / Fir Tree 13.5 / 8.3 Elliot / BlueMountain / Avenue 10/16/17 2.2 39.0 09/18/17 1.7 Fir Tree 18.5 09/14/17 0.1 Q Investments / Fir Tree 7.9 / 7.2 07/03/17 10.2 JANA Partners / D.E. Shaw 5.9 / 4.0 05/31/17 5.4 Corvex Management 5.5 04/10/17 98.3 Elliott Management 4.1 11/21/16 22.9 Elliott Management 4.0 Source: SharkRepellent, Wall Street Journal / Reuters, FactSet; Note: Most recent campaigns listed first; 1 At start of agitation 6 • Material increase in activist activity over the past 18 months across the oil and gas space with attention focused on upstream – 10 public campaigns launched, with many more undisclosed situations • Commodity prices largely viewed as range-bound, with more optimism for oil vs. gas – Commodity price stability gives activists comfort that commodity price declines won’t undermine investment/activism thesis • Activist activity (both in oil and gas and across industries) expanding from “traditional” activists to investors who have historically been more passive • Activist arguments generally center around the following themes, and are coupled with allegations of governance “failures” – Need for targeted company to engage in M&A to address undervaluation (whether due to lack of scale, insufficient management expertise or otherwise) – Need for targeted company to explore structural alternatives to address sum-of-parts discount Select Campaigns TargetAnnouncement dateMarket cap ($bn)1ActivistStake1 Activist Demands StrategicStructuralGovernance
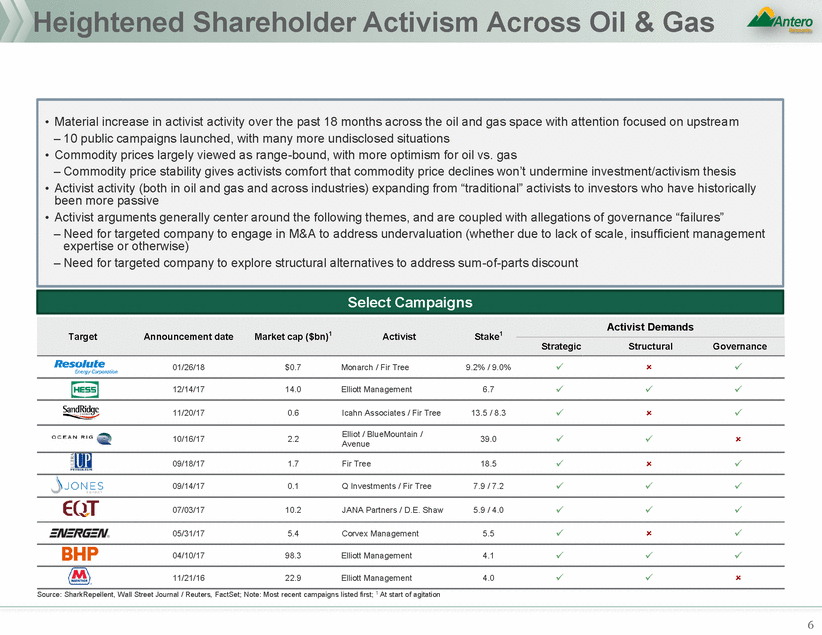
AR Performance Over Time AR COG EQT RRC Other Appalachia¹ 80% 40% 24% 0% (13%) (23%) (49%) (66%) (40%) (80%) Feb-16 Aug-16 Feb-17 Aug-17 Feb-18 AR COG EQT RRC Other Appalachia¹ 30.0x 25.0x 20.0x 15.0x 8.4x 7.9x 6.6x 6.1x 3.9x 10.0x 5.0x 0.0x Feb-16 Aug-16 Feb-17 Aug-17 Feb-18 Source: FactSet as of 02/16/18 1 Other Appalachia includes GPOR and SWN 7 Consolidated Two-Year Rolling FV / NTM EBITDAX Two-Year Share Price Performance
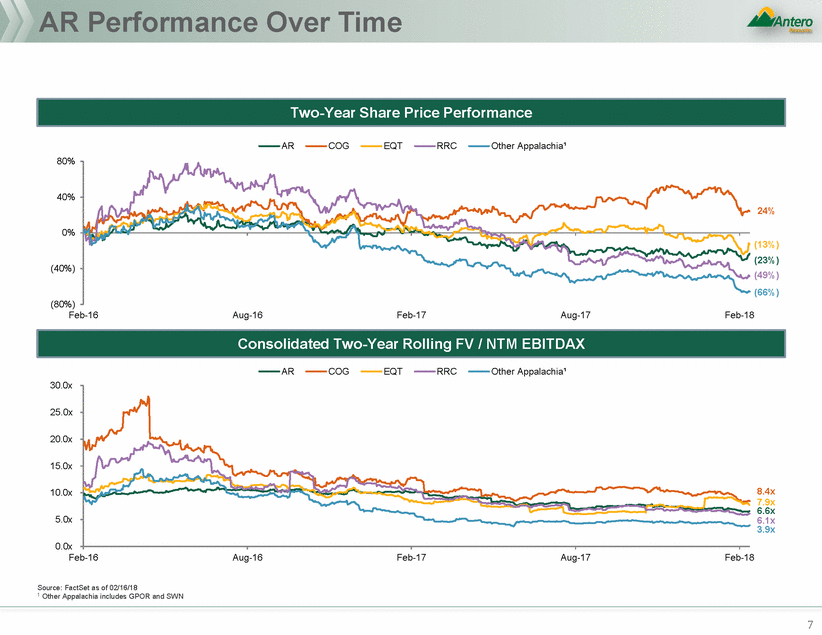
AR Peer Benchmarking Flow5 (excl. MLPs and Midstream) Flow5 (excl. MLPs and Midstream) Source: FactSet as of 02/16/18, company filings Note: Firm value reflects market value of non-controlling interest for public MLPs, where applicable. Permian peers include CXO, FANG, PE, RSPP, EGN, CDEV, JAG, LPI and CPE 1 Adjusted to remove MLP value based on public MLP ownership, Rice GP value based on LP ownership and 15.0x GP distributions as well as Rice Midstream Holdings based on 10.0x FV / 2018E EBITDA of $130mm based on company estimates, assumes tax drag of 20% on EQT ownership of GP and LP cash flow and Rice Midstream Holdings; 2 Adjusted to remove Antero Midstream value with no assumed tax drag as result of NOL usage; 3 Adjusted to remove midstream services contribution, based on 8.0x FV / 2018E EBITDA and 20% EBITDA margin on broker median projections for midstream services revenue; 4 FANG firm value adjusted to remove public MLP ownership in VNOM, assumes tax drag of 20%; 5 Equity value to deconsolidated discretionary cash flow 8 Adjusted Equity Value / 2019E Cash 123 Permian Peers 7.0x 4.7x 4.4x 3.3x 2.7x 1.9x 1.6x Consolidated FV / 2019E EBITDAX Permian Peers 6.8x 6.5x 5.3x 5.2x 5.2x 3.9x 3.4x Adjusted FV / 2019E EBITDAX (excl. MLPs and Midstream) 123 Permian 4 Peers 6.5x 5.2x 5.2x 4.9x 4.2x 3.4x 3.1x 123 Permian Peers 9.2x 6.9x 5.1x 4.4x 3.3x 2.2x 1.7x Permian Peers 8.4x 7.9x 7.2x 6.6x 6.1x 4.1x 3.7x 123 Permian 4 Peers 8.4x 7.2x 6.1x 5.4x 5.4x 3.7x 3.3x Adjusted Equity Value / 2018E Cash Adjusted FV / 2018E EBITDAX (excl. MLPs and Midstream) Consolidated FV / 2018E EBITDAX
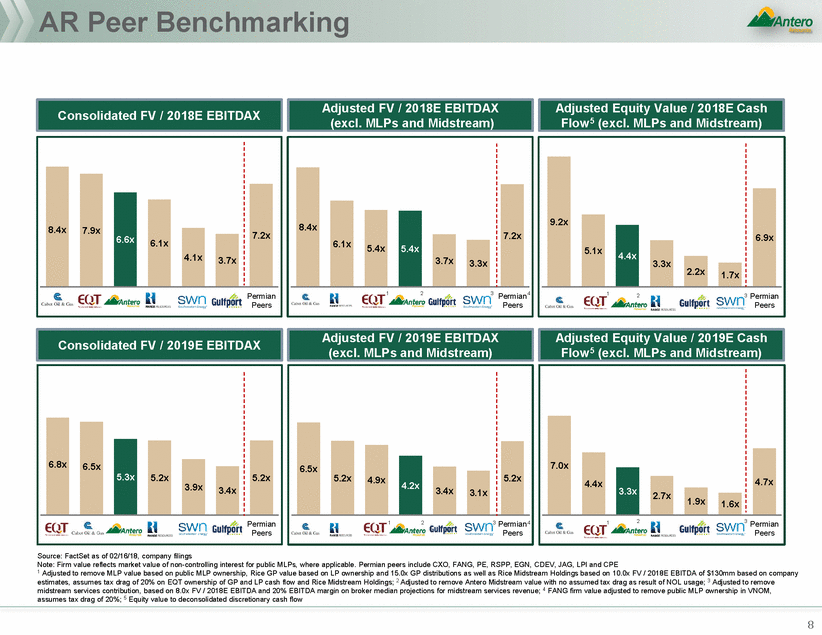
AR Peer Benchmarking Cont’d Source: FactSet as of 02/16/18, company filings, broker estimates 1 Debt adjusted to remove debt at AM; Adjusted EBITDAX equal to AR E&P-only EBITDAX plus distributions received from AM; 2 Debt adjusted to remove debt at EQM, EQGP, and RMP; Adjusted EBITDAX equal to EQT E&P-only EBITDAX plus distributions received from EQGP, RMP and RMH; RMH distributions defined as $130mm of RMH EBITDA less capex assumed at 10% of RMH EBITDA; 3 FANG debt adjusted to remove VNOM debt; Adjusted EBITDAX equal to FANG E&P-only EBITDAX plus distributions received from VNOM 9 3.1x 2.9x 2.2x 2.0x 1.9x 0.9x 1.0x Permian Peers 3.1x 2.9x 2.2x 2.0x 2.0x 0.9x 1.0x 12Permian 3 Peers Consolidated Debt / 2019E Consolidated EBITDAX Deconsolidated E&P Debt / 2019E Adj. EBITDAX 3.3x 3.3x 2.5x 2.4x 2.2x 1.2x 1.2x Permian Peers 3.3x 3.3x 2.6x 2.4x 2.2x 1.2x 1.2x 12Permian 3 Peers Deconsolidated E&P Debt / 2018E Adj. EBITDAX Consolidated Debt / 2018E Consolidated EBITDAX
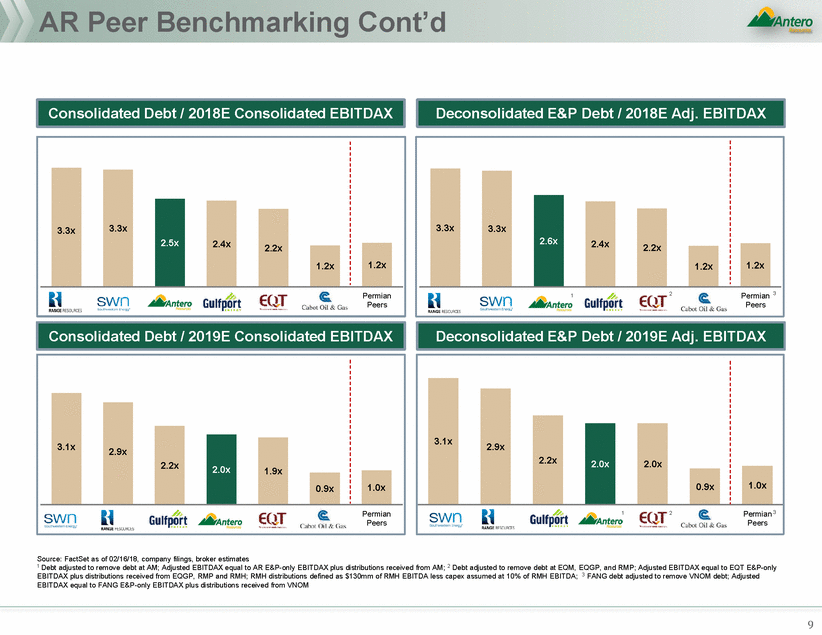
Wall Street Perspectives “We view [Antero’s] valuation multiple as cheap given that we forecast AR E&P can grow production at a mid-teens rate in 2020+ within cash flow with >10 years of inventory remaining post 2022.” “Antero set the stage for strong growth for the next five years, while simultaneously transitioning to a FCF positive company with <2.0x leverage levels. We remain at Hold on the name as we take a wait-and see approach to the company's ability to reach its targets.… We think interest from investors could potentially pick up as the company positions itself for fiscally responsible growth.” “While we believe management remains one of the best in the business, and the strategy of transitioning to free cash generation should be well received, we remain on the sidelines awaiting a better entry point given complexity of integrated corporate structure, momentum from 5 year plan that doesn’t build until 2019, and the 6% outperformance of shares vs. gassy peers over the last 12 months” Street Shifted To More Hold Recommendations % of Ratings $ / Share 100% 75.00 80% 60.00 60% 45.00 40% 30.00 20% 15.00 0% 0.00 Notes 1. Market Data as of February 16, 2018 2. AR peers include COG, EQT and RRC 10 BuyHoldSellAverage Price TargetShare Price Buy Recommendations Have Declined Over the Last Year as the Broker Price Targets (1)(2) • $24.86 Street consensus price target –31% premium to current • 50% “Buy” vs. 50% “Hold” street recommendations –67% “Buy” recommendations for peers on average –33% “Hold” recommendations for peers on average Broker Commentary Wall Street Believes In Less Upside At AR Relative To Peers
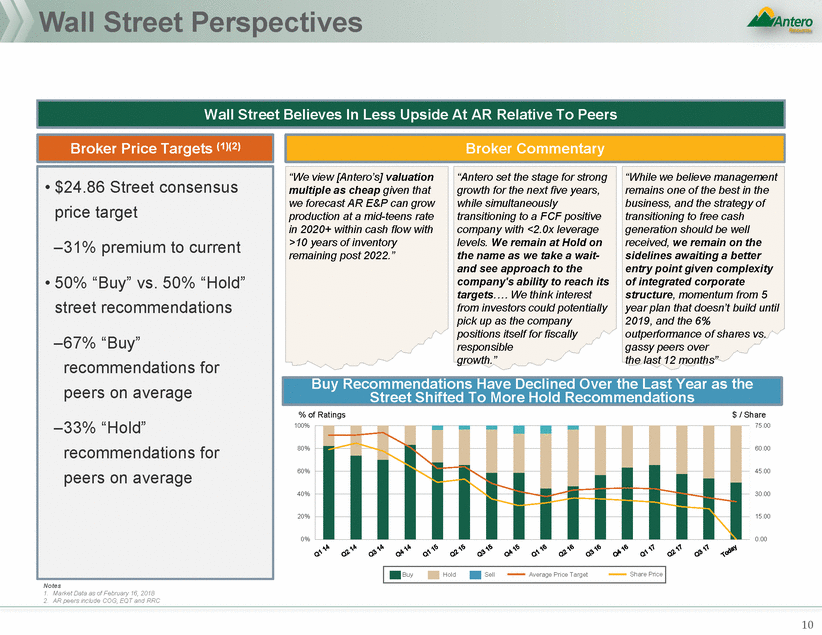
Potential Structural and Financial Alternatives 1 AMGP acquisition of 100% of AM AR share repurchase, financed via: 1 AR leverage capacity AR sale of AM via public secondary AR sale of AM via private secondary to Infra/Pension AR water earn out monetization AR use of AM distributions AR issuance of alternative AR security (e.g., mandatory TEU) AR asset sale AR hedge book monetization AR margin loan of AM shares AMGP bond issuance to buy AM units from AR a) b) c) AM purchase of IDRs 2 3 AMGP acquisition of AR’s ownership in AM 4 AM acquisition of AMGP d) e) f) 5 AMGP acquisition of AR AR acquisition of AMGP and/or AM 6 AR spin/split-off of AM units 7 g) h) i) j) AR dividend a2) 11 Financial Alternatives Structural Alternatives
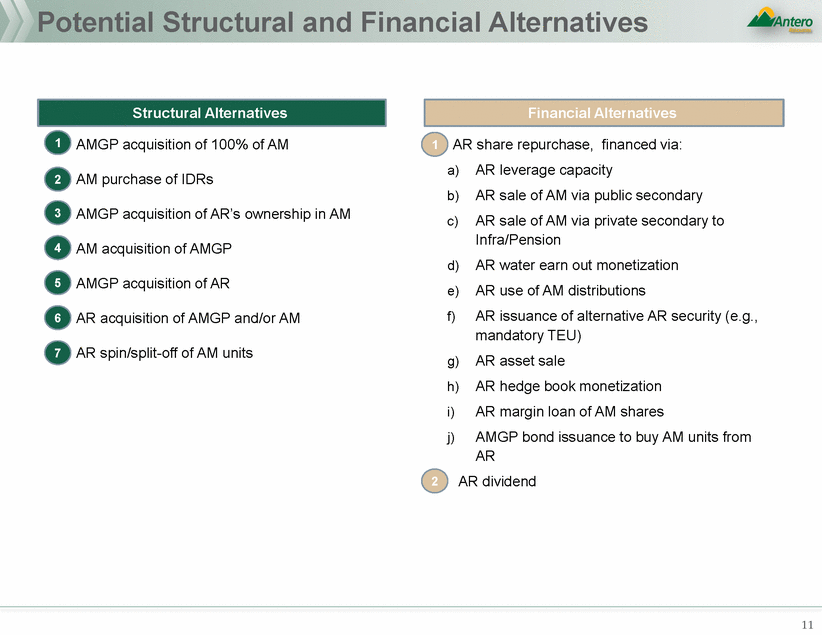
Tier I Potential Consolidation Scenarios removals of IDRs capital at C-Corp and MLP levels difference between AMGP and AM non-distribution bearing units or cash to mitigate dilution • Still maintains complexity of three public currencies and doesn’t AMGP • Requires AMGP vote; need legal input regarding majority of Analyzed in Detail 12 • AMGP eliminates AM’s incentive distribution rights in exchange for newly issued AM common units and / or cash • Consistent with current market preference for simplifications / • Lowers AM cost of capital due to elimination of IDRs • Creates “Up-C” structure for AM, and ability to raise midstream • Significant near term accretion to AMGP given yield spread • Dilutive to AM and AR for first few years but becomes accretive longer term • No tax impact to AR, AMGP or AM shareholders / unitholders • Near-term LP dilution to AM holders (including AR), particularly with respect to ‘18E-’19E DPU; may require coverage reduction, • IDRs not materially impacting AM cost of capital at current time fully address perception of misalignment between AR and • No tax step-up to AM (unless cash is used) minority voting • AMGP acquires AM in all-equity transaction thereby eliminating the MLP • Dramatically improves “mis-alignment” issue; positive for AR • Compelling Value proposition for both AM and AMGP – AM receives up-front premium and accretion to distributions beginning in year 4 – Tax shelter provided by step-up enhances DCF – AMGP gets 100%+ up-front accretion and still enjoys 25% higher distributions 5 years out – Analysis indicates AMGP will hold value and even improve • C-Corp structure provides larger float, liquidity and access to institutional capital, reducing perceived overhang at AM today (i.e. from AR’s significant ownership of AM) • Lowers AM cost of capital due to elimination of IDRs • Research analysts have done pre-conditioning by referring to the AMGP acquisition of AM as most logical combination structure • Taxable to AM unitholders, though average unitholder has relatively high basis in AM units (~$24 / unit) • Taxable to AR, though fully shielded by NOLs • AM distribution dilution in 2018 – 2020 • Potentially seen as reversal of AMGP IPO messaging • Requires AMGP vote; need legal input regarding majority of minority voting Overview Benefits Considerations AM Acquisition of AMGP IDRs AMGP Acquisition of AM
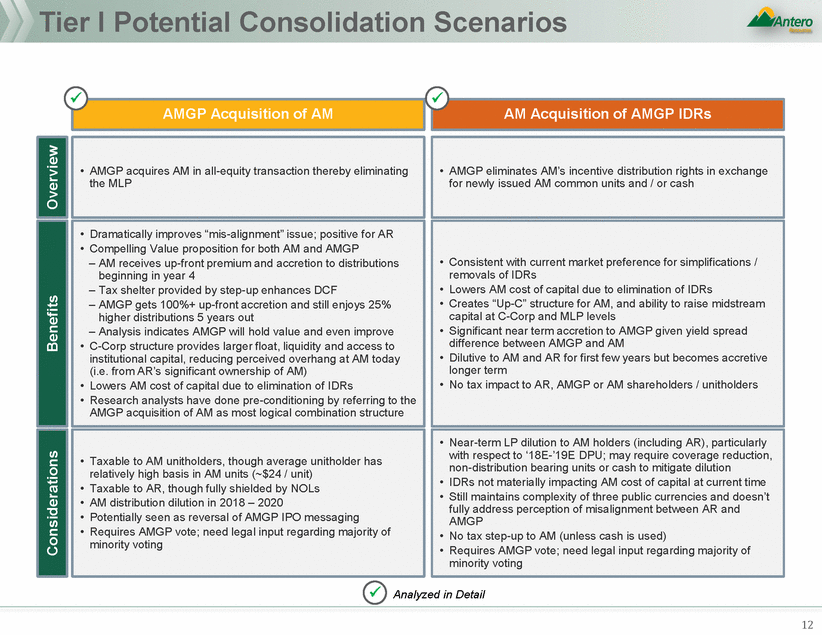
Tier II Potential Consolidation Scenarios – AR no longer public shareholders concerns • Creates a more liquid currency for future M&A 13 • “Integrated Gas” business model •A AMGP issues shares to buy AR •B Or AR issues shares (or AM units) to current AMGP – Issue AM units – AM consolidated simultaneously • Brings AM control under AR, addressing some alignment • Uses AMGP’s comparably higher valuation • Existing AMGP shareholders are unlikely to be supportive given dramatically different assets • Highly dilutive to AR • Co-mingles shareholder bases with notably different objectives • AMGP issues shares to AR for its 53% stake in AM • Preserves all 3 public entities • Pro forma AR would own 42% of AMGP; AMGP would own IDRs and 53% of AM • AR owns largest stake in AMGP (~42%); improves alignment • Basis step-up • Source of funding for AR deleveraging or share repurchase • Taxable to AR, though fully shielded via NOLs • Does not eliminate IDRs for AM • Reduces near-term cash flow to AR • Leaves 3 public entities outstanding Overview Benefits Considerations Merge AR and AMGP AMGP Acquisition of AR’s Interest in AM
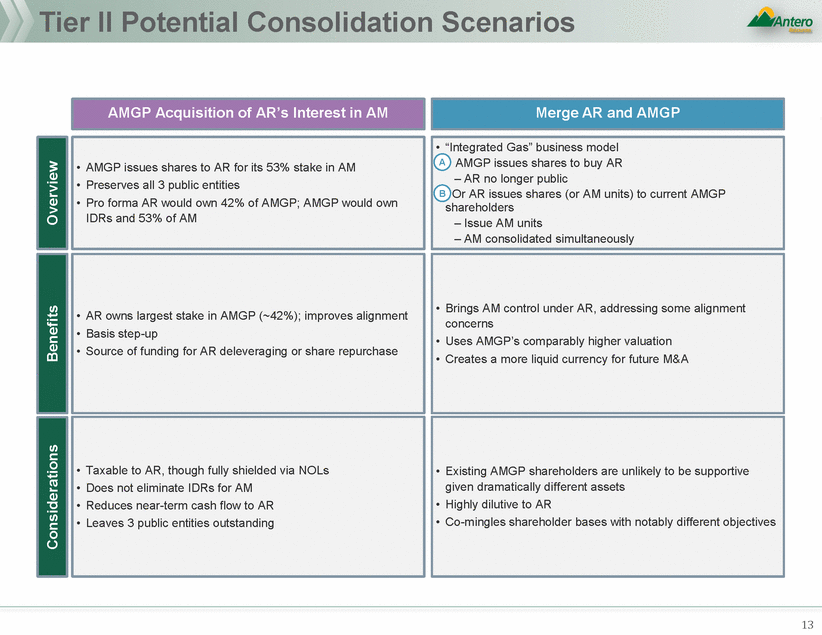
Tier II Potential Consolidation Scenarios Cont’d contributed to C-Corp) addressing SOTP discount issues – Split may be challenging if units contributed to C-Corp basis between AR and AMGP removing dividends received by AM 14 • Does not address market preference for IDR elimination (unless simultaneously repurchased) • Still maintains complexity of three (and potentially four) public currencies • Potentially exacerbates market’s perceived misalignment • Limits balance sheet / capital structure flexibility for AR by • May require access to public markets to fund drilling program • Premium is required to entice AR shareholders to exchange their shares for AM shares • Utilize AR’s tax assets if units not contributed to C-Corp • IDRs not materially impacting AM cost of capital at current time • Inconsistent with the structure employed by recent GP / MLP simplifications • Does not address concerns regarding MLP liquidity and capital market access • Tax inefficient to have MLP acquire C-Corp • Only one precedent in market where MLP acquired C-Corp IDR holder and may not be well received • Near term LP dilution to AM holders (including AR) Considerations • Potentially tax efficient, depending on structure (if units • Full clarity around AR and AM value in the public markets • Preserves optionality to address IDRs / AM cost of capital when IDRs are more substantial and dilution is less pronounced • Cashless retirement of AR shares in the case of split • May be able to merge SpinCo with AMGP on a tax-efficient Benefits • Consistent with current market preference for simplifications / removals of IDRs • Improves alignment between AR and AMGP / owners • Lowers AM cost of capital due to elimination of IDRs • Maintains upstream and midstream vehicles to raise capital • Simplification without near-term tax burden to AR and AM unitholders • No tax impact to AR or AM shareholders / unitholders • AR distributes AM units pro rata to its shareholders • AR shareholders can enter into split-off transaction by exchanging AR shares for AM units • AM acquires AMGP in exchange for AM units and / or cash • Extinguishment of AM’s IDRs with AMGP becoming a wholly owned subsidiary of AM Overview AR Spin / Split-off of AM Units AM Acquisition of AMGP
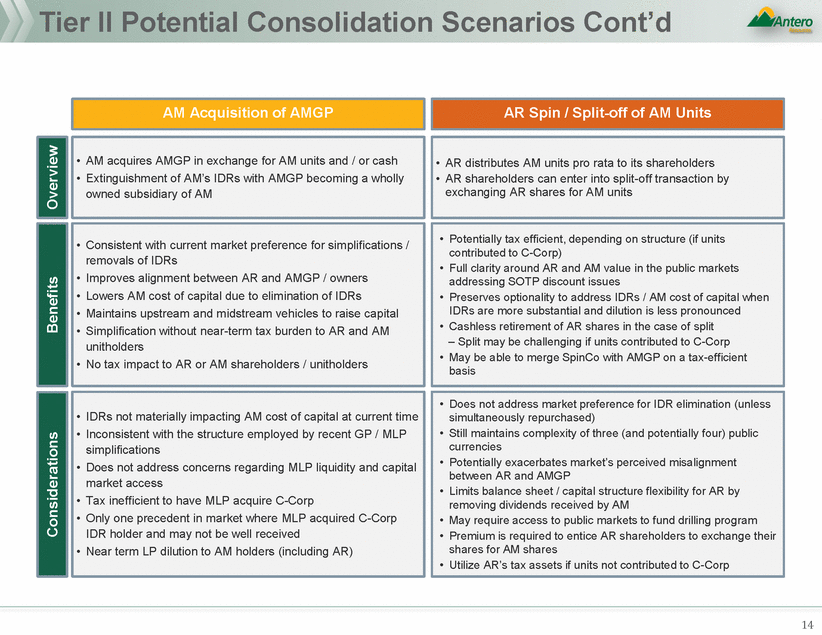
AR Share Repurchase – Overview 15 Considerations • Mixed market reception, particularly if announcing smaller program • Cash on hand from divestitures and FCF viewed as best source of funds by investors • Balance sheet capacity somewhat limited today, materially expands in 2019 as leverage declines further • Largest potential source of funds in AM units difficult to monetize today Benefits • Addresses investor calls for material return of capital • Significantly accretive to discretionary cash flow per share at current valuations • AR has balance sheet capacity given disciplined capital program and deleveraging steps • Increasingly utilized across the E&P sector to address valuation discounts • Several potential levers to generate cash at AR to finance • Could be combined with simplification announcement to maximize market impact
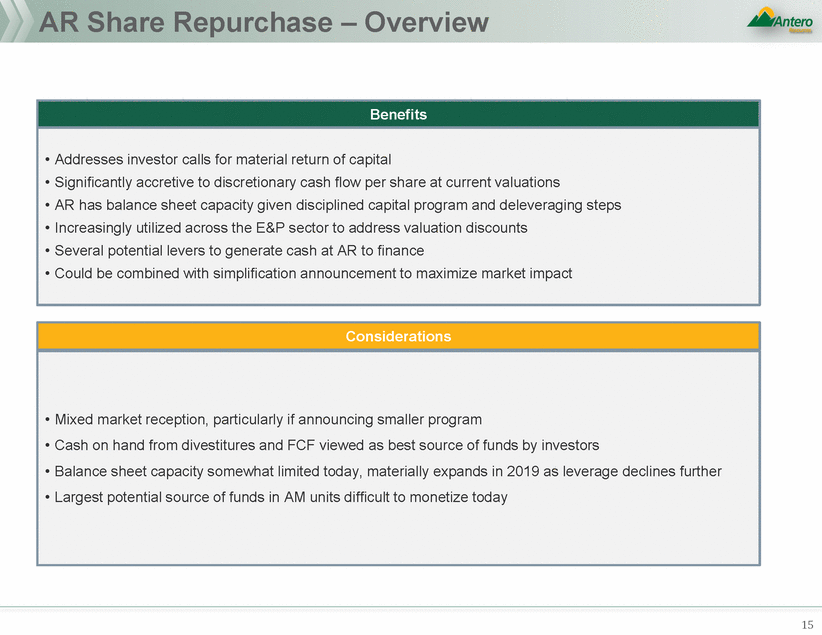
AR Capital Return - Funding Options 16 • AM distributions not true FCF until 2020+ • Any sell downs of AM shares would result in decreased AR share repurchase • May be more attractive uses of capital at other times than share repurchase • Likely some discount to nominal value of the earn out • Contributes to FCF profile in 2019 and 2020 • Investors typically seeking structured opportunities with preferred or conversion features • Partnership units not preferred investment structure • Investor desire to acquire somewhat illiquid MLP position • Likely seek discount to current market price • Friction costs to execute given poor MLP market conditions • Limited ability to execute in size (>$350MM) • Ongoing AM distributions contribute to FCF at AR • Long term value in owning AM units • Sequencing / disclosure issues if also pursing simplification transaction • AR not generating material FCF until 2019 • Need to maintain IG ratings trajectory • Larger programs (>5% of market cap) more likely to have significant share price impact Considerations • New financial policy of tying AR share repurchase to AM distributions received by AR • Clear identification of on going share repurchase funds • Modest impact on pro forma leverage • AM distributions growing from $170MM in 2018 to $282MM in 2020 • Brings forward potentially $250MM of proceeds AR is due to receive in 2019 and 2020 • Unlikely receive full value in AR share price today • No increase in leverage • Large pool of infrastructure capital seeking contracted midstream opportunities • Yield and cash flow growth profile should be highly attractive to investors • Offers ability for investor to acquire large block of units at one time • Largest source of potential proceeds ($2.7Bn market value of AM units) • Most commonly cited by investor as potential funding source • Potentially not receiving full value for AM units today in AR share price • Minimal impact to pro forma net leverage Benefits • AR net leverage projected at 2.1x at year end 2018, allowing for capacity if target hard 2.5x leverage cap • Material decrease in net leverage in 2019 down to 1.5x by year end • Hedge book, AM units and no near term maturities supportive of balance sheet strength AR Sale of AM Secondary AR Use of AM Distributions AR Water Earn-Out Monetization Private Secondary to Infra / Pension AR Debt Issuance (Leverage Capacity)
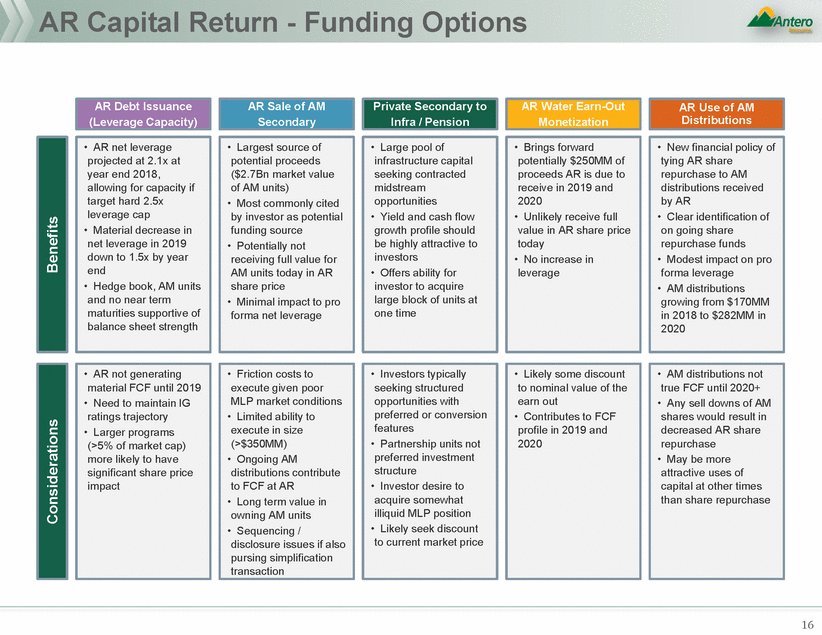
AR Capital Return - Funding Options Cont’d 17 • Commits capital, future reductions difficult • Unusual for upstream companies under $10Bn • “Token” dividend unlikely to alter trading multiple • AR loss of upside from AM units • Sale of AM units to repurchase AR shares dilutive • Reduces future flexibility at AMGP • Increases total leverage • Another form of debt, on balance sheet • Higher cost of capital than RBL • Mixed market reaction to past hedge book monetization • Most confirm consistency with strategy and communicate with market • Reduces drilling inventory and optionality • Bearish gas markets won’t support premium value • Limited buyer universe for Utica assets Considerations • Adds additional complexity • Likely higher cost of capital • Potentially viewed as debt by rating agencies • Demonstrates commitment to returning capital to shareholders • Immediate, consistent shareholder return • AMGP uses proceeds from public bond issuance to buy AM units from AR as a means to structurally simplify AR from midstream • Increases near-term yield of AMGP • Near-term cash proceeds • AR collateralizes AM units in a margin loan to fund ASR program to demonstrate their commitment to return capital • Debt is recourse only to AM units • Monetize hedge book (currently 100% hedged for ’18-’19) as a near-term source of cash proceeds • Previously pursued, well understood by the market • AR sells non-core acreage – likely in Utica Shale – as a near-term source of cash proceeds • Likely would not materially impact publicly disclosed capital plan Benefits • Issuance of convertible/ preferred security to provide a source of funding • Provides ability to kick-start share repurchase without increasing debt or selling AM units AR Asset Sale AR Common Dividend AMGP Bond Issuance AR Margin Loan on AM Units Hedge Book Monetization Issue Alternative AR Security
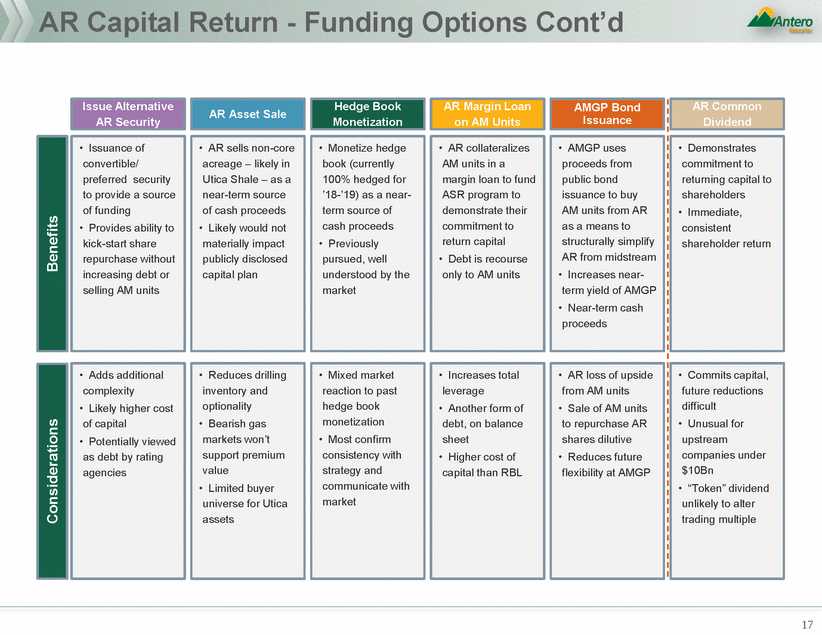
Antero Alternatives Evaluation Material Return of Capital Delever Balance Sheet and Partially Fund Repurchase Eliminate IDR Structure / Conflict of Interest More Independent AR Board Attractive 1 Somewhat Attractive 1Not Attractive 18 Improved AR Valuation •Add More Independents as PEs Roll Off •1 AMGP Shares Swapped For AR’s AM Units •1 AMGP Buys AM Units •1 AM Buys IDRs •1 AM Buys AMGP •1 3-Way Merger – “Integrated Gas Company” •1 AMGP Buys AR •1 AR Buys AMGP / AM •1 Sell Non-Core Acreage •1 Sell AM Units to Infrastructure Fund •1 Sell AM Units to Public •1 Monetize Hedges $500MM+ share buyback capping leverage at 2.5x Bring forward contingent water business payment Propose AMGP acquire AM for stock / cash New Independent Director Rick Connor becomes fully independent post-merger of AMGP / AM (4 of 9 fully independent) Potential Recommendation Other Ideas AR Shareholder Input
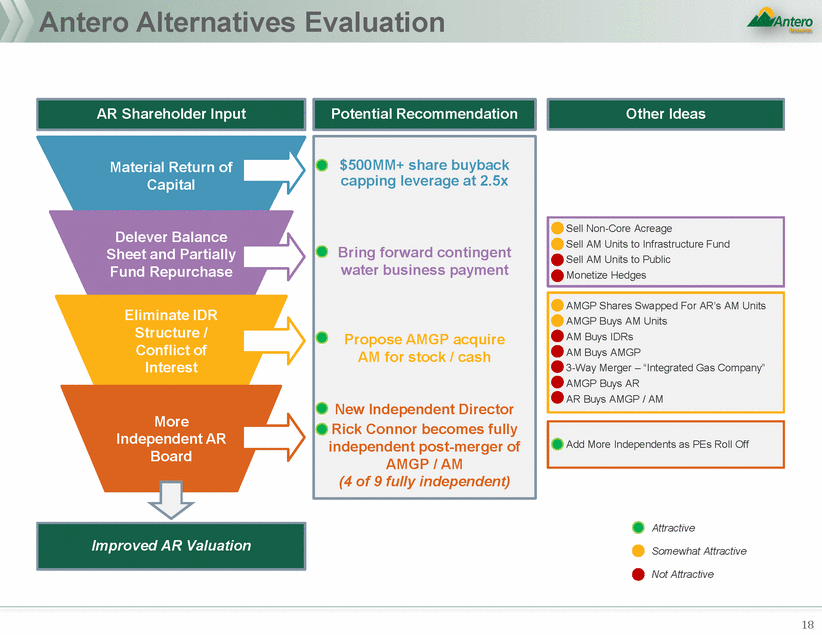
AMGP / AM Transaction AM Share Price ($ / Share) $27.70 Acquisition Premium 15.0% AM YE 2017E FDUO (MM) 186.6 AM YE 2017E Debt 1,200 AM Noncontrolling Interest 288 AM Cash (5) AM 2018E EBITDA 730 Implied 2018E EBITDA Multiple (x) 10.2x % Debt Funded 0.0% Assumed Net Debt 1,195 New Debt Issuance (Cash) - AMGP Price $20.52 AMGP Shares Issued to AM Public 136.2 AMGP Shares Issued to AR 153.5 Notes 1. Market Data as of February 16, 2018 2. Sponsors include Warburg and Yorktown 3. Assumes Series B units converted into AMGP shares at current market capitalization for standalone AMGP 19 AMGP Shares Issued to AM289.7 Summary Ownership ARAMAMGP PF AMGP AR-53%-31% Management9%-19% 7% Sponsors (2) 23%-36% 14% Series B (3) --3% 5% Public69%47%42% 43% Total100%100%100%100% AM Valuation Total Equity Value5,945 Substantially Improves Alignment Aggregate Value7,428 AM Valuation Equity Value5,945 AM Common Equity Offer Value5,945 Acquisition Share Price ($ / Share)$31.86 • AMGP purchases 100% of AM public units at a 1.552x exchange ratio (15% premium) – AMGP issues approximately 290MM shares to current AM unitholders – AR receives 154MM AMGP shares, representing its 53% ownership in standalone AM as of YE2017 – Assumes AM current total coverage profile held constant • All AM debt is assumed by AMGP • For tax purposes, projected new capex D&A and a step-up in basis associated with tax portion of transaction provide NOL carryforward through 2022 • Assumes Series B AMGP shares convert into 23MM common shares upon transaction, based on transaction-implied market capitalization • AR, AMGP and AM forecast based on company projections AM Equity Take-Out Purchase Price Transaction Assumptions (1)
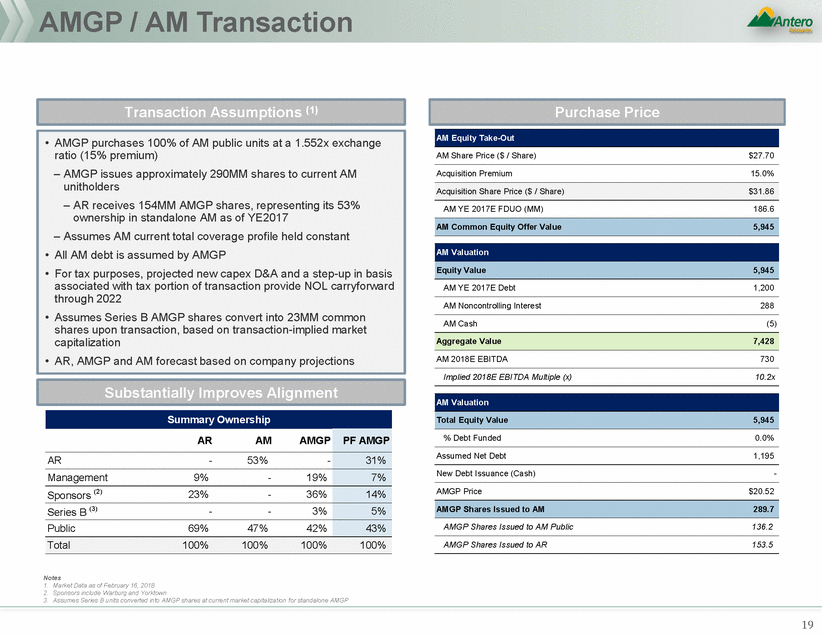
AM / AMGP Exchange Ratio AM / AMGP Exchange Ratio (x) 15% Premium to Current Implied Premium 1.90 1.75 1.60 emium: 1.547x .494x .451x 1.45 1.350x 1.30 May-2017 Jul-2017 Sep-2017 Nov-2017 Jan-2018 Feb-2018 Notes 1. Market Data as of February 16, 2018 20 Better for AMGP Better for AM 2/16/20181.350x1.552x15% 30-Day Avg.1.451x1.552x 90-Day Avg.1.494x1.552x 180-Day Avg.1.547x1.552x 7% 4% 0% 15% Pr 1.552x 180-Day: 90-Day: 1 30 Day: 1 Current: Exchange Ratio – Since AMGP IPO (1)
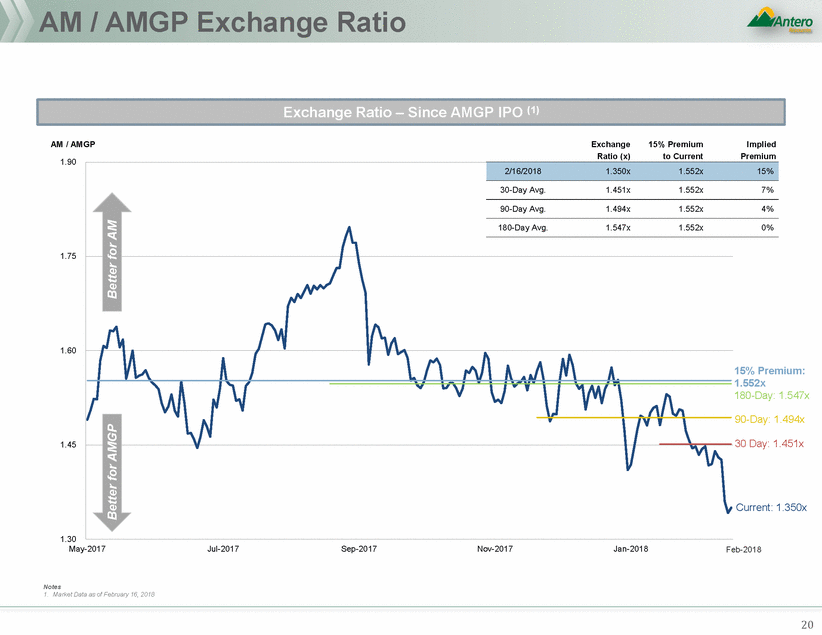
Pro Forma Impact to AM $ / unit $6.00 $ / unit $6.00 $4.10 $4.00 $4.00 $2.03 $2.00 $2.00 $0.00 $0.00 2018E 2019E 2020E 2021E 2022E 2018E 2019E 2020E 2021E 2022E x 1.50x CAGR % 60% 1.11x 1.11x 1.05x 1.05x 1.00x 40% 30.7% 0.50x 20% 0.00x 0% 2018E 2019E 2020E 2021E 2022E 2019E 2020E 2021E 2022E Notes 1. Assumes 186.6MM units standalone, 499MM shares pro forma 2. Calculated as DCF / total distribution 21 StandalonePro Forma 39.7%38.2% 28.9% 28.9% 33.5% 25.9% 24.3% 1.28x 1.28x1.32x 1.32x 1.17x 1.17x DPU CAGR vs. 2018 Total Coverage (2) $4.25 $3.42 $3.46 $2.85 $2.78 $2.21 $1.72 $1.45 $4.29 $4.47 $3.75 $3.84 $3.24 $3.24 $2.76 $2.67 $2.06 $1.86 $0.33 / unit less distribution over next 5 years Accretion / (Dilution) (15.2%) (8.2%) (2.6%) 1.1% 3.6% Accretion / (Dilution) (9.8%) (3.2%) (0.2%) 2.5% 4.2% AMGP Buys AM Distribution / Unit (1) Distributable Cash Flow / Unit (1) Based on pro forma shares held by former AM unitholder AM unitholder also has 15% more principal value on $31.86 versus $27.70 today ($4.16 premium)
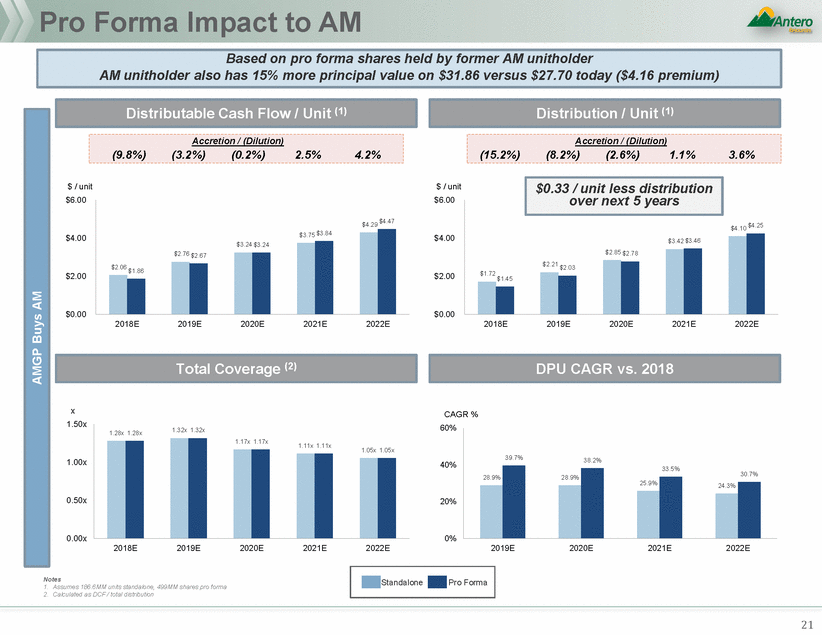
Pro Forma Impact to AMGP $ / unit $4.50 $ / unit $4.50 $3.00 $3.00 $2.22 $1.74 $1.50 $1.50 $0.89 $0.00 $0.00 2018E 2019E 2020E 2021E 2022E 2018E 2019E 2020E 2021E 2022E Implied Yield SA PF 2.6% 4.6% 4.3% 6.4% 6.5% 8.7% 8.5% 10.9% 10.8% 13.3% x 3.00x CAGR % 75% 2.00x 50% 42.6% 1.17x 1.11x 1.05x 1.00x 25% 0.00x 0% 2018E 2019E 2020E 2021E 2022E 2019E 2020E 2021E 2022E 22 StandalonePro Forma 1.28x1.32x 1.00x 1.00x 1.00x1.00x1.00x 65.2% 57.9% 39.7% 48.0% 38.2% 33.5% 30.7% DPS CAGR vs. 2018 Total Coverage $2.74 $2.23$2.22 $1.79$1.74 $1.31$1.34 $0.94$0.89 $0.54 $2.88 $2.48 $2.09 $1.72 $1.20 $1.34 $0.54 Accretion / (Dilution) 123.2% 93.8% 55.8% 42.2% 29.7% Accretion / (Dilution) 74.4% 47.4% 33.6% 27.9% 23.2% AMGP Buys AM Distribution / Unit Distributable Cash Flow / Unit
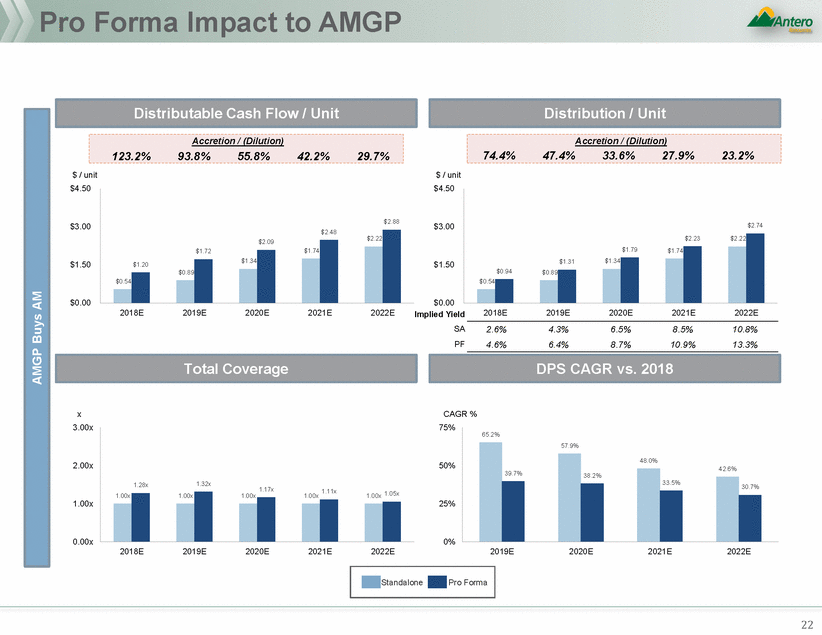
Support For AMGP Trading Level 23 Key Trading Level Considerations 11.EQGP trades at a ~4.6% 2018 yield with a ~20% 2-year forward growth rate. Pro forma, AMGP will have a ~38% growth rate and would need a ~4.6% yield to hold its current price 22.5 year dividend discount model with 10% cost of equity implies an ~12.1% terminal yield to support current price; 8.0% terminal yield implies share price of $23.03 33.Maintaining 3-year IRR would suggest a pro forma share price of $24.40 44.Correlation of yield vs. growth would suggest a pro forma share price greater than ~$33 55.Pro forma 2019E EBITDA multiple of 12.0x in-line with key peers
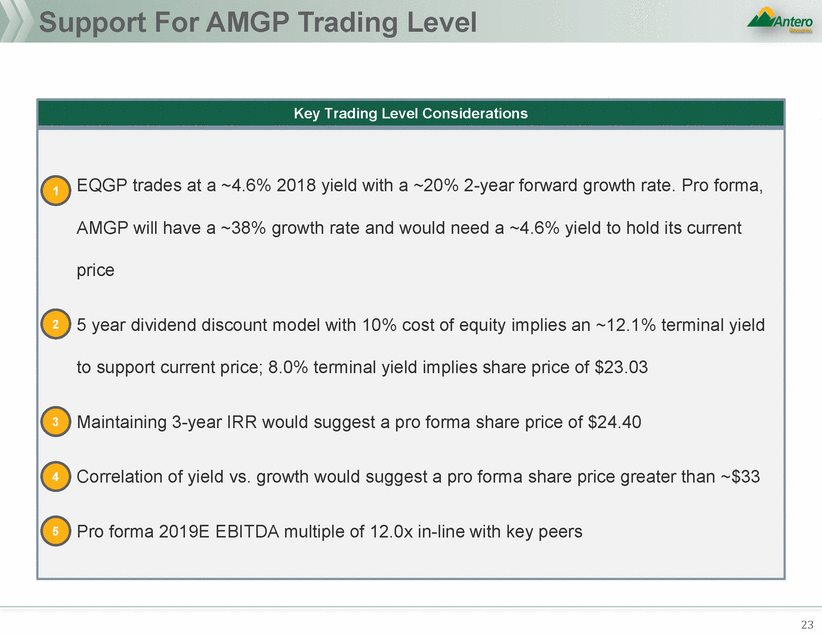
Market Reaction 6.0 EQGP Notes 1. Market Data as of February 16, 2018 2. Peer and standalone Antero represents 2-year 2018-2020 DPS/DPU CAGR 3. Peer and standalone Antero represents current yield; PF AMGP represents estimated current yield at 12/31/2018 24 12.0 10.0 DCP 8.0 ETE HESM ENLCWGPRMP 4.0 2.0 0.0 0.010.020.030.040.050.060.070.0 C-CorpNon C-CorpAntero ENBL TRGPWES TEGPMPLXCNXM EPDWPZEQM OKE WMB NBLX AMGP SA Current Price: $20.52 Current Price: $27.70 AM SA Implied PF AMGP Price: $33.35 (3) AMGP PF As of 12/31/18 Current Yield (3) AMGP Yield Sensitivity (YE2018) Assumed Implied Yield Price 4.8% $19.48 Breakeven Yield 4.6% $20.52 3.8% $24.59 3.3% $28.31 Implied Yield 2.8% $33.35 2.3% $40.57 1.8% $51.80 R-Squared: 0.843 2-Year DPS/DPU CAGR (2018E – 2020E) (2) AMGP Yield vs. 2-Year DPS/DPU CAGR (G&P Peers) (1)
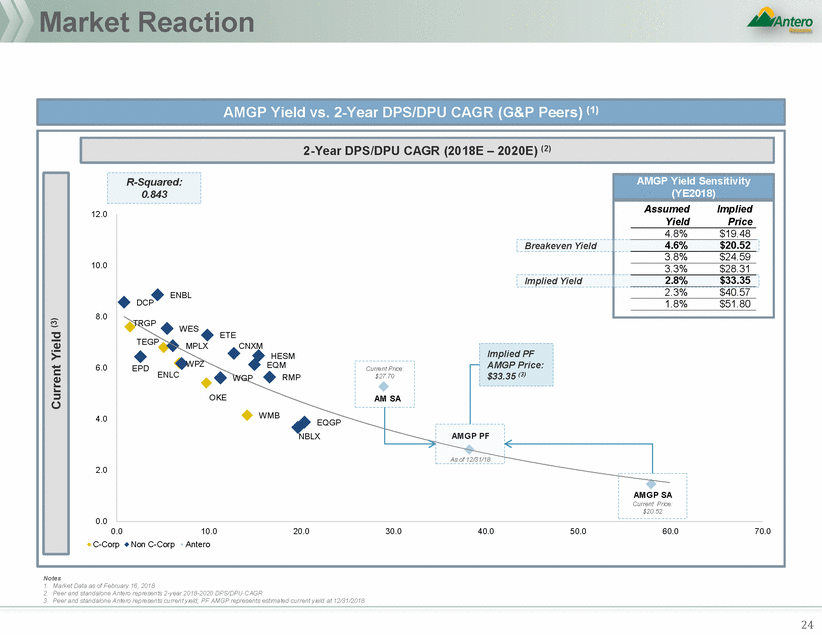
AppendixA: AMGPBuysAM F E B R U A RY 2 1 , 2 0 1 8
AR Trading Observations 26 AR Pushback – Research View • Capital efficiencies still a “show me” story • E&P “clean” free cash flow not until 2020 and beyond • Outspend required to meet FT requirements • Management / sponsor “misalignment” given GP / IDRs are held outside of AR AR Recognized Strengths • Long-term growth of 20% • Deepest inventory among Appalachian peers • Superior margins driven by liquids-rich production • Best hedge book among peers • Capital efficiencies driving toward positive free cash flow • AR represents good value; upstream trades at a discount to peer group – Average one year price target of $24.86, ~31% higher than current trading level
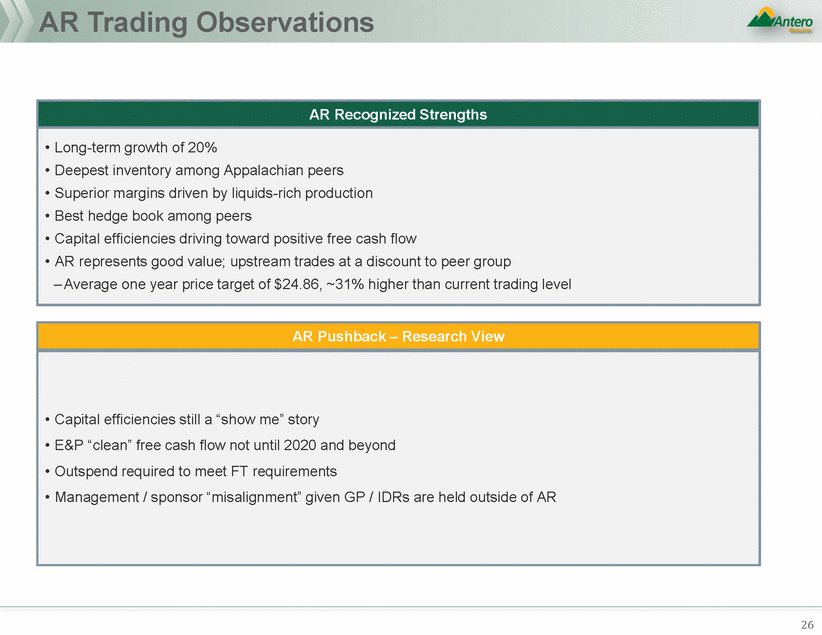
AMGP Acquisition of AM - Summary 27 Considerations • Taxable to AM unitholders • Taxable to AR, though fully shielded by NOLs • AM distribution dilution in 2018 - 2020 Benefits • Dramatically improves “mis-alignment” issue; positive for AR • Value proposition is compelling to both AM and AMGP – AM receives up-front premium and accretion to distributions beginning in year 4 – This profile compares favorably to precedent simplifications – Tax shelter provided by step-up enhances DCF – AMGP gets 100%+ up-front accretion and still enjoys 25% higher distributions 5 years out – Our analysis indicates AMGP will hold value and even improve – DDM and yield-vs.-growth correlation indicate upside from current share price • Structure provides larger float, liquidity and access to institutional capital – IDR elimination improves long-term cost of capital – Reduces overhang risk at AM level (which currently exists through AR’s 53% LP ownership of AM) • Research analysts have done some pre-conditioning by referring to the AMGP acquisition of AM as most logical combination structure – Also notable that GP take of cash flow is highest for AM vs. peers beginning in 2021 Overview • A combination of AMGP and AM via acquisition represents an attractive transaction from each of the AM, AMGP and AR perspectives
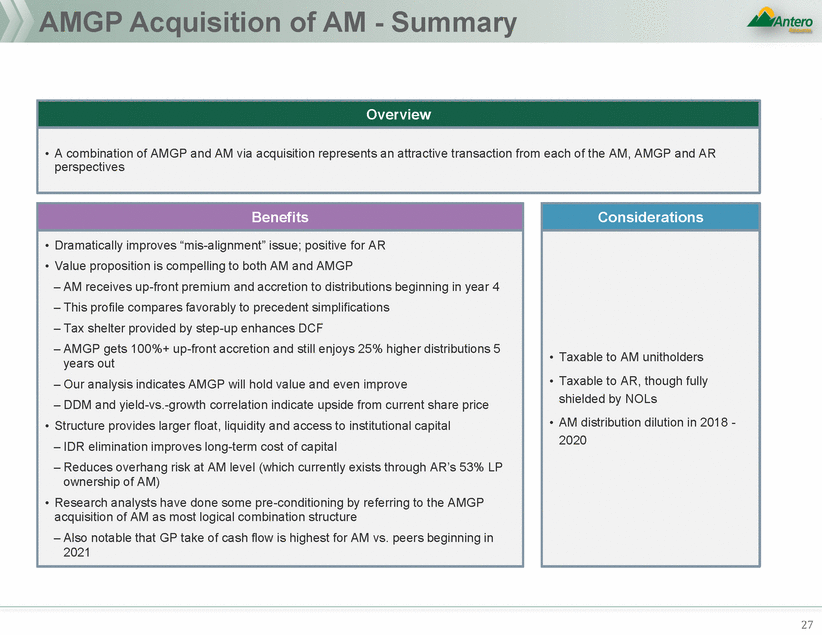
(1) GP Take of LP Cash Flow Benchmarking % GP Take % GP Take 50% 50% 40% 40% 36.3% 35.8% 35.1% 30.8% 30% 30% 20% 20% DCP AM VLP SHLX EQM WES PSXP TEP DCP SHLX VLP AM WES EQM TEP PSXP % GP Take % GP Take 50% 50% 38.7% 38.5% 40% 40% 30% 30% 20% 20% DCP SHLX VLP WES AM EQM TEP PSXP DCP SHLX VLP WES TEP EQM PSXP AM Notes 1. AM metrics per company projections 28 40.0%39.9%40.1%41.1% 36.9%37.5%37.9% 26.1% 41.9%41.9% 40.3%41.0% 38.0% 26.8% 2021E GP Take 2020E GP Take 38.4%39.3% 35.9%36.2% 32.3%32.4% 25.6% 39.9%40.1% 38.1% 37.2% 25.6% 2019E GP Take 2018E GP Take
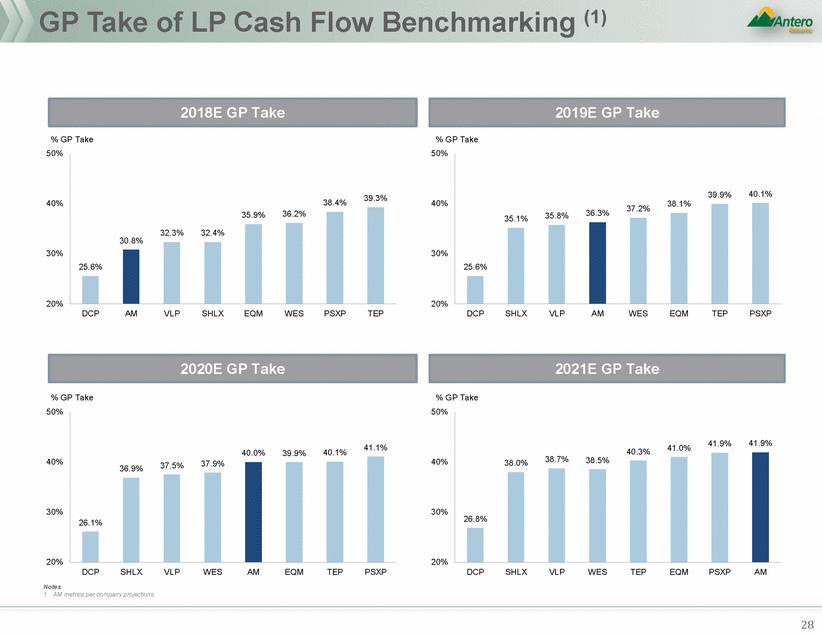
Impact To AM vs. Precedents % MLP Distribution Cut Year 1-Day Prem. (%) % Cash OKS AM KMP AM RRMP AM KMP KMP EPB EPB EPB RRMP NGLS NGLS NGLS NGLS RRMP RRMP OKS OKS 25% 0% 10%20% 30%40% 0 2 4 6 0% 10% 20% 30% 0% 5% 10% 15% 29 6% 15% 15% 17% 23% 31% KMP EPB 12% 12% AM 0% OKS 0% 0% 0% 12% 15% 15% 16% 18% 4 4 5 5 5 5 MLP Distribution Cut Breakeven Year Up-Front Premium Cash Considerations
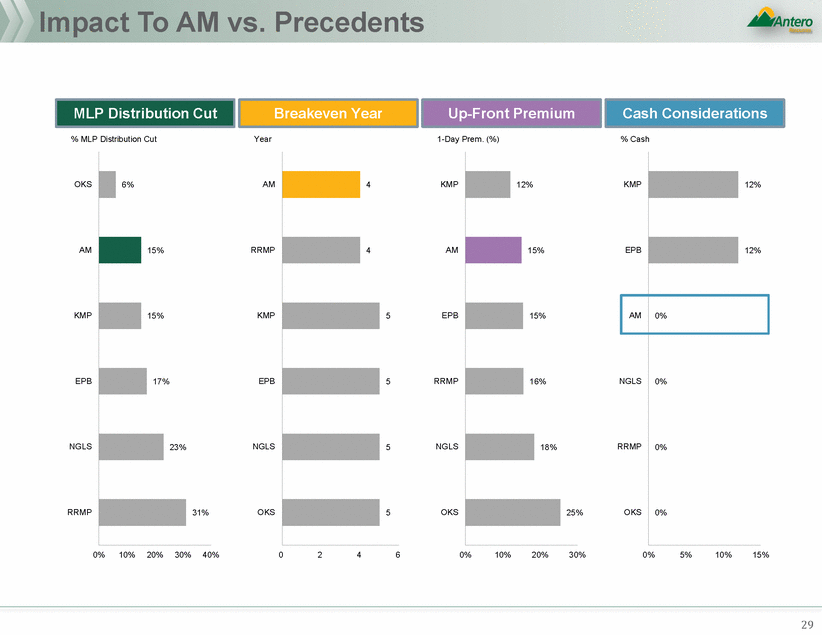
How Will Pro Forma AMGP Be Valued? 2018E Yield (%) Growth CAGR (%) Exit Growth (%) Predicted Exit Yield (%) 3 Year IRR Equity Value Price ($) Distributions per Share ($ / Share) Antero 2018E 2019E 2020E 2018 - 2020 2020 - 2022 WGP EQGP TEGP ENLC 9,741 6,710 3,401 3,025 $39.13 $25.21 $21.63 $16.75 6.0% 4.6% 8.2% 6.4% $2.36 $1.16 $1.77 $1.07 $2.61 $1.47 $1.92 $1.13 $2.92 $1.68 $1.96 $1.22 11.2% 20.3% 5.1% 6.8% 12.3% 9.7% 1.9% 15.9% 5.8% 6.2% 7.8% 5.2% 15.3% 7.9% 14.1% 18.2% WES EQM NBLX CNXM HESM 8,210 5,395 1,914 1,215 1,085 $48.82 $66.95 $53.27 $19.10 $19.88 7.8% 6.6% 4.1% 7.2% 7.1% $3.83 $4.43 $2.18 $1.37 $1.42 $4.07 $5.09 $2.61 $1.58 $1.64 $4.26 $5.85 $3.12 $1.74 $1.89 5.5% 14.9% 19.6% 12.7% 15.4% 4.7% 7.3% 19.8% 7.7% 12.0% 7.2% 6.7% 4.7% 6.6% 5.9% 15.1% 16.9% 12.5% 19.4% 25.4% 2018 2019 2020 2021 2022 Terminal Interest Expense Maintenance Capex Other (61) (67) (4) (88) (39) (4) (115) (63) (4) (131) (44) (4) (144) (58) (4) Assumed Terminal Yield (%) 6.00% 8.00% 10.00% Coverage 131 205 148 124 72 10.0% Period PV @ 10.0% Cost of Equity 1.00 424 2.00 539 3.00 670 4.00 759 5.00 847 5.00 6,994 12.5% 15.0% Notes 1. Market Data as of February 16, 2018 30 Discount Rate Terminal Value Implied Breakeven Yield 12.1% Undiscounted Terminal Value 11,264 Total PV @ 10.0% Cost of Equity 10,233 Current Share Price $20.52 Present Value AMGP Distributions 467 652 892 1,111 1,364 $34.81$27.73$23.48 $31.33$25.01$21.21 $28.28$22.61$19.21 Cash Flow Available 598 857 1,040 1,234 1,436 PF AMGP Distributions EBITDA 730 989 1,222 1,413 1,642 Share Price Sensitivity Dividend Discount Method (1) Peer Mean 12.4% 10.1% 6.2% 16.1% Peer Median 12.7% 9.7% 6.2% 15.3% MLP Peers 2018E 2019E 2020E 2018 - 2020 2020 - 2022 AMGP SA 3,820 AMGP PF 12,164 $20.52 $24.40 2.6% $0.54 $0.89 $1.34 57.9% 28.8% 3.7% 25.2% 3.8% $0.94 $1.31 $1.79 38.2% 23.7% 4.2% 25.2% GP Peers 2018E 2019E 2020E 2018 - 2020 2020 - 2022 IRR Method (1)
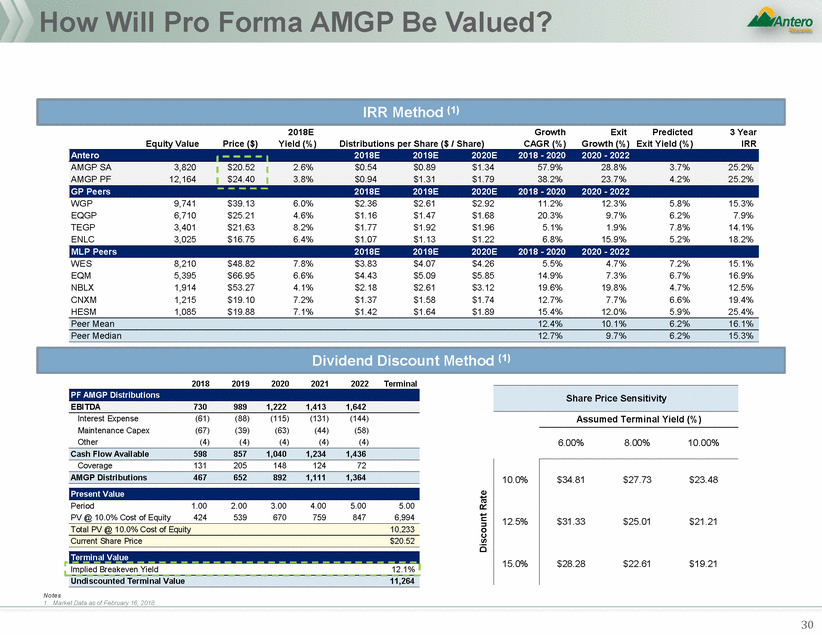
AMGP Valuation Considerations Consolidated (2) SA SA PF Commentary Equity Value 6,710 13,493 21,821 10,334 3,820 10,231 • PF AMGP becomes more in-line with C-Corp peers with minimal leverage Aggregate Value 6,708 14,799 31,423 17,131 3,818 11,857 2018E EBITDA 22.4x 12.7x 14.0x 13.3x 29.0x 16.2x • PF AMGP's high growth results in forward multiples that are in-line or lower than peers, assuming current AMGP standalone share price 2020E EBITDA 15.0x 9.0x 12.4x 9.8x 11.8x 9.7x 2018E DCF 22.4x 13.8x 13.8x 11.7x 46.7x 17.1x • PF AMGP's peer-leading DCF growth for suggests potential for upward share price rerating post-transaction 2019E DCF 18.2x 11.2x 12.4x 9.8x 28.5x 11.9x 2020E DCF 15.0x 10.0x 12.1x 8.4x 19.0x 9.8x 2018E Yield 4.6% 5.5% 7.6% 2.6% 4.6% • Significant coverage paired with high growth supports premium valuation relative to peers 2018E Cash Coverage Ratio 1.0x 1.3x 1.1x 1.0x 1.3x DPU Growth (18E-20E CAGR) 20.3% 9.7% 1.4% 57.9% 38.2% EBITDA Growth (18E-20E CAGR) 22.3% 6.3% 16.4% 57.0% 29.4% Notes 1. Market Data as of February 16, 2018 2. Assumes $730MM RMGP equity value, per Wall Street Research 31 Yield & Growth Metrics DCF Growth (18E - 20E) 22.3% 17.6% 6.7% 17.8% 56.7% 31.9% Equity Value / 2019E EBITDA 18.2x 10.1x 12.8x 11.2x 17.7x 12.0x Aggregate Value / Trading Summary Peer Trading Statistics (1)
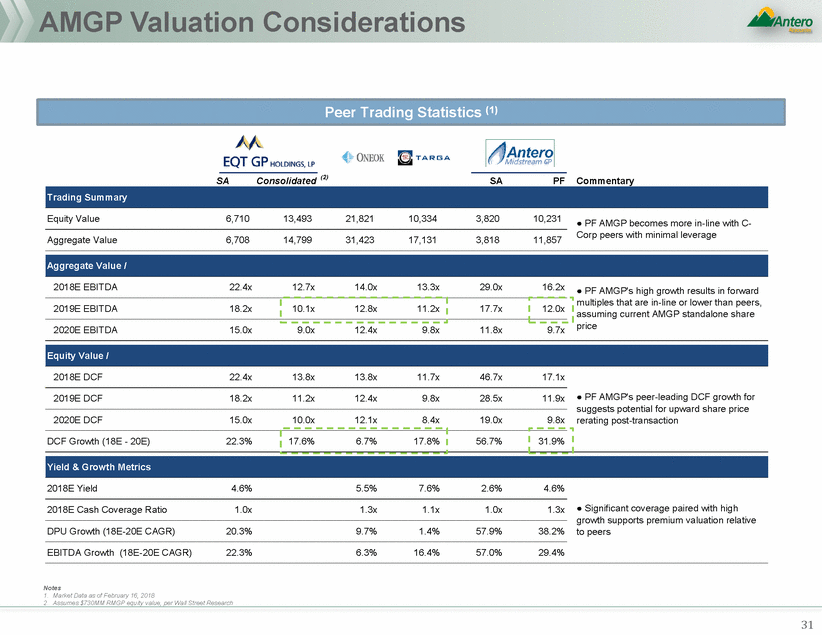
AppendixB: ARShareBuyback Analysis F E B R U A RY 2 1 , 2 0 1 8
AR Share Repurchase Considerations % Relative Price Performance vs. S&P E&P Index T+30 18.0 APA - COP - Dec 11 Oct 14 May 13 Mar 10 COP - MRO - MUR - Aug 14 Mar 14 3.0 May 14 - (4.0) (2.0) - 2.0 4.0 6.0 8.0 02/15/18 Encana Corporation $400 3.7% 4.5x (1.4%) - - - (1.1%) - - - 01/29/18 Gulfport Energy Corporation $100 4.5% 2.5x (8.9%) (24.3%) - - (6.3%) (15.8%) - - 09/20/17 Anadarko Petroleum Corporation $2,500 10.0% 11.6x 8.2% 9.5% 11.9% 7.7% 7.1% 4.2% 4.1% 2.6% 08/07/14 Linn Energy, LLC $250 2.4% 6.9x 0.5% (0.2%) 0.8% (20.1%) (1.6%) 0.1% 1.6% (5.6%) Source: Factset as of 02/16/18; 1 Market reaction defined as one day post-announcement; 2 Relative performance based on S&P 500 E&P index; 3 Based on PV-10 of earn-out proceeds discounted to mid-year 2018 33 % of Market Capitalization Mean $1,092 6.0% 6.7x 2.4% (1.7%) 6.6% (3.4%) 2.3% (1.3%) 3.8% 1.8% Median $375 4.7% 7.4x 3.0% (0.2%) 6.9% (0.6%) 3.2% 0.1% 3.0% (0.3%) 03/29/17 ConocoPhillips $3,000 4.9% 7.9x 8.8% 6.9% 3.6% (2.2%) 8.1% 6.0% 7.7% 13.3% 11/16/17 Hes s Corporation $500 3.6% 2.7x 1.0% (0.5%) 10.2% 1.0% 1.2% (1.1%) 1.9% (3.2%) 02/14/18 Laredo Petroleum $200 10.4% 8.5x 5.0% - - - 5.3% - - - Announcem ent Buyback % 90-Day date Com pany value ($m m ) s hares O/S ADTV Multple Market reaction Relative performance2 1 days 5 days 30 days 60 days 1 days 5 days 30 days 60 days 02/15/18 Noble Energy $750 5.8% 5.8x (0.3%) - - - (0.0%) - - - E&P Share Repurchase Precedents 15.0 12.0 OXY -9.0 MRO - Dec 13 6.0 Nov HES PXP DVN May 14 APC COP -APA - 16OXY - Feb 14 MUR - • While only three E&P firms had announced share repurchase programs from 2015-2017, four more firms have already done so in Q1 ‘18 • Market reaction1 has been mixed: 8.2% up for APC, 1.0% up for HES, and (8.9%) down for GPOR • Larger programs (5-10% of market capitalization) with well-defined funding sources and timelines have received strongest response • Analysis of 16 precedent Energy share buy-backs since 2010 indicates positive impact on share price – T+30 relative performance to E&P index averaged 4.5% outperformance when announced buy-back was 10% of market cap or higher • AR share buy-backs need to be sized to balance impact, credibility, and balance sheet – Average FCF over 5 years is $320mm / year – Two year, $600mm program – A $300mm debt issuance in 2018 and 2019 keeps debt / EBITDAX below 2.0x in 2019 and beyond – Two year, $600mm program assuming approximately $207mm3 of earn out proceeds and the balance with debt Precedent Performance Key Considerations
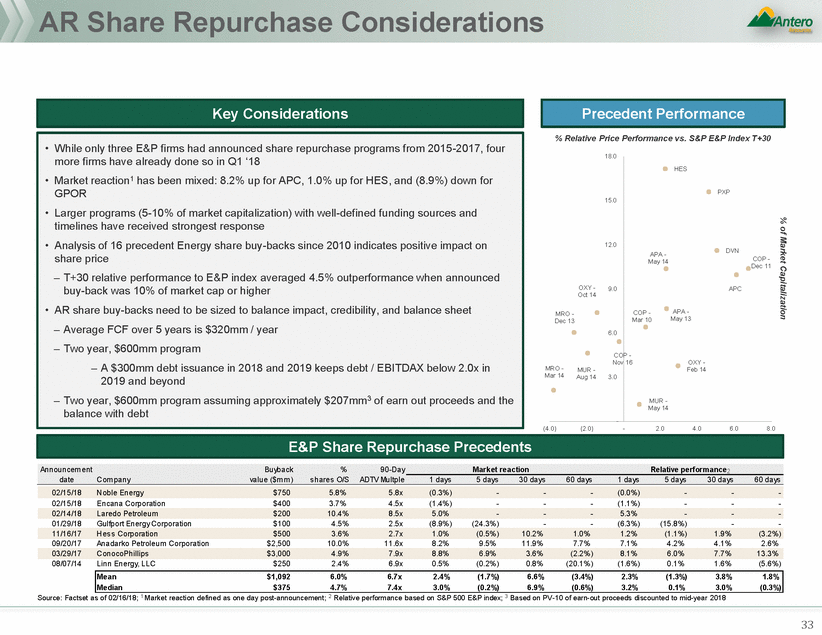
AR Share Repurchase Analysis Standalone Share repurchase $10.00 $8.00 $6.00 $4.00 $2.00 $0.00 $8.66 Buybacks Total uses 300 300 0 0 $7.05 $6.03 $6.37 $6.66 $5.93 $6.30 $300 $300 $0 $0 $5.09 $4.94 AR leverage capacity Water earn outs AR sale of AM units Total sources 300 0 0 300 0 0 0 0 0 0 0 0 2018E 2019E 2020E 2021E 2022E $300 $300 $0 $0 Acc / (dil) 3.2% 6.1% 5.7% 5.8% 6.2% Net free cash flow ($mm) AR Net Debt / LTM EBITDAX (including AM distributions) Standalone ($69) $464 $248 $222 $466 Standalone 2.1x 1.5x 1.4x 1.2x 0.8x Pro forma ($77) $440 $215 $189 $433 Pro forma 2.3x 1.9x 1.7x 1.5x 1.1x Difference ($8) ($25) ($33) ($33) ($33) Standalone Share repurchase $10.00 $8.00 $6.00 $4.00 $2.00 $0.00 $8.70 Buybacks Total uses 450 150 0 0 $7.10 $6.03 $6.41 $5.93 $6.32 $6.66 $450 $150 $0 $0 $5.19 AR leverage capacity Water earn outs1 AR sale of AM units Total sources 243 207 0 150 0 0 0 0 0 0 0 0 2018E 2019E 2020E 2021E 2022E $450 $150 $0 $0 Acc / (dil) 5.2% 6.5% 6.3% 6.5% 6.7% Net free cash flow ($mm) AR Net Debt / LTM EBITDAX (including AM distributions) Standalone ($69) $464 $248 $222 $466 Standalone 2.1x 1.5x 1.4x 1.2x 0.8x Pro forma $131 $321 $101 $201 $444 Pro forma 2.1x 1.7x 1.6x 1.4x 1.0x Difference $200 ($143) ($147) ($21) ($21) 1 Based on PV-10 of earn-out proceeds discounted to mid-year 2018 34 2018E2019E2020E2021E2022E 2018E2019E2020E2021E2022E Sources ($mm) 2018201920202021 $8.16 $4.94 $600mm repurchase: Water earn-out monetization1 + AR debt issuance Uses ($mm) 2018201920202021 2018E2019E2020E2021E2022E 2018E2019E2020E2021E2022E Sources ($mm) 2018201920202021 $8.16 $600mm repurchase: AR debt issuance in 2018 and 2019 Uses ($mm) 2018201920202021 Illustrative AR Share Repurchase Analysis (Discretionary Cash Flow / Share)
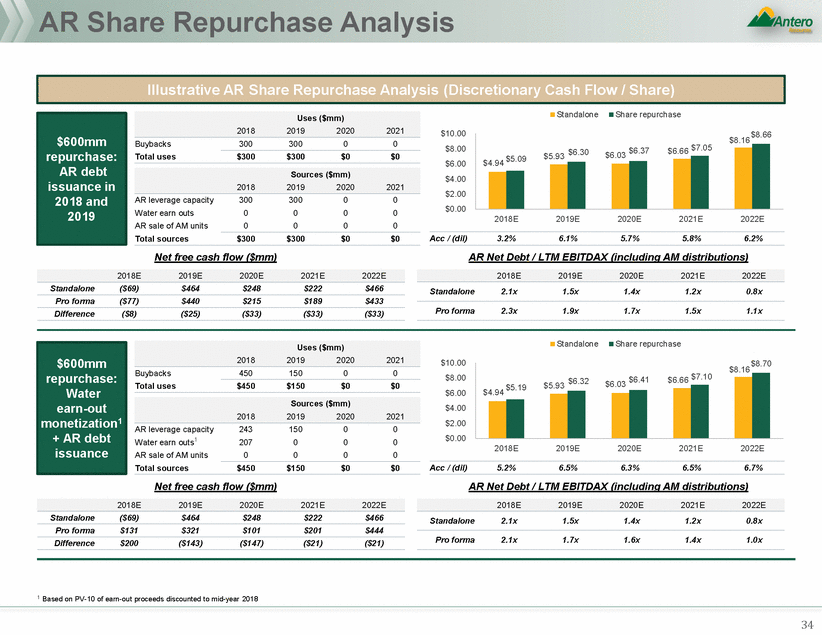
TABLE OF CONTENTS EXECUTIVE SUMMARY AMGP ACQUISITION OF AM AM ACQUISITION OF AMGP IDRS AR SHARE REPURCHASE WATER EARNOUT APPENDIX 2
ExecutiveSummary
Executive Summary 4 J.P. Morgan (“JPM”) is pleased to provide the materials herein to the Special Committee of the Board of Directors of Antero Resources Corporation (“AR, “Antero”) and its advisors regarding our review of Antero’s structural and financial alternatives Shareholders of Antero have made requests for management and the Board to consider and evaluate potential measures to remedy perceived issues associated with the following: Shareholder “misalignment”, primarily referring to the IDR value stream being held outside of the AR family Perceived valuation discount and relative underperformance of AR vs. certain Appalachia peers As a result, Antero management and its financial advisors conducted a detailed review of potential financial and structural alternatives across the Antero family of companies Based on its analysis of the potential structural alternatives, Antero management and its advisors believe that an acquisition of AM by AMGP could be attractive Financially viable to shareholders of AR, AMGP and AM Addresses AR shareholder concerns regarding mis-alignment of incentives; and Pro forma AM / AMGP would be highly-attractive midstream C-Corp with differentiated growth, coverage, leverage and yield profile A range of other potential structural alternatives have been considered, including an AM acquisition of AMGP’s IDRs In addition, AR management and its advisors have considered a range of financial alternatives and believe that repurchases of AR shares funded in part by an early monetization of the water earn-out payments could be attractive Sizable enough to be meaningful while preserving AR leverage below 2.0x for 2019 and beyond Ability to structure an early settlement that is a win-win for AR and AM Executive Summary
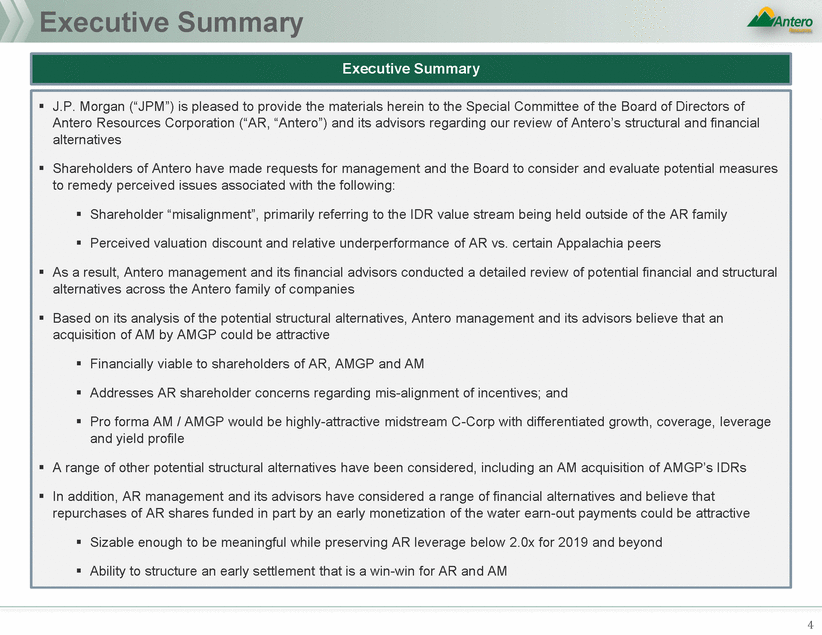
Antero Family Relative Trading Source: FactSet as of 3/16/18 Note: SailingStone filed 13D during market trading on 1/29/18, unaffected date of 1/26/18 used; TPH released its Antero simplification report before market open on 2/20/18, unaffected date of 2/16/18 used; Antero Board Meeting held on 2/21/18, unaffected date of 2/21/18 used; Antero released its press release announcing the formation of Special Committees before market open on 2/26/18, unaffected date of 2/23/18 used 5 ARAMAMGP 25% 8% 20%0% 15% 10% simplification report 5% 0% (5%) %) (10%) (15%)%) (20%) Jan-18Jan-18Jan-18Feb-18Feb-18Mar-18 Performance since SailingStone 13D (1/29/18)TPH simplification report (2/20/18)Antero Board Meeting (2/21/18)Special Committee Formation (2/26/18) AR2%8%11% AM(20%)(4%)0% %) 7% (9 (15 AMGP(24%)(18%)(13%)(12 1/29/18: SailingStone files 13D 2/26/18: Announced formation of Special Committees 2/21/18: First Board meeting 2/20/18: TPH issues Antero Price performance YTD
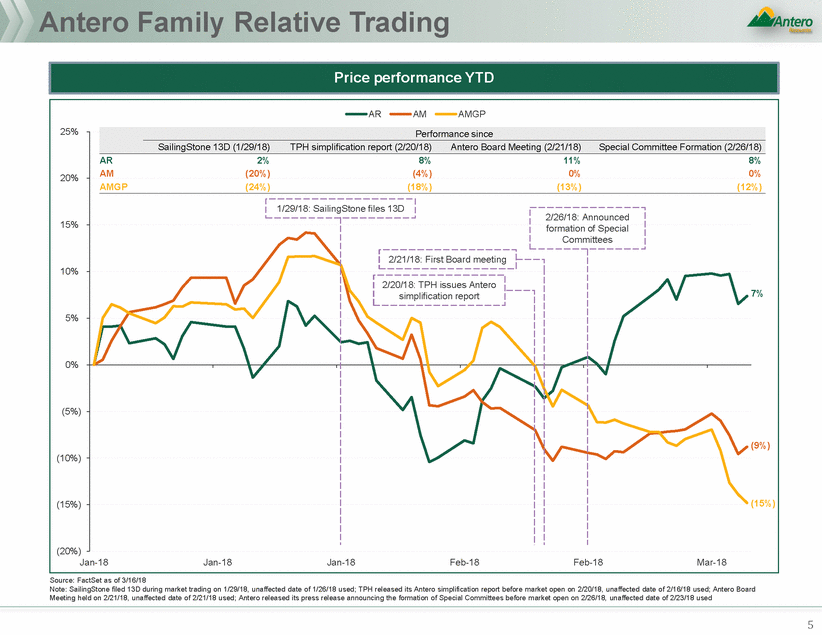
Antero Family Price Performance Benchmarking (10%) (13%) (8%) (11%) (15%) (20%) Source: FactSet as of 3/16/18 AR Peers: COG, EQT, GPOR, RRC, SWN; AM Peers: CNXM, EQM, HESM, NBLX, WES; AMGP Peers: ENLC, EQGP, TEGP, WGP Note: Peer returns weighted by market cap; SailingStone filed 13D during market trading on 1/29/18, unaffected date of 1/26/18 used; TPH released its Antero simplification report before market open on 2/20/18, unaffected date of 2/16/18 used; Antero Board Meeting held on 2/21/18, unaffected date of 2/21/18 used; Antero released its press release announcing the formation of Special Committees before market open on 2/26/18, unaffected date of 2/23/18 used 6 15% 10% 5% 0% (5%) (10%)(8%) (15%) Jan-18Jan-18Jan-18Feb-18Feb-18Mar-18 AMGPAMGP PeersAMZ Performance since 1/29/182/20/182/21/182/26/18 AMGP(24%)(18%)(13%)(12%) Peers(18%)(9%)(5%)(5%) AMZ (17%) (6%) (5%) (5%) AMGP Price performance YTD 15% 5% (5%)(5%) (9%) (15%)AMZ (17%) (6%) (5%) (5%) Jan-18Jan-18Jan-18Feb-18Feb-18Mar-18 AMAM PeersAMZ Performance since 1/29/182/20/182/21/182/26/18 AM(20%)(4%)0%0% Peers(14%)(5%)(2%)(1%) AM Price performance YTD 20% 10%7% 0% (6%) (20%) (30%) Jan-18Jan-18Jan-18Feb-18Feb-18Mar-18 ARAR PeersS&P E&P Index Performance since 1/29/182/20/182/21/182/26/18 AR2%8%11%8% Peers(11%)5%9% 3% S&P E&P (13%) (2%) 0% (4%) AR Price performance YTD SailingStone 13D (1/29/18)TPH simplification report (2/20/18)Antero Board Meeting (2/21/18)Special Committee Formation (2/26/18)
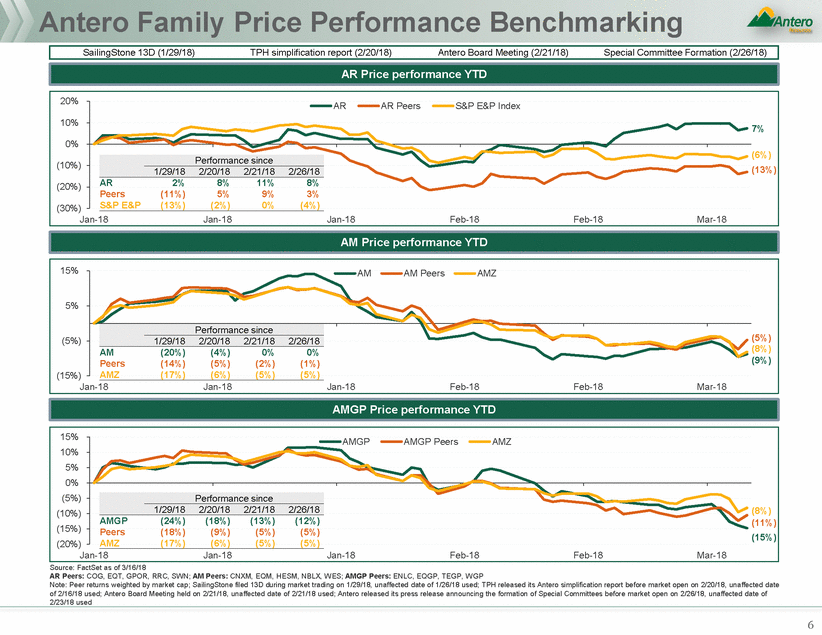
Antero Family Price Performance (cont’d) 13% (19%) 5% 0% Source: FactSet as of 3/16/18 Note: Peer returns weighted by market cap; AR Peers: COG: 9%, EQT: (22%), GPOR: (65%), RRC: (55%), SWN (44%); AM Peers: CNXM: 69%, EQM: (19%), HESM: NA, NBLX: NA, WES: (12%); AMGP Peers: ENLC: (13%), EQGP: (14%), TEGP: (30%), WGP: (20%) 7 10%AMGPAMGP PeersAMZ 0% (10%)(16%) (20%)(16%) (30%)(29%) (40%) May-17Jul-17Sep-17Nov-17Jan-18Mar-18 AMAGMPGPPriPcericpeerpfoermoarmncaencseinYcTeDIPO 60%AMAM PeersAMZ 40% 20%6% (6%) (20%) (40%) Mar-16Sep-16Mar-17Sep-17Mar-18 AMATMwPorYiceeapr ePrrfiocrempaenrcfoerYmTaDnce 40%ARAR PeersS&P E&P Index 20% 0% (20%)(17%) (40%) Mar-16Sep-16Mar-17Sep-17Mar-18 ARATRwPorYiceeapr ePrrfiocrempaenrcfoerYmTaDnce
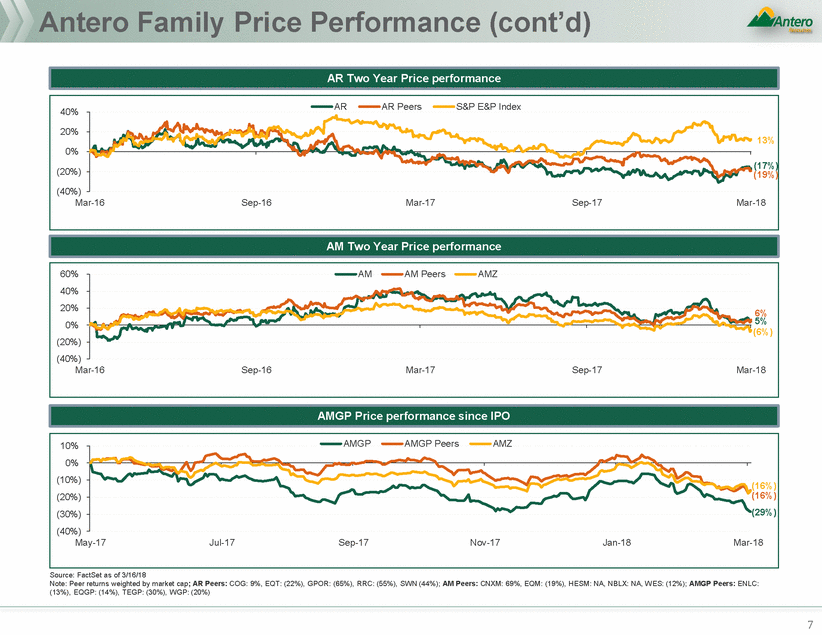
AR Peer Benchmarking MLP Distributions Paid to the Public) MLP Distributions Paid to the Public) Source: FactSet as of 03/16/18, company filings Note: Firm value reflects market value of non-controlling interest for public MLPs, where applicable. Permian peers include CXO, FANG, PE, RSPP, EGN, CDEV, JAG, LPI and CPE; Consolidated EQT not pro forma for potential spin of EQT Midstream 1 Adjusted to remove MLP value based on public MLP ownership; pro forma for dropdown of RMH midstream assets, merger of EQM and RMP, and EQGP acquisition of RMP IDRs; 2 Adjusted to remove Antero Midstream value with no assumed tax drag as result of NOL usage; 3 Adjusted to remove midstream services contribution, based on 7.0x FV / 2019E EBITDA and 20% EBITDA margin on broker median projections for midstream services revenue; 4 FANG firm value adjusted to remove public MLP ownership in VNOM, assumes tax drag of 20%; 5 Equity value to consolidated cash flow less MLP distributions paid to public unitholders 8 Equity Value / 2019E Cash Flow5 (Excl. 123 Permian Peers 7.3x 5.3x 4.4x 3.6x 3.1x 2.3x 1.9x Consolidated FV / 2019E EBITDAX Permian Peers 6.9x 6.9x 5.6x 5.8x 5.4x 4.3x 3.8x Adjusted FV / 2019E EBITDAX (excl. MLPs and Midstream) 3.8x 123Permian 4 Peers 6.9x 5.6x 5.8x 4.8x 4.5x 4.0x 123 Permian Peers 9.5x 7.6x 5.1x 4.7x 3.7x 2.5x 2.1x Permian Peers 9.0x 8.2x 8.0x 6.8x 6.6x 4.5x 4.1x 213Permian 4 Peers 9.0x 8.2x 6.6x 5.8x 5.3x 4.3x 4.1x Equity Value / 2018E Cash Flow5 (Excl. Adjusted FV / 2018E EBITDAX (excl. MLPs and Midstream) Consolidated FV / 2018E EBITDAX
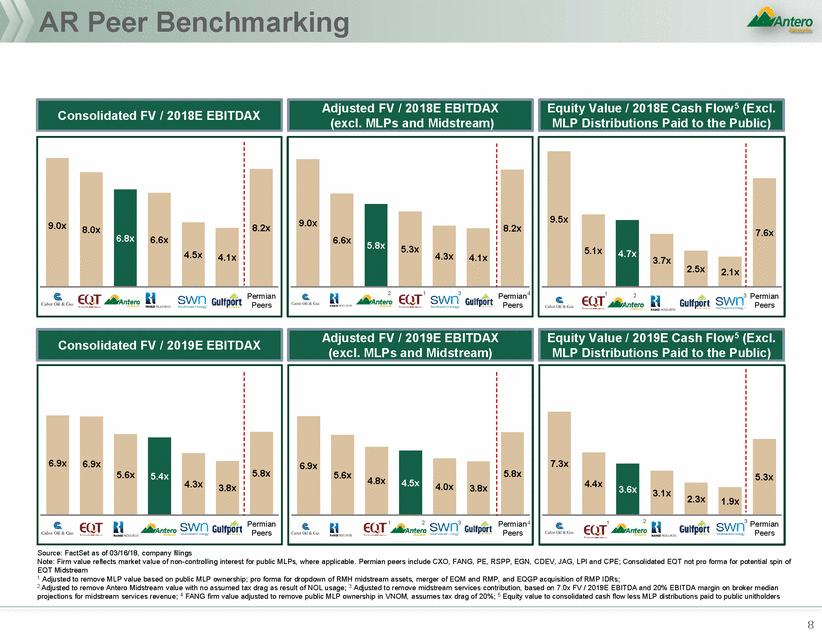
AR Peer Benchmarking Cont’d Source: FactSet as of 03/16/18, company filings, broker estimates Note: ; Consolidated EQT not pro forma for potential spin of EQT Midstream 1 Debt adjusted to remove debt at AM; Adjusted EBITDAX equal to AR E&P-only EBITDAX plus distributions received from AM; 2 Debt adjusted to remove debt at EQM, EQGP; Adjusted EBITDAX equal to EQT E&P-only EBITDAX plus distributions received from EQGP; 3 FANG debt adjusted to remove VNOM debt; Adjusted EBITDAX equal to FANG E&P-only EBITDAX plus distributions received from VNOM 9 3.1x 2.9x 2.3x 2.2x 2.0x 0.9x 0.9x Permian Peers 3.1x 2.9x 2.2x 2.1x 2.0x 0.9x 0.9x 21Permian 3 Peers Consolidated Debt / 2019E Consolidated EBITDAX Deconsolidated E&P Debt / 2019E Adj. EBITDAX 3.4x 3.2x 2.6x 2.5x 2.4x 1.2x 1.2x Permian Peers 3.4x 3.2x 2.6x 2.4x 2.4x 1.2x 1.2x 12Permian 3 Peers Deconsolidated E&P Debt / 2018E Adj. EBITDAX Consolidated Debt / 2018E Consolidated EBITDAX
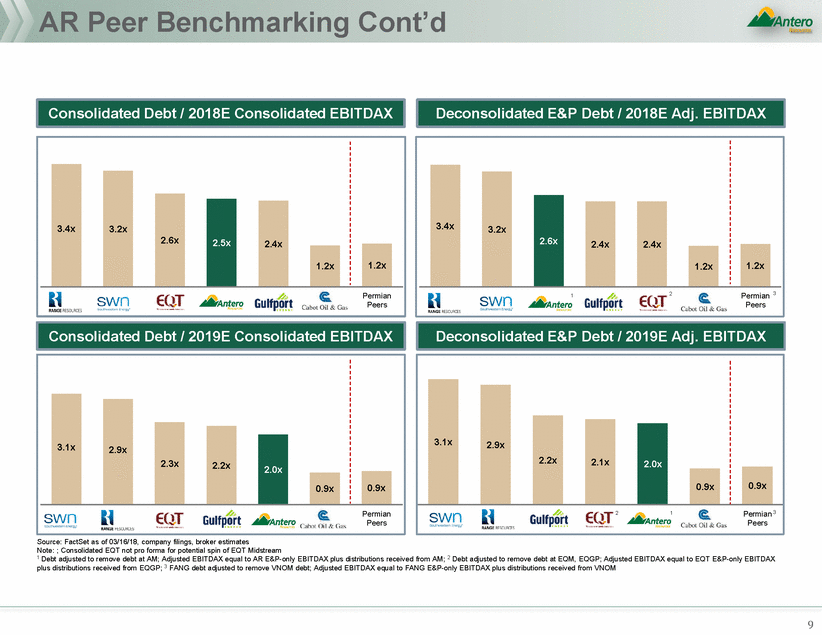
Wall Street Perspectives “Relatedly, on the midstream-side, investors have speculated about incentives created by varying ownership levels in AR, AM, and AMGP across both AR itself and insiders.” - Raymond James 2/15/18 “Issue centers on management and private equity ownership in AMGP with fears AR may grow more than is optimal at the expense of E&P shareholders to the benefit of midstream.” - TPH 2/20/18 “Management is clearly attuned to investor calls for greater clarity surrounding segment-level reporting and engagement with the investment community generally.” - Morgan Stanley 2/14/18 “relative valuation gap between AM and AMGP leaves a GP buy-in of the LP as the more probable outcome.” “We view a consolidation of the midstream complex as the most likely outcome of this review” - TPH 2/20/18 “Though two scenarios are explored, relative valuation gap between AM and AMGP leaves a GP buy-in of the LP as the more probable outcome. Recent sell-off at AM and taxable transaction likely necessitates a meaningful premium to the LP.” - TPH 2/20/18 “we see AM+AMGP potentially trading at 11.4x 2019e EBITDA, a level we believe could be quite attractive relative to an estimated 2019-2021 EBITDA CAGR of 22%.” - Morgan Stanley 2/14/18 “Given the easier path to accretion in the second scenario, our updated AM price target of $38/unit assumes a midpoint between an assumed takeout value of ~$36/unit (~30% premium to current).” “Recent sell-off at AM and taxable transaction likely necessitates a meaningful premium to the LP” “the combined midstream asset base could see a significant rerate with NAV of inventory blowdown >$12.5B vs. current combined equity value of ~$8.5B.” - TPH 2/20/18 10 Select broker commentary Recent Wall Street research analyst commentary has focused on the likelihood and attractiveness of an acquisition of AM by AMGP given relative valuation Summary Results
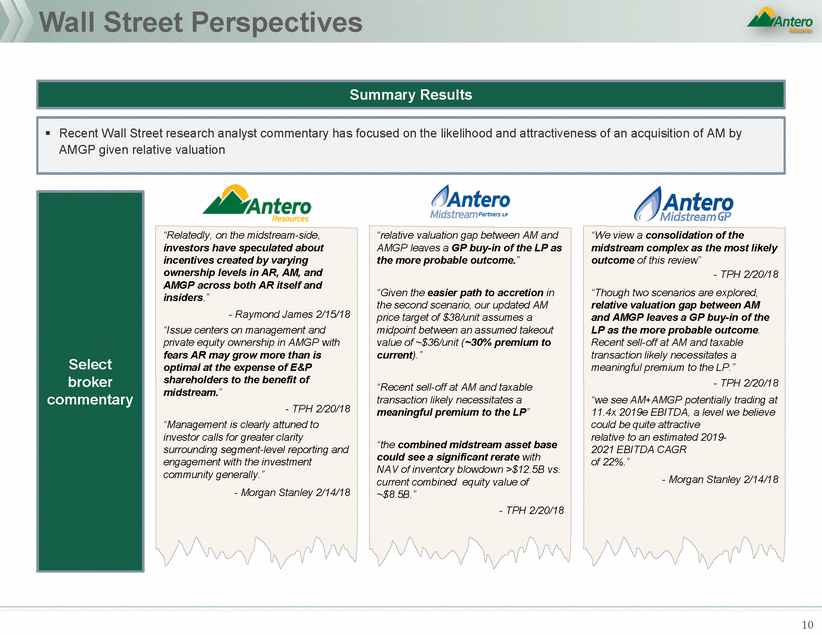
Potential Structural and Financial Alternatives Reviewed AR share repurchase, financed via: AMGP acquisition of 100% of AM 1 1 AR leverage capacity AR sale of AM via public secondary AR sale of AM via private secondary to Infra/Pension AR water earn out monetization AR use of AM distributions AR issuance of alternative AR security (e.g., mandatory TEU) AR asset sale AR hedge book monetization AR margin loan of AM shares AMGP bond issuance to buy AM units from AR a) b) c) AM purchase of IDRs 2 AMGP acquisition of AR’s ownership in AM 3 4 AM acquisition of AMGP d) e) f) AMGP acquisition of AR 5 6 AR acquisition of AMGP and/or AM AR spin/split-off of AM units 7 g) h) i) j) AR dividend a2) 11 Financial Alternatives Structural Alternatives
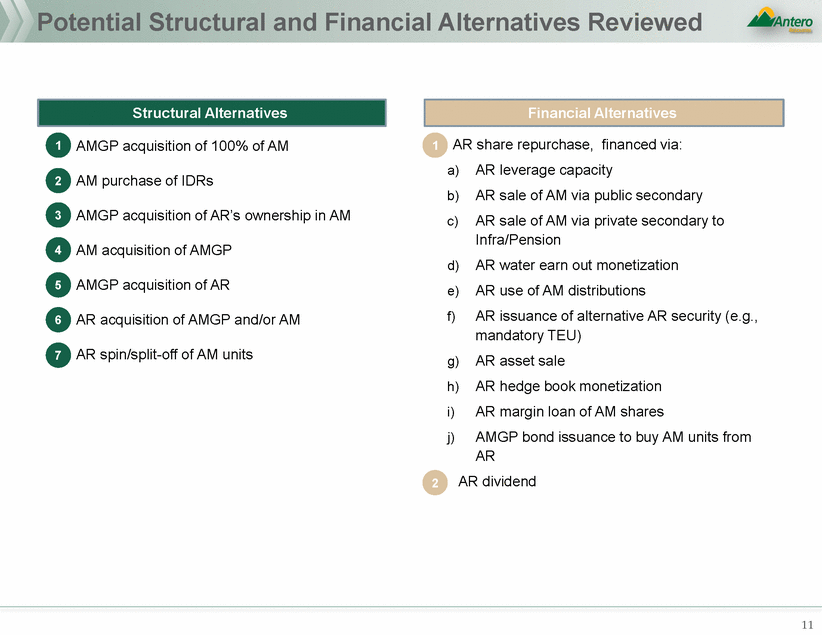
Tier I Potential Consolidation Scenarios removals of IDRs Creates “Up-C” structure for AM, and ability to raise midstream Significant near term accretion to AMGP given yield spread Dilutive to AM and AR for first few years but becomes accretive No tax impact to AR, AMGP or AM shareholders / unitholders AMGP 12 Near-term LP dilution to AM holders (including AR), particularly with respect to ‘18E-’20E DPU; may require coverage reduction, non-distribution bearing units or cash to mitigate dilution IDRs not materially impacting AM cost of capital at current time Still maintains complexity of three public currencies and doesn’t fully address perception of misalignment between AR and No tax step-up to AM (unless cash is used) Requires AMGP vote; need legal input regarding majority of minority voting Considerations Consistent with current market preference for simplifications / Lowers AM cost of capital due to elimination of IDRs capital at C-Corp and MLP levels difference between AMGP and AM longer term Benefits AMGP eliminates AM’s incentive distribution rights in exchange for newly issued AM common units and / or cash Overview AM Acquisition of AMGP IDRs Taxable to AM unitholders, though average unitholder has relatively high basis in AM units (~$24 / unit) Taxable to AR, though fully shielded by NOLs AM distribution dilution in ‘18E – ‘19E Potentially seen as reversal of AMGP IPO messaging Requires AM vote; need legal input regarding majority of minority voting Dramatically improves “mis-alignment” issue; positive for AR Compelling value proposition for both AM and AMGP AM receives up-front premium and accretion to distributions beginning in 2020 Tax shelter provided by step-up enhances AMGP DCF Analysis indicates AMGP will hold value and even improve C-Corp structure provides larger float, liquidity and access to institutional capital, reducing perceived overhang at AM today (i.e. from AR’s significant ownership of AM) Lowers AM cost of capital due to elimination of IDRs Research analysts have done pre-conditioning by referring to the AMGP acquisition of AM as most logical combination structure Potential for modest cash component with election structure to facilitate AR share repurchases AMGP acquires AM in all-equity transaction thereby eliminating the MLP AMGP Acquisition of AM
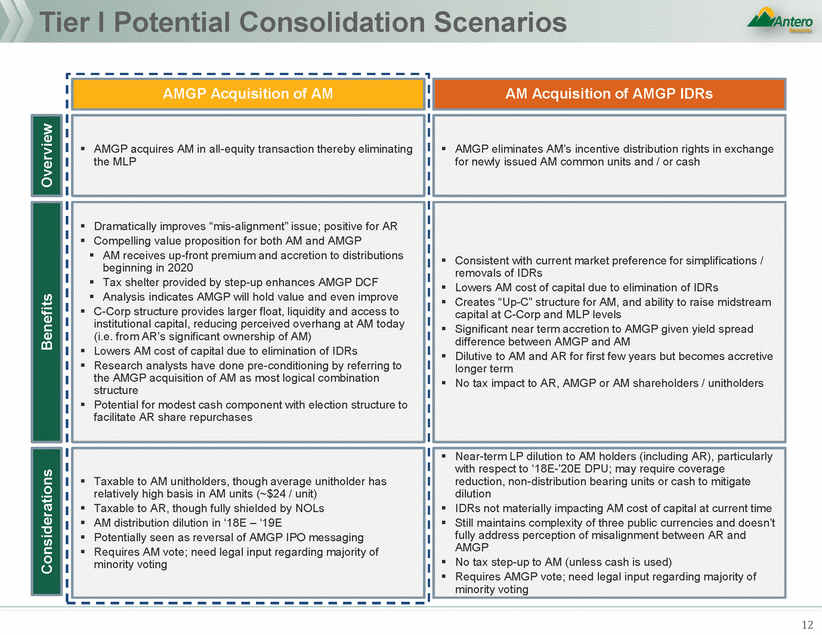
Tier II Potential Consolidation Scenarios AR no longer public shareholders given dramatically different assets objectives 1 Assumes 100% equity transaction with illustrative 0% premium on AM unit price as of 3/16/18 13 “Integrated Gas” business model MGP issues shares to buy AR Or AR issues shares (or AM units) to current AMGP Issue AM units AM consolidated simultaneously Fully eliminates mis-alignment concerns Uses AMGP’s comparably higher valuation Creates a more liquid currency for future M&A Existing AMGP shareholders are unlikely to be supportive Highly dilutive to AR Co-mingles shareholder bases with notably different AMGP issues shares to AR for its 53% stake in AM Preserves all 3 public entities Pro forma AR would own ~46%1 of AMGP; AMGP would own IDRs and 53% of AM AR owns largest stake in AMGP (~46%)1; improves alignment Basis step-up Source of funding for AR deleveraging or share repurchase Taxable to AR, though fully shielded via NOLs Does not eliminate IDRs for AM Reduces near-term cash flow to AR Leaves 3 public entities outstanding Overview Benefits Considerations Merge AR and AMGP AMGP Acquisition of AR’s Interest in AM
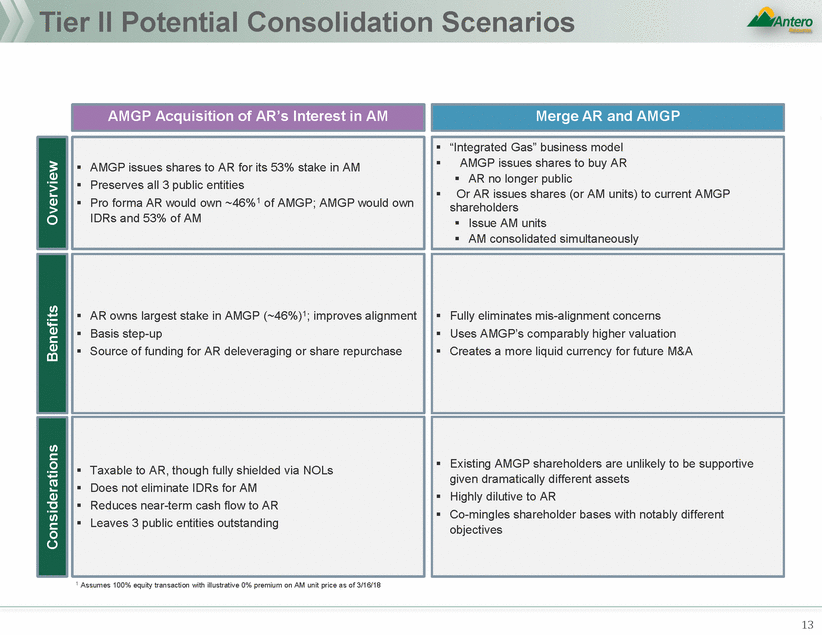
Tier II Potential Consolidation Scenarios Cont’d contributed to C-Corp) addressing SOTP discount issues Split may be challenging if units contributed to C-Corp basis simultaneously repurchased) currencies Premium is required to entice AR shareholders to exchange Utilize AR’s tax assets if units not contributed to C-Corp 14 Does not address market preference for IDR elimination (unless Still maintains complexity of three (and potentially four) public Potentially exacerbates market’s perceived misalignment between AR and AMGP Limits balance sheet / capital structure flexibility for AR by removing dividends received by AM May require access to public markets to fund drilling program their shares for AM shares IDRs not materially impacting AM cost of capital at current time Inconsistent with the structure employed by recent GP / MLP simplifications Does not address concerns regarding MLP liquidity and capital market access Tax inefficient to have MLP acquire C-Corp Only one precedent in market where MLP acquired C-Corp IDR holder and may not be well received Near term LP dilution to AM holders (including AR) Considerations Potentially tax efficient, depending on structure (if units Full clarity around AR and AM value in the public markets Preserves optionality to address IDRs / AM cost of capital when IDRs are more substantial and dilution is less pronounced Cashless retirement of AR shares in the case of split May be able to merge SpinCo with AMGP on a tax-efficient Benefits Consistent with current market preference for simplifications / removals of IDRs Improves alignment between AR and AMGP / owners Lowers AM cost of capital due to elimination of IDRs Maintains upstream and midstream vehicles to raise capital Simplification without near-term tax burden to AR and AM unitholders No tax impact to AR or AM shareholders / unitholders AR distributes AM units pro rata to its shareholders AR shareholders can enter into split-off transaction by exchanging AR shares for AM units AM acquires AMGP in exchange for AM units and / or cash Extinguishment of AM’s IDRs with AMGP becoming a wholly owned subsidiary of AM Overview AR Spin / Split-off of AM Units AM Acquisition of AMGP
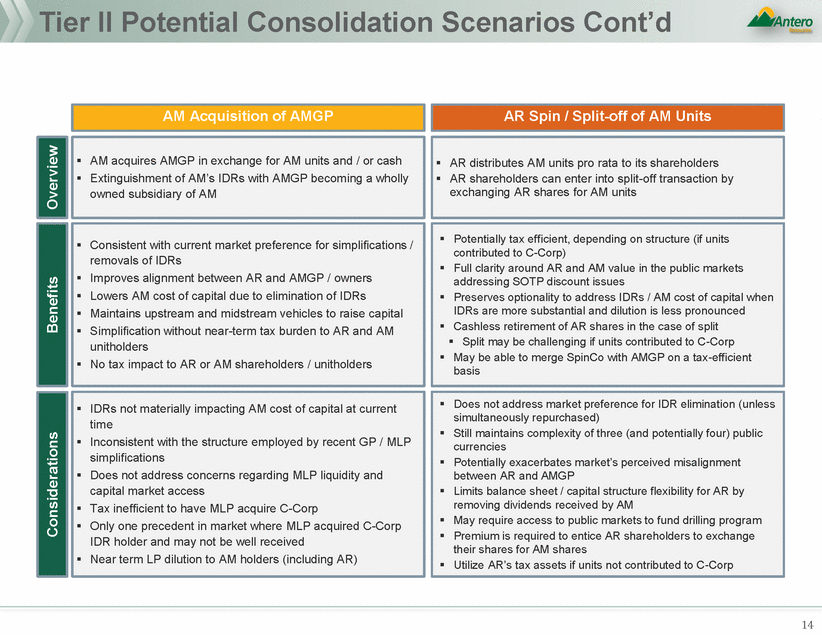
Antero Alternatives Evaluation Material Return of Capital Delever Balance Sheet and Partially Fund Repurchase Eliminate IDR Structure / Conflict of Interest More Independent AR Board Attractive 1 Somewhat Attractive 1Not Attractive 15 Improved AR Valuation •Add More Independents as PEs Roll Off •1 AMGP Shares Swapped For AR’s AM Units •1 AMGP Buys AM Units •1 AM Buys IDRs •1 AM Buys AMGP •1 3-Way Merger – “Integrated Gas Company” •1 AMGP Buys AR •1 AR Buys AMGP / AM •1 Sell Non-Core Acreage •1 Sell AM Units to Infrastructure Fund •1 Sell AM Units to Public •1 Monetize Hedges $500MM+ share buyback capping leverage at 2.5x Bring forward contingent water business payment Propose AMGP acquire AM for stock / cash Rick Connor becomes fully independent post-merger of AMGP / AM (4 of 9 fully independent) Potential Recommendation Other Ideas AR Shareholder Input
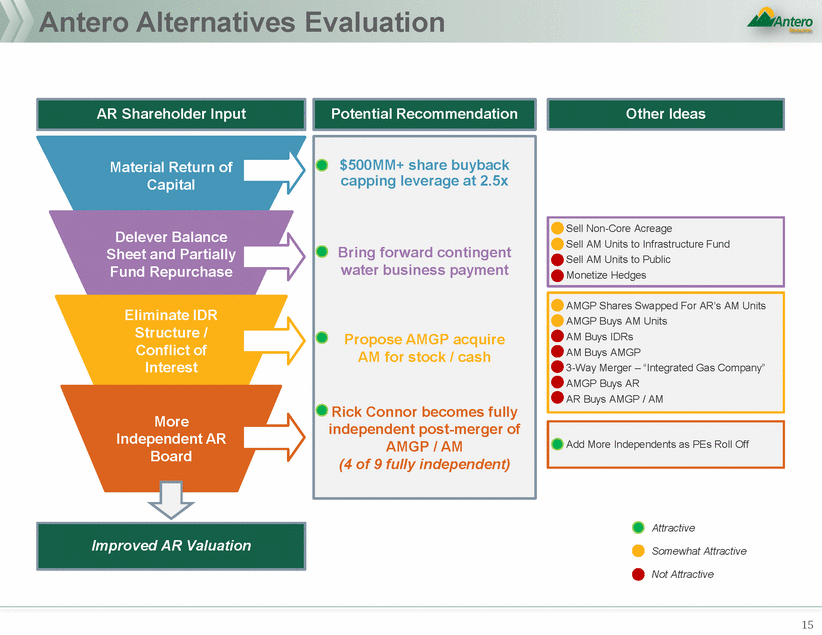
AMGPAcquisition ofAM
AMGP / AM Transaction AM unit price ($ / share) $26.49 Illustrative acquisition premium 15.0% Acquisition share price ($ / share) $30.46 AM diluted shares outstanding (mm) 187.7 AM Common Equity Purchase Price $5,717 Equity Value $5,717 Debt 1,205 Cash (8) Firm Value $6,914 2018E LP DCF 383 Implied 2018E Equity Value / LP DCF multiple 18.1x AM Equity Value $5,717 % debt funded Assumed net debt 1,197 New debt issuance (cash) 0 AMGP share price $16.80 AMGP shares issued to AM 340 AMGP share issued to AM public 161.0 AMGP shares issued to AR 179.3 Note: Market Data as of 3/16/18; standalone ownership per January 2018 investor presentation 1 Includes Warburg, Yorktown, management and Series B units; assumes Series B units converted into AMGP shares at PF market capitalization for PF AMGP 17 Transaction Ownership ARAMAMGP PF AMGP AR-53%-Management / sponsors127%-68% Public73%47%32% 33% 27% 40% Total100%100%100%100% 0.0% Substantially Improves Alignment Transaction Mechanics AM Valuation AM Equity Take-Out AMGP purchases 100% of AM public units at a 1.813x exchange ratio (illustrative 15% premium to current; 21% premium to unaffected date prior to the SailingStone 13D) AMGP issues approximately 340mm shares to current AM unitholders AR receives approximately 179mm AMGP shares, representing its 53% ownership in standalone AM as of YE2017 Assumes AM current total coverage profile held constant All AM debt is assumed by AMGP For tax purposes, projected new capex D&A and a step-up in basis associated with tax portion of transaction provide NOL carryforward through 2022 Assumes Series B AMGP shares convert into 24mm common shares upon transaction, based on transaction-implied market capitalization AR, AMGP and AM forecast based on company projections Purchase Price Transaction Assumptions
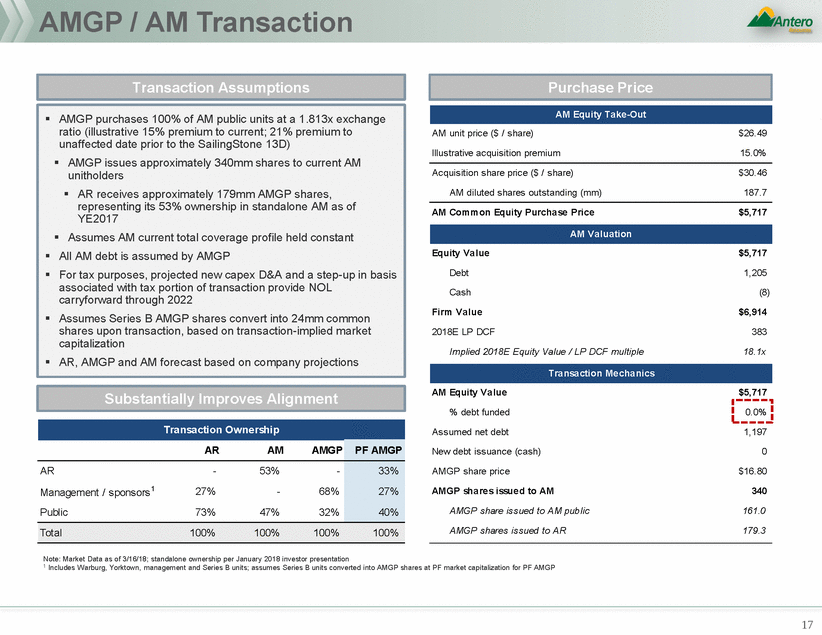
Antero Family Relative Trading Source: FactSet as of 3/16/18 Note: SailingStone filed 13D during market trading on 1/29/18, unaffected date of 1/26/18 used; TPH released its Antero simplification report before market open on 2/20/18, unaffected date of 2/16/18 used; Antero Board Meeting held on 2/21/18, unaffected date of 2/21/18 used; Antero released its press release announcing the formation of Special Committees before market open on 2/26/18, unaffected date of 2/23/18 used 18 Better for AMGP Better for AM Current 3/16/18 1.577x 5% 10% 15% 20% 25% Special Committee announcement 2/23/18 1.380x 20% 26% 31% 37% 43% Board Meeting 2/21/18 1.375x 20% 26% 32% 38% 43% TPH Report 2/16/18 1.350x 23% 28% 34% 40% 46% SailingStone 13D 1/26/18 1.505x 10% 15% 21% 26% 31% 90-day average 12/14/17 1.472x 12% 18% 23% 29% 34% 180-day average 9/14/17 1.514x 9% 15% 20% 25% 30% 1.80 1.75 1.70 1.65 1.60 Current: 1.577x 1.55 180 day: 1.514x 1.50 SailingStone 13D: 1.505x 90 day: 1.472x 1.45 1.40 Special Committee: 1.380x Board Meeting: 1.375x 1.35 TPH Report: 1.350x 1.30 May-17Jun-17Aug-17Oct-17Nov-17Jan-18Mar-18 UnaffectedExchange DateRatio Implied Premium Based on 5 - 25% Premium to Current 1.656x1.734x1.813x1.892x1.971x AM / AMGP Exchange Ratio Since AMGP IPO
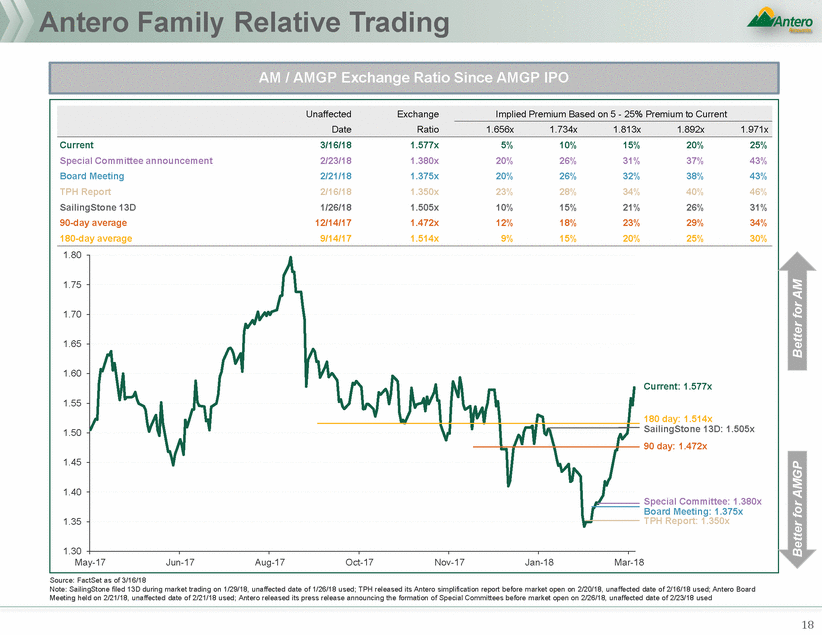
Pro Forma Impact to AM $ / unit $5.00 $ / unit $5.00 $4.68 $4.29 $4.05 $4.00 $4.00 $3.42 $3.24 $3.00 $3.00 $2.00 $2.00 $1.51 $1.00 $1.00 $0.00 $0.00 2018E 2019E 2020E 2021E 2022E 2018E 2019E 2020E 2021E 2022E x 2.00x CAGR % 60% 1.50x 40% 1.16x 1.16x 1.11x 1.11x 1.05x 1.05x 1.00x 20% 0.50x 0.00x 0% 2018E 2019E 2020E 2021E 2022E 2019E 2020E 2021E 2022E Note: Assumes AMGP purchases 100% of AM public units with 100% equity at a 1.813x exchange ratio (15% illustrative premium); AMGP issues approximately 340mm shares to current AM unitholders; 1 Pro forma coverage per AM management case 19 StandalonePro Forma 1.27x 1.27x1.31x 1.31x 40%39% 29% 29% 34% 26% 31% 24% DPU CAGR vs. 2018 Total Coverage1 $4.45 $4.10 $3.65 $2.85 $2.93 $2.21 $2.11 $1.72 $3.74 $3.42 $2.75 $2.77 $2.04 $1.92 $0.36 / unit more distribution over next 5 years Accretion / (Dilution) (11.8%)(4.4%)2.9%6.7%8.5% Accretion / (Dilution) (6.1%)0.8%5.4%8.2%9.2% AMGP Buys AM Distribution / Unit Distributable Cash Flow / Unit
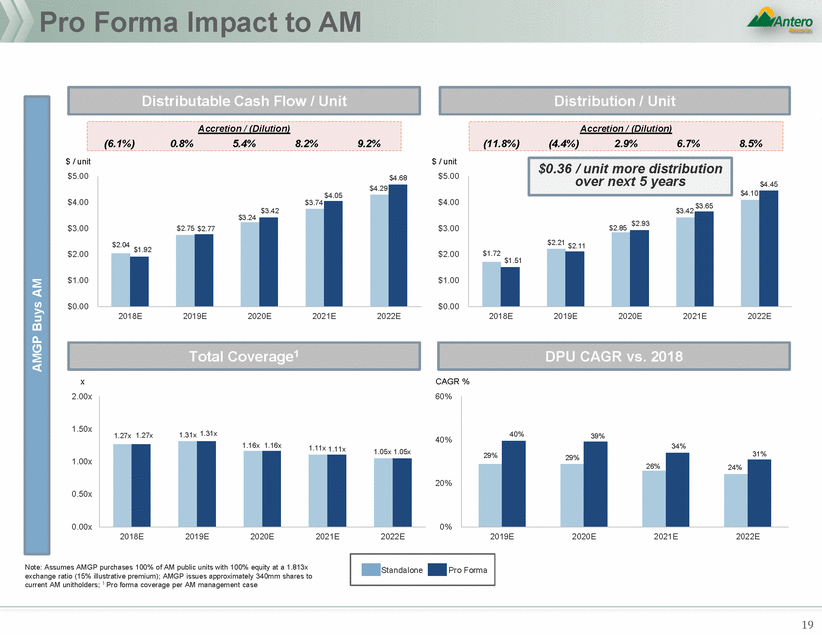
AM Sensitivity Analysis Note: Sensitivities based on 100% equity base case 20 Prem. / (disc.) to current AM equity value Prem. / (disc.) to current AM equity value 2018E2019E2020E2021E2022E 5% 10% 15% 20% 25% (15%) (7%) (0%) 3% 5% (13%) (6%) 1% 5% 7% (12%) (4%) 3% 7% 9% (10%) (3%) 4% 8% 10% (9%) (2%) 6% 10% 12% 2018E2019E2020E2021E2022E 5% 10% 15% 20% 25% (9%) (2%) 2% 5% 6% (8%) (1%) 4% 7% 7% (6%) 1% 5% 8% 9% (5%) 2% 7% 10% 11% (3%) 4% 8% 11% 12% Distribution / Unit Distributable Cash Flow / Unit
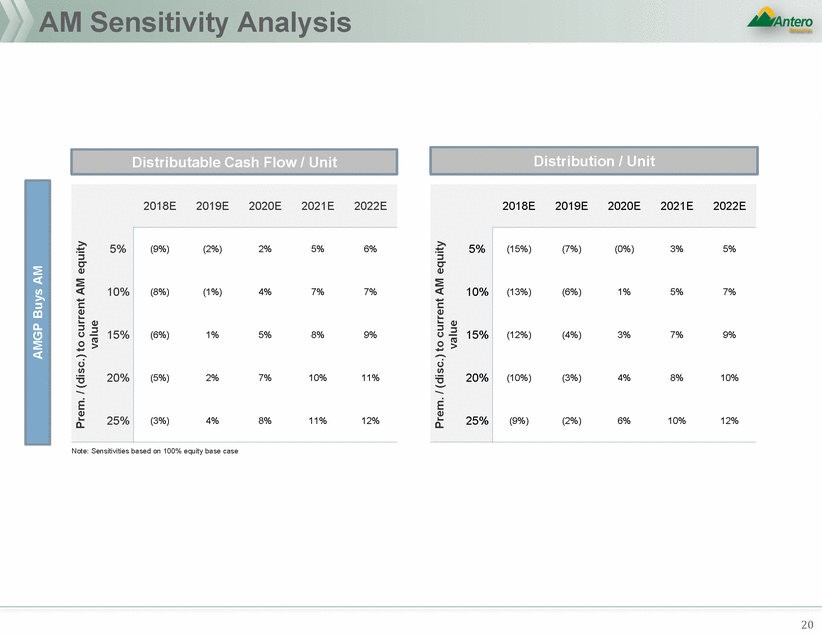
Pro Forma Impact to AMGP $ / unit $3.00 $ / unit $3.00 $2.00 $2.00 $1.62 $1.00 $1.00 $0.00 $0.00 Im plie d yie ld 2018E 2019E 2020E 2021E 2022E 2018E 2019E 2020E 2021E 2022E SA PF 3.2% 5.0% 5.3% 6.9% 8.0% 9.6% 10.4% 12.0% 13.2% 14.6% x 2.00x CAGR % 80.0% 1.50x 60.0% 1.00x 1.05x 1.00x 1.00x 1.00x 40.0% 0.50x 20.0% 0.00x 0.0% 2018E 2019E 2020E 2021E 2022E 2019E 2020E 2021E 2022E Note: Assumes AMGP purchases 100% of AM public units with 100% equity at a 1.813x exchange ratio (15% illustrative premium); AMGP issues approximately 340mm shares to current AM unitholders; pro forma implied yield based on current market price 21 StandalonePro Forma 1.27x1.31x 1.00x 1.16x1.11x 1.00x 65.2% 57.9% 39.6% 48.0% 39.2% 42.6% 34.1% 30.9% DPS CAGR vs. 2018 Total Coverage $2.45 $2.22 $2.01 $1.74 $1.34 $1.17 $0.83$0.89 $0.54 $2.58 $2.23$2.22 $1.88$1.74 $1.53 $1.06 $1.34 $0.54 $0.89 Accretion / (Dilution) 55.5%31.4%20.8%15.6%10.5% Accretion / (Dilution) 97.3%72.4%40.7%28.3%16.3% AMGP Buys AM Distribution / Unit Distributable Cash Flow / Unit
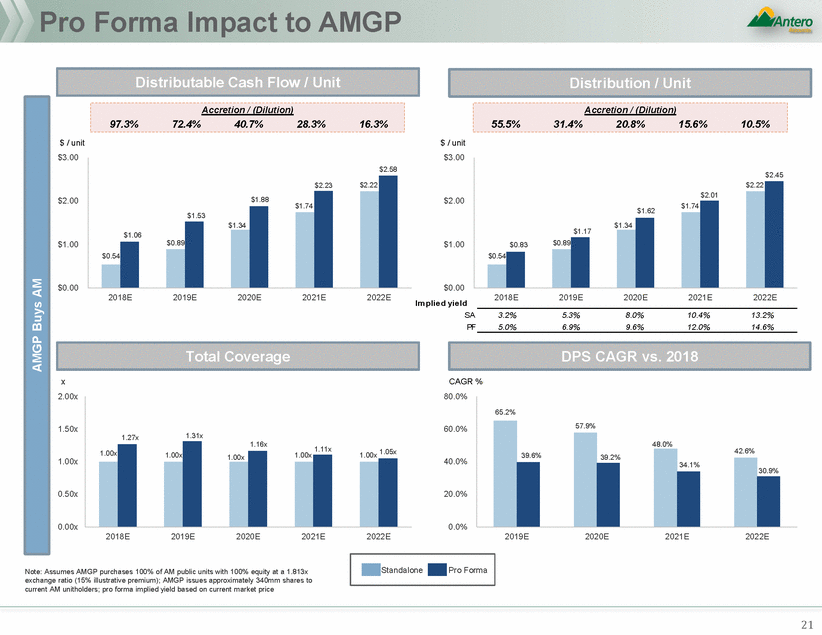
AMGP Sensitivity Analysis 22 % cash % cash % cash % cash % cash % cash 2020E % Pre m ium 5%10%15%20%25% 0% 5% 10% 15% 28%24%21%17%14% 31%27%23%20%16% 33%29%26%22%19% 36%32%28%25%21% 2020E % Pre m ium 5%10%15%20%25% 0% 5% 10% 15% 49%45%41%37%33% 52%48%43%39%36% 55%51%46%42%38% 59%54%49%45%41% 2019E % Pre m ium 5%10%15%20%25% 0% 5% 10% 15% 39%35%31%28%24% 42%37%33%30%26% 44%40%36%32%28% 47%42%38%34%31% 2019E % Pre m ium 5%10%15%20%25% 0% 5% 10% 15% 83%77%72%68%63% 86%80%75%70%66% 89%83%78%73%68% 93%87%81%76%71% 2018E % Pre m ium 5%10%15%20%25% 0% 5% 10% 15% 65%60%55%51%47% 66%61%57%52%48% 68%63%58%54%49% 70%65%60%55%50% 2018E % Pre m ium 5%10%15%20%25% 0% 5% 10% 15% 109%103%97%92%87% 111%105%99%93%88% 113%107%101%95%89% 116%109%103%97%91% AMGP Buys AM Distribution / Unit Distributable Cash Flow / Unit
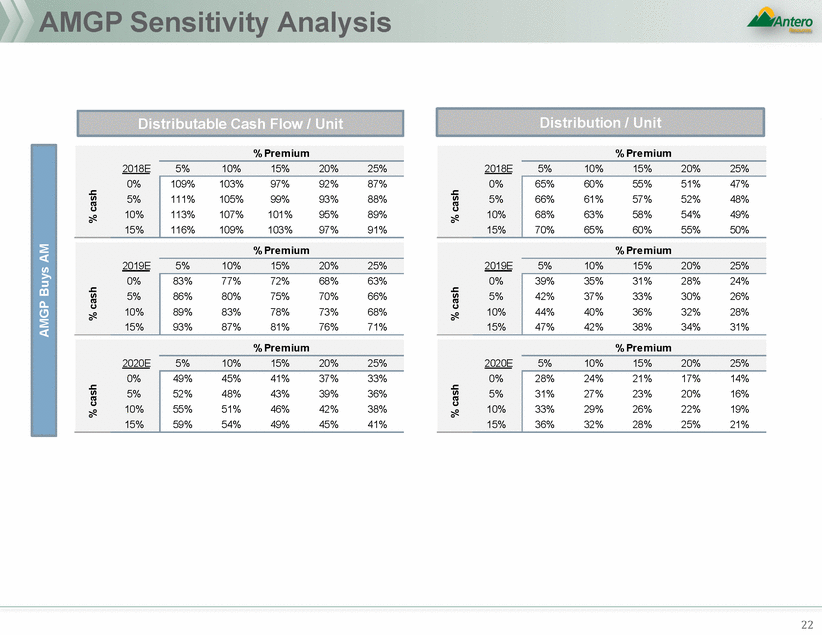
AMGP Sensitivity Analysis (cont’d) Note: % cash represents cash used to fund total equity purchase price of AM 23 % cash % cash % cash 2020E % Pre m ium 5%10%15%20%25% 0% 5% 10% 15% 2.24x2.24x2.24x2.24x2.24x 2.46x2.47x2.48x2.49x2.50x 2.68x2.70x2.72x2.74x2.77x 2.90x2.93x2.96x3.00x3.03x 2019E % Pre m ium 5%10%15%20%25% 0% 5% 10% 15% 2.26x2.26x2.26x2.26x2.26x 2.53x2.54x2.55x2.56x2.58x 2.80x2.82x2.85x2.87x2.90x 3.07x3.10x3.14x3.18x3.22x 2018E % Pre m ium 5%10%15%20%25% 0% 5% 10% 15% 2.27x2.27x2.27x2.27x2.27x 2.63x2.65x2.66x2.68x2.70x 2.99x3.03x3.06x3.09x3.13x 3.35x3.40x3.46x3.51x3.56x AMGP Buys AM Pro Forma Leverage
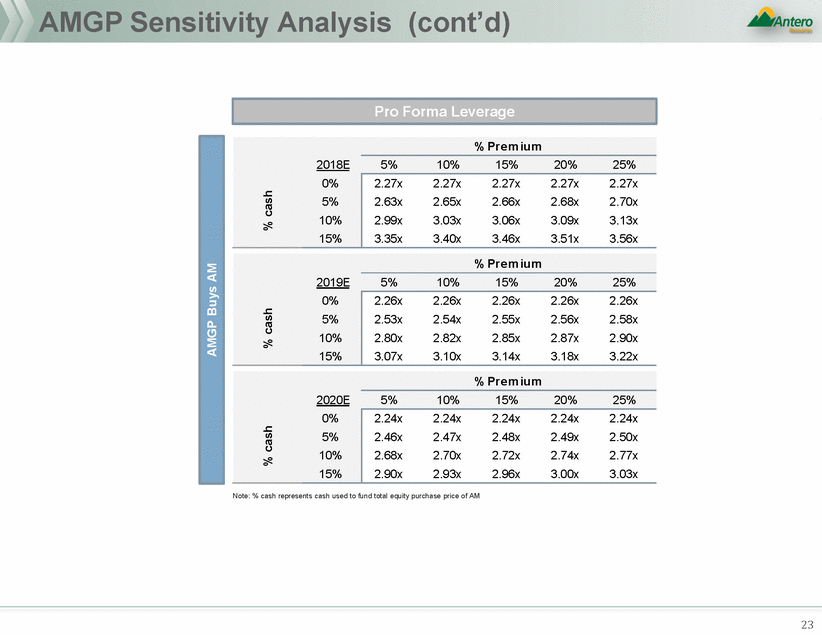
Pro Forma Impact to AR $ / unit $8.00 $ / unit $10.00 $8.00 $6.00 $6.00 $4.36 $4.00 $4.00 $2.00 $2.00 $0.00 $0.00 2018E 2019E 2020E 2021E 2022E 2018E 2019E 2020E 2021E 2022E x 2.5x CAGR % 30.0% 2.0x 20.0% 1.5x 11.4% 10.5% 10.5% 11.5% 1.0x 10.0% 0.5x 0.0x 0.0% 2018E 2019E 2020E 2021E 2022E 2019E 2020E 2021E 2022E Note: Assumes AMGP purchases 100% of AM public units with 100% equity at a 1.813x exchange ratio (15% illustrative premium); AMGP issues approximately 340mm shares to current AM unitholders 24 StandalonePro Forma 20.2% 21.2% 13.4% 14.1% 2.1x 2.1x 1.5x 1.6x 1.4x 1.4x 1.2x 1.2x 0.8x 0.8x Debt-Adjusted Cash Flow/Share CAGR vs. 2018 Total Debt / Adjusted EBITDAX $6.12 $6.21 $4.82 $4.86 $4.20 $4.17$4.36 $3.52 $3.48 $8.16 $8.27 $6.66 $6.74 $5.93 $5.90$6.03 $6.05 $4.94 $4.87 Accretion / (Dilution) (1.3%)(0.5%)0.4%1.1%1.4% Accretion / (Dilution) (1.3%)(0.7%)0.2%0.9%1.5% AMGP Buys AM Discretionary Cash Flow / Share Discretionary Cash Flow / Debt Adj. Share
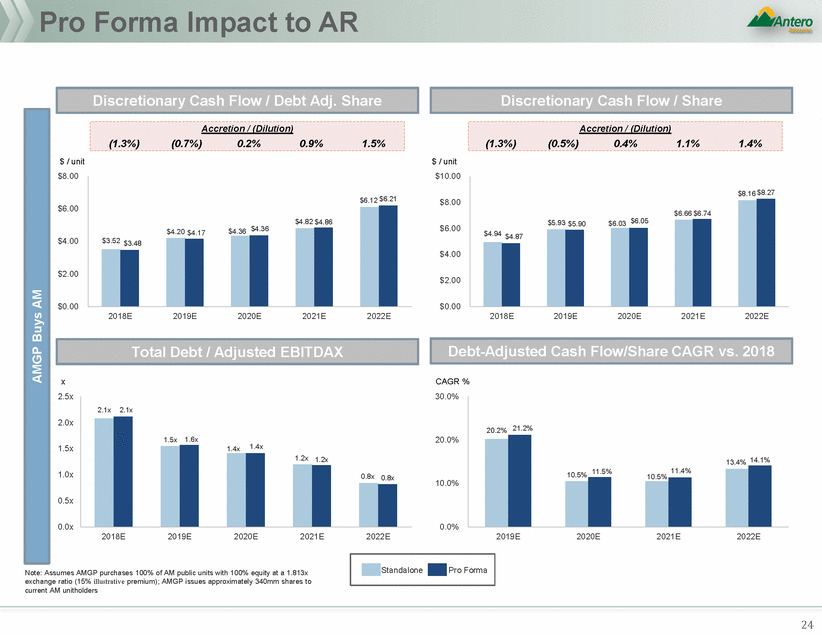
AR Sensitivity Analysis 1 Assumes AR uses cash proceeds received to repurchase AR shares at market value 25 % cash % cash % cash % cash % cash % cash 2020E % Pre m ium 5%10%15%20%25% 0% 5% 10% 15% (0%)0%0%1%1% 1%1%2%2%2% 2%3%3%4%4% 4%4%5%5%6% 2020E % Pre m ium 5%10%15%20%25% 0% 5% 10% 15% (0%)(0%)0%0%1% 0%0%1%1%1% 1%1%1%2%2% 1%2%2%2%3% 2019E % Pre m ium 5%10%15%20%25% 0% 5% 10% 15% (1%)(1%)(1%)(0%)(0%) 0%1%1%1%1% 2%2%2%3%3% 3%3%4%4%5% 2019E % Pre m ium 5%10%15%20%25% 0% 5% 10% 15% (1%)(1%)(1%)(1%)(0%) (1%)(0%)(0%)(0%) 0% (0%)(0%) 0% 0% 1% 0%0%1%1%1% 2018E % Pre m ium 5%10%15%20%25% 0% 5% 10% 15% (2%)(1%)(1%)(1%)(1%) (0%)(0%) 0% 0% 1% 1%1%2%2%2% 2%3%3%3%4% 2018E % Pre m ium 5%10%15%20%25% 0% 5% 10% 15% (2%) (1%) (1%) (1%) (1%) (2%) (1%) (1%) (1%) (1%) (1%) (1%) (1%) (1%) (1%) (1%) (1%) (1%) (1%) (1%) AMGP Buys AM Discretionary Cash Flow / Share Discretionary Cash Flow / Debt Adj. Share1
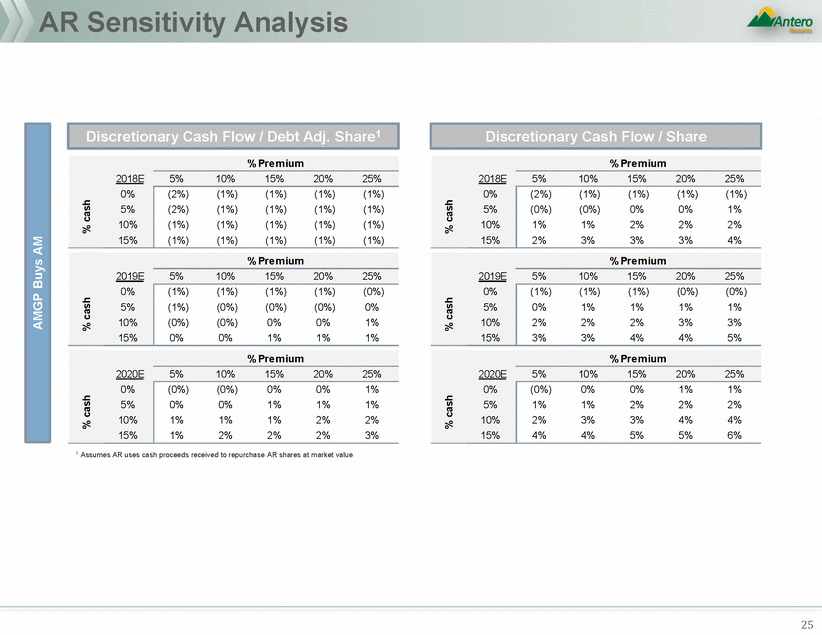
Pro forma AMGP valuation framework 26 •1 Pr o forma AMGP w ould likely be traded as a “ simple” corporate midstream company (i.e., no need to account for different valuation metrics / growth rates between standalone AM and AMGP) •2 Despite pro forma AMGP demonstrating DCF, EBITDA and cash distribution growth vastly superior to its new corporate peers (and generally as good - if not better - than comparable MLPs), at the current AMGP share price, pro forma AMGP would be trading at multiples of 2019E DCF and EBITDA appreciably below its comparables, corporate or MLP •3Moreover, a simple correlation of projected yield to distribution growth would suggest strong support for the AMGP share price materially above its current trading levels •4Lastly, pro forma AMGP would offer a conservative capital return and balance sheet posture with distribution coverage and balance sheet leverage superior to its corporate peers
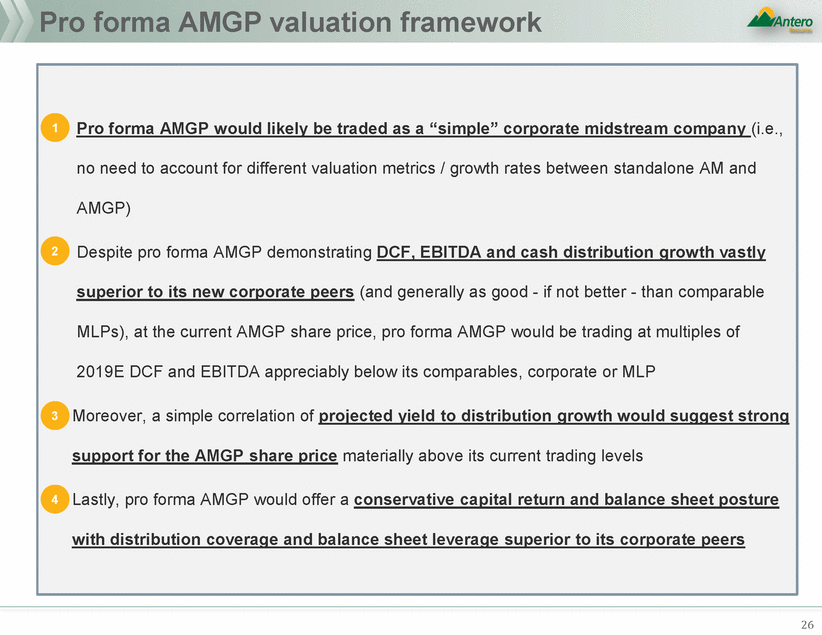
AMGP Pro Forma Valuation Considerations $9,250 $10,450 14.3x 10.6x 8.6x 15.9x 11.0x 8.9x 29% 33% 39% 5.0% 6.9% 1.3x 2.3x PF1 OKE $23,862 $33,024 14.3x 13.3x 11.8x 13.9x 12.7x 11.5x 10% 10% 10% 5.5% 6.1% 1.3x 4.0x TRGP $10,594 $17,045 13.4x 11.4x 10.0x 13.5x 11.8x 10.3x 16% 14% 0% 7.6% 7.6% 1.0x 3.8x WES $7,732 $16,684 14.7x 13.6x 12.8x 13.1x 11.6x 10.6x 13% 11% 6% 8.2% 8.7% 1.1x 3.5x EQM PF $7,159 $14,699 13.0x 10.2x 9.3x 12.2x 10.1x 9.4x 18% 17% 18% 6.7% 8.1% 1.3x 3.6x NBLX $1,960 $3,680 18.1x 15.6x 13.1x 15.7x 12.4x 9.4x 33% 29% 20% 4.4% 5.3% 2.1x 1.7x CNXM $1,263 $2,625 14.8x 11.8x 10.3x 14.9x 12.1x 9.9x 25% 23% 15% 6.9% 8.0% 1.2x 2.6x HESM $1,082 $3,377 13.9x 12.1x 9.9x 14.6x 11.8x 8.8x 40% 29% 15% 7.2% 8.3% 1.2x 0.0x Source: FactSet as of 3/16/18 Note: Firm values and equity values include an assumed GP value based on 2019E GP DCF at a 15.0x multiple or public market value, and DCF is total to LP and GP; CNXM, HESM, NBLX and WES 2019E & 2020E Firm Value adjusted to include financing required for future projected drop downs; EQGP pro forma for dropdown of RMH midstream assets, merger of EQM and RMP, and EQGP acquisition of RMP IDRs 1 Assumes AMGP purchases 100% of AM public units with 100% equity at a 1.813x exchange ratio (15% premium); AMGP issues approximately 340MM shares to current AM unitholders 27 Mean14.7x12.1x10.3x14.6x11.8x9.4x29%28%15%7.2%8.3%1.2x2.2x Median 14.4x12.0x 10.5x 14.4x11.4x 9.4x 28%24% 14%6.8% 7.8%1.4x 2.0x E&P Sponsored MLPs Median 13.8x12.3x 10.9x 13.7x12.2x 10.9x 13%12% 5%6.6% 6.9%1.2x 3.9x Midstream C-Corps AMGP EquityFirm Firm Value / EBITDAEquity Value / DCFEBITDA GrowthDCF GrowthDPU GrowthYieldYieldCash Coverage Debt / 2018E ValueValue 2018E 2019E 2020E2018E 2019E 2020E 18E-'20E CAGR 18E-'20E CAGR 18E-'20E CAGR 2018E 2019E2018EEBITDA Peer Trading Statistics ($mm except where otherwise noted)
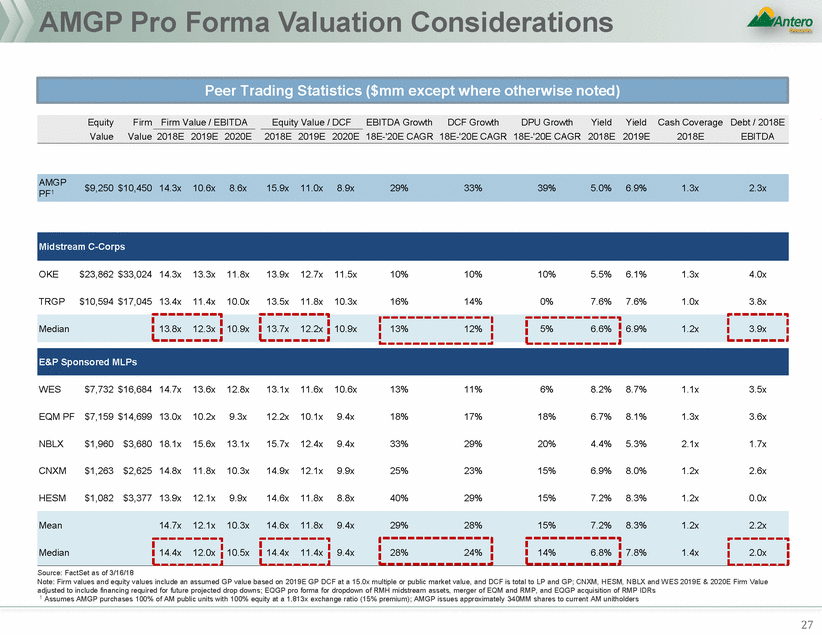
AMGP Pro Forma Valuation Considerations (Cont’d) ENBL ANDX OMP 8% HESM EQM WPZ 6% 4% Note: Market Data as of 3/16/18 1 Peer and standalone Antero represents 2-year 2018-2020 DPS/DPU CAGR; PF AMGP represents estimated 2-year 2018-2020 DPS/DPU CAGR 2 Peer and standalone Antero represents 2018E yield 28 18% 16% 14% ETP 12% 10% SEMG MPLXRMP MMPPSXPVLP OKEPAA NBLX 2% 0% 0%10%20%30%40%50%60% e: SMLP EEP NGL BKEP BPL NS MIC DKL CEQP DCPTLP TRGPWES EPDENBCNXMDM SHLX TRPKMI AMGP SA Current Pric $16.80 AMGP PF price based on SA yield: $26.11 AMGP PF price based on regression: $21.31 2018E Yield 2 R-Squared: 0.5212 2-Year DPS/DPU CAGR (2018E – 2020E) 1 AMGP Yield vs. 2-Year DPS/DPU CAGR (G&P Peers)
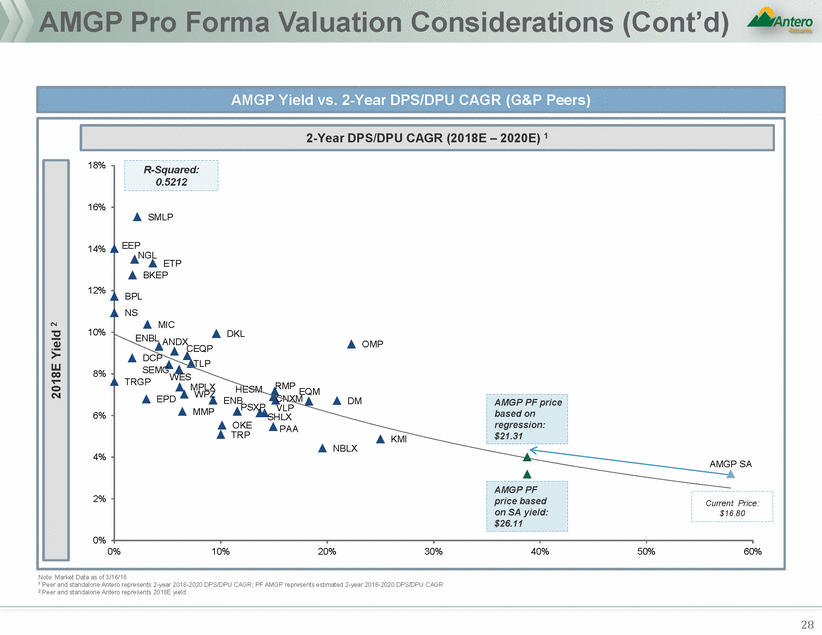
Potential Market Reaction to AMGP Acquisition of AM 29 In light of substantial DCF and cash flow accretion and slightly lower growth, AMGP could see a higher trading price albeit with a higher yield Market would positively view a tax step-up, which would materially reduce in corporate taxes going forward AMGP holders would positively view the transaction as long as the premium is within the range of precedents Despite having a PF multiple that would be lower than its corporate peers, PF AMGP would have superior growth and balance sheet, implying upside to the share price AMGP As with AR, market likely to applaud elimination of IDRs and broader simplification if structured appropriately Would be viewed positively as the slight near term dilution would be more than offset by the accretion in 2020+ Distribution growth profile for next 5+ years is materially enhanced for AM unitholders after the transaction AM unitholders may expect a greater than market premium given the material accretion expected to be had by AMGP As long as AM has an enhanced growth profile, higher distributions, and increased investor base through the C-Corp, AM could see a potential multiple re-rating to the upside AM Market likely to applaud elimination of IDRs and broader simplification of the Antero structure Potentially positive reaction for taking a material step to eliminate the perceived misalignment issue, as well as accretion to AM unitholders after 2018, including AR AMGP purchase of AM and elimination of IDRs helps AR pro forma cash flow (absent significant DPU reduction at AM) Transaction would potentially have a slight positive impact to AR’s share price given the above factors A larger impact to AR’s stock to the upside would require a re-rating of AR’s multiple AR
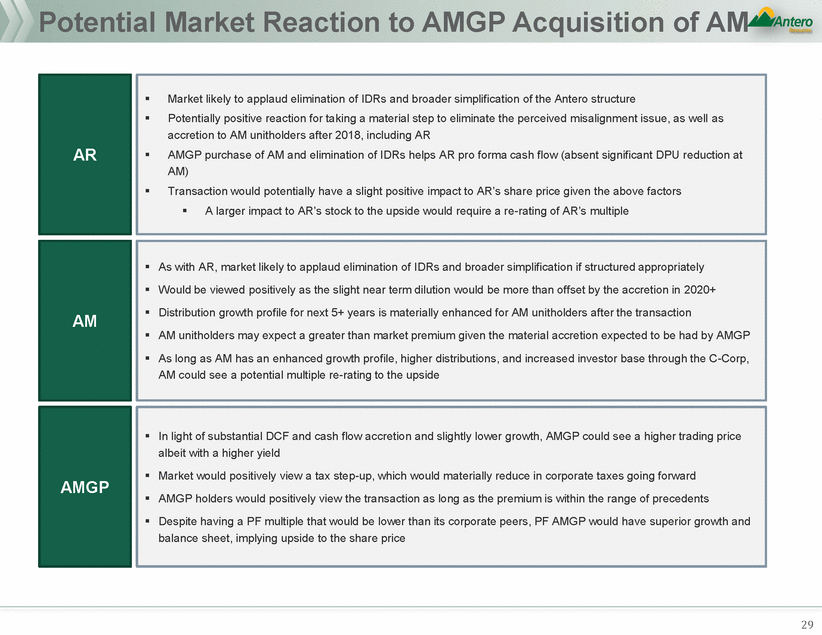
Future Share Price Analysis - AR equity Assumes AMGP acquires AM AMGP shares with 100% for $5,717mm in exchange for 2022 standalone cash flow per share $8.16 1-year forward cash flow per share multiple 4.5x Implied standalone future share price $36.93 Discount factor¹ 0.6x 2022 proforma cash flow per share $8.27 1-year forward cash flow per share multiple 4.5x Implied standalone future share price $37.43 Discount factor¹ 0.6x premium / (discount) to current share price² 18.7% premium / (discount) to implied standalone share price 1.4% 1 Assumes equity discount rate of 11.5%; 2 AR current share price of $20.40 as of 03/16/18; 3 Assumes standalone share price receives no multiple expansion 30 Discount rate Discount rate Implied proforma share price$24.22 1 - yr forward cash flow per share multiple 4.5x5.0x5.5x 10.5% 11.5% 12.5% 1%13%24% 1%13%24% 1%13%24% Implied pro forma share price premium / (discount) to implied standalone share price3 Implied standalone share price$23.89 1 - yr forward cash flow per share multiple 4.5x5.0x5.5x 10.5% 11.5% 12.5% 23%37%50% 19%32%45% 15%27%40% Implied pro forma share price premium / (discount) to current Sensitivity Analysis Standalone vs Pro Forma
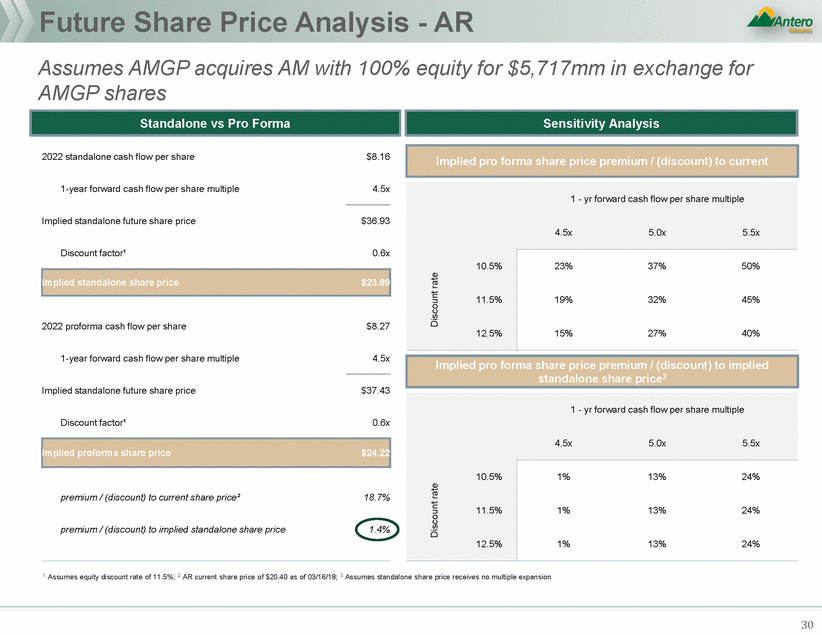
Future Share Price Analysis - AR Assumes AMGP acquires AM exchange for AMGP shares with 90% equity 10% cash for $5,717mm in 2022 standalone cash flow per share $8.16 1-year forward cash flow per share multiple 4.5x Implied standalone future share price $36.93 Discount factor¹ 0.6x 2022 proforma cash flow per share $8.49 1-year forward cash flow per share multiple 4.5x Implied standalone future share price $38.43 Discount factor¹ 0.6x premium / (discount) to current share price² 21.9% premium / (discount) to implied standalone share price 4.1% 1 Assumes equity discount rate of 11.5%; 2 AR current share price of $20.40 as of 03/16/18; 3 Assumes standalone share price receives no multiple expansion 31 Discount rate Discount rate Implied proforma share price$24.86 1 - yr forward cash flow per share multiple 4.5x5.0x5.5x 10.5% 11.5% 12.5% 4%16%27% 4%16%27% 4%16%27% Implied pro forma share price premium / (discount) to implied standalone share price3 Implied standalone share price$23.89 1 - yr forward cash flow per share multiple 4.5x5.0x5.5x 10.5% 11.5% 12.5% 26%40%54% 22%35%49% 18%31%44% Implied pro forma share price premium / (discount) to current Sensitivity Analysis Standalone vs Pro Forma
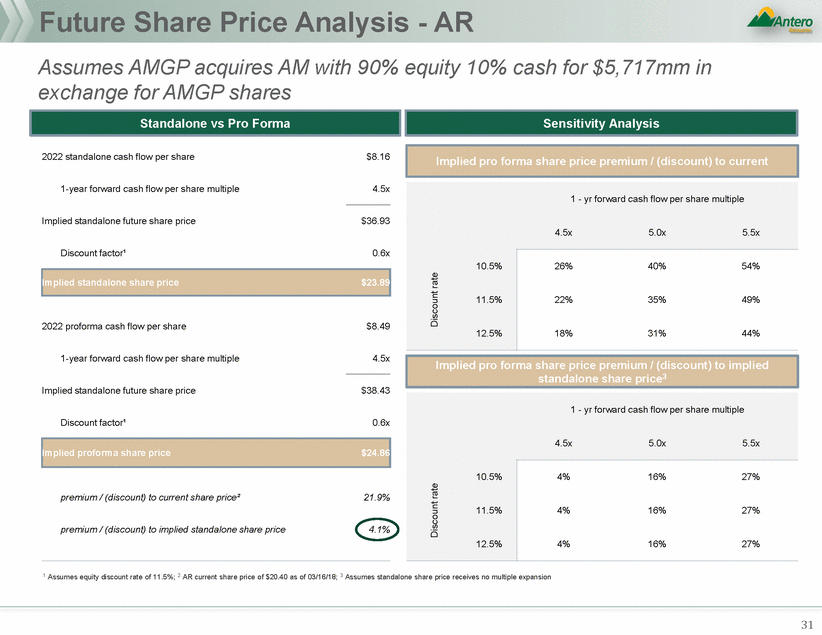
AMAcquisition ofAMGPIDRs
Transaction Overview IDRs 27% 73% 68% 32% IDRs Non-Economic GP interest 53% IDR AM units 47% 68% 32% 27% 73% Non-Economic GP interest 31% LP Interest 42% LP Interest 27% 1 Includes management and sponsor ownership; assumes Series B units converted into AMGP shares at current market capitalization of standalone AMGP Sponsor1 Public 33 Transaction Steps AM Acquisition of IDRs Lowers AM cost of capital due to elimination of Creates “Up-C” structure for AM, and ability to raise midstream capital at C-Corp and MLP levels Consistent with current market preference for simplifications / removals of IDRs Significant near term accretion to AMGP given yield spread difference between AMGP and AM Dilutive to AM and AR for first few years but becomes accretive longer term No tax impact to AR, AMGP or AM shareholders / unitholders ×Near-term LP dilution to AM holders (including AR), particularly with respect to 2018E-2019E DPU; may require coverage reduction, non-distribution bearing units or cash to mitigate dilution ×IDRs not materially impacting AM cost of capital at current time ×Still maintains complexity of three public currencies and doesn’t fully address perception of misalignment between AR and AMGP ×No tax step-up to AM (unless cash is used) ×Requires AMGP vote; need legal input regarding majority of minority voting AM Acquisition of IDRs Overview AMGP eliminates AM’s incentive distribution rights in exchange for newly issued AM common units Transaction assumes illustrative 15% premium to AMGP’s current firm value implying a transaction value of $3.6bn and, a multiple of 17.5x for 2018E GP DCF and a multiple of 25.2x 2018E GP distributions Series B are converted into 4.0mm shares of AMGP PF AMGP receives proportional allocation of net income of AM based on its PF ownership interest
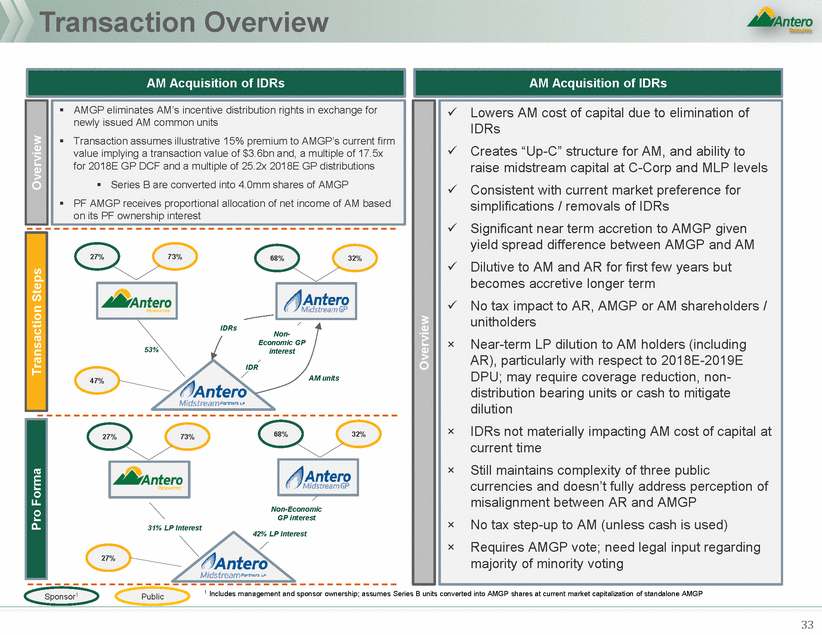
Analysis at Various Prices 0.0% 5.0% 10.0% 15.0% 20.0% 25.0% LP Market Price $26.49 $3,122 $3,278 $3,434 $3,590 $3,746 $3,902 LP Market Cap $4,971 2018E GP DCF $205 15.2x 16.0x 16.8x 17.5x 18.3x 19.0x 2018E LP DCF $383 13.0x 2019E GP DCF $337 9.3x 9.7x 10.2x 10.7x 11.1x 11.6x 2019E LP DCF $515 9.7x 2020E GP DCF $428 7.3x 7.7x 8.0x 8.4x 8.7x 9.1x 2020E LP DCF $606 8.2x 2018E GP distributions 2018E GP distributions 2020E GP distributions $143 21.9x 23.0x 24.1x 25.2x 26.3x 27.4x 2018E LP DPU $1.72 15.4x $236 13.3x 13.9x 14.6x 15.2x 15.9x 16.6x 2019E LP DPU $2.21 12.0x $355 8.8x 9.2x 9.7x 10.1x 10.5x 11.0x 2020E LP DPU $2.85 9.3x Source: Management projections; AMGP firm value and AM market price as of 03/16/18 Note: Assumes AM acquires its IDRs from AMGP funded with AM units issued to AMGP 34 Multiple of:Metric Multiple of:Metric AM Current Market Multiples Value of IDRs - Premium to Current AMGP Firm Value Implied Multiples Analysis ($mm, except per unit data)
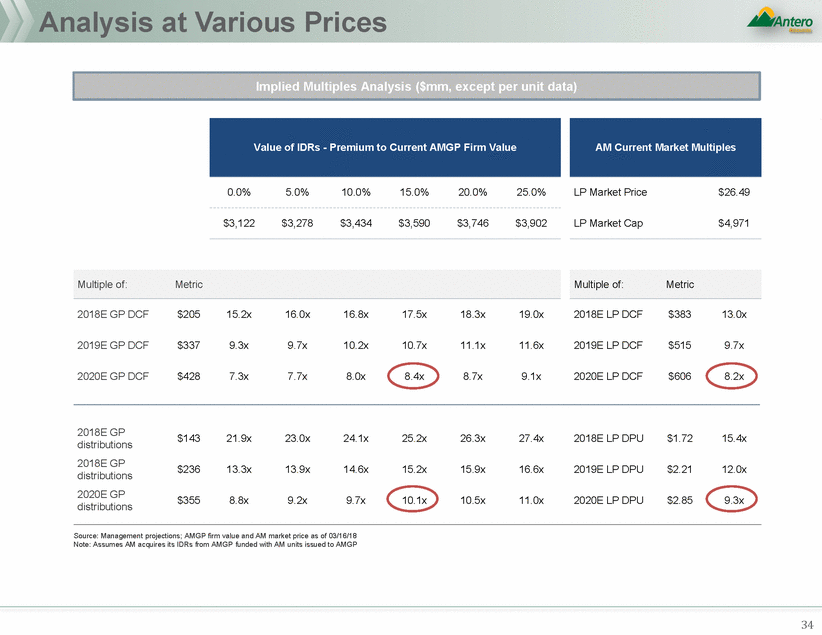
Precedent Simplifications – GP Take Source: Management projections, company filings, equity research 1 ANDX GP take of 29% at transaction includes $50mm annual concessions in 2017E and 2018E (excluding concessions results in 34% GP take) 2 Broker estimates pre-announcement of DPU cut 35 GP take: 2021E: 42% 2020E: 40% 36% 2019E: 36% 29%29%28% 11 2 2018E: 31% Current: 26% 31%31%30% 24% 22%21% 16% 13% 2% IDR life cycle comparison vs. precedents – GP take as percentage of total distributions at time of transaction
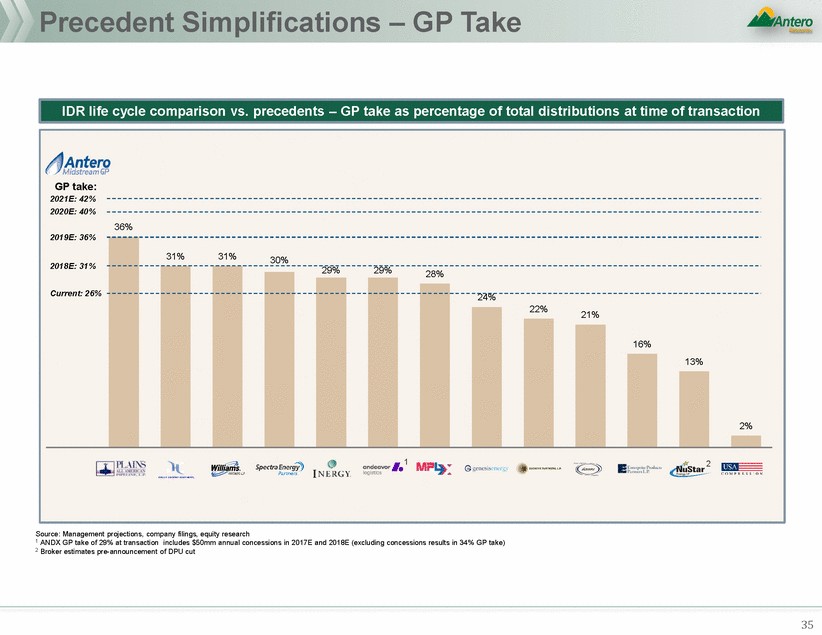
Precedent Simplifications – GP Growth Source: Management projections, equity research; Note: Median excludes AM,1 Based on 2018-2020E CAGR, adjusted for effect of $8.1bn drop down announced concurrent with simplification Note: ANDX growth adjusted for 2017E GP DCF giveback 1 Broker estimates pre-announcement of DPU cut 36 45% 12%12%11%11% 11 ’18E-’20E’18E-’20E MgmtStreet Year + 1 DCF18.3x13.1x11.1x18.3x18.2x21.3x13.8x11.1x17.7x12.4x11.9x13.4x22.3x12.9x11.5x GP value / Curr. 39% 36%36% 34% 25%25%25% 14%14%Median: 14% 8% GP DCF growth at time of simplification (Curr. year to Curr. year +2 CAGR)
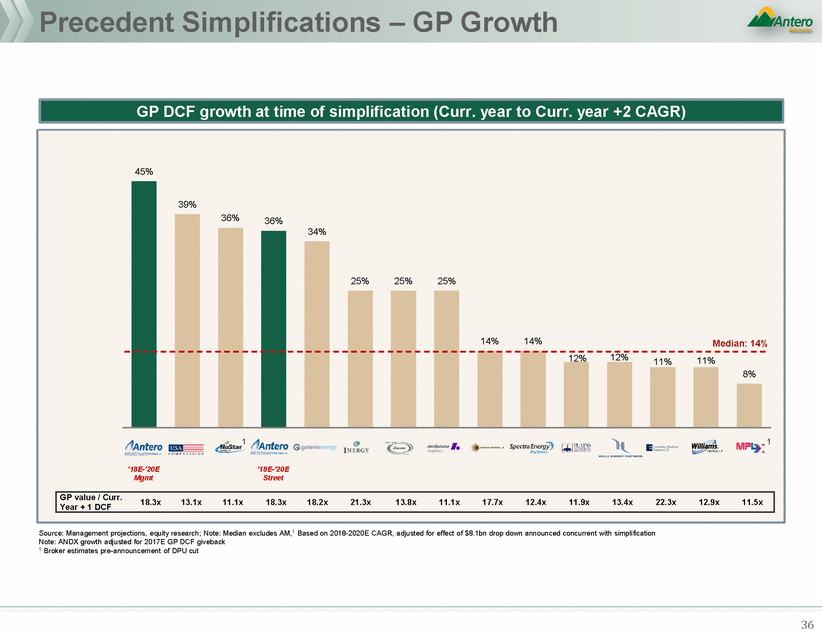
Pro Forma Impact to AM Standalone Pro forma Accretion / (Dilution) (10.9%) (4.1%) (1.0%) 1.3% 3.1% $5.00 $4.00 $3.00 $2.64 $1.82 $2.00 $1.00 $0.00 2018E Coverage 2019E 2020E 2021E 2022E AM Net Debt / LTM EBITDA Standalone Pro forma 1.27x 1.27x 1.31x 1.31x 1.16x 1.16x 1.11x 1.11x 1.05x 1.05x Standalone Pro forma 2.3x 2.3x 2.2x 2.2x 2.2x 2.2x 2.1x 2.1x 2.0x 2.0x Accretion / (Dilution) (16.3%) (9.0%) (3.4%) (0.1%) 2.5% $5.00 $4.00 $3.00 $2.01 $2.00 $1.44 $1.00 $0.00 2018E Growth 2019E 2020E 2021E 2022E Aggregate AM distributions Standalone Pro forma 29% 8% 29% 40% 29% 37% 20% 24% 20% 23% Standalone Pro forma $463 $463 $649 $649 $889 $889 $1,102 $1,102 $1,356 $1,356 Note: Assumes AM acquires its IDRs from AMGP for $3,590mm (illustrative 15% premium to AMGP’s firm value as of 3/16/18) in exchange for 136mm newly-issued AM common units issued to AMGP based on AM’s closing unit price of $26.49 as of 3/16/18; Pro forma for the potential transaction, AMGP receives a pro rata allocation of AM taxable income based on its AM ownership; AM and AMGP pro forma total coverage ratio equal to standalone, respectively 37 Prem. / (disc.) to current AMGP firm value Prem. / (disc.) to current AMGP firm value Implied 2018E IDR DCF multiple Implied 2018E IDR DCF multiple IDR purchase price IDR purchase price $4.10 $4.20 $3.42$3.42 $2.85 $2.75 $2.21 $1.72 2018E2019E2020E2021E2022E 5% 10% 15% 20% 25% 16.0x 16.8x 17.5x 18.3x 19.0x $3,278 $3,434 $3,590 $3,746 $3,902 (13%) (6%) 0% 4% 6% (15%) (7%) (2%) 2% 4% (16%) (9%) (3%) (0%) 3% (18%) (11%) (5%) (2%) 1% (19%) (12%) (7%) (4%) (1%) Distribution / Unit $4.29 $4.42 $3.74$3.79 $3.24 $3.21 $2.75 $2.04 2018E2019E2020E2021E2022E 5% 10% 15% 20% 25% 16.0x 16.8x 17.5x 18.3x 19.0x $3,278 $3,434 $3,590 $3,746 $3,902 (7%) (0%) 3% 5% 7% (9%)(2%)1%3%5% (11%) (4%) (1%) 1% 3% (12%) (6%) (3%)(1%) 1% (14%)(7%)(5%)(2%)(1%) Distributable Cash Flow / Unit
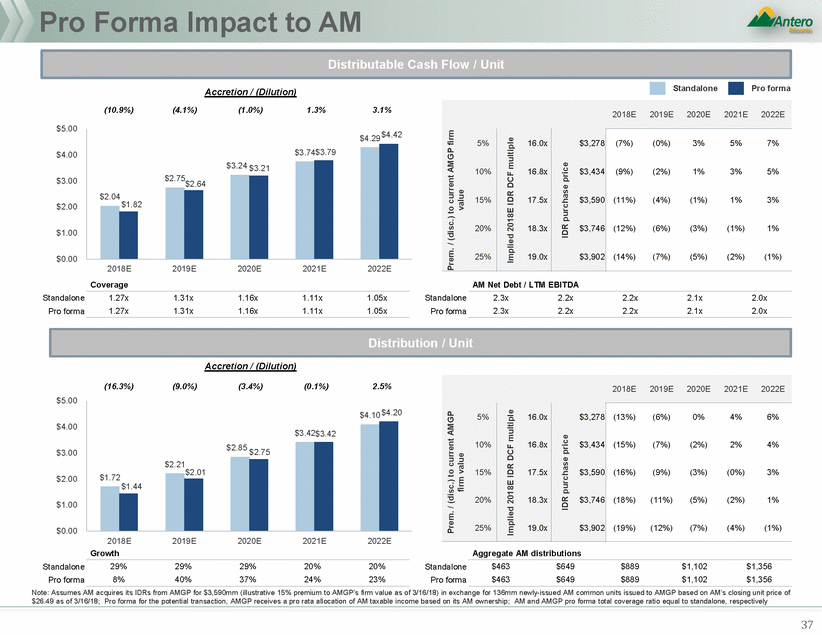
AM Distribution / Unit Sensitivity Analysis Coverage 1.27x 1.31x 1.16x 1.11x 1.05x Coverage 1.17x 1.21x 1.06x 1.11x 1.05x Coverage 1.12x 1.16x 1.01x 1.11x 1.05x AM Net Debt / LTM EBITDA 2.8x 2.6x 2.6x 2.4x 2.2x Note: Assumes AM acquires its IDRs from AMGP for $3,590mm (illustrative 15% premium to AMGP’s firm value as of 3/16/18) in exchange for 136mm newly-issued AM common units issued to AMGP based on AM’s closing unit price of $26.49 as of 3/16/18; Pro forma for the potential transaction, AMGP receives a pro rata allocation of AM taxable income based on its AM ownership 1 Pro forma coverage per AM standalone case; 2 Assumes AM levers up to 3.0x 2017YE debt / 2017E EBITDA 38 Prem. / (disc.) to current AMGP firm value Prem. / (disc.) to current AMGP firm value Implied 2018E IDR DCF multiple Implied 2018E IDR DCF multiple IDR purchase price IDR purchase price Prem. / (disc.) to current AMGP firm value Prem. / (disc.) to current AMGP firm value Implied 2018E IDR DCF multiple Implied 2018E IDR DCF multiple IDR purchase price IDR purchase price 2018E2019E2020E2021E2022E 5% 10% 15% 20% 25% 16.0x 16.8x 17.5x 18.3x 19.0x $3,278 $3,434 $3,590 $3,746 $3,902 (12%) (3%) 3% 7% 10% (14%) (5%) 1% 5% 8% (15%) (7%) (1%) 3% 6% (17%) (9%) (3%) 1% 4% (18%) (10%) (4%) (1%) 2% 2018E2019E2020E2021E2022E 5% 10% 15% 20% 25% 16.0x 16.8x 17.5x 18.3x 19.0x $3,278 $3,434 $3,590 $3,746 $3,902 (2%) 6% 14% 3% 6% (3%) 4% 12% 1% 4% (5%) 2% 10% (1%) 2% (7%) 1% 8% (3%) 0% (9%) (1%) 6% (4%) (2%) IDR buy-in funded with $386mm cash consideration2 IDR buy-in with coverage reduced 0.15x from 2018-2020 2018E2019E2020E2021E2022E 5% 10% 15% 20% 25% 16.0x 16.8x 17.5x 18.3x 19.0x $3,278 $3,434 $3,590 $3,746 $3,902 (6%) 2% 9% 3%6% (8%) 0%7% 1%4% (9%)(2%)5%(1%)2% (11%) (3%) 3%(2%)0% (12%)(5%)2%(4%)(1%) 2018E2019E2020E2021E2022E 5% 10% 15% 20% 25% 16.0x 16.8x 17.5x 18.3x 19.0x $3,278 $3,434 $3,590 $3,746 $3,902 (13%) (6%) 0% 4% 6% (15%) (7%) (2%) 2% 4% (16%) (9%) (3%) (0%) 3% (18%) (11%) (5%) (2%) 1% (19%) (12%) (7%) (4%) (1%) IDR buy-in with coverage reduced 0.1x from 2018-2020 IDR buy-in with coverage held flat1 Distribution / Unit
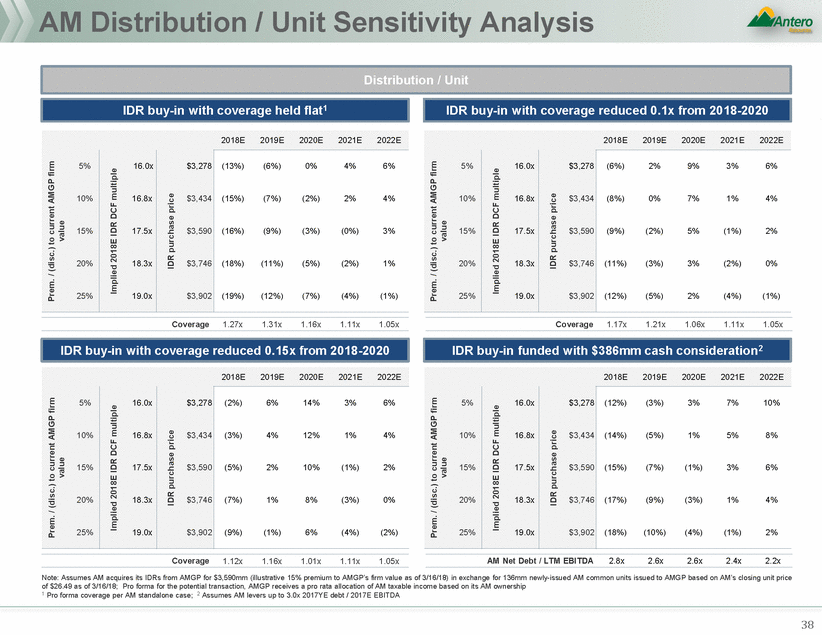
Pro Forma Impact to AR (1.8%) (1.3%) (0.9%) (0.6%) (0.2%) $8.00 $6.00 $4.36 $4.32 $4.20 $4.15 $4.00 $2.00 $0.00 2018E 2019E 2020E 2021E 2022E Net AR Debt / LTM EBITDAX (including AM distributions) Standalone Pro forma 2.1x 2.1x 1.5x 1.6x 1.4x 1.4x 1.2x 1.2x 0.8x 0.9x Accretion / (Dilution) (1.8%) (1.1%) (0.5%) (0.1%) 0.3% $10.00 $8.00 $6.03 $6.00 $5.93 $5.87 $6.00 $4.00 $2.00 $0.00 2018E 2019E 2020E 2021E 2022E Distributions received from AM $170 $142 $219 $199 $282 $272 $338 $338 $405 $416 Standalone Pro forma Note: Assumes AM acquires its IDRs from AMGP for $3,590mm (illustrative 15% premium to AMGP’s firm value as of 3/16/18) in exchange for 136mm newly-issued AM common units issued to AMGP based on AM’s closing unit price of $26.49 as of 3/16/18; Pro forma for the potential transaction, AMGP receives a pro rata allocation of AM taxable income based on its AM ownership; AM and AMGP pro forma total coverage ratio equal to standalone, respectively 1 Debt adjusted cash flow per share equal to discretionary cash flow plus after-tax interest expense / debt adjusted shares; debt adjusted shares: represents ending period debt divided by ending share price plus ending shares outstanding; forecasted debt-adjusted shares assumes AR share price of $20.40 per share as of 03/16/18; 2 Discretionary cash flow includes effect of AM distributions to AR 39 Prem. / (disc.) to current AMGP firm value Prem. / (disc.) to current AMGP firm value Implied 2018E IDR DCF multiple Implied 2018E IDR DCF multiple IDR purchase price IDR purchase price $8.16 $8.19 $6.66 $6.66 $4.94 $4.85 2018E2019E2020E2021E2022E 5% 10% 15% 20% 25% 16.0x 16.8x 17.5x 18.3x 19.0x $3,278 $3,434 $3,590 $3,746 $3,902 (1%) (1%) 0% 1% 1% (2%) (1%) (0%) 0% 1% (2%) (1%) (1%) (0%) 0% (2%) (1%) (1%) (0%) 0% (2%) (1%) (1%) (1%) (0%) Discretionary Cash Flow / Share2 $6.12 $6.10 $4.82 $4.79 $3.52 $3.46 2018E2019E2020E2021E2022E 5% 10% 15% 20% 25% 16.0x 16.8x 17.5x 18.3x 19.0x $3,278 $3,434 $3,590 $3,746 $3,902 (1%)(1%)(0%) 0% 1% (2%)(1%)(1%)(0%) 0% (2%)(1%)(1%)(1%)(0%) (2%)(1%)(1%)(1%)(1%) (2%)(2%)(2%)(1%)(1%) Discretionary Cash Flow / Debt Adj. Share1 Accretion / (Dilution) Standalone Pro forma

Future Share Price Analysis - AR Assumes IDR purchase price of $3,590mm in exchange for AM units 2022 standalone cash flow per share $8.16 1-year forward cash flow per share multiple 4.5x Implied standalone future share price $36.93 Discount factor¹ 0.6x 2022 proforma cash flow per share $8.19 1-year forward cash flow per share multiple 4.5x Implied standalone future share price $37.06 Discount factor¹ 0.6x premium / (discount) to current share price² 17.5% premium / (discount) to implied standalone share price 0.3% 1 Assumes equity discount rate of 11.5%; 2 AR current share price of $20.40 as of 03/16/18; 3 Assumes standalone share price receives no multiple expansion 40 Discount rate Discount rate Implied proforma share price$23.97 1 - yr forward cash flow per share multiple 4.5x5.0x5.5x 10.5% 11.5% 12.5% 0%11%23% 0%11%23% 0%11%23% Implied pro forma share price premium / (discount) to implied standalone share price3 Implied standalone share price$23.89 1 - yr forward cash flow per share multiple 4.5x5.0x5.5x 10.5% 11.5% 12.5% 22%35%49% 18%31%43% 13%26%38% Implied pro forma share price premium / (discount) to current Sensitivity Analysis Standalone vs Pro Forma
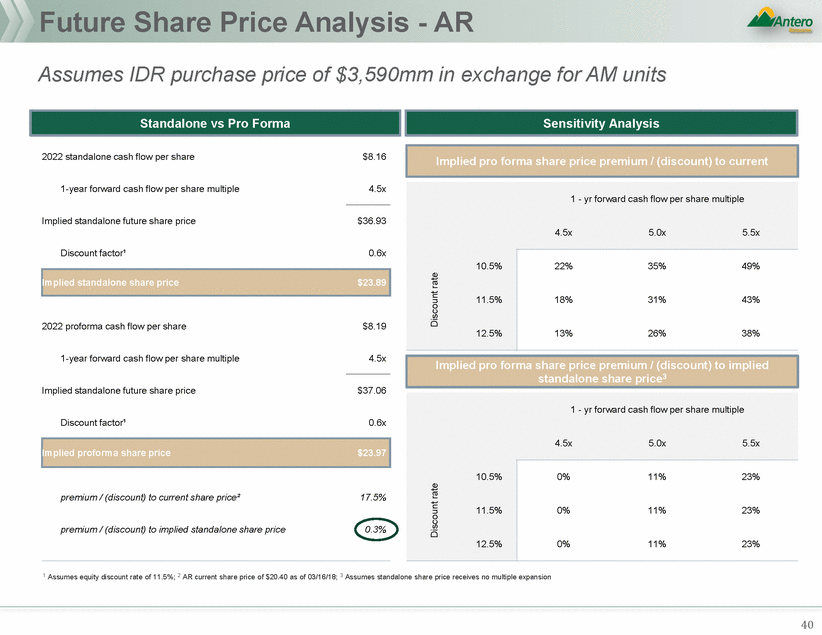
Pro Forma Impact to AMGP Standalone Pro forma Accretion / (Dilution) 52.3% 26.4% 21.6% 25.2% 18.0% $3.00 $2.00 $1.63 $1.00 $0.00 2018E 2019E 2020E 2021E 2022E Distributions received from AM Standalone Pro forma $143 $195 $236 $273 $355 $373 $462 $463 $589 $570 Accretion / (Dilution) 52.3% 26.4% 21.6% 25.2% 18.0% $3.00 $2.00 $1.63 $1.00 $0.00 2018E 2019E 2020E 2021E 2022E Growth Standalone Pro forma 138% 263% 65% 37% 51% 45% 30% 34% 28% 20% Note: Assumes AM acquires its IDRs from AMGP for $3,590mm (illustrative 15% premium to AMGP’s firm value as of 3/16/18) in exchange for 136mm newly-issued AM common units issued to AMGP based on AM’s closing unit price of $26.49 as of 3/16/18; Pro forma for the potential transaction, AMGP receives a pro rata allocation of AM taxable income based on its AM ownership; AM and AMGP pro forma total coverage ratio equal to standalone, respectively 41 Prem. / (disc.) to current AMGP firm value Prem. / (disc.) to current AMGP firm value Implied 2018E IDR DCF multiple Implied 2018E IDR DCF multiple IDR purchase price IDR purchase price $2.62 $2.18$2.22 $1.74 $1.34 $1.12 $0.82$0.89 $0.54 2018E2019E2020E2021E2022E 5% 10% 15% 20% 25% 16.0x 16.8x 17.5x 18.3x 19.0x $3,278 $3,434 $3,590 $3,746 $3,902 44%20%15%19%12% 48%23%18%22%15% 52%26%22%25%18% 56%30%25%28%21% 60%33%28%31%24% Distribution / Share $2.62 $2.18$2.22 $1.74 $1.34 $1.12 $0.82$0.89 $0.54 2018E2019E2020E2021E2022E 5% 10% 15% 20% 25% 16.0x 16.8x 17.5x 18.3x 19.0x $3,278 $3,434 $3,590 $3,746 $3,902 44%20%15%19%12% 48%23%18%22%15% 52%26%22%25%18% 56%30%25%28%21% 60%33%28%31%24% Distributable Cash Flow / Share
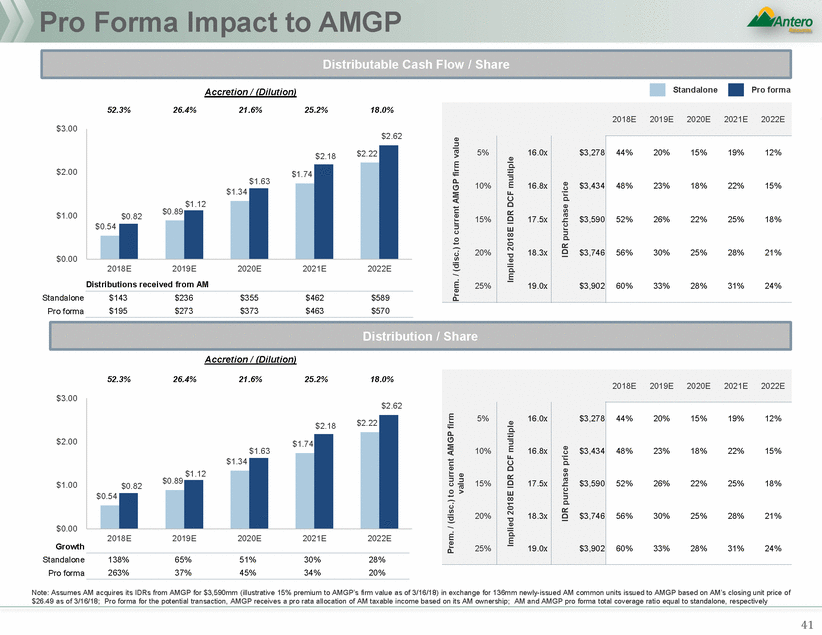
AMGP Distribution / Share Sensitivity Analysis Coverage 1.27x 1.31x 1.16x 1.11x 1.05x Coverage 1.17x 1.21x 1.06x 1.11x 1.05x Coverage 1.12x 1.16x 1.01x 1.11x 1.05x Note: Assumes AM acquires its IDRs from AMGP for $3,590mm (illustrative 15% premium to AMGP’s firm value as of 3/16/18) in exchange for 136mm newly-issued AM common units issued to AMGP based on AM’s closing unit price of $26.49 as of 3/16/18; Pro forma for the potential transaction, AMGP receives a pro rata allocation of AM taxable income based on its AM ownership; 1 Pro forma coverage per AM standalone case 42 Prem. / (disc.) to current AMGP firm value Implied 2018E IDR DCF multiple IDR purchase price Prem. / (disc.) to current AMGP firm value Implied 2018E IDR DCF multiple IDR purchase price Prem. / (disc.) to current AMGP firm value Implied 2018E IDR DCF multiple IDR purchase price 2018E2019E2020E2021E2022E 5% 10% 15% 20% 25% 16.0x 16.8x 17.5x 18.3x 19.0x $3,278 $3,434 $3,590 $3,746 $3,902 68%39%35%18%11% 73%43%39%21%14% 78%47%43%25%17% 82%51%46%28%20% 86%54%49%31%23% IDR buy-in with coverage reduced 0.15x from 2018-2020 2018E2019E2020E2021E2022E 5% 10% 15% 20% 25% 16.0x 16.8x 17.5x 18.3x 19.0x $3,278 $3,434 $3,590 $3,746 $3,902 60%32%28%18%11% 64%36%31%22%15% 68%40%35%25%18% 73%43%38%28%21% 77%46%42%31%23% 2018E2019E2020E2021E2022E 5% 10% 15% 20% 25% 16.0x 16.8x 17.5x 18.3x 19.0x $3,278 $3,434 $3,590 $3,746 $3,902 44%20%15%19%12% 48%23%18%22%15% 52%26%22%25%18% 56%30%25%28%21% 60%33%28%31%24% IDR buy-in with coverage reduced 0.1x from 2018-2020 IDR buy-in with coverage held flat1 Distribution / Share
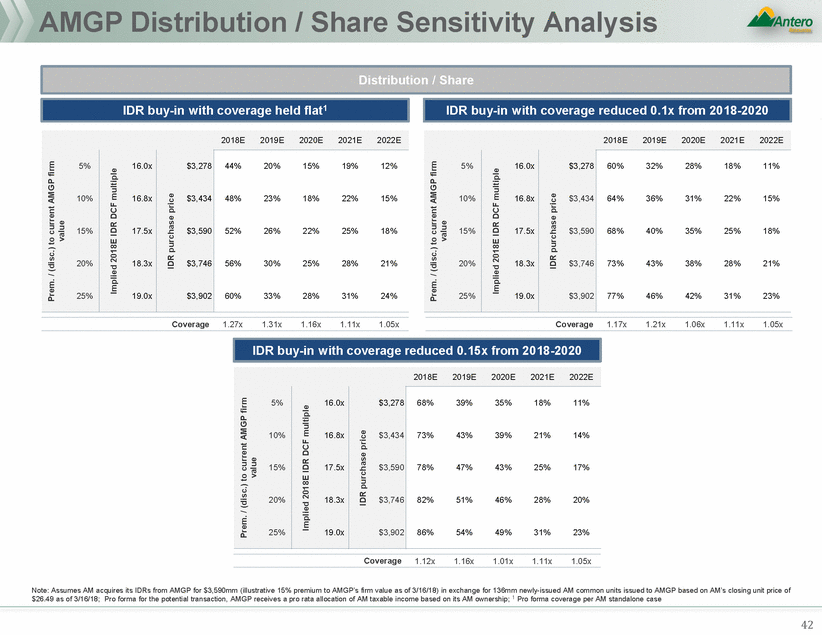
Potential Market Reaction to AM IDR Repurchase impact of IDR growth on multiple required 43 So long as value paid for IDRs is consistent with AMGP market-implied trading value and cash flow impact in near term is positive, market reaction for AMGP likely to be flat to positive In light of substantial accretion in cash flow in near-term and substantial tempering of growth, implied AMGP yield likely to rise materially After-tax yield at AMGP likely to track AM yield, although other precedents have seen C-Corp “holding company” trading at a slightly improved yield relative to the underlying MLP in light of enhanced liquidity and greater market depth AMGP As with AR, market likely to applaud elimination of IDRs and AM simplification if structured appropriately However, substantial near-term dilution to AM DCF/unit and DPU likely to be viewed as a negative by unitholders Will need to address through coverage, cash consideration and/or delivery of non-distribution bearing units Likewise, market may react negatively to multiple paid for IDRs relative to recent precedents; education regarding Assuming dilution and multiple paid are addressed, AM would be expected to trade flat/modestly down on announcement, consistent with recent precedents However, if substantial dilution to DPU were to be realized, would likely lead to very negative trading reaction AM Market likely to applaud elimination of IDRs and partial simplification with respect to AM Potential reaction may be muted by retention of three public currencies and continued perceived misalignment, as well as potential dilution to AM unitholders, including AR IDR repurchase has minimal impact on AR pro forma cash flow (absent significant DPU reduction at AM) Unless there is a re-rating of AR's multiple due to the above factors, transaction may have limited impact on AR stock price AR
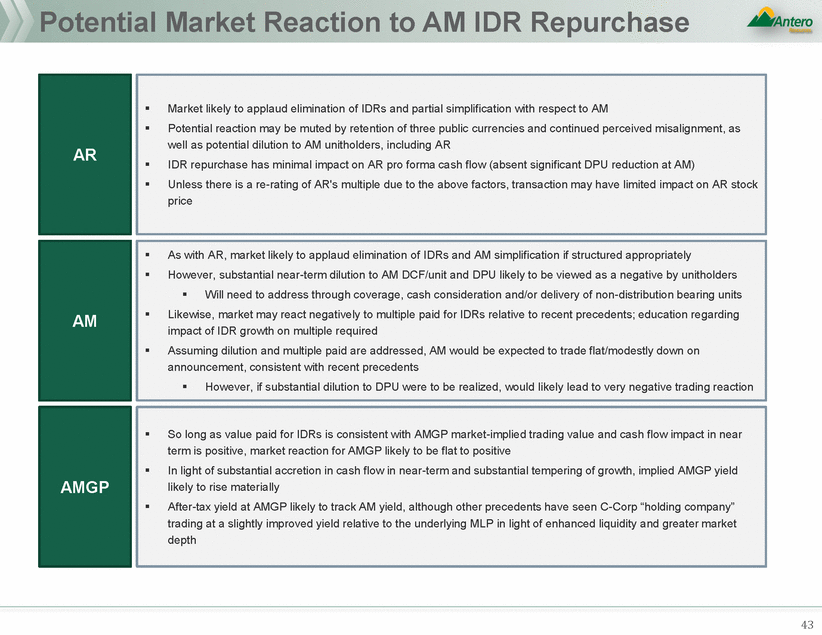
ARShareBuybackAnalysis
AR Share Repurchase – Overview 03/07/18 Devon Energy $1,000 6.1 33% 4.7% 5.4% - (0.4%) - - 5.0% - - 02/15/18 Noble Energy $750 5.8 (0.3%) 10.1% - (0.3%) (2.8%) - (0.0%) 12.9% - 02/14/18 Laredo Petroleum $200 10.4 5.0% 8.1% - (0.3%) (2.8%) - 5.3% 10.9% - 02/01/18 ConocoPhillips 8% 0.9% (5.4%) (8.2%) 1.0% (7.5%) (9.6%) (0.1%) 2.1% 1.4% 01/03/18 Cabot Oil 20% (0.4%) (3.7%) (17.3%) 1.1% 0.8% (6.3%) (1.5%) (4.5%) (11.1%) 0.3% (0.2%) (2.0%) (2.8%) (2.5%) (5.2%) Mean Median $934 $720 5.7% 5.8% 2.1% 1.7% 0.9% 2.1% (1.9%) (2.3%) 1.8% 1.0% 2.0% 3.6% 0.6% 1.6% Source: FactSet as of 03/16/18; 1 Market reaction defined as one day post-announcement; 2 Relative performance based on S&P 500 E&P index; 3 Based on PV of earn-out proceeds discounted to 5/1/18 at 8% 45 01/29/18 Gulfport Energy Corporation $100 4.5 (8.9%) (24.3%) (11.6%) (2.6%) (8.6%) (11.2%) (6.3%) (15.8%) (0.3%) 02/06/18 Pioneer $100 0.3 300% 1.3% (1.0%) - (1.8%) (5.2%) 3.1% 4.2% - 02/15/18 Encana Corporation $400 3.7 (1.4%) (5.9%) - (0.3%) (2.8%) - (1.1%) (3.1%) - 02/23/18 Cabot Oil $720 6.5 2.4% 4.4% - 2.9% - - (0.4%) - - 2018YTD E&P Share Repurchase and Dividend Increases Precedents Announcem ent Buyback % Dividend Market reaction1 Benchmark performance Relative performance2 date Com pany value ($m m ) s hares O/S Increas e % 1 days 5 days 30 days 1 days 5 days 30 days 1 days 5 days 30 days 03/08/18 Hes s Corporation $1,000 6.8 0.5% 4.5% - (0.4%) - - 0.8% - - Mixed market reception, particularly if announcing smaller program Cash on hand from divestitures and FCF viewed as best source of funds by investors Balance sheet capacity somewhat limited today, materially expands in 2019 as leverage declines further Largest potential source of funds in AM units difficult to monetize today Considerations Addresses investor calls for material return of capital Significantly accretive to discretionary cash flow per share at current valuations AR has balance sheet capacity given disciplined capital program and deleveraging steps Increasingly utilized across the E&P sector to address valuation discounts Several potential levers to generate cash at AR to finance Could be combined with simplification announcement to maximize market impact Potential to use cash consideration from AMGP/AM combination for share repurchases Benefits
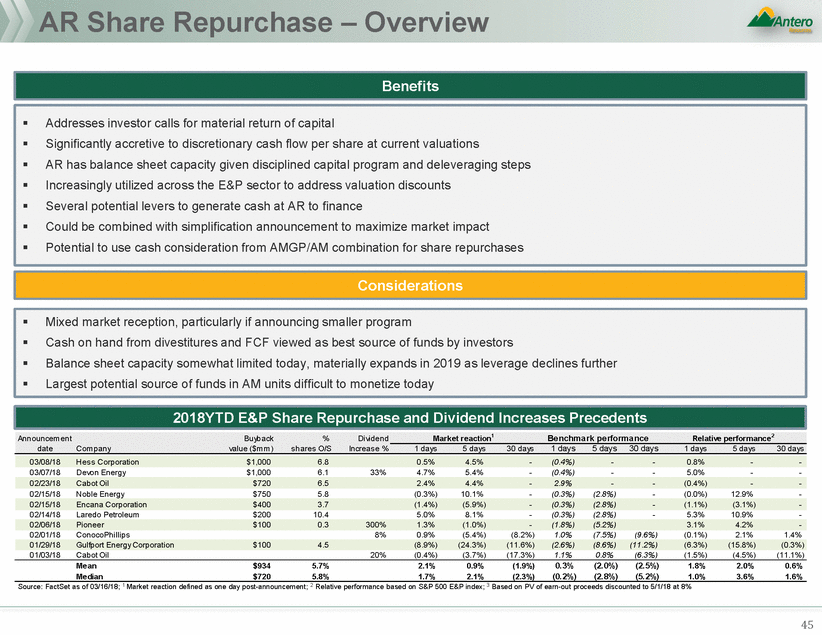
AR Capital Return - Funding Options 46 AR not generating material FCF until 2019 Need to maintain IG ratings trajectory Larger programs (>5% of market cap) more likely to have significant share price impact Friction costs to execute given poor MLP market conditions Limited ability to execute in size (>$350MM) Ongoing AM distributions contribute to FCF at AR Long term value in owning AM units Sequencing / disclosure issues if also pursing simplification transaction Investors typically seeking structured opportunities with preferred or conversion features fePaaturrtneesrship units not preferred inPveasrtnmeersnht isptruncittusrenot prIenfveersretodr idnevesisrtemteonatcsqtruuirceture soInmvewsthoartdilelisqiureidtoMaLcPqpuoirseition soLmikewlyhsaeteilkliqduisidcoMuLnPt tpoocsuitriroennt mLairkkeelyt psreiceek discount to current market price Likely some discount to nominal vnaolmueinoafl vthaelueeaornf tohuet earn out Contributes to FCF profile in 2019 and 2020 AM distributions not true FCF until 2020+ Any sell downs of AM shares would result in decreased AR share repurchase May be more attractive uses of coaf pciataplitatl oathoetrhetirmteims ethsatnhasnhare rsehpaurercrheapsuerchase Benefits AR net leverage projected at 2.1x at year end 2018, allowing for capacity if target hard 2.5x leverage cap Material decrease in net leverage in 2019 down to 1.5x by year end Hedge book, AM units and no near term maturities supportive of balance sheet strength Largest source of potential proceeds ($2.7Bn market value of AM units owned by AR) Most commonly cited by investor as potential funding source Potentially not receiving full value for AM units today in AR share price Minimal impact to pro forma net leverage Large pool of infrastructure capital seeking contracted midstream opportunities Yield and cash flow growth profile should be highly attractive taottirnavcetisvteortso investors Offers ability for investor to acquire large block of units at one time Brings forward potentially ~$2$5201M0MMMofopf rporcoecedesdsAARRisisdudeue to receive in 2019 and 2020 Unlikely receive full value in AR sAhRarsehapreiceprtiocdeatyoday No increase in leverage New financial policy of tying AR sAhRarseharerepurrecphuarscehatoseAtMo AM distributions received by AR Clear identification of on going share repurchase funds Modest impact on pro forma leverage AM distributions growing from $170MM in 2018 to $282MM in 2020 AR Use of AM Distributions AR Water Earn-Out Monetization AR Debt Issuance (Leverage Capacity) AR Sale of AM Secondary Private Secondary to Infra / Pension
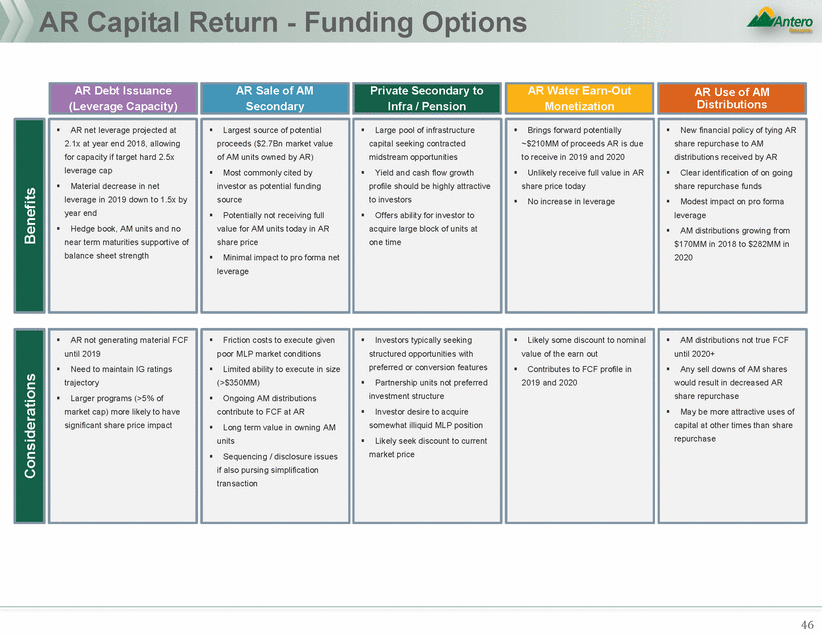
AR Capital Return - Funding Options Cont’d 47 Commits capital, future reductions difficult Unusual for upstream companies under $10Bn “Token” dividend unlikely to alter trading multiple AR loss of upside from AM units Sale of AM units to repurchase AR shares dilutive Reduces future flexibility at AMGP Increases total leverage Another form of debt, on balance sheet Higher cost of capital than RBL Mixed market reaction to past hedge book monetization Most confirm consistency with strategy and communicate with market Reduces drilling inventory and optionality Bearish gas markets won’t support premium value Limited buyer universe for Utica assets Considerations Adds additional complexity Likely higher cost of capital Potentially viewed as debt by rating agencies Demonstrates commitment to returning capital to shareholders Immediate, consistent shareholder return AMGP uses proceeds from public bond issuance to buy AM units from AR as a means to structurally simplify AR from midstream Increases near-term yield of AMGP Near-term cash proceeds AR collateralizes AM units in a margin loan to fund ASR program to demonstrate their commitment to return capital Debt is recourse only to AM units Monetize hedge book (currently 100% hedged for ’18-’19) as a near-term source of cash proceeds Previously pursued, well understood by the market AR sells non-core acreage – likely in Utica Shale – as a near-term source of cash proceeds Likely would not materially impact publicly disclosed capital plan Benefits Issuance of convertible/ preferred security to provide a source of funding Provides ability to kick-start share repurchase without increasing debt or selling AM units AR Asset Sale AR Common Dividend AMGP Bond Issuance AR Margin Loan on AM Units Hedge Book Monetization Issue Alternative AR Security

Water Earn-out
Water Earn-out Executive Summary 49 Key considerations for a potential offer by AR to AM in connection with an early settlement of the earn-out of the fresh water delivery business (“Earn-Out”) Goals for AR may include the following: Maximize the cash proceeds received near term from any settlement Conduct a relatively expedited negotiation process with the AM Special Committee, keeping in mind other likely transactions being considered Enter into a transaction that would be seen as a “win-win” by both AR and AM investors Using Street and Management estimates, reaching the 2019 Earn-Out seems certain and reaching the 2020 Earn-Out seems likely, but less certain For the 2019 Earn-Out, volumes are expected to be 11% above the threshold (184Kbbld Street and 178Kbbld Management vs. 161Kbbld Earn-Out trigger) For the 2020 Earn-Out, volumes are expected to meet the threshold (217Kbbld Street and 200Kbbld Management vs. 200Kbbld Earn-Out trigger) Key topics to consider include: Discount rate applied to the Earn-Out Any risking factor applied to the 2020 Earn-Out Potential value to AM of any of the following: Raising the volume level of the existing MVCs Extending the tenor of the MVC commitments
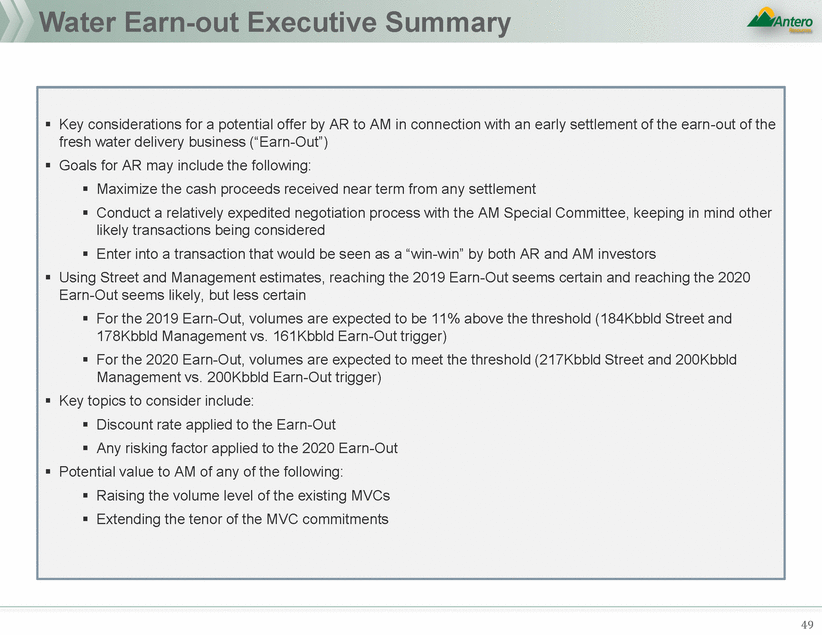
Water Earn-Out Summary Source: Management projections; equity research ¹ As of 5/1/18; ² Assumes 100% risking of 2019 earn-out 50 2020 Earn-out Payment Risking2 Discount Rate 10.0%9.5%9.0%8.5%8.0%7.5%7.0% 100% 95% 90% 85% 80% 75% 70% 65% 60% 55% 50% $204$206$208$210$212$214$216 199201203205207209211 194196198200202204206 189191193195196198200 184186188190191193195 179181183185186188190 174176178179181183185 170171173174176178179 165166168169171173174 160161163164166167169 155156158159161162164 Present Value of Water Payment ($mm)¹ In September 2015, AR dropped down water assets to AM for $1.05bn. The consideration also included an Earn-Out as outlined below: Earn-Outs include a payment at year end 2019 of $125mm and at year end 2020 of $125mm (total potential of $250mm) 2019 year end payment is contingent upon AM delivering 161Kbbld of average volume from 1/1/17 – 12/31/19 2020 year end payment is contingent upon AM delivering 200Kbbld of average volume from 1/1/18 – 12/31/20 Earn-Out payments are binary events Additionally, the transaction included average MVCs by AR to AM of 90Kbbld in 2016, 100Kbbld in 2017, and 120Kbbld in 2018 & 2019 Overview of Water Earn-Out
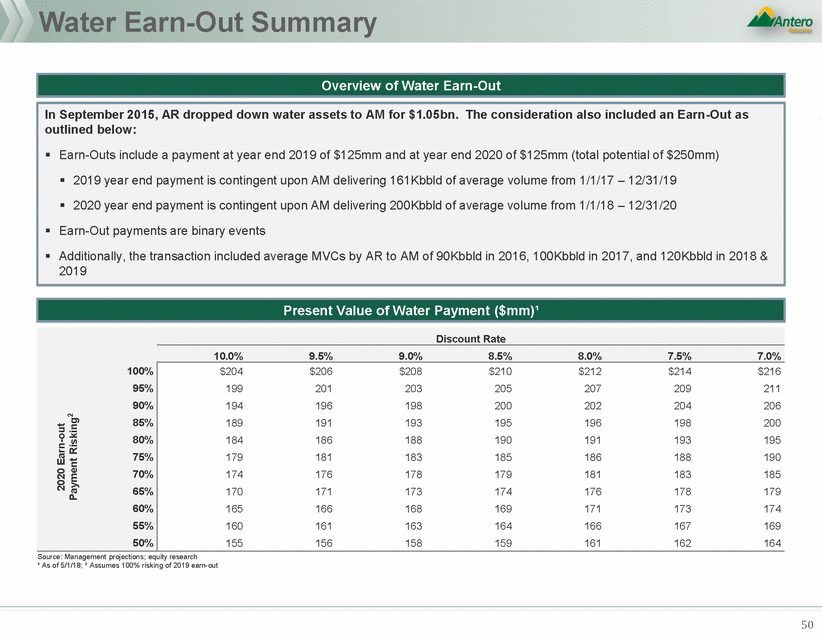
Equity Research Expects AM to Make Both Earn-Out Payments to AR 1 Volume AM 2/14/18 2 Payment AM 1/26/18 3 Payment AR 1/23/18 4 Volume AM 12/6/17 5 Payment AM 11/6/17 Source: Equity research 1 Per water volume projections through 2020; Earn-Out payment not explicitly noted in growth capex; 2 Earn-Out payment not explicitly broken out, however it is noted that payment is expected to be paid: “Of note, based on AR’s current drilling plans AM expects both volume requirements will be met”; 3 Earn-Out payments included in cash flow projections for 2019 and 2020; 4 Earn-Out payments not explicitly broken out, however it is noted that payment is expected to be paid: “Our forecast of 185 wells serviced by the water assets in 2020 would imply that AM will fulfill the requirements for Earn-Out payment to AR”; 5 Earn-Out payments included as acquisition capex in 2019 and 2020 51 BrokerEntityDateAssumes Earn-Out threshold met in 2019 & 2020Based on volume or payment Equity Research Perspectives
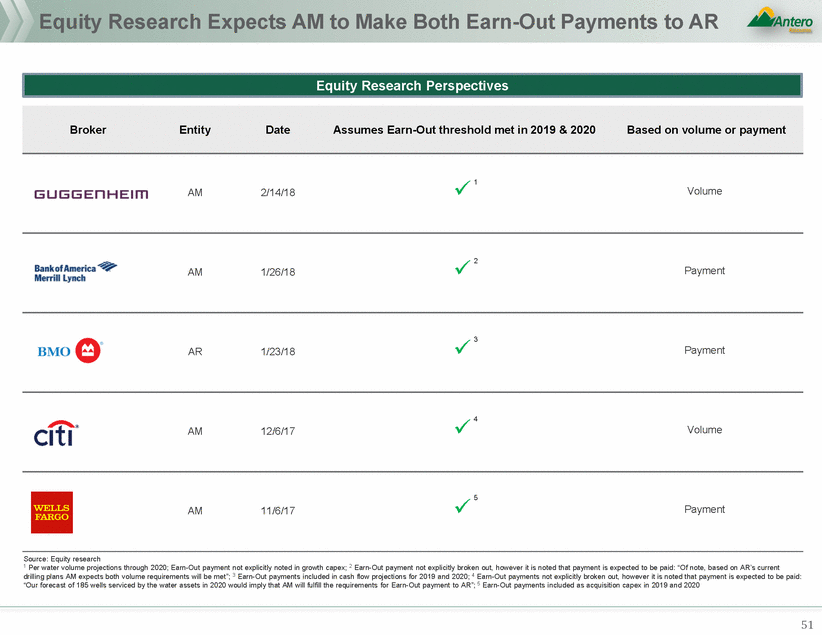
Water volumes: Management and Street estimates 178,425 177,892 Source: Management projections; equity research ¹ 2019 Earn-Out is contingent upon AM delivering 161Kbd of average volume from 1/1/17 – 12/31/19; ² 2020 Earn-Out is contingent upon AM delivering 200Kbd of average volume from 1/1/18 – 12/31/20 52 % above / (below) threshold 11%15%0%9% % above / (below) MVC 53%53%48%56%70%78%NANA ManagementStreet Earn-Out threshold 200,000217,198 161,000200,563 184,601 2019 Earn-Out¹2020 Earn-Out² Average run-rate of 164,936Bbld in 2018 and 2019 required to meet 2019 Earn-Out threshold ManagementStree 120,000 100,000 186,763 t MVC amounts 250,921 120,000 213,910219,541 204,255 153,129 153,129 2017A2018E2019E2020E Projections Compared to Earn-Out (Bbld)¹,² Water Volumes Benchmarking (Bbld)
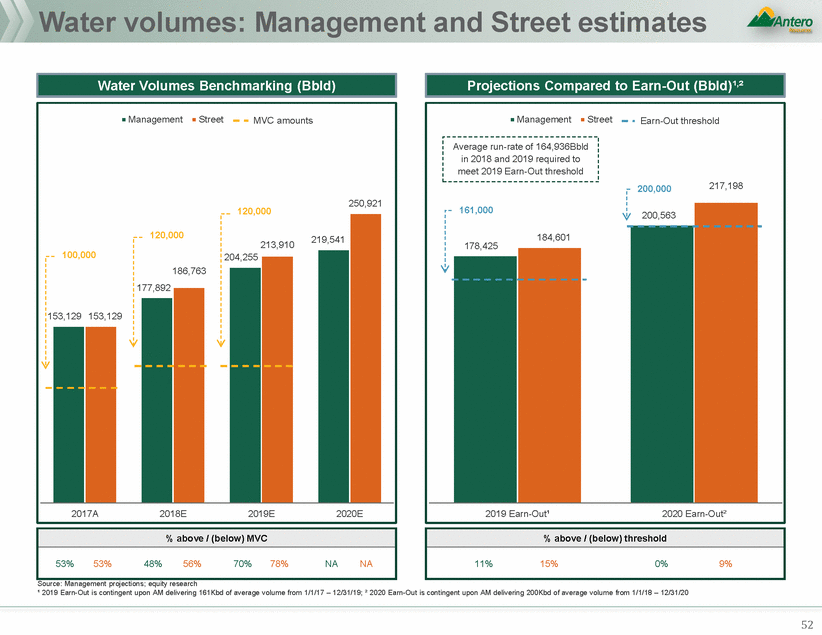
Contribution of Water Business to AM Water delivery volumes (Bbld) 153,129 177,892 204,255 219,541 Minimum volume commitment (Bbld) 100,000 120,000 120,000 --Source: Management projections Note: Revenue per Bbl of $3.71, $3.78, $3.82, $3.87 in 2017, 2018, 2019, 2020, respectively; EBITDA per Bbl of $3.05, $3.19, $3.28, $3.34 in 2017, 2018, 2019, 2020, respectively 53 Total water EBITDAMVC water EBITDA % of total AM EBITDA 32%21%28%19%25%15%22%NA $268 $245 $207 $144 $171 $140 $111 2017A2018E2019E2020E Total water revenueMVC water revenue % of total AM revenue 27%18%27%18%24%14%21%NA $311 $285 $245 $167 $208 $165 $136 2017A2018E2019E2020E EBITDA ($mm) Revenue ($mm) Year end, 2017A2018E2019E2020E Assumptions
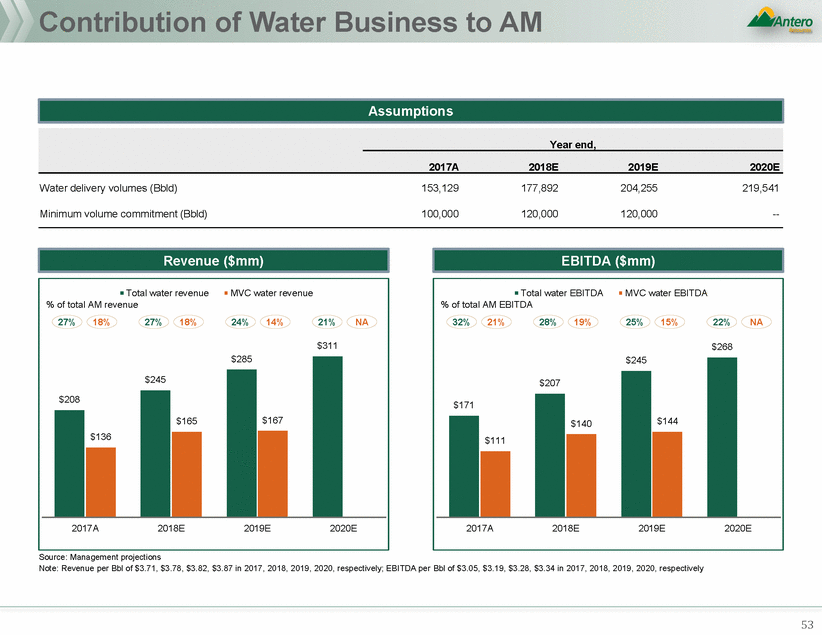
AR Management’s Positioning of Transaction to AM 54 AM is already expected to make both earn out payments Water delivery volumes ultimately controlled by AR Realize immediate discount on the Earn-Out Payments Enhances AM’s MVCs and EBITDA profile Demonstrates continued sponsor support Mitigates overhang pressure on AM units Compelling Transaction for AM Unitholders
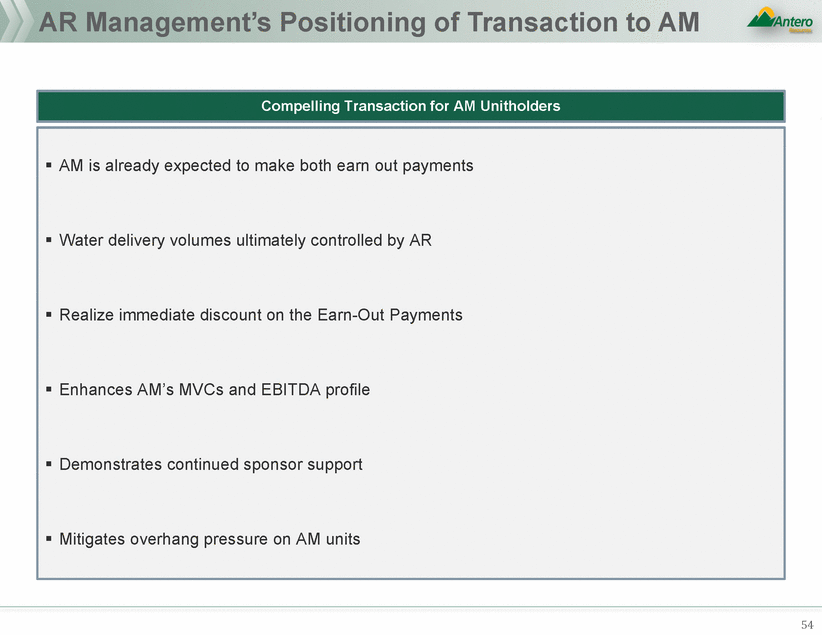
AppendixA: AMGPAcquisition ofAM
Benchmarking1 GP Take of LP Cash Flow % GP Take % GP Take 50% 50% 40% 40% 36% 36% 35% 31% 30% 30% 20% 20% AM1 AM 1 DCP VLP SHLX EQM WES PSXP TEP DCP SHLX VLP WES EQM TEP PSXP % GP Take % GP Take 50% 50% 39% 39% 40% 40% 30% 30% 20% 20% AM 1 AM 1 DCP SHLX VLP WES EQM TEP PSXP DCP SHLX VLP WES TEP EQM PSXP 1 AM metrics per company projections 56 40%40%40%41% 37%37%38% 26% 42%42% 40%41% 38% 27% 2021E GP Take 2020E GP Take 38%39% 36%36% 32%32% 26% 40%40% 38% 37% 26% 2019E GP Take 2018E GP Take
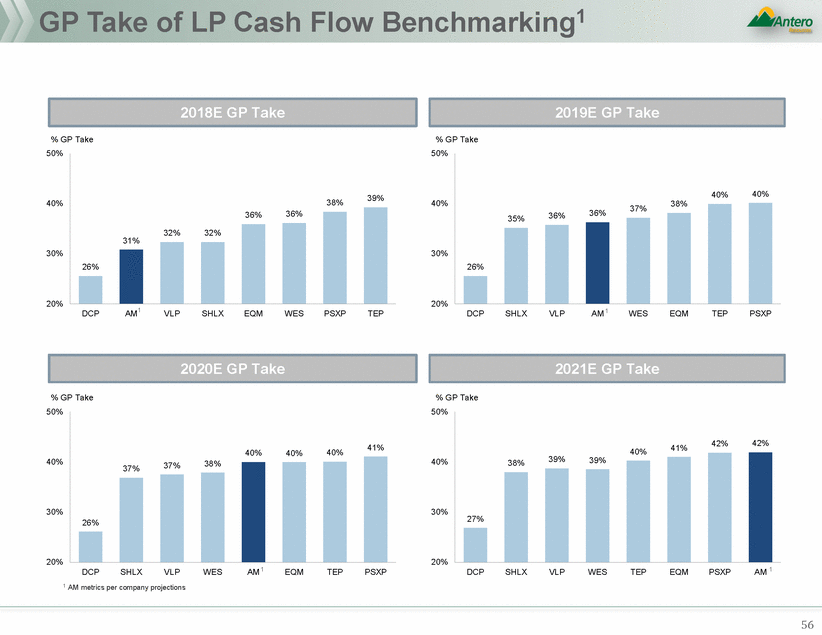
MLP Buy-ins: Typically Occurred at Modest Premium Premia to last close 12% 10% Premia to 30-day 13% 14% cost of • LT financial • No cash investments dropdowns benefit Notes 1. Each of KMP and EPB unitholders received 12% cash consideration 2. Alon USA Partners was a variable rate distribution MLP 57 Targa Resource Partners LP VTTI Energy Partners Year 2014 2015 2015 2016 2016 2017 2017 2017 2017 2017 2018 Cash / equity Equity/Cash1 Equity Equity Equity Cash Cash Equity Cash Cash Equity Equity LP value / NTM DCF 15.4x / 14.6x 11.2x 11.0x 10.1x 20.5x 11.0x 16.0x 13.0x 10.7x 9.1x 6.7x Premium to last close 12% / 15% 17% 18% 0% 11% (9%) 26% 6% 3% 3% 23% Premium to 30-day 10% / 10% 21% 16% 27% 17% 5% 22% 7% 2% 5% 27% GP/IDR take at announce date 46% / 27% 12% 24% 20% ~0% 2% 32% 4% 0% No IDRs 3% Yield spread at announce date (bps) 200 / 300 200 500 500 200 1,300 300 N/A (private GP) N/A (private GP) 800 500 % MLP distribution cut 21% / 27% 8% 32% 45% NM NM 7% NM NM 79% 2 41% Rationale • Significant upfront dividend increase • Enhanced future dividend growth and coverage • Lowers cost of capital • Substantial tax shield for foreseeable future • Improved cost of capital • Distribution growth and stability • Unified corporate strategy • Further reduce cost structure / fixed charges • Improved coverage and credit profile • Simplified structure • Improved cost of capital • Stronger long-term growth outlook • Positive tax • Stronger LT growth outlook • Improved cost of capital and capital markets access • Simplified structure • Improved credit profile • Simplified structure • Improve cost of capital • Increases TCP backlog of droppable assets • Tax savings (step up) due to buy-in of CPPL • Reduces costs and simplifies corporate structure • Significant upfront dividend increase and higher growth rate • Greater capital market access • No near term cash income taxes • Under-performance despite drop-downs and distribution increases • Cost of capital advantage of MLP had dissipated • Simplifies structure • Slower growth at MLP provides opportune time for buy-in • Simplifies structure • Reduce public company costs • Reallocate cash flow to growth • Allows to DKL • Simplifies structure • Improved capital stability income taxes Selected Precedent Transaction Key Statistics MedianMean
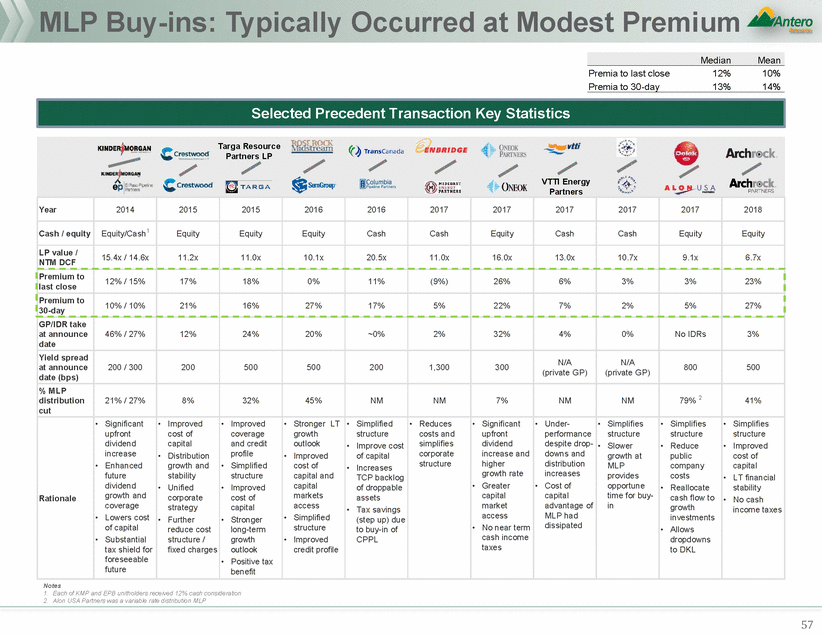
Pro Forma AMGP Tax Detail EBITDA and GP-level SG&A (GAAP) Synergies Interes t expens e $676 2 (76) (214) (371) (261) $925 2 (103) (218) (637) (261) $1,144 2 (118) (336) (458) (261) $1,332 2 (136) (630) (332) (261) $1,548 2 (135) (591) (247) (261) AM unit price ($ / share) $26.49 Illustrative acquisition premium 15.0% 1 New capex Acquisition share price ($ / share) $30.46 Step up in bas is Am ortization of goodwill2 Pre-tax incom e AM diluted shares outstanding (mm) 187.7 ($244) ($291) ($27) ($24) $315 AM Purchase Price $5,717 Debt 1,205 NOL Balance Beginning balance NOL utilization3 NOL realization Ending balance $0 0 244 244 $244 0 291 536 $536 0 27 563 $563 0 24 587 $587 (252) 0 335 Cash (8) Firm Value $6,914 Total basis $2,993 Total incremental step-up value $3,921 Pre-tax incom e NOL utilization / realization Taxable incom e ($244) 244 0 ($291) 291 0 ($27) 27 0 ($24) 24 0 $315 (252) 63 Allocable percentage to goodwill 100% Note: Market Data as of 3/16/18 1 D&A and capital expense, including depreciation associated with water earn-out payments in 2019 and 2020 2 Goodwill amortized straight line over 15 years 3 Utilization of NOLs created after 12/31/17 limited to 80% of pre-tax income per tax reform 58 Cash taxes due$0$0$0$0$16 Total goodwill3,921 ($mm)2018E2019E2020E2021E2022E ($mm)AM Tax Step-Up Analysis Summary Tax Calculation
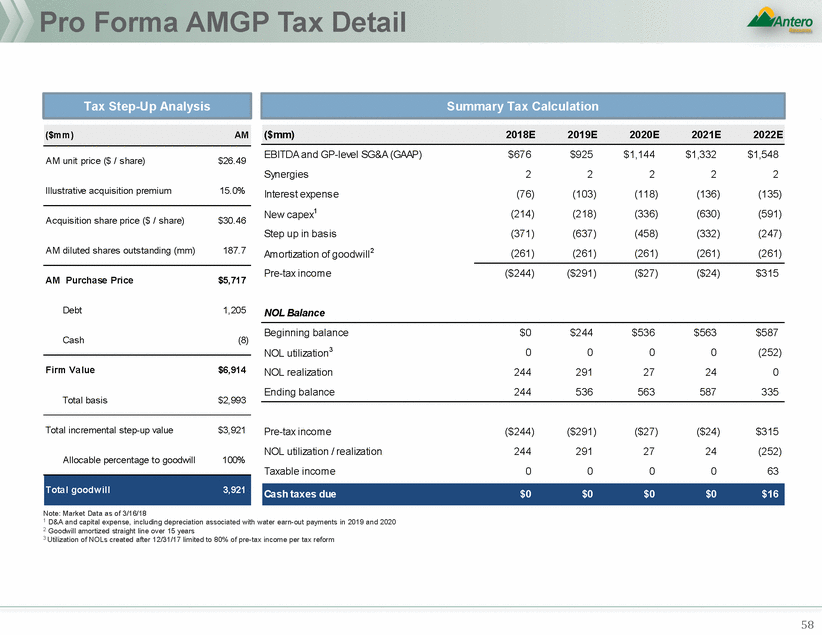
Pro Forma Impact to AR Note: Assumes AMGP purchases 100% of AM public units with 100% equity at a 1.813x exchange ratio (15% illustrative premium); AMGP issues approximately 340mm shares to current AM unitholders 59 E&P EBITDAX $1,604 $1,868 $1,832 $1,967 $2,323 $1,604 $1,868 $1,832 $1,967 $2,323 Midstream distributions to AR 170 219 282 338 405 150 209 290 361 440 EBITDAX including AM distributions to AR $1,774 $2,086 $2,114 $2,305 $2,728 $1,754 $2,077 $2,122 $2,328 $2,763 Exploration expense (9) (10) (11) (12) (14) (9) (10) (11) (12) (14) DD&A (797) (980) (1,171) (1,364) (1,566) (797) (980) (1,171) (1,364) (1,566) Other 0 0 0 0 0 0 0 0 0 0 Interest expense (207) (204) (201) (190) (141) (207) (204) (201) (191) (140) Pre-tax income $761 $893 $731 $738 $1,007 $740 $883 $739 $761 $1,042 Income taxes (148) (169) (112) (100) (150) (144) (167) (113) (103) (156) Net income $613 $724 $618 $638 $857 $597 $716 $625 $658 $886 Discretionary cash flow Net income $613 $724 $618 $638 $857 $597 $716 $625 $658 $886 DD&A 797 980 1,171 1,364 1,566 797 980 1,171 1,364 1,566 Non-cash taxes 148 169 112 100 150 144 167 113 103 156 Discretionary cash flow $1,557 $1,872 $1,901 $2,102 $2,574 $1,537 $1,862 $1,909 $2,125 $2,609 Common shares outstanding 315 315 315 315 315 315 315 315 315 315 Cash flow / debt adj. share $3.52 $4.20 $4.36 $4.82 $6.12 $3.48 $4.17 $4.36 $4.86 $6.21 Cash flow / debt adj. share accretion / (dilution) - % (1%) (1%) 0% 1% 1% y-o-y growth 19% 4% 11% 27% 20% 5% 11% 28% Discretionary cash flow per share $4.94 $5.93 $6.03 $6.66 $8.16 $4.87 $5.90 $6.05 $6.74 $8.27 CFPS accretion / (dilution) - % (1%) (1%) 0% 1% 1% y-o-y growth 20% 2% 11% 22% 21% 3% 11% 23% Net debt $3,694 $3,230 $2,982 $2,760 $2,294 $3,714 $3,260 $3,004 $2,759 $2,259 Leverage 2.1x 1.5x 1.4x 1.2x 0.8x 2.1x 1.6x 1.4x 1.2x 0.8x 2018E2019E2020E2021E2022E 2018E2019E2020E2021E2022E Pro forma Standalone Pro Forma Projections
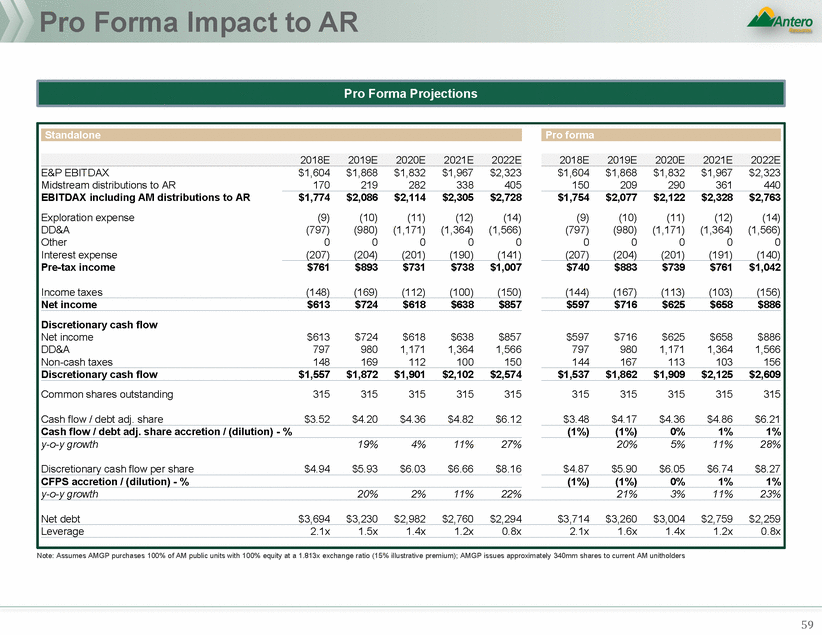
Pro Forma Impact to AMGP Note: Assumes AMGP purchases 100% of AM public units with 100% equity at a 1.813x exchange ratio (15% illustrative premium); AMGP issues approximately 340MM shares to current AM unitholders 60 Total EBITDA 143 236 355 462 589 730 989 1,222 1,413 1,642 Cash interest expense 0 0 0 0 0 (76) (103) (118) (136) (143) Maintenance capex 0 0 0 0 0 (67) (39) (63) (44) (58) Synergies 0 0 0 0 0 2 2 2 2 2 G&A (2) (2) (2) (2) (2) 0 0 0 0 0 Cash taxes (34) (56) (85) (110) (140) 0 0 0 0 (16) Tax Witholding Reimbursement Paid to AR 0 0 0 0 0 (6) (6) (6) (6) (6) Cash flow to Series B (7) (12) (20) (26) (34) 0 0 0 0 0 Cash flow available for dividends $100 $165 $249 $324 $413 $583 $842 $1,037 $1,230 $1,422 Common shares outstanding 186 186 186 186 186 551 551 551 551 551 DCF per share $0.54 $0.89 $1.34 $1.74 $2.22 $1.06 $1.53 $1.88 $2.23 $2.58 DCF per share accretion / (dilution) - % 97% 72% 41% 28% 16% y-o-y growth 65% 51% 30% 28% 44% 23% 19% 16% Coverage ratio 1.00x 1.00x 1.00x 1.00x 1.00x 1.27x 1.31x 1.16x 1.11x 1.05x Distribution per share $0.54 $0.89 $1.34 $1.74 $2.22 $0.83 $1.17 $1.62 $2.01 $2.45 Distribution per share accretion / (dilution) - % 55% 31% 21% 16% 11% y-o-y growth 65% 51% 30% 28% 40% 39% 24% 22% 2018E2019E2020E20212022E 2018E2019E2020E20212022E Pro forma Standalone Pro Forma Projections
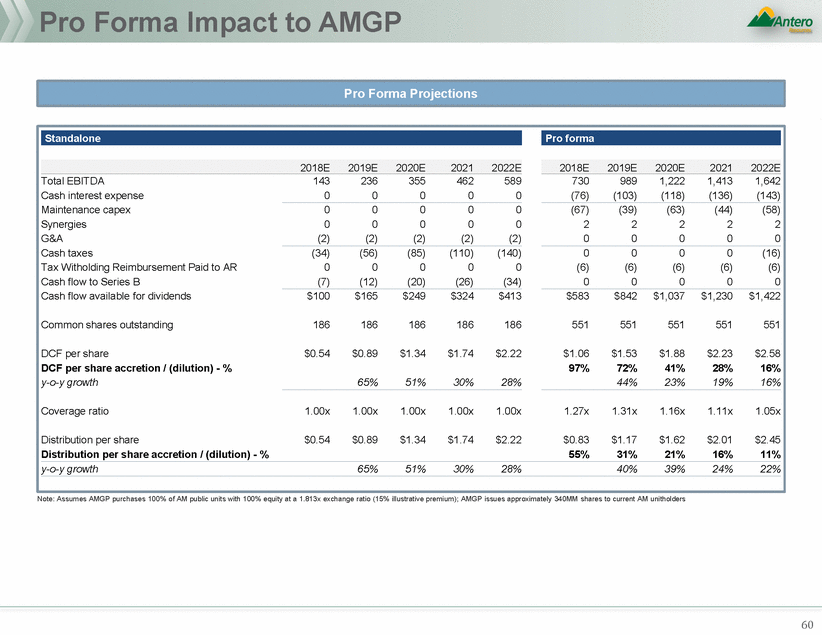
AR Cost of Equity Analysis Risk free rate1 Equity risk premium Levered beta 2.8% 5.25% 1.00 6.25% 1.90 EQT Cabot Oil & Gas Range Resources Southwestern Energy Gulfport Energy $13,354 $11,599 $3,774 $2,651 $1,887 35.6% 11.6% 52.3% 62.6% 52.4% 1.426 1.127 1.927 2.307 1.864 0.988 0.800 1.003 1.021 1.116 1.149 1.166 0.924 0.771 0.844 Source: FactSet, Barra, J.P. Morgan estimates Note: Market data as of 03/16/18 ¹ U.S. 10-year treasury bond yield as of 03/15/18 2 Relevered historical beta is implied based on unlevering historical levered beta for each respective company based on their current capital structure and 5-year historical weighted average tax rate then subsequently relevering based on debt/total cap target of 45.2% and target marginal tax rate of 21.0% 61 Antero Resources$6,55342.5%1.3891.0011.068 Mean42.9%1.7300.9860.971 Median52.3%1.8641.0030.924 MarketDebt/Levered betaRelevered Companycaptotal capBarra Historical historical2 Capital Structure Benchmarks Calculated cost of equity8.1%14.7% Selected cost of equity10.5%12.5% Cost of Equity Summary
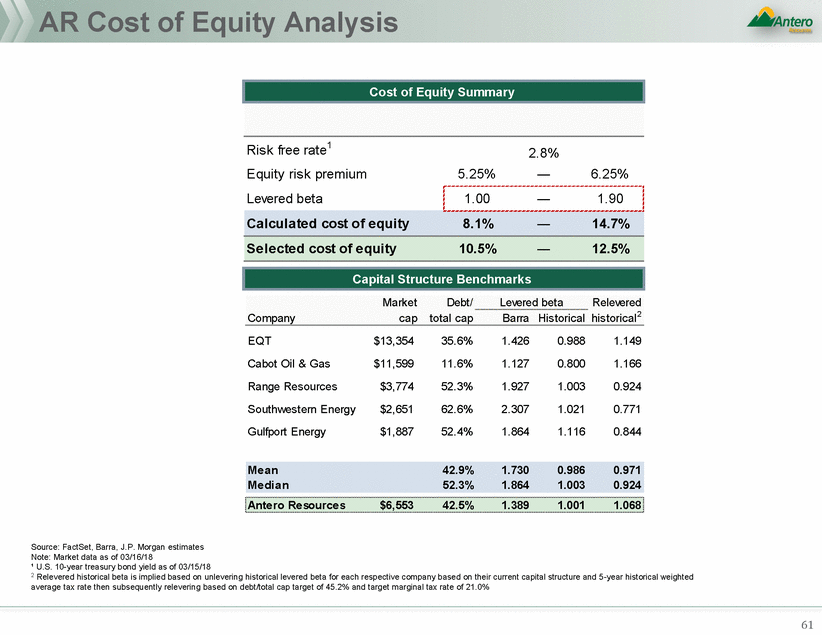
AppendixA: AMAcquisition ofAMGPIDRs
Pro Forma Impact to AR Note: Assumes AM acquires its IDRs from AMGP for $3,590mm (15% illustrative premium to AMGP’s firm value as of 3/16/18) in exchange for 136mm newly-issued AM common units issued to AMGP based on AM’s closing unit price of $26.49 as of 3/16/18. Pro forma for the potential transaction, AMGP receives a pro rata allocation of AM taxable income based on its AM ownership. AM and AMGP pro forma total coverage ratio equal to standalone, respectively. 63 Weighted-average AM units owned 99 99 99 99 99 99 99 99 99 99 AM LP Distribution per unit $1.72 $2.21 $2.85 $3.42 $4.10 $1.44 $2.01 $2.75 $3.42 $4.20 LP distributions to AR $170 $219 $282 $338 $405 $142 $199 $272 $338 $416 E&P EBITDAX $1,604 $1,868 $1,832 $1,967 $2,323 $1,604 $1,868 $1,832 $1,967 $2,323 AM distributions to AR 170 219 282 338 405 142 199 272 338 416 EBITDAX including AM distributions to AR $1,774 $2,086 $2,114 $2,305 $2,728 $1,746 $2,067 $2,104 $2,305 $2,738 Exploration expense (9) (10) (11) (12) (14) (9) (10) (11) (12) (14) DD&A (797) (980) (1,171) (1,364) (1,566) (797) (980) (1,171) (1,364) (1,566) Other 0 0 0 0 0 0 0 0 0 0 Interest expense (207) (204) (201) (190) (141) (207) (204) (201) (191) (142) Pre-tax income $761 $893 $731 $738 $1,007 $733 $872 $721 $737 $1,016 Income taxes (148) (169) (112) (100) (150) (142) (165) (111) (100) (152) Net income $613 $724 $618 $638 $857 $590 $708 $610 $637 $864 Discretionary cash flow Net income $613 $724 $618 $638 $857 $590 $708 $610 $637 $864 DD&A 797 980 1,171 1,364 1,566 797 980 1,171 1,364 1,566 Non-cash taxes 148 169 112 100 150 142 165 111 100 152 Discretionary cash flow $1,557 $1,872 $1,901 $2,102 $2,574 $1,529 $1,852 $1,891 $2,101 $2,582 Common shares outstanding 315 315 315 315 315 315 315 315 315 315 Cash flow / debt adj. share $3.52 $4.20 $4.36 $4.82 $6.12 $3.46 $4.15 $4.32 $4.79 $6.10 Cash flow / debt adj. share accretion / (dilution) - % (2%) (1%) (1%) (1%) (0%) y-o-y growth 19% 4% 11% 27% 20% 4% 11% 28% Discretionary cash flow per share $4.94 $5.93 $6.03 $6.66 $8.16 $4.85 $5.87 $6.00 $6.66 $8.19 CFPS accretion / (dilution) - % (2%) (1%) (1%) (0%) 0% y-o-y growth 20% 2% 11% 22% 21% 2% 11% 23% Net debt $3,694 $3,230 $2,982 $2,760 $2,294 $3,722 $3,278 $3,040 $2,819 $2,344 Leverage 2.1x 1.5x 1.4x 1.2x 0.8x 2.1x 1.6x 1.4x 1.2x 0.9x 2018E2019E2020E2021E2022E 2018E2019E2020E2021E2022E Pro forma Standalone Pro Forma Projections
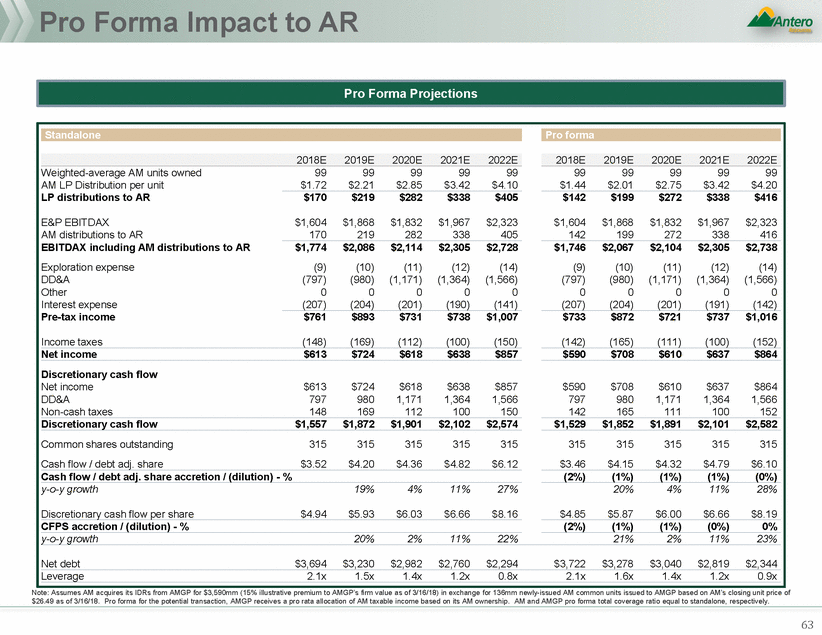
Pro Forma Impact to AM Note: Assumes AM acquires its IDRs from AMGP for $3,590mm (15% illustrative premium to AMGP’s firm value as of 3/16/18) in exchange for 136mm newly-issued AM common units issued to AMGP based on AM’s closing unit price of $26.49 as of 3/16/18. Pro forma for the potential transaction, AMGP receives a pro rata allocation of AM taxable income based on its AM ownership. AM and AMGP pro forma total coverage ratio equal to standalone, respectively. 1 Assumes AMGP Series B units converted; results in additional 4.0mm AM units issued to AMGP 64 EBITDA $730 $989 $1,222 $1,413 $1,642 $730 $989 $1,222 $1,413 $1,642 Tax Witholding Reimbursement Paid to AR (6) (6) (6) (6) (6) (6) (6) (6) (6) (6) Cash interest expense (69) (91) (118) (140) (151) (69) (91) (118) (140) (151) Maintenance capex (67) (39) (63) (44) (58) (67) (39) (63) (44) (58) Synergies 0 0 0 0 0 0 0 0 0 0 Distributable cash flow $588 $852 $1,035 $1,223 $1,427 $588 $852 $1,035 $1,223 $1,427 GP DCF $205 $337 $428 $523 $625 $0 $0 $0 $0 $0 LP DCF 383 515 606 701 803 588 852 1,035 1,223 1,427 Total coverage 1.27x 1.31x 1.16x 1.11x 1.05x 1.27x 1.31x 1.16x 1.11x 1.05x Total distributions $463 $649 $889 $1,102 $1,356 $463 $649 $889 $1,102 $1,356 GP distributions 143 236 355 462 589 0 0 0 0 0 LP distributions 320 414 533 640 767 463 649 889 1,102 1,356 Average LP units outstanding¹ 187 187 187 187 187 322 323 323 323 323 LP DCF / unit $2.04 $2.75 $3.24 $3.74 $4.29 $1.82 $2.64 $3.21 $3.79 $4.42 LP DCF accretion / (dilution) - % (11%) (4%) (1%) 1% 3% y-o-y growth 35% 18% 16% 15% 45% 21% 18% 17% DPU $1.72 $2.21 $2.85 $3.42 $4.10 $1.44 $2.01 $2.75 $3.42 $4.20 DPU accretion / (dilution) - % (16%) (9%) (3%) (0%) 3% y-o-y growth 29% 29% 20% 20% 40% 37% 24% 23% Net debt $1,651 $2,223 $2,733 $2,990 $3,213 $1,651 $2,223 $2,733 $2,990 $3,213 Leverage 2.3x 2.2x 2.2x 2.1x 2.0x 2.3x 2.2x 2.2x 2.1x 2.0x 2018E2019E2020E2021E2022E 2018E2019E2020E2021E2022E Pro forma Standalone Pro Forma Projections
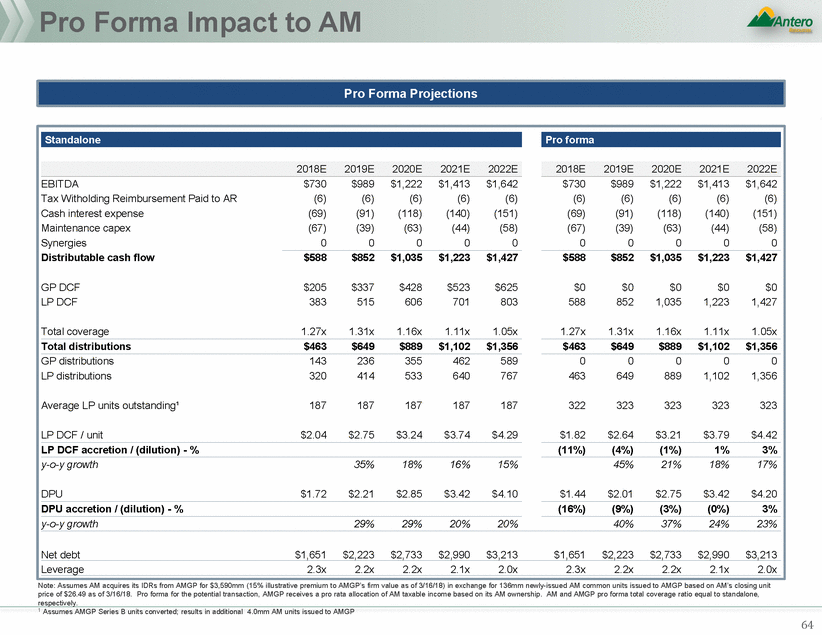
Pro Forma Impact to AMGP Note: Assumes AM acquires its IDRs from AMGP for $3,590mm (15% illustrative premium to AMGP’s firm value as of 3/16/18) in exchange for 136mm newly-issued AM common units issued to AMGP based on AM’s closing unit price of $26.49 as of 3/16/18. Pro forma for the potential transaction, AMGP receives a pro rata allocation of AM taxable income based on its AM ownership. AM and AMGP pro forma total coverage ratio equal to standalone, respectively. 65 AM LP units owned00000136136136136136 AM DPU$1.72$2.21$2.85$3.42$4.10$1.44$2.01$2.75$3.42$4.20 LP distributions to AMGP$0$0$0$0$0$195$273$373$463$570 GP / IDR cash flow from AM$143$236$355$462$589$0$0$0$0$0 Total distributions to AMGP$143$236$355$462$589$195$273$373$463$570 Cash flow to Series B(7)(12)(20)(26)(34)00000 Cash flow to AMGP$136$223$336$436$556$195$273$373$463$570 G&A($2)($2)($2)($2)($2)($2)($2)($2)($2)($2) Interest expense0000000000 Cash taxes(34)(56)(85)(110)(140)(37)(57)(62)(47)(70) Cash consideration utilized to pay cash taxes0000000000 DCF to AMGP$100$165$249$324$413$155$213$309$414$498 Common shares outstanding186186186186186190190190190190 DCF per share$0.54$0.89$1.34$1.74$2.22$0.82$1.12$1.63$2.18$2.62 DCF per share accretion / (dilution) - %52%26%22%25%18% y-o-y growth65%51%30%28%37%45%34%20% Coverage ratio1.00x1.00x1.00x1.00x1.00x1.00x1.00x1.00x1.00x1.00x Distribution per share$0.54$0.89$1.34$1.74$2.22$0.82$1.12$1.63$2.18$2.62 Distribution per share accretion / (dilution) - %52%26%22%25%18% y-o-y growth65%51%30%28%37%45%34%20% 2018E2019E2020E20212022E 2018E2019E2020E20212022E Pro forma Standalone Pro Forma Projections
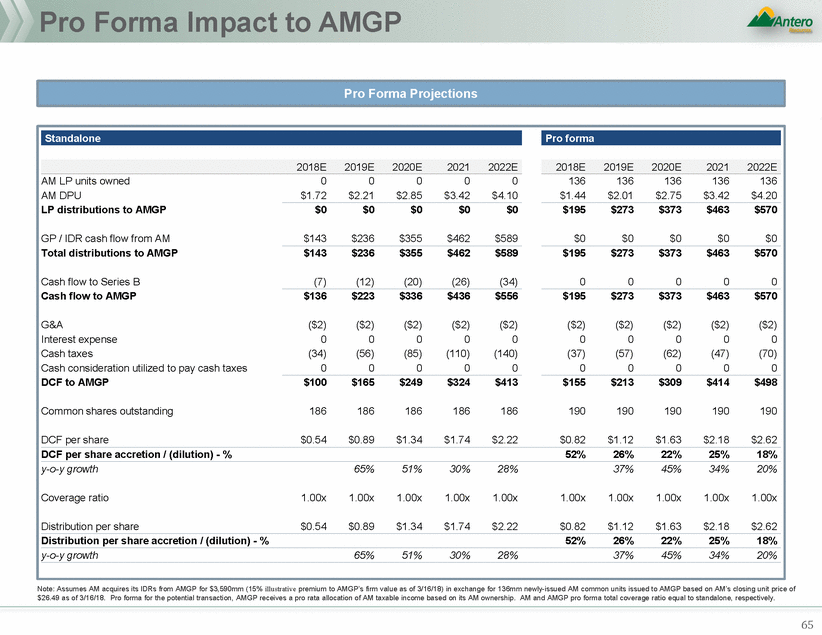
Precedent IDR Buy-In Transactions acquires Source: Equity research, company filings Note: Andeavor Logistics and Andeavor transaction multiples are based on ANDX DCF pro forma for WNRL; ANDX GP growth adjusted to exclude 2017E GP DCF giveback; USAC multiples represent 2018E multiples given no 2017 figures available for proforma entity; 1 Based on 2018-2020E CAGR, adjusted for effect of $8.1bn drop down concurrent with simplification; 2 Estimates for DCF accretion based on company disclosure; in the absence of company disclosure based on equity research commentary; Long-term represents FY3+; 3 Broker estimates pre-announcement of DPU cut 66 Year 2010 2010 2010 2010 2010 2016 2017 2017 2017 2017 2018 2018 2018 Transaction value ($mm) $1,157 $2,092 $9,121 $948 $689 $6,869 $11,173 $3,768 $1,250 $10,067 $140 $7,200 $419 Structure MLP acquires public GP MLP acquires public GP MLP acquires public GP MLP acquires public GP MLP acquires privately held IDRs MLP acquires privately held IDRs MLP acquires privately held IDRs MLP acquires privately held IDRs MLP acquires privately held IDRs MLP acquires publicly held IDRs MLP acquires privately held IDRs MLP acquires privately held IDRs MLP public GP GP value / Curr. Year + 1 DCF 17.7x 21.3x 22.3x 13.8x 18.2x 11.9x 12.9x 11.1x 13.4x 11.5x 13.1x 12.4x 11.1x MLP LP Price / Curr. Year + 1 DCF 13.2x 14.5x 18.5x 12.3x 12.4x 10.1x 12.9x 11.4x 12.1x 11.6x 7.5x 12.1x 8.6x DCF valuation differential 4.4x 6.8x 3.8x 1.5x 5.8x 1.8x 0.1x (0.3x) 1.3x (0.1x) 5.7x 0.4x 2.4x GP value / Curr. Year + 1 distribution 20.0x 20.8x 23.0x 16.3x 29.7x 17.4x 23.2x 11.1x 14.1x 17.7x 35.9x 15.7x 6.8x MLP LP Price / Curr. Year + 1 distribution 14.7x 14.4x 23.7x 12.9x 14.8x 12.2x 16.1x 11.4x 12.4x 14.4x 8.3x 13.6x 7.1x Distribution valuation differential 5.3x 6.4x (0.7x) 3.4x 14.9x 5.2x 7.1x (0.3x) 1.7x 3.4x 27.6x 2.2x (0.3x) Forecast GP DCF growth (Curr. Year + 0 - 2) 14% 25% 11% 25% 34% 12% 11% 25% 12% 8%1 39% 14% 36%3 Forecast LP DCF growth (Curr. Year + 0 - 2) 6% 10% 6% 8% 7% 2% 2% 7% 4% 4%1 5% 5% 10% Timeline until accretion (years) 2 Long-term FY1 Long-term FY2 Long-term Long-term Long-term FY2 Immediate FY2 FY1 FY2 Long-term Precedent Transactions Key Statistics
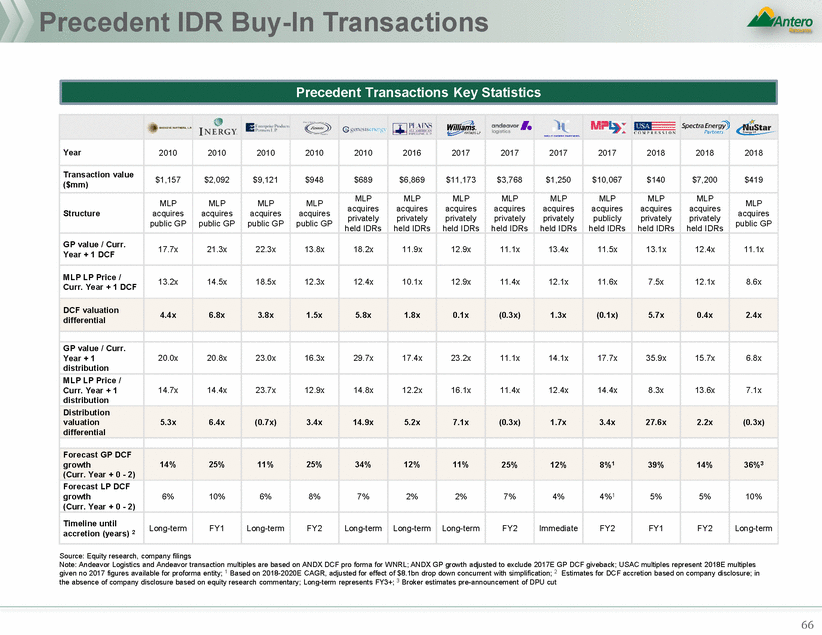
Market Reaction – Precedent IDR Buy-In Analysis public GP MLP acquires privately held IDRs 2 1/22/18 FY2 12.4x 15.7x 7.2 1% 2% 2% (20%) (8%) (13%) (2%) (0%) (7%) 4% MLP acquires privately held IDRs 1%3 3% 3 12/15/17 FY2 11.5x 17.7x 10.1 (5%) 2% (1%) 2% 10% 10% (4%) (8%) 3 14% (0%)3 10/19/17 privately held Immediate 13.4x 14.1x 1.3 0% 0% 0% (3%) 23% (8%) (0%) 5% MLP acquires privately held IDRs 3 3 8/14/17 FY2 11.1x 11.1x 3.8 (1%) 1% (0%) (1%) 10% 0% (1%) 0% (2%) (1%) MLP acquires privately held IDRs 7/11/16 Long-term 11.9x 17.4x 6.9 11% 12% 3% 10% 15% (1%) 8% 9% 10% 16% MLP acquires public GP 9/21/10 FY2 13.8x 16.3x 0.9 (4%) 0% 0% 10% 15% 7% (4%) 0% 4% 8% Long-term 22.3x 23.0x 9.1 (1%) 12% (0%) 9% 24% 7% (1%) 12% 2% 17% public GP MLP acquires public GP 8/9/10 FY1 21.3x 16.3x 2.1 (2%) 2% (1%) (11%) (8%) (1%) (1%) 3% (9%) (7%) Long-term 17.7x 5.3x 1.2 (4%) 18% 1% 8% 32% 12% (5%) 17% (4%) 20% public GP 1 Market reaction based on trading days from unaffected date 2 SEP relative reaction based on peer index that includes TRP, KMI, OKE, ETP, PAA, WMB 3 GP relative reaction based on peer index that includes VLO, PSX, HFC, MPC, ANDV 4 Based on company disclosure; in the absence of company disclosure based on equity research commentary; long-term represents FY3+ 67 6/11/10MLP acquires Mean14.7x$4.2(2%)2%(0%)1%8%1%(2%)2%1%6% Median13.1x$2.1(1%)2%(0%)4%10%2%(1%)0%0%4% 9/7/10MLP acquires MLP acquires 12/28/10privately heldLong-term18.2x29.7x0.73%-1%6%-4%2%-2%-IDRs MLP acquires 1/9/17privately heldLong-term12.9x23.2x11.2(0%)(11%)(2%)4%(12%)4%1%(9%)(1%)(16%) IDRs MLP acquires IDRs MLP acquires 1/16/18privately heldFY113.1x33.3x0.11%1%(1%)4%(7%)(12%)2%2%16%4% IDRs Market reaction1 AnnouncementTimeline until GP value / curr. GP value / curr. Transaction1 day30 day dateCompanyStructureaccretion (years)4 Year + 1 DCFYear + 1 dist. value ($bn)LPGPAMZLPGPAMZ Relative reaction 1 day LPGP 30 day LPGP 2/8/18MLP acquiresLong-term11.1x6.8x$0.7(19%)(18%)(3%)---(16%)(15%)--Precedent IDR Buy-in Analysis
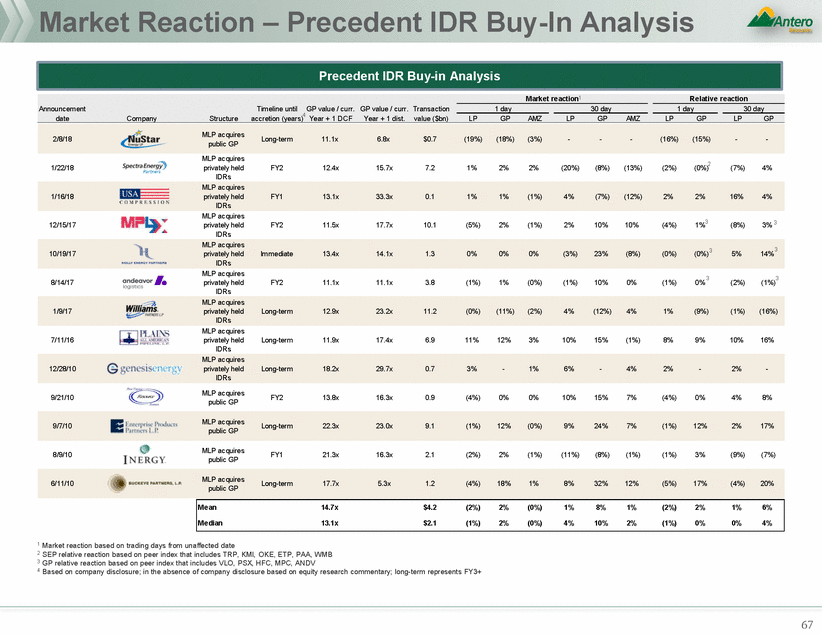
AppendixB: ARShareBuyback Analysis
AR Share Repurchase Analysis Standalone Share repurchase $10.00 $8.00 $6.00 $4.00 $2.00 $0.00 $8.66 Buybacks Total uses 300 300 0 0 $7.05 $300 $300 $0 $0 $4.94 $5.00 AR leverage capacity Water earn outs AR sale of AM units Total sources 300 0 0 300 0 0 0 0 0 0 0 0 2018E 2019E 2020E 2021E 2022E $300 $300 $0 $0 Acc / (dil) 1.3% 4.2% 5.7% 5.8% 6.2% AR Net Debt / LTM EBITDAX (including AM distributions) Net free cash flow ($mm) Standalone ($69) $464 $248 $222 $466 Standalone 2.1x 1.5x 1.4x 1.2x 0.8x Pro forma ($77) $440 $215 $189 $433 Pro forma 2.3x 1.9x 1.7x 1.5x 1.1x Difference ($8) ($25) ($33) ($33) ($33) Standalone Share repurchase $10.00 $8.00 $6.00 $4.00 $2.00 $0.00 $8.70 Buybacks Total uses 450 150 0 0 $7.09 $6.03 $6.41 $6.66 $5.93 $6.27 $450 $150 $0 $0 $4.94 $5.05 AR leverage capacity Water earn outs AR sale of AM units Total sources 240 210 0 150 0 0 0 0 0 0 0 0 2018E 2019E 2020E 2021E 2022E $450 $150 $0 $0 Acc / (dil) 2.3% 5.6% 6.3% 6.5% 6.7% AR Net Debt / LTM EBITDAX (including AM distributions) Net free cash flow ($mm) Standalone ($69) $464 $248 $222 $466 Standalone 2.1x 1.5x 1.4x 1.2x 0.8x Pro forma ($76) $447 $226 $201 $444 Pro forma 2.2x 1.7x 1.6x 1.4x 1.0x Difference ($7) ($17) ($21) ($21) ($21) 1 Based on PV-8.5 of earn-out proceeds discounted to 5/1/18 69 2018E2019E2020E2021E2022E 2018E2019E2020E2021E2022E Sources ($mm) 2018201920202021 $8.16 $600mm repurchase: Water earn-out monetization1 + AR debt issuance Uses ($mm) 2018201920202021 2018E2019E2020E2021E2022E 2018E2019E2020E2021E2022E Sources ($mm) 2018201920202021 $8.16 $5.93 $6.18$6.03 $6.37$6.66 $600mm repurchase: AR debt issuance in 2018 and 2019 Uses ($mm) 2018201920202021 Illustrative AR Share Repurchase Analysis (Discretionary Cash Flow / Share)
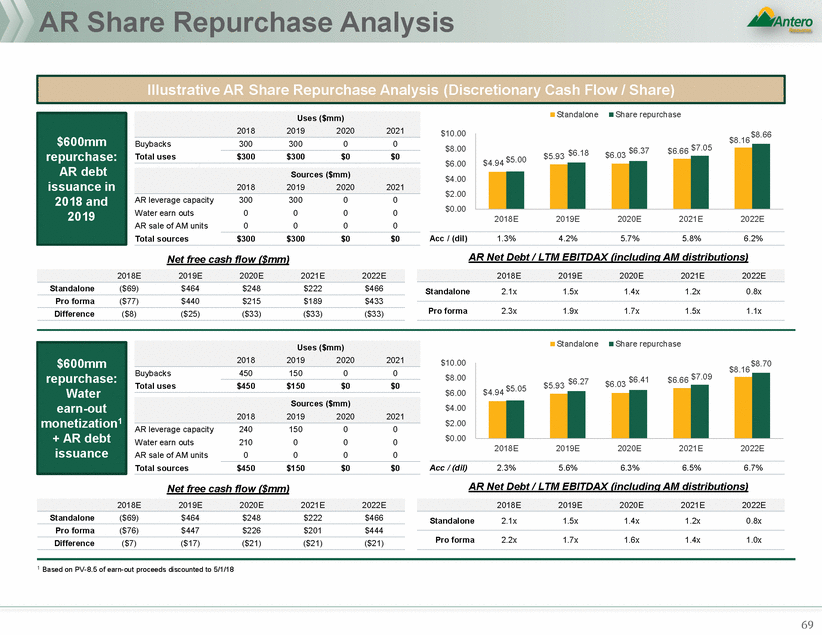
Executive Summary As Antero Resources (“AR”) continues to evaluate a potential simplification transaction between Antero Midstream GP LP (“AMGP”) and Antero Midstream Partners (“AM”), J.P. Morgan has prepared these discussion materials to address the following topics: consideration in a transaction, the metrics as compared to peers leverage (>3.0x Debt / 2018E spreads and rating agency views equity investor views and strategic credit documents including the RP 2 After a multi-month, detailed review of all potential alternatives, J.P. Morgan continues to believe that the currently contemplated transaction between AMGP and AM is the most attractive structural alternative for AR In evaluating potential levels of cash following should be considered: Pro forma AM / AMGP leverage Potential implications of higher EBITDA) at AM / AMGP on credit Implications of higher leverage on financial flexibility Considerations raised by AM’s basket in AM’s bond indenture Transaction results in a best-in-class midstream C-Corp with traditional governance, peerless distribution growth and a self-sustaining balance sheet We would expect the pro forma entity to trade at a significant premium to AMGP’s current share price AR owning pro forma AMGP C-Corp shares vs. AM LP units materially enhances liquidity and monetization ability C-Corp structure provides larger float, trading volume, access to institutional capital, and an improved future source of liquidity for AR Precedent E&P monetizations of midstream LP interests have been mixed and often require a significant discount (e.g., Devon and EnLink) AR improves its position at AM across a range of criteria, including governance, valuation, trading liquidity and ability to monetize Eliminates concerns regarding incentives associated with IDRs and Series B units held by AMGP Places midstream assets in C-Corp structure with traditional governance favored by investors As the largest owner of pro forma AMGP (without IDRs and Series B units), AR can benefit from acquisitions of integrated upstream and midstream assets The transaction also provides an efficient way to raise cash sufficient to reduce leverage and / or execute a prudent share repurchase program at AR The transaction addresses a majority of the key issues raised by AR shareholders Credit and leverage considerations of pro forma AMGP / AM Trading and valuation of pro forma AMGP / AM Benefits to AR of a simplification transaction
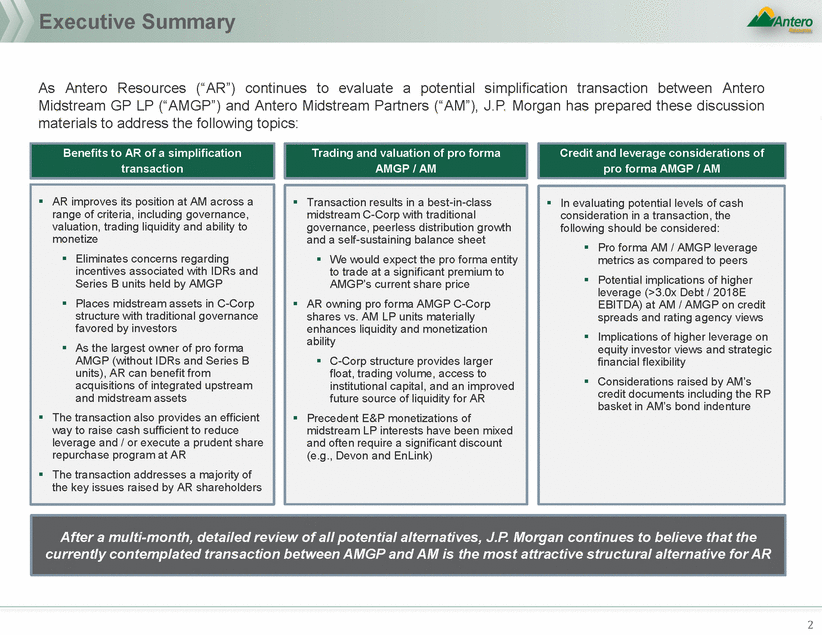
General Benefits of an AMGP / AM Merger to AR 3 A Merger of AMGP and AM Provides More Benefits to AR Than Any Other Proposed Transaction J.P. Morgan believes that an acquisition of AM by AMGP is attractive to AR for the following reasons: Significantly addresses “misalignment” concerns regarding incentives associated with IDRs and Series B units held by AMGP and creates C-Corp structure with traditional governance AR receiving a premium for AM units in part for cash; sales of AM units today would carry a substantial discount C-Corp structure provides larger float, liquidity, access to institutional capital, and an improved future source of liquidity for AR Pro forma AM / AMGP would be a highly-attractive midstream C-Corp with differentiated growth, coverage, leverage and yield profile AM receives up-front premium and accretion to long-term distributions Tax shelter provided by step-up enhances AMGP DCF Analysis indicates AMGP should trade at a significant premium to its current share price AR goes from having limited voting rights at AM to being the largest AMGP stockholder with proportionate voting rights Lowers AM cost of equity capital due to elimination of IDRs and Series B units Generally consistent with expectations of third party commentators Potential for modest cash component facilitates AR share repurchases consistent with recent peer actions and investor preferences
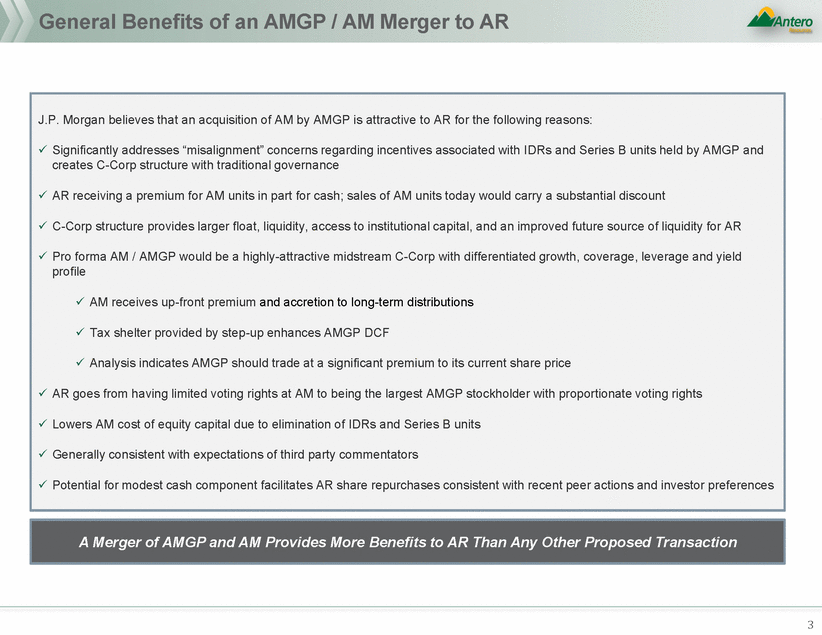
Comparison of AR Standalone and AR Pro Forma Assessment Standalone Pro Forma “Ownership of IDRs and Series B drives decision making” AR owns greater percentage than Management of same midstream security Perceived alignment of Management Largest single shareholder with significant influence and voting power, depending on terms of shareholder agreement Governance / Control of Antero Midstream None; AMGP’s ownership of AM’s General Partner limits AR control Potential of up to ~$360 million (depending on election) None Immediate Cash Infusion to AR AM unitholders to enjoy enhanced liquidity as midstream C-Corp; Pro forma public float is $3.8bn2; midstream C-Corp ADTV1 as a % of public float is typically 1.1% AM current public float is $2.5bn; ADTV1 as a % of public float is 0.7% Trading Liquidity AR has ability to realize premium cash value for AM in transaction; future monetizations may be at lower discounts Valuation of AM to AR in Monetization AR ability to monetize likely at a significant discount Midstream Distributions to AR per annum Pro forma DPU expected to be flat; distributions to AR depends on cash election 2019E distributions of $219 million to AR Removal of IDRs and Series B units permanently lowers Antero Midstream’s cost of capital Burdened by IDRs and Series B units (36% GP / IDR take in 2019) Equity Cost of Capital Ownership of Antero Midstream 53% of AM ~29 – 32% of Pro Forma AMGP Source: FactSet as of 8/2/18 1 90 day average daily traded volume; 2 Based on 1.68x exchange ratio on AM public float 4 J.P. Morgan Proposed Transaction: Key Items for AR’s Consideration
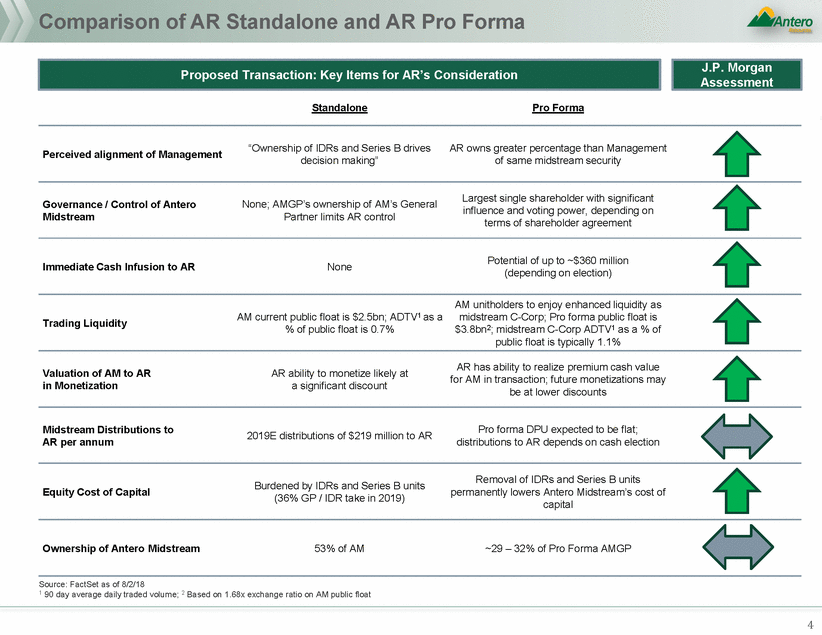
Several Large-Scale Corporate Simplifications Have Announced and Been Well-Received in 2017 / 2018 Since Simplification Announcement1 Top Midstream performers Acquiror Target 14.0% ETE ETP 8.0% WMB WPZ Source: Company filings, FactSet 1 Simplification announcement took place on 2/1/17 and closed on 6/30/17 5 2.3% 2.8% One-Day Price Reactions to Recent Large-Scale Simplification Announcements CEQP CQP 32% 28% OKE 27% NBLX ENBL WPZ DCP GLOP EPD 23% 15% 14% 12% 10% 4% AMZ (14%) Shortly after the 2008 / 2009 financial crisis, a handful of bellwether MLPs underwent similar simplifications (Magellan, Enterprise, etc.), and entered the Shale revolution with a more advantageous and cost-effective structure In recent years, several major MLPs folded into their publicly traded GP C-Corps (KMI, OKE, TRGP), resulting in structural simplification, enhanced corporate governance and greater institutional ownership In an acceleration of the trend, and in recognition of the long-term benefits many of the most reputable MLPs have taken action in 2018 towards some type of corporate simplification ONEOK Has Been a Top 3 Performer Simplification Trend Has Accelerated
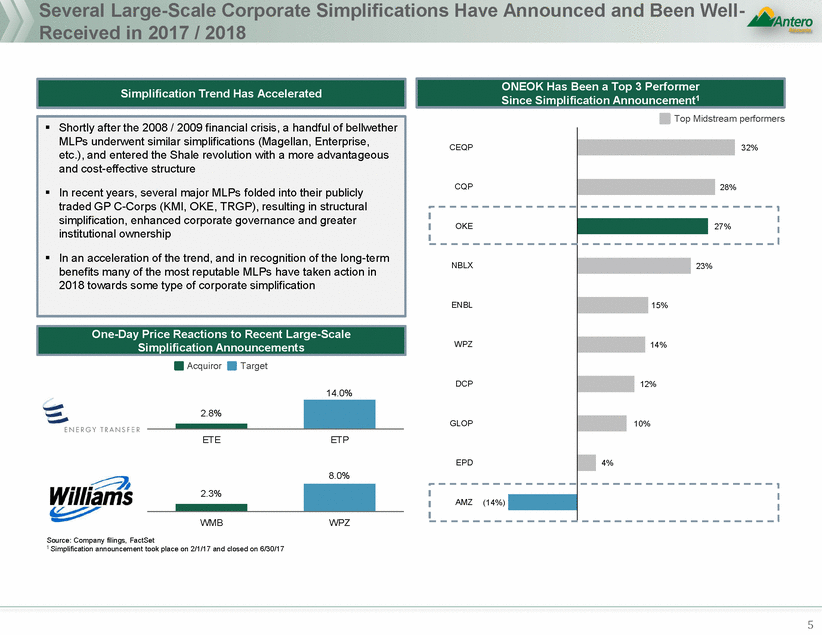
C-Corps Attract More Liquidity Than MLPs Index Investors and Have Meaningfully Higher Trading Average Daily Trading Volume1 1.1% $175 $126 $118 $109 $63 $34 Legally-structured C-Corps Check-the-box C-Corps MLPs KMI OKE post roll-up 2 EPD ONEOK Pre roll-up 3 ETP TRGP MPLX MMP WPZ Growth / Aggressive Growth 74% Growth / Aggressive Growth 64% 706 GARP 14% GARP 7% Other 1% Other 1% Yield 9% Value / Deep Value 1% Yield 13% Value / Deep Value 0% Index 0% Index 15% Source: FactSet as of 8/2/18, equity research Note: Legally-Structured C-Corps: KMI, OKE, SEMG, TRGP, WMB; Check-the-Box C-Corps: AMGP, ENLC, PAGP, TEGP 1 Reflects 30 day ADTV as of 9/30/17 (i.e. as of three months post-closing of OKE / OKS transaction) unless otherwise noted 2 Represents ADTV from 9/30/17 – 12/31/17 3 Represents 30 day ADTV as of 1/31/17 (unaffected date prior to roll-up announcement) 4 Based on conversion date of 5/21/15 6 Index ownership increased to 15% 464 6-months post-conversion4 6-months pre-conversion4 Post-conversion – 12/31/16 Pre-conversion – 3/31/15 Macquarie Infrastructure Corp – LLC to C-Corp Conversion Case Study Change in Investor Base Change in Average Daily Trading Volume (000s) $129 30.6 OKS 87.5 OKE $50$47 0.9% 0.7% ONEOK Simplification Case Study – ADTV as % of Public Float – Current Public Companies
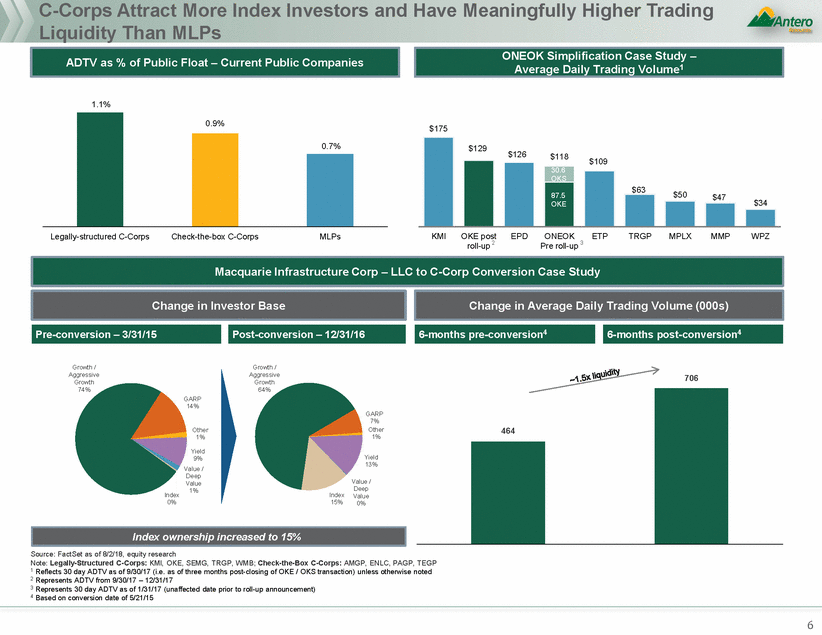
How does pro forma AMGP address issues raised by AR Shareholders? Interest / reduce leverage and / or fund share repurchase at AR 7 Financial flexibility C-Corp structure provides larger float, liquidity and access to institutional capital, improving overall flexibility of AR to monetize units for cash acquisitions As the largest owner of pro forma AMGP (without IDRs and Series B units), AR can benefit from acquisitions of integrated upstream and midstream assets Improve the ability of Antero to take advantage of future dislocations in the markets Leverage profile Accelerate debt reduction Cash portion of AMGP offer provides flexibility to Enhanced liquidity at pro forma AMGP provides greater ability for future AMGP sell-downs to fund debt reduction / share repurchases Future acceleration of water earn out payments would provide an additional capital source for deleveraging and share repurchases if included as part of transaction Implement a material share repurchase program Shareholder return Alignment of Governance Eliminates concerns regarding incentives associated with IDRs and Series B units held by AMGP Places AR as largest shareholder of pro forma AMGP in C-Corp structure Enhanced liquidity allows for more rapid monetization of midstream ownership by PE and Management Eliminate potential conflicts of interest resulting from the current corporate structure Transaction benefits AR Shareholders’ position
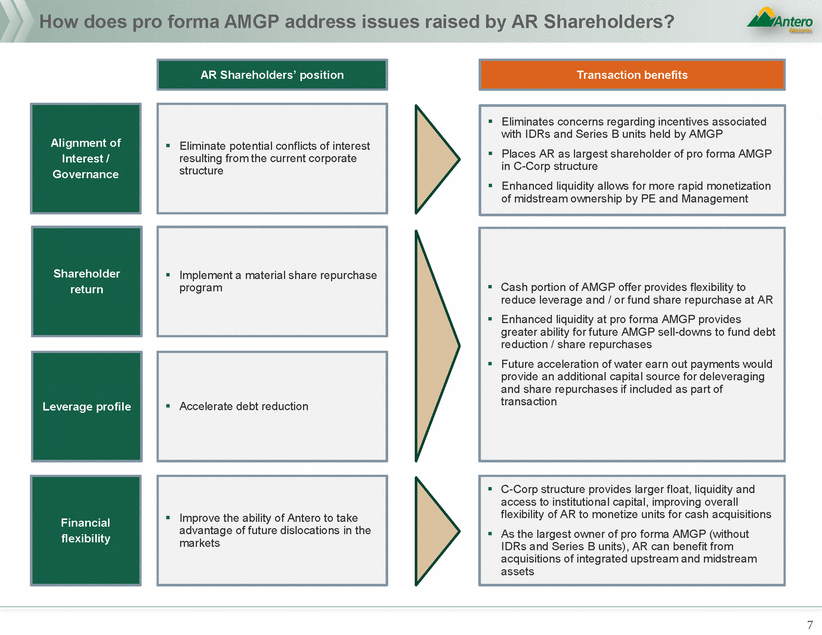
ProFormaTrading&Valuation
Pro Forma AMGP Will Provide a Differentiated Growth, Leverage and Valuation Proposition to Potential Investors 2018E – 2020E EBITDA Growth 2018E – 2020E DPU Growth 2018E – 2020E DCF Growth 38% 38% 29% 29% AMGP PF Midstream C-Corps E&P Sponsored MLPs AMGP PF Midstream C-Corps E&P Sponsored MLPs AMGP PF Midstream C-Corps E&P Sponsored MLPs¹ Note: Assumes AMGP acquires AM for 1.68x exchange ratio plus $1.92 in cash per unit; Assumes current AMGP share price of $19.04 as of 8/2/18 in calculating metrics 1 Represents LP DCF growth rather than total DCF growth 9 16% 15% 5% 14%14% Transaction places midstream assets in best-in-class C-Corp structure with traditional governance favored by investors Pro forma AMGP would have DCF, EBITDA and cash distribution growth vastly superior to its new corporate peers, thereby suggesting strong support for AMGP above its current trading level Pro forma AMGP would offer a conservative capital return and balance sheet posture with distribution coverage and balance sheet leverage superior to its corporate peers Ultimately, pro forma AMGP’s superior growth and balance sheet will imply upside to the share price, to the benefit of AR Summary
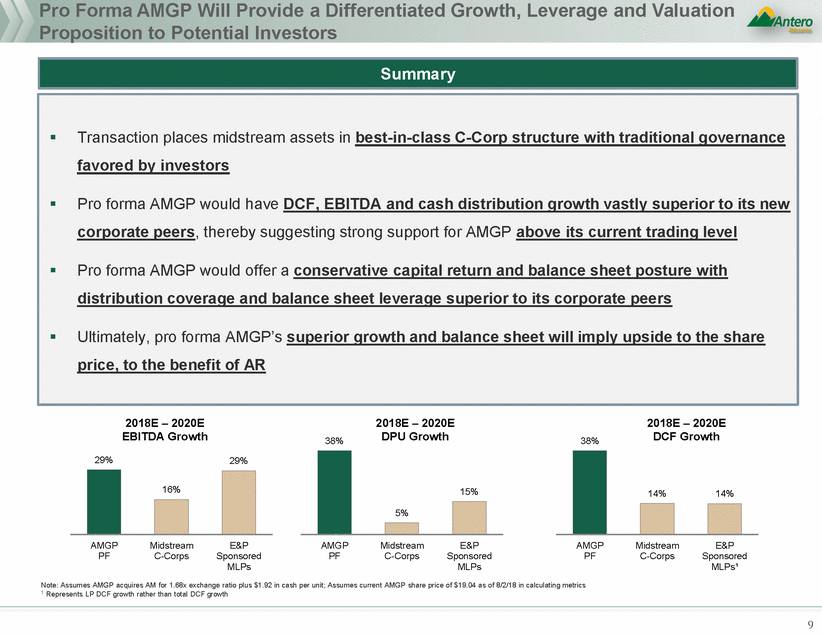
AMGP Pro Forma Valuation Considerations 2019E Total coverage Net debt / 2018E EBITDA 90-day ADTV % 2019E Yield 2019E FV / EBITDA 2019E EV / DCF 15.6x 12.2x 1.1% 11.7x 11.2x 1.2x 1.2x 1.2x 3.5x 8% 7% AMGP PF Midstream E&P AMGP PF Midstream E&P AMGP Midstream E&P AMGP PF Midstream E&P AMGP PF Midstream E&P AMGP Midstream E&P PF C-Corps Sponsored MLPs C-Corps Sponsored MLPs C-Corps Sponsored MLPs PF C-Corps Sponsored MLPs C-Corps Sponsored MLPs C-Corps Sponsored MLPs Net debt / 2019E EBITDA 2020E EV / DCF 13.1x 2020E Total coverage Public float ($bn) $25 2020E Yield 2020E FV / EBITDA 11.0x 1.3x 1.2x 9% 8% 3.2x 2.7x AMGP PF Midstream E&P AMGP PF Midstream E&P AMGP Midstream E&P AMGP PF Midstream E&P AMGP PF Midstream E&P AMGP PF Midstream E&P PF C-Corps Sponsored MLPs C-Corps Sponsored MLPs C-Corps Sponsored MLPs C-Corps Sponsored MLPs C-Corps Sponsored MLPs C-Corps Sponsored MLPs Source: FactSet as of 8/2/18; Midstream C-Corps include: OKE, TRGP,WMB; E&P Sponsored MLPs include: WES, EQM, NBLX, CNXM, HESM Note: Assumes AMGP acquires AM for 1.68x exchange ratio plus $1.92 in cash per unit; Assumes current AMGP share price of $19.04 as of 8/2/18 in calculating metrics 10 1.8x 6% 1.1x 9.1x 8.7x $4 $2 10.0x 10.9x 5% 2.8x 2.5x 0.7% 0.5% 12.3x 11.2x Despite materially higher DCF growth, AMGP PF trades at significantly lower cash flow multiples with 100 - 300bps of potential yield improvement Every 100bps improvement in 2019E yield would represent a $3.25 increase in share price, or a ~18% improvement to AMGP’s current price Peer Trading Statistics ($mm except where otherwise noted)
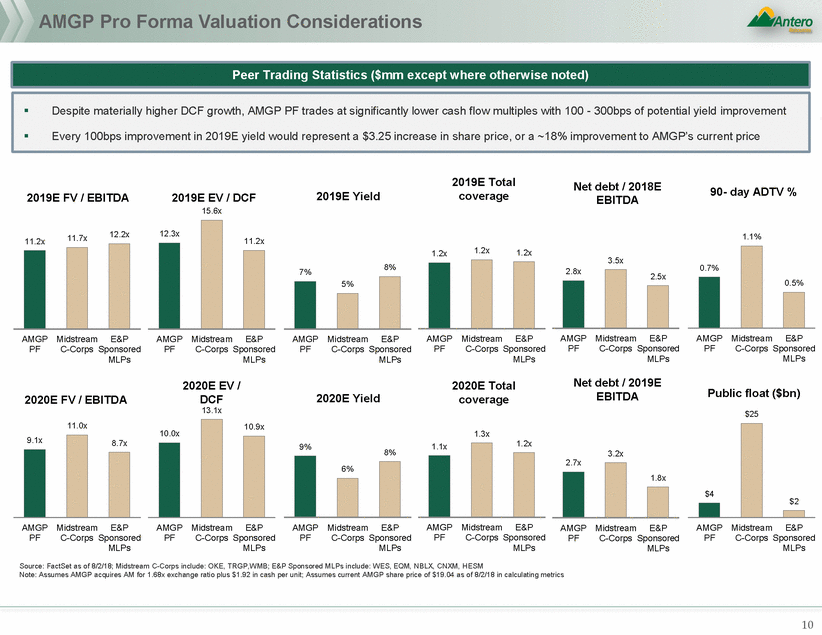
In Both Secondary Offerings and Sales of a Full Stake, Parent Companies Realize a Significant Discount to the Market Value of Their MLP Ownership Size % File/ All-in Offer/ Offer/ Pricing date Issuer Deal type ($mm) Mkt cap xADTV Offer discount 1-Day Current Selling shareholder 06/26/18 CNX Midstream Partners LP CMPO $137 11.7% 68.0x (11.9%) (13.3%) 2.7% 10.5% Noble Energy 06/12/18 USA Compression Partners LP Block 81 5.2 24.0 (9.9) (11.0) 0.3 2.3 Riverstone 09/06/17 Antero Midstream Partners LP Block 315 5.4 26.3 (6.4) (7.4) (0.7) 7.8 Antero Resources 01/30/17 Summit Midstream Partners LP Block 96 5.5 21.5 (8.2) (9.5) (0.2) (27.9) Energy Capital Partners 09/09/16 GasLog Pts LP Block 46 10.9 18.4 (4.6) (6.3) 0.1 28.5 Directors of the Company 06/13/16 Western Gas Equity Pts LP Block 481 5.7 77.8 (7.8) (8.8) (3.6) (5.5) Anadarko Petroleum 03/24/16 Antero Midstream Pts LP Block 179 4.5 17.5 (10.3) (10.9) (2.9) 51.3 Antero Resources 06/04/15 Western Gas Equity Pts Fully Marketed 134 1.1 31.6 (8.3) (11.1) - (37.5) Anadarko Petroleum 06/04/15 04/09/15 Western Gas Memorial Production Pts TEU Block 460 77 5.5 5.3 110.1 5.8 n/a (4.4) n/a (6.0) - 0.1 (37.5) n/a Anadarko Petroleum NGP ENLC share price as of 6/5/18 ENLK unit price as of 6/5/18 DVN ownership (shares / units in mm) ENLC ENLK DVN ownership ($mm) ENLC ENLK Total equity value attributable to Devon Global Infrastructure Partners purchase price ($mm) $17.80 $17.77 115.5 94.7 2,056 1,682 $3,738 $3,125 Source: Dealogic and FactSet as of 8/2/18, company filings 11 Implied discount to market value(16.4%) Implied discount to 30-day VWAPs(8.0%) In June 2018, Devon Energy sold its entire stake in the EnLink Midstream complex, comprised of ~115 million shares in EnLink Midstream LLC (“ENLC”) and ~95 million units in EnLink Midstream Partners LP (“ENLK”) for $3.1bn to Global Infrastructure Partners (“GIP”) Sale represented a 16.4% discount to then current market value and a discount of 8.0% to ENLC/ENLK’s respective 30 day volume weighted average prices Devon Energy Divestiture of its Stake in EnLink Midstream Total$2,006 Mean$2016.1%40.1x(8.0%)(9.4%)(0.4%)(0.9%) Median$1355.4%25.2x(8.2%)(9.5%)-2.3% Selected Recent Secondary MLP Follow-Ons
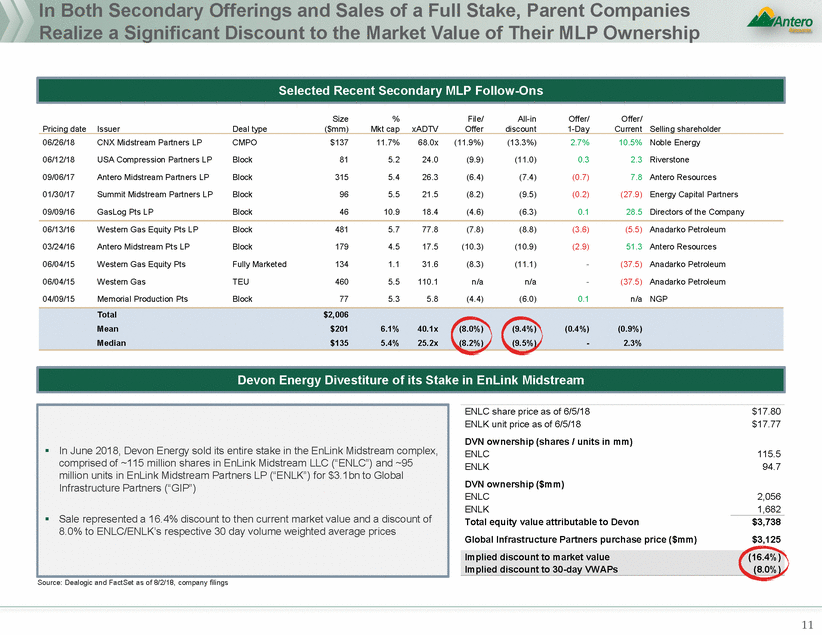
ProFormaLeverage&Credit Considerations
Review of AMGP / AM Peer Leverage Levels 3.5x 3.4x 3.2x 2.5x 2.3x 2.3x (0.4x) Standalone AM OKE WES TRGP EQM CNXM NBLX HESM Amount ($mm) Issue Ratings Current as of 8/2/18 Implied Tenor Issuer Issue type Coupon Issue Date Maturity Price YTW YTW date Nustar Logistics Sr Nts 5.625% 550 Apr-17 Apr-27 Ba2 / BB 98.13 5.90% Apr-27 8.7 Enlink Midstream Partners Sr Nts 4.850% 500 Jul-16 Jul-26 Ba1 / BB+ 95.88 5.50% Jul-26 7.9 Antero Midstream Partners Sr Nts 5.375% 650 Sep-16 Sep-24 B1 / BB+ 100.75 5.17% Sep-22 4.1 Western Gas Partners Sr Nts 4.650% 500 Jun-16 Jul-26 Ba1 / BBB-99.37 4.75% Jul-26 7.9 Source: FactSet and Bloomberg as of 8/2/18; Note: Antero metrics represent company projections 13 JPMorgan Global HY6.70% EQT Midstream PartnersSr Nts4.125%500Nov-16Dec-26Ba1 / BBB-93.165.15%Dec-268.3 Hess Infrastructure Partners LPSr Nts5.625%800Nov-17Feb-26Ba3 / BB+100.635.49%Feb-245.5 Summit Midstream PartnersSr Nts5.500%300Jul-14Aug-22B1 / BB-99.255.71%Aug-224.0 CNX Midstream Partners LPSr Nts6.500%400Mar-18Mar-26B3 / BB-99.006.67%Mar-267.6 Current Debt Trading Levels 2.8x 2018E Net Debt / EBITDA
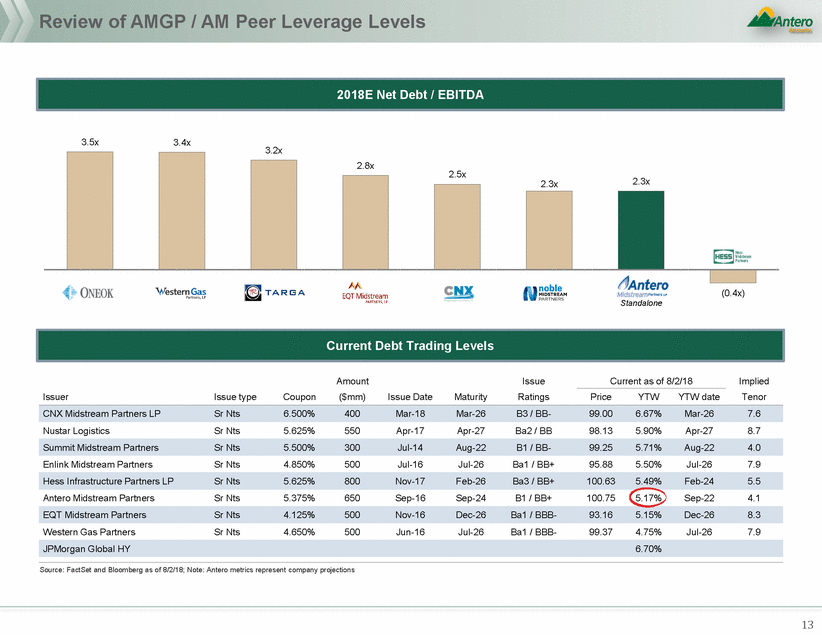
AM / AMGP Standalone vs. Pro Forma Leverage Analysis considerations issuances, including upcoming term out of AM fund new growth capex and/or external M&A 2018E 2019E 3.3x 3.1x AM standalone 1.65x ex ratio, no cash 1.68x ex ratio, $1.92 cash per unit 1.71x ex ratio, $3.84 cash per unit Source: Antero management projections 14 2.8x2.7x 2.3x2.2x2.3x2.4x Net Debt / LTM EBITDA Pro forma leverage of >3.0x raises the following Higher credit spreads – as much as 100bps – for new revolver Negative reaction from equity investors who viewed AMGP / AM’s balance sheet as differentiating Reduced financial flexibility including the ability to J.P. Morgan believes that leverage levels of up to 3.0x should not pose a risk to the ratings Leverage levels near 4.0x or greater would clearly cause a downgrade of both Ba2 and BB+ ratings A leverage level from 3.0 – 4.0x is in the “grey zone” and ratings will fundamentally depend on the financial policy articulated to the rating agencies and the deleveraging in the business plan Financial and Strategic Considerations Rating Agency Considerations
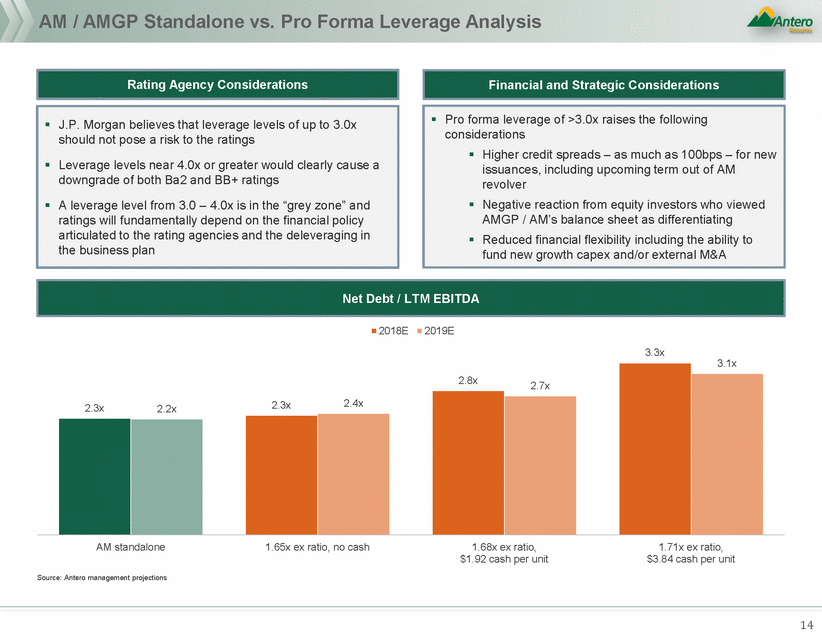
Credit Considerations of Transaction a Sizeable Cash Component in a Potential AMGP / AM 15 AM’s credit agreement does not allow for any restricted payments outside of regular distributions to unitholders Any cash consideration as part of a simplification transaction will require AM to seek a 50.1% amendment from RCF lenders to allow for the restricted payment Given current drawing under the RCF, AM has been contemplating exercising the incremental with the credit facility and increasing commitments from $1.5bn to $2.0bn in conjunction with any simplification The RCF lenders are all private side bank relationship lenders who have seen the AM’s projections over time and also heard their communicated financial policy The increased leverage profile of AMGP PF could make the execution of the amendment and the $500mm upsize more challenging Ramifications for Credit Facility AM trading levels could be negatively impacted as a result of incremental leverage and investor surprise with the Company’s breach of its financial policy and the flexibility of the existing indenture Antero currently estimates their restricted payment capacity in AM’s high yield indenture to be ~$700 - $750 million Restricted payment calculations are notoriously challenging for investors to calculate without direct input from the Company Meaningful usage of AM’s large restricted payment capacity will likely be surprising to investors as most high yield issuers, particularly public companies, rarely push the envelope of their restricted payment capacity Additionally, MLPs rarely make any meaningful restricted payments outside of their regular distribution to unitholders While impossible to perfectly predict, J.P. Morgan believes that with the contemplated amount of cash consideration, AM’s existing high yield notes could trade off by ~100bps and expect a similar impact to any near-term new issues rates used to term out revolving credit facility borrowings Ramifications for High Yield J.P. Morgan understands that the cash consideration of any AMGP / AM transaction will be structured to avoid requiring AM bondholder consent Since its inaugural bond offering, AM has communicated a financial policy to bondholders of leverage between 2.0x – 2.5x, with the potential to flex up to ~3.0x in conjunction with accretive acquisitions With a cash component at / near $700 million, AMGP pro forma leverage will exceed 3.0x, a departure from AM’s corporate policy Both Antero and Antero Midstream have been able to achieve best in class pricing in the high yield market over time and are now considered a “darling” of the high yield space with a trajectory to investment grade The current AM high yield trading levels of $100.75 / 5.17% reflect not only AM’s credit profile but also the trust that AR and AM management have built with investors through years of delivering strong financial and operational results Overview
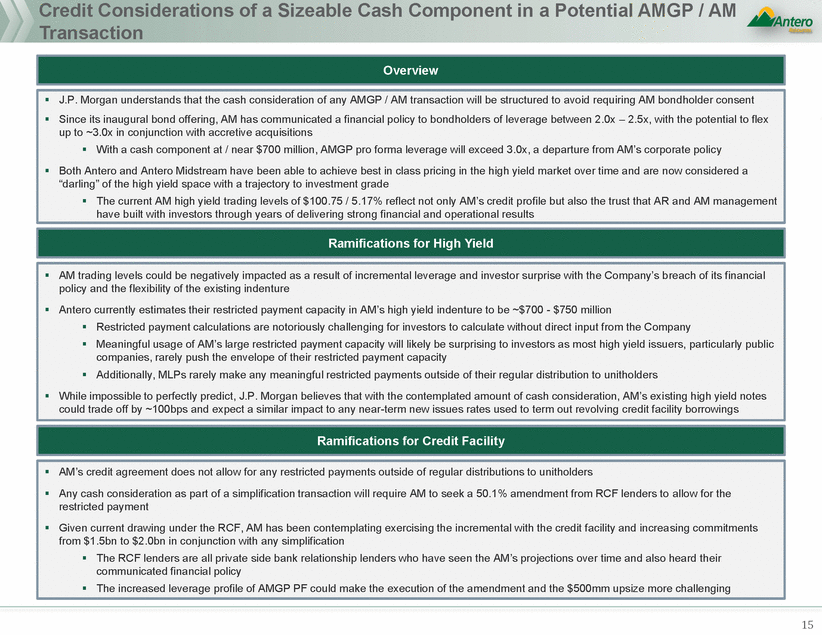
Conclusion
Summary Takeaways 17 A Merger of AMGP and AM Provides More Benefits to AR Than Any Other Proposed Transaction Based on its detailed analysis of the potential structural alternatives previously reviewed with the AR Special Committee and the Board, Antero management and its advisors continue to believe that an acquisition of AM by AMGP is the most attractive structural alternative for AR’s shareholders Financially viable to equity holders of AR, AMGP and AM Best addresses AR shareholder concerns regarding mis-alignment of incentives Pro forma AM / AMGP would be highly-attractive midstream C-Corp with differentiated growth, coverage, leverage and yield profile AM receives up-front premium and accretion to long-term distributions Tax shelter provided by step-up enhances AMGP DCF Analysis indicates AMGP should hold value and even improve C-Corp structure provides larger float, liquidity, access to institutional capital, and an improved future source of liquidity for AR as exampled by ONEOK and Macquarie Infrastructure At pro forma leverage of 3.0x or lower, there is little risk of a credit downgrade at AMGP pro forma
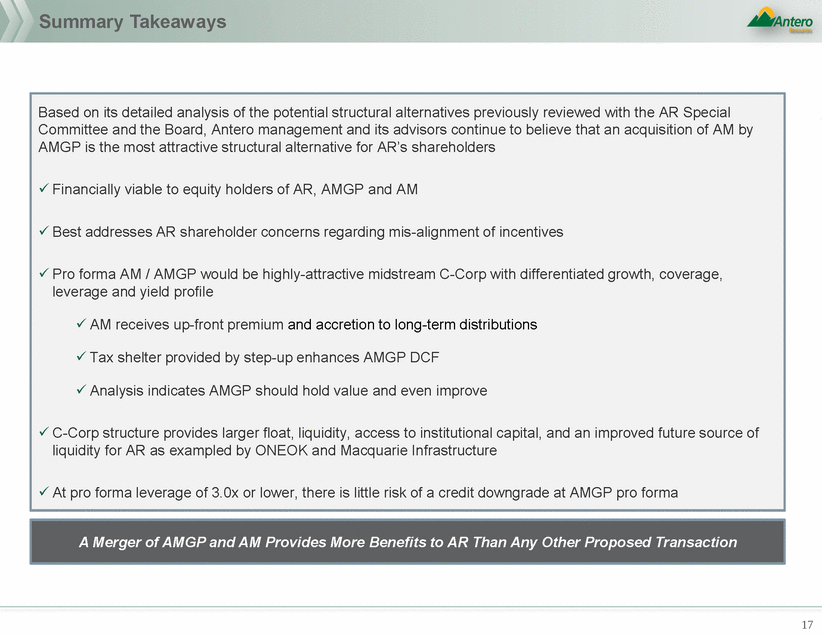
Appendix
The Antero Family has Modestly Outperformed Peers as Market Waits for an Anticipated Simplification Announcement AR price performance has been in line with industry but 6% above peers since SailingStone filed 13D Peers continue to pursue midstream simplification / separation (EQT and GPOR) and announce share repurchase programs (EQT and COG) Living within cash flow and focus on shareholder returns remain core themes in the upstream industry AR (5%) 0% (1%) (10%) Peers (11%) 2% 3% (7%) S&P E&P 4% 16% 6% 1% AM has outperformed its peers by of 12% since SailingStone filed 13D (7% versus AMZ) IDR and Series B elimination and governance simplification remain core themes in the midstream space AM 2% 28% 24% 12% Peers (10%) 3% 4% 4% AMZ (5%) 8% 9% 8% AM outperformance is driven in part by expectation of a potential AMGP offer to AM at a premium AMGP performance in line with industry and peers AMGP’s performance relative to AM possibly driven by investor expectations for proposed transaction AMGP (14%) (1%) 9% 2% Peers (15%) (0%) 3% 1% AMZ (5%) 8% 9% 8% Source: FactSet as of 8/2/18 AR Peers: COG, EQT, GPOR, RRC, SWN, CNX; AM Peers: CNXM, EQM, HESM, NBLX, WES; AMGP Peers: ENLC, EQGP, TEGP, WGP Note: SailingStone filed 13D during market trading on 1/29/18, unaffected date of 1/26/18 used; Antero released its press release announcing the formation of Special Committees before market open on 2/26/18, unaffected date of 2/23/18 used 19 Performance since 1/29/182/26/183 months1 month AMGP Price performance YTD Performance since 1/29/182/26/183 months1 month AMGP / AM Commentary AM Price performance YTD Performance since 1/29/182/26/183 months1 month AR Commentary AR Price performance YTD SailingStone 13D (1/29/18)Special Committee Formation (2/26/18)
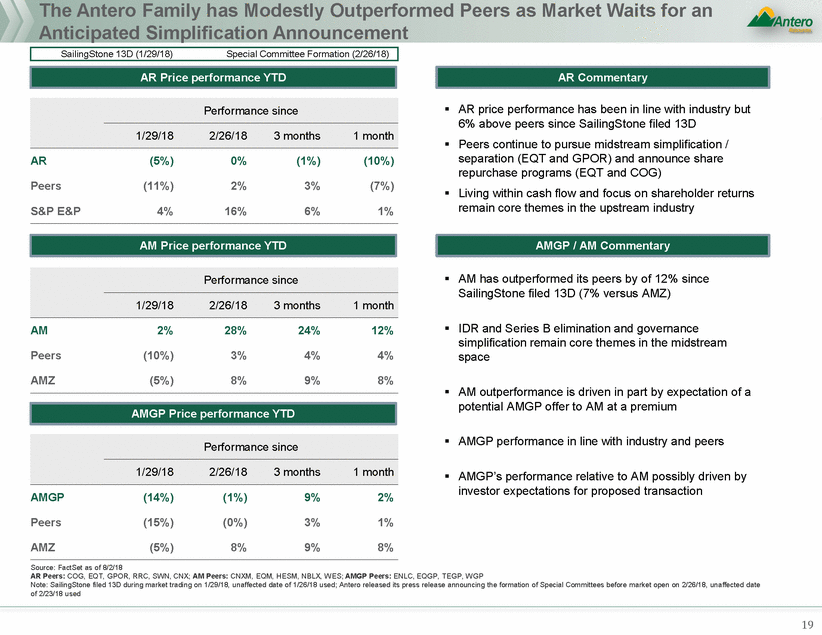
Wall Street Perspectives “We view a consolidation of the midstream complex as the most likely outcome of this review” “the combined midstream asset base could see a significant rerate with NAV of inventory blowdown >$12.5B vs. current combined equity value of ~$8.5B.” “Though two scenarios are explored, relative valuation gap between AM and AMGP leaves a GP buy-in of the LP as the more probable outcome.” - TPH - TPH - TPH “We believe that the focus remains on the potential merger of Antero Midstream GP and conversion from an MLP structure to a corporation. We would view a simplified proforma entity favourably.” “[Post-transaction, the pro-forma entity] would retain a far and away best in class dividend / share growth outlook with conservative coverage and a very conservative leverage ratio for the foreseeable future.” “we see AM+AMGP potentially trading at 11.4x 2019e EBITDA, a level we believe could be quite attractive relative to an estimated 2019-2021 EBITDA CAGR of 22%.” - TD Securities - Raymond James - Morgan Stanley 20 Pro forma Valuation Midstream Simplification
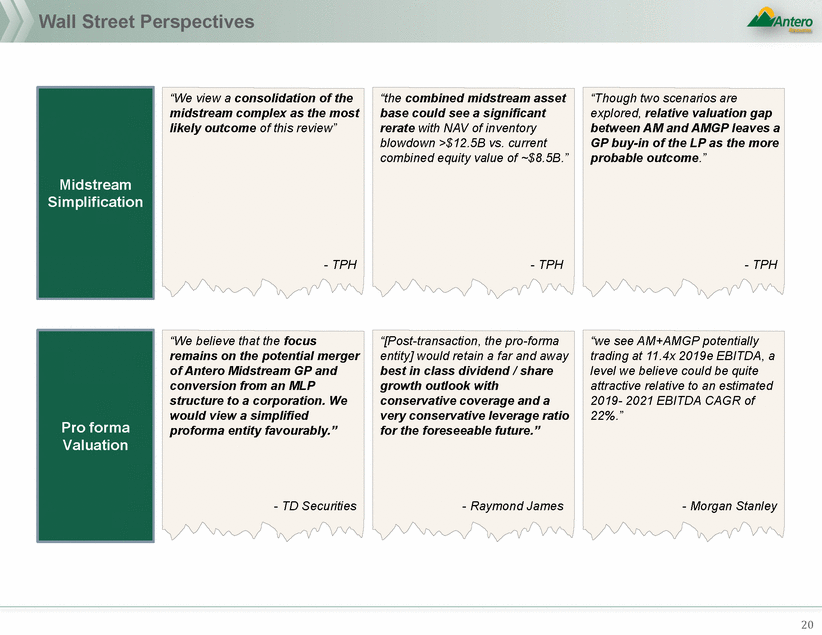
ETE / ETP simplification case study ETE Peers¹ Index² affirms ETP at Baa3, negative outlook (8/2/18) “This simplification transaction, which, with the projected elimination of ETE's Incentive Distribution Rights (IDRs), will relieve ETP of the growing IDR burden on its cost of capital, while enabling it to retain a significantly greater amount of cash flow with which to fund its future growth. The combined entities' extremely large and diversified midstream asset base, generating largely fee-based cash flows should enable the company to manage its financial leverage to a modestly lower level while sustaining high levels of distribution coverage” 2.8% 2.7% 2.7% 2.3% 1 day 2 day ETP Peers³ Index² 14.0% 13.6% 1.2% 1 day 2 day “From the perspective of the consolidated credit profile, the acquisition of ETP in an all equity transaction will reduce structural complexity, enhance corporate transparency, and further grow scale and business segment diversity. The combined entity will have strong distribution coverage metrics and the corresponding ability to internally fund a meaningful portion of its growth capital expenditures. This will result in less reliance on equity capital markets to fund growth expenditures while correspondingly providing for sounder liquidity.” Standalone Pro forma AMGP pro forma4 2019E DCF 2019E DPU Coverage DPU growth (2019-2021 CAGR) $1.46 $1.22 1.20x 6.7% $2.05 $1.22 1.68x 6.7% 1.54 1.32 1.17x 24.4% 2019E LP DCF/unit 2019E DPU 2019E LP coverage DPU growth (2019-2021 CAGR) $2.85 $2.26 1.26x 2.6% $2.63 $1.56 1.68x 6.7% 4 2019E GP take of distributions 37.4% - Source: FactSet as of 8/1/18, broker research, investor presentation, press release 1 ETE peers include WGP, EQGP, AMGP, ENLC; 2 Alerian MLP Index; 3 ETP peers include ENB, TRP, WPZ, EPD, KMI, PAA; 4 Assumes AMGP acquires AM at 1.68x exchange ratio + $1.92 in cash consideration per AM unit 21 ETP ETE Pro forma metrics 0.8%2.3% 2.7% ETP 0.0% 0.5% ETE Select ratings agency commentary Market reaction
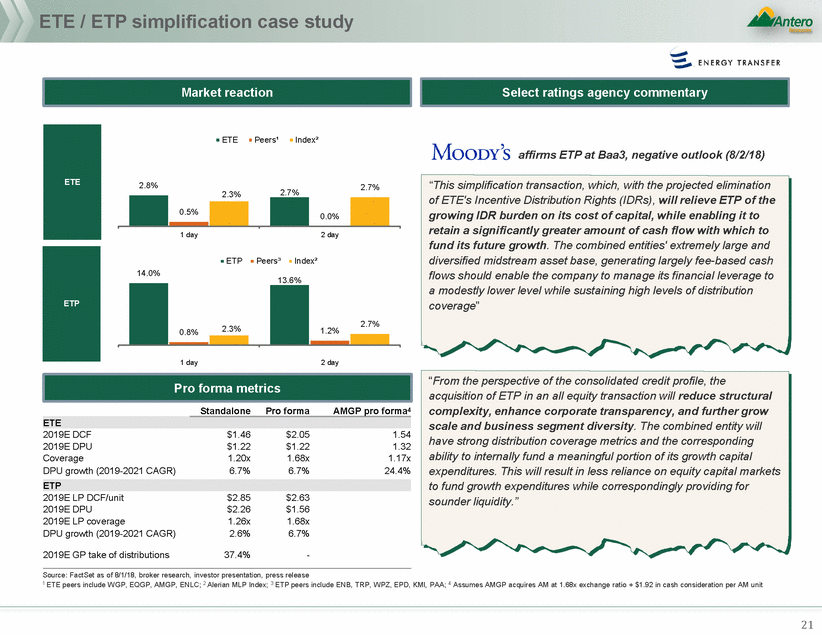
Serious News for Serious Traders! Try StreetInsider.com Premium Free!
You May Also Be Interested In
- Morgan Stanley Upgrades Antero Resources (AR) to Overweight
- Net Asset Value(s)
- Himax Joins Forces with E Ink to Revolutionize Smart Retail with Premier of WiseEye™ AI at 2024 Touch Taiwan
Create E-mail Alert Related Categories
SEC FilingsSign up for StreetInsider Free!
Receive full access to all new and archived articles, unlimited portfolio tracking, e-mail alerts, custom newswires and RSS feeds - and more!


 Tweet
Tweet Share
Share