

Form N-CSRS WILLIAMSBURG INVESTMENT For: Sep 30
 Tweet
Tweet Share
Share| OMB APPROVAL | |
|
OMB Number: 3235-0570
Expires: July 31, 2022
Estimated average burden hours per response: 20.6 |
UNITED STATES
SECURITIES AND EXCHANGE COMMISSION
Washington, D.C. 20549
FORM N-CSR
CERTIFIED SHAREHOLDER REPORT OF REGISTERED
MANAGEMENT INVESTMENT COMPANIES
| Investment Company Act file number | 811-05685 |
| Williamsburg Investment Trust |
| (Exact name of registrant as specified in charter) |
| 225 Pictoria Drive, Suite 450 Cincinnati, Ohio | 45246 |
| (Address of principal executive offices) | (Zip code) |
John Chilton, Esq.
| Sullivan & Worcester LLP 1666 K Street, NW Washington, D.C. 20006 |
| (Name and address of agent for service) |
| Registrant's telephone number, including area code: | (513) 587-3400 |
| Date of fiscal year end: | March 31 | |
| Date of reporting period: | September 30, 2020 |
Form N-CSR is to be used by management investment companies to file reports with the Commission not later than 10 days after the transmission to stockholders of any report that is required to be transmitted to stockholders under Rule 30e-1 under the Investment Company Act of 1940 (17 CFR 270.30e-1). The Commission may use the information provided on Form N-CSR in its regulatory, disclosure review, inspection, and policymaking roles.
A registrant is required to disclose the information specified by Form N-CSR, and the Commission will make this information public. A registrant is not required to respond to the collection of information contained in Form N-CSR unless the Form displays a currently valid Office of Management and Budget ("OMB") control number. Please direct comments concerning the accuracy of the information collection burden estimate and any suggestions for reducing the burden to the Secretary, Securities and Exchange Commission, 450 Fifth Street, NW, Washington, DC 20549-0609. The OMB has reviewed this collection of information under the clearance requirements of 44 U.S.C. § 3507.
Item 1. Reports to Stockholders.
SEMI-ANNUAL REPORT
September 30, 2020
(Unaudited)
Beginning on January 1, 2021, as permitted by regulations adopted by the U.S. Securities and Exchange Commission, paper copies of the Funds’ shareholder reports like this one will no longer be sent by mail, unless you specifically request paper copies of the reports from the Funds or from your financial intermediary, such as a broker-dealer or bank. Instead, the reports will be made available on a website, and you will be notified by mail each time a report is posted and provided with a website link to access the report.
If you have already elected to receive shareholder reports electronically, you will not be affected by this change and you need not take any action. You may elect to receive shareholder reports and other communications from the Funds electronically by contacting the Funds at 1-800-281-3217 or, if you own these shares through a financial intermediary, by contacting your financial intermediary.
You may elect to receive all future reports in paper free of charge. You can inform the Funds that you wish to continue receiving paper copies of your shareholder reports by contacting the Funds at 1-800-281-3217. If you own shares through a financial intermediary, you may contact your financial intermediary or follow instructions included with this document to elect to continue to receive paper copies of your shareholder reports. Your election to receive reports in paper will apply to all Funds held with the Fund complex or at your financial intermediary.
THE DAVENPORT FUNDS |
October 23, 2020 |
Dear Shareholders,
Equity markets continued their strong positive performance off the March lows in the third quarter. Despite a modest selloff in September, the S&P 500® Index gained 8.93% for the third quarter ended September 30, 2020. Combined with Q2’s 20.54% gain, it was the best two-quarter stretch for large-cap stocks since 2009, when markets were recovering from the financial crisis. Small caps’ gains were less robust, with a 4.93% rise in the Russell 2000® Index during Q3. Year-to-date, the S&P 500 is up 5.57% through the end of the third quarter, and the Russell 2000 is down 8.69%.
Most of the strong index returns have been driven by mega-cap tech stocks. Apple, Inc. (APPL), for example, gained 27% in Q3, becoming the first company in global history to surpass a $2 trillion market cap. Apple’s market cap has surpassed that of the entire Russell 2000 and roughly equals the S&P 500 Energy, Utilities and Materials sectors combined. The Information Technology sector has grown to 28% of the S&P 500, and if you add in the tech-heavy Communication Services sector’s 11% weighting and Amazon’s 5% weighting, the true Tech weighting is now pushing 44%, a record high.
This phenomenon has sucked attention and capital from other areas of the market. While the Nasdaq is up 25% year-to-date, the small-cap oriented Russell 2000 is down 8.69% year-to-date and the Lipper Large Cap Value® Index is down around 11%, highlighting the massive disparity between “growth” and “value” investing. A low-growth economic environment and ultra-low interest rates have combined to increase the allure of long-tailed growth stories. Recently, Fed Chairman Jerome Powell added fuel to the fire by announcing new monetary policy that takes a more relaxed approach to inflation and virtually promising easy money/low interest rates for the foreseeable future. This policy has greased the skids for further speculation, and we clearly see signs of excess in certain areas of the market: with the red-hot initial public offering (IPO) market, junk bonds offering low yields, and the return of day traders – this time on the Robinhood app.
We are making sure that we maintain balance in our portfolios between durable growth stories and more economically sensitive companies. We also recognize that many of our holdings have benefitted from the stay at home phenomena and may have seen a demand pull forward. We have been scaling back our exposure to some of these holdings, while adding to companies that stand to benefit when the world normalizes from the pandemic. In the near term, investors will likely continue to grapple with fears of a second coronavirus wave this fall/winter and potentially positive phase 3 vaccine trial data readouts. Given the cross currents, we think maintaining balance in the portfolios is the most prudent course of action. At the margin, tilting the portfolios towards re-opening beneficiaries could pay off handsomely in the next couple of years, especially given their attractive valuations relative to hotter parts of the market.
All eyes are on the federal government. It remains unclear whether Congress will agree on a fourth stimulus package. Even more importantly, the November elections are in particular focus this year, and the prospect for a delayed/contested outcome seems to be the biggest risk to markets. Market volatility returned in September and we expect volatility to remain
1
elevated through this uncertain period. While political party leadership has typically had very little correlation with equity markets, we expect markets to be volatile throughout the election process. We don’t have a crystal ball on timing, but we think the election will eventually conclude, and the economy should continue to gradually heal from the depths of the pandemic earlier this year. Importantly, Fed policy remains highly supportive for equities, and our rebalancing actions taken in the quarter should further improve risk/reward for our portfolios going forward.
Please see our fund letters for discussion of specific ideas and investment themes. Thank you for your trust.
Davenport Core Fund (DAVPX)
The following chart represents Davenport Core Fund (DAVPX) performance and the performance of the S&P 500 Index, the Core Fund’s primary benchmark, for the periods ended September 30, 2020.
|
Q3 2020 |
1 Year |
3 Years* |
5 Years* |
10 Years* |
Since |
Core Fund (DAVPX) |
8.40% |
9.43% |
10.28% |
11.77% |
12.30% |
7.23% |
S&P 500 Index** |
8.93% |
15.15% |
12.28% |
14.15% |
13.74% |
7.74% |
30-Day SEC Yield: -0.06%; Expense Ratio in current prospectus: 0.89%
Past performance is no guarantee of future results. Investment return and principal value of an investment will fluctuate so that an investor’s shares, when redeemed, may be worth more or less than their original cost. Current performance may be lower or higher than the performance data quoted. Performance data, current to the most recent month-end, may be obtained by calling 1-800-281-3217.
|
* |
Returns greater than one year are annualized. |
|
** |
The S&P 500 Index is comprised of 500 U.S. stocks and is an indicator of the performance of the overall U.S. stock market. An investor cannot invest in an index and its returns are not indicative of the performance of any specific investment. |
The Davenport Core Fund (DAVPX) posted strong performance in the third quarter, building on the second quarter’s sharp recovery from the first quarter selloff. The Core Fund gained 8.40% in the third quarter, roughly in-line with the S&P 500® Index’s 8.93% advance. Calendar year-to-date the Fund is up 2.63%, behind the S&P 500’s 5.57% return.
This year, the S&P 500’s returns have been overwhelmingly driven by a handful of mega-cap Tech stocks. As a market cap-weighted index, the largest companies by market value have a disproportionate effect on the Index’s performance. Given the strong performance of the top five names (Apple, Inc. (AAPL), Amazon.com, Inc. (AMZN), Microsoft Corp. (MSFT), Facebook, Inc. (FB) and Alphabet, Inc. (GOOGL)) over the last several years, these top five now comprise ~22% of the S&P 500, a concentration level not seen since the late 1990s.
We own four of these five companies in the Core Fund (FB being the sole exception), and hold these platform companies in high regard, given their dominance in highly attractive end markets. That being said, a crucial part of our job is to manage the risk of the Fund. Our risk management process has caused us to own these names in smaller size than the S&P 500 Index does. These
2
underweights have made it tough to outperform the Index in recent years, including this one. Nevertheless, we think the owners of the Fund and readers of this letter will be better served with us keeping a watchful eye on risk mitigation over time, rather than continuing to buy at ever higher prices. We note that the S&P 500 Equal-Weighted Index is actually down 5.8% year-to-date, which is one of the wider divergences we have seen. So while we never enjoy underperforming, we think that framing performance in light of the recent market dynamics provides a more complete picture; and we are pleased to have captured most of the broader market’s advance this year.
Transaction activity remained relatively high in Q3, as it has all year given the elevated volatility and unique nature of 2020. We took some profits in standout performers Adobe, Inc. (ADBE) and Amazon.com, Inc. (AMZN). We added to our position in Walt Disney Co. (DIS), which is currently executing well in streaming and would stand to benefit nicely with its parks and sports exposure in a vaccine-led COVID recovery. We swapped out one ESG-friendly company for another, selling our position in sanitation provider Ecolab, Inc. (ECL) to purchase Ball Corp. (BLL), achieving a more attractive valuation for another high-quality company. Ball is the dominant provider of aluminum cans, with more than double the market share of its closest competitor. Aluminum cans are on trend given favorable sustainability attributes (aluminum cans are infinitely recyclable), resulting in a growth tailwind for this franchise that has consistently created shareholder value over time.
We also sold some companies whose outlooks are more challenged. We completely exited the Energy sector, with sales of Chevron Corp. (CVX) and Marathon Petroleum Corp. (MPC), as the environment becomes increasingly difficult for fossil fuel companies when looking out over the long term. We also sold CVS Health Corp. (CVS) and Capital One Financial Corp. (COF), which have been struggling to consistently grow. We added to merger-driven stories we remain excited about: T-Mobile US, Inc. (TMUS) and AON plc (AON).
We continue to invest in what we consider high potential opportunities, buying positions in MercadoLibre, Inc. (MELI) and Illumina, Inc. (ILMN). MercadoLibre is the #1 e-commerce player in South America, where e-commerce penetration remains low and the growth runway very long. We are perhaps even more excited about the FinTech side of the business, which is the front-runner to profitably serve South America’s underbanked population in a low-cost, digital manner. Management has been exceptional at both innovation and execution. Illumina is the dominant provider of genome-sequencing equipment and consumables. Genomic medicine is perhaps the most promising area of healthcare over the next decade, with the potential to detect (and possibly cure) cancer earlier, cure genetic diseases and generally improve our understanding of human biology. Virtually all of these exciting breakthroughs are enabled through the use of ILMN’s platform sequencing technology.
In closing, we have been active during a very turbulent year for the markets, working to uncover new opportunities and optimize the Fund, remaining mindful of risk. Thank you for your trust and interest.
Recent Purchases:
Aon plc (AON) – Given our belief that the rising insurance pricing cycle still has further to run, we elected to add to AON during the quarter, which should stand to benefit without the risks of payouts that underwriters face.
3
Ball Corporation (BLL) – BLL is the dominant player in the metal packaging industry, which we believe should be supported by several tailwinds over the coming years, so we chose to initiate a position.
Illumina, Inc. (ILMN) – We initiated a position in ILMN as it is the world’s dominant provider of tools (machines & consumables) for genetic and genomic analysis, with an 80-90% market share. In 2019, the company did $3.5bn in revenue with a 70% gross margin and a 28% operating margin. We chose to add to our position during the quarter as long term prospects outweigh near-term pandemic pressures on the stock.
iShares Nasdaq Biotechnology ETF (IBB) – We added to IBB during the quarter to gain diversified exposure to the broad-based innovation happening in the healthcare sector, while looking to minimize stock-specific risks attached to any one therapy.
MercadoLibre, Inc. (MELI) – MELI is an online marketplace e-commerce and payments company operating across Latin America. MELI’s original e-commerce business launched in 1999, and has become the #1 e-commerce website in Latin America. In light of the business model, growth rate, and large market opportunity, we elected to initiate a position at what we believe to be a reasonable valuation.
Sony Corporation (SNE) – SNE has grown from an audio-video equipment manufacturer to a global digital entertainment conglomerate. With the company focused on cultivating its portfolio to be an enabler of entertainment, we chose to initiate a position in the name.
T-Mobile US, Inc. (TMUS) – We added to our position in TMUS. We continue to see a significant runway for double-digit earnings growth as TMUS continues to take share, improves its network with the Sprint spectrum, reduces duplicative marketing costs, and eliminates a competitor.
Walt Disney Company (The) (DIS) – Despite results from the COVID-19 pandemic, Disney’s best-in-class brand, global distribution, production assets, content library, and balance sheet strength should allow the company to build scaled DTC video platforms in the large and growing streaming market that is significantly bigger than Disney’s parks and movie theater businesses currently. As such we added to our position.
Recent Sales:
Adobe, Inc. (ADBE) – Despite two previous chips, the strong performance had caused the stock to become the biggest position in the portfolio and the only position above 5.0%.As such, we elected to reduce the position back by 120 basis points (1.2%.)
Amazon.com, Inc. (AMZN) – We elected to reduce our position size somewhat after a 63% year-to-date move relative to a flat S&P 500®, as we think there is some risk that future gains have been pulled forward so far this year.
Capital One Financial Corporation (COF) – COF has been a frustrating stock over the last couple of years given a persistently low valuation that seems to overly discount the prospects for negative revisions while giving little credit to positive developments. As such, we elected to sell our position.
Chevron Corporation (CVX) – With governments and entrepreneurs around the world increasingly working to decrease their use in favor of greener alternatives, we are not enthused by the longer-term growth outlook for fossil fuel producers, and therefore elected to sell our position in CVX.
4
CVS Health Corporation (CVS) – We elected to sell our position during the quarter, as shares have failed to gain steam during our ownership period. While we ultimately think that the merger with Aetna could turn out to become a major positive for CVS, it is hard to have much visibility in the near term.
Ecolab, Inc. (ECL) – While ECL has been a good stock for us since our initial purchase, we chose to sell the shares as recent earnings growth has been disappointing and valuations appear full.
Marathon Petroleum Corporation (MPC) – MPC has been a volatile name for us over our holding period. While we initially purchased it well, we overstayed our welcome with the refining cycle peaking in 2018. With the effects of the COVID-19 pandemic, the clouded visibility combined with a more reasonable valuation prompted us to move out of the name.
Davenport Value & Income Fund (DVIPX)
The following chart represents Davenport Value & Income Fund (DVIPX) performance and the performance of the Russell 1000® Value Index, the Fund’s primary benchmark, and the S&P 500 Index for the periods ended September 30, 2020.
|
Q3 2020 |
1 Year |
3 Years* |
5 Years* |
Since |
Value & Income Fund (DVIPX) |
8.10% |
(3.71%) |
2.32% |
7.28% |
9.51% |
Russell 1000® Value Index** |
5.59% |
(5.02%) |
2.63% |
7.66% |
9.09% |
S&P 500 Index** |
8.93% |
15.15% |
12.28% |
14.15% |
12.93% |
30-Day SEC Yield: 1.50%; Expense Ratio in current prospectus: 0.89%
Past performance is no guarantee of future results. Investment return and principal value of an investment will fluctuate so that an investor’s shares, when redeemed, may be worth more or less than their original cost. Current performance may be lower or higher than the performance data quoted. Performance data, current to the most recent month-end, may be obtained by calling 1-800-281-3217.
|
* |
Returns greater than one year are annualized. |
|
** |
The Russell 1000® Value Index measures the performance of the Russell 1000 companies with lower price-to-book ratios and lower forecasted growth values. The S&P 500 Index is comprised of 500 U.S. stocks and is an indicator of the performance of the overall U.S. stock market. Standard & Poor’s Financial Services LLC, a division of S&P Global, is the source and owner of the registered trademarks related to the S&P 500 Index. An investor cannot invest in an index and its returns are not indicative of the performance of any specific investment. |
The Davenport Value & Income Fund (DVIPX) continued to recover during the third quarter ended September 30, 2020, increasing 8.10%, but remains down 10.11% year-to-date. This compares to the Fund’s primary benchmark, the Russell 1000 Value® Index, which increased 5.59% in the third quarter and is down 11.58% year-to-date. The S&P 500® Index increased 8.93% in the third quarter and is up 5.57% year-to-date. Many of the same themes from the second quarter continued into the third, with strong performance from growth stocks as well as those tied to an economic recovery. We continue to try to maintain a balance between companies that have benefitted from “stay at home” and those that should do well in a COVID-19 recovery scenario. At the same time, we have reduced exposure to areas where the crisis has accelerated or intensified secular headwinds.
5
Third-quarter performance was led by Industrials stocks as the economy snapped back sharply from second quarter lows. United Parcel Service, Inc. (UPS) and Watsco, Inc. (WSO) were our top two performers as both companies reported stellar results. UPS continues to benefit from increased e-commerce volumes and we think the new management team’s focus on operational efficiency, margins, and returns should lead to continued gains ahead. QUALCOMM, Inc. (QCOM) was another standout performer as the company removed a significant overhang by settling two long-standing legal battles, allowing investors to focus solely on the upcoming 5G cycle. Our key detractors in the quarter were Cisco Systems, Inc. (CSCO), Chevron Corp. (CVX), and CVS Health Corp. (CVS). Cisco was hurt by poor earnings and a subdued outlook given a slowdown in IT spending. Chevron continues to be hurt by low oil prices and a tough investing environment for fossil fuel businesses. We sold our position in CVS during the quarter as the company’s integration of Aetna is taking longer than anticipated, and we suspect some of the front of store pressure may persist post-COVID.
During the quarter, as part of our balanced strategy, we increased our positions in several names that pay good dividends and are also likely to benefit from economic improvement. These include Lamar Advertising Co. (LAMR), Brookfield Asset Management, Inc. (BAM), Gaming & Leisure Properties, Inc. (GLPI), and 3M Co. (MMM). As noted, we reduced exposure to names with secular headwinds, including the sale of Bank of America Corp. (BAC), Marathon Petroleum Corp. (MPC), International Business Machines (IBM), and the aforementioned CVS. We reinvested the proceeds into new positions in Sony Corp. (SNE), Deere & Co. (DE), L3Harris Technologies, Inc. (LHX), and Alphabet, Inc. (GOOGL). We view all four of these stocks as significantly undervalued relative to their growth prospects and business quality.
Deere is a perfect example of what we are focused on in the current environment. The company is the largest manufacturer of agricultural equipment in the world and a major producer of construction machinery. As expected, the company’s earnings (and stock) were hurt by the worldwide coronavirus outbreak, which gave us an opportunity to purchase this best-in-class industrial at an attractive price. As the recovery continues, the company’s strong efficiency during down cycles should lead to earnings that are double or triple this year’s cyclical low. With an investment-grade balance sheet, shareholder-friendly management team, and consistently growing dividend, we think the stock fits well in the Fund.
In sum, we are pleased that the Fund continues to recover and is outpacing its benchmark so far this year. A reversal of the outperformance of “growth” vs. “value” stocks would certainly bode well for the Fund. However, in the meantime we believe our balanced approach should position us well as the recovery continues, while also improving our risk profile should things take a turn for the worse.
Recent Purchases:
Alphabet, Inc. - Class A (GOOGL) – GOOGL may not be thought of as a traditional “value” stock, but we believe the stock is undervalued relative to its growth prospects and business quality, so we initiated a position in the name.
Brookfield Asset Management, Inc. (BAM) – We added to BAM as near zero interest rates in virtually all developed economies enhanced the value of the contractual cash flows associated with the company’s asset base.
6
Deere & Company (DE) – We view Deere as a best-in-class industrial cyclical with dominant market share and a focus on technology that should allow the company to continue to outperform peers. Therefore we decided to initiate a position.
Gaming and Leisure Properties, Inc, (GLPI) – Due to an improved outlook for the company, dividend visibility, and valuation below that of peers, we elected to add to the position.
Fidelity National Financial, Inc. (FNF) – At 10x 2021 consensus expectations, we feel the stock sports an attractive risk reward profile, especially when considering a near 3.9% dividend yield and ongoing share repurchases. As such, we have added to our position.
Lamar Advertising Company (LAMR) – We think the current level (down 12% from their June highs) is attractive for a company that is still generating solid cash flow and we believe can get through the current period of duress and emerge stronger on the other side, so we have added to our position.
L3Harris Technologies, Inc. (LHX) – We initiated a position in LHX as we like the combination of above-average growth, industry-leading margins, and significant cash flow generation, all at a below-market valuation.
3M Company (MMM) – While MMM has benefited from COVID-related sales (they are the largest producer of N95 masks), we think economies re-opening will provide an added lift given the broad diversification of the company’s end markets. We believe the valuation discount can close and felt now was a good time to boost our position.
QUALCOMM, Inc. (QCOM) – We added to our position as we continue to be attracted to the Qualcomm story with a multi-year earnings growth outlook driven by the implementation of 5G wireless networks globally.
Sony Corporation (SNE) – The company’s portfolio of key content IP assets across gaming, music, and movies/TV will enable the company to execute the shift of value creation from consumer hardware to software (content and services). Therefore, we elected to initiate a position.
Starbucks Corporation (SBUX) – SBUX has been a first mover in the digital area, with a widely used app that customers can order and pay through. These digital investments should position SBUX well for a rebound on the other side of the pandemic so we added to our position.
Recent Sales:
Bank of America Corporation (BAC) – While we think BAC has improved its business greatly under the current leadership, we think the stock is likely to continue to struggle in the face of zero interest rates, unknown loan losses, lack of loan demand, and limited capital returns to shareholders. As such, we elected to sell the position.
CVS Health Corporation (CVS) – We have elected to sell our position in CVS as we struggle to find any near-term catalysts and think earnings estimates are likely to trend down as front of store pressure may persist post-COVID.
International Business Machines Corporation (IBM) – Shares of IBM have failed to gain much traction year-to-date as IBM’s non-cloud business continues to deteriorate. We have become more cautious on the company’s long-term strategy and growth potential, and elected to sell the position.
7
Las Vegas Sands Corporation (LVS) – Considering March lows, LVS’ business remains significantly impaired and there is limited visibility on the exact timeline of a return to normal. Thus we decided to sell our position.
Lowe’s Companies, Inc. (LOW) – With the stock trading at an all-time high and the potential for moderating growth in the second half of the year, we felt it prudent to take some profits. We continue to like the story long-term but decided to chip our position.
Marathon Petroleum Corporation (MPC) – Given the large losses the company is currently running and an unclear timeline on a path back to profitability, we elected to move on from the name.
Watsco, Inc. (WSO) – We have been waiting for Watsco’s technology investments to pay off, and it seems that margins are finally inflecting higher, and e-commerce adoption is accelerating. WSO was (and continues to be) one of our largest positions, but we decided to take some profits after the recent move.
Davenport Equity Opportunities Fund (DEOPX)
The following chart represents Davenport Equity Opportunities Fund (DEOPX) performance and the performance of the Russell Midcap® Index, the Fund’s primary benchmark, and the S&P 500 Index for the periods ended September 30, 2020.
|
Q3 2020 |
1 Year |
3 Years* |
5 Years* |
Since |
Equity Opportunities Fund (DEOPX) |
9.24% |
8.57% |
11.49% |
11.84% |
12.39% |
Russell Midcap® Index** |
7.46% |
4.55% |
7.13% |
10.13% |
10.67% |
S&P 500 Index** |
8.93% |
15.15% |
12.28% |
14.15% |
12.93% |
30-Day SEC Yield: -0.27%; Expense Ratio in current prospectus: 0.91%
Past performance is no guarantee of future results. Investment return and principal value of an investment will fluctuate so that an investor’s shares, when redeemed, may be worth more or less than their original cost. Current performance may be lower or higher than the performance data quoted. Performance data, current to the most recent month-end, may be obtained by calling 1-800-281-3217.
|
* |
Returns greater than one year are annualized. |
|
** |
The Russell Midcap® Index measures the performance of the 800 smallest companies in the Russell 1000, which represents approximately 25% of the total market capitalization of the Russell 1000®. The S&P 500 Index is comprised of 500 U.S. stocks and is an indicator of the performance of the overall U.S. stock market. Standard & Poor’s Financial Services LLC, a division of S&P Global, is the source and owner of the registered trademarks related to the S&P 500 Index. An investor cannot invest in an index and its returns are not indicative of the performance of any specific investment. |
The Davenport Equity Opportunities Fund (DEOPX) enjoyed continued momentum in the third quarter ended September 30, 2020. The Fund’s 9.24% quarterly advance outpaced the 7.46% increase for the Russell Midcap® Index and puts it nicely into positive territory with a 4.39% year-to-date gain. Again, this compares favorably to the Russell Midcap, which is down 2.35% year-to-date.
8
Recent purchase DraftKings, Inc. (DKNG) was the Fund’s top performer for the period, advancing north of 75% alongside strong results, compelling partnership announcements (i.e., ESPN and several NFL teams), and additional sports gambling approvals in new jurisdictions. We are pleased this relatively new position has gotten off to such a strong start and realize recent momentum and media attention may lend itself to a higher degree of volatility for the stock going forward. That said, we believe upside remains as the company capitalizes on its first-mover advantage in a new and exciting market opportunity with significant growth runway. Watsco, Inc. (WSO) was another top contributor as the leading HVAC distributor reported strong results, highlighting the resilience of the company’s business model. We added to the position in the midst of panic-selling in April and were pleased to see the shares rally nearly 50% subsequently. Though we elected to trim the position during the quarter, we are still very constructive on the outlook for the company and the stock. After performing well in the second quarter, Dish Network Corp. (DISH) was the Fund’s top detractor in the period. Though this special situation has tried our patience over the years, we maintain confidence that the company will realize significant value through the construction of a next-generation 5G wireless network, utilizing its unique spectrum holdings and newly acquired Boost Mobile assets.
As has been the case throughout the history of the Fund, much of the activity during the period centered on taking opportunities to redistribute funds is a way that optimizes the overall risk/reward profile. This involves maintaining a balance between durable growth stories (some of which have benefitted from the “stay at home” phenomenon) and companies that could benefit substantially from a COVID recovery scenario. As such, we maintain meaningful exposure to companies such as American Tower Corp. (AMT), Etsy, Inc. (ETSY), Take Two Interactive Software, Inc. (TTWO), and others, which are largely net beneficiaries of COVID-19 related restrictions. On the flip side, we have also taken incremental steps to emphasize great businesses with solid long-term prospects that might have more leverage to a “normalization” of economic conditions. Two names that fit this mold are Lamar Advertising Co. (LAMR) and Colfax Corp. (CFX).
Lamar Advertising is a leader in the outdoor advertising space (a.k.a. billboards) and is a name we have great familiarity with, having owned it in the past. Big picture, we are attracted to this category of advertising as it continues to take share from other forms and note the company is still in the early stages of converting traditional billboards to a digital format, which offers attractive returns. In the meantime, LAMR is generating solid cash flow that can get it through the current period of duress and emerge stronger on the other side. While LAMR did cut its dividend (current yield of 3.0%), we expect the dividend to recover quickly as ad spending should get a boost from new categories (i.e., sports betting) and the current political season. As states resume re-opening, we expect consumers to spend more time on the road, thus benefiting outdoor advertising.
As worldwide economies continue to re-open, our confidence in the recovery at Colfax Corp. (CFX) has increased as a rebound in global industrial production should help the welding business and numbers around elective surgeries (many of which can be postponed but not put off indefinitely) should drive a recovery in MedTech. We continue to believe the company’s portfolio is now in a good position to implement its continuous improvement program and compound value creation for shareholders. While near-term results are likely to remain choppy, we think CFX can return to pre-COVID levels of EBITDA in the next year and note that the shares continue to trade at a meaningful discount to peers on a blended basis.
9
In sum, we are pleased with the Fund’s performance to date and continue to take steps to optimize the risk/reward profile of the strategy. In the face of continued uncertainty, we think it makes sense to maintain an element of balance in the Fund while always staying true to our commitment to quality.
Recent Purchases:
Align Technologies, Inc. (ALGN) – While overall case volumes remain down in this pandemic-affected period, ALGN is well-positioned to ride out this bumpy period with no debt, $400mn of cash on the balance sheet and strong free cash flow generation. Since our initial purchase, the stock has continued to act well, so we added to our position.
Brookfield Asset Management, Inc. (BAM) – We elected to add to BAM as near-zero interest rates in virtually all developed economies enhances the value of the contractual cash flows associated with the company’s asset base.
Black Knight, Inc. (BKI) – BKI has been a stout performer for the strategy, nearly tripling in value since its split from Fidelity National Financial (FNF) in 2015. We are grateful to have had the knowledge base and opportunity to make BKI a meaningful holding early on, and have added to the position again.
Cannae Holdings, Inc. (CNNE) – Put simply, our conviction level is very high with this name and the significant margin of safety coupled with the long list of catalysts/value drivers, we feel like the risk/reward is quite favorable here. Thus, we added to our position multiple times this quarter.
Colfax Corporation (CFX) – While near-term results are likely to remain choppy, we think CFX can return to pre-COVID levels of EBITDA in the next year, and the shares continue to trade at a meaningful discount to peers on a blended basis, so we elected to add to our position.
Draftkings, Inc. (DKNG) – DKNG is the leading U.S. provider of online sports betting. We believe sports betting and mobile gaming can grow at a 25-30% rate for the next decade. DKNG seems well positioned with a leading brand, strong balance sheet (net debt-free), and attractive unit economics at scale so we elected to add to our position.
Fidelity National Financial, Inc. (FNF) – We added to our position as we feel the stock sports an attractive risk reward profile, especially when considering a near 4.5% dividend yield and ongoing share repurchases.
Lamar Advertising Company (LAMR) – We think the current level is attractive for a company that is still generating solid cash flow and we believe can get through the current period of duress and emerge stronger on the other side so initiated a position. We then added to the position as we have greater conviction and visibility with respect to earnings power.
Take-Two Interactive Software, Inc. (TTWO) – Shares of TTWO outperformed throughout the COVID-19 crisis as stay at home orders have encouraged more engagement with the video game publisher’s content, leading to a surge in recurrent consumer spending (RCS) and game sales. Thus, we added to our position.
10
Recent Sales:
Cboe Global Markets, Inc. (CBOE) – Visibility on the growth outlook has become more clouded since our purchase in 2018. Performance has been somewhat underwhelming as CBOE’s multiple has contracted further. We elected to move on from the name and reposition proceeds into names with a more visible growth outlook
Liberty Broadband Corporation (LBRDK) – As a reminder, LBRDK is a holding company that owns shares of cable company Charter Communications (CHTR). The stock is now trading near all-time highs due to strong performance from CHTR and we felt it prudent to take some profits and redeploy the funds elsewhere. In addition, we chipped the position a second time during the quarter bringing the name to a more normal position size.
LiveNation Entertainment, Inc. (LYV) – After adding to the position in the throes of COVID-19 shutdown panic, we have since been trimming the position as the dramatic recovery in the stock has given way to a more balanced risk-reward profile. For the time being, we elect to sell our position, but hope to return to this company someday.
Watsco, Inc. (WSO) – We have been waiting for WSO’s technology investments to pay off and it seems that margins are finally inflecting higher and e-commerce adoption is accelerating. We continue to believe the company will increase share, grow through acquisition, expand margins and return cash to shareholders. Though we decided to take some profits multiple times this quarter, we are still very constructive on the long-term outlook for this company.
Davenport Small Cap Focus Fund (DSCPX)
This chart represents Davenport Small Cap Focus Fund (DSCPX) performance and the performance of the Russell 2000® Index, the Small Cap Focus Fund’s primary benchmark, for the periods ended September 30, 2020.
|
Q3 2020 |
1 Year |
3 Year |
5 Year |
Since |
Small Cap Focus Fund (DSCPX) |
8.70% |
16.66% |
9.97% |
13.82% |
10.08% |
Russell 2000® Index** |
4.93% |
0.39% |
1.77% |
8.00% |
5.44% |
30-Day SEC Yield: 0.04%; Expense Ratio in current prospectus: 0.98%
Past performance is no guarantee of future results. Investment return and principal value of an investment will fluctuate so that an investor’s shares, when redeemed, may be worth more or less than their original cost. Current performance may be lower or higher than the performance data quoted. Performance data, current to the most recent month-end, may be obtained by calling 1-800-281-3217.
|
* |
Returns greater than one year are annualized. |
|
** |
The Russell 2000® Index measures the performance of the 2,000 smallest companies in the Russell 3000® index, representing approximately 8% of the total market capitalization of the Russell 3000. An investor cannot invest in an index and its returns are not indicative of the performance of any specific investment. |
The Davenport Small Cap Focus Fund (DSCPX) advanced 8.70% during the third quarter ended September 30, 2020, outpacing the 4.93% gain for the Russell 2000® Index. Calendar year-to-date, the Fund is now up 4.53%, which compares favorably to the 8.69% decline for the Russell 2000.
11
As we highlighted at the end of last quarter, housing has been an important theme for the strategy and a meaningful contributor to performance. This quarter was no different, as building products distributor Builders FirstSource, Inc. (BLDR) and title insurer Stewart Information Services Corp. (STC) produced gains of roughly 58% and 35% during the period, respectively. On top of strong industry fundamentals, BLDR responded favorably to a transformational merger announcement with a major competitor, BMC Stock Holdings, Inc. (BMCH). We elaborate on STC in detail below, as it was a name we pressed meaningfully early in the quarter. Elsewhere, the Fund benefitted from a more than 50% surge in the shares of leading pet insurer, Trupanion, Inc. (TRUP), which saw gains following strong quarterly results and kicked into overdrive due to a short squeeze. While we remain attracted to the long-term growth runway for both the industry and the company, we elected to exit the position entirely as the stock’s valuation became difficult to justify. Our worst performer was a relatively new position called GAN Ltd. (GAN), which is an enabler of online sports betting and virtual casino gambling over the internet. While we are disappointed the position got off to a rocky start, we remain attracted to the company’s net debt-free balance sheet, profitable software-driven business model, and positioning as an enabler of an exciting growth theme.
As mentioned above, we meaningfully increased exposure to Stewart Information Services Corp. (STC) during the quarter. In addition to liking the backdrop for housing transaction activity due to favorable interest rates, demographics, and supply/demand characteristics, we saw a compelling company-specific opportunity for self-improvement on both the operational and capital allocation fronts. We have long followed Stewart Title, having observed several unsuccessful attempts to bring the company’s margin and return profile up to industry standards. Following industry leader Fidelity National Financial, Inc.’s (FNF) unsuccessful takeover bid for the company in late 2019, STC finally got what it needed. In stepped new CEO Fred Eppinger, who has quickly refocused the company operationally and revamped the capital allocation strategy. Already, Eppinger and team executed on a dramatic cost reduction program, stemmed market share losses and announced several M&A transactions that make financial and strategic sense. Though we have been rewarded with the stock’s 35%+ ascent during the quarter, we continue to believe the shares offer further upside as management continues to execute against a favorable industry backdrop.
As is core to our process, we took several steps aimed at optimizing the risk/reward profile of the Fund. As the country (and world) emerges from what we hope is the worst of COVID-19 related shutdowns, we have been busy identifying good businesses, with ample access to liquidity that can survive the current turmoil and have more leverage to a recovery scenario. As such, we have begun to reintroduce names like OneSpaWorld Holdings Ltd. (OSW), which operates spas on cruise ships. This business is extremely predictable and cash generative (when the industry is not shut down), and the company has the liquidity to survive until the end of 2021 with no revenues. We have also introduced a new position in J&J Snack Foods Corp. (JJSF), a distributor of popular snacks (funnel cakes, hot pretzels, and churros) and beverages (owner of the ICEE franchise) to entertainment venues. While the current environment is clearly challenging for the company, this is a quality business with no debt that has compounded value for shareholders consistently over the years. In each of these cases, the stocks trade at meaningful discounts when considering normalized earnings power and should benefit from pent up demand when/if the world ever returns to a state of normalcy. Importantly, we note that these actions have been measured and incremental, reflecting our intent to achieve balance between durable growth companies with defensive characteristics and good businesses with a bit more economic sensitivity.
12
In sum, we are pleased with our results to date, yet remain hard at work positioning the Fund for the future. On top of the balanced and concentrated collection of high-quality businesses, we continue to have ample flexibility via an above-average cash balance. As always, we thank you for your trust and support.
Davenport Balanced Income Fund (DBALX)
The following chart represents Davenport Balanced Income Fund (DBALX) performance and performance of the Fund’s primary benchmark, the Russell 1000® Value Index for the period ended September 30, 2020.
|
Q3 2020 |
1 Year |
3 Year |
Since |
Balanced Income Fund (DBALX) |
5.60% |
(0.83%) |
2.62% |
5.02% |
Russell 1000® Value Index** |
5.59% |
(5.02%) |
2.63% |
6.83% |
30-Day SEC Yield: 0.91%; Expense Ratio in current prospectus: 0.96%
Past performance is no guarantee of future results. Investment return and principal value of an investment will fluctuate so that an investor’s shares, when redeemed, may be worth more or less than their original cost. Current performance may be lower or higher than the performance data quoted. Performance data, current to the most recent month-end, may be obtained by calling 1-800-281-3217.
|
* |
Returns greater than one year are annualized. |
|
** |
The Russell 1000® Value Index measures the performance of the Russell 1000 companies with lower price-to-book ratios and lower forecasted growth values |
The Davenport Balanced Income Fund (DBALX) increased 5.60% during the third quarter ended September 30, 2020, outperforming the 3.61% increase for the blended 60% Russell 1000 Value® Index and 40% Bloomberg Barclays Intermediate Government/Credit Index. Calendar year-to-date, the Fund decreased 5.07% compared to the 4.25% decrease for the blended benchmark.
The equity performance within the Fund was led by industrial stocks as the economy emerged from lows seen in the previous quarter. United Parcel Service, Inc. (UPS) was our top contributor to performance as the company continues to benefit from increased e-commerce volumes and focus on overall operational efficiency, improving margins, and returns. Outside of Industrials, Brookfield Renewable Partners LP (BEP) was a big contributor to performance during the quarter as there continues to be a growing focus on renewable energy and de-carbonization of the electricity sector. BEP is well-positioned to benefit from this trend, given their diversified global portfolio of renewable generation assets. Our biggest detractors during the quarter were Cisco Systems, Inc. (CSCO), Chevron Corp. (CVX), and CVS Health Corp. (CVS). We elected to sell our position in CVS during the quarter as we believe the company’s integration of Aetna is taking longer than originally anticipated and believe the retail side of the business may continue to see pressure beyond COVID-19.
During the quarter, we introduced and increased positions that we believe are likely to benefit from economic improvement such as Lamar Advertising Co. (LAMR) and Gaming & Leisure Properties, Inc. (GLPI)—while also reducing exposure to names facing secular headwinds such as Bank of America Corp. (BAC) and the aforementioned CVS. We initiated a new position in
13
Sony Corp. (SNE), a global digital entertainment conglomerate with market-leading positions in video games, music, movies, CMOS image sensors, consumer electronics, and financial services. Despite the company’s business shift from traditional electronic hardware to higher growth digital entertainment verticals, the stock has maintained a below-market multiple over recent years, and we believe the stock trades at a significant discount to intrinsic value, especially when looking out beyond the current fiscal year which has been affected by the global pandemic. Additionally, the company is led by a high-quality management team with a capital allocation strategy that prioritizes investments for the future and returning cash to shareholders through share repurchases and dividends. While the current yield may appear low, the company intends to grow the dividend more meaningfully in the future.
The bond allocation of the Balanced Income Fund consists of 26 high-quality bonds across seven sectors with the top allocations to U.S. Treasuries at 23.06%, Consumer Discretionary at 21.55%, and Energy at 19.62%. The credit quality of the Fund is A+/A1 with an effective maturity of 4.05 years and a duration of 3.62 years. Our floating-rate exposure at the end of the quarter was 17.40%; as you may remember this exposure was closer to 40% at the beginning of 2019 when 3-month LIBOR (London Inter-Bank Offered Rate) was around 3.00%. As the Federal Reserve has taken drastic measures to calm the downdraft in the economy and the market, LIBOR finished Q3 2020 at 0.23%. The income levels for the floating-rate notes change quarterly based on the level of 3-month LIBOR. We still feel that the spread margin of the vintage floating-rate notes that we bought prior to the downturn offer a compelling yield compared to the recent issue fixed issuance. Therefore, we are not outright sellers nor inclined to increase our exposure at this point, as the new floating-rate notes spread on this product doesn’t compensate the Fed Funds rate risk. So, going forward, we will let the floating-rate notes mature, which will decrease our exposure to this coupon type. With the accommodation of the Fed, we will be looking to add exposure to corporate credit if we are compensated for taking either rate or credit risk.
In closing, we are pleased to see the Fund outperform the blended benchmark during the quarter. As the economic recovery continues and we enter a potentially volatile election season, we continue to see value in a balanced portfolio. Our allocation to dividend-paying, value-oriented equities with what we consider strong balance sheets that can weather economic uncertainty and defensive positioning in fixed income should continue to provide a volatility buffer in the near-term as well current income and long-term capital appreciation.
Sincerely,
John P. Ackerly IV, CFA
President, The Davenport Funds
14
DAVENPORT CORE FUND
PERFORMANCE INFORMATION (Unaudited)
Comparison of the Change in Value of a $10,000 Investment in
Davenport Core Fund and the S&P 500® Index

Average Annual Total Returns |
||||
1 Year |
5 Years |
10 Years |
||
Davenport Core Fund(a) |
9.43% |
11.77% |
12.30% |
|
S&P 500® Index |
15.15% |
14.15% |
13.74% |
|
(a) |
The total returns shown do not reflect the deduction of taxes that a shareholder would pay on Fund distributions or the redemption of Fund shares. |
15
DAVENPORT VALUE & INCOME FUND
PERFORMANCE INFORMATION (Unaudited)
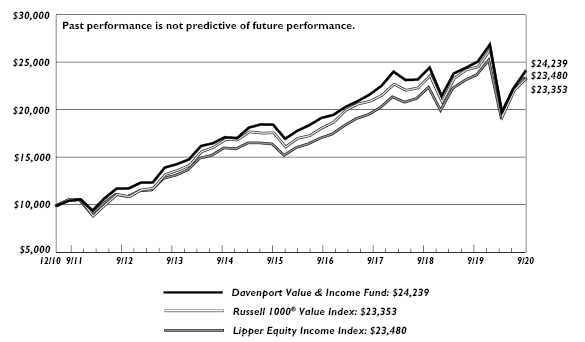
Comparison of the Change in Value of a $10,000 Investment in
Davenport Value & Income Fund, the Russell 1000® Value Index
and the Lipper Equity Income Index
Average Annual Total Returns |
||||
1 Year |
5 Years |
Since |
||
Davenport Value & Income Fund(a) |
(3.71%) |
7.28% |
9.51% |
|
Russell 1000® Value Index |
(5.02%) |
7.66% |
9.09% |
|
Lipper Equity Income Index |
(1.35%) |
8.91% |
9.15% |
|
(a) |
The total returns shown do not reflect the deduction of taxes that a shareholder would pay on Fund distributions or the redemption of Fund shares. |
(b) |
Commencement of operations was December 31, 2010. |
16
DAVENPORT EQUITY OPPORTUNITIES FUND
PERFORMANCE INFORMATION (Unaudited)
Comparison of the Change in Value of a $10,000 Investment in
Davenport Equity Opportunities Fund and the Russell Midcap® Index

Average Annual Total Returns |
||||
1 Year |
5 Years |
Since |
||
Davenport Equity Opportunities Fund(a) |
8.57% |
11.84% |
12.39% |
|
Russell Midcap® Index |
4.55% |
10.13% |
10.67% |
|
(a) |
The total returns shown do not reflect the deduction of taxes that a shareholder would pay on Fund distributions or the redemption of Fund shares. |
(b) |
Commencement of operations was December 31, 2010. |
17
DAVENPORT SMALL CAP FOCUS FUND
PERFORMANCE INFORMATION (Unaudited)
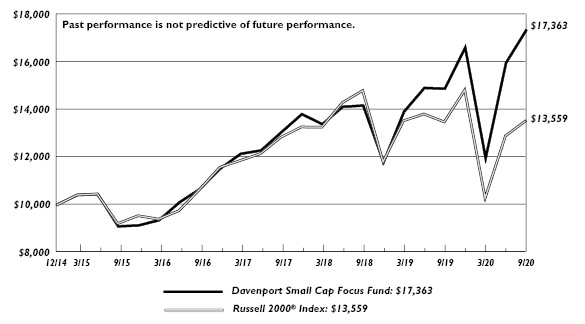
Comparison of the Change in Value of a $10,000 Investment in
Davenport Small Cap Focus Fund and the Russell 2000® Index
Average Annual Total Returns |
||||
1 Year |
5 Years |
Since |
||
Davenport Small Cap Focus Fund(a) |
16.66% |
13.82% |
10.08% |
|
Russell 2000® Index |
0.39% |
8.00% |
5.44% |
|
(a) |
The total returns shown do not reflect the deduction of taxes that a shareholder would pay on Fund distributions or the redemption of Fund shares. |
(b) |
Commencement of operations was December 31, 2014. |
18
DAVENPORT BALANCED INCOME FUND
PERFORMANCE INFORMATION (Unaudited)
Comparison of the Change in Value of a $10,000 Investment in Davenport Balanced
Income Fund, the Russell 1000® Value Index, a Blended 60% Russell 1000® Value
Index / 40% Bloomberg Barclays Intermediate Government/Credit Bond Index
and the Morningstar US OE Allocation — 50% to 70% Equity

Average Annual Total Returns |
||||
1 Year |
3 Years |
Since |
||
Davenport Balanced Income Fund(a) |
(0.83%) |
2.62% |
5.02% |
|
Russell 1000® Value Index |
(5.02%) |
2.63% |
6.83% |
|
Blended 60% Russell 1000® Value Index / 40% Bloomberg Barclays Intermediate Government/Credit Bond Index |
0.12% |
3.79% |
5.92% |
|
Morningstar US OE Allocation - 50% to 70% Equity |
6.28% |
5.38% |
6.95% |
|
(a) |
The total returns shown do not reflect the deduction of taxes that a shareholder would pay on Fund distributions or the redemption of Fund shares. |
(b) |
Commencement of operations was December 31, 2015. |
19
DAVENPORT CORE FUND
PORTFOLIO INFORMATION
September 30, 2020 (Unaudited)
Sector Allocation vs. the S&P 500® Index

Top Ten Equity Holdings
Security Description |
% of Net Assets |
Danaher Corporation |
4.3% |
Adobe, Inc. |
3.8% |
American Tower Corporation |
3.7% |
Microsoft Corporation |
3.6% |
Accenture plc - Class A |
3.3% |
T-Mobile US, Inc. |
3.2% |
Apple, Inc. |
3.2% |
Amazon.com, Inc. |
3.2% |
Mastercard, Inc. - Class A |
3.1% |
Visa, Inc. - Class A |
2.9% |
20
DAVENPORT VALUE & INCOME FUND
PORTFOLIO INFORMATION
September 30, 2020 (Unaudited)
Sector Allocation vs. the Russell 1000® Value Index

Top Ten Equity Holdings
Security Description |
% of Net Assets |
Comcast Corporation - Class A |
3.6% |
Johnson & Johnson |
3.6% |
Brookfield Asset Management, Inc. - Class A |
3.6% |
Watsco, Inc. |
3.4% |
United Parcel Service, Inc. - Class B |
3.3% |
Fidelity National Financial, Inc. |
3.2% |
QUALCOMM, Inc. |
3.2% |
Lamar Advertising Conpany - Class A |
2.8% |
Diageo plc - ADR |
2,8% |
Berkshire Hathaway, Inc. - Class B |
2.7% |
21
DAVENPORT EQUITY OPPORTUNITIES FUND
PORTFOLIO INFORMATION
September 30, 2020 (Unaudited)
Sector Allocation vs. the Russell Midcap® Index

Top Ten Equity Holdings
Security Description |
% of Net Assets |
American Tower Corporation |
5.7% |
Sherwin-Williams Company (The) |
5.6% |
Brookfield Asset Management, Inc. - Class A |
5.0% |
Etsy, Inc. |
4.8% |
Take-Two Interactive Software, Inc. |
4.7% |
Markel Corporation |
4.7% |
DISH Network Corporation - Class A |
4.6% |
O’Reilly Automotive, Inc. |
4.2% |
Fidelity National Financial, Inc. |
4.2% |
Liberty Broadband Corporation - Series C |
4.1% |
22
DAVENPORT SMALL CAP FOCUS FUND
PORTFOLIO INFORMATION
September 30, 2020 (Unaudited)
Sector Allocation vs. the Russell 2000® Index

Top Ten Equity Holdings
Security Description |
% of Net Assets |
Cannae Holdings, Inc. |
6.4% |
Monarch Casino & Resort, Inc. |
5.9% |
Evoqua Water Technologies Corporation |
5.3% |
Stewart Information Services Corporation |
4.8% |
Builders FirstSource, Inc. |
4.3% |
Colfax Corporation |
3.9% |
Lamar Advertising Company - Class A |
3.9% |
Switch, Inc. - Class A |
3.7% |
Diamond Hill Investment Group, Inc. |
3.4% |
Watsco, Inc. |
3.4% |
23
DAVENPORT BALANCED INCOME FUND
PORTFOLIO INFORMATION
September 30, 2020 (Unaudited)
Asset Allocation (% of Net Assets) |
Ten Largest Equity Holdings |
% of Net Assets |
|
|
Comcast Corporation - Class A |
2.0% |
|
Brookfield Asset Management, Inc. - Class A |
1.9% |
||
Johnson & Johnson |
1.9% |
||
Watsco, Inc. |
1.8% |
||
Fidelity National Financial, Inc. |
1.8% |
||
United Parcel Service, Inc. - Class B |
1.8% |
||
QUALCOMM, Inc. |
1.8% |
||
Brookfield Renewable Partners, L.P. |
1.6% |
||
Lamar Advertising Company - Class A |
1.6% |
||
Diageo plc - ADR |
1.6% |

Equity Sector Concentration vs. the Russell 1000 Value Index (62.0% of Net Assets) |

Bond Portfolio (42.6% of Net Assets) |
Credit Quality |
Composite Quality |
||
Number of Fixed-Income Securities |
23 |
AAA |
||
Average Quality |
AA |
|||
Effective Maturity |
yrs. |
A |
||
Average Effective Duration |
yrs. |
BBB |
||
Ba |
||||
Sector Breakdown |
% of Corporate |
Consumer Staples |
9.3% |
Energy |
19.6% |
Financials |
13.6% |
Health Care |
8.3% |
Industrials |
9.4% |
Materials |
5.9% |
Technology |
10.8% |
U.S. Treasury |
23.1% |
24
DAVENPORT CORE FUND |
||||||||
COMMON STOCKS — 95.7% |
Shares |
Value |
||||||
Communications — 10.8% |
||||||||
Alphabet, Inc. - Class A (a) |
8,290 | $ | 12,149,824 | |||||
Alphabet, Inc. - Class C (a) |
6,941 | 10,200,494 | ||||||
Liberty Broadband Corporation - Series C (a) |
103,475 | 14,783,473 | ||||||
T-Mobile US, Inc. (a) |
181,618 | 20,769,834 | ||||||
Walt Disney Company (The) |
93,875 | 11,648,010 | ||||||
| 69,551,635 | ||||||||
Consumer Discretionary — 11.3% |
||||||||
Amazon.com, Inc. (a) |
6,552 | 20,630,479 | ||||||
CarMax, Inc. (a) |
139,983 | 12,865,838 | ||||||
Home Depot, Inc. (The) |
35,678 | 9,908,137 | ||||||
MercadoLibre, Inc. (a) |
5,315 | 5,753,381 | ||||||
NIKE, Inc. - Class B |
96,606 | 12,127,917 | ||||||
TJX Companies, Inc. (The) |
207,349 | 11,538,972 | ||||||
| 72,824,724 | ||||||||
Consumer Staples — 5.2% |
||||||||
Mondelez International, Inc. - Class A |
154,758 | 8,890,847 | ||||||
Nestlé S.A. - ADR |
126,482 | 15,083,611 | ||||||
PepsiCo, Inc. |
65,734 | 9,110,733 | ||||||
| 33,085,191 | ||||||||
Financials — 14.4% |
||||||||
Aon plc - Class A |
60,100 | 12,398,630 | ||||||
Berkshire Hathaway, Inc. - Class B (a) |
82,053 | 17,472,366 | ||||||
Brookfield Asset Management, Inc. - Class A |
493,357 | 16,310,382 | ||||||
Charles Schwab Corporation (The) |
282,887 | 10,248,996 | ||||||
CME Group, Inc. |
56,766 | 9,497,519 | ||||||
JPMorgan Chase & Company |
116,788 | 11,243,181 | ||||||
Markel Corporation (a) |
15,757 | 15,342,591 | ||||||
| 92,513,665 | ||||||||
Health Care — 12.9% |
||||||||
Abbott Laboratories |
103,075 | 11,217,652 | ||||||
Becton, Dickinson and Company |
44,474 | 10,348,210 | ||||||
Danaher Corporation |
126,980 | 27,342,604 | ||||||
Illumina, Inc. (a) |
30,448 | 9,410,868 | ||||||
Johnson & Johnson |
99,285 | 14,781,551 | ||||||
Medtronic plc |
92,610 | 9,624,031 | ||||||
| 82,724,916 | ||||||||
Industrials — 5.0% |
||||||||
Honeywell International, Inc. |
65,415 | 10,767,963 | ||||||
Lockheed Martin Corporation |
21,531 | 8,252,402 | ||||||
Union Pacific Corporation |
65,908 | 12,975,308 | ||||||
| 31,995,673 | ||||||||
Materials — 7.7% |
||||||||
Air Products & Chemicals, Inc. |
39,294 | 11,704,111 | ||||||
25
DAVENPORT CORE FUND |
||||||||
COMMON STOCKS — 95.7% (Continued) |
Shares |
Value |
||||||
Materials — 7.7% (Continued) |
||||||||
Ball Corporation |
115,660 | $ | 9,613,659 | |||||
Martin Marietta Materials, Inc. |
43,247 | 10,178,614 | ||||||
Sherwin-Williams Company (The) |
25,703 | 17,908,308 | ||||||
| 49,404,692 | ||||||||
Real Estate — 3.7% |
||||||||
American Tower Corporation |
98,746 | 23,869,871 | ||||||
Technology — 24.7% |
||||||||
Accenture plc - Class A |
93,234 | 21,069,952 | ||||||
Adobe, Inc. (a) |
50,230 | 24,634,299 | ||||||
Apple, Inc. |
179,128 | 20,744,814 | ||||||
Broadcom, Inc. |
29,532 | 10,759,098 | ||||||
Mastercard, Inc. - Class A |
59,045 | 19,967,248 | ||||||
Microsoft Corporation |
108,857 | 22,895,893 | ||||||
Moody’s Corporation |
36,170 | 10,483,874 | ||||||
Sony Corporation - ADR |
119,530 | 9,173,927 | ||||||
Visa, Inc. - Class A |
92,686 | 18,534,419 | ||||||
| 158,263,524 | ||||||||
Total Common Stocks (Cost $343,075,474) |
$ | 614,233,891 | ||||||
|
||||||||
EXCHANGE-TRADED FUNDS — 1.4% |
Shares |
Value |
||||||
iShares Nasdaq Biotechnology ETF (Cost $9,000,550) |
64,546 | $ | 8,740,174 | |||||
|
||||||||
MONEY MARKET FUNDS — 1.5% |
Shares |
Value |
||||||
First American Treasury Obligations Fund - Class Z, 0.04% (b) (Cost $9,387,059) |
9,387,059 | $ | 9,387,059 | |||||
Total Investments at Value — 98.6% (Cost $361,463,083) |
$ | 632,361,124 | ||||||
Other Assets in Excess of Liabilities — 1.4% |
9,091,537 | |||||||
Net Assets — 100.0% |
$ | 641,452,661 | ||||||
ADR - American Depositary Receipt.
|
(a) |
Non-income producing security. |
|
(b) |
The rate shown is the 7-day effective yield as of September 30, 2020. |
See accompanying notes to financial statements.
26
DAVENPORT VALUE & INCOME FUND |
||||||||
COMMON STOCKS — 98.3% |
Shares |
Value |
||||||
Communications — 6.8% |
||||||||
Alphabet, Inc. - Class A (a) |
6,649 | $ | 9,744,775 | |||||
Comcast Corporation - Class A |
508,509 | 23,523,626 | ||||||
Verizon Communications, Inc. |
184,737 | 10,990,004 | ||||||
| 44,258,405 | ||||||||
Consumer Discretionary — 6.2% |
||||||||
Lowe’s Companies, Inc. |
63,437 | 10,521,661 | ||||||
McDonald’s Corporation |
74,202 | 16,286,597 | ||||||
Starbucks Corporation |
154,691 | 13,291,050 | ||||||
| 40,099,308 | ||||||||
Consumer Staples — 13.4% |
||||||||
Anheuser-Busch InBev S.A./N.V. - ADR |
248,693 | 13,399,579 | ||||||
Bunge Ltd. |
284,727 | 13,012,024 | ||||||
Diageo plc - ADR |
132,306 | 18,213,244 | ||||||
PepsiCo, Inc. |
120,461 | 16,695,895 | ||||||
Philip Morris International, Inc. |
196,772 | 14,755,932 | ||||||
Tyson Foods, Inc. - Class A |
180,501 | 10,736,199 | ||||||
| 86,812,873 | ||||||||
Energy — 2.7% |
||||||||
Chevron Corporation |
122,264 | 8,803,008 | ||||||
Enbridge, Inc. |
303,018 | 8,848,126 | ||||||
| 17,651,134 | ||||||||
Financials — 18.7% |
||||||||
Berkshire Hathaway, Inc. - Class B (a) |
83,352 | 17,748,975 | ||||||
Brookfield Asset Management, Inc. - Class A |
694,467 | 22,959,079 | ||||||
Capital One Financial Corporation |
179,721 | 12,914,751 | ||||||
Fairfax Financial Holdings Ltd. |
41,675 | 12,222,444 | ||||||
Fidelity National Financial, Inc. |
660,175 | 20,670,080 | ||||||
JPMorgan Chase & Company |
183,956 | 17,709,444 | ||||||
Markel Corporation (a) |
17,206 | 16,753,482 | ||||||
| 120,978,255 | ||||||||
Health Care — 10.3% |
||||||||
Bristol-Myers Squibb Company |
232,049 | 13,990,234 | ||||||
Johnson & Johnson |
155,492 | 23,149,649 | ||||||
Medtronic plc |
161,829 | 16,817,270 | ||||||
Merck & Company, Inc. |
154,002 | 12,774,466 | ||||||
| 66,731,619 | ||||||||
Industrials — 17.2% |
||||||||
3M Company |
108,467 | 17,374,244 | ||||||
Deere & Company |
53,955 | 11,958,046 | ||||||
L3Harris Technologies, Inc. |
55,517 | 9,429,007 | ||||||
Norfolk Southern Corporation |
71,232 | 15,242,936 | ||||||
TE Connectivity Ltd. |
143,304 | 14,006,533 | ||||||
27
DAVENPORT VALUE & INCOME FUND |
||||||||
COMMON STOCKS — 98.3% (Continued) |
Shares |
Value |
||||||
Industrials — 17.2% (Continued) |
||||||||
United Parcel Service, Inc. - Class B |
128,609 | $ | 21,430,118 | |||||
Watsco, Inc. |
93,164 | 21,696,964 | ||||||
| 111,137,848 | ||||||||
Real Estate — 8.8% |
||||||||
Crown Castle International Corporation |
93,603 | 15,584,900 | ||||||
Gaming and Leisure Properties, Inc. |
377,879 | 13,955,062 | ||||||
Lamar Advertising Company - Class A |
277,643 | 18,371,637 | ||||||
W.P. Carey, Inc. |
135,517 | 8,830,288 | ||||||
| 56,741,887 | ||||||||
Technology — 9.8% |
||||||||
Cisco Systems, Inc. |
307,385 | 12,107,895 | ||||||
Microsoft Corporation |
82,296 | 17,309,318 | ||||||
QUALCOMM, Inc. |
174,494 | 20,534,454 | ||||||
Sony Corporation - ADR |
170,308 | 13,071,139 | ||||||
| 63,022,806 | ||||||||
Utilities — 4.4% |
||||||||
Dominion Energy, Inc. |
223,273 | 17,622,938 | ||||||
NextEra Energy, Inc. |
37,769 | 10,483,163 | ||||||
| 28,106,101 | ||||||||
Total Common Stocks (Cost $541,703,734) |
$ | 635,540,236 | ||||||
|
||||||||
MONEY MARKET FUNDS — 0.2% |
Shares |
Value |
||||||
First American Treasury Obligations Fund - Class Z, 0.04% (b) (Cost $1,497,827) |
1,497,827 | $ | 1,497,827 | |||||
Total Investments at Value — 98.5% (Cost $543,201,561) |
$ | 637,038,063 | ||||||
Other Assets in Excess of Liabilities — 1.5% |
9,584,761 | |||||||
Net Assets — 100.0% |
$ | 646,622,824 | ||||||
ADR - American Depositary Receipt.
|
(a) |
Non-income producing security. |
|
(b) |
The rate shown is the 7-day effective yield as of September 30, 2020. |
See accompanying notes to financial statements.
28
DAVENPORT EQUITY OPPORTUNITIES FUND |
||||||||
COMMON STOCKS — 98.5% |
Shares |
Value |
||||||
Communications — 16.2% |
||||||||
Altice USA, Inc. - Class A (a) |
555,409 | $ | 14,440,634 | |||||
DISH Network Corporation - Class A (a) |
828,365 | 24,047,436 | ||||||
Liberty Broadband Corporation - Series C (a) |
149,709 | 21,388,925 | ||||||
Take-Two Interactive Software, Inc. (a) |
146,444 | 24,195,478 | ||||||
| 84,072,473 | ||||||||
Consumer Discretionary — 22.3% |
||||||||
Cannae Holdings, Inc. (a) |
529,947 | 19,745,825 | ||||||
CarMax, Inc. (a) |
203,830 | 18,734,015 | ||||||
DraftKings, Inc. - Class A (a) |
282,846 | 16,642,659 | ||||||
Etsy, Inc. (a) |
203,598 | 24,763,625 | ||||||
MercadoLibre, Inc. (a) |
13,071 | 14,149,096 | ||||||
O’Reilly Automotive, Inc. (a) |
47,551 | 21,924,815 | ||||||
| 115,960,035 | ||||||||
Financials — 17.7% |
||||||||
Brookfield Asset Management, Inc. - Class A |
791,144 | 26,155,221 | ||||||
Fairfax Financial Holdings Ltd. |
67,386 | 19,762,966 | ||||||
Fidelity National Financial, Inc. |
690,050 | 21,605,465 | ||||||
Markel Corporation (a) |
24,847 | 24,193,524 | ||||||
| 91,717,176 | ||||||||
Health Care — 5.1% |
||||||||
Align Technology, Inc. (a) |
36,156 | 11,836,028 | ||||||
Zoetis, Inc. |
87,976 | 14,548,591 | ||||||
| 26,384,619 | ||||||||
Industrials — 10.4% |
||||||||
Colfax Corporation (a) |
471,677 | 14,791,791 | ||||||
Watsco, Inc. |
87,416 | 20,358,312 | ||||||
Xylem, Inc. |
224,492 | 18,884,267 | ||||||
| 54,034,370 | ||||||||
Materials — 8.8% |
||||||||
Martin Marietta Materials, Inc. |
71,088 | 16,731,272 | ||||||
Sherwin-Williams Company (The) |
41,395 | 28,841,552 | ||||||
| 45,572,824 | ||||||||
Real Estate — 8.2% |
||||||||
American Tower Corporation |
123,333 | 29,813,286 | ||||||
Lamar Advertising Company - Class A |
190,442 | 12,601,547 | ||||||
| 42,414,833 | ||||||||
Technology — 9.8% |
||||||||
Autodesk, Inc. (a) |
67,113 | 15,503,774 | ||||||
Black Knight, Inc. (a) |
239,209 | 20,823,144 | ||||||
Intuit, Inc. |
45,549 | 14,858,539 | ||||||
| 51,185,457 | ||||||||
Total Common Stocks (Cost $368,339,179) |
$ | 511,341,787 | ||||||
29
DAVENPORT EQUITY OPPORTUNITIES FUND |
||||||||
MONEY MARKET FUNDS — 1.8% |
Shares |
Value |
||||||
First American Treasury Obligations Fund - Class Z, 0.04% (b) (Cost $9,506,489) |
9,506,489 | $ | 9,506,489 | |||||
Total Investments at Value — 100.3% (Cost $377,845,668) |
$ | 520,848,276 | ||||||
Liabilities in Excess of Other Assets — (0.3%) |
(1,726,117 | ) | ||||||
Net Assets — 100.0% |
$ | 519,122,159 | ||||||
|
(a) |
Non-income producing security. |
|
(b) |
The rate shown is the 7-day effective yield as of September 30, 2020. |
See accompanying notes to financial statements.
30
DAVENPORT SMALL CAP FOCUS FUND |
||||||||
COMMON STOCKS — 92.3% |
Shares |
Value |
||||||
Communications — 9.9% |
||||||||
Cable One, Inc. |
3,357 | $ | 6,329,388 | |||||
Liberty Latin America Ltd. - Class C (a) |
639,576 | 5,206,149 | ||||||
Shenandoah Telecommunications Company |
150,368 | 6,681,602 | ||||||
Switch, Inc. - Class A |
703,796 | 10,986,256 | ||||||
| 29,203,395 | ||||||||
Consumer Discretionary — 27.4% |
||||||||
American Woodmark Corporation (a) |
100,212 | 7,870,651 | ||||||
Builders FirstSource, Inc. (a) |
391,598 | 12,773,927 | ||||||
Cannae Holdings, Inc. (a) |
503,866 | 18,774,047 | ||||||
Etsy, Inc. (a) |
29,629 | 3,603,775 | ||||||
GAN Ltd. (a) |
369,308 | 6,241,305 | ||||||
Hanesbrands, Inc. |
626,701 | 9,870,541 | ||||||
Monarch Casino & Resort, Inc. (a) |
387,244 | 17,271,082 | ||||||
OneSpaWorld Holdings Ltd. |
655,099 | 4,258,144 | ||||||
| 80,663,472 | ||||||||
Consumer Staples — 7.1% |
||||||||
Bunge Ltd. |
110,000 | 5,027,000 | ||||||
J & J Snack Foods Corporation |
51,000 | 6,649,890 | ||||||
Seaboard Corporation |
3,254 | 9,230,589 | ||||||
| 20,907,479 | ||||||||
Financials — 16.0% |
||||||||
Diamond Hill Investment Group, Inc. |
79,614 | 10,056,840 | ||||||
Foley Trasimene Acquisition Corporation (a) |
800,000 | 9,032,000 | ||||||
Kinsale Capital Group, Inc. |
16,917 | 3,217,275 | ||||||
Stewart Information Services Corporation |
323,757 | 14,157,894 | ||||||
TowneBank |
323,732 | 5,309,205 | ||||||
Trebia Acquisition Corporation (a) |
500,000 | 5,400,000 | ||||||
| 47,173,214 | ||||||||
Industrials — 15.3% |
||||||||
Casella Waste Systems, Inc. - Class A (a) |
139,012 | 7,763,820 | ||||||
Colfax Corporation (a) |
366,992 | 11,508,869 | ||||||
Evoqua Water Technologies Corporation (a) |
739,579 | 15,693,866 | ||||||
Watsco, Inc. |
42,896 | 9,990,050 | ||||||
| 44,956,605 | ||||||||
Materials — 7.7% |
||||||||
Fortuna Silver Mines, Inc. (a) |
1,078,251 | 6,857,676 | ||||||
MAG Silver Corporation (a) |
407,434 | 6,624,877 | ||||||
NewMarket Corporation |
27,246 | 9,326,851 | ||||||
| 22,809,404 | ||||||||
Real Estate — 5.5% |
||||||||
FRP Holdings, Inc. (a) |
118,860 | 4,952,896 | ||||||
Lamar Advertising Company - Class A |
171,595 | 11,354,441 | ||||||
| 16,307,337 | ||||||||
31
DAVENPORT SMALL CAP FOCUS FUND |
||||||||
COMMON STOCKS — 92.3% (Continued) |
Shares |
Value |
||||||
Technology — 3.4% |
||||||||
Sonos, Inc. (a) |
301,970 | $ | 4,583,904 | |||||
Verra Mobility Corporation (a) |
549,260 | 5,305,852 | ||||||
| 9,889,756 | ||||||||
Total Common Stocks (Cost $225,446,792) |
$ | 271,910,662 | ||||||
|
||||||||
MONEY MARKET FUNDS — 7.9% |
Shares |
Value |
||||||
First American Treasury Obligations Fund - Class Z, 0.04% (b) (Cost $23,298,839) |
23,298,839 | $ | 23,298,839 | |||||
Total Investments at Value — 100.2% (Cost $248,745,631) |
$ | 295,209,501 | ||||||
Liabilities in Excess of Other Assets — (0.2%) |
(687,151 | ) | ||||||
Net Assets — 100.0% |
$ | 294,522,350 | ||||||
|
(a) |
Non-income producing security. |
|
(b) |
The rate shown is the 7-day effective yield as of September 30, 2020. |
See accompanying notes to financial statements.
32
DAVENPORT BALANCED INCOME FUND |
||||||||
COMMON STOCKS — 61.5% |
Shares |
Value |
||||||
Communications — 3.7% |
||||||||
Alphabet, Inc. - Class A (a) |
925 | $ | 1,355,680 | |||||
Comcast Corporation - Class A |
72,401 | 3,349,270 | ||||||
Verizon Communications, Inc. |
25,334 | 1,507,120 | ||||||
| 6,212,070 | ||||||||
Consumer Discretionary — 4.2% |
||||||||
Cannae Holdings, Inc. (a) |
35,849 | 1,335,734 | ||||||
Lowe’s Companies, Inc. |
8,846 | 1,467,198 | ||||||
McDonald’s Corporation |
10,246 | 2,248,894 | ||||||
Starbucks Corporation |
21,567 | 1,853,037 | ||||||
| 6,904,863 | ||||||||
Consumer Staples — 8.7% |
||||||||
Anheuser-Busch InBev S.A./N.V. - ADR |
34,055 | 1,834,883 | ||||||
Bunge Ltd. |
39,012 | 1,782,849 | ||||||
Diageo plc - ADR |
18,672 | 2,570,388 | ||||||
Ingredion, Inc. |
13,155 | 995,570 | ||||||
PepsiCo, Inc. |
16,526 | 2,290,504 | ||||||
Philip Morris International, Inc. |
27,471 | 2,060,050 | ||||||
Tyson Foods, Inc. - Class A |
24,894 | 1,480,695 | ||||||
Universal Corporation |
31,964 | 1,338,652 | ||||||
| 14,353,591 | ||||||||
Energy — 1.9% |
||||||||
Chevron Corporation |
16,932 | 1,219,104 | ||||||
Enbridge, Inc. |
41,717 | 1,218,137 | ||||||
Enterprise Products Partners, L.P. |
45,067 | 711,608 | ||||||
| 3,148,849 | ||||||||
Financials — 12.4% |
||||||||
Berkshire Hathaway, Inc. - Class B (a) |
11,473 | 2,443,061 | ||||||
Brookfield Asset Management, Inc. - Class A |
97,228 | 3,214,358 | ||||||
Capital One Financial Corporation |
24,967 | 1,794,129 | ||||||
Diamond Hill Investment Group, Inc. |
11,715 | 1,479,839 | ||||||
Fairfax Financial Holdings Ltd. |
5,756 | 1,688,120 | ||||||
Fidelity National Financial, Inc. |
94,131 | 2,947,241 | ||||||
JPMorgan Chase & Company |
25,480 | 2,452,959 | ||||||
Markel Corporation (a) |
2,366 | 2,303,774 | ||||||
Stewart Information Services Corporation |
50,417 | 2,204,735 | ||||||
| 20,528,216 | ||||||||
Health Care — 5.6% |
||||||||
Bristol-Myers Squibb Company |
32,006 | 1,929,642 | ||||||
Johnson & Johnson |
21,433 | 3,190,945 | ||||||
Medtronic plc |
22,304 | 2,317,831 | ||||||
Merck & Company, Inc. |
21,142 | 1,753,729 | ||||||
| 9,192,147 | ||||||||
33
DAVENPORT BALANCED INCOME FUND |
||||||||
COMMON STOCKS — 61.5% (Continued) |
Shares |
Value |
||||||
Industrials — 9.3% |
||||||||
3M Company |
15,092 | $ | 2,417,437 | |||||
Deere & Company |
7,738 | 1,714,973 | ||||||
L3Harris Technologies, Inc. |
7,710 | 1,309,466 | ||||||
Norfolk Southern Corporation |
9,678 | 2,070,995 | ||||||
TE Connectivity Ltd. |
19,630 | 1,918,636 | ||||||
United Parcel Service, Inc. - Class B |
17,565 | 2,926,856 | ||||||
Watsco, Inc. |
13,056 | 3,040,612 | ||||||
| 15,398,975 | ||||||||
Real Estate — 4.8% |
||||||||
Crown Castle International Corporation |
12,840 | 2,137,860 | ||||||
Gaming and Leisure Properties, Inc. |
52,565 | 1,941,221 | ||||||
Lamar Advertising Company - Class A |
39,607 | 2,620,795 | ||||||
W.P. Carey, Inc. |
18,598 | 1,211,846 | ||||||
| 7,911,722 | ||||||||
Technology — 5.3% |
||||||||
Cisco Systems, Inc. |
42,155 | 1,660,486 | ||||||
Microsoft Corporation |
11,293 | 2,375,257 | ||||||
QUALCOMM, Inc. |
24,680 | 2,904,342 | ||||||
Sony Corporation - ADR |
24,392 | 1,872,086 | ||||||
| 8,812,171 | ||||||||
Utilities — 5.6% |
||||||||
Brookfield Infrastructure Partners, L.P. |
41,245 | 1,964,087 | ||||||
Brookfield Renewable Partners, L.P. |
51,333 | 2,697,549 | ||||||
Brookfield Renewable Corporation - Class A |
12,833 | 752,014 | ||||||
Dominion Energy, Inc. |
30,720 | 2,424,729 | ||||||
NextEra Energy, Inc. |
5,146 | 1,428,324 | ||||||
| 9,266,703 | ||||||||
Total Common Stocks (Cost $93,221,125) |
$ | 101,729,307 | ||||||
|
||||||||
EXCHANGE-TRADED FUNDS — 0.5% |
Shares |
Value |
||||||
Utilities Select Sector SPDR Fund (The) (Cost $656,257) |
13,027 | $ | 773,543 | |||||
34
DAVENPORT BALANCED INCOME FUND |
||||||||
FIXED RATE CORPORATE BONDS — 21.5% |
Par Value |
Value |
||||||
Consumer Staples — 2.6% |
||||||||
Altria Group, Inc., 4.75%, due 05/05/2021 |
$ | 1,500,000 | $ | 1,537,715 | ||||
J.M. Smucker Company (The), 3.50%, due 10/15/2021 |
1,500,000 | 1,546,264 | ||||||
PepsiCo, Inc., 2.75%, due 03/05/2022 |
1,200,000 | 1,241,545 | ||||||
| 4,325,524 | ||||||||
Energy — 5.0% |
||||||||
Boardwalk Pipelines, L.P., 4.45%, due 07/15/2027 |
2,000,000 | 2,153,892 | ||||||
Halliburton Company, 3.80%, due 11/15/2025 |
2,325,000 | 2,526,310 | ||||||
MPLX, L.P., 4.125%, due 03/01/2027 |
3,250,000 | 3,572,542 | ||||||
| 8,252,744 | ||||||||
Financials — 2.3% |
||||||||
BlackRock, Inc., 3.50%, due 03/18/2024 |
1,150,000 | 1,267,311 | ||||||
Citigroup, Inc., 3.30%, due 04/27/2025 |
2,250,000 | 2,473,694 | ||||||
| 3,741,005 | ||||||||
Health Care — 3.0% |
||||||||
Amgen, Inc., 2.20%, due 02/21/2027 |
2,000,000 | 2,119,260 | ||||||
CVS Health Corporation, 3.00%, due 08/15/2026 |
2,600,000 | 2,846,605 | ||||||
| 4,965,865 | ||||||||
Industrials — 3.4% |
||||||||
General Dynamics Corporation, 3.375%, due 05/15/2023 |
3,250,000 | 3,489,786 | ||||||
John Deere Capital Corporation, 2.60%, due 03/07/2024 |
2,000,000 | 2,138,384 | ||||||
| 5,628,170 | ||||||||
Materials — 1.3% |
||||||||
Sherwin-Williams Company (The), 3.45%, due 06/01/2027 |
2,000,000 | 2,246,030 | ||||||
Technology — 3.9% |
||||||||
Fiserv, Inc., 3.20%, due 07/01/2026 |
2,225,000 | 2,472,072 | ||||||
Oracle Corporation, 3.625%, due 07/15/2023 |
1,500,000 | 1,628,849 | ||||||
PayPal Holdings, Inc., 2.40%, due 10/01/2024 |
2,250,000 | 2,383,982 | ||||||
| 6,484,903 | ||||||||
Total Fixed Rate Corporate Bonds (Cost $33,574,379) |
$ | 35,644,241 | ||||||
35
DAVENPORT BALANCED INCOME FUND |
||||||||
VARIABLE RATE CORPORATE BONDS (b) — 6.3% |
Par Value |
Value |
||||||
Consumer Staples — 0.7% |
||||||||
Campbell Soup Company, 0.88% (3MO LIBOR + 63), due 03/15/2021 |
$ | 1,250,000 | $ | 1,252,312 | ||||
Energy — 2.1% |
||||||||
BP Capital Markets plc, 0.88% (3MO LIBOR + 65), due 09/19/2022 |
1,750,000 | 1,754,867 | ||||||
ConocoPhillips Company, 1.18% (3MO LIBOR + 90), due 05/15/2022 |
1,750,000 | 1,766,740 | ||||||
| 3,521,607 | ||||||||
Financials — 2.7% |
||||||||
Goldman Sachs Group, Inc., 1.45% (3MO LIBOR + 117), due 11/15/2021 |
2,000,000 | 2,002,468 | ||||||
JPMorgan Chase & Company, 1.73% (3MO LIBOR + 148), due 03/01/2021 |
1,500,000 | 1,507,334 | ||||||
Wells Fargo & Company, 1.26% (3MO LIBOR + 101), due 12/07/2020 |
929,000 | 930,646 | ||||||
| 4,440,448 | ||||||||
Materials — 0.8% |
||||||||
Vulcan Materials Company, 0.90% (3MO LIBOR + 65), due 03/01/2021 |
1,275,000 | 1,275,482 | ||||||
Total Variable Rate Corporate Bonds (Cost $10,483,071) |
$ | 10,489,849 | ||||||
|
||||||||
U.S. TREASURY OBLIGATIONS — 8.4% |
Par Value |
Value |
||||||
U.S. Treasury Notes — 8.4% |
||||||||
3.125%, due 05/15/2021 |
$ | 2,750,000 | $ | 2,801,563 | ||||
2.75%, due 06/30/2025 |
4,810,000 | 5,374,423 | ||||||
2.875%, due 08/15/2028 |
4,785,000 | 5,650,973 | ||||||
Total U.S. Treasury Obligations (Cost $12,357,204) |
$ | 13,826,959 | ||||||
36
DAVENPORT BALANCED INCOME FUND |
||||||||
MONEY MARKET FUNDS — 1.5% |
Shares |
Value |
||||||
First American Treasury Obligations Fund - Class Z, 0.04% (c) (Cost $2,535,899) |
2,535,899 | $ | 2,535,899 | |||||
Total Investments at Value — 99.7% (Cost $152,827,935) |
$ | 164,999,798 | ||||||
Other Assets in Excess of Liabilities — 0.3% |
465,225 | |||||||
Net Assets — 100.0% |
$ | 165,465,023 | ||||||
ADR - American Depositary Receipt.
LIBOR - London Interbank Offered Rate.
|
(a) |
Non-income producing security. |
|
(b) |
Variable rate security. Interest rate resets periodically. The rate shown is the effective interest rate as of September 30, 2020. The reference rate and spread (in basis points) are indicated parenthetically. |
|
(c) |
The rate shown is the 7-day effective yield as of September 30, 2020. |
See accompanying notes to financial statements.
37
THE DAVENPORT FUNDS |
||||||||||||
|
Davenport |
Davenport |
Davenport |
|||||||||
ASSETS |
||||||||||||
Investments in securities: |
||||||||||||
At cost |
$ | 361,463,083 | $ | 543,201,561 | $ | 377,845,668 | ||||||
At value (Note 2) |
$ | 632,361,124 | $ | 637,038,063 | $ | 520,848,276 | ||||||
Cash |
9,008,000 | — | — | |||||||||
Receivable for capital shares sold |
331,159 | 87,830 | 69,889 | |||||||||
Receivable for investment securities sold |
— | 9,397,931 | — | |||||||||
Dividends receivable |
334,026 | 913,931 | 140,901 | |||||||||
Other assets |
24,338 | 27,355 | 24,342 | |||||||||
TOTAL ASSETS |
642,058,647 | 647,465,110 | 521,083,408 | |||||||||
LIABILITIES |
||||||||||||
Payable for capital shares redeemed |
151,077 | 378,191 | 116,957 | |||||||||
Payable for investment securities purchased |
— | — | 1,469,475 | |||||||||
Accrued investment advisory fees (Note 4) |
393,569 | 401,640 | 317,997 | |||||||||
Payable to administrator (Note 4) |
52,520 | 54,965 | 47,510 | |||||||||
Other accrued expenses |
8,820 | 7,490 | 9,310 | |||||||||
TOTAL LIABILITIES |
605,986 | 842,286 | 1,961,249 | |||||||||
NET ASSETS |
$ | 641,452,661 | $ | 646,622,824 | $ | 519,122,159 | ||||||
Net assets consist of: |
||||||||||||
Paid-in capital |
$ | 373,975,251 | $ | 581,925,263 | $ | 362,969,869 | ||||||
Accumulated earnings |
267,477,410 | 64,697,561 | 156,152,290 | |||||||||
Net assets |
$ | 641,452,661 | $ | 646,622,824 | $ | 519,122,159 | ||||||
Shares of beneficial interest outstanding (unlimited number of shares authorized, $0.01 par value) |
23,229,896 | 42,314,025 | 24,815,755 | |||||||||
Net asset value, offering price and redemption price per share (Note 2) |
$ | 27.61 | $ | 15.28 | $ | 20.92 | ||||||
See accompanying notes to financial statements.
38
THE DAVENPORT FUNDS |
||||||||
|
Davenport |
Davenport |
||||||
ASSETS |
||||||||
Investments in securities: |
||||||||
At cost |
$ | 248,745,631 | $ | 152,827,935 | ||||
At value (Note 2) |
$ | 295,209,501 | $ | 164,999,798 | ||||
Cash |
— | 42,475 | ||||||
Receivable for capital shares sold |
369,415 | 13,103 | ||||||
Dividends and interest receivable |
138,074 | 519,392 | ||||||
Other assets |
20,975 | 19,037 | ||||||
TOTAL ASSETS |
295,737,965 | 165,593,805 | ||||||
LIABILITIES |
||||||||
Payable for capital shares redeemed |
205,498 | 6,200 | ||||||
Payable for investment securities purchased |
797,670 | — | ||||||
Accrued investment advisory fees (Note 4) |
176,327 | 102,152 | ||||||
Payable to administrator (Note 4) |
28,660 | 16,285 | ||||||
Other accrued expenses |
7,460 | 4,145 | ||||||
TOTAL LIABILITIES |
1,215,615 | 128,782 | ||||||
NET ASSETS |
$ | 294,522,350 | $ | 165,465,023 | ||||
Net assets consist of: |
||||||||
Paid-in capital |
$ | 231,748,861 | $ | 159,715,201 | ||||
Accumulated earnings |
62,773,489 | 5,749,822 | ||||||
Net assets |
$ | 294,522,350 | $ | 165,465,023 | ||||
Shares of beneficial interest outstanding (unlimited number of shares authorized, $0.01 par value) |
18,278,503 | 14,535,669 | ||||||
Net asset value, offering price and redemption price per share (Note 2) |
$ | 16.11 | $ | 11.38 | ||||
See accompanying notes to financial statements.
39
THE DAVENPORT FUNDS |
||||||||||||
|
Davenport |
Davenport |
Davenport |
|||||||||
INVESTMENT INCOME |
||||||||||||
Dividends |
$ | 4,001,785 | $ | 9,265,253 | $ | 1,933,540 | ||||||
Foreign withholding taxes on dividends |
(137,583 | ) | (124,089 | ) | (25,873 | ) | ||||||
TOTAL INVESTMENT INCOME |
3,864,202 | 9,141,164 | 1,907,667 | |||||||||
EXPENSES |
||||||||||||
Investment advisory fees (Note 4) |
2,212,431 | 2,320,354 | 1,777,755 | |||||||||
Administration fees (Note 4) |
290,632 | 309,875 | 259,629 | |||||||||
Registration and filing fees |
18,698 | 16,783 | 20,318 | |||||||||
Custodian and bank service fees |
17,302 | 18,260 | 14,110 | |||||||||
Compliance service fees (Note 4) |
13,642 | 14,195 | 11,464 | |||||||||
Audit and tax service fees |
8,750 | 8,750 | 8,750 | |||||||||
Printing of shareholder reports |
7,167 | 8,827 | 7,513 | |||||||||
Trustees’ fees (Note 4) |
7,500 | 7,500 | 7,500 | |||||||||
Insurance expense |
5,616 | 7,628 | 4,844 | |||||||||
Legal fees |
3,952 | 3,952 | 3,952 | |||||||||
Postage and supplies |
3,541 | 3,735 | 3,758 | |||||||||
Other expenses |
4,496 | 4,726 | 3,574 | |||||||||
TOTAL EXPENSES |
2,593,727 | 2,724,585 | 2,123,167 | |||||||||
NET INVESTMENT INCOME (LOSS) |
1,270,475 | 6,416,579 | (215,500 | ) | ||||||||
REALIZED AND UNREALIZED GAINS (LOSSES) ON INVESTMENTS AND FOREIGN CURRENCIES |
||||||||||||
Net realized gains (losses) from: |
||||||||||||
Investments |
12,514,645 | (30,121,558 | ) | 13,365,439 | ||||||||
Foreign currency transactions |
— | 7,294 | — | |||||||||
Net change in unrealized appreciation (depreciation) on investments |
127,592,003 | 143,228,369 | 120,780,448 | |||||||||
NET REALIZED AND UNREALIZED GAINS ON INVESTMENTS AND FOREIGN CURRENCIES |
140,106,648 | 113,114,105 | 134,145,887 | |||||||||
NET INCREASE IN NET ASSETS FROM OPERATIONS |
$ | 141,377,123 | $ | 119,530,684 | $ | 133,930,387 | ||||||
See accompanying notes to financial statements.
40
THE DAVENPORT FUNDS |
||||||||
|
Davenport |
Davenport |
||||||
INVESTMENT INCOME |
||||||||
Dividends |
$ | 1,061,944 | $ | 1,510,596 | ||||
Foreign withholding taxes on dividends |
— | (23,003 | ) | |||||
Interest |
— | 735,895 | ||||||
TOTAL INVESTMENT INCOME |
1,061,944 | 2,223,488 | ||||||
EXPENSES |
||||||||
Investment advisory fees (Note 4) |
922,201 | 597,224 | ||||||
Administration fees (Note 4) |
148,274 | 89,664 | ||||||
Registration and filing fees |
20,125 | 16,568 | ||||||
Audit and tax service fees |
8,750 | 9,500 | ||||||
Custodian and bank service fees |
9,911 | 5,995 | ||||||
Trustees’ fees (Note 4) |
7,500 | 7,500 | ||||||
Compliance service fees (Note 4) |
6,859 | 5,185 | ||||||
Legal fees |
3,952 | 3,952 | ||||||
Printing of shareholder reports |
4,539 | 3,262 | ||||||
Postage and supplies |
3,267 | 2,357 | ||||||
Insurance expense |
2,130 | 1,955 | ||||||
Other expenses |
2,782 | 3,866 | ||||||
TOTAL EXPENSES |
1,140,290 | 747,028 | ||||||
NET INVESTMENT INCOME (LOSS) |
(78,346 | ) | 1,476,460 | |||||
REALIZED AND UNREALIZED GAINS (LOSSES) ON INVESTMENTS AND FOREIGN CURRENCIES |
||||||||
Net realized gains (losses) from: |
||||||||
Investments |
18,551,945 | (6,584,978 | ) | |||||
Foreign currency transactions |
— | 977 | ||||||
Net change in unrealized appreciation (depreciation) on investments |
64,839,297 | 28,858,422 | ||||||
NET REALIZED AND UNREALIZED GAINS ON INVESTMENTS AND FOREIGN CURRENCIES |
83,391,242 | 22,274,421 | ||||||
NET INCREASE IN NET ASSETS FROM OPERATIONS |
$ | 83,312,896 | $ | 23,750,881 | ||||
See accompanying notes to financial statements.
41
DAVENPORT CORE FUND |
||||||||
|
Six Months |
Year |
||||||
FROM OPERATIONS |
||||||||
Net investment income |
$ | 1,270,475 | $ | 3,080,120 | ||||
Net realized gains (losses) from investment transactions |
12,514,645 | (7,699,360 | ) | |||||
Net change in unrealized appreciation (depreciation) on investments |
127,592,003 | (35,959,215 | ) | |||||
Net increase (decrease) in net assets from operations |
141,377,123 | (40,578,455 | ) | |||||
DISTRIBUTIONS TO SHAREHOLDERS (Note 2) |
(1,170,099 | ) | (13,553,767 | ) | ||||
FROM CAPITAL SHARE TRANSACTIONS |
||||||||
Proceeds from shares sold |
36,156,976 | 54,999,660 | ||||||
Net asset value of shares issued in reinvestment of distributions to shareholders |
1,089,462 | 12,838,833 | ||||||
Payments for shares redeemed |
(22,569,309 | ) | (43,365,603 | ) | ||||
Net increase in net assets from capital share transactions |
14,677,129 | 24,472,890 | ||||||
TOTAL INCREASE (DECREASE) IN NET ASSETS |
154,884,153 | (29,659,332 | ) | |||||
NET ASSETS |
||||||||
Beginning of period |
486,568,508 | 516,227,840 | ||||||
End of period |
$ | 641,452,661 | $ | 486,568,508 | ||||
CAPITAL SHARE ACTIVITY |
||||||||
Shares sold |
1,399,687 | 2,182,947 | ||||||
Shares reinvested |
42,097 | 502,726 | ||||||
Shares redeemed |
(869,074 | ) | (1,763,953 | ) | ||||
Net increase in shares outstanding |
572,710 | 921,720 | ||||||
Shares outstanding at beginning of period |
22,657,186 | 21,735,466 | ||||||
Shares outstanding at end of period |
23,229,896 | 22,657,186 | ||||||
See accompanying notes to financial statements.
42
DAVENPORT VALUE & INCOME FUND |
||||||||
|
Six Months |
Year |
||||||
FROM OPERATIONS |
||||||||
Net investment income |
$ | 6,416,579 | $ | 14,392,938 | ||||
Net realized gains (losses) from: |
||||||||
Investments |
(30,121,558 | ) | 31,723,502 | |||||
Foreign currency transactions |
7,294 | (2,226 | ) | |||||
Net change in unrealized appreciation (depreciation) on investments |
143,228,369 | (161,093,770 | ) | |||||
Net increase (decrease) in net assets from operations |
119,530,684 | (114,979,556 | ) | |||||
DISTRIBUTIONS TO SHAREHOLDERS (Note 2) |
(24,111,821 | ) | (28,599,834 | ) | ||||
FROM CAPITAL SHARE TRANSACTIONS |
||||||||
Proceeds from shares sold |
18,506,345 | 64,226,968 | ||||||
Net asset value of shares issued in reinvestment of distributions to shareholders |
22,347,650 | 26,096,159 | ||||||
Payments for shares redeemed |
(38,761,593 | ) | (70,586,528 | ) | ||||
Net increase in net assets from capital share transactions |
2,092,402 | 19,736,599 | ||||||
TOTAL INCREASE (DECREASE) IN NET ASSETS |
97,511,265 | (123,842,791 | ) | |||||
NET ASSETS |
||||||||
Beginning of period |
549,111,559 | 672,954,350 | ||||||
End of period |
$ | 646,622,824 | $ | 549,111,559 | ||||
CAPITAL SHARE ACTIVITY |
||||||||
Shares sold |
1,256,991 | 3,853,987 | ||||||
Shares reinvested |
1,581,362 | 1,597,248 | ||||||
Shares redeemed |
(2,648,633 | ) | (4,406,389 | ) | ||||
Net increase in shares outstanding |
189,720 | 1,044,846 | ||||||
Shares outstanding at beginning of period |
42,124,305 | 41,079,459 | ||||||
Shares outstanding at end of period |
42,314,025 | 42,124,305 | ||||||
See accompanying notes to financial statements.
43
DAVENPORT EQUITY OPPORTUNITIES FUND |
||||||||
|
Six Months |
Year |
||||||
FROM OPERATIONS |
||||||||
Net investment loss |
$ | (215,500 | ) | $ | (78,050 | ) | ||
Net realized gains from investment transactions |
13,365,439 | 33,664,952 | ||||||
Net change in unrealized appreciation (depreciation) on investments |
120,780,448 | (74,592,493 | ) | |||||
Net increase (decrease) in net assets from operations |
133,930,387 | (41,005,591 | ) | |||||
DISTRIBUTIONS TO SHAREHOLDERS (Note 2) |
(29,439,023 | ) | (18,269,665 | ) | ||||
FROM CAPITAL SHARE TRANSACTIONS |
||||||||
Proceeds from shares sold |
21,491,263 | 81,385,180 | ||||||
Net asset value of shares issued in reinvestment of distributions to shareholders |
27,999,850 | 17,525,692 | ||||||
Payments for shares redeemed |
(20,023,004 | ) | (63,475,317 | ) | ||||
Net increase in net assets from capital share transactions |
29,468,109 | 35,435,555 | ||||||
TOTAL INCREASE (DECREASE) IN NET ASSETS |
133,959,473 | (23,839,701 | ) | |||||
NET ASSETS |
||||||||
Beginning of period |
385,162,686 | 409,002,387 | ||||||
End of period |
$ | 519,122,159 | $ | 385,162,686 | ||||
CAPITAL SHARE ACTIVITY |
||||||||
Shares sold |
1,086,422 | 3,965,405 | ||||||
Shares reinvested |
1,500,528 | 874,454 | ||||||
Shares redeemed |
(1,027,526 | ) | (3,128,179 | ) | ||||
Net increase in shares outstanding |
1,559,424 | 1,711,680 | ||||||
Shares outstanding at beginning of period |
23,256,331 | 21,544,651 | ||||||
Shares outstanding at end of period |
24,815,755 | 23,256,331 | ||||||
See accompanying notes to financial statements.
44
DAVENPORT SMALL CAP FOCUS FUND |
||||||||
|
Six Months |
Year |
||||||
FROM OPERATIONS |
||||||||
Net investment income (loss) |
$ | (78,346 | ) | $ | 759,028 | |||
Net realized gains from investment transactions |
18,551,945 | 1,787,177 | ||||||
Net change in unrealized appreciation (depreciation) on investments |
64,839,297 | (33,622,447 | ) | |||||
Net increase (decrease) in net assets from operations |
83,312,896 | (31,076,242 | ) | |||||
DISTRIBUTIONS TO SHAREHOLDERS (Note 2) |
(1,058,489 | ) | (4,283,969 | ) | ||||
FROM CAPITAL SHARE TRANSACTIONS |
||||||||
Proceeds from shares sold |
41,797,556 | 81,570,070 | ||||||
Net asset value of shares issued in reinvestment of distributions to shareholders |
1,020,517 | 4,127,892 | ||||||
Payments for shares redeemed |
(10,627,160 | ) | (22,323,610 | ) | ||||
Net increase in net assets from capital share transactions |
32,190,913 | 63,374,352 | ||||||
TOTAL INCREASE IN NET ASSETS |
114,445,320 | 28,014,141 | ||||||
NET ASSETS |
||||||||
Beginning of period |
180,077,030 | 152,062,889 | ||||||
End of period |
$ | 294,522,350 | $ | 180,077,030 | ||||
CAPITAL SHARE ACTIVITY |
||||||||
Shares sold |
2,774,258 | 5,996,677 | ||||||
Shares reinvested |
71,390 | 280,868 | ||||||
Shares redeemed |
(736,551 | ) | (1,584,623 | ) | ||||
Net increase in shares outstanding |
2,109,097 | 4,692,922 | ||||||
Shares outstanding at beginning of period |
16,169,406 | 11,476,484 | ||||||
Shares outstanding at end of period |
18,278,503 | 16,169,406 | ||||||
See accompanying notes to financial statements.
45
DAVENPORT BALANCED INCOME FUND |
||||||||
|
Six Months |
Year |
||||||
FROM OPERATIONS |
||||||||
Net investment income |
$ | 1,476,460 | $ | 3,404,637 | ||||
Net realized gains (losses) from: |
||||||||
Investments |
(6,584,978 | ) | 1,057,558 | |||||
Foreign currency transactions |
977 | (258 | ) | |||||
Net change in unrealized appreciation (depreciation) on investments |
28,858,422 | (23,327,826 | ) | |||||
Net increase (decrease) in net assets from operations |
23,750,881 | (18,865,889 | ) | |||||
DISTRIBUTIONS TO SHAREHOLDERS (Note 2) |
||||||||
From distributable earnings |
(1,313,705 | ) | (4,232,642 | ) | ||||
Return of capital |
— | (415,129 | ) | |||||
Decrease in net assets from distributions to shareholders |
(1,313,705 | ) | (4,647,771 | ) | ||||
FROM CAPITAL SHARE TRANSACTIONS |
||||||||
Proceeds from shares sold |
8,774,536 | 42,349,095 | ||||||
Net asset value of shares issued in reinvestment of distributions to shareholders |
1,213,108 | 4,325,997 | ||||||
Payments for shares redeemed |
(10,856,648 | ) | (21,463,883 | ) | ||||
Net increase (decrease) in net assets from capital share transactions |
(869,004 | ) | 25,211,209 | |||||
TOTAL INCREASE IN NET ASSETS |
21,568,172 | 1,697,549 | ||||||
NET ASSETS |
||||||||
Beginning of period |
143,896,851 | 142,199,302 | ||||||
End of period |
$ | 165,465,023 | $ | 143,896,851 | ||||
CAPITAL SHARE ACTIVITY |
||||||||
Shares sold |
802,679 | 3,606,559 | ||||||
Shares reinvested |
108,443 | 380,947 | ||||||
Shares redeemed |
(993,760 | ) | (1,913,131 | ) | ||||
Net increase (decrease) in shares outstanding |
(82,638 | ) | 2,074,375 | |||||
Shares outstanding at beginning of period |
14,618,307 | 12,543,932 | ||||||
Shares outstanding at end of period |
14,535,669 | 14,618,307 | ||||||
See accompanying notes to financial statements.
46
DAVENPORT CORE FUND |
||||||||||||||||||||||||
Selected Per Share Data and Ratios for a Share Outstanding Throughout Each Period |
||||||||||||||||||||||||
Six Months |
|
|||||||||||||||||||||||
|
2020 |
2020 |
2019 |
2018 |
2017 |
2016 |
||||||||||||||||||
Net asset value at beginning of period |
$ | 21.48 | $ | 23.75 | $ | 22.96 | $ | 21.15 | $ | 18.78 | $ | 20.02 | ||||||||||||
Income (loss) from investment operations: |
||||||||||||||||||||||||
Net investment income |
0.06 | 0.14 | 0.11 | 0.09 | 0.11 | 0.11 | ||||||||||||||||||
Net realized and unrealized gains (losses) on investments |
6.12 | (1.80 | ) | 1.74 | 2.29 | 2.92 | (0.56 | ) | ||||||||||||||||
Total from investment operations |
6.18 | (1.66 | ) | 1.85 | 2.38 | 3.03 | (0.45 | ) | ||||||||||||||||
Less distributions from: |
||||||||||||||||||||||||
Net investment income |
(0.05 | ) | (0.14 | ) | (0.11 | ) | (0.11 | ) | (0.10 | ) | (0.11 | ) | ||||||||||||
Net realized gains |
— | (0.47 | ) | (0.95 | ) | (0.46 | ) | (0.56 | ) | (0.68 | ) | |||||||||||||
Total distributions |
(0.05 | ) | (0.61 | ) | (1.06 | ) | (0.57 | ) | (0.66 | ) | (0.79 | ) | ||||||||||||
Net asset value at end of period |
$ | 27.61 | $ | 21.48 | $ | 23.75 | $ | 22.96 | $ | 21.15 | $ | 18.78 | ||||||||||||
Total return (a) |
28.79 | %(b) | (7.36 | %) | 8.21 | % | 11.38 | % | 16.56 | % | (2.39 | %) | ||||||||||||
Net assets at end of period (000’s) |
$ | 641,453 | $ | 486,569 | $ | 516,228 | $ | 464,919 | $ | 399,432 | $ | 337,229 | ||||||||||||
Ratio of total expenses to average net assets |
0.88 | %(c) | 0.89 | % | 0.89 | % | 0.90 | % | 0.90 | % | 0.92 | % | ||||||||||||
Ratio of net investment income to average net assets |
0.43 | %(c) | 0.55 | % | 0.48 | % | 0.41 | % | 0.56 | % | 0.56 | % | ||||||||||||
Portfolio turnover rate |
15 | %(b) | 12 | % | 21 | % | 22 | % | 23 | % | 23 | % | ||||||||||||
|
(a) |
Total return is a measure of the change in value of an investment in the Fund over the periods covered, which assumes any dividends or capital gains distributions are reinvested in shares of the Fund. Returns shown do not reflect the deduction of taxes a shareholder would pay on Fund distributions or the redemption of Fund shares. |
|
(b) |
Not annualized. |
|
(c) |
Annualized. |
See accompanying notes to financial statements.
47
DAVENPORT VALUE & INCOME FUND |
||||||||||||||||||||||||
Selected Per Share Data and Ratios for a Share Outstanding Throughout Each Period |
||||||||||||||||||||||||
Six Months |
|
|||||||||||||||||||||||
|
2020 |
2020 |
2019 |
2018 |
2017 |
2016 |
||||||||||||||||||
Net asset value at beginning of period |
$ | 13.04 | $ | 16.38 | $ | 16.85 | $ | 15.97 | $ | 14.40 | $ | 15.46 | ||||||||||||
Income (loss) from investment operations: |
||||||||||||||||||||||||
Net investment income |
0.15 | 0.35 | 0.36 | 0.30 | 0.30 | 0.29 | ||||||||||||||||||
Net realized and unrealized gains (losses) on investments and foreign currencies |
2.67 | (3.00 | ) | 0.12 | 1.39 | 1.64 | (0.36 | ) | ||||||||||||||||
Total from investment operations |
2.82 | (2.65 | ) | 0.48 | 1.69 | 1.94 | (0.07 | ) | ||||||||||||||||
Less distributions from: |
||||||||||||||||||||||||
Net investment income |
(0.13 | ) | (0.36 | ) | (0.36 | ) | (0.30 | ) | (0.31 | ) | (0.29 | ) | ||||||||||||
Net realized gains |
(0.45 | ) | (0.33 | ) | (0.59 | ) | (0.51 | ) | (0.06 | ) | (0.70 | ) | ||||||||||||
Total distributions |
(0.58 | ) | (0.69 | ) | (0.95 | ) | (0.81 | ) | (0.37 | ) | (0.99 | ) | ||||||||||||
Net asset value at end of period |
$ | 15.28 | $ | 13.04 | $ | 16.38 | $ | 16.85 | $ | 15.97 | $ | 14.40 | ||||||||||||
Total return (a) |
22.00 | %(b) | (16.97 | %) | 2.96 | % | 10.67 | % | 13.60 | % | (0.46 | %) | ||||||||||||
Net assets at end of period (000’s) |
$ | 646,623 | $ | 549,112 | $ | 672,954 | $ | 648,456 | $ | 561,995 | $ | 450,447 | ||||||||||||
Ratio of total expenses to average net assets |
0.88 | %(c) | 0.88 | % | 0.88 | % | 0.88 | % | 0.89 | % | 0.91 | % | ||||||||||||
Ratio of net investment income to average net assets |
1.95 | %(c) | 2.07 | % | 2.21 | % | 1.79 | % | 1.96 | % | 2.03 | % | ||||||||||||
Portfolio turnover rate |
18 | %(b) | 28 | % | 18 | % | 22 | % | 26 | % | 25 | % | ||||||||||||
|
(a) |
Total return is a measure of the change in value of an investment in the Fund over the periods covered, which assumes any dividends or capital gains distributions are reinvested in shares of the Fund. Returns shown do not reflect the deduction of taxes a shareholder would pay on Fund distributions or the redemption of Fund shares. |
|
(b) |
Not annualized. |
|
(c) |
Annualized. |
See accompanying notes to financial statements.
48
DAVENPORT EQUITY OPPORTUNITIES FUND |
||||||||||||||||||||||||
Selected Per Share Data and Ratios for a Share Outstanding Throughout Each Period |
||||||||||||||||||||||||
Six Months |
|
|||||||||||||||||||||||
|
2020 |
2020 |
2019 |
2018 |
2017 |
2016 |
||||||||||||||||||
Net asset value at beginning of period |
$ | 16.56 | $ | 18.98 | $ | 17.75 | $ | 15.64 | $ | 14.73 | $ | 16.61 | ||||||||||||
Income (loss) from investment operations: |
||||||||||||||||||||||||
Net investment income (loss) |
(0.01 | ) | (0.00 | )(a) | (0.02 | ) | (0.04 | ) | 0.00 | (a) | 0.00 | (a) | ||||||||||||
Net realized and unrealized gains (losses) on investments |
5.64 | (1.59 | ) | 1.91 | 2.15 | 1.10 | (1.14 | ) | ||||||||||||||||
Total from investment operations |
5.63 | (1.59 | ) | 1.89 | 2.11 | 1.10 | (1.14 | ) | ||||||||||||||||
Less distributions from: |
||||||||||||||||||||||||
Net investment income |
— | — | — | — | — | (0.01 | ) | |||||||||||||||||
Net realized gains |
(1.27 | ) | (0.83 | ) | (0.66 | ) | — | (0.19 | ) | (0.73 | ) | |||||||||||||
Total distributions |
(1.27 | ) | (0.83 | ) | (0.66 | ) | — | (0.19 | ) | (0.74 | ) | |||||||||||||
Net asset value at end of period |
$ | 20.92 | $ | 16.56 | $ | 18.98 | $ | 17.75 | $ | 15.64 | $ | 14.73 | ||||||||||||
Total return (b) |
34.90 | %(c) | (9.13 | %) | 11.02 | % | 13.49 | % | 7.57 | % | (7.07 | %) | ||||||||||||
Net assets at end of period (000’s) |
$ | 519,122 | $ | 385,163 | $ | 409,002 | $ | 399,460 | $ | 351,754 | $ | 316,788 | ||||||||||||
Ratio of total expenses to average net assets |
0.89 | %(d) | 0.90 | % | 0.91 | % | 0.91 | % | 0.92 | % | 0.93 | % | ||||||||||||
Ratio of net investment income (loss) to average net assets |
(0.09 | %)(d) | (0.02 | %) | (0.13 | %) | (0.23 | %) | 0.00 | %(e) | 0.02 | % | ||||||||||||
Portfolio turnover rate |
15 | %(c) | 21 | % | 19 | % | 21 | % | 23 | % | 29 | % | ||||||||||||
|
(a) |
Amount rounds to less than $0.01 per share. |
|
(b) |
Total return is a measure of the change in value of an investment in the Fund over the periods covered, which assumes any dividends or capital gains distributions are reinvested in shares of the Fund. Returns shown do not reflect the deduction of taxes a shareholder would pay on Fund distributions or the redemption of Fund shares. |
|
(c) |
Not annualized. |
|
(d) |
Annualized. |
|
(e) |
Amount rounds to less than 0.01%. |
See accompanying notes to financial statements.
49
DAVENPORT SMALL CAP FOCUS FUND |
||||||||||||||||||||||||
Selected Per Share Data and Ratios for a Share Outstanding Throughout Each Period |
||||||||||||||||||||||||
Six Months |
|
|||||||||||||||||||||||
|
2020 |
2020 |
2019 |
2018 |
2017 |
2016 |
||||||||||||||||||
Net asset value at beginning of period |
$ | 11.14 | $ | 13.25 | $ | 13.01 | $ | 12.13 | $ | 9.34 | $ | 10.41 | ||||||||||||
Income (loss) from investment operations: |
||||||||||||||||||||||||
Net investment income (loss) |
(0.00 | )(a) | 0.05 | 0.06 | 0.02 | 0.02 | 0.01 | |||||||||||||||||
Net realized and unrealized gains (losses) on investments |
5.03 | (1.84 | ) | 0.44 | 1.22 | 2.77 | (1.07 | ) | ||||||||||||||||
Total from investment operations |
5.03 | (1.79 | ) | 0.50 | 1.24 | 2.79 | (1.06 | ) | ||||||||||||||||
Less distributions from: |
||||||||||||||||||||||||
Net investment income |
(0.02 | ) | (0.10 | ) | — | — | — | — | ||||||||||||||||
Net realized gains |
(0.04 | ) | (0.22 | ) | (0.26 | ) | (0.36 | ) | — | (0.01 | ) | |||||||||||||
Total distributions |
(0.06 | ) | (0.32 | ) | (0.26 | ) | (0.36 | ) | — | (0.01 | ) | |||||||||||||
Net asset value at end of period |
$ | 16.11 | $ | 11.14 | $ | 13.25 | $ | 13.01 | $ | 12.13 | $ | 9.34 | ||||||||||||
Total return (b) |
45.26 | %(c) | (14.08 | %) | 3.90 | % | 10.28 | % | 29.87 | % | (10.19 | %) | ||||||||||||
Net assets at end of period (000’s) |
$ | 294,522 | $ | 180,077 | $ | 152,063 | $ | 116,239 | $ | 74,946 | $ | 39,636 | ||||||||||||
Ratio of total expenses to average net assets |
0.93 | %(d) | 0.95 | % | 0.97 | % | 1.00 | % | 1.06 | % | 1.15 | % | ||||||||||||
Ratio of net investment income (loss) to average net assets |
(0.06 | %)(d) | 0.40 | % | 0.51 | % | 0.26 | % | 0.09 | % | 0.14 | % | ||||||||||||
Portfolio turnover rate |
35 | %(c) | 66 | % | 60 | % | 48 | % | 37 | % | 48 | % | ||||||||||||
|
(a) |
Amount rounds to less than $0.01 per share. |
|
(b) |
Total return is a measure of the change in value of an investment in the Fund over the periods covered, which assumes any dividends or capital gains distributions are reinvested in shares of the Fund. Returns shown do not reflect the deduction of taxes a shareholder would pay on Fund distributions or the redemption of Fund shares. |
|
(c) |
Not annualized. |
|
(d) |
Annualized. |
See accompanying notes to financial statements.
50
DAVENPORT BALANCED INCOME FUND |
||||||||||||||||||||||||
Selected Per Share Data and Ratios for a Share Outstanding Throughout Each Period |
||||||||||||||||||||||||
Six Months |
|
|||||||||||||||||||||||
|
2020 |
2020 |
2019 |
2018 |
2017 |
2016(a) |
||||||||||||||||||
Net asset value at beginning of period |
$ | 9.84 | $ | 11.34 | $ | 11.28 | $ | 11.02 | $ | 10.27 | $ | 10.00 | ||||||||||||
Income (loss) from investment operations: |
||||||||||||||||||||||||
Net investment income |
0.10 | 0.25 | 0.25 | 0.20 | 0.14 | 0.03 | ||||||||||||||||||
Net realized and unrealized gains (losses) on investments and foreign currencies |
1.53 | (1.41 | ) | 0.12 | 0.33 | 0.74 | 0.26 | |||||||||||||||||
Total from investment operations |
1.63 | (1.16 | ) | 0.37 | 0.53 | 0.88 | 0.29 | |||||||||||||||||
Less distributions from: |
||||||||||||||||||||||||
Net investment income |
(0.09 | ) | (0.23 | ) | (0.24 | ) | (0.17 | ) | (0.13 | ) | (0.02 | ) | ||||||||||||
Net realized gains |
— | (0.08 | ) | (0.07 | ) | (0.10 | ) | — | — | |||||||||||||||
Return of capital |
— | (0.03 | ) | — | — | — | — | |||||||||||||||||
Total distributions |
(0.09 | ) | (0.34 | ) | (0.31 | ) | (0.27 | ) | (0.13 | ) | (0.02 | ) | ||||||||||||
Net asset value at end of period |
$ | 11.38 | $ | 9.84 | $ | 11.34 | $ | 11.28 | $ | 11.02 | $ | 10.27 | ||||||||||||
Total return (b) |
16.58 | %(c) | (10.59 | %) | 3.35 | % | 4.81 | % | 8.59 | % | 2.90 | %(c) | ||||||||||||
Net assets at end of period (000’s) |
$ | 165,465 | $ | 143,897 | $ | 142,199 | $ | 129,268 | $ | 83,419 | $ | 17,885 | ||||||||||||
Ratio of total expenses to average net assets |
0.94 | %(d) | 0.95 | % | 0.96 | % | 0.97 | % | 1.13 | %(e) | 1.25 | %(d)(f) | ||||||||||||
Ratio of net investment income to average net assets |
1.85 | %(d) | 2.18 | % | 2.28 | % | 1.85 | % | 1.55 | % | 1.65 | %(d)(g) | ||||||||||||
Portfolio turnover rate |
13 | %(c) | 29 | % | 30 | % | 23 | % | 16 | % | 7 | %(c) | ||||||||||||
|
(a) |
Represents the period from commencement of operations (December 31, 2015) through March 31, 2016. |
|
(b) |
Total return is a measure of the change in value of an investment in the Fund over the periods covered, which assumes any dividends or capital gains distributions are reinvested in shares of the Fund. Returns shown do not reflect the deduction of taxes a shareholder would pay on Fund distributions or the redemption of Fund shares. |
|
(c) |
Not annualized. |
|
(d) |
Annualized. |
|
(e) |
Absent advisory fee reductions and expense reimbursements recouped by the Adviser, the ratio of net expenses to average net assets would have been 1.08% for the year ended March 31, 2017. |
|
(f) |
Absent advisory fee reductions and expense reimbursements, the ratio of total expenses to average net assets would have been 2.25%(d) for the period ended March 31, 2016 (Note 4). |
|
(g) |
Ratio was determined after advisory fee reduction and expense reimbursements. |
See accompanying notes to financial statements.
51
THE DAVENPORT FUNDS
NOTES TO FINANCIAL STATEMENTS
September 30, 2020 (Unaudited)
1. Organization
Davenport Core Fund, Davenport Value & Income Fund, Davenport Equity Opportunities Fund, Davenport Small Cap Focus Fund and Davenport Balanced Income Fund (individually, a “Fund,” and, collectively, the “Funds”) are each a no-load series of the Williamsburg Investment Trust (the “Trust”), an open-end management investment company registered under the Investment Company Act of 1940, as amended. The Trust was organized as a Massachusetts business trust on July 18, 1988. Other series of the Trust are not incorporated in this report.
Davenport Core Fund’s investment objective is long-term growth of capital.
Davenport Value & Income Fund’s investment objective is to achieve long-term growth while generating current income through dividend payments on portfolio securities.
Davenport Equity Opportunities Fund’s investment objective is long-term capital appreciation.
Davenport Small Cap Focus Fund’s investment objective is long-term capital appreciation.
Davenport Balanced Income Fund’s investment objective is current income and an opportunity for long-term growth.
Davenport Core Fund, Davenport Value & Income Fund, Davenport Small Cap Focus Fund and Davenport Balanced Income Fund are each classified as a diversified fund. Davenport Equity Opportunities Fund is classified as a non-diversified fund.
2. Significant Accounting Policies
Each Fund follows accounting and reporting guidance under Financial Accounting Standards Board (“FASB”) Accounting Standards Codification Topic 946, “Financial Services – Investment Companies.” The following is a summary of the Funds’ significant accounting policies. The policies are in conformity with accounting principles generally accepted in the United States of America (“GAAP”).
New Accounting Pronouncement — In March 2020, the FASB issued Accounting Standards Update No. 2020-04 (“ASU 2020-04”), “Reference Rate Reform (Topic 840): Facilitation of the Effects of Reference Rate Reform on Financial Reporting”. ASU 2020-04 provides entities with optional guidance to ease the potential accounting burden associated with transitioning away from reference rates (e.g., LIBOR) that are expected to be discontinued. ASU 2020-04 allows, among other things, certain contract modifications to be accounted as a continuation of the existing contract. This ASU was effective upon the issuance and its optional relief can be applied through December 31, 2022. The Funds will consider this optional guidance prospectively, if applicable.
Securities valuation — The Funds’ portfolio securities are valued as of the close of business of the regular session of the New York Stock Exchange (the “NYSE”) (normally 4:00 p.m. Eastern time). Securities traded on a national stock exchange, including common stocks and exchange-traded funds (“ETFs”), are valued based upon the closing price on the principal exchange where the security is traded, if available, otherwise, at the last quoted bid price. Securities that are quoted
52
THE DAVENPORT FUNDS
NOTES TO FINANCIAL STATEMENTS (Continued)
by NASDAQ are valued at the NASDAQ Official Closing Price. Investments representing shares of money market funds and other open-end investment companies, other than ETFs, are valued at their net asset value (“NAV”) as reported by such companies. When using a quoted price and when the market is considered active, securities will be classified as Level 1 within the fair value hierarchy (see below).
Fixed income securities, including corporate bonds and U.S. Treasury obligations, are typically valued on the basis of prices provided by an independent pricing service. The prices provided by the pricing service are determined with consideration given to institutional bid and last sale prices and take into account securities prices, yields, maturities, call features, ratings, institutional trading in similar groups of securities, and developments related to specific securities. Given the inputs used by the pricing service, these securities are classified as Level 2 within the fair value hierarchy.
When market quotations are not readily available, if a pricing service cannot provide a price, or if the investment adviser believes the price received from the pricing service is not indicative of market value, securities will be valued in good faith at fair value using methods consistent with procedures adopted by the Board of Trustees and will be classified as Level 2 or 3 within the fair value hierarchy, depending on the inputs used. Such methods of fair valuation may include, but are not limited to: multiple of earnings, multiple of book value, discount from market of a similar freely traded security, purchase price of the security, subsequent private transactions in the security or related securities, or a combination of these and other factors.
GAAP establishes a single authoritative definition of fair value, sets out a framework for measuring fair value and requires additional disclosures about fair value measurements.
Various inputs are used in determining the value of the Funds’ investments. These inputs are summarized in the three broad levels listed below:
|
● |
Level 1 – quoted prices in active markets for identical securities |
|
● |
Level 2 – other significant observable inputs |
|
● |
Level 3 – significant unobservable inputs |
The inputs or methodology used for valuing securities are not necessarily an indication of the risks associated with investing in those securities. The inputs used to measure fair value may fall into different levels of the fair value hierarchy. In such cases, for disclosure purposes, the level in the fair value hierarchy within which the fair value measurement falls in its entirety is determined based on the lowest level input that is significant to the fair value measurement.
53
THE DAVENPORT FUNDS
NOTES TO FINANCIAL STATEMENTS (Continued)
The following is a summary of the Funds’ investments based on the input used to value the investments as of September 30, 2020, by security type:
Davenport Core Fund |
Level 1 |
Level 2 |
Level 3 |
Total |
||||||||||||
Common Stocks |
$ | 614,233,891 | $ | — | $ | — | $ | 614,233,891 | ||||||||
Exchange-Traded Funds |
8,740,174 | — | — | 8,740,174 | ||||||||||||
Money Market Funds |
9,387,059 | — | — | 9,387,059 | ||||||||||||
Total |
$ | 632,361,124 | $ | — | $ | — | $ | 632,361,124 | ||||||||
Davenport Value & Income Fund |
Level 1 |
Level 2 |
Level 3 |
Total |
||||||||||||
Common Stocks |
$ | 635,540,236 | $ | — | $ | — | $ | 635,540,236 | ||||||||
Money Market Funds |
1,497,827 | — | — | 1,497,827 | ||||||||||||
Total |
$ | 637,038,063 | $ | — | $ | — | $ | 637,038,063 | ||||||||
Davenport Equity Opportunities Fund |
Level 1 |
Level 2 |
Level 3 |
Total |
||||||||||||
Common Stocks |
$ | 511,341,787 | $ | — | $ | — | $ | 511,341,787 | ||||||||
Money Market Funds |
9,506,489 | — | — | 9,506,489 | ||||||||||||
Total |
$ | 520,848,276 | $ | — | $ | — | $ | 520,848,276 | ||||||||
Davenport Small Cap Focus Fund |
Level 1 |
Level 2 |
Level 3 |
Total |
||||||||||||
Common Stocks |
$ | 271,910,662 | $ | — | $ | — | $ | 271,910,662 | ||||||||
Money Market Funds |
23,298,839 | — | — | 23,298,839 | ||||||||||||
Total |
$ | 295,209,501 | $ | — | $ | — | $ | 295,209,501 | ||||||||
Davenport Balanced Income Fund |
Level 1 |
Level 2 |
Level 3 |
Total |
||||||||||||
Common Stocks |
$ | 101,729,307 | $ | — | $ | — | $ | 101,729,307 | ||||||||
Exchange-Traded Funds |
773,543 | — | — | 773,543 | ||||||||||||
Fixed Rate Corporate Bonds |
— | 35,644,241 | — | 35,644,241 | ||||||||||||
Variable Rate Corporate Bonds |
— | 10,489,849 | — | 10,489,849 | ||||||||||||
U.S. Treasury Obligations |
— | 13,826,959 | — | 13,826,959 | ||||||||||||
Money Market Funds |
2,535,899 | — | — | 2,535,899 | ||||||||||||
Total |
$ | 105,038,749 | $ | 59,961,049 | $ | — | $ | 164,999,798 | ||||||||
Refer to each Fund’s Schedule of Investments for a listing of the securities by sector type. There were no Level 3 securities or derivative instruments held by the Funds as of or during the six months ended September 30, 2020.
54
THE DAVENPORT FUNDS
NOTES TO FINANCIAL STATEMENTS (Continued)
Foreign currency translation — Investment securities and other assets and liabilities denominated in or expected to settle in foreign currencies, if any, are translated into U.S. dollars based on exchange rates on the following basis:
|
A. |
The fair values of investment securities and other assets and liabilities are translated as of the close of the NYSE each day. |
|
B. |
Purchases and sales of investment securities and income and expenses are translated at the rate of exchange prevailing as of 4:00 p.m. Eastern time on the respective date of such transactions. |
|
C. |
The Funds do not isolate that portion of the results of operations caused by changes in foreign exchange rates on investments from those caused by changes in market prices of securities held. Such fluctuations are included with the net realized and unrealized gains or losses on investments. |
Reported net realized foreign exchange gains or losses arise from 1) purchases and sales of foreign currencies and 2) the difference between the amounts of dividends and foreign withholding taxes recorded on the Fund’s books and the U.S. dollar equivalent of the amounts actually received or paid. Reported net unrealized foreign exchange gains and losses arise from changes in the value of assets and liabilities that result from changes in exchange rates.
Share valuation — The NAV per share of each Fund is calculated daily by dividing the total value of its assets, less liabilities, by the number of shares outstanding. The offering price and redemption price per share of each Fund is equal to the NAV per share.
Investment income — Interest income is accrued as earned. Discounts and premiums on fixed-income securities are amortized using the interest method. Dividend income is recorded on the ex-dividend date. Non-cash dividends included in dividend income, if any, are recorded at the fair market value of the security received. The Funds record distributions received from investments in real estate investment trusts (also known as “REITs”) in excess of income from underlying investments as a reduction of cost of investments and/or realized gain. These amounts are recorded once the issuers provide information about the actual composition of the distributions. Withholding taxes on foreign dividends have been recorded in accordance with the Funds’ understanding of the applicable country’s rules and tax rates.
Investment transactions — Investment transactions are accounted for on trade date for financial reporting purposes. Realized gains and losses on investment securities sold are determined on a specific identification basis.
Common expenses — Common expenses of the Trust are allocated among the Funds and the other series of the Trust based on relative net assets of each series or the nature of the services performed and the relative applicability to each series.
Distributions to shareholders — Dividends arising from net investment income, if any, are declared and paid quarterly to shareholders of Davenport Core Fund, Davenport Value & Income Fund, Davenport Small Cap Focus Fund and Davenport Balanced Income Fund; and declared and paid semi-annually to shareholders of Davenport Equity Opportunities Fund. Net realized
55
THE DAVENPORT FUNDS
NOTES TO FINANCIAL STATEMENTS (Continued)
short-term capital gains, if any, may be distributed throughout the year and net realized long-term capital gains, if any, are distributed at least once each year. The amount of distributions from net investment income and net realized capital gains are determined in accordance with federal income tax regulations, which may differ from GAAP. Dividends and distributions are recorded on the ex-dividend date.
The tax character of distributions paid during the periods ended September 30, 2020 and March 31, 2020 was as follows:
|
Period |
Ordinary |
Long-Term |
Return of |
Total |
||||||||||||
Davenport Core Fund |
09/30/20 |
$ | 1,170,099 | $ | — | $ | — | $ | 1,170,099 | ||||||||
03/31/20 |
$ | 3,136,527 | $ | 10,417,240 | $ | — | $ | 13,553,767 | |||||||||
Davenport Value & Income Fund |
09/30/20 |
$ | 5,445,259 | $ | 18,666,562 | $ | — | $ | 24,111,821 | ||||||||
03/31/20 |
$ | 14,608,026 | $ | 13,991,808 | $ | — | $ | 28,599,834 | |||||||||
Davenport Equity Opportunities Fund |
09/30/20 |
$ | 239,568 | $ | 29,199,455 | $ | — | $ | 29,439,023 | ||||||||
03/31/20 |
$ | — | $ | 18,269,665 | $ | — | $ | 18,269,665 | |||||||||
Davenport Small Cap Focus Fund |
09/30/20 |
$ | 322,359 | $ | 736,130 | $ | — | $ | 1,058,489 | ||||||||
03/31/20 |
$ | 1,256,060 | $ | 3,027,909 | $ | — | $ | 4,283,969 | |||||||||
Davenport Balanced Income Fund |
09/30/20 |
$ | 1,313,705 | $ | — | $ | — | $ | 1,313,705 | ||||||||
03/31/20 |
$ | 3,164,526 | $ | 1,068,116 | $ | 415,129 | $ | 4,647,771 | |||||||||
Estimates — The preparation of financial statements in conformity with GAAP requires management to make estimates and assumptions that affect the reported amounts of assets and liabilities and disclosure of contingent assets and liabilities, each as of the date of the financial statements, and the reported amounts of increase (decrease) in net assets from operations during the reporting period. Actual results could differ from those estimates.
Federal income tax — Each Fund has qualified and intends to continue to qualify as a regulated investment company under the Internal Revenue Code of 1986, as amended (the “Code”). Qualification generally will relieve the Funds of liability for federal income taxes to the extent 100% of their net investment income and net realized capital gains are distributed in accordance with the Code.
In order to avoid imposition of the excise tax applicable to regulated investment companies, it is also each Fund’s intention to declare as dividends in each calendar year at least 98% of its net investment income (earned during the calendar year) and 98.2% of its net realized capital gains (earned during the twelve months ended October 31) plus undistributed amounts from prior years.
56
THE DAVENPORT FUNDS
NOTES TO FINANCIAL STATEMENTS (Continued)
The following information is computed on a tax basis for each item as of September 30, 2020:
|
Davenport |
Davenport |
Davenport |
|||||||||
Cost of portfolio investments |
$ | 361,475,560 | $ | 543,270,746 | $ | 378,399,909 | ||||||
Gross unrealized appreciation |
$ | 275,957,993 | $ | 130,735,951 | $ | 171,974,238 | ||||||
Gross unrealized depreciation |
(5,072,429 | ) | (36,968,634 | ) | (29,525,871 | ) | ||||||
Net unrealized appreciation |
270,885,564 | 93,767,317 | 142,448,367 | |||||||||
Accumulated ordinary income (loss) |
125,800 | 982,617 | (215,500 | ) | ||||||||
Accumulated capital gains |
— | — | 13,919,423 | |||||||||
Accumulated capital and other losses |
(3,533,954 | ) | (30,052,373 | ) | — | |||||||
Accumulated earnings |
$ | 267,477,410 | $ | 64,697,561 | $ | 156,152,290 | ||||||
|
Davenport |
Davenport |
||||||
Cost of portfolio investments |
$ | 251,871,241 | $ | 152,762,866 | ||||
Gross unrealized appreciation |
$ | 57,767,149 | $ | 19,687,035 | ||||
Gross unrealized depreciation |
(14,428,889 | ) | (7,450,103 | ) | ||||
Net unrealized appreciation |
43,338,260 | 12,236,932 | ||||||
Accumulated ordinary income |
2,460,957 | 250,604 | ||||||
Accumulated capital gains |
16,974,272 | — | ||||||
Accumulated capital and other losses |
— | (6,737,714 | ) | |||||
Accumulated earnings |
$ | 62,773,489 | $ | 5,749,822 | ||||
The difference between the federal income tax cost of portfolio investments and the financial statement cost of portfolio investments for each Fund is due to certain timing differences in the recognition of capital gains and losses under income tax regulations and GAAP. These timing differences are temporary in nature and are due to the tax deferral of losses on wash sales, adjustments to basis on publicly traded partnerships and passive foreign investment companies.
The Funds recognize the tax benefits or expenses of uncertain tax positions only when the position is “more likely than not” to be sustained assuming examination by tax authorities. Management has reviewed the tax positions taken on Federal income tax returns for each Fund for the current and all open tax years (generally, three years) and has concluded that no provision for unrecognized tax benefits or expenses is required in these financial statements.
57
THE DAVENPORT FUNDS
NOTES TO FINANCIAL STATEMENTS (Continued)
3. Investment Transactions
Investment transactions, other than short-term investments and U.S. government securities, were as follows for the six months ended September 30, 2020:
|
Davenport |
Davenport |
Davenport |
|||||||||
Purchases of investment securities |
$ | 99,683,820 | $ | 109,001,687 | $ | 76,652,826 | ||||||
Proceeds from sales of investment securities |
$ | 83,568,163 | $ | 113,457,753 | $ | 68,008,879 | ||||||
|
Davenport |
Davenport |
||||||
Purchases of investment securities |
$ | 107,374,493 | $ | 21,934,507 | ||||
Proceeds from sales and maturities of investment securities |
$ | 76,406,012 | $ | 20,345,676 | ||||
4. Transactions with Related Parties
INVESTMENT ADVISORY AGREEMENTS
Each Fund’s investments are managed by Davenport & Company LLC (the “Adviser”) under the terms of an Investment Advisory Agreement. Under the Investment Advisory Agreement, each Fund pays the Adviser a fee, which is computed and accrued daily and paid monthly, at an annual rate of 0.75% of its average daily net assets. Certain officers and a Trustee of the Trust are also officers of the Adviser.
A significant portion of the Funds’ investment trades are executed through an affiliated broker-dealer of the Adviser. No commissions are paid by the Funds to the Adviser or the affiliate for these trades.
OTHER SERVICE PROVIDERS
Ultimus Fund Solutions, LLC (“Ultimus”) provides administration, fund accounting, compliance and transfer agent services to the Funds. The Funds pay Ultimus fees in accordance with the agreements for such services. In addition, the Funds pay out-of-pocket expenses including, but not limited to, postage, supplies, and certain costs related to the pricing of the Funds’ portfolio securities. Certain officers of the Trust are also officers of Ultimus, or of Ultimus Fund Distributors, LLC (the “Distributor”), the principal underwriter of each Fund’s shares and an affiliate of Ultimus. The Distributor is compensated by the Adviser (not the Funds) for acting as principal underwriter.
COMPENSATION OF TRUSTEES
Trustees and officers affiliated with the Adviser or Ultimus are not compensated by the Trust for their services. Each Trustee who is not an affiliated person of the Adviser or Ultimus received from the Trust an annual retainer of $24,000, payable quarterly; a fee of $2,000 for attendance at
58
THE DAVENPORT FUNDS
NOTES TO FINANCIAL STATEMENTS (Continued)
each meeting of the Board of Trustees (except that such fee is $3,000 for the independent chair); and a fee of $1,000 for attendance at each meeting of any committee of the Board (except that such fee is $1,500 for the committee chair); plus reimbursement of travel and other expenses incurred in attending meetings. Each Fund pays its proportionate share of such fees along with the other series of the Trust.
5. Sector Risk
If a Fund has significant investments in the securities of issuers in industries within a particular business sector, any development affecting that sector will have a greater impact on the value of the net assets of the Fund than would be the case if the Fund did not have significant investments in that sector. In addition, this may increase the risk of loss of an investment in the Fund and increase the volatility of the Fund’s NAV per share. From time to time, circumstances may affect a particular sector and the companies within such sector. For instance, economic or market factors, regulation or deregulation, or other developments may negatively impact all companies in a particular sector and therefore the value of a Fund’s portfolio would be adversely affected. As of September 30, 2020, Davenport Small Cap Focus Fund had 27.4% of the value of its net assets invested in common stocks within the Consumer Discretionary sector.
6. Contingencies and Commitments
The Funds indemnify the Trust’s officers and Trustees for certain liabilities that might arise from the performance of their duties to the Funds. Additionally, in the normal course of business the Funds enter into contracts that contain a variety of representations and warranties and which provide general indemnifications. The Funds’ maximum exposure under these arrangements is unknown, as this would involve future claims that may be made against the Funds that have not yet occurred. However, based on experience, the Funds expect the risk of loss to be remote.
7. Subsequent Events
The Funds are required to recognize in the financial statements the effects of all subsequent events that provide additional evidence about conditions that existed as of the date of the Statements of Assets and Liabilities. For non-recognized subsequent events that must be disclosed to keep the financial statements from being misleading, the Funds are required to disclose the nature of the event as well as an estimate of its financial effect, or a statement that such an estimate cannot be made. Management has evaluated subsequent events through the issuance of these financial statements and has noted no such events.
59
THE DAVENPORT FUNDS
YOUR FUNDS’ EXPENSES (Unaudited)
We believe it is important for you to understand the impact of costs on your investment. All mutual funds have operating expenses. As a shareholder of the Funds, you incur ongoing costs, including management fees and other expenses. These ongoing costs, which are deducted from each Fund’s gross income, directly reduce the investment return of the Funds.
A mutual fund’s ongoing costs are expressed as a percentage of its average net assets. This figure is known as the expense ratio. The following examples are intended to help you understand the ongoing costs (in dollars) of investing in the Funds and to compare these costs with the ongoing costs of investing in other mutual funds. The examples below are based on an investment of $1,000 made at the beginning of the period shown and held for the entire period (April 1, 2020 through September 30, 2020).
The table below illustrates each Fund’s ongoing costs in two ways:
Actual fund return – This section helps you to estimate the actual expenses that you paid over the period. The “Ending Account Value” shown is derived from each Fund’s actual return, and the fourth column shows the dollar amount of operating expenses that would have been paid by an investor who started with $1,000 in the Funds. You may use the information here, together with the amount you invested, to estimate the expenses that you paid over the period.
To do so, simply divide your account value by $1,000 (for example, an $8,600 account value divided by $1,000 = 8.6), then multiply the result by the number given for the applicable Fund under the heading “Expenses Paid During Period.”
Hypothetical 5% return – This section is intended to help you compare each Fund’s ongoing costs with those of other mutual funds. It assumes that each Fund had an annual return of 5% before expenses during the period shown, but that the expense ratio is unchanged. In this case, because the return used is not each Fund’s actual return, the results do not apply to your investment. The example is useful in making comparisons because the U.S. Securities and Exchange Commission (the “SEC”) requires all mutual funds to calculate expenses based on a 5% return. You can assess each Fund’s ongoing costs by comparing this hypothetical example with the hypothetical examples that appear in shareholder reports of other funds.
Note that expenses shown in the table are meant to highlight and help you compare ongoing costs only. The Funds do not charge sales loads or redemption fees.
The calculations assume no shares were bought or sold during the period. Your actual costs may have been higher or lower, depending on the amount of your investment and the timing of any purchases or redemptions.
More information about each Fund’s expenses, including historical annual expense ratios, can be found in this report. For additional information on operating expenses and other shareholder costs, please refer to the Funds’ prospectus.
60
THE DAVENPORT FUNDS
YOUR FUNDS’ EXPENSES (Unaudited) (Continued)
|
Beginning |
Ending |
Expense |
Expenses Paid |
Davenport Core Fund |
|
|
|
|
Based on Actual Fund Return |
$1,000.00 |
$ 1,287.90 |
0.88% |
$5.03 |
Based on Hypothetical 5% Return (before expenses) |
$1,000.00 |
$ 1,020.60 |
0.88% |
$4.45 |
Davenport Value & Income Fund |
||||
Based on Actual Fund Return |
$1,000.00 |
$ 1,220.00 |
0.88% |
$4.88 |
Based on Hypothetical 5% Return (before expenses) |
$1,000.00 |
$ 1,020.60 |
0.88% |
$4.45 |
Davenport Equity Opportunities Fund |
||||
Based on Actual Fund Return |
$1,000.00 |
$ 1,349.00 |
0.89% |
$5.23 |
Based on Hypothetical 5% Return (before expenses) |
$1,000.00 |
$ 1,020.55 |
0.89% |
$4.50 |
Davenport Small Cap Focus Fund |
||||
Based on Actual Fund Return |
$1,000.00 |
$ 1,452.60 |
0.93% |
$5.70 |
Based on Hypothetical 5% Return (before expenses) |
$1,000.00 |
$ 1,020.35 |
0.93% |
$4.70 |
Davenport Balanced Income Fund |
||||
Based on Actual Fund Return |
$1,000.00 |
$ 1.165.80 |
0.94% |
$5.09 |
Based on Hypothetical 5% Return (before expenses) |
$1,000.00 |
$ 1,020.30 |
0.94% |
$4.75 |
(a) |
Annualized, based on each Fund’s most recent one-half year expenses. |
(b) |
Expenses are equal to each Fund’s annualized expense ratio multiplied by the average account value over the period, multiplied by 183/366 (to reflect the one-half year period). |
61
THE DAVENPORT FUNDS |
A description of the policies and procedures that the Funds use to vote proxies relating to portfolio securities is available without charge upon request by calling toll-free 1-800-281-3217, or on the SEC’s website at www.sec.gov. Information regarding how the Funds voted proxies relating to portfolio securities during the most recent 12-month period ended June 30 is also available without charge upon request by calling toll-free 1-800-281-3217, or on the SEC’s website at www.sec.gov.
The Trust files a complete listing of portfolio holdings for each Fund with the SEC as of the end of the first and third quarters of each fiscal year as an exhibit to its reports on Form N-PORT. These filings are available upon request by calling 1-800-281-3217. Furthermore, you may obtain a copy of these filings on the SEC’s website at www.sec.gov.
A complete listing of portfolio holdings for each Fund is updated daily and can be reviewed at the Funds’ website at www.investdavenport.com.
62
Privacy Notice |
|||
FACTS |
WHAT DO THE DAVENPORT FUNDS DO WITH YOUR PERSONAL INFORMATION? |
||
Why? |
Financial companies choose how they share your personal information. Federal law gives consumers the right to limit some but not all sharing. Federal law also requires us to tell you how we collect, share, and protect your personal information. Please read this notice carefully to understand what we do. |
||
What? |
The types of personal information we collect and share depend on the product or service you have with us. This information can include: ■ Social Security number ■ Assets ■ Retirement Assets ■ Transaction History ■ Checking Account Information ■ Purchase History ■ Account Balances ■ Account Transactions ■ Wire Transfer Instructions When you are no longer our customer, we continue to share your information as described in this notice. |
||
How? |
All financial companies need to share your personal information to run their everyday business. In the section below, we list the reasons financial companies can share their customers’ personal information; the reasons The Davenport Funds choose to share; and whether you can limit this sharing. |
||
Reasons we can share your personal information |
Do The Davenport Funds share? |
Can you limit this sharing? |
|
For our everyday business purposes – |
Yes |
No |
|
For our marketing purposes – |
No |
We don’t share |
|
For joint marketing with other financial companies |
No |
We don’t share |
|
For our affiliates’ everyday business purposes – information about your creditworthiness |
No |
We don’t share |
|
For nonaffiliates to market to you |
No |
We don’t share |
|
Questions? |
Call 1-800-281-3217 |
||
Who we are |
|
Who is providing this notice? |
Williamsburg Investment Trust Ultimus Fund Distributors, LLC Ultimus Fund Solutions, LLC |
What we do |
|
How do The Davenport Funds protect my personal information? |
To protect your personal information from unauthorized access and use, we use security measures that comply with federal law. These measures include computer safeguards and secured files and buildings. Our service providers are held accountable for adhering to strict policies and procedures to prevent any misuse of your nonpublic personal information. |
How do The Davenport Funds collect my personal information? |
We collect your personal information, for example, when you ■ Provide account information ■ Give us your contact information ■ Make deposits or withdrawals from your account ■ Make a wire transfer ■ Tell us where to send the money ■ Tell us who receives the money ■ Show your government-issued ID ■ Show your driver’s license We also collect your personal information from other companies. |
Why can’t I limit all sharing? |
Federal law gives you the right to limit only ■ Sharing for affiliates’ everyday business purposes – information about your creditworthiness ■ Affiliates from using your information to market to you ■ Sharing for nonaffiliates to market to you State laws and individual companies may give you additional rights to limit sharing. |
Definitions |
|
Affiliates |
Companies related by common ownership or control. They can be financial and nonfinancial companies. ■ Davenport & Company LLC, the investment adviser to The Davenport Funds, could be deemed to be an affiliate. |
Nonaffiliates |
Companies not related by common ownership or control. They can be financial and nonfinancial companies ■ The Davenport Funds do not share with nonaffiliates so they can market to you |
Joint marketing |
A formal agreement between nonaffiliated financial companies that together market financial products or services to you. ■ The Davenport Funds don’t jointly market. |
THE DAVENPORT FUNDS
Investment Adviser
Davenport & Company LLC
One James Center
901 East Cary Street
Richmond, Virginia 23219-4037
Administrator
Ultimus Fund Solutions, LLC
P.O. Box 46707
Cincinnati, Ohio 45246-0707
1-800-281-3217
Custodian
U.S. Bank, N.A.
425 Walnut Street
Cincinnati, Ohio 45202
Independent Registered Public
Accounting Firm
Cohen & Company, Ltd.
1350 Euclid Avenue
Suite 800
Cleveland, Ohio 44115
Legal Counsel
Sullivan & Worcester LLP
1666 K Street, N.W.
Washington, DC 20006
Board of Trustees
Robert S. Harris, Ph.D., Chairman
John P. Ackerly, IV
John T. Bruce
George K. Jennison
Harris V. Morrissette
Elizabeth W. Robertson
Officers
John P. Ackerly, IV, President
George L. Smith, III, Vice President

One James Center
901 East Cary Street
Richmond, VA 23219
Davenport & Company LLC
Member: NYSE ● SIPC
Toll Free: (800) 846-6666
www.investdavenport.com
FBP Equity & Dividend Plus Fund
FBP Appreciation & Income Opportunities Fund
Semi-Annual Report
September 30, 2020
(Unaudited)
No-Load Funds
Beginning on January 1, 2021, as permitted by regulations adopted by the U.S. Securities and Exchange Commission, paper copies of the Funds’ shareholder reports like this one will no longer be sent by mail, unless you specifically request paper copies of the reports from the Funds or from your financial intermediary, such as a broker-dealer or bank. Instead, the reports will be made available on a website, and you will be notified by mail each time a report is posted and provided with a website link to access the report.
If you have already elected to receive shareholder reports electronically, you will not be affected by this change and you need not take any action. You may elect to receive shareholder reports and other communications from the Funds electronically by contacting the Funds at 1-866-738-1127 or, if you own these shares through a financial intermediary, by contacting your financial intermediary.
You may elect to receive all future reports in paper free of charge. You can inform the Funds that you wish to continue receiving paper copies of your shareholder reports by contacting the Funds at 1-866-738-1127. If you own shares through a financial intermediary, you may contact your financial intermediary or follow instructions included with this document to elect to continue to receive paper copies of your shareholder reports. Your election to receive reports in paper will apply to all Funds held with the Fund complex or at your financial intermediary.
Letter to Shareholders |
November 6, 2020 |
We are pleased to report on your Funds and their investments for the six-month period ended September 30, 2020, and to provide some additional information since we last communicated with you.
Economic and Market Update
The U.S. stock market continued to recover from its lows in March, but it was far from a smooth ride for investors as markets fell sharply late in the most recent quarter. The high-flying Nasdaq composite has continued to advance, but it experienced a near 15% decline from record-high levels in August to its recent low in late September. With the coronavirus still in widespread circulation and the presidential election mired by contested results, volatility remains elevated.
To be sure, there were positive developments in the fight against Covid-19. A number of clinical trials are underway for vaccines. Pharma companies Pfizer, Johnson & Johnson, AstraZenaca and Moderna are each involved in vaccines that met critical endpoints in early phases and have already advanced to large, Phase 3 efficacy trials. The rapid progress on this front is a testament to science. Additionally, it appears that treatment protocols involving antivirals and steroids have produced more favorable patient outcomes than were evident early in the outbreak. As a result, the death rate from Covid-19 has stabilized at much lower levels than originally believed. But the coronavirus remains a threat, especially given how easily it transmits and how dangerous it can be for the elderly and other high-risk groups. Until a vaccine is widely available, not likely for several more months, we would expect virus mitigation efforts to continue to limit economic recovery potential. We do not expect widespread lockdowns of businesses that would push the economy back into recession, however, better control of the virus will be needed to fully unleash economic growth potential.
The 2020 election cycle is now behind us. The race was tight and we expect the outcome will take some time to unfold due to the significant increase of mail-in voting and the wide range of state guidelines regarding those votes. It appears the Democrats will retain control of the House of Representatives and possibly more significant than the battle for the White House is the control of the Senate. We may well end up with one party controlling the presidency and the other in charge of the Senate. Unfortunately, it may be January before the Senate outcome is clear due to possible runoff elections in Georgia. In our opinion, having the Houses of Congress represented by different political parties would be desirable for investors as it may bring about more moderate and broadly supported long-term policy even though it would likely result in a smaller fiscal rescue package for the economy.
We have seen signs that a rotation from growth into value could be occurring, a welcome sign as value stocks have been out of favor in the market for some time. Historically, market leadership has rotated between the two styles. Over the last several months markets have shifted back and forth between favoring growth or value, depending on expectations for stimulus packages and progress on Covid. The recent sharp correction in the Nasdaq was in our opinion an early indication that broadening of the market is underway. We believe that in order for there to be a healthy market advance, value stocks need to participate. Economic growth is the key to this rotation. As progress is made towards better treatments and vaccines to fight Covid-19, economic prospects for 2021 and 2022 should improve greatly. And now that the election is over, we believe additional stimulus measures will be passed to support both individuals, businesses and state governments affected by the virus. This should help equity markets continue on a positive path and help advance the rotation to value stocks in particular.
1
Delving deeper into the growth versus value cycle can be instructive. The growth segment of the market has significantly outperformed the value segment for the last several years, leading to very narrow market leadership, akin to the technology bubble of the late 1990s. The Nasdaq, S&P 500 Index and other large-cap growth indices are near all-time high levels. These benchmarks are all heavily weighted towards a small group of technology companies represented by the now well-known acronym FAANG (Facebook, Apple, Amazon, Netflix and Alphabet (parent company of Google)). While these indices are at record levels, the average stock has not gotten back to its previous high price, and, in our opinion, is not excessively valued. Many of these companies offer attractive return potential, and we are focused on identifying opportunities among them. The Russell 1000 Growth forward P/E is now over 30 times, while value stocks like those in the Funds are on average 15 times or below, indicating what we believe is significant relative return potential for value stocks.
FBP Equity & Dividend Plus Fund Review
The FBP Equity & Dividend Plus Fund and the S&P 500 Index returned 17.48% and 31.31% for the semi-annual period ended September 30, 2020. The Fund was invested 95.3% equity and 4.7% cash as of September 30, 2020.
The Fund’s results were helped this period by holdings in the Industrials, Materials and Consumer Discretionary sectors, and results were held back by lower returns in the Financials, Energy and Health Care sectors. Individual outperformers were United Parcel Service, ViacomCBS, Dow, Inc. and Broadcom Ltd. Royal Dutch Shell, Wells Fargo & Co. and Intel Corp. negatively affected returns. While the Fund achieved a very nice rebound from the March lows, the lack of exposure to the Tech heavy names in the Index held back relative returns. During the period, we purchased new positions in HP, Inc., Tyson Foods, Duke Energy, Amdocs and Devon Energy. We sold Molson Coors and Dominion Energy following reports they may alter their dividend policies. We also exited Ford, primarily through call option exercises.
The Fund does utilize as part of its investment discipline the use of covered call options as individual securities approach the top of the Adviser’s growth and price expectations. The Fund’s purpose in selling the call options is to generate additional cash flow to the Fund and to hedge the possibility the security may not achieve its price objective. In very strong stock markets, this discipline may limit the upside of the securities where options have been written, but in flat to negative markets, it may provide additional return. During the six months ended September 30, 2020, the amount of premiums generated from selling covered call options was $291,516.
FBP Appreciation & Income Opportunities Fund Review
The FBP Appreciation & Income Opportunities Fund returned 16.68% for the semi-annual period ended September 30, 2020. The S&P 500 Index returned 31.31% and the Bloomberg Barclays Intermediate U.S. Government/Credit Index returned 3.44% over the same period. The Fund was 72.9% equity, 16.7% fixed income and 10.4% cash as of September 30, 2020.
Industrials, Materials and Technology helped the Fund’s results this period. Energy, Utilities and Health Care were the weaker sectors. Leading individual performers were Freeport-McMoran, FedEx Corp., ViacomCBS and Apple, Inc. Royal Dutch Shell, General Electric, Well Fargo & Co. and Occidental Petroleum most negatively affected returns. During the period, we added First Energy to the Fund but sold it at a small loss once news broke that management of the company was allegedly involved in a political donation scheme to influence regulation. A new position in Intel was initiated and positions in Bristol-Myers Squibb, Tapesty and Devon Energy were increased. The Fund sold small positions in Carrier Global and Otis Worldwide. Carrier and Otis were spun out of United Technologies following its acquisition of Raytheon
2
Corp. We retained our holdings of United Technologies, which changed its name to Raytheon Technologies after completing the corporate reorganization. Positions were reduced in Apple, Inc. and Microsoft Corp. following strong price performance.
The Fund does utilize as part of its investment discipline the use of covered call options as individual securities approach the top of the Adviser’s growth and price expectations. The Fund’s purpose in selling the call options is to generate additional income to the Fund and to hedge the possibility the security may not achieve its price objective. In very strong stock markets, this discipline may limit the upside of the securities where options have been written, but in modest to negative markets, it may provide additional return. During the six months ended September 30, 2020, the amount of premiums generated from selling covered call options was $72,982.
We want to thank you for your continued support and investment in the Flippin, Bruce & Porter Funds. Please visit our website at www.fbpfunds.com for information on your Funds and the investment philosophy and process we utilize to achieve their investment objectives.

John T. Bruce, CFA
President - Portfolio Manager
November 6, 2020
Data presented reflects past performance, which is no guarantee of future results. Investment results and principal value will fluctuate so that shares, when redeemed, may be worth more or less than their original cost. Due to market volatility, current performance may be higher or lower than the performance shown. Updated performance information, current through the most recent month-end, is available by contacting the Funds at 1-866-738-1127.
This report is submitted for the general information of the shareholders of the Funds. It reflects our views, opinions and portfolio holdings as of the date of this letter. These views are subject to change at any time based upon market or other conditions. For more current information throughout the year please visit www.fbpfunds.com or call the Funds at 1-866-738-1127. This report is not authorized for distribution to prospective investors in the Funds unless accompanied by a current prospectus.
3
THE FLIPPIN, BRUCE & PORTER FUNDS
COMPARATIVE PERFORMANCE CHARTS
(Unaudited)
Performance for each Fund is compared to the most appropriate broad-based index, the S&P 500® Index, an unmanaged index of 500 large common stocks. Each Fund’s performance results are also compared to the Consumer Price Index, a measure of inflation; the Bloomberg Barclays Intermediate U.S. Government/Credit Index is also compared for the FBP Appreciation & Income Opportunities Fund.
FBP Equity & Dividend Plus Fund
Comparison of the Change in Value of a $10,000 Investment in FBP Equity & Dividend Plus Fund, the S&P 500® Index and the Consumer Price Index

4
THE FLIPPIN, BRUCE & PORTER FUNDS
COMPARATIVE PERFORMANCE CHARTS
(Unaudited) (Continued)
FBP Appreciation & Income Opportunities Fund
Comparison of the Change in Value of a $10,000 Investment in FBP Appreciation & Income Opportunities Fund, the S&P 500® Index, the Consumer Price Index and the Bloomberg Barclays Intermediate U.S. Government/Credit Index

Average Annual Total Returns (for periods ended September 30, 2020) |
||||
|
1 Year |
5 Years |
10 Years |
|
FBP Equity & Dividend Plus Fund (a) |
(11.25%) |
5.69% |
6.03% |
|
FBP Appreciation & Income Opportunities Fund (a) |
(5.86%) |
5.20% |
5.57% |
|
S&P 500® Index |
15.15% |
14.15% |
13.74% |
|
Consumer Price Index |
1.30% |
1.75% |
1.76% |
|
Bloomberg Barclays Intermediate U.S. Government/Credit Index |
6.32% |
3.39% |
2.91% |
|
(a) |
Total returns are a measure of the change in value of an investment in the Fund over the periods covered, which assumes any dividends or capital gains distributions are reinvested in shares of the Fund. Returns do not reflect the deduction of taxes a shareholder would pay on the Fund’s distributions or the redemption of Fund shares. |
5
FBP EQUITY & DIVIDEND PLUS FUND
PORTFOLIO INFORMATION
September 30, 2020 (Unaudited)
General Information |
|
|||
Net Asset Value Per Share |
$ | 21.17 | ||
Total Net Assets (Millions) |
$ | 23.2 | ||
Current Expense Ratio |
1.12 | % | ||
Portfolio Turnover |
13 | % | ||
Fund Inception Date |
7/30/1993 | |||
Stock Characteristics |
Fund |
S&P 500® |
||||||
Number of Stocks |
49 | 500 | ||||||
Weighted Avg Market Capitalization (Billions) |
$ | 97.6 | $ | 452.9 | ||||
Price-to-Earnings Ratio (Bloomberg 1 Yr. Forecast EPS) |
12.6 | 21.4 | ||||||
Price-to-Book Value |
1.6 | 3.8 | ||||||
Asset Allocation (% of Net Assets) |
|

Sector Diversification vs. the S&P 500® Index |

Ten Largest Equity Holdings |
% of Net Assets |
Broadcom, Inc. |
4.4% |
Merck & Company, Inc. |
3.4% |
Eaton Corporation plc |
3.0% |
International Business Machines Corporation |
2.9% |
JPMorgan Chase & Company |
2.7% |
Pfizer, Inc. |
2.7% |
Duke Energy Corporation |
2.7% |
Kellogg Company |
2.6% |
Johnson & Johnson |
2.6% |
J.M. Smucker Company (The) |
2.6% |
6
FBP APPRECIATION & INCOME OPPORTUNITIES FUND
PORTFOLIO INFORMATION
September 30, 2020 (Unaudited)
General Information |
||||
Net Asset Value Per Share |
$ | 16.68 | ||
Total Net Assets (Millions) |
$ | 28.1 | ||
Current Expense Ratio |
1.05 | % | ||
Portfolio Turnover |
11 | % | ||
Fund Inception Date |
7/3/1989 | |||
Asset Allocation (% of Net Assets) |
|

Common Stock Portfolio (72.9% of Net Assets ) |
Number of Stocks |
51 | |||
Weighted Avg Market Capitalization (Billions) |
$ | 227.3 | ||
Price-to-Earnings Ratio (Bloomberg 1 Yr. Forecast EPS) |
13.1 | |||
Price-to-Book Value |
1.6 |
Ten Largest Equity Holdings |
% of Net Assets |
JPMorgan Chase & Company |
3.4% |
Bank of America Corporation |
3.3% |
Broadcom, Inc. |
3.1% |
Microsoft Corporation |
2.6% |
Apple, Inc. |
2.5% |
Cisco Systems, Inc. |
2.4% |
Merck & Company, Inc. |
2.4% |
Eaton Corporation plc |
2.4% |
International Business Machines Corporation |
2.3% |
Walmart, Inc. |
2.2% |
Five Largest Sectors |
% of Net Assets |
Technology |
17.3% |
Financials |
15.1% |
Health Care |
9.5% |
Consumer Staples |
7.7% |
Industrials |
7.0% |
Fixed-Income Portfolio (16.7% of Net Assets) |
Number of Fixed-Income Securities |
9 |
Average Quality |
BBB+ |
Average Weighted Maturity |
1.8 yrs. |
Average Effective Duration |
1.8 yrs. |
Sector Breakdown |
% of Net Assets |
Consumer Staples |
1.8% |
Energy |
1.9% |
Financials |
7.5% |
Industrials |
1.9% |
Utilities |
1.8% |
U.S. Treasury Obligations |
1.8% |
7
FBP EQUITY & DIVIDEND PLUS FUND |
||||||||
COMMON STOCKS — 95.3% |
Shares |
Value |
||||||
Communications — 4.3% |
||||||||
AT&T, Inc. |
16,000 | $ | 456,160 | |||||
ViacomCBS, Inc. - Class B |
19,500 | 546,195 | ||||||
| 1,002,355 | ||||||||
Consumer Discretionary — 5.3% |
||||||||
Genuine Parts Company |
5,500 | 523,435 | ||||||
Kohl’s Corporation (a) |
8,500 | 157,505 | ||||||
Tapestry, Inc. (a) |
35,000 | 547,050 | ||||||
| 1,227,990 | ||||||||
Consumer Staples — 12.6% |
||||||||
Archer-Daniels-Midland Company |
12,500 | 581,125 | ||||||
J.M. Smucker Company (The) (a) |
5,200 | 600,704 | ||||||
Kellogg Company (a) |
9,500 | 613,605 | ||||||
Philip Morris International, Inc. |
5,300 | 397,447 | ||||||
Tyson Foods, Inc. - Class A |
3,600 | 214,128 | ||||||
Walmart, Inc. (a) |
3,700 | 517,667 | ||||||
| 2,924,676 | ||||||||
Energy — 5.8% |
||||||||
Chevron Corporation |
4,800 | 345,600 | ||||||
ConocoPhillips (a) |
8,500 | 279,140 | ||||||
Devon Energy Corporation |
26,000 | 245,960 | ||||||
Exxon Mobil Corporation |
6,600 | 226,578 | ||||||
Royal Dutch Shell plc - Class B - ADR |
10,000 | 242,200 | ||||||
| 1,339,478 | ||||||||
Financials — 16.0% |
||||||||
JPMorgan Chase & Company |
6,500 | 625,755 | ||||||
KeyCorp |
30,200 | 360,286 | ||||||
Lincoln National Corporation |
9,500 | 297,635 | ||||||
MetLife, Inc. |
10,200 | 379,134 | ||||||
People’s United Financial, Inc. |
25,000 | 257,750 | ||||||
Prudential Financial, Inc. |
6,000 | 381,120 | ||||||
Truist Financial Corporation |
15,500 | 589,775 | ||||||
U.S. Bancorp |
14,200 | 509,070 | ||||||
Wells Fargo & Company (a) |
13,500 | 317,385 | ||||||
| 3,717,910 | ||||||||
Health Care — 13.0% |
||||||||
Bristol-Myers Squibb Company |
7,800 | 470,262 | ||||||
CVS Health Corporation (a) |
9,000 | 525,600 | ||||||
Johnson & Johnson |
4,100 | 610,408 | ||||||
Merck & Company, Inc. (a) |
9,400 | 779,730 | ||||||
Pfizer, Inc. (a) |
17,000 | 623,900 | ||||||
| 3,009,900 | ||||||||
8
FBP EQUITY & DIVIDEND PLUS FUND |
||||||||
COMMON STOCKS — 95.3% (Continued) |
Shares |
Value |
||||||
Industrials — 9.8% |
||||||||
Eaton Corporation plc (a) |
6,800 | $ | 693,804 | |||||
Emerson Electric Company |
7,000 | 458,990 | ||||||
Raytheon Technologies Corporation |
9,200 | 529,368 | ||||||
United Parcel Service, Inc. - Class B (a) |
3,500 | 583,205 | ||||||
| 2,265,367 | ||||||||
Materials — 5.4% |
||||||||
Compass Minerals International, Inc. |
4,000 | 237,400 | ||||||
Dow, Inc. |
10,600 | 498,730 | ||||||
Nucor Corporation |
11,500 | 515,890 | ||||||
| 1,252,020 | ||||||||
Real Estate — 3.8% |
||||||||
Public Storage |
1,500 | 334,080 | ||||||
Simon Property Group, Inc. |
3,800 | 245,784 | ||||||
Ventas, Inc. |
6,900 | 289,524 | ||||||
| 869,388 | ||||||||
Technology — 15.6% |
||||||||
Amdocs Ltd. |
4,000 | 229,640 | ||||||
Broadcom, Inc. (a) |
2,800 | 1,020,096 | ||||||
Cisco Systems, Inc. |
15,000 | 590,850 | ||||||
HP, Inc. (a) |
29,500 | 560,205 | ||||||
Intel Corporation |
5,000 | 258,900 | ||||||
International Business Machines Corporation |
5,500 | 669,185 | ||||||
Texas Instruments, Inc. (a) |
2,000 | 285,580 | ||||||
| 3,614,456 | ||||||||
Utilities — 3.7% |
||||||||
Duke Energy Corporation |
7,000 | 619,920 | ||||||
PPL Corporation |
8,500 | 231,285 | ||||||
| 851,205 | ||||||||
Total Common Stocks (Cost $20,870,357) |
$ | 22,074,745 | ||||||
9
FBP EQUITY & DIVIDEND PLUS FUND |
||||||||
MONEY MARKET FUNDS — 5.0% |
Shares |
Value |
||||||
Fidelity Institutional Money Market Government Portfolio - Class I, 0.01% (b) (Cost $1,168,150) |
1,168,150 | $ | 1,168,150 | |||||
Total Investments at Value — 100.3% (Cost $22,038,507) |
$ | 23,242,895 | ||||||
Liabilities in Excess of Other Assets — (0.3%) |
(80,945 | ) | ||||||
Net Assets — 100.0% |
$ | 23,161,950 | ||||||
ADR - American Depositary Receipt. |
|
(a) |
Security covers a written call option. |
(b) |
The rate shown is the 7-day effective yield as of September 30, 2020. |
See accompanying notes to financial statements. |
|
10
FBP EQUITY & DIVIDEND PLUS FUND |
||||||||||||||||||||
COVERED WRITTEN CALL OPTIONS |
Contracts |
Notional |
Strike |
Expiration |
Value of |
|||||||||||||||
Broadcom, Inc. |
14 | $ | 510,048 | $ | 430.00 | 03/19/21 | $ | 19,880 | ||||||||||||
ConocoPhillips |
45 | 147,780 | 50.00 | 11/20/20 | 450 | |||||||||||||||
CVS Health Corporation |
40 | 233,600 | 75.00 | 11/20/20 | 280 | |||||||||||||||
Eaton Corporation plc |
20 | 204,060 | 92.50 | 10/16/20 | 22,200 | |||||||||||||||
Eaton Corporation plc |
48 | 489,744 | 100.00 | 01/15/21 | 39,840 | |||||||||||||||
HP, Inc. |
90 | 170,910 | 22.00 | 04/16/21 | 9,810 | |||||||||||||||
J.M. Smucker Company (The) |
25 | 288,800 | 130.00 | 04/16/21 | 11,500 | |||||||||||||||
Kellogg Company |
45 | 290,655 | 75.00 | 01/15/21 | 2,250 | |||||||||||||||
Kohl’s Corporation |
50 | 92,650 | 30.00 | 10/16/20 | 100 | |||||||||||||||
Merck & Company, Inc. |
45 | 373,275 | 90.00 | 01/15/21 | 7,875 | |||||||||||||||
Pfizer, Inc. |
95 | 348,650 | 41.00 | 01/15/21 | 8,075 | |||||||||||||||
Tapestry, Inc. |
100 | 156,300 | 25.00 | 02/19/21 | 3,500 | |||||||||||||||
Texas Instruments, Inc. |
20 | 285,580 | 140.00 | 10/16/20 | 10,800 | |||||||||||||||
United Parcel Service, Inc. - Class B |
35 | 583,205 | 155.00 | 01/15/21 | 67,725 | |||||||||||||||
Walmart, Inc. |
37 | 517,667 | 125.00 | 01/15/21 | 68,709 | |||||||||||||||
Wells Fargo & Company |
70 | 164,570 | 35.00 | 10/16/20 | 70 | |||||||||||||||
Total Covered Written Call Options (Premiums received $211,968) |
$ | 4,857,494 | $ | 273,064 | ||||||||||||||||
See accompanying notes to financial statements. |
11
FBP APPRECIATION & INCOME OPPORTUNITIES FUND |
||||||||
COMMON STOCKS — 72.9% |
Shares |
Value |
||||||
Communications — 2.6% |
||||||||
AT&T, Inc. |
5,000 | $ | 142,550 | |||||
CenturyLink, Inc. |
15,000 | 151,350 | ||||||
ViacomCBS, Inc. - Class B |
15,000 | 420,150 | ||||||
| 714,050 | ||||||||
Consumer Discretionary — 4.3% |
||||||||
Carnival Corporation |
8,500 | 129,030 | ||||||
Ford Motor Company |
26,000 | 173,160 | ||||||
Kohl’s Corporation (a) |
10,000 | 185,300 | ||||||
Tapestry, Inc. |
32,000 | 500,160 | ||||||
TJX Companies, Inc. (The) |
4,000 | 222,600 | ||||||
| 1,210,250 | ||||||||
Consumer Staples — 7.7% |
||||||||
Archer-Daniels-Midland Company |
9,000 | 418,410 | ||||||
Kellogg Company |
8,500 | 549,015 | ||||||
Philip Morris International, Inc. |
3,300 | 247,467 | ||||||
Target Corporation |
2,000 | 314,840 | ||||||
Walmart, Inc. (a) |
4,500 | 629,595 | ||||||
| 2,159,327 | ||||||||
Energy — 4.2% |
||||||||
Chevron Corporation |
4,000 | 288,000 | ||||||
ConocoPhillips (a) |
6,000 | 197,040 | ||||||
Devon Energy Corporation |
40,000 | 378,400 | ||||||
Royal Dutch Shell plc - Class B - ADR |
13,000 | 314,860 | ||||||
| 1,178,300 | ||||||||
Financials — 15.1% |
||||||||
Bank of America Corporation |
38,000 | 915,420 | ||||||
Bank of New York Mellon Corporation (The) |
6,000 | 206,040 | ||||||
Capital One Financial Corporation |
6,000 | 431,160 | ||||||
JPMorgan Chase & Company |
10,000 | 962,700 | ||||||
KeyCorp |
16,320 | 194,698 | ||||||
Lincoln National Corporation |
12,500 | 391,625 | ||||||
MetLife, Inc. |
12,000 | 446,040 | ||||||
Travelers Companies, Inc. (The) |
3,600 | 389,484 | ||||||
Wells Fargo & Company |
13,000 | 305,630 | ||||||
| 4,242,797 | ||||||||
Health Care — 9.5% |
||||||||
Bristol-Myers Squibb Company |
8,000 | 482,320 | ||||||
CVS Health Corporation (a) |
7,500 | 438,000 | ||||||
Johnson & Johnson |
4,000 | 595,520 | ||||||
Merck & Company, Inc. (a) |
8,000 | 663,600 | ||||||
Pfizer, Inc. |
13,500 | 495,450 | ||||||
| 2,674,890 | ||||||||
12
FBP APPRECIATION & INCOME OPPORTUNITIES FUND |
||||||||
COMMON STOCKS — 72.9% (Continued) |
Shares |
Value |
||||||
Industrials — 7.0% |
||||||||
Eaton Corporation plc |
6,500 | $ | 663,195 | |||||
FedEx Corporation |
2,500 | 628,800 | ||||||
General Electric Company |
25,000 | 155,750 | ||||||
Raytheon Technologies Corporation |
4,000 | 230,160 | ||||||
Trane Technologies plc |
2,400 | 291,000 | ||||||
| 1,968,905 | ||||||||
Materials — 3.8% |
||||||||
Compass Minerals International, Inc. |
5,000 | 296,750 | ||||||
Freeport-McMoRan, Inc. |
11,000 | 172,040 | ||||||
Mosaic Company (The) |
11,000 | 200,970 | ||||||
Nucor Corporation |
8,500 | 381,310 | ||||||
| 1,051,070 | ||||||||
Real Estate — 0.5% |
||||||||
Simon Property Group, Inc. |
2,200 | 142,296 | ||||||
Technology — 17.3% |
||||||||
Apple, Inc. |
6,000 | 694,860 | ||||||
Broadcom, Inc. (a) |
2,400 | 874,368 | ||||||
Cisco Systems, Inc. |
17,000 | 669,630 | ||||||
HP, Inc. |
28,000 | 531,720 | ||||||
Intel Corporation |
4,500 | 233,010 | ||||||
International Business Machines Corporation |
5,200 | 632,684 | ||||||
Microsoft Corporation |
3,500 | 736,155 | ||||||
Nokia Corporation - ADR |
87,000 | 340,170 | ||||||
Western Union Company (The) |
7,000 | 150,010 | ||||||
| 4,862,607 | ||||||||
Utilities — 0.9% |
||||||||
PPL Corporation |
9,000 | 244,890 | ||||||
Total Common Stocks (Cost $15,364,448) |
$ | 20,449,382 | ||||||
|
||||||||
CORPORATE BONDS — 14.9% |
Par Value |
Value |
||||||
Consumer Staples — 1.8% |
||||||||
Kroger Company (The), 2.60%, due 02/01/2021 |
$ | 500,000 | $ | 502,764 | ||||
Energy — 1.9% |
||||||||
Pioneer Natural Resources Company, 3.95%, due 07/15/2022 |
500,000 | 522,202 | ||||||
13
FBP APPRECIATION & INCOME OPPORTUNITIES FUND |
||||||||
CORPORATE BONDS — 14.9% (Continued) |
Par Value |
Value |
||||||
Financials — 7.5% |
||||||||
America Express Company, 3.40%, due 02/27/2023 |
$ | 500,000 | $ | 532,682 | ||||
Citigroup, Inc., 2.90%, due 12/08/2021 |
500,000 | 513,624 | ||||||
UNUM Group, 4.00%, due 03/15/2024 |
500,000 | 541,928 | ||||||
Wells Fargo & Company, 3.50%, due 03/08/2022 |
500,000 | 521,162 | ||||||
| 2,109,396 | ||||||||
Industrials — 1.9% |
||||||||
Norfolk Sothern Corporation, 3.85%, due 01/15/2024 |
500,000 | 547,701 | ||||||
Utilities — 1.8% |
||||||||
PSEG Power, LLC, 3.00%, due 06/15/2021 |
500,000 | 508,119 | ||||||
Total Corporate Bonds (Cost $4,042,985) |
$ | 4,190,182 | ||||||
|
||||||||
U.S. TREASURY OBLIGATIONS — 1.8% |
Par Value |
Value |
||||||
U.S. Treasury Notes — 1.8% |
||||||||
2.125%, due 05/15/2022 (Cost $503,610) |
$ | 500,000 | $ | 516,211 | ||||
|
||||||||
MONEY MARKET FUNDS — 11.2% |
Shares |
Value |
||||||
Fidelity Institutional Money Market Government Portfolio - Class I, 0.01% (b) |
2,730,870 | $ | 2,730,870 | |||||
First American Government Obligations Fund - Class Z, 0.04% (b) |
406,108 | 406,108 | ||||||
Total Money Market Funds (Cost $3,136,978) |
$ | 3,136,978 | ||||||
Total Investments at Value — 100.8% (Cost $23,048,021) |
$ | 28,292,753 | ||||||
Liabilities in Excess of Other Assets — (0.8%) |
(218,402 | ) | ||||||
Net Assets — 100.0% |
$ | 28,074,351 | ||||||
ADR - American Depositary Receipt. |
|
(a) |
Security covers a written call option. |
(b) |
The rate shown is the 7-day effective yield as of September 30, 2020. |
See accompanying notes to financial statements. |
|
14
FBP APPRECIATION & INCOME OPPORTUNITIES FUND |
||||||||||||||||||||
COVERED WRITTEN CALL OPTIONS |
Contracts |
Notional |
Strike |
Expiration |
Value of |
|||||||||||||||
Broadcom, Inc. |
10 | $ | 364,320 | $ | 430.00 | 03/19/21 | $ | 14,200 | ||||||||||||
ConocoPhillips |
30 | 98,520 | 50.00 | 11/20/20 | 300 | |||||||||||||||
CVS Health Corporation |
25 | 146,000 | 75.00 | 11/20/20 | 175 | |||||||||||||||
Kohl’s Corporation |
50 | 92,650 | 30.00 | 10/16/20 | 100 | |||||||||||||||
Merck & Company, Inc. |
18 | 149,310 | 90.00 | 01/15/21 | 3,150 | |||||||||||||||
Walmart, Inc. |
15 | 209,865 | 125.00 | 01/15/21 | 27,855 | |||||||||||||||
Total Covered Written Call Options (Premiums received $55,132) |
$ | 1,060,665 | $ | 45,780 | ||||||||||||||||
See accompanying notes to financial statements. |
15
THE FLIPPIN, BRUCE & PORTER FUNDS |
||||||||
|
FBP Equity |
FBP |
||||||
ASSETS |
||||||||
Investments in securities: |
||||||||
At cost |
$ | 22,038,507 | $ | 23,048,021 | ||||
At value (Note 2) |
$ | 23,242,895 | $ | 28,292,753 | ||||
Receivable for capital shares sold |
169,893 | 211,009 | ||||||
Receivable for investment securities sold |
— | 3,005 | ||||||
Dividends and interest receivable |
46,663 | 61,369 | ||||||
Other assets |
13,642 | 13,001 | ||||||
TOTAL ASSETS |
23,473,093 | 28,581,137 | ||||||
LIABILITIES |
||||||||
Written call options, at value (Notes 2 and 5) (premiums received $211,968 and $55,132, respectively) |
273,064 | 45,780 | ||||||
Distributions payable |
2,637 | 10,564 | ||||||
Payable for capital shares redeemed |
20,888 | 16,298 | ||||||
Payable for investment securities purchased |
— | 415,913 | ||||||
Accrued investment advisory fees (Note 4) |
5,584 | 8,851 | ||||||
Payable to administrator (Note 4) |
5,580 | 5,580 | ||||||
Other accrued expenses |
3,390 | 3,800 | ||||||
TOTAL LIABILITIES |
311,143 | 506,786 | ||||||
NET ASSETS |
$ | 23,161,950 | $ | 28,074,351 | ||||
NET ASSETS CONSIST OF: |
||||||||
Paid-in capital |
$ | 22,373,120 | $ | 22,993,151 | ||||
Accumulated earnings |
788,830 | 5,081,200 | ||||||
Net assets |
$ | 23,161,950 | $ | 28,074,351 | ||||
Shares of beneficial interest outstanding (unlimited number of shares authorized, $0.01 par value) |
1,094,153 | 1,683,326 | ||||||
Net asset value, offering price and redemption price per share (Note 2) |
$ | 21.17 | $ | 16.68 | ||||
See accompanying notes to financial statements. |
16
THE FLIPPIN, BRUCE & PORTER FUNDS |
||||||||
|
FBP Equity |
FBP |
||||||
INVESTMENT INCOME |
||||||||
Dividends |
$ | 445,061 | $ | 333,908 | ||||
Interest |
— | 66,891 | ||||||
TOTAL INVESTMENT INCOME |
445,061 | 400,799 | ||||||
EXPENSES |
||||||||
Investment advisory fees (Note 4) |
80,359 | 97,760 | ||||||
Administration fees (Note 4) |
30,000 | 30,000 | ||||||
Audit and tax services fees |
9,500 | 9,500 | ||||||
Registration and filing fees |
9,294 | 9,270 | ||||||
Trustees’ fees (Note 4) |
7,500 | 7,500 | ||||||
Printing of shareholder reports |
5,647 | 3,478 | ||||||
Legal fees |
3,952 | 3,952 | ||||||
Custodian and bank service fees |
3,796 | 3,664 | ||||||
Compliance service fees (Note 4) |
3,497 | 3,497 | ||||||
Postage and supplies |
2,488 | 1,957 | ||||||
Account maintenance fees |
772 | 1,114 | ||||||
Insurance expense |
508 | 516 | ||||||
Other expenses |
2,661 | 3,708 | ||||||
TOTAL EXPENSES |
159,974 | 175,916 | ||||||
Fees reduced by the Adviser (Note 4) |
(37,139 | ) | (36,259 | ) | ||||
NET EXPENSES |
122,835 | 139,657 | ||||||
NET INVESTMENT INCOME |
322,226 | 261,142 | ||||||
REALIZED AND UNREALIZED GAINS (LOSSES) ON INVESTMENTS AND WRITTEN OPTION CONTRACTS |
||||||||
Net realized gains (losses) from: |
||||||||
Investment transactions |
(451,164 | ) | (116,363 | ) | ||||
Written option contracts (Note 5) |
175,149 | 73,257 | ||||||
Net change in unrealized appreciation (depreciation) on: |
||||||||
Investment transactions |
3,740,245 | 3,996,401 | ||||||
Written option contracts (Note 5) |
(153,324 | ) | (32,990 | ) | ||||
NET REALIZED AND UNREALIZED GAINS ON INVESTMENTS AND WRITTEN OPTION CONTRACTS |
3,310,906 | 3,920,305 | ||||||
NET INCREASE IN NET ASSETS FROM OPERATIONS |
$ | 3,633,132 | $ | 4,181,447 | ||||
See accompanying notes to financial statements. |
17
FBP EQUITY & DIVIDEND PLUS FUND |
||||||||
|
Six Months |
Year Ended |
||||||
FROM OPERATIONS |
||||||||
Net investment income |
$ | 322,226 | $ | 753,622 | ||||
Net realized gains (losses) from: |
||||||||
Investment transactions |
(451,164 | ) | 866,361 | |||||
Written option contracts (Note 5) |
175,149 | 5,965 | ||||||
Net change in unrealized appreciation (depreciation) on: |
||||||||
Investment transactions |
3,740,245 | (7,770,619 | ) | |||||
Written option contracts (Note 5) |
(153,324 | ) | 148,826 | |||||
Net increase (decrease) in net assets from operations |
3,633,132 | (5,995,845 | ) | |||||
DISTRIBUTIONS TO SHAREHOLDERS (Note 2) |
(326,895 | ) | (1,862,805 | ) | ||||
FROM CAPITAL SHARE TRANSACTIONS |
||||||||
Proceeds from shares sold |
361,125 | 706,131 | ||||||
Net asset value of shares issued in reinvestment of distributions to shareholders |
321,593 | 1,835,780 | ||||||
Payments for shares redeemed |
(1,745,680 | ) | (2,379,340 | ) | ||||
Net increase (decrease) in net assets from capital share transactions |
(1,062,962 | ) | 162,571 | |||||
TOTAL INCREASE (DECREASE) IN NET ASSETS |
2,243,275 | (7,696,079 | ) | |||||
NET ASSETS |
||||||||
Beginning of period |
20,918,675 | 28,614,754 | ||||||
End of period |
$ | 23,161,950 | $ | 20,918,675 | ||||
CAPITAL SHARE ACTIVITY |
||||||||
Shares sold |
17,477 | 29,464 | ||||||
Shares reinvested |
15,427 | 75,041 | ||||||
Shares redeemed |
(82,909 | ) | (96,146 | ) | ||||
Net increase (decrease) in shares outstanding |
(50,005 | ) | 8,359 | |||||
Shares outstanding, beginning of period |
1,144,158 | 1,135,799 | ||||||
Shares outstanding, end of period |
1,094,153 | 1,144,158 | ||||||
See accompanying notes to financial statements. |
18
FBP APPRECIATION & INCOME OPPORTUNITIES FUND |
||||||||
|
Six Months |
Year Ended |
||||||
FROM OPERATIONS |
||||||||
Net investment income |
$ | 261,142 | $ | 653,523 | ||||
Net realized gains (losses) from: |
||||||||
Investment transactions |
(116,363 | ) | 918,263 | |||||
Written option contracts (Note 5) |
73,257 | (82,368 | ) | |||||
Net change in unrealized appreciation (depreciation) on: |
||||||||
Investment transactions |
3,996,401 | (7,297,718 | ) | |||||
Written option contracts (Note 5) |
(32,990 | ) | 42,342 | |||||
Net increase (decrease) in net assets from operations |
4,181,447 | (5,765,958 | ) | |||||
DISTRIBUTIONS TO SHAREHOLDERS (Note 2) |
(261,543 | ) | (2,084,951 | ) | ||||
FROM CAPITAL SHARE TRANSACTIONS |
||||||||
Proceeds from shares sold |
301,327 | 506,506 | ||||||
Net asset value of shares issued in reinvestment of distributions to shareholders |
240,539 | 2,020,586 | ||||||
Payments for shares redeemed |
(1,674,558 | ) | (2,765,454 | ) | ||||
Net decrease in net assets from capital share transactions |
(1,132,692 | ) | (238,362 | ) | ||||
TOTAL INCREASE (DECREASE) IN NET ASSETS |
2,787,212 | (8,089,271 | ) | |||||
NET ASSETS |
||||||||
Beginning of period |
25,287,139 | 33,376,410 | ||||||
End of period |
$ | 28,074,351 | $ | 25,287,139 | ||||
CAPITAL SHARE ACTIVITY |
||||||||
Shares sold |
18,122 | 28,002 | ||||||
Shares reinvested |
14,643 | 109,664 | ||||||
Shares redeemed |
(101,372 | ) | (150,760 | ) | ||||
Net decrease in shares outstanding |
(68,607 | ) | (13,094 | ) | ||||
Shares outstanding, beginning of period |
1,751,933 | 1,765,027 | ||||||
Shares outstanding, end of period |
1,683,326 | 1,751,933 | ||||||
See accompanying notes to financial statements. |
19
FBP EQUITY & DIVIDEND PLUS FUND |
||||||||||||||||||||||||
Selected Per Share Data for a Share Outstanding Throughout Each Period |
||||||||||||||||||||||||
Six Months |
Years Ended March 31, |
|||||||||||||||||||||||
|
2020 |
2020 |
2019 |
2018 |
2017 |
2016 |
||||||||||||||||||
Net asset value at beginning of period |
$ | 18.28 | $ | 25.19 | $ | 25.68 | $ | 25.96 | $ | 22.65 | $ | 24.89 | ||||||||||||
Income (loss) from investment operations: |
||||||||||||||||||||||||
Net investment income |
0.30 | 0.67 | 0.60 | 0.57 | 0.50 | 0.61 | ||||||||||||||||||
Net realized and unrealized gains (losses) on investments and written option contracts |
2.89 | (5.90 | ) | 0.83 | 1.38 | 3.37 | (1.21 | ) | ||||||||||||||||
Total from investment operations |
3.19 | (5.23 | ) | 1.43 | 1.95 | 3.87 | (0.60 | ) | ||||||||||||||||
Less distributions: |
||||||||||||||||||||||||
From net investment income |
(0.30 | ) | (0.67 | ) | (0.60 | ) | (0.57 | ) | (0.50 | ) | (0.61 | ) | ||||||||||||
From net realized gains |
— | (1.01 | ) | (1.32 | ) | (1.66 | ) | (0.06 | ) | (1.03 | ) | |||||||||||||
Total distributions |
(0.30 | ) | (1.68 | ) | (1.92 | ) | (2.23 | ) | (0.56 | ) | (1.64 | ) | ||||||||||||
Net asset value at end of period |
$ | 21.17 | $ | 18.28 | $ | 25.19 | $ | 25.68 | $ | 25.96 | $ | 22.65 | ||||||||||||
Total return (a) |
17.48 | %(b) | (22.33 | %) | 5.64 | % | 7.91 | % | 17.29 | % | (2.31 | %) | ||||||||||||
Net assets at end of period (000’s) |
$ | 23,162 | $ | 20,919 | $ | 28,615 | $ | 26,279 | $ | 27,415 | $ | 24,764 | ||||||||||||
Ratio of total expenses to average net assets |
1.39 | %(c) | 1.25 | % | 1.23 | % | 1.24 | % | 1.25 | % | 1.19 | % | ||||||||||||
Ratio of net expenses to average net assets (d) |
1.07 | %(c) | 1.07 | % | 1.07 | % | 1.07 | % | 1.07 | % | 1.07 | % | ||||||||||||
Ratio of net investment income to average net assets (d) |
2.81 | %(c) | 2.70 | % | 2.35 | % | 2.19 | % | 2.07 | % | 2.60 | % | ||||||||||||
Portfolio turnover rate |
13 | %(b) | 38 | % | 18 | % | 18 | % | 19 | % | 21 | % | ||||||||||||
(a) |
Total return is a measure of the change in value of an investment in the Fund over the periods covered, which assumes any dividends or capital gains distributions are reinvested in shares of the Fund. The returns shown do not reflect the deduction of taxes a shareholder would pay on Fund distributions or the redemption of Fund shares. The total returns would have been lower if the Adviser had not waived/reduced advisory fees. |
(b) |
Not annualized. |
(c) |
Annualized. |
(d) |
Ratios were determined after advisory fee waivers/reductions by the Adviser (Note 4). |
See accompanying notes to financial statements. |
|
20
FBP APPRECIATION & INCOME OPPORTUNITIES FUND |
||||||||||||||||||||||||
Selected Per Share Data for a Share Outstanding Throughout Each Period |
||||||||||||||||||||||||
Six Months |
Years Ended March 31, |
|||||||||||||||||||||||
|
2020 |
2020 |
2019 |
2018 |
2017 |
2016 |
||||||||||||||||||
Net asset value at beginning of period |
$ | 14.43 | $ | 18.91 | $ | 18.99 | $ | 18.81 | $ | 16.55 | $ | 18.53 | ||||||||||||
Income (loss) from investment operations: |
||||||||||||||||||||||||
Net investment income |
0.15 | 0.38 | 0.37 | 0.41 | 0.28 | 0.31 | ||||||||||||||||||
Net realized and unrealized gains (losses) on investments and written option contracts |
2.25 | (3.65 | ) | 0.28 | 1.03 | 2.28 | (1.11 | ) | ||||||||||||||||
Total from investment operations |
2.40 | (3.27 | ) | 0.65 | 1.44 | 2.56 | (0.80 | ) | ||||||||||||||||
Less distributions: |
||||||||||||||||||||||||
From net investment income |
(0.15 | ) | (0.38 | ) | (0.37 | ) | (0.41 | ) | (0.28 | ) | (0.32 | ) | ||||||||||||
From net realized gains |
— | (0.83 | ) | (0.36 | ) | (0.85 | ) | (0.02 | ) | (0.86 | ) | |||||||||||||
Total distributions |
(0.15 | ) | (1.21 | ) | (0.73 | ) | (1.26 | ) | (0.30 | ) | (1.18 | ) | ||||||||||||
Net asset value at end of period |
$ | 16.68 | $ | 14.43 | $ | 18.91 | $ | 18.99 | $ | 18.81 | $ | 16.55 | ||||||||||||
Total return (a) |
16.68 | %(b) | (18.56 | %) | 3.44 | % | 7.91 | % | 15.58 | % | (4.48 | %) | ||||||||||||
Net assets at end of period (000’s) |
$ | 28,074 | $ | 25,287 | $ | 33,376 | $ | 34,614 | $ | 34,069 | $ | 31,669 | ||||||||||||
Ratio of total expenses to average net assets |
1.26 | %(c) | 1.16 | % | 1.12 | % | 1.10 | % | 1.12 | % | 1.05 | % | ||||||||||||
Ratio of net expenses to average net assets (d) |
1.00 | %(c) | 1.00 | % | 1.00 | % | 1.00 | % | 1.00 | % | 1.00 | % | ||||||||||||
Ratio of net investment income to average net assets (d) |
1.87 | %(c) | 2.03 | % | 1.89 | % | 2.16 | % | 1.57 | % | 1.75 | % | ||||||||||||
Portfolio turnover rate |
11 | %(b) | 18 | % | 21 | % | 10 | % | 18 | % | 23 | % | ||||||||||||
(a) |
Total return is a measure of the change in value of an investment in the Fund over the periods covered, which assumes any dividends or capital gains distributions are reinvested in shares of the Fund. The returns shown do not reflect the deduction of taxes a shareholder would pay on Fund distributions or the redemption of Fund shares. The total returns would have been lower if the Adviser had not waived/reduced advisory fees. |
(b) |
Not annualized. |
(c) |
Annualized. |
(d) |
Ratios were determined after advisory fee waivers/reductions by the Adviser (Note 4). |
See accompanying notes to financial statements. |
|
21
THE FLIPPIN, BRUCE & PORTER FUNDS |
1. Organization
FBP Equity & Dividend Plus Fund and FBP Appreciation & Income Opportunities Fund (each a “Fund” and collectively the “Funds”) are no-load, diversified series of Williamsburg Investment Trust (the “Trust”), an open-end management investment company registered under the Investment Company Act of 1940, as amended (the “1940 Act”). The Trust was organized as a Massachusetts business trust on July 18, 1988. Other series of the Trust are not included in this report.
The investment objective of FBP Equity & Dividend Plus Fund is to provide above-average and growing income while also achieving long-term growth of capital.
The investment objectives of FBP Appreciation & Income Opportunities Fund are long term capital appreciation and current income, assuming a moderate level of investment risk.
2. Significant Accounting Policies
Each Fund follows accounting and reporting guidance under Financial Accounting Standards Board (“FASB”) Accounting Standards Codification Topic 946, “Financial Services – Investment Companies.” The following is a summary of the Funds’ significant accounting policies. These policies are in conformity with accounting principles generally accepted in the United States of America (“GAAP”).
Securities valuation — The Funds’ portfolio securities are valued as of the close of business of the regular session of the New York Stock Exchange (normally 4:00 p.m. Eastern time). Securities traded on a national stock exchange, including common stocks and closed-end investment companies, if any, are valued based upon the closing price on the principal exchange where the security is traded, if available, otherwise, at the last quoted bid price. Securities that are quoted by NASDAQ are valued at the NASDAQ Official Closing Price. Covered call options written by the Funds are valued at the last quoted sale price or, in the absence of a sale, at the ask price on the principal exchanges on which they are traded. Investments representing shares of money market funds and other open-end investment companies are valued at their net asset value (“NAV”) as reported by such companies. When using a quoted price and when the market is considered active, securities will be classified as Level 1 within the fair value hierarchy (see below).
Fixed income securities, including U.S. Treasury obligations and corporate bonds, are typically valued on the basis of prices provided by an independent pricing service. The prices provided by the pricing service are determined with consideration given to institutional bid and last sale prices and take into account securities prices, yields, maturities, call features, ratings, institutional trading in similar groups of securities, and developments related to specific securities. Given the inputs used by the pricing service, these securities are classified as Level 2 within the fair value hierarchy.
When market quotations are not readily available, if a pricing service cannot provide a price, or if the investment adviser believes the price received from the pricing service is not indicative of market value, securities will be valued in good faith at fair value using methods consistent with procedures adopted by the Board of Trustees and will be classified as Level 2 or 3 within the fair value hierarchy, depending on the inputs used. Such methods of fair valuation may include, but are not limited to: multiple of earnings,
22
THE FLIPPIN, BRUCE & PORTER FUNDS |
multiple of book value, discount from market of a similar freely traded security, purchase price of the security, subsequent private transactions in the security or related securities, or a combination of these and other factors.
GAAP establishes a single authoritative definition of fair value, sets out a framework for measuring fair value and requires additional disclosures about fair value measurements. Various inputs are used in determining the value of each Fund’s investments. These inputs are summarized in the three broad levels listed below:
|
● |
Level 1 – quoted prices in active markets for identical securities |
|
● |
Level 2 – other significant observable inputs |
|
● |
Level 3 – significant unobservable inputs |
The inputs or methodology used for valuing securities are not necessarily an indication of the risks associated with investing in those securities. The inputs used to measure fair value may fall into different levels of the fair value hierarchy. In such cases, for disclosure purposes, the level in the fair value hierarchy within which the fair value measurement falls in its entirety is determined based on the lowest level input that is significant to the fair value measurement.
The following is a summary of each Fund’s investments and other financial instruments based on the inputs used to value the investments as of September 30, 2020, by security type:
FBP Equity & Dividend Plus Fund |
Level 1 |
Level 2 |
Level 3 |
Total |
||||||||||||
Investments in Securities: |
||||||||||||||||
Common Stocks |
$ | 22,074,745 | $ | — | $ | — | $ | 22,074,745 | ||||||||
Money Market Funds |
1,168,150 | — | — | 1,168,150 | ||||||||||||
Total |
$ | 23,242,895 | $ | — | $ | — | $ | 23,242,895 | ||||||||
Other Financial Instruments: |
||||||||||||||||
Covered Written Call Options |
$ | (217,134 | ) | $ | (55,930 | ) | $ | — | $ | (273,064 | ) | |||||
Total |
$ | (217,134 | ) | $ | (55,930 | ) | $ | — | $ | (273,064 | ) | |||||
FBP Appreciation & Income |
Level 1 |
Level 2 |
Level 3 |
Total |
||||||||||||
Investments in Securities: |
||||||||||||||||
Common Stocks |
$ | 20,449,382 | $ | — | $ | — | $ | 20,449,382 | ||||||||
Corporate Bonds |
— | 4,190,182 | — | 4,190,182 | ||||||||||||
U.S. Treasury Obligations |
— | 516,211 | — | 516,211 | ||||||||||||
Money Market Funds |
3,136,978 | — | — | 3,136,978 | ||||||||||||
Total |
$ | 23,586,360 | $ | 4,706,393 | $ | — | $ | 28,292,753 | ||||||||
Other Financial Instruments: |
||||||||||||||||
Covered Written Call Options |
$ | (31,580 | ) | $ | (14,200 | ) | $ | — | $ | (45,780 | ) | |||||
Total |
$ | (31,580 | ) | $ | (14,200 | ) | $ | — | $ | (45,780 | ) | |||||
23
THE FLIPPIN, BRUCE & PORTER FUNDS |
Refer to each Fund’s Schedule of Investments for a listing of the common stocks and corporate bonds by sector type. There were no Level 3 investments held by the Funds as of or during the six months ended September 30, 2020.
Share valuation — The NAV per share of each Fund is calculated daily by dividing the total value of its assets, less liabilities, by the number of shares outstanding. The offering price and redemption price per share of each Fund is equal to its NAV per share.
Investment income — Dividend income is recorded on the ex-dividend date. Non-cash dividends included in dividend income, if any, are recorded at the fair market value of the security received. Interest income is accrued as earned. Discounts and premiums on fixed income securities purchased are amortized using the interest method. Withholding taxes on foreign dividends have been recorded in accordance with the Funds’ understanding of the applicable country’s rules and tax rates.
Distributions to shareholders — Dividends arising from net investment income are declared and paid quarterly to shareholders of each Fund. Net realized short-term capital gains, if any, may be distributed throughout the year and net realized long-term capital gains, if any, are distributed at least once each year. The amount of distributions from net investment income and net realized capital gains are determined in accordance with federal income tax regulations, which may differ from GAAP. These “book/tax” differences are either temporary or permanent in nature. Dividends and distributions are recorded on the ex-dividend date. The tax character of distributions paid during the periods ended September 30, 2020 and March 31, 2020 was as follows:
|
Period |
Ordinary |
Long-Term |
Total |
||||||||||||
FBP Equity & Dividend Plus Fund |
09/30/20 | $ | 326,895 | $ | — | $ | 326,895 | |||||||||
| 03/31/20 | $ | 823,397 | $ | 1,038,197 | $ | 1,861,594 | ||||||||||
FBP Appreciation & Income |
09/30/20 | $ | 261,543 | $ | — | $ | 261,543 | |||||||||
Opportunities Fund |
03/31/20 | $ | 662,167 | $ | 1,423,747 | $ | 2,085,914 | |||||||||
Investment transactions — Investment transactions are accounted for on trade date for financial reporting purposes. Realized gains and losses on investments sold are determined on a specific identification basis.
Common expenses — Common expenses of the Trust are allocated among the Funds and the other series of the Trust based on relative net assets of each series or the nature of the services performed and the relative applicability to each series.
Options transactions — When the Funds’ investment adviser believes that individual portfolio investment securities held by the Funds are approaching the top of the adviser’s growth and price expectations, covered call options can be written (sold) against such securities and the Funds will receive a premium in return. The Funds write options only for income generation and hedging purposes and not for speculation. The premiums received from writing the options are recorded as a liability and are subsequently valued daily at the closing prices on their primary exchanges. Premiums received from writing options that expire are treated as realized gains. Premiums received from writing options that are exercised increase the proceeds used to calculate the realized gain or loss on the sale of the underlying security. If a closing purchase transaction is used to
24
THE FLIPPIN, BRUCE & PORTER FUNDS |
terminate a Fund’s obligation on a call option, a gain or loss will be realized, depending upon whether the price of the closing purchase transaction is more or less than the premium previously received on the call option written.
Estimates — The preparation of financial statements in conformity with GAAP requires management to make estimates and assumptions that affect the reported amounts of assets and liabilities and the disclosure of contingent assets and liabilities, each as of the date of the financial statements, and the reported amounts of increase (decrease) in net assets from operation during the reporting period. Actual results could differ from those estimates.
Federal income tax — Each Fund has qualified and intends to continue to qualify as a regulated investment company under the Internal Revenue Code of 1986, as amended (the “Code”). Qualification generally will relieve the Funds of liability for federal income taxes to the extent 100% of their net investment income and any net realized capital gains are distributed in accordance with the Code.
In order to avoid imposition of the excise tax applicable to regulated investment companies, it is also each Fund’s intention to declare as dividends in each calendar year at least 98% of its net investment income (earned during the calendar year) and 98.2% of its net realized capital gains (earned during the twelve months ended October 31) plus undistributed amounts from prior years.
The following information is computed on a tax basis for each item as of September 30, 2020:
|
FBP Equity |
FBP Appreciation |
||||||
Tax cost of portfolio investments and written option contracts |
$ | 21,826,544 | $ | 23,064,819 | ||||
Gross unrealized appreciation |
$ | 3,946,899 | $ | 7,174,345 | ||||
Gross unrealized depreciation |
(2,803,612 | ) | (1,992,191 | ) | ||||
Net unrealized appreciation |
1,143,287 | 5,182,154 | ||||||
Accumulated ordinary income |
5,066 | 10,081 | ||||||
Other losses |
(356,886 | ) | (100,471 | ) | ||||
Distributions payable |
(2,637 | ) | (10,564 | ) | ||||
Accumulated earnings |
$ | 788,830 | $ | 5,081,200 | ||||
The difference between the federal income tax cost of portfolio investments and the financial statement cost of portfolio investments for the Funds is due to certain differences in the recognition of capital gains and losses under income tax regulations and GAAP. These “book/tax” differences are temporary in nature and are primarily due to losses deferred due to wash sales and differing methods in the amortization of discounts and premiums on fixed income securities.
The Funds recognize the tax benefits or expenses of uncertain tax positions only when the position is “more likely than not” to be sustained assuming examination by tax authorities. Management has reviewed the tax positions taken by each Fund on federal income tax returns for the current and all open tax years (generally, three years) and has concluded that no provision for unrecognized tax benefits or expenses is required in these financial statements.
25
THE FLIPPIN, BRUCE & PORTER FUNDS |
3. Investment Transactions
Investment transactions, other than short-term investments and U.S. government securities, were as follows for the six months ended September 30, 2020:
|
FBP Equity |
FBP Appreciation |
||||||
Purchases of investment securities |
$ | 2,773,136 | $ | 2,659,256 | ||||
Proceeds from sales and maturities of investment securities |
$ | 3,177,386 | $ | 3,416,875 | ||||
4. Transactions with Related Parties
INVESTMENT ADVISORY AGREEMENTS
Each Fund’s investments are managed by Flippin, Bruce & Porter, Inc. (the “Adviser”) under the terms of an Investment Advisory Agreement. Under the Investment Advisory Agreements, each Fund pays the Adviser a fee, which is computed and accrued daily and paid monthly, at an annual rate of 0.70% of its average daily net assets up to $250 million; 0.65% of the next $250 million of such assets; and 0.50% of such assets in excess of $500 million.
Effective August 1, 2020, pursuant to Expense Limitation Agreements (“ELAs”) between each Fund and the Adviser, the Adviser has contractually agreed, until August 1, 2021, to reduce advisory fees and/or reimburse expenses to the extent necessary to limit total annual fund operating expenses (excluding brokerage costs, taxes, interest, Acquired Fund Fees and Expenses and extraordinary expenses) to an amount not exceeding 1.12% and 1.05% of the average daily net assets of FBP Equity & Dividend Plus Fund and FBP Appreciation & Income Opportunities Fund, respectively.
Prior to August 1, 2020, pursuant to Expense Limitation Agreements (“ELAs”) between each Fund and the Adviser, the Adviser contractually agreed, until August 1, 2020, to reduce advisory fees and/or reimburse other expenses to the extent necessary to limit total annual fund operating expenses (excluding brokerage costs, taxes, interest, Acquired Fund Fees and Expenses and extraordinary expenses) to an amount not exceeding 1.07% and 1.00% of the average daily net assets of FBP Equity & Dividend Plus Fund and FBP Appreciation & Income Opportunities Fund, respectively.
Accordingly, during the six months ended September 30, 2020, the Adviser reduced its advisory fees in the amounts of $37,139 and $36,259 for FBP Equity & Dividend Plus Fund and FBP Appreciation & Income Opportunities Fund, respectively.
Under the terms of the ELAs, investment advisory fee reductions and expense reimbursements by the Adviser are subject to recoupment by the Adviser for a period of three years after such fees and expenses were incurred, provided the recoupments do not cause total annual fund operating expenses to exceed the
26
THE FLIPPIN, BRUCE & PORTER FUNDS |
lesser of (i) the expense limitation then in effect, if any, or (ii) the expense limitation in effect at the time the expenses to be recouped were incurred. As of September 30, 2020, the Adviser may seek recoupment of investment advisory fee reductions and expense reimbursements no later than the dates as stated below:
|
FBP Equity |
FBP Appreciation |
||||||
March 31, 2023 |
$ | 31,428 | $ | 33,267 | ||||
September 30, 2023 |
37,139 | 36,259 | ||||||
Total |
$ | 68,567 | $ | 69,526 | ||||
Certain officers and a Trustee of the Trust are also officers of the Adviser.
OTHER SERVICE PROVIDERS
Ultimus Fund Solutions, LLC (“Ultimus”) provides administration, fund accounting, compliance and transfer agent services to the Funds. The Funds pay Ultimus fees in accordance with the agreements for such services. In addition, the Funds pay out-of-pocket expenses including, but not limited to, postage, supplies, and certain costs related to the pricing of the Funds’ portfolio securities. Certain officers of the Trust are also officers of Ultimus, or of Ultimus Fund Distributors, LLC (the “Distributor”), the principal underwriter of each Fund’s shares and an affiliate of Ultimus. The Distributor is compensated by the Adviser (not the Funds) for acting as principal underwriter.
COMPENSATION OF TRUSTEES
Trustees and officers affiliated with the Adviser or Ultimus are not compensated by the Trust for their services. Each Trustee who is not an affiliated person of the Adviser or Ultimus received from the Trust an annual retainer of $24,000, payable quarterly; a fee of $2,000 for attendance at each meeting of the Board of Trustees (except that such fee is $3,000 for the independent chair); and a fee of $1,000 for attendance at each meeting of any committee of the Board (except that such fee is $1,500 for the committee chair); plus reimbursement of travel and other expenses incurred in attending meetings. Each Fund pays its proportionate share of such fees along with the other series of the Trust.
5. Derivatives Transactions
The location on the Statements of Assets and Liabilities of the Funds’ derivative positions as of September 30, 2020 is as follows:
FBP Equity & Dividend Plus Fund
|
Gross Notional |
||||||||||||
Type of Derivative (Risk) |
Location |
Asset |
Liability |
September 30, |
|||||||||
Call options written (Equity) |
Written call options, at value |
$ | — | $ | (273,064 | ) | $ | (4,857,494 | ) | ||||
27
THE FLIPPIN, BRUCE & PORTER FUNDS |
FBP Appreciation & Income Opportunities Fund
|
Gross Notional |
||||||||||||
Type of Derivative (Risk) |
Location |
Asset |
Liability |
September 30, |
|||||||||
Call options written (Equity) |
Written call options, at value |
$ | — | $ | (45,780 | ) | $ | (1,060,665 | ) | ||||
The Funds’ transactions in derivative instruments during the six months ended September 30, 2020 are recorded in the following locations on the Statements of Operations:
FBP Equity & Dividend Plus Fund
Type of Derivative (Risk) |
Location |
Net |
Location |
Change in |
||||||
Call options written (Equity) |
Net realized gains (losses) from written option contracts |
$ | 175,149 | Net change in unrealized appreciation (depreciation) on written option contracts |
$ | (153,324 | ) | |||
FBP Appreciation & Income Opportunities Fund
Type of Derivative (Risk) |
Location |
Net |
Location |
Change in |
||||||
Call options written (Equity) |
Net realized gains (losses) from written option contracts |
$ | 73,257 | Net change in unrealized appreciation (depreciation) on written option contracts |
$ | (32,990 | ) | |||
The average monthly notional amount of written call options during the six months ended September 30, 2020 is $5,250,620 and $1,188,125 for FBP Equity & Dividend Plus Fund and FBP Appreciation & Income Opportunities Fund, respectively.
6. Contingencies and Commitments
The Funds indemnify the Trust’s officers and Trustees for certain liabilities that might arise from the performance of their duties to the Funds. Additionally, in the normal course of business the Funds enter into contracts that contain a variety of representations and warranties and which provide general indemnifications. The Funds’ maximum exposure under these arrangements is unknown, as this would involve future claims that may be made against the Funds that have not yet occurred. However, based on experience, the Trust expects the risk of loss to be remote.
28
THE FLIPPIN, BRUCE & PORTER FUNDS |
7. Subsequent Events
The Funds are required to recognize in the financial statements the effects of all subsequent events that provide additional evidence about conditions that existed as of the date of the Statements of Assets and Liabilities. For non-recognized subsequent events that must be disclosed to keep the financial statements from being misleading, the Funds are required to disclose the nature of the event as well as an estimate of its financial effect, or a statement that such an estimate cannot be made. Management has evaluated subsequent events through the issuance of these financial statements and has noted no such events.
29
THE FLIPPIN, BRUCE & PORTER FUNDS |
We believe it is important for you to understand the impact of costs on your investment. All mutual funds have operating expenses. As a shareholder of a Fund, you incur ongoing costs, including management fees and other operating expenses. These ongoing costs, which are deducted from each Fund’s gross income, directly reduce the investment return of the Funds.
A mutual fund’s ongoing costs are expressed as a percentage of its average net assets. This figure is known as the expense ratio. The following examples are intended to help you understand the ongoing costs (in dollars) of investing in the Funds and to compare these costs with the ongoing costs of investing in other mutual funds. The examples below are based on an investment of $1,000 made at the beginning of the period shown and held for the entire period (April 1, 2020 through September 30, 2020).
The table below illustrates each Fund’s ongoing costs in two ways:
Actual fund return – This section helps you to estimate the actual expenses that you paid over the period. The “Ending Account Value” shown is derived from each Fund’s actual return, and the fourth column shows the dollar amount of operating expenses that would have been paid by an investor who started with $1,000 in the Funds. You may use the information here, together with the amount you invested, to estimate the expenses that you paid over the period.
To do so, simply divide your account value by $1,000 (for example, an $8,600 account value divided by $1,000 = 8.6), then multiply the result by the number given for the Funds under the heading “Expenses Paid During Period.”
Hypothetical 5% return – This section is intended to help you compare the Funds’ ongoing costs with those of other mutual funds. It assumes that each Fund had an annual return of 5% before expenses during the period shown, but that the expense ratio is unchanged. In this case, because the returns used are not the Funds’ actual returns, the results do not apply to your investment. The example is useful in making comparisons because the U.S. Securities and Exchange Commission (the “SEC”) requires all mutual funds to calculate expenses based on a 5% return. You can assess each Fund’s ongoing costs by comparing this hypothetical example with the hypothetical examples that appear in shareholder reports of other funds.
Note that expenses shown in the table are meant to highlight and help you compare ongoing costs only. The Funds do not charge sales loads or redemption fees.
The calculations assume no shares were bought or sold during the period. Your actual costs may have been higher or lower, depending on the amount of your investment and the timing of any purchases or redemptions.
More information about the Funds’ expenses, including annual expense ratios for the past five fiscal years, can be found in this report. For additional information on operating expenses and other shareholder costs, please refer to the Funds’ prospectus.
30
THE FLIPPIN, BRUCE & PORTER FUNDS |
|
Beginning |
Ending |
Net |
Expenses |
FBP Equity & Dividend Plus Fund |
||||
Based on Actual Fund Return |
$1,000.00 |
$1,174.80 |
1.07% |
$5.82 |
Based on Hypothetical 5% Return (before expenses) |
$1,000.00 |
$1,019.65 |
1.07% |
$5.40 |
FBP Appreciation & Income Opportunities Fund |
||||
Based on Actual Fund Return |
$1,000.00 |
$1,166.80 |
1.00% |
$5.42 |
Based on Hypothetical 5% Return (before expenses) |
$1,000.00 |
$1,020.00 |
1.00% |
$5.05 |
(a) |
Annualized, based on each Fund’s most recent one-half year expenses. |
(b) |
Expenses are equal to each Fund’s annualized net expense ratio multiplied by the average account value over the period, multiplied by 183/366 (to reflect the one-half year period). |
31
THE FLIPPIN, BRUCE & PORTER FUNDS |
The Trust files a complete listing of portfolio holdings for the Funds with the SEC as of the end of the first and third quarters of each fiscal year as an exhibit to its reports on Form N-PORT. The filings are available upon request, by calling 1-866-738-1127. Furthermore, you may obtain a copy of these filings on the SEC’s website at www.sec.gov.
A description of the policies and procedures that the Funds use to determine how to vote proxies relating to portfolio securities is available without charge upon request by calling toll-free 1-800-327-9375, or on the SEC’s website at www.sec.gov. Information regarding how the Funds voted proxies relating to portfolio securities during the most recent 12-month period ended June 30 is also available without charge upon request by calling toll-free 1-866-738-1127, or on the SEC’s website at www.sec.gov.
LIQUIDITY RISK MANAGEMENT PROGRAM (Unaudited)
The Funds have adopted and implemented a written liquidity risk management program as required by Rule 22e-4 (the “Liquidity Rule”) under the Investment Company Act. The program is reasonably designed to assess and manage each Fund’s liquidity risk, taking into consideration, among other factors, the Fund’s investment strategy and the liquidity of its portfolio investments during normal and reasonably foreseeable stressed conditions; its short and long-term cash flow projections; and its cash holdings and access to other funding sources. The Funds’ Board of Trustees approved the appointment of a Liquidity Risk Committee, which includes representatives from Flippin, Bruce & Porter, Inc., the Funds’ investment adviser, and Ultimus Fund Solutions, LLC, the Funds’ Administrator. The Liquidity Risk Committee is responsible for the program’s administration and oversight and for reporting to the Board on at least an annual basis regarding the program’s operation and effectiveness. The Liquidity Risk Committee updated its assessment of each Fund’s liquidity risk profile, considering additional data gathered in the 12 months ended May 31, 2020 and the adequacy and effectiveness of the liquidity risk management program’s operations since its inception on June 1, 2019 (the “Review Period”) in order to prepare a written report for the Board of Trustees (the “Report”) for consideration at its meeting held on August 18, 2020. During the Review Period, which covered the period when all but essential businesses were mandated to close for a time in response to the COVID-19 pandemic, none of the Funds experienced unusual stress or disruption to its operations related to purchase and redemption activity. Also, during the Review Period the Funds held adequate levels of cash and highly liquid investments to meet shareholder redemption activities in accordance with applicable requirements. The Report concluded that (i) the Funds’ liquidity risk management program is reasonably designed to prevent violations of the Liquidity Rule and (ii) the Funds’ liquidity risk management program has been effectively implemented.
32
Investment Adviser
Flippin, Bruce & Porter, Inc. 800 Main Street, Second Floor P.O. Box 6138 Lynchburg, Virginia 24505 Toll-Free 1-800-851-3804 www.fbpfunds.com
Administrator
Ultimus Fund Solutions, LLC P.O. Box 46707 Cincinnati, Ohio 45246-0707 Toll-Free 1-866-738-1127
Custodian
U.S. Bank, N.A. 425 Walnut Street Cincinnati, Ohio 45202
Independent Registered
Cohen & Company, Ltd. Cleveland, Ohio 44115 |
Legal Counsel
Sullivan & Worcester LLP 1666 K Street, N.W. Washington, DC 20006
Officers
John T. Bruce, President and Portfolio Manager Norman D. Darden, III, John H. Hanna, IV, Vice President
Trustees
Robert S. Harris, Ph.D., Chairman John P. Ackerly, IV John T. Bruce George K. Jennison Harris V. Morrissette Elizabeth W. Robertson |
34
THE
GOVERNMENT STREET
FUNDS
No-Load Mutual Funds
Semi-Annual Report |
|
The Government Street Equity Fund The Government Street Mid-Cap Fund |

Beginning on January 1, 2021, as permitted by regulations adopted by the U.S. Securities and Exchange Commission, paper copies of the Funds’ shareholder reports like this one will no longer be sent by mail, unless you specifically request paper copies of the reports from the Funds or from your financial intermediary, such as a broker-dealer or bank. Instead, the reports will be made available on a website, and you will be notified by mail each time a report is posted and provided with a website link to access the report.
If you already elected to receive shareholder reports electronically, you will not be affected by this change and you need not take any action. You may elect to receive shareholder reports and other communications from the Funds electronically by contacting the Funds at 1-866-738-1125 or, if you own these shares through a financial intermediary, by contacting your financial intermediary.
You may elect to receive all future reports in paper free of charge. You can inform the Funds that you wish to continue receiving paper copies of your shareholder reports by contacting the Funds at 1-866-738-1125. If you own shares through a financial intermediary, you may contact your financial intermediary or follow instructions included with this document to elect to continue to receive paper copies of your shareholder reports. Your election to receive reports in paper will apply to all Funds held with the Fund complex or at your financial intermediary.
LETTER FROM THE PRESIDENT |
October 15, 2020 |
Dear Fellow Shareholders:
We are enclosing for your review the Semi-Annual Reports of The Government Street Funds for the period ended September 30, 2020.
The Government Street Equity Fund
The Government Street Equity Fund (the “Fund”) had a positive 33.17% total return for the six-month period ended September 30, 2020. By comparison, the S&P 500® Index and the Morningstar Large Blend categories returned 31.30% and 29.03%, respectively.
|
Government |
S&P 500 |
Morningstar |
3 Qtr 2020 |
10.48% |
8.93% |
8.05% |
2 Qtr 2020 |
20.54% |
20.54% |
19.42% |
1 Qtr 2020 |
-17.08% |
-19.60% |
-20.89% |
4 Qtr 2019 |
8.17% |
9.07% |
8.13% |
Year-End 9/30/20 |
19.45% |
15.15% |
10.38% |
As can be seen in the chart, your Fund and the other representative measures of large-capitalization securities enjoyed strong positive returns for the same annual period covered by this report.
The entire 2020 fiscal year was positively impacted by the last two-quarters of the period. The outstanding returns for Technology and Consumer Discretionary economic sectors carried the portfolio to one of the best 6-month returns in memory. At the time the COVID-19 pandemic was creating havoc in most areas of the economy, enterprises engaged in digital technologies and ultimate recipients of Government granted stimulus funds experienced extreme positive returns.
Within the S&P 500, growth stocks outperformed value stocks for the twelve months, by 30.6% to -2.7%, respectively.
Major purchases for the period were Blackstone Group (Financials), Amazon.com, Inc. (Consumer Discretionary) and iShares Gold (Precious Metals).
Major sales for the period were Ecolab, Inc. (Health Care), and Apple (Technology).
The transactions, in total, were distributed along the investment sectors of your Fund with the Standard & Poor’s 500 sectors as guidelines. While your Fund is not invested with a pseudo index approach, the sectors provide an objective comparison for the diversification we believe important for the control of relative risk in your portfolio. Overall we depend on our own conclusions as to the ultimate security selection and position weightings.
1
The top 10 holdings in The Government Street Equity Fund as of September 30, 2020 were:
Security Description |
% of Net Assets |
NVIDIA Corporation |
6.28% |
Apple, Inc. |
5.39% |
Lockheed Martin Corporation |
4.14% |
Amazon.com, Inc. |
4.13% |
Microsoft Corporation |
3.57% |
JPMorgan Chase & Company |
3.56% |
Bio-Techne Corporation |
3.25% |
Comcast Corporation – Class A |
2.93% |
Wal-Mart Store, Inc. |
2.91% |
Visa, Inc. – Class A |
2.87% |
There were significant individual performances during the twelve months ended September 30, 2020. The five highest returns, held for the entire 12 months, as measured by the time-weighted rate of return were:
Security Description |
1 Year |
NVIDIA Corporation |
212.33% |
Apple, Inc. |
108.75% |
Wheaton Precious Metals Corporation |
88.38% |
Skyworks Solutions, Inc. |
85.38% |
Amazon.com, Inc. |
81.71% |
The five worst individual performances, held for the twelve months ended September 30, 2020, as measured by time-weighted rate of return for the entire period were:
Security Description |
1 Year |
JPMorgan Chase & Company |
-15.49% |
Blackstone Group, Inc. |
-17.25% |
CME Group |
-18.32% |
General Dynamics Corporation |
-22.24% |
Aflac, Inc. |
-28.61% |
The Fund’s best performing economic sector for the 12 months was Technology, up 69.95%. The second-best sector was Consumer Discretionary up 41.54%. The worst performing sector was Financials down -10.18%.
Note: The investment performances listed for economic sectors and securities in the two preceding paragraphs are extracted from an in-house independent time-weighted rates of return computation by the Addepar portfolio accounting system. The calculations are gross investment returns. Total investment returns are for the twelve months ended September 30, 2020.
Our past commentaries, for several periods, have focused on the growing Governmental debt burden brought about by what we consider to be irresponsible political spending programs. The upward spiral of the borrowed funds has been
2
accelerated by the unanticipated new factor in the form of the COVID-19 pandemic. While unarguably necessary to offset the dire consequences of many total business shutdown, the actions of our Congress has raised the debt burden to an excess of $26 trillion, with promise of more to come. The result of the increase has led to the United States, without doubt, solidifying its position currently as the largest debtor nation in the world.
It is impossible to evaluate the implications for our future economic well-being to be derived from investments. It may well be “different this time.” Certainly the prescribed low, and possibly negative, interest rates perceived to be a stimulus for the economy upends the prospects for retirement funds, endowments, savings, earnings, etc. It is our assessment that the by-product of our financial predicament portends movement toward greater acceptance of risks in stock and bond investments to compensate for the new investment realities.
Portfolio returns and the economy rarely march in lockstep. This has never been truer than today when we see such a negative economic environment compared to a soaring stock market. However, investment returns ultimately have to be ratified by economic results. If the stock market is truly a leading economic indicator, then good times seem to be in our future.
While we truly hope for a positive development for our investment future, we continue to focus significant efforts to address the mitigation of risks in the portfolio. As in the past, we continue to broadly diversify the Fund. In that effort, we eliminated our exposure to the energy sector until many of the challenges confronting that investment area demonstrate a more positive expectation. The resulting funds were moved to precious metals, which now represent 2.5% of the portfolio. The remainder of the Fund has 58 companies and approximately 4.1% in cash equivalent reserves.
As of September 30, 2020, the Fund’s net assets were $64.7 million; net asset value per share was $88.82; and the annualized ratio of expenses to net average assets was 0.88%. Portfolio turnover rate was 5% (not annualized). Income dividends of $0.3315 per share and capital gains of $1.6155 per share were distributed to shareholders during the six-months ended September 30, 2020.
The Government Street Mid-Cap Fund
The Government Street Mid-Cap Fund (the “Fund”), as of September 30, 2020, produced a fiscal six-month total return of 25.62%. By comparison, the Standard & Poor’s 400® Index and the Morningstar Mid-Cap Blended Index, used as relative performance benchmarks, were 29.99% and 30.49%, respectively.
|
Government |
S&P 400 |
Morningstar |
3 Qtr 2020 |
6.76% |
4.77% |
6.29% |
2 Qtr 2020 |
17.67% |
24.07% |
22.07% |
1 Qtr 2020 |
-19.95% |
-29.70% |
-28.36% |
4 Qtr 2019 |
6.36% |
7.06% |
7.03% |
Year-End 9/30/20 |
6.96% |
-2.16% |
-0.51% |
3
The mid-capitalization category of individual companies is usually represented by the Standard & Poor’s 400 ranging from approximately $487 million to $21.0 billion (based on 8/31/2020 Morningstar data) market values. Generally, these companies are considered to have slightly higher risk and return characteristics than the S&P 500 companies, which start at the upper end of the mid-cap values and range in sizes 10 times or greater in terms of capitalization. As you would guess, the mid-cap companies tend to be primarily domestically oriented.
Your Fund has a slightly different range of capitalizations than the S&P 400. Upper and lower limits for Fund purchase consideration are $11.7 billion and $894 million, respectively. There are two provisions that allow the makeup of the Fund to exceed those limits. To the extent securities originally purchased within the limits have grown to greater capitalizations, they may be retained without limitation. Secondly, the Fund manager has latitude to purchase and hold up to 20% of the Fund’s value outside the limitations.
It should be noted that your Fund has initiated positions directly into International investments thru individual stock purchases. These investments meet the same capitalization constraints as domestic security holdings. This global approach is being done to provide additional diversification of the portfolio’s risk component and to address attractive potential return areas. The approach falls within the allowed exceptions previously cited and are expected to improve the compounded investment return over time.
The top 10 holdings in The Government Street Mid-Cap Fund as of September 30, 2020 were:
Security Description |
% of Net Assets |
NVIDIA Corporation |
4.50% |
Mid-America Apartment Communities, Inc. |
3.53% |
Chemed Corporation |
2.92% |
Teleflex, Inc. |
2.73% |
Bio-Techne Corporation |
2.51% |
ANSYS, Inc. |
2.32% |
Lam Research Corporation |
2.30% |
Waste Connections, Inc. |
2.21% |
L3harris Technologies, Inc. |
2.20% |
iShares Gold Trust (ETF) |
2.15% |
An exchange-traded fund (“ETF”) represents a significant holding in the Fund. This asset holds the physical gold represented by the security. Additionally, the Fund has an ETF investment in silver. This asset also holds the physical silver which backs the asset value of the security.
4
There were significant individual performances during the twelve months ended September 30, 2020. The five highest returns, held for the entire period, as measured by the time-weighted rate of return, were:
Security Description |
1 Year |
NVIDIA Corporation |
211.88% |
Celsius Holdings, Inc. |
153.08% |
Okta, Inc. |
117.19% |
Charles River Laboratories Int’l., Inc. |
71.07% |
Hain Celestial Group, Inc. |
59.74% |
The five worst individual performances, held for the entire period, as measured by time-weighted rate of return, were:
Security Description |
1 Year |
MasTec, Inc. |
-34.95% |
American Financial Group, Inc. |
-35.26% |
Macys, Inc. |
-39.17% |
Gildan Activewear, Inc. |
-43.85% |
ONEOK, Inc. |
-61.50% |
The Fund’s best performing economic sector for the 12 months was Technology, up 49.91%. The second-best sector was Consumer Staples, up 31.60%. The worst performing sector was Energy, down -58.8%.
Note: The investment performances listed for economic sectors and securities in the two preceding paragraphs are extracted from an in-house independent time-weighted rates of return computation by the Addepar portfolio accounting system. The calculations are gross investment returns. Total investment returns are for the year ended September 30, 2020.
We believe that mid-cap stocks offer an attractive combination of growth and safety as they have successfully overcome startup challenges yet remain nimble enough to generate stronger growth than large-cap stocks. Mid-cap stocks have been able to match the performance of large-cap stocks in down markets while exceeding large-cap performance in up markets, leading to long-term outperformance.
The strategy to manage risks in the Fund is primarily thru diversification over the eleven economic sectors. The securities which comprise the Fund are represented in each of those sectors according to their perceived investment prospects. Additionally, the Fund currently holds exchange-traded funds in gold and silver. Precious metal stocks tend to act as a diversification of securities‘ risks by historically moving counter to general market directions. Finally, in periods of expected volatility, the Fund will hold higher than normal (defined as 5% or lower) cash equivalent positions. On September 30, 2020, the cash equivalent position was 8.1%. In all cases, the intent is to manage the portfolio’s volatility, which should result in greater compounded returns over time.
5
It may be interesting for the readers to compare and contrast the Global Industry Classification Standard (GICS) sectors between the larger capitalization S&P 500 and the lower capitalization S&P 400. The approximate weights based on component’s capitalizations change daily but are reasonably stable over short periods. As of September 30, 2020, they are:
GICS |
S&P 500 |
S&P 400 |
Energy |
4.23% |
1.90% |
Materials |
2.30% |
4.74% |
Industrials |
9.81% |
17.74% |
Consumer Discretionary |
9.61% |
13.98% |
Consumer Staples |
7.59% |
4.94% |
Health Care |
14.25% |
11.28% |
Financials |
16.15% |
14.18% |
Information Technology |
19.37% |
16.20% |
Telecommunication Services |
10.44% |
2.17% |
Utilities |
3.29% |
3.34% |
Real Estate |
2.98% |
9.54% |
The Government Street Mid-Cap Fund uses the S&P 400 sector weights for guidance in its diversification of investment holdings.
As of September 30, 2020, the net assets of the Government Street Mid-Cap Fund were $49.3 million, and the net asset value per share was $29.55. The turnover rate for the previous six months was 8% and the total number of holdings was 81 as of September 30, 2020. The net annualized expense ratio for the Fund was 1.10%.
Thank you for your continued confidence in The Government Street Funds. Please call us if we can be of further service to you.
Very truly yours,

Thomas W. Leavell
President
Leavell Investment Management, Inc.
The Government Street Funds
6
THE GOVERNMENT STREET EQUITY FUND PORTFOLIO INFORMATION
September 30, 2020 (Unaudited)
Asset Allocation
(% of Net Assets)

Top Ten Equity Holdings
Security Description |
% of Net Assets |
NVIDIA Corporation |
6.3% |
Apple, Inc. |
5.4% |
Lockheed Martin Corporation |
4.1% |
Amazon.com, Inc. |
4.1% |
Microsoft Corporation |
3.6% |
JPMorgan Chase & Company |
3.6% |
Bio-Techne Corporation |
3.3% |
Comcast Corporation - Class A |
2.9% |
Walmart, Inc. |
2.9% |
Visa, Inc. - Class A |
2.9% |
7
THE GOVERNMENT STREET MID-CAP FUND PORTFOLIO INFORMATION
September 30, 2020 (Unaudited)
Asset Allocation
(% of Net Assets)
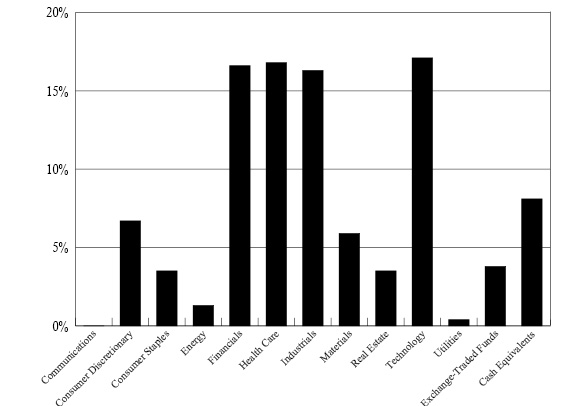
Top Ten Equity Holdings
Security Description |
% of Net Assets |
NVIDIA Corporation |
4.5% |
Mid-America Apartment Communities, Inc. |
3.5% |
Chemed Corporation |
2.9% |
Teleflex, Inc. |
2.7% |
Bio-Techne Corporation |
2.5% |
ANSYS, Inc. |
2.3% |
Lam Research Corporation |
2.3% |
Waste Connections, Inc. |
2.2% |
L3Harris Technologies, Inc. |
2.2% |
iShares Gold Trust |
2.2% |
8
THE GOVERNMENT STREET EQUITY FUND |
||||||||
COMMON STOCKS — 94.4% |
Shares |
Value |
||||||
Communications — 7.6% |
||||||||
Alphabet, Inc. - Class A (a) |
850 | $ | 1,245,760 | |||||
Alphabet, Inc. - Class C (a) |
1,067 | 1,568,063 | ||||||
Comcast Corporation - Class A |
41,000 | 1,896,660 | ||||||
Twitter, Inc. (a) |
4,000 | 178,000 | ||||||
| 4,888,483 | ||||||||
Consumer Discretionary — 11.4% |
||||||||
Amazon.com, Inc. (a) |
850 | 2,676,421 | ||||||
Home Depot, Inc. (The) |
5,000 | 1,388,550 | ||||||
Lowe’s Companies, Inc. |
6,000 | 995,160 | ||||||
McDonald’s Corporation |
5,000 | 1,097,450 | ||||||
NIKE, Inc. - Class B |
10,000 | 1,255,400 | ||||||
| 7,412,981 | ||||||||
Consumer Staples — 6.5% |
||||||||
Clorox Company (The) |
1,000 | 210,170 | ||||||
Coca-Cola Company (The) |
12,000 | 592,440 | ||||||
Costco Wholesale Corporation |
1,000 | 355,000 | ||||||
McCormick & Company, Inc. |
3,000 | 582,300 | ||||||
Procter & Gamble Company (The) |
4,000 | 555,960 | ||||||
Walmart, Inc. |
13,500 | 1,888,785 | ||||||
| 4,184,655 | ||||||||
Financials — 10.9% |
||||||||
Aflac, Inc. |
16,000 | 581,600 | ||||||
Ares Management Corporation - Class A |
5,000 | 202,100 | ||||||
Blackstone Group, L.P. (The) - Class A |
13,000 | 678,600 | ||||||
Brookfield Asset Management, Inc. - Class A |
33,000 | 1,090,980 | ||||||
CME Group, Inc. |
6,000 | 1,003,860 | ||||||
Intercontinental Exchange, Inc. |
12,000 | 1,200,600 | ||||||
JPMorgan Chase & Company |
24,000 | 2,310,480 | ||||||
| 7,068,220 | ||||||||
Health Care — 10.5% |
||||||||
Abbott Laboratories |
9,500 | 1,033,885 | ||||||
AbbVie, Inc. |
11,500 | 1,007,285 | ||||||
AstraZeneca plc - ADR |
4,000 | 219,200 | ||||||
Bio-Techne Corporation |
8,500 | 2,105,705 | ||||||
Bristol-Myers Squibb Company |
12,000 | 723,480 | ||||||
Edwards Lifesciences Corporation (a) |
4,800 | 383,136 | ||||||
Johnson & Johnson |
1,750 | 260,540 | ||||||
Merck & Company, Inc. |
3,000 | 248,850 | ||||||
Pfizer, Inc. |
6,000 | 220,200 | ||||||
9
THE GOVERNMENT STREET EQUITY FUND |
||||||||
COMMON STOCKS — 94.4% (Continued) |
Shares |
Value |
||||||
Health Care — 10.5% (Continued) |
||||||||
Roche Holding AG - ADR |
5,000 | $ | 214,050 | |||||
Thermo Fisher Scientific, Inc. |
900 | 397,368 | ||||||
| 6,813,699 | ||||||||
Industrials — 11.3% |
||||||||
Emerson Electric Co. |
6,500 | 426,205 | ||||||
General Dynamics Corporation |
5,200 | 719,836 | ||||||
Honeywell International, Inc. |
11,000 | 1,810,710 | ||||||
Lockheed Martin Corporation |
7,000 | 2,682,960 | ||||||
Raytheon Technologies Corporation |
13,500 | 776,790 | ||||||
TE Connectivity Ltd. |
9,000 | 879,660 | ||||||
| 7,296,161 | ||||||||
Materials — 2.3% |
||||||||
Freeport-McMoRan, Inc. |
16,000 | 250,240 | ||||||
International Paper Company |
3,000 | 121,620 | ||||||
Linde plc |
2,300 | 547,699 | ||||||
Wheaton Precious Metals Corporation |
12,000 | 588,840 | ||||||
| 1,508,399 | ||||||||
Real Estate — 2.2% |
||||||||
Life Storage, Inc. |
1,000 | 105,270 | ||||||
Mid-America Apartment Communities, Inc. |
11,394 | 1,321,134 | ||||||
| 1,426,404 | ||||||||
Technology — 27.7% |
||||||||
Accenture plc - Class A |
6,150 | 1,389,839 | ||||||
Apple, Inc. |
30,200 | 3,497,462 | ||||||
ASML Holding N.V. |
850 | 313,880 | ||||||
Mastercard, Inc. - Class A |
2,000 | 676,340 | ||||||
Microsoft Corporation |
11,000 | 2,313,630 | ||||||
NVIDIA Corporation |
7,525 | 4,072,680 | ||||||
QUALCOMM, Inc. |
6,000 | 706,080 | ||||||
S&P Global, Inc. |
1,000 | 360,600 | ||||||
Skyworks Solutions, Inc. |
10,000 | 1,455,000 | ||||||
Taiwan Semiconductor Manufacturing Company Ltd. - ADR |
5,000 | 405,350 | ||||||
Texas Instruments, Inc. |
6,200 | 885,298 | ||||||
Visa, Inc. - Class A |
9,300 | 1,859,721 | ||||||
| 17,935,880 | ||||||||
Utilities — 4.0% |
||||||||
Dominion Energy, Inc. |
6,000 | 473,580 | ||||||
Duke Energy Corporation |
8,250 | 730,620 | ||||||
WEC Energy Group, Inc. |
14,000 | 1,356,600 | ||||||
| 2,560,800 | ||||||||
Total Common Stocks (Cost $25,779,662) |
$ | 61,095,682 | ||||||
10
THE GOVERNMENT STREET EQUITY FUND |
||||||||
EXCHANGE-TRADED FUNDS — 1.6% |
Shares |
Value |
||||||
iShares Gold Trust (a) |
34,000 | $ | 611,660 | |||||
iShares Silver Trust (a) |
21,000 | 454,440 | ||||||
Total Exchange-Traded Funds (Cost $976,813) |
$ | 1,066,100 | ||||||
|
||||||||
MONEY MARKET FUNDS — 4.1% |
Shares |
Value |
||||||
Fidelity Institutional Money Market Government Portfolio - Class I, 0.01% (b) (Cost $2,662,397) |
2,662,397 | $ | 2,662,397 | |||||
Total Investments at Value — 100.1% (Cost $29,418,872) |
$ | 64,824,179 | ||||||
Liabilities in Excess of Other Assets — (0.1%) |
(85,194 | ) | ||||||
Net Assets — 100.0% |
$ | 64,738,985 | ||||||
ADR - American Depositary Receipt. |
|
(a) |
Non-income producing security. |
(b) |
The rate shown is the 7-day effective yield as of September 30, 2020. |
See accompanying notes to financial statements. |
|
11
THE GOVERNMENT STREET MID-CAP FUND |
||||||||
COMMON STOCKS — 88.1% |
Shares |
Value |
||||||
Consumer Discretionary — 6.7% |
||||||||
Gildan Activewear, Inc. |
13,400 | $ | 263,578 | |||||
Hasbro, Inc. |
5,000 | 413,600 | ||||||
Kontoor Brands, Inc. |
1,671 | 40,438 | ||||||
Macy’s, Inc. |
5,000 | 28,500 | ||||||
Melco Resorts & Entertainment Ltd. - ADR |
5,000 | 83,250 | ||||||
NVR, Inc. (a) |
135 | 551,221 | ||||||
Scotts Miracle-Gro Company (The) |
2,200 | 336,402 | ||||||
Service Corporation International |
16,200 | 683,316 | ||||||
Tempur Sealy International, Inc. (a) |
3,000 | 267,570 | ||||||
Tiffany & Company |
2,500 | 289,625 | ||||||
VF Corporation |
4,700 | 330,175 | ||||||
| 3,287,675 | ||||||||
Consumer Staples — 3.5% |
||||||||
Celsius Holdings, Inc. (a) |
12,000 | 272,520 | ||||||
Church & Dwight Company, Inc. |
9,000 | 843,390 | ||||||
Energizer Holdings, Inc. |
5,000 | 195,700 | ||||||
Hain Celestial Group, Inc. (The) (a) |
3,500 | 120,050 | ||||||
Ollie’s Bargain Outlet Holdings, Inc. (a) |
3,300 | 288,255 | ||||||
| 1,719,915 | ||||||||
Energy — 1.3% |
||||||||
Enphase Energy, Inc. (a) |
6,000 | 495,540 | ||||||
ONEOK, Inc. |
6,000 | 155,880 | ||||||
| 651,420 | ||||||||
Financials — 16.6% |
||||||||
Alleghany Corporation |
1,190 | 619,336 | ||||||
American Financial Group, Inc. |
8,600 | 576,028 | ||||||
Ares Management Corporation - Class A |
5,000 | 202,100 | ||||||
Arthur J. Gallagher & Company |
8,000 | 844,640 | ||||||
Berkley (W.R.) Corporation |
11,175 | 683,351 | ||||||
Brown & Brown, Inc. |
20,000 | 905,400 | ||||||
CME Group, Inc. |
5,000 | 836,550 | ||||||
Eaton Vance Corporation |
13,000 | 495,950 | ||||||
Intercontinental Exchange, Inc. |
10,500 | 1,050,525 | ||||||
Nasdaq, Inc. |
8,500 | 1,043,035 | ||||||
Old Republic International Corporation |
24,400 | 359,656 | ||||||
SEI Investments Company |
5,500 | 278,960 | ||||||
Voya Financial, Inc. |
3,000 | 143,790 | ||||||
Waddell & Reed Financial, Inc. - Class A |
11,500 | 170,775 | ||||||
| 8,210,096 | ||||||||
Health Care — 16.8% |
||||||||
Bio-Rad Laboratories, Inc. - Class A (a) |
1,700 | 876,282 | ||||||
Bio-Techne Corporation |
5,000 | 1,238,650 | ||||||
12
THE GOVERNMENT STREET MID-CAP FUND |
||||||||
COMMON STOCKS — 88.1% (Continued) |
Shares |
Value |
||||||
Health Care — 16.8% (Continued) |
||||||||
Centene Corporation (a) |
6,000 | $ | 349,980 | |||||
Charles River Laboratories International, Inc. (a) |
4,500 | 1,019,025 | ||||||
Chemed Corporation |
3,000 | 1,441,050 | ||||||
Globus Medical, Inc. - Class A (a) |
3,000 | 148,560 | ||||||
Laboratory Corporation of America Holdings (a) |
2,574 | 484,607 | ||||||
Penumbra, Inc. (a) |
2,500 | 485,950 | ||||||
ResMed, Inc. |
3,000 | 514,290 | ||||||
Teleflex, Inc. |
3,950 | 1,344,659 | ||||||
Waters Corporation (a) |
2,000 | 391,360 | ||||||
| 8,294,413 | ||||||||
Industrials — 16.3% |
||||||||
AMETEK, Inc. |
2,350 | 233,590 | ||||||
C.H. Robinson Worldwide, Inc. |
4,000 | 408,760 | ||||||
Donaldson Company, Inc. |
13,000 | 603,460 | ||||||
Expeditors International of Washington, Inc. |
8,000 | 724,160 | ||||||
Fastenal Company |
18,000 | 811,620 | ||||||
Graco, Inc. |
13,000 | 797,550 | ||||||
Jacobs Engineering Group, Inc. |
6,475 | 600,686 | ||||||
L3Harris Technologies, Inc. |
6,400 | 1,086,976 | ||||||
MasTec, Inc. (a) |
3,200 | 135,040 | ||||||
MSC Industrial Direct Company, Inc. - Class A |
6,000 | 379,680 | ||||||
National Instruments Corporation |
12,000 | 428,400 | ||||||
nVent Electric plc |
2,900 | 51,301 | ||||||
Pentair plc |
2,900 | 132,733 | ||||||
Snap-on, Inc. |
1,475 | 217,017 | ||||||
Waste Connections, Inc. |
10,500 | 1,089,900 | ||||||
Woodward, Inc. |
4,400 | 352,704 | ||||||
| 8,053,577 | ||||||||
Materials — 5.9% |
||||||||
Albemarle Corporation |
6,700 | 598,176 | ||||||
Ashland Global Holdings, Inc. |
6,000 | 425,520 | ||||||
Martin Marietta Materials, Inc. |
3,000 | 706,080 | ||||||
Packaging Corporation of America |
6,000 | 654,300 | ||||||
Steel Dynamics, Inc. |
12,000 | 343,560 | ||||||
Valvoline, Inc. |
9,236 | 175,853 | ||||||
| 2,903,489 | ||||||||
Real Estate — 3.5% |
||||||||
Mid-America Apartment Communities, Inc. |
15,000 | 1,739,250 | ||||||
Technology — 17.1% |
||||||||
Analog Devices, Inc. |
3,671 | 428,553 | ||||||
ANSYS, Inc. (a) |
3,500 | 1,145,305 | ||||||
Arrow Electronics, Inc. (a) |
10,100 | 794,466 | ||||||
13
THE GOVERNMENT STREET MID-CAP FUND |
||||||||
COMMON STOCKS — 88.1% (Continued) |
Shares |
Value |
||||||
Technology — 17.1% (Continued) |
||||||||
Broadridge Financial Solutions, Inc. |
3,500 | $ | 462,000 | |||||
FLIR Systems, Inc. |
3,000 | 107,550 | ||||||
InterDigital, Inc. |
2,500 | 142,650 | ||||||
Lam Research Corporation |
3,400 | 1,127,950 | ||||||
Microchip Technology, Inc. |
6,000 | 616,560 | ||||||
NVIDIA Corporation |
4,100 | 2,219,002 | ||||||
Okta, Inc. (a) |
3,500 | 748,475 | ||||||
Xilinx, Inc. |
6,000 | 625,440 | ||||||
| 8,417,951 | ||||||||
Utilities — 0.4% |
||||||||
NRG Energy, Inc. |
3,000 | 92,220 | ||||||
UGI Corporation |
3,038 | 100,193 | ||||||
| 192,413 | ||||||||
Total Common Stocks (Cost $17,073,853) |
$ | 43,470,199 | ||||||
|
||||||||
EXCHANGE-TRADED FUNDS — 3.8% |
Shares |
Value |
||||||
iShares Gold Trust (a) |
59,000 | $ | 1,061,410 | |||||
iShares Silver Trust (a) |
37,000 | 800,680 | ||||||
Total Exchange-Traded Funds (Cost $1,704,596) |
$ | 1,862,090 | ||||||
|
||||||||
MONEY MARKET FUNDS — 8.1% |
Shares |
Value |
||||||
Fidelity Institutional Money Market Government Portfolio - Class I, 0.01% (b) (Cost $3,983,156) |
3,983,156 | $ | 3,983,156 | |||||
Total Investments at Value — 100.0% (Cost $22,761,605) |
$ | 49,315,445 | ||||||
Liabilities in Excess of Other Assets — (0.0%) (c) |
(9,474 | ) | ||||||
Net Assets — 100.0% |
$ | 49,305,971 | ||||||
ADR - American Depositary Receipt. |
|
(a) |
Non-income producing security. |
(b) |
The rate shown is the 7-day effective yield as of September 30, 2020. |
(c) |
Percentage rounds to greater than (0.1%). |
See accompanying notes to financial statements. |
|
14
THE GOVERNMENT STREET FUNDS |
||||||||
|
The |
The |
||||||
ASSETS |
||||||||
Investments in securities: |
||||||||
At cost |
$ | 29,418,872 | $ | 22,761,605 | ||||
At value (Note 2) |
$ | 64,824,179 | $ | 49,315,445 | ||||
Cash |
3,672 | — | ||||||
Receivable for capital shares sold |
1,500 | 100 | ||||||
Dividends receivable |
11,104 | 19,238 | ||||||
Other assets |
12,794 | 12,616 | ||||||
TOTAL ASSETS |
64,853,249 | 49,347,399 | ||||||
LIABILITIES |
||||||||
Distributions payable |
2,472 | — | ||||||
Payable for capital shares redeemed |
67,882 | — | ||||||
Accrued investment advisory fees (Note 4) |
31,790 | 30,278 | ||||||
Payable to administrator (Note 4) |
5,900 | 5,580 | ||||||
Other accrued expenses |
6,220 | 5,570 | ||||||
TOTAL LIABILITIES |
114,264 | 41,428 | ||||||
NET ASSETS |
$ | 64,738,985 | $ | 49,305,971 | ||||
Net assets consist of: |
||||||||
Paid-in capital |
$ | 26,647,493 | $ | 21,083,030 | ||||
Accumulated earnings |
38,091,492 | 28,222,941 | ||||||
Net assets |
$ | 64,738,985 | $ | 49,305,971 | ||||
Shares of beneficial interest outstanding (unlimited number of shares authorized, $0.01 par value) |
728,887 | 1,668,604 | ||||||
Net asset value, offering price and redemption price per share (Note 2) |
$ | 88.82 | $ | 29.55 | ||||
See accompanying notes to financial statements. |
15
THE GOVERNMENT STREET FUNDS |
||||||||
|
The |
The |
||||||
INVESTMENT INCOME |
||||||||
Dividends |
$ | 503,013 | $ | 309,234 | ||||
Foreign withholding taxes on dividends |
(1,439 | ) | (583 | ) | ||||
TOTAL INVESTMENT INCOME |
501,574 | 308,651 | ||||||
EXPENSES |
||||||||
Investment advisory fees (Note 4) |
180,202 | 174,022 | ||||||
Administration fees (Note 4) |
30,817 | 29,900 | ||||||
Registration and filing fees |
8,689 | 9,421 | ||||||
Audit and tax services fees |
8,750 | 8,750 | ||||||
Account maintenance fees |
8,913 | 7,228 | ||||||
Trustees’ fees and expenses (Note 4) |
7,500 | 7,500 | ||||||
Legal fees |
3,952 | 3,952 | ||||||
Custodian and bank service fees |
3,715 | 3,289 | ||||||
Compliance fees (Note 4) |
3,459 | 3,467 | ||||||
Printing of shareholder reports |
3,381 | 3,207 | ||||||
Postage and supplies |
2,111 | 2,129 | ||||||
Pricing costs |
455 | 455 | ||||||
Other expenses |
3,340 | 2,993 | ||||||
TOTAL EXPENSES |
265,284 | 256,313 | ||||||
NET INVESTMENT INCOME |
236,290 | 52,338 | ||||||
REALIZED AND UNREALIZED GAINS ON INVESTMENTS |
||||||||
Net realized gains from investments |
2,684,996 | 1,616,860 | ||||||
Net realized gains from in-kind redemptions (Note 2) |
247,761 | — | ||||||
Net change in unrealized appreciation (depreciation) on investments |
13,285,286 | 8,438,594 | ||||||
NET REALIZED AND UNREALIZED GAINS ON INVESTMENTS |
16,218,043 | 10,055,454 | ||||||
NET INCREASE IN NET ASSETS RESULTING FROM OPERATIONS |
$ | 16,454,333 | $ | 10,107,792 | ||||
See accompanying notes to financial statements. |
16
THE GOVERNMENT STREET EQUITY FUND |
||||||||
|
Six Months |
Year |
||||||
FROM OPERATIONS |
||||||||
Net investment income |
$ | 236,290 | $ | 588,300 | ||||
Net realized gains from investments |
2,684,996 | 2,828,555 | ||||||
Net realized gains from in-kind redemptions (Note 2) |
247,761 | 999,929 | ||||||
Net change in unrealized appreciation (depreciation) on investments |
13,285,286 | (5,017,527 | ) | |||||
Net increase (decrease) in net assets resulting from operations |
16,454,333 | (600,743 | ) | |||||
DISTRIBUTIONS TO SHAREHOLDERS (Note 2) |
(1,418,121 | ) | (2,979,301 | ) | ||||
FROM CAPITAL SHARE TRANSACTIONS |
||||||||
Proceeds from shares sold |
163,271 | 225,208 | ||||||
Net asset value of shares issued in reinvestment of distributions to shareholders |
1,389,439 | 2,900,422 | ||||||
Payments for shares redeemed |
(1,830,598 | ) | (5,744,573 | ) | ||||
Net decrease in net assets from capital share transactions |
(277,888 | ) | (2,618,943 | ) | ||||
TOTAL INCREASE (DECREASE) IN NET ASSETS |
14,758,324 | (6,198,987 | ) | |||||
NET ASSETS |
||||||||
Beginning of period |
49,980,661 | 56,179,648 | ||||||
End of period |
$ | 64,738,985 | $ | 49,980,661 | ||||
CAPITAL SHARE ACTIVITY |
||||||||
Shares sold |
1,909 | 2,893 | ||||||
Shares reinvested |
17,130 | 36,909 | ||||||
Shares redeemed |
(21,969 | ) | (73,663 | ) | ||||
Net decrease in shares outstanding |
(2,930 | ) | (33,861 | ) | ||||
Shares outstanding, beginning of period |
731,817 | 765,678 | ||||||
Shares outstanding, end of period |
728,887 | 731,817 | ||||||
See accompanying notes to financial statements. |
17
THE GOVERNMENT STREET MID-CAP FUND |
||||||||
|
Six Months |
Year |
||||||
FROM OPERATIONS |
||||||||
Net investment income |
$ | 52,338 | $ | 272,370 | ||||
Net realized gains from investments |
1,616,860 | 917,145 | ||||||
Net realized gains from in-kind redemptions (Note 2) |
— | 428,697 | ||||||
Net change in unrealized appreciation (depreciation) on investments |
8,438,594 | (4,884,827 | ) | |||||
Net increase (decrease) in net assets resulting from operations |
10,107,792 | (3,266,615 | ) | |||||
DISTRIBUTIONS TO SHAREHOLDERS (Note 2) |
(73,395 | ) | (2,059,713 | ) | ||||
FROM CAPITAL SHARE TRANSACTIONS |
||||||||
Proceeds from shares sold |
370,028 | 496,731 | ||||||
Net asset value of shares issued in reinvestment of distributions to shareholders |
71,813 | 2,011,302 | ||||||
Payments for shares redeemed |
(592,270 | ) | (4,053,012 | ) | ||||
Net decrease in net assets from capital share transactions |
(150,429 | ) | (1,544,979 | ) | ||||
TOTAL INCREASE (DECREASE) IN NET ASSETS |
9,883,968 | (6,871,307 | ) | |||||
NET ASSETS |
||||||||
Beginning of period |
39,422,003 | 46,293,310 | ||||||
End of period |
$ | 49,305,971 | $ | 39,422,003 | ||||
CAPITAL SHARE ACTIVITY |
||||||||
Shares sold |
13,870 | 17,789 | ||||||
Shares reinvested |
2,594 | 70,826 | ||||||
Shares redeemed |
(21,458 | ) | (143,976 | ) | ||||
Net decrease in shares outstanding |
(4,994 | ) | (55,361 | ) | ||||
Shares outstanding, beginning of period |
1,673,598 | 1,728,959 | ||||||
Shares outstanding, end of period |
1,668,604 | 1,673,598 | ||||||
See accompanying notes to financial statements. |
18
THE GOVERNMENT STREET EQUITY FUND |
||||||||||||||||||||||||
Selected Per Share Data for a Share Outstanding Throughout Each Period: |
||||||||||||||||||||||||
|
Six Months |
Years Ended March 31, |
||||||||||||||||||||||
|
Ended |
2020 |
2019 |
2018 |
2017 |
2016 |
||||||||||||||||||
Net asset value at beginning of period |
$ | 68.30 | $ | 73.37 | $ | 74.60 | $ | 67.08 | $ | 61.72 | $ | 65.95 | ||||||||||||
Income (loss) from investment operations: |
||||||||||||||||||||||||
Net investment income |
0.33 | 0.80 | 0.69 | 0.66 | 0.68 | 0.61 | ||||||||||||||||||
Net realized and unrealized gains (losses) on investments and foreign currencies |
22.14 | (1.82 | ) | 3.37 | 9.32 | 6.76 | (2.17 | ) | ||||||||||||||||
Total from investment operations |
22.47 | (1.02 | ) | 4.06 | 9.98 | 7.44 | (1.56 | ) | ||||||||||||||||
Less distributions from: |
||||||||||||||||||||||||
Net investment income |
(0.33 | ) | (0.80 | ) | (0.68 | ) | (0.65 | ) | (0.68 | ) | (0.64 | ) | ||||||||||||
Net realized gains |
(1.62 | ) | (3.25 | ) | (4.61 | ) | (1.81 | ) | (1.40 | ) | (2.03 | ) | ||||||||||||
Total distributions |
(1.95 | ) | (4.05 | ) | (5.29 | ) | (2.46 | ) | (2.08 | ) | (2.67 | ) | ||||||||||||
Net asset value at end of period |
$ | 88.82 | $ | 68.30 | $ | 73.37 | $ | 74.60 | $ | 67.08 | $ | 61.72 | ||||||||||||
Total return (a) |
33.17 | %(b) | (2.04 | %) | 5.65 | % | 15.08 | % | 12.32 | % | (2.46 | %) | ||||||||||||
Net assets at end of period (000’s) |
$ | 64,739 | $ | 49,981 | $ | 56,180 | $ | 62,707 | $ | 65,407 | $ | 80,307 | ||||||||||||
Ratio of total expenses to average net assets |
0.88 | %(c) | 0.91 | % | 0.89 | % | 0.88 | % | 0.87 | % | 0.85 | % | ||||||||||||
Ratio of net investment income to average net assets |
0.79 | %(c) | 1.01 | % | 0.92 | % | 0.90 | % | 1.03 | % | 0.95 | % | ||||||||||||
Portfolio turnover rate |
5 | %(b) | 14 | % | 9 | % | 13 | % | 20 | % | 17 | % | ||||||||||||
(a) |
Total return is a measure of the change in value of an investment in the Fund over the periods covered, which assumes any dividends or capital gains distributions are reinvested in shares of the Fund. The returns shown do not reflect the deduction of taxes a shareholder would pay on Fund distributions or the redemption of Fund shares. |
(b) |
Not Annualized. |
(c) |
Annualized. |
See accompanying notes to financial statements. |
|
19
THE GOVERNMENT STREET MID-CAP FUND |
||||||||||||||||||||||||
Selected Per Share Data for a Share Outstanding Throughout Each Period: |
||||||||||||||||||||||||
|
Six Months |
Years Ended March 31, |
||||||||||||||||||||||
|
Ended |
2020 |
2019 |
2018 |
2017 |
2016 |
||||||||||||||||||
Net asset value at beginning of period |
$ | 23.56 | $ | 26.78 | $ | 26.64 | $ | 24.42 | $ | 21.95 | $ | 22.96 | ||||||||||||
Income (loss) from investment operations: |
||||||||||||||||||||||||
Net investment income |
0.03 | 0.16 | 0.18 | 0.20 | 0.16 | 0.10 | ||||||||||||||||||
Net realized and unrealized gains (losses) on investments |
6.00 | (2.16 | ) | 0.90 | 3.32 | 3.36 | 0.11 | |||||||||||||||||
Total from investment operations |
6.03 | (2.00 | ) | 1.08 | 3.52 | 3.52 | 0.21 | |||||||||||||||||
Less distributions from: |
||||||||||||||||||||||||
Net investment income |
— | (0.16 | ) | (0.14 | ) | (0.20 | ) | (0.14 | ) | (0.10 | ) | |||||||||||||
Net realized gains |
(0.04 | ) | (1.06 | ) | (0.80 | ) | (1.10 | ) | (0.91 | ) | (1.12 | ) | ||||||||||||
Total distributions |
(0.04 | ) | (1.22 | ) | (0.94 | ) | (1.30 | ) | (1.05 | ) | (1.22 | ) | ||||||||||||
Net asset value at end of period |
$ | 29.55 | $ | 23.56 | $ | 26.78 | $ | 26.64 | $ | 24.42 | $ | 21.95 | ||||||||||||
Total return (a) |
25.62 | %(b) | (8.18 | %) | 4.21 | % | 14.67 | % | 16.44 | % | 1.04 | % | ||||||||||||
Net assets at end of period (000’s) |
$ | 49,306 | $ | 39,422 | $ | 46,293 | $ | 50,059 | $ | 48,540 | $ | 48,547 | ||||||||||||
Ratio of total expenses to average net assets |
1.10 | %(c) | 1.09 | % | 1.08 | % | 1.06 | % | 1.07 | % | 1.07 | % | ||||||||||||
Ratio of net investment income to average net assets |
0.23 | %(c) | 0.57 | % | 0.64 | % | 0.78 | % | 0.66 | % | 0.46 | % | ||||||||||||
Portfolio turnover rate |
8 | %(b) | 2 | % | 6 | % | 12 | % | 14 | % | 20 | % | ||||||||||||
(a) |
Total return is a measure of the change in value of an investment in the Fund over the periods covered, which assumes any dividends or capital gains distributions are reinvested in shares of the Fund. The returns shown do not reflect the deduction of taxes a shareholder would pay on Fund distributions or the redemption of Fund shares. |
(b) |
Not Annualized. |
(c) |
Annualized. |
See accompanying notes to financial statements. |
|
20
THE GOVERNMENT STREET FUNDS
NOTES TO FINANCIAL STATEMENTS
September 30, 2020 (Unaudited)
1. Organization
The Government Street Equity Fund and The Government Street Mid-Cap Fund (the “Funds”) are each a diversified, no-load series of the Williamsburg Investment Trust (the “Trust”), an open-end management investment company registered under the Investment Company Act of 1940, as amended (the “1940 Act”). The Trust was organized as a Massachusetts business trust on July 18, 1988. Other series of the Trust are not included in this report.
The investment objective of The Government Street Equity is to seek capital appreciation.
The investment objective of The Government Street Mid-Cap is to seek capital appreciation.
2. Significant Accounting Policies
Each Fund follows accounting and reporting guidance under Financial Accounting Standards Board Accounting Standards Codification Topic 946, “Financial Services – Investment Companies.” The following is a summary of the Funds’ significant accounting policies. The policies are in conformity with accounting principles generally accepted in the United States of America (“GAAP”).
Securities valuation — The Funds’ portfolio securities are valued as of the close of business of the regular session of the New York Stock Exchange (“NYSE”) (normally 4:00 p.m. Eastern time). Securities traded on a national stock exchange, including common stocks and exchange-traded funds (“ETFs”), if any, are valued based upon the closing price on the principal exchange where the security is traded, if available, otherwise, at the last quoted bid price. Securities that are quoted by NASDAQ are valued at the NASDAQ Official Closing Price. Investments representing shares of other open-end investment companies, other than ETFs but including money market funds, are valued at their net asset value (“NAV”) as reported by such companies. When using a quoted price and when the market is considered active, securities will be classified as Level 1 within the fair value hierarchy (see below).
When market quotations are not readily available, if a pricing service cannot provide a price, or if the investment adviser believes the price received from the pricing service is not indicative of market value, securities will be valued in good faith at fair value using methods consistent with procedures adopted by the Board of Trustees and will be classified as Level 2 or 3 within the fair value hierarchy, depending on the inputs used. Such methods of fair valuation may include, but are not limited to: multiple of earnings, multiple of book value, discount from market of a similar freely traded security, purchase price of the security, subsequent private transactions in the security
21
THE GOVERNMENT STREET FUNDS
NOTES TO FINANCIAL STATEMENTS (Continued)
or related securities, or a combination of these and other factors. GAAP establishes a single authoritative definition of fair value, sets out a framework for measuring fair value and requires additional disclosures about fair value measurements.
Various inputs are used in determining the value of each Fund’s investments. These inputs are summarized in the three broad levels listed below:
|
● |
Level 1 – quoted prices in active markets for identical securities |
|
● |
Level 2 – other significant observable inputs |
|
● |
Level 3 – significant unobservable inputs |
The inputs or methodology used for valuing securities are not necessarily an indication of the risks associated with investing in those securities. The inputs used to measure fair value may fall into different levels of the fair value hierarchy. In such cases, for disclosure purposes, the level in the fair value hierarchy within which the fair value measurement falls in its entirety is determined based on the lowest level input that is significant to the fair value measurement.
The following is a summary of the Funds’ investments based on the inputs used to value the investments as of September 30, 2020, by asset type:
The Government Street Equity Fund: |
Level 1 |
Level 2 |
Level 3 |
Total |
||||||||||||
Common Stocks |
$ | 61,095,682 | $ | — | $ | — | $ | 61,095,682 | ||||||||
Exchange-Traded Funds |
1,066,100 | — | — | 1,066,100 | ||||||||||||
Money Market Funds |
2,662,397 | — | — | 2,662,397 | ||||||||||||
Total |
$ | 64,824,179 | $ | — | $ | — | $ | 64,824,179 | ||||||||
The Government Street Mid-Cap Fund: |
Level 1 |
Level 2 |
Level 3 |
Total |
||||||||||||
Common Stocks |
$ | 43,470,199 | $ | — | $ | — | $ | 43,470,199 | ||||||||
Exchange-Traded Funds |
1,862,090 | — | — | 1,862,090 | ||||||||||||
Money Market Funds |
3,983,156 | — | — | 3,983,156 | ||||||||||||
Total |
$ | 49,315,445 | $ | — | $ | — | $ | 49,315,445 | ||||||||
Refer to each Fund’s Schedule of Investments for a listing of the common stocks by sector type. There were no Level 3 securities or derivative instruments held by the Funds as of or during the six months ended September 30, 2020.
Foreign currency translation — Investment securities and other assets and liabilities denominated in or expected to settle in foreign currencies, if any, are translated into U.S. dollars based on exchange rates on the following basis:
|
A. |
The fair values of investment securities and other assets and liabilities are translated as of the close of the NYSE each day. |
22
THE GOVERNMENT STREET FUNDS
NOTES TO FINANCIAL STATEMENTS (Continued)
|
B. |
Purchases and sales of investment securities and income and expenses are translated at the rate of exchange prevailing as of 4:00 p.m. Eastern time on the respective date of such transactions. |
|
C. |
The Fund does not isolate that portion of the results of operations caused by changes in foreign exchange rates on investments from those caused by changes in market prices of investment securities held. Such fluctuations are included with the net realized and unrealized gains or losses on investments. |
Reported net realized foreign exchange gains or losses arise from 1) purchases and sales of foreign currencies and 2) the difference between the amounts of dividends and foreign withholding taxes recorded on a Fund’s books and the U.S. dollar equivalent of the amounts actually received or paid. Reported net unrealized foreign exchange gains and losses arise from changes in the value of assets and liabilities that result from changes in exchange rates.
Share valuation — The NAV per share of each Fund is calculated daily by dividing the total value of its assets, less liabilities, by the number of shares outstanding. The offering price and redemption price per share of each Fund is equal to the NAV per share.
Investment income — Interest income is accrued as earned. Discounts and premiums on fixed-income securities purchased, if any, are amortized using the interest method. Dividend income is recorded on the ex-dividend date. Non-cash dividends included in dividend income, if any, are recorded at the fair market value of the security received. Withholding taxes on foreign dividends have been recorded in accordance with the Trust’s understanding of the applicable country’s rules and tax rates.
Distributions to shareholders — Dividends arising from net investment income are declared and paid quarterly to shareholders of The Government Street Equity Fund and declared and paid annually to shareholders of The Government Street Mid-Cap Fund. Net realized short-term capital gains, if any, may be distributed throughout the year and net realized long-term capital gains, if any, are distributed at least once each year. Dividends and distributions are recorded on the ex-dividend date. The amount of distributions from net investment income and net realized capital gains are determined in accordance with federal income tax regulations, which may differ from GAAP. These “book/tax” differences are either temporary or permanent in nature.
The tax character of distributions paid during the periods ended September 30, 2020 and March 31, 2020 was as follows:
|
Periods |
Ordinary |
Long-Term |
Total |
||||||||||||
The Government Street Equity Fund |
09/30/20 | $ | 241,462 | $ | 1,176,659 | $ | 1,418,121 | |||||||||
| 03/31/20 | $ | 589,910 | $ | 2,390,603 | $ | 2,980,513 | ||||||||||
The Government Street Mid-Cap Fund |
09/30/20 | $ | — | $ | 73,395 | $ | 73,395 | |||||||||
| 03/31/20 | $ | 270,308 | $ | 1,789,405 | $ | 2,059,713 | ||||||||||
23
THE GOVERNMENT STREET FUNDS
NOTES TO FINANCIAL STATEMENTS (Continued)
Investment transactions — Investment transactions are accounted for on trade date for financial reporting purposes. Realized gains and losses on investment securities sold are determined on a specific identification basis.
Common expenses — Common expenses of the Trust are allocated among the Funds and the other series of the Trust based on relative net assets of each series or the nature of the services performed and the relative applicability to each series.
Estimates — The preparation of financial statements in conformity with GAAP requires management to make estimates and assumptions that affect the reported amounts of assets and liabilities and the disclosure of contingent assets and liabilities as of the date of the financial statements and the reported amounts of increase (decrease) in net assets from operations during the reporting period. Actual results could differ from those estimates.
Federal income tax — Each Fund has qualified and intends to continue to qualify as a regulated investment company under the Internal Revenue Code of 1986, as amended (the “Code”). Qualification generally will relieve the Funds of liability for federal income taxes to the extent 100% of their net investment income and any net realized capital gains are distributed in accordance with the Code.
In order to avoid imposition of the excise tax applicable to regulated investment companies, it is also each Fund’s intention to declare as dividends in each calendar year at least 98% of its net investment income (earned during the calendar year) and 98.2% of its net realized capital gains (earned during the twelve months ended October 31) plus undistributed amounts from prior years.
The following information is computed on a tax basis for each item as of September 30, 2020:
|
The Government |
The Government |
||||||
Cost of portfolio investments |
$ | 29,418,872 | $ | 22,761,605 | ||||
Gross unrealized appreciation |
$ | 35,491,593 | $ | 26,901,839 | ||||
Gross unrealized depreciation |
(86,286 | ) | (347,999 | ) | ||||
Net unrealized appreciation |
35,405,307 | 26,553,840 | ||||||
Accumulated ordinary income |
3,677 | 52,338 | ||||||
Other gains |
2,684,980 | 1,616,763 | ||||||
Distributions payable |
(2,472 | ) | — | |||||
Total accumulated earnings |
$ | 38,091,492 | $ | 28,222,941 | ||||
During the six months ended September 30, 2020, The Government Street Equity Fund realized $247,761 of net capital gains resulting from in-kind redemptions (redemptions in which shareholders who redeemed Fund shares received investment
24
THE GOVERNMENT STREET FUNDS
NOTES TO FINANCIAL STATEMENTS (Continued)
securities held by the Fund rather than cash). The Fund recognizes a gain on in-kind redemptions to the extent that the value of the distributed investment securities on the date of redemption exceeds the cost of those investment securities. Such gains are not taxable to the Fund and are not required to be distributed to shareholders. The Fund has reclassified these gains against paid-in capital on the Statements of Assets and Liabilities. Such reclassification, the result of permanent differences between the financial statement and income tax reporting requirements, had no effect on the Fund’s net assets or NAV per share.
The Funds recognize the tax benefits or expenses of uncertain tax positions only when the position is “more likely than not” to be sustained assuming examination by tax authorities. Management has reviewed the tax positions taken on federal income tax returns for the current and all open tax years (generally, three years) of each Fund and has concluded that no provision for unrecognized tax benefits or expenses is required in these financial statements.
3. Investment Transactions
Investment transactions, other than short-term investments and U.S. government securities, were as follows for the six months ended September 30, 2020:
|
The Government |
The Government |
||||||
Purchases of investment securities |
$ | 2,858,212 | $ | 3,249,700 | ||||
Proceeds from sales of investment securities |
$ | 5,121,329 | $ | 3,668,544 | ||||
4. Transactions with Related Parties
INVESTMENT ADVISORY AGREEMENT
Each Fund’s investments are managed by Leavell Investment Management, Inc. (the “Adviser”) under the terms of an Investment Advisory Agreement. The Government Street Equity Fund pays the Adviser a fee, which is computed and accrued daily and paid monthly, at annual rates of 0.60% of its average daily net assets up to $100 million and 0.50% of such assets in excess of $100 million. The Government Street Mid-Cap Fund pays the Adviser a fee, which is computed and accrued daily and paid monthly, at an annual rate of 0.75% of its average daily net assets.
Certain officers of the Trust are also officers of the Adviser.
OTHER SERVICE PROVIDERS
Ultimus Fund Solutions, LLC (“Ultimus”) provides administration, fund accounting, compliance and transfer agent services to the Funds. The Funds pay Ultimus fees in accordance with the agreements for such services. In addition, the Funds pay out-of-pocket expenses including, but not limited to, postage, supplies, and certain costs
25
THE GOVERNMENT STREET FUNDS
NOTES TO FINANCIAL STATEMENTS (Continued)
related to the pricing of the Funds’ portfolio securities. Certain officers of the Trust are also officers of Ultimus, or of Ultimus Fund Distributors, LLC (the “Distributor”), the principal underwriter of each Fund’s shares and an affiliate of Ultimus. The Distributor is compensated by the Adviser (not the Funds) for acting as principal underwriter.
COMPENSATION OF TRUSTEES
Trustees and officers affiliated with the Adviser or Ultimus are not compensated by the Trust for their services. Each Trustee who is not an affiliated person of the Adviser or Ultimus receives from the Trust an annual retainer of $24,000, payable quarterly; a fee of $2,000 for attendance at each meeting of the Board of Trustees (except that such fee is $3,000 for the independent chair); and a fee of $1,000 for attendance at each meeting of any committee of the Board (except that such fee is $1,500 for the committee chair); plus reimbursement of travel and other expenses incurred in attending meetings. Each series of the Trust pays its proportionate share of such fees.
5. Contingencies and Commitments
The Funds indemnify the Trust’s officers and Trustees for certain liabilities that might arise from their performance of their duties to the Funds. Additionally, in the normal course of business the Funds enter into contracts that contain a variety of representations and warranties and which provide general indemnifications. The Funds’ maximum exposure under these arrangements is unknown, as this would involve future claims that may be made against the Funds that have not yet occurred. However, based on experience, the Trust expects the risk of loss to be remote.
6. Sector Risk
If a Fund has significant investments in the securities of issuers in industries within a particular business sector, any development affecting that sector will have a greater impact on the value of the net assets of the Fund than would be the case if the Fund did not have significant investments in that sector. In addition, this may increase the risk of loss of an investment in the Fund and increase the volatility of the Fund’s NAV per share. From time to time, circumstances may affect a particular sector and companies within such sector. For instance, economic or market factors, regulation or deregulation, or other developments may negatively impact all companies in a particular sector and therefore the value of a Fund’s portfolio would be adversely affected. As of September 30, 2020, The Government Street Equity Fund had 27.7% of the value of its net assets invested in common stocks within the Technology sector.
26
THE GOVERNMENT STREET FUNDS
NOTES TO FINANCIAL STATEMENTS (Continued)
7. Subsequent Events
The Funds are required to recognize in the financial statements the effects of all subsequent events that provide additional evidence about conditions that existed as of the date of the Statements of Assets and Liabilities. For non-recognized subsequent events that must be disclosed to keep the financial statements from being misleading, the Funds are required to disclose the nature of the event as well as an estimate of its financial effect, or a statement that such an estimate cannot be made. Management has evaluated subsequent events through the issuance of these financial statements and has noted no such events.
27
THE GOVERNMENT STREET FUNDS
ABOUT YOUR FUNDS’ EXPENSES (Unaudited)
We believe it is important for you to understand the impact of costs on your investment. All mutual funds have operating expenses. As a shareholder of the Funds, you incur ongoing costs, including management fees and other expenses. These ongoing costs, which are deducted from each Fund’s gross income, directly reduce the investment returns of the Funds.
A mutual fund’s ongoing costs are expressed as a percentage of its average net assets. This figure is known as the expense ratio. The following examples are intended to help you understand the ongoing costs (in dollars) of investing in the Funds and to compare these costs with the ongoing costs of investing in other mutual funds. The examples below are based on an investment of $1,000 made at the beginning of the period shown and held for the entire period (April 1, 2020 through September 30, 2020).
The table below illustrates each Fund’s ongoing costs in two ways:
Actual fund return – This section helps you to estimate the actual expenses that you paid over the period. The “Ending Account Value” shown is derived from each Fund’s actual return, and the fourth column shows the dollar amount of operating expenses that would have been paid by an investor who started with $1,000 in the Funds. You may use the information here, together with the amount you invested, to estimate the expenses that you paid over the period.
To do so, simply divide your account value by $1,000 (for example, an $8,600 account value divided by $1,000 = 8.6), then multiply the result by the number given for the Funds under the heading “Expenses Paid During Period.”
Hypothetical 5% return – This section is intended to help you compare the Funds’ ongoing costs with those of other mutual funds. It assumes that each Fund had an annual return of 5% before expenses during the period shown, but that the expense ratio is unchanged. In this case, because the returns used are not the Funds’ actual returns, the results do not apply to your investment. The example is useful in making comparisons because the U.S. Securities and Exchange Commission (the “SEC”) requires all mutual funds to calculate expenses based on a 5% return. You can assess each Fund’s ongoing costs by comparing this hypothetical example with the hypothetical examples that appear in shareholder reports of other funds.
Note that expenses shown in the table are meant to highlight and help you compare ongoing costs only. The Funds do not charge sales loads or redemption fees.
The calculations assume no shares were bought or sold during the period. Your actual costs may have been higher or lower, depending on the amount of your investment and the timing of any purchases or redemptions.
28
THE GOVERNMENT STREET FUNDS
ABOUT YOUR FUNDS’ EXPENSES (Unaudited) (Continued)
More information about the Funds’ expenses, including historical expense ratios, can be found in this report. For additional information on operating expenses and other shareholder costs, please refer to the Funds’ prospectus.
Beginning |
Ending |
Expense |
Expenses |
|
The Government Street Equity Fund |
||||
Based on Actual Fund Return |
$1,000.00 |
$1,331.70 |
0.88% |
$5.13 |
Based on Hypothetical 5% Return (before expenses) |
$1,000.00 |
$1,020.60 |
0.88% |
$4.45 |
The Government Street Mid-Cap Fund |
||||
Based on Actual Fund Return |
$1,000.00 |
$1,256.20 |
1.10% |
$6.20 |
Based on Hypothetical 5% Return (before expenses) |
$1,000.00 |
$1,019.50 |
1.10% |
$5.55 |
(a) |
Annualized, based on each Fund’s most recent one-half year expenses. |
(b) |
Expenses are equal to each Fund’s annualized expense ratio multiplied by the average account value over the period, multiplied by 183/366 (to reflect the one-half year period). |
29
THE GOVERNMENT STREET FUNDS
OTHER INFORMATION (Unaudited)
A description of the policies and procedures that the Funds use to vote proxies relating to portfolio securities is available without charge upon request by calling toll-free 1-866-738-1125, or on the SEC’s website at www.sec.gov. Information regarding how the Funds voted proxies relating to portfolio securities during the most recent 12-month period ended June 30 is also available without charge upon request by calling toll-free 1-866-738-1125 or on the SEC’s website at www.sec.gov.
The Trust files a complete listing of portfolio holdings for the Funds with the SEC as of the end of the first and third quarters of each fiscal year as an exhibit to its reports on Form N-PORT. The filings are available upon request, by calling 1-866-738-1125. Furthermore, you may obtain a copy of these filings on the SEC’s website at www.sec.gov.
30
THE GOVERNMENT STREET FUNDS
LIQUIDITY RISK MANAGEMENT PROGRAM (Unaudited)
The Funds have adopted and implemented a written liquidity risk management program as required by Rule 22e-4 (the “Liquidity Rule”) under the Investment Company Act. The program is reasonably designed to assess and manage each Fund’s liquidity risk, taking into consideration, among other factors, the Fund’s investment strategy and the liquidity of its portfolio investments during normal and reasonably foreseeable stressed conditions; its short and long-term cash flow projections; and its cash holdings and access to other funding sources. The Funds’ Board of Trustees approved the appointment of a Liquidity Risk Committee, which includes representatives from Leavell Investment Management, Inc, the Funds’ investment adviser, and Ultimus Fund Solutions, LLC, the Funds’ Administrator. The Liquidity Risk Committee is responsible for the program’s administration and oversight and for reporting to the Board on at least an annual basis regarding the program’s operation and effectiveness. The Liquidity Risk Committee updated its assessment of each Fund’s liquidity risk profile, considering additional data gathered in the 12 months ended May 31, 2020 and the adequacy and effectiveness of the liquidity risk management program’s operations since its inception on June 1, 2019 (the “Review Period”) in order to prepare a written report for the Board of Trustees (the “Report”) for consideration at its meeting held on August 18, 2020. During the Review Period, which covered the period when all but essential businesses were mandated to close for a time in response to the COVID-19 pandemic, none of the Funds experienced unusual stress or disruption to its operations related to purchase and redemption activity. Also, during the Review Period the Funds held adequate levels of cash and highly liquid investments to meet shareholder redemption activities in accordance with applicable requirements. The Report concluded that (i) the Funds’ liquidity risk management program is reasonably designed to prevent violations of the Liquidity Rule and (ii) the Funds’ liquidity risk management program has been effectively implemented.
31
This page intentionally left blank.
This page intentionally left blank.
The Government Street Funds
No-Load Mutual Funds
Investment Adviser
Leavell Investment Management, Inc.
210 St. Joseph Street
Mobile, AL 36602
Administrator
Ultimus Fund Solutions, LLC
P.O. Box 46707
Cincinnati, OH 45246-0707
1-866-738-1125
Legal Counsel
Sullivan & Worcester LLP
1666 K Street, N.W.
Washington, DC 20006
Independent Registered Public Accounting Firm
Cohen & Company, Ltd.
1350 Euclid Avenue
Suite 800
Cleveland, Ohio 44115
Board of Trustees
Robert S. Harris, Ph.D., Chairman
John P. Ackerly, IV
John T. Bruce
George K. Jennison
Harris V. Morrissette
Elizabeth W. Robertson
Portfolio Manager
Thomas W. Leavell,
The Government Street Equity Fund
The Government Street Mid-Cap Fund
THE
JAMESTOWN
EQUITY FUND
No-Load Fund
SEMI-ANNUAL REPORT
September 30, 2020
(Unaudited)
Investment Adviser
Lowe, Brockenbrough & Company, Inc.
Richmond, Virginia
Beginning on January 1, 2021, as permitted by regulations adopted by the U.S. Securities and Exchange Commission, paper copies of the Fund’s shareholder reports like this one will no longer be sent by mail, unless you specifically request paper copies of the reports from the Fund or from your financial intermediary, such as a broker-dealer or bank. Instead, the reports will be made available on a website, and you will be notified by mail each time a report is posted and provided with a website link to access the report.
If you have already elected to receive shareholder reports electronically, you will not be affected by this change and you need not take any action. You may elect to receive shareholder reports and other communications from the Fund electronically by contacting the Fund at 1-866-738-1126 or, if you own these shares through a financial intermediary, by contacting your financial intermediary.
You may elect to receive all future reports in paper free of charge. You can inform the Fund that you wish to continue receiving paper copies of your shareholder reports by contacting the Fund at 1-866-738-1126. If you own shares through a financial intermediary, you may contact your financial intermediary or follow instructions included with this document to elect to continue to receive paper copies of your shareholder reports. Your election to receive reports in paper will apply to all Funds held with the Fund complex or at your financial intermediary.
LETTER TO SHAREHOLDERS |
November 2, 2020 |
Jamestown Equity Fund
In a remarkable reversal after markets sold off into late March as a result of the global spread of COVID-19, equity markets recovered strongly and even briefly exceeded the all-time high on the S&P 500. For the six-month period ended September 30, 2020, The Jamestown Equity Fund rose 31.29% compared to 31.31% for the S&P 500 Index. At the end of September 2020, the Fund was overweight compared to the S&P 500 benchmark in the Consumer Discretionary sector, while maintaining underweights in the Utilities, Health Care, and Consumer Staples sectors.
The dramatic outperformance of growth over value stocks accelerated in the past six months. While both large and small caps did well, the performance disparity between the groups is notable, and the year-to-date differences are stunning. For the calendar year-to-date, the S&P 500, a mostly large cap index, is up nearly 6%, while the smaller company Russell 2000 Index is down over 8%. The S&P Growth Index has risen more than 20%, trouncing its value step-cousin (down 11.5% year-to-date). We believe these extreme divergences are mainly the result of a potent mix of COVID-19 winners, losers and speculation, with the winners drawn mostly from a technology cohort perfectly positioned to benefit from our stay-at-home lives. The losers, unluckily (for now), are tied to our previous routines.
The equity market recovery is being supported by massive fiscal and monetary stimulus and support from governments and central banks around the world. The total amount of fiscal and monetary stimulus to-date is equal to almost 30% of global GDP as governments and central banks have stepped into to support individuals, corporations and markets from the massive downside in economies around the world as a result of the global pandemic. Due to the actions of central banks, interest rates have moved to extraordinarily low levels around the world, helping to support equity markets. Also helping markets recover is the unprecedented efforts of the scientific and medical communities coming together to develop treatments and vaccines to combat COVID 19. Investors will no doubt be closely focused on the progress on the development of these treatments and vaccines over the coming months.
U.S. Treasury bond yields remained well below 1% throughout the past six months, and the Fed reiterated their position that short rates would stay at 0% for years, inflation be damned. For several years now we’ve counseled that prospective returns will be lower; that remains our base case; plan accordingly. Financially speaking, however, with the S&P 500 yielding more than twice the 10-year Treasury, stocks offer better value than bonds. In plain English, we believe stocks aren’t cheap but they’re cheaper than bonds. Investment time horizon is the key here.
The opinions expressed are those of Lowe, Brockenbrough & Co. The opinions referenced are as of the date of publication and are subject to change due to changes in the market of economic conditions and may not necessarily come to pass. Forward looking statements cannot be guaranteed.
1
THE JAMESTOWN EQUITY FUND
PERFORMANCE INFORMATION (Unaudited)
Comparison of the Change in Value of a $10,000 Investment in
The Jamestown Equity Fund
and the S&P 500® Index
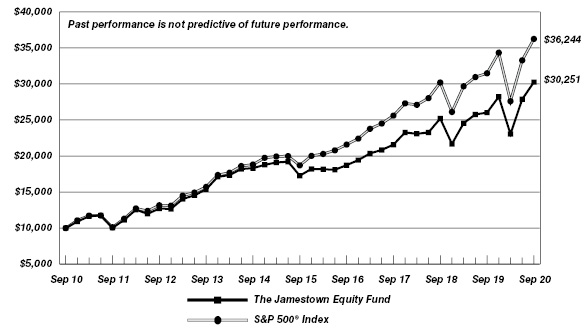
Average Annual Total Returns |
||||
1 Year |
5 Years |
10 Years |
||
The Jamestown Equity Fund (a) |
16.26% |
11.86% |
11.71% |
|
S&P 500® Index |
15.15% |
14.15% |
13.74% |
|
(a) |
Total return is a measure of the change in value of an investment in the Fund over the periods covered, which assumes any dividends or capital gains distributions are reinvested in shares of the Fund. Returns shown do not reflect the deduction of taxes a shareholder would pay on Fund distributions or the redemption of Fund shares. |
2
THE JAMESTOWN EQUITY FUND
PORTFOLIO INFORMATION
September 30, 2020 (Unaudited)
|
|
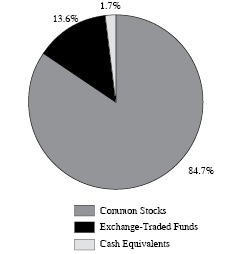
Ten Largest Equity Holdings |
% of |
Apple, Inc. |
6.7% |
Amazon.com, Inc. |
5.2% |
Microsoft Corporation |
4.4% |
Facebook, Inc. - Class A |
3.7% |
Vanguard Information Technology ETF |
2.9% |
SPDR Portfolio S&P 500 Value ETF |
2.4% |
JPMorgan Chase & Company |
2.2% |
iShares Expanded Tech-Software Sector ETF |
2.1% |
Thermo Fisher Scientific, Inc. |
2.1% |
Merck & Company, Inc. |
2.1% |
Sector Concentration vs. the S&P 500® Index |
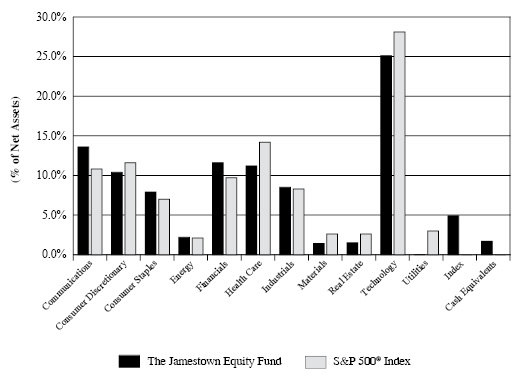
3
THE JAMESTOWN EQUITY FUND |
||||||||
COMMON STOCKS — 84.7% |
Shares |
Value |
||||||
Communications — 12.9% |
||||||||
Alphabet, Inc. - Class A (a) |
550 | $ | 806,080 | |||||
Alphabet, Inc. - Class C (a) |
500 | 734,800 | ||||||
Booking Holdings, Inc. (a) |
450 | 769,806 | ||||||
Comcast Corporation - Class A |
16,000 | 740,160 | ||||||
Facebook, Inc. - Class A (a) |
5,600 | 1,466,640 | ||||||
Walt Disney Company (The) |
4,550 | 564,564 | ||||||
| 5,082,050 | ||||||||
Consumer Discretionary — 10.4% |
||||||||
Amazon.com, Inc. (a) |
650 | 2,046,674 | ||||||
Home Depot, Inc. (The) |
2,400 | 666,504 | ||||||
Lowe’s Companies, Inc. |
4,695 | 778,713 | ||||||
TJX Companies, Inc. (The) |
11,000 | 612,150 | ||||||
| 4,104,041 | ||||||||
Consumer Staples — 6.3% |
||||||||
Dollar Tree, Inc. (a) |
6,000 | 548,040 | ||||||
PepsiCo, Inc. |
5,200 | 720,720 | ||||||
Target Corporation |
4,960 | 780,803 | ||||||
Walmart, Inc. |
3,000 | 419,730 | ||||||
| 2,469,293 | ||||||||
Energy — 2.2% |
||||||||
Chevron Corporation |
7,700 | 554,400 | ||||||
Total SE - ADR |
9,500 | 325,850 | ||||||
| 880,250 | ||||||||
Financials — 11.6% |
||||||||
Ameriprise Financial, Inc. |
4,250 | 654,968 | ||||||
Chubb Ltd. |
2,500 | 290,300 | ||||||
Goldman Sachs Group, Inc. (The) |
3,300 | 663,201 | ||||||
JPMorgan Chase & Company |
9,200 | 885,684 | ||||||
Morgan Stanley |
14,300 | 691,405 | ||||||
PNC Financial Services Group, Inc. (The) |
5,500 | 604,505 | ||||||
Truist Financial Corporation |
20,625 | 784,781 | ||||||
| 4,574,844 | ||||||||
Health Care — 11.2% |
||||||||
Amgen, Inc. |
1,800 | 457,488 | ||||||
Anthem, Inc. |
2,000 | 537,180 | ||||||
CVS Health Corporation |
10,800 | 630,720 | ||||||
Merck & Company, Inc. |
9,800 | 812,910 | ||||||
Pfizer, Inc. |
14,500 | 532,150 | ||||||
Thermo Fisher Scientific, Inc. |
1,900 | 838,888 | ||||||
UnitedHealth Group, Inc. |
2,000 | 623,540 | ||||||
| 4,432,876 | ||||||||
4
THE JAMESTOWN EQUITY FUND |
||||||||
COMMON STOCKS — 84.7% (Continued) |
Shares |
Value |
||||||
Industrials — 8.5% |
||||||||
Eaton Corporation plc |
7,300 | $ | 744,819 | |||||
Lockheed Martin Corporation |
1,000 | 383,280 | ||||||
Norfolk Southern Corporation |
3,700 | 791,763 | ||||||
Raytheon Technologies Corporation |
5,800 | 333,732 | ||||||
Trane Technologies plc |
4,300 | 521,375 | ||||||
United Parcel Service, Inc. - Class B |
3,600 | 599,868 | ||||||
| 3,374,837 | ||||||||
Materials — 1.4% |
||||||||
Eastman Chemical Company |
7,000 | 546,840 | ||||||
Real Estate — 1.5% |
||||||||
American Tower Corporation |
2,400 | 580,152 | ||||||
Technology — 18.7% |
||||||||
Apple, Inc. |
22,800 | 2,640,468 | ||||||
Broadcom, Inc. |
1,400 | 510,048 | ||||||
Cisco Systems, Inc. |
19,500 | 768,105 | ||||||
Intel Corporation |
6,900 | 357,282 | ||||||
Microsoft Corporation |
8,200 | 1,724,706 | ||||||
Oracle Corporation |
11,500 | 686,550 | ||||||
Visa, Inc. - Class A |
3,400 | 679,898 | ||||||
| 7,367,057 | ||||||||
Total Common Stocks (Cost $15,959,855) |
$ | 33,412,240 | ||||||
|
||||||||
EXCHANGE-TRADED FUNDS — 13.6% |
Shares |
Value |
||||||
Communication Services Select Sector SPDR Fund |
4,500 | $ | 267,300 | |||||
Consumer Staples Select Sector SPDR Fund |
10,000 | 641,000 | ||||||
iShares Expanded Tech-Software Sector ETF |
2,700 | 840,024 | ||||||
iShares PHLX Semiconductor ETF |
1,700 | 517,837 | ||||||
SPDR Portfolio S&P 500 Growth ETF |
8,000 | 400,880 | ||||||
SPDR Portfolio S&P 500 Value ETF |
31,265 | 944,203 | ||||||
Vanguard Information Technology ETF |
3,700 | 1,152,365 | ||||||
Vanguard S&P 500 ETF |
1,900 | 584,535 | ||||||
Total Exchange-Traded Funds (Cost $3,541,255) |
$ | 5,348,144 | ||||||
5
THE JAMESTOWN EQUITY FUND |
||||||||
MONEY MARKET FUNDS — 1.8% |
Shares |
Value |
||||||
Federated Hermes Government Obligations Fund - Institutional Class, 0.01% (b) (Cost $719,128) |
719,128 | $ | 719,128 | |||||
Total Investments at Value — 100.1% (Cost $20,220,238) |
$ | 39,479,512 | ||||||
Liabilities in Excess of Other Assets — (0.1%) |
(24,581 | ) | ||||||
Net Assets — 100.0% |
$ | 39,454,931 | ||||||
ADR - American Depositary Receipt. |
|
(a) |
Non-income producing security. |
(b) |
The rate shown is the 7-day effective yield as of September 30, 2020. |
See accompanying notes to financial statements. |
|
6
THE JAMESTOWN EQUITY FUND |
||||
ASSETS |
||||
Investments in securities: |
||||
At cost |
$ | 20,220,238 | ||
At value (Note 2) |
$ | 39,479,512 | ||
Dividends receivable |
24,326 | |||
Other assets |
11,257 | |||
TOTAL ASSETS |
39,515,095 | |||
LIABILITIES |
||||
Distributions payable |
4,957 | |||
Payable for capital shares redeemed |
27,121 | |||
Accrued investment advisory fees (Note 4) |
18,136 | |||
Payable to administrator (Note 4) |
6,000 | |||
Other accrued expenses |
3,950 | |||
TOTAL LIABILITIES |
60,164 | |||
NET ASSETS |
$ | 39,454,931 | ||
Net assets consist of: |
||||
Paid-in capital |
$ | 19,568,726 | ||
Accumulated earnings |
19,886,205 | |||
Net assets |
$ | 39,454,931 | ||
Shares of beneficial interest outstanding (unlimited number of shares authorized, $0.01 par value) |
1,621,460 | |||
Net asset value, offering price and redemption price per share (Note 2) |
$ | 24.33 | ||
See accompanying notes to financial statements. |
7
THE JAMESTOWN EQUITY FUND |
||||
INVESTMENT INCOME |
||||
Dividends |
$ | 323,474 | ||
Foreign withholding taxes on dividends |
(3,770 | ) | ||
TOTAL INVESTMENT INCOME |
319,704 | |||
EXPENSES |
||||
Investment advisory fees (Note 4) |
119,828 | |||
Administration fees (Note 4) |
30,000 | |||
Audit and tax services fees |
8,750 | |||
Registration and filing fees |
8,514 | |||
Trustees’ fees (Note 4) |
7,500 | |||
Compliance service fees (Note 4) |
6,000 | |||
Printing of shareholder reports |
4,893 | |||
Custodian and bank service fees |
4,617 | |||
Legal fees |
3,952 | |||
Postage and supplies |
2,669 | |||
Account maintenance fees |
1,717 | |||
Insurance expense |
617 | |||
Pricing costs |
319 | |||
Other expenses |
3,750 | |||
TOTAL EXPENSES |
203,126 | |||
Fees voluntarily waived by the Adviser (Note 4) |
(27,993 | ) | ||
NET EXPENSES |
175,133 | |||
NET INVESTMENT INCOME |
144,571 | |||
REALIZED AND UNREALIZED GAINS ON INVESTMENTS |
||||
Net realized gains on investment transactions |
692,747 | |||
Net change in unrealized appreciation (depreciation) on investments |
8,720,985 | |||
NET REALIZED AND UNREALIZED GAINS ON INVESTMENTS |
9,413,732 | |||
NET INCREASE IN NET ASSETS RESULTING FROM OPERATIONS |
$ | 9,558,303 | ||
See accompanying notes to financial statements. |
8
THE JAMESTOWN EQUITY FUND |
||||||||
|
Six Months |
Year |
||||||
FROM OPERATIONS |
||||||||
Net investment income |
$ | 144,571 | $ | 357,046 | ||||
Net realized gains on investment transactions |
692,747 | 2,267,311 | ||||||
Net change in unrealized appreciation (depreciation) on investments |
8,720,985 | (4,447,825 | ) | |||||
Net increase (decrease) in net assets resulting from operations |
9,558,303 | (1,823,468 | ) | |||||
DISTRIBUTIONS TO SHAREHOLDERS (Note 2) |
(1,066,907 | ) | (2,585,429 | ) | ||||
FROM CAPITAL SHARE TRANSACTIONS |
||||||||
Proceeds from shares sold |
85,491 | 405,362 | ||||||
Net asset value of shares issued in reinvestment of distributions to shareholders |
990,830 | 2,409,578 | ||||||
Payments for shares redeemed |
(1,174,903 | ) | (4,001,840 | ) | ||||
Net decrease in net assets from capital share transactions |
(98,582 | ) | (1,186,900 | ) | ||||
TOTAL INCREASE (DECREASE) IN NET ASSETS |
8,392,814 | (5,595,797 | ) | |||||
NET ASSETS |
||||||||
Beginning of period |
31,062,117 | 36,657,914 | ||||||
End of period |
$ | 39,454,931 | $ | 31,062,117 | ||||
CAPITAL SHARE ACTIVITY |
||||||||
Shares sold |
4,033 | 17,643 | ||||||
Shares reinvested |
43,910 | 107,138 | ||||||
Shares redeemed |
(54,340 | ) | (179,068 | ) | ||||
Net decrease in shares outstanding |
(6,397 | ) | (54,287 | ) | ||||
Shares outstanding, beginning of period |
1,627,857 | 1,682,144 | ||||||
Shares outstanding, end of period |
1,621,460 | 1,627,857 | ||||||
See accompanying notes to financial statements. |
9
THE JAMESTOWN EQUITY FUND |
||||||||||||||||||||||||
Selected Per Share Data for a Share Outstanding Throughout Each Period: |
||||||||||||||||||||||||
|
Six Months |
Years Ended March 31, |
||||||||||||||||||||||
|
(Unaudited) |
2020 |
2019 |
2018 |
2017 |
2016 |
||||||||||||||||||
Net asset value at beginning of period |
$ | 19.08 | $ | 21.79 | $ | 22.10 | $ | 20.89 | $ | 19.57 | $ | 21.91 | ||||||||||||
Income (loss) from investment operations: |
||||||||||||||||||||||||
Net investment income (a) |
0.09 | 0.22 | 0.24 | 0.19 | 0.19 | 0.16 | ||||||||||||||||||
Net realized and unrealized gains (losses) on investments |
5.82 | (1.35 | ) | 1.10 | 2.51 | 2.12 | (1.18 | ) | ||||||||||||||||
Total from investment operations |
5.91 | (1.13 | ) | 1.34 | 2.70 | 2.31 | (1.02 | ) | ||||||||||||||||
Less distributions: |
||||||||||||||||||||||||
From net investment income |
(0.09 | ) | (0.22 | ) | (0.24 | ) | (0.19 | ) | (0.20 | ) | (0.16 | ) | ||||||||||||
From net realized gains |
(0.57 | ) | (1.36 | ) | (1.41 | ) | (1.30 | ) | (0.79 | ) | (1.16 | ) | ||||||||||||
Total distributions |
(0.66 | ) | (1.58 | ) | (1.65 | ) | (1.49 | ) | (0.99 | ) | (1.32 | ) | ||||||||||||
Net asset value at end of period |
$ | 24.33 | $ | 19.08 | $ | 21.79 | $ | 22.10 | $ | 20.89 | $ | 19.57 | ||||||||||||
Total return (b) |
31.29 | %(c) | (6.17 | %) | 6.40 | % | 13.35 | % | 12.14 | % | (4.96 | %) | ||||||||||||
Net assets at end of period (000’s) |
$ | 39,455 | $ | 31,062 | $ | 36,658 | $ | 37,570 | $ | 37,460 | $ | 37,682 | ||||||||||||
Ratio of total expenses to average net assets (d) |
1.10 | %(e) | 1.08 | % | 1.03 | % | 1.03 | % | 1.03 | % | 1.03 | % | ||||||||||||
Ratio of net expenses to average net assets (d) |
0.95 | %(e)(f) | 0.95 | %(f) | 0.95 | %(f) | 0.95 | %(f) | 0.95 | %(f) | 1.00 | % | ||||||||||||
Ratio of net investment income to average net assets (a)(d) |
0.78 | %(e)(f) | 0.96 | %(f) | 1.10 | %(f) | 0.87 | %(f) | 0.96 | %(f) | 0.82 | % | ||||||||||||
Portfolio turnover rate |
6 | %(b) | 18 | % | 18 | % | 18 | % | 27 | % | 50 | % | ||||||||||||
(a) |
Recognition of net investment income by the Fund is affected by the timing of the declarations of dividends by the underlying investment companies in which the Fund invests. |
(b) |
Total return is a measure of the change in value of an investment in the Fund over the periods covered, which assumes any dividends or capital gains distributions are reinvested in shares of the Fund. Returns shown do not reflect the deduction of taxes a shareholder would pay on Fund distributions or the redemption of Fund shares. |
(c) |
Not annualized. |
(d) |
The ratios of expenses and net investment income to average net assets do not reflect the Fund’s proportionate share of expenses of the underlying investment companies in which the Fund invests. Ratios were also determined based on net expenses after expense reimbursements through a directed brokerage arrangement (Note 5). |
(e) |
Annualized. |
(f) |
Ratio was determined after voluntary advsiory fee waivers by the Adviser and reimbursed expenses (Notes 4 and 5). |
See accompanying notes to financial statements. |
|
10
THE JAMESTOWN EQUITY FUND
NOTES TO FINANCIAL STATEMENTS
September 30, 2020 (Unaudited)
1. Organization
The Jamestown Equity Fund (the “Fund”) is a diversified, no-load series of Williamsburg Investment Trust (the “Trust”), an open-end management investment company registered under the Investment Company Act of 1940, as amended (the “1940 Act”). The Trust was organized as a Massachusetts business trust on July 18, 1988. Other series of the Trust are not included in this report.
The investment objective of the Fund is long-term growth of capital.
2. Significant Accounting Policies
The Fund follows accounting and reporting guidance under Financial Accounting Standards Board Accounting Standards Codification Topic 946, “Financial Services – Investment Companies.” The following is a summary of the Fund’s significant accounting policies. These policies are in conformity with accounting principles generally accepted in the United States of America (“GAAP”).
Securities valuation — The Fund’s portfolio securities are valued as of the close of business of the regular session of the New York Stock Exchange (normally 4:00 p.m., Eastern time). Securities traded on a national stock exchange, including common stocks and exchange-traded funds (“ETFs”), are generally valued based upon the closing price on the principal exchange where the security is traded, if available, otherwise, at the last quoted bid price. Securities that are quoted by NASDAQ are valued at the NASDAQ Official Closing Price. Investments representing shares of other open-end investment companies, other than ETFs but including money market funds, are valued at their net asset value (“NAV”) as reported by such companies. When using a quoted price and when the market is considered active, securities will be classified as Level 1 within the fair value hierarchy (see below).
When market quotations are not readily available, if a pricing service cannot provide a price, or if the investment adviser believes the price received from the pricing service is not indicative of market value, securities will be valued in good faith at fair value using methods consistent with procedures adopted by the Board of Trustees and will be classified as Level 2 or 3 within the fair value hierarchy, depending on the inputs used. Such methods of fair valuation may include, but are not limited to: multiple of earnings, multiple of book value, discount from market of a similar freely traded security, purchase price of the security, subsequent private transactions in the security or related securities, or a combination of these and other factors.
GAAP establishes a single authoritative definition of fair value, sets out a framework for measuring fair value and requires additional disclosures about fair value measurements.
Various inputs are used in determining the value of the Fund’s investments. These inputs are summarized in the three broad levels listed below:
|
● |
Level 1 – quoted prices in active markets for identical securities |
|
● |
Level 2 – other significant observable inputs |
11
THE JAMESTOWN EQUITY FUND
NOTES TO FINANCIAL STATEMENTS (Continued)
|
● |
Level 3 – significant unobservable inputs |
The inputs or methodology used for valuing securities are not necessarily an indication of the risks associated with investing in those securities. The inputs used to measure fair value may fall into different levels of the fair value hierarchy. In such cases, for disclosure purposes, the level in the fair value hierarchy within which the fair value measurement falls in its entirety is determined based on the lowest level input that is significant to the fair value measurement.
The following is a summary of the Fund’s investments based on the inputs used to value the investments as of September 30, 2020, by security type:
|
Level 1 |
Level 2 |
Level 3 |
Total |
||||||||||||
Common Stocks |
$ | 33,412,240 | $ | — | $ | — | $ | 33,412,240 | ||||||||
Exchange-Traded Funds |
5,348,144 | — | — | 5,348,144 | ||||||||||||
Money Market Funds |
719,128 | — | — | 719,128 | ||||||||||||
Total |
$ | 39,479,512 | $ | — | $ | — | $ | 39,479,512 | ||||||||
Refer to the Fund’s Schedule of Investments for a listing of the common stocks by sector type. There were no Level 3 securities or derivative instruments held by the Fund as of or during the six months ended September 30, 2020.
Share valuation — The NAV per share of the Fund is calculated daily by dividing the total value of its assets, less liabilities, by the number of shares outstanding. The offering price and redemption price per share of the Fund is equal to the NAV per share.
Investment income — Dividend income is recorded on the ex-dividend date. Non-cash dividends included in dividend income, if any, are recorded at the fair market value of the security received. Withholding taxes on foreign dividends received by the Fund, if any, have been recorded in accordance with the Trust’s understanding of the applicable country’s rules and tax rates.
Distributions to shareholders — Dividends arising from net investment income, if any, are declared and paid quarterly to shareholders of the Fund. Net realized short-term capital gains, if any, may be distributed throughout the year and net realized long-term capital gains, if any, are distributed at least once each year. The amount of distributions from net investment income and net realized capital gains are determined in accordance with federal income tax regulations, which may differ from GAAP. Dividends and distributions are recorded on the ex-dividend date.
The tax character of distributions paid during the periods ended September 30, 2020 and March 31, 2020 was as follows:
Periods |
Ordinary |
Long-Term |
Total |
|||||||||
9/30/2020 |
$ | 253,875 | $ | 813,032 | $ | 1,066,907 | ||||||
3/31/2020 |
$ | 357,284 | $ | 2,227,772 | $ | 2,585,056 | ||||||
12
THE JAMESTOWN EQUITY FUND
NOTES TO FINANCIAL STATEMENTS (Continued)
Investment transactions — Investment transactions are accounted for on trade date for financial reporting purposes. Realized gains and losses on investment securities sold are determined on a specific identification basis.
Common expenses — Common expenses of the Trust are allocated among the series of the Trust based on relative net assets of each series or the nature of the services performed and the relative applicability to each series.
Estimates — The preparation of financial statements in conformity with GAAP requires management to make estimates and assumptions that affect the reported amounts of assets and liabilities and the disclosure of contingent assets and liabilities, each as of the date of the financial statements, and the reported amounts of increase (decrease) in net assets from operations during the reporting period. Actual results could differ from those estimates.
Federal income tax — The Fund has qualified and intends to continue to qualify as a regulated investment company under the Internal Revenue Code of 1986, as amended (the “Code”). Qualification generally will relieve the Fund of liability for federal income taxes to the extent 100% of its net investment income and net realized capital gains are distributed in accordance with the Code.
In order to avoid imposition of the excise tax applicable to regulated investment companies, it is also the Fund’s intention to declare as dividends in each calendar year at least 98% of its net investment income (earned during the calendar year) and 98.2% of its net realized capital gains (earned during the twelve months ended October 31) plus undistributed amounts from prior years.
The tax character of accumulated earnings at September 30, 2020 was as follows:
Tax cost of portfolio investments |
$ | 20,284,079 | ||
Gross unrealized appreciation |
$ | 19,452,049 | ||
Gross unrealized depreciation |
(256,616 | ) | ||
Net unrealized appreciation |
19,195,433 | |||
Accumulated ordinary income |
3,892 | |||
Other gains |
691,837 | |||
Distributions payable |
(4,957 | ) | ||
Accumulated earnings |
$ | 19,886,205 |
The difference between the federal income tax cost of portfolio investments and the financial statement cost of portfolio investments for the Fund is due to certain timing differences in the recognition of capital gains or losses under income tax regulations and GAAP. These “book/tax” differences are temporary in nature and are primarily due to the tax deferral of losses on wash sales.
13
THE JAMESTOWN EQUITY FUND
NOTES TO FINANCIAL STATEMENTS (Continued)
The Fund recognizes the tax benefits or expenses of uncertain tax positions only when the position is “more likely than not” to be sustained assuming examination by tax authorities. Management has reviewed the tax positions taken on Federal income tax returns for the current and all open tax years (generally three years) of the Fund and has concluded that no provision for unrecognized tax benefits or expenses is required in these financial statements.
3. Investment Transactions
Investment transactions, other than short-term investments and U.S. government securities, were as follows for the six months ended September 30, 2020:
Purchase of investment securities |
$ | 3,738,075 | ||
Proceeds from sales of investment securities |
$ | 2,031,084 |
4. Transactions with Related Parties
INVESTMENT ADVISORY AGREEMENT
The Fund’s investments are managed by Lowe, Brockenbrough & Company, Inc. (the “Adviser”) under the terms of an Investment Advisory Agreement. The Fund pays the Adviser a fee, which is computed and accrued daily and paid monthly, at annual rates of 0.65% of its average daily net assets up to $500 million and 0.55% of such assets in excess of $500 million. Certain officers of the Trust are also officers of the Adviser.
During the six months ended September 30, 2020, the Adviser voluntarily limited the total annual operating expenses of the Fund to 0.95% of average daily net assets; accordingly, the Adviser voluntarily waived $27,993 of its investment advisory fees during the six months ended September 30, 2020. This amount is not subject to recapture in future periods.
OTHER SERVICE PROVIDERS
Ultimus Fund Solutions, LLC (“Ultimus”) provides administration, fund accounting, compliance and transfer agent services to the Fund. The Fund pays Ultimus fees in accordance with the agreements for such services. In addition, the Fund pays out-of-pocket expenses including, but not limited to, postage, supplies, and certain costs related to the pricing of the Fund’s portfolio securities. Certain officers of the Trust are also officers of Ultimus, or of Ultimus Fund Distributors, LLC (the “Distributor”), the principal underwriter of the Fund and an affiliate of Ultimus. The Distributor is compensated by the Adviser (not the Fund) for acting as principal underwriter.
COMPENSATION OF TRUSTEES
Trustees and officers affiliated with the Adviser or Ultimus are not compensated by the Trust for their services. Each Trustee who is not an affiliated person of the Adviser or Ultimus received from the Trust an annual retainer of $24,000, payable quarterly; a fee of $2,000 for attendance at each meeting of the Board of Trustees (except that such fee is $3,000 for the independent chair);
14
THE JAMESTOWN EQUITY FUND
NOTES TO FINANCIAL STATEMENTS (Continued)
and a fee of $1,000 for attendance at each meeting of any committee of the Board (except that such fee is $1,500 for the committee chair); plus reimbursement of travel and other expenses incurred in attending meetings. Each series of the Trust pays its proportionate share of such fees.
5. Sector Risk
If a Fund has significant investments in the securities of issuers in industries within a particular business sector, any development affecting that sector will have a greater impact on the value of the net assets of the Fund than would be the case if the Fund did not have significant investments in that sector. In addition, this may increase the risk of loss of an investment in the Fund and increase the volatility of the Fund’s NAV per share. From time to time, circumstances may affect a particular sector and the companies within such sector. For instance, economic or market factors, regulation or deregulation, or other developments may negatively impact all companies in a particular sector and therefore the value of a Fund’s portfolio would be adversely affected. As of September 30, 2020, the Fund had 25.0% of the value of its net assets invested in common stocks and ETFs within the Technology sector.
6. Contingencies and Commitments
The Fund indemnifies the Trust’s officers and Trustees for certain liabilities that might arise from the performance of their duties to the Fund. Additionally, in the normal course of business the Fund enters into contracts that contain a variety of representations and warranties and which provide general indemnifications. The Fund’s maximum exposure under these arrangements is unknown, as this would involve future claims that may be made against the Fund that have not yet occurred. However, based on experience, the Trust expects the risk of loss to be remote.
7. Subsequent Events
The Fund is required to recognize in the financial statements the effects of all subsequent events that provide additional evidence about conditions that existed as of the date of the Statement of Assets and Liabilities. For non-recognized subsequent events that must be disclosed to keep the financial statements from being misleading, the Fund is required to disclose the nature of the event as well as an estimate of its financial effect, or a statement that such an estimate cannot be made. Management has evaluated subsequent events through the issuance of these financial statements and has noted no such events.
15
THE JAMESTOWN EQUITY FUND
ABOUT YOUR FUND’S EXPENSES (Unaudited)
We believe it is important for you to understand the impact of costs on your investment. All mutual funds have operating expenses. As a shareholder of the Fund, you incur ongoing costs, including management fees and other expenses. The following examples are intended to help you understand your ongoing costs (in dollars) of investing in the Fund and to compare these costs with the ongoing costs of investing in other mutual funds.
A mutual fund’s ongoing costs are expressed as a percentage of its average net assets. This figure is known as the expense ratio. The expenses in the table below are based on an investment of $1,000 made at the beginning of the period shown and held for the entire period (April 1, 2020 through September 30, 2020).
The table below illustrates the Fund’s costs in two ways:
Actual fund return – This section helps you to estimate the actual expenses that you paid over the period. The “Ending Account Value” shown is derived from the Fund’s actual return, and the fourth column shows the dollar amount of operating expenses that would have been paid by an investor who started with $1,000 in the Fund. You may use the information here, together with the amount you invested, to estimate the expenses that you paid over the period.
To do so, simply divide your account value by $1,000 (for example, an $8,600 account value divided by $1,000 = 8.6), then multiply the result by the number given for the Fund under the heading “Expenses Paid During Period.”
Hypothetical 5% return – This section is intended to help you compare the Fund’s ongoing costs with those of other mutual funds. It assumes that the Fund had an annual return of 5% before expenses during the period shown, but that the expense ratio is unchanged. In this case, because the returns used are not the Fund’s actual returns, the results do not apply to your investment. The example is useful in making comparisons because the U.S. Securities and Exchange Commission (the “SEC”) requires all mutual funds to calculate expenses based on a 5% return. You can assess the Fund’s ongoing costs by comparing this hypothetical example with the hypothetical examples that appear in shareholder reports of other funds.
Note that expenses shown in the table are meant to highlight and help you compare ongoing costs only. The Fund does not charge sales loads or redemption fees.
The calculations assume no shares were bought or sold during the period. Your actual costs may have been higher or lower, depending on the amount of your investment and the timing of any purchases or redemptions.
More information about the Fund’s expenses, including annual expense ratios for the prior five fiscal years, can be found in this report. For additional information on operating expenses and other shareholder costs, please refer to the Fund’s prospectus.
16
THE JAMESTOWN EQUITY FUND
ABOUT YOUR FUND’S EXPENSES (Unaudited) (Continued)
Beginning |
Ending |
Net |
Expenses |
|
Based on Actual Fund Return |
$1,000.00 |
$ 1,312.90 |
0.95% |
$5.49 |
Based on Hypothetical 5% Return (before expenses) |
$1,000.00 |
$ 1,020.25 |
0.95% |
$4.80 |
(a) |
Annualized, based on the Fund’s most recent one-half year expenses. |
(b) |
Expenses are equal to the Fund’s annualized net expense ratio multiplied by the average account value over the period, muliplied by 183/366 (to reflect the one-half year period). |
OTHER INFORMATION (Unaudited)
A description of the policies and procedures that the Fund uses to vote proxies relating to portfolio securities is available without charge upon request by calling toll-free 1-866-738-1126, or on the SEC’s website at www.sec.gov. Information regarding how the Fund voted proxies relating to portfolio securities during the most recent 12-month period ended June 30 is also available without charge upon request by calling toll-free 1-866-738-1126, or on the SEC’s website at www.sec.gov.
The Trust files a complete listing of portfolio holdings of the Fund with the SEC as of the end of the first and third quarters of each fiscal year as an exhibit to its reports on Form N-PORT. The filings are available upon request, by calling 1-866-738-1126. Furthermore, you may obtain a copy of these filings on the SEC’s website at www.sec.gov.
17
THE JAMESTOWN EQUITY FUND
LIQUIDITY RISK MANAGEMENT PROGRAM (Unaudited)
The Fund has adopted and implemented a written liquidity risk management program as required by Rule 22e-4 (the “Liquidity Rule”) under the Investment Company Act. The program is reasonably designed to assess and manage the Fund’s liquidity risk, taking into consideration, among other factors, the Fund’s investment strategy and the liquidity of its portfolio investments during normal and reasonably foreseeable stressed conditions; its short and long-term cash flow projections; and its cash holdings and access to other funding sources. The Fund’s Board of Trustees approved the appointment of a Liquidity Risk Committee, which includes representatives from Lowe, Brockenbrough & Company, the Fund’s investment adviser, and Ultimus Fund Solutions, LLC, the Fund’s Administrator. The Liquidity Risk Committee is responsible for the program’s administration and oversight and for reporting to the Board on at least an annual basis regarding the program’s operation and effectiveness. The Liquidity Risk Committee updated its assessment of the Fund’s liquidity risk profile, considering additional data gathered in the 12 months ended May 31, 2020 and the adequacy and effectiveness of the liquidity risk management program’s operations since its inception on June 1, 2019 (the “Review Period”) in order to prepare a written report for the Board of Trustees (the “Report”) for consideration at its meeting held on August 18, 2020. During the Review Period, which covered the period when all but essential businesses were mandated to close for a time in response to the COVID-19 pandemic, the Fund did not experience unusual stress or disruption to its operations related to purchase and redemption activity. Also, during the Review Period the Fund held adequate levels of cash and highly liquid investments to meet shareholder redemption activities in accordance with applicable requirements. The Report concluded that (i) the Fund’s liquidity risk management program is reasonably designed to prevent violations of the Liquidity Rule and (ii) the Fund’s liquidity risk management program has been effectively implemented.
18
This page intentionally left blank.
This page intentionally left blank.
This page intentionally left blank.
THE JAMESTOWN EQUITY FUND
www.jamestownfunds.com
Investment Adviser
Lowe, Brockenbrough & Company, Inc.
1802 Bayberry Court
Suite 400
Richmond, Virginia 23226
Administrator
Ultimus Fund Solutions, LLC
P.O. Box 46707
Cincinnati, Ohio 45246-0707
(Toll-Free) 1-866-738-1126
Independent Registered
Public Accounting Firm
Cohen & Company, Ltd.
1350 Euclid Avenue
Suite 800
Cleveland, Ohio 44115
Legal Counsel
Sullivan & Worcester LLP
1666 K Street, N.W.
Washington, DC 20006
Board of Trustees
John P. Ackerly, IV
John T. Bruce
George K. Jennison
Robert S. Harris, Ph.D.
Harris V. Morrissette
Elizabeth W. Robertson
| Item 2. | Code of Ethics. |
Not required
| Item 3. | Audit Committee Financial Expert. |
Not required
| Item 4. | Principal Accountant Fees and Services. |
Not required
| Item 5. | Audit Committee of Listed Registrants. |
Not applicable
| Item 6. | Schedule of Investments. |
| (a) | Schedule filed with Item 1 |
| (b) | Not applicable |
| Item 7. | Disclosure of Proxy Voting Policies and Procedures for Closed-End Management Investment Companies. |
Not applicable
| Item 8. | Portfolio Managers of Closed-End Management Investment Companies. |
Not applicable
| Item 9. | Purchases of Equity Securities by Closed-End Management Investment Company and Affiliated Purchasers. |
Not applicable
| Item 10. | Submission of Matters to a Vote of Security Holders. |
The registrant’s Governance, Nominating, Compensation and QLCC Committee shall review shareholder recommendations to fill vacancies on the registrant’s board of trustees if such recommendations are submitted in writing, addressed to the Committee at the registrant’s offices and meet any minimum qualifications adopted by the Committee. The Committee may adopt, by resolution, a policy regarding its procedures for considering candidates for the board of trustees, including any recommended by shareholders.
| Item 11. | Controls and Procedures. |
(a) Based on their evaluation of the registrant’s disclosure controls and procedures (as defined in Rule 30a-3(c) under the Investment Company Act of 1940) as of a date within 90 days of the filing date of this report, the registrant’s principal executive officers and principal financial officer have concluded that such disclosure controls and procedures are reasonably designed and are operating effectively to ensure that material information relating to the registrant, including its consolidated subsidiaries, is made known to them by others within those entities, particularly during the period in which this report is being prepared, and that the information required in filings on Form N-CSR is recorded, processed, summarized, and reported on a timely basis.
(b) There were no changes in the registrant’s internal control over financial reporting (as defined in Rule 30a-3(d) under the Investment Company Act of 1940) that occurred during the period covered by this report that have materially affected, or are reasonably likely to materially affect, the registrant’s internal control over financial reporting.
| Item 12. | Disclosure of Securities Lending Activities for Closed-End Management Investment Companies. |
Not applicable
| Item 13. | Exhibits. |
File the exhibits listed below as part of this Form. Letter or number the exhibits in the sequence indicated.
(a)(1) Any code of ethics, or amendment thereto, that is the subject of the disclosure required by Item 2, to the extent that the registrant intends to satisfy the Item 2 requirements through filing of an exhibit: Not required
(a)(2) A separate certification for each principal executive officer and principal financial officer of the registrant as required by Rule 30a-2(a) under the Act (17 CFR 270.30a-2(a)): Attached hereto
(a)(3) Any written solicitation to purchase securities under Rule 23c-1 under the Act (17 CFR 270.23c-1) sent or given during the period covered by the report by or on behalf of the registrant to 10 or more persons: Not applicable
(a)(4) Change in the registrant’s independent public accountants: Not applicable
(b) Certifications required by Rule 30a-2(b) under the Act (17 CFR 270.30a-2(b)): Attached hereto
| Exhibit 99.CERT | Certifications required by Rule 30a-2(a) under the Act |
| Exhibit 99.906CERT | Certifications required by Rule 30a-2(b) under the Act |
SIGNATURES
Pursuant to the requirements of the Securities Exchange Act of 1934 and the Investment Company Act of 1940, the registrant has duly caused this report to be signed on its behalf by the undersigned, thereunto duly authorized.
| (Registrant) | Williamsburg Investment Trust |
| By (Signature and Title)* | /s/ David James | ||
| David James, Secretary | |||
| Date | November 23, 2020 | ||
| Pursuant to the requirements of the Securities Exchange Act of 1934 and the Investment Company Act of 1940, this report has been signed below by the following persons on behalf of the registrant and in the capacities and on the dates indicated. | |||
| By (Signature and Title)* | /s/ John T. Bruce | ||
| John T. Bruce, President | |||
| (FBP Equity & Dividend Plus Fund and FBP Appreciation & Income Opportunities Fund) | |||
| Date | November 23, 2020 | ||
| By (Signature and Title)* | /s/ Thomas W. Leavell | ||
| Thomas W. Leavell, President | |||
| (The Government Street Equity Fund and The Government Street Mid-Cap Fund) | |||
| Date | November 23, 2020 | ||
| By (Signature and Title)* | /s/ Charles M. Caravati III | ||
| Charles M. Caravati III, President | |||
| (The Jamestown Equity Fund) | |||
| Date | November 23, 2020 | ||
| By (Signature and Title)* | /s/ John P. Ackerly IV | ||
| John P. Ackerly IV, President | |||
| (The Davenport Core Fund, Davenport Value & Income Fund, Davenport Equity Opportunities Fund, Davenport Small Cap Focus Fund and the Davenport Balanced Income Fund) | |||
| Date | November 23, 2020 | ||
| By (Signature and Title)* | /s/ Mark J. Seger | ||
| Mark J. Seger, Treasurer and Principal Financial Officer | |||
| Date | November 23, 2020 | ||
| * | Print the name and title of each signing officer under his or her signature. |
EX-99.CERT
CERTIFICATIONS
I, John T. Bruce, certify that:
1. I have reviewed this report on Form N-CSR of FBP Equity & Dividend Plus Fund and FBP Appreciation & Income Opportunities Fund;
2. Based on my knowledge, this report does not contain any untrue statement of a material fact or omit to state a material fact necessary to make the statements made, in light of the circumstances under which such statements were made, not misleading with respect to the period covered by this report;
3. Based on my knowledge, the financial statements, and other financial information included in this report, fairly present in all material respects the financial condition, results of operations, changes in net assets, and cash flows (if the financial statements are required to include a statement of cash flows) of the registrant as of, and for, the periods presented in this report;
4. The registrant’s other certifying officer(s) and I are responsible for establishing and maintaining disclosure controls and procedures (as defined in Rule 30a-3(c) under the Investment Company Act of 1940) and internal control over financial reporting (as defined in Rule 30a-3(d) under the Investment Company Act of 1940) for the registrant and have:
(a) Designed such disclosure controls and procedures, or caused such disclosure controls and procedures to be designed under our supervision, to ensure that material information relating to the registrant, including its consolidated subsidiaries, is made known to us by others within those entities, particularly during the period in which this report is being prepared;
(b) Designed such internal control over financial reporting, or caused such internal control over financial reporting to be designed under our supervision, to provide reasonable assurance regarding the reliability of financial reporting and the preparation of financial statements for external purposes in accordance with generally accepted accounting principles;
(c) Evaluated the effectiveness of the registrant’s disclosure controls and procedures and presented in this report our conclusions about the effectiveness of the disclosure controls and procedures, as of a date within 90 days prior to the filing date of this report based on such evaluation; and
(d) Disclosed in this report any change in the registrant’s internal control over financial reporting that occurred during the period covered by this report that has materially affected, or is reasonably likely to materially affect, the registrant’s internal control over financial reporting; and
5. The registrant’s other certifying officer(s) and I have disclosed to the registrant’s auditors and the audit committee of the registrant’s board of directors (or persons performing the equivalent functions):
(a) All significant deficiencies and material weaknesses in the design or operation of internal control over financial reporting which are reasonably likely to adversely affect the registrant’s ability to record, process, summarize, and report financial information; and
(b) Any fraud, whether or not material, that involves management or other employees who have a significant role in the registrant’s internal control over financial reporting.
| Date: | November 23, 2020 | /s/ John T. Bruce | |
| John T. Bruce, President of FBP Equity & Dividend Plus Fund | |||
| and FBP Appreciation & Income Opportunities Fund | |||
CERTIFICATIONS
I, Thomas W. Leavell, certify that:
1. I have reviewed this report on Form N-CSR of The Government Street Equity Fund and The Government Street Mid-Cap Fund;
2. Based on my knowledge, this report does not contain any untrue statement of a material fact or omit to state a material fact necessary to make the statements made, in light of the circumstances under which such statements were made, not misleading with respect to the period covered by this report;
3. Based on my knowledge, the financial statements, and other financial information included in this report, fairly present in all material respects the financial condition, results of operations, changes in net assets, and cash flows (if the financial statements are required to include a statement of cash flows) of the registrant as of, and for, the periods presented in this report;
4. The registrant’s other certifying officer(s) and I are responsible for establishing and maintaining disclosure controls and procedures (as defined in Rule 30a-3(c) under the Investment Company Act of 1940) and internal control over financial reporting (as defined in Rule 30a3(d) under the Investment Company Act of 1940) for the registrant and have:
(a) Designed such disclosure controls and procedures, or caused such disclosure controls and procedures to be designed under our supervision, to ensure that material information relating to the registrant, including its consolidated subsidiaries, is made known to us by others within those entities, particularly during the period in which this report is being prepared;
(b) Designed such internal control over financial reporting, or caused such internal control over financial reporting to be designed under our supervision, to provide reasonable assurance regarding the reliability of financial reporting and the preparation of financial statements for external purposes in accordance with generally accepted accounting principles;
(c) Evaluated the effectiveness of the registrant’s disclosure controls and procedures and presented in this report our conclusions about the effectiveness of the disclosure controls and procedures, as of a date within 90 days prior to the filing date of this report based on such evaluation; and
(d) Disclosed in this report any change in the registrant’s internal control over financial reporting that occurred during the period covered by this report that has materially affected, or is reasonably likely to materially affect, the registrant’s internal control over financial reporting; and
5. The registrant’s other certifying officer(s) and I have disclosed to the registrant’s auditors and the audit committee of the registrant’s board of directors (or persons performing the equivalent functions):
(a) All significant deficiencies and material weaknesses in the design or operation of internal control over financial reporting which are reasonably likely to adversely affect the registrant’s ability to record, process, summarize, and report financial information; and
(b) Any fraud, whether or not material, that involves management or other employees who have a significant role in the registrant’s internal control over financial reporting.
| Date: | November 23, 2020 | /s/ Thomas W. Leavell | |
| Thomas W. Leavell, President of The Government Street | |||
| Equity Fund and The Government Street Mid-Cap Fund | |||
CERTIFICATIONS
I, Charles M. Caravati III, certify that:
1. I have reviewed this report on Form N-CSR of The Jamestown Equity Fund;
2. Based on my knowledge, this report does not contain any untrue statement of a material fact or omit to state a material fact necessary to make the statements made, in light of the circumstances under which such statements were made, not misleading with respect to the period covered by this report;
3. Based on my knowledge, the financial statements, and other financial information included in this report, fairly present in all material respects the financial condition, results of operations, changes in net assets, and cash flows (if the financial statements are required to include a statement of cash flows) of the registrant as of, and for, the periods presented in this report;
4. The registrant’s other certifying officer(s) and I are responsible for establishing and maintaining disclosure controls and procedures (as defined in Rule 30a-3(c) under the Investment Company Act of 1940) and internal control over financial reporting (as defined in Rule 30a-3(d) under the Investment Company Act of 1940) for the registrant and have:
(a) Designed such disclosure controls and procedures, or caused such disclosure controls and procedures to be designed under our supervision, to ensure that material information relating to the registrant, including its consolidated subsidiaries, is made known to us by others within those entities, particularly during the period in which this report is being prepared;
(b) Designed such internal control over financial reporting, or caused such internal control over financial reporting to be designed under our supervision, to provide reasonable assurance regarding the reliability of financial reporting and the preparation of financial statements for external purposes in accordance with generally accepted accounting principles;
(c) Evaluated the effectiveness of the registrant’s disclosure controls and procedures and presented in this report our conclusions about the effectiveness of the disclosure controls and procedures, as of a date within 90 days prior to the filing date of this report based on such evaluation; and
(d) Disclosed in this report any change in the registrant’s internal control over financial reporting that occurred during the period covered by this report that has materially affected, or is reasonably likely to materially affect, the registrant’s internal control over financial reporting; and
5. The registrant’s other certifying officer(s) and I have disclosed to the registrant’s auditors and the audit committee of the registrant’s board of directors (or persons performing the equivalent functions):
(a) All significant deficiencies and material weaknesses in the design or operation of internal control over financial reporting which are reasonably likely to adversely affect the registrant’s ability to record, process, summarize, and report financial information; and
(b) Any fraud, whether or not material, that involves management or other employees who have a significant role in the registrant’s internal control over financial reporting.
| Date: | November 23, 2020 | /s/ Charles M. Caravati III | |
| Charles M. Caravati III, President of The Jamestown | |||
| Equity Fund | |||
CERTIFICATIONS
I, John P. Ackerly IV, certify that:
1. I have reviewed this report on Form N-CSR of The Davenport Core Fund, Davenport Value & Income Fund, Davenport Equity Opportunities Fund, Davenport Small Cap Focus Fund and Davenport Balanced Income Fund;
2. Based on my knowledge, this report does not contain any untrue statement of a material fact or omit to state a material fact necessary to make the statements made, in light of the circumstances under which such statements were made, not misleading with respect to the period covered by this report;
3. Based on my knowledge, the financial statements, and other financial information included in this report, fairly present in all material respects the financial condition, results of operations, changes in net assets, and cash flows (if the financial statements are required to include a statement of cash flows) of the registrant as of, and for, the periods presented in this report;
4. The registrant’s other certifying officer(s) and I are responsible for establishing and maintaining disclosure controls and procedures (as defined in Rule 30a-3(c) under the Investment Company Act of 1940) and internal control over financial reporting (as defined in Rule 30a-3(d) under the Investment Company Act of 1940) for the registrant and have:
(a) Designed such disclosure controls and procedures, or caused such disclosure controls and procedures to be designed under our supervision, to ensure that material information relating to the registrant, including its consolidated subsidiaries, is made known to us by others within those entities, particularly during the period in which this report is being prepared;
(b) Designed such internal control over financial reporting, or caused such internal control over financial reporting to be designed under our supervision, to provide reasonable assurance regarding the reliability of financial reporting and the preparation of financial statements for external purposes in accordance with generally accepted accounting principles;
(c) Evaluated the effectiveness of the registrant’s disclosure controls and procedures and presented in this report our conclusions about the effectiveness of the disclosure controls and procedures, as of a date within 90 days prior to the filing date of this report based on such evaluation; and
(d) Disclosed in this report any change in the registrant’s internal control over financial reporting that occurred during the period covered by this report that has materially affected, or is reasonably likely to materially affect, the registrant’s internal control over financial reporting; and
5. The registrant’s other certifying officer(s) and I have disclosed to the registrant’s auditors and the audit committee of the registrant’s board of directors (or persons performing the equivalent functions):
(a) All significant deficiencies and material weaknesses in the design or operation of internal control over financial reporting which are reasonably likely to adversely affect the registrant’s ability to record, process, summarize, and report financial information; and
(b) Any fraud, whether or not material, that involves management or other employees who have a significant role in the registrant’s internal control over financial reporting.
| Date: | November 23, 2020 | /s/ John P. Ackerly IV | |
| John P. Ackerly IV, President of The Davenport Core Fund, | |||
| Davenport Value & Income Fund, Davenport Equity | |||
| Opportunities Fund, Davenport Small Cap Focus Fund | |||
| and Davenport Balanced Income Fund | |||
CERTIFICATIONS
I, Mark J. Seger, certify that:
1. I have reviewed this report on Form N-CSR of Williamsburg Investment Trust;
2. Based on my knowledge, this report does not contain any untrue statement of a material fact or omit to state a material fact necessary to make the statements made, in light of the circumstances under which such statements were made, not misleading with respect to the period covered by this report;
3. Based on my knowledge, the financial statements, and other financial information included in this report, fairly present in all material respects the financial condition, results of operations, changes in net assets, and cash flows (if the financial statements are required to include a statement of cash flows) of the registrant as of, and for, the periods presented in this report;
4. The registrant’s other certifying officer(s) and I are responsible for establishing and maintaining disclosure controls and procedures (as defined in Rule 30a-3(c) under the Investment Company Act of 1940) and internal control over financial reporting (as defined in Rule 30a-3(d) under the Investment Company Act of 1940) for the registrant and have:
(a) Designed such disclosure controls and procedures, or caused such internal controls and procedures to be designed under our supervision, to ensure that material information relating to the registrant, including its consolidated subsidiaries, is made known to us by others within those entities, particularly during the period in which this report is being prepared;
(b) Designed such internal control over financial reporting, or caused such internal control over financial reporting to be designed under our supervision, to provide reasonable assurance regarding the reliability of financial reporting and the preparation of financial statements for external purposes in accordance with generally accepted accounting principles;
(c) Evaluated the effectiveness of the registrant’s disclosure controls and procedures and presented in this report our conclusions about the effectiveness of the disclosure controls and procedures, as of a date within 90 days prior to the filing date of this report based on such evaluation; and
(d) Disclosed in this report any change in the registrant’s internal control over financial reporting that occurred during the period covered by this report that has materially affected, or is reasonably likely to materially affect, the registrant’s internal control over financial reporting; and
5. The registrant’s other certifying officer(s) and I have disclosed to the registrant’s auditors and the audit committee of the registrant’s board of directors (or persons performing the equivalent functions):
(a) All significant deficiencies and material weaknesses in the design or operation of internal control over financial reporting which are reasonably likely to adversely affect the registrant’s ability to record, process, summarize, and report financial information; and
(b) Any fraud, whether or not material, that involves management or other employees who have a significant role in the registrant’s internal control over financial reporting.
| Date: | November 23, 2020 | /s/ Mark J. Seger | |
| Mark J. Seger, Treasurer and Principal Accounting Officer | |||
EX-99.906CERT
CERTIFICATIONS
John T. Bruce, Chief Executive Officer, and Mark J. Seger, Chief Financial Officer, of FBP Equity & Dividend Plus Fund and FBP Appreciation & Income Opportunities Fund, series of Williamsburg Investment Trust (the “Registrant”), each certify to the best of his knowledge that:
| 1. | The Registrant’s periodic report on Form N-CSR for the period ended September 30, 2020 (the “Form N-CSR”) fully complies with the requirements of section 13(a) or section 15(d) of the Securities Exchange Act of 1934, as amended; and |
| 2. | The information contained in the Form N-CSR fairly presents, in all material respects, the financial condition and results of operations of the Registrant. |
| CHIEF EXECUTIVE OFFICER | CHIEF FINANCIAL OFFICER | ||
| Williamsburg Investment Trust | Williamsburg Investment Trust | ||
| /s/ John T. Bruce | /s/ Mark J. Seger | ||
| John T. Bruce, President of | Mark J. Seger, Treasurer and Principal | ||
| FBP Equity & Dividend Plus Fund and | Accounting Officer | ||
| FBP Appreciation & Income Opportunities Fund | |||
| Date: November 23, 2020 | Date: November 23, 2020 |
A signed original of this written statement required by Section 906, or other document authenticating, acknowledging or otherwise adopting the signature that appears in typed form within the electronic version of this written statement required by Section 906, has been provided to Williamsburg Investment Trust and will be retained by Williamsburg Investment Trust and furnished to the Securities and Exchange Commission or its staff upon request.
This certification is being furnished to the Securities and Exchange Commission solely pursuant to 18 U.S.C. 1350 and is not being filed as part of the Form N-CSR filed with the Commission.
CERTIFICATIONS
Thomas W. Leavell, Chief Executive Officer, and Mark J. Seger, Chief Financial Officer, of The Government Street Equity Fund and The Government Street Mid-Cap Fund, series of Williamsburg Investment Trust (the “Registrant”), each certify to the best of his knowledge that:
| 1. | The Registrant’s periodic report on Form N-CSR for the period ended September 30, 2020 (the “Form N-CSR”) fully complies with the requirements of section 13(a) or section 15(d) of the Securities Exchange Act of 1934, as amended; and |
| 2. | The information contained in the Form N-CSR fairly presents, in all material respects, the financial condition and results of operations of the Registrant. |
| CHIEF EXECUTIVE OFFICER | CHIEF FINANCIAL OFFICER | ||
| Williamsburg Investment Trust | Williamsburg Investment Trust | ||
| /s/ Thomas W. Leavell | /s/ Mark J. Seger | ||
| Thomas W. Leavell, President of | Mark J. Seger, Treasurer and Principal | ||
| The Government Street Equity Fund | Accounting Officer | ||
| The Government Street Mid-Cap Fund | |||
| Date: November 23, 2020 | Date: November 23, 2020 |
A signed original of this written statement required by Section 906, or other document authenticating, acknowledging or otherwise adopting the signature that appears in typed form within the electronic version of this written statement required by Section 906, has been provided to Williamsburg Investment Trust and will be retained by Williamsburg Investment Trust and furnished to the Securities and Exchange Commission or its staff upon request.
This certification is being furnished to the Securities and Exchange Commission solely pursuant to 18 U.S.C. 1350 and is not being filed as part of the Form N-CSR filed with the Commission.
CERTIFICATIONS
Charles M. Caravati III, Chief Executive Officer, and Mark J. Seger, Chief Financial Officer, of The Jamestown Equity Fund, series of Williamsburg Investment Trust (the “Registrant”), each certify to the best of his knowledge that:
| 1. | The Registrant’s periodic report on Form N-CSR for the period ended September 30, 2020 (the “Form N-CSR”) fully complies with the requirements of section 13(a) or section 15(d) of the Securities Exchange Act of 1934, as amended; and |
| 2. | The information contained in the Form N-CSR fairly presents, in all material respects, the financial condition and results of operations of the Registrant. |
| CHIEF EXECUTIVE OFFICER | CHIEF FINANCIAL OFFICER | ||
| Williamsburg Investment Trust | Williamsburg Investment Trust | ||
| /s/ Charles M. Caravati III | /s/ Mark J. Seger | ||
| Charles M. Caravati III, President of | Mark J. Seger, Treasurer and Principal | ||
| The Jamestown Equity Fund | Accounting Officer | ||
| Date: November 23, 2020 | Date: November 23, 2020 |
A signed original of this written statement required by Section 906, or other document authenticating, acknowledging or otherwise adopting the signature that appears in typed form within the electronic version of this written statement required by Section 906, has been provided to Williamsburg Investment Trust and will be retained by Williamsburg Investment Trust and furnished to the Securities and Exchange Commission or its staff upon request.
This certification is being furnished to the Securities and Exchange Commission solely pursuant to 18 U.S.C. 1350 and is not being filed as part of the Form N-CSR filed with the Commission.
CERTIFICATIONS
John P. Ackerly IV, Chief Executive Officer, and Mark J. Seger, Chief Financial Officer, of The Davenport Core Fund, Davenport Value & Income Fund, Davenport Equity Opportunities Fund, Davenport Small Cap Focus Fund and Davenport Balanced Income Fund, series of Williamsburg Investment Trust (the “Registrant”), each certify to the best of his knowledge that:
| 1. | The Registrant’s periodic report on Form N-CSR for the period ended September 30, 2020 (the “Form N-CSR”) fully complies with the requirements of section 13(a) or section 15(d) of the Securities Exchange Act of 1934, as amended; and |
| 2. | The information contained in the Form N-CSR fairly presents, in all material respects, the financial condition and results of operations of the Registrant. |
| CHIEF EXECUTIVE OFFICER | CHIEF FINANCIAL OFFICER | ||
| Williamsburg Investment Trust | Williamsburg Investment Trust | ||
| /s/ John P. Ackerly IV | /s/ Mark J. Seger | ||
| John P. Ackerly IV, President of | Mark J. Seger, Treasurer and Principal | ||
| Davenport Core Fund | Accounting Officer | ||
| Davenport Value & Income Fund | |||
| Davenport Equity Opportunities Fund | |||
| Davenport Small Cap Focus Fund | |||
| Davenport Balanced Income Fund | |||
| Date: November 23, 2020 | Date: November 23, 2020 |
A signed original of this written statement required by Section 906, or other document authenticating, acknowledging or otherwise adopting the signature that appears in typed form within the electronic version of this written statement required by Section 906, has been provided to Williamsburg Investment Trust and will be retained by Williamsburg Investment Trust and furnished to the Securities and Exchange Commission or its staff upon request.
This certification is being furnished to the Securities and Exchange Commission solely pursuant to 18 U.S.C. 1350 and is not being filed as part of the Form N-CSR filed with the Commission.
Serious News for Serious Traders! Try StreetInsider.com Premium Free!
You May Also Be Interested In
- Daniel Karpovič steps down as Head of B2B at Telia Lietuva
- UPM Interim Report Q1 2024: A positive start to the year, growth investments contributed to earnings
- Sobi Q1 2024 report: Strong sales reflecting the strength of the portfolio
Create E-mail Alert Related Categories
SEC FilingsSign up for StreetInsider Free!
Receive full access to all new and archived articles, unlimited portfolio tracking, e-mail alerts, custom newswires and RSS feeds - and more!
