

Form N-CSRS T. Rowe Price Institutio For: Jun 30
 Tweet
Tweet Share
ShareUNITED STATES
SECURITIES AND EXCHANGE COMMISSION
Washington, D.C. 20549
FORM N-CSR
CERTIFIED SHAREHOLDER REPORT OF
REGISTERED
MANAGEMENT INVESTMENT COMPANIES
Investment Company Act File Number: 811-07639
| T. Rowe Price Institutional Equity Funds, Inc. |
|
|
| (Exact name of registrant as specified in charter) |
| 100 East Pratt Street, Baltimore, MD 21202 |
|
|
| (Address of principal executive offices) |
| David Oestreicher |
| 100 East Pratt Street, Baltimore, MD 21202 |
|
|
| (Name and address of agent for service) |
Registrant’s telephone number, including area code: (410) 345-2000
Date of fiscal year end: December 31
Date of reporting period: June 30, 2018
 |
|
Institutional Large-Cap Core Growth Fund |
June 30, 2018 |
| T. ROWE PRICE INSTITUTIONAL LARGE-CAP CORE GROWTH FUND |
|
|
HIGHLIGHTS
| ■ |
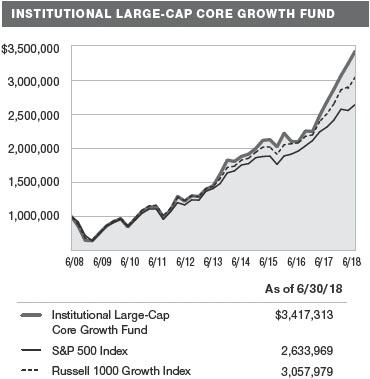
The Institutional Large-Cap Core Growth Fund returned 11.78% in the six months ended June 30, 2018. The fund outperformed its benchmark, the S&P 500 Index, and its Lipper peer group. |
| ■ |
Stock selection in the consumer discretionary, information technology, and health care sectors contributed to relative performance. |
|
| |
| ■ |
Given the strong relative performance of large-cap growth stocks, we recognize that near-term performance could be less robust. |
| ■ |
We believe that the longer-term prospects for the growth stocks in your portfolio remain favorable. |

Log in to your account at troweprice.com for more information.
*Certain mutual fund accounts that are assessed an annual account service fee can also save money by switching to e-delivery.
CIO Market Commentary
Dear Investor
U.S. stocks recorded decent gains in the first half of 2018, but unlike last year, investors had to absorb some bumps along the way. In February, volatility spiked and the S&P 500 Index briefly tumbled over 10% from its highs, putting it in correction territory. The major U.S. benchmarks recovered their losses in the spring, eventually bringing the technology-focused Nasdaq Composite Index and the smaller-cap indexes to new highs. Volatility stayed somewhat elevated, however, and many investors clearly remained anxious as the first half of your fund’s fiscal year ended.
Solid corporate and economic fundamentals initially seemed to promise that 2017’s strong stock market momentum might carry forward into 2018. Continued global synchronized growth led to strong profits for many multinationals. In the U.S., earnings for the S&P 500 rose by nearly 25% in the first quarter versus a year before, according to FactSet—the best performance since the recovery from the financial crisis. Profit growth also picked up in Europe, Japan, and emerging markets, even as growth in many international economies cooled a bit.
Inflation fears presented the first obstacle to the markets in February, however. Stocks tumbled on news that hourly wages had jumped in January, sparking fears that the Federal Reserve would pick up its pace of interest rate increases in order to head off inflation. Wage growth moderated in the following months, but a series of strong economic reports raised growth expectations and sent long-term interest rates to multiyear peaks by May. Investors also worried that the massive U.S. fiscal stimulus from December’s tax cuts and March’s spending bill might overheat the economy, though interest rates fell back in late May and June as Fed officials stressed their intention to move slowly in tightening monetary policy.
Trade tensions soon emerged as a second impediment for the markets. The Trump administration began implementing a more populist trade stance in March, announcing tariffs on steel and aluminum imports, threatening to withdraw from the North American Free Trade Agreement (NAFTA), and later raising the possibility of taxing auto imports. The administration also announced a steady escalation in possible tariffs on Chinese goods, eventually targeting a list of $200 billion in Chinese imports. China and other U.S. trading partners vowed to retaliate proportionately.
Investors initially seemed willing to dismiss the tit-for-tat threats as negotiating tactics, but evidence eventually emerged that even the prospect of tariffs was impacting corporate strategies and profit outlooks. Stocks slumped on June 21, after German automaker Daimler lowered its earnings guidance due to possible tariff increases on SUVs it manufactures in the U.S. and sells in China. A few days later, Harley-Davidson revealed that it was planning to move some of its motorcycle production to Europe to avoid retaliatory tariffs recently announced by the European Union.
Boeing, Caterpillar, and other leading exporters suffered declines as trade tensions worsened, but small-caps, which typically have far less international exposure, fared much better than large-caps in the first half of the year. Growth shares continued to outperform value shares despite the strong performance of energy stocks, which benefited from a rise in oil prices to multiyear highs. Stocks in overseas markets reacted particularly poorly to growing trade fears and fell for the period. A decline in many currencies relative to the dollar also weighed on international bond and stock returns for U.S. investors.
Meanwhile, technology shares continued to dominate, with much of the market’s overall gain to date in 2018 concentrated in a handful of mega-cap companies able to leverage dominant Internet platforms. Data breaches and concerns about the growing power of these firms resulted in calls for government intervention in early 2018. For now, however, the threat of increased regulation seems a longer-term one that appears minor in comparison to the powerful fundamental strength of these companies.
T. Rowe Price’s global team of industry experts is monitoring the possible impact of tariffs and other challenges on a wide range of companies—from the global tech titans to small, domestic firms that get little analyst coverage on Wall Street. While the rest of 2018 may bring further surprises, you can rest assured that your portfolio manager is drawing on a wide range of insights in seeking to provide shareholders with superior returns while minimizing the impact of unforeseen political events or other pitfalls.
Thank you for your continued confidence in T. Rowe Price.
Sincerely,

Robert Sharps
Group Chief Investment Officer
Management’s Discussion of Fund Performance
INVESTMENT OBJECTIVE
The fund seeks to provide long-term capital growth through investments in the common stocks of large-cap growth companies.
FUND COMMENTARY
How did the fund perform in the past six months?
The Institutional Large-Cap Core Growth Fund returned 11.78% in the six-month period ended June 30, 2018. The fund outperformed its benchmark, the S&P 500 Index; the style-specific Russell 1000 Growth Index; and its peer group, the Lipper Large-Cap Growth Funds Index. (Past performance cannot guarantee future results.)

What factors influenced the fund’s performance?
We outperformed our benchmark primarily due to stock selection in the consumer discretionary, information technology, and health care sectors. Overall, we also benefited from sector allocation decisions. However, underweight allocations to the energy and real estate sectors detracted. Given our strong results, there were few notable detractors, although travel-related areas such as airlines and cruise lines underperformed as higher fuel costs raised concerns about profit margins.
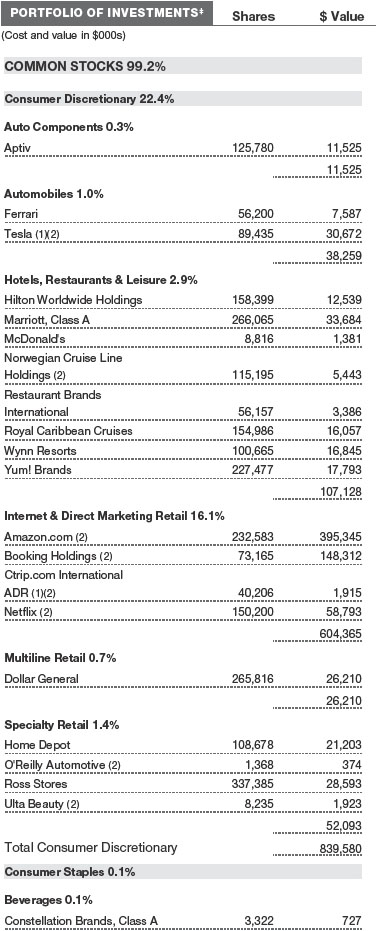
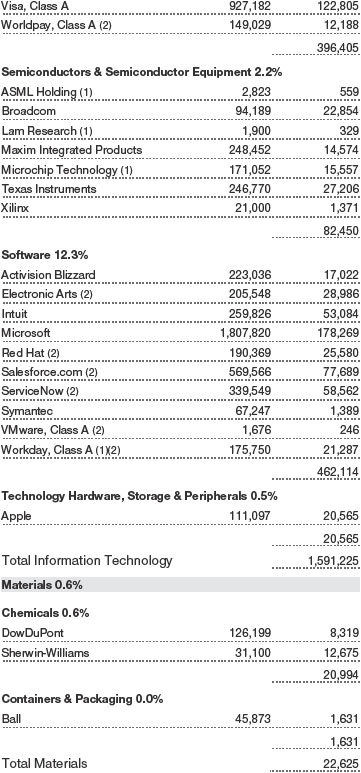
In the information technology sector, our large positions in leading cloud software companies generated strong contributions. Microsoft continued to perform well with its successful transition toward a subscription-based revenue model under the astute leadership of CEO Satya Nadella. The software behemoth is well positioned with its Office 365 and Azure cloud computing service. Salesforce.com is executing well in its core business, where a robust enterprise IT spending environment has helped strengthen the company’s advantageous positioning as a strategic cloud vendor. ServiceNow, another cloud-based software firm, is poised for continued growth as it extends its leadership in IT service management and pursues attractive growth opportunities in complementary areas, including human resources, corporate security, and customer service. Intuit, the leading purveyor of software-as-a-service for small to medium-sized businesses, appears to have a long growth runway with a core addressable market that remains underpenetrated, especially outside the U.S. The company, with key products that include QuickBooks and TurboTax, has excelled in its efforts to transition online and align its platform for increasing mobile adoption. (Please refer to our portfolio of investments for a complete list of holdings and the amount each represents in the portfolio.)
Payments processors in the IT services segment, including MasterCard and Visa, were top 10 absolute contributors. Bolstered by their exposure to e-commerce as well as the ongoing global shift from paper to plastic, the credit card processing giants generated strong and consistent revenue and profit growth. PayPal Holdings, a leading online and digital payments services provider, was also among the portfolio’s top contributors. Similarly, Facebook, Alphabet, and Alibaba Group Holding in the Internet software and services industry group posted solid gains. These companies possess substantial growth opportunities in social networking, streaming video, advertising, and e-commerce.
In the consumer discretionary sector, our largest holding, Amazon.com, was the portfolio’s top absolute and relative performance contributor. We continue to be impressed by the company’s ability to execute effectively across so many fronts simultaneously. In addition to its dominant online retail and cloud computing businesses, which still have plenty of headroom for growth, the company continued to enhance its overall value through expansion into areas such as advertising, home devices, and video streaming. Netflix, the dominant global video streaming service, doubled its share price in the first half of 2018 as it continued to disrupt the traditional pay television model. Booking Holdings (formerly called Priceline), another top 10 performer, reported strong fourth-quarter results that beat expectations, as lower online advertising spending drove improved profitability. It is taking market share in the vast and underpenetrated global hotel market, and we believe the company is well positioned to expand into complementary markets such as vacation rentals and business travel.
In the health care sector, our emphasis on innovative device and equipment manufacturers with durable, recurring revenue business models benefited returns. Intuitive Surgical, Stryker, and Becton, Dickinson & Company continued to perform well. Overall, our holdings in the industrials and business services sector posted gains relative to the benchmark, led by our large position in Boeing. We believe that the company is well positioned to generate sustained earnings and free cash flow growth, supported by its robust backlog of orders and tailwinds from secular growth in global air traffic. But several other holdings in the sector, especially American Airlines, Alaska Air Group, Delta Air Lines, and United Continental, posted steep losses.
How is the fund positioned?
The fund continues to emphasize secular growth companies with strong competitive positions in large addressable markets that support multiyear growth horizons. We recognize that higher valuations have skewed the risk/reward trade-off less in our favor, but, in our opinion, there are still interesting opportunities in select high-quality growth companies with strong fundamentals. Information technology, consumer discretionary, and health care remained our largest allocations entirely as a result of our bottom-up stock selection process. We believe that these sectors offer the most fertile ground for innovation and growth.

On the other hand, we remain cautious with respect to structurally challenged industries and defensive sectors, including consumer staples, which appear to have limited growth prospects and face secular headwinds from e-commerce and private-label competition. Also, at this late stage in the economic cycle, we believe that valuations are rich in cyclical areas, including industrials and business services and materials. Therefore, we intend to maintain our underweight exposure to those sectors. As shown in the Sector Diversification table, we have zero allocations in the telecommunication services and energy sectors—a decision that modestly hurt our relative returns.
What is portfolio management’s outlook?
The market proved resilient and performed well in the first half of 2018, given the increasing tensions around global trade combined with the unpredictability of the political and regulatory environment. The market’s valuation is modestly above historical averages, but we don’t think that necessarily precludes stocks from continuing to perform well. It does, however, mean that a more circumspect approach is appropriate at this late stage in the cycle. For now, the fundamental backdrop is solid and, by our estimation, the outlook for global earnings growth remains quite strong. However, as we look ahead we also recognize that this year’s tax benefit creates tough comparisons in early 2019.
While we have concerns about rising interest rates, a flattening yield curve, and geopolitical turmoil, the key risk, in our view, is that trade tensions escalate into a full-blown trade war. There have been encouraging signs that China is willing to negotiate—perhaps because it perceives that it has more to lose in a trade war scenario. However, the situation could escalate if both countries focus on retaliatory measures.
The recent developments around global trade have introduced an additional layer of uncertainty and raised questions about the global growth backdrop. Trying to discern the direction and level of growth is always a difficult task, and particularly now. Fortunately, our fundamentals-driven, bottom-up approach can actually suit this type of market quite well. Leveraging the rigorous research and unique insights from our talented analyst platform gives us an important edge as we sift through the noise to identify attractive idiosyncratic growth stories. Examples may include companies executing a restructuring plan, integrating a key acquisition, or launching an innovative new product. The common theme is our general emphasis on “all season” growth companies that aren’t reliant on a robust economy, tax reform, or any other regulatory action to generate strong and sustainable earnings and cash flow growth.
The views expressed reflect the opinions of T. Rowe Price as of the date of this report and are subject to change based on changes in market, economic, or other conditions. These views are not intended to be a forecast of future events and are no guarantee of future results.
RISKS OF STOCK INVESTING
The fund’s share price can fall because of weakness in the stock markets, a particular industry, or specific holdings. Stock markets can decline for many reasons, including adverse political or economic developments, changes in investor psychology, or heavy institutional selling. The prospects for an industry or company may deteriorate because of a variety of factors, including disappointing earnings or changes in the competitive environment. In addition, the investment manager’s assessment of companies held in a fund may prove incorrect, resulting in losses or poor performance even in rising markets.
RISKS OF GROWTH INVESTING
Growth stocks can be volatile for several reasons. Since these companies usually invest a high portion of earnings in their businesses, they may lack the dividends of value stocks that can cushion stock prices in a falling market. Also, earnings disappointments often lead to sharply falling prices because investors buy growth stocks in anticipation of superior earnings growth.
BENCHMARK INFORMATION
Note: Frank Russell Company (Russell) is the source and owner of the Russell index data contained or reflected in these materials and all trademarks and copyrights related thereto. Russell® is a registered trademark of Russell. Russell is not responsible for the formatting or configuration of these materials or for any inaccuracy in T. Rowe Price Associates’ presentation thereof.

GROWTH OF $1 MILLION
This table shows the value of a hypothetical $1 million investment in the fund over the past 10 fiscal year periods or since inception (for funds lacking 10-year records). The result is compared with benchmarks, which include a broad-based market index and may also include a peer group average or index. Market indexes do not include expenses, which are deducted from fund returns as well as mutual fund averages and indexes.
AVERAGE ANNUAL COMPOUND TOTAL RETURN


FUND EXPENSE EXAMPLE
As a mutual fund shareholder, you may incur two types of costs: (1) transaction costs, such as redemption fees or sales loads, and (2) ongoing costs, including management fees, distribution and service (12b-1) fees, and other fund expenses. The following example is intended to help you understand your ongoing costs (in dollars) of investing in the fund and to compare these costs with the ongoing costs of investing in other mutual funds. The example is based on an investment of $1,000 invested at the beginning of the most recent six-month period and held for the entire period.
Actual Expenses
The first line of the following table (Actual) provides information about actual account values and actual expenses. You may use the information on this line, together with your account balance, to estimate the expenses that you paid over the period. Simply divide your account value by $1,000 (for example, an $8,600 account value divided by $1,000 = 8.6), then multiply the result by the number on the first line under the heading “Expenses Paid During Period” to estimate the expenses you paid on your account during this period.
Hypothetical Example for Comparison Purposes
The information on the second line of the table (Hypothetical) is based on hypothetical account values and expenses derived from the fund’s actual expense ratio and an assumed 5% per year rate of return before expenses (not the fund’s actual return). You may compare the ongoing costs of investing in the fund with other funds by contrasting this 5% hypothetical example and the 5% hypothetical examples that appear in the shareholder reports of the other funds. The hypothetical account values and expenses may not be used to estimate the actual ending account balance or expenses you paid for the period.
You should also be aware that the expenses shown in the table highlight only your ongoing costs and do not reflect any transaction costs, such as redemption fees or sales loads. Therefore, the second line of the table is useful in comparing ongoing costs only and will not help you determine the relative total costs of owning different funds. To the extent a fund charges transaction costs, however, the total cost of owning that fund is higher.

Unaudited

The accompanying notes are an integral part of these financial statements.
Unaudited


The accompanying notes are an integral part of these financial statements.
Unaudited

The accompanying notes are an integral part of these financial statements.
Unaudited

The accompanying notes are an integral part of these financial statements.
Unaudited

The accompanying notes are an integral part of these financial statements.
Unaudited
| NOTES TO FINANCIAL STATEMENTS |
T. Rowe Price Institutional Equity Funds, Inc. (the corporation) is registered under the Investment Company Act of 1940 (the 1940 Act). The Institutional Large-Cap Core Growth Fund (the fund) is a diversified, open-end management investment company established by the corporation. The fund seeks to provide long-term capital growth through investments in the common stocks of large-cap growth companies.
NOTE 1 - SIGNIFICANT ACCOUNTING POLICIES
Basis of Preparation The fund is an investment company and follows accounting and reporting guidance in the Financial Accounting Standards Board (FASB) Accounting Standards Codification Topic 946 (ASC 946). The accompanying financial statements were prepared in accordance with accounting principles generally accepted in the United States of America (GAAP), including, but not limited to, ASC 946. GAAP requires the use of estimates made by management. Management believes that estimates and valuations are appropriate; however, actual results may differ from those estimates, and the valuations reflected in the accompanying financial statements may differ from the value ultimately realized upon sale or maturity.
Investment Transactions, Investment Income, and Distributions Investment transactions are accounted for on the trade date basis. Income and expenses are recorded on the accrual basis. Realized gains and losses are reported on the identified cost basis. Dividends received from mutual fund investments are reflected as dividend income; capital gain distributions are reflected as realized gain/loss. Dividend income and capital gain distributions are recorded on the ex-dividend date. Income tax-related interest and penalties, if incurred, are recorded as income tax expense. Distributions from REITs are initially recorded as dividend income and, to the extent such represent a return of capital or capital gain for tax purposes, are reclassified when such information becomes available. Income distributions, if any, are declared and paid annually. Distributions to shareholders are recorded on the ex-dividend date. A capital gain distribution may also be declared and paid by the fund annually.
Currency Translation Assets, including investments, and liabilities denominated in foreign currencies are translated into U.S. dollar values each day at the prevailing exchange rate, using the mean of the bid and asked prices of such currencies against U.S. dollars as quoted by a major bank. Purchases and sales of securities, income, and expenses are translated into U.S. dollars at the prevailing exchange rate on the respective date of such transaction. The portion of the results of operations attributable to changes in foreign exchange rates on investments is not bifurcated from the portion attributable to changes in market prices. The effect of changes in foreign currency exchange rates on realized and unrealized security gains and losses is reflected as a component of security gains and losses.
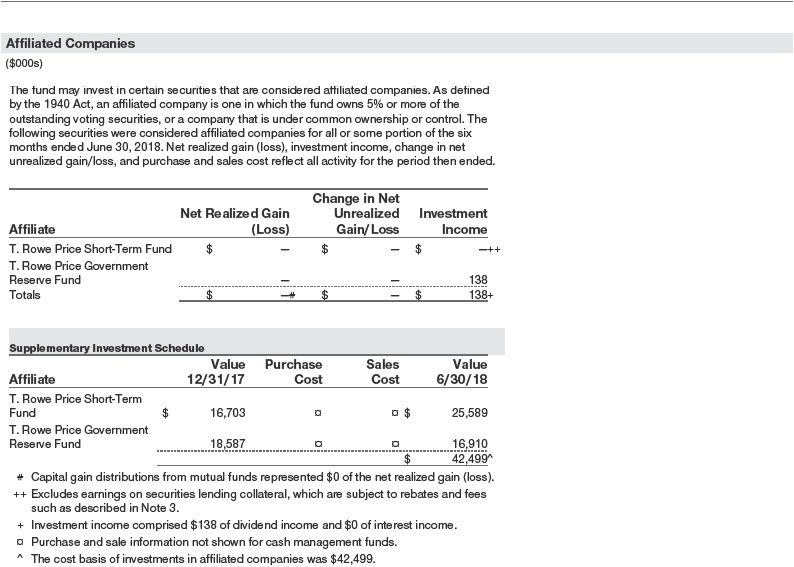
In-Kind Subscriptions Under certain circumstances, and when considered to be in the best interest of all shareholders, the fund may accept portfolio securities rather than cash as payment for the purchase of fund shares (in-kind subscription). For financial reporting and tax purposes, the cost basis of contributed securities is equal to the market value of the securities on the date of contribution. In-kind subscriptions result in no gain or loss and no tax consequences for the fund. During the six months ended June 30, 2018, the fund accepted $75,036,000 of in-kind subscriptions all of which were from other T. Rowe Price Funds.
New Accounting Guidance In March 2017, the FASB issued amended guidance to shorten the amortization period for certain callable debt securities held at a premium. The guidance is effective for fiscal years and interim periods beginning after December 15, 2018. Adoption will have no effect on the fund’s net assets or results of operations.
Indemnification In the normal course of business, the fund may provide indemnification in connection with its officers and directors, service providers, and/or private company investments. The fund’s maximum exposure under these arrangements is unknown; however, the risk of material loss is currently considered to be remote.
NOTE 2 - VALUATION
The fund’s financial instruments are valued and its net asset value (NAV) per share is computed at the close of the New York Stock Exchange (NYSE), normally 4 p.m. ET, each day the NYSE is open for business. However, the NAV per share may be calculated at a time other than the normal close of the NYSE if trading on the NYSE is restricted, if the NYSE closes earlier, or as may be permitted by the SEC.
Fair Value The fund’s financial instruments are reported at fair value, which GAAP defines as the price that would be received to sell an asset or paid to transfer a liability in an orderly transaction between market participants at the measurement date. The T. Rowe Price Valuation Committee (the Valuation Committee) is an internal committee that has been delegated certain responsibilities by the fund’s Board of Directors (the Board) to ensure that financial instruments are appropriately priced at fair value in accordance with GAAP and the 1940 Act. Subject to oversight by the Board, the Valuation Committee develops and oversees pricing-related policies and procedures and approves all fair value determinations. Specifically, the Valuation Committee establishes procedures to value securities; determines pricing techniques, sources, and persons eligible to effect fair value pricing actions; oversees the selection, services, and performance of pricing vendors; oversees valuation-related business continuity practices; and provides guidance on internal controls and valuation-related matters. The Valuation Committee reports to the Board and has representation from legal, portfolio management and trading, operations, risk management, and the fund’s treasurer.
Various valuation techniques and inputs are used to determine the fair value of financial instruments. GAAP establishes the following fair value hierarchy that categorizes the inputs used to measure fair value:
Level 1 – quoted prices (unadjusted) in active markets for identical financial instruments that the fund can access at the reporting date
Level 2 – inputs other than Level 1 quoted prices that are observable, either directly or indirectly (including, but not limited to, quoted prices for similar financial instruments in active markets, quoted prices for identical or similar financial instruments in inactive markets, interest rates and yield curves, implied volatilities, and credit spreads)
Level 3 – unobservable inputs
Observable inputs are developed using market data, such as publicly available information about actual events or transactions, and reflect the assumptions that market participants would use to price the financial instrument. Unobservable inputs are those for which market data are not available and are developed using the best information available about the assumptions that market participants would use to price the financial instrument. GAAP requires valuation techniques to maximize the use of relevant observable inputs and minimize the use of unobservable inputs. When multiple inputs are used to derive fair value, the financial instrument is assigned to the level within the fair value hierarchy based on the lowest-level input that is significant to the fair value of the financial instrument. Input levels are not necessarily an indication of the risk or liquidity associated with financial instruments at that level but rather the degree of judgment used in determining those values.
Valuation Techniques Equity securities listed or regularly traded on a securities exchange or in the over-the-counter (OTC) market are valued at the last quoted sale price or, for certain markets, the official closing price at the time the valuations are made. OTC Bulletin Board securities are valued at the mean of the closing bid and asked prices. A security that is listed or traded on more than one exchange is valued at the quotation on the exchange determined to be the primary market for such security. Listed securities not traded on a particular day are valued at the mean of the closing bid and asked prices for domestic securities and the last quoted sale or closing price for international securities.
For valuation purposes, the last quoted prices of non-U.S. equity securities may be adjusted to reflect the fair value of such securities at the close of the NYSE. If the fund determines that developments between the close of a foreign market and the close of the NYSE will affect the value of some or all of its portfolio securities, the fund will adjust the previous quoted prices to reflect what it believes to be the fair value of the securities as of the close of the NYSE. In deciding whether it is necessary to adjust quoted prices to reflect fair value, the fund reviews a variety of factors, including developments in foreign markets, the performance of U.S. securities markets, and the performance of instruments trading in U.S. markets that represent foreign securities and baskets of foreign securities. The fund may also fair value securities in other situations, such as when a particular foreign market is closed but the fund is open. The fund uses outside pricing services to provide it with quoted prices and information to evaluate or adjust those prices. The fund cannot predict how often it will use quoted prices and how often it will determine it necessary to adjust those prices to reflect fair value. As a means of evaluating its security valuation process, the fund routinely compares quoted prices, the next day’s opening prices in the same markets, and adjusted prices.
Actively traded equity securities listed on a domestic exchange generally are categorized in Level 1 of the fair value hierarchy. Non-U.S. equity securities generally are categorized in Level 2 of the fair value hierarchy despite the availability of quoted prices because, as described above, the fund evaluates and determines whether those quoted prices reflect fair value at the close of the NYSE or require adjustment. OTC Bulletin Board securities, certain preferred securities, and equity securities traded in inactive markets generally are categorized in Level 2 of the fair value hierarchy.
Investments in mutual funds are valued at the mutual fund’s closing NAV per share on the day of valuation and are categorized in Level 1 of the fair value hierarchy. Assets and liabilities other than financial instruments, including short-term receivables and payables, are carried at cost, or estimated realizable value, if less, which approximates fair value.
Thinly traded financial instruments and those for which the above valuation procedures are inappropriate or are deemed not to reflect fair value are stated at fair value as determined in good faith by the Valuation Committee. The objective of any fair value pricing determination is to arrive at a price that could reasonably be expected from a current sale. Financial instruments fair valued by the Valuation Committee are primarily private placements, restricted securities, warrants, rights, and other securities that are not publicly traded.
Subject to oversight by the Board, the Valuation Committee regularly makes good faith judgments to establish and adjust the fair valuations of certain securities as events occur and circumstances warrant. For instance, in determining the fair value of an equity investment with limited market activity, such as a private placement or a thinly traded public company stock, the Valuation Committee considers a variety of factors, which may include, but are not limited to, the issuer’s business prospects, its financial standing and performance, recent investment transactions in the issuer, new rounds of financing, negotiated transactions of significant size between other investors in the company, relevant market valuations of peer companies, strategic events affecting the company, market liquidity for the issuer, and general economic conditions and events. In consultation with the investment and pricing teams, the Valuation Committee will determine an appropriate valuation technique based on available information, which may include both observable and unobservable inputs. The Valuation Committee typically will afford greatest weight to actual prices in arm’s length transactions, to the extent they represent orderly transactions between market participants, transaction information can be reliably obtained, and prices are deemed representative of fair value. However, the Valuation Committee may also consider other valuation methods such as market-based valuation multiples; a discount or premium from market value of a similar, freely traded security of the same issuer; or some combination. Fair value determinations are reviewed on a regular basis and updated as information becomes available, including actual purchase and sale transactions of the issue. Because any fair value determination involves a significant amount of judgment, there is a degree of subjectivity inherent in such pricing decisions, and fair value prices determined by the Valuation Committee could differ from those of other market participants. Depending on the relative significance of unobservable inputs, including the valuation technique(s) used, fair valued securities may be categorized in Level 2 or 3 of the fair value hierarchy.
Valuation Inputs The following table summarizes the fund’s financial instruments, based on the inputs used to determine their fair values on June 30, 2018 (for further detail by category, please refer to the accompanying Portfolio of Investments):

There were no material transfers between Levels 1 and 2 during the six months ended June 30, 2018.
Following is a reconciliation of the fund’s Level 3 holdings for the six months ended June 30, 2018. Gain (loss) reflects both realized and change in unrealized gain/loss on Level 3 holdings during the period, if any, and is included on the accompanying Statement of Operations. The change in unrealized gain/loss on Level 3 instruments held at June 30, 2018, totaled $0 for the six months ended June 30, 2018.

NOTE 3 - OTHER INVESTMENT TRANSACTIONS
Consistent with its investment objective, the fund engages in the following practices to manage exposure to certain risks and/or to enhance performance. The investment objective, policies, program, and risk factors of the fund are described more fully in the fund’s prospectus and Statement of Additional Information.
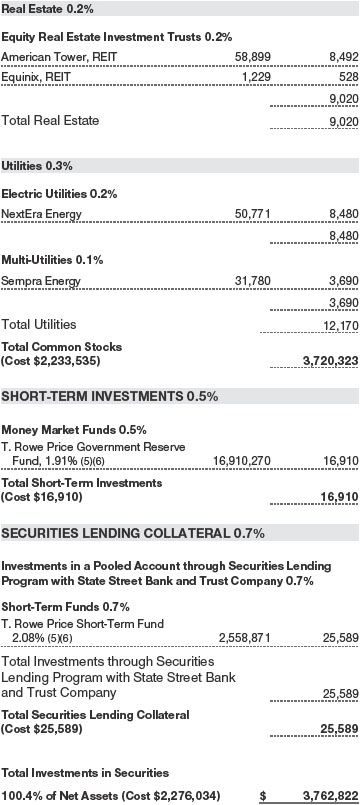
Securities Lending The fund may lend its securities to approved borrowers to earn additional income. Its securities lending activities are administered by a lending agent in accordance with a securities lending agreement. Security loans generally do not have stated maturity dates, and the fund may recall a security at any time. The fund receives collateral in the form of cash or U.S. government securities, valued at 102% to 105% of the value of the securities on loan. Collateral is maintained over the life of the loan in an amount not less than the value of loaned securities; any additional collateral required due to changes in security values is delivered to the fund the next business day. Cash collateral is invested in accordance with investment guidelines approved by fund management. Additionally, the lending agent indemnifies the fund against losses resulting from borrower default. Although risk is mitigated by the collateral and indemnification, the fund could experience a delay in recovering its securities and a possible loss of income or value if the borrower fails to return the securities, collateral investments decline in value, and the lending agent fails to perform. Securities lending revenue consists of earnings on invested collateral and borrowing fees, net of any rebates to the borrower, compensation to the lending agent, and other administrative costs. In accordance with GAAP, investments made with cash collateral are reflected in the accompanying financial statements, but collateral received in the form of securities is not. At June 30, 2018, the value of loaned securities was $24,794,000; the value of cash collateral and related investments was $25,589,000.
Other Purchases and sales of portfolio securities other than short-term securities aggregated $677,057,000 and $429,129,000, respectively, for the six months ended June 30, 2018.
NOTE 4 - FEDERAL INCOME TAXES
No provision for federal income taxes is required since the fund intends to continue to qualify as a regulated investment company under Subchapter M of the Internal Revenue Code and distribute to shareholders all of its taxable income and gains. Distributions determined in accordance with federal income tax regulations may differ in amount or character from net investment income and realized gains for financial reporting purposes. Financial reporting records are adjusted for permanent book/tax differences to reflect tax character but are not adjusted for temporary differences. The amount and character of tax-basis distributions and composition of net assets are finalized at fiscal year-end; accordingly, tax-basis balances have not been determined as of the date of this report.
At June 30, 2018, the cost of investments for federal income tax purposes was $2,289,187,000. Net unrealized gain aggregated $1,473,635,000 at period-end, of which $1,496,809,000 related to appreciated investments and $23,174,000 related to depreciated investments.
NOTE 5 - RELATED PARTY TRANSACTIONS
The fund is managed by T. Rowe Price Associates, Inc. (Price Associates), a wholly owned subsidiary of T. Rowe Price Group, Inc. (Price Group). The investment management agreement between the fund and Price Associates provides for an annual investment management fee equal to 0.55% of the fund’s average daily net assets. The fee is computed daily and paid monthly.
In addition, the fund has entered into service agreements with Price Associates and a wholly owned subsidiary of Price Associates, each an affiliate of the fund (collectively, Price). Price Associates provides certain accounting and administrative services to the fund. T. Rowe Price Services, Inc., provides shareholder and administrative services in its capacity as the fund’s transfer and dividend-disbursing agent. For the six months ended June 30, 2018, expenses incurred pursuant to these service agreements were $46,000 for Price Associates and $4,000 for T. Rowe Price Services, Inc. All amounts due to and due from Price, exclusive of investment management fees payable, are presented net on the accompanying Statement of Assets and Liabilities.
Mutual funds, trusts, and other accounts managed by Price Associates or its affiliates (collectively, Price funds and accounts) may invest in the fund. No Price fund or account may invest for the purpose of exercising management or control over the fund. At June 30, 2018, none of the fund’s outstanding shares were held by Price funds and accounts.
The fund may invest its cash reserves in certain open-end management investment companies managed by Price Associates and considered affiliates of the fund: the T. Rowe Price Government Reserve Fund or the T. Rowe Price Treasury Reserve Fund, organized as money market funds, or the T. Rowe Price Short-Term Fund, a short-term bond fund (collectively, the Price Reserve Funds). The Price Reserve Funds are offered as short-term investment options to mutual funds, trusts, and other accounts managed by Price Associates or its affiliates and are not available for direct purchase by members of the public. Cash collateral from securities lending is invested in the T. Rowe Price Short-Term Fund. The Price Reserve Funds pay no investment management fees.
The fund may participate in securities purchase and sale transactions with other funds or accounts advised by Price Associates (cross trades), in accordance with procedures adopted by the fund’s Board and Securities and Exchange Commission rules, which require, among other things, that such purchase and sale cross trades be effected at the independent current market price of the security. During the six months ended June 30, 2018, the fund had no purchases or sales cross trades with other funds or accounts advised by Price Associates.
INFORMATION ON PROXY VOTING POLICIES, PROCEDURES, AND RECORDS
A description of the policies and procedures used by T. Rowe Price funds and portfolios to determine how to vote proxies relating to portfolio securities is available in each fund’s Statement of Additional Information. You may request this document by calling 1-800-225-5132 or by accessing the SEC’s website, sec.gov.
The description of our proxy voting policies and procedures is also available on our corporate website. To access it, please visit the following Web page:
https://www3.troweprice.com/usis/corporate/en/utility/policies.html
Scroll down to the section near the bottom of the page that says, “Proxy Voting Policies.” Click on the Proxy Voting Policies link in the shaded box.
Each fund’s most recent annual proxy voting record is available on our website and through the SEC’s website. To access it through T. Rowe Price, visit the website location shown above, and scroll down to the section near the bottom of the page that says, “Proxy Voting Records.” Click on the Proxy Voting Records link in the shaded box.
HOW TO OBTAIN QUARTERLY PORTFOLIO HOLDINGS
The fund files a complete schedule of portfolio holdings with the Securities and Exchange Commission for the first and third quarters of each fiscal year on Form N-Q. The fund’s Form N-Q is available electronically on the SEC’s website (sec.gov); hard copies may be reviewed and copied at the SEC’s Public Reference Room, 100 F St. N.E., Washington, DC 20549. For more information on the Public Reference Room, call 1-800-SEC-0330.
APPROVAL OF INVESTMENT MANAGEMENT AGREEMENT
Each year, the fund’s Board of Directors (Board) considers the continuation of the investment management agreement (Advisory Contract) between the fund and its investment advisor, T. Rowe Price Associates, Inc. (Advisor), on behalf of the fund. In that regard, at an in-person meeting held on March 5–6, 2018 (Meeting), the Board, including a majority of the fund’s independent directors, approved the continuation of the fund’s Advisory Contract. At the Meeting, the Board considered the factors and reached the conclusions described below relating to the selection of the Advisor and the approval of the Advisory Contract. The independent directors were assisted in their evaluation of the Advisory Contract by independent legal counsel, from whom they received separate legal advice and with whom they met separately.
In providing information to the Board, the Advisor was guided by a detailed set of requests for information submitted by independent legal counsel on behalf of the independent directors. In considering and approving the Advisory Contract, the Board considered the information it believed was relevant, including, but not limited to, the information discussed below. The Board considered not only the specific information presented in connection with the Meeting but also the knowledge gained over time through interaction with the Advisor about various topics. The Board meets regularly and, at each of its meetings, covers an extensive agenda of topics and materials and considers factors that are relevant to its annual consideration of the renewal of the T. Rowe Price funds’ advisory contracts, including performance and the services and support provided to the funds and their shareholders.
Services Provided by the Advisor
The Board considered the nature, quality, and extent of the services provided to the fund by the Advisor. These services included, but were not limited to, directing the fund’s investments in accordance with its investment program and the overall management of the fund’s portfolio, as well as a variety of related activities such as financial, investment operations, and administrative services; compliance; maintaining the fund’s records and registrations; and shareholder communications. The Board also reviewed the background and experience of the Advisor’s senior management team and investment personnel involved in the management of the fund, as well as the Advisor’s compliance record. The Board concluded that it was satisfied with the nature, quality, and extent of the services provided by the Advisor.
Investment Performance of the Fund
The Board took into account discussions with the Advisor and reports that it receives throughout the year relating to fund performance. In connection with the Meeting, the Board reviewed the fund’s net annualized total returns for the 1-, 2-, 3-, 4-, 5-, and 10-year periods as of September 30, 2017, and compared these returns with the performance of a peer group of funds with similar investment programs and a wide variety of other previously agreed-upon comparable performance measures and market data, including those supplied by Broadridge, which is an independent provider of mutual fund data.
On the basis of this evaluation and the Board’s ongoing review of investment results and factoring in the relative market conditions during certain of the performance periods, the Board concluded that the fund’s performance was satisfactory.
Costs, Benefits, Profits, and Economies of Scale
The Board reviewed detailed information regarding the revenues received by the Advisor under the Advisory Contract and other benefits that the Advisor (and its affiliates) may have realized from its relationship with the fund, including any research received under “soft dollar” agreements and commission-sharing arrangements with broker-dealers. The Board considered that the Advisor may receive some benefit from soft-dollar arrangements pursuant to which research is received from broker-dealers that execute the fund’s portfolio transactions. The Board received information on the estimated costs incurred and profits realized by the Advisor from managing the T. Rowe Price funds. The Board also reviewed estimates of the profits realized from managing the fund in particular, and the Board concluded that the Advisor’s profits were reasonable in light of the services provided to the fund.
The Board also considered whether the fund benefits under the fee levels set forth in the Advisory Contract from any economies of scale realized by the Advisor. Under the Advisory Contract, the fund pays a fee to the Advisor for investment management services based on the fund’s average daily net assets and the fund pays its own expenses of operations. Assets of the fund are included in the calculation of the group fee rate, which serves as a component of the management fee for many other T. Rowe Price funds and declines at certain asset levels based on the combined average net assets of most of the T. Rowe Price funds (including the fund). Although the fund does not have a group fee component to its management fee, its assets are included in the calculation because the primary investment resources utilized to manage the fund are shared with other actively managed funds. The fund’s shareholders also benefit from potential economies of scale through a decline in certain operating expenses as the fund grows in size. The Board concluded that the advisory fee structure for the fund provided for a reasonable sharing of benefits from any economies of scale and that the advisory fee structure continued to be appropriate.
Fees and Expenses
The Board was provided with information regarding industry trends in management fees and expenses. Among other things, the Board reviewed data for peer groups that were compiled by Broadridge, which compared: (i) contractual management fees, total expenses, actual management fees, and nonmanagement expenses of the fund with a group of competitor funds selected by Broadridge (Expense Group) and (ii) total expenses, actual management fees, and nonmanagement expenses of the fund with a broader set of funds within the Lipper investment classification (Expense Universe). The Board considered the fund’s contractual management fee rate, actual management fee rate (which reflects the management fees actually received from the fund by the Advisor after any applicable waivers, reductions, or reimbursements), operating expenses, and total expenses (which reflect the net total expense ratio of the fund after any waivers, reductions, or reimbursements) in comparison with the information for the Broadridge peer groups. Broadridge generally constructed the peer groups by seeking the most comparable funds based on similar investment classifications and objectives, expense structure, asset size, and operating components and attributes and ranked funds into quintiles, with the first quintile representing the funds with the lowest relative expenses and the fifth quintile representing the funds with the highest relative expenses. The information provided to the Board indicated that the fund’s contractual management fee ranked in the first quintile (Expense Group), the fund’s actual management fee rate ranked in the first quintile (Expense Group) and second quintile (Expense Universe), and the fund’s total expenses ranked in the first quintile (Expense Group and Expense Universe).
The Board also reviewed the fee schedules for institutional accounts and private accounts with similar mandates that are advised or subadvised by the Advisor and its affiliates. Management provided the Board with information about the Advisor’s responsibilities and services provided to subadvisory and other institutional account clients, including information about how the requirements and economics of the institutional business are fundamentally different from those of the mutual fund business. The Board considered information showing that the Advisor’s mutual fund business is generally more complex from a business and compliance perspective than its institutional account business and considered various relevant factors, such as the broader scope of operations and oversight, more extensive shareholder communication infrastructure, greater asset flows, heightened business risks, and differences in applicable laws and regulations associated with the Advisor’s proprietary mutual fund business. In assessing the reasonableness of the fund’s management fee rate, the Board considered the differences in the nature of the services required for the Advisor to manage its mutual fund business versus managing a discrete pool of assets as a subadvisor to another institution’s mutual fund or for an institutional account and that the Advisor generally performs significant additional services and assumes greater risk in managing the fund and other T. Rowe Price funds than it does for institutional account clients.
On the basis of the information provided and the factors considered, the Board concluded that the fees paid by the fund under the Advisory Contract are reasonable.
Approval of the Advisory Contract
As noted, the Board approved the continuation of the Advisory Contract. No single factor was considered in isolation or to be determinative to the decision. Rather, the Board concluded, in light of a weighting and balancing of all factors considered, that it was in the best interests of the fund and its shareholders for the Board to approve the continuation of the Advisory Contract (including the fees to be charged for services thereunder).
Item 2. Code of Ethics.
A code of ethics, as defined in Item 2 of Form N-CSR, applicable to its principal executive officer, principal financial officer, principal accounting officer or controller, or persons performing similar functions is filed as an exhibit to the registrant’s annual Form N-CSR. No substantive amendments were approved or waivers were granted to this code of ethics during the registrant’s most recent fiscal half-year.
Item 3. Audit Committee Financial Expert.
Disclosure required in registrant’s annual Form N-CSR.
Item 4. Principal Accountant Fees and Services.
Disclosure required in registrant’s annual Form N-CSR.
Item 5. Audit Committee of Listed Registrants.
Not applicable.
Item 6. Investments.
(a) Not applicable. The complete schedule of investments is included in Item 1 of this Form N-CSR.
(b) Not applicable.
Item 7. Disclosure of Proxy Voting Policies and Procedures for Closed-End Management Investment Companies.
Not applicable.
Item 8. Portfolio Managers of Closed-End Management Investment Companies.
Not applicable.
Item 9. Purchases of Equity Securities by Closed-End Management Investment Company and Affiliated Purchasers.
Not applicable.
Item 10. Submission of Matters to a Vote of Security Holders.
Not applicable.
Item 11. Controls and Procedures.
(a) The registrant’s principal executive officer and principal financial officer have evaluated the registrant’s disclosure controls and procedures within 90 days of this filing and have concluded that the registrant’s disclosure controls and procedures were effective, as of that date, in ensuring that information required to be disclosed by the registrant in this Form N-CSR was recorded, processed, summarized, and reported timely.
(b) During the period, the Price Funds’ accounting agent, The Bank of New York Mellon (BNYM), converted the fund’s books and records from a legacy fund accounting system / operating model to a BNYM fund accounting system / operating model.
Item 12. Exhibits.
(a)(1) The registrant’s code of ethics pursuant to Item 2 of Form N-CSR is filed with the registrant’s annual Form N-CSR.
(2) Separate certifications by the registrant's principal executive officer and principal financial officer, pursuant to Section 302 of the Sarbanes-Oxley Act of 2002 and required by Rule 30a-2(a) under the Investment Company Act of 1940, are attached.
(3) Written solicitation to repurchase securities issued by closed-end companies: not applicable.
(b) A certification by the registrant's principal executive officer and principal financial officer, pursuant to Section 906 of the Sarbanes-Oxley Act of 2002 and required by Rule 30a-2(b) under the Investment Company Act of 1940, is attached.
SIGNATURES
Pursuant to the requirements of the Securities Exchange Act of 1934 and the Investment Company Act of 1940, the registrant has duly caused this report to be signed on its behalf by the undersigned, thereunto duly authorized.
T. Rowe Price Institutional Equity Funds, Inc.
| By | /s/ David Oestreicher | |||||
| David Oestreicher | ||||||
| Principal Executive Officer | ||||||
| Date | August 16, 2018 | |||||
Pursuant to the requirements of the Securities Exchange Act of 1934 and the Investment Company Act of 1940, this report has been signed below by the following persons on behalf of the registrant and in the capacities and on the dates indicated.
| By | /s/ David Oestreicher | |||||
| David Oestreicher | ||||||
| Principal Executive Officer | ||||||
| Date | August 16, 2018 | |||||
| By | /s/ Catherine D. Mathews | |||||
| Catherine D. Mathews | ||||||
| Principal Financial Officer | ||||||
| Date | August 16, 2018 | |||||
Item 12(a)(2).
CERTIFICATIONS
I, David Oestreicher, certify that:
| 1. | I have reviewed this report on Form N-CSR of T. Rowe Price Institutional Large-Cap Core Growth Fund; | |||
| 2. | Based on my knowledge, this report does not contain any untrue statement of a material fact or omit to state a material fact necessary to make the statements made, in light of the circumstances under which such statements were made, not misleading with respect to the period covered by this report; | |||
| 3. | Based on my knowledge, the financial statements, and other financial information included in this report, fairly present in all material respects the financial condition, results of operations, changes in net assets, and cash flows (if the financial statements are required to include a statement of cash flows) of the registrant as of, and for, the periods presented in this report; | |||
| 4. | The registrant's other certifying officer(s) and I are responsible for establishing and maintaining disclosure controls and procedures (as defined in rule 30a-3(c) under the Investment Company Act of 1940) and internal control over financial reporting (as defined in Rule 30a-3(d) under the Investment Company Act of 1940) for the registrant and have: | |||
| (a) | Designed such disclosure controls and procedures, or caused such disclosure controls and procedures to be designed under our supervision, to ensure that material information relating to the registrant, including its consolidated subsidiaries, is made known to us by others within those entities, particularly during the period in which this report is being prepared; | |||
| (b) | Designed such internal control over financial reporting, or caused such internal control over financial reporting to be designed under our supervision, to provide reasonable assurance regarding the reliability of financial reporting and the preparation of financial statements for external purposes in accordance with generally accepted accounting principles; | |||
| (c) | Evaluated the effectiveness of the registrant's disclosure controls and procedures and presented in this report our conclusions about the effectiveness of the disclosure controls and procedures, as of a date within 90 days prior to the filing date of this report based on such evaluation; and | |||
| (d) | Disclosed in this report any change in the registrant’s internal control over financial reporting that occurred during the second fiscal quarter of the period covered by this report that has materially affected, or is reasonably likely to materially affect, the registrant’s internal control over financial reporting; and | |||
| 5. | The registrant's other certifying officer(s) and I have disclosed to the registrant's auditors and the audit committee of the registrant's board of directors (or persons performing the equivalent functions): | |||
| (a) | All significant deficiencies and material weaknesses in the design or operation of internal control over financial reporting which are reasonably likely to adversely affect the registrant's ability to record, process, summarize, and report financial information; and | |||
| (b) | Any fraud, whether or not material, that involves management or other employees who have a significant role in the registrant's internal control over financial reporting. | |||
| Date: August 16, 2018 | /s/ David Oestreicher |
| David Oestreicher | |
| Principal Executive Officer |
CERTIFICATIONS
I, Catherine D. Mathews, certify that:
| 1. | I have reviewed this report on Form N-CSR of T. Rowe Price Institutional Large-Cap Core Growth Fund; | |||
| 2. | Based on my knowledge, this report does not contain any untrue statement of a material fact or omit to state a material fact necessary to make the statements made, in light of the circumstances under which such statements were made, not misleading with respect to the period covered by this report; | |||
| 3. | Based on my knowledge, the financial statements, and other financial information included in this report, fairly present in all material respects the financial condition, results of operations, changes in net assets, and cash flows (if the financial statements are required to include a statement of cash flows) of the registrant as of, and for, the periods presented in this report; | |||
| 4. | The registrant's other certifying officer(s) and I are responsible for establishing and maintaining disclosure controls and procedures (as defined in rule 30a-3(c) under the Investment Company Act of 1940) and internal control over financial reporting (as defined in Rule 30a-3(d) under the Investment Company Act of 1940) for the registrant and have: | |||
| (a) | Designed such disclosure controls and procedures, or caused such disclosure controls and procedures to be designed under our supervision, to ensure that material information relating to the registrant, including its consolidated subsidiaries, is made known to us by others within those entities, particularly during the period in which this report is being prepared; | |||
| (b) | Designed such internal control over financial reporting, or caused such internal control over financial reporting to be designed under our supervision, to provide reasonable assurance regarding the reliability of financial reporting and the preparation of financial statements for external purposes in accordance with generally accepted accounting principles; | |||
| (c) | Evaluated the effectiveness of the registrant's disclosure controls and procedures and presented in this report our conclusions about the effectiveness of the disclosure controls and procedures, as of a date within 90 days prior to the filing date of this report based on such evaluation; and | |||
| (d) | Disclosed in this report any change in the registrant’s internal control over financial reporting that occurred during the second fiscal quarter of the period covered by this report that has materially affected, or is reasonably likely to materially affect, the registrant’s internal control over financial reporting; and | |||
| 5. | The registrant's other certifying officer(s) and I have disclosed to the registrant's auditors and the audit committee of the registrant's board of directors (or persons performing the equivalent functions): | |||
| (a) | All significant deficiencies and material weaknesses in the design or operation of internal control over financial reporting which are reasonably likely to adversely affect the registrant's ability to record, process, summarize, and report financial information; and | |||
| (b) | Any fraud, whether or not material, that involves management or other employees who have a significant role in the registrant's internal control over financial reporting. | |||
| Date: August 16, 2018 | /s/ Catherine D. Mathews |
| Catherine D. Mathews | |
| Principal Financial Officer |
Item 12(b).
| CERTIFICATION UNDER SECTION 906 OF SARBANES-OXLEY ACT OF 2002 | ||
| Name of Issuer: T. Rowe Price Institutional Large-Cap Core Growth Fund | ||
| In connection with the Report on Form N-CSR for the above named Issuer, the undersigned hereby certifies, to the best of his knowledge, that: | ||
| 1. | The Report fully complies with the requirements of Section 13(a) or 15(d) of the Securities Exchange Act of 1934; | |
| 2. | The information contained in the Report fairly presents, in all material respects, the financial condition and results of operations of the Issuer. | |
| Date: August 16, 2018 | /s/ David Oestreicher |
| David Oestreicher | |
| Principal Executive Officer | |
| Date: August 16, 2018 | /s/ Catherine D. Mathews |
| Catherine D. Mathews | |
| Principal Financial Officer | |
Serious News for Serious Traders! Try StreetInsider.com Premium Free!
You May Also Be Interested In
- Q-SYS Launches VisionSuite Training Certification
- Partner base continues to grow: Greenman Energy opts for battery-buffered fast chargers from ADS-TEC Energy
- Humana Healthy Horizons Commits $500K to Improve Health of Louisianians
Create E-mail Alert Related Categories
SEC FilingsSign up for StreetInsider Free!
Receive full access to all new and archived articles, unlimited portfolio tracking, e-mail alerts, custom newswires and RSS feeds - and more!
