

Form N-CSRS SIT MUTUAL FUNDS II INC For: Sep 30
 Tweet
Tweet Share
ShareUNITED STATES SECURITIES AND EXCHANGE COMMISSION
Washington, D.C. 20549
FORM N-CSR
—————
CERTIFIED SHAREHOLDER REPORT OF REGISTERED
MANAGEMENT INVESTMENT COMPANIES
Investment Company Act file number: 811-04033
————-
Sit Mutual Funds II, Inc.
(Exact name of registrant as specified in charter)
3300 IDS Center
80 South Eighth Street
Minneapolis, MN 55402
(Address of principal executive offices)
Paul E. Rasmussen, VP & Treasurer
Sit Mutual Funds, Inc.
3300 IDS Center
80 South Eighth Street
Minneapolis, MN 55402
(Name and address of agent for service)
Registrant’s telephone number, including area code:
(612) 332-3223
Date of fiscal year end: March 31, 2020
Date of reporting period: September 30, 2020
Item 1: Reports to Stockholders
Semi-Annual Report
September 30, 2020
U.S. Government Securities Fund
Quality Income Fund
Tax-Free Income Fund
Minnesota Tax-Free Income Fund
Important Information on Paperless Delivery
Beginning on January 1, 2021, as permitted by regulations adopted by the Securities and Exchange Commission, paper copies of the Funds’ shareholder reports will no longer be sent by mail, unless you specifically request paper copies of the reports from Sit Mutual Funds or from your financial intermediary, such as a broker-dealer or bank. Instead, the reports will remain available on the Funds’ website (sitfunds.com) and you will be notified by mail each time a report is posted and provided with a website link to access the report.
If you already elected to receive shareholder reports electronically, you will not be affected by this change and you need not take any action. You may elect to receive shareholder reports electronically from the Fund by calling 1-800-332-5580 or by enrolling online at sitfunds.com, or, if you are invested through your financial intermediary, you may contact them directly.
You may elect to receive all future reports in paper free of charge. You can inform the Funds by calling 1-800-332-5580, or, if you are invested through your financial intermediary, you may contact them directly. Your election to receive reports in paper will apply to all funds held with Sit Mutual Funds or through your financial intermediary, as applicable.

| Sit Mutual Funds BOND FUNDS SEMI-ANNUAL REPORT |
| Page | ||||
| 2 | ||||
| Fund Reviews and Schedules of Investments |
||||
| 4 | ||||
| 12 | ||||
| 20 | ||||
| 38 | ||||
| 50 | ||||
| 51 | ||||
| 52 | ||||
| 54 | ||||
| 60 | ||||
| 67 | ||||
| 68 | ||||
This document must be preceded or accompanied by a Prospectus.
|
|
|
October 30, 2020
|
| 2 | SIT MUTUAL FUNDS SEMI-ANNUAL REPORT | |
|
|
|
|

| SEPTEMBER 30, 2020 | 3 | |
|
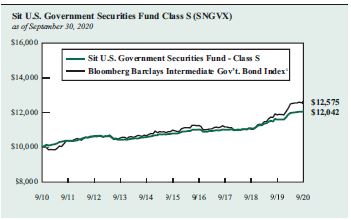
Sit U.S. Government Securities Fund - Class S and Class Y
|
OBJECTIVE & STRATEGY
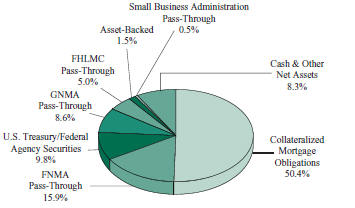
The objective of the U.S. Government Securities Fund is to provide high current income and safety of principal, which it seeks to attain by investing solely in debt obligations issued, guaranteed or insured by the U.S. government or its agencies or its instrumentalities.
Agency mortgage securities and U.S. Treasury securities are the principal holdings in the Fund. The mortgage securities that the Fund purchases consist of pass-through securities including those issued by Government National Mortgage Association (GNMA), Federal National Mortgage Association (FNMA), and Federal Home Loan Mortgage Corporation (FHLMC).
| 4 | SIT MUTUAL FUNDS SEMI-ANNUAL REPORT | |
|
|
| SEPTEMBER 30, 2020 | 5 | |
|
|
| SCHEDULE OF INVESTMENTS (Unaudited) September 30, 2020
Sit U.S. Government Securities Fund |
| See accompanying notes to financial statements.
|
||
| 6 | SIT MUTUAL FUNDS SEMI-ANNUAL REPORT | |
|
|
|
|
| See accompanying notes to financial statements.
|
||
| SEPTEMBER 30, 2020 | 7 | |
|
|
| SCHEDULE OF INVESTMENTS (Unaudited) September 30, 2020
Sit U.S. Government Securities Fund (Continued) |
| See accompanying notes to financial statements.
|
||
| 8 | SIT MUTUAL FUNDS SEMI-ANNUAL REPORT | |
|
|
|
|
| See accompanying notes to financial statements.
|
||
| SEPTEMBER 30, 2020 | 9 | |
|
|
| SCHEDULE OF INVESTMENTS (Unaudited) September 30, 2020
Sit U.S. Government Securities Fund (Continued) |
| See accompanying notes to financial statements.
|
||
| 10 | SIT MUTUAL FUNDS SEMI-ANNUAL REPORT | |
|
|
|
|
A summary of the levels for the Fund’s investments as of September 30, 2020 is as follows (see Note 2-significant accounting policies in the notes to financial statements):
| Investment in Securities | ||||||||||||||
| Level 1 Quoted Price ($) |
Level 2 Other significant observable inputs ($) |
Level 3 Significant |
Total ($) | |||||||||||
| Assets |
||||||||||||||
| Mortgage Pass-Through Securities |
— | 145,184,881 | — | 145,184,881 | ||||||||||
| U.S. Treasury / Federal Agency Securities |
— | 47,258,017 | — | 47,258,017 | ||||||||||
| Collateralized Mortgage Obligations |
— | 243,970,709 | — | 243,970,709 | ||||||||||
| Asset-Backed Securities |
— | 7,288,315 | — | 7,288,315 | ||||||||||
| Short-Term Securities |
60,730,021 | — | — | 60,730,021 | ||||||||||
| 60,730,021 | 443,701,922 | — | 504,431,943 | |||||||||||
There were no transfers into or out of level 3 during the reporting period.
| See accompanying notes to financial statements.
|
||
| SEPTEMBER 30, 2020 | 11 | |
|
|
OBJECTIVE & STRATEGY
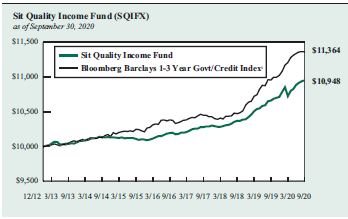
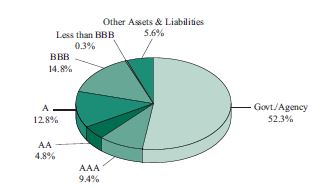
The objective of the Quality Income Fund is to provide high current income and safety of principal, which it seeks to attain by investing at least 80% of its assets in debt securities issued by the U.S. government and its agencies, debt securities issued by corporations, and mortgage and other asset-backed securities. The Fund invests at least 50% of its assets in U.S. government debt securities, which are securities issued, guaranteed or insured by the U.S. government, its agencies or instrumentalities.
| 12 | SIT MUTUAL FUNDS SEMI-ANNUAL REPORT | |
|
|
| SEPTEMBER 30, 2020 | 13 | |
|
|
| SCHEDULE OF INVESTMENTS (Unaudited) September 30, 2020
Sit Quality Income Fund |
| Name of Issuer | Principal Amount ($) |
Coupon Rate (%) |
Maturity Date |
Fair Value ($) |
||||||||||||
| Asset-Backed Securities - 7.8% |
||||||||||||||||
| Agency - 1.1% |
||||||||||||||||
| FNMA Grantor Trust, Series 2004-T5, Class A11 1 |
579,152 | 0.76 | 5/28/35 | 568,845 | ||||||||||||
| FNMA REMICS, Series 2001-W2, Class AS5 14 |
1,263 | 6.47 | 10/25/31 | 1,280 | ||||||||||||
| Small Business Administration, Series 2006-20D, Class 1 |
170,625 | 5.64 | 4/1/26 | 182,889 | ||||||||||||
| Small Business Administration, Series 2007-20B, Class 1 |
139,035 | 5.49 | 2/1/27 | 150,950 | ||||||||||||
| Small Business Administration, Series 2007-20J, Class 1 |
225,335 | 5.57 | 10/1/27 | 242,095 | ||||||||||||
|
|
|
|||||||||||||||
| 1,146,059 | ||||||||||||||||
|
|
|
|||||||||||||||
| Non-Agency - 6.7% |
||||||||||||||||
| ACE Securities Corp. Manufactured Housing Trust, Series 2003-MH1, Class M2 1, 4 |
499,642 | 6.50 | 8/15/30 | 533,632 | ||||||||||||
| Aegis Asset Backed Securities Corp., Series 2003-2, Class M1, 1 Mo. Libor + 1.13% 1 |
747,206 | 1.27 | 11/25/33 | 727,525 | ||||||||||||
| Bayview Opportunity Master Fund, Series 2017-SPL5, Class A 1, 4 |
294,326 | 3.50 | 6/28/57 | 304,239 | ||||||||||||
| Centex Home Equity Loan Trust, Series 2004-A, Class AF4 14 |
102,684 | 5.01 | 8/25/32 | 106,943 | ||||||||||||
| Centex Home Equity Loan Trust, Series 2004-A, Class AF5 14 |
310,000 | 5.43 | 1/25/34 | 316,710 | ||||||||||||
| Countrywide Asset-Backed Certificates, Series 2004-S1, Class A3 14 |
74,504 | 5.12 | 2/25/35 | 74,411 | ||||||||||||
| GSAMP Trust, Series 2004-FM1, Class M1, 1 Mo. Libor + 0.98% 1 |
157,810 | 1.12 | 11/25/33 | 155,624 | ||||||||||||
| Home Equity Mortgage Loan Asset-Backed Trust, Series 2003-A, Class AV2, 1 Mo. Libor + 0.86% 1 |
310,634 | 1.01 | 10/25/33 | 308,186 | ||||||||||||
| Mill City Mortgage Loan Trust, Series 2017-3, Class A1 1, 4 |
240,716 | 2.75 | 1/25/61 | 247,957 | ||||||||||||
| OSCAR US Funding Trust IX, LLC, Series 2018-2A, Class A4 4 |
500,000 | 3.63 | 9/10/25 | 522,517 | ||||||||||||
| OSCAR US Funding Trust VI, LLC, Series 2017-1A, Class A4 4 |
645,658 | 3.30 | 5/10/24 | 653,906 | ||||||||||||
| Towd Point Mortgage Trust, Series 2019-MH1, Class A2 1, 4 |
800,000 | 3.00 | 11/25/58 | 824,647 | ||||||||||||
| Towd Point Mortgage Trust, Series 2019-SJ1, Class A1 1, 4 |
625,822 | 3.75 | 11/25/58 | 632,894 | ||||||||||||
| Towd Point Mortgage Trust, Series 2019-SJ3, Class A1 1, 4 |
529,567 | 3.00 | 11/25/59 | 538,593 | ||||||||||||
| Towd Point Mortgage Trust, Series 2020-MH1, Class A1A 1, 4 |
870,291 | 2.18 | 2/25/60 | 883,869 | ||||||||||||
|
|
|
|||||||||||||||
| 6,831,653 | ||||||||||||||||
|
|
|
|||||||||||||||
| Total Asset-Backed Securities |
7,977,712 | |||||||||||||||
|
|
|
|||||||||||||||
| Collateralized Mortgage Obligations - 13.9% |
||||||||||||||||
| Agency - 8.3% |
||||||||||||||||
| FHLMC REMICS, Series 2528, Class KM |
17,322 | 5.50 | 11/15/22 | 17,909 | ||||||||||||
| FHLMC REMICS, Series 2968, Class EG |
498,326 | 6.00 | 10/15/34 | 501,382 | ||||||||||||
| FHLMC REMICS, Series 3104, Class BY |
87,853 | 5.50 | 1/15/26 | 94,885 | ||||||||||||
| FHLMC REMICS, Series 3806, Class JA |
192,102 | 3.50 | 2/15/26 | 199,559 | ||||||||||||
| FHLMC REMICS, Series 4246, Class PT |
429,965 | 6.50 | 2/15/36 | 514,142 | ||||||||||||
| FHLMC REMICS, Series 4759, Class NA |
592,051 | 3.00 | 8/15/44 | 608,291 | ||||||||||||
| FHLMC REMICS, Series 4776, Class QG |
506,226 | 3.00 | 9/15/42 | 514,861 | ||||||||||||
| FHLMC Structured Pass-Through Certificates, Series T-60, Class 1A2 |
738,260 | 7.00 | 3/25/44 | 905,098 | ||||||||||||
| FNMA Grantor Trust, Series 2004-T1, Class 2A 1 |
415,338 | 3.55 | 8/25/43 | 442,592 | ||||||||||||
| FNMA REMICS, Series 2003-52, Class NA |
18,713 | 4.00 | 6/25/23 | 19,012 | ||||||||||||
| FNMA REMICS, Series 2005-68, Class PC |
290 | 5.50 | 7/25/35 | 290 | ||||||||||||
| FNMA REMICS, Series 2008-65, Class CD |
6 | 4.50 | 8/25/23 | 6 | ||||||||||||
| FNMA REMICS, Series 2009-13, Class NX |
744 | 4.50 | 3/25/24 | 763 | ||||||||||||
| FNMA REMICS, Series 2009-71, Class MB |
22,300 | 4.50 | 9/25/24 | 23,024 | ||||||||||||
| FNMA REMICS, Series 2009-88, Class DA |
2 | 4.50 | 10/25/20 | 2 | ||||||||||||
| FNMA REMICS, Series 2012-19, Class GH |
18,168 | 3.00 | 11/25/30 | 18,604 | ||||||||||||
| FNMA REMICS, Series 2013-74, Class AD |
73,333 | 2.00 | 7/25/23 | 74,076 | ||||||||||||
| FNMA REMICS, Series 2017-97, Class DP |
465,321 | 3.50 | 10/25/46 | 475,896 | ||||||||||||
| FNMA REMICS, Series 2018-1, Class TE |
341,678 | 3.50 | 3/25/44 | 353,793 | ||||||||||||
| FNMA REMICS, Series 2018-25, Class AG |
498,090 | 3.50 | 4/25/47 | 524,848 | ||||||||||||
| FRESB Mortgage Trust, Series 2018-SB45, Class A5H 1 |
750,176 | 2.96 | 11/25/37 | 775,057 | ||||||||||||
| See accompanying notes to financial statements.
|
||
| 14 | SIT MUTUAL FUNDS SEMI-ANNUAL REPORT | |
|
|
|
|
| Name of Issuer | Principal Amount ($) |
Coupon Rate (%) |
Maturity Date |
Fair Value ($) |
||||||||||||
| FRESB Mortgage Trust, Series 2018-SB46, Class A5H 1 |
818,826 | 2.89 | 12/25/37 | 857,584 | ||||||||||||
| NCUA Guaranteed Notes Trust, Series 2010-R1, Class 1A, 1 Mo. Libor + 0.45% 1 |
165,627 | 0.60 | 10/7/20 | 165,610 | ||||||||||||
| NCUA Guaranteed Notes Trust, Series 2010-R3, Class 2A, 1 Mo. Libor + 0.56% 1 |
861,830 | 0.71 | 12/8/20 | 861,830 | ||||||||||||
| Seasoned Credit Risk Transfer Trust, Series 2019-4, Class M55D |
438,461 | 4.00 | 2/25/59 | 487,181 | ||||||||||||
| Vendee Mortgage Trust, Series 1993-1, Class ZB |
34,172 | 7.25 | 2/15/23 | 36,176 | ||||||||||||
|
|
|
|||||||||||||||
| 8,472,471 | ||||||||||||||||
|
|
|
|||||||||||||||
| Non-Agency - 5.6% |
||||||||||||||||
| Bear Stearns ALT-A Trust, Series 2004-12, Class 1A1, 1 Mo. Libor + 0.70% 1 |
240,024 | 0.85 | 1/25/35 | 239,742 | ||||||||||||
| COLT Mortgage Loan Trust, Series 2019-1, Class A1 1, 4 |
194,947 | 3.71 | 3/25/49 | 196,572 | ||||||||||||
| JP Morgan Mortgage Trust, Series 2019-9, Class A8 1, 4 |
750,000 | 3.50 | 5/25/50 | 770,956 | ||||||||||||
| JP Morgan Mortgage Trust, Series 2020-2, Class A4 1, 4 |
722,659 | 3.50 | 7/25/50 | 740,231 | ||||||||||||
| MASTR Alternative Loan Trust, Series 2003-4, Class 2A1 |
64,416 | 6.25 | 6/25/33 | 67,978 | ||||||||||||
| MASTR Alternative Loan Trust, Series 2003-5, Class 4A1 |
76,527 | 5.50 | 7/25/33 | 79,202 | ||||||||||||
| MASTR Alternative Loan Trust, Series 2003-8, Class 3A1 |
54,160 | 5.50 | 12/25/33 | 55,409 | ||||||||||||
| New Residential Mortgage Loan Trust, Series 2017-2A, Class A4 1, 4 |
450,806 | 4.00 | 3/25/57 | 486,078 | ||||||||||||
| New Residential Mortgage Loan Trust, Series 2017-3A, Class A1 1, 4 |
480,816 | 4.00 | 4/25/57 | 519,514 | ||||||||||||
| New Residential Mortgage Loan Trust, Series 2017-5A, Class A1, 1 Mo. Libor + 1.50% 1, 4 |
188,902 | 1.65 | 6/25/57 | 189,006 | ||||||||||||
| New Residential Mortgage Loan Trust, Series 2018-1A, Class A1A 1, 4 |
328,670 | 4.00 | 12/25/57 | 354,825 | ||||||||||||
| New Residential Mortgage Loan Trust, Series 2018-4A, Class A1S, 1 Mo. Libor + 0.75% 1, 4 |
511,837 | 0.90 | 1/25/48 | 510,695 | ||||||||||||
| Sequoia Mortgage Trust, Series 2012-2, Class B1 1 |
360,994 | 4.21 | 4/25/42 | 369,651 | ||||||||||||
| Sequoia Mortgage Trust, Series 2017-4, Class A4 1, 4 |
107,265 | 3.50 | 7/25/47 | 108,304 | ||||||||||||
| Sequoia Mortgage Trust, Series 2018-3, Class A4 1, 4 |
268,521 | 3.50 | 3/25/48 | 269,174 | ||||||||||||
| Sequoia Mortgage Trust, Series 2020-2, Class A4 1, 4 |
696,687 | 3.50 | 3/25/50 | 717,924 | ||||||||||||
|
|
|
|||||||||||||||
| 5,675,261 | ||||||||||||||||
|
|
|
|||||||||||||||
| Total Collateralized Mortgage Obligations |
14,147,732 | |||||||||||||||
|
|
|
|||||||||||||||
| Corporate Bonds - 22.9% |
||||||||||||||||
| AmSouth Bancorp. (Subordinated) |
750,000 | 6.75 | 11/1/25 | 916,710 | ||||||||||||
| Bank of America Corp., SOFRRATE + 1.15% 1 |
600,000 | 1.32 | 6/19/26 | 604,521 | ||||||||||||
| Capital One Bank USA NA, SOFRRATE + 0.91% 1 |
175,000 | 2.28 | 1/28/26 | 181,122 | ||||||||||||
| Comerica Bank (Subordinated) |
500,000 | 4.00 | 7/27/25 | 552,694 | ||||||||||||
| Credit Suisse Group Funding Guernsey, Ltd. 4 |
450,000 | 3.75 | 3/26/25 | 496,338 | ||||||||||||
| Delta Air Lines 2015-1 Class A Pass Through Trust |
587,222 | 3.88 | 7/30/27 | 550,776 | ||||||||||||
| Delta Air Lines 2019-1 Class A Pass Through Trust |
286,000 | 3.40 | 4/25/24 | 275,993 | ||||||||||||
| Delta Air Lines, Inc./SkyMiles 4 |
850,000 | 4.50 | 10/20/25 | 872,824 | ||||||||||||
| Discover Bank |
400,000 | 4.25 | 3/13/26 | 455,226 | ||||||||||||
| Doric Nimrod Air Finance Alpha 2012-1 Trust 4 |
320,644 | 5.13 | 11/30/22 | 286,434 | ||||||||||||
| Duke Energy Florida Project Finance, LLC |
743,680 | 1.73 | 9/1/22 | 728,353 | ||||||||||||
| Fidelity & Guaranty Life Holdings, Inc. 4 |
1,035,000 | 5.50 | 5/1/25 | 1,160,494 | ||||||||||||
| Fulton Financial Corp. (Subordinated) |
900,000 | 4.50 | 11/15/24 | 983,245 | ||||||||||||
| Georgia-Pacific, LLC |
645,000 | 7.38 | 12/1/25 | 833,563 | ||||||||||||
| JetBlue 2019-1 Class B Pass Through Trust |
1,000,000 | 8.00 | 11/15/27 | 1,039,295 | ||||||||||||
| John Hancock Life Insurance Co. (Subordinated) 4 |
900,000 | 7.38 | 2/15/24 | 1,066,206 | ||||||||||||
| JPMorgan Chase & Co., 3 Mo. Libor + 0.80% 1 |
900,000 | 1.04 | 5/10/23 | 897,231 | ||||||||||||
| KeyBank (Subordinated) |
500,000 | 3.40 | 5/20/26 | 560,665 | ||||||||||||
| Liberty Mutual Insurance Co. (Subordinated) 4 |
700,000 | 8.50 | 5/15/25 | 879,617 | ||||||||||||
| Marsh & McLennan Cos., Inc., 3 Mo. Libor + 1.20% 1 |
465,000 | 1.42 | 12/29/21 | 465,443 | ||||||||||||
| Metropolitan Life Insurance Co. (Subordinated) 4 |
750,000 | 7.80 | 11/1/25 | 982,290 | ||||||||||||
| Minnesota Life Insurance Co. (Subordinated) 4 |
750,000 | 8.25 | 9/15/25 | 952,039 | ||||||||||||
| Nationwide Mutual Insurance Co. (Subordinated), 3 Mo. Libor + 2.29% 1, 4 |
975,000 | 2.54 | 12/15/24 | 974,996 | ||||||||||||
| See accompanying notes to financial statements.
|
||
| SEPTEMBER 30, 2020 | 15 | |
|
|
| SCHEDULE OF INVESTMENTS (Unaudited) September 30, 2020
Sit Quality Income Fund (Continued) |
| Name of Issuer | Principal Amount ($) |
Coupon Rate (%) |
Maturity Date |
Fair Value ($) |
||||||||||||
| NetApp, Inc. |
300,000 | 1.88 | 6/22/25 | 310,739 | ||||||||||||
| Prudential Insurance Co. of America (Subordinated) 4 |
615,000 | 8.30 | 7/1/25 | 802,025 | ||||||||||||
| RenaissanceRe Finance, Inc. |
500,000 | 3.70 | 4/1/25 | 542,087 | ||||||||||||
| SBA Tower Trust 4 |
500,000 | 2.84 | 1/15/25 | 535,117 | ||||||||||||
| SBA Tower Trust, Series 2014-2A, Class C 4, 14 |
750,000 | 3.87 | 10/15/49 | 789,674 | ||||||||||||
| TIAA FSB Holdings, Inc. (Subordinated) |
780,000 | 5.75 | 7/2/25 | 852,963 | ||||||||||||
| United Airlines 2014-1 Class A Pass Through Trust |
1,013,305 | 4.00 | 4/11/26 | 993,932 | ||||||||||||
| Wachovia Corp. (Subordinated) 14 |
661,000 | 7.57 | 8/1/26 | 852,489 | ||||||||||||
| Webster Financial Corp. |
950,000 | 4.38 | 2/15/24 | 1,004,919 | ||||||||||||
|
|
|
|||||||||||||||
| Total Corporate Bonds |
23,400,020 | |||||||||||||||
|
|
|
|||||||||||||||
| Mortgage Pass-Through Securities - 18.5% |
||||||||||||||||
| Federal Home Loan Mortgage Corporation - 3.9% |
||||||||||||||||
| Freddie Mac |
576,586 | 2.00 | 11/1/31 | 602,441 | ||||||||||||
| Freddie Mac |
730,153 | 2.00 | 8/1/32 | 763,046 | ||||||||||||
| Freddie Mac |
104,685 | 3.00 | 9/1/27 | 111,035 | ||||||||||||
| Freddie Mac |
997,324 | 3.00 | 1/1/35 | 1,070,856 | ||||||||||||
| Freddie Mac |
20,963 | 3.50 | 7/1/26 | 22,209 | ||||||||||||
| Freddie Mac |
594,785 | 3.50 | 9/1/32 | 632,552 | ||||||||||||
| Freddie Mac |
137,670 | 4.00 | 7/1/26 | 146,413 | ||||||||||||
| Freddie Mac |
144,729 | 4.00 | 1/1/27 | 153,903 | ||||||||||||
| Freddie Mac |
54 | 4.50 | 12/1/21 | 56 | ||||||||||||
| Freddie Mac |
5,479 | 4.50 | 7/1/26 | 5,747 | ||||||||||||
| Freddie Mac |
9,717 | 5.00 | 10/1/25 | 10,629 | ||||||||||||
| Freddie Mac |
451,422 | 5.00 | 5/1/28 | 497,670 | ||||||||||||
| Freddie Mac |
1,210 | 5.50 | 3/1/21 | 1,216 | ||||||||||||
| Freddie Mac |
231 | 5.50 | 3/1/21 | 231 | ||||||||||||
|
|
|
|||||||||||||||
| 4,018,004 | ||||||||||||||||
|
|
|
|||||||||||||||
| Federal National Mortgage Association - 11.5% |
||||||||||||||||
| Fannie Mae |
1,263,776 | 2.35 | 5/1/23 | 1,314,370 | ||||||||||||
| Fannie Mae |
1,147,432 | 2.50 | 2/1/35 | 1,212,860 | ||||||||||||
| Fannie Mae |
1,658,828 | 2.99 | 3/1/22 | 1,696,662 | ||||||||||||
| Fannie Mae |
176,246 | 3.00 | 8/1/28 | 185,009 | ||||||||||||
| Fannie Mae |
890,996 | 3.00 | 9/1/32 | 941,583 | ||||||||||||
| Fannie Mae |
1,775,049 | 3.00 | 6/1/40 | 1,927,963 | ||||||||||||
| Fannie Mae |
380,894 | 3.50 | 1/1/26 | 403,343 | ||||||||||||
| Fannie Mae |
975,272 | 3.50 | 2/1/32 | 1,053,312 | ||||||||||||
| Fannie Mae |
800,103 | 3.50 | 5/1/35 | 862,389 | ||||||||||||
| Fannie Mae |
11,241 | 4.00 | 9/1/24 | 11,909 | ||||||||||||
| Fannie Mae |
80,955 | 4.00 | 6/1/25 | 85,792 | ||||||||||||
| Fannie Mae |
16,315 | 4.00 | 10/1/31 | 17,791 | ||||||||||||
| Fannie Mae |
67,704 | 4.50 | 4/1/25 | 71,984 | ||||||||||||
| Fannie Mae |
3 | 5.50 | 1/1/21 | 3 | ||||||||||||
| Fannie Mae |
64 | 5.50 | 10/1/21 | 64 | ||||||||||||
| See accompanying notes to financial statements.
|
||
| 16 | SIT MUTUAL FUNDS SEMI-ANNUAL REPORT | |
|
|
|
|
| Name of Issuer | Principal Amount ($) |
Coupon Rate (%) |
Maturity Date |
Fair Value ($) |
||||||||||||
| Fannie Mae |
704,626 | 5.50 | 8/1/40 | 833,876 | ||||||||||||
| Fannie Mae |
971,511 | 5.50 | 2/1/42 | 1,128,577 | ||||||||||||
|
|
|
|||||||||||||||
| 11,747,487 | ||||||||||||||||
|
|
|
|||||||||||||||
| Government National Mortgage Association - 0.9% |
||||||||||||||||
| Ginnie Mae, US Treasury + 1.50% 1 |
31,497 | 2.88 | 4/20/33 | 32,950 | ||||||||||||
| Ginnie Mae, US Treasury + 1.50% 1 |
5,601 | 2.88 | 4/20/42 | 5,811 | ||||||||||||
| Ginnie Mae |
8,229 | 5.00 | 12/20/23 | 8,482 | ||||||||||||
| Ginnie Mae |
6,120 | 5.00 | 9/15/24 | 6,478 | ||||||||||||
| Ginnie Mae |
28,681 | 5.00 | 6/20/26 | 31,091 | ||||||||||||
| Ginnie Mae |
669,789 | 6.00 | 7/20/37 | 793,918 | ||||||||||||
|
|
|
|||||||||||||||
| 878,730 | ||||||||||||||||
|
|
|
|||||||||||||||
| Other Federal Agency Securities - 2.2% |
||||||||||||||||
| Small Business Administration Pools, PRIME - 2.50% 1 |
570,839 | 0.75 | 5/25/43 | 569,186 | ||||||||||||
| Small Business Administration Pools, PRIME + 0.80% 1 |
1,149,302 | 4.05 | 2/25/28 | 1,225,256 | ||||||||||||
| Small Business Administration Pools, PRIME + 0.76% 1 |
381,550 | 4.06 | 3/25/30 | 407,641 | ||||||||||||
|
|
|
|||||||||||||||
| 2,202,083 | ||||||||||||||||
|
|
|
|||||||||||||||
| Total Mortgage Pass-Through Securities |
18,846,304 | |||||||||||||||
|
|
|
|||||||||||||||
| Taxable Municipal Bonds - 7.1% |
||||||||||||||||
| Berks County Industrial Development Authority |
140,000 | 3.20 | 5/15/21 | 140,423 | ||||||||||||
| City of Worcester MA 17 |
250,000 | 6.75 | 11/1/34 | 251,275 | ||||||||||||
| Colorado Housing & Finance Authority |
5,000 | 4.00 | 11/1/31 | 5,138 | ||||||||||||
| County of Yamhill OR |
500,000 | 4.50 | 10/1/30 | 499,720 | ||||||||||||
| Financial Consulting Services Group, LLC 4 |
1,000,000 | 5.50 | 2/1/21 | 1,006,102 | ||||||||||||
| Massachusetts Educational Financing Authority |
370,000 | 4.00 | 1/1/32 | 378,506 | ||||||||||||
| Massachusetts Educational Financing Authority |
750,000 | 4.41 | 7/1/34 | 823,740 | ||||||||||||
| New Hampshire Housing Finance Authority |
290,000 | 4.00 | 7/1/35 | 295,243 | ||||||||||||
| New Hampshire Housing Finance Authority |
5,000 | 4.00 | 1/1/37 | 5,191 | ||||||||||||
| New Jersey Economic Development Authority |
365,000 | 4.43 | 12/1/21 | 370,895 | ||||||||||||
| New Jersey Economic Development Authority 9 |
500,000 | 2.88 | 6/15/24 | 506,685 | ||||||||||||
| New Jersey Turnpike Authority 4 |
1,000,000 | 3.22 | 1/1/35 | 1,064,800 | ||||||||||||
| New York City Transitional Finance Authority Future Tax Secured Revenue |
750,000 | 6.27 | 8/1/39 | 753,270 | ||||||||||||
| Tennessee Housing Development Agency |
60,000 | 3.50 | 7/1/31 | 60,956 | ||||||||||||
| Wisconsin Housing & Economic Development Authority 8 |
655,000 | 3.50 | 3/1/46 | 690,973 | ||||||||||||
| Wisconsin Public Finance Authority (Statler Hilton) 6 |
500,000 | 3.50 | 12/15/27 | 377,555 | ||||||||||||
|
|
|
|||||||||||||||
| Total Taxable Municipal Bonds |
7,230,472 | |||||||||||||||
|
|
|
|||||||||||||||
| U.S. Treasury / Federal Agency Securities - 24.2% |
||||||||||||||||
| Federal Agency Issues - 0.9% |
||||||||||||||||
| Federal Agricultural Mortgage Corp., 3 Mo. Libor + 0.37% 1 |
250,000 | 0.61 | 3/9/23 | 251,638 | ||||||||||||
| U.S. Department of Housing and Urban Development |
690,000 | 4.28 | 8/1/27 | 691,697 | ||||||||||||
|
|
|
|||||||||||||||
| 943,335 | ||||||||||||||||
|
|
|
|||||||||||||||
| U.S. Treasury - 23.3% |
||||||||||||||||
| U.S. Treasury Bill 6 |
4,500,000 | 0.13 | 10/1/20 | 4,500,000 | ||||||||||||
| U.S. Treasury Floating Rate Note, 3 Mo. Libor + 0.05% 1 |
2,250,000 | 0.15 | 10/31/20 | 2,250,053 | ||||||||||||
| U.S. Treasury Inflation Indexed Bonds |
2,733,050 | 0.13 | 4/15/21 | 2,744,900 | ||||||||||||
| U.S. Treasury Inflation Indexed Bonds |
4,634,490 | 0.13 | 4/15/22 | 4,716,680 | ||||||||||||
| U.S. Treasury Inflation Indexed Bonds |
902,790 | 0.13 | 4/15/25 | 960,848 | ||||||||||||
| See accompanying notes to financial statements.
|
||
| SEPTEMBER 30, 2020 | 17 | |
|
|
| SCHEDULE OF INVESTMENTS (Unaudited) September 30, 2020
Sit Quality Income Fund (Continued) |
| Name of Issuer | Principal Amount($) |
Coupon Rate (%) |
Maturity Date |
Fair Value ($) |
||||||||||||
| U.S. Treasury Inflation Indexed Bonds |
2,874,000 | 0.63 | 7/15/21 | 2,915,931 | ||||||||||||
| U.S. Treasury Inflation Indexed Bonds |
1,564,680 | 0.63 | 4/15/23 | 1,637,169 | ||||||||||||
| U.S. Treasury Note |
4,000,000 | 2.00 | 2/28/21 | 4,031,250 | ||||||||||||
|
|
|
|||||||||||||||
| 23,756,831 | ||||||||||||||||
|
|
|
|||||||||||||||
| Total U.S. Treasury / Federal Agency Securities |
24,700,166 | |||||||||||||||
|
|
|
|||||||||||||||
| Short-Term Securities - 5.7% |
||||||||||||||||
| Fidelity Inst. Money Mkt. Gvt. Fund, 0.01% |
5,788,068 | 5,788,068 | ||||||||||||||
|
|
|
|||||||||||||||
| (cost: $5,788,068) |
||||||||||||||||
| Total Investments in Securities - 100.1% |
102,090,474 | |||||||||||||||
|
|
|
|||||||||||||||
| Other Assets and Liabilities, net - (0.1%) |
(106,964 | ) | ||||||||||||||
|
|
|
|||||||||||||||
| Total Net Assets - 100.0% |
$ | 101,983,510 | ||||||||||||||
|
|
|
|||||||||||||||
| 1 | Variable rate security. Rate disclosed is as of September 30, 2020. Certain variable rate securities are not based on a published reference rate and spread but are determined by the issuer or agent and are based on current market conditions, or, for mortgage-backed securities, are impacted by the individual mortgages which are paying off over time. These securities do not indicate a reference rate and spread in their descriptions. |
| 4 | 144A Restricted Security. The total value of such securities as of September 30, 2020 was $21,874,489 and represented 21.5% of net assets. These securities have been determined to be liquid by the Adviser in accordance with guidelines established by the Board of Directors. |
| 6 | Zero coupon or convertible capital appreciation bond, for which the rate disclosed is either the effective yield on purchase date or the coupon rate to be paid upon conversion to coupon paying. |
| 8 | Securities the income from which is treated as a tax preference that is included in alternative minimum taxable income for purposes of computing federal alternative minimum tax (AMT). At September 30, 2020, 0.7% of net assets in the Fund was invested in such securities. |
| 9 | Municipal Lease Security. The total value of such securities as of September 30, 2020 was $506,685 and represented 0.5% of net assets. These securities have been determined to be liquid by the Adviser in accordance with guidelines established by the Board of Directors. |
| 14 | Step Coupon: A bond that pays a coupon rate that increases on a specified date(s). Rate disclosed is as of September 30, 2020. |
| 17 | Security that is either an absolute and unconditional obligation of the United States Government or is collateralized by securities, loans, or leases guaranteed by the U.S. Government or its agencies or instrumentalities. |
Numeric footnotes not disclosed are not applicable to this Schedule of Investments.
| See accompanying notes to financial statements.
|
||
| 18 | SIT MUTUAL FUNDS SEMI-ANNUAL REPORT | |
|
|
|
|
Short futures contracts outstanding as of September 30, 2020 were as follows:
| Type | Contracts | Expiration Date |
Notional Amount ($) |
Value/ Unrealized Appreciation (Depreciation) ($) |
||||||||||||
| Short Futures: 10 |
||||||||||||||||
| U.S. Treasury 5-Year |
28 | December 2020 | (3,528,875) | (4,519) | ||||||||||||
| 10 | The amount of $50,000 in cash was segregated with the broker to cover margin requirements for derivative transactions as of September 30, 2020. |
A summary of the levels for the Fund’s investments as of September 30, 2020 is as follows (see Note 2 - significant accounting policies in the notes to financial statements):
| Investment in Securities | ||||||||||||||||
| Level 1 Quoted Price ($) |
Level 2 Other Significant Observable Inputs ($) |
Level 3 Other Significant Observable Inputs ($) |
Total ($) | |||||||||||||
| Assets |
||||||||||||||||
| Asset-Backed Securities |
— | 7,977,712 | — | 7,977,712 | ||||||||||||
| Collateralized Mortgage Obligations |
— | 14,147,732 | — | 14,147,732 | ||||||||||||
| Corporate Bonds |
— | 23,400,020 | — | 23,400,020 | ||||||||||||
| Mortgage Pass-Through Securities |
— | 18,846,304 | — | 18,846,304 | ||||||||||||
| Taxable Municipal Bonds |
— | 7,230,472 | — | 7,230,472 | ||||||||||||
| U.S. Treasury / Federal Agency Securities |
— | 24,700,166 | — | 24,700,166 | ||||||||||||
| Short-Term Securities |
5,788,068 | — | — | 5,788,068 | ||||||||||||
| 5,788,068 | 96,302,406 | — | 102,090,474 | |||||||||||||
| Liabilities |
||||||||||||||||
| Futures |
(4,519 | ) | — | — | (4,519 | ) | ||||||||||
There were no transfers into or out of level 3 during the reporting period.
| See accompanying notes to financial statements.
|
||
| SEPTEMBER 30, 2020 | 19 | |
|
|
OBJECTIVE & STRATEGY
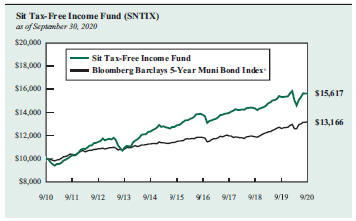
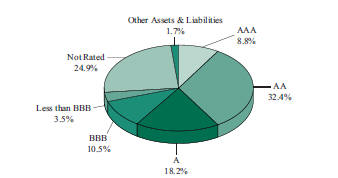
The objective of the Tax-Free Income Fund is to provide a high level of current income that is exempt from federal income tax, consistent with preservation of capital, by investing primarily in investment-grade municipal securities.
Such municipal securities generate interest income that is exempt from both federal regular income tax and federal alternative minimum tax. During normal market conditions, the Fund invests 100% of its net assets in such tax-exempt municipal securities.
| 20 | SIT MUTUAL FUNDS SEMI-ANNUAL REPORT | |
|
|
| SEPTEMBER 30, 2020 | 21 | |
|
|
| SCHEDULE OF INVESTMENTS (Unaudited) September 30, 2020
Sit Tax-Free Income Fund |
| Name of Issuer | Principal Amount ($) |
Coupon Rate (%) |
Maturity Date |
Fair Value ($) | |||||||||||||||||||||
| Municipal Bonds - 93.0% |
|||||||||||||||||||||||||
| Alabama - 0.5% |
|||||||||||||||||||||||||
| Clio Water & Sewer Rev. (AGM Insured) |
340,000 | 3.10 | 1/1/33 | 340,707 | |||||||||||||||||||||
| Mobile Co. Limited Obligation Warrants Rev. (Gomesa Proj.) 4 |
500,000 | 4.00 | 11/1/45 | 499,975 | |||||||||||||||||||||
| Pell City Special Care Facs. Finance Auth.Rev. (Noland Health Services, Inc.) |
500,000 | 5.00 | 12/1/31 | 520,265 | |||||||||||||||||||||
| Russell Co. Board of Education Rev. |
345,000 | 3.05 | 12/1/34 | 345,276 | |||||||||||||||||||||
|
|
|
||||||||||||||||||||||||
| 1,706,223 | |||||||||||||||||||||||||
|
|
|
||||||||||||||||||||||||
| Alaska - 0.6% |
|||||||||||||||||||||||||
| AK Hsg. Finance Corp. Mtg.Rev. |
775,000 | 3.75 | 12/1/40 | 838,558 | |||||||||||||||||||||
| AK Hsg. Finance Corp. Rev. (State Capital Proj.) |
500,000 | 4.00 | 6/1/36 | 553,810 | |||||||||||||||||||||
| AK Industrial Dev. & Export Auth. Rev. (Boys & Girls Home) 2, 5, 15 |
250,000 | 5.50 | N/A | 12,500 | |||||||||||||||||||||
| AK Industrial Dev. & Export Auth. Rev. (GTR Fairbanks Community Hospital Foundation) |
250,000 | 5.00 | 4/1/33 | 269,783 | |||||||||||||||||||||
| AK Industrial Dev. & Export Auth. Rev. (Tanana Chiefs Conference Proj.) |
300,000 | 4.00 | 10/1/49 | 333,768 | |||||||||||||||||||||
|
|
|
||||||||||||||||||||||||
| 2,008,419 | |||||||||||||||||||||||||
|
|
|
||||||||||||||||||||||||
| Arizona - 3.2% |
|||||||||||||||||||||||||
| AZ Health Facs. Auth. Rev. (Scottsdale Lincoln Hospital Proj.) 1 |
250,000 | 4.00 | 12/1/39 | 250,238 | |||||||||||||||||||||
| AZ Industrial Dev. Auth. Rev. (Bridgewater Avondale Proj.) |
500,000 | 5.38 | 1/1/38 | 472,815 | |||||||||||||||||||||
| AZ Industrial Dev. Auth. Rev. (Legacy Cares, Inc. Proj.) 4 |
750,000 | 6.75 | 7/1/30 | 751,913 | |||||||||||||||||||||
| AZ Industrial Dev. Auth. Rev. (Legacy Cares, Inc. Proj.) 4 |
750,000 | 7.75 | 7/1/50 | 754,950 | |||||||||||||||||||||
| AZ Industrial Dev. Auth. Rev. (Pinecrest Academy Horizon) 4 |
500,000 | 5.75 | 7/15/38 | 554,015 | |||||||||||||||||||||
| AZ Industrial Dev. Auth. Rev. (Social Bond Equitable School Revolving Fund) |
500,000 | 4.00 | 11/1/45 | 566,360 | |||||||||||||||||||||
| Glendale Industrial Dev. & Auth. Rev. (Beatitudes Campus Proj.) |
300,000 | 5.00 | 11/15/36 | 315,378 | |||||||||||||||||||||
| Glendale Industrial Dev. & Auth. Rev. (Glencroft Retirement Community) |
400,000 | 5.00 | 11/15/36 | 390,464 | |||||||||||||||||||||
| La Paz Co. Industrial Dev. Auth. (Charter School Solutions Harmony Public Proj.) |
750,000 | 5.00 | 2/15/48 | 821,445 | |||||||||||||||||||||
| Maricopa Co. Industrial Dev. Auth. Education Rev. (Horizon Community Learning Center) |
300,000 | 5.00 | 7/1/35 | 312,588 | |||||||||||||||||||||
| Maricopa Co. Industrial Dev. Auth. Rev. (Christian Care Surprise, Inc.) 4 |
250,000 | 5.75 | 1/1/36 | 252,322 | |||||||||||||||||||||
| Maricopa Co. Industrial Dev. Auth. Rev. (Paradise School Proj.) |
1,000,000 | 4.00 | 7/1/54 | 1,105,760 | |||||||||||||||||||||
| Peoria Industrial Dev. Auth. Rev. (Sierra Winds Life Care Community) |
400,000 | 5.25 | 11/15/29 | 384,012 | |||||||||||||||||||||
| Phoenix City Industrial Dev. Auth. Rev. (Northwest Christian School Proj.) 4 |
600,000 | 5.00 | 9/1/45 | 626,688 | |||||||||||||||||||||
| Phoenix City Industrial Dev. Auth. Rev. (Vista College Preparatory Proj.) |
400,000 | 4.13 | 7/1/38 | 445,140 | |||||||||||||||||||||
| Pima Co. Industrial Dev. Auth. Education Rev. (American Leadership Academy Proj.) 4 |
1,000,000 | 5.38 | 6/15/35 | 1,061,870 | |||||||||||||||||||||
| Pima Co. Industrial Dev. Auth. Education Rev. (American Leadership Academy Proj.) 4 |
370,000 | 4.75 | 6/15/37 | 373,348 | |||||||||||||||||||||
| Quechan Indian Tribe of Fort Yuma Rev. (Tribal Economic Dev.) |
325,000 | 9.75 | 5/1/25 | 342,686 | |||||||||||||||||||||
| Tempe Industrial Dev. Auth. Rev. (Mirabella at ASU Proj.) 4 |
500,000 | 4.70 | 10/1/24 | 501,240 | |||||||||||||||||||||
|
|
|
||||||||||||||||||||||||
| 10,283,232 | |||||||||||||||||||||||||
|
|
|
||||||||||||||||||||||||
| Arkansas - 0.7% |
|||||||||||||||||||||||||
| Clarksville School District No. 17 of Johnson Co. G.O. |
500,000 | 2.70 | 12/1/24 | 500,725 | |||||||||||||||||||||
| Rogers City Rev. |
1,000,000 | 3.88 | 11/1/39 | 1,097,410 | |||||||||||||||||||||
| Springdale City Sales & Use Tax Rev. Ref. (BAM Insured) |
500,000 | 3.60 | 4/1/41 | 515,160 | |||||||||||||||||||||
|
|
|
||||||||||||||||||||||||
| 2,113,295 | |||||||||||||||||||||||||
|
|
|
||||||||||||||||||||||||
| California - 4.8% |
|||||||||||||||||||||||||
| CA School Facs. Finance Auth. Rev. (Azusa Unified School District) (AGM Insured) 6 |
500,000 | 6.00 | 8/1/29 | 646,895 | |||||||||||||||||||||
| CA State G.O. |
500,000 | 4.00 | 12/1/40 | 539,125 | |||||||||||||||||||||
| Carlsbad Unified School District G.O. Capital Appreciation 6 |
400,000 | 6.00 | 8/1/31 | 545,624 | |||||||||||||||||||||
| Colton Joint Unified School District G.O. (AGM Insured) 6 |
1,000,000 | 6.00 | 8/1/35 | 1,199,840 | |||||||||||||||||||||
| Encinitas Union School District G.O. Capital Appreciation 6 |
500,000 | 7.00 | 8/1/35 | 700,960 | |||||||||||||||||||||
| Hartnell Community College G.O. 6 |
500,000 | 7.00 | 8/1/34 | 614,835 | |||||||||||||||||||||
| Healdsburg Unified School District G.O. 6 |
1,250,000 | 5.00 | 8/1/37 | 1,334,762 | |||||||||||||||||||||
| Imperial Community College District G.O. Capital Appreciation (AGM Insured) 6 |
250,000 | 6.75 | 8/1/40 | 325,315 | |||||||||||||||||||||
| Los Alamitos Unified School District Capital Appreciation C.O.P. 6 |
1,100,000 | 6.00 | 8/1/34 | 1,250,062 | |||||||||||||||||||||
| See accompanying notes to financial statements.
|
||
| 22 | SIT MUTUAL FUNDS SEMI-ANNUAL REPORT | |
|
|
|
|
| Name of Issuer | Principal Amount ($) |
Coupon Rate (%) |
Maturity Date |
Fair Value ($) | |||||||||||||||||||||
| Martinez Unified School District G.O. 6 |
250,000 | 6.13 | 8/1/35 | 306,172 | |||||||||||||||||||||
| Orange Co. Community Facs. District No. 2017-1 Special Assessment (Village of Esencia) |
500,000 | 4.00 | 8/15/45 | 538,575 | |||||||||||||||||||||
| Placentia-Yorba Linda Unified School District C.O.P. Capital Appreciation (AGM Insured) 6 |
500,000 | 6.25 | 10/1/28 | 527,785 | |||||||||||||||||||||
| Redondo Beach School District G.O. 6 |
600,000 | 6.38 | 8/1/34 | 783,078 | |||||||||||||||||||||
| Reef-Sunset Unified School District (BAM Insured) 6 |
750,000 | 5.00 | 8/1/38 | 835,222 | |||||||||||||||||||||
| Ripon Unified School District G.O. (BAM Insured) 6 |
270,000 | 4.50 | 8/1/30 | 300,802 | |||||||||||||||||||||
| Ripon Unified School District G.O. (BAM Insured) 6 |
80,000 | 4.50 | 8/1/30 | 88,398 | |||||||||||||||||||||
| Sacramento Co. Water Financing Auth. Rev. (NATL-RE FGIC Insured) 1 |
500,000 | 0.74 | 6/1/39 | 407,030 | |||||||||||||||||||||
| San Jose Financing Auth. Rev. (Civic Center Garage Proj.) 9 |
400,000 | 5.00 | 6/1/39 | 436,196 | |||||||||||||||||||||
| South Tahoe Joint Powers Financing Auth. Tax Allocation Ref. (South Tahoe Redev. Proj.) (AGM Insured) |
500,000 | 5.00 | 10/1/30 | 575,425 | |||||||||||||||||||||
| Sulphur Springs Union School District C.O.P. (AGM Insured) 6 |
450,000 | 6.50 | 12/1/37 | 571,401 | |||||||||||||||||||||
| Tracy Joint Unified School District G.O. Capital Appreciation 6 |
600,000 | 7.00 | 8/1/41 | 647,154 | |||||||||||||||||||||
| Tustin Unified School District G.O. Capital Appreciation 6 |
500,000 | 6.00 | 8/1/28 | 524,050 | |||||||||||||||||||||
| Upland Unified School District G.O. Capital Appreciation 6 |
1,000,000 | 7.00 | 8/1/41 | 1,298,160 | |||||||||||||||||||||
| Val Verde Unified School District G.O. Capital Appreciation (AGM Insured) 6 |
500,000 | 6.00 | 8/1/34 | 664,605 | |||||||||||||||||||||
|
|
|
||||||||||||||||||||||||
| 15,661,471 | |||||||||||||||||||||||||
|
|
|
||||||||||||||||||||||||
| Colorado - 5.8% |
|||||||||||||||||||||||||
| Aerotropolis Regional Transportation Auth. Rev. |
400,000 | 5.00 | 12/1/51 | 407,832 | |||||||||||||||||||||
| Broadway Station Metropolitan District No. 2 G.O. |
750,000 | 5.13 | 12/1/48 | 777,863 | |||||||||||||||||||||
| Broadway Station Metropolitan District No. 3 G.O. |
500,000 | 5.00 | 12/1/49 | 516,705 | |||||||||||||||||||||
| Buffalo Highlands Metropolitan District G.O. |
350,000 | 5.25 | 12/1/38 | 360,430 | |||||||||||||||||||||
| CO Educational & Cultural Facs. Auth. Rev. (CO Springs Charter Academy Proj.) |
250,000 | 5.60 | 7/1/34 | 250,923 | |||||||||||||||||||||
| CO Educational & Cultural Facs. Auth. Rev. Ref. (Windsor Charter Academy) 4 |
800,000 | 5.00 | 9/1/36 | 802,728 | |||||||||||||||||||||
| CO Health Facs. Auth. Rev. (Covenant Retirement Community) |
650,000 | 5.00 | 12/1/48 | 740,974 | |||||||||||||||||||||
| CO Health Facs. Auth. Rev. (Park View Medical Center, Inc. Proj.) |
500,000 | 4.00 | 9/1/45 | 545,830 | |||||||||||||||||||||
| CO Science and Technology Park Metropolitan District No. 1 Rev. |
500,000 | 5.00 | 12/1/33 | 518,685 | |||||||||||||||||||||
| Copper Ridge Metropolitan District Rev. |
350,000 | 5.00 | 12/1/43 | 326,778 | |||||||||||||||||||||
| Copperleaf Metro District No. 2 G.O. |
500,000 | 5.75 | 12/1/45 | 514,640 | |||||||||||||||||||||
| Copperleaf Metro District No. 4 G.O. |
750,000 | 5.00 | 12/1/49 | 759,435 | |||||||||||||||||||||
| Creekwalk Marketplace Business Improvement District Rev. 4 |
500,000 | 5.50 | 12/1/39 | 511,625 | |||||||||||||||||||||
| Crystal Crossing Metro District G.O. |
500,000 | 5.25 | 12/1/40 | 516,075 | |||||||||||||||||||||
| Denver 9th Avenue Metropolitan District No. 2 G.O. |
500,000 | 5.00 | 12/1/48 | 517,980 | |||||||||||||||||||||
| Denver Urban Renewal Auth. Tax Allocation 4 |
500,000 | 5.25 | 12/1/39 | 514,535 | |||||||||||||||||||||
| DIATC Metropolitan District G.O. 4 |
500,000 | 5.00 | 12/1/49 | 511,415 | |||||||||||||||||||||
| Green Valley Ranch East Metropolitan District No. 6 G.O. |
1,000,000 | 5.88 | 12/1/50 | 1,035,400 | |||||||||||||||||||||
| Haskins Station Metropolitan District G.O. |
500,000 | 5.00 | 12/1/49 | 504,150 | |||||||||||||||||||||
| Hunters Overlook Metropolitan District No. 5 G.O. |
500,000 | 5.00 | 12/1/49 | 515,595 | |||||||||||||||||||||
| Iron Mountain Metropolitan District No. 2 G.O. |
635,000 | 5.00 | 12/1/39 | 651,821 | |||||||||||||||||||||
| Johnstown Village Metropolitan District No. 2. G.O. |
500,000 | 5.00 | 12/1/50 | 503,715 | |||||||||||||||||||||
| Lambertson Farms Metro District No. 1 G.O. |
500,000 | 5.00 | 12/15/25 | 449,295 | |||||||||||||||||||||
| Leyden Rock Metropolitan District No. 10 G.O. |
250,000 | 5.00 | 12/1/45 | 256,798 | |||||||||||||||||||||
| Mirabelle Metropolitan Dist. No. 2 G.O. |
500,000 | 5.00 | 12/1/49 | 505,225 | |||||||||||||||||||||
| North Range Village Metropolitan District, G.O. (AGC Insured) |
565,000 | 4.25 | 12/1/26 | 566,695 | |||||||||||||||||||||
| Painted Prairie Public Improvement Auth. Rev. |
500,000 | 5.00 | 12/1/39 | 527,345 | |||||||||||||||||||||
| Palisade Metropolitan District No. 2 G.O. |
500,000 | 5.00 | 12/1/46 | 507,850 | |||||||||||||||||||||
| St. Vrain Lakes Metropolitan District No. 2 G.O. |
500,000 | 5.00 | 12/1/37 | 512,790 | |||||||||||||||||||||
| STC Metropolitan District No. 2 G.O. |
500,000 | 5.00 | 12/1/49 | 507,160 | |||||||||||||||||||||
| Tallman Gulch Metropolitan District G.O. |
500,000 | 5.25 | 12/1/47 | 511,525 | |||||||||||||||||||||
| Thompson Crossing Metropolitan District No. 4 G.O. |
500,000 | 5.00 | 12/1/49 | 510,820 | |||||||||||||||||||||
| Vauxmont Metropolitan District G.O. (AGM Insured) |
500,000 | 3.25 | 12/15/50 | 532,800 | |||||||||||||||||||||
| Velocity Metropolitan District No. 3 G.O. |
500,000 | 5.38 | 12/1/39 | 521,405 | |||||||||||||||||||||
| Wild Plum Metropolitan District G.O. |
595,000 | 5.00 | 12/1/49 | 626,035 | |||||||||||||||||||||
|
|
|
||||||||||||||||||||||||
| 18,840,877 | |||||||||||||||||||||||||
|
|
|
||||||||||||||||||||||||
| See accompanying notes to financial statements.
|
||
| SEPTEMBER 30, 2020 | 23 | |
|
|
| SCHEDULE OF INVESTMENTS (Unaudited) September 30, 2020
Sit Tax-Free Income Fund (Continued) |
| Name of Issuer | Principal Amount ($) |
Coupon Rate (%) |
Maturity Date |
Fair Value ($) | |||||||||||||||||||||
| Connecticut - 1.0% |
|||||||||||||||||||||||||
| CT Health & Educational Facs. Auth. Rev. 4 |
250,000 | 3.25 | 1/1/27 | 251,555 | |||||||||||||||||||||
| CT Health & Educational Facs. Auth. Rev. 4 |
250,000 | 5.00 | 1/1/55 | 262,985 | |||||||||||||||||||||
| CT Hsg. Finance Auth. Rev. |
550,000 | 3.88 | 11/15/35 | 606,287 | |||||||||||||||||||||
| CT Hsg. Finance Auth. Rev. 9 |
505,000 | 4.25 | 6/15/43 | 570,216 | |||||||||||||||||||||
| CT Hsg. Finance Auth. Rev. |
1,000,000 | 3.85 | 5/15/45 | 1,035,510 | |||||||||||||||||||||
| CT Hsg. Finance Auth. Rev. 9 |
455,000 | 4.30 | 6/15/48 | 511,561 | |||||||||||||||||||||
|
|
|
||||||||||||||||||||||||
| 3,238,114 | |||||||||||||||||||||||||
|
|
|
||||||||||||||||||||||||
| District of Columbia - 0.4% |
|||||||||||||||||||||||||
| District of Columbia Hsg. Finance Agency Rev. (Multi-Family Dev. Program) |
600,000 | 4.05 | 9/1/43 | 661,956 | |||||||||||||||||||||
| District of Columbia Rev. (Ingleside Rock Creek Proj.) |
500,000 | 5.00 | 7/1/37 | 485,605 | |||||||||||||||||||||
|
|
|
||||||||||||||||||||||||
| 1,147,561 | |||||||||||||||||||||||||
|
|
|
||||||||||||||||||||||||
| Florida - 11.0% |
|||||||||||||||||||||||||
| Alachua Co. Health Facs. Auth. Rev. (Oak Hammock University) |
385,000 | 8.00 | 10/1/32 | 424,928 | |||||||||||||||||||||
| Alta Lakes Community Dev. District Special Assessment |
500,000 | 4.40 | 5/1/39 | 524,615 | |||||||||||||||||||||
| Ave Maria Stewardship Community District Special Assessment. (AGM Insured) |
295,000 | 3.00 | 5/1/38 | 318,989 | |||||||||||||||||||||
| Bay Co. Educational Facs. Rev. (Bay Haven Charter) |
400,000 | 5.25 | 9/1/30 | 401,072 | |||||||||||||||||||||
| Blackburn Creek Community Dev. District Special Assessment (Grand Palm Proj.) |
200,000 | 6.25 | 5/1/35 | 222,380 | |||||||||||||||||||||
| Capital Trust Agency Rev. (Elim Senior Housing, Inc.) 4 |
250,000 | 5.00 | 8/1/27 | 224,070 | |||||||||||||||||||||
| Capital Trust Agency Rev. (Elim Senior Housing, Inc.) 4 |
250,000 | 5.38 | 8/1/32 | 211,748 | |||||||||||||||||||||
| Capital Trust Agency Rev. (River City Educational Services, Inc. Proj.) |
500,000 | 5.38 | 2/1/35 | 517,010 | |||||||||||||||||||||
| Capital Trust Agency Rev. (River City Educational Services, Inc. Proj.) |
300,000 | 5.63 | 2/1/45 | 308,844 | |||||||||||||||||||||
| Capital Trust Agency Rev. (Tallahassee Tapestry) 2, 4, 5 |
550,000 | 6.75 | 12/1/35 | 302,500 | |||||||||||||||||||||
| Capital Trust Agency Rev. (Tapestry Walden Senior Hsg. Proj.) 2, 4, 5 |
250,000 | 6.75 | 7/1/37 | 150,000 | |||||||||||||||||||||
| Capital Trust Agency Rev. (Tuscan Gardens Senior Living Center) |
250,000 | 7.00 | 4/1/35 | 172,100 | |||||||||||||||||||||
| Capital Trust Agency Rev. (University Bridge LLC Student Housing Proj.) 4 |
500,000 | 5.25 | 12/1/43 | 499,375 | |||||||||||||||||||||
| Celebration Pointe Community Dev. District Special Assessment Rev. 4 |
240,000 | 5.00 | 5/1/32 | 256,817 | |||||||||||||||||||||
| Collier Co. Industrial Dev. Auth. Rev. (Arlington of Naples Proj.) 4, 5 |
250,000 | 7.25 | 5/15/26 | 193,438 | |||||||||||||||||||||
| Collier Co. Industrial Dev. Auth. Rev. (Arlington of Naples Proj.) 4, 5 |
750,000 | 8.13 | 5/15/44 | 580,313 | |||||||||||||||||||||
| Collier Co. Industrial Dev. Auth. Rev. (NCH Healthcare System Proj.) |
415,000 | 6.25 | 10/1/39 | 423,549 | |||||||||||||||||||||
| Dowden West Community Dev. District Special Assessment 4 |
360,000 | 5.40 | 5/1/39 | 399,924 | |||||||||||||||||||||
| Durbin Crossing Community Dev. District Special Assessment (AGM Insured) |
520,000 | 5.00 | 5/1/32 | 643,812 | |||||||||||||||||||||
| Escambia Co. Housing Finance Auth. Rev. (Multi-County Program) |
965,000 | 3.75 | 10/1/49 | 1,038,919 | |||||||||||||||||||||
| Fishhawk Ranch Community Dev. District Special Assessment (AGM Insured) |
500,000 | 3.00 | 11/1/41 | 495,185 | |||||||||||||||||||||
| FL Dev. Finance Corp. Rev. (Discovery High School Proj.) 4 |
500,000 | 5.00 | 6/1/40 | 517,380 | |||||||||||||||||||||
| FL Hsg. Finance Corp. (GNMA/FNMA/FHLMC Collateralized) |
980,000 | 4.20 | 1/1/45 | 1,093,121 | |||||||||||||||||||||
| FL Hsg. Finance Corp. (GNMA/FNMA/FHLMC Collateralized) |
500,000 | 3.30 | 7/1/49 | 529,665 | |||||||||||||||||||||
| FL Hsg. Finance Corp. (GNMA/FNMA/FHLMC Collateralized) |
1,000,000 | 2.75 | 7/1/50 | 1,023,660 | |||||||||||||||||||||
| FL State Department of Education |
1,000,000 | 4.38 | 7/1/30 | 1,013,410 | |||||||||||||||||||||
| FRERC Community Dev. District Special Assessment |
1,000,000 | 5.38 | 11/1/40 | 1,018,290 | |||||||||||||||||||||
| Gramercy Farms Community Dev. District Special Assessment 6 |
415,000 | 3.20 | 5/1/39 | 228,250 | |||||||||||||||||||||
| Harbor Bay Community Dev. District Special Assessment |
350,000 | 4.10 | 5/1/48 | 365,124 | |||||||||||||||||||||
| Heritage Harbour North Community Dev. District Special Assessment |
200,000 | 5.00 | 5/1/34 | 225,598 | |||||||||||||||||||||
| Lake Co. Educational Project. Rev. (Imagine South Lake Charter School Proj.) 4 |
550,000 | 5.00 | 1/15/39 | 581,185 | |||||||||||||||||||||
| Lake Co. Retirement Project. Rev. (Lakeside at Waterman Village Proj.) |
500,000 | 5.75 | 8/15/50 | 510,135 | |||||||||||||||||||||
| Lakewood Ranch Stewardship District Cap. Improvement Special Assesment Rev. (Azario Proj.) |
520,000 | 3.75 | 5/1/40 | 522,907 | |||||||||||||||||||||
| Lakewood Ranch Stewardship District Cap. Improvement Special Assesment Rev. (Azario Proj.) |
580,000 | 4.00 | 5/1/40 | 597,261 | |||||||||||||||||||||
| Lakewood Ranch Stewardship District Cap. Improvement Special Assesment Rev. (Lorraine Lakes Proj.) 4 |
500,000 | 3.63 | 5/1/40 | 498,945 | |||||||||||||||||||||
| See accompanying notes to financial statements.
|
||
| 24 | SIT MUTUAL FUNDS SEMI-ANNUAL REPORT | |
|
|
|
|
| Name of Issuer | Principal Amount ($) |
Coupon Rate (%) |
Maturity Date |
Fair Value ($) | |||||||||||||||||||||
| Lakewood Ranch Stewardship District Cap. Improvement Special Assesment Rev. (NE Sector Proj.) |
435,000 | 3.85 | 5/1/39 | 441,351 | |||||||||||||||||||||
| Lakewood Ranch Stewardship District Cap. Improvement Special Assessment Rev. |
155,000 | 4.25 | 5/1/25 | 160,529 | |||||||||||||||||||||
| Lakewood Ranch Stewardship District Cap. Improvement Special Assessment Rev. (Country Club East Proj.) |
145,000 | 6.70 | 5/1/33 | 155,091 | |||||||||||||||||||||
| Lakewood Ranch Stewardship District Cap. Improvement Special Assessment Rev. (Lakewood Center) |
200,000 | 7.40 | 5/1/30 | 208,314 | |||||||||||||||||||||
| Lakewood Ranch Stewardship District Cap. Improvement Special Assessment Rev. (Lakewood National) |
300,000 | 5.25 | 5/1/37 | 327,846 | |||||||||||||||||||||
| Lakewood Ranch Stewardship District Cap. Improvement Special Assessment Rev. (Lakewood Ranch) |
400,000 | 5.00 | 5/1/36 | 430,220 | |||||||||||||||||||||
| Lakewood Ranch Stewardship District Cap. Improvement Special Assessment Rev. (NE Sector Proj.) |
300,000 | 5.00 | 5/1/38 | 319,626 | |||||||||||||||||||||
| Lakewood Ranch Stewardship District Cap. Improvement Special Assessment Rev. (NE Sector Proj.) |
550,000 | 5.30 | 5/1/39 | 600,644 | |||||||||||||||||||||
| Lakewood Ranch Stewardship District Cap. Improvement Special Assessment Rev. (Webb Proj.) 4 |
320,000 | 5.00 | 5/1/37 | 343,126 | |||||||||||||||||||||
| Lakewood Ranch Stewardship District Special Assessment (Lake Club Phase 4 Proj.) |
490,000 | 4.50 | 5/1/49 | 514,524 | |||||||||||||||||||||
| Lexington Oaks Community Dev. District Special Assessment Rev. |
235,000 | 5.65 | 5/1/33 | 240,870 | |||||||||||||||||||||
| Live Oak No. 2 Community Dev. District Special Assessment |
400,000 | 4.00 | 5/1/35 | 427,768 | |||||||||||||||||||||
| Long Lake Ranch Community Dev. District Special Assessment |
35,000 | 5.63 | 5/1/24 | 36,211 | |||||||||||||||||||||
| LT Ranch Community Dev. District Special Assessment |
500,000 | 4.00 | 5/1/40 | 512,810 | |||||||||||||||||||||
| Magnolia Creek Community Dev. District Rev. 2, 5, 15 |
250,000 | 5.60 | N/A | 45,000 | |||||||||||||||||||||
| Marshall Creek Community Dev. District Cap. Improvement Special Assessment Rev. |
250,000 | 5.00 | 5/1/32 | 261,350 | |||||||||||||||||||||
| Miami-Dade Co. Transit Sales Tax Rev. |
500,000 | 5.00 | 7/1/34 | 588,190 | |||||||||||||||||||||
| New River Community Dev. District Cap. Improvement Special Assessment Rev. 2, 5, 15 |
230,000 | 5.00 | N/A | 2 | |||||||||||||||||||||
| Northern Palm Beach Co. Improvement District Special Assessment |
500,000 | 5.00 | 8/1/29 | 540,860 | |||||||||||||||||||||
| Northern Palm Beach Co. Improvement District Special Assessment |
250,000 | 5.00 | 8/1/37 | 277,490 | |||||||||||||||||||||
| Orange Co. Health Facs. Auth. Rev. (Presbyterian Retirement Community Proj.) |
550,000 | 5.00 | 8/1/34 | 604,769 | |||||||||||||||||||||
| Orange Co. Health Facs. Auth. Rev. (Presbyterian Retirement Community Proj.) |
500,000 | 5.00 | 8/1/35 | 560,885 | |||||||||||||||||||||
| Orange Co. Health Facs. Auth. Rev. (Presbyterian Retirement Community Proj.) |
250,000 | 5.00 | 8/1/41 | 273,525 | |||||||||||||||||||||
| Orange Co. Hsg. Finance Auth. Rev. (GNMA/FNMA/FHLMC Collateralized) |
330,000 | 3.95 | 3/1/40 | 349,252 | |||||||||||||||||||||
| Orange Co. Hsg. Finance Auth. Rev. (GNMA/FNMA/FHLMC Collateralized) |
345,000 | 4.00 | 9/1/48 | 381,715 | |||||||||||||||||||||
| Orlando Tourist Dev. Rev. (Senior Lien Tourist Dev.) (AGM Insured) |
250,000 | 5.00 | 11/1/38 | 296,622 | |||||||||||||||||||||
| Palm Beach Co. Health Facs. Auth. Rev. (ACTS Retirement-Life Community, Inc.) |
500,000 | 5.00 | 11/15/32 | 584,415 | |||||||||||||||||||||
| Palm Beach Co. Health Facs. Auth. Rev. (Lifespace Communities, Inc.) |
500,000 | 4.00 | 5/15/53 | 481,450 | |||||||||||||||||||||
| Palm Beach Co. Health Facs. Auth. Rev. (Sinai Residences Boca Raton Proj.) |
600,000 | 7.25 | 6/1/34 | 656,820 | |||||||||||||||||||||
| Palm Beach Co. Health Facs. Auth. Rev. (Sinai Residences Boca Raton Proj.) |
690,000 | 7.50 | 6/1/49 | 755,143 | |||||||||||||||||||||
| Palm Beach Co. Health Facs. Auth. Rev. (Toby & Leon Cooperman Sinai Residences of Boca Raton) |
500,000 | 5.00 | 6/1/55 | 516,350 | |||||||||||||||||||||
| Parker Road Community Dev. Dist. Special Assessment |
500,000 | 4.10 | 5/1/50 | 504,320 | |||||||||||||||||||||
| Pinellas Co. Industrial Dev. Auth. Rev. |
500,000 | 5.00 | 7/1/39 | 560,470 | |||||||||||||||||||||
| Seven Oaks Community Dev. District Special Assessment Rev |
250,000 | 5.50 | 5/1/33 | 256,985 | |||||||||||||||||||||
| Southern Groves Community Dev. District No. 5 Special Assessment |
500,000 | 4.00 | 5/1/30 | 519,050 | |||||||||||||||||||||
| Southern Groves Community Dev. District No. 5 Special Assessment |
500,000 | 4.00 | 5/1/43 | 512,040 | |||||||||||||||||||||
| St. Johns Co. Industrial Dev. Auth. Rev. (Presbyterian Retirement Communities Obligated Group Proj.) |
1,000,000 | 4.00 | 8/1/55 | 1,067,130 | |||||||||||||||||||||
| Tolomato Community Dev. District Special Assessment |
500,000 | 4.25 | 5/1/37 | 538,800 | |||||||||||||||||||||
| Tolomato Community Dev. District Special Assessment 2, 5 |
120,000 | 6.61 | 5/1/40 | 1 | |||||||||||||||||||||
| Tolomato Community Dev. District Special Assessment 6 |
185,000 | 7.00 | 5/1/40 | 167,297 | |||||||||||||||||||||
| Tolomato Community Dev. District Special Assessment 6 |
110,000 | 7.00 | 5/1/40 | 76,770 | |||||||||||||||||||||
| Tolomato Community Dev. District Special Assessment 6 |
45,000 | 7.00 | 5/1/40 | 35,244 | |||||||||||||||||||||
| Tolomato Community Dev. District Special Assessment (AGM Insured) |
500,000 | 3.75 | 5/1/40 | 560,280 | |||||||||||||||||||||
| Trout Creek Community Dev. District Special Assessment |
300,000 | 5.38 | 5/1/38 | 329,151 | |||||||||||||||||||||
| University Park Recreation District Special Assessment (BAM Insured) |
750,000 | 3.50 | 5/1/50 | 826,110 | |||||||||||||||||||||
| Waters Edge Community Dev. District Cap. Improvement Rev. |
9,000 | 5.35 | 5/1/39 | 9,004 | |||||||||||||||||||||
| Waters Edge Community Dev. District Cap. Improvement Rev. 6 |
125,000 | 6.60 | 5/1/39 | 126,219 | |||||||||||||||||||||
| Wiregrass Community Dev. District Special Assessment |
245,000 | 5.38 | 5/1/35 | 262,258 | |||||||||||||||||||||
| Zephyr Ridge Community Dev. District Special Assessment 2, 5, 15 |
450,000 | 5.25 | N/A | 198,000 | |||||||||||||||||||||
|
|
|
||||||||||||||||||||||||
| 35,476,416 | |||||||||||||||||||||||||
|
|
|
||||||||||||||||||||||||
| See accompanying notes to financial statements.
|
||
| SEPTEMBER 30, 2020 | 25 | |
|
|
| SCHEDULE OF INVESTMENTS (Unaudited) September 30, 2020
Sit Tax-Free Income Fund (Continued) |
| Name of Issuer | Principal Amount ($) |
Coupon Rate (%) |
Maturity Date |
Fair Value ($) | |||||||||||||||||||||
| Georgia - 3.0% |
|||||||||||||||||||||||||
| Clarke Co. Hospital Auth. Rev. (Piedmont Healthcare) |
350,000 | 5.00 | 7/1/46 | 401,433 | |||||||||||||||||||||
| Cobb Co. Dev. Auth. Rev. (Presbyterian Village Proj.) 4 |
650,000 | 5.00 | 12/1/39 | 644,417 | |||||||||||||||||||||
| Fulton Co. Dev. Auth. Rev. (Woodruff Arts Center) |
500,000 | 5.00 | 3/15/44 | 563,175 | |||||||||||||||||||||
| GA Housing & Finance Authority Rev. |
1,280,000 | 3.80 | 12/1/37 | 1,321,984 | |||||||||||||||||||||
| GA Housing & Finance Authority Rev. |
1,000,000 | 4.00 | 12/1/37 | 1,020,110 | |||||||||||||||||||||
| GA Housing & Finance Authority Rev. |
465,000 | 3.85 | 12/1/38 | 508,384 | |||||||||||||||||||||
| GA Housing & Finance Authority Rev. |
185,000 | 4.00 | 12/1/39 | 197,077 | |||||||||||||||||||||
| GA Housing & Finance Authority Rev. |
650,000 | 3.80 | 12/1/40 | 691,093 | |||||||||||||||||||||
| GA Housing & Finance Authority Rev. |
605,000 | 3.85 | 12/1/41 | 623,307 | |||||||||||||||||||||
| GA Housing & Finance Authority Rev. |
990,000 | 3.50 | 12/1/46 | 1,035,382 | |||||||||||||||||||||
| GA Housing & Finance Authority Rev. |
600,000 | 4.00 | 12/1/48 | 644,184 | |||||||||||||||||||||
| GA Housing & Finance Authority Rev. |
600,000 | 4.20 | 12/1/48 | 663,546 | |||||||||||||||||||||
| GA Tax Allocation (Beltline Proj.) |
500,000 | 5.00 | 1/1/30 | 501,825 | |||||||||||||||||||||
| Gainesville Hospital Auth. Rev. (Northeast Georgia Health System, Inc. Proj.) |
500,000 | 5.00 | 2/15/37 | 592,490 | |||||||||||||||||||||
| Glynn-Brunswick Memorial Hospital Auth. Rev. (Southeast Georgia Health System Proj.) |
350,000 | 5.00 | 8/1/47 | 398,622 | |||||||||||||||||||||
|
|
|
||||||||||||||||||||||||
| 9,807,029 | |||||||||||||||||||||||||
|
|
|
||||||||||||||||||||||||
| Idaho - 0.4% |
|||||||||||||||||||||||||
| ID Health Facs. Authority Rev. (Terraces Boise Proj.) |
380,000 | 7.00 | 10/1/24 | 304,008 | |||||||||||||||||||||
| ID Health Facs. Authority Rev. (Terraces Boise Proj.) |
250,000 | 7.38 | 10/1/29 | 199,998 | |||||||||||||||||||||
| ID Health Facs. Authority Rev. (Terraces Boise Proj.) |
500,000 | 8.00 | 10/1/44 | 399,990 | |||||||||||||||||||||
| ID Hsg. & Fin. Assoc. Nonprofit Facs. Rev. (Idaho Arts Charter School Proj.) |
380,000 | 5.75 | 12/1/32 | 407,972 | |||||||||||||||||||||
|
|
|
||||||||||||||||||||||||
| 1,311,968 | |||||||||||||||||||||||||
|
|
|
||||||||||||||||||||||||
| Illinois - 6.2% |
|||||||||||||||||||||||||
| Bellwood Village G.O. |
500,000 | 5.88 | 12/1/27 | 554,490 | |||||||||||||||||||||
| Bolingbrook Special Tax (AGM Insured) |
998,000 | 4.00 | 3/1/30 | 1,157,341 | |||||||||||||||||||||
| Burbank Educational Facs. Rev. (Intercultural Montessori Language School) 4 |
500,000 | 6.00 | 9/1/35 | 533,395 | |||||||||||||||||||||
| Bureau Co. Township High School Dist. No. 502 G.O. (BAM Insured) |
500,000 | 6.25 | 12/1/33 | 593,785 | |||||||||||||||||||||
| Chicago Board of Education G.O. (AGM Insured) |
280,000 | 4.50 | 12/1/36 | 280,302 | |||||||||||||||||||||
| Chicago Heights G.O. (NATL-RE Insured) |
500,000 | 4.50 | 12/1/29 | 556,405 | |||||||||||||||||||||
| Chicago Midway Airport Rev. (Second Lien) |
500,000 | 5.25 | 1/1/35 | 541,185 | |||||||||||||||||||||
| Chicago Park Dist. G.O. (BAM Insured) |
500,000 | 4.00 | 1/1/42 | 541,010 | |||||||||||||||||||||
| Chicago Park Dist. G.O. (Limited Tax) |
1,000,000 | 5.00 | 1/1/28 | 1,096,620 | |||||||||||||||||||||
| Chicago Transit Auth. Sales Tax Rev. |
250,000 | 5.25 | 12/1/30 | 264,790 | |||||||||||||||||||||
| IL Educational Facs. Auth. Rev. |
250,000 | 4.50 | 11/1/36 | 277,178 | |||||||||||||||||||||
| IL Educational Facs. Auth. Rev. (Field Museum of Natural History) |
500,000 | 3.90 | 11/1/36 | 541,995 | |||||||||||||||||||||
| IL Fin. Auth. Rev. (Admiral Lake Proj.) |
670,000 | 5.13 | 5/15/38 | 610,122 | |||||||||||||||||||||
| IL Fin. Auth. Rev. (Christian Homes, Inc.) |
500,000 | 5.00 | 5/15/36 | 530,085 | |||||||||||||||||||||
| IL Fin. Auth. Rev. (Edward Elmhurst Healthcare) |
1,000,000 | 5.00 | 1/1/44 | 1,166,960 | |||||||||||||||||||||
| IL Fin. Auth. Rev. (Lifespace Communities) |
500,000 | 5.00 | 5/15/35 | 530,180 | |||||||||||||||||||||
| IL Fin. Auth. Rev. (Lifespace Communities) |
500,000 | 5.00 | 5/15/45 | 521,520 | |||||||||||||||||||||
| IL Fin. Auth. Rev. (Rogers Park Montessori School Proj.) |
100,000 | 5.00 | 2/1/24 | 102,807 | |||||||||||||||||||||
| IL Fin. Auth. Rev. (Westminster Village) |
500,000 | 5.25 | 5/1/38 | 510,630 | |||||||||||||||||||||
| IL Fin. Auth. Sports Facs. Rev. (North Shore Ice Arena Proj.) |
1,000,000 | 6.25 | 12/1/38 | 616,990 | |||||||||||||||||||||
| IL G.O. |
250,000 | 5.50 | 7/1/33 | 260,230 | |||||||||||||||||||||
| IL G.O. (AGM Insured) |
500,000 | 4.00 | 2/1/30 | 537,770 | |||||||||||||||||||||
| IL Housing Dev. Auth. Rev. (GNMA/FNMA/FHLMC Collateralized) |
435,000 | 3.88 | 4/1/41 | 472,684 | |||||||||||||||||||||
| IL Housing Dev. Auth. Rev. (GNMA/FNMA/FHLMC Collateralized) |
315,000 | 4.00 | 10/1/48 | 346,604 | |||||||||||||||||||||
| IL Rev. |
500,000 | 5.00 | 6/15/33 | 569,600 | |||||||||||||||||||||
| IL Sports Facilities Auth. Rev. (State Tax Supported) (AGM Insured) |
1,000,000 | 5.25 | 6/15/31 | 1,113,600 | |||||||||||||||||||||
| La Salle & Bureau Counties Township High School Dist. No. 120 LaSalle-Peru G.O. (BAM Insured) |
250,000 | 5.00 | 12/1/31 | 309,172 | |||||||||||||||||||||
| See accompanying notes to financial statements.
|
||
| 26 | SIT MUTUAL FUNDS SEMI-ANNUAL REPORT | |
|
|
|
|
| Name of Issuer | Principal Amount ($) |
Coupon Rate (%) |
Maturity Date |
Fair Value ($) | |||||||||||||||||||||
| Macon & Moultrie Counties Community Unit School District No. 3 Mt Zion G.O. |
335,000 | 5.50 | 12/1/41 | 368,540 | |||||||||||||||||||||
| Macon Co. School District No. 61 Decatur G.O. (AGM Insured) |
250,000 | 5.25 | 1/1/37 | 253,150 | |||||||||||||||||||||
| Macoupin Sangamon & Montgomery Counties Community Unit School District G.O. (AGM Insured) |
990,000 | 4.25 | 12/1/35 | 1,069,101 | |||||||||||||||||||||
| Malta Tax Allocation Rev. 2, 5 |
1,921,000 | 5.75 | 12/30/25 | 614,720 | |||||||||||||||||||||
| Metropolitan Pier & Exposition Auth. Rev. (McCormick Place Expansion Proj.) |
250,000 | 5.00 | 6/15/57 | 271,538 | |||||||||||||||||||||
| Richton Park Public Library District G.O. |
250,000 | 4.50 | 12/15/32 | 263,912 | |||||||||||||||||||||
| Southwestern IL Dev. Auth. Tax Allocation Ref. (Local Govt. Program) 2 |
370,000 | 7.00 | 10/1/22 | 214,600 | |||||||||||||||||||||
| University of Illinois (AGM Insured) |
1,000,000 | 4.13 | 4/1/48 | 1,091,740 | |||||||||||||||||||||
| Upper Illinois River Valley Dev. Auth. Rev. (Cambridge Lakes Learning Center) 4 |
145,000 | 4.00 | 12/1/22 | 145,900 | |||||||||||||||||||||
| Upper Illinois River Valley Dev. Auth. Rev. (Cambridge Lakes Learning Center) 4 |
250,000 | 5.25 | 12/1/37 | 257,805 | |||||||||||||||||||||
| Upper Illinois River Valley Dev. Auth. Rev. (Prairie Crossing Charter) 4 |
250,000 | 5.00 | 1/1/45 | 254,815 | |||||||||||||||||||||
|
|
|
||||||||||||||||||||||||
| 19,943,271 | |||||||||||||||||||||||||
|
|
|
||||||||||||||||||||||||
| Indiana - 0.9% |
|||||||||||||||||||||||||
| City of Carmel Rev. (Barrington Carmel Proj.) 2, 5 |
164,203 | 6.00 | 11/15/22 | 1,642 | |||||||||||||||||||||
| IN Finance Auth. Rev. (BHI Senior Living) |
775,000 | 5.88 | 11/15/41 | 831,761 | |||||||||||||||||||||
| IN Finance Auth. Rev. (BHI Senior Living) |
425,000 | 6.00 | 11/15/41 | 458,469 | |||||||||||||||||||||
| IN Finance Auth. Rev. (BHI Senior Living) |
170,000 | 5.25 | 11/15/46 | 182,189 | |||||||||||||||||||||
| IN Finance Auth. Rev. (Greencroft Obligated Group) |
350,000 | 6.50 | 11/15/33 | 373,180 | |||||||||||||||||||||
| IN Housing & Community Dev. Auth. Rev. (Hammond Assisted Living Proj.) |
500,000 | 5.75 | 1/1/36 | 508,220 | |||||||||||||||||||||
| Merrillville Industry Economic Dev. Rev. (Belvedere Housing Proj.) |
300,000 | 5.75 | 4/1/36 | 306,651 | |||||||||||||||||||||
| Richmond Hospital Auth. Rev. (Reid Hospital & Health Care) |
350,000 | 5.00 | 1/1/35 | 390,218 | |||||||||||||||||||||
|
|
|
||||||||||||||||||||||||
| 3,052,330 | |||||||||||||||||||||||||
|
|
|
||||||||||||||||||||||||
| Iowa - 0.6% |
|||||||||||||||||||||||||
| IA Fin. Auth. Rev. (Lifespace Communities, Inc.) |
650,000 | 5.00 | 5/15/36 | 695,214 | |||||||||||||||||||||
| IA Fin. Auth. Rev. (Lifespace Communities, Inc.) |
565,000 | 5.00 | 5/15/47 | 591,708 | |||||||||||||||||||||
| IA Fin. Auth. Rev. (Lifespace Communities, Inc.) |
530,000 | 4.00 | 5/15/55 | 507,926 | |||||||||||||||||||||
|
|
|
||||||||||||||||||||||||
| 1,794,848 | |||||||||||||||||||||||||
|
|
|
||||||||||||||||||||||||
| Kansas - 0.1% |
|||||||||||||||||||||||||
| Wichita Health Care Facs. Rev. (Kansas Masonic Home) |
300,000 | 5.25 | 12/1/36 | 298,683 | |||||||||||||||||||||
|
|
|
||||||||||||||||||||||||
| Kentucky - 0.1% |
|||||||||||||||||||||||||
| Pikeville Hospital Rev. Ref. (Pikeville Medical Center) |
425,000 | 6.50 | 3/1/41 | 435,982 | |||||||||||||||||||||
|
|
|
||||||||||||||||||||||||
| Louisiana - 1.7% |
|||||||||||||||||||||||||
| Denham Springs/Livingston Hsg. & Mtg. Finance Auth. Rev. (GNMA/FHLMC Collateralized) |
13,141 | 5.00 | 11/1/40 | 13,388 | |||||||||||||||||||||
| LA Hsg. Fin. Agy. Single Family Mtg. Rev. (Home Ownership Prog.)(GNMA/FHLMC Collateralized) |
500,000 | 2.50 | 12/1/45 | 493,165 | |||||||||||||||||||||
| LA Hsg. Fin. Agy. Single Family Mtg. Rev. (Mtg. Backed Sec. Prog.) (GNMA/FHLMC Collateralized) |
20,000 | 4.60 | 6/1/29 | 20,401 | |||||||||||||||||||||
| LA Local Government Environmental Facilities & Community Development Auth. |
500,000 | 5.25 | 11/15/25 | 515,140 | |||||||||||||||||||||
| LA Local Government Environmental Facilities & Community Development Auth. |
500,000 | 6.00 | 11/15/30 | 525,990 | |||||||||||||||||||||
| LA Local Government Environmental Facilities & Community Development Auth. Rev. 4 |
300,000 | 5.65 | 11/1/37 | 332,787 | |||||||||||||||||||||
| LA Local Government Environmental Facilities & Community Development Auth. Rev. 4 |
500,000 | 5.00 | 7/1/39 | 492,785 | |||||||||||||||||||||
| LA Local Government Environmental Facilities & Community Development Auth. Rev. 4 |
300,000 | 5.50 | 11/1/39 | 322,005 | |||||||||||||||||||||
| LA Local Government Environmental Facilities & Community Development Auth. Rev. 4 |
500,000 | 4.00 | 11/1/44 | 499,985 | |||||||||||||||||||||
| LA Local Government Environmental Facilities & Community Development Auth.Rev. 4 |
495,000 | 4.40 | 11/1/44 | 508,543 | |||||||||||||||||||||
| LA Public Facs. Auth. Rev. (Belle-Chase Educational Foundation Proj.) (NATL-RE Insured) |
510,000 | 6.50 | 5/1/31 | 527,865 | |||||||||||||||||||||
| LA Public Facs. Auth. Rev. (Franciscan Missionaries Health System Proj.) |
300,000 | 5.00 | 7/1/35 | 341,100 | |||||||||||||||||||||
| LA Public Facs. Auth. Rev. (Tulane Univ. Proj.) (NATL-RE Insured) 1 |
570,000 | 0.89 | 2/15/36 | 557,500 | |||||||||||||||||||||
| St. Tammany Parish Fin. Auth. Rev. (Christwood Proj.) |
300,000 | 5.25 | 11/15/37 | 308,700 | |||||||||||||||||||||
|
|
|
||||||||||||||||||||||||
| 5,459,354 | |||||||||||||||||||||||||
|
|
|
||||||||||||||||||||||||
| See accompanying notes to financial statements.
|
||
| SEPTEMBER 30, 2020 | 27 | |
|
|
| SCHEDULE OF INVESTMENTS (Unaudited) September 30, 2020
Sit Tax-Free Income Fund (Continued) |
| Name of Issuer | Principal Amount ($) |
Coupon Rate (%) |
Maturity Date |
Fair Value ($) | |||||||||||||||||||||
| Maine - 0.8% |
|||||||||||||||||||||||||
| ME Hsg. Auth. Rev. |
600,000 | 4.00 | 11/15/35 | 643,902 | |||||||||||||||||||||
| ME Hsg. Auth. Rev. |
500,000 | 4.00 | 11/15/37 | 544,675 | |||||||||||||||||||||
| ME Hsg. Auth. Rev. |
25,000 | 4.50 | 11/15/37 | 26,117 | |||||||||||||||||||||
| ME Hsg. Auth. Rev. |
615,000 | 4.13 | 11/15/38 | 689,446 | |||||||||||||||||||||
| ME Hsg. Auth. Rev. |
500,000 | 3.85 | 11/15/40 | 529,980 | |||||||||||||||||||||
|
|
|
||||||||||||||||||||||||
| 2,434,120 | |||||||||||||||||||||||||
|
|
|
||||||||||||||||||||||||
| Maryland - 0.3% |
|||||||||||||||||||||||||
| MD Community Dev. Administration Rev. |
240,000 | 4.10 | 9/1/38 | 267,146 | |||||||||||||||||||||
| MD Community Dev. Administration Rev. |
350,000 | 4.20 | 7/1/46 | 380,905 | |||||||||||||||||||||
| Montgomery Co. Housing Opportunities Commission Rev. |
405,000 | 4.00 | 7/1/38 | 413,197 | |||||||||||||||||||||
|
|
|
||||||||||||||||||||||||
| 1,061,248 | |||||||||||||||||||||||||
|
|
|
||||||||||||||||||||||||
| Massachusetts - 2.8% |
|||||||||||||||||||||||||
| Dedham Municipal Purpose Loan. G.O. (NATL Insured) |
480,000 | 4.00 | 10/15/24 | 481,493 | |||||||||||||||||||||
| Ipswich Muncipal Purpose Loan G.O. (AGM Insured) |
500,000 | 4.00 | 6/1/25 | 501,515 | |||||||||||||||||||||
| MA Dev. Finance Agy. Rev. |
890,000 | 5.00 | 7/1/44 | 1,020,091 | |||||||||||||||||||||
| MA Dev.Finance Agy. Rev. (Atrius Health Issue) |
1,375,000 | 4.00 | 6/1/49 | 1,475,678 | |||||||||||||||||||||
| MA Dev. Finance Agy. Rev. (Newbridge on the Charles, Inc.) 4 |
300,000 | 5.00 | 10/1/47 | 320,349 | |||||||||||||||||||||
| MA Dev. Finance Agy. Rev. (Orchard Cove, Inc.) |
400,000 | 5.00 | 10/1/49 | 429,696 | |||||||||||||||||||||
| MA Education Finance Auth. Education Rev. |
50,000 | 5.15 | 1/1/26 | 50,322 | |||||||||||||||||||||
| MA Education Finance Auth. Education Rev. |
1,000,000 | 3.63 | 7/1/34 | 1,029,630 | |||||||||||||||||||||
| MA Housing Finance Agy. Rev. |
250,000 | 4.75 | 6/1/35 | 255,162 | |||||||||||||||||||||
| MA Housing Finance Agy. Rev. |
500,000 | 4.00 | 12/1/38 | 557,235 | |||||||||||||||||||||
| MA Housing Finance Agy. Rev. |
500,000 | 3.75 | 12/1/40 | 533,935 | |||||||||||||||||||||
| MA Housing Finance Agy. Rev. |
900,000 | 3.85 | 12/1/47 | 975,645 | |||||||||||||||||||||
| MA Housing Finance Agy. Rev. (FHA Insured) |
500,000 | 5.30 | 12/1/38 | 501,310 | |||||||||||||||||||||
| MA Housing Finance Agy. Rev. (GNMA/FNMA/FHLMC Collateralized) |
135,000 | 3.90 | 12/1/38 | 138,027 | |||||||||||||||||||||
| Northbridge Muncipal Purpose Loan G.O. (AGM Insured) |
500,000 | 4.00 | 6/15/25 | 501,405 | |||||||||||||||||||||
| Rowley Land Acquisition Loan G.O. (AGM Insured) |
360,000 | 4.00 | 5/1/27 | 360,983 | |||||||||||||||||||||
|
|
|
||||||||||||||||||||||||
| 9,132,476 | |||||||||||||||||||||||||
|
|
|
||||||||||||||||||||||||
| Michigan - 2.7% |
|||||||||||||||||||||||||
| Chandler Park Academy Rev. |
130,000 | 5.00 | 11/1/22 | 130,280 | |||||||||||||||||||||
| City of Allen Park G.O. (BAM Insured) |
300,000 | 3.25 | 5/1/34 | 319,503 | |||||||||||||||||||||
| City of Kalamazoo Economic Dev. Corp. Rev. (Revel Creek Proj.) |
500,000 | 5.00 | 5/15/43 | 531,770 | |||||||||||||||||||||
| MI Finance Auth. Rev. (Presbyterian Village) |
250,000 | 5.25 | 11/15/35 | 261,382 | |||||||||||||||||||||
| MI Hsg. Dev. Auth. (G.O. of Authority Insured) |
250,000 | 4.63 | 10/1/41 | 258,135 | |||||||||||||||||||||
| MI Hsg. Dev. Auth. Rev. |
500,000 | 4.10 | 10/1/35 | 539,595 | |||||||||||||||||||||
| MI Hsg. Dev. Auth. Rev. |
430,000 | 3.70 | 12/1/36 | 462,564 | |||||||||||||||||||||
| MI Hsg. Dev. Auth. Rev. |
385,000 | 4.13 | 12/1/38 | 405,232 | |||||||||||||||||||||
| MI Hsg. Dev. Auth. Rev. |
300,000 | 3.75 | 10/1/42 | 321,885 | |||||||||||||||||||||
| MI Hsg. Dev. Auth. Rev. |
750,000 | 4.00 | 10/1/43 | 827,355 | |||||||||||||||||||||
| MI Hsg. Dev. Auth. Rev. |
1,000,000 | 4.00 | 6/1/49 | 1,076,340 | |||||||||||||||||||||
| MI Hsg. Dev. Auth. Rev. |
1,000,000 | 3.15 | 6/1/50 | 1,036,720 | |||||||||||||||||||||
| MI Hsg. Dev. Auth. Rev. |
1,000,000 | 3.50 | 10/1/54 | 1,065,330 | |||||||||||||||||||||
| MI Public Educational Facs. Auth. Rev. (Chandler Park Academy) |
280,000 | 6.35 | 11/1/28 | 280,636 | |||||||||||||||||||||
| MI Strategic Fund. Rev. (United Methodist Retirement Facs.) |
415,000 | 5.00 | 11/15/49 | 446,104 | |||||||||||||||||||||
| Muskegon Heights Water Supply Rev. (NATL Insured) |
165,000 | 4.15 | 11/1/23 | 165,478 | |||||||||||||||||||||
| Muskegon Heights Water Supply Rev. (NATL Insured) |
135,000 | 4.20 | 11/1/24 | 135,396 | |||||||||||||||||||||
| Taylor Brownfield Redevelopment Authority (NATL Insured) |
250,000 | 5.00 | 5/1/32 | 286,315 | |||||||||||||||||||||
| Universal Academy Michigan Public School Rev. |
135,000 | 6.50 | 12/1/23 | 140,800 | |||||||||||||||||||||
|
|
|
||||||||||||||||||||||||
| 8,690,820 | |||||||||||||||||||||||||
|
|
|
||||||||||||||||||||||||
| See accompanying notes to financial statements.
|
||
| 28 | SIT MUTUAL FUNDS SEMI-ANNUAL REPORT | |
|
|
|
|
| Name of Issuer | Principal Amount ($) |
Coupon Rate (%) |
Maturity Date |
Fair Value ($) | |||||||||||||||||||||
| Minnesota - 0.1% |
|||||||||||||||||||||||||
| Apple Valley Rev. (Senior Living, LLC Proj.) |
500,000 | 5.00 | 1/1/47 | 319,050 | |||||||||||||||||||||
| MN Hsg. Fin. Agy. Mtg. Rev. (Mtg. Backed Securities Program) (GNMA/FNMA Collateralized) |
85,000 | 4.40 | 7/1/32 | 86,683 | |||||||||||||||||||||
|
|
|
||||||||||||||||||||||||
| 405,733 | |||||||||||||||||||||||||
|
|
|
||||||||||||||||||||||||
| Mississippi - 0.7% |
|||||||||||||||||||||||||
| MS Development Bank Rev. (Green Bond-Hancock County) 4 |
1,000,000 | 4.55 | 11/1/39 | 1,036,930 | |||||||||||||||||||||
| MS Gaming Tax Rev. |
740,000 | 4.00 | 10/15/38 | 813,290 | |||||||||||||||||||||
| MS Home Corp. Single Family Mtg. Rev. (GNMA/FNMA/FHLMC Collateralized) |
335,000 | 4.00 | 12/1/43 | 360,989 | |||||||||||||||||||||
|
|
|
||||||||||||||||||||||||
| 2,211,209 | |||||||||||||||||||||||||
|
|
|
||||||||||||||||||||||||
| Missouri - 1.3% |
|||||||||||||||||||||||||
| Kansas City Industrial Dev. Auth. Rev. (Kansas City Pkg. LLC) |
200,000 | 5.45 | 9/1/23 | 200,038 | |||||||||||||||||||||
| Kansas City Industrial Dev. Auth. Rev. (United Methodist Retirement Home, Inc.) 2, 4, 5 |
500,000 | 5.75 | 11/15/36 | 175,250 | |||||||||||||||||||||
| Lees Summit Industrial Dev. Auth. Rev. (John Knox Village Proj.) |
370,000 | 5.00 | 8/15/32 | 391,934 | |||||||||||||||||||||
| MO Health & Education Facs. Auth. Rev. (Lutheran Senior Services) |
775,000 | 4.00 | 2/1/42 | 799,366 | |||||||||||||||||||||
| MO Health & Education Facs. Auth. Rev. (Lutheran Senior Services) |
1,000,000 | 4.00 | 2/1/48 | 1,022,740 | |||||||||||||||||||||
| MO Hsg. Dev. Commission Rev. (GNMA/FNMA/FHLMC Collateralized) |
670,000 | 3.80 | 11/1/48 | 723,051 | |||||||||||||||||||||
| MO Hsg. Dev. Commission Rev. (GNMA/FNMA/FHLMC Collateralized) |
485,000 | 3.35 | 11/1/49 | 509,890 | |||||||||||||||||||||
| MO Hsg. Dev. Commission Rev. (GNMA/FNMA/FHLMC Collateralized) |
500,000 | 2.50 | 5/1/50 | 502,080 | |||||||||||||||||||||
|
|
|
||||||||||||||||||||||||
| 4,324,349 | |||||||||||||||||||||||||
|
|
|
||||||||||||||||||||||||
| Montana - 0.5% |
|||||||||||||||||||||||||
| MT Board of Housing Single Family Rev. |
195,000 | 4.00 | 12/1/38 | 209,756 | |||||||||||||||||||||
| MT Board of Housing Single Family Rev. |
500,000 | 2.40 | 12/1/45 | 494,945 | |||||||||||||||||||||
| MT Board of Housing Single Family Rev. (BRD Insured) |
500,000 | 4.00 | 6/1/45 | 551,570 | |||||||||||||||||||||
| MT Board of Housing Single Family Rev. (FHA Insured) |
260,000 | 3.75 | 12/1/38 | 269,924 | |||||||||||||||||||||
| MT Facs. Finance Auth. Rev. (Great Falls Pre-Release Services Proj.) |
92,526 | 5.08 | 4/1/21 | 93,587 | |||||||||||||||||||||
|
|
|
||||||||||||||||||||||||
| 1,619,782 | |||||||||||||||||||||||||
|
|
|
||||||||||||||||||||||||
| Nebraska - 0.4% |
|||||||||||||||||||||||||
| Douglas Co. Hospital Auth. No. 2 Rev. (Children Hospital Obligation) |
500,000 | 4.00 | 11/15/50 | 566,610 | |||||||||||||||||||||
| Douglas Co. Hospital Auth. No. 3 Rev. (Methodist Hospital) |
400,000 | 5.00 | 11/1/30 | 465,124 | |||||||||||||||||||||
| Mead Village Tax Allocation Rev. (E3 Biofuels - Mead LLC Proj.) 2, 5, 15 |
410,000 | 5.13 | N/A | 17,015 | |||||||||||||||||||||
| Nebraska Investment Fin. Auth. Rev. (GNMA/FNMA/FHLMC Collateralized) |
380,000 | 3.05 | 9/1/42 | 397,761 | |||||||||||||||||||||
|
|
|
||||||||||||||||||||||||
| 1,446,510 | |||||||||||||||||||||||||
|
|
|
||||||||||||||||||||||||
| Nevada - 1.1% |
|||||||||||||||||||||||||
| City of Las Vegas Special Improvement District No. 815 |
500,000 | 5.00 | 12/1/49 | 528,870 | |||||||||||||||||||||
| City of North Las Vegas (Special Northern Beltway Commercial Area) 4 |
340,000 | 4.00 | 12/1/27 | 354,348 | |||||||||||||||||||||
| City of North Las Vegas (Special Northern Beltway Commercial Area) 4 |
345,000 | 5.00 | 12/1/37 | 369,260 | |||||||||||||||||||||
| NV Hsg.Division Rev. (GNMA/FNMA/FHLMC Collateralized) |
320,000 | 3.85 | 10/1/39 | 335,581 | |||||||||||||||||||||
| NV Hsg.Division Rev. (GNMA/FNMA/FHLMC Collateralized) |
1,000,000 | 3.35 | 10/1/49 | 1,054,620 | |||||||||||||||||||||
| NV Hsg. Division Rev. (GNMA/FNMA/FHLMC Collateralized) |
990,000 | 3.40 | 10/1/49 | 1,047,628 | |||||||||||||||||||||
|
|
|
||||||||||||||||||||||||
| 3,690,307 | |||||||||||||||||||||||||
|
|
|
||||||||||||||||||||||||
| See accompanying notes to financial statements.
|
||
| SEPTEMBER 30, 2020 | 29 | |
|
|
| SCHEDULE OF INVESTMENTS (Unaudited) September 30, 2020
Sit Tax-Free Income Fund (Continued) |
| Name of Issuer | Principal Amount ($) |
Coupon Rate (%) |
Maturity Date |
Fair Value ($) | |||||||||||||||||||||
| New Hampshire - 0.5% |
|||||||||||||||||||||||||
| NH Business Finance Auth. Rev. (The Vista Proj.) 4 |
310,000 | 5.25 | 7/1/39 | 314,504 | |||||||||||||||||||||
| NH Business Finance Auth. Rev. (The Vista Proj.) 4 |
500,000 | 5.63 | 7/1/46 | 512,725 | |||||||||||||||||||||
| NH Hsg. Fin. Agy. Rev. (Cimarron, Whittier Falls & Mars) (FHA Insured) |
725,000 | 4.00 | 7/1/52 | 784,559 | |||||||||||||||||||||
|
|
|
||||||||||||||||||||||||
| 1,611,788 | |||||||||||||||||||||||||
|
|
|
||||||||||||||||||||||||
| New Jersey - 3.2% |
|||||||||||||||||||||||||
| NJ Economic Dev. Auth. Rev. (North Star Academy Charter School Newark) |
250,000 | 5.00 | 7/15/47 | 274,145 | |||||||||||||||||||||
| NJ Economic Dev. Auth. Rev. (State Government Buildings Proj.) 9 |
500,000 | 5.00 | 6/15/42 | 555,400 | |||||||||||||||||||||
| NJ Economic Dev. Auth. Rev. (State Housing Proj.) 9 |
250,000 | 5.00 | 6/15/37 | 284,202 | |||||||||||||||||||||
| NJ Economic Dev. Auth. Rev. (State Housing Proj.) 9 |
500,000 | 5.00 | 6/15/43 | 556,995 | |||||||||||||||||||||
| NJ Higher Education Student Assistance Auth. Rev. |
1,250,000 | 3.50 | 12/1/39 | 1,256,762 | |||||||||||||||||||||
| NJ Higher Education Student Assistance Auth. Rev. |
1,000,000 | 4.25 | 12/1/50 | 1,008,760 | |||||||||||||||||||||
| NJ Hsg. & Mtg. Finance Agy. Rev. |
750,000 | 3.95 | 11/1/43 | 822,030 | |||||||||||||||||||||
| NJ Hsg. & Mtg. Finance Agy. Rev. (Mciver Homes Hsg. Proj.) (FHLMC Collateralized) |
550,000 | 3.60 | 1/1/30 | 577,242 | |||||||||||||||||||||
| NJ Hsg. & Mtg. Finance Agy. Single Family Mtg. Rev. |
195,000 | 4.50 | 10/1/30 | 203,130 | |||||||||||||||||||||
| NJ Hsg. & Mtg. Finance Agy. Single Family Mtg. Rev. |
935,000 | 3.75 | 10/1/35 | 1,042,806 | |||||||||||||||||||||
| NJ Hsg. & Mtg. Finance Agy. Single Family Mtg. Rev. |
580,000 | 4.50 | 10/1/48 | 657,877 | |||||||||||||||||||||
| NJ Hsg. & Mtg. Finance Agy. Single Family Mtg. Rev. |
475,000 | 4.00 | 4/1/49 | 507,386 | |||||||||||||||||||||
| NJ Hsg. & Mtg. Finance Agy. Single Family Mtg. Rev. |
1,000,000 | 2.45 | 10/1/50 | 968,840 | |||||||||||||||||||||
| NJ Transportation Trust Fund Auth. Rev. |
250,000 | 5.25 | 12/15/22 | 270,970 | |||||||||||||||||||||
| NJ Transportation Trust Fund Auth. Rev. 9 |
500,000 | 4.00 | 12/15/39 | 525,140 | |||||||||||||||||||||
| NJ Transportation Trust Fund Auth. Rev. 9 |
500,000 | 5.25 | 6/15/43 | 565,880 | |||||||||||||||||||||
| Tobacco Settlement Financing Corp. Rev. |
300,000 | 5.00 | 6/1/46 | 339,042 | |||||||||||||||||||||
|
|
|
||||||||||||||||||||||||
| 10,416,607 | |||||||||||||||||||||||||
|
|
|
||||||||||||||||||||||||
| New Mexico - 1.5% |
|||||||||||||||||||||||||
| NM Mtg.Fin. Auth. Single Family Mtg. Rev. (GNMA/FNMA/FHLMC Collateralized) |
305,000 | 3.90 | 9/1/42 | 311,179 | |||||||||||||||||||||
| NM Mtg. Fin. Auth. Single Family Mtg. Rev. (GNMA/FNMA/FHLMC Collateralized) |
285,000 | 4.13 | 9/1/42 | 291,660 | |||||||||||||||||||||
| NM Mtg. Fin. Auth. Single Family Mtg. Rev. (GNMA/FNMA/FHLMC Collateralized) |
745,000 | 3.85 | 7/1/43 | 809,279 | |||||||||||||||||||||
| NM Mtg. Fin. Auth. Single Family Mtg. Rev. (GNMA/FNMA/FHLMC Collateralized) |
465,000 | 3.85 | 7/1/43 | 505,120 | |||||||||||||||||||||
| NM Mtg.Fin. Auth. Single Family Mtg. Rev. (GNMA/FNMA/FHLMC Collateralized) |
380,000 | 3.80 | 9/1/46 | 399,011 | |||||||||||||||||||||
| NM Mtg. Fin. Auth. Single Family Mtg. Rev. (GNMA/FNMA/FHLMC Collateralized) |
840,000 | 4.00 | 7/1/48 | 913,450 | |||||||||||||||||||||
| NM Mtg. Fin. Auth. Single Family Mtg. Rev. (GNMA/FNMA/FHLMC Collateralized) |
995,000 | 3.35 | 7/1/49 | 1,051,257 | |||||||||||||||||||||
| NM Mtg. Fin. Auth. Single Family Mtg. Rev. (GNMA/FNMA/FHLMC Collateralized) |
480,000 | 4.00 | 7/1/49 | 522,850 | |||||||||||||||||||||
|
|
|
||||||||||||||||||||||||
| 4,803,806 | |||||||||||||||||||||||||
|
|
|
||||||||||||||||||||||||
| New York - 4.2% |
|||||||||||||||||||||||||
| Buffalo & Erie Co. Industrial Land Dev. Corp. Rev. (D’Youville College Proj.) |
500,000 | 4.00 | 11/1/40 | 519,510 | |||||||||||||||||||||
| Hempstead Town Local Development Corp. Rev. (Hofstra University Proj.) |
350,000 | 4.00 | 7/1/33 | 368,368 | |||||||||||||||||||||
| New York City Housing Development Corp. Multifamily Mtg. Rev. |
250,000 | 4.60 | 11/1/36 | 253,528 | |||||||||||||||||||||
| New York City Housing Development Corp. Multifamily Mtg. Rev. |
300,000 | 4.05 | 11/1/41 | 323,952 | |||||||||||||||||||||
| New York City Housing Development Corp. Multifamily Mtg. Rev. |
300,000 | 3.85 | 11/1/42 | 321,834 | |||||||||||||||||||||
| New York City Housing Development Corp. Multifamily Mtg. Rev. |
650,000 | 3.65 | 11/1/47 | 678,509 | |||||||||||||||||||||
| New York City Housing Development Corp. Multifamily Mtg. Rev. |
500,000 | 3.95 | 11/1/49 | 537,325 | |||||||||||||||||||||
| New York City Housing Development Corp. Multifamily Mtg. Rev. |
1,000,000 | 3.00 | 11/1/55 | 1,020,410 | |||||||||||||||||||||
| New York City Housing Development Corp. Rev. |
500,000 | 3.80 | 11/1/37 | 511,305 | |||||||||||||||||||||
| New York City Municipal Water Finance Authority |
750,000 | 5.00 | 6/15/38 | 837,712 | |||||||||||||||||||||
| New York Transportation Dev. Corp. Rev. (Laguardia Airport Proj.) |
750,000 | 4.00 | 10/1/30 | 766,140 | |||||||||||||||||||||
| NY Monroe Co. Industrial Development Corp. Rev. (St. Ann’s Community Proj.) |
750,000 | 4.00 | 1/1/30 | 751,012 | |||||||||||||||||||||
| NY Monroe Co. Industrial Development Corp. Rev. (St. Ann’s Community Proj.) |
750,000 | 5.00 | 1/1/50 | 770,348 | |||||||||||||||||||||
| NY Mortgage Agency Rev. |
175,000 | 3.75 | 10/1/42 | 178,622 | |||||||||||||||||||||
| NY Mortgage Agency Rev. |
500,000 | 4.20 | 10/1/43 | 553,225 | |||||||||||||||||||||
| See accompanying notes to financial statements.
|
||
| 30 | SIT MUTUAL FUNDS SEMI-ANNUAL REPORT | |
|
|
|
|
| Name of Issuer | Principal Amount ($) |
Coupon Rate (%) |
Maturity Date |
Fair Value ($) | |||||||||||||||||||||
| NY Mortgage Agency Rev. |
1,315,000 | 3.80 | 10/1/48 | 1,407,339 | |||||||||||||||||||||
| NY State Dormitory Auth. Rev. Ref. (N. Shore-Long Island Jewish Obligation) |
300,000 | 5.00 | 5/1/33 | 343,251 | |||||||||||||||||||||
| NY State Housing Finance Agency Rev. (Affordable Hsg. Proj.) |
590,000 | 3.75 | 11/1/37 | 603,806 | |||||||||||||||||||||
| NY State Housing Finance Agency Rev. (Affordable Hsg. Proj.) |
400,000 | 4.88 | 11/1/42 | 410,328 | |||||||||||||||||||||
| NY State Housing Finance Agency Rev. (Affordable Hsg. Proj.) (FNMA/FHLMC Collateralized) |
500,000 | 3.65 | 11/1/34 | 530,615 | |||||||||||||||||||||
| NY State Housing Finance Agency Rev. (Affordable Hsg. Proj.) (GNMA/FNMA/FHLMC Collateralized) |
500,000 | 3.95 | 11/1/37 | 544,775 | |||||||||||||||||||||
| NY State Housing Finance Agency Rev. (GNMA/FNMA/FHLMC Collateralized) |
250,000 | 4.10 | 11/1/41 | 271,358 | |||||||||||||||||||||
| NY State Mortgage Agency Rev. |
1,000,000 | 2.55 | 4/1/50 | 1,013,300 | |||||||||||||||||||||
|
|
|
||||||||||||||||||||||||
| 13,516,572 | |||||||||||||||||||||||||
|
|
|
||||||||||||||||||||||||
| North Carolina - 1.5% |
|||||||||||||||||||||||||
| Mecklenburg Co. Rev. (Little Rock Apts) |
195,000 | 5.15 | 1/1/22 | 196,591 | |||||||||||||||||||||
| Mecklenburg Co. Rev. (Little Rock Apts) |
510,000 | 5.38 | 1/1/36 | 515,289 | |||||||||||||||||||||
| NC Education Assistance Auth. Senior Bond-Student Loan Rev. |
500,000 | 3.13 | 6/1/39 | 488,980 | |||||||||||||||||||||
| NC Housing Finance Agency Rev. |
295,000 | 3.95 | 1/1/41 | 322,016 | |||||||||||||||||||||
| NC Housing Finance Agency Rev. |
880,000 | 4.00 | 7/1/47 | 955,733 | |||||||||||||||||||||
| NC Housing Finance Agency Rev. (GNMA/FNMA/FHLMC Collateralized) |
465,000 | 4.00 | 1/1/48 | 506,264 | |||||||||||||||||||||
| NC Housing Finance Agency Rev. (GNMA/FNMA/FHLMC Collateralized) |
1,000,000 | 3.63 | 7/1/49 | 1,072,630 | |||||||||||||||||||||
| NC Medical Care Comm. Rev. (Salemtowne Proj.) |
400,000 | 5.00 | 10/1/38 | 429,128 | |||||||||||||||||||||
| University of North Carolina School of the Arts |
500,000 | 3.25 | 2/1/46 | 523,455 | |||||||||||||||||||||
|
|
|
||||||||||||||||||||||||
| 5,010,086 | |||||||||||||||||||||||||
|
|
|
||||||||||||||||||||||||
| North Dakota - 0.2% |
|||||||||||||||||||||||||
| ND Housing Finance Agency Rev. |
550,000 | 3.85 | 1/1/42 | 597,311 | |||||||||||||||||||||
|
|
|
||||||||||||||||||||||||
| Ohio - 3.2% |
|||||||||||||||||||||||||
| Ashland City School Dist. G.O. (Classroom Facilities & School Improvement) |
750,000 | 4.00 | 11/1/49 | 751,778 | |||||||||||||||||||||
| Butler Co. Port Auth. Rev. |
640,000 | 5.00 | 12/1/34 | 643,104 | |||||||||||||||||||||
| Columbus-Franklin Co. Finance Auth. Rev. (Beulah Park Phase 1 Proj.) |
840,000 | 4.00 | 5/15/49 | 917,960 | |||||||||||||||||||||
| Dayton-Montgomery Co. Port Auth. Rev. (Storypoint Troy Proj.) |
400,000 | 7.00 | 1/15/40 | 338,420 | |||||||||||||||||||||
| Franklin Co. Health Care Facs. Rev. (Ohio Living Communities) |
1,000,000 | 4.00 | 7/1/45 | 1,021,030 | |||||||||||||||||||||
| Lake Co. Port & Economic Dev. Auth. Rev. (Tapestry Wickliffe Proj.) 4 |
250,000 | 6.50 | 12/1/37 | 88,015 | |||||||||||||||||||||
| Liberty Community Infrastructure Financing Auth. Special Assessment |
500,000 | 3.13 | 12/1/46 | 517,690 | |||||||||||||||||||||
| Lucas Metro Hsg. Auth. |
500,000 | 5.00 | 11/1/36 | 557,540 | |||||||||||||||||||||
| OH Higher Educational Facs. Commission Rev. (Tiffin University Proj.) |
1,045,000 | 4.00 | 11/1/49 | 963,814 | |||||||||||||||||||||
| OH Housing Finance Agency Rev. |
955,000 | 3.35 | 9/1/49 | 1,012,405 | |||||||||||||||||||||
| OH Housing Finance Agency Rev. (GNMA/FNMA Collateralized) |
385,000 | 4.05 | 3/1/37 | 424,201 | |||||||||||||||||||||
| OH Housing Finance Agency Rev. (GNMA/FNMA/FHLMC Collateralized) |
390,000 | 3.35 | 9/1/39 | 413,388 | |||||||||||||||||||||
| OH Housing Finance Agency Rev. (GNMA/FNMA/FHLMC Collateralized) |
840,000 | 4.00 | 9/1/48 | 906,965 | |||||||||||||||||||||
| OH Housing Finance Agency Rev. (GNMA/FNMA/FHLMC Collateralized) |
675,000 | 4.00 | 3/1/49 | 725,753 | |||||||||||||||||||||
| Port of Greater Cincinnati Dev. Auth. Rev. (St. Xavier High School, Inc. Proj.) |
400,000 | 4.00 | 4/1/40 | 429,664 | |||||||||||||||||||||
| Stow G.O. (Limited Tax Various Purpose) |
530,000 | 3.75 | 12/1/31 | 530,790 | |||||||||||||||||||||
|
|
|
||||||||||||||||||||||||
| 10,242,517 | |||||||||||||||||||||||||
|
|
|
||||||||||||||||||||||||
| Oklahoma - 0.5% |
|||||||||||||||||||||||||
| Fort Sill Apache Tribe Economic Dev. Auth. 4 |
410,000 | 8.50 | 8/25/26 | 439,594 | |||||||||||||||||||||
| Oklahoma Dev. Finance Auth. Rev. (Oklahoma City University Proj.) |
1,000,000 | 5.00 | 8/1/49 | 1,097,450 | |||||||||||||||||||||
|
|
|
||||||||||||||||||||||||
| 1,537,044 | |||||||||||||||||||||||||
|
|
|
||||||||||||||||||||||||
| Oregon - 2.3% |
|||||||||||||||||||||||||
| Clackamas Co. Hospital Facs. Auth. Rev. (Rose Villa Proj.) |
500,000 | 5.38 | 11/15/55 | 531,380 | |||||||||||||||||||||
| Clackamas Co. Hospital Facs. Auth. Rev. (Willamette View Proj.) |
460,000 | 5.00 | 11/15/47 | 481,845 | |||||||||||||||||||||
| Clackamas Co. Hsg. Auth. Rev. (Easton Ridge Apts. Proj.) |
350,000 | 3.50 | 9/1/33 | 361,162 | |||||||||||||||||||||
| Forest Grove Rev. (Campus Improvement-Pacific Unv. Proj.) |
250,000 | 5.25 | 5/1/34 | 257,933 | |||||||||||||||||||||
| Marion Co. School District No. 1 Gervais G.O. |
500,000 | 4.00 | 6/1/33 | 501,020 | |||||||||||||||||||||
| See accompanying notes to financial statements.
|
||
| SEPTEMBER 30, 2020 | 31 | |
|
|
| SCHEDULE OF INVESTMENTS (Unaudited) September 30, 2020
Sit Tax-Free Income Fund (Continued) |
| Name of Issuer | Principal Amount ($) |
Coupon Rate (%) |
Maturity Date |
Fair Value ($) | |||||||||||||||||||||
| OR Hsg. & Community Services Dept. Rev. |
240,000 | 3.80 | 7/1/34 | 269,698 | |||||||||||||||||||||
| OR Hsg. & Community Services Dept. Rev. (Single Family Mtg. Program) |
200,000 | 3.75 | 7/1/35 | 220,476 | |||||||||||||||||||||
| OR Hsg. & Community Services Dept. Rev. (Single Family Mtg. Program) |
375,000 | 4.00 | 7/1/38 | 392,332 | |||||||||||||||||||||
| OR Hsg. & Community Services Dept. Rev. (Single Family Mtg. Program) |
450,000 | 3.75 | 7/1/48 | 480,596 | |||||||||||||||||||||
| OR State Ref G.O. (Veterans Welfare Service) |
1,000,000 | 3.90 | 12/1/39 | 1,052,600 | |||||||||||||||||||||
| Polk Co. Hospital Fac. Auth. Rev. (Dallas Retirement Village Proj.) |
1,000,000 | 4.00 | 7/1/24 | 1,002,350 | |||||||||||||||||||||
| Polk Co. Hospital Fac. Auth. Rev. (Dallas Retirement Village Proj.) |
740,000 | 5.13 | 7/1/35 | 754,763 | |||||||||||||||||||||
| Polk Co. Hospital Fac. Auth. Rev. (Dallas Retirement Village Proj.) |
500,000 | 5.13 | 7/1/55 | 502,650 | |||||||||||||||||||||
| Yamill Co. Rev. (Linfield University Proj.) |
500,000 | 5.00 | 10/1/45 | 547,720 | |||||||||||||||||||||
|
|
|
||||||||||||||||||||||||
| 7,356,525 | |||||||||||||||||||||||||
|
|
|
||||||||||||||||||||||||
| Pennsylvania - 2.9% |
|||||||||||||||||||||||||
| Allegheny Co. Industrial Dev. Auth. Charter School Rev. (Propel Charter-McKeesport) |
115,000 | 5.90 | 8/15/26 | 115,351 | |||||||||||||||||||||
| Butler Co. General Authority Rev. (School District Proj.) (AGM G.O. of District) 1 |
465,000 | 0.90 | 10/1/34 | 444,600 | |||||||||||||||||||||
| Central Bradford Progress Auth. Rev. (Guthrie Healthcare System) |
250,000 | 5.50 | 12/1/31 | 265,063 | |||||||||||||||||||||
| Chester Co. Health & Education Fac. Auth. Rev. (The Devereux Foundation) |
475,000 | 3.00 | 11/1/30 | 473,765 | |||||||||||||||||||||
| Commonwealth Financing Auth. Rev. (Tobacco Master Settlement Payment) (AGM Insured) |
350,000 | 4.00 | 6/1/39 | 397,103 | |||||||||||||||||||||
| Dauphin Co. General Auth. Rev. (Harrisburg University Science Technology) 4 |
400,000 | 4.00 | 10/15/22 | 395,456 | |||||||||||||||||||||
| PA Higher Educational Facs. Auth. Rev. (La Salle University) |
280,000 | 5.00 | 5/1/42 | 284,435 | |||||||||||||||||||||
| PA Hsg. Finance Agy. Rev. |
500,000 | 3.90 | 10/1/36 | 536,140 | |||||||||||||||||||||
| PA Hsg.Finance Agy. Rev. |
530,000 | 3.95 | 10/1/38 | 530,000 | |||||||||||||||||||||
| PA Hsg. Finance Agy. Rev. |
825,000 | 3.65 | 10/1/42 | 866,481 | |||||||||||||||||||||
| PA Hsg. Finance Agy. Rev. |
155,000 | 4.00 | 10/1/46 | 167,978 | |||||||||||||||||||||
| PA Hsg. Finance Agy. Rev. |
250,000 | 4.00 | 10/1/47 | 267,365 | |||||||||||||||||||||
| PA Hsg.Finance Agy. Rev. |
1,000,000 | 3.40 | 10/1/49 | 1,050,080 | |||||||||||||||||||||
| PA Turnpike Commission Rev. Capital Appreciation 6 |
1,250,000 | 5.00 | 12/1/38 | 1,516,462 | |||||||||||||||||||||
| Palmerton Area School District G.O. (AGM Insured) |
500,000 | 4.00 | 8/15/35 | 504,580 | |||||||||||||||||||||
| Philadelphia Industrial Dev. Auth. Rev. (Alliance for Progress Charter School Proj.) |
635,000 | 5.00 | 6/15/49 | 654,634 | |||||||||||||||||||||
| Philadelphia Industrial Dev. Auth. Rev. (Charter School Proj.) |
350,000 | 5.63 | 8/1/36 | 383,103 | |||||||||||||||||||||
| Philadelphia Industrial Dev. Auth. Rev. (Independence Charter School Proj.) |
500,000 | 5.00 | 6/15/39 | 521,890 | |||||||||||||||||||||
|
|
|
||||||||||||||||||||||||
| 9,374,486 | |||||||||||||||||||||||||
| Rhode Island - 0.3% |
|||||||||||||||||||||||||
| RI Hsg. & Mortgage Finance Corp. Rev. |
250,000 | 3.90 | 10/1/37 | 258,805 | |||||||||||||||||||||
| RI Student Loan Auth. Rev. |
750,000 | 3.63 | 12/1/37 | 753,622 | |||||||||||||||||||||
|
|
|
||||||||||||||||||||||||
| 1,012,427 | |||||||||||||||||||||||||
|
|
|
||||||||||||||||||||||||
| South Carolina - 1.3% |
|||||||||||||||||||||||||
| Berkeley Co. Nexton Improvement District Special Assessment |
350,000 | 4.25 | 11/1/40 | 353,063 | |||||||||||||||||||||
| SC Education Assistance Auth. Student Loan Rev. |
135,000 | 5.10 | 10/1/29 | 135,081 | |||||||||||||||||||||
| SC Jobs-Economic Dev. Auth. Rev. (Bishop Gadsden Episcopal Retirement Community) |
500,000 | 4.00 | 4/1/54 | 498,170 | |||||||||||||||||||||
| SC Jobs-Economic Dev. Auth. Rev. (Bon Secours Mercy Health, Inc.) |
750,000 | 4.00 | 12/1/44 | 852,975 | |||||||||||||||||||||
| SC Public Service Auth. Rev. (Santee Cooper) |
250,000 | 5.00 | 12/1/38 | 278,898 | |||||||||||||||||||||
| SC Public Service Auth. Rev. (Santee Cooper) |
500,000 | 5.75 | 12/1/43 | 586,610 | |||||||||||||||||||||
| SC State Hsg. Finance & Dev. Auth. Rev. |
500,000 | 3.05 | 7/1/45 | 522,925 | |||||||||||||||||||||
| SC State Hsg.Finance & Dev. Auth. Rev. |
910,000 | 4.00 | 1/1/47 | 975,183 | |||||||||||||||||||||
|
|
|
||||||||||||||||||||||||
| 4,202,905 | |||||||||||||||||||||||||
|
|
|
||||||||||||||||||||||||
| South Dakota - 0.2% |
|||||||||||||||||||||||||
| SD Health & Educational Facs. Auth. Rev. (Westhills Village Retirement Community) |
500,000 | 5.00 | 9/1/40 | 561,615 | |||||||||||||||||||||
|
|
|
||||||||||||||||||||||||
| Tennessee - 2.7% |
|||||||||||||||||||||||||
| Franklin Health & Education Facs. Board Rev. (Provision Cares Proton Therapy Center) 2, 4, 5 |
500,000 | 6.50 | 6/1/27 | 325,000 | |||||||||||||||||||||
| Nashville Metropolitan Dev. & Hsg. Agency Tax Allocation 4 |
300,000 | 5.13 | 6/1/36 | 314,829 | |||||||||||||||||||||
| Shelby Co. Health, Education & Hsg. Facs. Rev. (CME Memphis Apts. Proj.) 2, 5, 15 |
1,850,000 | 5.35 | N/A | 4,625 | |||||||||||||||||||||
| See accompanying notes to financial statements.
|
||
| 32 | SIT MUTUAL FUNDS SEMI-ANNUAL REPORT | |
|
|
|
|
| Name of Issuer | Principal Amount ($) |
Coupon Rate (%) |
Maturity Date |
Fair Value ($) | |||||||||||||||||||||
| Shelby Co. Health, Education & Hsg. Facs. Rev. (CME Memphis Apts. Proj.) 2, 5 |
7,875,000 | 5.55 | 1/1/29 | 19,688 | |||||||||||||||||||||
| Shelby Co. Health, Education & Hsg. Facs. Rev. (CME Memphis Apts. Proj.) 2, 5 |
1,630,000 | 6.00 | 1/1/29 | 16 | |||||||||||||||||||||
| Shelby Co. Health, Education & Hsg. Facs. Rev. (The Farms at Bailey Station Proj.) |
650,000 | 5.50 | 10/1/39 | 632,827 | |||||||||||||||||||||
| TN Hsg. Dev. Agency. Rev. |
335,000 | 3.60 | 1/1/31 | 348,902 | |||||||||||||||||||||
| TN Hsg. Dev. Agency. Rev. |
445,000 | 3.88 | 7/1/35 | 478,562 | |||||||||||||||||||||
| TN Hsg. Dev. Agency. Rev. |
245,000 | 3.95 | 7/1/35 | 264,220 | |||||||||||||||||||||
| TN Hsg. Dev. Agency. Rev. |
530,000 | 4.00 | 7/1/39 | 573,709 | |||||||||||||||||||||
| TN Hsg. Dev. Agency. Rev. |
490,000 | 3.85 | 7/1/42 | 533,164 | |||||||||||||||||||||
| TN Hsg. Dev. Agency. Rev. |
480,000 | 3.90 | 7/1/42 | 523,771 | |||||||||||||||||||||
| TN Hsg. Dev. Agency. Rev. |
1,000,000 | 4.00 | 7/1/44 | 1,101,570 | |||||||||||||||||||||
| TN Hsg. Dev. Agency. Rev. |
1,000,000 | 2.55 | 1/1/45 | 1,011,640 | |||||||||||||||||||||
| TN Hsg. Dev. Agency. Rev. |
995,000 | 3.95 | 1/1/49 | 1,057,745 | |||||||||||||||||||||
| TN Hsg. Dev. Agency. Rev. |
1,585,000 | 4.05 | 1/1/49 | 1,694,413 | |||||||||||||||||||||
|
|
|
||||||||||||||||||||||||
| 8,884,681 | |||||||||||||||||||||||||
|
|
|
||||||||||||||||||||||||
| Texas - 7.3% |
|||||||||||||||||||||||||
| Arlington Higher Education Finance Corp., Education Rev. (Leadership Prep School) |
200,000 | 5.00 | 6/15/36 | 201,540 | |||||||||||||||||||||
| Arlington Special Tax (BAM Insured) |
350,000 | 5.00 | 2/15/41 | 397,446 | |||||||||||||||||||||
| Brazoria Co. Municipal Utility District No. 28 G.O. (MAC Insured) |
540,000 | 4.00 | 9/1/27 | 553,576 | |||||||||||||||||||||
| Brazos Higher Education Auth., Inc. Rev. (Subordinate Student Loan) |
1,000,000 | 3.00 | 4/1/40 | 930,720 | |||||||||||||||||||||
| Cypress Hill Municipal Utility Dist. No. 1 G.O. (AGM Insured) |
1,000,000 | 4.00 | 9/1/34 | 1,034,190 | |||||||||||||||||||||
| Dallas/Fort Worth International Airport Rev. (JT Improvement) |
500,000 | 5.25 | 11/1/37 | 556,855 | |||||||||||||||||||||
| Danbury Higher Education Auth. Education Rev. (Golden Rule Schools) |
650,000 | 5.13 | 8/15/49 | 673,023 | |||||||||||||||||||||
| El Paso Co. Hospital District G.O. |
825,000 | 5.00 | 8/15/43 | 847,176 | |||||||||||||||||||||
| Fort Bend Co. Municipal Utility Dist. No. 50 G.O. (MAC Insured) |
400,000 | 4.00 | 9/1/29 | 407,804 | |||||||||||||||||||||
| Harris Co. Cultural Education Facs. Finance Corp. Rev. (Brazos Presbyterian Homes, Inc. Proj.) |
500,000 | 5.00 | 1/1/37 | 531,215 | |||||||||||||||||||||
| Harris Co. Municipal Utility Dist. No. 284 G.O. (MAC Insured) |
285,000 | 4.00 | 9/1/33 | 289,930 | |||||||||||||||||||||
| Harris Co. Municipal Utility Dist. No. 381 G.O. (BAM Insured) |
435,000 | 4.00 | 9/1/30 | 444,100 | |||||||||||||||||||||
| Harris Co. Municipal Utility Dist. No. 381 G.O. (BAM Insured) |
250,000 | 4.00 | 9/1/33 | 254,325 | |||||||||||||||||||||
| Harris Co. Municipal Utility Dist. No. 400 G.O. (BAM Insured) |
470,000 | 4.00 | 9/1/30 | 479,832 | |||||||||||||||||||||
| Harris Co. Municipal Utility Dist. No. 400 G.O. (BAM Insured) |
920,000 | 4.00 | 9/1/32 | 936,946 | |||||||||||||||||||||
| Harris Co. Municipal Utility Dist. No. 400 G.O. (BAM Insured) |
1,050,000 | 4.00 | 9/1/34 | 1,067,314 | |||||||||||||||||||||
| Houston Higher Education Finance Corp. (Cosmos Foundation) |
480,000 | 5.00 | 2/15/32 | 499,454 | |||||||||||||||||||||
| Meadowhill Regional Municipal Utility Dist. G.O. (AGM Insured) |
500,000 | 4.00 | 10/1/35 | 524,225 | |||||||||||||||||||||
| New Hope Cultural Education Fac. Corp. Rev. (Cardinal Bay) |
260,000 | 4.00 | 7/1/23 | 251,956 | |||||||||||||||||||||
| New Hope Cultural Education Fac. Corp. Rev. (Cardinal Bay) |
460,000 | 4.00 | 7/1/26 | 417,795 | |||||||||||||||||||||
| New Hope Cultural Education Fac. Corp. Rev. (Cardinal Bay) |
500,000 | 5.00 | 7/1/46 | 421,015 | |||||||||||||||||||||
| New Hope Cultural Education Facs. Corp. Rev. (Beta Academy) 4 |
425,000 | 5.00 | 8/15/39 | 440,538 | |||||||||||||||||||||
| New Hope Cultural Education Facs. Corp. Rev. (Cardinal Bay, Inc.) |
400,000 | 5.00 | 7/1/46 | 389,792 | |||||||||||||||||||||
| New Hope Cultural Education Facs. Corp. Rev. (Flower Mound Campus Proj.) 9 |
495,000 | 3.75 | 6/1/28 | 505,251 | |||||||||||||||||||||
| New Hope Cultural Education Facs. Corp. Rev. (Flower Mound Campus Proj.) 9 |
500,000 | 4.00 | 6/1/32 | 509,420 | |||||||||||||||||||||
| New Hope Cultural Education Facs. Corp. Rev. (Jubilee Academic Center) 4 |
250,000 | 5.00 | 8/15/36 | 252,018 | |||||||||||||||||||||
| New Hope Cultural Education Facs. Corp. Rev. (Presbyterian Village North Proj.) |
500,000 | 5.00 | 10/1/34 | 511,910 | |||||||||||||||||||||
| New Hope Cultural Education Facs. Corp. Rev. (Wesleyan Homes, Inc. Proj.) |
250,000 | 5.50 | 1/1/35 | 260,235 | |||||||||||||||||||||
| New Hope Cultural Education Facs. Finance Corp. Rev. (Presbyterian Village North Proj.) |
350,000 | 5.25 | 10/1/49 | 353,871 | |||||||||||||||||||||
| New Hope Cultural Education Facs. Finance Corp. Rev. (Wesleyan Homes, Inc. Proj.) |
750,000 | 5.00 | 1/1/55 | 750,442 | |||||||||||||||||||||
| Newark Higher Education Finance Corp. Rev. (Austin Achieve Public School) |
100,000 | 5.00 | 6/15/37 | 101,955 | |||||||||||||||||||||
| Newark Higher Education Finance Corp. Rev. (Austin Achieve Public School) |
1,000,000 | 5.00 | 6/15/42 | 1,016,240 | |||||||||||||||||||||
| North Central Texas Health Facility Development Corp. (CC Young Memorial Home) |
204,000 | 5.38 | 2/15/25 | 165,568 | |||||||||||||||||||||
| Parkway Utility Dist. G.O. (BAM Insured) |
500,000 | 3.63 | 3/1/35 | 507,165 | |||||||||||||||||||||
| Parkway Utility Dist. G.O. (Waterworks and Sewer System) (BAM Insured) |
275,000 | 4.00 | 3/1/33 | 282,890 | |||||||||||||||||||||
| Red River Health Facs. Dev. Corp. Rev. (MRC Crossings Proj.) |
250,000 | 7.50 | 11/15/34 | 259,702 | |||||||||||||||||||||
| Sugar Land Dev. Corp. Rev. (BAM Insured) |
500,000 | 5.00 | 2/15/33 | 553,045 | |||||||||||||||||||||
| See accompanying notes to financial statements.
|
||
| SEPTEMBER 30, 2020 | 33 | |
|
|
| SCHEDULE OF INVESTMENTS (Unaudited) September 30, 2020
Sit Tax-Free Income Fund (Continued) |
| Name of Issuer | Principal Amount ($) |
Coupon Rate (%) |
Maturity Date |
Fair Value ($) | |||||||||||||||||||||
| Tarrant Co. Cultural Education Facs. Finance Corp. Rev. (Buckingham Senior Living Community, Inc.) 2, 5 |
500,000 | 5.63 | 11/15/27 | 325,000 | |||||||||||||||||||||
| Tarrant Co. Cultural Education Facs. Finance Corp. Rev. (Buckner Retirement Service) |
500,000 | 5.00 | 11/15/37 | 574,715 | |||||||||||||||||||||
| Tarrant Co. Cultural Education Facs. Finance Corp. Rev. (Buckner Senior Living Ventana Proj.) |
200,000 | 5.63 | 11/15/24 | 200,186 | |||||||||||||||||||||
| TX Department of Housing & Community Affairs (GNMA Collateralized) |
500,000 | 4.13 | 9/1/38 | 564,160 | |||||||||||||||||||||
| TX Department of Housing & Community Affairs (GNMA Collateralized) |
1,100,000 | 3.63 | 9/1/44 | 1,193,082 | |||||||||||||||||||||
| TX Department of Housing & Community Affairs (GNMA Collateralized) |
500,000 | 3.00 | 9/1/45 | 520,095 | |||||||||||||||||||||
| TX Grand Parkway Transportation Corp. Rev. 6 |
500,000 | 6.00 | 10/1/35 | 576,820 | |||||||||||||||||||||
| TX State Affordable Hsg. Corp. Rev. (Heroes Home Loan Program) (GNMA Collateralized) |
105,000 | 3.00 | 3/1/35 | 112,986 | |||||||||||||||||||||
| TX State Affordable Hsg. Corp. Rev. (Heroes Home Loan Program) (GNMA Collateralized) |
970,000 | 4.00 | 3/1/50 | 1,068,630 | |||||||||||||||||||||
|
|
|
||||||||||||||||||||||||
| 23,716,153 | |||||||||||||||||||||||||
|
|
|
||||||||||||||||||||||||
| Utah - 0.4% |
|||||||||||||||||||||||||
| UT Charter School Finance Auth. Rev. (Spectrum Academy Proj.) 4 |
500,000 | 6.00 | 4/15/45 | 502,250 | |||||||||||||||||||||
| UT Hsg. Corp. Single Family Mtg. Rev. |
30,000 | 5.75 | 1/1/33 | 30,341 | |||||||||||||||||||||
| UT Hsg. Corp. Single Family Mtg. Rev. |
65,000 | 4.60 | 7/1/34 | 65,084 | |||||||||||||||||||||
| UT Hsg. Corp. Single Family Mtg. Rev. (FHA Insured) |
300,000 | 4.00 | 1/1/36 | 323,274 | |||||||||||||||||||||
| West Valley City Municipal Building Auth. Rev. (AGM Insured) |
400,000 | 5.00 | 2/1/39 | 476,604 | |||||||||||||||||||||
|
|
|
||||||||||||||||||||||||
| 1,397,553 | |||||||||||||||||||||||||
| Vermont - 0.2% |
|||||||||||||||||||||||||
| VT Hsg. Fin. Agy. Rev. (GNMA/FNMA/FHLMC Collateralized) |
460,000 | 3.50 | 5/1/38 | 492,356 | |||||||||||||||||||||
|
|
|
||||||||||||||||||||||||
| Virginia - 0.3% |
|||||||||||||||||||||||||
| VA Hsg. Dev. Auth. Rev. (Commonwealth Mtg.) |
300,000 | 3.88 | 1/1/38 | 310,713 | |||||||||||||||||||||
| VA Hsg. Dev. Auth. Rev. (Rental Hsg. Proj.) |
400,000 | 4.13 | 7/1/33 | 420,696 | |||||||||||||||||||||
| VA Hsg. Dev. Auth. Rev. (Rental Hsg. Proj.) (G.O. of Auth. Insured) |
250,000 | 4.60 | 12/1/38 | 251,095 | |||||||||||||||||||||
|
|
|
||||||||||||||||||||||||
| 982,504 | |||||||||||||||||||||||||
|
|
|
||||||||||||||||||||||||
| Washington - 3.1% |
|||||||||||||||||||||||||
| Kalispel Tribe of Indians Rev. 4 |
300,000 | 5.25 | 1/1/38 | 334,959 | |||||||||||||||||||||
| King Co. Hsg. Auth. Rev. |
1,000,000 | 3.00 | 11/1/39 | 1,051,450 | |||||||||||||||||||||
| King Co. Hsg. Auth. Rev. |
750,000 | 3.00 | 8/1/40 | 792,840 | |||||||||||||||||||||
| Pike Place Market Preservation Dev. Auth. Rev. |
500,000 | 5.00 | 12/1/40 | 542,760 | |||||||||||||||||||||
| Snohomish Co. Hsg. Auth. Rev. |
500,000 | 4.00 | 4/1/44 | 549,940 | |||||||||||||||||||||
| Vancouver Hsg. Auth. Rev. |
500,000 | 3.75 | 8/1/34 | 548,260 | |||||||||||||||||||||
| Vancouver Hsg. Auth. Rev. (Anthem Park & Columbia Hsg. Proj.) |
1,000,000 | 3.00 | 6/1/38 | 1,033,190 | |||||||||||||||||||||
| Vancouver Hsg. Auth. Rev. (Van Vista Plaza Proj.) |
1,000,000 | 3.30 | 12/1/51 | 1,051,560 | |||||||||||||||||||||
| WA Hsg. Fin. Commission Multi Family Mtg. Rev. (Bayview Manor Homes) 4 |
250,000 | 5.00 | 7/1/31 | 264,715 | |||||||||||||||||||||
| WA Hsg.Fin. Commission Multi Family Mtg. Rev. (Bayview Manor Homes) 4 |
850,000 | 5.00 | 7/1/36 | 887,434 | |||||||||||||||||||||
| WA Hsg. Fin. Commission Multi Family Mtg. Rev. (Horizon House Proj.) 4 |
500,000 | 5.00 | 1/1/38 | 540,965 | |||||||||||||||||||||
| WA Hsg. Fin. Commission Multi Family Mtg. Rev. (The Hearthstone Proj.) 4 |
1,075,000 | 5.00 | 7/1/38 | 1,094,963 | |||||||||||||||||||||
| WA Hsg. Fin. Commission Multi Family Mtg. Rev. (The Hearthstone Proj.) 4 |
525,000 | 5.00 | 7/1/48 | 525,630 | |||||||||||||||||||||
| WA Hsg.Fin. Commission Multi Family Mtg. Rev. (Transforming Age Proj.) 4 |
500,000 | 5.00 | 1/1/44 | 526,355 | |||||||||||||||||||||
| WA Hsg. Fin. Commission Multi Family Mtg. Rev. (Wesley Homes Lea Hill Proj.) 4 |
300,000 | 5.00 | 7/1/36 | 307,503 | |||||||||||||||||||||
| WA Hsg. Fin. Commission Single Family Mtg. Rev. (GNMA/FNMA/FHLMC Collateralized) |
60,000 | 4.60 | 10/1/33 | 60,875 | |||||||||||||||||||||
|
|
|
||||||||||||||||||||||||
| 10,113,399 | |||||||||||||||||||||||||
|
|
|
||||||||||||||||||||||||
| West Virginia - 0.5% |
|||||||||||||||||||||||||
| WV Hsg. Dev. Fund Rev. |
250,000 | 3.75 | 11/1/32 | 269,415 | |||||||||||||||||||||
| WV Hsg. Dev. Fund Rev. |
245,000 | 3.80 | 11/1/35 | 254,984 | |||||||||||||||||||||
| WV Hsg. Dev. Fund Rev. |
1,005,000 | 2.75 | 11/1/45 | 1,018,688 | |||||||||||||||||||||
| WV Hsg. Dev. Fund Rev. |
120,000 | 4.10 | 11/1/45 | 126,820 | |||||||||||||||||||||
|
|
|
||||||||||||||||||||||||
| 1,669,907 | |||||||||||||||||||||||||
|
|
|
||||||||||||||||||||||||
| See accompanying notes to financial statements.
|
||
| 34 | SIT MUTUAL FUNDS SEMI-ANNUAL REPORT | |
|
|
|
|
| Name of Issuer | Principal Amount ($) |
Coupon Rate (%) |
Maturity Date |
Fair Value ($) | |||||||||||||||||||||
| Wisconsin - 4.7% |
|||||||||||||||||||||||||
| WI Health & Education Facs. Auth. Rev. (Medical College) |
870,000 | 5.25 | 12/1/35 | 873,115 | |||||||||||||||||||||
| WI Health & Education Facs. Auth. Rev. (PHW Oconomowoc, Inc. Proj.) |
1,000,000 | 5.13 | 10/1/48 | 1,004,150 | |||||||||||||||||||||
| WI Health & Education Facs. Auth. Rev. (St. John’s Communities, Inc. Proj.) |
500,000 | 5.00 | 9/15/40 | 514,345 | |||||||||||||||||||||
| WI Health & Education Facs. Auth. Rev. (St. John’s Communities, Inc. Proj.) |
500,000 | 5.00 | 9/15/45 | 512,385 | |||||||||||||||||||||
| WI Health & Educational Facs. Auth. Rev. (Aspirus, Inc. Obligation Group) |
500,000 | 5.00 | 8/15/32 | 569,175 | |||||||||||||||||||||
| WI Health & Educational Facs. Auth. Rev. (Benevolent Corp. Cedar Community) |
300,000 | 5.00 | 6/1/37 | 316,779 | |||||||||||||||||||||
| WI Health & Educational Facs. Auth. Rev. (Froedtert Health, Inc. Obligated Group) |
500,000 | 5.00 | 4/1/35 | 604,570 | |||||||||||||||||||||
| WI Health & Educational Facs. Auth. Rev. (St. Camillus Health System, Inc.) |
745,000 | 5.00 | 11/1/27 | 806,336 | |||||||||||||||||||||
| WI Health & Educational Facs. Auth. Rev. (St. Camillus Health System, Inc.) |
350,000 | 5.00 | 11/1/46 | 355,957 | |||||||||||||||||||||
| WI Health & Educational Facs. Auth. Rev. (Three Pillars Senior Living Communities) |
920,000 | 5.00 | 8/15/43 | 972,606 | |||||||||||||||||||||
| WI Health & Educational Facs. Auth. Rev. (Three Pillars Senior Living Communities) |
80,000 | 5.00 | 8/15/43 | 90,390 | |||||||||||||||||||||
| WI Housing & Economic Dev. Auth. Rev. |
250,000 | 3.88 | 11/1/35 | 268,912 | |||||||||||||||||||||
| WI Housing & Economic Dev. Auth. Rev. |
560,000 | 3.90 | 11/1/42 | 607,673 | |||||||||||||||||||||
| WI Housing & Economic Dev. Auth. Rev. |
1,500,000 | 4.15 | 5/1/55 | 1,621,530 | |||||||||||||||||||||
| WI Public Finance Auth. Rev. (ACTS Retirement-Life Community, Inc.) |
600,000 | 4.00 | 11/15/37 | 666,732 | |||||||||||||||||||||
| WI Public Finance Auth. Rev. (Coral Academy of Science Reno) 4 |
700,000 | 5.00 | 6/1/39 | 725,214 | |||||||||||||||||||||
| WI Public Finance Auth. Rev. (Delray Beach Radiation Therapy) 4 |
750,000 | 6.25 | 11/1/28 | 804,472 | |||||||||||||||||||||
| WI Public Finance Auth. Rev. (Glenridge Palmer Ranch Proj.) 4 |
500,000 | 8.25 | 6/1/46 | 524,095 | |||||||||||||||||||||
| WI Public Finance Auth. Rev. (Lombard Public Facilities Corp.) 2, 4, 6 |
16,520 | 9.00 | 1/1/46 | 410 | |||||||||||||||||||||
| WI Public Finance Auth. Rev. (Lombard Public Facilities Corp.) 2, 4, 6 |
16,287 | 9.00 | 1/1/47 | 388 | |||||||||||||||||||||
| WI Public Finance Auth. Rev. (Lombard Public Facilities Corp.) 2, 4, 6 |
447 | 12.00 | 1/1/47 | 11 | |||||||||||||||||||||
| WI Public Finance Auth. Rev. (Lombard Public Facilities Corp.) 2, 4, 6 |
16,171 | 9.00 | 1/1/48 | 378 | |||||||||||||||||||||
| WI Public Finance Auth. Rev. (Lombard Public Facilities Corp.) 2, 4, 6 |
390 | 12.00 | 1/1/48 | 9 | |||||||||||||||||||||
| WI Public Finance Auth. Rev. (Lombard Public Facilities Corp.) 2, 4, 6 |
16,055 | 9.00 | 1/1/49 | 367 | |||||||||||||||||||||
| WI Public Finance Auth. Rev. (Lombard Public Facilities Corp.) 2, 4, 6 |
384 | 11.00 | 1/1/49 | 9 | |||||||||||||||||||||
| WI Public Finance Auth. Rev. (Lombard Public Facilities Corp.) 2, 4, 6 |
15,822 | 9.00 | 1/1/50 | 347 | |||||||||||||||||||||
| WI Public Finance Auth. Rev. (Lombard Public Facilities Corp.) 2, 4, 6 |
372 | 11.00 | 1/1/50 | 8 | |||||||||||||||||||||
| WI Public Finance Auth. Rev. (Lombard Public Facilities Corp.) 2, 4, 6 |
17,334 | 9.00 | 1/1/51 | 372 | |||||||||||||||||||||
| WI Public Finance Auth. Rev. (Lombard Public Facilities Corp.) 2, 4, 6 |
365 | 11.00 | 1/1/51 | 8 | |||||||||||||||||||||
| WI Public Finance Auth. Rev. (Lombard Public Facilities Corp.) 1, 2, 4 |
446,246 | 3.75 | 7/1/51 | 281,947 | |||||||||||||||||||||
| WI Public Finance Auth. Rev. (Lombard Public Facilities Corp.) 2, 4, 6 |
17,218 | 9.00 | 1/1/52 | 355 | |||||||||||||||||||||
| WI Public Finance Auth. Rev. (Lombard Public Facilities Corp.) 2, 4, 6 |
475 | 10.00 | 1/1/52 | 10 | |||||||||||||||||||||
| WI Public Finance Auth. Rev. (Lombard Public Facilities Corp.) 2, 4, 6 |
16,985 | 9.00 | 1/1/53 | 343 | |||||||||||||||||||||
| WI Public Finance Auth. Rev. (Lombard Public Facilities Corp.) 2, 4, 6 |
469 | 10.00 | 1/1/53 | 9 | |||||||||||||||||||||
| WI Public Finance Auth. Rev. (Lombard Public Facilities Corp.) 2, 4, 6 |
16,869 | 9.00 | 1/1/54 | 330 | |||||||||||||||||||||
| WI Public Finance Auth. Rev. (Lombard Public Facilities Corp.) 2, 4, 6 |
453 | 10.00 | 1/1/54 | 9 | |||||||||||||||||||||
| WI Public Finance Auth. Rev. (Lombard Public Facilities Corp.) 2, 4, 6 |
16,636 | 9.00 | 1/1/55 | 318 | |||||||||||||||||||||
| WI Public Finance Auth. Rev. (Lombard Public Facilities Corp.) 2, 4, 6 |
444 | 9.00 | 1/1/55 | 8 | |||||||||||||||||||||
| WI Public Finance Auth. Rev. (Lombard Public Facilities Corp.) 2, 4, 6 |
16,404 | 9.00 | 1/1/56 | 307 | |||||||||||||||||||||
| WI Public Finance Auth. Rev. (Lombard Public Facilities Corp.) 2, 4, 6 |
434 | 9.00 | 1/1/56 | 8 | |||||||||||||||||||||
| WI Public Finance Auth. Rev. (Lombard Public Facilities Corp.) 2, 4 |
22,407 | 5.50 | 7/1/56 | 16,196 | |||||||||||||||||||||
| WI Public Finance Auth. Rev. (Lombard Public Facilities Corp.) 2, 4, 6 |
16,287 | 9.00 | 1/1/57 | 296 | |||||||||||||||||||||
| WI Public Finance Auth. Rev. (Lombard Public Facilities Corp.) 2, 4, 6 |
481 | 9.00 | 1/1/57 | 9 | |||||||||||||||||||||
| WI Public Finance Auth. Rev. (Lombard Public Facilities Corp.) 2, 4, 6 |
16,055 | 9.00 | 1/1/58 | 284 | |||||||||||||||||||||
| WI Public Finance Auth. Rev. (Lombard Public Facilities Corp.) 2, 4, 6 |
469 | 9.00 | 1/1/58 | 8 | |||||||||||||||||||||
| WI Public Finance Auth. Rev. (Lombard Public Facilities Corp.) 2, 4, 6 |
15,938 | 9.00 | 1/1/59 | 276 | |||||||||||||||||||||
| WI Public Finance Auth. Rev. (Lombard Public Facilities Corp.) 2, 4, 6 |
456 | 9.00 | 1/1/59 | 8 | |||||||||||||||||||||
| WI Public Finance Auth. Rev. (Lombard Public Facilities Corp.) 2, 4, 6 |
447 | 8.00 | 1/1/60 | 7 | |||||||||||||||||||||
| WI Public Finance Auth. Rev. (Lombard Public Facilities Corp.) 2, 4, 6 |
15,822 | 9.00 | 1/1/60 | 265 | |||||||||||||||||||||
| WI Public Finance Auth. Rev. (Lombard Public Facilities Corp.) 2, 4, 6 |
440 | 8.00 | 1/1/61 | 7 | |||||||||||||||||||||
| WI Public Finance Auth. Rev. (Lombard Public Facilities Corp.) 2, 4, 6 |
15,589 | 9.00 | 1/1/61 | 253 | |||||||||||||||||||||
| See accompanying notes to financial statements.
|
||
| SEPTEMBER 30, 2020 | 35 | |
|
|
| SCHEDULE OF INVESTMENTS (Unaudited) September 30, 2020
Sit Tax-Free Income Fund (Continued) |
| Name of Issuer | Principal Amount ($) Quantity |
Coupon Rate (%) |
Maturity Date |
Fair Value ($) | |||||||||||||||||||||
| WI Public Finance Auth. Rev. (Lombard Public Facilities Corp.) 2, 4, 6 |
428 | 8.00 | 1/1/62 | 7 | |||||||||||||||||||||
| WI Public Finance Auth. Rev. (Lombard Public Facilities Corp.) 2, 4, 6 |
15,473 | 9.00 | 1/1/62 | 244 | |||||||||||||||||||||
| WI Public Finance Auth. Rev. (Lombard Public Facilities Corp.) 2, 4, 6 |
419 | 8.00 | 1/1/63 | 6 | |||||||||||||||||||||
| WI Public Finance Auth. Rev. (Lombard Public Facilities Corp.) 2, 4, 6 |
15,240 | 9.00 | 1/1/63 | 234 | |||||||||||||||||||||
| WI Public Finance Auth. Rev. (Lombard Public Facilities Corp.) 2, 4, 6 |
409 | 8.00 | 1/1/64 | 6 | |||||||||||||||||||||
| WI Public Finance Auth. Rev. (Lombard Public Facilities Corp.) 2, 4, 6 |
15,124 | 9.00 | 1/1/64 | 228 | |||||||||||||||||||||
| WI Public Finance Auth. Rev. (Lombard Public Facilities Corp.) 2, 4, 6 |
403 | 7.00 | 1/1/65 | 6 | |||||||||||||||||||||
| WI Public Finance Auth. Rev. (Lombard Public Facilities Corp.) 2, 4, 6 |
15,008 | 9.00 | 1/1/65 | 218 | |||||||||||||||||||||
| WI Public Finance Auth. Rev. (Lombard Public Facilities Corp.) 2, 4, 6 |
434 | 7.00 | 1/1/66 | 6 | |||||||||||||||||||||
| WI Public Finance Auth. Rev. (Lombard Public Facilities Corp.) 2, 4, 6 |
14,775 | 9.00 | 1/1/66 | 204 | |||||||||||||||||||||
| WI Public Finance Auth. Rev. (Lombard Public Facilities Corp.) 2, 4, 6 |
5,235 | 5.00 | 1/1/67 | 67 | |||||||||||||||||||||
| WI Public Finance Auth. Rev. (Lombard Public Facilities Corp.) 2, 4, 6 |
192,429 | 9.00 | 1/1/67 | 2,455 | |||||||||||||||||||||
| WI Public Finance Auth. Rev. (MD Proton Treatment Center) 4 |
500,000 | 6.13 | 1/1/33 | 431,785 | |||||||||||||||||||||
| WI Public Finance Auth. Rev. (MN College of Osteopathic Medicine) 2, 4, 5 |
7,608 | 5.50 | 12/1/48 | 3,804 | |||||||||||||||||||||
| WI Public Finance Auth. Rev. (Mountain Island Charter School) |
820,000 | 5.00 | 7/1/37 | 878,614 | |||||||||||||||||||||
| WI Public Finance Auth. Rev. (North Carolina Leadership Academy) 4 |
410,000 | 5.00 | 6/15/39 | 422,886 | |||||||||||||||||||||
| WI Public Finance Auth. Rev. (Rose Villa Proj.) 4 |
420,000 | 5.00 | 11/15/24 | 439,891 | |||||||||||||||||||||
| WI Public Finance Auth. Rev. (Roseman University Health Sciences) |
240,000 | 5.00 | 4/1/25 | 252,084 | |||||||||||||||||||||
| WI Public Finance Auth. Rev. (Roseman University Health Sciences) |
500,000 | 5.50 | 4/1/32 | 515,055 | |||||||||||||||||||||
| WI Public Finance Auth. Rev. (Southminster) 4 |
250,000 | 5.00 | 10/1/43 | 256,122 | |||||||||||||||||||||
|
|
|
||||||||||||||||||||||||
| 15,345,918 | |||||||||||||||||||||||||
|
|
|
||||||||||||||||||||||||
| Wyoming - 0.3% |
|||||||||||||||||||||||||
| WY Community Dev. Auth. Rev. |
265,000 | 3.75 | 12/1/32 | 274,058 | |||||||||||||||||||||
| WY Community Dev. Auth. Rev. |
335,000 | 3.90 | 12/1/38 | 358,473 | |||||||||||||||||||||
| WY Community Dev. Auth. Rev. |
285,000 | 4.05 | 12/1/38 | 294,667 | |||||||||||||||||||||
|
|
|
||||||||||||||||||||||||
| 927,198 | |||||||||||||||||||||||||
|
|
|
||||||||||||||||||||||||
| Total Municipal Bonds |
301,368,985 | ||||||||||||||||||||||||
|
|
|
||||||||||||||||||||||||
| Investment Companies - 5.3% |
|||||||||||||||||||||||||
| BlackRock Long-Term Municipal Advantage Trust (BTA) |
59,383 | 700,719 | |||||||||||||||||||||||
| BlackRock Municipal Income Investment Quality Trust (BAF) |
28,500 | 402,705 | |||||||||||||||||||||||
| BlackRock MuniEnhanced Fund, Inc. (MEN) |
26,706 | 301,778 | |||||||||||||||||||||||
| BlackRock MuniHoldings Florida Insured Fund (MFL) |
85,398 | 1,145,187 | |||||||||||||||||||||||
| BlackRock MuniHoldings Fund II, Inc. (MUH) |
36,000 | 528,120 | |||||||||||||||||||||||
| BlackRock MuniHoldings Quality Fund II, Inc. (MUE) |
57,814 | 736,550 | |||||||||||||||||||||||
| BlackRock MuniHoldings Quality Fund, Inc. (MUS) |
51,538 | 663,809 | |||||||||||||||||||||||
| BlackRock MuniYield Insured Fund (MYI) |
71,171 | 956,538 | |||||||||||||||||||||||
| BlackRock MuniYield Michigan Insured Fund (MIY) |
21,538 | 301,963 | |||||||||||||||||||||||
| BNY Mellon Strategic Municipal Bond Fund, Inc. (DSM) |
20,000 | 145,800 | |||||||||||||||||||||||
| DWS Municipal, Income Trust (KTF) |
93,236 | 1,033,055 | |||||||||||||||||||||||
| DWS Strategic Municipal Income Trust (KSM) |
15,000 | 162,750 | |||||||||||||||||||||||
| Eaton Vance Municipal Bond Fund (EIM) |
12,645 | 166,535 | |||||||||||||||||||||||
| Invesco Municipal Opportunity Trust (VMO) |
67,520 | 825,094 | |||||||||||||||||||||||
| Invesco Municipal Trust (VKQ) |
76,548 | 919,341 | |||||||||||||||||||||||
| Invesco Quality Municipal Income Trust (IQI) |
80,200 | 991,272 | |||||||||||||||||||||||
| Invesco Van Kampen Advantage Muni Income Trust (VKI) |
76,507 | 827,041 | |||||||||||||||||||||||
| Invesco Van Kampen Trust For Investment Grade Municipals (VGM) |
71,847 | 892,340 | |||||||||||||||||||||||
| Nuveen AMT-Free Quality Municipal Income Fund (NEA) |
163,972 | 2,351,358 | |||||||||||||||||||||||
| Nuveen Dividend Advantage Municipal Income Fund (NVG) |
20,000 | 313,200 | |||||||||||||||||||||||
| Nuveen Pennsylvania Quality Municipal Income Fund (NQP) |
5,000 | 67,200 | |||||||||||||||||||||||
| See accompanying notes to financial statements.
|
||
| 36 | SIT MUTUAL FUNDS SEMI-ANNUAL REPORT | |
|
|
|
|
| Name of Issuer | Quantity | Fair Value ($) | |||||||||||||
| Nuveen Quality Municipal Income Fund (NAD) |
163,973 | 2,380,888 | |||||||||||||
| Putnam Municipal Opportunities Trust (PMO) |
15,000 | 194,550 | |||||||||||||
|
|
|
||||||||||||||
| Total Investment Companies |
17,007,793 | ||||||||||||||
|
|
|
||||||||||||||
| Total Investments in Securities - 98.3% |
318,376,778 | ||||||||||||||
| Other Assets and Liabilities, net - 1.7% |
5,630,495 | ||||||||||||||
|
|
|
||||||||||||||
| Total Net Assets - 100.0% |
$324,007,273 | ||||||||||||||
|
|
|
||||||||||||||
| 1 | Variable rate security. Rate disclosed is as of September 30, 2020. Certain variable rate securities are not based on a published reference rate and spread but are determined by the issuer or agent and are based on current market conditions, or, for mortgage-backed securities, are impacted by the individual mortgages which are paying off over time. These securities do not indicate a reference rate and spread in their descriptions. |
| 2 | Securities considered illiquid by the Investment Adviser. The total value of such securities as of September 30, 2020 was $2,716,604 and represented 0.8% of net assets. |
| 4 | 144A Restricted Security. The total value of such securities as of September 30, 2020 was $31,221,522 and represented 9.6% of net assets. These securities have been determined to be liquid by the Adviser in accordance with guidelines established by the Board of Directors. |
| 5 | The issuer is in default of interest or principal payments, or other debt covenants. Income is not being accrued. The total value of such securities as of September 30, 2020 was $2,968,514 and represented 0.9% of net assets. |
| 6 | Zero coupon or convertible capital appreciation bond, for which the rate disclosed is either the effective yield on purchase date or the coupon rate to be paid upon conversion to coupon paying. |
| 9 | Municipal Lease Security. The total value of such securities as of September 30, 2020 was $5,020,261 and represented 1.6% of net assets. These securities have been determined to be liquid by the Adviser in accordance with guidelines established by the Board of Directors. |
| 15 | Securities with a “N/A” maturity date have passed their stated maturity date and have pending restructuring arrangements. |
Numeric footnotes not disclosed are not applicable to this Schedule of Investments.
A summary of the levels for the Fund’s investments as of September 30, 2020 is as follows (see Note 2 - significant accounting policies in the notes to financial statements):
| Investment in Securities | ||||||||||||||||
|
|
|
|||||||||||||||
| Level 1 Price ($) |
Level 2 Other significant observable inputs ($) |
Level 3 Significant unobservable inputs ($) |
Total ($) | |||||||||||||
|
|
|
|||||||||||||||
| Assets |
||||||||||||||||
| Municipal Bonds |
— | 301,368,985 | — | 301,368,985 | ||||||||||||
| Investment Companies |
17,007,793 | — | — | 17,007,793 | ||||||||||||
|
|
|
|||||||||||||||
| 17,007,793 | 301,368,985 | — | 318,376,778 | |||||||||||||
|
|
|
|||||||||||||||
There were no transfers into or out of level 3 during the reporting period.
| See accompanying notes to financial statements.
|
||
| SEPTEMBER 30, 2020 | 37 | |
|
Sit Minnesota Tax-Free Income Fund
|
OBJECTIVE & STRATEGY
The investment objective of the Minnesota Tax-Free Income Fund is to provide a high level of current income exempt from federal regular income tax and Minnesota regular personal income tax as is consistent with the preservation of capital.
During normal market conditions, the Fund invests 100% of its net assets in municipal securities that generate interest income that is exempt from federal regular income tax and Minnesota regular personal income tax. The Fund anticipates that substantially all of its distributions to its shareholders will be exempt as such. For investors subject to the alternative minimum tax (“AMT”), up to 20% of the Fund’s income may be alternative minimum taxable income.
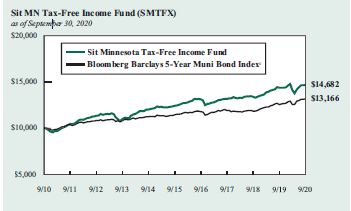
| 38 |
SIT MUTUAL FUNDS SEMI-ANNUAL REPORT |
|
|
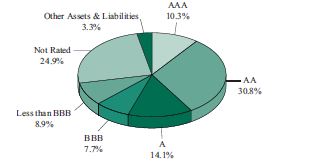
| SEPTEMBER 30, 2020 | 39 | |
|
|
| SCHEDULE OF INVESTMENTS (Unaudited) September 30, 2020
Sit Minnesota Tax-Free Income Fund |
| Name of Issuer | Principal Amount ($) |
Coupon Rate (%) |
Maturity Date |
Fair Value ($) | ||||||||||
| Municipal Bonds - 95.7% |
||||||||||||||
| Education/Student Loan - 15.6% |
||||||||||||||
| Baytown Township Rev. (St. Croix Prep) |
1,000,000 | 4.00 | 8/1/36 | 1,030,920 | ||||||||||
| Baytown Township Rev. (St. Croix Prep) |
1,250,000 | 4.00 | 8/1/41 | 1,275,375 | ||||||||||
| Baytown Township Rev. (St. Croix Prep) |
1,935,000 | 4.25 | 8/1/46 | 1,986,181 | ||||||||||
| Bethel Charter School Lease Rev. (Spectrum High School Proj.) |
500,000 | 3.50 | 7/1/27 | 513,405 | ||||||||||
| Bethel Charter School Lease Rev. (Spectrum High School Proj.) |
900,000 | 4.00 | 7/1/32 | 945,018 | ||||||||||
| Bethel Charter School Lease Rev. (Spectrum High School Proj.) |
1,100,000 | 4.00 | 7/1/37 | 1,134,760 | ||||||||||
| Bethel Charter School Lease Rev. (Spectrum High School Proj.) |
1,750,000 | 4.25 | 7/1/47 | 1,801,642 | ||||||||||
| Brooklyn Park Charter School Lease Rev. (Athlos Leadership Academy Proj.) |
605,000 | 5.25 | 7/1/30 | 638,438 | ||||||||||
| Cologne Charter School Lease Rev. (Cologne Academy Proj.) |
285,000 | 4.00 | 7/1/21 | 289,520 | ||||||||||
| Cologne Charter School Lease Rev. (Cologne Academy Proj.) |
295,000 | 4.00 | 7/1/22 | 305,487 | ||||||||||
| Cologne Charter School Lease Rev. (Cologne Academy Proj.) |
575,000 | 5.00 | 7/1/29 | 622,023 | ||||||||||
| Cologne Charter School Lease Rev. (Cologne Academy Proj.) |
500,000 | 5.00 | 7/1/34 | 530,795 | ||||||||||
| Deephaven Charter School Lease Rev. (Eagle Ridge Academy Proj.) |
855,000 | 5.25 | 7/1/37 | 933,156 | ||||||||||
| Deephaven Charter School Lease Rev. (Eagle Ridge Academy Proj.) |
600,000 | 5.25 | 7/1/40 | 651,540 | ||||||||||
| Deephaven Charter School Lease Rev. (Eagle Ridge Academy Proj.) |
1,000,000 | 5.50 | 7/1/50 | 1,087,180 | ||||||||||
| Forest Lake Charter School Lease Rev. (Lake International Language Academy) |
580,000 | 4.50 | 8/1/26 | 614,179 | ||||||||||
| Forest Lake Charter School Lease Rev. (Lake International Language Academy) |
1,000,000 | 5.00 | 8/1/36 | 1,100,380 | ||||||||||
| Forest Lake Charter School Lease Rev. (Lake International Language Academy) |
750,000 | 5.50 | 8/1/36 | 793,305 | ||||||||||
| Ham Lake Charter School Lease Rev. (Davinci Academy Proj.) |
875,000 | 5.00 | 7/1/31 | 940,214 | ||||||||||
| Ham Lake Charter School Lease Rev. (Davinci Academy Proj.) |
1,000,000 | 5.00 | 7/1/36 | 1,063,560 | ||||||||||
| Ham Lake Charter School Lease Rev. (Parnassus Prep. Sch. Proj.) |
1,000,000 | 4.00 | 11/1/26 | 1,045,590 | ||||||||||
| Ham Lake Charter School Lease Rev. (Parnassus Prep. Sch. Proj.) |
2,720,000 | 5.00 | 11/1/36 | 2,943,203 | ||||||||||
| Hugo Charter School Lease Rev. (Noble Academy Proj.) |
460,000 | 4.00 | 7/1/21 | 466,297 | ||||||||||
| Hugo Charter School Lease Rev. (Noble Academy Proj.) |
750,000 | 5.00 | 7/1/29 | 806,340 | ||||||||||
| Hugo Charter School Lease Rev. (Noble Academy Proj.) |
1,000,000 | 5.00 | 7/1/34 | 1,061,590 | ||||||||||
| Independence Charter School Lease Rev. (Beacon Academy Proj.) |
440,000 | 4.25 | 7/1/26 | 454,938 | ||||||||||
| Independence Charter School Lease Rev. (Beacon Academy Proj.) |
750,000 | 4.75 | 7/1/31 | 770,820 | ||||||||||
| Independence Charter School Lease Rev. (Beacon Academy Proj.) |
1,200,000 | 5.00 | 7/1/36 | 1,222,092 | ||||||||||
| Minneapolis Charter School Lease Rev. (Hiawatha Academy Proj.) |
800,000 | 4.00 | 7/1/26 | 825,464 | ||||||||||
| Minneapolis Educational Fac. Lease Rev. (Seed/Harvest Preparatory Proj.) 4 |
270,000 | 6.25 | 3/1/21 | 263,893 | ||||||||||
| Minneapolis School Lease Rev. (Friendship Academy of the Arts) 4 |
585,000 | 4.00 | 12/1/31 | 579,776 | ||||||||||
| Minneapolis School Lease Rev. (Friendship Academy of the Arts) 4 |
1,385,000 | 5.25 | 12/1/43 | 1,437,616 | ||||||||||
| Minneapolis School Lease Rev. (Twin Cities International School) 4 |
1,000,000 | 4.25 | 12/1/27 | 1,052,950 | ||||||||||
| Minneapolis School Lease Rev. (Twin Cities International School) 4 |
1,000,000 | 5.00 | 12/1/37 | 1,061,060 | ||||||||||
| MN Higher Education Fac. Auth. Rev. (Augsburg College) |
1,925,000 | 4.25 | 5/1/40 | 1,802,532 | ||||||||||
| MN Higher Education Fac. Auth. Rev. (Bethel Univ.) |
1,200,000 | 5.00 | 5/1/37 | 1,298,244 | ||||||||||
| MN Higher Education Fac. Auth. Rev. (Bethel Univ.) |
3,500,000 | 5.00 | 5/1/47 | 3,717,000 | ||||||||||
| MN Higher Education Fac. Auth. Rev. (College of St. Benedict) |
1,000,000 | 4.00 | 3/1/43 | 1,017,240 | ||||||||||
| MN Higher Education Fac. Auth. Rev. (College of St. Benedict) |
1,900,000 | 5.00 | 3/1/37 | 2,078,201 | ||||||||||
| MN Higher Education Fac. Auth. Rev. (College of St. Scholastica) |
1,100,000 | 4.00 | 12/1/40 | 1,160,423 | ||||||||||
| MN Higher Education Fac. Auth. Rev. (Gustavus Adolphus College) |
1,250,000 | 4.00 | 10/1/41 | 1,322,762 | ||||||||||
| MN Higher Education Fac. Auth. Rev. (St. Olaf College) |
500,000 | 4.00 | 10/1/32 | 560,375 | ||||||||||
| MN Higher Education Fac. Auth. Rev. (St. Olaf College) |
500,000 | 4.00 | 10/1/34 | 555,690 | ||||||||||
| MN Higher Education Fac. Auth. Rev. (St. Olaf College) |
500,000 | 4.00 | 10/1/35 | 553,940 | ||||||||||
| MN Higher Education Fac. Auth. Rev. (Univ. of St. Thomas) |
400,000 | 4.00 | 10/1/35 | 445,704 | ||||||||||
| MN Higher Education Fac. Auth. Rev. (Univ. of St. Thomas) |
500,000 | 4.00 | 10/1/37 | 553,610 | ||||||||||
| MN Higher Education Fac. Auth. Rev. (Univ. of St. Thomas) |
3,150,000 | 4.00 | 4/1/39 | 3,409,214 | ||||||||||
| MN Higher Education Fac. Auth. Rev. (Univ. of St. Thomas) |
750,000 | 4.00 | 10/1/41 | 830,625 | ||||||||||
| MN Higher Education Fac. Auth. Rev. (Univ. of St. Thomas) |
4,000,000 | 4.00 | 10/1/44 | 4,397,720 | ||||||||||
| MN Higher Education Fac. Auth. Rev. (Univ. of St. Thomas) |
750,000 | 5.00 | 4/1/35 | 870,045 | ||||||||||
| MN Higher Education Fac. Auth. Rev. (Univ. of St. Thomas) |
850,000 | 5.00 | 10/1/40 | 1,023,893 | ||||||||||
| See accompanying notes to financial statements.
|
||
| 40 | SIT MUTUAL FUNDS SEMI-ANNUAL REPORT | |
|
|
|
|
| Name of Issuer | Principal Amount ($) |
Coupon Rate (%) |
Maturity Date |
Fair Value ($) | ||||||||||||
| MN Office of Higher Education Rev. 8 |
3,500,000 | 2.65 | 11/1/38 | 3,456,985 | ||||||||||||
| MN Office of Higher Education Rev. 8 |
5,000,000 | 4.00 | 11/1/37 | 5,428,200 | ||||||||||||
| Moorhead Educational Fac. Rev. (Concordia College Corp. Proj.) |
1,250,000 | 5.00 | 12/1/40 | 1,361,850 | ||||||||||||
| Olmsted Co. Hsg. & Redev. Auth. Rev. (Schaeffer Academy Proj.) |
504,162 | 4.98 | 4/25/27 | 504,253 | ||||||||||||
| Ramsey Lease Rev. (Pact Charter School Proj.) |
385,000 | 5.00 | 12/1/26 | 398,902 | ||||||||||||
| Ramsey Lease Rev. (Pact Charter School Proj.) |
1,850,000 | 5.50 | 12/1/33 | 1,912,364 | ||||||||||||
| Rice Co. Educational Fac. Rev. (Shattuck-St. Mary’s School) 4 |
3,300,000 | 5.00 | 8/1/22 | 3,373,491 | ||||||||||||
| Rochester Rev. (Math & Science Academy) |
1,430,000 | 5.13 | 9/1/38 | 1,525,166 | ||||||||||||
| Savage Charter School Lease Rev. (Aspen Academy) |
500,000 | 4.00 | 10/1/26 | 506,390 | ||||||||||||
| Savage Charter School Lease Rev. (Aspen Academy) |
1,000,000 | 4.75 | 10/1/31 | 1,034,250 | ||||||||||||
| St. Cloud Charter School Lease Rev. (Stride Academy Proj.) 2 |
350,000 | 3.00 | 4/1/21 | 238,000 | ||||||||||||
| St. Cloud Charter School Lease Rev. (Stride Academy Proj.) 2 |
1,850,000 | 5.00 | 4/1/36 | 1,258,000 | ||||||||||||
| St. Paul Hsg. & Redev. Auth. |
700,000 | 5.00 | 12/1/30 | 768,698 | ||||||||||||
| St. Paul Hsg. & Redev. Auth. |
1,150,000 | 5.00 | 12/1/37 | 1,245,094 | ||||||||||||
| St. Paul Hsg. & Redev. Auth. |
705,000 | 5.00 | 12/1/46 | 751,058 | ||||||||||||
| St. Paul Hsg. & Redev. Auth. (German Immersion School) |
285,000 | 4.00 | 7/1/23 | 293,824 | ||||||||||||
| St. Paul Hsg. & Redev. Auth. (German Immersion School) |
855,000 | 5.00 | 7/1/33 | 898,348 | ||||||||||||
| St. Paul Hsg. & Redev. Auth. (German Immersion School) |
500,000 | 5.00 | 7/1/44 | 519,455 | ||||||||||||
| St. Paul Hsg. & Redev. Auth. (Higher Ground Academy Proj.) |
1,065,000 | 4.25 | 12/1/23 | 1,111,253 | ||||||||||||
| St. Paul Hsg. & Redev. Auth. (Higher Ground Academy Proj.) |
1,500,000 | 5.00 | 12/1/33 | 1,580,775 | ||||||||||||
| St. Paul Hsg. & Redev. Auth. (Higher Ground Academy Proj.) |
390,000 | 5.13 | 12/1/38 | 409,988 | ||||||||||||
| St. Paul Hsg. & Redev. Auth. (Hope Community Academy Proj.) |
720,000 | 4.50 | 12/1/29 | 741,730 | ||||||||||||
| St. Paul Hsg. & Redev. Auth. (St. Paul Conservatory for Performing Artists) |
1,135,000 | 4.63 | 3/1/43 | 1,149,301 | ||||||||||||
| St. Paul Hsg. & Redev. Auth. (Twin Cities Academy Proj.) |
1,185,000 | 4.00 | 7/1/25 | 1,239,332 | ||||||||||||
| St. Paul Hsg. & Redev. Auth. (Twin Cities Academy Proj.) |
955,000 | 5.00 | 7/1/35 | 1,010,676 | ||||||||||||
| St. Paul Hsg. & Redev. Auth. (Twin Cities German Immersion School) |
555,000 | 5.00 | 7/1/49 | 606,371 | ||||||||||||
| St. Paul Hsg. & Redev. Auth. (Twin Cities German Immersion School) |
870,000 | 5.00 | 7/1/55 | 945,072 | ||||||||||||
| St. Paul Hsg. & Redev. Auth. Lease Rev. (Hmong College Preparatory Academy) |
195,000 | 4.75 | 9/1/22 | 197,469 | ||||||||||||
| St. Paul Hsg. & Redev. Auth. Lease Rev. (Hmong College Preparatory Academy) |
500,000 | 5.00 | 9/1/27 | 506,400 | ||||||||||||
| St. Paul Hsg. & Redev. Auth. Lease Rev. (Nova Classical Academy Proj.) |
135,000 | 5.70 | 9/1/21 | 140,351 | ||||||||||||
| St. Paul Hsg. & Redev. Auth. Rev. (Community of Peace Academy Proj.) |
600,000 | 4.00 | 12/1/39 | 631,986 | ||||||||||||
| St. Paul Hsg. & Redev. Auth. Rev. (Community of Peace Academy Proj.) |
1,000,000 | 4.00 | 12/1/49 | 1,030,850 | ||||||||||||
| St. Paul Hsg. & Redev. Auth. Rev. (Hmong College Preparatory Academy Proj.) |
1,000,000 | 5.25 | 9/1/31 | 1,142,610 | ||||||||||||
| St. Paul Hsg. & Redev. Auth. Rev. (Metro Deaf School Proj.) 4 |
700,000 | 5.00 | 6/15/38 | 726,355 | ||||||||||||
| St. Paul Hsg. & Redev. Auth. Rev. (Nova Classical Academy Proj.) |
600,000 | 4.00 | 9/1/36 | 629,610 | ||||||||||||
| St. Paul Hsg. & Redev. Auth. Rev. (Nova Classical Academy Proj.) |
1,000,000 | 4.13 | 9/1/47 | 1,033,900 | ||||||||||||
| University of Minnesota Rev. |
1,000,000 | 5.00 | 4/1/41 | 1,212,010 | ||||||||||||
| Victoria Private School Fac. Rev. (Holy Family Catholic High) |
1,610,000 | 4.00 | 9/1/23 | 1,544,054 | ||||||||||||
| Woodbury Charter School Lease Rev. (MSA Building) |
355,000 | 5.00 | 12/1/27 | 364,010 | ||||||||||||
| Woodbury Charter School Lease Rev. (MSA Building) |
225,000 | 5.00 | 12/1/32 | 230,443 | ||||||||||||
|
|
|
| ||||||||||||||
|
|
101,504,799 |
| ||||||||||||||
|
|
|
| ||||||||||||||
| Escrowed To Maturity/Prerefunded - 1.4% |
||||||||||||||||
| Deephaven Charter School Lease Rev. (Eagle Ridge Academy Proj.) |
1,280,000 | 5.13 | 7/1/33 | 1,445,824 | ||||||||||||
| MN Higher Education Fac. Auth. Rev. (Hamline Univ.) |
750,000 | 6.00 | 10/1/32 | 792,690 | ||||||||||||
| MN Higher Education Fac. Auth. Rev. (Hamline Univ.) |
1,000,000 | 6.00 | 10/1/40 | 1,056,920 | ||||||||||||
| Western MN Municipal Power Agy. Rev. |
4,725,000 | 5.00 | 1/1/46 | 5,458,698 | ||||||||||||
|
|
|
| ||||||||||||||
|
|
8,754,132 |
| ||||||||||||||
|
|
|
| ||||||||||||||
| General Obligation - 9.8% |
||||||||||||||||
| Brainerd Independent School District No. 181 |
1,000,000 | 4.00 | 2/1/42 | 1,133,540 | ||||||||||||
| Brainerd Independent School District No. 181 |
4,000,000 | 4.00 | 2/1/43 | 4,525,840 | ||||||||||||
| Brooklyn Center Independent School District No. 286 |
4,000,000 | 4.00 | 2/1/40 | 4,449,120 | ||||||||||||
| See accompanying notes to financial statements.
|
||
| SEPTEMBER 30, 2020 | 41 | |
|
|
| SCHEDULE OF INVESTMENTS (Unaudited) September 30, 2020
Sit Minnesota Tax-Free Income Fund (Continued) |
| Name of Issuer | Principal Amount ($) |
Coupon Rate (%) |
Maturity Date |
Fair Value ($) | ||||||||||
| Cloquet Independent School District No. 94 |
4,250,000 | 4.00 | 2/1/36 | 4,612,482 | ||||||||||
| Elk River Independent School District No. 728 |
7,000,000 | 3.00 | 2/1/40 | 7,393,400 | ||||||||||
| Fosston Independent School District No. 601 |
250,000 | 4.00 | 2/1/36 | 280,718 | ||||||||||
| Fosston Independent School District No. 601 |
1,000,000 | 4.00 | 2/1/38 | 1,117,010 | ||||||||||
| Long Prairie G.O. 8 |
750,000 | 4.00 | 2/1/37 | 819,900 | ||||||||||
| Minneapolis Capital Improvement |
4,000,000 | 4.00 | 12/1/43 | 4,532,080 | ||||||||||
| Minneapolis Capital Improvement |
2,000,000 | 4.00 | 12/1/46 | 2,243,600 | ||||||||||
| Minneapolis G.O. |
5,000,000 | 3.00 | 12/1/42 | 5,261,950 | ||||||||||
| Minneapolis Special School District No. 1 |
1,000,000 | 4.00 | 2/1/40 | 1,179,930 | ||||||||||
| Minnetonka Independent School District No. 276 |
1,900,000 | 5.00 | 2/1/41 | 2,207,325 | ||||||||||
| Morrison Co. Education District No. 6979 |
1,000,000 | 4.50 | 2/1/34 | 933,220 | ||||||||||
| Richfield Independent School District No. 280 |
6,000,000 | 4.00 | 2/1/37 | 6,782,400 | ||||||||||
| Roseville Independent School District No. 623 |
930,000 | 4.00 | 2/1/35 | 1,057,940 | ||||||||||
| Roseville Independent School District No. 623 |
4,895,000 | 4.00 | 2/1/36 | 5,550,098 | ||||||||||
| South Washington Co. Independent School District No. 833 |
5,000,000 | 4.00 | 2/1/31 | 5,688,750 | ||||||||||
| St. Francis Independent School District No. 15 |
550,000 | 4.00 | 2/1/35 | 581,388 | ||||||||||
| St. Francis Independent School District No. 15 |
750,000 | 4.00 | 2/1/36 | 791,768 | ||||||||||
| United Hospital District Health Care Facs. G.O (Lake Wood Health System) |
1,005,000 | 5.00 | 12/1/30 | 1,233,075 | ||||||||||
| Worthington Independent School District No. 518 |
1,000,000 | 3.00 | 2/1/37 | 1,064,380 | ||||||||||
| Worthington Independent School District No. 518 |
500,000 | 3.00 | 2/1/40 | 528,885 | ||||||||||
|
|
|
| ||||||||||||
|
|
63,968,799 |
| ||||||||||||
|
|
|
| ||||||||||||
| Hospital/Health Care - 15.2% |
||||||||||||||
| Anoka Health Care and Hsg. Facs. Rev. |
1,135,000 | 5.38 | 11/1/34 | 1,197,550 | ||||||||||
| Anoka Health Care and Hsg. Facs. Rev. (Walker Methodist Plaza) |
1,500,000 | 5.25 | 7/1/35 | 1,494,270 | ||||||||||
| Center City Heath Care Facs. Rev. (Hazelden Betty Ford Foundation Proj.) |
3,000,000 | 4.50 | 11/1/34 | 3,235,920 | ||||||||||
| Center City Heath Care Facs. Rev. (Hazelden Betty Ford Foundation Proj.) |
250,000 | 5.00 | 11/1/29 | 279,377 | ||||||||||
| Center City Heath Care Facs. Rev. (Hazelden Betty Ford Foundation Proj.) |
500,000 | 5.00 | 11/1/44 | 541,675 | ||||||||||
| Chatfield Health Care and Hsg. Facs. Rev. (Chosen Valley Care Center) |
350,000 | 4.00 | 9/1/39 | 286,947 | ||||||||||
| Chatfield Health Care and Hsg. Facs. Rev. (Chosen Valley Care Center) |
500,000 | 5.00 | 9/1/44 | 468,835 | ||||||||||
| Chatfield Health Care and Hsg. Facs. Rev. (Chosen Valley Care Center) |
1,225,000 | 5.00 | 9/1/52 | 1,112,839 | ||||||||||
| Chippewa Co. Rev. (Monte Video Hospital Proj.) |
2,000,000 | 4.00 | 3/1/32 | 2,081,220 | ||||||||||
| Crookston Health Care Facs. Rev. (Riverview Health Care Proj.) |
1,000,000 | 4.00 | 5/1/32 | 974,710 | ||||||||||
| Crookston Health Care Facs. Rev. (Riverview Health Care Proj.) |
1,000,000 | 5.00 | 5/1/34 | 974,370 | ||||||||||
| Crookston Health Care Facs. Rev. (Riverview Health Care Proj.) |
1,000,000 | 5.00 | 5/1/38 | 973,300 | ||||||||||
| Dakota Co. Community Dev. Agy. (Sanctuary at W. St. Paul Proj.) |
1,700,000 | 5.75 | 8/1/30 | 1,696,056 | ||||||||||
| Dakota Co. Community Dev. Agy. (Sanctuary at W. St. Paul Proj.) |
1,050,000 | 6.00 | 8/1/35 | 1,046,840 | ||||||||||
| Duluth Economic Dev. Auth. Rev. (St. Lukes Hospital Oblig. Group) |
575,000 | 4.75 | 6/15/22 | 594,700 | ||||||||||
| Duluth Economic Dev. Auth. Rev. (St. Lukes Hospital Oblig. Group) |
1,600,000 | 5.75 | 6/15/32 | 1,689,264 | ||||||||||
| Duluth Economic Dev. Auth. Rev. (St. Lukes Hospital Oblig. Group) |
2,000,000 | 6.00 | 6/15/39 | 2,109,980 | ||||||||||
| Glencoe Health Care Fac. Rev. (Glencoe Regional Health Services Proj.) |
2,110,000 | 4.00 | 4/1/31 | 2,168,827 | ||||||||||
| Hayward Health Care Fac. Rev. (American Baptist Homes Midwest Proj.) |
1,350,000 | 5.38 | 8/1/34 | 1,294,582 | ||||||||||
| Hayward Health Care Fac. Rev. (American Baptist Homes Midwest Proj.) |
500,000 | 5.75 | 2/1/44 | 481,935 | ||||||||||
| Hayward Hsg. & Health Care Fac. Rev. (St. John Lutheran Home of Albert Lea Proj.) |
1,900,000 | 5.00 | 10/1/34 | 1,757,367 | ||||||||||
| Maple Grove Health Care System Rev. (Maple Grove Hospital Corp.) |
4,175,000 | 4.00 | 5/1/37 | 4,453,013 | ||||||||||
| Maple Grove Health Care System Rev. (Maple Grove Hospital Corp.) |
825,000 | 5.00 | 5/1/32 | 955,218 | ||||||||||
| Maple Grove Health Care System Rev. (Memorial Health Care) |
1,275,000 | 4.00 | 9/1/35 | 1,351,220 | ||||||||||
| Minneapolis Health Care System Rev. (Fairview Health Services) |
3,000,000 | 4.00 | 11/15/37 | 3,414,810 | ||||||||||
| Minneapolis Health Care System Rev. (Fairview Health Services) |
1,000,000 | 4.00 | 11/15/38 | 1,134,890 | ||||||||||
| Minneapolis Health Care System Rev. (Fairview Health Services) |
2,590,000 | 5.00 | 11/15/34 | 2,989,974 | ||||||||||
| Minneapolis Health Care System Rev. (Fairview Health Services) |
2,500,000 | 5.00 | 11/15/49 | 2,988,925 | ||||||||||
| Minneapolis Rev. Ref. (Walker Campus) |
595,000 | 4.50 | 11/15/20 | 594,958 | ||||||||||
| Moorhead Economic Dev. Auth. Rev. |
550,000 | 4.60 | 9/1/25 | 544,978 | ||||||||||
| See accompanying notes to financial statements.
|
||
| 42 | SIT MUTUAL FUNDS SEMI-ANNUAL REPORT | |
|
|
|
|
| Name of Issuer | Principal Amount ($) |
Coupon Rate (%) |
Maturity Date |
Fair Value ($) | ||||||||||||
| Oak Park Heights Nursing Home Rev. (Boutwells Landing Care Center) |
1,500,000 | 5.50 | 8/1/28 | 1,524,990 | ||||||||||||
| Oak Park Heights Nursing Home Rev. (Boutwells Landing Care Center) |
1,000,000 | 6.00 | 8/1/36 | 1,024,150 | ||||||||||||
| Rochester Health Care Facs. Rev. (Mayo Clinic) |
7,500,000 | 4.00 | 11/15/48 | 8,386,125 | ||||||||||||
| Rochester Health Care Facs. Rev. (Mayo Clinic) |
5,000,000 | 5.00 | 11/15/33 | 7,145,050 | ||||||||||||
| Rochester Health Care Facs. Rev. (Olmsted Medical Center Proj.) |
1,500,000 | 5.88 | 7/1/30 | 1,505,310 | ||||||||||||
| Shakopee Health Care Facs. Rev. (St. Francis Regional Medical Center Proj.) |
745,000 | 5.00 | 9/1/28 | 840,934 | ||||||||||||
| Shakopee Health Care Facs. Rev. (St. Francis Regional Medical Center Proj.) |
1,350,000 | 5.00 | 9/1/34 | 1,484,284 | ||||||||||||
| St. Cloud Health Care Rev. (CentraCare Health System Proj.) |
2,500,000 | 4.00 | 5/1/37 | 2,733,475 | ||||||||||||
| St. Cloud Health Care Rev. (CentraCare Health System Proj.) |
500,000 | 4.00 | 5/1/49 | 554,310 | ||||||||||||
| St. Cloud Health Care Rev. (CentraCare Health System Proj.) |
3,750,000 | 5.00 | 5/1/46 | 4,301,850 | ||||||||||||
| St. Cloud Health Care Rev. (CentraCare Health System Proj.) |
500,000 | 5.00 | 5/1/48 | 602,285 | ||||||||||||
| St. Louis Park Health Care Facs. Rev. (Mount Olivet Careview Home Health Proj.) 1 |
2,250,000 | 4.60 | 6/1/41 | 2,129,175 | ||||||||||||
| St. Paul Hsg. & Redev. Auth. Health Care Rev. (Fairview Health Services Proj.) |
750,000 | 4.00 | 11/15/35 | 847,215 | ||||||||||||
| St. Paul Hsg. & Redev. Auth. Health Care Rev. (Fairview Health Services Proj.) |
4,000,000 | 4.00 | 11/15/43 | 4,426,160 | ||||||||||||
| St. Paul Hsg. & Redev. Auth. Health Care Rev. (Fairview Health Services Proj.) |
1,000,000 | 5.00 | 11/15/47 | 1,175,810 | ||||||||||||
| St. Paul Hsg. & Redev. Auth. Health Care Rev. (HealthPartners Oblig. Group Proj.) |
4,800,000 | 5.00 | 7/1/32 | 5,521,968 | ||||||||||||
| St. Paul Hsg. & Redev. Auth. Health Care Rev. (HealthPartners Oblig. Group Proj.) |
2,000,000 | 5.00 | 7/1/33 | 2,293,300 | ||||||||||||
| St. Paul Hsg. & Redev. Auth. Health Care Rev. (Senior Episcopal Homes Proj.) |
525,000 | 4.25 | 11/1/25 | 525,032 | ||||||||||||
| St. Paul Hsg. & Redev. Auth. Health Care Rev. (Senior Episcopal Homes Proj.) |
750,000 | 4.75 | 11/1/31 | 750,195 | ||||||||||||
| St. Paul Hsg. & Redev. Auth. Health Care Rev. (Senior Episcopal Homes Proj.) |
2,150,000 | 5.00 | 5/1/38 | 2,067,204 | ||||||||||||
| St. Paul Hsg. & Redev. Auth. Health Care Rev. (Senior Episcopal Homes Proj.) |
500,000 | 5.15 | 11/1/42 | 500,115 | ||||||||||||
| St. Paul Hsg. & Redev. Auth. Rev. (Nursing Home NTS-Episcopal) |
1,809,970 | 5.63 | 10/1/33 | 1,814,260 | ||||||||||||
| Victoria Health Care Facs. Rev. (Augustana Emerald Care LLC) |
820,000 | 4.25 | 8/1/24 | 820,492 | ||||||||||||
| West St. Paul Hsg. & Health Care Rev. (Walker Westwood Ridge Camp) |
1,000,000 | 5.00 | 11/1/37 | 1,015,190 | ||||||||||||
| Winsted Health Care Rev. (St. Mary’s Care Center Proj.) 2, 5 |
546,853 | 6.00 | 9/1/25 | 10,937 | ||||||||||||
| Winsted Health Care Rev. (St. Mary’s Care Center Proj.) 2, 5 |
525,820 | 6.50 | 9/1/34 | 10,516 | ||||||||||||
|
|
|
| ||||||||||||||
|
|
98,898,882 |
| ||||||||||||||
|
|
|
| ||||||||||||||
| Industrial/Pollution Control - 0.6% |
||||||||||||||||
| International Falls Rev. (Boise Cascade Corp. Proj.) |
925,000 | 5.65 | 12/1/22 | 919,866 | ||||||||||||
| St. Paul Port Auth. Rev. 8 |
1,000,000 | 4.00 | 10/1/40 | 1,109,140 | ||||||||||||
| St. Paul Port Auth. Rev. |
1,000,000 | 4.00 | 10/1/42 | 1,119,920 | ||||||||||||
| St. Paul Port Auth. Solid Waste Disposal Rev. (Gerdau St. Paul Steel Mill Proj.) 4, 8 |
1,000,000 | 4.50 | 10/1/37 | 1,007,780 | ||||||||||||
|
|
|
| ||||||||||||||
|
|
4,156,706 |
| ||||||||||||||
|
|
|
| ||||||||||||||
| Insured - 0.4% |
||||||||||||||||
| Guam Power Auth. Rev. (AGM Insured) 11 |
500,000 | 5.00 | 10/1/30 | 533,700 | ||||||||||||
| MN Governmental Agy. Fin. Group (Flex Terminal Prog.) (AGC Insured) |
55,000 | 4.00 | 3/1/22 | 55,138 | ||||||||||||
| Puerto Rico Public Improvement G.O. (AGM Insured) 11 |
750,000 | 5.13 | 7/1/30 | 764,730 | ||||||||||||
| Virgin Islands Public Fin. Auth. (Gross Receipts Taxes Loan Note) (NATL Insured) 11 |
1,000,000 | 5.00 | 10/1/23 | 1,017,030 | ||||||||||||
|
|
|
| ||||||||||||||
|
|
2,370,598 |
| ||||||||||||||
|
|
|
| ||||||||||||||
| Multifamily Mortgage - 20.5% |
||||||||||||||||
| Anoka Hsg. Rev. (Homestead at Anoka, Inc. Proj.) |
695,000 | 3.50 | 11/1/20 | 695,021 | ||||||||||||
| Anoka Hsg. Rev. (Homestead at Anoka, Inc. Proj.) |
315,000 | 4.00 | 11/1/21 | 316,912 | ||||||||||||
| Anoka Hsg. Rev. (Homestead at Anoka, Inc. Proj.) |
1,000,000 | 4.75 | 11/1/35 | 1,049,460 | ||||||||||||
| Anoka Hsg. Rev. (Homestead at Anoka, Inc. Proj.) |
1,000,000 | 5.50 | 11/1/46 | 1,079,470 | ||||||||||||
| Apple Valley Economic Dev. Auth. Rev. (Augustana Healthcare Center) |
500,000 | 3.90 | 2/1/31 | 465,980 | ||||||||||||
| Apple Valley Economic Dev. Auth. Rev. (Augustana Healthcare Center) |
500,000 | 4.15 | 2/1/36 | 453,840 | ||||||||||||
| Apple Valley Senior Hsg. Rev. (Orchard Path Proj.) |
2,000,000 | 5.00 | 9/1/58 | 2,047,100 | ||||||||||||
| Apple Valley Senior Hsg. Rev. (Presbyterian Homes) |
1,500,000 | 5.00 | 9/1/43 | 1,547,355 | ||||||||||||
| Apple Valley Senior Living Rev. (Senior Living LLC Proj.) |
1,100,000 | 4.00 | 1/1/25 | 1,019,689 | ||||||||||||
| Apple Valley Senior Living Rev. (Senior Living LLC Proj.) |
500,000 | 4.00 | 1/1/25 | 446,335 | ||||||||||||
| Apple Valley Senior Living Rev. (Senior Living LLC Proj.) |
1,235,000 | 4.00 | 1/1/26 | 1,121,837 | ||||||||||||
| See accompanying notes to financial statements.
|
||
| SEPTEMBER 30, 2020 | 43 | |
|
|
| SCHEDULE OF INVESTMENTS (Unaudited) September 30, 2020
Sit Minnesota Tax-Free Income Fund (Continued) |
| Name of Issuer | Principal Amount ($) |
Coupon Rate (%) |
Maturity Date |
Fair Value ($) | ||||||||||
| Apple Valley Senior Living Rev. (Senior Living LLC Proj.) |
1,000,000 | 4.00 | 1/1/30 | 841,480 | ||||||||||
| Apple Valley Senior Living Rev. (Senior Living LLC Proj.) |
1,500,000 | 4.25 | 1/1/37 | 1,145,535 | ||||||||||
| Apple Valley Senior Living Rev. (Senior Living LLC Proj.) |
2,775,000 | 4.38 | 1/1/47 | 1,929,985 | ||||||||||
| Apple Valley Senior Living Rev. (Senior Living LLC Proj.) |
3,000,000 | 5.00 | 1/1/47 | 1,914,300 | ||||||||||
| Apple Valley Senior Living Rev. (Senior Living LLC Proj.) |
1,530,000 | 6.75 | 1/1/27 | 1,342,682 | ||||||||||
| Apple Valley Senior Living Rev. (Senior Living LLC Proj.) |
1,000,000 | 7.00 | 1/1/37 | 765,170 | ||||||||||
| Bethel Rev. (Grandview Christian Home Proj.) |
3,000,000 | 5.00 | 10/1/41 | 2,950,230 | ||||||||||
| Blaine Senior Hsg. & Health Care Fac. Rev. (Crest View Senior Community Proj.) |
485,000 | 5.13 | 7/1/25 | 469,005 | ||||||||||
| Blaine Senior Hsg. & Health Care Fac. Rev. (Crest View Senior Community Proj.) |
1,645,000 | 5.75 | 7/1/35 | 1,517,183 | ||||||||||
| Cambridge Hsg. & Health Care Facs. Rev. (Walker Methodist Levande, LLC Proj.) |
1,250,000 | 5.13 | 3/1/39 | 1,327,800 | ||||||||||
| Champlin Multifamily Hsg. Rev. (Champlin Drive Apts.) |
565,000 | 6.00 | 1/1/27 | 566,113 | ||||||||||
| Chisago Hsg. and Health Care Rev. (CDL Homes LLC) |
750,000 | 6.00 | 8/1/33 | 794,047 | ||||||||||
| City of Otsego Rev. (Riverview Landing Proj.) |
1,500,000 | 5.00 | 10/1/42 | 1,508,085 | ||||||||||
| Cloquet Hsg. Fac. Ref. (HADC Cloquet LLC Proj.) |
1,020,000 | 5.00 | 8/1/38 | 1,020,918 | ||||||||||
| Columbus Hsg. Rev. (Richfield Senior Hsg., Inc.) |
1,000,000 | 5.00 | 1/1/34 | 908,550 | ||||||||||
| Columbus Hsg. Rev. (Richfield Senior Hsg., Inc.) |
1,000,000 | 5.25 | 1/1/40 | 880,700 | ||||||||||
| Crystal Multifamily Hsg. Rev. (Cavanagh Proj.) |
2,500,000 | 5.25 | 6/1/31 | 2,418,575 | ||||||||||
| Dakota Co. Community Dev. Agy. (Glen at Valley Creek Proj.) |
1,400,000 | 4.50 | 8/1/36 | 1,285,130 | ||||||||||
| Dakota Co. Community Dev. Agy. Multifamily Hsg. Rev. |
3,500,000 | 4.00 | 1/1/42 | 3,655,505 | ||||||||||
| Dakota Co. Community Dev. Agy. Multifamily Hsg. Rev. (Walker Highviews Hills LLC) 4 |
750,000 | 5.00 | 8/1/36 | 776,490 | ||||||||||
| Dakota Co. Community Dev. Agy. Multifamily Hsg. Rev. (Walker Highviews Hills LLC) 4 |
500,000 | 5.00 | 8/1/51 | 514,420 | ||||||||||
| Deephaven Hsg. & Healthcare Rev. (St. Therese Senior Living Proj.) |
1,345,000 | 5.00 | 4/1/38 | 1,300,306 | ||||||||||
| Fridley Multifamily Hsg. Rev. (Village Green Apartments Proj.) |
3,431,501 | 3.75 | 11/1/34 | 3,852,957 | ||||||||||
| Independence Health Care Facs. Rev. (Augustana Chapel View Home) |
250,000 | 4.00 | 12/1/32 | 237,250 | ||||||||||
| Maple Plain Senior Hsg. Health Care Rev. (Haven Home Inc Proj.) |
1,000,000 | 4.25 | 7/1/39 | 975,930 | ||||||||||
| Maple Plain Senior Hsg. Health Care Rev. (Haven Home Inc Proj.) |
1,000,000 | 4.45 | 7/1/44 | 979,820 | ||||||||||
| Maple Plain Senior Hsg. Health Care Rev. (Haven Home Inc Proj.) |
500,000 | 5.00 | 7/1/39 | 517,610 | ||||||||||
| Maple Plain Senior Hsg. Health Care Rev. (Haven Home Inc Proj.) |
1,000,000 | 5.00 | 7/1/49 | 1,025,240 | ||||||||||
| Minneapolis & St. Paul Hsg. & Redev. Auth. Multifamily Hsg. Rev. (GNMA Collateralized) 8 |
2,765,000 | 4.75 | 1/20/42 | 2,769,535 | ||||||||||
| Minneapolis Multifamily Hsg. Rev. (14th & Central LLLP Proj.) (FNMA Collateralized) |
5,000,000 | 2.35 | 2/1/38 | 5,062,200 | ||||||||||
| Minneapolis Multifamily Hsg. Rev. (Greenway Heights Family Housing) |
1,015,000 | 5.75 | 7/15/31 | 1,056,696 | ||||||||||
| Minneapolis Senior Hsg. & Health Care Rev. (Ecumen Mill City Quarter) |
375,000 | 4.75 | 11/1/28 | 376,339 | ||||||||||
| Minneapolis Senior Hsg. & Health Care Rev. (Ecumen Mill City Quarter) |
1,500,000 | 5.00 | 11/1/35 | 1,504,980 | ||||||||||
| Minneapolis Student Hsg. Rev. (Riverton Community Housing Proj.) 4 |
1,000,000 | 4.75 | 8/1/43 | 983,510 | ||||||||||
| Minneapolis Student Hsg. Rev. (Riverton Community Housing Proj.) 4 |
500,000 | 5.00 | 8/1/53 | 504,240 | ||||||||||
| Minnetonka MF Hsg. Rev. (Elmbrooke & Golden Valley Townhome Proj.) (FNMA Collateralized) |
1,930,157 | 3.00 | 11/1/34 | 2,034,463 | ||||||||||
| MN Hsg. Fin. Agy. Rental Hsg. (G.O. of AGY. Insured) |
250,000 | 5.05 | 8/1/31 | 256,968 | ||||||||||
| MN Hsg. Fin. Agy. Rental Hsg. (G.O. of AGY. Insured) |
1,760,000 | 5.45 | 8/1/41 | 1,805,408 | ||||||||||
| MN Hsg. Fin. Agy. Rental Hsg. Rev. |
1,000,000 | 5.20 | 8/1/43 | 1,075,970 | ||||||||||
| MN Hsg. Fin. Agy. Rev. |
270,000 | 4.00 | 8/1/29 | 304,447 | ||||||||||
| MN Hsg. Fin. Agy. Rev. |
255,000 | 4.00 | 8/1/31 | 284,792 | ||||||||||
| MN Hsg. Fin. Agy. Rev. |
335,000 | 4.00 | 8/1/34 | 370,701 | ||||||||||
| MN Hsg. Fin. Agy. Rev. |
335,000 | 4.00 | 8/1/35 | 369,800 | ||||||||||
| MN Hsg. Fin. Agy. Rev. |
515,000 | 4.00 | 8/1/39 | 606,794 | ||||||||||
| MN Hsg. Fin. Agy. Rev. |
535,000 | 4.00 | 8/1/40 | 628,031 | ||||||||||
| MN Hsg. Fin. Agy. Rev. |
815,000 | 4.00 | 8/1/41 | 954,137 | ||||||||||
| MN Hsg. Fin. Agy. Rev. (State Appropriation) |
250,000 | 4.00 | 8/1/33 | 287,430 | ||||||||||
| MN Hsg. Fin. Agy. Rev. (State Appropriation) |
2,000,000 | 5.00 | 8/1/34 | 2,296,220 | ||||||||||
| MN Hsg. Fin. Agy. Rev. (State Appropriation) |
1,000,000 | 5.00 | 8/1/35 | 1,145,670 | ||||||||||
| Moorhead Economic Dev. Auth. Rev. Ref. (EverCare Sr. Living LLC) |
280,000 | 4.65 | 9/1/26 | 275,727 | ||||||||||
| Moorhead Health Care Rev. Ref. (EverCare Sr. Living LLC) |
1,000,000 | 5.00 | 9/1/32 | 975,430 | ||||||||||
| Moorhead Health Care Rev. Ref. (EverCare Sr. Living LLC) |
250,000 | 5.13 | 9/1/37 | 240,818 | ||||||||||
| New Ulm Economic Dev. Auth. Rev. (HADC Ridgeway Proj.) |
1,500,000 | 5.00 | 8/1/39 | 1,432,935 | ||||||||||
| See accompanying notes to financial statements.
|
||
| 44 | SIT MUTUAL FUNDS SEMI-ANNUAL REPORT | |
|
|
|
|
| Name of Issuer | Principal Amount ($) |
Coupon Rate (%) |
Maturity Date |
Fair Value ($) | ||||||||||
| North Oaks Senior Hsg. Rev. (Waverly Gardens Proj.) |
2,000,000 | 4.00 | 10/1/33 | 2,035,240 | ||||||||||
| North Oaks Senior Hsg. Rev. (Waverly Gardens Proj.) |
1,500,000 | 5.00 | 10/1/35 | 1,608,195 | ||||||||||
| North Oaks Senior Hsg. Rev. (Waverly Gardens Proj.) |
1,000,000 | 5.00 | 10/1/47 | 1,052,850 | ||||||||||
| Oakdale Rev. (Sr. Hsg. Oak Meadows Proj.) |
875,000 | 5.00 | 4/1/34 | 864,019 | ||||||||||
| Red Wing Senior Hsg. Rev. (Deer Crest Proj.) |
325,000 | 5.00 | 11/1/27 | 328,400 | ||||||||||
| Red Wing Senior Hsg. Rev. (Deer Crest Proj.) |
330,000 | 5.00 | 11/1/32 | 333,432 | ||||||||||
| Red Wing Senior Hsg. Rev. (Deer Crest Proj.) |
500,000 | 5.00 | 11/1/42 | 504,995 | ||||||||||
| Rochester Health Care & Hsg. Rev. (Homestead Rochester, Inc.) |
1,950,000 | 5.00 | 12/1/30 | 2,012,420 | ||||||||||
| Rochester Health Care & Hsg. Rev. (Homestead Rochester, Inc.) |
1,325,000 | 5.00 | 12/1/49 | 1,303,826 | ||||||||||
| Rochester Health Care & Hsg. Rev. (Samaritan Bethany, Inc. Proj.) |
1,000,000 | 5.00 | 8/1/37 | 1,042,580 | ||||||||||
| Rochester Health Care & Hsg. Rev. (Samaritan Bethany, Inc. Proj.) |
1,800,000 | 5.00 | 8/1/48 | 1,852,740 | ||||||||||
| Rochester Health Care & Hsg. Rev. (The Homestead at Rochester) |
720,000 | 6.38 | 12/1/33 | 773,402 | ||||||||||
| Rochester Health Care & Hsg. Rev. (The Homestead at Rochester) |
2,500,000 | 6.50 | 12/1/35 | 2,684,625 | ||||||||||
| Rochester Health Care & Hsg. Rev. (The Homestead at Rochester) |
250,000 | 6.88 | 12/1/48 | 268,375 | ||||||||||
| Rochester Multifamily Hsg. Rev. (Essex Place Apartments Proj.) (FHLMC) |
4,000,000 | 3.75 | 6/1/29 | 4,143,680 | ||||||||||
| Sartell Health Care & Hsg. Fac. Rev. (Country Manor Campus LLC Proj.) |
1,275,000 | 5.00 | 9/1/42 | 1,277,894 | ||||||||||
| Sartell Health Care & Hsg. Fac. Rev. (Country Manor Campus LLC Proj.) |
1,135,000 | 5.25 | 9/1/27 | 1,152,683 | ||||||||||
| Sartell Health Care & Hsg. Fac. Rev. (Country Manor Campus LLC Proj.) |
1,000,000 | 5.25 | 9/1/30 | 1,012,470 | ||||||||||
| Sartell Health Care & Hsg. Fac. Rev. (Country Manor Campus LLC Proj.) |
2,150,000 | 5.30 | 9/1/37 | 2,174,746 | ||||||||||
| Sauk Rapids Health Care & Hsg. Facs. Rev. (Good Shepherd Lutheran Home Proj.) |
1,705,000 | 5.13 | 1/1/39 | 1,678,061 | ||||||||||
| St. Anthony Multifamily Hsg. Rev. (Silver Lake Village Hsg.) |
250,000 | 5.75 | 12/1/28 | 266,618 | ||||||||||
| St. Anthony Multifamily Hsg. Rev. (Silver Lake Village Hsg.) |
2,000,000 | 6.00 | 12/1/30 | 2,131,580 | ||||||||||
| St. Joseph Senior Hsg. & Health Care Rev. (Woodcrest of Country Manor Proj.) |
750,000 | 4.25 | 7/1/39 | 671,070 | ||||||||||
| St. Joseph Senior Hsg. & Health Care Rev. (Woodcrest of Country Manor Proj.) |
1,125,000 | 4.25 | 7/1/44 | 969,120 | ||||||||||
| St. Joseph Senior Hsg. & Health Care Rev. (Woodcrest of Country Manor Proj.) |
1,500,000 | 5.00 | 7/1/55 | 1,437,945 | ||||||||||
| St. Paul Hsg. & Redev. Auth. Health Care Rev. (Carondelet Village Proj.) |
2,185,000 | 4.25 | 12/1/27 | 2,290,011 | ||||||||||
| St. Paul Hsg. & Redev. Auth. Health Care Rev. (Carondelet Village Proj.) |
2,400,000 | 5.00 | 12/1/47 | 2,566,248 | ||||||||||
| St. Paul Hsg. & Redev. Auth. Multifamily Housing Rev. (Marian Center Proj.) |
685,000 | 5.20 | 11/1/22 | 684,959 | ||||||||||
| St. Paul Hsg. & Redev. Auth. Multifamily Housing Rev. (Marian Center Proj.) |
1,000,000 | 5.30 | 11/1/30 | 999,930 | ||||||||||
| St. Paul Hsg. & Redev. Auth. Multifamily Housing Rev. (Marian Center Proj.) |
2,590,000 | 5.38 | 5/1/43 | 2,421,391 | ||||||||||
| St. Paul Park Health Care Facs. Rev (Presbyterian Homes Interlu Proj.) |
1,000,000 | 5.00 | 5/1/43 | 1,070,660 | ||||||||||
| St. Paul Park Hsg. Rev. (Buffalo Senior Housing Proj.) |
1,115,000 | 5.00 | 10/1/38 | 1,087,861 | ||||||||||
| St. Paul Park Senior Hsg. Rev. (Presbyterian Homes Bloomin Proj.) |
1,000,000 | 5.00 | 9/1/42 | 1,041,530 | ||||||||||
| St. Paul Port Auth. Rev. (Energy Park Utility Company Proj.) 8 |
2,515,000 | 5.70 | 8/1/36 | 2,606,018 | ||||||||||
| St. Peter Hsg. & Health Care Fac. Rev. (Ecumen Second Century & Owatonna Senior Living Proj.) |
700,000 | 5.00 | 3/1/40 | 735,371 | ||||||||||
| Vergas Hsg. & Healthcare Facs. Rev. (CDL Homes Proj.) |
1,000,000 | 4.25 | 8/1/43 | 954,880 | ||||||||||
| Wayzata Senior Hsg. Rev. (Folkestone Senior Living Community) |
1,500,000 | 4.00 | 8/1/44 | 1,488,540 | ||||||||||
| Wayzata Senior Hsg. Rev. (Folkestone Senior Living Community) |
1,000,000 | 5.00 | 8/1/49 | 1,046,200 | ||||||||||
| Wayzata Senior Hsg. Rev. (Folkestone Senior Living Community) |
2,750,000 | 5.00 | 8/1/54 | 2,865,472 | ||||||||||
| West St. Paul Hsg. & Health Care Rev. (Walker Westwood Ridge Camp) |
250,000 | 5.00 | 11/1/49 | 249,230 | ||||||||||
| Willmar Hsg. & Redev. Auth. Multifamily Rev. (Eagle Ridge Apartments) |
2,610,000 | 4.63 | 4/1/30 | 2,623,755 | ||||||||||
|
|
|
| ||||||||||||
|
|
133,580,278 |
| ||||||||||||
|
|
|
| ||||||||||||
| Municipal Lease 9 - 5.1% |
||||||||||||||
| Anoka-Hennepin Independent School District No. 11 Lease Rev. |
600,000 | 4.00 | 2/1/41 | 624,282 | ||||||||||
| Chaska Economic Dev. Auth. Lease Rev. |
1,100,000 | 4.00 | 2/1/31 | 1,221,440 | ||||||||||
| Chaska Economic Dev. Auth. Lease Rev. |
690,000 | 4.00 | 2/1/33 | 759,738 | ||||||||||
| Chaska Economic Dev. Auth. Lease Rev. |
500,000 | 4.00 | 2/1/35 | 548,280 | ||||||||||
| Duluth Independent School District No. 709 |
1,000,000 | 4.00 | 2/1/27 | 1,151,170 | ||||||||||
| Duluth Independent School District No. 709 |
750,000 | 4.20 | 3/1/34 | 752,070 | ||||||||||
| Duluth Independent School District No. 709 |
2,000,000 | 5.00 | 2/1/25 | 2,354,100 | ||||||||||
| Duluth Independent School District No. 709 |
785,000 | 5.13 | 3/1/29 | 786,256 | ||||||||||
| Golden Valley Hsg. & Redev. Auth. Rev. |
1,000,000 | 4.00 | 2/1/30 | 1,086,610 | ||||||||||
| See accompanying notes to financial statements.
|
||
| SEPTEMBER 30, 2020 | 45 | |
|
|
| SCHEDULE OF INVESTMENTS (Unaudited) September 30, 2020
Sit Minnesota Tax-Free Income Fund (Continued) |
| Name of Issuer | Principal Amount ($) |
Coupon Rate (%) |
Maturity Date |
Fair Value ($) | ||||||||||
| Golden Valley Hsg. & Redev. Auth. Rev. |
500,000 | 4.00 | 2/1/32 | 539,450 | ||||||||||
| Goodhue Co. Education District No. 6051 Lease Rev. |
1,030,000 | 5.00 | 2/1/34 | 1,161,150 | ||||||||||
| Goodhue Co. Education District No. 6051 Lease Rev. |
1,500,000 | 5.00 | 2/1/39 | 1,677,390 | ||||||||||
| Guam Education Fin. Foundation 11 |
1,000,000 | 5.00 | 10/1/21 | 1,016,050 | ||||||||||
| Guam Education Fin. Foundation 11 |
1,730,000 | 5.00 | 10/1/22 | 1,780,602 | ||||||||||
| Lake Agassiz Education Cooperative No. 0397-52 |
645,000 | 2.50 | 2/1/32 | 640,001 | ||||||||||
| Lake Agassiz Education Cooperative No. 0397-52 |
365,000 | 2.75 | 2/1/36 | 357,069 | ||||||||||
| Minnetonka Independent School District No. 276 |
450,000 | 4.00 | 3/1/30 | 502,992 | ||||||||||
| Minnetonka Independent School District No. 276 |
340,000 | 4.00 | 2/1/33 | 360,709 | ||||||||||
| Minnetonka Independent School District No. 276 |
300,000 | 4.00 | 3/1/33 | 330,537 | ||||||||||
| Minnetonka Independent School District No. 276 |
400,000 | 4.00 | 2/1/36 | 421,428 | ||||||||||
| Minnetonka Independent School District No. 276 |
500,000 | 4.50 | 1/1/41 | 552,275 | ||||||||||
| MN Hsg. Fin. Agy. Hsg. Infrastructure (State Appropriation) |
750,000 | 3.88 | 8/1/38 | 831,008 | ||||||||||
| MN Hsg. Fin. Agy. Hsg. Infrastructure (State Appropriation) |
1,040,000 | 4.00 | 8/1/36 | 1,218,360 | ||||||||||
| MN Hsg. Fin. Agy. Hsg. Infrastructure (State Appropriation) |
580,000 | 4.00 | 8/1/37 | 676,350 | ||||||||||
| MN Hsg. Fin. Agy. Hsg. Infrastructure (State Appropriation) |
945,000 | 4.00 | 8/1/40 | 1,092,033 | ||||||||||
| MN Hsg. Fin. Agy. Rev. (State Appropriation) |
300,000 | 5.00 | 8/1/35 | 333,654 | ||||||||||
| Northeastern Metropolitan Intermediate School District No. 916 |
1,000,000 | 5.00 | 2/1/34 | 1,159,920 | ||||||||||
| Osseo Independent School District No. 279 |
1,000,000 | 4.00 | 2/1/28 | 1,096,750 | ||||||||||
| Plymouth Intermediate District No. 287 |
535,000 | 3.00 | 5/1/32 | 567,148 | ||||||||||
| Plymouth Intermediate District No. 287 |
470,000 | 4.00 | 5/1/31 | 519,519 | ||||||||||
| Plymouth Intermediate District No. 287 |
600,000 | 4.00 | 2/1/37 | 676,710 | ||||||||||
| Rochester Economic Dev. Auth. Rev. |
1,000,000 | 2.13 | 2/1/38 | 1,009,520 | ||||||||||
| Southern Plains Education Cooperative No. 915 |
1,215,000 | 4.00 | 2/1/37 | 1,129,197 | ||||||||||
| Southern Plains Education Cooperative No. 915 |
1,000,000 | 4.50 | 2/1/39 | 974,750 | ||||||||||
| St. Cloud Independent School District No. 742 |
750,000 | 4.00 | 2/1/38 | 810,788 | ||||||||||
| Waconia Independent School District No. 110 |
500,000 | 5.00 | 2/1/37 | 570,185 | ||||||||||
| Winona School District No. 861 Lease Purchase |
184,456 | 6.04 | 8/1/24 | 184,637 | ||||||||||
| Wright Co. |
1,350,000 | 3.00 | 12/1/39 | 1,460,146 | ||||||||||
|
|
|
| ||||||||||||
|
|
32,934,274 |
| ||||||||||||
|
|
|
| ||||||||||||
| Municipal Money Market - 0.8% |
||||||||||||||
| City of Minneapolis Rev. (Univ. Gateway Proj.) 1 |
5,400,000 | 0.10 | 12/1/27 | 5,400,000 | ||||||||||
|
|
|
| ||||||||||||
|
Other Revenue Bonds - 3.8% |
||||||||||||||
| Center City Heath Care Facs. Rev. (Hazelden Betty Ford Foundation Proj.) |
1,000,000 | 4.00 | 11/1/41 | 1,098,010 | ||||||||||
| Crystal Governmental Fac. Rev. |
352,602 | 5.10 | 12/15/26 | 336,594 | ||||||||||
| Milaca Rev. (Edina Headquarters Proj.) |
250,000 | 5.00 | 2/1/44 | 249,982 | ||||||||||
| Minneapolis Rev. (YMCA Greater Twin Cities Proj.) |
165,000 | 4.00 | 6/1/29 | 180,513 | ||||||||||
| Minneapolis Rev. (YMCA Greater Twin Cities Proj.) |
125,000 | 4.00 | 6/1/30 | 135,592 | ||||||||||
| Minneapolis Rev. (YMCA Greater Twin Cities Proj.) |
250,000 | 4.00 | 6/1/31 | 268,980 | ||||||||||
| Minneapolis Tax Increment Rev. |
320,000 | 3.50 | 3/1/23 | 323,654 | ||||||||||
| Minneapolis Tax Increment Rev. |
170,000 | 3.80 | 3/1/25 | 172,599 | ||||||||||
| Minneapolis Tax Increment Rev. |
200,000 | 4.00 | 3/1/27 | 203,452 | ||||||||||
| Minneapolis Tax Increment Rev. |
260,000 | 4.00 | 3/1/30 | 262,803 | ||||||||||
| MN Development Rev. Limited Tax Supported Comm. Board |
1,000,000 | 6.00 | 12/1/40 | 1,009,230 | ||||||||||
| MN Development Rev. Limited Tax Supported Comm. Board |
2,000,000 | 6.25 | 12/1/30 | 2,019,280 | ||||||||||
| Mound Hsg. & Redev. Auth. Tax Increment Rev. Ref. (Metroplain Proj.) |
694,000 | 5.00 | 2/15/27 | 694,805 | ||||||||||
| Northeastern Metropolitan Intermediate School District No. 916 |
4,500,000 | 4.00 | 2/1/38 | 4,864,725 | ||||||||||
| St. Louis Park Economic Dev. Auth. Tax Increment Rev. (Hoigaard Vlg.) |
575,000 | 5.00 | 2/1/23 | 575,351 | ||||||||||
| St. Paul Hsg. & Redev. Auth. Tax Increment Rev. (9th St. Lofts Proj.) |
733,000 | 6.38 | 2/15/28 | 737,530 | ||||||||||
| St. Paul Hsg. & Redev. Auth. Tax Increment Rev. (Drake Marble Proj.) |
370,000 | 6.75 | 3/1/28 | 370,240 | ||||||||||
| St. Paul Hsg. & Redev. Auth. Tax Increment Rev. (Emerald Gardens Proj.) |
695,000 | 6.50 | 3/1/29 | 695,834 | ||||||||||
| St. Paul Hsg. & Redev. Auth. Tax Increment Rev. (North Quadrant Owner Occupied Proj.) |
867,000 | 7.00 | 2/15/28 | 872,323 | ||||||||||
| See accompanying notes to financial statements.
|
||
| 46 | SIT MUTUAL FUNDS SEMI-ANNUAL REPORT | |
|
|
|
|
| Name of Issuer | Principal Amount ($) |
Coupon Rate (%) |
Maturity Date |
Fair Value ($) | ||||||||||
| St. Paul Hsg. & Redev. Auth. Tax Increment Rev. (North Quadrant Owner Occupied Proj.) |
648,000 | 7.50 | 2/15/28 | 648,726 | ||||||||||
| St. Paul Port Auth. Lease Rev. (Regions Hospital Parking Ramp Proj.) |
3,875,000 | 5.00 | 8/1/36 | 3,877,868 | ||||||||||
| St. Paul Port Auth. Rev. (Amherst H. Wilder Foundation) |
3,000,000 | 5.00 | 12/1/36 | 3,004,530 | ||||||||||
| Territory of Guam. Rev. 11 |
500,000 | 5.00 | 12/1/46 | 545,680 | ||||||||||
| Virgin Islands Public Fin. Auth. (Gross Receipts Taxes Loan Note) 11 |
2,000,000 | 5.00 | 10/1/42 | 1,792,820 | ||||||||||
|
|
|
| ||||||||||||
|
|
24,941,121 |
| ||||||||||||
|
|
|
| ||||||||||||
| Public Facilities - 0.2% |
||||||||||||||
| Lakeville Hsg. & Redev. Auth. Parking Rev. (Ice Arena. Proj.) |
1,250,000 | 4.00 | 2/1/32 | 1,408,188 | ||||||||||
|
|
|
| ||||||||||||
|
Sales Tax Revenue - 1.2% |
||||||||||||||
| American Samoa Economic Development Authority Rev. 4, 11 |
700,000 | 6.00 | 9/1/23 | 750,302 | ||||||||||
| American Samoa Economic Development Authority Rev. 11 |
2,000,000 | 6.25 | 9/1/29 | 2,318,400 | ||||||||||
| Guam Govt. Business Privilege Tax Rev. 11 |
2,750,000 | 5.00 | 11/15/35 | 3,016,695 | ||||||||||
| St. Paul Sales Tax Rev. |
1,400,000 | 5.00 | 11/1/31 | 1,636,754 | ||||||||||
|
|
|
| ||||||||||||
|
|
7,722,151 |
| ||||||||||||
|
|
|
| ||||||||||||
| Single Family Mortgage - 18.6% |
||||||||||||||
| Dakota Co. Community Dev. Agy. Single Family Mtg. Rev. (GNMA) |
850,000 | 4.45 | 12/1/32 | 864,926 | ||||||||||
| Dakota Co. Community Dev. Agy. Single Family Mtg. Rev. (GNMA-FNMA-FHLMC) |
290,000 | 4.63 | 12/1/30 | 290,278 | ||||||||||
| Dakota Co. Community Dev. Agy. Single Family Mtg. Rev. (GNMA-FNMA-FHLMC) |
430,000 | 4.88 | 12/1/33 | 432,313 | ||||||||||
| Dakota Co. Community Dev. Agy. Single Family Mtg. Rev. (GNMA-FNMA-FHLMC) 8 |
25,666 | 5.13 | 12/1/40 | 25,750 | ||||||||||
| Minneapolis St. Paul Hsg. Fin. Board Single Family Mtg. Rev. (GNMA-FNMA) |
365,000 | 4.45 | 12/1/27 | 367,358 | ||||||||||
| Minneapolis St. Paul Hsg. Fin. Board Single Family Mtg. Rev. (GNMA-FNMA) 8 |
368 | 5.00 | 12/1/38 | 368 | ||||||||||
| Minneapolis St. Paul Hsg. Fin. Board Single Family Mtg. Rev. (GNMA-FNMA-FHLMC) 8 |
14,219 | 5.25 | 12/1/40 | 14,266 | ||||||||||
| MN Hsg. Fin. Agy. Homeownership Fin. |
1,920,977 | 2.35 | 6/1/50 | 1,953,480 | ||||||||||
| MN Hsg. Fin. Agy. Homeownership Fin. (GNMA-FNMA-FHLMC) |
3,750,000 | 2.45 | 7/1/45 | 3,792,225 | ||||||||||
| MN Hsg. Fin. Agy. Homeownership Fin. (GNMA-FNMA-FHLMC) |
2,122,089 | 2.47 | 1/1/50 | 2,170,876 | ||||||||||
| MN Hsg. Fin. Agy. Homeownership Fin. (GNMA-FNMA-FHLMC) |
6,100,000 | 2.55 | 1/1/51 | 6,108,479 | ||||||||||
| MN Hsg. Fin. Agy. Homeownership Fin. (GNMA-FNMA-FHLMC) |
2,092,088 | 3.15 | 6/1/49 | 2,191,587 | ||||||||||
| MN Hsg. Fin. Agy. Homeownership Fin. (GNMA-FNMA-FHLMC) |
3,831,794 | 3.30 | 3/1/48 | 4,029,745 | ||||||||||
| MN Hsg. Fin. Agy. Homeownership Fin. (GNMA-FNMA-FHLMC) |
2,989,981 | 3.30 | 5/1/48 | 3,144,443 | ||||||||||
| MN Hsg. Fin. Agy. Homeownership Fin. (GNMA-FNMA-FHLMC) |
1,523,094 | 3.45 | 3/1/49 | 1,597,177 | ||||||||||
| MN Hsg. Fin. Agy. Homeownership Fin. (GNMA-FNMA-FHLMC) |
1,436,725 | 3.60 | 1/1/49 | 1,511,190 | ||||||||||
| MN Hsg. Fin. Agy. Homeownership Fin. (GNMA-FNMA-FHLMC) |
1,382,463 | 3.75 | 11/1/48 | 1,461,457 | ||||||||||
| MN Hsg. Fin. Agy. Homeownership Fin. (GNMA-FNMA-FHLMC) |
2,800,000 | 4.40 | 7/1/32 | 2,855,440 | ||||||||||
| MN Hsg. Fin. Agy. Homeownership Fin. (GNMA-FNMA-FHLMC) |
2,420,000 | 4.45 | 7/1/31 | 2,472,078 | ||||||||||
| MN Hsg. Fin. Agy. Homeownership Fin. (GNMA-FNMA-FHLMC) |
1,300,000 | 4.70 | 1/1/31 | 1,330,186 | ||||||||||
| MN Hsg. Fin. Agy. Residential Hsg. Rev. |
1,335,000 | 3.30 | 7/1/29 | 1,461,531 | ||||||||||
| MN Hsg. Fin. Agy. Residential Hsg. Rev. (G.O. of AGY. Insured) |
1,300,000 | 3.63 | 7/1/25 | 1,314,807 | ||||||||||
| MN Hsg. Fin. Agy. Residential Hsg. Rev. (G.O. of AGY. Insured) |
1,695,000 | 3.90 | 7/1/30 | 1,744,664 | ||||||||||
| MN Hsg. Fin. Agy. Residential Hsg. Rev. (GNMA-FNMA-FHLMC) |
3,045,000 | 2.45 | 7/1/34 | 3,146,368 | ||||||||||
| MN Hsg. Fin. Agy. Residential Hsg. Rev. (GNMA-FNMA-FHLMC) |
9,780,000 | 2.55 | 7/1/39 | 9,996,920 | ||||||||||
| MN Hsg. Fin. Agy. Residential Hsg. Rev. (GNMA-FNMA-FHLMC) |
3,800,000 | 2.70 | 7/1/44 | 3,872,314 | ||||||||||
| MN Hsg. Fin. Agy. Residential Hsg. Rev. (GNMA-FNMA-FHLMC) |
7,155,000 | 2.75 | 7/1/44 | 7,294,594 | ||||||||||
| MN Hsg. Fin. Agy. Residential Hsg. Rev. (GNMA-FNMA-FHLMC) |
4,735,000 | 2.80 | 1/1/44 | 4,868,764 | ||||||||||
| MN Hsg. Fin. Agy. Residential Hsg. Rev. (GNMA-FNMA-FHLMC) |
785,000 | 3.10 | 7/1/35 | 839,989 | ||||||||||
| MN Hsg. Fin. Agy. Residential Hsg. Rev. (GNMA-FNMA-FHLMC) |
875,000 | 3.15 | 1/1/37 | 934,824 | ||||||||||
| MN Hsg. Fin. Agy. Residential Hsg. Rev. (GNMA-FNMA-FHLMC) 8 |
1,120,000 | 3.30 | 1/1/30 | 1,224,026 | ||||||||||
| MN Hsg. Fin. Agy. Residential Hsg. Rev. (GNMA-FNMA-FHLMC) |
770,000 | 3.30 | 7/1/33 | 849,333 | ||||||||||
| MN Hsg. Fin. Agy. Residential Hsg. Rev. (GNMA-FNMA-FHLMC) |
5,920,000 | 3.30 | 1/1/34 | 6,427,107 | ||||||||||
| MN Hsg. Fin. Agy. Residential Hsg. Rev. (GNMA-FNMA-FHLMC) |
1,435,000 | 3.35 | 7/1/29 | 1,464,805 | ||||||||||
| MN Hsg. Fin. Agy. Residential Hsg. Rev. (GNMA-FNMA-FHLMC) |
1,100,000 | 3.40 | 7/1/38 | 1,175,801 | ||||||||||
| MN Hsg. Fin. Agy. Residential Hsg. Rev. (GNMA-FNMA-FHLMC) |
6,530,000 | 3.50 | 1/1/32 | 6,944,786 | ||||||||||
| See accompanying notes to financial statements.
|
||
| SEPTEMBER 30, 2020 | 47 | |
|
|
| SCHEDULE OF INVESTMENTS (Unaudited) September 30, 2020
Sit Minnesota Tax-Free Income Fund (Continued) |
| Name of Issuer | Principal Quantity |
Coupon Rate (%) |
Maturity Date |
Fair Value ($) | ||||||||||||
| MN Hsg. Fin. Agy. Residential Hsg. Rev. (GNMA-FNMA-FHLMC) |
3,825,000 | 3.60 | 7/1/31 | 4,005,502 | ||||||||||||
| MN Hsg. Fin. Agy. Residential Hsg. Rev. (GNMA-FNMA-FHLMC) |
2,040,000 | 3.60 | 7/1/33 | 2,119,784 | ||||||||||||
| MN Hsg. Fin. Agy. Residential Hsg. Rev. (GNMA-FNMA-FHLMC) 8 |
1,430,000 | 3.63 | 7/1/32 | 1,500,485 | ||||||||||||
| MN Hsg. Fin. Agy. Residential Hsg. Rev. (GNMA-FNMA-FHLMC) |
2,830,000 | 3.65 | 7/1/37 | 3,100,972 | ||||||||||||
| MN Hsg. Fin. Agy. Residential Hsg. Rev. (GNMA-FNMA-FHLMC) |
740,000 | 3.80 | 1/1/33 | 838,494 | ||||||||||||
| MN Hsg. Fin. Agy. Residential Hsg. Rev. (GNMA-FNMA-FHLMC) |
4,590,000 | 3.80 | 7/1/38 | 4,759,004 | ||||||||||||
| MN Hsg. Fin. Agy. Residential Hsg. Rev. (GNMA-FNMA-FHLMC) |
4,150,000 | 3.90 | 7/1/43 | 4,294,130 | ||||||||||||
| MN Hsg. Fin. Agy. Residential Hsg. Rev. (GNMA-FNMA-FHLMC) |
65,000 | 4.00 | 7/1/40 | 65,866 | ||||||||||||
| MN Hsg. Fin. Agy. Residential Hsg. Rev. (GNMA-FNMA-FHLMC) |
1,385,000 | 4.00 | 1/1/48 | 1,513,791 | ||||||||||||
| MN Hsg. Fin. Agy. Residential Hsg. Rev. (GNMA-FNMA-FHLMC) |
3,325,000 | 4.00 | 7/1/48 | 3,654,940 | ||||||||||||
| MN Hsg. Fin. Agy. Rev. (GNMA-FNMA Collateralized) |
455,000 | 5.00 | 1/1/31 | 465,679 | ||||||||||||
| MN Hsg. Fin. Agy. Rev. (GNMA-FNMA FHLMC) |
2,830,000 | 3.70 | 1/1/31 | 3,089,398 | ||||||||||||
| MN Hsg. Fin. Agy. Rev. (GNMA-FNMA FHLMC) |
990,000 | 4.00 | 1/1/47 | 1,058,983 | ||||||||||||
| MN Hsg. Fin. Agy. Rev. (GNMA-FNMA-FHLMC) 8 |
785,000 | 4.00 | 1/1/41 | 826,338 | ||||||||||||
|
|
|
| ||||||||||||||
|
|
121,467,621 |
| ||||||||||||||
|
|
|
| ||||||||||||||
| Transportation - 0.3% |
||||||||||||||||
| Minneapolis & St. Paul Metro Airport Commission Sub. Rev. |
1,100,000 | 5.00 | 1/1/33 | 1,225,224 | ||||||||||||
| Minneapolis & St. Paul Metro Airport Commission Sub. Rev. |
600,000 | 5.00 | 1/1/34 | 667,092 | ||||||||||||
|
|
|
| ||||||||||||||
|
|
1,892,316 |
| ||||||||||||||
|
|
|
| ||||||||||||||
| Utility - 2.2% |
||||||||||||||||
| Guam Govt. Waterworks Auth. Rev. 11 |
2,000,000 | 5.00 | 1/1/46 | 2,248,260 | ||||||||||||
| MN Municipal Power Agy. Electric Rev. |
500,000 | 4.00 | 10/1/31 | 552,475 | ||||||||||||
| MN Municipal Power Agy. Electric Rev. |
1,250,000 | 4.00 | 10/1/32 | 1,375,262 | ||||||||||||
| MN Municipal Power Agy. Electric Rev. |
1,155,000 | 4.00 | 10/1/33 | 1,266,492 | ||||||||||||
| MN Municipal Power Agy. Electric Rev. |
1,000,000 | 5.25 | 10/1/35 | 1,000,000 | ||||||||||||
| Northern Municipal Power Agy. Electric Rev. |
695,000 | 5.00 | 1/1/31 | 758,120 | ||||||||||||
| Rochester Electric Utility Rev. |
500,000 | 5.00 | 12/1/42 | 601,115 | ||||||||||||
| Southern Minnesota Municipal Power Agency |
1,000,000 | 5.00 | 1/1/41 | 1,184,240 | ||||||||||||
| St. Paul Hsg. & Redev. Auth. |
900,000 | 3.38 | 10/1/37 | 948,465 | ||||||||||||
| St. Paul Hsg. & Redev. Auth. |
880,000 | 4.00 | 10/1/31 | 1,010,654 | ||||||||||||
| St. Paul Hsg. & Redev. Auth. |
650,000 | 4.00 | 10/1/33 | 738,004 | ||||||||||||
| St. Paul Hsg. & Redev. Auth. |
800,000 | 4.00 | 10/1/37 | 895,096 | ||||||||||||
| St. Paul Port Auth. Rev. (Energy Park Utility Company Proj.) 8 |
1,250,000 | 5.45 | 8/1/28 | 1,301,100 | ||||||||||||
| Western MN Municipal Power Agy. Rev. |
600,000 | 5.00 | 1/1/35 | 721,674 | ||||||||||||
|
|
|
| ||||||||||||||
|
|
14,600,957 |
| ||||||||||||||
|
|
|
| ||||||||||||||
| Total Municipal Bonds |
623,600,822 | |||||||||||||||
|
|
|
| ||||||||||||||
| Investment Companies - 1.0% |
||||||||||||||||
| Delaware Investments Minnesota Municipal Income Fund II (VMM) |
334,436 | 4,347,668 | ||||||||||||||
| Nuveen Minnesota Municipal Income Fund (NMS) |
159,408 | 2,247,493 | ||||||||||||||
|
|
|
| ||||||||||||||
| Total Investment Companies |
6,595,161 | |||||||||||||||
|
|
|
| ||||||||||||||
| Total Investments in Securities - 96.7% |
630,195,983 | |||||||||||||||
| Other Assets and Liabilities, net - 3.3% |
21,724,183 | |||||||||||||||
|
|
|
| ||||||||||||||
| Total Net Assets - 100.0% |
$ | 651,920,166 | ||||||||||||||
|
|
|
| ||||||||||||||
| See accompanying notes to financial statements.
|
||
| 48 | SIT MUTUAL FUNDS SEMI-ANNUAL REPORT | |
|
|
|
|
| 1 | Variable rate security. Rate disclosed is as of September 30, 2020. Certain variable rate securities are not based on a published reference rate and spread but are determined by the issuer or agent and are based on current market conditions, or, for mortgage-backed securities, are impacted by the individual mortgages which are paying off over time. These securities do not indicate a reference rate and spread in their descriptions. |
| 2 | Security considered illiquid by the Investment Adviser. The total value of such securities as of September 30, 2020 was $1,517,453 and represented 0.2% of net assets. |
| 4 | 144A Restricted Security. The total value of such securities as of September 30, 2020 was $13,031,883 and represented 2.0% of net assets. These securities have been determined to be liquid by the Adviser in accordance with guidelines established by the Board of Directors. |
| 5 | The issuer is in default of interest or principal payments, or other debt covenants. Income is not being accrued. The total value of such securities as of September 30, 2020 was $21,453 and represented 0.0% of net assets. |
| 8 | Securities the income from which is treated as a tax preference that is included in alternative minimum taxable income for purposes of computing federal alternative minimum tax (AMT). At September 30, 2020, 3.4% of net assets in the Fund was invested in such securities. |
| 9 | Municipal Lease Security. The total value of such securities as of September 30, 2020 was $32,934,274 and represented 5.1% of net assets. These securities have been determined to be liquid by the Adviser in accordance with guidelines established by the Board of Directors. |
| 11 | The Fund may invest in obligations issued by U.S. territories, for example Guam, Puerto Rico, and Virgin Islands. The total value of such securities as of September 30, 2020 was $15,784,269 and represented 2.4% of net assets. |
Numeric footnotes not disclosed are not applicable to this Schedule of Investments.
A summary of the levels for the Fund’s investments as of September 30, 2020 is as follows (see Note 2 - significant accounting policies in the notes to financial statements):
| Investment in Securities | ||||||||||||||||
| Level 1 | Level 2 | Level 3 | ||||||||||||||
| Quoted | Other significant | Significant | ||||||||||||||
| Price ($) | observable inputs ($) | unobservable inputs ($) | Total ($) | |||||||||||||
| Assets |
||||||||||||||||
| Municipal Bonds |
— | 623,600,822 | — | 623,600,822 | ||||||||||||
| Investment Companies |
6,595,161 | — | — | 6,595,161 | ||||||||||||
| 6,595,161 | 623,600,822 | — | 630,195,983 | |||||||||||||
There were no transfers into or out of level 3 during the reporting period.
| See accompanying notes to financial statements.
|
||
| SEPTEMBER 30, 2020 | 49 | |
STATEMENTS OF ASSETS AND LIABILITIES (Unaudited)
September 30, 2020
| Sit U.S. Government Securities Fund |
Sit Quality Income Fund |
Sit Tax-Free Income Fund |
Sit Minnesota Tax-Free Income Fund |
|||||||||||||
| ASSETS |
||||||||||||||||
| Investments in securities, at identified cost |
$487,511,642 | $100,733,924 | $321,846,708 | $613,563,561 | ||||||||||||
|
|
|
|
|
|
|
|
|
|||||||||
| Investments in securities, at fair value - see accompanying schedule for detail |
$504,431,943 | $102,090,474 | $318,376,778 | $630,195,983 | ||||||||||||
| Cash in bank on demand deposit |
— | 5,617 | 6,047,060 | 16,046,362 | ||||||||||||
| Cash collateral held at broker |
— | 50,000 | — | — | ||||||||||||
| Accrued interest and dividends receivable |
1,831,430 | 447,252 | 3,745,721 | 6,877,793 | ||||||||||||
| Receivable for investment securities sold |
7,023 | 73,879 | — | — | ||||||||||||
| Receivable for Fund shares sold |
469,308 | 1,554 | 114,036 | 563,118 | ||||||||||||
|
|
|
|
|
|
|
|
|
|||||||||
| Total assets |
506,739,704 | 102,668,776 | 328,283,595 | 653,683,256 | ||||||||||||
|
|
|
|
|
|
|
|
|
|||||||||
| LIABILITIES |
||||||||||||||||
| Disbursements in excess of cash balances |
123,217 | — | — | — | ||||||||||||
| Payable for investment securities purchased |
20,073,226 | 600,098 | 3,613,210 | 501,903 | ||||||||||||
| Payable for Fund shares redeemed |
2,152,312 | 2,792 | 181,398 | 660,834 | ||||||||||||
| Cash portion of dividends payable to shareholders |
28,078 | 4,029 | 268,579 | 174,008 | ||||||||||||
| Variation margin on futures contracts |
— | 4,519 | — | — | ||||||||||||
| Accrued supervisory and administrative fees |
231,233 | — | — | — | ||||||||||||
| Accrued investment management fees |
78,671 | 73,828 | 213,135 | 426,345 | ||||||||||||
|
|
|
|
|
|
|
|
|
|||||||||
| Total liabilities |
22,686,737 | 685,266 | 4,276,322 | 1,763,090 | ||||||||||||
|
|
|
|
|
|
|
|
|
|||||||||
| Net assets applicable to outstanding capital stock |
$484,052,967 | $101,983,510 | $324,007,273 | $651,920,166 | ||||||||||||
|
|
|
|
|
|
|
|
|
|||||||||
| Net assets consist of: |
||||||||||||||||
| Capital (par value and paid-in surplus) |
$485,146,405 | $102,169,214 | $336,979,040 | $637,554,964 | ||||||||||||
| Total distributable earnings (loss), including unrealized appreciation (depreciation) |
(1,093,438 | ) | (185,704 | ) | (12,971,767 | ) | 14,365,202 | |||||||||
|
|
|
|
|
|
|
|
|
|||||||||
| $484,052,967 | $101,983,510 | $324,007,273 | $651,920,166 | |||||||||||||
|
|
|
|
|
|
|
|
|
|||||||||
| Outstanding shares: |
||||||||||||||||
| Class S Shares (Class S)* |
38,650,095 | 10,223,916 | 33,083,134 | 61,335,737 | ||||||||||||
|
|
|
|
|
|
|
|
|
|||||||||
| Class Y Shares (Class Y)* |
4,364,976 | — | — | — | ||||||||||||
|
|
|
|
|
|
|
|
|
|||||||||
| Net assets applicable to outstanding shares: |
||||||||||||||||
| Net Assets (Class S) * |
$434,947,816 | $101,983,510 | $324,007,273 | $651,920,166 | ||||||||||||
|
|
|
|
|
|
|
|
|
|||||||||
| Net Assets (Class Y) * |
49,105,151 | — | — | — | ||||||||||||
|
|
|
|
|
|
|
|
|
|||||||||
| Net asset value per share of outstanding capital stock: |
||||||||||||||||
| Net Asset Value (Class S) * |
$11.25 | $9.97 | $9.79 | $10.63 | ||||||||||||
|
|
|
|
|
|
|
|
|
|||||||||
| Net Asset Value (Class Y) * |
11.25 | — | — | — | ||||||||||||
|
|
|
|
|
|
|
|
|
|||||||||
* Sit U.S. Government Securities Fund offers multiple share classes (S and Y). All other Funds offer a single share class.
See accompanying notes to financial statements.
| 50 |
SIT MUTUAL FUNDS SEMI-ANNUAL REPORT |
STATEMENTS OF OPERATIONS (Unaudited)
Six Months Ended September 30, 2020
| Sit U.S. Government Securities Fund |
Sit Quality Income Fund |
Sit Tax-Free Income Fund |
Sit Minnesota Tax-Free Income Fund |
|||||||||||||
| Investment income: |
||||||||||||||||
| Income: |
||||||||||||||||
| Dividends |
— | — | $361,033 | $113,672 | ||||||||||||
| Interest |
$5,183,607 | $989,969 | 5,574,368 | 11,920,030 | ||||||||||||
|
|
|
|
|
|
|
|
|
|||||||||
| Total income |
5,183,607 | 989,969 | 5,935,401 | 12,033,702 | ||||||||||||
|
|
|
|
|
|
|
|
|
|||||||||
| Expenses (note 4): |
||||||||||||||||
| Investment management fee |
450,134 | 430,666 | 1,266,043 | 2,545,861 | ||||||||||||
| Supervisory and administrative fee |
1,331,390 | — | — | — | ||||||||||||
|
|
|
|
|
|
|
|
|
|||||||||
| Total expenses |
1,781,524 | 430,666 | 1,266,043 | 2,545,861 | ||||||||||||
|
|
|
|
|
|
|
|
|
|||||||||
| Net investment income |
3,402,083 | 559,303 | 4,669,358 | 9,487,841 | ||||||||||||
|
|
|
|
|
|
|
|
|
|||||||||
| Realized and unrealized gain (loss): |
||||||||||||||||
| Net realized gain (loss) on investments |
(248,266 | ) | 66,454 | (177,626 | ) | 207,457 | ||||||||||
| Net realized gain (loss) on futures |
— | 670 | — | — | ||||||||||||
| Net change in unrealized appreciation (depreciation) on investments |
(52,010 | ) | 1,375,258 | 7,843,646 | 15,152,713 | |||||||||||
| Net change in unrealized appreciation (depreciation) on futures |
— | (4,519 | ) | — | — | |||||||||||
|
|
|
|
|
|
|
|
|
|||||||||
| Net gain (loss) |
(300,276 | ) | 1,437,863 | 7,666,020 | 15,360,170 | |||||||||||
|
|
|
|
|
|
|
|
|
|||||||||
| Net increase (decrease) in net assets resulting from operations |
$3,101,807 | $1,997,166 | $12,335,378 | $24,848,011 | ||||||||||||
|
|
|
|
|
|
|
|
|
|||||||||
See accompanying notes to financial statements.
| SEPTEMBER 30, 2020 |
51 |
STATEMENTS OF CHANGES IN NET ASSETS
| Sit U.S. Government Securities Fund | ||||||||
| Six Months Ended September 30, 2020 (Unaudited) |
Year Ended March 31, 2020 |
|||||||
| Operations: |
||||||||
| Net investment income |
$3,402,083 | $8,479,108 | ||||||
| Net realized gain (loss) on investments, written options and futures |
(248,266 | ) | (1,745,753 | ) | ||||
| Net change in unrealized appreciation (depreciation) of investments, written options and futures |
(52,010 | ) | 14,303,888 | |||||
|
|
|
|
|
|
||||
| Net increase (decrease) in net assets resulting from operations |
3,101,807 | 21,037,243 | ||||||
|
|
|
|
|
|
||||
| Distributions from: |
||||||||
| Net investment income and net realized gains |
||||||||
| Common shares (Class I) |
— | — | ||||||
| Common shares (Class S) |
(3,226,966 | ) | (8,509,113 | ) | ||||
| Common shares (Class Y) |
(175,370 | ) | (60,462 | ) | ||||
|
|
|
|
|
|
||||
| Total distributions |
(3,402,336 | ) | (8,569,575 | ) | ||||
|
|
|
|
|
|
||||
| Capital share transactions: |
||||||||
| Proceeds from shares sold |
||||||||
| Class S Shares |
117,513,627 | 101,588,852 | ||||||
| Class Y Shares |
36,859,942 | 13,495,056 | ||||||
| Reinvested distributions |
||||||||
| Class S Shares |
3,072,775 | 7,974,475 | ||||||
| Class Y Shares |
160,736 | 51,559 | ||||||
| Payments for shares redeemed |
||||||||
| Class S Shares |
(90,394,580 | ) | (144,047,050 | ) | ||||
| Class Y Shares |
(928,322 | ) | (775,130 | ) | ||||
|
|
|
|
|
|
||||
| Increase (decrease) in net assets from capital transactions |
66,284,178 | (21,712,238 | ) | |||||
|
|
|
|
|
|
||||
| Total increase (decrease) in net assets |
65,983,649 | (9,244,570 | ) | |||||
| Net assets: |
||||||||
| Beginning of period |
418,069,318 | 427,313,888 | ||||||
|
|
|
|
|
|
||||
| End of period |
$484,052,967 | $418,069,318 | ||||||
|
|
|
|
|
|
||||
| Capital transactions in shares: |
||||||||
| Sold |
||||||||
| Class S Shares |
10,419,009 | 45,551,026 | ||||||
| Class Y Shares |
3,270,636 | 1,227,355 | ||||||
| Reinvested distributions |
||||||||
| Class S Shares |
272,825 | 723,317 | ||||||
| Class Y Shares |
14,277 | 4,611 | ||||||
| Redeemed |
||||||||
| Class S Shares |
(8,019,237 | ) | (49,435,171 | ) | ||||
| Class Y Shares |
(82,388 | ) | (69,515 | ) | ||||
|
|
|
|
|
|
||||
| Net increase (decrease) |
5,875,122 | (1,998,377 | ) | |||||
|
|
|
|
|
|
||||
See accompanying notes to financial statements.
| 52 |
SIT MUTUAL FUNDS SEMI-ANNUAL REPORT |
| Sit Quality Income Fund |
Sit Tax-Free Income Fund |
Minnesota Tax-Free Income Fund | ||||||||||||||||||||
| Six Months Ended |
Year Ended March 31, 2020 |
Six Months Ended September 30, 2020 (Unaudited) |
Year Ended March 31, 2020 |
Six Months Ended September 30, 2020 (Unaudited) |
Year Ended March 31, 2020 |
|||||||||||||||||
| $559,303 | $1,525,198 | $4,669,358 | $8,630,509 | $9,487,841 | $18,682,152 | |||||||||||||||||
| 67,124 | 345,244 | (177,626 | ) | (1,465,404 | ) | 207,457 | (323,774 | ) | ||||||||||||||
| 1,370,739 | (149,979 | ) | 7,843,646 | (5,319,636 | ) | 15,152,713 | (9,036,335 | ) | ||||||||||||||
|
|
|
|
|
|
|
|
|
|
|
|
|
|
|
|
||||||||
| 1,997,166 | 1,720,463 | 12,335,378 | 1,845,469 | 24,848,011 | 9,322,043 | |||||||||||||||||
|
|
|
|
|
|
|
|
|
|
|
|
|
|
|
|
||||||||
| (559,284 | ) | (1,535,098 | ) | (4,669,753 | ) | (8,761,294 | ) | (9,487,878 | ) | (18,780,673 | ) | |||||||||||
| — | — | — | — | — | — | |||||||||||||||||
| — | — | — | — | — | — | |||||||||||||||||
|
|
|
|
|
|
|
|
|
|
|
|
|
|
|
|
||||||||
| (559,284 | ) | (1,535,098 | ) | (4,669,753 | ) | (8,761,294 | ) | (9,487,878 | ) | (18,780,673 | ) | |||||||||||
|
|
|
|
|
|
|
|
|
|
|
|
|
|
|
|
||||||||
| 17,310,217 | 41,736,062 | 43,327,872 | 136,550,794 | 64,925,573 | 173,103,966 | |||||||||||||||||
| — | — | — | — | — | — | |||||||||||||||||
| 534,638 | 1,420,239 | 3,072,692 | 6,513,741 | 8,258,038 | 16,426,302 | |||||||||||||||||
| — | — | — | — | — | — | |||||||||||||||||
| (7,572,257 | ) | (35,355,615 | ) | (43,354,735 | ) | (70,203,739 | ) | (78,645,887 | ) | (155,815,141 | ) | |||||||||||
| — | — | — | — | — | — | |||||||||||||||||
|
|
|
|
|
|
|
|
|
|
|
|
|
|
|
|
||||||||
| 10,272,598 | 7,800,686 | 3,045,829 | 72,860,796 | (5,462,276 | ) | 33,715,127 | ||||||||||||||||
|
|
|
|
|
|
|
|
|
|
|
|
|
|
|
|
||||||||
| 11,710,480 | 7,986,051 | 10,711,454 | 65,944,971 | 9,897,857 | 24,256,497 | |||||||||||||||||
| 90,273,030 | 82,286,979 | 313,295,819 | 247,350,848 | 642,022,309 | 617,765,812 | |||||||||||||||||
|
|
|
|
|
|
|
|
|
|
|
|
|
|
|
|
||||||||
| $101,983,510 | $90,273,030 | $324,007,273 | $313,295,819 | $651,920,166 | $642,022,309 | |||||||||||||||||
|
|
|
|
|
|
|
|
|
|
|
|
|
|
|
|
||||||||
| 1,745,113 | 4,246,769 | 4,516,807 | 13,869,208 | 6,192,325 | 16,257,684 | |||||||||||||||||
| — | — | — | — | — | — | |||||||||||||||||
| 53,801 | 144,292 | 318,209 | 661,211 | 788,698 | 1,540,122 | |||||||||||||||||
| — | — | — | — | — | — | |||||||||||||||||
| (764,012 | ) | (3,598,408 | ) | (4,534,387 | ) | (7,262,186 | ) | (7,568,568 | ) | (14,784,906 | ) | |||||||||||
| — | — | — | — | — | — | |||||||||||||||||
|
|
|
|
|
|
|
|
|
|
|
|
|
|
|
|
||||||||
| 1,034,902 | 792,653 | 300,629 | 7,268,233 | (587,545 | ) | 3,012,900 | ||||||||||||||||
|
|
|
|
|
|
|
|
|
|
|
|
|
|
|
|
||||||||
| SEPTEMBER 30, 2020 |
53 |
Per share income and capital changes for a share outstanding throughout the period. See accompanying notes to financial statements.
Sit U.S. Government Securities Fund
| Six Months Ended | ||||||||||||||||||||||||
| Class S |
September 30, 2020 |
Year Ended March 31, | ||||||||||||||||||||||
| 2020 | 2019 | 2018 | 2017 | 2016 | ||||||||||||||||||||
| Net Asset Value: |
||||||||||||||||||||||||
| Beginning of period |
$11.26 | $10.92 | $10.80 | $10.90 | $11.07 | $11.09 | ||||||||||||||||||
|
|
|
| ||||||||||||||||||||||
| Operations: |
||||||||||||||||||||||||
| Net investment income 1 |
0.08 | 0.22 | 0.23 | 0.18 | 0.17 | 0.20 | ||||||||||||||||||
| Net realized and unrealized gains (losses) on investments, written options and futures |
(0.01 | ) | 0.34 | 0.12 | (0.10 | ) | (0.17 | ) | (0.02 | ) | ||||||||||||||
|
|
|
| ||||||||||||||||||||||
| Total from operations |
0.07 | 0.56 | 0.35 | 0.08 | — | 0.18 | ||||||||||||||||||
|
|
|
| ||||||||||||||||||||||
| Distributions from: |
||||||||||||||||||||||||
| Net investment income |
(0.08 | ) | (0.22 | ) | (0.23 | ) | (0.18 | ) | (0.17 | ) | (0.20 | ) | ||||||||||||
|
|
|
| ||||||||||||||||||||||
| Net Asset Value: |
||||||||||||||||||||||||
| End of period |
$11.25 | $11.26 | $10.92 | $10.80 | $10.90 | $11.07 | ||||||||||||||||||
|
|
|
| ||||||||||||||||||||||
| Total investment return 2 |
0.66% | 5.25% | 3.31% | 0.76% | 0.02% | 1.63% | ||||||||||||||||||
|
|
|
| ||||||||||||||||||||||
| Net assets at end of period (000’s omitted) |
$434,948 | $404,985 | $427,314 | $527,748 | $643,304 | $663,676 | ||||||||||||||||||
| Ratios: 3 |
||||||||||||||||||||||||
| Expenses |
0.80% | 0.80% | 0.80% | 0.80% | 0.80% | 0.80% | ||||||||||||||||||
| Net investment income |
1.50% | 2.06% | 2.13% | 1.68% | 1.57% | 1.81% | ||||||||||||||||||
| Portfolio turnover rate (excluding short-term securities) |
9.78% | 4 | 29.91% | 14.88% | 14.68% | 29.00% | 28.65% | |||||||||||||||||
| 1 | The net investment income per share is based on average shares outstanding for the period. |
| 2 | Total investment return is based on the change in net asset value of a share during the period (not annualized) and assumes reinvestment of distributions at net asset value. |
| 3 | Ratios are annualized for periods less than one year. In addition to fees and expenses which the Fund bears directly, the Fund indirectly bears a pro rata share of the fees and expenses of the acquired funds in which it invests. Such indirect expenses are not included in the above reported expense ratios. |
| 4 | Not annualized. |
| 54 |
SIT MUTUAL FUNDS SEMI-ANNUAL REPORT |
FINANCIAL HIGHLIGHTS
Per share income and capital changes for a share outstanding throughout the period. See accompanying notes to financial statements.
Sit U.S. Government Securities Fund
| Six Months Ended | ||||||||
| Class Y | September 30, 2020 | Period Ended March 31, | ||||||
| (Unaudited) | 2020 1 | |||||||
| Net Asset Value: |
||||||||
| Beginning of period |
$11.26 | $10.97 | ||||||
|
|
|
| ||||||
| Operations: |
||||||||
| Net investment income 2 |
0.11 | 0.06 | ||||||
| Net realized and unrealized gains (losses) on investments, written options and futures |
(0.02 | ) | 0.29 | |||||
|
|
|
| ||||||
| Total from operations. |
0.09 | 0.35 | ||||||
|
|
|
| ||||||
| Distributions from: |
||||||||
| Net investment income |
(0.10 | ) | (0.06 | ) | ||||
|
|
|
| ||||||
| Net Asset Value: |
||||||||
| End of period |
$11.25 | $11.26 | ||||||
|
|
|
| ||||||
| Total investment return 3 |
0.80% | 3.20% | ||||||
|
|
|
| ||||||
| Net assets at end of period (000’s omitted) |
$49,105 | $13,085 | ||||||
| Ratios: 4 |
||||||||
| Expenses |
0.55% | 0.55%5 | ||||||
| Net investment income |
1.90% | 2.19% | ||||||
| Portfolio turnover rate (excluding short-term securities) |
9.78%6 | 29.91% | ||||||
| 1 | The inception date of Class Y shares was January 1, 2020. |
| 2 | The net investment income per share is based on average shares outstanding for the period. |
| 3 | Total investment return is based on the change in net asset value of a share during the period (not annualized) and assumes reinvestment of distributions at net asset value. |
| 4 | Ratios are annualized for periods less than one year. In addition to fees and expenses which the Fund bears directly, the Fund indirectly bears a pro rata share of the fees and expenses of the acquired funds in which it invests. Such indirect expenses are not included in the above reported expense ratios. |
| 5 | Sit U.S. Government Securities Fund Class Y shares were first issued on January 1, 2020, and therefore the fees presented reflect the fees provided for in the Investment Management Agreement and Supervision and Administration Agreement. |
| 6 | Not annualized. |
| SEPTEMBER 30, 2020 |
55 |
FINANCIAL HIGHLIGHTS
Per share income and capital changes for a share outstanding throughout the period. See accompanying notes to financial statements.
Sit Quality Income Fund
| Six Months Ended | ||||||||||||||||||||||||
|
September 30, 2020 |
Years Ended March 31, | |||||||||||||||||||||||
| 2020 | 2019 | 2018 | 2017 | 2016 | ||||||||||||||||||||
|
|
||||||||||||||||||||||||
| Net Asset Value: |
||||||||||||||||||||||||
| Beginning of period |
$9.82 | $9.80 | $9.78 | $9.83 | $9.83 | $9.94 | ||||||||||||||||||
|
|
|
|||||||||||||||||||||||
| Operations: |
||||||||||||||||||||||||
| Net investment income 1 |
0.06 | 0.18 | 0.19 | 0.13 | 0.09 | 0.10 | ||||||||||||||||||
| Net realized and unrealized gains (losses) on investments, written options and futures |
0.15 | 0.02 | 0.02 | (0.05 | ) | — | (0.11 | ) | ||||||||||||||||
|
|
|
|||||||||||||||||||||||
| Total from operations |
0.21 | 0.20 | 0.21 | 0.08 | 0.09 | (0.01 | ) | |||||||||||||||||
|
|
|
|||||||||||||||||||||||
| Distributions from: |
||||||||||||||||||||||||
| Net investment income |
(0.06) | (0.18 | ) | (0.19 | ) | (0.13 | ) | (0.09 | ) | (0.10 | ) | |||||||||||||
|
|
|
|||||||||||||||||||||||
| Net Asset Value: |
||||||||||||||||||||||||
| End of period |
$9.97 | $9.82 | $9.80 | $9.78 | $9.83 | $9.83 | ||||||||||||||||||
|
|
|
|||||||||||||||||||||||
| Total investment return 2 |
2.12% | 2.04% | 2.17% | 0.79% | 0.91% | (0.10% | ) | |||||||||||||||||
|
|
|
|||||||||||||||||||||||
| Net assets at end of period (000’s omitted) |
$101,984 | $90,273 | $82,287 | $74,542 | $73,861 | $66,880 | ||||||||||||||||||
| Ratios: 3 |
||||||||||||||||||||||||
| Expenses |
0.90% | 0.90% | 0.90% | 0.90% | 0.90% | 0.90% | ||||||||||||||||||
| Net investment income |
1.17% | 1.80% | 1.96% | 1.31% | 0.91% | 1.02% | ||||||||||||||||||
| Portfolio turnover rate (excluding short-term securities) |
31.85%4 | 117.52% | 68.93% | 81.14% | 84.03% | 90.38% | ||||||||||||||||||
| 1 | The net investment income per share is based on average shares outstanding for the period. |
| 2 | Total investment return is based on the change in net asset value of a share during the period (not annualized) and assumes reinvestment of distributions at net asset value. |
| 3 | Ratios are annualized for periods less than one year. In addition to fees and expenses which the Fund bears directly, the Fund indirectly bears a pro rata share of the fees and expenses of the acquired funds in which it invests. Such indirect expenses are not included in the above reported expense ratios. |
| 4 | Not annualized. |
| 56 |
SIT MUTUAL FUNDS SEMI-ANNUAL REPORT |
FINANCIAL HIGHLIGHTS
Per share income and capital changes for a share outstanding throughout the period. See accompanying notes to financial statements.
Sit Tax-Free Income Fund
| Six Months Ended September 30, 2020 |
Years Ended March 31, | |||||||||||||||||||||||
| (Unaudited) | 2020 | 2019 | 2018 | 2017 | 2016 | |||||||||||||||||||
|
|
||||||||||||||||||||||||
| Net Asset Value: |
||||||||||||||||||||||||
| Beginning of period |
$9.56 | $9.69 | $9.66 | $9.49 | $9.80 | $9.68 | ||||||||||||||||||
|
|
|
|||||||||||||||||||||||
| Operations: |
||||||||||||||||||||||||
| Net investment income 1 |
0.14 | 0.29 | 0.32 | 0.39 | 0.35 | 0.33 | ||||||||||||||||||
| Net realized and unrealized gains (losses) on investments and futures |
0.23 | (0.13 | ) | 0.03 | 0.17 | (0.31 | ) | 0.12 | ||||||||||||||||
|
|
|
|||||||||||||||||||||||
| Total from operations |
0.37 | 0.16 | 0.35 | 0.56 | 0.04 | 0.45 | ||||||||||||||||||
|
|
|
|||||||||||||||||||||||
| Distributions from: |
||||||||||||||||||||||||
| Net investment income |
(0.14) | (0.29 | ) | (0.32 | ) | (0.39 | ) | (0.35 | ) | (0.33 | ) | |||||||||||||
|
|
|
|||||||||||||||||||||||
| Net Asset Value: |
||||||||||||||||||||||||
| End of period |
$9.79 | $9.56 | $9.69 | $9.66 | $9.49 | $9.80 | ||||||||||||||||||
|
|
|
|||||||||||||||||||||||
| Total investment return 2 |
3.93% | 1.66% | 3.67% | 6.00% | 0.37% | 4.78% | ||||||||||||||||||
|
|
|
|||||||||||||||||||||||
| Net assets at end of period (000’s omitted) |
$324,007 | $313,296 | $247,351 | $196,018 | $160,445 | $156,890 | ||||||||||||||||||
| Ratios: 3 |
||||||||||||||||||||||||
| Expenses |
0.80% | 0.80% | 0.80% | 0.80% | 0.80% | 0.80% | ||||||||||||||||||
| Net investment income |
2.95% | 2.95% | 3.37% | 4.03% | 3.58% | 3.45% | ||||||||||||||||||
| Portfolio turnover rate (excluding short-term securities) |
11.82%4 | 14.33% | 13.80% | 15.72% | 25.41% | 23.11% | ||||||||||||||||||
| 1 | The net investment income per share is based on average shares outstanding for the period. |
| 2 | Total investment return is based on the change in net asset value of a share during the period (not annualized) and assumes reinvestment of distributions at net asset value. |
| 3 | Ratios are annualized for periods less than one year. In addition to fees and expenses which the Fund bears directly, the Fund indirectly bears a pro rata share of the fees and expenses of the acquired funds in which it invests. Such indirect expenses are not included in the above reported expense ratios. |
| 4 | Not annualized. |
| SEPTEMBER 30, 2020 |
57 |
FINANCIAL HIGHLIGHTS
Per share income and capital changes for a share outstanding throughout the period. See accompanying notes to financial statements.
Sit Minnesota Tax-Free Income Fund
| Six Months Ended September 30, 2020 |
Years Ended March 31, | |||||||||||||||||||||||
| (Unaudited) | 2020 | 2019 | 2018 | 2017 | 2016 | |||||||||||||||||||
| Net Asset Value: |
||||||||||||||||||||||||
| Beginning of period |
$10.37 | $10.49 | $10.39 | $10.29 | $10.63 | $10.57 | ||||||||||||||||||
|
|
|
|||||||||||||||||||||||
| Operations: |
||||||||||||||||||||||||
| Net investment income 1 |
0.16 | 0.30 | 0.32 | 0.32 | 0.32 | 0.34 | ||||||||||||||||||
| Net realized and unrealized gains (losses) on investments and futures |
0.26 | (0.12 | ) | 0.10 | 0.10 | (0.34 | ) | 0.06 | ||||||||||||||||
|
|
|
|||||||||||||||||||||||
| Total from operations |
0.42 | 0.18 | 0.42 | 0.42 | (0.02 | ) | 0.40 | |||||||||||||||||
|
|
|
|||||||||||||||||||||||
| Distributions from: |
||||||||||||||||||||||||
| Net investment income |
(0.16) | (0.30 | ) | (0.32 | ) | (0.32 | ) | (0.32 | ) | (0.34 | ) | |||||||||||||
|
|
|
|||||||||||||||||||||||
| Net Asset Value: |
||||||||||||||||||||||||
| End of period |
$10.63 | $10.37 | $10.49 | $10.39 | $10.29 | $10.63 | ||||||||||||||||||
|
|
|
|||||||||||||||||||||||
| Total investment return 2 |
4.05% | 1.46% | 4.15% | 4.08% | (0.19% | ) | 3.89% | |||||||||||||||||
|
|
|
|||||||||||||||||||||||
| Net assets at end of period (000’s omitted) |
$651,920 | $642,022 | $617,766 | $551,163 | $529,821 | $508,209 | ||||||||||||||||||
| Ratios: 3 |
||||||||||||||||||||||||
| Expenses |
0.80% | 0.80% | 0.80% | 0.80% | 0.80% | 0.80% | ||||||||||||||||||
| Net investment income |
2.98% | 2.80% | 3.12% | 3.05% | 3.06% | 3.25% | ||||||||||||||||||
| Portfolio turnover rate (excluding short-term securities) |
3.15%4 | 10.05% | 9.25% | 12.97% | 16.18% | 10.45% | ||||||||||||||||||
| 1 | The net investment income per share is based on average shares outstanding for the period. |
| 2 | Total investment return is based on the change in net asset value of a share during the period (not annualized) and assumes reinvestment of distributions at net asset value. |
| 3 | Ratios are annualized for periods less than one year. In addition to fees and expenses which the Fund bears directly, the Fund indirectly bears a pro rata share of the fees and expenses of the acquired funds in which it invests. Such indirect expenses are not included in the above reported expense ratios. |
| 4 | Not annualized. |
| 58 |
SIT MUTUAL FUNDS SEMI-ANNUAL REPORT |
[This page intentionally left blank.]
| SEPTEMBER 30, 2020 |
59 |
NOTES TO FINANCIAL STATEMENTS (Unaudited)
Six Months Ended September 30, 2020
| (1) | Organization |
The Sit Mutual Funds (the Funds) are no-load funds, and are registered under the Investment Company Act of 1940 (as amended) as diversified (except Minnesota Tax-Free Income Fund which is non-diversified), open-end management investment companies, or series thereof. The Sit Quality Income Fund, Sit Tax-Free Income Fund and Minnesota Tax-Free Income Fund are series funds of Sit Mutual Funds II, Inc. Each fund has 10 billion authorized shares of capital stock. Shares in the U.S. Government Securities Fund have a par value of $0.01, and shares in other funds have a par value of $0.001. This report covers the bond funds of the Sit Mutual Funds.
The investment objective for each Fund is as follows:
| Fund | Investment Objective | |
| U.S. Government Securities Fund |
High level of current income and safety of principal. | |
| Quality Income Fund |
High level of current income and safety of principal. | |
| Tax-Free Income Fund |
High level of current income that is exempt from federal income tax, consistent with the preservation of capital. | |
| Minnesota Tax-Free Income Fund |
High level of current income that is exempt from federal regular income tax and Minnesota regular personal income tax, consistent with the preservation of capital. |
The U.S. Government Securities Fund offer Class S and Class Y shares. Both classes of shares have identical voting, dividend and liquidation rights. Income, expenses (other than class specific expenses) and realized and unrealized gains or losses on investments are allocated to each class of shares based upon its relative net assets.
| (2) | Significant Accounting Policies |
The Funds are investment companies and follow accounting and reporting guidance under Financial Accounting Standards Board (“FASB”) Accounting Standards Codification (“ASC”) Topic 946, “Financial Services-Investment Companies”. The following is a summary of significant accounting policies consistently followed by the Funds in the preparation of their financial statements in conformity with U.S. generally accepted accounting principles (“GAAP”).
Investments in Securities
Investment securities are carried at fair value based upon closing market quotations on the last business day of the period. Investments in securities traded on national or international securities exchanges are valued at the last reported sales price prior to the time when assets are valued. Equity securities traded on the over-the-counter market are valued at the last reported sales price or if the last sales price is not available, at the last reported bid price. The sale and bid prices or prices deemed best to reflect fair value quoted by dealers who make markets in these securities are obtained from independent pricing services. Consistent with the Funds’ valuation policies and procedures, the current fair value of certain fixed income securities is provided by an independent pricing service. Fixed income securities for which prices are not available from an independent pricing service but where an active market exists are valued using market quotations obtained from broker-dealers or quotation systems. Securities for which market quotations are not available, such as private placement securities, are valued at fair value according to methods selected in good faith by Sit Investment Associates, Inc. (the “Adviser”) and may include dealer-supplied valuations or other inputs and assumptions that pricing services would typically utilize. Short-term investments of sufficient credit quality with maturities of 60 days or less when acquired, or which subsequently are within 60 days of maturity, are valued at amortized cost, which approximates fair value. Options and futures contracts entered into and held by the Funds are valued at the close of the securities and commodities exchange on which they are traded.
Security transactions are accounted for on the date the securities are purchased or sold. Gains and losses are calculated on the identified-cost basis. Interest, including level-yield amortization of long-term bond premium and discount, is recorded on the accrual basis. Dividends received from closed-end fund holdings are included in Dividend Income and distributions from capital gains, if any, are included in Net Realized Gain (Loss).
| 60 |
SIT MUTUAL FUNDS SEMI-ANNUAL REPORT |
Delivery and payment for securities which have been purchased by the Funds on a forward commitment or when-issued basis can take place two weeks or more after the transaction date. During this period, such securities are subject to market fluctuations and may increase or decrease in value prior to delivery.
The Minnesota Tax-Free Income Fund concentrates its investments in Minnesota, and therefore may have more credit risk related to the economic conditions in the state of Minnesota than a portfolio with broader geographical diversification.
Derivative Instruments
The Funds apply derivative instrument disclosure standards in order to enable investors to understand how and why the Funds use derivatives, how derivatives are accounted for, and how derivative instruments affect the Funds’ financial statements.
To hedge interest rate risk, the Funds used Treasury options and futures traded on a U.S. exchange. Risks of entering into futures and options contracts include the possibility of an illiquid market and that a change in the value of the option may not correlate with changes in the value of the underlying securities.
The premiums paid for the options represent the cost of the investment and the options are valued daily at their closing price. The Funds recognize a realized gain or loss when the option is sold or expired. Option holdings within the Funds, which may include put options and call options, are subject to loss of value with the passage of time, and may experience a total loss of value upon expiration. With options, there is minimal counterparty risk to the Funds since they are exchange traded.
Upon entering into a futures contract, a Fund is required to deposit either cash or securities in an amount (initial margin) equal to a certain percentage of the contract value. Subsequent payments (variation margin) are made or received by the Fund each day. The variation margin payments are equal to the daily changes in the contract value and are recorded as unrealized gains and losses. The Fund recognizes a realized gain or loss when the contract is closed or expired. With futures contracts, there is minimal counterparty risk to the Fund since futures are exchange traded and the exchange’s clearinghouse, as counterparty to all exchange-traded futures, guarantees the futures against default.
During the six months ended September 30, 2020, the average volume of derivative activity, calculated on a quarterly basis (monthly for U.S. Government Securities Fund), was as follows:
| Average Cost |
Average Premium Received |
Average Notional Amount |
||||||||||
| U.S. Government Securities Fund |
||||||||||||
| Purchased put options |
$69,605 | — | $18,187,500 | |||||||||
| Quality Income Fund |
||||||||||||
| Treasury futures - short |
— | — | 1,176,292 | |||||||||
The number of open option contracts and open futures contracts outstanding as of September 30, 2020 also serve as indicators of the volume of activity for the Funds throughout the period.
| SEPTEMBER 30, 2020 |
61 |
NOTES TO FINANCIAL STATEMENTS (Unaudited)
Six Months Ended September 30, 2020 (Continued)
Statement of Assets and Liabilities - Values of derivatives as of September 30, 2020
| Asset Derivatives Value | Liability Derivatives Value | |||||||
|
|
|
|||||||
| Interest rate risk: |
||||||||
| Quality Income Fund |
||||||||
| Treasury futures |
— | $4,519 1 | ||||||
| 1 | Statement of Assets and Liabilities location: Variation margin receivable/payable. Includes cumulative appreciation(depreciation) of futures as reportedin the Schedule of Investments. |
The effect of derivative instruments on the statement of operations for the six months ended September 30, 2020:
| Amount of Realized | Change in Unrealized | |||||||
| Gain (Loss) on Derivatives 3 | Appreciation (Depreciation) on Derivatives 4 | |||||||
| Interest rate risk: |
||||||||
| U.S. Government Securities Fund |
||||||||
| Purchased put options |
($246,616 | ) | $194,397 | |||||
| Quality Income Fund |
||||||||
| Treasury futures |
670 | (4,519 | ) | |||||
| 3 | Statement of Operations location: Net realized gain (loss) on investments and net realized gain (loss) on futures, respectively. |
| 4 | Statement of Operations location: Net change in unrealized appreciation (depreciation) on investments and net change in unrealized appreciation (depreciation) on futures, respectively. |
| 62 |
SIT MUTUAL FUNDS SEMI-ANNUAL REPORT |
Fair Value Measurements
The inputs and valuation techniques used to measure fair value of the Funds’ net assets are summarized into three levels as described in the hierarchy below:
| • | Level 1 – quoted prices in active markets for identical securities. An active market for the security is a market in which transactions occur with sufficient frequency and volume to provide pricing information on an ongoing basis. A quoted price in an active market provides the most reliable evidence of fair value. |
| • | Level 2 – debt securities are valued based on evaluated prices received from independent pricing services or from dealers who make markets in such securities. For corporate bonds, U.S. government and government agency obligations, and municipal securities the pricing services utilize matrix pricing which considers yield or price of bonds of comparable quality, coupon, maturity, and type as well as dealer supplied prices. For asset-backed securities and mortgage-backed securities, the pricing services utilize matrix pricing which considers prepayment speed assumptions, attributes of the collateral, yield or price of bonds of comparable quality, coupon, maturity, and type as well as dealer supplied prices. All of these inputs are derived principally from or corroborated by observable market data. An adjustment to any observable input that is significant to the fair value may render the measurement a Level 3 measurement. |
| • | Level 3 – significant unobservable inputs, including the Adviser’s own assumptions in determining the fair value of investments. |
The inputs or methodology used for valuing securities are not necessarily an indication of the risk associated with investing in those securities.
At the end of each calendar quarter, management evaluates the Level 2 and 3 assets and liabilities for changes in liquidity, including but not limited to: whether a broker is willing to execute at the quoted price, the depth and consistency of prices from third party services, and the existence of contemporaneous, observable trades in the market. Additionally, management evaluates the Level 1 and 2 assets and liabilities on a quarterly basis for changes in listings or delistings on national exchanges. Due to the inherent uncertainty of determining the fair value of investments that do not have a readily available market value, the fair value of the Funds’ investments may fluctuate from period to period. Additionally, the fair value of investments may differ significantly from the values that would have been used had a ready market existed for such investments and may differ materially from the values the Fund may ultimately realize. Further, such investments may be subject to legal and other restrictions on resale or otherwise are less liquid than publicly traded securities.
A summary of the levels for the Funds’ investments as of September 30, 2020 is included with the Funds’ schedules of investments.
Federal Taxes
The Funds’ policy is to comply with the requirements of the Internal Revenue Code applicable to regulated investment companies and to distribute all of their taxable income to shareholders. The Funds have recorded in their financial statements the full benefit of their tax positions taken in connection with the Registered Investment Company (RIC) qualification and distribution requirements of the Internal Revenue Code. Therefore, no income tax provision is required. Also, in order to avoid the payment of any federal excise taxes, the Funds will distribute substantially all of their net investment income and net realized gains on a calendar year basis.
Management has analyzed the Funds’ tax positions taken in federal tax returns for all open tax years and has concluded that as of September 30, 2020, no provision for income tax would be required in the Funds’ financial statements. The Funds’ federal and state income and federal excise tax returns remain subject to examination by the Internal Revenue Service and state departments of revenue until such time as the applicable statute of limitations for audit has expired. For example, U.S. tax returns are generally subject to audit for three years from the date they are filed.
| SEPTEMBER 30, 2020 |
63 |
NOTES TO FINANCIAL STATEMENTS (Unaudited)
Six Months Ended September 30, 2020 (Continued)
At September 30, 2020, the gross unrealized appreciation (depreciation) on investments and cost of investments on a tax basis for federal income tax purposes were as follows:
| Unrealized Appreciation |
Unrealized Depreciation |
Net Unrealized Appreciation (Depreciation) |
Cost (Proceeds) of Investments on a Tax Basis |
|||||||||||||
| U.S. Government Securities - Investments |
$17,945,589 | ($1,025,288 | ) | $16,920,301 | $487,511,642 | |||||||||||
| Quality Income - Investments |
1,558,408 | (201,858 | ) | 1,356,550 | 100,733,924 | |||||||||||
| Tax-Free Income - Investments |
15,180,969 | (18,650,899 | ) | (3,469,930 | ) | 321,846,708 | ||||||||||
| Minnesota Tax-Free Income - Investments |
25,821,034 | (9,188,612 | ) | 16,632,422 | 613,563,561 | |||||||||||
Net investment income and net realized gains may differ for financial statement and tax purposes. The character of distributions made during the year from net investment income or net realized gains may also differ from its ultimate characterization for tax purposes. The tax character of distributions paid during the fiscal years ended March 31, 2020 and 2019 were as follows:
| Year Ended March 31, 2020: | ||||||||||||||
| Ordinary Income | Tax-Exempt Income |
Long Term Capital Gain |
Total | |||||||||||
| U.S. Government Securities |
$8,592,078 | — | — | $8,592,078 | ||||||||||
| Quality Income |
1,540,562 | — | — | 1,540,562 | ||||||||||
| Tax-Free Income* |
51,791 | $8,593,961 | — | 8,645,752 | ||||||||||
| Minnesota Tax-Free Income* |
21,281 | 18,749,227 | — | 18,770,508 | ||||||||||
| *99.4% and 99.9% of dividends were derived from interest on tax-exempt securities for the Tax-Free Income and Minnesota Tax-Free Income Funds, respectively. |
| |||||||||||||
| Year Ended March 31, 2019: | ||||||||||||||
| Ordinary Income | Tax-Exempt Income |
Long Term Capital Gain |
Total | |||||||||||
| U.S. Government Securities |
$10,088,083 | — | — | $10,088,083 | ||||||||||
| Quality Income |
1,541,309 | — | — | 1,541,309 | ||||||||||
| Tax-Free Income* |
155,254 | $7,037,416 | — | 7,192,670 | ||||||||||
| Minnesota Tax-Free Income* |
43,587 | 17,831,078 | — | 17,874,665 | ||||||||||
| *97.8% and 99.8% of dividends were derived from interest on tax-exempt securities for the Tax-Free Income and Minnesota Tax-Free Income Funds, respectively. |
| |||||||||||||
As of March 31, 2020, the components of distributable earnings on a tax basis were as follows:
| Undistributed Ordinary Income |
Undistributed Tax-Exempt Income |
Accumulated Gain (Loss) |
Unrealized Appreciation (Depreciation) | |||||||||||||
|
|
|
| ||||||||||||||
| U.S. Government Securities |
$34,347 | — | ($17,495,957 | ) | $17,166,708 | |||||||||||
| Quality Income |
4,622 | — | (1,544,827 | ) | (20,188 | ) | ||||||||||
| Tax-Free Income |
— | $258,577 | (9,326,582 | ) | (11,319,611 | ) | ||||||||||
| Minnesota Tax-Free Income |
— | 174,777 | (2,526,401 | ) | 1,563,873 | |||||||||||
| 64 |
SIT MUTUAL FUNDS SEMI-ANNUAL REPORT |
Net capital loss carryovers and late year losses, if any, as of March 31, 2020, are available to offset future realized capital gains and thereby reduce future capital gains distributions. The Funds are permitted to carry forward capital losses for an unlimited period. Capital losses that are carried forward retain their character as either short-term or long-term capital losses. The net capital loss carryovers and the late year losses deferred as of March 31, 2020, were as follows:
| Unlimited Period of
Net Capital Loss Carryover |
Late Year Losses Deferred |
Accumulated Capital and |
||||||||||||
| Short-Term | Long-Term | |||||||||||||
| U.S. Government Securities |
$8,515,454 | $8,980,503 | — | $17,495,957 | ||||||||||
| Quality Income |
307,300 | 1,237,527 | — | 1,544,827 | ||||||||||
| Tax-Free Income |
1,339,517 | 7,987,065 | — | 9,326,582 | ||||||||||
| Minnesota Tax-Free Income |
1,267,950 | 1,258,451 | — | 2,526,401 | ||||||||||
For the year ended March 31, 2020, the Funds’ utilized capital losses and expired capital losses as follows:
| Utilized | Expired | |||||||
| Quality Income |
$770,253 | — | ||||||
| Minnesota Tax-Free Income |
9,712 | — | ||||||
Distributions
Distributions to shareholders are recorded as of the close of business on the record date. Such distributions are payable in cash or reinvested in additional shares of the Funds’ capital stock. Distributions from net investment income are declared daily and paid monthly for the Funds. Distributions from net realized gains, if any, will be made annually for each of the Funds.
Use of Estimates
The preparation of financial statements in conformity with U.S. generally accepted accounting principles requires management to make certain estimates and assumptions that affect the reported amounts of assets and liabilities and disclosure of contingent assets and liabilities at the date of the financial statements and the reported results for the respective periods. Actual results could differ from those estimates.
Guarantees and Indemnifications
Under each Fund’s organizational documents, its officers and directors are indemnified against certain liabilities arising out of the performance of their duties to each Fund. In addition, certain of each Fund’s contracts with its service providers contain general indemnification clauses. Each Fund’s maximum exposure under these arrangements is unknown since the amount of any future claims that may be made against each Fund cannot be determined and each Fund has no historical basis for predicting the likelihood of any such claims.
| SEPTEMBER 30, 2020 |
65 |
NOTES TO FINANCIAL STATEMENTS (Unaudited)
Six Months Ended September 30, 2020 (Continued)
| (3) | Investment Security Transactions |
The cost of purchases and proceeds from sales and maturities of investment securities, other than short-term securities, for the six months ended September 30, 2020, were as follows:
| Purchases | Proceeds | |||||||||||||
| U.S. Government | Other | U.S. Government | Other | |||||||||||
| U.S. Government Securities |
$79,504,692 | $10,180,017 | $39,936,336 | $898,279 | ||||||||||
| Quality Income |
20,316,985 | 19,073,023 | 4,999,138 | 19,971,265 | ||||||||||
| Tax-Free Income |
— | 43,402,351 | — | 35,772,237 | ||||||||||
| Minnesota Tax-Free Income |
— | 19,547,473 | — | 39,709,743 | ||||||||||
| (4) | Affiliated Fees and Transactions |
Investment Adviser
The Funds each have entered into an investment management agreement with Sit Investment Associates Inc. (SIA), under which SIA manages the Funds’ assets and provides research, statistical and advisory services, and pays related office rental, executive expenses and executive salaries and with respect to the U.S. Government Securities Fund, an additional separate supervision and administration agreement. SIA also is obligated to pay all of the Funds’ expenses (excluding extraordinary expenses, stock transfer taxes, interest, brokerage commissions, and other transaction charges relating to investing activities). The fee for investment management and advisory services is based on the average daily net assets of the Funds at the annual rate of:
| Advisory Fees |
Supervisory and Administrative Fees |
Total Management Fees | |||||||||||||
| U.S. Government Securities Class S 1 |
0.20% | 0.60% | 0.80% | ||||||||||||
| U.S. Government Securities Class Y 2 |
0.20% | 0.35% | 0.55% | ||||||||||||
| Quality Income |
0.90% | — | 0.90% | ||||||||||||
| Tax-Free Income |
0.80% | — | 0.80% | ||||||||||||
| Minnesota Tax-Free Income |
0.80% | — | 0.80% | ||||||||||||
| 1 | The supervisory and administrative fee was effective January 1, 2020. Prior to January 1, 2020, the advisory fee was 0.80% and the total management fee was 0.80%. |
| 2 | Sit U.S. Government Securities Fund Class Y shares were first issued on January 1, 2020, and therefore the fees presented reflect the fees provided for in the Investment Management Agreement and Supervision and Administration Agreement. |
Transactions with affiliates
The investment adviser, affiliates of the investment adviser, directors and officers of the Funds as a whole owned the following shares as of September 30, 2020:
| Shares | % Shares Outstanding | |||||||||||
| U.S. Government Securities Class S |
192,535 | 0.5 | ||||||||||
| U.S. Government Securities Class Y |
657,899 | 15.1 | ||||||||||
| Quality Income |
7,897,376 | 77.2 | ||||||||||
| Tax-Free Income |
1,176,726 | 3.6 | ||||||||||
| Minnesota Tax-Free Income |
1,924,824 | 3.1 | ||||||||||
| 66 |
SIT MUTUAL FUNDS SEMI-ANNUAL REPORT |
| SEPTEMBER 30, 2020 |
67 |
ADDITIONAL INFORMATION (Unaudited)
PROXY VOTING
A description of the policies and procedures that Sit Investment uses to vote proxies related to the Funds’ portfolio securities is set forth in the Funds’ Statement of Additional Information, which is available on the Funds’ website at www.sitfunds.com, without charge by calling 800-332-5580 and on the Securities and Exchange Commission’s (SEC) website at www.sec.gov. The Funds’ proxy voting record is available without charge by calling 800-332-5580 and on the SEC’s website at www.sec.gov no later than August 31 for the prior 12 months ending June.
QUARTERLY SCHEDULES OF INVESTMENTS
Each Fund files a complete schedule of investments with the SEC for the first and third quarters of each fiscal year on Form N-PORT. The Funds’ Form N-PORT is available on the SEC’s website at www.sec.gov. Each Fund’s complete schedule of investments, as filed on Form N-PORT, is also available on its website at www.sitfunds.com, or without charge by calling 800-332-5580.
| 68 |
SIT MUTUAL FUNDS SEMI-ANNUAL REPORT |
|
Semi-Annual Report September 30, 2020 |
||||
| INVESTMENT ADVISER | INDEPENDENT REGISTERED PUBLIC | |||
| Sit Investment Associates, Inc. | ACCOUNTING FIRM | |||
| 80 S. Eighth Street | KPMG LLP | |||
| Suite 3300 | Minneapolis, MN | |||
| Minneapolis, MN 55402 | ||||
| GENERAL COUNSEL | ||||
| CUSTODIAN | Dorsey & Whitney LLP | |||
| The Bank Of New York Mellon | Minneapolis, MN | |||
| 111 Sanders Creek Parkway | ||||
| Syracuse, NY 13057 | ||||
| TRANSFER AGENT AND | ||||
| DISBURSING AGENT | ||||
| BNY Mellon Investment Servicing (US) Inc. | ||||
| 4400 Computer Drive | ||||
| Westborough, MA 01581 | ||||
 Sit Mutual Funds
 | ||||
|
1-800-332-5580 www.sitfunds.com | ||||
SIT BOND 9-2020
Item 2: Code of Ethics.
Not applicable to Semi-Annual Report.
Item 3: Audit Committee Financial Expert.
Not applicable to Semi-Annual Report.
Item 4: Principal Accountant Fees and Services.
Not applicable to Semi-Annual Report.
Item 5: Audit Committee of Listed Registrants.
Not applicable to open-end investment companies.
Item 6: Schedule of Investments.
The schedule of investments is included as part of the report to shareholders filed under Item 1 of this Form.
Item 7: Disclosure of Proxy Voting Policies and Procedures for Closed-End Management Investment Companies.
Not applicable to open-end investment companies.
Item 8: Portfolio Managers of Closed-End Management Companies.
Not applicable to open-end investment companies.
Item 9: Purchases of Equity Securities by Closed-End Management Investment Company and Affiliated Purchasers.
Not applicable to open-end investment companies.
Item 10. Submission of Matters to a vote of Security Holders.
There have been no material changes to the procedures by which shareholders may recommend nominees to the registrant’s board of directors.
Item 11: Controls and Procedures -
(a) Based on their evaluation of the Registrant’s Disclosure Controls and Procedures as of a date within 90 days of the Filing Date, the Registrant’s Chairman and Treasurer have determined that the Disclosure Controls and Procedures (as defined in Rule 30a-2(c) under the Act) are designed to ensure that information required to be disclosed by the Registrant is recorded, processed, summarized and reported by the filing Date, and that information required to be disclosed in the report is communicated to the Registrant’s management, as appropriate, to allow timely decisions regarding required disclosure.
b) There were no changes in the Registrant’s internal control over financial reporting as defined in Rule 30a-3(d) under the Act) that occurred during the Registrant’s last fiscal half-year that has materially affected, or is reasonably likely to materially affect, the Registrant’s internal control over financial reporting.
Item 12: Disclosure of Securities Lending Activities for Closed-End Management Investment Companies.
Not applicable to open-end investment companies.
Item 13: Exhibits:
(a) The following exhibits are attached to this Form N-CSR:
SIGNATURES
Pursuant to the requirements of the Securities Exchange Act of 1934 and the Investment Company Act of 1940, the registrant has duly caused this report to be signed on its behalf by the undersigned, thereunto duly authorized.
| SIT MUTUAL FUNDS II, INC. | ||
| By: | /s/ Paul E. Rasmussen | |
| Paul E. Rasmussen | ||
| Vice President, Treasurer | ||
| Date: November 25, 2020 | ||
Pursuant to the requirements of the Securities Exchange Act of 1934 and the Investment Company Act of 1940, this report has been signed below by the following persons on behalf of the registrant and in the capacities and on the dates indicated.
| By: | /s/ Paul E. Rasmussen | |
| Paul E. Rasmussen | ||
| Vice President, Treasurer | ||
| Date: November 25, 2020 | ||
| By: | /s/ Roger J. Sit | |
| Roger J. Sit | ||
| Chairman | ||
| Date: November 25, 2020 | ||
I, Paul E. Rasmussen, certify that:
1. I have reviewed this report on Form N-CSR of Sit Mutual Funds II, Inc.;
2. Based on my knowledge, this report does not contain any untrue statement of a material fact or omit to state a material fact necessary to make the statements made, in light of the circumstances under which such statements were made, not misleading with respect to the period covered by this report;
3. Based on my knowledge, the financial statements, and other financial information included in this report, fairly present in all material respects the financial condition, results of operations, changes in net assets, and cash flows (if the financial statements are required to include a statement of cash flows) of the registrant as of, and for, the periods presented in this report;
4. The registrant’s other certifying officer(s) and I are responsible for establishing and maintaining disclosure controls and procedures (as defined in Rule 30a-3(c) under the Investment Company Act of 1940) for the registrant and have:
a. Designed such disclosure controls and procedures, or caused such disclosure controls and procedures to be designed under our supervision, to ensure that material information relating to the registrant, including its consolidated subsidiaries, is made known to us by others within those entities, particularly during the period in which this report is being prepared;
b. Designed such internal control over financial reporting, or caused such internal control over financial reporting to be designed under our supervision, to provide reasonable assurance regarding the reliability of financial reporting and the preparation of financial statements for external purposes in accordance with generally accepted accounting principles;
c. Evaluated the effectiveness of the registrant’s disclosure controls and procedures and presented in this report our conclusions about the effectiveness of the disclosure controls and procedures, as of a date within 90 days prior to the filing date of this report based upon such evaluation; and
d. Disclosed in this report any change in the registrant’s internal control over financial reporting that occurred during the registrant’s most recent fiscal half-year (the registrant’s second fiscal half-year in the case of an annual report) that has materially affected, or is reasonably likely to materially affect, the registrant’s internal control over financial reporting; and
5. The registrant’s other certifying officer(s) and I have disclosed to the registrant’s auditors and the audit committee of the registrant’s board of directors (or persons performing the equivalent functions):
a. All significant deficiencies and material weaknesses in the design or operation of internal control over financial reporting which are reasonably likely to adversely affect the registrant’s ability to record, process, summarize, and report financial information; and
b. Any fraud, whether or not material, that involves management or other employees who have a significant role in the registrant’s internal control over financial reporting.
Date: November 25, 2020
——————————-
/s/ Paul E. Rasmussen
——————————————-
Signature – Paul E. Rasmussen
Vice President, Treasurer
FORM N-CSR CERTIFICATION
I, Roger J. Sit, certify that:
1. I have reviewed this report on Form N-CSR of Sit Mutual Funds II, Inc.;
2. Based on my knowledge, this report does not contain any untrue statement of a material fact or omit to state a material fact necessary to make the statements made, in light of the circumstances under which such statements were made, not misleading with respect to the period covered by this report;
3. Based on my knowledge, the financial statements, and other financial information included in this report, fairly present in all material respects the financial condition, results of operations, changes in net assets, and cash flows (if the financial statements are required to include a statement of cash flows) of the registrant as of, and for, the periods presented in this report;
4. The registrant’s other certifying officer(s) and I are responsible for establishing and maintaining disclosure controls and procedures (as defined in Rule 30a-3(c) under the Investment Company Act of 1940) for the registrant and have:
a. Designed such disclosure controls and procedures, or caused such disclosure controls and procedures to be designed under our supervision, to ensure that material information relating to the registrant, including its consolidated subsidiaries, is made known to us by others within those entities, particularly during the period in which this report is being prepared;
b. Designed such internal control over financial reporting, or caused such internal control over financial reporting to be designed under our supervision, to provide reasonable assurance regarding the reliability of financial reporting and the preparation of financial statements for external purposes in accordance with generally accepted accounting principles;
c. Evaluated the effectiveness of the registrant’s disclosure controls and procedures and presented in this report our conclusions about the effectiveness of the disclosure controls and procedures, as of a date within 90 days prior to the filing date of this report based upon such evaluation; and
d. Disclosed in this report any change in the registrant’s internal control over financial reporting that occurred during the registrant’s most recent fiscal half-year (the registrant’s second fiscal half-year in the case of an annual report) that has materially affected, or is reasonably likely to materially affect, the registrant’s internal control over financial reporting; and
5. The registrant’s other certifying officer(s) and I have disclosed to the registrant’s auditors and the audit committee of the registrant’s board of directors (or persons performing the equivalent functions):
a. All significant deficiencies and material weaknesses in the design or operation of internal control over financial reporting which are reasonably likely to adversely affect the registrant’s ability to record, process, summarize, and report financial information; and
b. Any fraud, whether or not material, that involves management or other employees who have a significant role in the registrant’s internal control over financial reporting.
Date: November 25, 2020
/s/ Roger J. Sit
Signature – Roger J. Sit
Chairman
CERTIFICATION PURSUANT TO SECTION 906 OF THE SARBANES-OXLEY ACT
Pursuant to Section 906 of the Sarbanes-Oxley Act of 2002, each of the undersigned officers of Sit Mutual Funds II, Inc., do hereby certify, to such officer’s knowledge, that the report on Form N-CSR of Sit Mutual Funds II, Inc. for the period ended September 30, 2020 fully complies with the requirements of Section 13(a) or 15(d) of the Securities Exchange Act of 1934 and information contained in the Form N-CSR fairly presents, in all material respects, the financial condition and results of operations of Sit Mutual Funds II, Inc. for the periods presented in the report.
| /s/ Roger J. Sit |
/s/ Paul E. Rasmussen | |||
| Roger J. Sit |
Paul E. Rasmussen | |||
| Chairman |
VP, Treasurer | |||
| Sit Mutual Funds II, Inc. |
Sit Mutual Funds II, Inc. | |||
Dated: November 25, 2020
A signed original of this written statement required by Section 906 has been provided by Sit Mutual Funds II, Inc. and will be retained by Sit Mutual Funds II, Inc. and furnished to the SEC or its staff upon request.
Serious News for Serious Traders! Try StreetInsider.com Premium Free!
You May Also Be Interested In
- Port Houston Regular Commission Meeting
- Tocvan Provides Corporate Update
- Avis Budget Group to Announce First Quarter 2024 Results on May 1st
Create E-mail Alert Related Categories
SEC FilingsSign up for StreetInsider Free!
Receive full access to all new and archived articles, unlimited portfolio tracking, e-mail alerts, custom newswires and RSS feeds - and more!
