

Form N-CSRS NORTHERN LIGHTS FUND For: Mar 31
 Tweet
Tweet Share
Shareunited
states
securities and exchange commission
washington, d.c. 20549
form n-csr
certified shareholder report of registered management
investment companies
Investment Company Act file number 811-22655
Northern Lights Fund Trust III
(Exact name of registrant as specified in charter)
17605 Wright Street, Omaha, Nebraska 68130
(Address of principal executive offices) (Zip code)
Eric Kane
80 Arkay Drive, Hauppauge, NY 11788
(Name and address of agent for service)
Registrant's telephone number, including area code: 631-470-2619
Date of fiscal year end: 9/30
Date of reporting period: 3/31/19
Item 1. Reports to Stockholders.
| Marathon Value Portfolio |
MVPFX
Semi-Annual Report
March 31, 2019
Fund Advisor:
Gratus Capital, LLC
3350 Riverwood Parkway, Suite 1550
Atlanta, GA, 30339
(800) 788-6086
www.marathonvalue.com
Beginning on January 1, 2021, as permitted by regulations adopted by the Securities and Exchange Commission, paper copies of the Fund’s shareholder reports like this one will no longer be sent by mail, unless you specifically request paper copies of the reports. Instead, the reports will be made available on the Fund’s website www.marathonvalue.com, and you will be notified by mail each time a report is posted and provided with a website link to access the report.
If you already elected to receive shareholder reports electronically, you will not be affected by this change and you need not take any action. You may elect to receive shareholder reports and other communications from the Fund electronically or to continue receiving paper copies of shareholder reports, which are available free of charge by contacting your financial intermediary (such as a broker-dealer or bank) or, if you are a direct investor, by following the instructions included with paper Fund documents that have been mailed to you.
Dear Shareholder,
Global equity markets in the first quarter of 2019 reversed almost all of the damage done in the fourth quarter of 2018. For the S&P 500, it’s as if the fourth quarter never happened, while emerging markets have exhibited stronger performance due to a shallower drawdown. Developed international markets continue to exhibit weaker relative performance, which is likely attributable to both (1) weaker currencies relative to the US Dollar and (2) softer economic growth.
The question therefore is, now that we’re back to the prior high water mark for US equities, where do we go from here? As we’ve indicated in prior letters, the balance of probabilities suggested that global equity markets looked attractive and that new positions could be added in recent drawdown periods (specifically Q3 2017 and Q4 2018). Now that we’ve experienced a +13% move up in equity prices in Q1, we believe that equity markets will likely be range-bound for the foreseeable future. We believe this is the case for the following reasons:
| 1. | Valuation expansion has been the primary reason for the move higher in equities during Q1. Further expansion in valuation seems unlikely. |
| 2. | Subdued inflation provides valuation support at current levels. |
| 3. | Stable growth across all developed markets (US, Europe, Japan) helps remove significant downside scenarios, from an economic standpoint. |
| 4. | Institutional investor sentiment remains negative and is largely already expressed in equity prices. |
In all, sideways movements in equity markets aren’t an entirely bad situation. What might be considered frustrating for an index investor is actually a welcome opportunity for active investment portfolios like Marathon Value Portfolio (“Marathon” or “the Fund”).
Turning to the bond market for a moment, interest rates have a high likelihood of stabilizing in the current range as global growth remains low, which is important for equity investors as it means competition for investment dollars should remain muted given the relative attractiveness of stocks versus bonds. Further, global central banks have been unwilling to push for a normalization in interest rates at such low growth rates, fearing that rate normalization may end up causing the next recession. This fear isn’t isolated to just the US Federal Reserve; it also applies to most global central banks. After raising the US Federal Funds rate from 0.25% to the current range of 2.25-2.50%, the US Federal Reserve has now pivoted from its previous “autopilot” to a “wait-and-see” approach. Interestingly, over the last 35 years, whenever the US Federal Reserve has moved to a wait-and-see approach (1989, 1995, 2000, and 2006), interest rates have moved lower in every period.
That said, understanding where we are in the economic/credit cycle can lead to valuable portfolio positioning adjustments. One adjustment we’ve been looking at recently has been the commodity markets and, by extension, commodity equities. In short, we believe commodities (generally speaking) have a strong likelihood of positive, non-correlated performance in the years to come. We have this outlook for commodities due to (1) a rationalized supply situation among a number of different commodity industries, (2) the US dollar coming off a period of sustained outperformance relative to most every other currency and appearing likely to give back some of those gains, and (3) the possibility of longer-term inflation developing if central banks’ quantitative easing programs work as designed. By no means does this outlook dictate that we will actually invest in commodity equities, as actual buy/sell decisions are based on individual company factors. We just believe that the commodity equity sector looks compelling for the first time in a number of years.
In summary, we remain in a conservative position within the Fund. Valuations in both equities and bonds prevent any aggressive adjustments. Yet, at the individual security level, opportunities to add to new positons continue to arise for investors with a disciplined approach.
1
Management Discussion and Analysis
Over the six-month period ended March 31, 2019, the Fund returned -0.48%. Marathon’s annualized performance since inception (March 28, 2000) is +8.18%. The comparable total returns for the S&P 500 benchmark are -1.72% and +5.41%. Since the Fund’s inception, the Fund’s cumulative total return has been +345.79% versus the S&P 500’s cumulative total return of +172.32%, for a total return differential of +173.47% for Marathon.
PERFORMANCE SUMMARY
| For Calendar Year | ||||||||||||||||||||
| Since | ||||||||||||||||||||
| Inception | ||||||||||||||||||||
| as of | ||||||||||||||||||||
| 2000 | 2001 | 2002 | 2003 | 2004 | 2005 | 2006 | 2007 | 2008 | 2009 | 2010 | 2011 | 2012 | 2013 | 2014 | 2015 | 2016 | 2017 | 2018 | 3/31/2019 | |
| Marathon Value Portfolio | 16.06% | 4.70% | -11.00% | 26.20% | 14.03% | 6.20% | 11.76% | 3.10% | -23.33% | 20.29% | 15.87% | 1.76% | 12.91% | 26.89% | 7.37% | -1.96% | 13.73% | 16.44% | -5.61% | 345.79% |
| S&P 500 Index | -11.67% | -11.89% | -22.10% | 28.68% | 10.88% | 4.91% | 15.79% | 5.49% | -37.00% | 26.46% | 15.06% | 2.11% | 16.00% | 32.39% | 13.69% | 1.38% | 11.96% | 21.83% | -4.38% | 172.32% |
| Annualized Total Returns | |||||
| For the Periods Ended March 31, 2019 | |||||
| Three Year | Five Year | Ten Year | Since | ||
| One Year | Average | Average | Average | Inception | |
| Marathon Value Portfolio | 8.17% | 10.92% | 8.25% | 12.98% | 8.18% |
| S&P 500 Index | 9.50% | 13.51% | 10.91% | 15.92% | 5.41% |
The total gross annual expense ratio for the Fund, as disclosed in the Fund’s prospectus, is 1.10%.
| * | March 28, 2000 is the date the portfolio manager assumed management of Marathon. Returns for 2000 are from 03/28/00 through 12/31/00. Returns are not annualized except where noted. Performance quoted is past performance. The Fund’s past performance does not guarantee future results. The investment return and principal value of an investment in the Fund will fluctuate so that an investor’s shares, when redeemed, may be worth more or less than their original cost. Current performance of the Fund may be lower or higher than the performance quoted. Performance data current to the most recent month end may be obtained by visiting www.marathonvalue.com or by calling 1-800-788-6086. The index is unmanaged, and returns for both the index and the Fund include reinvested dividends and capital gains. It is not possible to invest directly in an index. |
You should carefully consider the investment objectives, potential risks, management fees, and charges and expenses of the Fund before investing. The Fund’s prospectus contains this and other information about the Fund and should be read carefully before investing. You may obtain a current copy of the Fund’s prospectus by visiting www.marathonvalue.com or by calling 1-800-788-6086.
6454-NLD-05/15/2019
2
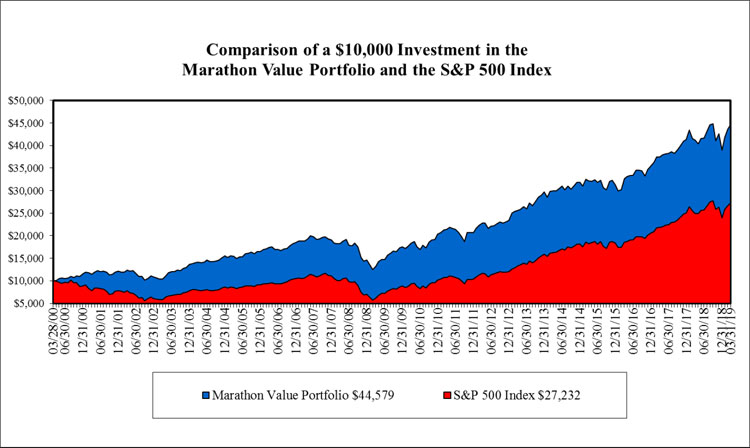
The chart above assumes an initial investment of $10,000 made on March 28, 2000 (commencement of Fund operations) and held through March 31, 2019. The Fund’s return represents past performance and does not guarantee future results. The line graph and performance table shown do not reflect deduction of taxes that a shareholder would pay on Fund distributions or the redemption of Fund shares. Investment returns and principal values will fluctuate so that an investor’s shares, when redeemed, may be worth more or less than their original purchase price.
The Fund’s investment objectives, risk, charges and expenses must be considered carefully before investing. The prospectus contains this and other important information about the investment company and can be obtained by calling 1-800-788-6086 or visiting www.marathonvalue.com. The prospectus should be read carefully before investing.
The S&P 500 Total Return Index is a capitalization-weighted index of 500 stocks designed to measure performance of the broad domestic economy through changes in the aggregate market value of 500 stocks representing all major industries. The Fund’s portfolio holdings may differ significantly from the securities held in the Index, and unlike a mutual fund, an unmanaged index assumes no transaction costs, taxes, management fees or other expenses.
Moving to portfolio holdings, we’re outlining the top three contributors and detractors by portfolio weighting during the prior six months ended March 31, 2019 and providing a brief commentary on each:
On the positive side, the best-performing position in the portfolio was Zebra Technologies (ZBRA, +20.98%, 1.73% of assets). ZBRA stock continues to benefit from being a misunderstood company. While the legacy business segment of barcode printing and manufacturing has slowed with global growth, the Enterprise business segment (acquired from Motorola in 2014) continues to generate exceptional results as ZBRA saw a 56% increase in Fiscal Year 2018 earnings per share and a 2% increase in adjusted margins. The second best-performing position in the portfolio was McDonalds (MCD, +15.40%, 2.51% of assets). Not only did the defensive characteristics of the MCD business help weather a challenging period for markets, but the benefits from recent menu reconfigurations and store remodeling also came through in the results, where global comparable sales increased 4.5% from the prior year. Clearly, the turnaround at MCD, led by CEO Steve Easterbrook, is making a positive impact. Finally, Edwards Lifesciences Corporation (EW, +10.80%,
3
3.79% of assets) continues to be a contributor to positive performance despite potential headwinds from lower reimbursement rates.
Companies that detracted from performance over the prior six-month period ended March 31, 2019 were in a variety of industries. The worst-performing company in the portfolio by weight was Apple Inc. (AAPL, -18.70%, 2.19% of assets). This -18.70% was a substantial recovery from the peak-to-trough decline of -33% intra-period. While recent management decisions have concerned investors (e.g., curtailment of iPhone unit-sales figures), valuation of the company (at ~16x trailing earnings) combined with its substantial cash hoard give us comfort that the company will remain a contributor to the Fund over time. The second worst-performing company in the Fund was Axos Financial, Inc. (AXOS, -16.32%, 1.72% of assets). Performance in shares of AXOS was consistent with the banking sector. As the US Treasury yield curve flattens, earnings at financial institutions have become constrained. Finally, Phillips 66 Company (PSX, -15.56%, 1.26% of assets) generated a negative return primarily due to the challenging market conditions in its refining division, which lost $219m during Q1 2019, versus a profit of $2bln in Q4 2018. Such swings indicate why valuations in the refining subsector tend to be among the lowest in the energy sector. Yet, PSX should be fine over the long term as they continue to pivot the business into less sensitive segments of the energy markets (midstream transportation and chemicals). These investments in midstream and refining should translate into lower earnings volatility over time, leading to a (potentially) higher valuation.
In all, remaining nimble in the current environment is critical for long-term investment success, given how fast prices are moving. We look forward to updating you in September in our annual letter.

4
| Marathon Value Portfolio |
| PORTFOLIO REVIEW (Unaudited) |
| March 31, 2019 |
The Fund’s performance figures(*) for the periods ended March 31, 2019, compared to its benchmark:
| Five | Ten | Inception*** through | |||
| Six | One | Year | Year | March 31, 2019 | |
| Months | Year | (Annualized) | (Annualized) | (Annualized) | |
| Marathon Value Portfolio | (0.48)% | 8.17% | 8.25% | 12.98% | 8.18% |
| S&P 500 Index ** | (1.72)% | 9.50% | 10.91% | 15.92% | 5.41% |
| * | The performance data quoted here represents past performance. Current performance may be lower or higher than the performance data quoted above. Investment return and principal value will fluctuate, so that shares, when redeemed, may be worth more or less than their original cost. The returns shown do not reflect the deduction of taxes that a shareholder would pay on Fund distributions or on the redemptions of Fund shares. Past performance is no guarantee of future results. Performance figures for periods greater than 1 year are annualized. The Fund’s investment advisor has contractually agreed to pay most of the Fund’s operating expenses (with certain exceptions) in return for a “universal fee” of 1.10% (excluding indirect costs of investing in other investment companies and certain other expenses) of the Fund’s net assets. Please review the Fund’s most recent prospectus for more detail on this universal fee. The Fund’s total annual expense ratio is 1.10% per the Fund’s most recent prospectus. For performance information current to the most recent month-end, please call toll-free 1-800-788-6086. |
| ** | The S&P 500 Index is a capitalization-weighted index of 500 stocks designed to measure performance of the broad domestic economy through changes in the aggregate market value of 500 stocks representing all major industries. The Fund’s portfolio holdings may differ significantly from the securities held in the Index, and unlike a mutual fund, an unmanaged index assumes no transaction costs, taxes, management fees or other expenses. Investors may not invest directly in an index. |
| *** | Inception date is March 28, 2000. |
Portfolio Composition as of March 31, 2019:
| Sectors | Percentage of Net Assets | |||
| Information Technology | 25.2 | % | ||
| Industrials | 17.5 | % | ||
| Financial Services | 15.9 | % | ||
| Consumer Discretionary | 14.0 | % | ||
| Healthcare | 12.7 | % | ||
| Consumer Staples | 8.1 | % | ||
| Materials | 2.8 | % | ||
| Energy | 2.0 | % | ||
| Real Estate Investment Trusts | 0.9 | % | ||
| Other | 0.9 | % | ||
| 100.0 | % | |||
Please refer to the Schedule of Investments in this semi-annual report for a detailed listing of the Fund’s holdings.
5
| Marathon Value Portfolio |
| SCHEDULE OF INVESTMENTS (Unaudited) |
| March 31, 2019 |
| Shares | Fair Value | |||||||
| COMMON STOCKS - 98.2% | ||||||||
| CONSUMER DISCRETIONARY - 14.0% | ||||||||
| 4,500 | Advance Auto Parts, Inc. | $ | 767,385 | |||||
| 550 | Amazon.com, Inc. * | 979,413 | ||||||
| 8,500 | Genuine Parts Co. | 952,255 | ||||||
| 23,660 | Johnson Controls International PLC | 874,000 | ||||||
| 14,700 | Lowe’s Cos., Inc. | 1,609,209 | ||||||
| 8,000 | McDonald’s Corp. | 1,519,200 | ||||||
| 30,780 | Reading International, Inc. * | 491,249 | ||||||
| 4,000 | Tiffany & Co. | 422,200 | ||||||
| 8,000 | Walt Disney Co. | 888,240 | ||||||
| 8,503,151 | ||||||||
| CONSUMER STAPLES - 8.1% | ||||||||
| 10,000 | Colgate-Palmolive Co. | 685,400 | ||||||
| 6,300 | Costco Wholesale Corp. | 1,525,482 | ||||||
| 5,000 | Kimberly-Clark Corp. | 619,500 | ||||||
| 13,151 | Koninklijke DSM NV - ADR | 358,233 | ||||||
| 9,100 | PepsiCo, Inc. | 1,115,205 | ||||||
| 5,858 | Procter & Gamble Co. | 609,525 | ||||||
| 4,913,345 | ||||||||
| ENERGY - 2.0% | ||||||||
| 6,600 | ConocoPhillips | 440,484 | ||||||
| 8,000 | Phillips 66 | 761,360 | ||||||
| 1,201,844 | ||||||||
| FINANCIAL SERVICES - 15.9% | ||||||||
| 3,013 | Alleghany Corp. * | 1,845,161 | ||||||
| 3,000 | Aon PLC | 512,100 | ||||||
| 36,000 | Axos Financial, Inc. * | 1,042,560 | ||||||
| 6,500 | Berkshire Hathaway, Inc. * | 1,305,785 | ||||||
| 10,000 | Brookfield Asset Management, Inc. | 466,500 | ||||||
| 5,030 | M&T Bank Corp. | 789,811 | ||||||
| 1,306 | National Western Life Group, Inc. | 342,786 | ||||||
| 50,900 | Northeast Bancorp | 1,052,612 | ||||||
| 19,530 | US Bancorp | 941,151 | ||||||
| 20,000 | Virtu Financial, Inc. | 475,000 | ||||||
| 900 | White Mountains Insurance Group Ltd. | 832,932 | ||||||
| 9,606,398 | ||||||||
| HEALTHCARE - 12.7% | ||||||||
| 13,497 | Abbott Laboratories | 1,078,950 | ||||||
| 3,134 | Becton Dickinson and Co. | 782,654 | ||||||
See accompanying notes to financial statements.
6
| Marathon Value Portfolio |
| SCHEDULE OF INVESTMENTS (Unaudited) (Continued) |
| March 31, 2019 |
| Shares | Fair Value | |||||||
| COMMON STOCKS - 98.2% (Continued) | ||||||||
| HEALTHCARE - 12.7% (Continued) | ||||||||
| 8,500 | Bristol-Myers Squibb Co. | $ | 405,535 | |||||
| 12,000 | Edwards Lifesciences Corp. * | 2,295,960 | ||||||
| 6,845 | Novartis AG - ADR | 658,078 | ||||||
| 8,000 | Novo Nordisk A/S - ADR | 418,480 | ||||||
| 8,723 | Pfizer, Inc. | 370,466 | ||||||
| 8,500 | Stryker Corp. | 1,678,920 | ||||||
| 7,689,043 | ||||||||
| INDUSTRIALS - 17.5% | ||||||||
| 10,400 | 3M Co. | 2,160,912 | ||||||
| 14,600 | Emerson Electric Co. | 999,662 | ||||||
| 9,000 | Equifax, Inc. | 1,066,500 | ||||||
| 45,000 | Graco, Inc. | 2,228,400 | ||||||
| 8,300 | Illinois Tool Works, Inc. | 1,191,299 | ||||||
| 12,300 | Lincoln Electric Holdings, Inc. | 1,031,601 | ||||||
| 12,484 | Raven Industries, Inc. | 479,011 | ||||||
| 6,000 | United Parcel Service, Inc. | 670,440 | ||||||
| 6,000 | Verisk Analytics, Inc. | 798,000 | ||||||
| 10,625,825 | ||||||||
| INFORMATION TECHNOLOGY - 25.2% | ||||||||
| 750 | Alphabet, Inc. Class A * | 882,667 | ||||||
| 1,103 | Alphabet, Inc. Class C * | 1,294,161 | ||||||
| 7,000 | Apple, Inc. | 1,329,650 | ||||||
| 6,700 | Automatic Data Processing, Inc. | 1,070,258 | ||||||
| 21,600 | Avnet, Inc. | 936,792 | ||||||
| 17,876 | Cisco Systems, Inc. | 965,125 | ||||||
| 22,500 | Corning, Inc. | 744,750 | ||||||
| 14,300 | Global Payments, Inc. | 1,952,236 | ||||||
| 18,154 | Intel Corp. | 974,870 | ||||||
| 5,200 | International Business Machines Corp. | 733,720 | ||||||
| 11,400 | Microsoft Corp. | 1,344,516 | ||||||
| 9,000 | TE Connectivity Ltd. | 726,750 | ||||||
| 12,200 | Texas Instruments, Inc. | 1,294,054 | ||||||
| 5,000 | Zebra Technologies Corp. * | 1,047,650 | ||||||
| 15,297,199 | ||||||||
| MATERIALS - 2.8% | ||||||||
| 15,000 | PPG Industries, Inc. | 1,693,050 | ||||||
| TOTAL COMMON STOCK (Cost $19,890,060) | 59,529,855 | |||||||
See accompanying notes to financial statements.
7
| Marathon Value Portfolio |
| SCHEDULE OF INVESTMENTS (Unaudited) (Continued) |
| March 31, 2019 |
| Shares | Fair Value | |||||||||||
| REAL ESTATE INVESTMENT TRUSTS (REITs) - 0.9% | ||||||||||||
| 4,800 | EastGroup Properties, Inc. | $ | 535,872 | |||||||||
| TOTAL REAL ESTATE INVESTMENT TRUSTS (REITs) (Cost $148,349) | 535,872 | |||||||||||
| Par Value | Coupon Rate% | Maturity | ||||||||||
| BONDS AND NOTES - 0.0% | ||||||||||||
| FINANCIAL SERVICES - 0.0% | ||||||||||||
| 22,270 | Countrywide Asset-Backed Certificates, 1 Month LIBOR +3.0% (A) | 5.49% | 10/25/2032 | 11,585 | ||||||||
| TOTAL BONDS AND NOTES (Cost $22,287) | 11,585 | |||||||||||
| TOTAL INVESTMENTS (Cost $20,060,696) - 99.1% | $ | 60,077,312 | ||||||||||
| OTHER ASSETS IN EXCESS OF LIABILITIES - 0.9% | 519,749 | |||||||||||
| NET ASSETS - 100.0% | $ | 60,597,061 | ||||||||||
* Non-income producing securities.
ADR - American Depositary Receipt.
PLC - Public Limited Company
| (A) | Variable rate security |
See accompanying notes to financial statements.
8
| Marathon Value Portfolio |
| STATEMENT OF ASSETS AND LIABILITIES (Unaudited) |
| March 31, 2019 |
| ASSETS | ||||
| Investment securities: | ||||
| At cost | $ | 20,060,696 | ||
| At fair value | $ | 60,077,312 | ||
| Cash and cash equivalents | 540,662 | |||
| Dividends and interest receivable | 75,275 | |||
| Receivable for fund shares sold | 14,550 | |||
| TOTAL ASSETS | 60,707,799 | |||
| LIABILITIES | ||||
| Payable for fund shares redeemed | 80,000 | |||
| Investment advisory fees payable (a) | 30,738 | |||
| TOTAL LIABILITIES | 110,738 | |||
| NET ASSETS | $ | 60,597,061 | ||
| Net Assets Consist Of: | ||||
| Paid in capital | $ | 18,248,762 | ||
| Accumulated earnings | 42,348,299 | |||
| NET ASSETS | $ | 60,597,061 | ||
| Net Asset Value Per Share: | ||||
| Shares: | ||||
| Net Assets | $ | 60,597,061 | ||
| Shares of beneficial interest outstanding (b) | 2,154,604 | |||
| Net asset value (Net Assets ÷ Shares Outstanding), offering price and redemption price per share | $ | 28.12 |
| (a) | See Note 4 in the Notes to Financial Statements. |
| (b) | Unlimited number of shares of beneficial interest authorized, no par value. |
See accompanying notes to financial statements.
9
| Marathon Value Portfolio |
| STATEMENT OF OPERATIONS |
| Six Months Ended | ||||
| March 31, 2019 | ||||
| (Unaudited) | ||||
| INVESTMENT INCOME | ||||
| Dividends (net of foreign withholding tax of $3,131) | $ | 536,111 | ||
| Interest | 4,796 | |||
| TOTAL INVESTMENT INCOME | 540,907 | |||
| EXPENSES | ||||
| Investment advisory fees (a) | 325,933 | |||
| Overdraft expense | 693 | |||
| TOTAL EXPENSES | 326,626 | |||
| NET INVESTMENT INCOME | 214,281 | |||
| REALIZED AND UNREALIZED GAIN FROM INVESTMENTS AND FOREIGN CURRENCY TRANSACTIONS | ||||
| Net realized gain from investments and foreign currency transactions | 2,427,588 | |||
| Net change in unrealized appreciation on investments and foreign currency transactions | (3,390,386 | ) | ||
| NET REALIZED AND UNREALIZED LOSS FROM INVESTMENTS | (962,798 | ) | ||
| NET DECREASE IN NET ASSETS RESULTING FROM OPERATIONS | $ | (748,517 | ) | |
| (a) | See Note 4 in the Notes to Financial Statements. |
See accompanying notes to financial statements.
10
| Marathon Value Portfolio |
| STATEMENTS OF CHANGES IN NET ASSETS |
| Six Months Ended | Year Ended | |||||||
| March 31, 2019 | September 30, 2018 | |||||||
| FROM OPERATIONS | (Unaudited) | |||||||
| Net investment income | $ | 214,281 | $ | 410,024 | ||||
| Net realized gain from investments and foreign currency transactions | 2,427,588 | 1,918,054 | ||||||
| Net change in unrealized appreciation on investments | (3,390,386 | ) | 7,043,663 | |||||
| Net increase in net assets resulting from operations | (748,517 | ) | 9,371,741 | |||||
| DISTRIBUTIONS TO SHAREHOLDERS | ||||||||
| From net investment income | — | (529,856 | ) | |||||
| From net realized gains | — | (3,849,701 | ) | |||||
| Total Distribution paid*: | (2,491,639 | ) | — | |||||
| Net decrease in net assets from distributions to shareholders | (2,491,639 | ) | (4,379,557 | ) | ||||
| FROM SHARES OF BENEFICIAL INTEREST | ||||||||
| Proceeds from shares sold | 557,804 | 1,200,161 | ||||||
| Reinvestment of distributions to shareholders | 2,488,890 | 4,366,789 | ||||||
| Payments for shares redeemed | (5,641,739 | ) | (15,989,333 | ) | ||||
| Net increase (decrease) in net assets from shares of beneficial interest | (2,595,045 | ) | (10,422,383 | ) | ||||
| TOTAL INCREASE (DECREASE) IN NET ASSETS | (5,835,201 | ) | (5,430,199 | ) | ||||
| NET ASSETS | ||||||||
| Beginning of Period | 66,432,262 | 71,862,461 | ||||||
| End of Period ** | $ | 60,597,061 | $ | 66,432,262 | ||||
| SHARE ACTIVITY | ||||||||
| Shares Sold | 20,829 | 42,879 | ||||||
| Shares Reinvested | 96,882 | 161,673 | ||||||
| Shares Redeemed | (214,481 | ) | (573,457 | ) | ||||
| Net decrease from share activity | (96,770 | ) | (368,905 | ) | ||||
| * | Distributions from net investment income and net realized capital gains are combined for the six months ended March 31, 2019. See “New Accounting Pronouncements” in the Notes to Financial Statements for more information. The dividends and distributions to shareholders for the year ended September 30, 2018 have not been reclassified to conform to the current year presentation. |
| ** | Net Assets - End of Year includes distributions in excess of net investment income of $337,907 as of September 30, 2018. |
See accompanying notes to financial statements.
11
| Marathon Value Portfolio |
| FINANCIAL HIGHLIGHTS |
Per Share Data and Ratios for a Share of Beneficial Interest Outstanding Throughout Each Period Presented
| Six Months Ended | Year Ended | Year Ended | Period Ended | Year Ended | Year Ended | Year Ended | ||||||||||||||||||||||
| March 31, 2019 | September 30, | September 30, | September 30, | October 31, | October 31, | October 31, | ||||||||||||||||||||||
| (Unaudited) | 2018 | 2017 | 2016 (f) | 2015 | 2014 | 2013 | ||||||||||||||||||||||
| Net asset value, beginning of period | $ | 29.51 | $ | 27.43 | $ | 24.59 | $ | 23.24 | $ | 23.01 | $ | 21.88 | $ | 17.72 | ||||||||||||||
| Activity from investment operations: | ||||||||||||||||||||||||||||
| Net investment income (a) | 0.10 | 0.17 | 0.17 | 0.17 | 0.15 | 0.13 | 0.12 | |||||||||||||||||||||
| Net realized and unrealized gain (loss) on investments | (0.36 | ) | 3.65 | 3.12 | 1.51 | 0.62 | 1.69 | 4.33 | ||||||||||||||||||||
| Total from investment operations | (0.26 | ) | 3.82 | 3.29 | 1.68 | 0.77 | 1.82 | 4.45 | ||||||||||||||||||||
| Less distributions from: | ||||||||||||||||||||||||||||
| Net investment income | (0.17 | ) | (0.21 | ) | (0.12 | ) | (0.16 | ) | (0.14 | ) | (0.08 | ) | (0.14 | ) | ||||||||||||||
| Net realized gains | (0.96 | ) | (1.53 | ) | (0.33 | ) | (0.17 | ) | (0.40 | ) | (0.61 | ) | (0.15 | ) | ||||||||||||||
| Total distributions | (1.13 | ) | (1.74 | ) | (0.45 | ) | (0.33 | ) | (0.54 | ) | (0.69 | ) | (0.29 | ) | ||||||||||||||
| Net asset value, end of period | $ | 28.12 | $ | 29.51 | $ | 27.43 | $ | 24.59 | $ | 23.24 | $ | 23.01 | $ | 21.88 | ||||||||||||||
| Total return (b) | (0.52 | )% (h,i) | 14.51 | % | 13.56 | % | 7.36 | % (h) | 3.46 | % | 8.58 | % | 25.48 | % | ||||||||||||||
| Net assets, end of period (000s) | $ | 60,597 | $ | 66,432 | $ | 71,862 | $ | 62,984 | $ | 63,306 | $ | 67,133 | $ | 64,045 | ||||||||||||||
| Ratio of expenses to average net assets (c) | 1.10 | % (g) | 1.10 | % | 1.10 | % | 1.10 | % (g) | 1.10 | % | 1.13 | % (e) | 1.21 | % (d) | ||||||||||||||
| Ratio of net investment income to average net assets | 0.72 | % (g) | 0.60 | % | 0.64 | % | 0.79 | % (g) | 0.65 | % | 0.56 | % | 0.61 | % | ||||||||||||||
| Portfolio Turnover Rate | 3 | % (h) | 6 | % | 15 | % | 6 | % (h) | 12 | % | 16 | % | 10 | % | ||||||||||||||
| (a) | Per share amounts calculated using the average shares method, which more appropriately presents the per share data for the period. |
| (b) | Total return represents the rate that the investor would have earned or lost on an investment in the Fund, assuming reinvestment of dividends. |
| (c) | Recognition of net investment income by the Fund is affected by the timing of the declaration of dividends by the underlying investment companies in which the Fund invests. The expenses of the investment funds are excluded from the Fund’s expense ratio. |
| (d) | Effective March 8, 2013, the universal fee changed from 1.25% to 1.20%. |
| (e) | Effective March 1, 2014, the universal fee changed from 1.20% to 1.10%. |
| (f) | Represents the period November 1, 2015 through September 30, 2016. See Note 1. |
| (g) | Annualized. |
| (h) | Not annualized. |
| (i) | Includes adjustments in accordance with accounting principles generally accepted in the United States and, consequently, the net asset value for financial reporting purposes and the returns based upon those net asset values may differ from the net asset values and returns for shareholder transactions. |
See accompanying notes to financial statements.
12
| Marathon Value Portfolio |
| NOTES TO FINANCIAL STATEMENTS (Unaudited) |
| March 31, 2019 |
| 1. | ORGANIZATION |
Marathon Value Portfolio (the “Fund”) is a diversified series of shares of beneficial interest of Northern Lights Fund Trust III, a Delaware statutory trust organized on December 5, 2011 (the “Trust”). The Trust is an open-end management investment company registered under the Investment Company Act of 1940, as amended (the “1940 Act”). The Fund currently consists of one class of shares. Pursuant to a reorganization that took place on March 8, 2013, the Fund is the successor to the Marathon Value Portfolio, a former series of the Unified Series Trust (the “Predecessor Fund”), which in turn was the successor to the Marathon Value Portfolio, formerly of the AmeriPrime Funds (the “Original Fund”), pursuant to a reorganization that took place on January 3, 2003. The Predecessor Fund and the Original Fund had the same investment objectives and strategies and substantially the same investment policies as the Fund. The Original Fund commenced operations in March 1998. The Fund’s investment objective is to provide shareholders with long-term capital appreciation in a well-diversified portfolio. Effective May 1, 2016, Gratus Capital LLC (“Gratus” or the “Advisor”) began serving as the Fund’s investment advisor. Prior to May 1, 2016, Spectrum Advisory Services, Inc. (“Spectrum”) served as the Fund’s advisor.
| 2. | SUMMARY OF SIGNIFICANT ACCOUNTING POLICIES |
The following is a summary of significant accounting policies consistently followed by the Fund in the preparation of its financial statements. The policies are in conformity with accounting principles generally accepted in the United States of America (’‘GAAP”), which require management to make estimates and assumptions that affect the reported amounts of assets and liabilities and disclosure of contingent assets and liabilities at the date of the financial statements and the reported amounts of increases and decreases in net assets from operations during the reporting period. Actual results could differ from those estimates. The Fund is an investment company and accordingly follows the investment company accounting and reporting guidance of the Financial Accounting Standards Board (FASB) Accounting Standard Codification Topic 946 “Financial Services – Investment Companies” including FASB Accounting Standard Update (“ASU”) 2013-08.
Security Valuation – Securities listed on an exchange are valued at the last reported sale price at the close of the regular trading session of the primary exchange on the business day the value is being determined, or in the case of securities listed on NASDAQ at the NASDAQ Official Closing Price (“NOCP”). In the absence of a sale, such securities shall be valued at the mean between the current bid and ask prices on the day of valuation. Debt securities (other than short-term obligations) are valued each day by an independent pricing service approved by the Trust’s Board of Trustees (the “Board”) using methods which include current market quotations from a major market maker in the securities and based on methods which include the consideration of yields or prices of securities of comparable quality, coupon, maturity and type. Short-term debt obligations having 60 days or less remaining until maturity, at the time of purchase, may be valued at amortized cost. Investments in open-end investment companies are valued at net asset value.
The Fund may hold securities, such as private investments, interests in commodity pools, other non-traded securities or temporarily illiquid securities, for which market quotations are not readily available or are determined to be unreliable. These securities will be valued using the “fair value” procedures approved by the Board. The Board has delegated execution of these procedures to a fair value team composed of one or more representatives from each of the (i) Trust, (ii) administrator, and (iii) advisor. The team may also enlist third party consultants such as a valuation specialist at a public accounting firm, valuation consultant or financial officer of a security issuer on an as-needed basis to assist in determining a security-specific fair value. The Board reviews and ratifies the execution of this process and the resultant fair value prices at least quarterly to assure the process produces reliable results.
Fair Valuation Process – As noted above, the fair value team is composed of one or more representatives from each of the (i) Trust, (ii) administrator, and (iii) advisor. The applicable investments are valued collectively via inputs from each of these groups. For example, fair value determinations are required for the following securities: (i) securities for which market quotations are insufficient or not readily available on a particular business day (including securities for which there is a short and temporary lapse in the provision of a price by the regular pricing source), (ii) securities for which, in the judgment of the advisor, the prices or values available do not represent the fair value of the instrument. Factors which may cause the advisor to make such a judgment include, but are not limited to, the following: only a bid price or an asked price is available; the spread between bid and asked prices is substantial; the frequency of sales; the thinness of the market; the size of reported trades; and actions of the securities markets, such as the suspension or limitation of trading; (iii) securities determined to be illiquid; (iv) securities with respect to which an event that will affect the value thereof has occurred (a “significant event”) since the closing prices were
13
| Marathon Value Portfolio |
| NOTES TO FINANCIAL STATEMENTS (Unaudited) (Continued) |
| March 31, 2019 |
established on the principal exchange on which they are traded, but prior to the Fund’s calculation of its net asset value. Specifically, interests in commodity pools or managed futures pools are valued on a daily basis by reference to the closing market prices of each futures contract or other asset held by a pool, as adjusted for pool expenses. Restricted or illiquid securities, such as private investments or non-traded securities are valued via inputs from the advisor based upon the current bid for the security from two or more independent dealers or other parties reasonably familiar with the facts and circumstances of the security (who should take into consideration all relevant factors as may be appropriate under the circumstances). If the advisor is unable to obtain a current bid from such independent dealers or other independent parties, the fair value team shall determine the fair value of such security using the following factors: (i) the type of security; (ii) the cost at date of purchase; (iii) the size and nature of the Fund’s holdings; (iv) the discount from market value of unrestricted securities of the same class at the time of purchase and subsequent thereto; (v) information as to any transactions or offers with respect to the security; (vi) the nature and duration of restrictions on disposition of the security and the existence of any registration rights; (vii) how the yield of the security compares to similar securities of companies of similar or equal creditworthiness; (viii) the level of recent trades of similar or comparable securities; (ix) the liquidity characteristics of the security; (x) current market conditions; and (xi) the market value of any securities into which the security is convertible or exchangeable.
Valuation of Fund of Funds – The Fund may invest in portfolios of open-end or closed-end investment companies (the “Underlying Funds”). Underlying open-end investment companies are valued at their respective net asset values as reported by such investment companies. The Underlying Funds value securities in their portfolios for which market quotations are readily available at their market values (generally the last reported sale price) and all other securities and assets at their fair value by the methods established by the board of directors of the Underlying Funds. The shares of many closed-end investment companies, after their initial public offering, frequently trade at a price per share, which is different than the net asset value per share. The difference represents a market premium or market discount of such shares. There can be no assurances that the market discount or market premium on shares of any closed-end investment company purchased by the Fund will not change.
The Fund utilizes various methods to measure the fair value of all of its investments on a recurring basis. GAAP establishes a hierarchy that prioritizes inputs to valuation methods. The three levels of inputs are:
Level 1 – Unadjusted quoted prices in active markets for identical assets and liabilities that the Fund has the ability to access.
Level 2 – Observable inputs other than quoted prices included in Level 1 that are observable for the asset or liability, either directly or indirectly. These inputs may include quoted prices for the identical instrument on an inactive market, prices for similar instruments, interest rates, prepayment speeds, credit risk, yield curves, default rates and similar data.
Level 3 – Unobservable inputs for the asset or liability, to the extent relevant observable inputs are not available, representing the Fund’s own assumptions about the assumptions a market participant would use in valuing the asset or liability, and would be based on the best information available.
The availability of observable inputs can vary from security to security and is affected by a wide variety of factors, including, for example, the type of security, whether the security is new and not yet established in the marketplace, the liquidity of markets, and other characteristics particular to the security. To the extent that valuation is based on models or inputs that are less observable or unobservable in the market, the determination of fair value requires more judgment. Accordingly, the degree of judgment exercised in determining fair value is greatest for instruments categorized in Level 3.
The inputs used to measure fair value may fall into different levels of the fair value hierarchy. In such cases, for disclosure purposes, the level in the fair value hierarchy within which the fair value measurement falls in its entirety, is determined based on the lowest level input that is significant to the fair value measurement in its entirety.
14
| Marathon Value Portfolio |
| NOTES TO FINANCIAL STATEMENTS (Unaudited) (Continued) |
| March 31, 2019 |
The inputs or methodology used for valuing securities are not necessarily an indication of the risk associated with investing in those securities. The following tables summarize the inputs used as of March 31, 2019, for the Fund’s investments measured at fair value:
| Level 3 | ||||||||||||||||
| Level 2 | (Other Significant | |||||||||||||||
| Level 1 | (Other Significant | Unobservable | ||||||||||||||
| Assets* | (Quoted Prices) | Observable Inputs) | Inputs) | Total | ||||||||||||
| Common Stocks | $ | 59,529,855 | $ | — | $ | — | $ | 59,529,855 | ||||||||
| Real Estate Investment Trust (REITs) | 535,872 | — | — | 535,872 | ||||||||||||
| Bonds and Notes | — | 11,585 | — | 11,585 | ||||||||||||
| Total | $ | 60,065,727 | $ | 11,585 | $ | — | $ | 60,077,312 | ||||||||
The Fund did not hold any Level 3 securities during the period.
| * | Refer to the Schedule of Investments for industry classifications. |
Security Transactions and Related Income – Security transactions are accounted for on the trade date. Interest income is recognized on an accrual basis. Discounts are accreted and premiums are amortized on securities purchased over the lives of the respective securities using the effective interest method. Dividend income is recorded on the ex-dividend date. Realized gains or losses from sales of securities are determined by comparing the identified cost of the security lot sold with the net sales proceeds.
Return of capital distributions received from Real Estate Investment Trusts (“REITs”) securities are recorded as an adjustment to the cost of the security and thus may impact unrealized or realized gains or losses on the security. Withholding taxes on foreign dividends have been provided for in accordance with the Fund’s understanding of the applicable country’s tax rules and rates.
Dividends and Distributions to Shareholders – Dividends from net investment income and distributions from net realized capital gains if any, are declared and paid annually. Dividends and distributions to shareholders are recorded on the ex-dividend date and are determined in accordance with Federal income tax regulations, which may differ from GAAP. These “book/tax” differences are considered either temporary (e.g., deferred losses, capital loss carryforwards) or permanent in nature. To the extent these differences are permanent in nature, such amounts are reclassified within the composition of net assets based on their federal tax-basis treatment; temporary differences do not require reclassification. These reclassifications have no effect on net assets, results from operations or net asset values per share of the Fund.
Federal Income Taxes – The Fund intends to continue to comply with the requirements of the Internal Revenue Code applicable to regulated investment companies and to distribute all of its taxable income to its shareholders. Therefore, no provision for federal income tax is required. The Fund recognizes the tax benefits of uncertain tax positions only where the position is “more likely than not” to be sustained assuming examination by tax authorities. Management has analyzed the Fund’s tax positions and has concluded that no liability for unrecognized tax benefits should be recorded related to uncertain tax positions taken on returns filed for open tax years ended October 31, 2016, September 30, 2018, or expected to be taken in the Fund’s September 30, 2019 year-end tax returns. The Fund identified its major tax jurisdictions as U.S. federal, Nebraska and foreign jurisdictions where the Fund makes significant investments; however, the Fund is not aware of any tax positions for which it is reasonably possible that the total amounts of unrecognized tax benefits will change materially in the next twelve months.
Foreign currency – Investment securities and other assets and liabilities denominated in foreign currencies are translated into U.S. dollar amounts at the date of valuation. Purchases and sales of investment securities and income and expense items denominated in foreign currencies are translated into U.S. dollar amounts on the respective dates of such transactions.
15
| Marathon Value Portfolio |
| NOTES TO FINANCIAL STATEMENTS (Unaudited) (Continued) |
| March 31, 2019 |
Expenses – Expenses of the Trust that are directly identifiable to a specific fund are charged to that fund. Expenses, which are not readily identifiable to a specific fund, are allocated in such a manner as deemed equitable, taking into consideration the nature and type of expense and the relative sizes of the funds in the Trust.
Indemnification – The Trust indemnifies its officers and Trustees for certain liabilities that may arise from the performance of their duties to the Trust. Additionally, in the normal course of business, the Fund enters into contracts that contain a variety of representations and warranties and which provide general indemnities. The Fund’s maximum exposure under these arrangements is unknown, as this would involve future claims that may be made against the Fund that have not yet occurred. However, based on experience, the risk of loss due to these warranties and indemnities appears to be remote.
| 3. | INVESTMENT TRANSACTIONS |
For the six months ended March 31, 2019, cost of purchases and proceeds from sales of portfolio securities, excluding short-term investments, amounted to $1,567,127 and $6,943,547, respectively.
| 4. | INVESTMENT ADVISORY AGREEMENT AND TRANSACTIONS WITH RELATED PARTIES |
Gratus Capital, LLC (“Gratus”) has served as the Fund’s investment advisor since May 1, 2016 and is an indirect, wholly-owned subsidiary of Focus Financial Partners, LLC (“Focus”). Focus is a Delaware limited liability company that is a strategic and financial investor in independently-managed wealth managed firms. On July 3, 2017, two private equity firms, Stone Point Capital LLC and Kohlberg Kravis Roberts & Co. L.P., through an affiliate, made a majority investment in Focus (the “Transaction”), which resulted in a change in control of Focus. Since Gratus is a wholly-owned subsidiary of Focus, the Transaction resulted in an indirect change in control of Gratus. Under the Investment Company Act of 1940, as amended (the “1940 Act’), a transaction that results in the transfer, either directly or indirectly, of ownership of more than 25% of the voting interests of an investment advisor to a third-party is presumed to constitute a “change in control” of the advisor. The 1940 Act further states that a change in control of an investment advisor causes the advisor’s investment advisory agreement to be “assigned,” which results in the automatic termination of the agreement. The Transaction was presumed to constitute a “change in control” of Gratus for purposes of the 1940 Act, causing the “assignment” and resulting termination of the prior investment advisory agreement with Gratus, dated June 10, 2016 (the “Prior Agreement”). In order for Gratus to continue to serve as the investment advisor to the Fund, at an in-person meeting on May 30, 2017 (the “Board Meeting”), the Board approved a new advisory agreement with Gratus (the “Advisory Agreement”), subject to shareholder approval. The 1940 Act requires that investment advisory agreements such as the Advisory Agreement be approved by a vote of a majority of the outstanding shares of the Fund. Therefore, shareholders were asked to approve the proposed Advisory Agreement with Gratus. At the Board Meeting, the Board also approved an interim advisory agreement between the Trust, on behalf of the Fund, and Gratus (the “Interim Advisory Agreement”). The Interim Advisory Agreement was effective for 150 days from the close of the Transaction on July 3, 2017 until the Advisory Agreement was approved by shareholders on October 27, 2017. Both the Advisory Agreement and the Interim Advisory Agreement are similar in all material respects to the Prior Agreement.
Under the terms of Advisory Agreement, the Advisor provides investment advisory services and pays the Fund’s operating expenses (except for the following expenses, which are paid by the Fund: brokerage fees and commissions, indirect costs of investing in other investment companies, taxes, borrowing costs (such as (a) interest and (b) dividend expenses on securities sold short), such extraordinary or non-recurring expenses as may arise, including litigation to which the Fund may be a party and indemnification of the Trust’s Trustees and officers with respect thereto, and any 12b-1 fees) in return for a “universal fee.” For its services to the Fund, the Advisor is entitled to receive an annual fee, computed and accrued daily and paid monthly, equal to 1.10% of the Fund’s average daily net assets.
For the six months ended March 31, 2019 Gratus earned fees of $325,933 for its services under on the Advisory Agreement.
Northern Lights Distributors, LLC (“NLD” or the “Distributor”) acts as the Fund’s principal underwriter in a continuous public offering of the Fund shares. During the six months ended March 31, 2019, the Distributor received $0 in underwriting commissions.
16
| Marathon Value Portfolio |
| NOTES TO FINANCIAL STATEMENTS (Unaudited) (Continued) |
| March 31, 2019 |
In addition, certain affiliates of the Distributor provide services to the Fund as follows:
Gemini Fund Services, LLC (“GFS”), an affiliate of the Distributor, provides administration, fund accounting, and transfer agent services to the Trust. Pursuant to an administrative servicing agreement with GFS, the Fund pays GFS customary fees based on aggregate net assets of the Fund as described in the servicing agreement for providing administration, fund accounting, and transfer agency services to the Fund. In accordance with this agreement, GFS pays for all other operating expenses for the Fund, including but not limited to legal fees, audit fees, compliance services and custody fees (“universal fee”). Certain officers of the Trust are also officers of GFS and are not paid any fees directly by the Fund for serving in such capacities.
Northern Lights Compliance Services, LLC (“NLCS”), an affiliate of GFS and the Distributor, provides a chief compliance officer to the Trust, as well as related compliance services, pursuant to a consulting agreement between NLCS and the Trust. Under the terms of such agreement, NLCS receives customary fees from GFS (as part of the universal fee).
Blu Giant, LLC (“Blu Giant”), an affiliate of GFS and the Distributor, provides EDGAR conversion and filing services as well as print management services for the Fund on an ad-hoc basis. For the provision of these services, Blu Giant receives customary fees from GFS (as part of the universal fee).
Compensation of Directors. The total amount allocated to the Fund for the six months ended March 31, 2019, was $6,247 (as part of the universal fee).
Effective February 1, 2019, NorthStar Financial Services Group, LLC, the parent company of GFS and its affiliated companies including NLD, NLCS and Blu Giant (collectively, the “Gemini Companies”), sold its interest in the Gemini Companies to a third party private equity firm that contemporaneously acquired Ultimus Fund Solutions, LLC (an independent mutual fund administration firm) and its affiliates (collectively, the “Ultimus Companies”). As a result of these separate transactions, the Gemini Companies and the Ultimus Companies are now indirectly owned through a common parent entity, The Ultimus Group, LLC.
| 5. | DISTRIBUTIONS TO SHAREHOLDERS AND TAX COMPONENTS OF CAPITAL |
The below table represents aggregate cost for federal tax purposes as of March 31, 2019 and differs from market value by net unrealized appreciation/depreciation which consisted of:
| Total Unrealized | ||||||||||||||
| Gross Unrealized | Gross Unrealized | Appreciation/ | ||||||||||||
| Aggregate Cost | Appreciation | Depreciation | Depreciation | |||||||||||
| $ | 20,060,696 | $ | 40,027,318 | $ | (10,702 | ) | $ | 40,016,616 | ||||||
The tax character of distributions paid during the periods ended September 30, 2018 and September 30, 2017 was as follows:
| Fiscal Year Ended | Fiscal Year Ended | |||||||
| September 30, 2018 | September 30, 2017 | |||||||
| Ordinary Income | $ | 529,856 | $ | 333,158 | ||||
| Long-Term Capital Gain | 3,849,701 | 821,806 | ||||||
| Return of Capital | — | — | ||||||
| $ | 4,379,557 | $ | 1,154,964 | |||||
As of September 30, 2018, the components of accumulated earnings/ (deficit) on a tax basis were as follows:
| Undistributed | Undisributed | Post October | Capital Loss | Other | Unrealized | Total | ||||||||||||||||||||
| Ordinary | Long-Term | Loss and Late | Carry | Book/Tax | Appreciation/ | Accumulated | ||||||||||||||||||||
| Income | Gains | Year Loss | Forwards | Differences | (Deprecation) | Earnings/(Deficits) | ||||||||||||||||||||
| $ | 282,790 | $ | 1,843,546 | $ | — | $ | — | $ | — | $ | 43,462,119 | $ | 45,588,455 | |||||||||||||
The difference between book basis and tax basis unrealized appreciation and undistributed net investment income is primarily attributable to adjustments for return of capital distributions from C-Corporations.
17
| Marathon Value Portfolio |
| NOTES TO FINANCIAL STATEMENTS (Unaudited) (Continued) |
| March 31, 2019 |
Permanent book and tax differences, primarily attributable to the tax treatment of foreign currency gains, resulted in reclassification for the year ended September 30, 2018 as follows:
| Undistributed Net | Accumulated Net | |||||||||
| Investment Income | Realized Gains | |||||||||
| Paid in Capital | (Loss) | (Loss) | ||||||||
| $ | — | $ | (318 | ) | $ | 318 | ||||
| 6. | BENEFICIAL OWNERSHIP |
The beneficial ownership, either directly or indirectly, of 25% or more of the outstanding shares of a fund creates a presumption of control of the fund under Section 2(a)(9) of the 1940 Act. As of March 31, 2019, Charles Schwab & Co. was the record owner of 78.90% of the Fund’s outstanding shares. Charles Schwab & Co. may be the beneficial owner of some or all of the shares, or may hold the shares for the benefit of others. As a result, Charles Schwab & Co. may be deemed to control the Fund.
| 7. | RECENT ACCOUNTING PRONOUNCEMENTS AND REPORTING UPDATES |
In August 2018, the FASB issued ASU No. 2018-13, which changes certain fair value measurement disclosure requirements. The new ASU, in addition to other modifications and additions, removes the requirement to disclose the amount and reasons for transfers between Level 1 and Level 2 of the fair value hierarchy, and the policy for the timing of transfers between levels. For investment companies, the amendments are effective for financial statements issued for fiscal years beginning after December 15, 2019, and interim periods within those fiscal years. Early adoption is allowed. These amendments have been adopted with these financial statements.
In March 2017, the Financial Accounting Standards Board (FASB) issued Accounting Standards Update (ASU) No. 2017-08, Receivables—Nonrefundable Fees and Other Costs (Subtopic 310-20): Premium Amortization on Purchased Callable Debt Securities. The amendments in the ASU shorten the amortization period for certain callable debt securities, held at a premium, to be amortized to the earliest call date. The ASU does not require an accounting change for securities held at a discount; which continues to be amortized to maturity. The ASU is effective for fiscal years and interim periods within those fiscal years beginning after December 15, 2018. Management is currently evaluating the impact, if any, of applying this provision.
In August 2018, the Securities and Exchange Commission adopted amendments to certain disclosure requirements under Regulation S-X to conform to US GAAP, including: (i) an amendment to require presentation of the total, rather than the components, of distributable earnings on the Statement of Assets and Liabilities; and (ii) an amendment to require presentation of the total, rather than the components, of distributable earnings on the Statement of Assets and Liabilities; and (ii) an amendment to require presentation of the total, rather than the components, of distributions to shareholders, except for tax return of capital distributions, if any, on the Statement of Changes in Net Assets. The amendments also removed the requirement for parenthetical disclosure of undistributed net investment income on the Statement of Changes in Net Assets. Early adoption is allowed. These amendments have been adopted with these financial statements.
| 8. | SUBSEQUENT EVENTS |
Subsequent events after the date of the Statement of Assets and Liabilities have been evaluated through the date the financial statements were issued. Management has determined that no events or transactions occurred requiring adjustment or disclosure in the financial statements.
18
| Marathon Value Portfolio |
| SUPPLEMENTAL INFORMATION |
| March 31, 2018 (Unaudited) |
Approval of Advisory Agreement – Marathon Value Portfolio*
In connection with a meeting held on February 20 and 21, 2019, the Board of Trustees (the “Board”) of Northern Lights Fund Trust III (the “Trust”), including a majority of the Trustees who are not “interested persons” as that term is defined in the Investment Company Act of 1940, as amended, discussed the approval of the investment advisory agreement (the “Advisory Agreement”) between Gratus Capital, LLC (the “Adviser”) and the Trust, with respect to the Marathon Value Portfolio (“Marathon”). In considering the approval of the Advisory Agreement, the Board reviewed materials specifically relating to Marathon and the Advisory Agreement.
The Board discussed the Adviser’s presentation and materials. The Board relied upon the advice of independent legal counsel and its own business judgment in determining the material factors to be considered in evaluating the Advisory Agreement and the weight to be given to each such factor. The Board’s conclusions were based on an evaluation of all of the information provided and were not the result of any one factor. Moreover, each trustee may have afforded different weight to the various factors in reaching his or her conclusions with respect to the Advisory Agreement.
Nature, Extent & Quality of Services. The Board observed that the Adviser was founded in 2005 and managed client accounts using a global equity strategy to give investors exposure to a broad range of asset classes. The Board remarked that the Adviser’s investment personnel had diverse investment experience with impressive educational backgrounds. The Board noted that the Adviser’s strategy focused on long-term capital appreciation through analysis of market sectors and individual equities. The Board discussed that the Adviser provided equity and fixed income research, compliance services and investment analysis to Marathon, and managed risk through asset allocation across stocks, bonds and cash, and diversification within asset classes in a thorough security selection process. The Board remarked that the Adviser monitored Marathon daily for compliance through internal monitoring spreadsheets, and conducted a more in-depth review at month-end using Charles River reports. The Board acknowledged that the Adviser’s best execution committee reviewed and approved broker-dealers based on a broad range of factors. The Board noted that the Adviser was a large organization with the resources available to support Marathon’s investment process and operations. The Board concluded that the Adviser should continue to provide high-quality service to Marathon and its shareholders.
Performance. The Board commented that Marathon underperformed its peer group, Morningstar category and benchmark over the 1-year, 3-year and 5-year periods, but had outperformed all of them since inception. The Board remarked that prior to the fourth quarter, Marathon had been outperforming its benchmark in 2018. The Board discussed that Marathon’s underperformance prior to 2018 could be attributed to holding more cash and cash equivalents in anticipation of a down market that never materialized. The Board noted that although the Adviser did not manage Marathon with short term objectives, it had repositioned Marathon to be more conservative which limited some of the market’s significant drawdown in December 2018. The Board acknowledged that Marathon posted positive returns in the year-to-date. Although
19
| Marathon Value Portfolio |
| SUPPLEMENTAL INFORMATION |
| March 31, 2019 (Unaudited) (Continued) |
past performance is not predictive of future results, the Board concluded the Adviser was expected to provide reasonable returns to Marathon and its shareholders.
Fees and Expenses. The Board discussed that the Marathon peer group selected by Broadridge consisted of 12 funds with an average size of $332.8 million. The Board observed that the Adviser was paid a unitary fee of 1.10%, which meant the Adviser paid most of Marathon’s operating expenses. The Board discussed that after Fund operating expenses paid by the Adviser, the effective advisory fee for Marathon was 0.60%, which was lower than the peer group and Morningstar category averages and medians. The Board reviewed the Adviser’s explanation that its fee was reasonable because of Marathon’s small size relative to its peers and the progressive reduction of the fee over the past five years. It discussed the fees paid by the Adviser’s separate accounts. Given these considerations, the Board concluded that the Adviser’s advisory fee for Marathon was not unreasonable.
Economies of Scale. The Board discussed the size of Marathon and its prospects for growth, and concluded it had not achieved meaningful economies that would necessitate the establishment of breakpoints. The Board noted the Adviser was willing to discuss the implementation of breakpoints as Marathon’s assets under management approached $500 million, and the Adviser achieved material economies of scale related to its operation. The Board agreed to monitor and revisit this issue at the appropriate time.
Profitability. The Board reviewed the Adviser’s profitability analysis in connection with its management of Marathon, and acknowledged that the Adviser earned a modest profit. It also considered the Adviser’s soft dollar arrangements, and the benefit received by the Adviser from those arrangements. The Board concluded that the Adviser’s profitability was not excessive.
Conclusion. Having requested and reviewed such information from the Adviser as the Board believed to be reasonably necessary to evaluate the terms of the Advisory Agreement, and as assisted by the advice of independent counsel, the Board concluded that the advisory fee structure for Marathon was not unreasonable, and that renewal of the Advisory Agreement was in the best interests of Marathon and its shareholders.
| * | Due to timing of the contract renewal schedule, these deliberations may or may not relate to the current performance results of the Fund. |
20
| Marathon Value Portfolio |
| EXPENSE EXAMPLES (Unaudited) |
| March 31, 2019 |
As a shareholder of the Fund, you incur ongoing costs, consisting of the Fund’s universal fee. This example is intended to help you understand your ongoing costs (in dollars) of investing in the Fund and to compare these costs with the ongoing costs of investing in other mutual funds.
The Example is based on an investment of $1,000 invested at the beginning of the period and held for the entire period from October 1, 2018 to March 31, 2019 (the “period”).
Actual Expenses
The first table below provides information about actual account values and actual expenses. You may use the information in this line, together with the amount you invested, to estimate the expenses that you paid over the period. Simply divide your account value by $1,000 (for example, an $8,600 account value divided by $1,000 = 8.6), then multiply the result by the number in the first line under the heading entitled “Expenses Paid During the Period” to estimate the expenses you paid on your account during this period.
Hypothetical Example for Comparison Purposes
The second table below provides information about hypothetical account values and hypothetical expenses based on the Fund’s actual expense ratio and an assumed rate of return of 5% per year before expenses, which is not the Fund’s actual return. The hypothetical account values and expenses may not be used to estimate the actual ending account balance or expenses you paid for the period. You may use this information to compare the ongoing costs of investing in the Fund and other funds. To do so, compare this 5% hypothetical example with the 5% hypothetical examples that appear in the shareholder reports of the other funds. Please note that the expenses shown in the table are meant to highlight your ongoing costs only and do not reflect any transactional costs. Therefore, the second table is useful in comparing ongoing costs only, and will not help you determine the relative total costs of owning different funds. In addition, if these transactional costs were included, your costs would have been higher.
| Beginning | Ending | Expenses Paid | Expense Ratio | |
| Account Value | Account Value | During Period | During the Period | |
| Actual | 10/1/18 | 3/31/19 | 10/1/18-3/31/19* | 10/1/18-3/31/19 |
| $1,000.00 | 995.20 | 5.47 | 1.10% | |
| Beginning | Ending | Expenses Paid | Expense Ratio | |
| Hypothetical | Account Value | Account Value | During Period | During the Period |
| (5% return before expenses) | 10/1/18 | 3/31/19 | 10/1/18-3/31/19* | 10/1/18-3/31/19 |
| $1,000.00 | $1,019.45 | $5.54 | 1.10% |
| * | Expenses are equal to the average account value over the period, multiplied by the Fund’s annualized expense ratio, multiplied by the number of days in the period (182) divided by the number of days in the fiscal year (365). |
21
| PRIVACY NOTICE |
NORTHERN LIGHTS FUND TRUST III
Rev. February 2014
| FACTS | WHAT DOES NORTHERN LIGHTS FUND TRUST III DO WITH YOUR PERSONAL INFORMATION? |
| Why? | Financial companies choose how they share your personal information. Federal law gives consumers the right to limit some but not all sharing. Federal law also requires us to tell you how we collect, share, and protect your personal information. Please read this notice carefully to understand what we do. |
| What? | The types of personal information we collect and share depend on the product or service you have with us. This information can include:
¡ Social Security number and income
¡ assets, account transfers and transaction history
¡ investment experience and risk tolerance
When you are no longer our customer, we continue to share your information as described in this notice. |
| How? | All financial companies need to share customers’ personal information to run their everyday business. In the section below, we list the reasons financial companies can share their customers’ personal information; the reasons Northern Lights Fund Trust III chooses to share and whether you can limit this sharing. |
| Reasons we can share your personal information | Does
Northern Lights Fund Trust III share? |
Can you limit this sharing? |
| For
our everyday business purposes– such as to process your transactions, maintain your account(s), respond to court orders and legal investigations, or report to credit bureaus |
YES | NO |
| For
our marketing purposes– to offer our products and services to you |
NO | We don’t share. |
| For joint marketing with other financial companies | NO | We don’t share. |
| For our affiliates’ everyday business purposes–information about your transactions and experiences | NO | We don’t share. |
| For our affiliates’ everyday business purposes–information about your creditworthiness | NO | We don’t share. |
| For our affiliates to market to you | NO | We don’t share. |
| For nonaffiliates to market to you | NO | We don’t share. |
| Questions? | Call 1-888-339-4230 |
22
| Page 2 |
| What we do | |
|
How does Northern Lights Fund Trust III protect my personal information? |
To protect your personal information from unauthorized access and use, we use security measures that comply with federal law. These measures include computer safeguards and secured files and buildings.
Our service providers are held accountable for adhering to strict policies and procedures to prevent any misuse of your nonpublic personal information.
|
|
How does Northern Lights Fund Trust III collect my personal information? |
We collect your personal information, for example, when you
¡ open an account or give us contact information
¡ provide account information or give us your income information
¡ make deposits or withdrawals from your account
We also collect your personal information from other companies.
|
|
Why can’t I limit all sharing? |
Federal law gives you the right to limit only
¡ sharing for affiliates’ everyday business purposes—information about your creditworthiness
¡ affiliates from using your information to market to you
¡ sharing for nonaffiliates to market to you
State laws and individual companies may give you additional rights to limit sharing
|
| Definitions | |
| Affiliates | Companies related by common ownership or control. They can be financial and nonfinancial companies.
¡ Northern Lights Fund Trust III does not share with our affiliates.
|
| Nonaffiliates | Companies not related by common ownership or control. They can be financial and nonfinancial companies.
¡ Northern Lights Fund Trust III does not share with nonaffiliates so they can market to you.
|
| Joint marketing | A formal agreement between nonaffiliated financial companies that together market financial products or services to you.
¡ Northern Lights Fund Trust III doesn’t jointly market.
|
23
| Marathon Value Portfolio |
| OTHER INFORMATION |
| March 31, 2019 (Unaudited) |
Portfolio Holdings
The Fund files its complete schedule of portfolio holdings with the Securities and Exchange Commission (the “SEC”) for the first and third quarters of each fiscal year on Form N-Q. The Fund’s Forms N-Q are available on the SEC’s website at http://www.sec.gov. Finally, the information on the Fund’s Form N-Q is available, upon request, by calling the Fund at (800) 788-6086.
Proxy Voting Policies
The policies and procedures that the Fund uses to determine how to vote proxies relating to its investments is available without charge, upon request, by calling the Fund’s toll-free number at (800) 788-6086 or by visiting the Fund’s website at http://www.marathonvalue.com. A description of these policies and procedures is also included in the Fund’s Statement of Additional Information, which is available on the SEC’s website at http://www.sec.gov. Information regarding how the Fund voted proxies for each 12 month period ending June 30 is filed with the SEC on Form N-PX. Such information, when filed, is available without charge, upon request, by calling the Fund’s toll-free number at (800) 788-6086 or by visiting the Fund’s website at http://www.marathonvalue.com. Such information is also available on the SEC’s website at http://www.sec.gov.
24
| Northern Lights Fund Trust III |
| 17645 Wright Street, Suite 200 |
| Omaha, NE 68130 |
| ADVISOR |
| Gratus Capital, LLC |
| 3350 Riverwood Parkway, Suite 1550 |
| Atlanta, GA, 30339 |
| ADMINISTRATOR |
| Gemini Fund Services, LLC |
| 80 Arkay Drive, Suite 110 |
| Hauppauge, NY 11788 |
| TRANSFER AGENT |
| Gemini Fund Services, LLC |
| 17645 Wright Street, Suite 200 |
| Omaha, NE 68130 |
| INDEPENDENT REGISTERED PUBLIC ACCOUNTING FIRM |
| Cohen & Company Ltd. |
| 1350 Euclid Avenue |
| Suite 800 |
| Cleveland, OH 44115 |
| LEGAL COUNSEL |
| Thompson Hine LLP |
| 41 South High Street |
| Suite 1700 |
| Columbus, OH 43215 |
| CUSTODIAN BANK |
| Huntington National Bank |
| 41 South High Street |
| Columbus, OH 43215 |
Item 2. Code of Ethics. Not applicable.
Item 3. Audit Committee Financial Expert. Not applicable.
Item 4. Principal Accountant Fees and Services. Not applicable.
Item 5. Audit Committee of Listed Companies. Not applicable to open-end investment companies.
Item 6. Schedule of Investments. Schedule of investments in securities of unaffiliated issuers is included under Item 1.
Item 7. Disclosure of Proxy Voting Policies and Procedures for Closed-End Funds. Not applicable to open-end investment companies.
Item 8. Portfolio Managers of Closed-End Management Investment Companies. Not applicable to open-end investment companies.
Item 9. Purchases of Equity Securities by Closed-End Funds. Not applicable to open-end investment companies.
Item 10. Submission of Matters to a Vote of Security Holders. None
Item 11. Controls and Procedures.
(a) Based on an evaluation of the Registrant’s disclosure controls and procedures as of a date within 90 days of filing date of this Form N-CSR, the principal executive officer and principal financial officer of the Registrant have concluded that the disclosure controls and procedures of the Registrant are reasonably designed to ensure that the information required in filings on Form N-CSR is recorded, processed, summarized, and reported by the filing date, including that information required to be disclosed is accumulated and communicated to the Registrant’s management, including the Registrant’s principal executive officer and principal financial officer, as appropriate to allow timely decisions regarding required disclosure.
(b) There were no significant changes in the Registrant’s internal control over financial reporting that occurred during the Registrant’s last fiscal half-year that have materially affected, or are reasonably likely to materially affect, the Registrant’s internal control over financial reporting.
Item 12. Disclosure of Securities Lending Activities for Closed-Ended Management Investment Companies
Not applicable.
Item 13. Exhibits.
(a)(1) Not applicable.
(a)(2) Certifications required by Section 302 of the Sarbanes-Oxley Act of 2002 (and Item 11(a)(2) of Form N-CSR) are filed herewith.
(a)(3) Not applicable for open-end investment companies.
(b) Certifications required by Section 906 of the Sarbanes-Oxley Act of 2002 (and Item 11(b) of Form N-CSR) are filed herewith.
SIGNATURES
Pursuant to the requirements of the Securities Exchange Act of 1934 and the Investment Company Act of 1940, the registrant has duly caused this report to be signed on its behalf by the undersigned, thereunto duly authorized.
(Registrant) Northern Lights Fund Trust III
By (Signature and Title)
/s/ Richard Malinowski
Richard Malinowski, Principal Executive Officer/President
Date 6/6/19
Pursuant to the requirements of the Securities Exchange Act of 1934 and the Investment Company Act of 1940, this report has been signed below by the following persons on behalf of the registrant and in the capacities and on the dates indicated.
By (Signature and Title)
/s/ Richard Malinowski
Richard Malinowski, Principal Executive Officer/President
Date 6/6/19
By (Signature and Title)
/s/ Brian Curley
Brian Curley, Principal Financial Officer/Treasurer
Date 6/6/19
CERTIFICATIONS
I, Richard Malinowski, certify that:
1. I have reviewed this report on Form N-CSR of the Marathon Value Portfolio (a series of Northern Lights Fund Trust III);
2. Based on my knowledge, this report does not contain any untrue statement of a material fact or omit to state a material fact necessary to make the statements made, in light of the circumstances under which such statements were made, not misleading with respect to the period covered by this report;
3. Based on my knowledge, the financial statements, and other financial information included in this report, fairly present in all material respects the financial condition, results of operations, changes in net assets, and cash flows (if the financial statements are required to include a statement of cash flows) of the registrant as of, and for, the periods presented in this report;
4. The registrant's other certifying officer(s) and I are responsible for establishing and maintaining disclosure controls and procedures (as defined in Rule 30a-3(c) under the Investment Company Act of 1940) and internal control over financial reporting (as defined in Rule 30a-3(d) under the Investment Company Act of 1940) for the registrant and have:
a) designed such disclosure controls and procedures, or caused such disclosure controls and procedures to be designed under our supervision, to ensure that material information relating to the registrant, including its consolidated subsidiaries, is made known to us by others within those entities, particularly during the period in which this report is being prepared;
b) designed such internal control over financial reporting, or caused such internal control over financial reporting to be designed under our supervision, to provide reasonable assurance regarding the reliability of financial reporting and the preparation of financial statements for external purposes in accordance with generally accepted accounting principles;
c) evaluated the effectiveness of the registrant's disclosure controls and procedures and presented in this report our conclusions about the effectiveness of the disclosure controls and procedures, as of a date within 90 days prior to the filing date of this report based on such evaluation; and
d) disclosed in this report any change in the registrant’s internal control over financial reporting that occurred during the registrant’s most recent fiscal half-year (the registrant’s second fiscal half-year in the case of an annual report) that has materially affected, or is reasonably likely to materially affect, the registrant’s internal control over financial reporting; and
5. The registrant's other certifying officer(s) and I have disclosed to the registrant's auditors and the audit committee of the registrant's board of directors (or persons performing the equivalent functions):
a) all significant deficiencies and material weaknesses in the design or operation of internal control over financial reporting which are reasonably likely to adversely affect the registrant's ability to record, process, summarize, and report financial information; and
b) any fraud, whether or not material, that involves management or other employees who have a significant role in the registrant's internal control over financial reporting.
| Date: 6/6/19 | /s/ Richard Malinowski |
| Richard Malinowski | |
| Principal Executive Officer/President |
I, Brian Curley, certify that:
1. I have reviewed this report on Form N-CSR of the Marathon Value Portfolio (a series of Northern Lights Fund Trust III);
2. Based on my knowledge, this report does not contain any untrue statement of a material fact or omit to state a material fact necessary to make the statements made, in light of the circumstances under which such statements were made, not misleading with respect to the period covered by this report;
3. Based on my knowledge, the financial statements, and other financial information included in this report, fairly present in all material respects the financial condition, results of operations, changes in net assets, and cash flows (if the financial statements are required to include a statement of cash flows) of the registrant as of, and for, the periods presented in this report;
4. The registrant's other certifying officer(s) and I are responsible for establishing and maintaining disclosure controls and procedures (as defined in Rule 30a-3(c) under the Investment Company Act of 1940) and internal control over financial reporting (as defined in Rule 30a-3(d) under the Investment Company Act of 1940) for the registrant and have:
a) designed such disclosure controls and procedures, or caused such disclosure controls and procedures to be designed under our supervision, to ensure that material information relating to the registrant, including its consolidated subsidiaries, is made known to us by others within those entities, particularly during the period in which this report is being prepared;
b) designed such internal control over financial reporting, or caused such internal control over financial reporting to be designed under our supervision, to provide reasonable assurance regarding the reliability of financial reporting and the preparation of financial statements for external purposes in accordance with generally accepted accounting principles;
c) evaluated the effectiveness of the registrant's disclosure controls and procedures and presented in this report our conclusions about the effectiveness of the disclosure controls and procedures, as of a date within 90 days prior to the filing date of this report based on such evaluation; and
d) disclosed in this report any change in the registrant’s internal control over financial reporting that occurred during the registrant’s most recent fiscal half-year (the registrant’s second fiscal half-year in the case of an annual report) that has materially affected, or is reasonably likely to materially affect, the registrant’s internal control over financial reporting; and
5. The registrant's other certifying officer(s) and I have disclosed to the registrant's auditors and the audit committee of the registrant's board of directors (or persons performing the equivalent functions):
a) all significant deficiencies and material weaknesses in the design or operation of internal control over financial reporting which are reasonably likely to adversely affect the registrant's ability to record, process, summarize, and report financial information; and
b) any fraud, whether or not material, that involves management or other employees who have a significant role in the registrant's internal control over financial reporting.
| Date: 6/6/19 | /s/ Brian Curley |
| Brian Curley | |
| Principal Financial Officer/Treasurer |
certification
Richard Malinowski, Principal Executive Officer/President and Brian Curley, Principal Financial Officer/Treasurer of Northern Lights Fund Trust III (the “Registrant”), each certify to the best of his knowledge that:
1. The Registrant’s periodic report on Form N-CSR for the period ended March 31, 2019 (the “Form N-CSR”) fully complies with the requirements of Sections 15(d) of the Securities Exchange Act of 1934, as amended; and
2. The information contained in the Form N-CSR fairly presents, in all material respects, the financial condition and results of operations of the Registrant.
| Principal Executive Officer/President | Principal Financial Officer/Treasurer |
| Northern Lights Fund Trust III | Northern Lights Fund Trust III |
| /s/ Richard Malinowski | /s/ Brian Curley |
| Brian Curley | Brian Curley |
| Date: 6/6/19 | Date: 6/6/19 |
A signed original of this written statement required by Section 906 of the Sarbanes-Oxley Act of 2002 has been provided to Northern Lights Funds Trust III and will be retained by Northern Lights Fund Trust III and furnished to the Securities and Exchange Commission (the “Commission”) or its staff upon request.
This certification is being furnished to the Commission solely pursuant to 18 U.S.C. § 1350 and is not being filed as part of the Form N-CSR filed with the Commission.
Serious News for Serious Traders! Try StreetInsider.com Premium Free!
You May Also Be Interested In
- Aviva pledges $6M to Nature Conservancy of Canada for conservation and nature-based carbon removal projects
- Roborock S8 MaxV Ultra Breaks New Ground as the First Robotic Vacuum to Achieve Matter Certification
- Nine Mile Metals Announces Drill Hole WD-24-04 Certified Assay Results of 1.33% Copper Equivalent (Cu-Eq) over 37.10m Including 3.08% Cu-Eq over 10.24m
Create E-mail Alert Related Categories
SEC FilingsSign up for StreetInsider Free!
Receive full access to all new and archived articles, unlimited portfolio tracking, e-mail alerts, custom newswires and RSS feeds - and more!
