

Form N-CSRS MFS SPECIAL VALUE TRUST For: Apr 30
 Tweet
Tweet Share
ShareTable of Contents
UNITED STATES
SECURITIES AND EXCHANGE COMMISSION
Washington, D.C. 20549
FORM N-CSR
CERTIFIED SHAREHOLDER REPORT OF
REGISTERED MANAGEMENT INVESTMENT COMPANIES
Investment Company Act file number 811-05912
MFS SPECIAL VALUE TRUST
(Exact name of registrant as specified in charter)
111 Huntington Avenue, Boston, Massachusetts 02199
(Address of principal executive offices) (Zip code)
Christopher R. Bohane
Massachusetts Financial Services Company
111 Huntington Avenue
Boston, Massachusetts 02199
(Name and address of agents for service)
Registrant’s telephone number, including area code: (617) 954-5000
Date of fiscal year end: October 31
Date of reporting period: April 30, 2018
Table of Contents
| ITEM 1. | REPORTS TO STOCKHOLDERS. |
Table of Contents
Semiannual Report
April 30, 2018

MFS® Special Value Trust

MFV-SEM
Table of Contents
MANAGED DISTRIBUTION POLICY DISCLOSURE
The MFS Special Value Trust’s (the fund) Board of Trustees adopted a managed distribution policy. The fund seeks to pay monthly distributions based on an annual rate of 10.00% of the fund’s average monthly net asset value. The primary purpose of the managed distribution policy is to provide shareholders with a constant, but not guaranteed, fixed minimum rate of distribution each month. You should not draw any conclusions about the fund’s investment performance from the amount of the current distribution or from the terms of the fund’s managed distribution policy. The Board may amend or terminate the managed distribution policy at any time without prior notice to fund shareholders. The amendment or termination of the managed distribution policy could have an adverse effect on the market price of the fund’s shares.
With each distribution, the fund will issue a notice to shareholders and an accompanying press release which will provide detailed information regarding the amount and composition of the distribution and other related information. The amounts and sources of distributions reported in the notice to shareholders are only estimates and are not being provided for tax reporting purposes. The actual amounts and sources of the amounts for tax reporting purposes will depend upon the fund’s investment experience during the remainder of its fiscal year and may be subject to changes based on tax regulations. The fund will send you a Form 1099-DIV for the calendar year that will tell you how to report these distributions for federal income tax purposes. Please refer to “Tax Matters and Distributions” under Note 2 of the Notes to Financial Statements for information regarding the tax character of the fund’s distributions.
Under a managed distribution policy the fund may at times distribute more than its net investment income and net realized capital gains; therefore, a portion of your distribution may result in a return of capital. A return of capital may occur, for example, when some or all of the money that you invested in the fund is paid back to you. Any such returns of capital will decrease the fund’s total assets and, therefore, could have the effect of increasing the fund’s expense ratio. In addition, in order to make the level of distributions called for under its managed distribution policy, the fund may have to sell portfolio securities at a less than opportune time. A return of capital does not necessarily reflect the fund’s investment performance and should not be confused with ‘yield’ or ‘income’. The fund’s total return in relation to changes in net asset value is presented in the Financial Highlights.
Table of Contents
MFS® Special Value Trust
New York Stock Exchange Symbol: MFV
NOT FDIC INSURED • MAY LOSE VALUE • NO BANK GUARANTEE
Table of Contents

LETTER FROM THE EXECUTIVE CHAIRMAN
Dear Shareholders:
Rising bond yields have led to a measurable uptick in market volatility — a departure from the low-volatility environment that prevailed for much of 2017. In recent months,
against this backdrop, global markets have given back some of the strong gains recorded during 2017 and early 2018. Global economic growth remains robust, notwithstanding signs of a modest slowdown over the past few months, particularly in Europe.
Although the U.S. Federal Reserve continues to gradually raise interest rates and shrink its balance sheet, monetary policy remains accommodative around the world, with many central banks taking only tentative steps toward tighter policies. Newly enacted U.S. tax reforms have been welcomed by equity markets, while emerging market economies have benefited from a weaker U.S. dollar.
Around the world, inflation remains largely subdued, but tight labor markets and solid global demand have investors on the lookout for its potential resurgence. Increased U.S. protectionism is also a growing concern, as investors fear that trade friction could disrupt the synchronized rise in global growth.
As a global investment manager, MFS® strives to create long-term value and protect capital for clients through an active approach and an investment platform built on nearly a century of expertise. To make that long-term value meaningful for clients, we work to align with you on our beliefs, your needs and the time it takes to deliver on your desired outcomes.
Respectfully,

Robert J. Manning
Executive Chairman
MFS Investment Management
June 18, 2018
The opinions expressed in this letter are subject to change and may not be relied upon for investment advice. No forecasts can be guaranteed.
1
Table of Contents
2
Table of Contents
Portfolio Composition – continued
| (a) | For all securities other than those specifically described below, ratings are assigned to underlying securities utilizing ratings from Moody’s, Fitch, and Standard & Poor’s rating agencies and applying the following hierarchy: If all three agencies provide a rating, the middle rating (after dropping the highest and lowest ratings) is assigned; if two of the three agencies rate a security, the lower of the two is assigned. Ratings are shown in the S&P and Fitch scale (e.g., AAA). Securities rated BBB or higher are considered investment grade. All ratings are subject to change. Not Rated includes fixed income securities and fixed income futures contracts, which have not been rated by any rating agency. Non-Fixed Income includes equity securities (including convertible bonds and equity derivatives) and commodities. The fund may or may not have held all of these instruments on this date. The fund is not rated by these agencies. |
| (i) | For purposes of this presentation, the components include the value of securities, and reflect the impact of the equivalent exposure of derivative positions, if any. These amounts may be negative from time to time. Equivalent exposure is a calculated amount that translates the derivative position into a reasonable approximation of the amount of the underlying asset that the portfolio would have to hold at a given point in time to have the same price sensitivity that results from the portfolio’s ownership of the derivative contract. When dealing with derivatives, equivalent exposure is a more representative measure of the potential impact of a position on portfolio performance than value. The bond component will include any accrued interest amounts. |
| (o) | Less than 0.1%. |
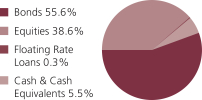
Where the fund holds convertible bonds, they are treated as part of the equity portion of the portfolio.
Cash & Cash Equivalents includes any cash, investments in money market funds, short-term securities, and other assets less liabilities. Please see the Statement of Assets and Liabilities for additional information related to the fund’s cash position and other assets and liabilities.
Percentages are based on net assets as of April 30, 2018.
The portfolio is actively managed and current holdings may be different.
3
Table of Contents
| Portfolio Manager | Primary Role | Since | Title and Five Year History | |||
| William Adams | Below Investment Grade Debt Instruments Portfolio Manager |
2011 | Investment Officer of MFS; employed in the investment management area of MFS since 2009. | |||
| Ward Brown | Emerging Markets Debt Instruments Portfolio Manager |
2012 | Investment Officer of MFS; employed in the investment management area of MFS since 2005. | |||
| Nevin Chitkara | Equity Securities Portfolio Manager |
2012 | Investment Officer of MFS; employed in the investment management area of MFS since 1997. | |||
| David Cole | Below Investment Grade Debt Instruments Portfolio Manager |
2006 | Investment Officer of MFS; employed in the investment management area of MFS since 2004. | |||
| Matt Ryan | Emerging Markets Debt Instruments Portfolio Manager |
2012 | Investment Officer of MFS; employed in the investment management area of MFS since 1997. | |||
| Michael Skatrud | Below Investment Grade Debt Instruments Portfolio Manager |
2018 |
Investment Officer of MFS; employed in the investment management area of MFS since 2013. | |||
Note to Shareholders: Effective March 1, 2018, Michael Skatrud became a Portfolio Manager of the Fund. Effective September 1, 2018, William Adams will no longer be a Portfolio Manager of the Fund.
4
Table of Contents
The fund’s shares may trade at a discount or premium to net asset value. When fund shares trade at a premium, buyers pay more than the net asset value underlying fund shares, and shares purchased at a premium would receive less than the amount paid for them in the event of the fund’s concurrent liquidation.
The fund’s monthly distributions may include a return of capital to shareholders to the extent that the fund’s net investment income and net capital gains, determined in accordance with federal income tax regulations, are insufficient to meet the fund’s target annual distribution rate. Distributions that are treated for federal income tax purposes as a return of capital will reduce each shareholder’s basis in his or her shares and, to the extent the return of capital exceeds such basis, will be treated as gain to the shareholder from a sale of shares. It may also result in a recharacterization of what economically represents a return of capital to ordinary income in those situations where a fund has long term capital gains and a capital loss carryforward. Returns of shareholder capital may have the effect of reducing the fund’s assets and increasing the fund’s expense ratio.
The fund’s target annual distribution rate is calculated based on an annual rate of 10.00% of the fund’s average monthly net asset value, not a fixed share price, and the fund’s dividend amount will fluctuate with changes in the fund’s average monthly net assets.
In accordance with Section 23(c) of the Investment Company Act of 1940, the fund hereby gives notice that it may from time to time repurchase shares of the fund in the open market at the option of the Board of Trustees and on such terms as the Trustees shall determine.
5
Table of Contents
4/30/18 (unaudited)
The Portfolio of Investments is a complete list of all securities owned by your fund. It is categorized by broad-based asset classes.
| Bonds - 54.8% | ||||||||
| Issuer | Shares/Par | Value ($) | ||||||
| Aerospace - 1.1% | ||||||||
| Dae Funding LLC, 5%, 8/01/2024 (n) | $ | 135,000 | $ | 130,113 | ||||
| KLX, Inc., 5.875%, 12/01/2022 (n) | 120,000 | 125,250 | ||||||
| TransDigm, Inc., 6.5%, 7/15/2024 | 125,000 | 127,109 | ||||||
| TransDigm, Inc., 6.375%, 6/15/2026 | 65,000 | 65,325 | ||||||
|
|
|
|||||||
| $ | 447,797 | |||||||
| Asset-Backed & Securitized - 0.0% | ||||||||
| Morgan Stanley Capital I, Inc., 1.493%, 4/28/2039 (i)(z) | $ | 40,778 | $ | 61 | ||||
| Broadcasting - 2.1% | ||||||||
| Liberty Media Corp. - Liberty Formula One, 8.5%, 7/15/2029 | $ | 110,000 | $ | 118,525 | ||||
| Liberty Media Corp. - Liberty Formula One, 8.25%, 2/01/2030 | 50,000 | 53,750 | ||||||
| Match Group, Inc., 6.375%, 6/01/2024 | 105,000 | 110,775 | ||||||
| Meredith Corp., 6.875%, 2/01/2026 (n) | 95,000 | 96,064 | ||||||
| Netflix, Inc., 5.875%, 2/15/2025 | 60,000 | 61,632 | ||||||
| Netflix, Inc., 4.375%, 11/15/2026 | 40,000 | 37,388 | ||||||
| Netflix, Inc., 4.875%, 4/15/2028 (n) | 25,000 | 23,594 | ||||||
| Netflix, Inc., 5.875%, 11/15/2028 (n) | 100,000 | 99,750 | ||||||
| Sinclair Broadcast Group, Inc., 5.125%, 2/15/2027 (n) | 125,000 | 115,937 | ||||||
| WMG Acquisition Corp., 5%, 8/01/2023 (n) | 30,000 | 29,812 | ||||||
| WMG Acquisition Corp., 4.875%, 11/01/2024 (n) | 95,000 | 93,100 | ||||||
| WMG Acquisition Corp., 5.5%, 4/15/2026 (n) | 15,000 | 15,075 | ||||||
|
|
|
|||||||
| $ | 855,402 | |||||||
| Building - 2.1% | ||||||||
| ABC Supply Co., Inc., 5.75%, 12/15/2023 (n) | $ | 105,000 | $ | 108,250 | ||||
| Beacon Escrow Corp., 4.875%, 11/01/2025 (n) | 60,000 | 56,700 | ||||||
| Beacon Roofing Supply, Inc., 6.375%, 10/01/2023 | 95,000 | 99,512 | ||||||
| Gibraltar Industries, Inc., 6.25%, 2/01/2021 | 95,000 | 96,510 | ||||||
| New Enterprise Stone & Lime Co, Inc., 10.125%, 4/01/2022 (n) | 90,000 | 95,850 | ||||||
| New Enterprise Stone & Lime Co., Inc., 6.25%, 3/15/2026 (n) | 50,000 | 50,625 | ||||||
| PriSo Acquisition Corp., 9%, 5/15/2023 (n) | 80,000 | 83,600 | ||||||
| Standard Industries, Inc., 5.375%, 11/15/2024 (n) | 95,000 | 96,247 | ||||||
| Standard Industries, Inc., 6%, 10/15/2025 (n) | 65,000 | 67,438 | ||||||
| Summit Materials LLC/Summit Materials Finance Co., 6.125%, 7/15/2023 | 105,000 | 107,331 | ||||||
|
|
|
|||||||
| $ | 862,063 | |||||||
6
Table of Contents
Portfolio of Investments (unaudited) – continued
| Issuer | Shares/Par | Value ($) | ||||||
| Bonds - continued | ||||||||
| Business Services - 2.2% | ||||||||
| Alliance Data Systems Corp., 5.875%, 11/01/2021 (n) | $ | 100,000 | $ | 101,750 | ||||
| Alliance Data Systems Corp., 5.375%, 8/01/2022 (n) | 55,000 | 55,275 | ||||||
| Ascend Learning LLC, 6.875%, 8/01/2025 (n) | 70,000 | 71,225 | ||||||
| CDK Global, Inc., 4.875%, 6/01/2027 | 155,000 | 149,962 | ||||||
| Equinix, Inc., 5.375%, 1/01/2022 | 25,000 | 25,781 | ||||||
| Equinix, Inc., 5.375%, 4/01/2023 | 35,000 | 35,963 | ||||||
| Equinix, Inc., 5.875%, 1/15/2026 | 60,000 | 62,100 | ||||||
| First Data Corp., 5%, 1/15/2024 (n) | 190,000 | 191,425 | ||||||
| MSCI, Inc., 4.75%, 8/01/2026 (n) | 90,000 | 89,177 | ||||||
| Travelport Worldwide Ltd., 6%, 3/15/2026 (n) | 90,000 | 92,025 | ||||||
|
|
|
|||||||
| $ | 874,683 | |||||||
| Cable TV - 3.5% | ||||||||
| Altice Financing S.A., 6.625%, 2/15/2023 (n) | $ | 200,000 | $ | 200,000 | ||||
| CCO Holdings LLC/CCO Holdings Capital Corp., 5.125%, 5/01/2023 (n) | 155,000 | 155,728 | ||||||
| CCO Holdings LLC/CCO Holdings Capital Corp., 5.75%, 1/15/2024 | 160,000 | 161,504 | ||||||
| CCO Holdings LLC/CCO Holdings Capital Corp., 5.375%, 5/01/2025 (n) | 25,000 | 24,578 | ||||||
| CCO Holdings LLC/CCO Holdings Capital Corp., 5.75%, 2/15/2026 (n) | 80,000 | 79,400 | ||||||
| CCO Holdings LLC/CCO Holdings Capital Corp., 5.875%, 5/01/2027 (n) | 45,000 | 43,988 | ||||||
| DISH DBS Corp., 5%, 3/15/2023 | 60,000 | 51,975 | ||||||
| DISH DBS Corp., 5.875%, 11/15/2024 | 45,000 | 38,306 | ||||||
| Intelsat Jackson Holdings S.A., 5.5%, 8/01/2023 | 70,000 | 58,800 | ||||||
| Intelsat Jackson Holdings S.A., 8%, 2/15/2024 (n) | 20,000 | 21,125 | ||||||
| Sirius XM Radio, Inc., 4.625%, 5/15/2023 (n) | 85,000 | 83,937 | ||||||
| Sirius XM Radio, Inc., 6%, 7/15/2024 (n) | 60,000 | 61,662 | ||||||
| Sirius XM Radio, Inc., 5.375%, 4/15/2025 (n) | 45,000 | 44,775 | ||||||
| Unitymedia KabelBW GmbH, 6.125%, 1/15/2025 (n) | 200,000 | 210,000 | ||||||
| Videotron Ltd., 5.375%, 6/15/2024 (n) | 25,000 | 25,688 | ||||||
| Videotron Ltd., 5.125%, 4/15/2027 (n) | 155,000 | 151,900 | ||||||
|
|
|
|||||||
| $ | 1,413,366 | |||||||
| Chemicals - 0.7% | ||||||||
| OCI N.V., 6.625%, 4/15/2023 (n) | $ | 200,000 | $ | 202,800 | ||||
| PolyOne Corp., 5.25%, 3/15/2023 | 90,000 | 92,137 | ||||||
|
|
|
|||||||
| $ | 294,937 | |||||||
| Computer Software - 0.7% | ||||||||
| Diamond 1 Finance Corp./Diamond 2 Finance Corp., 5.875%, 6/15/2021 (n) | $ | 85,000 | $ | 87,451 | ||||
| Diamond 1 Finance Corp./Diamond 2 Finance Corp., 6.02%, 6/15/2026 (n) | 45,000 | 47,725 | ||||||
| VeriSign, Inc., 4.625%, 5/01/2023 | 30,000 | 30,075 | ||||||
| VeriSign, Inc., 5.25%, 4/01/2025 | 85,000 | 87,231 | ||||||
7
Table of Contents
Portfolio of Investments (unaudited) – continued
| Issuer | Shares/Par | Value ($) | ||||||
| Bonds - continued | ||||||||
| Computer Software - continued | ||||||||
| VeriSign, Inc., 4.75%, 7/15/2027 | $ | 27,000 | $ | 25,886 | ||||
|
|
|
|||||||
| $ | 278,368 | |||||||
| Computer Software - Systems - 0.6% | ||||||||
| CDW LLC/CDW Finance Corp., 5%, 9/01/2025 | $ | 25,000 | $ | 24,905 | ||||
| JDA Software Group, Inc., 7.375%, 10/15/2024 (n) | 85,000 | 88,188 | ||||||
| Sabre GLBL, Inc., 5.375%, 4/15/2023 (n) | 115,000 | 116,115 | ||||||
|
|
|
|||||||
| $ | 229,208 | |||||||
| Conglomerates - 2.3% | ||||||||
| Amsted Industries Co., 5%, 3/15/2022 (n) | $ | 135,000 | $ | 134,748 | ||||
| Apergy Corp, 6.375%, 5/01/2026 (n) | 40,000 | 40,600 | ||||||
| Apex Tool Group LLC, 9%, 2/15/2023 (n) | 95,000 | 92,625 | ||||||
| EnerSys, 5%, 4/30/2023 (n) | 155,000 | 155,775 | ||||||
| Enpro Industries, Inc., 5.875%, 9/15/2022 | 130,000 | 133,900 | ||||||
| Entegris, Inc., 4.625%, 2/10/2026 (n) | 100,000 | 96,500 | ||||||
| Gates Global LLC, 6%, 7/15/2022 (n) | 48,000 | 48,600 | ||||||
| SPX FLOW, Inc., 5.625%, 8/15/2024 (n) | 105,000 | 106,312 | ||||||
| TriMas Corp., 4.875%, 10/15/2025 (n) | 110,000 | 105,875 | ||||||
|
|
|
|||||||
| $ | 914,935 | |||||||
| Construction - 0.5% | ||||||||
| Empresas ICA S.A.B. de C.V., 8.9%, 2/04/2021 (a)(d) | $ | 125,000 | $ | 19,438 | ||||
| Mattamy Group Corp., 6.5%, 10/01/2025 (n) | 85,000 | 84,787 | ||||||
| Toll Brothers Finance Corp., 4.875%, 11/15/2025 | 30,000 | 29,775 | ||||||
| Toll Brothers Finance Corp., 4.35%, 2/15/2028 | 95,000 | 87,875 | ||||||
|
|
|
|||||||
| $ | 221,875 | |||||||
| Consumer Products - 0.8% | ||||||||
| Coty, Inc., 6.5%, 4/15/2026 (n) | $ | 115,000 | $ | 111,838 | ||||
| Prestige Brands, Inc., 6.375%, 3/01/2024 (n) | 110,000 | 110,550 | ||||||
| Spectrum Brands, Inc., 6.125%, 12/15/2024 | 10,000 | 10,150 | ||||||
| Spectrum Brands, Inc., 5.75%, 7/15/2025 | 105,000 | 104,900 | ||||||
|
|
|
|||||||
| $ | 337,438 | |||||||
| Consumer Services - 1.2% | ||||||||
| Interval Acquisition Corp., 5.625%, 4/15/2023 | $ | 130,000 | $ | 135,525 | ||||
| Matthews International Corp., 5.25%, 12/01/2025 (n) | 80,000 | 78,400 | ||||||
| Service Corp. International, 4.625%, 12/15/2027 | 75,000 | 73,335 | ||||||
| ServiceMaster Co. LLC, 5.125%, 11/15/2024 (n) | 105,000 | 102,270 | ||||||
| West Corp., 8.5%, 10/15/2025 (n) | 110,000 | 106,150 | ||||||
|
|
|
|||||||
| $ | 495,680 | |||||||
| Containers - 2.5% | ||||||||
| Berry Global Group, Inc., 5.5%, 5/15/2022 | $ | 125,000 | $ | 128,204 | ||||
| Berry Global Group, Inc., 6%, 10/15/2022 | 30,000 | 31,238 | ||||||
8
Table of Contents
Portfolio of Investments (unaudited) – continued
| Issuer | Shares/Par | Value ($) | ||||||
| Bonds - continued | ||||||||
| Containers - continued | ||||||||
| Berry Global Group, Inc., 5.125%, 7/15/2023 | $ | 50,000 | $ | 50,312 | ||||
| Crown Americas LLC/Crown Americas Capital Corp., 4.75%, 2/01/2026 (n) | 25,000 | 24,125 | ||||||
| Crown Americas LLC/Crown Americas Capital Corp. V, 4.25%, 9/30/2026 | 55,000 | 50,944 | ||||||
| Flex Acquisition Co., Inc., 6.875%, 1/15/2025 (n) | 70,000 | 70,350 | ||||||
| Multi-Color Corp., 6.125%, 12/01/2022 (n) | 123,000 | 126,690 | ||||||
| Reynolds Group, 5.75%, 10/15/2020 | 48,456 | 48,819 | ||||||
| Reynolds Group, 5.125%, 7/15/2023 (n) | 70,000 | 70,437 | ||||||
| Reynolds Group, 7%, 7/15/2024 (n) | 70,000 | 72,887 | ||||||
| Sealed Air Corp., 4.875%, 12/01/2022 (n) | 115,000 | 116,725 | ||||||
| Sealed Air Corp., 5.125%, 12/01/2024 (n) | 25,000 | 25,375 | ||||||
| Sealed Air Corp., 5.5%, 9/15/2025 (n) | 25,000 | 25,844 | ||||||
| Silgan Holdings, Inc., 5.5%, 2/01/2022 | 10,000 | 10,150 | ||||||
| Silgan Holdings, Inc., 4.75%, 3/15/2025 | 85,000 | 82,246 | ||||||
| W/S Packaging Group, Inc., 9%, 4/15/2023 (n) | 70,000 | 71,575 | ||||||
|
|
|
|||||||
| $ | 1,005,921 | |||||||
| Electrical Equipment - 0.4% | ||||||||
| CommScope Tech LLC, 5%, 3/15/2027 (n) | $ | 175,000 | $ | 167,562 | ||||
| Electronics - 0.4% | ||||||||
| Sensata Technologies B.V., 5.625%, 11/01/2024 (n) | $ | 40,000 | $ | 41,500 | ||||
| Sensata Technologies B.V., 5%, 10/01/2025 (n) | 130,000 | 129,675 | ||||||
|
|
|
|||||||
| $ | 171,175 | |||||||
| Emerging Market Sovereign - 0.7% | ||||||||
| Republic of Ecuador, 10.5%, 3/24/2020 (n) | $ | 200,000 | $ | 206,000 | ||||
| Republic of Venezuela, 7%, 3/31/2038 (d) | 203,000 | 59,885 | ||||||
|
|
|
|||||||
| $ | 265,885 | |||||||
| Energy - Independent - 4.1% | ||||||||
| Afren PLC, 11.5%, 2/01/2016 (a)(d)(z) | $ | 195,167 | $ | 488 | ||||
| Alta Mesa Holdings LP/Alta Mesa Finance Services Corp., 7.875%, 12/15/2024 | 145,000 | 150,075 | ||||||
| CrownRock LP/CrownRock Finance, Inc., 5.625%, 10/15/2025 (n) | 110,000 | 108,625 | ||||||
| Diamondback Energy, Inc., 5.375%, 5/31/2025 | 145,000 | 146,812 | ||||||
| Diamondback Energy, Inc., 5.375%, 5/31/2025 (n) | 40,000 | 40,550 | ||||||
| Gulfport Energy Corp., 6%, 10/15/2024 | 125,000 | 118,750 | ||||||
| Gulfport Energy Corp., 6.375%, 5/15/2025 | 35,000 | 33,589 | ||||||
| Indigo Natural Resources LLC, 6.875%, 2/15/2026 (n) | 110,000 | 105,600 | ||||||
| Parsley Energy LLC/Parsley Finance Corp., 5.625%, 10/15/2027 (n) | 145,000 | 146,812 | ||||||
| PDC Energy, Inc., 6.125%, 9/15/2024 | 130,000 | 133,250 | ||||||
9
Table of Contents
Portfolio of Investments (unaudited) – continued
| Issuer | Shares/Par | Value ($) | ||||||
| Bonds - continued | ||||||||
| Energy - Independent - continued | ||||||||
| QEP Resources, Inc., 5.25%, 5/01/2023 | $ | 120,000 | $ | 117,000 | ||||
| QEP Resources, Inc., 5.625%, 3/01/2026 | 85,000 | 81,388 | ||||||
| Sanchez Energy Corp., 6.125%, 1/15/2023 | 45,000 | 32,499 | ||||||
| Seven Generations Energy, 6.75%, 5/01/2023 (n) | 105,000 | 108,938 | ||||||
| Seven Generations Energy, 5.375%, 9/30/2025 (n) | 55,000 | 53,488 | ||||||
| SM Energy Co., 6.75%, 9/15/2026 | 120,000 | 122,100 | ||||||
| SRC Energy, Inc., 6.25%, 12/01/2025 (n) | 90,000 | 90,900 | ||||||
| WPX Energy, Inc., 6%, 1/15/2022 | 66,000 | 68,805 | ||||||
|
|
|
|||||||
| $ | 1,659,669 | |||||||
| Entertainment - 1.0% | ||||||||
| Cedar Fair LP, 5.375%, 6/01/2024 | $ | 35,000 | $ | 35,438 | ||||
| Cedar Fair LP, 5.375%, 4/15/2027 (n) | 70,000 | 69,650 | ||||||
| Cinemark USA, Inc., 5.125%, 12/15/2022 | 50,000 | 50,812 | ||||||
| Cinemark USA, Inc., 4.875%, 6/01/2023 | 35,000 | 34,563 | ||||||
| Live Nation Entertainment, Inc., 5.625%, 3/15/2026 (n) | 70,000 | 69,825 | ||||||
| Six Flags Entertainment Corp., 4.875%, 7/31/2024 (n) | 165,000 | 161,238 | ||||||
|
|
|
|||||||
| $ | 421,526 | |||||||
| Financial Institutions - 1.1% | ||||||||
| Aircastle Ltd., 5.125%, 3/15/2021 | $ | 40,000 | $ | 41,050 | ||||
| Aircastle Ltd., 5.5%, 2/15/2022 | 40,000 | 41,800 | ||||||
| Navient Corp., 7.25%, 1/25/2022 | 100,000 | 105,750 | ||||||
| Navient Corp., 7.25%, 9/25/2023 | 75,000 | 78,375 | ||||||
| Park Aerospace Holdings Ltd., 5.5%, 2/15/2024 (n) | 175,000 | 169,969 | ||||||
|
|
|
|||||||
| $ | 436,944 | |||||||
| Food & Beverages - 2.0% | ||||||||
| Aramark Services, Inc., 4.75%, 6/01/2026 | $ | 80,000 | $ | 77,600 | ||||
| Aramark Services, Inc., 5%, 2/01/2028 (n) | 60,000 | 58,425 | ||||||
| Cott Holdings, Inc., 5.5%, 4/01/2025 (n) | 110,000 | 109,175 | ||||||
| JBS USA LLC/JBS USA Finance, Inc., 6.75%, 2/15/2028 (n) | 30,000 | 28,800 | ||||||
| JBS USA Lux S.A./JBS USA Finance, Inc., 5.875%, 7/15/2024 (n) | 95,000 | 92,150 | ||||||
| Lamb Weston Holdings, Inc., 4.625%, 11/01/2024 (n) | 65,000 | 64,431 | ||||||
| Lamb Weston Holdings, Inc., 4.875%, 11/01/2026 (n) | 40,000 | 39,650 | ||||||
| Pilgrim’s Pride Corp., 5.875%, 9/30/2027 (n) | 120,000 | 114,600 | ||||||
| Pinnacle Foods Finance LLC/Pinnacle Foods Finance Corp., 5.875%, 1/15/2024 | 105,000 | 108,150 | ||||||
| U.S. Foods Holding Corp., 5.875%, 6/15/2024 (n) | 110,000 | 111,925 | ||||||
|
|
|
|||||||
| $ | 804,906 | |||||||
| Forest & Paper Products - 0.0% | ||||||||
| Appvion, Inc., 9%, 6/01/2020 (d)(n) | $ | 41,000 | $ | 4 | ||||
10
Table of Contents
Portfolio of Investments (unaudited) – continued
| Issuer | Shares/Par | Value ($) | ||||||
| Bonds - continued | ||||||||
| Gaming & Lodging - 2.3% | ||||||||
| CCM Merger, Inc., 6%, 3/15/2022 (n) | $ | 85,000 | $ | 86,488 | ||||
| GLP Capital LP/GLP Financing II, Inc., 5.375%, 11/01/2023 | 95,000 | 98,206 | ||||||
| GLP Capital LP/GLP Financing II, Inc., 5.375%, 4/15/2026 | 10,000 | 10,075 | ||||||
| Hilton Domestic Operating Co., Inc., 5.125%, 5/01/2026 (n) | 90,000 | 90,000 | ||||||
| Hilton Worldwide Finance LLC, 4.625%, 4/01/2025 | 105,000 | 101,829 | ||||||
| MGM Resorts International, 6.625%, 12/15/2021 | 90,000 | 96,300 | ||||||
| Ryman Hospitality Properties, Inc., REIT, 5%, 4/15/2021 | 105,000 | 105,656 | ||||||
| Ryman Hospitality Properties, Inc., REIT, 5%, 4/15/2023 | 50,000 | 50,125 | ||||||
| Wyndham Hotels Group, LLC, 5.375%, 4/15/2026 (n) | 80,000 | 80,600 | ||||||
| Wynn Macau Ltd., 5.5%, 10/01/2027 (n) | 200,000 | 194,002 | ||||||
|
|
|
|||||||
| $ | 913,281 | |||||||
| Industrial - 0.6% | ||||||||
| Cleaver Brooks, Inc., 7.875%, 3/01/2023 (n) | $ | 120,000 | $ | 123,900 | ||||
| KAR Auction Services, Inc., 5.125%, 6/01/2025 (n) | 120,000 | 116,400 | ||||||
|
|
|
|||||||
| $ | 240,300 | |||||||
| Insurance - 0.2% | ||||||||
| AssuredPartners Inc., 7%, 8/15/2025 (n) | $ | 75,000 | $ | 74,063 | ||||
| Insurance - Health - 0.2% | ||||||||
| Centene Corp., 5.625%, 2/15/2021 | $ | 35,000 | $ | 35,919 | ||||
| Centene Corp., 6.125%, 2/15/2024 | 60,000 | 62,850 | ||||||
|
|
|
|||||||
| $ | 98,769 | |||||||
| Insurance - Property & Casualty - 0.3% | ||||||||
| Hub International Holdings, Inc., 7.875%, 10/01/2021 (n) | $ | 60,000 | $ | 62,532 | ||||
| Hub International Ltd., 7%, 5/01/2026 (n) | 40,000 | 40,050 | ||||||
|
|
|
|||||||
| $ | 102,582 | |||||||
| Major Banks - 0.2% | ||||||||
| Bank of America Corp., 5.875% to 3/15/2028, FLR to 12/31/2059 | $ | 90,000 | $ | 89,820 | ||||
| Medical & Health Technology & Services - 3.2% | ||||||||
| DaVita, Inc., 5.125%, 7/15/2024 | $ | 30,000 | $ | 29,063 | ||||
| DaVita, Inc., 5%, 5/01/2025 | 80,000 | 75,816 | ||||||
| HCA, Inc., 7.5%, 2/15/2022 | 135,000 | 148,500 | ||||||
| HCA, Inc., 5%, 3/15/2024 | 90,000 | 91,012 | ||||||
| HCA, Inc., 5.375%, 2/01/2025 | 60,000 | 59,700 | ||||||
| HealthSouth Corp., 5.125%, 3/15/2023 | 105,000 | 106,575 | ||||||
| Heartland Dental, LLC, 8.5%, 5/01/2026 (n) | 75,000 | 75,169 | ||||||
| NVA Holdings, Inc., 6.875%, 4/01/2026 (n) | 35,000 | 35,263 | ||||||
| Polaris, 8.5%, 12/01/2022 (n) | 85,000 | 86,275 | ||||||
| Quorum Health Corp., 11.625%, 4/15/2023 | 65,000 | 69,062 | ||||||
11
Table of Contents
Portfolio of Investments (unaudited) – continued
| Issuer | Shares/Par | Value ($) | ||||||
| Bonds - continued | ||||||||
| Medical & Health Technology & Services - continued | ||||||||
| Tenet Healthcare Corp., 8.125%, 4/01/2022 | $ | 140,000 | $ | 145,775 | ||||
| Tenet Healthcare Corp., 6.75%, 6/15/2023 | 60,000 | 58,988 | ||||||
| THC Escrow Corp. III, 5.125%, 5/01/2025 (n) | 85,000 | 82,662 | ||||||
| Universal Health Services, Inc., 7.625%, 8/15/2020 | 155,000 | 156,162 | ||||||
| West Street Merger Sub, Inc., 6.375%, 9/01/2025 (n) | 70,000 | 68,775 | ||||||
|
|
|
|||||||
| $ | 1,288,797 | |||||||
| Medical Equipment - 0.4% | ||||||||
| Teleflex, Inc., 5.25%, 6/15/2024 | $ | 80,000 | $ | 81,200 | ||||
| Teleflex, Inc., 4.875%, 6/01/2026 | 30,000 | 29,580 | ||||||
| Teleflex, Inc. , 4.625%, 11/15/2027 | 45,000 | 42,975 | ||||||
|
|
|
|||||||
| $ | 153,755 | |||||||
| Metals & Mining - 3.7% | ||||||||
| First Quantum Minerals Ltd., 7%, 2/15/2021 (n) | $ | 50,000 | $ | 50,112 | ||||
| First Quantum Minerals Ltd., 7.25%, 4/01/2023 (n) | 200,000 | 199,460 | ||||||
| Freeport-McMoRan Copper & Gold, Inc., 3.875%, 3/15/2023 | 45,000 | 43,144 | ||||||
| Freeport-McMoRan Copper & Gold, Inc., 5.4%, 11/14/2034 | 40,000 | 36,900 | ||||||
| Freeport-McMoRan, Inc., 6.875%, 2/15/2023 | 198,000 | 212,355 | ||||||
| Kaiser Aluminum Corp., 5.875%, 5/15/2024 | 155,000 | 159,650 | ||||||
| Kinross Gold Corp., 5.95%, 3/15/2024 | 26,000 | 27,105 | ||||||
| Kinross Gold Corp., 4.5%, 7/15/2027 (n) | 13,000 | 12,220 | ||||||
| Lundin Mining Corp., 7.875%, 11/01/2022 (n) | 85,000 | 89,223 | ||||||
| Northwest Acquisitions ULC/Dominion Finco, Inc., 7.125%, 11/01/2022 (n) | 115,000 | 117,104 | ||||||
| Novelis Corp., 5.875%, 9/30/2026 (n) | 140,000 | 138,950 | ||||||
| Petra Diamonds U.S. Treasury PLC, 7.25%, 5/01/2022 (n) | 200,000 | 199,900 | ||||||
| Steel Dynamics, Inc., 5.125%, 10/01/2021 | 45,000 | 45,801 | ||||||
| Steel Dynamics, Inc., 5.5%, 10/01/2024 | 80,000 | 82,200 | ||||||
| TMS International Corp., 7.25%, 8/15/2025 (n) | 75,000 | 77,625 | ||||||
|
|
|
|||||||
| $ | 1,491,749 | |||||||
| Midstream - 2.4% | ||||||||
| Blue Racer Midstream LLC/Blue Racer Finance Corp., 6.125%, 11/15/2022 (n) | $ | 140,000 | $ | 143,500 | ||||
| DCP Midstream LLC, 3.875%, 3/15/2023 | 85,000 | 82,025 | ||||||
| DCP Midstream LP, 4.95%, 4/01/2022 | 43,000 | 43,645 | ||||||
| DCP Midstream LP, 5.6%, 4/01/2044 | 45,000 | 44,100 | ||||||
| Energy Transfer Equity LP, 5.875%, 1/15/2024 | 115,000 | 117,444 | ||||||
| Energy Transfer Equity LP, 5.5%, 6/01/2027 | 30,000 | 30,000 | ||||||
| Tallgrass Energy GP, LP, 5.5%, 1/15/2028 (n) | 195,000 | 194,512 | ||||||
| Targa Resources Partners LP/Targa Resources Finance Corp, 5.375%, 2/01/2027 | 200,000 | 191,500 | ||||||
| Targa Resources Partners LP/Targa Resources Finance Corp., 5.25%, 5/01/2023 | 75,000 | 74,813 | ||||||
12
Table of Contents
Portfolio of Investments (unaudited) – continued
| Issuer | Shares/Par | Value ($) | ||||||
| Bonds - continued | ||||||||
| Midstream - continued | ||||||||
| Targa Resources Partners LP/Targa Resources Finance Corp., 5.125%, 2/01/2025 (n) | $ | 40,000 | $ | 38,800 | ||||
|
|
|
|||||||
| $ | 960,339 | |||||||
| Network & Telecom - 0.4% | ||||||||
| Zayo Group LLC/Zayo Capital, Inc., 6.375%, 5/15/2025 | $ | 60,000 | $ | 62,112 | ||||
| Zayo Group LLC/Zayo Capital, Inc., 5.75%, 1/15/2027 (n) | 110,000 | 109,217 | ||||||
|
|
|
|||||||
| $ | 171,329 | |||||||
| Oil Services - 1.2% | ||||||||
| Bristow Group, Inc., 6.25%, 10/15/2022 | $ | 165,000 | $ | 136,125 | ||||
| Diamond Offshore Drill Co., 7.875%, 8/15/2025 | 45,000 | 46,181 | ||||||
| Diamond Offshore Drill Co., 5.7%, 10/15/2039 | 140,000 | 109,200 | ||||||
| Ensco PLC, 7.75%, 2/01/2026 | 90,000 | 84,825 | ||||||
| Trinidad Drilling Ltd., 6.625%, 2/15/2025 (n) | 120,000 | 115,050 | ||||||
|
|
|
|||||||
| $ | 491,381 | |||||||
| Oils - 0.3% | ||||||||
| Parkland Fuel Corp., 6%, 4/01/2026 (n) | $ | 115,000 | $ | 115,000 | ||||
| Pharmaceuticals - 0.7% | ||||||||
| Mallinckrodt International Finance S.A., 5.75%, 8/01/2022 (n) | $ | 85,000 | $ | 70,762 | ||||
| Mallinckrodt International Finance S.A., 5.625%, 10/15/2023 (n) | 30,000 | 23,475 | ||||||
| Valeant Pharmaceuticals International, Inc., 5.5%, 3/01/2023 (n) | 90,000 | 81,225 | ||||||
| Valeant Pharmaceuticals International, Inc., 6.125%, 4/15/2025 (n) | 105,000 | 94,707 | ||||||
|
|
|
|||||||
| $ | 270,169 | |||||||
| Precious Metals & Minerals - 0.2% | ||||||||
| Teck Resources Ltd., 6%, 8/15/2040 | $ | 15,000 | $ | 15,637 | ||||
| Teck Resources Ltd., 6.25%, 7/15/2041 | 80,000 | 84,800 | ||||||
|
|
|
|||||||
| $ | 100,437 | |||||||
| Printing & Publishing - 0.2% | ||||||||
| Nielsen Finance LLC, 5%, 4/15/2022 (n) | $ | 71,000 | $ | 71,540 | ||||
| Real Estate - Healthcare - 0.5% | ||||||||
| MPT Operating Partnership LP/MPT Financial Co., REIT, 5.25%, 8/01/2026 | $ | 100,000 | $ | 97,000 | ||||
| MPT Operating Partnership LP/MPT Financial Co., REIT, 5%, 10/15/2027 | 120,000 | 113,700 | ||||||
|
|
|
|||||||
| $ | 210,700 | |||||||
13
Table of Contents
Portfolio of Investments (unaudited) – continued
| Issuer | Shares/Par | Value ($) | ||||||
| Bonds - continued | ||||||||
| Real Estate - Other - 0.5% | ||||||||
| CyrusOne LP/CyrusOne Finance Corp., REIT, 5%, 3/15/2024 | $ | 120,000 | $ | 120,300 | ||||
| CyrusOne LP/CyrusOne Finance Corp., REIT, 5.375%, 3/15/2027 | 60,000 | 60,000 | ||||||
| Starwood Property Trust, Inc., 5%, 12/15/2021 | 10,000 | 10,120 | ||||||
| Starwood Property Trust, Inc., 4.75%, 3/15/2025 (n) | 10,000 | 9,625 | ||||||
|
|
|
|||||||
| $ | 200,045 | |||||||
| Restaurants - 0.7% | ||||||||
| Golden Nugget, Inc., 6.75%, 10/15/2024 (n) | $ | 85,000 | $ | 86,275 | ||||
| IRB Holding Corp. , 6.75%, 2/15/2026 (n) | 75,000 | 72,375 | ||||||
| KFC Holding Co./Pizza Hut Holdings LLC/Taco Bell of America LLC, 5.25%, 6/01/2026 (n) | 115,000 | 115,575 | ||||||
|
|
|
|||||||
| $ | 274,225 | |||||||
| Retailers - 0.3% | ||||||||
| Hanesbrands, Inc., 4.625%, 5/15/2024 (n) | $ | 25,000 | $ | 24,125 | ||||
| Hanesbrands, Inc., 4.875%, 5/15/2026 (n) | 105,000 | 100,800 | ||||||
|
|
|
|||||||
| $ | 124,925 | |||||||
| Specialty Chemicals - 0.7% | ||||||||
| A Schulman, Inc., 6.875%, 6/01/2023 | $ | 95,000 | $ | 99,750 | ||||
| Univar USA, Inc., 6.75%, 7/15/2023 (n) | 180,000 | 185,400 | ||||||
|
|
|
|||||||
| $ | 285,150 | |||||||
| Specialty Stores - 0.2% | ||||||||
| Group 1 Automotive, Inc., 5%, 6/01/2022 | $ | 85,000 | $ | 85,238 | ||||
| Supermarkets - 0.2% | ||||||||
| Albertsons Cos. LLC/Safeway Co., 6.625%, 6/15/2024 | $ | 90,000 | $ | 83,813 | ||||
| Telecommunications - Wireless - 3.1% | ||||||||
| Altice Luxembourg S.A., 7.625%, 2/15/2025 (n) | $ | 200,000 | $ | 180,250 | ||||
| Digicel Group Ltd., 7.125%, 4/01/2022 (n) | 200,000 | 162,644 | ||||||
| SBA Communications Corp., REIT, 4%, 10/01/2022 (n) | 120,000 | 114,300 | ||||||
| SBA Communications Corp., REIT, 4.875%, 9/01/2024 | 30,000 | 28,838 | ||||||
| Sprint Corp., 7.875%, 9/15/2023 | 140,000 | 150,150 | ||||||
| Sprint Corp., 7.125%, 6/15/2024 | 125,000 | 129,531 | ||||||
| Sprint Corp., 7.625%, 3/01/2026 | 25,000 | 26,344 | ||||||
| Sprint Nextel Corp., 6%, 11/15/2022 | 185,000 | 188,931 | ||||||
| T-Mobile USA, Inc., 6.5%, 1/15/2024 | 75,000 | 78,562 | ||||||
| T-Mobile USA, Inc., 5.125%, 4/15/2025 | 60,000 | 60,450 | ||||||
| T-Mobile USA, Inc., 6.5%, 1/15/2026 | 70,000 | 74,397 | ||||||
| T-Mobile USA, Inc., 5.375%, 4/15/2027 | 50,000 | 50,563 | ||||||
|
|
|
|||||||
| $ | 1,244,960 | |||||||
14
Table of Contents
Portfolio of Investments (unaudited) – continued
| Issuer | Shares/Par | Value ($) | ||||||
| Bonds - continued | ||||||||
| Telephone Services - 0.4% | ||||||||
| Level 3 Financing, Inc., 5.375%, 1/15/2024 | $ | 50,000 | $ | 49,500 | ||||
| Level 3 Financing, Inc., 5.375%, 5/01/2025 | 100,000 | 98,470 | ||||||
|
|
|
|||||||
| $ | 147,970 | |||||||
| Transportation - Services - 0.2% | ||||||||
| Navios Maritime Holding, Inc., 7.375%, 1/15/2022 (n) | $ | 60,000 | $ | 45,375 | ||||
| Navios South American Logistics, Inc./Navios Logistics Finance (U.S.), Inc., 7.25%, 5/01/2022 | 50,000 | 48,000 | ||||||
|
|
|
|||||||
| $ | 93,375 | |||||||
| Utilities - Electric Power - 1.5% | ||||||||
| Calpine Corp., 5.5%, 2/01/2024 | $ | 120,000 | $ | 110,100 | ||||
| Calpine Corp., 5.75%, 1/15/2025 | 90,000 | 82,584 | ||||||
| Calpine Corp., 5.25%, 6/01/2026 (n) | 55,000 | 52,628 | ||||||
| Covanta Holding Corp., 6.375%, 10/01/2022 | 35,000 | 35,744 | ||||||
| Covanta Holding Corp., 5.875%, 3/01/2024 | 65,000 | 64,025 | ||||||
| Covanta Holding Corp., 5.875%, 7/01/2025 | 50,000 | 48,625 | ||||||
| NextEra Energy Operating Co., 4.25%, 9/15/2024 (n) | 105,000 | 101,325 | ||||||
| Pattern Energy Group, Inc., 5.875%, 2/01/2024 (n) | 115,000 | 117,300 | ||||||
|
|
|
|||||||
| $ | 612,331 | |||||||
| Total Bonds (Identified Cost, $22,830,559) | $ | 22,155,448 | ||||||
| Common Stocks - 38.6% | ||||||||
| Brokerage & Asset Managers - 3.3% | ||||||||
| BlackRock, Inc. | 1,058 | $ | 551,747 | |||||
| NASDAQ, Inc. | 8,870 | 783,399 | ||||||
|
|
|
|||||||
| $ | 1,335,146 | |||||||
| Business Services - 2.5% | ||||||||
| Accenture PLC, “A” | 4,235 | $ | 640,332 | |||||
| Equifax, Inc. | 3,342 | 374,471 | ||||||
|
|
|
|||||||
| $ | 1,014,803 | |||||||
| Cable TV - 1.5% | ||||||||
| Comcast Corp., “A” | 19,221 | $ | 603,347 | |||||
| Chemicals - 1.6% | ||||||||
| PPG Industries, Inc. | 5,980 | $ | 633,162 | |||||
| Construction - 1.7% | ||||||||
| Sherwin-Williams Co. | 1,895 | $ | 696,716 | |||||
15
Table of Contents
Portfolio of Investments (unaudited) – continued
| Issuer | Shares/Par | Value ($) | ||||||
| Common Stocks - continued | ||||||||
| Electrical Equipment - 1.2% | ||||||||
| Johnson Controls International PLC | 14,173 | $ | 480,040 | |||||
| Electronics - 1.6% | ||||||||
| Texas Instruments, Inc. | 6,597 | $ | 669,134 | |||||
| Food & Beverages - 1.3% | ||||||||
| Nestle S.A., ADR | 6,895 | $ | 533,397 | |||||
| Insurance - 3.3% | ||||||||
| Aon PLC | 4,808 | $ | 684,996 | |||||
| Travelers Cos., Inc. | 5,017 | 660,237 | ||||||
|
|
|
|||||||
| $ | 1,345,233 | |||||||
| Major Banks - 3.3% | ||||||||
| JPMorgan Chase & Co. | 8,010 | $ | 871,328 | |||||
| Wells Fargo & Co. | 9,146 | 475,226 | ||||||
|
|
|
|||||||
| $ | 1,346,554 | |||||||
| Medical Equipment - 4.5% | ||||||||
| Danaher Corp. | 5,447 | $ | 546,443 | |||||
| Medtronic PLC | 7,068 | 566,359 | ||||||
| Thermo Fisher Scientific, Inc. | 3,274 | 688,686 | ||||||
|
|
|
|||||||
| $ | 1,801,488 | |||||||
| Oil Services - 1.2% | ||||||||
| LTRI Holdings LP (a)(u) | 60 | $ | 53,365 | |||||
| Schlumberger Ltd. | 6,286 | 430,968 | ||||||
|
|
|
|||||||
| $ | 484,333 | |||||||
| Other Banks & Diversified Financials - 4.2% | ||||||||
| Citigroup, Inc. | 14,894 | $ | 1,016,813 | |||||
| U.S. Bancorp | 13,859 | 699,187 | ||||||
|
|
|
|||||||
| $ | 1,716,000 | |||||||
| Pharmaceuticals - 1.6% | ||||||||
| Johnson & Johnson | 5,084 | $ | 643,075 | |||||
| Printing & Publishing - 1.9% | ||||||||
| Moody’s Corp. | 4,692 | $ | 761,042 | |||||
| Tobacco - 1.2% | ||||||||
| Philip Morris International, Inc. | 5,781 | $ | 474,042 | |||||
16
Table of Contents
Portfolio of Investments (unaudited) – continued
| Issuer | Shares/Par | Value ($) | ||||||
| Common Stocks - continued | ||||||||
| Utilities - Electric Power - 2.7% | ||||||||
| Duke Energy Corp. | 8,187 | $ | 656,270 | |||||
| Southern Co. | 9,144 | 421,721 | ||||||
|
|
|
|||||||
| $ | 1,077,991 | |||||||
| Total Common Stocks (Identified Cost, $10,543,539) | $ | 15,615,503 | ||||||
| Floating Rate Loans (g)(r) - 0.3% | ||||||||
| Consumer Products - 0.1% | ||||||||
| Spectrum Brands, Inc., Term Loan B, 3.96%, 6/23/2022 | $ | 30,281 | $ | 30,243 | ||||
| Medical & Health Technology & Services - 0.2% | ||||||||
| DaVita HealthCare Partners, Inc., Term Loan B, 4.65%, 6/24/2021 | $ | 74,836 | $ | 75,397 | ||||
| Total Floating Rate Loans (Identified Cost, $104,966) | $ | 105,640 | ||||||
| Investment Companies (h) - 5.8% | ||||||||
| Money Market Funds - 5.8% | ||||||||
| MFS Institutional Money Market Portfolio, 1.78% (v) (Identified Cost, $2,359,302) |
2,359,627 | $ | 2,359,392 | |||||
| Other Assets, Less Liabilities - 0.5% | 194,292 | |||||||
| Net Assets - 100.0% | $ | 40,430,275 | ||||||
| (a) | Non-income producing security. |
| (d) | In default. |
| (g) | The rate shown represents a weighted average coupon rate on settled positions at period end, unless otherwise indicated. |
| (h) | An affiliated issuer may be considered one in which the fund owns 5% or more of the outstanding voting securities, or a company which is under common control. At period end, the aggregate values of the fund’s investments in affiliated issuers and in unaffiliated issuers were $2,359,392 and $37,876,591, respectively. |
| (i) | Interest only security for which the fund receives interest on notional principal (Par amount). Par amount shown is the notional principal and does not reflect the cost of the security. |
| (n) | Securities exempt from registration under Rule 144A of the Securities Act of 1933. These securities may be sold in the ordinary course of business in transactions exempt from registration, normally to qualified institutional buyers. At period end, the aggregate value of these securities was $12,328,430, representing 30.5% of net assets. |
| (r) | Remaining maturities of floating rate loans may be less than stated maturities shown as a result of contractual or optional prepayments by the borrower. Such prepayments cannot be predicted with certainty. These loans may be subject to restrictions on resale. Floating rate loans generally have rates of interest which are determined periodically by reference to a base lending rate plus a premium. |
| (u) | The security was valued using significant unobservable inputs and is considered level 3 under the fair value hierarchy. For further information about the fund’s level 3 holdings, please see Note 2 in the Notes to Financial Statements. |
17
Table of Contents
Portfolio of Investments (unaudited) – continued
| (v) | Affiliated issuer that is available only to investment companies managed by MFS. The rate quoted for the MFS Institutional Money Market Portfolio is the annualized seven-day yield of the fund at period end. |
| (z) | Restricted securities are not registered under the Securities Act of 1933 and are subject to legal restrictions on resale. These securities generally may be resold in transactions exempt from registration or to the public if the securities are subsequently registered. Disposal of these securities may involve time-consuming negotiations and prompt sale at an acceptable price may be difficult. The fund holds the following restricted securities: |
| Restricted Securities | Acquisition Date |
Cost | Value | |||||||
| Afren PLC, 11.5%, 2/01/2016 | 1/27/11 | $191,339 | $488 | |||||||
| Morgan Stanley Capital I, Inc., 1.493%, 4/28/2039 | 7/20/04 | 61 | 61 | |||||||
| Total Restricted Securities | $549 | |||||||||
| % of Net assets | 0.0% | |||||||||
The following abbreviations are used in this report and are defined:
| ADR | American Depositary Receipt |
| FLR | Floating Rate. Interest rate resets periodically based on the parenthetically disclosed reference rate plus a spread (if any). The period-end rate reported may not be the current rate. |
| PLC | Public Limited Company |
| REIT | Real Estate Investment Trust |
See Notes to Financial Statements
18
Table of Contents
Financial Statements
STATEMENT OF ASSETS AND LIABILITIES
At 4/30/18 (unaudited)
This statement represents your fund’s balance sheet, which details the assets and liabilities comprising the total value of the fund.
| Assets | ||||
| Investments in unaffiliated issuers, at value (identified cost, $33,479,064) |
$37,876,591 | |||
| Investments in affiliated issuers, at value (identified cost, $2,359,302) |
2,359,392 | |||
| Cash |
80,381 | |||
| Receivables for |
||||
| Investments sold |
201,024 | |||
| Interest and dividends |
341,120 | |||
| Other assets |
16,269 | |||
| Total assets |
$40,874,777 | |||
| Liabilities | ||||
| Payables for |
||||
| Investments purchased |
$365,752 | |||
| Payable to affiliates |
||||
| Investment adviser |
3,813 | |||
| Transfer agent and dividend disbursing costs |
358 | |||
| Payable for independent Trustees’ compensation |
9,716 | |||
| Accrued expenses and other liabilities |
64,863 | |||
| Total liabilities |
$444,502 | |||
| Net assets |
$40,430,275 | |||
| Net assets consist of | ||||
| Paid-in capital |
$37,226,860 | |||
| Unrealized appreciation (depreciation) |
4,397,617 | |||
| Accumulated net realized gain (loss) |
443,952 | |||
| Accumulated distributions in excess of net investment income |
(1,638,154 | ) | ||
| Net assets |
$40,430,275 | |||
| Shares of beneficial interest outstanding |
7,131,782 | |||
| Net asset value per share (net assets of $40,430,275 / 7,131,782 shares of beneficial interest outstanding) |
$5.67 |
See Notes to Financial Statements
19
Table of Contents
Financial Statements
Six months ended 4/30/18 (unaudited)
This statement describes how much your fund earned in investment income and accrued in expenses. It also describes any gains and/or losses generated by fund operations.
| Net investment income (loss) | ||||
| Income |
||||
| Interest |
$659,266 | |||
| Dividends |
172,813 | |||
| Dividends from affiliated issuers |
18,686 | |||
| Foreign taxes withheld |
(2,615 | ) | ||
| Total investment income |
$848,150 | |||
| Expenses |
||||
| Management fee |
$171,710 | |||
| Transfer agent and dividend disbursing costs |
7,739 | |||
| Administrative services fee |
8,679 | |||
| Independent Trustees’ compensation |
5,622 | |||
| Stock exchange fee |
11,797 | |||
| Custodian fee |
2,947 | |||
| Shareholder communications |
25,642 | |||
| Audit and tax fees |
36,916 | |||
| Legal fees |
1,090 | |||
| Miscellaneous |
14,328 | |||
| Total expenses |
$286,470 | |||
| Net investment income (loss) |
$561,680 | |||
| Realized and unrealized gain (loss) | ||||
| Realized gain (loss) (identified cost basis) |
||||
| Unaffiliated issuers |
$604,680 | |||
| Affiliated issuers |
(144 | ) | ||
| Net realized gain (loss) |
$604,536 | |||
| Change in unrealized appreciation or depreciation |
||||
| Unaffiliated issuers |
$(1,594,659 | ) | ||
| Affiliated issuers |
(100 | ) | ||
| Net unrealized gain (loss) |
$(1,594,759 | ) | ||
| Net realized and unrealized gain (loss) |
$(990,223 | ) | ||
| Change in net assets from operations |
$(428,543 | ) | ||
See Notes to Financial Statements
20
Table of Contents
Financial Statements
STATEMENTS OF CHANGES IN NET ASSETS
These statements describe the increases and/or decreases in net assets resulting from operations, any distributions, and any shareholder transactions.
| Change in net assets | Six months ended 4/30/18 (unaudited) |
Year ended |
||||||
| From operations | ||||||||
| Net investment income (loss) |
$561,680 | $1,427,526 | ||||||
| Net realized gain (loss) |
604,536 | 1,095,303 | ||||||
| Net unrealized gain (loss) |
(1,594,759 | ) | 2,578,328 | |||||
| Change in net assets from operations |
$(428,543 | ) | $5,101,157 | |||||
| Distributions declared to shareholders | ||||||||
| From net investment income |
$(1,083,860 | ) | $(1,520,530 | ) | ||||
| From tax return of capital |
— | (2,735,959 | ) | |||||
| From other sources |
(1,038,752 | ) | — | |||||
| Total distributions declared to shareholders |
$(2,122,612 | ) | $(4,256,489 | ) | ||||
| Change in net assets from fund share transactions |
$139,441 | $147,832 | ||||||
| Total change in net assets |
$(2,411,714 | ) | $992,500 | |||||
| Net assets | ||||||||
| At beginning of period |
42,841,989 | 41,849,489 | ||||||
| At end of period (including accumulated distributions in excess of net investment income of $1,638,154 and $77,222, respectively) |
$40,430,275 | $42,841,989 | ||||||
See Notes to Financial Statements
21
Table of Contents
Financial Statements
The financial highlights table is intended to help you understand the fund’s financial performance for the semiannual period and the past 5 fiscal years. Certain information reflects financial results for a single fund share. The total returns in the table represent the rate that an investor would have earned (or lost) on an investment in the fund share class (assuming reinvestment of all distributions) held for the entire period.
| Six months 4/30/18 |
Year ended | |||||||||||||||||||||||
| 10/31/17 | 10/31/16 | 10/31/15 | 10/31/14 | 10/31/13 | ||||||||||||||||||||
| (unaudited) | ||||||||||||||||||||||||
| Net asset value, beginning of |
$6.03 | $5.91 | $6.09 | $6.78 | $7.05 | $6.84 | ||||||||||||||||||
| Income (loss) from investment operations | ||||||||||||||||||||||||
| Net investment income (loss) (d) |
$0.08 | $0.20 | (c) | $0.23 | $0.25 | $0.28 | $0.33 | |||||||||||||||||
| Net realized and unrealized |
(0.14 | ) | 0.52 | 0.18 | (0.29 | ) | 0.15 | 0.58 | ||||||||||||||||
| Total from investment operations |
$(0.06 | ) | $0.72 | $0.41 | $(0.04 | ) | $0.43 | $0.91 | ||||||||||||||||
| Less distributions declared to shareholders | ||||||||||||||||||||||||
| From net investment income |
$(0.15 | ) | $(0.21 | ) | $(0.24 | ) | $(0.32 | ) | $(0.42 | ) | $(0.39 | ) | ||||||||||||
| From tax return of capital |
— | (0.39 | ) | (0.35 | ) | (0.33 | ) | (0.28 | ) | (0.31 | ) | |||||||||||||
| From other sources |
(0.15 | ) | — | — | — | — | — | |||||||||||||||||
| Total distributions declared to |
$(0.30 | ) | $(0.60 | ) | $(0.59 | ) | $(0.65 | ) | $(0.70 | ) | $(0.70 | ) | ||||||||||||
| Net increase from repurchase of |
$— | $0.00 | (w) | $— | $— | $— | $— | |||||||||||||||||
| Net asset value, end of period (x) |
$5.67 | $6.03 | $5.91 | $6.09 | $6.78 | $7.05 | ||||||||||||||||||
| Market value, end of period |
$6.02 | $6.66 | $5.50 | $5.53 | $7.59 | $7.29 | ||||||||||||||||||
| Total return at market value (%) |
(5.00 | )(n) | 33.86 | 10.75 | (19.11 | ) | 14.73 | 7.94 | ||||||||||||||||
| Total return at net asset |
(1.17 | )(n) | 12.79 | (c) | 8.07 | (0.28 | ) | 5.97 | 13.85 | |||||||||||||||
| Ratios (%) (to average net assets) and Supplemental data: |
||||||||||||||||||||||||
| Expenses before expense reductions (f) |
1.37 | (a) | 1.23 | (c) | 1.42 | 1.41 | 1.35 | 1.39 | ||||||||||||||||
| Expenses after expense reductions (f) |
N/A | N/A | N/A | N/A | 1.35 | 1.39 | ||||||||||||||||||
| Net investment income (loss) |
2.69 | (a) | 3.35 | (c) | 3.88 | 3.80 | 4.05 | 4.73 | ||||||||||||||||
| Portfolio turnover |
17 | (n) | 35 | 26 | 29 | 39 | 40 | |||||||||||||||||
| Net assets at end of period |
$40,430 | $42,842 | $41,849 | $43,126 | $47,904 | $49,402 | ||||||||||||||||||
See Notes to Financial Statements
22
Table of Contents
Financial Highlights – continued
| (a) | Annualized. |
| (c) | Amount reflects a one-time reimbursement of expenses by the custodian (or former custodian) without which net investment income and performance would be lower and expenses would be higher. |
| (d) | Per share data is based on average shares outstanding. |
| (f) | Ratios do not reflect reductions from fees paid indirectly, if applicable. |
| (j) | Total return at net asset value is calculated using the net asset value of the fund, not the publicly traded price and therefore may be different than the total return at market value. |
| (n) | Not annualized. |
| (r) | Certain expenses have been reduced without which performance would have been lower. |
| (s) | From time to time the fund may receive proceeds from litigation settlements, without which performance would be lower. |
| (w) | Per share amount was less than $0.01. |
| (x) | The net asset values and total returns at net asset value have been calculated on net assets which include adjustments made in accordance with U.S. generally accepted accounting principles required at period end for financial reporting purposes. |
See Notes to Financial Statements
23
Table of Contents
(unaudited)
(1) Business and Organization
MFS Special Value Trust (the fund) is organized as a Massachusetts business trust and is registered under the Investment Company Act of 1940, as amended, as a diversified closed-end management investment company.
The fund is an investment company and accordingly follows the investment company accounting and reporting guidance of the Financial Accounting Standards Board (FASB) Accounting Standards Codification Topic 946 Financial Services – Investment Companies.
(2) Significant Accounting Policies
General – The preparation of financial statements in conformity with U.S. generally accepted accounting principles requires management to make estimates and assumptions that affect the reported amounts of assets and liabilities, and disclosure of contingent assets and liabilities at the date of the financial statements and the reported amounts of increases and decreases in net assets from operations during the reporting period. Actual results could differ from those estimates. In the preparation of these financial statements, management has evaluated subsequent events occurring after the date of the fund’s Statement of Assets and Liabilities through the date that the financial statements were issued. The fund invests in high-yield securities rated below investment grade. Investments in below investment grade quality securities can involve a substantially greater risk of default or can already be in default, and their values can decline significantly. Below investment grade quality securities tend to be more sensitive to adverse news about the issuer, or the market or economy in general, than higher quality debt instruments. The fund invests in foreign securities. Investments in foreign securities are vulnerable to the effects of changes in the relative values of the local currency and the U.S. dollar and to the effects of changes in each country’s market, economic, industry, political, regulatory, geopolitical, and other conditions.
In March 2017, the FASB issued Accounting Standards Update 2017-08, Receivables –Nonrefundable Fees and Other Costs (Subtopic 310-20) – Premium Amortization on Purchased Callable Debt Securities (“ASU 2017-08”). For entities that hold callable debt securities at a premium, ASU 2017-08 requires that the premium be amortized to the earliest call date. ASU 2017-08 will be effective for fiscal years beginning after December 15, 2018, and interim periods within those fiscal years. Management has evaluated the potential impacts of ASU 2017-08 and believes that adoption of ASU 2017-08 will not have a material effect on the fund’s overall financial position or its overall results of operations.
Balance Sheet Offsetting – The fund’s accounting policy with respect to balance sheet offsetting is that, absent an event of default by the counterparty or a termination of the agreement, the International Swaps and Derivatives Association (ISDA) Master Agreement, or similar agreement, does not result in an offset of reported amounts of financial assets and financial liabilities in the Statement of Assets and Liabilities across transactions between the fund and the applicable counterparty. The fund’s right to setoff may be restricted or prohibited by the bankruptcy or insolvency laws of the particular jurisdiction to which a specific master netting agreement counterparty is subject. Balance sheet offsetting disclosures, to the extent applicable to the fund, have
24
Table of Contents
Notes to Financial Statements (unaudited) – continued
been included in the fund’s Significant Accounting Policies note under the captions for each of the fund’s in-scope financial instruments and transactions.
Investment Valuations – Equity securities, including restricted equity securities, are generally valued at the last sale or official closing price on their primary market or exchange as provided by a third-party pricing service. Equity securities, for which there were no sales reported that day, are generally valued at the last quoted daily bid quotation on their primary market or exchange as provided by a third-party pricing service. Debt instruments and floating rate loans, including restricted debt instruments, are generally valued at an evaluated or composite bid as provided by a third-party pricing service. Short-term instruments with a maturity at issuance of 60 days or less may be valued at amortized cost, which approximates market value. Open-end investment companies are generally valued at net asset value per share. Securities and other assets generally valued on the basis of information from a third-party pricing service may also be valued at a broker/dealer bid quotation. In determining values, third-party pricing services can utilize both transaction data and market information such as yield, quality, coupon rate, maturity, type of issue, trading characteristics, and other market data. The values of foreign securities and other assets and liabilities expressed in foreign currencies are converted to U.S. dollars using the mean of bid and asked prices for rates provided by a third-party pricing service.
The Board of Trustees has delegated primary responsibility for determining or causing to be determined the value of the fund’s investments (including any fair valuation) to the adviser pursuant to valuation policies and procedures approved by the Board. If the adviser determines that reliable market quotations are not readily available, investments are valued at fair value as determined in good faith by the adviser in accordance with such procedures under the oversight of the Board of Trustees. Under the fund’s valuation policies and procedures, market quotations are not considered to be readily available for most types of debt instruments and floating rate loans and many types of derivatives. These investments are generally valued at fair value based on information from third-party pricing services. In addition, investments may be valued at fair value if the adviser determines that an investment’s value has been materially affected by events occurring after the close of the exchange or market on which the investment is principally traded (such as foreign exchange or market) and prior to the determination of the fund’s net asset value, or after the halting of trading of a specific security where trading does not resume prior to the close of the exchange or market on which the security is principally traded. Events that occur on a frequent basis after foreign markets close (such as developments in foreign markets and significant movements in the U.S. markets) and prior to the determination of the fund’s net asset value may be deemed to have a material effect on the value of securities traded in foreign markets. Accordingly, the fund’s foreign equity securities may often be valued at fair value. The adviser generally relies on third-party pricing services or other information (such as the correlation with price movements of similar securities in the same or other markets; the type, cost and investment characteristics of the security; the business and financial condition of the issuer; and trading and other market data) to assist in determining whether to fair value and at what value to fair value an investment. The value of an investment for purposes of calculating the fund’s net asset value can differ depending on the source and method used to determine value. When fair valuation is used, the
25
Table of Contents
Notes to Financial Statements (unaudited) – continued
value of an investment used to determine the fund’s net asset value may differ from quoted or published prices for the same investment. There can be no assurance that the fund could obtain the fair value assigned to an investment if it were to sell the investment at the same time at which the fund determines its net asset value per share.
Various inputs are used in determining the value of the fund’s assets or liabilities. These inputs are categorized into three broad levels. In certain cases, the inputs used to measure fair value may fall into different levels of the fair value hierarchy. In such cases, an investment’s level within the fair value hierarchy is based on the lowest level of input that is significant to the fair value measurement. The fund’s assessment of the significance of a particular input to the fair value measurement in its entirety requires judgment, and considers factors specific to the investment. Level 1 includes unadjusted quoted prices in active markets for identical assets or liabilities. Level 2 includes other significant observable market-based inputs (including quoted prices for similar securities, interest rates, prepayment speed, and credit risk). Level 3 includes unobservable inputs, which may include the adviser’s own assumptions in determining the fair value of investments. The following is a summary of the levels used as of April 30, 2018 in valuing the fund’s assets or liabilities:
| Financial Instruments | Level 1 | Level 2 | Level 3 | Total | ||||||||||||
| Equity Securities: | ||||||||||||||||
| United States |
$15,028,741 | $— | $53,365 | $15,082,106 | ||||||||||||
| Switzerland |
533,397 | — | — | 533,397 | ||||||||||||
| Non-U.S. Sovereign Debt | — | 265,885 | — | 265,885 | ||||||||||||
| U.S. Corporate Bonds | — | 18,430,746 | — | 18,430,746 | ||||||||||||
| Commercial Mortgage-Backed Securities | — | 61 | — | 61 | ||||||||||||
| Foreign Bonds | — | 3,458,756 | — | 3,458,756 | ||||||||||||
| Floating Rate Loans | — | 105,640 | — | 105,640 | ||||||||||||
| Mutual Funds | 2,359,392 | — | — | 2,359,392 | ||||||||||||
| Total | $17,921,530 | $22,261,088 | $53,365 | $40,235,983 | ||||||||||||
For further information regarding security characteristics, see the Portfolio of Investments.
The following is a reconciliation of level 3 assets for which significant unobservable inputs were used to determine fair value. The fund’s policy is to recognize transfers between the levels as of the end of the period. The table presents the activity of level 3 securities held at the beginning and the end of the period.
| Equity Securities | ||||
| Balance as of 10/31/17 | $53,365 | |||
| Change in unrealized appreciation or depreciation |
0 | |||
| Balance as of 4/30/18 | $53,365 | |||
The net change in unrealized appreciation or depreciation from investments held as level 3 at April 30, 2018 is $0. At April 30, 2018, the fund held one level 3 security.
Foreign Currency Translation – Purchases and sales of foreign investments, income, and expenses are converted into U.S. dollars based upon currency exchange rates prevailing on the respective dates of such transactions or on the reporting date for
26
Table of Contents
Notes to Financial Statements (unaudited) – continued
foreign denominated receivables and payables. Gains and losses attributable to foreign currency exchange rates on sales of securities are recorded for financial statement purposes as net realized gains and losses on investments. Gains and losses attributable to foreign exchange rate movements on receivables, payables, income and expenses are recorded for financial statement purposes as foreign currency transaction gains and losses. That portion of both realized and unrealized gains and losses on investments that results from fluctuations in foreign currency exchange rates is not separately disclosed.
Loans and Other Direct Debt Instruments – The fund invests in loans and loan participations or other receivables. These investments may include standby financing commitments, including revolving credit facilities, which contractually obligate the fund to supply additional cash to the borrower on demand. The fund generally provides this financial support in order to preserve its existing investment or to obtain a more senior secured interest in the assets of the borrower. Loan participations involve a risk of insolvency of the lending bank or other financial intermediary.
Indemnifications – Under the fund’s organizational documents, its officers and Trustees may be indemnified against certain liabilities and expenses arising out of the performance of their duties to the fund. Additionally, in the normal course of business, the fund enters into agreements with service providers that may contain indemnification clauses. The fund’s maximum exposure under these agreements is unknown as this would involve future claims that may be made against the fund that have not yet occurred.
Investment Transactions and Income – Investment transactions are recorded on the trade date. Interest income is recorded on the accrual basis. All premium and discount is amortized or accreted for financial statement purposes in accordance with U.S. generally accepted accounting principles. The fund earns certain fees in connection with its floating rate loan purchasing activities. These fees are in addition to interest payments earned and may include amendment fees, commitment fees, facility fees, consent fees, and prepayment fees. Commitment fees are recorded on an accrual basis as income in the accompanying financial statements. Dividends received in cash are recorded on the ex-dividend date. Certain dividends from foreign securities will be recorded when the fund is informed of the dividend if such information is obtained subsequent to the ex-dividend date. Dividend and interest payments received in additional securities are recorded on the ex-dividend or ex-interest date in an amount equal to the value of the security on such date. Debt obligations may be placed on non-accrual status or set to accrue at a rate of interest less than the contractual coupon when the collection of all or a portion of interest has become doubtful. Interest income for those debt obligations may be further reduced by the write-off of the related interest receivables when deemed uncollectible.
The fund may receive proceeds from litigation settlements. Any proceeds received from litigation involving portfolio holdings are reflected in the Statement of Operations in realized gain/loss if the security has been disposed of by the fund or in unrealized gain/loss if the security is still held by the fund. Any other proceeds from litigation not related to portfolio holdings are reflected as other income in the Statement of Operations.
27
Table of Contents
Notes to Financial Statements (unaudited) – continued
Tax Matters and Distributions – The fund intends to qualify as a regulated investment company, as defined under Subchapter M of the Internal Revenue Code, and to distribute all of its taxable income, including realized capital gains. As a result, no provision for federal income tax is required. The fund’s federal tax returns, when filed, will remain subject to examination by the Internal Revenue Service for a three year period. Management has analyzed the fund’s tax positions taken on federal and state tax returns for all open tax years and does not believe that there are any uncertain tax positions that require recognition of a tax liability. Foreign taxes, if any, have been accrued by the fund in the accompanying financial statements in accordance with the applicable foreign tax law. Foreign income taxes may be withheld by certain countries in which the fund invests. Additionally, capital gains realized by the fund on securities issued in or by certain foreign countries may be subject to capital gains tax imposed by those countries.
Distributions to shareholders are recorded on the ex-dividend date. The fund seeks to pay monthly distributions based on an annual rate of 10.00% of the fund’s average monthly net asset value. As a result, distributions may exceed actual earnings which may result in a tax return of capital or, to the extent the fund has long-term gains and a capital loss carryforward, distributions of current year long-term gains may be recharacterized as ordinary income. Income and capital gain distributions are determined in accordance with income tax regulations, which may differ from U.S. generally accepted accounting principles. Certain capital accounts in the financial statements are periodically adjusted for permanent differences in order to reflect their tax character. These adjustments have no impact on net assets or net asset value per share. Temporary differences which arise from recognizing certain items of income, expense, gain or loss in different periods for financial statement and tax purposes will reverse at some time in the future.
Book/tax differences primarily relate to defaulted bonds, expiration of capital loss carryforwards, and amortization and accretion of debt securities.
For the six months ended April 30, 2018, the amount of distributions estimated to be a tax return of capital was approximately $1,038,752 which is reported as distributions from other sources in the Statements of Changes in Net Assets.
The tax character of distributions made during the current period will be determined at fiscal year end. The tax character of distributions declared to shareholders for the last fiscal year is as follows:
| Year ended 10/31/17 |
||||
| Ordinary income (including any short-term capital gains) (a) |
$1,520,530 | |||
| Tax return of capital (b) | 2,735,959 | |||
| Total distributions | $4,256,489 | |||
| (a) | Included in the fund’s distributions from ordinary income for the year ended October 31, 2017 is $50,216 in excess of investment company taxable income which, in accordance with applicable U.S. tax law, is taxable to shareholders as ordinary income distributions. |
| (b) | Distributions in excess of tax basis earnings and profits are reported in the financial statements as a tax return of capital. |
28
Table of Contents
Notes to Financial Statements (unaudited) – continued
The federal tax cost and the tax basis components of distributable earnings were as follows:
| As of 4/30/18 | ||||
| Cost of investments | $35,903,313 | |||
| Gross appreciation | 5,441,679 | |||
| Gross depreciation | (1,109,009 | ) | ||
| Net unrealized appreciation (depreciation) | $4,332,670 | |||
| As of 10/31/17 | ||||
| Capital loss carryforwards | (89,992 | ) | ||
| Other temporary differences | (35,124 | ) | ||
| Net unrealized appreciation (depreciation) | 5,879,686 | |||
The aggregate cost above includes prior fiscal year end tax adjustments, if applicable.
Under the Regulated Investment Company Modernization Act of 2010 (the “Act”), net capital losses recognized for fund fiscal years beginning after October 31, 2011 may be carried forward indefinitely, and their character is retained as short-term and/or long-term losses (“post-enactment losses”). Previously, net capital losses were carried forward for eight years and treated as short-term losses (“pre-enactment losses”). As a transition rule, the Act requires that all post-enactment net capital losses be used before pre-enactment net capital losses.
As of October 31, 2017, the fund had capital loss carryforwards available to offset future realized gains. Such pre-enactment losses expire as follows:
| 10/31/18 | $(89,992 | ) |
(3) Transactions with Affiliates
Investment Adviser – The fund has an investment advisory agreement with MFS to provide overall investment management and related administrative services and facilities to the fund. The management fee is computed daily and paid monthly at an annual rate of 0.68% of the fund’s average daily net assets and 3.40% of gross income. Gross income is calculated based on tax elections that generally include the accretion of discount and exclude the amortization of premium, which may differ from investment income reported in the Statement of Operations. MFS has agreed to reduce its management fee to the lesser of the contractual management fee as set forth above or 0.90% of the fund’s average daily net assets. This written agreement will continue until modified by the fund’s Board of Trustees, but such agreement will continue at least until October 31, 2018. For the six months ended April 30, 2018, the fund’s average daily net assets and gross income fees did not meet the thresholds required to waive the management fee under this agreement. The management fee, from net assets and gross income, incurred for the six months ended April 30, 2018 was equivalent to an annual effective rate of 0.82% of the fund’s average daily net assets.
Transfer Agent – The fund engages Computershare Trust Company, N.A. (“Computershare”) as the sole transfer agent for the fund. MFS Service Center, Inc. (MFSC) monitors and supervises the activities of Computershare for an agreed upon fee approved by the Board of Trustees. For the six months ended April 30, 2018, these fees paid to MFSC amounted to $1,167.
29
Table of Contents
Notes to Financial Statements (unaudited) – continued
Administrator – MFS provides certain financial, legal, shareholder communications, compliance, and other administrative services to the fund. Under an administrative services agreement, the fund reimburses MFS the costs incurred to provide these services. The fund is charged an annual fixed amount of $17,500 plus a fee based on average daily net assets. The administrative services fee incurred for the six months ended April 30, 2018 was equivalent to an annual effective rate of 0.0416% of the fund’s average daily net assets.
Trustees’ and Officers’ Compensation – The fund pays compensation to independent Trustees in the form of a retainer, attendance fees, and additional compensation to Board and Committee chairpersons. The fund does not pay compensation directly to Trustees or officers of the fund who are also officers of the investment adviser, all of whom receive remuneration for their services to the fund from MFS. Certain officers and Trustees of the fund are officers or directors of MFS and MFSC.
Prior to December 31, 2001, the fund had an unfunded defined benefit plan (“DB plan”) for independent Trustees. As of December 31, 2001, the Board took action to terminate the DB plan with respect to then-current and any future independent Trustees, such that the DB plan covers only certain of those former independent Trustees who retired on or before December 31, 2001. The DB plan resulted in a pension expense of $1,334 and is included in “Independent Trustees’ compensation” in the Statement of Operations for the six months ended April 30, 2018. The liability for deferred retirement benefits payable to those former independent Trustees under the DB plan amounted to $8,904 at April 30, 2018, and is included in “Payable for independent Trustees’ compensation” in the Statement of Assets and Liabilities.
Other – This fund and certain other funds managed by MFS (the funds) have entered into a service agreement (the ISO Agreement) which provides for payment of fees solely by the funds to Tarantino LLC in return for the provision of services of an Independent Senior Officer (ISO) for the funds. Frank L. Tarantino serves as the ISO and is an officer of the funds and the sole member of Tarantino LLC. The funds can terminate the ISO Agreement with Tarantino LLC at any time under the terms of the ISO Agreement. For the six months ended April 30, 2018, the fee paid by the fund under this agreement was $35 and is included in “Miscellaneous” expense in the Statement of Operations. MFS has agreed to bear all expenses associated with office space, other administrative support, and supplies provided to the ISO.
The fund invests in the MFS Institutional Money Market Portfolio which is managed by MFS and seeks current income consistent with preservation of capital and liquidity. This money market fund does not pay a management fee to MFS.
Effective January 3, 2018, the adviser has voluntarily undertaken to reimburse the fund from its own resources on a quarterly basis for the cost of investment research embedded in the cost of the fund’s securities trades. This agreement may be rescinded at any time. This reimbursement, if any, will be determined in arrears on a quarterly basis beginning with the quarter ending March 31, 2018.
(4) Portfolio Securities
For the six months ended April 30, 2018, purchases and sales of investments, other than short-term obligations, aggregated $6,510,411 and $7,735,681, respectively.
30
Table of Contents
Notes to Financial Statements (unaudited) – continued
(5) Shares of Beneficial Interest
The fund’s Declaration of Trust permits the Trustees to issue an unlimited number of full and fractional shares of beneficial interest. The Trustees have authorized the repurchase by the fund of up to 10% annually of its own shares of beneficial interest. The fund repurchased 249 shares of beneficial interest during the year ended October 31, 2017 at an average price per share of $5.43 and a weighted average discount of 7.65% per share. Transactions in fund shares were as follows:
| Six months ended 4/30/18 |
Year ended 10/31/17 |
|||||||||||||||
| Shares | Amount | Shares | Amount | |||||||||||||
| Shares issued to shareholders in reinvestment of distributions |
23,362 | $139,441 | 24,202 | $149,184 | ||||||||||||
| Capital shares reacquired | — | — | (249 | ) | (1,352 | ) | ||||||||||
| Net change | 23,362 | $139,441 | 23,953 | $147,832 | ||||||||||||
(6) Line of Credit
The fund and certain other funds managed by MFS participate in a $1.25 billion unsecured committed line of credit, subject to a $1 billion sublimit, provided by a syndication of banks under a credit agreement. Borrowings may be made for temporary financing needs. Interest is charged to each fund, based on its borrowings, generally at a rate equal to the higher of the Overnight Federal Reserve funds rate or daily one month LIBOR plus an agreed upon spread. A commitment fee, based on the average daily, unused portion of the committed line of credit, is allocated among the participating funds. In addition, the fund and other funds managed by MFS have established unsecured uncommitted borrowing arrangements with certain banks for temporary financing needs. Interest is charged to each fund, based on its borrowings, at a rate equal to the Overnight Federal Reserve funds rate plus an agreed upon spread. For the six months ended April 30, 2018, the fund’s commitment fee and interest expense were $139 and $0, respectively, and are included in “Miscellaneous” expense in the Statement of Operations.
(7) Investments in Affiliated Issuers
An affiliated issuer may be considered one in which the fund owns 5% or more of the outstanding voting securities, or a company which is under common control. For the purposes of this report, the fund assumes the following to be affiliated issuers:
| Affiliated Issuers | Beginning Shares/Par Amount |
Acquisitions Shares/Par Amount |
Dispositions Shares/Par Amount |
Ending Shares/Par Amount |
||||||||||||||||
| MFS Institutional Money Market Portfolio |
2,545,079 | 4,498,031 | (4,683,483 | ) | 2,359,627 | |||||||||||||||
| Affiliated Issuers | Realized Gain (Loss) |
Change in Unrealized Appreciation/ Depreciation |
Capital Gain Distributions |
Dividend Income |
Ending Value |
|||||||||||||||
| MFS Institutional Money Market Portfolio |
$(144 | ) | $(100 | ) | $— | $18,686 | $2,359,392 | |||||||||||||
31
Table of Contents
Notes to Financial Statements (unaudited) – continued
(8) Legal Proceedings
In May 2015, the Motors Liquidation Company Avoidance Action Trust (hereafter, “AAT”) served upon the fund a complaint in an adversary proceeding in the U.S. Bankruptcy Court for the Southern District of New York, captioned Motors Liquidation Company Avoidance Action Trust v. JPMorgan Chase Bank, N.A., et al. (No. 09-00504 (REG)). The complaint, which was originally filed in 2009 but not served on the fund until 2015, names as defendants over 500 entities (including the fund) that held an interest in a $1.5 billion General Motors (GM) term loan in 2009, when GM filed for bankruptcy. The AAT alleges that the fund and the other term loan lenders were improperly treated as secured lenders with respect to the term loan shortly before and immediately after GM’s bankruptcy, receiving full principal and interest payments under the loan. The AAT alleges that the fund and other term loan lenders should have been treated as unsecured (or partially unsecured) creditors because the main lien securing the collateral was allegedly not perfected at the time of GM’s bankruptcy due to an erroneous filing in October 2008 that terminated the financing statement perfecting the lien. The AAT seeks to claw back payments made to the fund and the other term loan lenders after, and during the 90 days before, GM’s June 2009 bankruptcy petition. During that time period, the fund received term loan payments of approximately $280,000. The fund cannot predict the outcome of this proceeding. Among other things, it is unclear whether the AAT’s claims will succeed; what the fund would be entitled to as an unsecured (or partially unsecured) creditor, given the existence of other collateral not impacted by the erroneous October 2008 filing; whether third parties responsible for the erroneous October 2008 filing would bear some or all of any liability; and the degree to which the fund may be entitled to indemnification from a third party for any amount required to be disgorged. The fund has and will continue to incur legal expenses associated with the defense of this action and in related claims against third parties.
32
Table of Contents
REPORT OF INDEPENDENT REGISTERED PUBLIC ACCOUNTING FIRM
To the Board of Trustees and Shareholders of MFS Special Value Trust:
We have reviewed the accompanying statement of assets and liabilities of MFS Special Value Trust (the Fund), including the portfolio of investments, as of April 30, 2018, and the related statements of operations, changes in net assets and financial highlights for the six-month period ended April 30, 2018. These interim financial statements and financial highlights are the responsibility of the Fund’s management.
We conducted our review in accordance with the standards of the Public Company Accounting Oversight Board (United States). A review of interim financial information consists principally of applying analytical procedures and making inquiries of persons responsible for financial and accounting matters. It is substantially less in scope than an audit conducted in accordance with the standards of the Public Company Accounting Oversight Board (United States), the objective of which is the expression of an opinion regarding the financial statements taken as a whole. Accordingly, we do not express such an opinion.
Based on our review, we are not aware of any material modifications that should be made to the accompanying interim financial statements and financial highlights for them to be in conformity with U.S. generally accepted accounting principles.
We have previously audited, in accordance with the standards of the Public Company Accounting Oversight Board (United States), the statement of changes in net assets for the year ended October 31, 2017 and the financial highlights for each of the five years in the period ended October 31, 2017, and in our report dated December 15, 2017, we expressed an unqualified opinion on such statement of changes in net assets and financial highlights.

Boston, Massachusetts
June 18, 2018
33
Table of Contents
PROXY VOTING POLICIES AND INFORMATION
MFS votes proxies on behalf of the fund pursuant to proxy voting policies and procedures that are available without charge, upon request, by calling 1-800-225-2606, by visiting mfs.com/proxyvoting, or by visiting the SEC’s Web site at http://www.sec.gov.
Information regarding how the fund voted proxies relating to portfolio securities during the most recent twelve-month period ended June 30 is available by August 31 of each year without charge by visiting mfs.com/proxyvoting, or by visiting the SEC’s Web site at http://www.sec.gov.
QUARTERLY PORTFOLIO DISCLOSURE
The fund will file a complete schedule of portfolio holdings with the Securities and Exchange Commission (the Commission) for the first and third quarters of each fiscal year on Form N-Q. A shareholder can obtain the quarterly portfolio holdings report at mfs.com. The fund’s Form N-Q is also available on the EDGAR database on the Commission’s Internet Web site at http://www.sec.gov, and may be reviewed and copied at the:
Public Reference Room
Securities and Exchange Commission
100 F Street, NE, Room 1580
Washington, D.C. 20549
Information on the operation of the Public Reference Room may be obtained by calling the Commission at 1-800-SEC-0330. Copies of the fund’s Form N-Q also may be obtained, upon payment of a duplicating fee, by electronic request at the following e-mail address: [email protected] or by writing the Public Reference Section at the above address.
From time to time, MFS may post important information about the fund or the MFS funds on the MFS web site (mfs.com). This information is available at https://www.mfs.com/en-us/what-we-do/announcements.html or at mfs.com/closedendfunds by choosing the fund’s name.
Additional information about the fund (e.g., performance, dividends and the fund’s price history) is also available by clicking on the fund’s name under “Closed-End Funds” in the “Products” section of mfs.com.
34
Table of Contents
INFORMATION ABOUT FUND CONTRACTS AND LEGAL CLAIMS
The fund has entered into contractual arrangements with an investment adviser, administrator, transfer agent, and custodian who each provide services to the fund. Unless expressly stated otherwise, shareholders are not parties to, or intended beneficiaries of these contractual arrangements, and these contractual arrangements are not intended to create any shareholder right to enforce them against the service providers or to seek any remedy under them against the service providers, either directly or on behalf of the fund.
Under the Trust’s By-Laws and Declaration of Trust, any claims asserted against or on behalf of the MFS Funds, including claims against Trustees and Officers, must be brought in state and federal courts located within the Commonwealth of Massachusetts.
35
Table of Contents
TRANSFER AGENT, REGISTRAR, AND
DIVIDEND DISBURSING AGENT
CALL
1-800-637-2304
9 a.m. to 5 p.m. Eastern time
WRITE
Computershare Trust Company, N.A.
P.O. Box 43078
Providence, RI 02940-3078
New York Stock Exchange Symbol: MFV
Table of Contents
| ITEM 2. | CODE OF ETHICS. |
During the period covered by this report, the Registrant has not amended any provision in its Code of Ethics (the “Code”) that relates to an element of the Code’s definitions enumerated in paragraph (b) of Item 2 of this Form N-CSR. During the period covered by this report, the Registrant did not grant a waiver, including an implicit waiver, from any provision of the Code.
| ITEM 3. | AUDIT COMMITTEE FINANCIAL EXPERT. |
Not applicable for semi-annual reports.
| ITEM 4. | PRINCIPAL ACCOUNTANT FEES AND SERVICES. |
Not applicable for semi-annual reports.
| ITEM 5. | AUDIT COMMITTEE OF LISTED REGISTRANTS. |
Not applicable for semi-annual reports.
| ITEM 6. | SCHEDULE OF INVESTMENTS |
A schedule of investments for MFS Special Value Trust is included as part of the report to shareholders under Item 1 of this Form N-CSR.
| ITEM 7. | DISCLOSURE OF PROXY VOTING POLICIES AND PROCEDURES FOR CLOSED-END MANAGEMENT INVESTMENT COMPANIES. |
Not applicable for semi-annual reports.
Table of Contents
| ITEM 8. | PORTFOLIO MANAGERS OF CLOSED-END MANAGEMENT INVESTMENT COMPANIES. |
Portfolio Manager(s)
Information regarding the portfolio manager(s) of the MFS Special Value Trust (the “Fund”) is set forth below. Each portfolio manager is primarily responsible for the day-to-day management of the Fund.
Michael Skatrud became a portfolio manager of the Fund on March 1, 2018. Effective September 1, 2018, William Adams will no longer be a portfolio manager of the Fund.
| Primary Role |
Since | Title and Five Year History | ||||
| William Adams | Below Investment Grade Debt Instruments Portfolio Manager | 2011 | Investment Officer of MFS; employed in the investment area of MFS since 2009 | |||
| Ward Brown | Emerging Markets Debt Instruments Portfolio Manager | 2012 | Investment Officer of MFS; employed in the investment area of MFS since 2005 | |||
| Nevin Chitkara | Equity Securities Portfolio Manager | 2012 | Investment Officer of MFS; employed in the investment area of MFS since 1997 | |||
| David Cole | Below Investment Grade Debt Instruments Portfolio Manager | 2006 | Investment Officer of MFS; employed in the investment area of MFS since 2004 | |||
| Matt Ryan | Emerging Markets Debt Instruments Portfolio Manager | 2012 | Investment Officer of MFS; employed in the investment area of MFS since 1997 | |||
| Michael Skatrud | Below Investment Grade Debt Instruments Portfolio Manager | March 2018 | Investment Officer of MFS; employed in the investment area of MFS since 2013 | |||
Compensation
Portfolio manager compensation is reviewed annually. As of December 31, 2017, portfolio manager total cash compensation is a combination of base salary and performance bonus:
Base Salary – Base salary represents a smaller percentage of portfolio manager total cash compensation than performance bonus.
Performance Bonus – Generally, the performance bonus represents more than a majority of portfolio manager total cash compensation.
The performance bonus is based on a combination of quantitative and qualitative factors, generally with more weight given to the former and less weight given to the latter.
The quantitative portion is primarily based on the pre-tax performance of assets managed by the portfolio manager over three- and five-year periods relative to peer group universes and/or indices (“benchmarks”). As of December 31, 2017, the following benchmarks were used to measure the following portfolio manager’s performance for the Fund:
| Fund |
Portfolio Manager |
Benchmark(s) | ||
| MFS Special Value Trust | Ward Brown | JPMorgan Emerging Markets Bond Index Global | ||
| Nevin Chitkara | Russell 1000® Value Index | |||
| David Cole | Bloomberg Barclays U.S. High-Yield Corporate Bond 2% Issuer Capped Index
JPMorgan Emerging Markets Bond Index Global Russell 1000® Value Index | |||
| Matt Ryan | JPMorgan Emerging Markets Bond Index Global | |||
| Michael Skatrud1 | Bloomberg Barclays U.S. High-Yield Corporate Bond 2% Issuer Capped Index
JPMorgan Emerging Markets Bond Index Global Russell 1000® Value Index |
| 1 | Information is as of March 1, 2018. |
Table of Contents
The Russell 1000® Value Index is a trademark/service mark of the Frank Russell Company. Russell® is a trademark of the Frank Russell Company.
Additional or different benchmarks, including versions and components of indices, custom indices, and linked indices that combine performance of different indices for different portions of the time period, may also be used. Consideration is primarily given to portfolio performance over three and five years with consideration given to other periods, if available. For portfolio managers who have served for more than five years, additional, longer-term performance periods, including the ten-year and since inception periods, are also considered. For portfolio managers who have served for less than three years, additional, shorter-term performance periods, including the one-year period, may also be considered. Emphasis is generally placed on longer performance periods when multiple performance periods are available.
The qualitative portion is based on the results of an annual internal peer review process (conducted by other portfolio managers, analysts, and traders) and management’s assessment of overall portfolio manager contributions to investor relations and the investment process (distinct from fund and other account performance). This performance bonus may be in the form of cash and/or a deferred cash award, at the discretion of management. A deferred cash award is issued for a cash value and becomes payable over a three-year vesting period if the portfolio manager remains in the continuous employ of MFS or its affiliates. During the vesting period, the value of the unfunded deferred cash award will fluctuate as though the portfolio manager had invested the cash value of the award in an MFS Fund(s) selected by the portfolio manager. A selected fund may be, but is not required to be, a fund that is managed by the portfolio manager.
With respect to Mr. Adams, his compensation reflects his broader role within MFS as Chief Investment Officer-Global Fixed Income in addition to being a portfolio manager. His performance bonus is based on a combination of quantitative and qualitative factors, generally with more weight given to the former and less weight given to the latter. The quantitative portion is based on overall group investment performance and business performance metrics. The qualitative portion is based on the results of an annual internal review process conducted by the Chief Executive Officer which takes into account his broad leadership responsibilities. This performance bonus may be in the form of cash and/or a deferred cash award, at the discretion of management. A deferred cash award is issued for a cash value and becomes payable over a three-year vesting period if the portfolio manager remains in the continuous employ of MFS or its affiliates. During the vesting period, the value of the unfunded deferred cash award will fluctuate as though the portfolio manager had invested the cash value of the award in an MFS Fund(s) selected by the portfolio manager. A selected fund may be, but is not required to be, a fund that is managed by the portfolio manager.
Portfolio managers also typically benefit from the opportunity to participate in the MFS Equity Plan. Equity interests are awarded by management, on a discretionary basis, taking into account tenure at MFS, contribution to the investment process, and other factors.
Table of Contents
Finally, portfolio managers also participate in benefit plans (including a defined contribution plan and health and other insurance plans) and programs available generally to other employees of MFS. The percentage such benefits represent of any portfolio manager’s compensation depends upon the length of the individual’s tenure at MFS and salary level, as well as other factors.
Ownership of Fund Shares
The following table shows the dollar range of equity securities of the Fund beneficially owned by the Fund’s portfolio manager(s) as of the Fund’s fiscal year ended October 31, 2017. The following dollar ranges apply:
N. None
A. $1 – $10,000
B. $10,001 – $50,000
C. $50,001 – $100,000
D. $100,001 – $500,000
E. $500,001 – $1,000,000
F. Over $1,000,000
| Name of Portfolio Manager |
Dollar Range of Equity Securities in Fund | |
| William Adams |
N | |
| Ward Brown |
N | |
| Nevin Chitkara |
N | |
| David Cole |
N | |
| Matt Ryan |
N | |
| Michael Skatrud1 |
N |
| 1 | Mr. Skatrud became a Portfolio Manager of the Fund on March 1, 2018. Information is as of March 1, 2018. |
Other Accounts
In addition to the Fund, each portfolio manager of the Fund is named as a portfolio manager of certain other accounts managed or subadvised by MFS or an affiliate. The number and assets of these accounts were as follows as of the Fund’s fiscal year ended October 31, 2017:
| Registered Investment Companies* |
Other Pooled Investment Vehicles |
Other Accounts | ||||||||||||||||||||||
| Name |
Number of Accounts |
Total Assets |
Number of Accounts |
Total Assets | Number of Accounts |
Total Assets | ||||||||||||||||||
| William Adams |
12 | $ | 9.2 billion | 6 | $ | 1.1 billion | 1 | $ | 108.4 million | |||||||||||||||
| Ward Brown |
9 | $ | 12.3 billion | 6 | $ | 3.7 billion | 3 | $ | 1.2 billion | |||||||||||||||
| Nevin Chitkara |
18 | $ | 75.2 billion | 8 | $ | 7.5 billion | 40 | $ | 23.0 billion | |||||||||||||||
| David Cole |
11 | $ | 9.2 billion | 4 | $ | 1.2 billion | 1 | $ | 108.4 million | |||||||||||||||
| Matt Ryan |
11 | $ | 12.9 billion | 7 | $ | 4.4 billion | 3 | $ | 1.2 billion | |||||||||||||||
| Michael Skatrud1 (Became a Portfolio Manager of the Fund on March 1, 2018) |
11 | $ | 8.8 billion | 5 | $ | 910.1 million | 1 | $ | 57.2 million | |||||||||||||||
| * | Includes the Fund. |
| 1 | Account information is as of March 1, 2018. |
Table of Contents
Advisory fees are not based upon performance of any of the accounts identified in the table above.
Potential Conflicts of Interest
MFS seeks to identify potential conflicts of interest resulting from a portfolio manager’s management of both the Fund and other accounts, and has adopted policies and procedures designed to address such potential conflicts.
The management of multiple funds and accounts (including proprietary accounts) gives rise to conflicts of interest if the funds and accounts have different objectives and strategies, benchmarks, time horizons and fees as a portfolio manager must allocate his or her time and investment ideas across multiple funds and accounts. In certain instances, there are securities which are suitable for the Fund’s portfolio as well as for accounts of MFS or its subsidiaries with similar investment objectives. The Fund’s trade allocation policies may give rise to conflicts of interest if the Fund’s orders do not get fully executed or are delayed in getting executed due to being aggregated with those of other accounts of MFS or its subsidiaries. A portfolio manager may execute transactions for another fund or account that may adversely affect the value of the Fund’s investments. Investments selected for funds or accounts other than the Fund may outperform investments selected for the Fund.
When two or more clients are simultaneously engaged in the purchase or sale of the same security, the securities are allocated among clients in a manner believed by MFS to be fair and equitable to each. Allocations may be based on many factors and may not always be pro rata based on assets managed. The allocation methodology could have a detrimental effect on the price or volume of the security as far as the Fund is concerned.
MFS and/or a portfolio manager may have a financial incentive to allocate favorable or limited opportunity investments or structure the timing of investments to favor accounts other than the Fund, for instance, those that pay a higher advisory fee and/or have a performance adjustment and/or include an investment by the portfolio manager.
Table of Contents
| ITEM 9. | PURCHASES OF EQUITY SECURITIES BY CLOSED-END MANAGEMENT INVESTMENT COMPANY AND AFFILIATED PURCHASERS. |
MFS Special Value Trust
| Period |
(a) Total number of Shares Purchased |
(b) Average Price Paid per Share |
(c) Total Number of Shares Purchased as Part of Publicly Announced Plans or Programs |
(d) Maximum Number (or Approximate Dollar Value) of Shares that May Yet Be Purchased under the Plans or Programs |
||||||||||||
| 11/01/17-11/30/17 |
0 | N/A | 0 | 710,046 | ||||||||||||
| 12/01/17-12/31/17 |
0 | N/A | 0 | 710,046 | ||||||||||||
| 1/01/18-1/31/18 |
0 | N/A | 0 | 710,046 | ||||||||||||
| 2/01/18-2/28/18 |
0 | N/A | 0 | 710,046 | ||||||||||||
| 3/01/18-3/31/18 |
0 | N/A | 0 | 710,046 | ||||||||||||
| 4/01/18-4/30/18 |
0 | N/A | 0 | 710,046 | ||||||||||||
| Total |
||||||||||||||||
Note: The Board approved procedures to repurchase shares and reviews the results periodically. The notification to shareholders of the program is part of the semi-annual and annual reports sent to shareholders. These annual programs begin on October 1st of each year. The programs conform to the conditions of Rule 10b-18 of the Securities Exchange Act of 1934 and limit the aggregate number of shares that may be purchased in each annual period (October 1 through the following September 30) to 10% of the Registrant’s outstanding shares as of the first day of the plan year (October 1). The aggregate number of shares available for purchase for the October 1, 2017 plan year is 710,046.
| ITEM 10. | SUBMISSION OF MATTERS TO A VOTE OF SECURITY HOLDERS. |
There were no material changes to the procedures by which shareholders may send recommendations to the Board for nominees to the Registrant’s Board since the Registrant last provided disclosure as to such procedures in response to the requirements of Item 407 (c)(2)(iv) of Regulation S-K or this Item.
Table of Contents
| ITEM 11. | CONTROLS AND PROCEDURES. |
| (a) | Based upon their evaluation of the registrant’s disclosure controls and procedures (as defined in Rule 30a-3(c) under the Investment Company Act of 1940 (the “Act”)) as conducted within 90 days of the filing date of this Form N-CSR, the registrant’s principal financial officer and principal executive officer have concluded that those disclosure controls and procedures provide reasonable assurance that the material information required to be disclosed by the registrant on this report is recorded, processed, summarized and reported within the time periods specified in the Securities and Exchange Commission’s rules and forms. |
| (b) | There were no changes in the registrant’s internal controls over financial reporting (as defined in Rule 30a-3(d) under the Act) that occurred during the second fiscal quarter covered by the report that has materially affected, or is reasonably likely to materially affect, the registrant’s internal control over financial reporting. |
| ITEM 12. | DISCLOSURE OF SECURITIES LENDING ACTIVITIES FOR CLOSED-END MANAGEMENT INVESTMENT COMPANIES. |
Not applicable for semi-annual reports.
| ITEM 13. | EXHIBITS. |
| (a) | File the exhibits listed below as part of this form. Letter or number the exhibits in the sequence indicated. |
| (1) | Any code of ethics, or amendment thereto, that is the subject of the disclosure required by Item 2, to the extent that the registrant intends to satisfy the Item 2 requirements through filing of an exhibit. |
| (2) | A separate certification for each principal executive officer and principal financial officer of the registrant as required by Rule 30a-2(a) under the Act (17 CFR 270.30a-2): Attached hereto. |
| (3) | Notices to Trust’s common shareholders in accordance with Investment Company Act Section 19(a) and Rule 19a-1. Attached hereto. |
| (b) | If the report is filed under Section 13(a) or 15(d) of the Exchange Act, provide the certifications required by Rule 30a-2(b) under the Act (17 CFR 270.30a-2(b)), Rule 13a-14(b) or Rule 15d-14(b) under the Exchange Act (17 CFR 240.13a-14(b) or 240.15d-14(b)) and Section 1350 of Chapter 63 of Title 18 of the United States Code (18 U.S.C. 1350) as an exhibit. A certification furnished pursuant to this paragraph will not be deemed “filed” for the purposes of Section 18 of the Exchange Act (15 U.S.C. 78r), or otherwise subject to the liability of that section. Such certification will not be deemed to be incorporated by reference into any filing under the Securities Act of 1933 or the Exchange Act, except to the extent that the registrant specifically incorporates it by reference: Attached hereto. |
Table of Contents
Notice
A copy of the Amended and Restated Declaration of Trust of the Registrant is on file with the Secretary of State of the Commonwealth of Massachusetts and notice is hereby given that this instrument is executed on behalf of the Registrant by an officer of the Registrant as an officer and not individually and the obligations of or arising out of this instrument are not binding upon any of the Trustees or shareholders individually, but are binding only upon the assets and property of the respective constituent series of the Registrant.
Table of Contents
SIGNATURES
Pursuant to the requirements of the Securities Exchange Act of 1934 and the Investment Company Act of 1940, the registrant has duly caused this report to be signed on its behalf by the undersigned, thereunto duly authorized.
Registrant MFS SPECIAL VALUE TRUST
| By (Signature and Title)* | DAVID L. DILORENZO | |
| David L. DiLorenzo, President |
Date: June 18, 2018
Pursuant to the requirements of the Securities Exchange Act of 1934 and the Investment Company Act of 1940, this report has been signed below by the following persons on behalf of the registrant and in the capacities and on the dates indicated.
| By (Signature and Title)* | DAVID L. DILORENZO | |
| David L. DiLorenzo, President (Principal Executive Officer) |
Date: June 18, 2018
| By (Signature and Title)* | JAMES O. YOST | |
| James O. Yost, Treasurer (Principal Financial Officer and Accounting Officer) |
Date: June 18, 2018
| * | Print name and title of each signing officer under his or her signature. |
EX-99.12(a)(3)

MFS® Special Value Trust
P.O. Box 43078
Providence, RI 02940-3078
Notice to shareholders — Source of distribution
| Distribution period |
April 2018 | |||
| Distribution amount per share |
$ | 0.04842 |
The following table sets forth the estimated amounts of the current distribution and the cumulative distributions paid this fiscal year to date from the following sources: net investment income, net realized short-term capital gains, net realized long-term capital gains and return of capital or other capital source. The fund’s fiscal year begins each November 1st. All amounts are expressed per common share.
| Current distribution |
% Breakdown of current distribution |
Total cumulative distributions for the fiscal year to date |
% Breakdown of the total cumulative distributions for the fiscal year to date |
|||||||||||||
| Net Investment Income |
$ | 0.01338 | 28 | % | $ | 0.07906 | 27 | % | ||||||||
| Net Realized ST Cap Gains |
0.00000 | 0 | % | 0.00000 | 0 | % | ||||||||||
| Net Realized LT Cap Gains |
0.01780 | 37 | % | 0.05703 | 19 | % | ||||||||||
| Return of Capital or Other Capital Source |
0.01724 | 35 | % | 0.16218 | 54 | % | ||||||||||
|
|
|
|
|
|
|
|
|
|||||||||
| Total (per common share) |
$ | 0.04842 | 100 | % | $ | 0.29827 | 100 | % | ||||||||
| Average annual total return (in relation to NAV) for the five years ended 03-31-2018 |
|
6.29 | % | |||||||||||||
|
|
|
|||||||||||||||
| Annualized current distribution rate expressed as a percentage of month end NAV as of 03-31-2018 |
|
10.12 | % | |||||||||||||
|
|
|
|||||||||||||||
| Cumulative total return (in relation to NAV) for the fiscal year through 03-31-2018 |
|
-0.79 | % | |||||||||||||
|
|
|
|||||||||||||||
| Cumulative fiscal year distributions as a percentage of NAV as of 03-31-2018 |
|
5.20 | % | |||||||||||||
|
|
|
|||||||||||||||
You should not draw any conclusions about the fund’s investment performance from the amount of this distribution or from the terms of the fund’s managed distribution plan.
The fund estimates that it has distributed more than its income and capital gains; therefore, a portion of your distribution may be a return of capital. A return of capital may occur, for example, when some or all of the money that you invested in the fund is paid back to you. A return of capital distribution does not necessarily reflect the fund’s investment performance and should not be confused with “yield” or “income.”
The amounts and sources of distributions reported in this notice are only estimates and are not being provided for tax-reporting purposes. The actual amounts and sources of the amounts for tax-reporting purposes will depend upon the fund’s investment experience during the remainder of its fiscal year and may be subject to changes based on tax regulations. The fund will send you a Form 1099-DIV for the calendar year that will tell you how to report these distributions for federal income tax purposes.
If you have any questions regarding this information, please call our fund service department at 1-800-637-2304 any business day from 9 a.m. to 5 p.m. Eastern time.
EX-99.302CERT
MFS SPECIAL VALUE TRUST
CERTIFICATION PURSUANT TO SECTION 302 OF THE SARBANES-OXLEY ACT
| I, | James O. Yost, certify that: |
| 1. | I have reviewed this report on Form N-CSR of MFS Special Value Trust; |
| 2. | Based on my knowledge, this report does not contain any untrue statement of a material fact or omit to state a material fact necessary to make the statements made, in light of the circumstances under which such statements were made, not misleading with respect to the period covered by this report; |
| 3. | Based on my knowledge, the financial statements, and other financial information included in this report, fairly present in all material respects the financial condition, results of operations, changes in net assets, and cash flows (if the financial statements are required to include a statement of cash flows) of the registrant as of, and for, the periods presented in this report; |
| 4. | The registrant’s other certifying officer and I are responsible for establishing and maintaining disclosure controls and procedures (as defined in Rule 30a-3(c) under the Investment Company Act of 1940) and internal control over financial reporting (as defined in Rule 30a-3(d) under the Investment Company Act of 1940) for the registrant and have: |
| a. | designed such disclosure controls and procedures, or caused such disclosure controls and procedures to be designed under our supervision, to ensure that material information relating to the registrant, including its consolidated subsidiaries, is made known to us by others within those entities, particularly during the period in which this report is being prepared; |
| b. | designed such internal control over financial reporting, or caused such internal control over financial reporting to be designed under our supervision, to provide reasonable assurance regarding the reliability of financial reporting and the preparation of financial statements for external purposes in accordance with generally accepted accounting principles; |
| c. | evaluated the effectiveness of the registrant’s disclosure controls and procedures and presented in this report our conclusions about the effectiveness of the disclosure controls and procedures as of a date within 90 days prior to the filing date of this report based on such evaluation; and |
| d. | disclosed in this report any change in the registrant’s internal control over financial reporting that occurred during the second fiscal quarter of the period covered by the report that has materially affected, or is reasonably likely to materially affect, the registrant’s internal control over financial reporting; and |
| 5. | The registrant’s other certifying officer and I have disclosed to the registrant’s auditors and the audit committee of the registrant’s board of directors (or persons performing the equivalent functions): |
| a. | all significant deficiencies and material weaknesses in the design or operation of internal control over financial reporting which are reasonably likely to adversely affect the registrant’s ability to record, process, summarize, and report financial information; and |
| b. | any fraud, whether or not material, that involves management or other employees who have a significant role in the registrant’s internal control over financial reporting. |
| Date: June 18, 2018 | JAMES O. YOST | |||
| James O. Yost | ||||
| Treasurer (Principal Financial Officer and Accounting Officer) |
EX-99.302CERT
MFS SPECIAL VALUE TRUST
CERTIFICATION PURSUANT TO SECTION 302 OF THE SARBANES-OXLEY ACT
| I, | David L. DiLorenzo, certify that: |
| 1. | I have reviewed this report on Form N-CSR of MFS Special Value Trust; |
| 2. | Based on my knowledge, this report does not contain any untrue statement of a material fact or omit to state a material fact necessary to make the statements made, in light of the circumstances under which such statements were made, not misleading with respect to the period covered by this report; |
| 3. | Based on my knowledge, the financial statements, and other financial information included in this report, fairly present in all material respects the financial condition, results of operations, changes in net assets, and cash flows (if the financial statements are required to include a statement of cash flows) of the registrant as of, and for, the periods presented in this report; |
| 4. | The registrant’s other certifying officer and I are responsible for establishing and maintaining disclosure controls and procedures (as defined in Rule 30a-3(c) under the Investment Company Act of 1940) and internal control over financial reporting (as defined in Rule 30a-3(d) under the Investment Company Act of 1940) for the registrant and have: |
| a. | designed such disclosure controls and procedures, or caused such disclosure controls and procedures to be designed under our supervision, to ensure that material information relating to the registrant, including its consolidated subsidiaries, is made known to us by others within those entities, particularly during the period in which this report is being prepared; |
| b. | designed such internal control over financial reporting, or caused such internal control over financial reporting to be designed under our supervision, to provide reasonable assurance regarding the reliability of financial reporting and the preparation of financial statements for external purposes in accordance with generally accepted accounting principles; |
| c. | evaluated the effectiveness of the registrant’s disclosure controls and procedures and presented in this report our conclusions about the effectiveness of the disclosure controls and procedures as of a date within 90 days prior to the filing date of this report based on such evaluation; and |
| d. | disclosed in this report any change in the registrant’s internal control over financial reporting that occurred during the second fiscal quarter of the period covered by the report that has materially affected, or is reasonably likely to materially affect, the registrant’s internal control over financial reporting; and |
| 5. | The registrant’s other certifying officer and I have disclosed to the registrant’s auditors and the audit committee of the registrant’s board of directors (or persons performing the equivalent functions): |
| a. | all significant deficiencies and material weaknesses in the design or operation of internal control over financial reporting which are reasonably likely to adversely affect the registrant’s ability to record, process, summarize, and report financial information; and |
| b. | any fraud, whether or not material, that involves management or other employees who have a significant role in the registrant’s internal control over financial reporting. |
| Date: June 18, 2018 | DAVID L. DILORENZO | |||
| David L. DiLorenzo | ||||
| President (Principal Executive Officer) |
EX-99.906CERT
MFS SPECIAL VALUE TRUST
CERTIFICATION PURSUANT TO SECTION 906 OF THE SARBANES-OXLEY ACT
| I, | James O. Yost, certify that, to my knowledge: |
| 1. | The Form N-CSR (the “Report”) of MFS Special Value Trust (the “Registrant”) fully complies for the period covered by the Report with the requirements of Section 13(a) or 15(d) of the Securities Exchange Act of 1934; and |
| 2. | The information contained in the Report fairly presents, in all material respects, the financial condition and results of operations of the Registrant. |
| Date: June 18, 2018 | JAMES O. YOST | |||
| James O. Yost | ||||
| Treasurer (Principal Financial Officer and Accounting Officer) |
A signed original of this written statement required by Section 906 has been provided to the Registrant and will be retained by the Registrant and furnished to the Securities and Exchange Commission or its staff upon request.
EX-99.906CERT
MFS SPECIAL VALUE TRUST
CERTIFICATION PURSUANT TO SECTION 906 OF THE SARBANES-OXLEY ACT
| I, | David L. DiLorenzo, certify that, to my knowledge: |
| 1. | The Form N-CSR (the “Report”) of MFS Special Value Trust (the “Registrant”) fully complies for the period covered by the Report with the requirements of Section 13(a) or 15(d) of the Securities Exchange Act of 1934; and |
| 2. | The information contained in the Report fairly presents, in all material respects, the financial condition and results of operations of the Registrant. |
| Date: June 18, 2018 | DAVID L. DILORENZO | |||
| David L. DiLorenzo | ||||
| President (Principal Executive Officer) |
A signed original of this written statement required by Section 906 has been provided to the Registrant and will be retained by the Registrant and furnished to the Securities and Exchange Commission or its staff upon request.
Serious News for Serious Traders! Try StreetInsider.com Premium Free!
You May Also Be Interested In
- Introducing SkyNest by NaturePaws: The Ultimate Hammock Chair for Outdoor Relaxation and Home Comfort
- Heineken Holding N.V. Annual General Meeting of Shareholders adopts all proposals
- MOHELA Awarded Top Workplace by USA Today for its Culture, Care, and Commitment to Borrowers
Create E-mail Alert Related Categories
SEC FilingsSign up for StreetInsider Free!
Receive full access to all new and archived articles, unlimited portfolio tracking, e-mail alerts, custom newswires and RSS feeds - and more!
