

Form N-CSRS MFS MULTIMARKET INCOME For: Apr 30
 Tweet
Tweet Share
ShareTable of Contents
UNITED STATES
SECURITIES AND EXCHANGE COMMISSION
Washington, D.C. 20549
FORM N-CSR
CERTIFIED SHAREHOLDER REPORT OF
REGISTERED MANAGEMENT INVESTMENT COMPANIES
Investment Company Act file number 811-04975
MFS MULTIMARKET INCOME TRUST
(Exact name of registrant as specified in charter)
111 Huntington Avenue, Boston, Massachusetts 02199
(Address of principal executive offices) (Zip code)
Christopher R. Bohane
Massachusetts Financial Services Company
111 Huntington Avenue
Boston, Massachusetts 02199
(Name and address of agents for service)
Registrant’s telephone number, including area code: (617) 954-5000
Date of fiscal year end: October 31
Date of reporting period: April 30, 2020
Table of Contents
| ITEM 1. | REPORTS TO STOCKHOLDERS. |
Table of Contents
Semiannual Report
April 30, 2020

MFS® Multimarket Income Trust

Beginning on January 1, 2021, as permitted by regulations adopted by the U.S. Securities and Exchange Commission, paper copies of the fund’s annual and semiannual shareholder reports will no longer be sent by mail, unless you specifically request paper copies of the reports. Instead, the complete reports will be made available on the fund’s Web site, and you will be notified by mail each time a report is posted and provided with a Web site link to access the report.
If you are already signed up to receive shareholder reports by email, you will not be affected by this change and you need not take any action. You may sign up to receive shareholder reports and other communications from the fund by email by contacting your financial intermediary (such as a broker-dealer or bank) or, if you hold your shares directly with the fund, by calling 1-800-637-2304 or by logging into your Investor Center account at www.computershare.com/investor.
Beginning on January 1, 2019, you may elect to receive all future reports in paper free of charge. Contact your financial intermediary to request that you continue to receive paper copies of your shareholder reports. If you invest directly with the fund, you can call 1-800-637-2304 to let the fund know that you wish to continue receiving paper copies of your shareholder reports. Your election to receive reports in paper will apply to all funds held in your account if you invest through your financial intermediary or all funds held with the MFS fund complex if you invest directly.
MMT-SEM
Table of Contents
MANAGED DISTRIBUTION POLICY DISCLOSURE
The MFS Multimarket Income Trust’s (the fund) Board of Trustees adopted a managed distribution policy. The fund seeks to pay monthly distributions based on an annual rate of 8.00% of the fund’s average monthly net asset value. The primary purpose of the managed distribution policy is to provide shareholders with a constant, but not guaranteed, fixed minimum rate of distribution each month. You should not draw any conclusions about the fund’s investment performance from the amount of the current distribution or from the terms of the fund’s managed distribution policy. The Board may amend or terminate the managed distribution policy at any time without prior notice to fund shareholders. The amendment or termination of the managed distribution policy could have an adverse effect on the market price of the fund’s shares.
With each distribution, the fund will issue a notice to shareholders and an accompanying press release which will provide detailed information regarding the amount and composition of the distribution and other related information. The amounts and sources of distributions reported in the notice to shareholders are only estimates and are not being provided for tax reporting purposes. The actual amounts and sources of the amounts for tax reporting purposes will depend upon the fund’s investment experience during the remainder of its fiscal year and may be subject to changes based on tax regulations. The fund will send you a Form 1099-DIV for the calendar year that will tell you how to report these distributions for federal income tax purposes. Please refer to “Tax Matters and Distributions” under Note 2 of the Notes to Financial Statements for information regarding the tax character of the fund’s distributions.
Under a managed distribution policy the fund may at times distribute more than its net investment income and net realized capital gains; therefore, a portion of your distribution may result in a return of capital. A return of capital may occur, for example, when some or all of the money that you invested in the fund is paid back to you. Any such returns of capital will decrease the fund’s total assets and, therefore, could have the effect of increasing the fund’s expense ratio. In addition, in order to make the level of distributions called for under its managed distribution policy, the fund may have to sell portfolio securities at a less than opportune time. A return of capital does not necessarily reflect the fund’s investment performance and should not be confused with ‘yield’ or ‘income’. The fund’s total return in relation to changes in net asset value is presented in the Financial Highlights.
Table of Contents
MFS® Multimarket Income Trust
New York Stock Exchange Symbol: MMT
NOT FDIC INSURED • MAY LOSE VALUE • NO BANK GUARANTEE
Table of Contents

LETTER FROM THE EXECUTIVE CHAIR
Dear Shareholders:
Markets experienced dramatic swings in early 2020 as the coronavirus pandemic crippled the global economy for a time. Optimism over the development of vaccines
and therapeutics, along with a decline in cases in countries hit early in the outbreak, has brightened the economic and market outlook during the second quarter, though a great deal of uncertainty remains on how long the aftereffects of the lockdowns will linger.
Global central banks have taken aggressive, coordinated steps to cushion the economic and market fallout related to the virus, and governments are undertaking unprecedented levels of fiscal stimulus. As uncertainty recedes, these measures can help build a supportive environment and encourage economic recovery. In the aftermath of the crisis, there are likely to be societal changes as
households, businesses, and governments adjust to a new reality, and these alterations could change the investment landscape. For investors, occurrences such as the COVID-19 outbreak demonstrate the importance of having a deep understanding of company fundamentals, and our global research platform has been built to do just that.
Here at MFS®, we aim to help our clients navigate the growing complexity of the markets and world economies. Our long-term investment philosophy and commitment to the responsible allocation of capital allow us to tune out the noise and uncover what we believe are the best, most durable investment opportunities in the market. Through our powerful global investment platform, we combine collective expertise, thoughtful risk management, and long-term discipline to create sustainable value for investors.
Respectfully,

Robert J. Manning
Executive Chair
MFS Investment Management
June 16, 2020
The opinions expressed in this letter are subject to change and may not be relied upon for investment advice. No forecasts can be guaranteed.
1
Table of Contents
2
Table of Contents
Portfolio Composition – continued
| (a) | For all securities other than those specifically described below, ratings are assigned to underlying securities utilizing ratings from Moody’s, Fitch, and Standard & Poor’s rating agencies and applying the following hierarchy: If all three agencies provide a rating, the middle rating (after dropping the highest and lowest ratings) is assigned; if two of the three agencies rate a security, the lower of the two is assigned. Ratings are shown in the S&P and Fitch scale (e.g., AAA). Securities rated BBB or higher are considered investment grade. All ratings are subject to change. U.S. Government includes securities issued by the U.S. Department of the Treasury. Federal Agencies includes rated and unrated U.S. Agency fixed-income securities, U.S. Agency mortgage-backed securities, and collateralized mortgage obligations of U.S. Agency mortgage-backed securities. Not Rated includes fixed income securities and fixed income derivatives, which have not been rated by any rating agency. Non-Fixed Income includes equity securities (including convertible bonds and equity derivatives) and/or commodity-linked derivatives. The fund may or may not have held all of these instruments on this date. The fund is not rated by these agencies. |
| (d) | Duration is a measure of how much a bond’s price is likely to fluctuate with general changes in interest rates, e.g., if rates rise 1.00%, a bond with a 5-year duration is likely to lose about 5.00% of its value due to the interest rate move. |
| (i) | For purposes of this presentation, the components include the value of securities, and reflect the impact of the equivalent exposure of derivative positions, if any. These amounts may be negative from time to time. Equivalent exposure is a calculated amount that translates the derivative position into a reasonable approximation of the amount of the underlying asset that the portfolio would have to hold at a given point in time to have the same price sensitivity that results from the portfolio’s ownership of the derivative contract. When dealing with derivatives, equivalent exposure is a more representative measure of the potential impact of a position on portfolio performance than value. The bond component will include any accrued interest amounts. |
| (m) | In determining each instrument’s effective maturity for purposes of calculating the fund’s dollar-weighted average effective maturity, MFS uses the instrument’s stated maturity or, if applicable, an earlier date on which MFS believes it is probable that a maturity-shortening device (such as a put, pre-refunding or prepayment) will cause the instrument to be repaid. Such an earlier date can be substantially shorter than the instrument’s stated maturity. |
| (v) | For purposes of this presentation, market value of fixed income and/or equity derivatives, if any, is included in Cash & Cash Equivalents. |
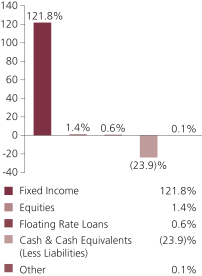
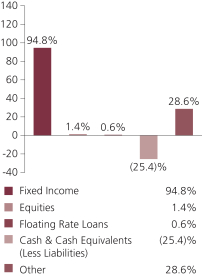
Where the fund holds convertible bonds, they are treated as part of the equity portion of the portfolio.
Cash & Cash Equivalents includes any cash, investments in money market funds, short-term securities, and other assets less liabilities. Please see the Statement of Assets and Liabilities for additional information related to the fund’s cash position and other assets and liabilities.
From time to time Cash & Cash Equivalents may be negative due to borrowings for leverage transactions and/or timing of cash receipts and disbursements.
Other includes equivalent exposure from currency derivatives and/or any offsets to derivative positions.
Percentages are based on net assets as of April 30, 2020.
The portfolio is actively managed and current holdings may be different.
3
Table of Contents
| Portfolio Manager | Primary Role | Since | Title and Five Year History | |||
| Robert Spector | Lead Portfolio Manager |
2017 | Investment Officer of MFS; employed in the investment management area of MFS since 2011. | |||
| Ward Brown | Emerging Markets Debt Instruments Portfolio Manager |
2012 | Investment Officer of MFS; employed in the investment management area of MFS since 2005. | |||
| David Cole | Below Investment Grade Debt Instruments Portfolio Manager |
2006 | Investment Officer of MFS; employed in the investment management area of MFS since 2004. | |||
| Pilar Gomez-Bravo | Debt Instruments Portfolio Manager |
2013 | Investment Officer of MFS; employed in the investment management area of MFS since 2013. | |||
| Andy Li | Investment Grade Debt Instruments Portfolio Manager |
2019 | Investment Officer of MFS; employed in the investment management area of MFS since 2018; Portfolio Manager of Man GLG from 2014 to 2018; Portfolio Manager of ECM Asset Management prior to April 2014. | |||
| Henry Peabody | Investment Grade Debt Instruments Portfolio Manager |
2019 | Investment Officer of MFS; employed in the investment management area of MFS since July 2019; Portfolio Manager and Analyst at Eaton Vance Management from 2014 to June 2019; Vice President/Research Analyst at Eaton Vance Management from July 2013 to October 2014. | |||
| Robert Persons | Investment Grade Debt Instruments Portfolio Manager |
2013 | Investment Officer of MFS; employed in the investment management area of MFS since 2000. | |||
| Matt Ryan | Emerging Markets Debt Instruments Portfolio Manager |
2004 | Investment Officer of MFS; employed in the investment management area of MFS since 1997. | |||
| Michael Skatrud | Below Investment Grade Debt Portfolio Manager |
2018 | Investment Officer of MFS; employed in the investment management area of MFS since 2013. | |||
4
Table of Contents
The fund’s shares may trade at a discount or premium to net asset value. When fund shares trade at a premium, buyers pay more than the net asset value underlying fund shares, and shares purchased at a premium would receive less than the amount paid for them in the event of the fund’s concurrent liquidation.
The fund’s target annual distribution rate is calculated based on an annual rate of 8.00% of the fund’s average monthly net asset value, not a fixed share price, and the fund’s dividend amount will fluctuate with changes in the fund’s average monthly net assets.
In accordance with Section 23(c) of the Investment Company Act of 1940, the fund hereby gives notice that it may from time to time repurchase shares of the fund in the open market at the option of the Board of Trustees and on such terms as the Trustees shall determine.
5
Table of Contents
4/30/20 (unaudited)
The Portfolio of Investments is a complete list of all securities owned by your fund. It is categorized by broad-based asset classes.
| Issuer | Shares/Par | Value ($) | ||||||
| Bonds - 121.8% | ||||||||
| Aerospace - 2.5% | ||||||||
| Airbus SE, 2.375%, 4/07/2032 | EUR | 100,000 | $ | 121,289 | ||||
| Boeing Co., 5.15%, 5/01/2030 | $ | 1,025,000 | 1,025,000 | |||||
| Bombardier, Inc., 7.5%, 3/15/2025 (n) | 1,108,000 | 714,660 | ||||||
| Bombardier, Inc., 7.875%, 4/15/2027 (n) | 900,000 | 582,750 | ||||||
| F-Brasile S.p.A./F-Brasile U.S. LLC, 7.375%, 8/15/2026 (n) | 605,000 | 412,913 | ||||||
| Huntington Ingalls Industries, Inc., 3.844%, 5/01/2025 (n) | 324,000 | 340,644 | ||||||
| Huntington Ingalls Industries, Inc., 3.483%, 12/01/2027 | 290,000 | 297,307 | ||||||
| L3Harris Technologies, Inc., 3.85%, 6/15/2023 (n) | 600,000 | 628,740 | ||||||
| Lockheed Martin Corp., 3.55%, 1/15/2026 | 406,000 | 455,995 | ||||||
| Moog, Inc., 4.25%, 12/15/2027 (n) | 1,365,000 | 1,279,688 | ||||||
| TransDigm, Inc., 6.5%, 7/15/2024 | 635,000 | 586,581 | ||||||
| TransDigm, Inc., 6.25%, 3/15/2026 (n) | 1,327,000 | 1,298,801 | ||||||
| TransDigm, Inc., 6.375%, 6/15/2026 | 605,000 | 517,759 | ||||||
| TransDigm, Inc., 5.5%, 11/15/2027 (n) | 1,060,000 | 895,700 | ||||||
|
|
|
|||||||
| $ | 9,157,827 | |||||||
| Apparel Manufacturers - 0.1% | ||||||||
| Tapestry, Inc., 4.125%, 7/15/2027 | $ | 511,000 | $ | 436,627 | ||||
| Asset-Backed & Securitized - 3.7% | ||||||||
| AA Bond Co. Ltd., 2.75%, 7/31/2023 | GBP | 625,000 | $ | 710,832 | ||||
| AA Bond Co. Ltd., 6.269%, 7/31/2025 | 250,000 | 293,139 | ||||||
| Bayview Financial Revolving Mortgage Loan Trust, FLR, 2.04% (LIBOR - 1mo. + 1.6%), 12/28/2040 (n) | $ | 923,812 | 902,108 | |||||
| Capital Automotive, 2020-1A, “A4”, REIT, 3.19%, 2/15/2050 (n) | 145,449 | 139,819 | ||||||
| Capital Automotive, 2020-1A, “B1”, REIT, 4.17%, 2/15/2050 (n) | 437,500 | 392,442 | ||||||
| Crest Ltd., CDO, 7%, (0.001% cash or 7% PIK) 1/28/2040 (a)(p) | 3,146,211 | 77,051 | ||||||
| GS Mortgage Securities Trust, 2019-GSA1, “A4”, 3.047%, 11/10/2052 | 2,000,000 | 2,116,065 | ||||||
| HarbourView CLO VII Ltd., 7RA, “B”, FLR, 2.835% (LIBOR -3mo. + 1.7%), 7/18/2031 (n) | 2,500,000 | 2,204,098 | ||||||
| Lehman Brothers Commercial Conduit Mortgage Trust, 1.112%, 2/18/2030 (i) | 53,770 | 1 | ||||||
| Loomis, Sayles & Co., CLO, 2015-2A, “A1R”, FLR, 2.118% (LIBOR - 3mo. + 0.9%), 4/15/2028 (n) | 2,482,317 | 2,370,613 | ||||||
| Morgan Stanley Capital I Trust, “2019-H7, ”A4“, 3.261%, 7/15/2052 | 1,289,610 | 1,382,371 | ||||||
| Octagon Investment Partners XVII Ltd., 2013-1A, ”BR2“, FLR, 2.391% (LIBOR - 3mo. + 1.4%), 1/25/2031 (n) | 2,139,000 | 1,996,168 | ||||||
6
Table of Contents
Portfolio of Investments (unaudited) – continued
| Issuer | Shares/Par | Value ($) | ||||||
| Bonds - continued | ||||||||
| Asset-Backed & Securitized - continued | ||||||||
| Securitized Term Auto Receivable Trust, 2019-CRTA, ”B“, 2.453%, 3/25/2026 (n) | $ | 417,542 | $ | 418,294 | ||||
| Securitized Term Auto Receivable Trust, 2019-CRTA, ”C“, 2.849%, 3/25/2026 (n) | 535,352 | 536,313 | ||||||
|
|
|
|||||||
| $ | 13,539,314 | |||||||
| Automotive - 1.9% | ||||||||
| Adient Global Holdings Ltd., 4.875%, 8/15/2026 (n) | $ | 675,000 | $ | 503,550 | ||||
| Adient US LLC, 7%, 5/15/2026 (n) | 60,000 | 59,700 | ||||||
| Allison Transmission, Inc., 5%, 10/01/2024 (n) | 1,695,000 | 1,627,200 | ||||||
| Allison Transmission, Inc., 5.875%, 6/01/2029 (n) | 405,000 | 392,660 | ||||||
| Dana, Inc., 5.5%, 12/15/2024 | 95,000 | 88,388 | ||||||
| Dana, Inc., 5.375%, 11/15/2027 | 358,000 | 315,935 | ||||||
| Ford Motor Credit Co. LLC, 1.514%, 2/17/2023 | EUR | 200,000 | 195,061 | |||||
| Hyundai Capital America, 6.375%, 4/08/2030 (n) | $ | 626,000 | 675,366 | |||||
| IAA Spinco, Inc., 5.5%, 6/15/2027 (n) | 1,050,000 | 1,047,690 | ||||||
| KAR Auction Services, Inc., 5.125%, 6/01/2025 (n) | 760,000 | 647,292 | ||||||
| Panther BR Aggregator 2 LP/Panther Finance Co., Inc., 8.5%, 5/15/2027 (n) | 820,000 | 694,950 | ||||||
| Volkswagen Financial Services N.V., 4.25%, 10/09/2025 | GBP | 300,000 | 405,883 | |||||
| Volkswagen International Finance N.V., 1.625%, 2/10/2024 | 200,000 | 242,858 | ||||||
|
|
|
|||||||
| $ | 6,896,533 | |||||||
| Broadcasting - 2.6% | ||||||||
| Diamond Sports Group, LLC/Diamond Sports Finance Co., 5.375%, 8/15/2026 (n) | $ | 120,000 | $ | 91,200 | ||||
| Discovery, Inc., 4.125%, 5/15/2029 | 219,000 | 230,097 | ||||||
| iHeartCommunications, Inc., 6.375%, 5/01/2026 (n) | 400,000 | 378,000 | ||||||
| iHeartCommunications, Inc., 8.375%, 5/01/2027 | 500,000 | 411,600 | ||||||
| iHeartCommunications, Inc., 5.25%, 8/15/2027 (n) | 190,000 | 172,425 | ||||||
| Lions Gate Capital Holding Co., 5.875%, 11/01/2024 | 410,000 | 378,225 | ||||||
| MMS USA Financing, Inc., 1.75%, 6/13/2031 | EUR | 1,200,000 | 1,245,552 | |||||
| National CineMedia LLC, 5.875%, 4/15/2028 (n) | $ | 505,000 | 358,550 | |||||
| Netflix, Inc., 5.875%, 2/15/2025 | 1,340,000 | 1,477,806 | ||||||
| Netflix, Inc., 3.625%, 6/15/2025 (n) | 555,000 | 561,937 | ||||||
| Netflix, Inc., 5.875%, 11/15/2028 | 470,000 | 531,500 | ||||||
| Nexstar Escrow Corp., 5.625%, 7/15/2027 (n) | 940,000 | 897,700 | ||||||
| Prosus N.V., 3.68%, 1/21/2030 (n) | 251,000 | 251,214 | ||||||
| RELX Finance B.V., 0.5%, 3/10/2028 | EUR | 100,000 | 105,582 | |||||
| Terrier Media Buyer, Inc., 8.875%, 12/15/2027 (n) | $ | 375,000 | 309,375 | |||||
| ViacomCBS, Inc., 4.375%, 3/15/2043 | 393,000 | 382,675 | ||||||
| WMG Acquisition Corp., 4.875%, 11/01/2024 (n) | 1,080,000 | 1,080,000 | ||||||
| WPP Finance, 3.75%, 9/19/2024 | 352,000 | 365,089 | ||||||
|
|
|
|||||||
| $ | 9,228,527 | |||||||
7
Table of Contents
Portfolio of Investments (unaudited) – continued
| Issuer | Shares/Par | Value ($) | ||||||
| Bonds - continued | ||||||||
| Brokerage & Asset Managers - 1.5% | ||||||||
| Banco BTG Pactual S.A. (Cayman Islands), 4.5%, 1/10/2025 (n) | $ | 800,000 | $ | 748,000 | ||||
| Charles Schwab Corp., 5.375%, 4/30/2070 | 598,000 | 612,203 | ||||||
| E*TRADE Financial Corp., 2.95%, 8/24/2022 | 245,000 | 250,141 | ||||||
| Euroclear Investments S.A., 2.625%, 4/11/2048 | EUR | 400,000 | 446,055 | |||||
| Intercontinental Exchange, Inc., 3.75%, 12/01/2025 | $ | 450,000 | 498,024 | |||||
| Low Income Investment Fund, 3.386%, 7/01/2026 | 185,000 | 183,256 | ||||||
| Low Income Investment Fund, 3.711%, 7/01/2029 | 490,000 | 492,454 | ||||||
| LPL Holdings, Inc., 4.625%, 11/15/2027 (n) | 1,340,000 | 1,279,700 | ||||||
| NASDAQ, Inc., 3.25%, 4/28/2050 | 340,000 | 341,058 | ||||||
| Raymond James Financial, 4.65%, 4/01/2030 | 658,000 | 740,740 | ||||||
|
|
|
|||||||
| $ | 5,591,631 | |||||||
| Building - 4.2% | ||||||||
| ABC Supply Co., Inc., 5.875%, 5/15/2026 (n) | $ | 845,000 | $ | 836,550 | ||||
| ABC Supply Co., Inc., 4%, 1/15/2028 (n) | 1,290,000 | 1,223,978 | ||||||
| Beacon Escrow Corp., 4.875%, 11/01/2025 (n) | 886,000 | 783,003 | ||||||
| Beacon Roofing Supply, Inc., 4.5%, 11/15/2026 (n) | 345,000 | 329,475 | ||||||
| Core & Main LP, 8.625%, (8.625% cash or 9.375% PIK) 9/15/2024 (n)(p) | 330,000 | 313,500 | ||||||
| Core & Main LP, 6.125%, 8/15/2025 (n) | 645,000 | 619,200 | ||||||
| Cornerstone Building Brands, Inc., 8%, 4/15/2026 (n) | 630,000 | 535,317 | ||||||
| CRH America Finance, Inc., 4.5%, 4/04/2048 (n) | 451,000 | 483,176 | ||||||
| CRH SMW Finance DAC, 1.25%, 11/05/2026 | EUR | 105,000 | 116,209 | |||||
| HD Supply, Inc., 5.375%, 10/15/2026 (n) | $ | 1,080,000 | 1,101,492 | |||||
| Holcim Finance (Luxembourg) S.A., 2.375%, 4/09/2025 | EUR | 489,000 | 559,417 | |||||
| James Hardie International Finance Ltd., 4.75%, 1/15/2025 (n) | $ | 560,000 | 546,224 | |||||
| James Hardie International Finance Ltd., 5%, 1/15/2028 (n) | 600,000 | 568,500 | ||||||
| Martin Marietta Materials, Inc., 3.45%, 6/01/2027 | 225,000 | 229,753 | ||||||
| Masco Corp., 4.45%, 4/01/2025 | 170,000 | 179,121 | ||||||
| Masco Corp., 4.375%, 4/01/2026 | 791,000 | 823,675 | ||||||
| New Enterprise Stone & Lime Co., Inc., 10.125%, 4/01/2022 (n) | 490,000 | 486,325 | ||||||
| New Enterprise Stone & Lime Co., Inc., 6.25%, 3/15/2026 (n) | 691,000 | 649,540 | ||||||
| Patrick Industries, Inc., 7.5%, 10/15/2027 (n) | 590,000 | 554,600 | ||||||
| PriSo Acquisition Corp., 9%, 5/15/2023 (n) | 734,000 | 570,898 | ||||||
| SRS Distribution, Inc., 8.25%, 7/01/2026 (n) | 330,000 | 303,039 | ||||||
| Standard Industries, Inc., 5.375%, 11/15/2024 (n) | 1,595,000 | 1,598,987 | ||||||
| Standard Industries, Inc., 6%, 10/15/2025 (n) | 655,000 | 674,650 | ||||||
| Summit Materials LLC/Summit Materials Finance Co., 6.125%, 7/15/2023 | 1,080,000 | 1,081,026 | ||||||
| U.S. Concrete, Inc., 6.375%, 6/01/2024 | 110,000 | 103,868 | ||||||
|
|
|
|||||||
| $ | 15,271,523 | |||||||
8
Table of Contents
Portfolio of Investments (unaudited) – continued
| Issuer | Shares/Par | Value ($) | ||||||
| Bonds - continued | ||||||||
| Business Services - 2.7% | ||||||||
| Ascend Learning LLC, 6.875%, 8/01/2025 (n) | $ | 910,000 | $ | 900,900 | ||||
| CDK Global, Inc., 4.875%, 6/01/2027 | 1,000,000 | 997,500 | ||||||
| CDK Global, Inc., 5.25%, 5/15/2029 (n) | 295,000 | 300,900 | ||||||
| Euronet Worldwide, Inc., 1.375%, 5/22/2026 | EUR | 1,100,000 | 1,137,641 | |||||
| Fidelity National Information Services, Inc., 3.875%, 6/05/2024 | $ | 180,000 | 193,480 | |||||
| Fidelity National Information Services, Inc., 2.602%, 5/21/2025 | GBP | 100,000 | 129,968 | |||||
| Fidelity National Information Services, Inc., 2.25%, 12/03/2029 | 300,000 | 382,339 | ||||||
| Fiserv, Inc., 4.4%, 7/01/2049 | $ | 196,000 | 233,912 | |||||
| Iron Mountain, Inc., REIT, 4.875%, 9/15/2027 (n) | 490,000 | 480,200 | ||||||
| MSCI, Inc., 5.75%, 8/15/2025 (n) | 530,000 | 553,638 | ||||||
| MSCI, Inc., 4.75%, 8/01/2026 (n) | 1,975,000 | 2,064,428 | ||||||
| NXP Semiconductors N.V., 3.4%, 5/01/2030 (n) | 536,000 | 535,826 | ||||||
| Refinitiv U.S. Holdings, Inc., 8.25%, 11/15/2026 (n) | 325,000 | 352,625 | ||||||
| Tencent Holdings Ltd., 3.8%, 2/11/2025 | 700,000 | 752,136 | ||||||
| Verscend Escrow Corp., 9.75%, 8/15/2026 (n) | 640,000 | 667,200 | ||||||
|
|
|
|||||||
| $ | 9,682,693 | |||||||
| Cable TV - 6.5% | ||||||||
| Altice Financing S.A., 7.5%, 5/15/2026 (n) | $ | 780,000 | $ | 813,150 | ||||
| CCO Holdings LLC/CCO Holdings Capital Corp., 5.375%, 5/01/2025 (n) | 435,000 | 446,065 | ||||||
| CCO Holdings LLC/CCO Holdings Capital Corp., 5.75%, 2/15/2026 (n) | 1,925,000 | 2,006,813 | ||||||
| CCO Holdings LLC/CCO Holdings Capital Corp., 5.875%, 5/01/2027 (n) | 1,545,000 | 1,609,021 | ||||||
| CCO Holdings LLC/CCO Holdings Capital Corp., 4.75%, 3/01/2030 (n) | 1,800,000 | 1,830,960 | ||||||
| Charter Communications Operating LLC/Charter Communications Operating Capital Corp., 6.384%, 10/23/2035 | 347,000 | 445,576 | ||||||
| Charter Communications Operating LLC/Charter Communications Operating Capital Corp., 4.8%, 3/01/2050 | 271,000 | 305,046 | ||||||
| Comcast Corp., 0.25%, 5/20/2027 | EUR | 150,000 | 159,997 | |||||
| Comcast Corp., 1.5%, 2/20/2029 | GBP | 175,000 | 220,332 | |||||
| Comcast Corp., 0.75%, 2/20/2032 | EUR | 300,000 | 323,800 | |||||
| CSC Holdings LLC, 5.5%, 5/15/2026 (n) | $ | 665,000 | 689,871 | |||||
| CSC Holdings LLC, 5.5%, 4/15/2027 (n) | 2,975,000 | 3,093,070 | ||||||
| DISH DBS Corp., 5.875%, 11/15/2024 | 295,000 | 283,743 | ||||||
| DISH DBS Corp., 7.75%, 7/01/2026 | 750,000 | 738,750 | ||||||
| Eutelsat S.A., 2.25%, 7/13/2027 | EUR | 1,200,000 | 1,247,260 | |||||
| Intelsat Jackson Holdings S.A., 5.5%, 8/01/2023 (a) | $ | 570,000 | 304,950 | |||||
| Intelsat Jackson Holdings S.A., 9.75%, 7/15/2025 (a)(n) | 615,000 | 347,475 | ||||||
| LCPR Senior Secured Financing DAC, 6.75%, 10/15/2027 (n) | 595,000 | 618,562 | ||||||
| SES Global Americas Holdings GP, 5.3%, 3/25/2044 (n) | 535,000 | 493,095 | ||||||
| Sirius XM Holdings, Inc., 4.625%, 7/15/2024 (n) | 1,335,000 | 1,361,166 | ||||||
9
Table of Contents
Portfolio of Investments (unaudited) – continued
| Issuer | Shares/Par | Value ($) | ||||||
| Bonds - continued | ||||||||
| Cable TV - continued | ||||||||
| Sirius XM Holdings, Inc., 5.5%, 7/01/2029 (n) | $ | 530,000 | $ | 558,938 | ||||
| Sirius XM Radio, Inc., 5.375%, 4/15/2025 (n) | 650,000 | 670,313 | ||||||
| Telenet Finance Luxembourg S.A., 5.5%, 3/01/2028 (n) | 1,200,000 | 1,224,000 | ||||||
| Telesat Holdings, Inc., 6.5%, 10/15/2027 (n) | 640,000 | 602,048 | ||||||
| Time Warner Cable, Inc., 4.5%, 9/15/2042 | 210,000 | 221,757 | ||||||
| Videotron Ltd., 5.375%, 6/15/2024 (n) | 315,000 | 333,906 | ||||||
| Videotron Ltd., 5.125%, 4/15/2027 (n) | 1,735,000 | 1,813,075 | ||||||
| Ziggo Bond Finance B.V., 5.125%, 2/28/2030 (n) | 820,000 | 807,700 | ||||||
|
|
|
|||||||
| $ | 23,570,439 | |||||||
| Chemicals - 1.4% | ||||||||
| Axalta Coating Systems Co., 4.875%, 8/15/2024 (n) | $ | 910,000 | $ | 923,650 | ||||
| Consolidated Energy Finance S.A., 6.875%, 6/15/2025 (n) | 805,000 | 619,850 | ||||||
| Cydsa S.A.B. de C.V., 6.25%, 10/04/2027 (n) | 675,000 | 602,437 | ||||||
| Element Solutions, Inc., 5.875%, 12/01/2025 (n) | 555,000 | 549,866 | ||||||
| Sasol Financing (USA) LLC, 6.5%, 9/27/2028 | 350,000 | 227,500 | ||||||
| SPCM S.A., 4.875%, 9/15/2025 (n) | 1,005,000 | 1,015,050 | ||||||
| Starfruit Finance Co./Starfruit U.S. Holding Co. LLC, 8%, 10/01/2026 (n) | 550,000 | 515,075 | ||||||
| Symrise AG, 1.25%, 11/29/2025 | EUR | 385,000 | 416,060 | |||||
| Tronox, Inc., 6.5%, 4/15/2026 (n) | $ | 275,000 | 248,875 | |||||
|
|
|
|||||||
| $ | 5,118,363 | |||||||
| Computer Software - 1.8% | ||||||||
| Camelot Finance S.A., 4.5%, 11/01/2026 (n) | $ | 670,000 | $ | 675,025 | ||||
| Dell International LLC/EMC Corp., 5.85%, 7/15/2025 (n) | 257,000 | 279,547 | ||||||
| Dell International LLC/EMC Corp., 4.9%, 10/01/2026 (n) | 863,000 | 892,238 | ||||||
| Microsoft Corp., 4.1%, 2/06/2037 | 1,422,000 | 1,771,843 | ||||||
| Microsoft Corp., 3.95%, 8/08/2056 | 354,000 | 465,434 | ||||||
| PTC, Inc., 3.625%, 2/15/2025 (n) | 750,000 | 738,375 | ||||||
| PTC, Inc., 4%, 2/15/2028 (n) | 120,000 | 117,600 | ||||||
| VeriSign, Inc., 5.25%, 4/01/2025 | 530,000 | 581,198 | ||||||
| VeriSign, Inc., 4.75%, 7/15/2027 | 770,000 | 820,212 | ||||||
|
|
|
|||||||
| $ | 6,341,472 | |||||||
| Computer Software - Systems - 1.7% | ||||||||
| Apple, Inc., 4.5%, 2/23/2036 | $ | 1,100,000 | $ | 1,403,720 | ||||
| Capgemini SE, 2%, 4/15/2029 | EUR | 300,000 | 346,031 | |||||
| Fair Isaac Corp., 5.25%, 5/15/2026 (n) | $ | 1,600,000 | 1,652,000 | |||||
| Fair Isaac Corp., 4%, 6/15/2028 (n) | 286,000 | 283,569 | ||||||
| JDA Software Group, Inc., 7.375%, 10/15/2024 (n) | 720,000 | 707,400 | ||||||
| Sabre GLBL, Inc., 5.375%, 4/15/2023 (n) | 905,000 | 841,650 | ||||||
| SS&C Technologies Holdings, Inc., 5.5%, 9/30/2027 (n) | 950,000 | 973,750 | ||||||
|
|
|
|||||||
| $ | 6,208,120 | |||||||
10
Table of Contents
Portfolio of Investments (unaudited) – continued
| Issuer | Shares/Par | Value ($) | ||||||
| Bonds - continued | ||||||||
| Conglomerates - 3.2% | ||||||||
| Amsted Industries Co., 5.625%, 7/01/2027 (n) | $ | 950,000 | $ | 951,045 | ||||
| BWX Technologies, Inc., 5.375%, 7/15/2026 (n) | 1,330,000 | 1,358,262 | ||||||
| CFX Escrow Corp., 6.375%, 2/15/2026 (n) | 525,000 | 541,380 | ||||||
| EnerSys, 5%, 4/30/2023 (n) | 870,000 | 867,825 | ||||||
| EnerSys, 4.375%, 12/15/2027 (n) | 460,000 | 443,900 | ||||||
| Gates Global LLC, 6.25%, 1/15/2026 (n) | 905,000 | 823,650 | ||||||
| General Electric Co., 0.875%, 5/17/2025 | EUR | 500,000 | 522,282 | |||||
| Granite Holdings U.S. Acquisition Co., 11%, 10/01/2027 (n) | $ | 455,000 | 386,750 | |||||
| Griffon Corp., 5.75%, 3/01/2028 | 555,000 | 528,638 | ||||||
| MTS Systems Corp., 5.75%, 8/15/2027 (n) | 810,000 | 751,275 | ||||||
| Roper Technologies, Inc., 4.2%, 9/15/2028 | 343,000 | 385,380 | ||||||
| Roper Technologies, Inc., 2.95%, 9/15/2029 | 270,000 | 282,694 | ||||||
| Stevens Holding Co., Inc., 6.125%, 10/01/2026 (n) | 765,000 | 766,683 | ||||||
| Thyssenkrupp AG, 2.875%, 2/22/2024 | EUR | 400,000 | 415,327 | |||||
| TriMas Corp., 4.875%, 10/15/2025 (n) | $ | 1,800,000 | 1,761,750 | |||||
| Westinghouse Air Brake Technologies Corp., 4.4%, 3/15/2024 | 370,000 | 371,484 | ||||||
| Westinghouse Air Brake Technologies Corp., 4.95%, 9/15/2028 | 364,000 | 360,088 | ||||||
|
|
|
|||||||
| $ | 11,518,413 | |||||||
| Construction - 0.8% | ||||||||
| Mattamy Group Corp., 5.25%, 12/15/2027 (n) | $ | 230,000 | $ | 215,625 | ||||
| Mattamy Group Corp., 4.625%, 3/01/2030 (n) | 750,000 | 664,050 | ||||||
| Shea Homes LP/Shea Homes Funding Corp., 4.75%, 2/15/2028 (n) | 570,000 | 492,338 | ||||||
| Toll Brothers Finance Corp., 4.875%, 11/15/2025 | 570,000 | 575,700 | ||||||
| Toll Brothers Finance Corp., 4.35%, 2/15/2028 | 865,000 | 852,025 | ||||||
|
|
|
|||||||
| $ | 2,799,738 | |||||||
| Consumer Products - 1.5% | ||||||||
| Coty, Inc., 6.5%, 4/15/2026 (n) | $ | 610,000 | $ | 512,400 | ||||
| Energizer Holdings, Inc., 6.375%, 7/15/2026 (n) | 1,010,000 | 1,050,299 | ||||||
| LVMH Moet Hennessy Louis Vuitton SE, 0.125%, 2/11/2028 | EUR | 500,000 | 538,223 | |||||
| LVMH Moet Hennessy Louis Vuitton SE, 0.375%, 2/11/2031 | 200,000 | 215,409 | ||||||
| Mattel, Inc., 6.75%, 12/31/2025 (n) | $ | 825,000 | 837,375 | |||||
| Mattel, Inc., 5.875%, 12/15/2027 (n) | 342,000 | 332,834 | ||||||
| Prestige Brands, Inc., 5.125%, 1/15/2028 (n) | 355,000 | 359,083 | ||||||
| Reckitt Benckiser Treasury Services PLC, 3.625%, 9/21/2023 (n) | 500,000 | 529,208 | ||||||
| Reckitt Benckiser Treasury Services PLC, 3%, 6/26/2027 (n) | 396,000 | 413,240 | ||||||
| Whirlpool Corp., 4.75%, 2/26/2029 | 135,000 | 144,792 | ||||||
| Whirlpool EMEA Finance S.à r.l., 0.5%, 2/20/2028 | EUR | 650,000 | 656,750 | |||||
|
|
|
|||||||
| $ | 5,589,613 | |||||||
11
Table of Contents
Portfolio of Investments (unaudited) – continued
| Issuer | Shares/Par | Value ($) | ||||||
| Bonds - continued | ||||||||
| Consumer Services - 2.6% | ||||||||
| Allied Universal Holdco LLC, 9.75%, 7/15/2027 (n) | $ | 580,000 | $ | 585,800 | ||||
| Booking Holdings, Inc., 4.5%, 4/13/2027 | 436,000 | 469,031 | ||||||
| Booking Holdings, Inc., 3.55%, 3/15/2028 | 238,000 | 240,491 | ||||||
| Experian Finance PLC, 4.25%, 2/01/2029 (n) | 778,000 | 853,264 | ||||||
| Frontdoor, Inc., 6.75%, 8/15/2026 (n) | 675,000 | 700,312 | ||||||
| Garda World Security Corp., 4.625%, 2/15/2027 (n) | 280,000 | 269,500 | ||||||
| GW B-CR Security Corp., 9.5%, 11/01/2027 (n) | 361,000 | 361,000 | ||||||
| ManpowerGroup, Inc., 1.75%, 6/22/2026 | EUR | 450,000 | 505,852 | |||||
| Match Group, Inc., 6.375%, 6/01/2024 | $ | 1,060,000 | 1,097,768 | |||||
| Match Group, Inc., 5%, 12/15/2027 (n) | 655,000 | 685,785 | ||||||
| Realogy Group LLC, 9.375%, 4/01/2027 (n) | 825,000 | 577,500 | ||||||
| Service Corp. International, 5.125%, 6/01/2029 | 570,000 | 592,800 | ||||||
| ServiceMaster Co. LLC, 5.125%, 11/15/2024 (n) | 695,000 | 709,039 | ||||||
| Toll Road Investors Partnership II LP, Capital Appreciation, 0%, 2/15/2027 (n) | 1,052,000 | 772,827 | ||||||
| Visa, Inc., 4.15%, 12/14/2035 | 465,000 | 586,806 | ||||||
| Visa, Inc., 3.65%, 9/15/2047 | 273,000 | 332,962 | ||||||
|
|
|
|||||||
| $ | 9,340,737 | |||||||
| Containers - 2.4% | ||||||||
| ARD Finance S.A., 6.5%, (6.5% cash or 7.25% PIK) 6/30/2027 (n)(p) | $ | 910,000 | $ | 844,662 | ||||
| Ball Corp., 5.25%, 7/01/2025 | 330,000 | 364,650 | ||||||
| Crown Americas LLC/Crown Americas Capital Corp. IV, 4.5%, 1/15/2023 | 927,000 | 950,360 | ||||||
| Crown Americas LLC/Crown Americas Capital Corp. V, 4.25%, 9/30/2026 | 1,080,000 | 1,082,214 | ||||||
| Crown Americas LLC/Crown Americas Capital Corp. VI, 4.75%, 2/01/2026 | 470,000 | 482,925 | ||||||
| DS Smith PLC, 0.875%, 9/12/2026 | EUR | 350,000 | 351,084 | |||||
| Flex Acquisition Co., Inc., 6.875%, 1/15/2025 (n) | $ | 665,000 | 644,019 | |||||
| LABL Escrow Issuer LLC, 6.75%, 7/15/2026 (n) | 120,000 | 123,996 | ||||||
| Mauser Packaging Solutions, 5.5%, 4/15/2024 (n) | 120,000 | 110,664 | ||||||
| Mauser Packaging Solutions, 7.25%, 4/15/2025 (n) | 165,000 | 129,113 | ||||||
| Reynolds Group, 5.125%, 7/15/2023 (n) | 725,000 | 728,625 | ||||||
| Reynolds Group, 7%, 7/15/2024 (n) | 230,000 | 230,851 | ||||||
| San Miguel Industrias PET S.A., 4.5%, 9/18/2022 | 839,000 | 819,750 | ||||||
| Silgan Holdings, Inc., 4.75%, 3/15/2025 | 900,000 | 913,500 | ||||||
| Silgan Holdings, Inc., 4.125%, 2/01/2028 (n) | 358,000 | 351,735 | ||||||
| Trivium Packaging Finance B.V., 8.5%, 8/15/2027 (n) | 600,000 | 627,000 | ||||||
|
|
|
|||||||
| $ | 8,755,148 | |||||||
12
Table of Contents
Portfolio of Investments (unaudited) – continued
| Issuer | Shares/Par | Value ($) | ||||||
| Bonds - continued | ||||||||
| Electrical Equipment - 0.4% | ||||||||
| Amphenol Corp., 0.75%, 5/04/2026 | EUR | 254,000 | $ | 276,578 | ||||
| CommScope Technologies LLC, 6%, 6/15/2025 (n) | $ | 545,000 | 484,996 | |||||
| CommScope Technologies LLC, 5%, 3/15/2027 (n) | 600,000 | 514,500 | ||||||
|
|
|
|||||||
| $ | 1,276,074 | |||||||
| Electronics - 1.7% | ||||||||
| ASML Holding N.V., 0.625%, 5/07/2029 | EUR | 127,000 | $ | 140,024 | ||||
| Broadcom Corp./Broadcom Cayman Finance Ltd., 3.875%, 1/15/2027 | $ | 767,000 | 799,581 | |||||
| Entegris, Inc., 4.625%, 2/10/2026 (n) | 890,000 | 892,225 | ||||||
| Entegris, Inc., 4.375%, 4/15/2028 (n) | 320,000 | 320,400 | ||||||
| Qorvo, Inc., 5.5%, 7/15/2026 | 645,000 | 677,250 | ||||||
| Sensata Technologies B.V., 5.625%, 11/01/2024 (n) | 710,000 | 720,650 | ||||||
| Sensata Technologies B.V., 5%, 10/01/2025 (n) | 890,000 | 885,194 | ||||||
| Sensata Technologies, Inc., 4.375%, 2/15/2030 (n) | 1,405,000 | 1,362,850 | ||||||
| Texas Instruments, Inc., 2.25%, 9/04/2029 | 312,000 | 324,593 | ||||||
|
|
|
|||||||
| $ | 6,122,767 | |||||||
| Emerging Market Quasi-Sovereign - 8.1% | ||||||||
| Abu Dhabi Crude Oil Pipeline, 3.65%, 11/02/2029 | $ | 1,100,000 | $ | 1,146,842 | ||||
| Aeropuerto Internacional de Tocumen S.A. (Republic of Panama), 6%, 11/18/2048 (n) | 1,020,000 | 1,030,200 | ||||||
| Banco de Reservas de la Republica Dominicana, 7%, 2/01/2023 (n) | 946,000 | 904,622 | ||||||
| CEZ A.S. (Czech Republic), 0.875%, 12/02/2026 | EUR | 650,000 | 680,170 | |||||
| China Construction Bank Corp., 4.25% to 2/27/2024, FLR (CMT - 5yr. + 1.88%) to 2/27/2029 | $ | 964,000 | 1,008,188 | |||||
| CNPC (HK) Overseas Capital Ltd. (People’s Republic of China), 4.5%, 4/28/2021 (n) | 1,242,000 | 1,282,489 | ||||||
| Empresa Nacional del Petroleo (Republic of Chile), 3.75%, 8/05/2026 (n) | 423,000 | 407,012 | ||||||
| Empresa Nacional del Petroleo (Republic of Chile), 3.75%, 8/05/2026 | 1,306,000 | 1,256,639 | ||||||
| EQUATE Petrochemical B.V. (State of Kuwait), 4.25%, 11/03/2026 | 1,034,000 | 1,002,980 | ||||||
| Eskom Holdings SOC Ltd. (Republic of South Africa), 6.35%, 8/10/2028 (n) | 1,052,000 | 939,857 | ||||||
| Export-Import Bank of India, 3.375%, 8/05/2026 | 1,366,000 | 1,340,977 | ||||||
| Gaz Capital S.A. (Russian Federation), 4.95%, 2/06/2028 (n) | 492,000 | 529,638 | ||||||
| KazMunayGas National Co., JSC (Republic of Kazakhstan), 5.375%, 4/24/2030 (n) | 1,002,000 | 992,214 | ||||||
| KazMunayGas National Co., JSC (Republic of Kazakhstan), 6.375%, 10/24/2048 (n) | 984,000 | 1,018,593 | ||||||
13
Table of Contents
Portfolio of Investments (unaudited) – continued
| Issuer | Shares/Par | Value ($) | ||||||
| Bonds - continued | ||||||||
| Emerging Market Quasi-Sovereign - continued | ||||||||
| MDGH - GMTN B.V. (United Arab Emirates), 2.5%, 11/07/2024 | $ | 508,000 | $ | 508,000 | ||||
| MDGH - GMTN B.V. (United Arab Emirates), 2.875%, 11/07/2029 (n) | 1,091,000 | 1,092,767 | ||||||
| NAK Naftogaz Ukraine via Standard Bank London Holdings PLC, 7.625%, 11/08/2026 (n) | 869,000 | 730,600 | ||||||
| NTPC Ltd. (Republic of India), 4.25%, 2/26/2026 | 613,000 | 608,329 | ||||||
| Office Cherifien des Phosphates S.A. (Republic of Madagascar), 6.875%, 4/25/2044 (n) | 373,000 | 441,073 | ||||||
| Petrobras Global Finance B.V. (Federative Republic of Brazil), 5.75%, 2/01/2029 | 1,322,000 | 1,255,900 | ||||||
| Petrobras Global Finance B.V. (Federative Republic of Brazil), 6.9%, 3/19/2049 | 1,235,000 | 1,197,950 | ||||||
| Petroleos del Peru S.A., 4.75%, 6/19/2032 | 1,067,000 | 1,035,001 | ||||||
| Petroleos Mexicanos, 6.49%, 1/23/2027 (n) | 904,000 | 736,670 | ||||||
| Petroleos Mexicanos, 5.35%, 2/12/2028 | 1,000,000 | 745,010 | ||||||
| Power Finance Corp. Ltd. (Republic of India), 3.75%, 12/06/2027 | 550,000 | 495,266 | ||||||
| PT Pertamina (Persero) (Republic of Indonesia), 3.65%, 7/30/2029 | 650,000 | 621,221 | ||||||
| PT Pertamina (Persero) (Republic of Indonesia), 6.5%, 11/07/2048 (n) | 1,200,000 | 1,343,458 | ||||||
| Sinopec Capital (2013) Ltd. (People’s Republic of China), 3.125%, 4/24/2023 (n) | 666,000 | 698,081 | ||||||
| Southern Gas Corridor CJSC (Republic of Azerbaijan), 6.875%, 3/24/2026 | 1,367,000 | 1,425,836 | ||||||
| State Grid Overseas Investment (2014) Ltd. (People’s Republic of China), 4.125%, 5/07/2024 (n) | 1,563,000 | 1,695,452 | ||||||
| State Oil Company of the Azerbaijan Republic, 6.95%, 3/18/2030 | 1,152,000 | 1,206,467 | ||||||
|
|
|
|||||||
| $ | 29,377,502 | |||||||
| Emerging Market Sovereign - 7.8% | ||||||||
| Arab Republic of Egypt, 6.588%, 2/21/2028 | $ | 1,087,000 | $ | 997,866 | ||||
| Arab Republic of Egypt, 6.375%, 4/11/2031 (n) | EUR | 1,011,000 | 926,697 | |||||
| Arab Republic of Egypt, 7.903%, 2/21/2048 | $ | 1,120,000 | 964,600 | |||||
| Dominican Republic, 5.95%, 1/25/2027 | 997,000 | 899,793 | ||||||
| Dominican Republic, 5.875%, 1/30/2060 (n) | 1,170,000 | 933,075 | ||||||
| Federal Republic of Nigeria, 8.747%, 1/21/2031 (n) | 1,415,000 | 1,129,971 | ||||||
| Government of Ukraine, 7.75%, 9/01/2023 | 1,061,000 | 1,005,297 | ||||||
| Government of Ukraine, 4.375%, 1/27/2030 | EUR | 450,000 | 379,811 | |||||
| Government of Ukraine, GDP Linked Bond, 0%, 5/31/2040 | $ | 824,000 | 608,140 | |||||
| Kingdom of Saudi Arabia, 4.375%, 4/16/2029 (n) | 942,000 | 1,049,200 | ||||||
| Republic of Angola, 9.5%, 11/12/2025 | 400,000 | 186,236 | ||||||
| Republic of Angola, 8.25%, 5/09/2028 | 491,000 | 213,604 | ||||||
| Republic of Argentina, 6.875%, 1/26/2027 | 1,669,000 | 417,267 | ||||||
14
Table of Contents
Portfolio of Investments (unaudited) – continued
| Issuer | Shares/Par | Value ($) | ||||||
| Bonds - continued | ||||||||
| Emerging Market Sovereign - continued | ||||||||
| Republic of Colombia, 3%, 1/30/2030 | $ | 829,000 | $ | 752,740 | ||||
| Republic of Colombia, 5%, 6/15/2045 | 1,050,000 | 1,048,960 | ||||||
| Republic of Cote d’Ivoire, 5.25%, 3/22/2030 | EUR | 750,000 | 669,838 | |||||
| Republic of Ghana, 8.125%, 3/26/2032 (n) | $ | 1,186,000 | 901,360 | |||||
| Republic of Guatemala, 6.125%, 6/01/2050 (n) | 792,000 | 826,452 | ||||||
| Republic of Hungary, 7.625%, 3/29/2041 | 488,000 | 780,800 | ||||||
| Republic of Indonesia, 4.125%, 1/15/2025 (n) | 339,000 | 353,608 | ||||||
| Republic of Kenya, 8%, 5/22/2032 (n) | 1,046,000 | 946,630 | ||||||
| Republic of Paraguay, 5.6%, 3/13/2048 | 1,049,000 | 1,103,034 | ||||||
| Republic of Peru, 2.392%, 1/23/2026 | 91,000 | 92,820 | ||||||
| Republic of Romania, 2%, 12/08/2026 (n) | EUR | 1,011,000 | 1,060,113 | |||||
| Republic of Romania, 2.124%, 7/16/2031 (n) | 1,200,000 | 1,137,097 | ||||||
| Republic of South Africa, 4.875%, 4/14/2026 | $ | 432,000 | 401,661 | |||||
| Republic of Sri Lanka, 6.125%, 6/03/2025 | 668,000 | 385,781 | ||||||
| Republic of Turkey, 4.25%, 3/13/2025 | 702,000 | 624,780 | ||||||
| Republic of Turkey, 7.625%, 4/26/2029 | 856,000 | 843,759 | ||||||
| Russian Federation, 4.75%, 5/27/2026 | 1,000,000 | 1,107,500 | ||||||
| Russian Federation, 4.25%, 6/23/2027 | 1,000,000 | 1,082,648 | ||||||
| Russian Federation, 4.375%, 3/21/2029 | 400,000 | 441,520 | ||||||
| State of Qatar, 4%, 3/14/2029 (n) | 533,000 | 591,406 | ||||||
| State of Qatar, 4.817%, 3/14/2049 (n) | 1,404,000 | 1,688,709 | ||||||
| State of Qatar, 4.4%, 4/16/2050 | 203,000 | 230,823 | ||||||
| United Mexican States, 4.5%, 4/22/2029 | 1,300,000 | 1,307,813 | ||||||
|
|
|
|||||||
| $ | 28,091,409 | |||||||
| Energy - Independent - 1.4% | ||||||||
| Afren PLC, 11.5%, 2/01/2016 (a)(d)(z) | $ | 326,905 | $ | 268 | ||||
| Afren PLC, 10.25%, 4/08/2019 (a)(d)(z) | 213,708 | 175 | ||||||
| CrownRock LP/CrownRock Finance, Inc., 5.625%, 10/15/2025 (n) | 830,000 | 672,391 | ||||||
| Jagged Peak Energy LLC, 5.875%, 5/01/2026 | 450,000 | 382,500 | ||||||
| Laredo Petroleum, Inc., 10.125%, 1/15/2028 | 145,000 | 59,070 | ||||||
| Magnolia Oil & Gas Operating LLC/Magnolia Oil & Gas Finance Corp., 6%, 8/01/2026 (n) | 580,000 | 475,600 | ||||||
| Matador Resources Co., 5.875%, 9/15/2026 | 355,000 | 177,500 | ||||||
| Medco Bell Pte. Ltd., 6.375%, 1/30/2027 (n) | 498,000 | 293,431 | ||||||
| Parsley Energy LLC/Parsley Finance Corp., 5.625%, 10/15/2027 (n) | 460,000 | 393,300 | ||||||
| PDC Energy, Inc., 5.75%, 5/15/2026 | 145,000 | 110,592 | ||||||
| SM Energy Co., 6.75%, 9/15/2026 | 190,000 | 51,775 | ||||||
| Southwestern Energy Co., 6.2%, 1/23/2025 | 310,800 | 275,058 | ||||||
| Southwestern Energy Co., 7.5%, 4/01/2026 | 181,000 | 162,448 | ||||||
| Tengizchevroil Finance Co. International Ltd., 4%, 8/15/2026 (n) | 422,000 | 401,997 | ||||||
| Tengizchevroil Finance Co. International Ltd., 4%, 8/15/2026 | 1,025,000 | 976,415 | ||||||
15
Table of Contents
Portfolio of Investments (unaudited) – continued
| Issuer | Shares/Par | Value ($) | ||||||
| Bonds - continued | ||||||||
| Energy - Independent - continued | ||||||||
| WPX Energy, Inc., 5.75%, 6/01/2026 | $ | 550,000 | $ | 498,465 | ||||
|
|
|
|||||||
| $ | 4,930,985 | |||||||
| Energy - Integrated - 0.5% | ||||||||
| Eni S.p.A., 4%, 9/12/2023 (n) | $ | 329,000 | $ | 335,285 | ||||
| Eni S.p.A., 4.25%, 5/09/2029 (n) | 379,000 | 386,726 | ||||||
| OMV AG, 1%, 7/03/2034 | EUR | 210,000 | 207,419 | |||||
| Shell International Finance B.V., 1.875%, 4/07/2032 | 170,000 | 201,285 | ||||||
| Shell International Finance B.V., 3.75%, 9/12/2046 | $ | 735,000 | 791,316 | |||||
|
|
|
|||||||
| $ | 1,922,031 | |||||||
| Entertainment - 0.9% | ||||||||
| Cinemark USA, Inc., 4.875%, 6/01/2023 | $ | 510,000 | $ | 428,400 | ||||
| Cinemark USA, Inc., 8.75%, 5/01/2025 (n) | 150,000 | 152,250 | ||||||
| Live Nation Entertainment, Inc., 5.625%, 3/15/2026 (n) | 1,205,000 | 1,060,400 | ||||||
| NCL Corp. Ltd., 3.625%, 12/15/2024 (n) | 175,000 | 112,437 | ||||||
| Royal Caribbean Cruises Ltd., 3.7%, 3/15/2028 | 755,000 | 494,072 | ||||||
| Six Flags Entertainment Corp., 4.875%, 7/31/2024 (n) | 760,000 | 668,952 | ||||||
| Six Flags Entertainment Corp., 7%, 7/01/2025 (n) | 460,000 | 476,008 | ||||||
|
|
|
|||||||
| $ | 3,392,519 | |||||||
| Financial Institutions - 3.1% | ||||||||
| AerCap Ireland Capital DAC, 3.65%, 7/21/2027 | $ | 1,230,000 | $ | 1,035,355 | ||||
| AnaCap Financial Europe S.A. SICAV-RAIF, 5%, 8/01/2024 | EUR | 650,000 | 516,775 | |||||
| Avation Capital S.A., 6.5%, 5/15/2021 (n) | $ | 400,000 | 336,000 | |||||
| Avolon Holdings Funding Ltd., 5.125%, 10/01/2023 | 1,125,000 | 1,006,555 | ||||||
| Avolon Holdings Funding Ltd., 5.25%, 5/15/2024 (n) | 640,000 | 555,149 | ||||||
| Avolon Holdings Funding Ltd., 3.95%, 7/01/2024 (n) | 454,000 | 390,630 | ||||||
| Avolon Holdings Funding Ltd., 4.375%, 5/01/2026 (n) | 363,000 | 311,073 | ||||||
| Credit Acceptance Corp., 5.125%, 12/31/2024 (n) | 700,000 | 614,250 | ||||||
| EXOR N.V., 2.25%, 4/29/2030 | EUR | 625,000 | 694,611 | |||||
| GE Capital International Funding Co., 3.373%, 11/15/2025 | $ | 1,086,000 | 1,118,438 | |||||
| Global Aircraft Leasing Co. Ltd., 6.5%, (6.5% cash or 7.25% PIK) 9/15/2024 (n)(p) | 1,657,000 | 1,002,485 | ||||||
| Nationstar Mortgage Holdings, Inc., 8.125%, 7/15/2023 (n) | 775,000 | 744,000 | ||||||
| Nationstar Mortgage Holdings, Inc., 6%, 1/15/2027 (n) | 300,000 | 255,930 | ||||||
| Navient Corp., 5.5%, 1/25/2023 | 240,000 | 222,600 | ||||||
| Navient Corp., 5%, 3/15/2027 | 230,000 | 193,660 | ||||||
| OneMain Financial Corp., 6.875%, 3/15/2025 | 660,000 | 624,162 | ||||||
| OneMain Financial Corp., 7.125%, 3/15/2026 | 395,000 | 372,288 | ||||||
| Park Aerospace Holdings Ltd., 5.5%, 2/15/2024 (n) | 870,000 | 765,989 | ||||||
| Springleaf Finance Corp., 5.375%, 11/15/2029 | 185,000 | 153,585 | ||||||
| Vonovia Finance B.V., 1.625%, 4/07/2024 | EUR | 100,000 | 113,287 | |||||
|
|
|
|||||||
| $ | 11,026,822 | |||||||
16
Table of Contents
Portfolio of Investments (unaudited) – continued
| Issuer | Shares/Par | Value ($) | ||||||
| Bonds - continued | ||||||||
| Food & Beverages - 3.7% | ||||||||
| Anheuser-Busch InBev S.A., 1.65%, 3/28/2031 | EUR | 330,000 | $ | 370,519 | ||||
| Anheuser-Busch InBev Worldwide, Inc., 4.375%, 4/15/2038 | $ | 209,000 | 225,060 | |||||
| Anheuser-Busch InBev Worldwide, Inc., 5.55%, 1/23/2049 | 331,000 | 413,838 | ||||||
| Bacardi Ltd., 5.15%, 5/15/2038 (n) | 425,000 | 470,826 | ||||||
| Constellation Brands, Inc., 4.25%, 5/01/2023 | 894,000 | 958,188 | ||||||
| Constellation Brands, Inc., 4.75%, 12/01/2025 | 313,000 | 348,754 | ||||||
| Constellation Brands, Inc., 3.15%, 8/01/2029 | 638,000 | 660,149 | ||||||
| Cott Holdings, Inc., 5.5%, 4/01/2025 (n) | 1,030,000 | 1,035,150 | ||||||
| Diageo Finance PLC, 1.875%, 3/27/2027 | EUR | 250,000 | 295,208 | |||||
| Diageo Finance PLC, 2.875%, 3/27/2029 | GBP | 550,000 | 744,189 | |||||
| Heineken N.V., 1.25%, 5/07/2033 | EUR | 538,000 | 595,192 | |||||
| JBS USA LLC/JBS USA Finance, Inc., 6.75%, 2/15/2028 (n) | $ | 1,260,000 | 1,349,384 | |||||
| JBS USA Lux S.A./JBS USA Finance, Inc., 5.875%, 7/15/2024 (n) | 415,000 | 423,300 | ||||||
| JBS USA Lux S.A./JBS USA Finance, Inc., 5.5%, 1/15/2030 (n) | 455,000 | 460,687 | ||||||
| Lamb Weston Holdings, Inc., 4.625%, 11/01/2024 (n) | 1,215,000 | 1,238,692 | ||||||
| NBM U.S. Holdings, Inc., 7%, 5/14/2026 (n) | 666,000 | 641,025 | ||||||
| PepsiCo, Inc., 3.875%, 3/19/2060 | 262,000 | 327,733 | ||||||
| Performance Food Group Co., 5.5%, 10/15/2027 (n) | 675,000 | 641,263 | ||||||
| Pilgrim’s Pride Corp., 5.75%, 3/15/2025 (n) | 350,000 | 353,546 | ||||||
| Pilgrim’s Pride Corp., 5.875%, 9/30/2027 (n) | 685,000 | 693,186 | ||||||
| U.S. Foods Holding Corp., 5.875%, 6/15/2024 (n) | 875,000 | 833,280 | ||||||
| U.S. Foods Holding Corp., 6.25%, 4/15/2025 (n) | 305,000 | 310,719 | ||||||
|
|
|
|||||||
| $ | 13,389,888 | |||||||
| Forest & Paper Products - 0.3% | ||||||||
| Mondi Finance Europe GmbH, 2.375%, 4/01/2028 | EUR | 300,000 | $ | 344,358 | ||||
| Suzano Austria GmbH, 6%, 1/15/2029 | $ | 860,000 | 861,892 | |||||
|
|
|
|||||||
| $ | 1,206,250 | |||||||
| Gaming & Lodging - 2.6% | ||||||||
| CCM Merger, Inc., 6%, 3/15/2022 (n) | $ | 790,000 | $ | 746,550 | ||||
| GLP Capital LP/GLP Financing II, Inc., 5.375%, 11/01/2023 | 300,000 | 291,000 | ||||||
| GLP Capital LP/GLP Financing II, Inc., 5.25%, 6/01/2025 | 760,000 | 739,176 | ||||||
| Hilton Domestic Operating Co., Inc., 5.125%, 5/01/2026 | 660,000 | 651,618 | ||||||
| Hilton Worldwide Finance LLC, 4.625%, 4/01/2025 | 1,075,000 | 1,053,500 | ||||||
| Las Vegas Sands Corp., 3.9%, 8/08/2029 | 263,000 | 241,940 | ||||||
| Marriott International, Inc., 5.75%, 5/01/2025 | 239,000 | 249,770 | ||||||
| Scientific Games Corp., 8.25%, 3/15/2026 (n) | 585,000 | 441,675 | ||||||
| Scientific Games International, Inc., 7%, 5/15/2028 (n) | 245,000 | 176,400 | ||||||
| VICI Properties LP, REIT, 4.25%, 12/01/2026 (n) | 830,000 | 775,710 | ||||||
| VICI Properties LP, REIT, 3.75%, 2/15/2027 (n) | 860,000 | 799,800 | ||||||
| VICI Properties LP, REIT, 4.625%, 12/01/2029 (n) | 185,000 | 172,050 | ||||||
| VICI Properties, Inc., 4.125%, 8/15/2030 (n) | 743,000 | 676,130 | ||||||
17
Table of Contents
Portfolio of Investments (unaudited) – continued
| Issuer | Shares/Par | Value ($) | ||||||
| Bonds - continued | ||||||||
| Gaming & Lodging - continued | ||||||||
| Wyndham Hotels Group LLC, 5.375%, 4/15/2026 (n) | $ | 1,525,000 | $ | 1,395,375 | ||||
| Wynn Las Vegas LLC/Wynn Las Vegas Capital Corp., 5.5%, 3/01/2025 (n) | 915,000 | 814,350 | ||||||
| Wynn Las Vegas LLC/Wynn Las Vegas Capital Corp., 5.25%, 5/15/2027 (n) | 335,000 | 291,450 | ||||||
|
|
|
|||||||
| $ | 9,516,494 | |||||||
| Healthcare Revenue - Hospitals - 0.2% | ||||||||
| Michigan Finance Authority Hospital Rev. (Trinity Health Credit Group), 3.384%, 12/01/2040 | $ | 605,000 | $ | 622,345 | ||||
| Industrial - 0.2% | ||||||||
| CPI Property Group S.A., 2.75%, 1/22/2028 | GBP | 300,000 | $ | 343,755 | ||||
| Investor AB, 1.5%, 6/20/2039 | EUR | 180,000 | 199,417 | |||||
|
|
|
|||||||
| $ | 543,172 | |||||||
| Insurance - 0.8% | ||||||||
| American International Group, Inc., 1.875%, 6/21/2027 | EUR | 400,000 | $ | 445,769 | ||||
| Argentum Zurich Insurance, 3.5%, 10/01/2046 | 500,000 | 616,904 | ||||||
| Assicurazioni Generali S.p.A., 2.124%, 10/01/2030 | 400,000 | 412,040 | ||||||
| Aviva PLC, 3.875% to 7/03/2024, FLR (EUR Swap Rate - 5yr. + 3.48%) to 7/03/2044 | 450,000 | 528,468 | ||||||
| CNP Assurances S.A., 2% to 7/27/2030, FLR (EURIBOR - 3mo. + 3%) to 7/27/2050 | 300,000 | 328,014 | ||||||
| Credit Agricole Assurances, 4.25% to 1/13/2025, FLR (EUR Swap Rate - 5yr. + 4.5%) to 1/29/2049 | 300,000 | 352,634 | ||||||
| La Mondiale, 4.375% to 10/24/2029, FLR (EUR Swap Rate -5yr. + 4.411%) to 10/24/2060 | 300,000 | 317,018 | ||||||
|
|
|
|||||||
| $ | 3,000,847 | |||||||
| Insurance - Health - 0.8% | ||||||||
| Centene Corp., 5.375%, 6/01/2026 (n) | $ | 700,000 | $ | 741,160 | ||||
| Centene Corp., 4.25%, 12/15/2027 (n) | 690,000 | 721,913 | ||||||
| UnitedHealth Group, Inc., 4.625%, 7/15/2035 | 1,009,000 | 1,270,314 | ||||||
|
|
|
|||||||
| $ | 2,733,387 | |||||||
| Insurance - Property & Casualty - 1.9% | ||||||||
| Alliant Holdings Intermediate LLC, 6.75%, 10/15/2027 (n) | $ | 685,000 | $ | 683,356 | ||||
| AmWINS Group, Inc., 7.75%, 7/01/2026 (n) | 250,000 | 257,500 | ||||||
| Berkshire Hathaway, Inc., 2.75%, 3/15/2023 | 359,000 | 380,156 | ||||||
| Chubb INA Holdings, Inc., 2.3%, 11/03/2020 | 144,000 | 144,753 | ||||||
| Chubb INA Holdings, Inc., 2.875%, 11/03/2022 | 336,000 | 349,819 | ||||||
| Fairfax Financial Holdings Ltd., 4.625%, 4/29/2030 (n) | 1,080,000 | 1,066,786 | ||||||
| GTCR (AP) Finance, Inc., 8%, 5/15/2027 (n) | 155,000 | 144,925 | ||||||
18
Table of Contents
Portfolio of Investments (unaudited) – continued
| Issuer | Shares/Par | Value ($) | ||||||
| Bonds - continued | ||||||||
| Insurance - Property & Casualty - continued | ||||||||
| Hartford Financial Services Group, Inc., 3.6%, 8/19/2049 | $ | 526,000 | $ | 557,735 | ||||
| Hub International Ltd., 7%, 5/01/2026 (n) | 1,130,000 | 1,114,688 | ||||||
| Marsh & McLennan Cos., Inc., 3.5%, 6/03/2024 | 315,000 | 336,919 | ||||||
| Progressive Corp., 4.125%, 4/15/2047 | 602,000 | 764,652 | ||||||
| QBE Capital Funding III Ltd., 7.5% to 5/24/2021, FLR (GBP Swap Rate - 10yr. + 4.003%) to 5/24/2041 | GBP | 300,000 | 393,537 | |||||
| Willis North America, Inc., 3.875%, 9/15/2049 | $ | 700,000 | 762,663 | |||||
|
|
|
|||||||
| $ | 6,957,489 | |||||||
| International Market Quasi-Sovereign - 0.6% | ||||||||
| Deutsche Bahn Finance GmbH, 1.375%, 4/16/2040 | EUR | 117,000 | $ | 142,932 | ||||
| Electricite de France S.A., 2%, 10/02/2030 | 300,000 | 362,964 | ||||||
| Electricite de France S.A., 5.875% to 1/22/2029, FLR (GBP Swap Rate - 15yr. + 3.046%) to 1/22/2049, FLR (GBP Swap Rate - 15yr. + 3.796%) to 12/31/2165 | GBP | 300,000 | 381,460 | |||||
| Islandsbanki (Republic of Iceland), 1.125%, 1/19/2024 | EUR | 820,000 | 866,082 | |||||
| Ontario Teachers Pension Plan, 0.5%, 5/06/2025 | 380,000 | 418,617 | ||||||
|
|
|
|||||||
| $ | 2,172,055 | |||||||
| International Market Sovereign - 0.1% | ||||||||
| Government of Japan, 2.4%, 3/20/2037 | JPY | 24,900,000 | $ | 314,344 | ||||
| Local Authorities - 0.4% | ||||||||
| Province of Alberta, 0.5%, 4/16/2025 | EUR | 500,000 | $ | 552,220 | ||||
| Province of Alberta, 4.5%, 12/01/2040 | CAD | 410,000 | 390,542 | |||||
| Province of British Columbia, 2.3%, 6/18/2026 | 595,000 | 459,103 | ||||||
|
|
|
|||||||
| $ | 1,401,865 | |||||||
| Machinery & Tools - 0.4% | ||||||||
| CNH Industrial Finance Europe S.A., 1.75%, 3/25/2027 | EUR | 725,000 | $ | 719,246 | ||||
| John Deere Cash Management S.A., 2.2%, 3/31/2032 | 150,000 | 182,573 | ||||||
| Sarens Finance Co. N.V., 5.75%, 2/21/2027 | 821,000 | 555,110 | ||||||
| United Rentals North America, Inc., 4.875%, 1/15/2028 | $ | 140,000 | 140,308 | |||||
|
|
|
|||||||
| $ | 1,597,237 | |||||||
| Major Banks - 5.8% | ||||||||
| Bank of America Corp., 3.5%, 4/19/2026 | $ | 1,437,000 | $ | 1,562,394 | ||||
| Bankinter S.A., 0.875%, 7/08/2026 | EUR | 400,000 | 419,824 | |||||
| Barclays PLC, 7.875%, 12/29/2049 | $ | 900,000 | 891,000 | |||||
| CaixaBank S.A., 2.75% to 7/14/2023, FLR to 7/14/2028 | EUR | 600,000 | 650,576 | |||||
| Credit Agricole S.A., 1.25%, 10/02/2024 | GBP | 400,000 | 495,479 | |||||
| Credit Agricole S.A., 1%, 4/22/2026 | EUR | 300,000 | 328,652 | |||||
| Credit Agricole S.A., 0.875%, 1/14/2032 | 400,000 | 420,485 | ||||||
| Credit Suisse Group AG, 1.25%, 7/17/2025 | 500,000 | 546,623 | ||||||
19
Table of Contents
Portfolio of Investments (unaudited) – continued
| Issuer | Shares/Par | Value ($) | ||||||
| Bonds - continued | ||||||||
| Major Banks - continued | ||||||||
| Credit Suisse Group AG, 7.25%, 12/29/2049 (n) | $ | 900,000 | $ | 897,750 | ||||
| Erste Group Bank AG, 0.875%, 5/22/2026 | EUR | 300,000 | 318,032 | |||||
| Erste Group Bank AG, 1% to 6/10/2025, FLR (EUR ICE Swap Rate - 5yr. + 1.3%) to 6/10/2030 | 500,000 | 512,463 | ||||||
| Erste Group Bank AG, 3.375% to 4/15/2027, FLR (EUR Swap Rate-5yr. + 3.433%) to 10/15/2068 | 600,000 | 532,496 | ||||||
| Goldman Sachs Group, Inc., 3%, 4/26/2022 | $ | 1,250,000 | 1,266,313 | |||||
| HSBC Holdings PLC, 4.375%, 11/23/2026 | 399,000 | 432,870 | ||||||
| JPMorgan Chase & Co., 2.95%, 10/01/2026 | 1,137,000 | 1,192,379 | ||||||
| JPMorgan Chase & Co., 4.26%, 2/22/2048 | 300,000 | 367,239 | ||||||
| Lloyds Banking Group PLC, 1.875% to 9/15/2025, FLR (GBP Government Yield - 5yr. + 1.3%) to 1/15/2026 | GBP | 350,000 | 428,389 | |||||
| Morgan Stanley, 3.125%, 7/27/2026 | $ | 572,000 | 606,859 | |||||
| Nationwide Building Society, 1.5%, 3/08/2026 | EUR | 600,000 | 667,215 | |||||
| Nationwide Building Society, 2% to 7/25/2024, FLR (EUR Swap Rate - 5yr. + 1.5%) to 7/25/2029 | 400,000 | 431,672 | ||||||
| NatWest Markets PLC, 2.75%, 4/02/2025 | 500,000 | 570,580 | ||||||
| Royal Bank of Canada, 2.55%, 7/16/2024 | $ | 1,761,000 | 1,816,414 | |||||
| Sumitomo Mitsui Financial Group, Inc., 0.465%, 5/30/2024 | EUR | 250,000 | 266,814 | |||||
| Sumitomo Mitsui Financial Group, Inc., 3.544%, 1/17/2028 | $ | 1,027,000 | 1,105,808 | |||||
| Svenska Handelsbanken AB, 0.5%, 2/18/2030 | EUR | 700,000 | 735,475 | |||||
| UBS Group AG, 6.875% to 8/07/2025, FLR (Swap Rate - 5yr. + 4.59%) to 12/29/2049 | $ | 990,000 | 1,023,413 | |||||
| UniCredit S.p.A., 3.875% to 6/3/2027, FLR (EUR ICE Swap Rate - 5yr. + 4.081%) to 6/03/2070 | EUR | 800,000 | 626,905 | |||||
| UniCredito Italiano S.p.A., 6.572%, 1/14/2022 (n) | $ | 1,312,000 | 1,353,223 | |||||
| Wells Fargo & Co., 0.625%, 8/14/2030 | EUR | 600,000 | 604,515 | |||||
|
|
|
|||||||
| $ | 21,071,857 | |||||||
| Medical & Health Technology & Services - 5.7% | ||||||||
| Alcon, Inc., 3.8%, 9/23/2049 (n) | $ | 200,000 | $ | 217,599 | ||||
| Amplifon S.p.A., 1.125%, 2/13/2027 | EUR | 449,000 | 448,654 | |||||
| Avantor, Inc., 9%, 10/01/2025 (n) | $ | 1,415,000 | 1,534,567 | |||||
| BCPE Cycle Merger Sub II, Inc., 10.625%, 7/15/2027 (n) | 355,000 | 351,450 | ||||||
| CHS/Community Health Systems, Inc., 8%, 12/15/2027 (n) | 120,000 | 114,000 | ||||||
| Cigna Corp., 4.125%, 11/15/2025 | 522,000 | 585,255 | ||||||
| Community Health Systems, Inc., 6.625%, 2/15/2025 (n) | 970,000 | 889,975 | ||||||
| DaVita, Inc., 5%, 5/01/2025 | 970,000 | 984,550 | ||||||
| Encompass Health Corp., 5.75%, 9/15/2025 | 445,000 | 451,675 | ||||||
| HCA, Inc., 5.375%, 2/01/2025 | 2,060,000 | 2,214,788 | ||||||
| HCA, Inc., 5.875%, 2/15/2026 | 1,110,000 | 1,240,758 | ||||||
| HCA, Inc., 5.25%, 6/15/2026 | 471,000 | 525,148 | ||||||
| HCA, Inc., 5.625%, 9/01/2028 | 160,000 | 177,293 | ||||||
20
Table of Contents
Portfolio of Investments (unaudited) – continued
| Issuer | Shares/Par | Value ($) | ||||||
| Bonds - continued | ||||||||
| Medical & Health Technology & Services - continued | ||||||||
| HCA, Inc., 3.5%, 9/01/2030 | $ | 845,000 | $ | 807,696 | ||||
| HCA, Inc., 5.125%, 6/15/2039 | 287,000 | 334,727 | ||||||
| HealthSouth Corp., 5.125%, 3/15/2023 | 1,025,000 | 1,019,875 | ||||||
| HealthSouth Corp., 5.75%, 11/01/2024 | 143,000 | 143,715 | ||||||
| Heartland Dental LLC, 8.5%, 5/01/2026 (n) | 460,000 | 396,750 | ||||||
| IQVIA Holdings, Inc., 5%, 10/15/2026 (n) | 835,000 | 860,050 | ||||||
| IQVIA Holdings, Inc., 5%, 5/15/2027 (n) | 1,565,000 | 1,607,552 | ||||||
| Laboratory Corp. of America Holdings, 4.7%, 2/01/2045 | 614,000 | 744,642 | ||||||
| LifePoint Health, Inc., 4.375%, 2/15/2027 (n) | 240,000 | 225,600 | ||||||
| MPH Acquisition Holdings LLC, 7.125%, 6/01/2024 (n) | 560,000 | 499,083 | ||||||
| Polaris, 8.5%, (8.5% cash or 8.5% PIK) 12/01/2022 (n)(p) | 325,000 | 272,188 | ||||||
| Radiology Partners, Inc., 9.25%, 2/01/2028 (n) | 345,000 | 328,613 | ||||||
| Regional Care/LifePoint Health, Inc., 9.75%, 12/01/2026 (n) | 920,000 | 984,400 | ||||||
| Team Health Holdings, Inc., 6.375%, 2/01/2025 (n) | 200,000 | 109,960 | ||||||
| Tenet Healthcare Corp., 4.875%, 1/01/2026 (n) | 875,000 | 860,737 | ||||||
| Tenet Healthcare Corp., 5.125%, 11/01/2027 (n) | 605,000 | 597,437 | ||||||
| Thermo Fisher Scientific, Inc., 0.875%, 10/01/2031 | EUR | 200,000 | 212,999 | |||||
| Toledo Hospital, 6.015%, 11/15/2048 | $ | 400,000 | 484,140 | |||||
| West Street Merger Sub, Inc., 6.375%, 9/01/2025 (n) | 485,000 | 454,688 | ||||||
|
|
|
|||||||
| $ | 20,680,564 | |||||||
| Medical Equipment - 1.0% | ||||||||
| Abbott Ireland Financing DAC, 1.5%, 9/27/2026 | EUR | 450,000 | $ | 523,500 | ||||
| Boston Scientific Corp., 0.625%, 12/01/2027 | 200,000 | 207,217 | ||||||
| DH Europe Finance II S.à r.l., 0.45%, 3/18/2028 | 100,000 | 106,193 | ||||||
| Hill-Rom Holdings, Inc., 4.375%, 9/15/2027 (n) | $ | 910,000 | 921,375 | |||||
| Hologic, Inc., 4.375%, 10/15/2025 (n) | 285,000 | 286,311 | ||||||
| Teleflex, Inc., 4.875%, 6/01/2026 | 510,000 | 517,650 | ||||||
| Teleflex, Inc., 4.625%, 11/15/2027 | 1,115,000 | 1,142,875 | ||||||
|
|
|
|||||||
| $ | 3,705,121 | |||||||
| Metals & Mining - 2.3% | ||||||||
| Arconic Corp., 6%, 5/15/2025 (n) | $ | 405,000 | $ | 409,556 | ||||
| Baffinland Iron Mines Corp./Baffinland Iron Mines LP, 8.75%, 7/15/2026 (n) | 455,000 | 400,400 | ||||||
| Cleveland-Cliffs, Inc., 6.75%, 3/15/2026 (n) | 380,000 | 331,550 | ||||||
| Cleveland-Cliffs, Inc., 5.875%, 6/01/2027 | 480,000 | 300,000 | ||||||
| Compass Minerals International, Inc., 6.75%, 12/01/2027 (n) | 725,000 | 717,750 | ||||||
| Constellium N.V., 5.875%, 2/15/2026 (n) | 275,000 | 253,688 | ||||||
| First Quantum Minerals Ltd., 7.25%, 4/01/2023 (n) | 200,000 | 181,520 | ||||||
| First Quantum Minerals Ltd., 6.875%, 3/01/2026 (n) | 200,000 | 175,400 | ||||||
| Freeport-McMoRan Copper & Gold, Inc., 5.4%, 11/14/2034 | 625,000 | 585,937 | ||||||
| Freeport-McMoRan, Inc., 5%, 9/01/2027 | 670,000 | 653,250 | ||||||
21
Table of Contents
Portfolio of Investments (unaudited) – continued
| Issuer | Shares/Par | Value ($) | ||||||
| Bonds - continued | ||||||||
| Metals & Mining - continued | ||||||||
| Freeport-McMoRan, Inc., 5.25%, 9/01/2029 | $ | 670,000 | $ | 661,625 | ||||
| Grinding Media, Inc./Moly-Cop AltaSteel Ltd., 7.375%, 12/15/2023 (n) | 545,000 | 537,861 | ||||||
| Kaiser Aluminum Corp., 4.625%, 3/01/2028 (n) | 1,317,000 | 1,226,127 | ||||||
| Northwest Acquisitions ULC/Dominion Finco, Inc., 7.125%, 11/01/2022 (a)(d)(n) | 170,000 | 17,425 | ||||||
| Novelis Corp., 5.875%, 9/30/2026 (n) | 1,125,000 | 1,093,837 | ||||||
| Petra Diamonds U.S. Treasury PLC, 7.25%, 5/01/2022 (n) | 263,000 | 86,790 | ||||||
| SunCoke Energy Partners LP/SunCoke Energy Partners Finance Corp., 7.5%, 6/15/2025 (n) | 275,000 | 209,688 | ||||||
| TMS International Corp., 7.25%, 8/15/2025 (n) | 790,000 | 589,537 | ||||||
|
|
|
|||||||
| $ | 8,431,941 | |||||||
| Midstream - 3.3% | ||||||||
| AI Candelaria Spain SLU, 7.5%, 12/15/2028 (n) | $ | 1,248,000 | $ | 1,132,560 | ||||
| Cheniere Energy Partners LP, 5.25%, 10/01/2025 | 1,875,000 | 1,789,875 | ||||||
| Cheniere Energy, Inc., 4.5%, 10/01/2029 (n) | 885,000 | 816,412 | ||||||
| Cheniere Energy, Inc., 3.7%, 11/15/2029 (n) | 419,000 | 383,362 | ||||||
| Cosan Ltd., 5.5%, 9/20/2029 (n) | 919,000 | 810,981 | ||||||
| EnLink Midstream Partners LP, 4.85%, 7/15/2026 | 175,000 | 106,750 | ||||||
| EQT Midstream Partners LP , 5.5%, 7/15/2028 | 725,000 | 645,250 | ||||||
| Genesis Energy LP/Genesis Energy Finance Corp., 5.625%, 6/15/2024 | 180,000 | 152,100 | ||||||
| Genesis Energy LP/Genesis Energy Finance Corp., 6.25%, 5/15/2026 | 666,500 | 556,527 | ||||||
| GNL Quintero S.A., 4.634%, 7/31/2029 (n) | 530,000 | 549,213 | ||||||
| MPLX LP, 4.5%, 4/15/2038 | 371,000 | 331,247 | ||||||
| Peru LNG, 5.375%, 3/22/2030 | 1,047,000 | 582,655 | ||||||
| Plains All American Pipeline, 3.55%, 12/15/2029 | 436,000 | 371,620 | ||||||
| Sabine Pass Liquefaction LLC, 5%, 3/15/2027 | 500,000 | 512,540 | ||||||
| Sabine Pass Liquefaction LLC, 4.2%, 3/15/2028 | 400,000 | 391,441 | ||||||
| Targa Resources Partners LP/Targa Resources Finance Corp., 5.25%, 5/01/2023 | 690,000 | 651,774 | ||||||
| Targa Resources Partners LP/Targa Resources Finance Corp., 5.375%, 2/01/2027 | 1,140,000 | 969,000 | ||||||
| Targa Resources Partners LP/Targa Resources Finance Corp., 6.875%, 1/15/2029 | 430,000 | 394,353 | ||||||
| Western Midstream Operating LP, 4.05%, 2/01/2030 | 430,000 | 392,375 | ||||||
| Western Midstream Operating LP, 5.25%, 2/01/2050 | 593,000 | 466,246 | ||||||
|
|
|
|||||||
| $ | 12,006,281 | |||||||
| Mortgage-Backed - 1.4% | ||||||||
| Fannie Mae, TBA, 3%, 6/17/2035 | $ | 1,850,000 | $ | 1,949,133 | ||||
| Freddie Mac, 3.194%, 7/25/2027 | 850,000 | 953,915 | ||||||
22
Table of Contents
Portfolio of Investments (unaudited) – continued
| Issuer | Shares/Par | Value ($) | ||||||
| Bonds - continued | ||||||||
| Mortgage-Backed - continued | ||||||||
| Ginnie Mae, TBA, 3%, 5/15/2050 - 6/22/2050 | $ | 1,975,000 | $ | 2,101,075 | ||||
|
|
|
|||||||
| $ | 5,004,123 | |||||||
| Municipals - 0.2% | ||||||||
| Commonwealth of Puerto Rico, Public Improvement, ”C-7“, 6%, 7/01/2027 | $ | 50,000 | $ | 50,359 | ||||
| Oklahoma Development Finance Authority, Health System Rev. (OU Medicine Project), ”C“, 5.45%, 8/15/2028 | 209,000 | 240,626 | ||||||
| Puerto Rico Industrial, Tourist, Educational, Medical & Environmental Control Facilities Financing Authority Rev. (Cogeneration Facilities - AES Puerto Rico Project), 9.12%, 6/01/2022 |
285,000 | 292,125 | ||||||
|
|
|
|||||||
| $ | 583,110 | |||||||
| Natural Gas - Distribution - 0.6% | ||||||||
| Boston Gas Co., 3.15%, 8/01/2027 (n) | $ | 420,000 | $ | 445,399 | ||||
| ENGIE S.A., 0.5%, 10/24/2030 | EUR | 400,000 | 430,802 | |||||
| Naturgy Finance B.V., 1.25%, 1/15/2026 | 500,000 | 563,223 | ||||||
| NiSource, Inc., 2.95%, 9/01/2029 | $ | 826,000 | 866,684 | |||||
|
|
|
|||||||
| $ | 2,306,108 | |||||||
| Natural Gas - Pipeline - 0.2% | ||||||||
| APT Pipelines Ltd., 5%, 3/23/2035 (n) | $ | 542,000 | $ | 596,882 | ||||
| Network & Telecom - 0.3% | ||||||||
| C&W Senior Financing DAC, 6.875%, 9/15/2027 (n) | $ | 450,000 | $ | 444,375 | ||||
| Front Range BidCo, Inc., 6.125%, 3/01/2028 (n) | 275,000 | 259,193 | ||||||
| Verizon Communications, Inc., 0.875%, 3/19/2032 | EUR | 360,000 | 391,400 | |||||
|
|
|
|||||||
| $ | 1,094,968 | |||||||
| Oil Services - 0.3% | ||||||||
| Apergy Corp., 6.375%, 5/01/2026 | $ | 495,000 | $ | 405,900 | ||||
| Diamond Offshore Drill Co., 5.7%, 10/15/2039 (a)(d) | 560,000 | 60,312 | ||||||
| Ensign Drilling, Inc., 9.25%, 4/15/2024 (n) | 425,000 | 123,335 | ||||||
| Halliburton Co., 5%, 11/15/2045 | 420,000 | 340,946 | ||||||
|
|
|
|||||||
| $ | 930,493 | |||||||
| Oils - 1.1% | ||||||||
| Neste Oyj, 1.5%, 6/07/2024 | EUR | 500,000 | $ | 551,795 | ||||
| Parkland Fuel Corp., 6%, 4/01/2026 (n) | $ | 1,345,000 | 1,294,562 | |||||
| PBF Holding Co. LLC/PBF Finance Corp., 7.25%, 6/15/2025 | 580,000 | 435,000 | ||||||
| PBF Holding Co. LLC/PBF Finance Corp., 6%, 2/15/2028 (n) | 415,000 | 295,439 | ||||||
| Phillips 66, 4.875%, 11/15/2044 | 356,000 | 399,744 | ||||||
| Puma International Financing S.A., 5%, 1/24/2026 | 900,000 | 568,039 | ||||||
| Thaioil Treasury Center Co. Ltd., 5.375%, 11/20/2048 (n) | 359,000 | 401,304 | ||||||
|
|
|
|||||||
| $ | 3,945,883 | |||||||
23
Table of Contents
Portfolio of Investments (unaudited) – continued
| Issuer | Shares/Par | Value ($) | ||||||
| Bonds - continued | ||||||||
| Other Banks & Diversified Financials - 2.7% | ||||||||
| AIB Group PLC, 1.875% to 11/19/2024, FLR (EUR Swap Rate-5yr. + 2.15%) to 11/19/2029 | EUR | 1,000,000 | $ | 1,032,176 | ||||
| Alpha Bank, 4.25%, 2/13/2030 | 740,000 | 575,759 | ||||||
| Banca Monte dei Paschi di Siena S.p.A., 2.625%, 4/28/2025 | 800,000 | 744,852 | ||||||
| Bangkok Bank (Hong Kong), 4.05%, 3/19/2024 (n) | $ | 1,046,000 | 1,101,930 | |||||
| Banque Federative du Credit Mutuel S.A., 1.25%, 12/05/2025 | GBP | 300,000 | 366,909 | |||||
| BPCE S.A., 5.25%, 4/16/2029 | 300,000 | 448,400 | ||||||
| CYBG PLC, 9.25% to 6/08/2024, FLR (GBP Government Yield - 5yr. + 8.307%) to 6/13/2049 | 200,000 | 201,405 | ||||||
| Deutsche Bank AG, 2.625%, 12/16/2024 | 500,000 | 603,345 | ||||||
| Deutsche Bank AG, 6%, 5/31/2049 | EUR | 200,000 | 173,692 | |||||
| Groupe BPCE S.A., 4.5%, 3/15/2025 (n) | $ | 652,000 | 686,620 | |||||
| Groupe BPCE S.A., 1.375%, 12/23/2026 | GBP | 300,000 | 365,546 | |||||
| Intesa Sanpaolo S.p.A., 2.5%, 1/15/2030 | 350,000 | 402,374 | ||||||
| JSC Kazkommertsbank, 5.5%, 12/21/2022 | $ | 910,652 | 887,695 | |||||
| KBC Group N.V., 0.5% to 12/03/2024, FLR (EUR Swap Rate -5yr. + 1.1%) to 12/03/2029 | EUR | 200,000 | 206,695 | |||||
| Macquarie Group Ltd., 1.25% to 3/5/2024, FLR (EURIBOR -3mo. + 0.839%) to 3/05/2025 | 300,000 | 323,692 | ||||||
| UBS AG, 5.125%, 5/15/2024 | $ | 981,000 | 1,034,900 | |||||
| Virgin Money UK PLC, 4% to 9/03/2026, FLR (GBP Government Yield - 1yr. + 3.75%) to 9/03/2027 | GBP | 500,000 | 612,455 | |||||
|
|
|
|||||||
| $ | 9,768,445 | |||||||
| Pharmaceuticals - 0.9% | ||||||||
| Bausch Health Companies, Inc., 5.5%, 3/01/2023 (n) | $ | 275,000 | $ | 272,250 | ||||
| Bausch Health Companies, Inc., 6.125%, 4/15/2025 (n) | 2,025,000 | 2,050,313 | ||||||
| Bausch Health Companies, Inc., 5%, 1/30/2028 (n) | 290,000 | 278,309 | ||||||
| Endo Finance LLC/Endo Finco, Inc., 5.375%, 1/15/2023 (n) | 660,000 | 495,000 | ||||||
|
|
|
|||||||
| $ | 3,095,872 | |||||||
| Pollution Control - 0.4% | ||||||||
| Covanta Holding Corp., 5.875%, 3/01/2024 | $ | 765,000 | $ | 751,612 | ||||
| Covanta Holding Corp., 6%, 1/01/2027 | 140,000 | 134,400 | ||||||
| GFL Environmental, Inc., 7%, 6/01/2026 (n) | 350,000 | 364,385 | ||||||
| GFL Environmental, Inc., 8.5%, 5/01/2027 (n) | 246,000 | 268,433 | ||||||
|
|
|
|||||||
| $ | 1,518,830 | |||||||
| Precious Metals & Minerals - 0.0% | ||||||||
| Teck Resources Ltd., 6.25%, 7/15/2041 | $ | 125,000 | $ | 117,808 | ||||
| Printing & Publishing - 0.5% | ||||||||
| Cimpress N.V., 7%, 6/15/2026 (n) | $ | 770,000 | $ | 559,097 | ||||
| Meredith Corp., 6.875%, 2/01/2026 | 530,000 | 454,210 | ||||||
24
Table of Contents
Portfolio of Investments (unaudited) – continued
| Issuer | Shares/Par | Value ($) | ||||||
| Bonds - continued | ||||||||
| Printing & Publishing - continued | ||||||||
| Nielsen Finance LLC, 5%, 4/15/2022 (n) | $ | 886,000 | $ | 872,807 | ||||
|
|
|
|||||||
| $ | 1,886,114 | |||||||
| Railroad & Shipping - 0.3% | ||||||||
| Lima Metro Line 2 Finance Ltd., 5.875%, 7/05/2034 | $ | 543,697 | $ | 608,696 | ||||
| Lima Metro Line 2 Finance Ltd., 4.35%, 4/05/2036 (n) | 314,000 | 318,239 | ||||||
|
|
|
|||||||
| $ | 926,935 | |||||||
| Real Estate - Apartment - 0.1% | ||||||||
| Camden Property Trust, 2.8%, 5/15/2030 | $ | 174,000 | $ | 180,469 | ||||
| Real Estate - Healthcare - 0.4% | ||||||||
| MPT Operating Partnership LP/MPT Financial Co., REIT, 5.25%, 8/01/2026 | $ | 980,000 | $ | 989,800 | ||||
| MPT Operating Partnership LP/MPT Financial Co., REIT, 5%, 10/15/2027 | 435,000 | 443,700 | ||||||
|
|
|
|||||||
| $ | 1,433,500 | |||||||
| Real Estate - Office - 0.2% | ||||||||
| Merlin Properties SOCIMI S.A., REIT, 1.875%, 11/02/2026 | EUR | 250,000 | $ | 261,279 | ||||
| Merlin Properties SOCIMI S.A., REIT, 1.875%, 12/04/2034 | 300,000 | 288,161 | ||||||
|
|
|
|||||||
| $ | 549,440 | |||||||
| Real Estate - Other - 0.5% | ||||||||
| Ryman Hospitality Properties, Inc., REIT, 5%, 4/15/2023 | $ | 230,000 | $ | 213,900 | ||||
| Ryman Hospitality Properties, Inc., REIT, 4.75%, 10/15/2027 (n) | 1,099,000 | 958,877 | ||||||
| SELP Finance S.à r.l., 1.5%, 12/20/2026 | EUR | 460,000 | 473,509 | |||||
|
|
|
|||||||
| $ | 1,646,286 | |||||||
| Real Estate - Retail - 0.1% | ||||||||
| VEREIT Operating Partnership LP, REIT, 3.1%, 12/15/2029 | $ | 390,000 | $ | 333,929 | ||||
| Restaurants - 0.5% | ||||||||
| Golden Nugget, Inc., 6.75%, 10/15/2024 (n) | $ | 895,000 | $ | 698,100 | ||||
| KFC Holding Co./Pizza Hut Holdings LLC/Taco Bell of America LLC, 5.25%, 6/01/2026 (n) | 1,140,000 | 1,165,650 | ||||||
|
|
|
|||||||
| $ | 1,863,750 | |||||||
| Retailers - 0.7% | ||||||||
| DriveTime Automotive Group, Inc., 8%, 6/01/2021 (n) | $ | 770,000 | $ | 689,150 | ||||
| EG Global Finance PLC, 6.75%, 2/07/2025 (n) | 200,000 | 182,000 | ||||||
| L Brands, Inc., 5.25%, 2/01/2028 | 880,000 | 631,400 | ||||||
| Marks & Spencer PLC, 4.75%, 6/12/2025 | GBP | 125,000 | 155,939 | |||||
| Marks & Spencer PLC, 3.25%, 7/10/2027 | 350,000 | 397,092 | ||||||
25
Table of Contents
Portfolio of Investments (unaudited) – continued
| Issuer | Shares/Par | Value ($) | ||||||
| Bonds - continued | ||||||||
| Retailers - continued | ||||||||
| Sally Beauty Holdings, Inc., 5.625%, 12/01/2025 | $ | 400,000 | $ | 327,840 | ||||
|
|
|
|||||||
| $ | 2,383,421 | |||||||
| Specialty Chemicals - 0.4% | ||||||||
| Koppers, Inc., 6%, 2/15/2025 (n) | $ | 595,000 | $ | 483,438 | ||||
| Univar Solutions USA, Inc., 5.125%, 12/01/2027 (n) | 1,007,000 | 999,447 | ||||||
|
|
|
|||||||
| $ | 1,482,885 | |||||||
| Specialty Stores - 0.4% | ||||||||
| Penske Automotive Group Co., 5.375%, 12/01/2024 | $ | 535,000 | $ | 492,039 | ||||
| Penske Automotive Group Co., 5.5%, 5/15/2026 | 520,000 | 475,800 | ||||||
| PetSmart, Inc., 7.125%, 3/15/2023 (n) | 285,000 | 272,888 | ||||||
| PetSmart, Inc., 8.875%, 6/01/2025 (n) | 225,000 | 218,250 | ||||||
|
|
|
|||||||
| $ | 1,458,977 | |||||||
| State & Local Agencies - 0.2% | ||||||||
| New Jersey Economic Development Authority State Pension Funding Rev., ”A“, 7.425%, 2/15/2029 | $ | 526,000 | $ | 622,379 | ||||
| Supermarkets - 1.4% | ||||||||
| Albertsons Cos. LLC/Safeway, Inc., 6.625%, 6/15/2024 | $ | 335,000 | $ | 346,306 | ||||
| Albertsons Cos. LLC/Safeway, Inc., 5.75%, 3/15/2025 | 535,000 | 549,713 | ||||||
| Albertsons Cos. LLC/Safeway, Inc., 4.625%, 1/15/2027 (n) | 1,000,000 | 1,010,000 | ||||||
| Albertsons Cos. LLC/Safeway, Inc., 5.875%, 2/15/2028 (n) | 55,000 | 57,459 | ||||||
| Auchan Holding S.A., 2.875%, 1/29/2026 | EUR | 300,000 | 333,972 | |||||
| Eurotorg LLC Via Bonitron DAC, 8.75%, 10/30/2022 | $ | 1,003,000 | 983,441 | |||||
| Iceland Bondco PLC, 4.625%, 3/15/2025 | GBP | 700,000 | 763,412 | |||||
| Loblaw Cos. Ltd., 4.86%, 9/12/2023 | CAD | 421,000 | 332,463 | |||||
| Tesco Corp. Treasury Services PLC, 2.5%, 5/02/2025 | GBP | 400,000 | 516,554 | |||||
|
|
|
|||||||
| $ | 4,893,320 | |||||||
| Supranational - 0.4% | ||||||||
| International Bank for Reconstruction and Development, 4.25%, 6/24/2025 | AUD | 405,000 | $ | 307,556 | ||||
| West African Development Bank, 4.7%, 10/22/2031 | $ | 463,000 | 416,700 | |||||
| West African Development Bank, 4.7%, 10/22/2031 (n) | 806,000 | 725,400 | ||||||
|
|
|
|||||||
| $ | 1,449,656 | |||||||
| Telecommunications - Wireless - 4.3% | ||||||||
| Altice France S.A., 7.375%, 5/01/2026 (n) | $ | 1,415,000 | $ | 1,478,675 | ||||
| Altice France S.A., 8.125%, 2/01/2027 (n) | 650,000 | 700,375 | ||||||
| Altice France S.A., 5.5%, 1/15/2028 (n) | 200,000 | 201,420 | ||||||
| Altice France S.A., 6%, 2/15/2028 (n) | 485,000 | 441,253 | ||||||
| American Tower Corp., REIT, 3.5%, 1/31/2023 | 743,000 | 785,202 | ||||||
26
Table of Contents
Portfolio of Investments (unaudited) – continued
| Issuer | Shares/Par | Value ($) | ||||||
| Bonds - continued | ||||||||
| Telecommunications - Wireless - continued | ||||||||
| American Tower Corp., REIT, 3.8%, 8/15/2029 | $ | 602,000 | $ | 672,947 | ||||
| Crown Castle International Corp., 3.7%, 6/15/2026 | 314,000 | 340,970 | ||||||
| Digicel International Finance Ltd., 8.75%, 5/25/2024 (n) | 400,000 | 370,500 | ||||||
| Millicom International Cellular S.A., 6.625%, 10/15/2026 (n) | 683,000 | 692,323 | ||||||
| Rogers Communications, Inc., 3.7%, 11/15/2049 | 339,000 | 364,206 | ||||||
| SBA Communications Corp., 4.875%, 9/01/2024 | 1,200,000 | 1,235,400 | ||||||
| SBA Communications Corp., 3.875%, 2/15/2027 (n) | 270,000 | 275,738 | ||||||
| Sprint Capital Corp., 6.875%, 11/15/2028 | 1,210,000 | 1,457,264 | ||||||
| Sprint Corp., 7.625%, 3/01/2026 | 1,980,000 | 2,340,558 | ||||||
| Tele2 AB Co., 2.125%, 5/15/2028 | EUR | 700,000 | 816,516 | |||||
| Telefonaktiebolaget LM Ericsson, 1.875%, 3/01/2024 | 350,000 | 385,019 | ||||||
| Telefónica Celular del Paraguay S.A., 5.875%, 4/15/2027 (n) | $ | 900,000 | 878,850 | |||||
| T-Mobile USA, Inc., 6.5%, 1/15/2024 | 405,000 | 414,072 | ||||||
| T-Mobile USA, Inc., 6.5%, 1/15/2026 | 590,000 | 623,188 | ||||||
| T-Mobile USA, Inc., 5.375%, 4/15/2027 | 1,125,000 | 1,189,811 | ||||||
|
|
|
|||||||
| $ | 15,664,287 | |||||||
| Tobacco - 0.2% | ||||||||
| B.A.T. Netherlands Finance B.V., 2.375%, 10/07/2024 | EUR | 493,000 | $ | 563,566 | ||||
| Vector Group Ltd., 10.5%, 11/01/2026 (n) | $ | 300,000 | 276,000 | |||||
|
|
|
|||||||
| $ | 839,566 | |||||||
| Transportation - Services - 1.2% | ||||||||
| Abertis Infraestructuras S.A., 3.375%, 11/27/2026 | GBP | 800,000 | $ | 979,218 | ||||
| Heathrow Funding Ltd., 1.5%, 2/11/2030 | EUR | 300,000 | 321,806 | |||||
| Heathrow Funding Ltd., 4.625%, 10/31/2046 | GBP | 200,000 | 328,535 | |||||
| Navios South American Logistics, Inc./Navios Logistics Finance (U.S.), Inc., 7.25%, 5/01/2022 | $ | 101,000 | 89,890 | |||||
| Rumo Luxembourg S.à r.l., 5.875%, 1/18/2025 | 1,212,000 | 1,199,759 | ||||||
| Transurban Finance Co., 1.75%, 3/29/2028 | EUR | 296,000 | 324,987 | |||||
| Vinci S.A., 3.75%, 4/10/2029 (n) | $ | 821,000 | 920,932 | |||||
|
|
|
|||||||
| $ | 4,165,127 | |||||||
| U.S. Treasury Obligations - 1.5% | ||||||||
| U.S. Treasury Bonds, 3.5%, 2/15/2039 | $ | 1,000,000 | $ | 1,436,953 | ||||
| U.S. Treasury Bonds, 2.25%, 8/15/2049 | 408,200 | 504,956 | ||||||
| U.S. Treasury Bonds, 2.375%, 11/15/2049 (f) | 2,730,000 | 3,468,273 | ||||||
|
|
|
|||||||
| $ | 5,410,182 | |||||||
| Utilities - Electric Power - 5.2% | ||||||||
| Adani Green Energy (UP) Ltd./Prayatna Developers Private Ltd., 6.25%, 12/10/2024 (n) | $ | 1,601,000 | $ | 1,559,534 | ||||
| American Electric Power, 2.3%, 3/01/2030 | 317,000 | 312,802 | ||||||
| AusNet Services Holdings Pty Ltd., 0.625%, 8/25/2030 | EUR | 500,000 | 531,765 | |||||
27
Table of Contents
Portfolio of Investments (unaudited) – continued
| Issuer | Shares/Par | Value ($) | ||||||
| Bonds - continued | ||||||||
| Utilities - Electric Power - continued | ||||||||
| Clearway Energy Operating LLC, 5.75%, 10/15/2025 | $ | 1,750,000 | $ | 1,802,325 | ||||
| Clearway Energy Operating LLC, 4.75%, 3/15/2028 (n) | 345,000 | 351,038 | ||||||
| Drax Finco PLC, 6.625%, 11/01/2025 (n) | 745,000 | 759,900 | ||||||
| Duke Energy Corp., 3.75%, 9/01/2046 | 220,000 | 249,441 | ||||||
| Emera U.S. Finance LP, 2.7%, 6/15/2021 | 142,000 | 142,807 | ||||||
| Emera U.S. Finance LP, 3.55%, 6/15/2026 | 162,000 | 170,983 | ||||||
| Enel Finance International N.V., 0.375%, 6/17/2027 | EUR | 250,000 | 266,644 | |||||
| Enel Finance International N.V., 3.5%, 4/06/2028 (n) | $ | 392,000 | 407,848 | |||||
| Enel S.p.A., 8.75% to 9/24/2023, FLR (Swap Rate - 5yr. + 5.88%) to 9/24/2043, FLR (Swap Rate - 5yr. + 6.63%) to 9/24/2073 (n) | 500,000 | 563,680 | ||||||
| Enel S.p.A., 6.625% to 9/15/2021, FLR (GBP Swap Rate - 5yr. + 4.089%) to 9/15/2026, FLR (GBP Swap Rate - 5yr. + 4.339%) to 9/15/2041, FLR (GBP Swap Rate - 5yr. + 5.089%) to 9/15/2076 | GBP | 230,000 | 299,128 | |||||
| ENGIE Energía Chile S.A., 4.5%, 1/29/2025 (n) | $ | 1,023,000 | 1,070,460 | |||||
| ENGIE Energía Chile S.A., 3.4%, 1/28/2030 (n) | 461,000 | 446,714 | ||||||
| Evergy, Inc., 2.9%, 9/15/2029 | 918,000 | 941,152 | ||||||
| Exelon Corp., 3.497%, 6/01/2022 | 259,000 | 266,865 | ||||||
| Georgia Power Co., 3.7%, 1/30/2050 | 446,000 | 504,618 | ||||||
| Listrindo Capital B.V., 4.95%, 9/14/2026 | 910,000 | 873,600 | ||||||
| Mong Duong Finance Holdings B.V., 5.125%, 5/07/2029 | 594,000 | 563,924 | ||||||
| NextEra Energy Operating Co., 4.25%, 9/15/2024 (n) | 1,315,000 | 1,334,725 | ||||||
| NextEra Energy Operating Co., 4.5%, 9/15/2027 (n) | 780,000 | 800,475 | ||||||
| NextEra Energy, Inc., 4.25%, 7/15/2024 (n) | 478,000 | 486,508 | ||||||
| PPL Capital Funding, Inc., 5%, 3/15/2044 | 270,000 | 320,646 | ||||||
| Star Energy Geothermal (Wayang Windu) Ltd., 6.75%, 4/24/2033 | 779,113 | 721,036 | ||||||
| TerraForm Global Operating LLC, 6.125%, 3/01/2026 (n) | 230,000 | 227,700 | ||||||
| TerraForm Power Operating Co., 5%, 1/31/2028 (n) | 910,000 | 946,400 | ||||||
| Transelec S.A., 4.25%, 1/14/2025 (n) | 535,000 | 547,037 | ||||||
| Virginia Electric & Power Co., 3.5%, 3/15/2027 | 839,000 | 935,894 | ||||||
| Virginia Electric & Power Co., 2.875%, 7/15/2029 | 348,000 | 374,619 | ||||||
|
|
|
|||||||
| $ | 18,780,268 | |||||||
| Utilities - Other - 0.1% | ||||||||
| United Utilities Water Finance PLC, 1.75%, 2/10/2038 | GBP | 325,000 | $ | 404,751 | ||||
| Total Bonds (Identified Cost, $455,955,955) | $ | 439,875,728 | ||||||
| Common Stocks - 1.4% | ||||||||
| Construction - 0.0% | ||||||||
| ICA Tenedora, S.A. de C.V. (a) | 127,848 | $ | 188,146 | |||||
| Energy - Independent - 0.0% | ||||||||
| Frontera Energy Corp. | 20,290 | $ | 65,563 | |||||
28
Table of Contents
Portfolio of Investments (unaudited) – continued
| Issuer | Shares/Par | Value ($) | ||||||
| Common Stocks - continued | ||||||||
| Oil Services - 0.1% | ||||||||
| LTRI Holdings LP (a)(u) | 520 | $ | 275,288 | |||||
| Special Products & Services - 1.3% | ||||||||
| iShares iBoxx $ High Yield Corporate Bond ETF | 58,000 | $ | 4,664,940 | |||||
| Total Common Stocks (Identified Cost, $6,599,467) |
|
$ | 5,193,937 | |||||
| Floating Rate Loans (r) - 0.6% | ||||||||
| Broadcasting - 0.1% | ||||||||
| Nexstar Broadcasting, Inc., Term Loan B4, 3.734%, 9/18/2026 | $ | 146,015 | $ | 136,524 | ||||
| WMG Acquisition Corp., Term Loan F, 2.528%, 11/01/2023 | 289,000 | 279,453 | ||||||
|
|
|
|||||||
| $ | 415,977 | |||||||
| Cable TV - 0.0% | ||||||||
| CSC Holdings LLC, Term Loan B5, 3.314%, 4/15/2027 | $ | 151,620 | $ | 144,039 | ||||
| Chemicals - 0.1% | ||||||||
| Axalta Coating Systems U.S. Holdings, Inc., Term Loan B3, 3.2%, 6/01/2024 | $ | 178,265 | $ | 172,739 | ||||
| Element Solutions, Inc., Term Loan B1, 2.403%, 1/31/2026 | 151,240 | 144,198 | ||||||
|
|
|
|||||||
| $ | 316,937 | |||||||
| Computer Software - Systems - 0.1% | ||||||||
| Sabre GLBL, Inc., Term Loan B, 2.75%, 2/22/2024 | $ | 302,453 | $ | 274,539 | ||||
| SS&C Technologies, Inc., Term Loan B5, 2.153%, 4/16/2025 | 151,226 | 145,051 | ||||||
|
|
|
|||||||
| $ | 419,590 | |||||||
| Conglomerates - 0.1% | ||||||||
| Gates Global LLC, Term Loan B2, 3.75%, 4/01/2024 | $ | 311,755 | $ | 286,814 | ||||
| Food & Beverages - 0.0% | ||||||||
| U.S. Foods, Inc., Term Loan B, 2.153%, 6/27/2023 | $ | 134,898 | $ | 123,853 | ||||
| Medical & Health Technology & Services - 0.1% | ||||||||
| DaVita Healthcare Partners, Inc., Term Loan B, 2.153%, 8/12/2026 | $ | 151,241 | $ | 146,751 | ||||
| Jaguar Holding Co. II, Term Loan, 2.903%, 8/18/2022 | 151,206 | 148,040 | ||||||
|
|
|
|||||||
| $ | 294,791 | |||||||
| Pharmaceuticals - 0.0% | ||||||||
| Bausch Health Companies, Inc., Term Loan B, 3.468%, 11/27/2025 | $ | 147,657 | $ | 141,593 | ||||
| Printing & Publishing - 0.1% | ||||||||
| Nielsen Finance LLC, Term Loan B4, 2.863%, 10/04/2023 | $ | 151,221 | $ | 145,550 | ||||
| Total Floating Rate Loans (Identified Cost, $2,411,149) |
|
$ | 2,289,144 | |||||
29
Table of Contents
Portfolio of Investments (unaudited) – continued
| Issuer | Strike Price | First Exercise | Shares/Par | Value ($) | ||||||||||||
| Warrants - 0.0% | ||||||||||||||||
| Forest & Paper Products - 0.0% |
|
|||||||||||||||
| Appvion Holdings Corp. - Tranche A (1 share for 1 warrant, Expiration 6/13/23) (a) | $ | 27.17 | 8/24/18 | 332 | $ | 42 | ||||||||||
| Appvion Holdings Corp. - Tranche B (1 share for 1 warrant, Expiration 6/13/23) (a) | 31.25 | 8/24/18 | 332 | 3 | ||||||||||||
| Total Warrants (Identified Cost, $0) |
|
$ | 45 | |||||||||||||
| Investment Companies (h) - 4.1% |
|
|||||||||||||||
| Money Market Funds - 4.1% | ||||||||||||||||
| MFS Institutional Money Market Portfolio, 0.41% (v) (Identified Cost, $14,783,819) |
|
14,781,543 | $ | 14,783,021 | ||||||||||||
| Underlying/Expiration Date/Exercise Price |
Put/Call | Counterparty | Notional Amount |
Par Amount/ Number of |
||||||||||||||||
| Purchased Options - 0.0% | ||||||||||||||||||||
| Market Index Securities - 0.0% | ||||||||||||||||||||
| Markit iTraxx Europe Index - May 2020 @ EUR 800 (Premiums Paid, $204,205) |
Put | |
Goldman Sachs International |
|
$ | 7,965,905 | EUR 7,200,000 | $ | 18,645 | |||||||||||
| Other Assets, Less Liabilities - (27.9)% | (100,792,528) |
|||||||||||||||||||
| Net Assets - 100.0% |
|
$ | 361,367,992 | |||||||||||||||||
| (a) | Non-income producing security. |
| (d) | In default. |
| (f) | All or a portion of the security has been segregated as collateral for open futures contracts. |
| (h) | An affiliated issuer, which may be considered one in which the fund owns 5% or more of the outstanding voting securities, or a company which is under common control. At period end, the aggregate values of the fund’s investments in affiliated issuers and in unaffiliated issuers were $14,783,021 and $447,377,499, respectively. |
| (i) | Interest only security for which the fund receives interest on notional principal (Par amount). Par amount shown is the notional principal and does not reflect the cost of the security. |
| (n) | Securities exempt from registration under Rule 144A of the Securities Act of 1933. These securities may be sold in the ordinary course of business in transactions exempt from registration, normally to qualified institutional buyers. At period end, the aggregate value of these securities was $217,700,879, representing 60.2% of net assets. |
| (p) | Payment-in-kind (PIK) security for which interest income may be received in additional securities and/or cash. |
| (r) | The remaining maturities of floating rate loans may be less than the stated maturities shown as a result of contractual or optional prepayments by the borrower. Such prepayments cannot be predicted with certainty. These loans may be subject to restrictions on resale. The interest rate shown represents the weighted average of the floating interest rates on settled contracts |
30
Table of Contents
Portfolio of Investments (unaudited) – continued
| within the loan facility at period end, unless otherwise indicated. The floating interest rates on settled contracts are determined periodically by reference to a base lending rate and a spread. |
| (u) | The security was valued using significant unobservable inputs and is considered level 3 under the fair value hierarchy. For further information about the fund’s level 3 holdings, please see Note 2 in the Notes to Financial Statements. |
| (v) | Affiliated issuer that is available only to investment companies managed by MFS. The rate quoted for the MFS Institutional Money Market Portfolio is the annualized seven-day yield of the fund at period end. |
| (z) | Restricted securities are not registered under the Securities Act of 1933 and are subject to legal restrictions on resale. These securities generally may be resold in transactions exempt from registration or to the public if the securities are subsequently registered. Disposal of these securities may involve time-consuming negotiations and prompt sale at an acceptable price may be difficult. The fund holds the following restricted securities: |
| Restricted Securities | Acquisition Date |
Cost | Value | |||||||
| Afren PLC, 11.5%, 2/01/2016 | 1/27/11 | $315,788 | $268 | |||||||
| Afren PLC, 10.25%, 4/08/2019 | 3/01/12 | 209,874 | 175 | |||||||
| Total Restricted Securities | $443 | |||||||||
| % of Net assets | 0.0% | |||||||||
The following abbreviations are used in this report and are defined:
| CDO | Collateralized Debt Obligation |
| CLO | Collateralized Loan Obligation |
| CMT | Constant Maturity Treasury |
| ETF | Exchange-Traded Fund |
| EURIBOR | Euro Interbank Offered Rate |
| FLR | Floating Rate. Interest rate resets periodically based on the parenthetically disclosed reference rate plus a spread (if any). The period-end rate reported may not be the current rate. All reference rates are USD unless otherwise noted. |
| ICE | Intercontinental Exchange |
| LIBOR | London Interbank Offered Rate |
| REIT | Real Estate Investment Trust |
| TBA | To Be Announced |
Abbreviations indicate amounts shown in currencies other than the U.S. dollar. All amounts are stated in U.S. dollars unless otherwise indicated. A list of abbreviations is shown below:
| AUD | Australian Dollar |
| CAD | Canadian Dollar |
| CHF | Swiss Franc |
| DKK | Danish Krone |
| EUR | Euro |
| GBP | British Pound |
| HKD | Hong Kong Dollar |
| JPY | Japanese Yen |
| KRW | South Korean Won |
| MXN | Mexican Peso |
| NOK | Norwegian Krone |
| NZD | New Zealand Dollar |
| SGD | Singapore Dollar |
31
Table of Contents
Portfolio of Investments (unaudited) – continued
Derivative Contracts at 4/30/20
Forward Foreign Currency Exchange Contracts
| Currency Purchased |
Currency Sold |
Counterparty | Settlement Date |
Unrealized Appreciation (Depreciation) |
||||||||||||||
| Asset Derivatives | ||||||||||||||||||
| AUD | 275,141 | USD | 161,932 | Deutsche Bank AG | 5/22/2020 | $17,374 | ||||||||||||
| CAD | 131,000 | USD | 93,232 | Goldman Sachs International | 5/22/2020 | 883 | ||||||||||||
| DKK | 11,055 | USD | 1,621 | Citibank N.A. | 5/26/2020 | 3 | ||||||||||||
| EUR | 654,408 | USD | 710,918 | Credit Suisse Group | 5/22/2020 | 6,441 | ||||||||||||
| EUR | 836,174 | USD | 915,177 | Deutsche Bank AG | 5/22/2020 | 1,433 | ||||||||||||
| EUR | 544,572 | USD | 589,955 | Goldman Sachs International | 5/22/2020 | 7,003 | ||||||||||||
| EUR | 534,033 | USD | 585,135 | JPMorgan Chase Bank N.A. | 5/22/2020 | 269 | ||||||||||||
| EUR | 1,256,299 | USD | 1,370,053 | Merrill Lynch International | 5/20/2020 | 7,043 | ||||||||||||
| EUR | 281,654 | USD | 306,743 | Merrill Lynch International | 5/22/2020 | 2,005 | ||||||||||||
| EUR | 539,180 | USD | 585,846 | UBS AG | 5/22/2020 | 5,202 | ||||||||||||
| GBP | 1,388,437 | USD | 1,724,271 | Deutsche Bank AG | 5/22/2020 | 24,576 | ||||||||||||
| GBP | 564,011 | USD | 700,766 | Goldman Sachs International | 5/22/2020 | 9,650 | ||||||||||||
| GBP | 424,055 | USD | 530,769 | JPMorgan Chase Bank N.A. | 5/22/2020 | 3,362 | ||||||||||||
| GBP | 402,628 | USD | 500,669 | Morgan Stanley Capital Services, Inc. | 5/22/2020 | 6,473 | ||||||||||||
| HKD | 19,818,000 | USD | 2,542,318 | Citibank N.A. | 5/22/2020 | 13,447 | ||||||||||||
| JPY | 115,338,000 | USD | 1,049,033 | Deutsche Bank AG | 5/22/2020 | 25,935 | ||||||||||||
| KRW | 42,694,000 | USD | 34,879 | JPMorgan Chase Bank N.A. | 6/22/2020 | 188 | ||||||||||||
| NZD | 339,000 | USD | 205,260 | Deutsche Bank AG | 5/22/2020 | 2,672 | ||||||||||||
| USD | 645,117 | AUD | 982,795 | Brown Brothers Harriman | 5/22/2020 | 4,642 | ||||||||||||
| USD | 209,049 | CAD | 278,107 | Citibank N.A. | 5/22/2020 | 9,249 | ||||||||||||
| USD | 230,417 | EUR | 204,351 | Barclays Bank PLC | 5/22/2020 | 6,408 | ||||||||||||
| USD | 818,408 | EUR | 729,267 | Brown Brothers Harriman | 5/22/2020 | 18,989 | ||||||||||||
| USD | 2,870,992 | EUR | 2,569,857 | Citibank N.A. | 5/22/2020 | 53,925 | ||||||||||||
| USD | 755,965 | EUR | 681,483 | Deutsche Bank AG | 5/22/2020 | 8,925 | ||||||||||||
| USD | 1,543,219 | EUR | 1,396,738 | JPMorgan Chase Bank N.A. | 5/22/2020 | 12,119 | ||||||||||||
| USD | 449,313 | EUR | 400,833 | Merrill Lynch International | 5/22/2020 | 9,922 | ||||||||||||
| USD | 266,408 | EUR | 241,228 | Morgan Stanley Capital Services, Inc. | 5/22/2020 | 1,974 | ||||||||||||
| USD | 550,568 | EUR | 499,446 | UBS AG | 5/22/2020 | 3,078 | ||||||||||||
| USD | 11,845,804 | GBP | 9,161,276 | Merrill Lynch International | 5/22/2020 | 306,451 | ||||||||||||
| USD | 385,588 | GBP | 298,686 | UBS AG | 5/20/2020 | 9,372 | ||||||||||||
| USD | 1,684,580 | MXN | 32,899,000 | JPMorgan Chase Bank N.A. | 5/22/2020 | 323,426 | ||||||||||||
|
|
|
|||||||||||||||||
| $902,439 | ||||||||||||||||||
|
|
|
|||||||||||||||||
| Liability Derivatives | ||||||||||||||||||
| EUR | 4,063,702 | USD | 4,511,404 | Deutsche Bank AG | 5/22/2020 | $(56,789 | ) | |||||||||||
| EUR | 1,165,191 | USD | 1,288,843 | Goldman Sachs International | 5/22/2020 | (11,564 | ) | |||||||||||
32
Table of Contents
Portfolio of Investments (unaudited) – continued
Forward Foreign Currency Exchange Contracts - continued
| Currency Purchased |
Currency Sold |
Counterparty | Settlement Date |
Unrealized Appreciation (Depreciation) |
||||||||||||||
| Liability Derivatives - continued | ||||||||||||||||||
| EUR | 2,520,454 | USD | 2,813,955 | JPMorgan Chase Bank N.A. | 5/22/2020 | $(51,043 | ) | |||||||||||
| EUR | 45,257 | USD | 51,362 | UBS AG | 5/22/2020 | (1,751 | ) | |||||||||||
| GBP | 232,597 | USD | 302,096 | Morgan Stanley Capital Services, Inc. | 5/20/2020 | (9,124 | ) | |||||||||||
| NOK | 1,421,290 | USD | 151,508 | Merrill Lynch International | 5/22/2020 | (12,767 | ) | |||||||||||
| SGD | 54,000 | USD | 38,674 | Goldman Sachs International | 5/22/2020 | (378 | ) | |||||||||||
| USD | 89,630 | AUD | 141,000 | UBS AG | 5/22/2020 | (2,258 | ) | |||||||||||
| USD | 205,964 | CAD | 291,000 | UBS AG | 5/22/2020 | (3,099 | ) | |||||||||||
| USD | 186,479 | CHF | 180,919 | UBS AG | 5/22/2020 | (1,038 | ) | |||||||||||
| USD | 2,526,018 | EUR | 2,324,000 | Citibank N.A. | 5/22/2020 | (21,542 | ) | |||||||||||
| USD | 9,827,587 | EUR | 9,002,755 | Deutsche Bank AG | 5/18/2020 | (40,418 | ) | |||||||||||
| USD | 3,910,152 | EUR | 3,597,364 | Deutsche Bank AG | 5/22/2020 | (33,265 | ) | |||||||||||
| USD | 27,742,697 | EUR | 25,380,537 | Goldman Sachs International | 5/22/2020 | (79,351 | ) | |||||||||||
| USD | 1,129,413 | EUR | 1,041,711 | JPMorgan Chase Bank N.A. | 5/22/2020 | (12,507 | ) | |||||||||||
| USD | 442,823 | EUR | 406,080 | Merrill Lynch International | 5/20/2020 | (2,303 | ) | |||||||||||
| USD | 411,091 | EUR | 379,438 | Merrill Lynch International | 5/22/2020 | (4,847 | ) | |||||||||||
| USD | 994,103 | EUR | 918,442 | Morgan Stanley Capital Services, Inc. | 5/22/2020 | (12,690 | ) | |||||||||||
| USD | 1,376,963 | EUR | 1,265,961 | UBS AG | 5/22/2020 | (10,779 | ) | |||||||||||
| USD | 265,580 | GBP | 211,004 | Barclays Bank PLC | 5/22/2020 | (197 | ) | |||||||||||
| USD | 368,601 | GBP | 300,312 | Citibank N.A. | 5/22/2020 | (9,666 | ) | |||||||||||
| USD | 352,667 | GBP | 297,009 | Deutsche Bank AG | 5/22/2020 | (21,439 | ) | |||||||||||
| USD | 1,053,101 | GBP | 878,223 | JPMorgan Chase Bank N.A. | 5/22/2020 | (53,091 | ) | |||||||||||
| USD | 1,283,262 | GBP | 1,030,858 | Morgan Stanley Capital Services, Inc. | 5/22/2020 | (15,185 | ) | |||||||||||
|
|
|
|||||||||||||||||
| $(467,091 | ) | |||||||||||||||||
|
|
|
|||||||||||||||||
Futures Contracts
| Description | Long/ Short |
Currency | Contracts | Notional Amount |
Expiration Date |
Value/ Unrealized Appreciation (Depreciation) |
||||||||||||
| Asset Derivatives | ||||||||||||||||||
| Interest Rate Futures | ||||||||||||||||||
| Euro-Bobl 5 yr | Short | EUR | 210 | $31,285,958 | June - 2020 | $77,779 | ||||||||||||
| Euro-Buxl 30 yr | Long | EUR | 9 | 2,161,892 | June - 2020 | 6,292 | ||||||||||||
| U.S. Treasury Bond | Long | USD | 8 | 1,448,250 | June - 2020 | 25,720 | ||||||||||||
| U.S. Treasury Note 5 yr | Long | USD | 48 | 6,023,250 | June - 2020 | 193,770 | ||||||||||||
| U.S. Treasury Ultra Bond | Long | USD | 12 | 2,697,375 | June - 2020 | 170,114 | ||||||||||||
|
|
|
|||||||||||||||||
| $473,675 | ||||||||||||||||||
|
|
|
|||||||||||||||||
33
Table of Contents
Portfolio of Investments (unaudited) – continued
Futures Contracts - continued
| Description | Long/ Short |
Currency | Contracts | Notional Amount |
Expiration Date |
Value/ Unrealized Appreciation (Depreciation) |
||||||||||||
| Liability Derivatives | ||||||||||||||||||
| Interest Rate Futures | ||||||||||||||||||
| Euro-Bund 10 yr | Short | EUR | 73 | $13,953,880 | June - 2020 | $(39,787 | ) | |||||||||||
| Long Gilt 10 yr | Short | GBP | 9 | 1,560,898 | June - 2020 | (6,490 | ) | |||||||||||
| U.S. Treasury Note 10 yr | Short | USD | 458 | 63,690,625 | June - 2020 | (2,684,502 | ) | |||||||||||
|
|
|
|||||||||||||||||
| $(2,730,779 | ) | |||||||||||||||||
|
|
|
|||||||||||||||||
At April 30, 2020, the fund had liquid securities with an aggregate value of $1,394,932 to cover any collateral or margin obligations for certain derivative contracts.
See Notes to Financial Statements
34
Table of Contents
Financial Statements
STATEMENT OF ASSETS AND LIABILITIES
At 4/30/20 (unaudited)
This statement represents your fund’s balance sheet, which details the assets and liabilities comprising the total value of the fund.
| Assets | ||||
| Investments in unaffiliated issuers, at value (identified cost, $465,170,776) |
$447,377,499 | |||
| Investments in affiliated issuers, at value (identified cost, $14,783,819) |
14,783,021 | |||
| Cash |
59,034 | |||
| Foreign currency, at value (identified cost, $13,009) |
13,150 | |||
| Receivables for |
||||
| Forward foreign currency exchange contracts |
902,439 | |||
| Investments sold |
2,904,703 | |||
| Investments sold on an extended settlement basis |
2,642,250 | |||
| Interest |
5,556,621 | |||
| Other assets |
42,403 | |||
| Total assets |
$474,281,120 | |||
| Liabilities | ||||
| Notes payable |
$100,000,000 | |||
| Payables for |
||||
| Distributions |
190,018 | |||
| Forward foreign currency exchange contracts |
467,091 | |||
| Net daily variation margin on open futures contracts |
254,032 | |||
| Investments purchased |
5,099,761 | |||
| Investments purchased on an extended settlement basis |
6,679,100 | |||
| Payable to affiliates |
||||
| Investment adviser |
15,301 | |||
| Administrative services fee |
339 | |||
| Transfer agent and dividend disbursing costs |
10,700 | |||
| Payable for independent Trustees’ compensation |
12,823 | |||
| Accrued interest expense |
55,651 | |||
| Accrued expenses and other liabilities |
128,312 | |||
| Total liabilities |
$112,913,128 | |||
| Net assets |
$361,367,992 | |||
| Net assets consist of | ||||
| Paid-in capital |
$408,369,255 | |||
| Total distributable earnings (loss) |
(47,001,263 | ) | ||
| Net assets |
$361,367,992 | |||
| Shares of beneficial interest outstanding (62,929,570 shares authorized less 369,227 capital shares to be retired) |
62,560,343 | |||
| Net asset value per share (net assets of $361,367,992 / 62,560,343 shares of beneficial interest outstanding) |
$5.78 | |||
See Notes to Financial Statements
35
Table of Contents
Financial Statements
Six months ended 4/30/20 (unaudited)
This statement describes how much your fund earned in investment income and accrued in expenses. It also describes any gains and/or losses generated by fund operations.
| Net investment income (loss) | ||||
| Income |
||||
| Interest |
$11,345,727 | |||
| Dividends from affiliated issuers |
91,509 | |||
| Dividends |
64,972 | |||
| Other |
25,710 | |||
| Foreign taxes withheld |
(920 | ) | ||
| Total investment income |
$11,526,998 | |||
| Expenses |
||||
| Management fee |
$1,316,385 | |||
| Transfer agent and dividend disbursing costs |
50,973 | |||
| Administrative services fee |
31,070 | |||
| Independent Trustees’ compensation |
31,894 | |||
| Stock exchange fee |
31,897 | |||
| Custodian fee |
23,883 | |||
| Shareholder communications |
80,647 | |||
| Audit and tax fees |
41,792 | |||
| Legal fees |
6,809 | |||
| Interest expense and fees |
891,519 | |||
| Miscellaneous |
30,675 | |||
| Total expenses |
$2,537,544 | |||
| Net investment income (loss) |
$8,989,454 | |||
| Realized and unrealized gain (loss) | ||||
| Realized gain (loss) (identified cost basis) |
||||
| Unaffiliated issuers |
$1,838,360 | |||
| Affiliated issuers |
3,156 | |||
| Written options |
21,830 | |||
| Futures contracts |
(179,194 | ) | ||
| Swap agreements |
1,587,764 | |||
| Forward foreign currency exchange contracts |
530,917 | |||
| Foreign currency |
4,528 | |||
| Net realized gain (loss) |
$3,807,361 | |||
| Change in unrealized appreciation or depreciation |
||||
| Unaffiliated issuers (net of $96,217 decrease in deferred country tax) |
$(34,320,335 | ) | ||
| Affiliated issuers |
(2,446 | ) | ||
| Written options |
(2,481 | ) | ||
| Futures contracts |
(3,303,876 | ) | ||
| Swap agreements |
(1,817 | ) | ||
| Forward foreign currency exchange contracts |
1,431,505 | |||
| Translation of assets and liabilities in foreign currencies |
(8,529 | ) | ||
| Net unrealized gain (loss) |
$(36,207,979 | ) | ||
| Net realized and unrealized gain (loss) |
$(32,400,618 | ) | ||
| Change in net assets from operations |
$(23,411,164 | ) | ||
See Notes to Financial Statements
36
Table of Contents
Financial Statements
STATEMENTS OF CHANGES IN NET ASSETS
These statements describe the increases and/or decreases in net assets resulting from operations, any distributions, and any shareholder transactions.
| Change in net assets | Six months ended 4/30/20 (unaudited) |
Year ended 10/31/19 |
||||||
| From operations | ||||||||
| Net investment income (loss) |
$8,989,454 | $18,396,387 | ||||||
| Net realized gain (loss) |
3,807,361 | (2,296,189 | ) | |||||
| Net unrealized gain (loss) |
(36,207,979 | ) | 34,699,386 | |||||
| Change in net assets from operations |
$(23,411,164 | ) | $50,799,584 | |||||
| Distributions to shareholders |
$(11,121,215 | ) | $(18,671,582 | ) | ||||
| Tax return of capital distributions to shareholders |
$— | $(13,664,509 | ) | |||||
| Distributions from other sources |
$(4,906,993 | ) | $— | |||||
| Change in net assets from fund share transactions |
$(7,051,961 | ) | $(18,139,266 | ) | ||||
| Total change in net assets |
$(46,491,333 | ) | $324,227 | |||||
| Net assets | ||||||||
| At beginning of period |
407,859,325 | 407,535,098 | ||||||
| At end of period |
$361,367,992 | $407,859,325 | ||||||
See Notes to Financial Statements
37
Table of Contents
Financial Statements
Six months ended 4/30/20 (unaudited)
This statement provides a summary of cash flows from investment activity for the fund.
| Cash flows from operating activities: | ||||
| Change in net assets from operations |
$(23,411,164 | ) | ||
| Adjustments to reconcile change in net assets from operations to net cash provided by operating activities: | ||||
| Purchase of investment securities |
(288,236,850 | ) | ||
| Proceeds from disposition of investment securities |
302,503,521 | |||
| Proceeds from disposition of short-term investments, net |
473,469 | |||
| Realized gain/loss on investments |
(1,838,360 | ) | ||
| Unrealized appreciation/depreciation on investments |
34,418,998 | |||
| Unrealized appreciation/depreciation on foreign currency contracts |
(1,431,505 | ) | ||
| Unrealized appreciation/depreciation on swaps |
1,817 | |||
| Net amortization/accretion of income |
218,390 | |||
| Decrease in interest receivable |
257,691 | |||
| Decrease in accrued expenses and other liabilities |
(198,245 | ) | ||
| Decrease in payable for net daily variation margin on open futures contracts |
(133,934 | ) | ||
| Increase in other assets |
(31,624 | ) | ||
| Decrease in interest payable |
(151,360 | ) | ||
| Net cash provided by operating activities |
$22,440,844 | |||
| Cash flows from financing activities: | ||||
| Distributions paid in cash |
(16,040,319 | ) | ||
| Repurchase of shares of beneficial interest |
(7,051,961 | ) | ||
| Net cash used by financing activities |
$(23,092,280 | ) | ||
| Net decrease in cash and restricted cash |
$(651,436 | ) | ||
| Cash and restricted cash: | ||||
| Beginning of period (including foreign currency of $11,990) |
$723,620 | |||
| End of period (including foreign currency of $13,150) |
$72,184 | |||
Supplemental disclosure of cash flow information:
Cash paid during the six months ended April 30, 2020 for interest was $1,042,879.
See Notes to Financial Statements
38
Table of Contents
Financial Statements
The financial highlights table is intended to help you understand the fund’s financial performance for the semiannual period and the past 5 fiscal years. Certain information reflects financial results for a single fund share. The total returns in the table represent the rate that an investor would have earned (or lost) on an investment in the fund share class (assuming reinvestment of all distributions) held for the entire period.
| Six months 4/30/20 |
Year ended | |||||||||||||||||||||||
| 10/31/19 | 10/31/18 | 10/31/17 | 10/31/16 | 10/31/15 | ||||||||||||||||||||
| (unaudited) | ||||||||||||||||||||||||
| Net asset value, beginning of period |
$6.37 | $6.06 | $6.67 | $6.73 | $6.76 | $7.39 | ||||||||||||||||||
| Income (loss) from investment operations |
|
|||||||||||||||||||||||
| Net investment income (loss) (d) |
$0.14 | $0.28 | $0.25 | $0.30 | (c) | $0.34 | $0.36 | |||||||||||||||||
| Net realized and unrealized gain (loss) |
(0.50 | ) | 0.50 | (0.38 | ) | 0.15 | 0.15 | (0.43 | ) | |||||||||||||||
| Total from investment operations |
$(0.36 | ) | $0.78 | $(0.13 | ) | $0.45 | $0.49 | $(0.07 | ) | |||||||||||||||
| Less distributions declared to shareholders |
|
|||||||||||||||||||||||
| From net investment income |
$(0.17 | ) | $(0.29 | ) | $(0.29 | ) | $(0.31 | ) | $(0.37 | ) | $(0.46 | ) | ||||||||||||
| From net realized gain |
— | — | — | — | — | (0.08 | ) | |||||||||||||||||
| From tax return of capital |
— | (0.21 | ) | (0.22 | ) | (0.23 | ) | (0.16 | ) | (0.03 | ) | |||||||||||||
| From other sources |
(0.08 | ) | — | — | — | — | — | |||||||||||||||||
| Total distributions declared to shareholders |
$(0.25 | ) | $(0.50 | ) | $(0.51 | ) | $(0.54 | ) | $(0.53 | ) | $(0.57 | ) | ||||||||||||
| Net increase from repurchase of capital shares |
$0.02 | $0.03 | $0.03 | $0.03 | $0.01 | $0.01 | ||||||||||||||||||
| Net asset value, end of period (x) |
$5.78 | $6.37 | $6.06 | $6.67 | $6.73 | $6.76 | ||||||||||||||||||
| Market value, end of period |
$5.47 | $6.01 | $5.24 | $6.16 | $5.97 | $5.94 | ||||||||||||||||||
| Total return at market value (%) |
(4.92 | )(n) | 25.05 | (7.01 | ) | 12.50 | 9.93 | 2.18 | ||||||||||||||||
| Total return at net asset |
(5.20 | )(n) | 14.60 | (0.68 | ) | 8.06 | (c) | 8.89 | 0.24 | |||||||||||||||
| Ratios (%) (to average net assets) and Supplemental data: |
| |||||||||||||||||||||||
| Expenses (f) |
1.30 | (a) | 1.56 | 1.33 | 1.10 | (c) | 1.10 | 0.98 | ||||||||||||||||
| Net investment income (loss) |
4.60 | (a) | 4.54 | 4.00 | 4.45 | (c) | 5.13 | 5.05 | ||||||||||||||||
| Portfolio turnover |
42 | (n) | 65 | 47 | 50 | 36 | 47 | |||||||||||||||||
| Net assets at end of period |
$361,368 | $407,859 | $407,535 | $471,461 | $504,331 | $515,095 | ||||||||||||||||||
| Supplemental Ratios (%): |
| |||||||||||||||||||||||
| Ratios of expenses to average net assets after expense reductions and excluding interest expense and fees (f) |
0.84 | (a) | 0.84 | 0.80 | 0.78 | (c) | 0.87 | 0.82 | ||||||||||||||||
39
Table of Contents
Financial Highlights – continued
| Six months 4/30/20 |
Year ended | |||||||||||||||||||||||
| 10/31/19 | 10/31/18 | 10/31/17 | 10/31/16 | 10/31/15 | ||||||||||||||||||||
| (unaudited) | ||||||||||||||||||||||||
| Senior Securities: |
|
|||||||||||||||||||||||
| Total notes payable outstanding |
$100,000 | $100,000 | $100,000 | $100,000 | $100,000 | $100,000 | ||||||||||||||||||
| Asset coverage per $1,000 of |
$4,614 | $5,079 | $5,075 | $5,715 | $6,043 | $6,151 | ||||||||||||||||||
| (a) | Annualized. |
| (c) | Amount reflects a one-time reimbursement of expenses by the custodian (or former custodian) without which net investment income and performance would be lower and expenses would be higher. |
| (d) | Per share data is based on average shares outstanding. |
| (f) | Ratios do not reflect reductions from fees paid indirectly, if applicable. |
| (j) | Total return at net asset value is calculated using the net asset value of the fund, not the publicly traded price and therefore may be different than the total return at market value. |
| (k) | Calculated by subtracting the fund’s total liabilities (not including notes payable) from the fund’s total assets and dividing this number by the notes payable outstanding and then multiplying by 1,000. |
| (n) | Not annualized. |
| (s) | From time to time the fund may receive proceeds from litigation settlements, without which performance would be lower. |
| (x) | The net asset values and total returns at net asset value have been calculated on net assets which include adjustments made in accordance with U.S. generally accepted accounting principles required at period end for financial reporting purposes. |
See Notes to Financial Statements
40
Table of Contents
(unaudited)
(1) Business and Organization
MFS Multimarket Income Trust (the fund) is organized as a Massachusetts business trust and is registered under the Investment Company Act of 1940, as amended, as a diversified closed-end management investment company.
The fund is an investment company and accordingly follows the investment company accounting and reporting guidance of the Financial Accounting Standards Board (FASB) Accounting Standards Codification Topic 946 Financial Services – Investment Companies.
(2) Significant Accounting Policies
General – The preparation of financial statements in conformity with U.S. generally accepted accounting principles requires management to make estimates and assumptions that affect the reported amounts of assets and liabilities, and disclosure of contingent assets and liabilities at the date of the financial statements and the reported amounts of increases and decreases in net assets from operations during the reporting period. Actual results could differ from those estimates. In the preparation of these financial statements, management has evaluated subsequent events occurring after the date of the fund’s Statement of Assets and Liabilities through the date that the financial statements were issued. The fund invests in high-yield securities rated below investment grade. Investments in below investment grade quality securities can involve a substantially greater risk of default or can already be in default, and their values can decline significantly. Below investment grade quality securities tend to be more sensitive to adverse news about the issuer, or the market or economy in general, than higher quality debt instruments. The fund invests in foreign securities, including securities of emerging market issuers. Investments in foreign securities are vulnerable to the effects of changes in the relative values of the local currency and the U.S. dollar and to the effects of changes in each country’s market, economic, industrial, political, regulatory, geopolitical, and other conditions. Investments in emerging markets can involve additional and greater risks than the risks associated with investments in developed foreign markets. Emerging markets can have less developed markets, greater custody and operational risk, less developed legal, regulatory, and accounting systems, and greater political, social, and economic instability than developed markets.
In March 2020, the FASB issued Accounting Standards Update 2020-04, Reference Rate Reform (Topic 848) – Facilitation of the Effects of Reference Rate Reform on Financial Reporting (“ASU 2020-04”), which provides optional, temporary relief with respect to the financial reporting of contracts subject to certain types of modifications due to the planned discontinuation of the London Interbank Offered Rate (LIBOR) and other IBOR-based reference rates as of the end of 2021. The temporary relief provided by ASU 2020-04 is effective for certain reference rate-related contract modifications that occur during the period from March 12, 2020 through December 31, 2022. Management is evaluating the impact of ASU 2020-04 on the fund’s investments, derivatives, debt and other contracts that will undergo reference rate-related modifications as a result of the reference rate reform.
In March 2017, the FASB issued Accounting Standards Update 2017-08, Receivables –Nonrefundable Fees and Other Costs (Subtopic 310-20) – Premium Amortization on
41
Table of Contents
Notes to Financial Statements (unaudited) – continued
Purchased Callable Debt Securities (“ASU 2017-08”). For callable debt securities purchased at a premium that have explicit, non-contingent call features and that are callable at fixed prices on preset dates, ASU 2017-08 requires the premium to be amortized to the earliest call date. The fund adopted ASU 2017-08 as of the beginning of the reporting period on a modified retrospective basis. The adoption resulted in a change in accounting principle, since the fund had historically amortized such premiums to maturity for U.S. GAAP. As a result of the adoption, the fund recognized a cumulative effect adjustment that decreased the beginning of period cost of investments and increased the unrealized appreciation on investments by offsetting amounts. Adoption had no impact on the fund’s net assets or any prior period information presented in the financial statements. With respect to the fund’s results of operations, amortization of premium to first call date under ASU 2017-08 accelerates amortization with the intent of more closely aligning the recognition of income on such bonds with the economics of the instrument.
Balance Sheet Offsetting – The fund’s accounting policy with respect to balance sheet offsetting is that, absent an event of default by the counterparty or a termination of the agreement, the International Swaps and Derivatives Association (ISDA) Master Agreement, or similar agreement, does not result in an offset of reported amounts of financial assets and financial liabilities in the Statement of Assets and Liabilities across transactions between the fund and the applicable counterparty. The fund’s right to setoff may be restricted or prohibited by the bankruptcy or insolvency laws of the particular jurisdiction to which a specific master netting agreement counterparty is subject. Balance sheet offsetting disclosures, to the extent applicable to the fund, have been included in the fund’s Significant Accounting Policies note under the captions for each of the fund’s in-scope financial instruments and transactions.
Investment Valuations – Equity securities, including restricted equity securities, are generally valued at the last sale or official closing price on their primary market or exchange as provided by a third-party pricing service. Equity securities, for which there were no sales reported that day, are generally valued at the last quoted daily bid quotation on their primary market or exchange as provided by a third-party pricing service. Debt instruments and floating rate loans, including restricted debt instruments, are generally valued at an evaluated or composite bid as provided by a third-party pricing service. Short-term instruments with a maturity at issuance of 60 days or less may be valued at amortized cost, which approximates market value. Exchange-traded options are generally valued at the last sale or official closing price on their primary exchange as provided by a third-party pricing service. Exchange-traded options for which there were no sales reported that day are generally valued at the last daily bid quotation on their primary exchange as provided by a third-party pricing service. For put options, the position may be valued at the last daily ask quotation if there are no trades reported during the day. Options not traded on an exchange are generally valued at a broker/dealer bid quotation. Foreign currency options are generally valued at valuations provided by a third-party pricing service. Futures contracts are generally valued at last posted settlement price on their primary exchange as provided by a third-party pricing service. Futures contracts for which there were no trades that day for a particular position are generally valued at the closing bid quotation on their primary exchange as provided by a third-party pricing service. Forward foreign currency
42
Table of Contents
Notes to Financial Statements (unaudited) – continued
exchange contracts are generally valued at the mean of bid and asked prices for the time period interpolated from rates provided by a third-party pricing service for proximate time periods. Swap agreements are generally valued at valuations provided by a third-party pricing service, which for cleared swaps includes an evaluation of any trading activity at the clearinghouses. Open-end investment companies are generally valued at net asset value per share. Securities and other assets generally valued on the basis of information from a third-party pricing service may also be valued at a broker/dealer bid quotation. In determining values, third-party pricing services can utilize both transaction data and market information such as yield, quality, coupon rate, maturity, type of issue, trading characteristics, and other market data. The values of foreign securities and other assets and liabilities expressed in foreign currencies are converted to U.S. dollars using the mean of bid and asked prices for rates provided by a third-party pricing service.
The Board of Trustees has delegated primary responsibility for determining or causing to be determined the value of the fund’s investments (including any fair valuation) to the adviser pursuant to valuation policies and procedures approved by the Board. If the adviser determines that reliable market quotations are not readily available, investments are valued at fair value as determined in good faith by the adviser in accordance with such procedures under the oversight of the Board of Trustees. Under the fund’s valuation policies and procedures, market quotations are not considered to be readily available for most types of debt instruments and floating rate loans and many types of derivatives. These investments are generally valued at fair value based on information from third-party pricing services. In addition, investments may be valued at fair value if the adviser determines that an investment’s value has been materially affected by events occurring after the close of the exchange or market on which the investment is principally traded (such as foreign exchange or market) and prior to the determination of the fund’s net asset value, or after the halt of trading of a specific security where trading does not resume prior to the close of the exchange or market on which the security is principally traded. The adviser generally relies on third-party pricing services or other information (such as the correlation with price movements of similar securities in the same or other markets; the type, cost and investment characteristics of the security; the business and financial condition of the issuer; and trading and other market data) to assist in determining whether to fair value and at what value to fair value an investment. The value of an investment for purposes of calculating the fund’s net asset value can differ depending on the source and method used to determine value. When fair valuation is used, the value of an investment used to determine the fund’s net asset value may differ from quoted or published prices for the same investment. There can be no assurance that the fund could obtain the fair value assigned to an investment if it were to sell the investment at the same time at which the fund determines its net asset value per share.
Various inputs are used in determining the value of the fund’s assets or liabilities. These inputs are categorized into three broad levels. In certain cases, the inputs used to measure fair value may fall into different levels of the fair value hierarchy. In such cases, an investment’s level within the fair value hierarchy is based on the lowest level of input that is significant to the fair value measurement. The fund’s assessment of the significance of a particular input to the fair value measurement in its entirety requires
43
Table of Contents
Notes to Financial Statements (unaudited) – continued
judgment, and considers factors specific to the investment. Level 1 includes unadjusted quoted prices in active markets for identical assets or liabilities. Level 2 includes other significant observable market-based inputs (including quoted prices for similar securities, interest rates, prepayment speed, and credit risk). Level 3 includes unobservable inputs, which may include the adviser’s own assumptions in determining the fair value of investments. Other financial instruments are derivative instruments, such as futures contracts and forward foreign currency exchange contracts. The following is a summary of the levels used as of April 30, 2020 in valuing the fund’s assets or liabilities:
| Financial Instruments | Level 1 | Level 2 | Level 3 | Total | ||||||||||||
| Equity Securities: | ||||||||||||||||
| United States |
$4,664,940 | $45 | $275,288 | $4,940,273 | ||||||||||||
| Mexico |
— | 188,146 | — | 188,146 | ||||||||||||
| Canada |
65,563 | — | — | 65,563 | ||||||||||||
| U.S. Treasury Bonds & U.S. Government Agencies & Equivalents | — | 5,410,182 | — | 5,410,182 | ||||||||||||
| Non-U.S. Sovereign Debt | — | 61,404,966 | — | 61,404,966 | ||||||||||||
| Municipal Bonds | — | 1,827,834 | — | 1,827,834 | ||||||||||||
| U.S. Corporate Bonds | — | 239,937,481 | — | 239,937,481 | ||||||||||||
| Residential Mortgage-Backed Securities | — | 5,004,123 | — | 5,004,123 | ||||||||||||
| Commercial Mortgage-Backed Securities | — | 3,498,436 | — | 3,498,436 | ||||||||||||
| Asset-Backed Securities (including CDOs) | — | 10,040,878 | — | 10,040,878 | ||||||||||||
| Foreign Bonds | — | 112,770,473 | — | 112,770,473 | ||||||||||||
| Floating Rate Loans | — | 2,289,144 | — | 2,289,144 | ||||||||||||
| Mutual Funds | 14,783,021 | — | — | 14,783,021 | ||||||||||||
| Total | $19,513,524 | $442,371,708 | $275,288 | $462,160,520 | ||||||||||||
| Other Financial Instruments | ||||||||||||||||
| Futures Contracts – Assets | $473,675 | $— | $— | $473,675 | ||||||||||||
| Futures Contracts – Liabilities | (2,730,779 | ) | — | — | (2,730,779 | ) | ||||||||||
| Forward Foreign Currency Exchange Contracts – Assets | — | 902,439 | — | 902,439 | ||||||||||||
| Forward Foreign Currency Exchange Contracts – Liabilities | — | (467,091 | ) | — | (467,091 | ) | ||||||||||
For further information regarding security characteristics, see the Portfolio of Investments.
The following is a reconciliation of level 3 assets for which significant unobservable inputs were used to determine fair value. The table presents the activity of level 3 securities held at the beginning and the end of the period.
| Equity Securities | ||||
| Balance as of 10/31/19 | $263,011 | |||
| Change in unrealized appreciation or depreciation |
12,277 | |||
| Balance as of 4/30/20 | $275,288 | |||
The net change in unrealized appreciation or depreciation from investments held as level 3 at April 30, 2020 is $12,277. At April 30, 2020, the fund held one level 3 security.
44
Table of Contents
Notes to Financial Statements (unaudited) – continued
Foreign Currency Translation – Purchases and sales of foreign investments, income, and expenses are converted into U.S. dollars based upon currency exchange rates prevailing on the respective dates of such transactions or on the reporting date for foreign denominated receivables and payables. Gains and losses attributable to foreign currency exchange rates on sales of securities are recorded for financial statement purposes as net realized gains and losses on investments. Gains and losses attributable to foreign exchange rate movements on receivables, payables, income and expenses are recorded for financial statement purposes as foreign currency transaction gains and losses. That portion of both realized and unrealized gains and losses on investments that results from fluctuations in foreign currency exchange rates is not separately disclosed.
Derivatives – The fund uses derivatives primarily to increase or decrease exposure to a particular market or segment of the market, or security, to increase or decrease interest rate or currency exposure, or as alternatives to direct investments. Derivatives are used for hedging or non-hedging purposes. While hedging can reduce or eliminate losses, it can also reduce or eliminate gains. When the fund uses derivatives as an investment to increase market exposure, or for hedging purposes, gains and losses from derivative instruments may be substantially greater than the derivative’s original cost.
The derivative instruments used by the fund during the period were written options, purchased options, futures contracts, forward foreign currency exchange contracts, and swap agreements. Depending on the type of derivative, the fund may exit a derivative position by entering into an offsetting transaction with a counterparty or exchange, negotiating an agreement with the derivative counterparty, or novating the position to a third party. The fund may be unable to promptly close out a futures position in instances where the daily fluctuation in the price for that type of future exceeds the daily limit set by the exchange. The fund’s period end derivatives, as presented in the Portfolio of Investments and the associated Derivative Contract tables, generally are indicative of the volume of its derivative activity during the period.
The following table presents, by major type of derivative contract, the fair value, on a gross basis, of the asset and liability components of derivatives held by the fund at April 30, 2020 as reported in the Statement of Assets and Liabilities:
| Fair Value (a) | ||||||||||
| Risk | Derivative Contracts | Asset Derivatives | Liability Derivatives | |||||||
| Interest Rate | Interest Rate Futures | $473,675 | $(2,730,779) | |||||||
| Foreign Exchange | Forward Foreign Currency Exchange Contracts | 902,439 | (467,091) | |||||||
| Credit | Purchased Credit Options | 18,645 | — | |||||||
| Total | $1,394,759 | $(3,197,870) | ||||||||
| (a) | The value of purchased options outstanding is included in investments in unaffiliated issuers, at value, within the fund’s Statement of Assets and Liabilities. Values presented in this table for futures contracts correspond to the values reported in the fund’s Portfolio of Investments. Only the current day net variation margin for futures contracts is separately reported within the fund’s Statement of Assets and Liabilities. |
45
Table of Contents
Notes to Financial Statements (unaudited) – continued
The following table presents, by major type of derivative contract, the realized gain (loss) on derivatives held by the fund for the six months ended April 30, 2020 as reported in the Statement of Operations:
| Risk | Futures Contracts |
Swap Agreements |
Forward Foreign Currency Exchange Contracts |
Unaffiliated Issuers (Purchased Options) |
Written Options |
|||||||||||||||
| Interest Rate | $(179,194) | $— | $— | $— | $— | |||||||||||||||
| Foreign Exchange | — | — | 530,917 | — | — | |||||||||||||||
| Credit | — | 1,587,764 | — | 35,152 | 21,830 | |||||||||||||||
| Total | $(179,194) | $1,587,764 | $530,917 | $35,152 | $21,830 | |||||||||||||||
The following table presents, by major type of derivative contract, the change in unrealized appreciation or depreciation on derivatives held by the fund for the six months ended April 30, 2020 as reported in the Statement of Operations:
| Risk | Futures Contracts |
Swap Agreements |
Forward Foreign Currency Exchange Contracts |
Unaffiliated Issuers (Purchased Options) |
Written Options |
|||||||||||||||
| Interest Rate | $(3,303,876) | $— | $— | $— | $— | |||||||||||||||
| Foreign Exchange | — | — | 1,431,505 | — | — | |||||||||||||||
| Credit | — | (1,817 | ) | — | (189,447 | ) | (2,481 | ) | ||||||||||||
| Total | $(3,303,876) | $(1,817 | ) | $1,431,505 | $(189,447 | ) | $(2,481 | ) | ||||||||||||
Derivative counterparty credit risk is managed through formal evaluation of the creditworthiness of all potential counterparties. On certain, but not all, uncleared derivatives, the fund attempts to reduce its exposure to counterparty credit risk whenever possible by entering into an ISDA Master Agreement on a bilateral basis. The ISDA Master Agreement gives each party to the agreement the right to terminate all transactions traded under such agreement if there is a specified deterioration in the credit quality of the other party. Upon an event of default or a termination of the ISDA Master Agreement, the non-defaulting party has the right to close out all transactions traded under such agreement and to net amounts owed under each agreement to one net amount payable by one party to the other. This right to close out and net payments across all transactions traded under the ISDA Master Agreement could result in a reduction of the fund’s credit risk to such counterparty equal to any amounts payable by the fund under the applicable transactions, if any.
Collateral and margin requirements differ by type of derivative. For cleared derivatives (e.g., futures contracts, cleared swaps, and exchange-traded options), margin requirements are set by the clearing broker and the clearing house and collateral, in the form of cash or securities, is posted by the fund directly with the clearing broker. Collateral terms are counterparty agreement specific for uncleared derivatives (e.g., forward foreign currency exchange contracts, uncleared swap agreements, and uncleared options) and collateral, in the form of cash and securities, is held in segregated accounts with the fund’s custodian in connection with these agreements. For derivatives traded under an ISDA Master Agreement, which contains a collateral
46
Table of Contents
Notes to Financial Statements (unaudited) – continued
support annex, the collateral requirements are netted across all transactions traded under such counterparty-specific agreement and an amount is posted from one party to the other to collateralize such obligations. Cash that has been segregated or delivered to cover the fund’s collateral or margin obligations under derivative contracts, if any, will be reported separately in the Statement of Assets and Liabilities as restricted cash for uncleared derivatives and/or deposits with brokers for cleared derivatives. Securities pledged as collateral or margin for the same purpose, if any, are noted in the Portfolio of Investments. The fund may be required to make payments of interest on uncovered collateral or margin obligations with the broker. Any such payments are included in “Interest expense and fees” in the Statement of Operations.
Written Options – In exchange for a premium, the fund wrote call options on securities for which it anticipated the price would decline and also wrote put options on securities for which it anticipated the price would increase. At the time the option was written, the fund believed the premium received exceeded the potential loss that could result from adverse price changes in the options’ underlying securities. In a written option, the fund as the option writer grants the buyer the right to purchase from, or sell to, the fund a specified number of shares or units of a particular security, currency or index at a specified price within a specified period of time.
The premium received is initially recorded as a liability in the Statement of Assets and Liabilities. The option is subsequently marked-to-market daily with the difference between the premium received and the market value of the written option being recorded as unrealized appreciation or depreciation. When a written option expires, the fund realizes a gain equal to the amount of the premium received. The difference between the premium received and the amount paid on effecting a closing transaction is considered a realized gain or loss. When a written call option is exercised, the premium received is offset against the proceeds to determine the realized gain or loss. When a written put option is exercised, the premium reduces the cost basis of the security purchased by the fund.
At the initiation of the written option contract, for exchange traded options, the fund is required to deposit securities or cash as collateral with the custodian for the benefit of the broker or directly with the clearing broker, based on the type of option. For uncleared options, the fund may post collateral subject to the terms of an ISDA Master Agreement as generally described above if the market value of the options contract moves against it. The fund, as writer of an option, may have no control over whether the underlying securities may be sold (call) or purchased (put) and, as a result, bears the market risk of an unfavorable change in the price of the securities underlying the written option. Losses from writing options can exceed the premium received and can exceed the potential loss from an ordinary buy and sell transaction. Although the fund’s market risk may be significant, the maximum counterparty credit risk to the fund is equal to the market value of any collateral posted to the broker. For uncleared options, this risk is mitigated in cases where there is an ISDA Master Agreement between the fund and the counterparty providing for netting as described above.
Purchased Options – The fund purchased call and put options for a premium. Purchased call and put options entitle the holder to buy and sell a specified number of shares or units of a particular security, currency or index at a specified price at a specified date or within a specified period of time. Purchasing call options may hedge
47
Table of Contents
Notes to Financial Statements (unaudited) – continued
against an anticipated increase in the dollar cost of securities or currency to be acquired or increase the fund’s exposure to an underlying instrument. Purchasing put options may hedge against an anticipated decline in the value of portfolio securities or currency or decrease the fund’s exposure to an underlying instrument.
The premium paid is initially recorded as an investment in the Statement of Assets and Liabilities. That investment is subsequently marked-to-market daily with the difference between the premium paid and the market value of the purchased option being recorded as unrealized appreciation or depreciation. Premiums paid for purchased call and put options which have expired are treated as realized losses on investments in the Statement of Operations. Upon the exercise or closing of a purchased call option, the premium paid is added to the cost of the security or financial instrument purchased. Upon the exercise or closing of a purchased put option, the premium paid is offset against the proceeds on the sale of the underlying security or financial instrument in order to determine the realized gain or loss on investments.
Whether or not the option is exercised, the fund’s maximum risk of loss from purchasing an option is the amount of premium paid. All option contracts involve credit risk if the counterparty to the option contract fails to perform. For uncleared options, this risk is mitigated in cases where there is an ISDA Master Agreement between the fund and the counterparty providing for netting as described above and, where applicable, by the posting of collateral by the counterparty to the fund to cover the fund’s exposure to the counterparty under such ISDA Master Agreement.
Futures Contracts – The fund entered into futures contracts which may be used to hedge against or obtain broad market exposure, interest rate exposure, currency exposure, or to manage duration. A futures contract represents a commitment for the future purchase or sale of an asset at a specified price on a specified date.
Upon entering into a futures contract, the fund is required to deposit with the broker, either in cash or securities, an initial margin in an amount equal to a specified percentage of the notional amount of the contract. Subsequent payments (variation margin) are made or received by the fund each day, depending on the daily fluctuations in the value of the contract, and are recorded for financial statement purposes as unrealized gain or loss by the fund until the contract is closed or expires at which point the gain or loss on futures contracts is realized.
The fund bears the risk of interest rates, exchange rates or securities prices moving unexpectedly, in which case, the fund may not achieve the anticipated benefits of the futures contracts and may realize a loss. While futures contracts may present less counterparty risk to the fund since the contracts are exchange traded and the exchange’s clearinghouse guarantees payments to the broker, there is still counterparty credit risk due to the insolvency of the broker. The fund’s maximum risk of loss due to counterparty credit risk is equal to the margin posted by the fund to the broker plus any gains or minus any losses on the outstanding futures contracts.
Forward Foreign Currency Exchange Contracts – The fund entered into forward foreign currency exchange contracts for the purchase or sale of a specific foreign currency at a fixed price on a future date. These contracts may be used to hedge the fund’s currency risk or for non-hedging purposes. For hedging purposes, the fund may enter into contracts to deliver or receive foreign currency that the fund will receive
48
Table of Contents
Notes to Financial Statements (unaudited) – continued
from or use in its normal investment activities. The fund may also use contracts to hedge against declines in the value of foreign currency denominated securities due to unfavorable exchange rate movements. For non-hedging purposes, the fund may enter into contracts with the intent of changing the relative exposure of the fund’s portfolio of securities to different currencies to take advantage of anticipated exchange rate changes.
Forward foreign currency exchange contracts are adjusted by the daily exchange rate of the underlying currency and any unrealized gains or losses are recorded as a receivable or payable for forward foreign currency exchange contracts until the contract settlement date. On contract settlement date, any gain or loss on the contract is recorded as realized gains or losses on forward foreign currency exchange contracts.
Risks may arise upon entering into these contracts from unanticipated movements in the value of the contract and from the potential inability of counterparties to meet the terms of their contracts. Generally, the fund’s maximum risk due to counterparty credit risk is the unrealized gain on the contract due to the use of Continuous Linked Settlement, a multicurrency cash settlement system for the centralized settlement of foreign transactions. This risk is mitigated in cases where there is an ISDA Master Agreement between the fund and the counterparty providing for netting as described above and, where applicable, by the posting of collateral by the counterparty to the fund to cover the fund’s exposure to the counterparty under such ISDA Master Agreement.
Swap Agreements – During the period the fund entered into swap agreements. Swap agreements generally involve a periodic exchange of cash payments on a net basis, at specified intervals or upon the occurrence of specified events, between the fund and a counterparty. Certain swap agreements may be entered into as a bilateral contract (“uncleared swaps”) while others are required to be centrally cleared (“cleared swaps”). In a cleared swap transaction, the ultimate counterparty to the transaction is a clearinghouse (the “clearinghouse”). The contract is transferred and accepted by the clearinghouse immediately following execution of the swap contract with an executing broker. Thereafter, throughout the term of the cleared swap, the fund interfaces indirectly with the clearinghouse through a clearing broker and has counterparty risk to the clearing broker as well.
Both cleared and uncleared swap agreements are marked to market daily. The value of uncleared swap agreements is reported in the Statement of Assets and Liabilities as “Uncleared swaps, at value” which includes any related interest accruals to be paid or received by the fund. For cleared swaps, payments (variation margin) are made or received by the fund each day, depending on the daily fluctuations in the value of the cleared swap, such that only the current day net receivable or payable for variation margin is reported in the Statement of Assets and Liabilities.
For both cleared and uncleared swaps, the periodic exchange of net cash payments, at specified intervals or upon the occurrence of specified events as stipulated by the agreement, is recorded as realized gain or loss on swap agreements in the Statement of Operations. Premiums paid or received at the inception of the agreements are amortized using the effective interest method over the term of the agreement as realized gain or loss on swap agreements in the Statement of Operations. A liquidation
49
Table of Contents
Notes to Financial Statements (unaudited) – continued
payment received or made upon early termination is recorded as a realized gain or loss on swap agreements in the Statement of Operations. The change in unrealized appreciation or depreciation on swap agreements in the Statement of Operations reflects the aggregate change over the reporting period in the value of swaps net of any unamortized premiums paid or received.
Risks related to swap agreements include the possible lack of a liquid market, unfavorable market and interest rate movements of the underlying instrument and the failure of the counterparty to perform under the terms of the agreements. The fund’s maximum risk of loss from counterparty credit risk is the discounted net value of the cash flows to be received from/paid to the counterparty over the contract’s remaining life, to the extent that the amount is positive. To address counterparty risk, uncleared swap agreements are limited to only highly-rated counterparties. Risk is further reduced by having an ISDA Master Agreement between the fund and the counterparty providing for netting as described above and, where applicable, by the posting of collateral by the counterparty to the fund to cover the fund’s exposure to the counterparty under such ISDA Master Agreement. The fund’s counterparty risk due to cleared swaps is mitigated by the fact that the clearinghouse is the true counterparty to the transaction and the regulatory requirement safeguards in the event of a clearing broker bankruptcy.
The fund entered into credit default swap agreements in order to manage its exposure to the market or certain sectors of the market, to reduce its credit risk exposure to defaults of corporate and sovereign issuers or to create exposure to corporate or sovereign issuers to which it is not otherwise exposed. In a credit default swap agreement, the protection buyer can make an upfront payment and will make a stream of payments to the protection seller based on a fixed percentage applied to the agreement notional amount in exchange for the right to receive a specified return upon the occurrence of a defined credit event on the reference obligation (which may be either a single security or a basket of securities issued by corporate or sovereign issuers) and, with respect to the cases where physical settlement applies, the delivery by the buyer to the seller of a defined deliverable obligation. Although agreement-specific, credit events generally consist of a combination of the following: bankruptcy, failure to pay, restructuring, obligation acceleration, obligation default, or repudiation/moratorium, each as defined in the 2003 ISDA Credit Derivatives Definitions as amended by the relevant agreement. Restructuring is generally not applicable when the reference obligation is issued by a North American corporation and obligation acceleration, obligation default, or repudiation/moratorium are generally only applicable when the reference obligation is issued by a sovereign entity or an entity in an emerging country. Upon determination of the final price for the deliverable obligation (or upon delivery of the deliverable obligation in the case of physical settlement), the difference between the value of the deliverable obligation and the swap agreement’s notional amount is recorded as realized gain or loss on swap agreements in the Statement of Operations.
Credit default swap agreements are considered to have credit-risk-related contingent features since they trigger payment by the protection seller to the protection buyer upon the occurrence of a defined credit event. The maximum amount of future, undiscounted payments that the fund, as protection seller, could be required to make
50
Table of Contents
Notes to Financial Statements (unaudited) – continued
is equal to the swap agreement’s notional amount. The protection seller’s payment obligation would be offset to the extent of the value of the agreement’s deliverable obligation. At April 30, 2020, the fund did not hold any credit default swap agreements at an unrealized loss where it is the protection seller. The fund’s maximum risk of loss from counterparty risk, either as the protection seller or as the protection buyer, is the fair value of the agreement.
Loans and Other Direct Debt Instruments – The fund invests in loans and loan participations or other receivables. These investments may include standby financing commitments, including revolving credit facilities, which contractually obligate the fund to supply additional cash to the borrower on demand. The fund generally provides this financial support in order to preserve its existing investment or to obtain a more senior secured interest in the assets of the borrower. Loan participations involve a risk of insolvency of the lending bank or other financial intermediary.
TBA Dollar Roll Transactions – The fund enters into TBA dollar roll transactions in which the fund sells TBA mortgage-backed securities to financial institutions and simultaneously agrees to repurchase similar (same issuer, type and coupon) securities at a later date at an agreed-upon price. During the period between the sale and repurchase, the fund will not be entitled to receive interest and principal payments on the securities sold. The fund accounts for dollar roll transactions as purchases and sales and realizes gains and losses on these transactions. TBA dollar roll transactions involve the risk that the market value of the securities that the fund is required to purchase may decline below the agreed upon repurchase price of those securities.
Statement of Cash Flows – Information on financial transactions which have been settled through the receipt or disbursement of cash or restricted cash is presented in the Statement of Cash Flows. Cash as presented in the fund’s Statement of Assets and Liabilities includes cash on hand at the fund’s custodian bank and does not include any short-term investments. Restricted cash is presented in the fund’s Statement of Assets and Liabilities as restricted cash for uncleared derivatives and/or deposits with brokers for cleared derivatives and represents cash that has been segregated or delivered to cover the fund’s collateral or margin obligations under derivative contracts.
The following table provides a reconciliation of cash and restricted cash reported within the Statement of Assets and Liabilities with that shown in the Statement of Cash Flows:
| 4/30/20 | ||||
| Cash | $72,184 | |||
| Restricted cash | — | |||
| Restricted cash included in deposits with brokers | — | |||
| Total cash and restricted cash in the Statement of Cash Flows | $72,184 | |||
Indemnifications – Under the fund’s organizational documents, its officers and Trustees may be indemnified against certain liabilities and expenses arising out of the performance of their duties to the fund. Additionally, in the normal course of business, the fund enters into agreements with service providers that may contain indemnification clauses. The fund’s maximum exposure under these agreements is unknown as this would involve future claims that may be made against the fund that have not yet occurred.
51
Table of Contents
Notes to Financial Statements (unaudited) – continued
Investment Transactions and Income – Investment transactions are recorded on the trade date. Interest income is recorded on the accrual basis. All premium and discount is amortized or accreted for financial statement purposes in accordance with U.S. generally accepted accounting principles. Some securities may be purchased or sold on an extended settlement basis which includes “when-issued”, “delayed delivery” or “To Be Announced” (TBA) securities. For extended settlement transactions, the receipt or delivery of the securities by the fund and related payments occur at a future date, usually beyond the customary settlement time. The fund earns certain fees in connection with its floating rate loan purchasing activities. These fees are in addition to interest payments earned and may include amendment fees, commitment fees, facility fees, consent fees, and prepayment fees. Commitment fees are recorded on an accrual basis as income in the accompanying financial statements. Dividends received in cash are recorded on the ex-dividend date. Certain dividends from foreign securities will be recorded when the fund is informed of the dividend if such information is obtained subsequent to the ex-dividend date. Dividend and interest payments received in additional securities are recorded on the ex-dividend or ex-interest date in an amount equal to the value of the security on such date. Debt obligations may be placed on non-accrual status or set to accrue at a rate of interest less than the contractual coupon when the collection of all or a portion of interest has become doubtful. Interest income for those debt obligations may be further reduced by the write-off of the related interest receivables when deemed uncollectible.
The fund may receive proceeds from litigation settlements. Any proceeds received from litigation involving portfolio holdings are reflected in the Statement of Operations in realized gain/loss if the security has been disposed of by the fund or in unrealized gain/loss if the security is still held by the fund. Any other proceeds from litigation not related to portfolio holdings are reflected as other income in the Statement of Operations.
The fund purchased or sold debt securities on a when-issued or delayed delivery basis, or in a “To Be Announced” (TBA) or “forward commitment” transaction with delivery or payment to occur at a later date beyond the normal settlement period. When the fund sells securities on a when-issued, delayed delivery, TBA, or forward commitment basis, the fund typically owns or has the right to acquire securities equivalent in kind and amount to the delivered securities. At the time a fund enters into a commitment to purchase or sell a security, the transaction is recorded and the value of the security acquired or sold is reflected in the fund’s net asset value. The price of such security and the date that the security will be delivered and paid for are fixed at the time the transaction is negotiated. The value of the security may vary with market fluctuations. TBA securities resulting from these transactions are included in the Portfolio of Investments. TBA purchase and sale commitments are held at carrying amount, which approximates fair value and are categorized as level 2 within the fair value hierarchy and included in Investments purchased or sold on an extended settlement basis in the Statement of Assets and Liabilities. No interest accrues to the fund until payment takes place. At the time that a fund enters into this type of transaction, the fund is required to have sufficient cash and/or liquid securities to cover its commitments. Losses may arise due to changes in the value of the underlying securities prior to settlement date or if the counterparty does not perform under the contract’s terms, or if the issuer does not issue the securities due to political, economic or other factors.
52
Table of Contents
Notes to Financial Statements (unaudited) – continued
To mitigate the counterparty credit risk on TBA securities and other types of forward settling mortgage-backed securities, the fund whenever possible enters into a Master Securities Forward Transaction Agreement (“MSFTA”) on a bilateral basis with each of the counterparties with whom it undertakes a significant volume of transactions. The MSFTA gives each party to the agreement the right to terminate all transactions traded under such agreement if there is a specified deterioration in the credit quality of the other party. Upon an event of default or a termination of the MSFTA, the non-defaulting party has the right to close out all transactions traded under such agreement and to net amounts owed under each transaction to one net amount payable by one party to the other. This right to close out and net payments across all transactions traded under the MSFTA could result in a reduction of the fund’s credit risk to such counterparty equal to any amounts payable by the fund under the applicable transactions, if any.
For mortgage-backed securities traded under a MSFTA, the collateral and margining
requirements are contract specific. Collateral amounts across all transactions traded under such agreement are netted and an amount is posted from one party to the other to collateralize such obligations. Cash that has been pledged to cover the fund’s collateral or margin obligations under a MSFTA, if any, will be reported separately on the Statement of Assets and Liabilities as restricted cash. Securities pledged as collateral or margin for the same purpose, if any, are noted in the Portfolio of Investments.
Tax Matters and Distributions – The fund intends to qualify as a regulated investment company, as defined under Subchapter M of the Internal Revenue Code, and to distribute all of its taxable income, including realized capital gains. As a result, no provision for federal income tax is required. The fund’s federal tax returns, when filed, will remain subject to examination by the Internal Revenue Service for a three year period. Management has analyzed the fund’s tax positions taken on federal and state tax returns for all open tax years and does not believe that there are any uncertain tax positions that require recognition of a tax liability. Foreign taxes, if any, have been accrued by the fund in the accompanying financial statements in accordance with the applicable foreign tax law. Foreign income taxes may be withheld by certain countries in which the fund invests. Additionally, capital gains realized by the fund on securities issued in or by certain foreign countries may be subject to capital gains tax imposed by those countries.
Distributions to shareholders are recorded on the ex-dividend date. The fund seeks to pay monthly distributions based on an annual rate of 8.00% of the fund’s average monthly net asset value. As a result, distributions may exceed actual earnings which may result in a tax return of capital. Income and capital gain distributions are determined in accordance with income tax regulations, which may differ from U.S. generally accepted accounting principles. Certain capital accounts in the financial statements are periodically adjusted for permanent differences in order to reflect their tax character. These adjustments have no impact on net assets or net asset value per share. Temporary differences which arise from recognizing certain items of income, expense, gain or loss in different periods for financial statement and tax purposes will reverse at some time in the future.
Book/tax differences primarily relate to amortization and accretion of debt securities, straddle loss deferrals, and derivative transactions.
53
Table of Contents
Notes to Financial Statements (unaudited) – continued
For the six months ended April 30, 2020, the amount of distributions estimated to be a tax return of capital was approximately $4,906,993 which is reported as distributions from other sources in the Statements of Changes in Net Assets.
The tax character of distributions made during the current period will be determined at fiscal year end. The tax character of distributions declared to shareholders for the last fiscal year is as follows:
| Year ended 10/31/19 |
||||
| Ordinary income (including any short-term capital gains) |
$18,671,582 | |||
| Tax return of capital (b) | 13,664,509 | |||
| Total distributions | $32,336,091 | |||
| (b) | Distributions in excess of tax basis earnings and profits are reported in the financial statements as a tax return of capital. |
The federal tax cost and the tax basis components of distributable earnings were as follows:
| As of 4/30/20 | ||||
| Cost of investments | $483,519,202 | |||
| Gross appreciation | 9,112,250 | |||
| Gross depreciation | (30,470,932 | ) | ||
| Net unrealized appreciation (depreciation) | $(21,358,682 | ) | ||
| As of 10/31/19 | ||||
| Capital loss carryforwards | (20,196,422 | ) | ||
| Other temporary differences | (254,599 | ) | ||
| Net unrealized appreciation (depreciation) | 12,889,130 | |||
The aggregate cost above includes prior fiscal year end tax adjustments, if applicable.
As of October 31, 2019, the fund had capital loss carryforwards available to offset future realized gains. These net capital losses may be carried forward indefinitely and their character is retained as short-term and/or long-term losses. Such losses are characterized as follows:
| Short-Term | $(1,981,466 | ) | ||
| Long-Term | (18,214,956 | ) | ||
| Total | $(20,196,422 | ) |
(3) Transactions with Affiliates
Investment Adviser – The fund has an investment advisory agreement with MFS to provide overall investment management and related administrative services and facilities to the fund. The management fee is computed daily and paid monthly at an annual rate of 0.34% of the fund’s average daily net assets and 5.40% of gross income. Gross income is calculated based on tax elections that generally include the accretion of discount and exclude the amortization of premium, which may differ from investment income reported in the Statement of Operations. The management fee,
54
Table of Contents
Notes to Financial Statements (unaudited) – continued
from net assets and gross income, incurred for the six months ended April 30, 2020 was equivalent to an annual effective rate of 0.67% of the fund’s average daily net assets.
Transfer Agent – The fund engages Computershare Trust Company, N.A. (“Computershare”) as the sole transfer agent for the fund. MFS Service Center, Inc. (MFSC) monitors and supervises the activities of Computershare for an agreed upon fee approved by the Board of Trustees. For the six months ended April 30, 2020, these fees paid to MFSC amounted to $16,132.
Administrator – MFS provides certain financial, legal, shareholder communications, compliance, and other administrative services to the fund. Under an administrative services agreement, the fund reimburses MFS the costs incurred to provide these services. The fund is charged an annual fixed amount of $17,500 plus a fee based on average daily net assets. The administrative services fee incurred for the six months ended April 30, 2020 was equivalent to an annual effective rate of 0.0159% of the fund’s average daily net assets.
Trustees’ and Officers’ Compensation – The fund pays compensation to independent Trustees in the form of a retainer, attendance fees, and additional compensation to Board and Committee chairpersons. The fund does not pay compensation directly to Trustees or officers of the fund who are also officers of the investment adviser, all of whom receive remuneration from MFS for their services to the fund. Certain officers and Trustees of the fund are officers or directors of MFS and MFSC.
Prior to December 31, 2001, the fund had an unfunded defined benefit plan (“DB plan”) for independent Trustees. As of December 31, 2001, the Board took action to terminate the DB plan with respect to then-current and any future independent Trustees, such that the DB plan covers only certain of those former independent Trustees who retired on or before December 31, 2001. The DB plan resulted in a pension expense of $1,215 and is included in “Independent Trustees’ compensation” in the Statement of Operations for the six months ended April 30, 2020. The liability for deferred retirement benefits payable to those former independent Trustees under the DB plan amounted to $8,328 at April 30, 2020, and is included in “Payable for independent Trustees’ compensation” in the Statement of Assets and Liabilities.
Other – The fund invests in the MFS Institutional Money Market Portfolio which is managed by MFS and seeks current income consistent with preservation of capital and liquidity. This money market fund does not pay a management fee to MFS but does incur investment and operating costs.
The fund is permitted to engage in purchase and sale transactions with funds and accounts for which MFS serves as investment adviser or sub-adviser (“cross-trades”) pursuant to a policy adopted by the Board of Trustees. This policy has been designed to ensure that cross-trades conducted by the fund comply with Rule 17a-7 under the Investment Company Act of 1940. During the six months ended April 30, 2020, the fund engaged in purchase transactions pursuant to this policy, which amounted to $1,198,560.
55
Table of Contents
Notes to Financial Statements (unaudited) – continued
(4) Portfolio Securities
For the six months ended April 30, 2020, purchases and sales of investments, other than purchased option transactions and short-term obligations, were as follows:
| Purchases | Sales | |||||||
| U.S. Government securities | $21,204,627 | $44,814,515 | ||||||
| Non-U.S. Government securities | 178,889,242 | 172,180,022 | ||||||
(5) Shares of Beneficial Interest
The fund’s Declaration of Trust permits the Trustees to issue an unlimited number of full and fractional shares of beneficial interest. The Trustees have authorized the repurchase by the fund of up to 10% annually of its own shares of beneficial interest. The fund repurchased 1,421,609 shares of beneficial interest during the six months ended April 30, 2020 at an average price per share of $4.96 and a weighted average discount of 10.46% per share. The fund repurchased 3,218,293 shares of beneficial interest during the year ended October 31, 2019 at an average price per share of $5.64 and a weighted average discount of 8.64% per share. Transactions in fund shares were as follows:
| Six months ended 4/30/20 |
Year ended 10/31/19 |
|||||||||||||||
| Shares | Amount | Shares | Amount | |||||||||||||
| Capital shares repurchased | (1,421,609 | ) | $(7,051,961 | ) | (3,218,293 | ) | $(18,139,266 | ) | ||||||||
(6) Loan Agreement
The fund has a credit agreement with a bank for a revolving secured line of credit that can be drawn upon up to $100,000,000. At April 30, 2020, the fund had outstanding borrowings under this agreement in the amount of $100,000,000, which are secured by a lien on the fund’s assets. The loan’s carrying value in the fund’s Statement of Assets and Liabilities approximates its fair value. The loan value as of the reporting date is considered level 2 under the fair value hierarchy. The credit agreement matures on August 19, 2020. Borrowings under the agreement can be made for liquidity or leverage purposes. Interest is charged at a rate per annum equal to LIBOR plus an agreed upon spread with the option to choose LIBOR periods of overnight, 1, 2, 3, or 6 months, or at the option of the borrower an alternate base rate plus an agreed upon spread. The fund incurred interest expense of $886,579 during the period, which is included in “Interest expense and fees” in the Statement of Operations. The fund may also be charged a commitment fee based on the average daily unused portion of the line of credit. The fund did not incur a commitment fee during the period. For the six months ended April 30, 2020, the average loan balance was $100,000,000 at a weighted average annual interest rate of 1.78%. The fund is subject to certain covenants including, but not limited to, requirements with respect to asset coverage, portfolio diversification and liquidity.
56
Table of Contents
Notes to Financial Statements (unaudited) – continued
(7) Investments in Affiliated Issuers
An affiliated issuer may be considered one in which the fund owns 5% or more of the outstanding voting securities, or a company which is under common control. For the purposes of this report, the following were affiliated issuers:
| Affiliated Issuers | Beginning Value |
Purchases | Sales Proceeds |
Realized Gain (Loss) |
Change in Unrealized Appreciation or Depreciation |
Ending Value |
||||||||||||||||||
| MFS Institutional Money Market Portfolio |
$15,258,936 | $82,820,079 | $83,296,704 | $3,156 | $(2,446 | ) | $14,783,021 | |||||||||||||||||
| Affiliated Issuers | Dividend Income |
Capital Gain Distributions |
||||||||||||||||||||||
| MFS Institutional Money Market Portfolio |
|
$91,509 | $— | |||||||||||||||||||||
(8) Impacts of COVID-19
The pandemic related to the global spread of novel coronavirus disease (COVID-19), which was first detected in December 2019, has resulted in significant disruptions to global business activity and the global economy, as well as the economies of individual countries, the financial performance of individual companies and sectors, and the securities and commodities markets in general. This pandemic, the full effects of which are still unknown, has resulted in substantial market volatility and may have adversely impacted the prices and liquidity of the fund’s investments and the fund’s performance.
57
Table of Contents
REPORT OF INDEPENDENT REGISTERED PUBLIC ACCOUNTING FIRM
To the Board of Trustees and Shareholders of MFS Multimarket Income Trust:
We have reviewed the accompanying statement of assets and liabilities of MFS Multimarket Income Trust (the Fund), including the portfolio of investments, as of April 30, 2020, and the related statements of operations, changes in net assets, cash flows and financial highlights for the six-month period ended April 30, 2020. These interim financial statements and financial highlights are the responsibility of the Fund’s management.
We conducted our review in accordance with the standards of the Public Company Accounting Oversight Board (United States). A review of interim financial information consists principally of applying analytical procedures and making inquiries of persons responsible for financial and accounting matters. It is substantially less in scope than an audit conducted in accordance with the standards of the Public Company Accounting Oversight Board (United States), the objective of which is the expression of an opinion regarding the financial statements taken as a whole. Accordingly, we do not express such an opinion.
Based on our review, we are not aware of any material modifications that should be made to the accompanying interim financial statements and financial highlights for them to be in conformity with U.S. generally accepted accounting principles.
We have previously audited, in accordance with the standards of the Public Company Accounting Oversight Board (United States), the statement of changes in net assets for the year ended October 31, 2019 and the financial highlights for each of the five years in the period ended October 31, 2019, and in our report dated December 16, 2019, we expressed an unqualified opinion on such statement of changes in net assets and financial highlights.

Boston, Massachusetts
June 16, 2020
58
Table of Contents
PROXY VOTING POLICIES AND INFORMATION
MFS votes proxies on behalf of the fund pursuant to proxy voting policies and procedures that are available without charge, upon request, by calling 1-800-225-2606, by visiting mfs.com/proxyvoting, or by visiting the SEC Web site at http://www.sec.gov.
Information regarding how the fund voted proxies relating to portfolio securities during the most recent twelve-month period ended June 30 is available by August 31 of each year without charge by visiting mfs.com/proxyvoting, or by visiting the SEC’s Web site at http://www.sec.gov.
QUARTERLY PORTFOLIO DISCLOSURE
The fund files a complete schedule of portfolio holdings with the SEC for the first and third quarters of each fiscal year as an exhibit to its reports on Form N-PORT. The fund’s Form N-PORT reports are available on the SEC’s website at http://www.sec.gov. A shareholder can obtain the portfolio holdings report for the first and third quarters of the fund’s fiscal year at mfs.com/closedendfunds by choosing the fund’s name and then selecting the “Resources” tab and clicking on “Prospectus and Reports”.
From time to time, MFS may post important information about the fund or the MFS funds on the MFS web site (mfs.com). This information is available at https://www.mfs.com/en-us/what-we-do/announcements.html or at mfs.com/closedendfunds by choosing the fund’s name.
Additional information about the fund (e.g., performance, dividends and the fund’s price history) is also available by clicking on the fund’s name under “Closed-End Funds” in the “Products” section of mfs.com.
INFORMATION ABOUT FUND CONTRACTS AND LEGAL CLAIMS
The fund has entered into contractual arrangements with an investment adviser, administrator, transfer agent, and custodian who each provide services to the fund. Unless expressly stated otherwise, shareholders are not parties to, or intended beneficiaries of these contractual arrangements, and these contractual arrangements are not intended to create any shareholder right to enforce them against the service providers or to seek any remedy under them against the service providers, either directly or on behalf of the fund.
Under the Trust’s By-Laws and Declaration of Trust, any claims asserted against or on behalf of the MFS Funds, including claims against Trustees and Officers, must be brought in state and federal courts located within the Commonwealth of Massachusetts.
59
Table of Contents
TRANSFER AGENT, REGISTRAR, AND
DIVIDEND DISBURSING AGENT
CALL
1-800-637-2304
9 a.m. to 5 p.m. Eastern time
WRITE
Computershare Trust Company, N.A.
P.O. Box 505005
Louisville, KY 40233-5005
New York Stock Exchange Symbol: MMT
Table of Contents
| ITEM 2. | CODE OF ETHICS. |
During the period covered by this report, the Registrant has not amended any provision in its Code of Ethics (the “Code”) that relates to an element of the Code’s definitions enumerated in paragraph (b) of Item 2 of this Form N-CSR. During the period covered by this report, the Registrant did not grant a waiver, including an implicit waiver, from any provision of the Code.
| ITEM 3. | AUDIT COMMITTEE FINANCIAL EXPERT. |
Not applicable for semi-annual reports.
| ITEM 4. | PRINCIPAL ACCOUNTANT FEES AND SERVICES. |
Not applicable for semi-annual reports.
| ITEM 5. | AUDIT COMMITTEE OF LISTED REGISTRANTS. |
Not applicable for semi-annual reports.
| ITEM 6. | SCHEDULE OF INVESTMENTS |
A schedule of investments for MFS Multimarket Income Trust is included as part of the report to shareholders under Item 1 of this Form N-CSR.
| ITEM 7. | DISCLOSURE OF PROXY VOTING POLICIES AND PROCEDURES FOR CLOSED-END MANAGEMENT INVESTMENT COMPANIES. |
Not applicable for semi-annual reports.
Table of Contents
| ITEM 8. | PORTFOLIO MANAGERS OF CLOSED-END MANAGEMENT INVESTMENT COMPANIES. |
There were no changes during the period.
| ITEM 9. | PURCHASES OF EQUITY SECURITIES BY CLOSED-END MANAGEMENT INVESTMENT COMPANY AND AFFILIATED PURCHASERS. |
MFS Multimarket Income Trust
| Period |
(a) Total number of Shares Purchased |
(b) Average Price Paid per Share |
(c) Total Number of Shares Purchased as Part of Publicly Announced Plans or Programs |
(d) Maximum Number (or Approximate Dollar Value) of Shares that May Yet Be Purchased under the Plans or Programs |
||||||||||||
| 11/01/19-11/30/19 |
0 | N/A | 0 | 6,398,195 | ||||||||||||
| 12/01/19-12/31/19 |
0 | N/A | 0 | 6,398,195 | ||||||||||||
| 1/01/20-1/31/20 |
0 | N/A | 0 | 6,398,195 | ||||||||||||
| 2/01/20-2/28/20 |
0 | N/A | 0 | 6,398,195 | ||||||||||||
| 3/01/20-3/31/20 |
765,542 | 4.83 | 765,542 | 5,632,653 | ||||||||||||
| 4/01/20-4/30/20 |
656,067 | 5.12 | 656,067 | 4,976,586 | ||||||||||||
|
|
|
|
|
|
|
|||||||||||
| Total |
1,421,609 | 4.96 | 1,421,609 | |||||||||||||
|
|
|
|
|
|
|
|||||||||||
Note: The Board approved procedures to repurchase shares and reviews the results periodically. The notification to shareholders of the program is part of the semi-annual and annual reports sent to shareholders. These annual programs begin on October 1st of each year. The programs conform to the conditions of Rule 10b-18 of the Securities Exchange Act of 1934 and limit the aggregate number of shares that may be purchased in each annual period (October 1 through the following September 30) to 10% of the Registrant’s outstanding shares as of the first day of the plan year (October 1). The aggregate number of shares available for purchase for the October 1, 2019 plan year is 6,398,195.
| ITEM 10. | SUBMISSION OF MATTERS TO A VOTE OF SECURITY HOLDERS. |
There were no material changes to the procedures by which shareholders may send recommendations to the Board for nominees to the Registrant’s Board since the Registrant last provided disclosure as to such procedures in response to the requirements of Item 407 (c)(2)(iv) of Regulation S-K or this Item.
Table of Contents
| ITEM 11. | CONTROLS AND PROCEDURES. |
| (a) | Based upon their evaluation of the registrant’s disclosure controls and procedures (as defined in Rule 30a-3(c) under the Investment Company Act of 1940 (the “Act”)) as conducted within 90 days of the filing date of this Form N-CSR, the registrant’s principal financial officer and principal executive officer have concluded that those disclosure controls and procedures provide reasonable assurance that the material information required to be disclosed by the registrant on this report is recorded, processed, summarized and reported within the time periods specified in the Securities and Exchange Commission’s rules and forms. |
| (b) | There were no changes in the registrant’s internal controls over financial reporting (as defined in Rule 30a-3(d) under the Act) that occurred during the period covered by the report that has materially affected, or is reasonably likely to materially affect, the registrant’s internal control over financial reporting. |
| ITEM 12. | DISCLOSURE OF SECURITIES LENDING ACTIVITIES FOR CLOSED-END MANAGEMENT INVESTMENT COMPANIES. |
Not applicable for semi-annual reports.
| ITEM 13. | EXHIBITS. |
| (a) | File the exhibits listed below as part of this form. Letter or number the exhibits in the sequence indicated. |
| (1) | Any code of ethics, or amendment thereto, that is the subject of the disclosure required by Item 2, to the extent that the registrant intends to satisfy the Item 2 requirements through filing of an exhibit. Not applicable. |
| (2) | A separate certification for each principal executive officer and principal financial officer of the registrant as required by Rule 30a-2(a) under the Act (17 CFR 270.30a-2): Attached hereto as EX-99.302CERT. |
| (3) | Any written solicitation to purchase securities under Rule 23c-1 under the Act (17 CFR 270.23c-1) sent or given during the period covered by the report by or on behalf of the registrant to 10 or more persons. Not applicable. |
| (4) | Change in the registrant’s independent public accountant. Not applicable. |
| (b) | If the report is filed under Section 13(a) or 15(d) of the Exchange Act, provide the certifications required by Rule 30a-2(b) under the Act (17 CFR 270.30a-2(b)), Rule 13a-14(b) or Rule 15d-14(b) under the Exchange Act (17 CFR 240.13a-14(b) or 240.15d-14(b)) and Section 1350 of Chapter 63 of Title 18 of the United States Code (18 U.S.C. 1350) as an exhibit. A certification furnished pursuant to this paragraph will not be deemed “filed” for the purposes of Section 18 of the Exchange Act (15 U.S.C. 78r), or otherwise subject to the liability of that section. Such certification will not be deemed to be incorporated by reference into any filing under the Securities Act of 1933 or the Exchange Act, except to the extent that the registrant specifically incorporates it by reference: Attached hereto as EX-99.906CERT. |
| (c) | Notices to Trust’s common shareholders in accordance with Investment Company Act Section 19(a) and Rule 19a-1. Attached hereto as EX-99.19a-1. |
Table of Contents
Notice
A copy of the Amended and Restated Declaration of Trust of the Registrant is on file with the Secretary of State of the Commonwealth of Massachusetts and notice is hereby given that this instrument is executed on behalf of the Registrant by an officer of the Registrant as an officer and not individually and the obligations of or arising out of this instrument are not binding upon any of the Trustees or shareholders individually, but are binding only upon the assets and property of the respective constituent series of the Registrant.
Table of Contents
SIGNATURES
Pursuant to the requirements of the Securities Exchange Act of 1934 and the Investment Company Act of 1940, the registrant has duly caused this report to be signed on its behalf by the undersigned, thereunto duly authorized.
Registrant MFS MULTIMARKET INCOME TRUST
| By (Signature and Title)* | DAVID L. DILORENZO | |
| David L. DiLorenzo, President |
Date: June 16, 2020
Pursuant to the requirements of the Securities Exchange Act of 1934 and the Investment Company Act of 1940, this report has been signed below by the following persons on behalf of the registrant and in the capacities and on the dates indicated.
| By (Signature and Title)* | DAVID L. DILORENZO | |
| David L. DiLorenzo, President (Principal Executive Officer) |
Date: June 16, 2020
| By (Signature and Title)* | JAMES O. YOST | |
| James O. Yost, Treasurer (Principal Financial Officer and Accounting Officer) |
Date: June 16, 2020
| * | Print name and title of each signing officer under his or her signature. |
EX-99.302CERT
MFS MULTIMARKET INCOME TRUST
CERTIFICATION PURSUANT TO SECTION 302 OF THE SARBANES-OXLEY ACT
I, James O. Yost, certify that:
| 1. | I have reviewed this report on Form N-CSR of MFS Multimarket Income Trust; |
| 2. | Based on my knowledge, this report does not contain any untrue statement of a material fact or omit to state a material fact necessary to make the statements made, in light of the circumstances under which such statements were made, not misleading with respect to the period covered by this report; |
| 3. | Based on my knowledge, the financial statements, and other financial information included in this report, fairly present in all material respects the financial condition, results of operations, changes in net assets, and cash flows (if the financial statements are required to include a statement of cash flows) of the registrant as of, and for, the periods presented in this report; |
| 4. | The registrant’s other certifying officer and I are responsible for establishing and maintaining disclosure controls and procedures (as defined in Rule 30a-3(c) under the Investment Company Act of 1940) and internal control over financial reporting (as defined in Rule 30a-3(d) under the Investment Company Act of 1940) for the registrant and have: |
| a. | designed such disclosure controls and procedures, or caused such disclosure controls and procedures to be designed under our supervision, to ensure that material information relating to the registrant, including its consolidated subsidiaries, is made known to us by others within those entities, particularly during the period in which this report is being prepared; |
| b. | designed such internal control over financial reporting, or caused such internal control over financial reporting to be designed under our supervision, to provide reasonable assurance regarding the reliability of financial reporting and the preparation of financial statements for external purposes in accordance with generally accepted accounting principles; |
| c. | evaluated the effectiveness of the registrant’s disclosure controls and procedures and presented in this report our conclusions about the effectiveness of the disclosure controls and procedures as of a date within 90 days prior to the filing date of this report based on such evaluation; and |
| d. | disclosed in this report any change in the registrant’s internal control over financial reporting that occurred during the period covered by the report that has materially affected, or is reasonably likely to materially affect, the registrant’s internal control over financial reporting; and |
| 5. | The registrant’s other certifying officer and I have disclosed to the registrant’s auditors and the audit committee of the registrant’s board of directors (or persons performing the equivalent functions): |
| a. | all significant deficiencies and material weaknesses in the design or operation of internal control over financial reporting which are reasonably likely to adversely affect the registrant’s ability to record, process, summarize, and report financial information; and |
| b. | any fraud, whether or not material, that involves management or other employees who have a significant role in the registrant’s internal control over financial reporting. |
| Date: June 16, 2020 | JAMES O. YOST | |||
| James O. Yost | ||||
| Treasurer (Principal Financial Officer and Accounting Officer) |
EX-99.302CERT
MFS MULTIMARKET INCOME TRUST
CERTIFICATION PURSUANT TO SECTION 302 OF THE SARBANES-OXLEY ACT
I, David L. DiLorenzo, certify that:
| 1. | I have reviewed this report on Form N-CSR of MFS Multimarket Income Trust; |
| 2. | Based on my knowledge, this report does not contain any untrue statement of a material fact or omit to state a material fact necessary to make the statements made, in light of the circumstances under which such statements were made, not misleading with respect to the period covered by this report; |
| 3. | Based on my knowledge, the financial statements, and other financial information included in this report, fairly present in all material respects the financial condition, results of operations, changes in net assets, and cash flows (if the financial statements are required to include a statement of cash flows) of the registrant as of, and for, the periods presented in this report; |
| 4. | The registrant’s other certifying officer and I are responsible for establishing and maintaining disclosure controls and procedures (as defined in Rule 30a-3(c) under the Investment Company Act of 1940) and internal control over financial reporting (as defined in Rule 30a-3(d) under the Investment Company Act of 1940) for the registrant and have: |
| a. | designed such disclosure controls and procedures, or caused such disclosure controls and procedures to be designed under our supervision, to ensure that material information relating to the registrant, including its consolidated subsidiaries, is made known to us by others within those entities, particularly during the period in which this report is being prepared; |
| b. | designed such internal control over financial reporting, or caused such internal control over financial reporting to be designed under our supervision, to provide reasonable assurance regarding the reliability of financial reporting and the preparation of financial statements for external purposes in accordance with generally accepted accounting principles; |
| c. | evaluated the effectiveness of the registrant’s disclosure controls and procedures and presented in this report our conclusions about the effectiveness of the disclosure controls and procedures as of a date within 90 days prior to the filing date of this report based on such evaluation; and |
| d. | disclosed in this report any change in the registrant’s internal control over financial reporting that occurred during the period covered by the report that has materially affected, or is reasonably likely to materially affect, the registrant’s internal control over financial reporting; and |
| 5. | The registrant’s other certifying officer and I have disclosed to the registrant’s auditors and the audit committee of the registrant’s board of directors (or persons performing the equivalent functions): |
| a. | all significant deficiencies and material weaknesses in the design or operation of internal control over financial reporting which are reasonably likely to adversely affect the registrant’s ability to record, process, summarize, and report financial information; and |
| b. | any fraud, whether or not material, that involves management or other employees who have a significant role in the registrant’s internal control over financial reporting. |
| Date: June 16, 2020 | DAVID L. DILORENZO | |||
| David L. DiLorenzo | ||||
| President (Principal Executive Officer) |
EX-99.906CERT
MFS MULTIMARKET INCOME TRUST
CERTIFICATION PURSUANT TO SECTION 906 OF THE SARBANES-OXLEY ACT
I, James O. Yost, certify that, to my knowledge:
| 1. | The Form N-CSR (the “Report”) of MFS Multimarket Income Trust (the “Registrant”) fully complies for the period covered by the Report with the requirements of Section 13(a) or 15(d) of the Securities Exchange Act of 1934; and |
| 2. | The information contained in the Report fairly presents, in all material respects, the financial condition and results of operations of the Registrant. |
| Date: June 16, 2020 | JAMES O. YOST | |||
| James O. Yost | ||||
| Treasurer (Principal Financial Officer and Accounting Officer) |
A signed original of this written statement required by Section 906 has been provided to the Registrant and will be retained by the Registrant and furnished to the Securities and Exchange Commission or its staff upon request.
EX-99.906CERT
MFS MULTIMARKET INCOME TRUST
CERTIFICATION PURSUANT TO SECTION 906 OF THE SARBANES-OXLEY ACT
I, David L. DiLorenzo, certify that, to my knowledge:
| 1. | The Form N-CSR (the “Report”) of MFS Multimarket Income Trust (the “Registrant”) fully complies for the period covered by the Report with the requirements of Section 13(a) or 15(d) of the Securities Exchange Act of 1934; and |
| 2. | The information contained in the Report fairly presents, in all material respects, the financial condition and results of operations of the Registrant. |
| Date: June 16, 2020 | DAVID L. DILORENZO | |||
| David L. DiLorenzo | ||||
| President (Principal Executive Officer) |
A signed original of this written statement required by Section 906 has been provided to the Registrant and will be retained by the Registrant and furnished to the Securities and Exchange Commission or its staff upon request.
EX-99.19a-1

MFS® Multimarket Income Trust
P.O. Box 505005
Louisville, KY 40233-5005
Notice to shareholders — Source of distribution
| Distribution period | November 2019 | |
| Distribution amount per share | $0.04244 |
The following table sets forth the estimated amounts of the current distribution and the cumulative distributions paid this fiscal year to date from the following sources: net investment income, net realized short-term capital gains, net realized long-term capital gains and return of capital or other capital source. The fund’s fiscal year begins each November 1st. All amounts are expressed per common share.
| Current distribution |
% Breakdown of current distribution |
Total cumulative distributions for the fiscal year to date |
% Breakdown of the total cumulative distributions for the fiscal year to date |
|||||||||||||
| Net Investment Income |
$ | 0.02386 | 56 | % | $ | 0.02386 | 56 | % | ||||||||
| Net Realized ST Cap Gains |
0.00000 | 0 | % | 0.00000 | 0 | % | ||||||||||
| Net Realized LT Cap Gains |
0.00000 | 0 | % | 0.00000 | 0 | % | ||||||||||
| Return of Capital or Other Capital Source |
0.01858 | 44 | % | 0.01858 | 44 | % | ||||||||||
|
|
|
|
|
|
|
|
|
|||||||||
| Total (per common share) |
$ | 0.04244 | 100 | % | $ | 0.04244 | 100 | % | ||||||||
| Average annual total return (in relation to NAV) for the five years ended 10-31-2019 |
6.10 | % | ||||||||
|
|
|
|||||||||
| Annualized current distribution rate expressed as a percentage of month end NAV as of 10-31-2019 |
7.98 | % | ||||||||
|
|
|
|||||||||
| Cumulative total return (in relation to NAV) for the fiscal year through 10-31-2019 |
14.78 | % | ||||||||
|
|
|
|||||||||
| Cumulative fiscal year distributions as a percentage of NAV as of 10-31-2019 |
0.67 | % | ||||||||
|
|
|
|||||||||
You should not draw any conclusions about the fund’s investment performance from the amount of this distribution or from the terms of the fund’s managed distribution plan.
The fund estimates that it has distributed more than its income and capital gains; therefore, a portion of your distribution may be a return of capital. A return of capital may occur, for example, when some or all of the money that you invested in the fund is paid back to you. A return of capital distribution does not necessarily reflect the fund’s investment performance and should not be confused with “yield” or “income.”
The amounts and sources of distributions reported in this notice are only estimates and are not being provided for tax-reporting purposes. The actual amounts and sources of the amounts for tax-reporting purposes will depend upon the fund’s investment experience during the remainder of its fiscal year and may be subject to changes based on tax regulations. The fund will send you a Form 1099-DIV for the calendar year that will tell you how to report these distributions for federal income tax purposes.
If you have any questions regarding this information, please call our fund service department at 1-800-637-2304 any business day from 9 a.m. to 5 p.m. Eastern time.
MMTSN-1119
MFS® Multimarket Income Trust
P.O. Box 505005
Louisville, KY 40233-5005
Notice to shareholders — Source of distribution
| Distribution period | December 2019 | |
| Distribution amount per share | $0.04231 |
The following table sets forth the estimated amounts of the current distribution and the cumulative distributions paid this fiscal year to date from the following sources: net investment income, net realized short-term capital gains, net realized long-term capital gains and return of capital or other capital source. The fund’s fiscal year begins each November 1st. All amounts are expressed per common share.
| Current distribution |
% Breakdown of current distribution |
Total cumulative distributions for the fiscal year to date |
% Breakdown of the total cumulative distributions for the fiscal year to date |
|||||||||||||
| Net Investment Income |
$ | 0.02327 | 55 | % | $ | 0.04654 | 55 | % | ||||||||
| Net Realized ST Cap Gains |
0.00000 | 0 | % | 0.00000 | 0 | % | ||||||||||
| Net Realized LT Cap Gains |
0.00000 | 0 | % | 0.00000 | 0 | % | ||||||||||
| Return of Capital or Other Capital Source |
0.01904 | 45 | % | 0.03821 | 45 | % | ||||||||||
|
|
|
|
|
|
|
|
|
|||||||||
| Total (per common share) |
$ | 0.04231 | 100 | % | $ | 0.08475 | 100 | % | ||||||||
| Average annual total return (in relation to NAV) for the five years ended 11-30-2019 |
6.18 | % | ||||||||
|
|
|
|||||||||
| Annualized current distribution rate expressed as a percentage of month end NAV as of 11-30-2019 |
8.00 | % | ||||||||
|
|
|
|||||||||
| Cumulative total return (in relation to NAV) for the fiscal year through 11-30-2019 |
0.22 | % | ||||||||
|
|
|
|||||||||
| Cumulative fiscal year distributions as a percentage of NAV as of 11-30-2019 |
1.33 | % | ||||||||
|
|
|
|||||||||
You should not draw any conclusions about the fund’s investment performance from the amount of this distribution or from the terms of the fund’s managed distribution plan.
The fund estimates that it has distributed more than its income and capital gains; therefore, a portion of your distribution may be a return of capital. A return of capital may occur, for example, when some or all of the money that you invested in the fund is paid back to you. A return of capital distribution does not necessarily reflect the fund’s investment performance and should not be confused with “yield” or “income.”
The amounts and sources of distributions reported in this notice are only estimates and are not being provided for tax-reporting purposes. The actual amounts and sources of the amounts for tax-reporting purposes will depend upon the fund’s investment experience during the remainder of its fiscal year and may be subject to changes based on tax regulations. The fund will send you a Form 1099-DIV for the calendar year that will tell you how to report these distributions for federal income tax purposes.
If you have any questions regarding this information, please call our fund service department at 1-800-637-2304 any business day from 9 a.m. to 5 p.m. Eastern time.
MMTSN-1219
MFS® Multimarket Income Trust
P.O. Box 505005
Louisville, KY 40233-5005
Notice to shareholders — Source of distribution
| Distribution period | January 2020 | |
| Distribution amount per share | $0.04257 |
The following table sets forth the estimated amounts of the current distribution and the cumulative distributions paid this fiscal year to date from the following sources: net investment income, net realized short-term capital gains, net realized long-term capital gains and return of capital or other capital source. The fund’s fiscal year begins each November 1st. All amounts are expressed per common share.
| Current distribution |
% Breakdown of current distribution |
Total cumulative distributions for the fiscal year to date |
% Breakdown of the total cumulative distributions for the fiscal year to date |
|||||||||||||
| Net Investment Income |
$ | 0.02291 | 54 | % | $ | 0.06910 | 54 | % | ||||||||
| Net Realized ST Cap Gains |
0.00000 | 0 | % | 0.00000 | 0 | % | ||||||||||
| Net Realized LT Cap Gains |
0.00000 | 0 | % | 0.00000 | 0 | % | ||||||||||
| Return of Capital or Other Capital Source |
0.01966 | 46 | % | 0.05822 | 46 | % | ||||||||||
|
|
|
|
|
|
|
|
|
|||||||||
| Total (per common share) |
$ | 0.04257 | 100 | % | $ | 0.12732 | 100 | % | ||||||||
| Average annual total return (in relation to NAV) for the five years ended 12-31-2019 |
6.69 | % | ||||||||
|
|
|
|||||||||
| Annualized current distribution rate expressed as a percentage of month end NAV as of 12-31-2019 |
7.98 | % | ||||||||
|
|
|
|||||||||
| Cumulative total return (in relation to NAV) for the fiscal year through 12-31-2019 |
1.70 | % | ||||||||
|
|
|
|||||||||
| Cumulative fiscal year distributions as a percentage of NAV as of 12-31-2019 |
1.99 | % | ||||||||
|
|
|
|||||||||
You should not draw any conclusions about the fund’s investment performance from the amount of this distribution or from the terms of the fund’s managed distribution plan.
The fund estimates that it has distributed more than its income and capital gains; therefore, a portion of your distribution may be a return of capital. A return of capital may occur, for example, when some or all of the money that you invested in the fund is paid back to you. A return of capital distribution does not necessarily reflect the fund’s investment performance and should not be confused with “yield” or “income.”
The amounts and sources of distributions reported in this notice are only estimates and are not being provided for tax-reporting purposes. The actual amounts and sources of the amounts for tax-reporting purposes will depend upon the fund’s investment experience during the remainder of its fiscal year and may be subject to changes based on tax regulations. The fund will send you a Form 1099-DIV for the calendar year that will tell you how to report these distributions for federal income tax purposes.
If you have any questions regarding this information, please call our fund service department at 1-800-637-2304 any business day from 9 a.m. to 5 p.m. Eastern time.
MMTSN-0120
MFS® Multimarket Income Trust
P.O. Box 505005
Louisville, KY 40233-5005
Notice to shareholders — Source of distribution
| Distribution period | February 2020 | |
| Distribution amount per share | $0.04277 |
The following table sets forth the estimated amounts of the current distribution and the cumulative distributions paid this fiscal year to date from the following sources: net investment income, net realized short-term capital gains, net realized long-term capital gains and return of capital or other capital source. The fund’s fiscal year begins each November 1st. All amounts are expressed per common share.
| Current distribution |
% Breakdown of current distribution |
Total cumulative distributions for the fiscal year to date |
% Breakdown of the total cumulative distributions for the fiscal year to date |
|||||||||||||
| Net Investment Income |
$ | 0.02373 | 55 | % | $ | 0.09365 | 55 | % | ||||||||
| Net Realized ST Cap Gains |
0.00000 | 0 | % | 0.00000 | 0 | % | ||||||||||
| Net Realized LT Cap Gains |
0.00000 | 0 | % | 0.00000 | 0 | % | ||||||||||
| Return of Capital or Other Capital Source |
0.01904 | 45 | % | 0.07644 | 45 | % | ||||||||||
|
|
|
|
|
|
|
|
|
|||||||||
| Total (per common share) |
$ | 0.04277 | 100 | % | $ | 0.17009 | 100 | % | ||||||||
| Average annual total return (in relation to NAV) for the five years ended 1-31-2020 |
6.67 | % | ||||||||
|
|
|
|||||||||
| Annualized current distribution rate expressed as a percentage of month end NAV as of 1-31-2020 |
8.01 | % | ||||||||
|
|
|
|||||||||
| Cumulative total return (in relation to NAV) for the fiscal year through 1-31-2020 |
2.56 | % | ||||||||
|
|
|
|||||||||
| Cumulative fiscal year distributions as a percentage of NAV as of 1-31-2020 |
2.65 | % | ||||||||
|
|
|
|||||||||
You should not draw any conclusions about the fund’s investment performance from the amount of this distribution or from the terms of the fund’s managed distribution plan.
The fund estimates that it has distributed more than its income and capital gains; therefore, a portion of your distribution may be a return of capital. A return of capital may occur, for example, when some or all of the money that you invested in the fund is paid back to you. A return of capital distribution does not necessarily reflect the fund’s investment performance and should not be confused with “yield” or “income.”
The amounts and sources of distributions reported in this notice are only estimates and are not being provided for tax-reporting purposes. The actual amounts and sources of the amounts for tax-reporting purposes will depend upon the fund’s investment experience during the remainder of its fiscal year and may be subject to changes based on tax regulations. The fund will send you a Form 1099-DIV for the calendar year that will tell you how to report these distributions for federal income tax purposes.
If you have any questions regarding this information, please call our fund service department at 1-800-637-2304 any business day from 9 a.m. to 5 p.m. Eastern time.
MMTSN-0220
MFS® Multimarket Income Trust
P.O. Box 505005
Louisville, KY 40233-5005
Notice to shareholders — Source of distribution
| Distribution period | March 2020 | |
| Distribution amount per share | $0.04288 |
The following table sets forth the estimated amounts of the current distribution and the cumulative distributions paid this fiscal year to date from the following sources: net investment income, net realized short-term capital gains, net realized long-term capital gains and return of capital or other capital source. The fund’s fiscal year begins each November 1st. All amounts are expressed per common share.
| Current distribution |
% Breakdown of current distribution |
Total cumulative distributions for the fiscal year to date |
% Breakdown of the total cumulative distributions for the fiscal year to date |
|||||||||||||
| Net Investment Income |
$ | 0.02088 | 49 | % | $ | 0.11167 | 52 | % | ||||||||
| Net Realized ST Cap Gains |
0.00000 | 0 | % | 0.00000 | 0 | % | ||||||||||
| Net Realized LT Cap Gains |
0.00000 | 0 | % | 0.00000 | 0 | % | ||||||||||
| Return of Capital or Other Capital Source |
0.02200 | 51 | % | 0.10130 | 48 | % | ||||||||||
|
|
|
|
|
|
|
|
|
|||||||||
| Total (per common share) |
$ | 0.04288 | 100 | % | $ | 0.21297 | 100 | % | ||||||||
| Average annual total return (in relation to NAV) for the five years ended 2-29-2020 |
6.16 | % | ||
|
|
|
|||
| Annualized current distribution rate expressed as a percentage of month end NAV as of 2-29-2020 |
8.14 | % | ||
|
|
|
|||
| Cumulative total return (in relation to NAV) for the fiscal year through 2-29-2020 |
1.86 | % | ||
|
|
|
|||
| Cumulative fiscal year distributions as a percentage of NAV as of 2-29-2020 |
3.37 | % | ||
|
|
|
You should not draw any conclusions about the fund’s investment performance from the amount of this distribution or from the terms of the fund’s managed distribution plan.
The fund estimates that it has distributed more than its income and capital gains; therefore, a portion of your distribution may be a return of capital. A return of capital may occur, for example, when some or all of the money that you invested in the fund is paid back to you. A return of capital distribution does not necessarily reflect the fund’s investment performance and should not be confused with “yield” or “income.”
The amounts and sources of distributions reported in this notice are only estimates and are not being provided for tax-reporting purposes. The actual amounts and sources of the amounts for tax-reporting purposes will depend upon the fund’s investment experience during the remainder of its fiscal year and may be subject to changes based on tax regulations. The fund will send you a Form 1099-DIV for the calendar year that will tell you how to report these distributions for federal income tax purposes.
If you have any questions regarding this information, please call our fund service department at 1-800-637-2304 any business day from 9 a.m. to 5 p.m. Eastern time.
MMTSN-0320
MFS® Multimarket Income Trust
P.O. Box 505005
Louisville, KY 40233-5005
Notice to shareholders — Source of distribution
| Distribution period | April 2020 | |
| Distribution amount per share | $0.03827 |
The following table sets forth the estimated amounts of the current distribution and the cumulative distributions paid this fiscal year to date from the following sources: net investment income, net realized short-term capital gains, net realized long-term capital gains and return of capital or other capital source. The fund’s fiscal year begins each November 1st. All amounts are expressed per common share.
| Current distribution |
% Breakdown of current distribution |
Total cumulative distributions for the fiscal year to date |
% Breakdown of the total cumulative distributions for the fiscal year to date |
|||||||||||||
| Net Investment Income |
$ | 0.02547 | 67 | % | $ | 0.14758 | 59 | % | ||||||||
| Net Realized ST Cap Gains |
0.00000 | 0 | % | 0.00000 | 0 | % | ||||||||||
| Net Realized LT Cap Gains |
0.00000 | 0 | % | 0.00000 | 0 | % | ||||||||||
| Return of Capital or Other Capital Source |
0.01280 | 33 | % | 0.10366 | 41 | % | ||||||||||
|
|
|
|
|
|
|
|
|
|||||||||
| Total (per common share) |
$ | 0.03827 | 100 | % | $ | 0.25124 | 100 | % | ||||||||
| Average annual total return (in relation to NAV) for the five years ended 3-31-2020 |
3.55 | % | ||
|
|
|
|||
| Annualized current distribution rate expressed as a percentage of month end NAV as of 3-31-2020 |
8.30 | % | ||
|
|
|
|||
| Cumulative total return (in relation to NAV) for the fiscal year through 3-31-2020 |
-10.08 | % | ||
|
|
|
|||
| Cumulative fiscal year distributions as a percentage of NAV as of 3-31-2020 |
4.54 | % | ||
|
|
|
You should not draw any conclusions about the fund’s investment performance from the amount of this distribution or from the terms of the fund’s managed distribution plan.
The fund estimates that it has distributed more than its income and capital gains; therefore, a portion of your distribution may be a return of capital. A return of capital may occur, for example, when some or all of the money that you invested in the fund is paid back to you. A return of capital distribution does not necessarily reflect the fund’s investment performance and should not be confused with “yield” or “income.”
The amounts and sources of distributions reported in this notice are only estimates and are not being provided for tax-reporting purposes. The actual amounts and sources of the amounts for tax-reporting purposes will depend upon the fund’s investment experience during the remainder of its fiscal year and may be subject to changes based on tax regulations. The fund will send you a Form 1099-DIV for the calendar year that will tell you how to report these distributions for federal income tax purposes.
If you have any questions regarding this information, please call our fund service department at 1-800-637-2304 any business day from 9 a.m. to 5 p.m. Eastern time.
MMTSN-0420
Serious News for Serious Traders! Try StreetInsider.com Premium Free!
You May Also Be Interested In
- M6 Metropole Television: 2024 First Quarter
- ROSEN, A RANKED AND LEADING FIRM, Encourages Innoviz Technologies Ltd. Investors to Secure Counsel Before Important Deadline in Securities Class Action – INVZ, INVZW
- Helo Corp Announces Annual 2023 Results
Create E-mail Alert Related Categories
SEC FilingsSign up for StreetInsider Free!
Receive full access to all new and archived articles, unlimited portfolio tracking, e-mail alerts, custom newswires and RSS feeds - and more!
