

Form N-CSRS FIDELITY CHARLES STREET For: Mar 31
 Tweet
Tweet Share
ShareUNITED STATES
SECURITIES AND EXCHANGE COMMISSION
Washington, D.C. 20549
FORM N-CSR
CERTIFIED SHAREHOLDER REPORT OF REGISTERED
MANAGEMENT INVESTMENT COMPANIES
Investment Company Act file number 811-3221
Fidelity Charles Street Trust
(Exact name of registrant as specified in charter)
245 Summer St., Boston, MA 02210
(Address of principal executive offices) (Zip code)
William C. Coffey, Secretary
245 Summer St.
Boston, Massachusetts 02210
(Name and address of agent for service)
Registrant's telephone number, including area code:
617-563-7000
| Date of fiscal year end: | September 30 |
| | |
| Date of reporting period: | March 31, 2019 |
Item 1.
Reports to Stockholders
|
Fidelity Asset Manager® Funds - 20%, 30%, 40%, 50%, 60%, 70%, 85%
Semi-Annual Report March 31, 2019 Includes Fidelity and Fidelity Advisor share classes |
 |
Beginning on January 1, 2021, as permitted by regulations adopted by the Securities and Exchange Commission, paper copies of a fund’s shareholder reports will no longer be sent by mail, unless you specifically request paper copies of the reports from the fund or from your financial intermediary, such as a financial advisor, broker-dealer or bank. Instead, the reports will be made available on a website, and you will be notified by mail each time a report is posted and provided with a website link to access the report.
If you already elected to receive shareholder reports electronically, you will not be affected by this change and you need not take any action. You may elect to receive shareholder reports and other communications from a fund electronically, by contacting your financial intermediary. For Fidelity customers, visit Fidelity's web site or call Fidelity using the contact information listed below.
You may elect to receive all future reports in paper free of charge. If you wish to continue receiving paper copies of your shareholder reports, you may contact your financial intermediary or, if you are a Fidelity customer, visit Fidelity’s website, or call Fidelity at the applicable toll-free number listed below. Your election to receive reports in paper will apply to all funds held with the fund complex/your financial intermediary.
| Account Type | Website | Phone Number |
| Brokerage, Mutual Fund, or Annuity Contracts: | fidelity.com/mailpreferences | 1-800-343-3548 |
| Employer Provided Retirement Accounts: | netbenefits.fidelity.com/preferences (choose 'no' under Required Disclosures to continue to print) | 1-800-343-0860 |
| Advisor Sold Accounts Serviced Through Your Financial Intermediary: | Contact Your Financial Intermediary | Your Financial Intermediary's phone number |
| Advisor Sold Accounts Serviced by Fidelity: | institutional.fidelity.com | 1-877-208-0098 |
Contents
|
Fidelity Asset Manager® 20% | |
|
Fidelity Asset Manager® 30% | |
|
Fidelity Asset Manager® 40% | |
|
Fidelity Asset Manager® 50% | |
|
Fidelity Asset Manager® 60% | |
|
Fidelity Asset Manager® 70% | |
|
Fidelity Asset Manager® 85% | |
To view a fund's proxy voting guidelines and proxy voting record for the 12-month period ended June 30, visit http://www.fidelity.com/proxyvotingresults or visit the Securities and Exchange Commission's (SEC) web site at http://www.sec.gov.
You may also call 1-800-544-8544 if you’re an individual investing directly with Fidelity, call 1-800-835-5092 if you’re a plan sponsor or participant with Fidelity as your recordkeeper or call 1-877-208-0098 on institutional accounts or if you’re an advisor or invest through one to request a free copy of the proxy voting guidelines.
Standard & Poor's, S&P and S&P 500 are registered service marks of The McGraw-Hill Companies, Inc. and have been licensed for use by Fidelity Distributors Corporation.
Other third-party marks appearing herein are the property of their respective owners.
All other marks appearing herein are registered or unregistered trademarks or service marks of FMR LLC or an affiliated company. © 2019 FMR LLC. All rights reserved.
This report and the financial statements contained herein are submitted for the general information of the shareholders of the Funds. This report is not authorized for distribution to prospective investors in the Funds unless preceded or accompanied by an effective prospectus.
A fund files its complete schedule of portfolio holdings with the SEC for the first and third quarters of each fiscal year on Form N-PORT. Forms N-PORT are available on the SEC’s web site at http://www.sec.gov. A fund's Forms N-PORT may be reviewed and copied at the SEC’s Public Reference Room in Washington, DC. Information regarding the operation of the SEC's Public Reference Room may be obtained by calling 1-800-SEC-0330.
For a complete list of a fund's portfolio holdings, view the most recent holdings listing, semiannual report, or annual report on Fidelity's web site at http://www.fidelity.com, http://www.institutional.fidelity.com, or http://www.401k.com, as applicable.
NOT FDIC INSURED •MAY LOSE VALUE •NO BANK GUARANTEE
Neither the Funds nor Fidelity Distributors Corporation is a bank.
Fidelity Asset Manager® 20%
Investment Summary (Unaudited)
The information in the following tables is based on the combined investments of the Fund and its pro-rata share of the investments of Fidelity's Central Funds, other than the Commodity Strategy and Money Market Central Funds.Top Five Bond Issuers as of March 31, 2019
| (with maturities greater than one year) | % of fund's net assets |
| U.S. Treasury Obligations | 17.2 |
| Fannie Mae | 4.8 |
| Ginnie Mae | 2.7 |
| Freddie Mac | 2.2 |
| Morgan Stanley | 1.0 |
| 27.9 |
Quality Diversification (% of fund's net assets)
| As of March 31, 2019 | ||
| U.S. Government and U.S. Government Agency Obligations | 26.9% | |
| AAA,AA,A | 3.5% | |
| BBB | 12.2% | |
| BB and Below | 5.3% | |
| Not Rated | 0.5% | |
| Equities* | 23.5% | |
| Short-Term Investments and Net Other Assets | 28.1% | |

* Includes investment in Fidelity® Commodity Strategy Central Fund of 0.2%
We have used ratings from Moody's Investors Service, Inc. Where Moody's® ratings are not available, we have used S&P® ratings. All ratings are as of the date indicated and do not reflect subsequent changes.
Top Five Stocks as of March 31, 2019
| % of fund's net assets | |
| Microsoft Corp. | 0.5 |
| Apple, Inc. | 0.5 |
| Amazon.com, Inc. | 0.3 |
| Alphabet, Inc. Class A | 0.2 |
| UnitedHealth Group, Inc. | 0.2 |
| 1.7 |
Top Five Market Sectors as of March 31, 2019
| % of fund's net assets | |
| Financials | 34.5 |
| Cash Equivalents | 4.8 |
| Health Care | 3.6 |
| Energy | 3.6 |
| Communication Services | 3.2 |
Asset Allocation (% of fund's net assets)
| As of March 31, 2019 | ||
| Stock Class and Equity Futures* | 23.5% | |
| Bond Class | 47.9% | |
| Short-Term Class | 28.6% | |

* Includes investment in Fidelity® Commodity Strategy Central Fund of 0.2%
Asset allocations in the pie charts reflect the categorization of assets as defined in the Fund's prospectus in effect as of the time periods indicated above. Percentages are adjusted for the effect of future contracts and swap contracts, if applicable.
At period end, foreign investments including the Fund's pro-rata share of the underlying Central Funds, other than the Commodity Strategy Central and Money Market Funds, was 9.9% of net assets.
Percentages in the above tables are adjusted for the effect of TBA Sale Commitments.
An unaudited holdings listing for the Fund, which presents direct holdings as well as the pro-rata share of any securities and other investments held indirectly through its investment in underlying Fidelity Central Funds, other than the Commodity Strategy and Money Market Central Funds, is available at fidelity.com and/or institutional.fidelity.com, as applicable.
Fidelity Asset Manager® 20%
Schedule of Investments March 31, 2019 (Unaudited)
Showing Percentage of Net Assets
| Equity Central Funds - 17.0% | |||
| Shares | Value | ||
| Fidelity Commodity Strategy Central Fund (a) | 1,839,533 | $9,124,086 | |
| Fidelity Communication Services Central Fund (a) | 256,639 | 50,126,651 | |
| Fidelity Consumer Discretionary Central Fund (a) | 191,380 | 62,759,238 | |
| Fidelity Consumer Staples Central Fund (a) | 205,668 | 40,117,514 | |
| Fidelity Emerging Markets Equity Central Fund (a) | 319,752 | 68,183,888 | |
| Fidelity Energy Central Fund (a) | 275,676 | 30,274,698 | |
| Fidelity Financials Central Fund (a) | 1,157,031 | 111,641,921 | |
| Fidelity Health Care Central Fund (a) | 214,678 | 92,049,451 | |
| Fidelity Industrials Central Fund (a) | 218,848 | 59,701,734 | |
| Fidelity Information Technology Central Fund (a) | 368,335 | 137,543,790 | |
| Fidelity International Equity Central Fund (a) | 1,606,157 | 121,955,479 | |
| Fidelity Materials Central Fund (a) | 79,890 | 16,043,570 | |
| Fidelity Real Estate Equity Central Fund (a) | 193,838 | 22,097,510 | |
| Fidelity Utilities Central Fund (a) | 110,392 | 20,621,304 | |
| TOTAL EQUITY CENTRAL FUNDS | |||
| (Cost $573,566,714) | 842,240,834 | ||
| Fixed-Income Central Funds - 49.3% | |||
| High Yield Fixed-Income Funds - 3.2% | |||
| Fidelity Emerging Markets Debt Central Fund (a) | 2,864,473 | 27,097,918 | |
| Fidelity Floating Rate Central Fund (a) | 502,473 | 50,850,312 | |
| Fidelity High Income Central Fund 1 (a) | 852,661 | 79,664,092 | |
| TOTAL HIGH YIELD FIXED-INCOME FUNDS | 157,612,322 | ||
| Investment Grade Fixed-Income Funds - 46.1% | |||
| Fidelity Inflation-Protected Bond Index Central Fund (a) | 1,991,787 | 198,999,428 | |
| Fidelity International Credit Central Fund (a) | 301,915 | 29,814,122 | |
| Fidelity Investment Grade Bond Central Fund (a) | 19,036,646 | 2,060,145,792 | |
| TOTAL INVESTMENT GRADE FIXED-INCOME FUNDS | 2,288,959,342 | ||
| TOTAL FIXED-INCOME CENTRAL FUNDS | |||
| (Cost $2,294,030,031) | 2,446,571,664 | ||
| Money Market Central Funds - 28.3% | |||
| Fidelity Cash Central Fund, 2.48% (b) | 165,665,549 | 165,698,682 | |
| Fidelity Money Market Central Fund, 2.68% (b) | 1,164,194,632 | 1,164,311,051 | |
| Fidelity Securities Lending Cash Central Fund 2.48% (b)(c) | 76,441,744 | 76,449,388 | |
| TOTAL MONEY MARKET CENTRAL FUNDS | |||
| (Cost $1,406,338,408) | 1,406,459,121 | ||
| Principal Amount | Value | ||
| U.S. Treasury Obligations - 0.1% | |||
| U.S. Treasury Bills, yield at date of purchase 2.37% to 2.42% 4/18/19 to 6/27/19 (d) | |||
| (Cost $4,756,881) | 4,770,000 | 4,756,975 | |
| Shares | Value | ||
| Investment Companies - 6.9% | |||
| iShares 20+ Year Treasury Bond ETF(e) | 698,941 | $88,374,100 | |
| iShares Core MSCI Emerging Markets ETF | 3,041,291 | 157,265,159 | |
| iShares MSCI EAFE Index ETF | 549,758 | 35,657,304 | |
| iShares MSCI Japan ETF | 1,130,346 | 61,852,533 | |
| TOTAL INVESTMENT COMPANIES | |||
| (Cost $332,384,744) | 343,149,096 | ||
| TOTAL INVESTMENT IN SECURITIES - 101.6% | |||
| (Cost $4,611,076,778) | 5,043,177,690 | ||
| NET OTHER ASSETS (LIABILITIES) - (1.6)% | (77,502,422) | ||
| NET ASSETS - 100% | $4,965,675,268 |
| Futures Contracts | |||||
| Number of contracts | Expiration Date | Notional Amount | Value | Unrealized Appreciation/(Depreciation) | |
| Sold | |||||
| Equity Index Contracts | |||||
| CME E-mini S&P 500 Index Contracts (United States) | 748 | June 2019 | $106,133,720 | $(2,883,409) | $(2,883,409) |
The notional amount of futures sold as a percentage of Net Assets is 2.1%
For the period, the average monthly notional amount at value for futures contracts in the aggregate was $84,073,767.
Security Type Abbreviations
ETF – Exchange-Traded Fund
Legend
(a) Affiliated fund that is generally available only to investment companies and other accounts managed by Fidelity Investments. A complete unaudited schedule of portfolio holdings for each Fidelity Central Fund is filed with the SEC for the first and third quarters of each fiscal year on Form N-PORT and is available upon request or at the SEC's website at www.sec.gov. An unaudited holdings listing for the Fund, which presents direct holdings as well as the pro-rata share of securities and other investments held indirectly through its investment in underlying non-money market Fidelity Central Funds, other than the Commodity Strategy Central Fund, is available at fidelity.com and/or institutional.fidelity.com, as applicable. In addition, each Fidelity Central Fund's financial statements are available on the SEC's website or upon request.
(b) Affiliated fund that is generally available only to investment companies and other accounts managed by Fidelity Investments. The rate quoted is the annualized seven-day yield of the fund at period end. A complete unaudited listing of the fund's holdings as of its most recent quarter end is available upon request. In addition, each Fidelity Central Fund's financial statements are available on the SEC's website or upon request.
(c) Investment made with cash collateral received from securities on loan.
(d) Security or a portion of the security was pledged to cover margin requirements for futures contracts. At period end, the value of securities pledged amounted to $4,756,975.
(e) Security or a portion of the security is on loan at period end.
Affiliated Central Funds
Information regarding fiscal year to date income earned by the Fund from investments in Fidelity Central Funds is as follows:
| Fund | Income earned |
| Fidelity Cash Central Fund | $2,134,527 |
| Fidelity Commodity Strategy Central Fund | 72,782 |
| Fidelity Communication Services Central Fund | 173,088 |
| Fidelity Consumer Discretionary Central Fund | 2,187,875 |
| Fidelity Consumer Staples Central Fund | 3,337,711 |
| Fidelity Emerging Markets Debt Central Fund | 815,546 |
| Fidelity Emerging Markets Equity Central Fund | 1,476,976 |
| Fidelity Energy Central Fund | 319,310 |
| Fidelity Financials Central Fund | 6,073,007 |
| Fidelity Floating Rate Central Fund | 1,501,626 |
| Fidelity Health Care Central Fund | 4,891,428 |
| Fidelity High Income Central Fund 1 | 2,490,366 |
| Fidelity Industrials Central Fund | 2,969,500 |
| Fidelity Inflation-Protected Bond Index Central Fund | 5,493,501 |
| Fidelity Information Technology Central Fund | 23,425,235 |
| Fidelity International Credit Central Fund | 1,082,072 |
| Fidelity International Equity Central Fund | 6,390,448 |
| Fidelity Investment Grade Bond Central Fund | 37,412,269 |
| Fidelity Materials Central Fund | 1,311,559 |
| Fidelity Money Market Central Fund | 14,948,274 |
| Fidelity Real Estate Equity Central Fund | 747,823 |
| Fidelity Securities Lending Cash Central Fund | 44,286 |
| Fidelity Utilities Central Fund | 1,725,294 |
| Total | $121,024,503 |
Amounts in the income column in the above table include any capital gain distributions from underlying funds, which are presented in the corresponding line-item in the Statement of Operations, if applicable.
Fiscal year to date information regarding the Fund’s investments in non-Money Market Central Funds, including the ownership percentage, is presented below.
| Fund | Value, beginning of period | Purchases(a) | Sales Proceeds(b) | Realized Gain/Loss | Change in Unrealized appreciation (depreciation) | Value, end of period | % ownership, end of period |
| Fidelity Commodity Strategy Central Fund | $-- | $10,220,647 | $364,426 | $(8,084) | $(724,051) | $9,124,086 | 3.5% |
| Fidelity Communication Services Central Fund | 13,740,335 | 35,967,124 | 2,553,697 | 34,101 | 2,938,788 | 50,126,651 | 3.1% |
| Fidelity Consumer Discretionary Central Fund | 78,963,339 | 6,074,980 | 17,527,583 | 409,102 | (5,160,600) | 62,759,238 | 3.3% |
| Fidelity Consumer Staples Central Fund | 41,905,713 | 4,701,836 | 5,169,911 | (365,582) | (954,542) | 40,117,514 | 3.1% |
| Fidelity Emerging Markets Debt Central Fund | 26,523,183 | 1,701,596 | 1,279,435 | 3,675 | 148,899 | 27,097,918 | 18.5% |
| Fidelity Emerging Markets Equity Central Fund | 20,179,028 | 53,332,991 | 5,947,444 | 170,561 | 448,752 | 68,183,888 | 6.4% |
| Fidelity Energy Central Fund | 41,080,792 | 1,558,503 | 4,938,323 | (565,981) | (6,860,293) | 30,274,698 | 3.2% |
| Fidelity Financials Central Fund | 126,873,901 | 10,178,687 | 16,403,160 | (904,850) | (8,102,657) | 111,641,921 | 3.4% |
| Fidelity Floating Rate Central Fund | 51,153,323 | 3,273,663 | 2,558,867 | 19,736 | (1,037,543) | 50,850,312 | 2.5% |
| Fidelity Health Care Central Fund | 109,351,344 | 8,206,947 | 14,571,378 | 723,632 | (11,661,094) | 92,049,451 | 3.2% |
| Fidelity High Income Central Fund 1 | 75,066,797 | 9,239,909 | 4,019,346 | (13,187) | (610,081) | 79,664,092 | 15.8% |
| Fidelity Industrials Central Fund | 70,743,549 | 5,189,899 | 9,001,992 | (235,214) | (6,994,508) | 59,701,734 | 3.3% |
| Fidelity Inflation-Protected Bond Index Central Fund | 206,124,407 | 12,941,989 | 19,568,662 | (183,524) | (314,782) | 198,999,428 | 16.8% |
| Fidelity Information Technology Central Fund | 190,356,674 | 32,428,058 | 46,765,313 | (2,791,732) | (35,683,897) | 137,543,790 | 3.2% |
| Fidelity International Credit Central Fund | 28,987,776 | 2,145,324 | 1,535,454 | (18,794) | 235,270 | 29,814,122 | 16.6% |
| Fidelity International Equity Central Fund | 132,076,285 | 14,914,516 | 12,477,440 | 219,527 | (12,777,409) | 121,955,479 | 5.0% |
| Fidelity Investment Grade Bond Central Fund | 2,069,713,719 | 110,437,619 | 176,442,366 | 2,052,382 | 54,384,438 | 2,060,145,792 | 26.4% |
| Fidelity Materials Central Fund | 18,945,269 | 1,941,883 | 2,300,563 | (398,946) | (2,144,073) | 16,043,570 | 3.4% |
| Fidelity Real Estate Equity Central Fund | 20,759,325 | 1,456,556 | 1,023,534 | 18,190 | 886,973 | 22,097,510 | 16.4% |
| Fidelity Utilities Central Fund | 21,377,685 | 2,428,502 | 2,979,305 | 164,791 | (370,369) | 20,621,304 | 3.3% |
| Total | $3,343,922,444 | $328,341,229 | $347,428,199 | $(1,670,197) | $(34,352,779) | $3,288,812,498 |
(a) Includes the value of shares purchased through in-kind transactions, if applicable.
(b) Includes the value of shares redeemed through in-kind transactions, if applicable.
Investment Valuation
The following is a summary of the inputs used, as of March 31, 2019, involving the Fund's assets and liabilities carried at fair value. The inputs or methodology used for valuing securities may not be an indication of the risk associated with investing in those securities. For more information on valuation inputs, and their aggregation into the levels used below, please refer to the Investment Valuation section in the accompanying Notes to Financial Statements.
| Valuation Inputs at Reporting Date: | ||||
| Description | Total | Level 1 | Level 2 | Level 3 |
| Investments in Securities: | ||||
| Equity Central Funds | $842,240,834 | $842,240,834 | $-- | $-- |
| Fixed-Income Central Funds | 2,446,571,664 | 2,446,571,664 | -- | -- |
| Money Market Central Funds | 1,406,459,121 | 1,406,459,121 | -- | -- |
| Other Short-Term Investments | 4,756,975 | -- | 4,756,975 | -- |
| Investment Companies | 343,149,096 | 343,149,096 | -- | -- |
| Total Investments in Securities: | $5,043,177,690 | $5,038,420,715 | $4,756,975 | $-- |
| Derivative Instruments: | ||||
| Liabilities | ||||
| Futures Contracts | $(2,883,409) | $(2,883,409) | $-- | $-- |
| Total Liabilities | $(2,883,409) | $(2,883,409) | $-- | $-- |
| Total Derivative Instruments: | $(2,883,409) | $(2,883,409) | $-- | $-- |
Value of Derivative Instruments
The following table is a summary of the Fund's value of derivative instruments by primary risk exposure as of March 31, 2019. For additional information on derivative instruments, please refer to the Derivative Instruments section in the accompanying Notes to Financial Statements.
| Primary Risk Exposure / Derivative Type | Value | |
| Asset | Liability | |
| Equity Risk | ||
| Futures Contracts(a) | $0 | $(2,883,409) |
| Total Equity Risk | 0 | (2,883,409) |
| Total Value of Derivatives | $0 | $(2,883,409) |
(a) Reflects gross cumulative appreciation (depreciation) on futures contracts as presented in the Schedule of Investments. In the Statement of Assets and Liabilities, the period end daily variation margin is included in receivable or payable for daily variation margin on futures contracts, and the net cumulative appreciation (depreciation) is included in distributable earnings.
See accompanying notes which are an integral part of the financial statements.
Fidelity Asset Manager® 20%
Financial Statements
Statement of Assets and Liabilities
| March 31, 2019 (Unaudited) | ||
| Assets | ||
| Investment in securities, at value (including securities loaned of $74,841,480) — See accompanying schedule: Unaffiliated issuers (cost $337,141,625) | $347,906,071 | |
| Fidelity Central Funds (cost $4,273,935,153) | 4,695,271,619 | |
| Total Investment in Securities (cost $4,611,076,778) | $5,043,177,690 | |
| Receivable for investments sold | 2,330,579 | |
| Receivable for fund shares sold | 2,273,873 | |
| Distributions receivable from Fidelity Central Funds | 394,006 | |
| Prepaid expenses | 3,588 | |
| Other receivables | 16,534 | |
| Total assets | 5,048,196,270 | |
| Liabilities | ||
| Payable for fund shares redeemed | $3,269,190 | |
| Accrued management fee | 1,663,727 | |
| Distribution and service plan fees payable | 39,325 | |
| Payable for daily variation margin on futures contracts | 628,320 | |
| Other affiliated payables | 427,428 | |
| Other payables and accrued expenses | 43,624 | |
| Collateral on securities loaned | 76,449,388 | |
| Total liabilities | 82,521,002 | |
| Net Assets | $4,965,675,268 | |
| Net Assets consist of: | ||
| Paid in capital | $4,761,200,957 | |
| Total distributable earnings (loss) | 204,474,311 | |
| Net Assets | $4,965,675,268 | |
| Net Asset Value and Maximum Offering Price | ||
| Class A: | ||
| Net Asset Value and redemption price per share ($43,966,992 ÷ 3,333,875 shares) | $13.19 | |
| Maximum offering price per share (100/94.25 of $13.19) | $13.99 | |
| Class M: | ||
| Net Asset Value and redemption price per share ($25,066,305 ÷ 1,904,933 shares) | $13.16 | |
| Maximum offering price per share (100/96.50 of $13.16) | $13.64 | |
| Class C: | ||
| Net Asset Value and offering price per share ($22,145,845 ÷ 1,689,785 shares)(a) | $13.11 | |
| Asset Manager 20%: | ||
| Net Asset Value, offering price and redemption price per share ($4,813,607,163 ÷ 364,393,734 shares) | $13.21 | |
| Class I: | ||
| Net Asset Value, offering price and redemption price per share ($58,588,886 ÷ 4,437,384 shares) | $13.20 | |
| Class Z: | ||
| Net Asset Value, offering price and redemption price per share ($2,300,077 ÷ 174,177 shares) | $13.21 |
(a) Redemption price per share is equal to net asset value less any applicable contingent deferred sales charge.
See accompanying notes which are an integral part of the financial statements.
Statement of Operations
| Six months ended March 31, 2019 (Unaudited) | ||
| Investment Income | ||
| Dividends | $4,033,520 | |
| Interest | 57,192 | |
| Income from Fidelity Central Funds | 66,065,080 | |
| Total income | 70,155,792 | |
| Expenses | ||
| Management fee | $9,843,857 | |
| Transfer agent fees | 1,966,137 | |
| Distribution and service plan fees | 230,290 | |
| Accounting and security lending fees | 586,069 | |
| Custodian fees and expenses | 3,847 | |
| Independent trustees' fees and expenses | 11,141 | |
| Registration fees | 98,515 | |
| Audit | 16,715 | |
| Legal | 4,705 | |
| Miscellaneous | 16,825 | |
| Total expenses before reductions | 12,778,101 | |
| Expense reductions | (68,854) | |
| Total expenses after reductions | 12,709,247 | |
| Net investment income (loss) | 57,446,545 | |
| Realized and Unrealized Gain (Loss) | ||
| Net realized gain (loss) on: | ||
| Investment securities: | ||
| Unaffiliated issuers | (1,412,109) | |
| Fidelity Central Funds | (1,671,559) | |
| Futures contracts | 5,099,674 | |
| Capital gain distributions from Fidelity Central Funds | 54,959,423 | |
| Total net realized gain (loss) | 56,975,429 | |
| Change in net unrealized appreciation (depreciation) on: | ||
| Investment securities: | ||
| Unaffiliated issuers | (3,040,687) | |
| Fidelity Central Funds | (34,350,062) | |
| Futures contracts | (963,433) | |
| Total change in net unrealized appreciation (depreciation) | (38,354,182) | |
| Net gain (loss) | 18,621,247 | |
| Net increase (decrease) in net assets resulting from operations | $76,067,792 |
See accompanying notes which are an integral part of the financial statements.
Statement of Changes in Net Assets
| Six months ended March 31, 2019 (Unaudited) | Year ended September 30, 2018 | |
| Increase (Decrease) in Net Assets | ||
| Operations | ||
| Net investment income (loss) | $57,446,545 | $90,059,063 |
| Net realized gain (loss) | 56,975,429 | 104,229,334 |
| Change in net unrealized appreciation (depreciation) | (38,354,182) | (64,059,608) |
| Net increase (decrease) in net assets resulting from operations | 76,067,792 | 130,228,789 |
| Distributions to shareholders | (148,341,300) | – |
| Distributions to shareholders from net investment income | – | (86,728,993) |
| Distributions to shareholders from net realized gain | – | (100,823,387) |
| Total distributions | (148,341,300) | (187,552,380) |
| Share transactions - net increase (decrease) | 82,342,007 | (8,653,347) |
| Total increase (decrease) in net assets | 10,068,499 | (65,976,938) |
| Net Assets | ||
| Beginning of period | 4,955,606,769 | 5,021,583,707 |
| End of period | $4,965,675,268 | $4,955,606,769 |
| Other Information | ||
| Undistributed net investment income end of period | $10,723,768 |
See accompanying notes which are an integral part of the financial statements.
Financial Highlights
Fidelity Asset Manager 20% Class A
| Six months ended (Unaudited) March 31, | Years endedSeptember 30, | |||||
| 2019 | 2018 | 2017 | 2016 | 2015 | 2014 | |
| Selected Per–Share Data | ||||||
| Net asset value, beginning of period | $13.40 | $13.55 | $13.24 | $12.93 | $13.56 | $13.42 |
| Income from Investment Operations | ||||||
| Net investment income (loss)A | .13 | .20 | .16 | .19 | .18 | .16 |
| Net realized and unrealized gain (loss) | .04 | .11 | .37 | .59 | (.22) | .44 |
| Total from investment operations | .17 | .31 | .53 | .78 | (.04) | .60 |
| Distributions from net investment income | (.14) | (.19) | (.16) | (.20) | (.17) | (.15) |
| Distributions from net realized gain | (.24) | (.27) | (.07) | (.27) | (.42) | (.30) |
| Total distributions | (.38) | (.46) | (.22)B | (.47) | (.59) | (.46)C |
| Net asset value, end of period | $13.19 | $13.40 | $13.55 | $13.24 | $12.93 | $13.56 |
| Total ReturnD,E,F | 1.40% | 2.36% | 4.08% | 6.18% | (.33)% | 4.54% |
| Ratios to Average Net AssetsG,H | ||||||
| Expenses before reductions | .83%I | .84% | .84% | .83% | .83% | .82% |
| Expenses net of fee waivers, if any | .83%I | .84% | .84% | .83% | .83% | .82% |
| Expenses net of all reductions | .83%I | .84% | .83% | .83% | .83% | .82% |
| Net investment income (loss) | 2.06%I | 1.49% | 1.21% | 1.47% | 1.32% | 1.16% |
| Supplemental Data | ||||||
| Net assets, end of period (000 omitted) | $43,967 | $39,089 | $39,787 | $42,221 | $38,841 | $38,733 |
| Portfolio turnover rateJ | 42%I | 24% | 22% | 19% | 20% | 13% |
A Calculated based on average shares outstanding during the period.
B Total distributions of $.22 per share is comprised of distributions from net investment income of $.157 and distributions from net realized gain of $.065 per share.
C Total distributions of $.46 per share is comprised of distributions from net investment income of $.154 and distributions from net realized gain of $.302 per share.
D Total returns for periods of less than one year are not annualized.
E Total returns would have been lower if certain expenses had not been reduced during the applicable periods shown.
F Total returns do not include the effect of the sales charges.
G Fees and expenses of any underlying Fidelity Central Funds are not included in the Fund's expense ratio. The Fund indirectly bears its proportionate share of the expenses of any underlying Fidelity Central Funds. Based on their most recent shareholder report date, the expenses ranged from less than .005% to .07%.
H Expense ratios reflect operating expenses of the class. Expenses before reductions do not reflect amounts reimbursed by the investment adviser or reductions from brokerage service arrangements or reductions from other expense offset arrangements and do not represent the amount paid by the class during periods when reimbursements or reductions occur. Expenses net of fee waivers reflect expenses after reimbursement by the investment adviser but prior to reductions from brokerage service arrangements or other expense offset arrangements. Expenses net of all reductions represent the net expenses paid by the class.
I Annualized
J Amount does not include the portfolio activity of any underlying Fidelity Central Funds.
See accompanying notes which are an integral part of the financial statements.
Fidelity Asset Manager 20% Class M
| Six months ended (Unaudited) March 31, | Years endedSeptember 30, | |||||
| 2019 | 2018 | 2017 | 2016 | 2015 | 2014 | |
| Selected Per–Share Data | ||||||
| Net asset value, beginning of period | $13.37 | $13.52 | $13.21 | $12.90 | $13.53 | $13.40 |
| Income from Investment Operations | ||||||
| Net investment income (loss)A | .12 | .16 | .13 | .16 | .14 | .12 |
| Net realized and unrealized gain (loss) | .03 | .12 | .37 | .58 | (.21) | .43 |
| Total from investment operations | .15 | .28 | .50 | .74 | (.07) | .55 |
| Distributions from net investment income | (.12) | (.16) | (.12) | (.17) | (.14) | (.12) |
| Distributions from net realized gain | (.24) | (.27) | (.07) | (.27) | (.42) | (.30) |
| Total distributions | (.36) | (.43) | (.19) | (.43)B | (.56) | (.42) |
| Net asset value, end of period | $13.16 | $13.37 | $13.52 | $13.21 | $12.90 | $13.53 |
| Total ReturnC,D,E | 1.26% | 2.10% | 3.81% | 5.93% | (.59)% | 4.20% |
| Ratios to Average Net AssetsF,G | ||||||
| Expenses before reductions | 1.09%H | 1.10% | 1.10% | 1.09% | 1.10% | 1.10% |
| Expenses net of fee waivers, if any | 1.09%H | 1.10% | 1.10% | 1.09% | 1.10% | 1.10% |
| Expenses net of all reductions | 1.08%H | 1.10% | 1.10% | 1.09% | 1.10% | 1.09% |
| Net investment income (loss) | 1.80%H | 1.23% | .95% | 1.21% | 1.06% | .89% |
| Supplemental Data | ||||||
| Net assets, end of period (000 omitted) | $25,066 | $22,133 | $22,474 | $25,052 | $19,162 | $21,010 |
| Portfolio turnover rateI | 42%H | 24% | 22% | 19% | 20% | 13% |
A Calculated based on average shares outstanding during the period.
B Total distributions of $.43 per share is comprised of distributions from net investment income of $.165 and distributions from net realized gain of $.269 per share.
C Total returns for periods of less than one year are not annualized.
D Total returns would have been lower if certain expenses had not been reduced during the applicable periods shown.
E Total returns do not include the effect of the sales charges.
F Fees and expenses of any underlying Fidelity Central Funds are not included in the Fund's expense ratio. The Fund indirectly bears its proportionate share of the expenses of any underlying Fidelity Central Funds. Based on their most recent shareholder report date, the expenses ranged from less than .005% to .07%.
G Expense ratios reflect operating expenses of the class. Expenses before reductions do not reflect amounts reimbursed by the investment adviser or reductions from brokerage service arrangements or reductions from other expense offset arrangements and do not represent the amount paid by the class during periods when reimbursements or reductions occur. Expenses net of fee waivers reflect expenses after reimbursement by the investment adviser but prior to reductions from brokerage service arrangements or other expense offset arrangements. Expenses net of all reductions represent the net expenses paid by the class.
H Annualized
I Amount does not include the portfolio activity of any underlying Fidelity Central Funds.
See accompanying notes which are an integral part of the financial statements.
Fidelity Asset Manager 20% Class C
| Six months ended (Unaudited) March 31, | Years endedSeptember 30, | |||||
| 2019 | 2018 | 2017 | 2016 | 2015 | 2014 | |
| Selected Per–Share Data | ||||||
| Net asset value, beginning of period | $13.32 | $13.47 | $13.17 | $12.85 | $13.48 | $13.35 |
| Income from Investment Operations | ||||||
| Net investment income (loss)A | .08 | .10 | .06 | .09 | .07 | .05 |
| Net realized and unrealized gain (loss) | .04 | .11 | .36 | .60 | (.21) | .43 |
| Total from investment operations | .12 | .21 | .42 | .69 | (.14) | .48 |
| Distributions from net investment income | (.09) | (.09) | (.06) | (.10) | (.07) | (.05) |
| Distributions from net realized gain | (.24) | (.27) | (.07) | (.27) | (.42) | (.30) |
| Total distributions | (.33) | (.36) | (.12)B | (.37) | (.49) | (.35) |
| Net asset value, end of period | $13.11 | $13.32 | $13.47 | $13.17 | $12.85 | $13.48 |
| Total ReturnC,D,E | 1.01% | 1.59% | 3.25% | 5.49% | (1.09)% | 3.70% |
| Ratios to Average Net AssetsF,G | ||||||
| Expenses before reductions | 1.59%H | 1.59% | 1.59% | 1.59% | 1.60% | 1.60% |
| Expenses net of fee waivers, if any | 1.59%H | 1.59% | 1.59% | 1.59% | 1.60% | 1.60% |
| Expenses net of all reductions | 1.59%H | 1.59% | 1.59% | 1.59% | 1.60% | 1.60% |
| Net investment income (loss) | 1.30%H | .74% | .45% | .71% | .56% | .39% |
| Supplemental Data | ||||||
| Net assets, end of period (000 omitted) | $22,146 | $26,000 | $28,217 | $29,337 | $28,515 | $26,225 |
| Portfolio turnover rateI | 42%H | 24% | 22% | 19% | 20% | 13% |
A Calculated based on average shares outstanding during the period.
B Total distributions of $.12 per share is comprised of distributions from net investment income of $.058 and distributions from net realized gain of $.065 per share.
C Total returns for periods of less than one year are not annualized.
D Total returns would have been lower if certain expenses had not been reduced during the applicable periods shown.
E Total returns do not include the effect of the contingent deferred sales charge.
F Fees and expenses of any underlying Fidelity Central Funds are not included in the Fund's expense ratio. The Fund indirectly bears its proportionate share of the expenses of any underlying Fidelity Central Funds. Based on their most recent shareholder report date, the expenses ranged from less than .005% to .07%.
G Expense ratios reflect operating expenses of the class. Expenses before reductions do not reflect amounts reimbursed by the investment adviser or reductions from brokerage service arrangements or reductions from other expense offset arrangements and do not represent the amount paid by the class during periods when reimbursements or reductions occur. Expenses net of fee waivers reflect expenses after reimbursement by the investment adviser but prior to reductions from brokerage service arrangements or other expense offset arrangements. Expenses net of all reductions represent the net expenses paid by the class.
H Annualized
I Amount does not include the portfolio activity of any underlying Fidelity Central Funds.
See accompanying notes which are an integral part of the financial statements.
Fidelity Asset Manager 20%
| Six months ended (Unaudited) March 31, | Years endedSeptember 30, | |||||
| 2019 | 2018 | 2017 | 2016 | 2015 | 2014 | |
| Selected Per–Share Data | ||||||
| Net asset value, beginning of period | $13.42 | $13.57 | $13.26 | $12.94 | $13.57 | $13.44 |
| Income from Investment Operations | ||||||
| Net investment income (loss)A | .15 | .24 | .20 | .23 | .22 | .20 |
| Net realized and unrealized gain (loss) | .04 | .12 | .37 | .60 | (.22) | .43 |
| Total from investment operations | .19 | .36 | .57 | .83 | – | .63 |
| Distributions from net investment income | (.16) | (.24) | (.20) | (.24) | (.21) | (.20) |
| Distributions from net realized gain | (.24) | (.27) | (.07) | (.27) | (.42) | (.30) |
| Total distributions | (.40) | (.51) | (.26)B | (.51) | (.63) | (.50) |
| Net asset value, end of period | $13.21 | $13.42 | $13.57 | $13.26 | $12.94 | $13.57 |
| Total ReturnC,D | 1.56% | 2.68% | 4.40% | 6.58% | (.04)% | 4.80% |
| Ratios to Average Net AssetsE,F | ||||||
| Expenses before reductions | .51%G | .52% | .52% | .52% | .53% | .53% |
| Expenses net of fee waivers, if any | .51%G | .52% | .52% | .52% | .53% | .53% |
| Expenses net of all reductions | .51%G | .51% | .52% | .52% | .52% | .52% |
| Net investment income (loss) | 2.38%G | 1.81% | 1.52% | 1.78% | 1.63% | 1.46% |
| Supplemental Data | ||||||
| Net assets, end of period (000 omitted) | $4,813,607 | $4,819,671 | $4,880,833 | $4,802,797 | $4,685,019 | $4,923,702 |
| Portfolio turnover rateH | 42%G | 24% | 22% | 19% | 20% | 13% |
A Calculated based on average shares outstanding during the period.
B Total distributions of $.26 per share is comprised of distributions from net investment income of $.199 and distributions from net realized gain of $.065 per share.
C Total returns for periods of less than one year are not annualized.
D Total returns would have been lower if certain expenses had not been reduced during the applicable periods shown.
E Fees and expenses of any underlying Fidelity Central Funds are not included in the Fund's expense ratio. The Fund indirectly bears its proportionate share of the expenses of any underlying Fidelity Central Funds. Based on their most recent shareholder report date, the expenses ranged from less than .005% to .07%.
F Expense ratios reflect operating expenses of the class. Expenses before reductions do not reflect amounts reimbursed by the investment adviser or reductions from brokerage service arrangements or reductions from other expense offset arrangements and do not represent the amount paid by the class during periods when reimbursements or reductions occur. Expenses net of fee waivers reflect expenses after reimbursement by the investment adviser but prior to reductions from brokerage service arrangements or other expense offset arrangements. Expenses net of all reductions represent the net expenses paid by the class.
G Annualized
H Amount does not include the portfolio activity of any underlying Fidelity Central Funds.
See accompanying notes which are an integral part of the financial statements.
Fidelity Asset Manager 20% Class I
| Six months ended (Unaudited) March 31, | Years endedSeptember 30, | |||||
| 2019 | 2018 | 2017 | 2016 | 2015 | 2014 | |
| Selected Per–Share Data | ||||||
| Net asset value, beginning of period | $13.41 | $13.57 | $13.26 | $12.94 | $13.57 | $13.44 |
| Income from Investment Operations | ||||||
| Net investment income (loss)A | .15 | .24 | .20 | .22 | .21 | .19 |
| Net realized and unrealized gain (loss) | .04 | .10 | .37 | .60 | (.21) | .43 |
| Total from investment operations | .19 | .34 | .57 | .82 | – | .62 |
| Distributions from net investment income | (.16) | (.23) | (.19) | (.24) | (.21) | (.19) |
| Distributions from net realized gain | (.24) | (.27) | (.07) | (.27) | (.42) | (.30) |
| Total distributions | (.40) | (.50) | (.26) | (.50)B | (.63) | (.49) |
| Net asset value, end of period | $13.20 | $13.41 | $13.57 | $13.26 | $12.94 | $13.57 |
| Total ReturnC,D | 1.53% | 2.57% | 4.35% | 6.56% | (.08)% | 4.74% |
| Ratios to Average Net AssetsE,F | ||||||
| Expenses before reductions | .56%G | .55% | .56% | .57% | .57% | .56% |
| Expenses net of fee waivers, if any | .56%G | .55% | .56% | .57% | .57% | .56% |
| Expenses net of all reductions | .56%G | .55% | .56% | .57% | .57% | .56% |
| Net investment income (loss) | 2.33%G | 1.78% | 1.48% | 1.73% | 1.59% | 1.42% |
| Supplemental Data | ||||||
| Net assets, end of period (000 omitted) | $58,589 | $48,713 | $50,272 | $27,315 | $16,388 | $14,204 |
| Portfolio turnover rateH | 42%G | 24% | 22% | 19% | 20% | 13% |
A Calculated based on average shares outstanding during the period.
B Total distributions of $.50 per share is comprised of distributions from net investment income of $.235 and distributions from net realized gain of $.269 per share.
C Total returns for periods of less than one year are not annualized.
D Total returns would have been lower if certain expenses had not been reduced during the applicable periods shown.
E Fees and expenses of any underlying Fidelity Central Funds are not included in the Fund's expense ratio. The Fund indirectly bears its proportionate share of the expenses of any underlying Fidelity Central Funds. Based on their most recent shareholder report date, the expenses ranged from less than .005% to .07%.
F Expense ratios reflect operating expenses of the class. Expenses before reductions do not reflect amounts reimbursed by the investment adviser or reductions from brokerage service arrangements or reductions from other expense offset arrangements and do not represent the amount paid by the class during periods when reimbursements or reductions occur. Expenses net of fee waivers reflect expenses after reimbursement by the investment adviser but prior to reductions from brokerage service arrangements or other expense offset arrangements. Expenses net of all reductions represent the net expenses paid by the class.
G Annualized
H Amount does not include the portfolio activity of any underlying Fidelity Central Funds.
See accompanying notes which are an integral part of the financial statements.
Fidelity Asset Manager 20% Class Z
| Six months ended (Unaudited) March 31, | |
| 2019 A | |
| Selected Per–Share Data | |
| Net asset value, beginning of period | $13.41 |
| Income from Investment Operations | |
| Net investment income (loss)B | .15 |
| Net realized and unrealized gain (loss) | .06 |
| Total from investment operations | .21 |
| Distributions from net investment income | (.16) |
| Distributions from net realized gain | (.24) |
| Total distributions | (.41)C |
| Net asset value, end of period | $13.21 |
| Total ReturnD,E | 1.66% |
| Ratios to Average Net AssetsF,G | |
| Expenses before reductions | .49%H |
| Expenses net of fee waivers, if any | .48%H |
| Expenses net of all reductions | .48%H |
| Net investment income (loss) | 2.40%H |
| Supplemental Data | |
| Net assets, end of period (000 omitted) | $2,300 |
| Portfolio turnover rateI | 42%H |
A For the period October 2, 2018 (commencement of sale of shares) to March 31, 2019.
B Calculated based on average shares outstanding during the period.
C Total distributions of $.41 per share is comprised of distributions from net investment income of $.161 and distributions from net realized gain of $.244 per share.
D Total returns for periods of less than one year are not annualized.
E Total returns would have been lower if certain expenses had not been reduced during the applicable periods shown.
F Fees and expenses of any underlying Fidelity Central Funds are not included in the Fund's expense ratio. The Fund indirectly bears its proportionate share of the expenses of any underlying Fidelity Central Funds. Based on their most recent shareholder report date, the expenses ranged from less than .005% to .07%.
G Expense ratios reflect operating expenses of the class. Expenses before reductions do not reflect amounts reimbursed by the investment adviser or reductions from brokerage service arrangements or reductions from other expense offset arrangements and do not represent the amount paid by the class during periods when reimbursements or reductions occur. Expense ratios before reductions for start-up periods may not be representative of longer-term operating periods. Expenses net of fee waivers reflect expenses after reimbursement by the investment adviser but prior to reductions from brokerage service arrangements or other expense offset arrangements. Expenses net of all reductions represent the net expenses paid by the class.
H Annualized
I Amount does not include the portfolio activity of any underlying Fidelity Central Funds.
See accompanying notes which are an integral part of the financial statements.
Fidelity Asset Manager® 30%
Investment Summary (Unaudited)
The information in the following tables is based on the combined investments of the Fund and its pro-rata share of the investments of Fidelity's Central Funds, other than the Commodity Strategy and Money Market Central Funds.Top Five Bond Issuers as of March 31, 2019
| (with maturities greater than one year) | % of fund's net assets |
| U.S. Treasury Obligations | 17.1 |
| Fannie Mae | 4.8 |
| Ginnie Mae | 2.7 |
| Freddie Mac | 2.2 |
| Morgan Stanley | 1.0 |
| 27.8 |
Quality Diversification (% of fund's net assets)
| As of March 31, 2019 | ||
| U.S. Government and U.S. Government Agency Obligations | 26.8% | |
| AAA,AA,A | 3.5% | |
| BBB | 12.0% | |
| BB and Below | 5.3% | |
| Not Rated | 0.5% | |
| Equities* | 34.0% | |
| Short-Term Investments and Net Other Assets | 17.9% | |

* Includes investment in Fidelity® Commodity Strategy Central Fund of 0.3%
We have used ratings from Moody's Investors Service, Inc. Where Moody's® ratings are not available, we have used S&P® ratings. All ratings are as of the date indicated and do not reflect subsequent changes.
Top Five Stocks as of March 31, 2019
| % of fund's net assets | |
| Microsoft Corp. | 0.8 |
| Apple, Inc. | 0.8 |
| Amazon.com, Inc. | 0.5 |
| Alphabet, Inc. Class A | 0.4 |
| UnitedHealth Group, Inc. | 0.2 |
| 2.7 |
Top Five Market Sectors as of March 31, 2019
| % of fund's net assets | |
| Financials | 25.4 |
| Cash Equivalents | 5.6 |
| Information Technology | 4.7 |
| Health Care | 4.7 |
| Communication Services | 4.0 |
Asset Allocation (% of fund's net assets)
| As of March 31, 2019 | ||
| Stock Class and Equity Futures* | 33.8% | |
| Bond Class | 47.6% | |
| Short-Term Class | 18.6% | |

* Includes investment in Fidelity® Commodity Strategy Central Fund of 0.3%
Asset allocations in the pie charts reflect the categorization of assets as defined in the Fund's prospectus in effect as of the time periods indicated above. Percentages are adjusted for the effect of future contracts and swap contracts, if applicable.
At period end, foreign investments including the Fund's pro-rata share of the underlying Central Funds, other than the Commodity Strategy Central and Money Market Funds, was 13.2% of net assets.
Percentages in the above tables are adjusted for the effect of TBA Sale Commitments.
An unaudited holdings listing for the Fund, which presents direct holdings as well as the pro-rata share of any securities and other investments held indirectly through its investment in underlying Fidelity Central Funds, other than the Commodity Strategy and Money Market Central Funds, is available at fidelity.com and/or institutional.fidelity.com, as applicable.
Fidelity Asset Manager® 30%
Schedule of Investments March 31, 2019 (Unaudited)
Showing Percentage of Net Assets
| Equity Central Funds - 27.0% | |||
| Shares | Value | ||
| Fidelity Commodity Strategy Central Fund (a) | 886,102 | $4,395,066 | |
| Fidelity Communication Services Central Fund (a) | 131,051 | 25,596,855 | |
| Fidelity Consumer Discretionary Central Fund (a) | 97,059 | 31,828,582 | |
| Fidelity Consumer Staples Central Fund (a) | 104,242 | 20,333,383 | |
| Fidelity Emerging Markets Equity Central Fund (a) | 158,093 | 33,711,721 | |
| Fidelity Energy Central Fund (a) | 139,105 | 15,276,533 | |
| Fidelity Financials Central Fund (a) | 585,895 | 56,532,980 | |
| Fidelity Health Care Central Fund (a) | 108,557 | 46,547,030 | |
| Fidelity Industrials Central Fund (a) | 111,125 | 30,314,931 | |
| Fidelity Information Technology Central Fund (a) | 186,578 | 69,671,774 | |
| Fidelity International Equity Central Fund (a) | 944,714 | 71,732,111 | |
| Fidelity Materials Central Fund (a) | 40,651 | 8,163,612 | |
| Fidelity Real Estate Equity Central Fund (a) | 63,697 | 7,261,473 | |
| Fidelity Utilities Central Fund (a) | 56,371 | 10,530,109 | |
| TOTAL EQUITY CENTRAL FUNDS | |||
| (Cost $346,210,330) | 431,896,160 | ||
| Fixed-Income Central Funds - 48.9% | |||
| High Yield Fixed-Income Funds - 3.1% | |||
| Fidelity Emerging Markets Debt Central Fund (a) | 868,639 | 8,217,327 | |
| Fidelity Floating Rate Central Fund (a) | 159,101 | 16,101,014 | |
| Fidelity High Income Central Fund 1 (a) | 276,121 | 25,798,026 | |
| TOTAL HIGH YIELD FIXED-INCOME FUNDS | 50,116,367 | ||
| Investment Grade Fixed-Income Funds - 45.8% | |||
| Fidelity Inflation-Protected Bond Index Central Fund (a) | 642,116 | 64,153,833 | |
| Fidelity International Credit Central Fund (a) | 97,820 | 9,659,682 | |
| Fidelity Investment Grade Bond Central Fund (a) | 6,097,207 | 659,839,712 | |
| TOTAL INVESTMENT GRADE FIXED-INCOME FUNDS | 733,653,227 | ||
| TOTAL FIXED-INCOME CENTRAL FUNDS | |||
| (Cost $766,042,075) | 783,769,594 | ||
| Money Market Central Funds - 18.2% | |||
| Fidelity Cash Central Fund, 2.48% (b) | 63,031,050 | 63,043,656 | |
| Fidelity Money Market Central Fund, 2.68% (b) | 202,058,469 | 202,078,675 | |
| Fidelity Securities Lending Cash Central Fund 2.48% (b)(c) | 25,572,878 | 25,575,435 | |
| TOTAL MONEY MARKET CENTRAL FUNDS | |||
| (Cost $290,683,286) | 290,697,766 | ||
| Principal Amount | Value | ||
| U.S. Treasury Obligations - 0.1% | |||
| U.S. Treasury Bills, yield at date of purchase 2.37% to 2.42% 4/18/19 to 6/27/19 (d) | |||
| (Cost $2,103,992) | 2,110,000 | 2,104,035 | |
| Shares | Value | ||
| Investment Companies - 7.4% | |||
| iShares 20+ Year Treasury Bond ETF (e) | 209,515 | $26,491,077 | |
| iShares Core MSCI Emerging Markets ETF | 992,814 | 51,338,413 | |
| iShares MSCI EAFE Index ETF | 261,295 | 16,947,594 | |
| iShares MSCI Japan ETF | 446,360 | 24,424,819 | |
| TOTAL INVESTMENT COMPANIES | |||
| (Cost $115,466,575) | 119,201,903 | ||
| TOTAL INVESTMENT IN SECURITIES - 101.6% | |||
| (Cost $1,520,506,258) | 1,627,669,458 | ||
| NET OTHER ASSETS (LIABILITIES) - (1.6)% | (25,895,121) | ||
| NET ASSETS - 100% | $1,601,774,337 |
| Futures Contracts | |||||
| Number of contracts | Expiration Date | Notional Amount | Value | Unrealized Appreciation/(Depreciation) | |
| Sold | |||||
| Equity Index Contracts | |||||
| CME E-mini S&P 500 Index Contracts (United States) | 301 | June 2019 | $42,708,890 | $(1,157,758) | $(1,157,758) |
The notional amount of futures sold as a percentage of Net Assets is 2.7%
For the period, the average monthly notional amount at value for futures contracts in the aggregate was $30,535,601.
Security Type Abbreviations
ETF – Exchange-Traded Fund
Legend
(a) Affiliated fund that is generally available only to investment companies and other accounts managed by Fidelity Investments. A complete unaudited schedule of portfolio holdings for each Fidelity Central Fund is filed with the SEC for the first and third quarters of each fiscal year on Form N-PORT and is available upon request or at the SEC's website at www.sec.gov. An unaudited holdings listing for the Fund, which presents direct holdings as well as the pro-rata share of securities and other investments held indirectly through its investment in underlying non-money market Fidelity Central Funds, other than the Commodity Strategy Central Fund, is available at fidelity.com and/or institutional.fidelity.com, as applicable. In addition, each Fidelity Central Fund's financial statements are available on the SEC's website or upon request.
(b) Affiliated fund that is generally available only to investment companies and other accounts managed by Fidelity Investments. The rate quoted is the annualized seven-day yield of the fund at period end. A complete unaudited listing of the fund's holdings as of its most recent quarter end is available upon request. In addition, each Fidelity Central Fund's financial statements are available on the SEC's website or upon request.
(c) Investment made with cash collateral received from securities on loan.
(d) Security or a portion of the security was pledged to cover margin requirements for futures contracts. At period end, the value of securities pledged amounted to $2,104,035.
(e) Security or a portion of the security is on loan at period end.
Affiliated Central Funds
Information regarding fiscal year to date income earned by the Fund from investments in Fidelity Central Funds is as follows:
| Fund | Income earned |
| Fidelity Cash Central Fund | $862,691 |
| Fidelity Commodity Strategy Central Fund | 35,044 |
| Fidelity Communication Services Central Fund | 87,211 |
| Fidelity Consumer Discretionary Central Fund | 1,094,510 |
| Fidelity Consumer Staples Central Fund | 1,667,566 |
| Fidelity Emerging Markets Debt Central Fund | 243,855 |
| Fidelity Emerging Markets Equity Central Fund | 1,190,625 |
| Fidelity Energy Central Fund | 158,544 |
| Fidelity Financials Central Fund | 3,031,795 |
| Fidelity Floating Rate Central Fund | 468,616 |
| Fidelity Health Care Central Fund | 2,439,900 |
| Fidelity High Income Central Fund 1 | 795,352 |
| Fidelity Industrials Central Fund | 1,486,211 |
| Fidelity Inflation-Protected Bond Index Central Fund | 1,756,317 |
| Fidelity Information Technology Central Fund | 11,704,564 |
| Fidelity International Credit Central Fund | 344,179 |
| Fidelity International Equity Central Fund | 3,671,486 |
| Fidelity Investment Grade Bond Central Fund | 11,762,466 |
| Fidelity Materials Central Fund | 656,442 |
| Fidelity Money Market Central Fund | 2,556,114 |
| Fidelity Real Estate Equity Central Fund | 242,203 |
| Fidelity Securities Lending Cash Central Fund | 11,438 |
| Fidelity Utilities Central Fund | 867,888 |
| Total | $47,135,017 |
Amounts in the income column in the above table include any capital gain distributions from underlying funds, which are presented in the corresponding line-item in the Statement of Operations, if applicable.
Fiscal year to date information regarding the Fund’s investments in non-Money Market Central Funds, including the ownership percentage, is presented below.
| Affiliate | Value, beginning of period | Purchases(a) | Sales Proceeds(b) | Realized Gain (loss) | Change in Unrealized appreciation (depreciation) | Value, end of period | % ownership, end of period |
| Fidelity Commodity Strategy Central Fund | $-- | $4,895,623 | $148,972 | $(3,153) | $(348,432) | $4,395,066 | 1.7% |
| Fidelity Communication Services Central Fund | 6,691,539 | 18,272,154 | 844,578 | 11,698 | 1,466,042 | 25,596,855 | 1.6% |
| Fidelity Consumer Discretionary Central Fund | 38,379,336 | 3,136,661 | 7,327,240 | 25,452 | (2,385,627) | 31,828,582 | 1.7% |
| Fidelity Consumer Staples Central Fund | 20,296,601 | 2,453,461 | 1,756,765 | (163,498) | (496,416) | 20,333,383 | 1.6% |
| Fidelity Emerging Markets Debt Central Fund | 7,879,274 | 588,554 | 295,640 | 283 | 44,856 | 8,217,327 | 5.6% |
| Fidelity Emerging Markets Equity Central Fund | 16,094,590 | 19,257,811 | 1,638,563 | (67,978) | 65,861 | 33,711,721 | 3.2% |
| Fidelity Energy Central Fund | 19,863,660 | 836,137 | 1,693,694 | (163,697) | (3,565,873) | 15,276,533 | 1.6% |
| Fidelity Financials Central Fund | 61,741,989 | 5,300,388 | 5,930,370 | (436,003) | (4,143,024) | 56,532,980 | 1.7% |
| Fidelity Floating Rate Central Fund | 15,857,545 | 1,158,013 | 591,298 | (3,236) | (320,010) | 16,101,014 | 0.8% |
| Fidelity Health Care Central Fund | 52,962,678 | 4,268,079 | 5,258,226 | 103,885 | (5,529,386) | 46,547,030 | 1.6% |
| Fidelity High Income Central Fund 1 | 23,805,744 | 3,136,343 | 939,214 | (6,904) | (197,943) | 25,798,026 | 5.1% |
| Fidelity Industrials Central Fund | 34,788,287 | 2,719,521 | 3,523,311 | (169,537) | (3,500,029) | 30,314,931 | 1.7% |
| Fidelity Inflation-Protected Bond Index Central Fund | 65,181,254 | 4,597,857 | 5,461,767 | (90,435) | (73,076) | 64,153,833 | 5.4% |
| Fidelity Information Technology Central Fund | 91,858,089 | 17,318,853 | 20,399,941 | (2,208,859) | (16,896,368) | 69,671,774 | 1.6% |
| Fidelity International Credit Central Fund | 9,185,262 | 757,790 | 354,787 | (1,907) | 73,324 | 9,659,682 | 5.4% |
| Fidelity International Equity Central Fund | 74,803,125 | 8,444,852 | 4,289,211 | (105,637) | (7,121,018) | 71,732,111 | 2.9% |
| Fidelity Investment Grade Bond Central Fund | 655,962,465 | 44,778,009 | 58,653,173 | (864,017) | 18,616,428 | 659,839,712 | 8.5% |
| Fidelity Materials Central Fund | 9,195,331 | 1,024,624 | 776,937 | (127,365) | (1,152,041) | 8,163,612 | 1.7% |
| Fidelity Real Estate Equity Central Fund | 6,687,035 | 518,290 | 236,870 | 1,566 | 291,452 | 7,261,473 | 5.4% |
| Fidelity Utilities Central Fund | 10,419,472 | 1,272,735 | 1,057,220 | 16,995 | (121,873) | 10,530,109 | 1.7% |
| 1,221,653,276 | 144,735,755 | 121,177,777 | (4,252,347) | (25,293,153) | 1,215,665,754 |
(a) Includes the value of shares purchased through in-kind transactions, if applicable.
(b) Includes the value of shares redeemed through in-kind transactions, if applicable.
Investment Valuation
The following is a summary of the inputs used, as of March 31, 2019, involving the Fund's assets and liabilities carried at fair value. The inputs or methodology used for valuing securities may not be an indication of the risk associated with investing in those securities. For more information on valuation inputs, and their aggregation into the levels used below, please refer to the Investment Valuation section in the accompanying Notes to Financial Statements.
| Valuation Inputs at Reporting Date: | ||||
| Description | Total | Level 1 | Level 2 | Level 3 |
| Investments in Securities: | ||||
| Equity Central Funds | $431,896,160 | $431,896,160 | $-- | $-- |
| Fixed-Income Central Funds | 783,769,594 | 783,769,594 | -- | -- |
| Money Market Central Funds | 290,697,766 | 290,697,766 | -- | -- |
| Other Short-Term Investments | 2,104,035 | -- | 2,104,035 | -- |
| Investment Companies | 119,201,903 | 119,201,903 | -- | -- |
| Total Investments in Securities: | $1,627,669,458 | $1,625,565,423 | $2,104,035 | $-- |
| Derivative Instruments: | ||||
| Liabilities | ||||
| Futures Contracts | $(1,157,758) | $(1,157,758) | $-- | $-- |
| Total Liabilities | $(1,157,758) | $(1,157,758) | $-- | $-- |
| Total Derivative Instruments: | $(1,157,758) | $(1,157,758) | $-- | $-- |
Value of Derivative Instruments
The following table is a summary of the Fund's value of derivative instruments by primary risk exposure as of March 31, 2019. For additional information on derivative instruments, please refer to the Derivative Instruments section in the accompanying Notes to Financial Statements.
| Primary Risk Exposure / Derivative Type | Value | |
| Asset | Liability | |
| Equity Risk | ||
| Futures Contracts(a) | $0 | $(1,157,758) |
| Total Equity Risk | 0 | (1,157,758) |
| Total Value of Derivatives | $0 | $(1,157,758) |
(a) Reflects gross cumulative appreciation (depreciation) on futures contracts as presented in the Schedule of Investments. In the Statement of Assets and Liabilities, the period end daily variation margin is included in receivable or payable for daily variation margin on futures contracts, and the net cumulative appreciation (depreciation) is included in distributable earnings.
Other Information
Distribution of investments by country or territory of incorporation, as a percentage of Total Net Assets, is as follows (Unaudited):
| United States of America | 86.8% |
| United Kingdom | 2.0% |
| Others (Individually Less Than 1%) | 11.2% |
| 100.0% |
The information in the above table is based on the combined investments of the Fund and its pro-rata share of the investments of Fidelity's Central Funds, other than the Commodity Strategy and Money Market Central Funds.
See accompanying notes which are an integral part of the financial statements.
Fidelity Asset Manager® 30%
Financial Statements
Statement of Assets and Liabilities
| March 31, 2019 (Unaudited) | ||
| Assets | ||
| Investment in securities, at value (including securities loaned of $25,035,120) — See accompanying schedule: Unaffiliated issuers (cost $117,570,567) | $121,305,938 | |
| Fidelity Central Funds (cost $1,402,935,691) | 1,506,363,520 | |
| Total Investment in Securities (cost $1,520,506,258) | $1,627,669,458 | |
| Receivable for investments sold | 471,565 | |
| Receivable for fund shares sold | 2,411,336 | |
| Distributions receivable from Fidelity Central Funds | 149,705 | |
| Prepaid expenses | 1,093 | |
| Other receivables | 5,208 | |
| Total assets | 1,630,708,365 | |
| Liabilities | ||
| Payable for investments purchased | $1,074,284 | |
| Payable for fund shares redeemed | 1,289,442 | |
| Accrued management fee | 532,033 | |
| Distribution and service plan fees payable | 31,829 | |
| Payable for daily variation margin on futures contracts | 252,840 | |
| Other affiliated payables | 144,558 | |
| Other payables and accrued expenses | 33,607 | |
| Collateral on securities loaned | 25,575,435 | |
| Total liabilities | 28,934,028 | |
| Net Assets | $1,601,774,337 | |
| Net Assets consist of: | ||
| Paid in capital | $1,525,737,761 | |
| Total distributable earnings (loss) | 76,036,576 | |
| Net Assets | $1,601,774,337 | |
| Net Asset Value and Maximum Offering Price | ||
| Class A: | ||
| Net Asset Value and redemption price per share ($32,094,710 ÷ 2,934,753 shares) | $10.94 | |
| Maximum offering price per share (100/94.25 of $10.94) | $11.61 | |
| Class M: | ||
| Net Asset Value and redemption price per share ($14,845,671 ÷ 1,359,568 shares) | $10.92 | |
| Maximum offering price per share (100/96.50 of $10.92) | $11.32 | |
| Class C: | ||
| Net Asset Value and offering price per share ($22,358,343 ÷ 2,058,617 shares)(a) | $10.86 | |
| Asset Manager 30%: | ||
| Net Asset Value, offering price and redemption price per share ($1,512,308,572 ÷ 138,340,508 shares) | $10.93 | |
| Class I: | ||
| Net Asset Value, offering price and redemption price per share ($19,745,348 ÷ 1,806,164 shares) | $10.93 | |
| Class Z: | ||
| Net Asset Value, offering price and redemption price per share ($421,693 ÷ 38,564 shares) | $10.93 |
(a) Redemption price per share is equal to net asset value less any applicable contingent deferred sales charge.
See accompanying notes which are an integral part of the financial statements.
Statement of Operations
| Six months ended March 31, 2019 (Unaudited) | ||
| Investment Income | ||
| Dividends | $1,266,934 | |
| Interest | 21,046 | |
| Income from Fidelity Central Funds | 19,933,168 | |
| Total income | 21,221,148 | |
| Expenses | ||
| Management fee | $3,116,537 | |
| Transfer agent fees | 596,714 | |
| Distribution and service plan fees | 186,881 | |
| Accounting and security lending fees | 261,126 | |
| Custodian fees and expenses | 1,290 | |
| Independent trustees' fees and expenses | 3,514 | |
| Registration fees | 87,380 | |
| Audit | 16,715 | |
| Legal | 1,320 | |
| Miscellaneous | 5,262 | |
| Total expenses before reductions | 4,276,739 | |
| Expense reductions | (32,009) | |
| Total expenses after reductions | 4,244,730 | |
| Net investment income (loss) | 16,976,418 | |
| Realized and Unrealized Gain (Loss) | ||
| Net realized gain (loss) on: | ||
| Investment securities: | ||
| Unaffiliated issuers | (734,215) | |
| Fidelity Central Funds | (4,254,175) | |
| Futures contracts | 1,969,637 | |
| Capital gain distributions from Fidelity Central Funds | 27,201,849 | |
| Total net realized gain (loss) | 24,183,096 | |
| Change in net unrealized appreciation (depreciation) on: | ||
| Investment securities: | ||
| Unaffiliated issuers | (608,645) | |
| Fidelity Central Funds | (25,292,677) | |
| Futures contracts | (342,247) | |
| Total change in net unrealized appreciation (depreciation) | (26,243,569) | |
| Net gain (loss) | (2,060,473) | |
| Net increase (decrease) in net assets resulting from operations | $14,915,945 |
See accompanying notes which are an integral part of the financial statements.
Statement of Changes in Net Assets
| Six months ended March 31, 2019 (Unaudited) | Year ended September 30, 2018 | |
| Increase (Decrease) in Net Assets | ||
| Operations | ||
| Net investment income (loss) | $16,976,418 | $25,079,910 |
| Net realized gain (loss) | 24,183,096 | 29,228,042 |
| Change in net unrealized appreciation (depreciation) | (26,243,569) | (4,623,745) |
| Net increase (decrease) in net assets resulting from operations | 14,915,945 | 49,684,207 |
| Distributions to shareholders | (42,961,113) | – |
| Distributions to shareholders from net investment income | – | (23,859,157) |
| Distributions to shareholders from net realized gain | – | (21,589,863) |
| Total distributions | (42,961,113) | (45,449,020) |
| Share transactions - net increase (decrease) | 56,922,833 | 352,505,002 |
| Total increase (decrease) in net assets | 28,877,665 | 356,740,189 |
| Net Assets | ||
| Beginning of period | 1,572,896,672 | 1,216,156,483 |
| End of period | $1,601,774,337 | $1,572,896,672 |
| Other Information | ||
| Undistributed net investment income end of period | $3,196,727 |
See accompanying notes which are an integral part of the financial statements.
Financial Highlights
Fidelity Asset Manager 30% Class A
| Six months ended (Unaudited) March 31, | Years endedSeptember 30, | |||||
| 2019 | 2018 | 2017 | 2016 | 2015 | 2014 | |
| Selected Per–Share Data | ||||||
| Net asset value, beginning of period | $11.15 | $11.11 | $10.62 | $10.19 | $10.71 | $10.43 |
| Income from Investment Operations | ||||||
| Net investment income (loss)A | .10 | .16 | .13 | .16 | .15 | .14 |
| Net realized and unrealized gain (loss) | (.02) | .21 | .51 | .60 | (.23) | .46 |
| Total from investment operations | .08 | .37 | .64 | .76 | (.08) | .60 |
| Distributions from net investment income | (.11) | (.15) | (.13) | (.17) | (.15) | (.13) |
| Distributions from net realized gain | (.18) | (.18) | (.02) | (.16) | (.30) | (.18) |
| Total distributions | (.29) | (.33) | (.15) | (.33) | (.44)B | (.32)C |
| Net asset value, end of period | $10.94 | $11.15 | $11.11 | $10.62 | $10.19 | $10.71 |
| Total ReturnD,E,F | .84% | 3.40% | 6.06% | 7.61% | (.79)% | 5.83% |
| Ratios to Average Net AssetsG,H | ||||||
| Expenses before reductions | .83%I | .84% | .85% | .85% | .86% | .85% |
| Expenses net of fee waivers, if any | .82%I | .84% | .85% | .85% | .86% | .85% |
| Expenses net of all reductions | .82%I | .84% | .85% | .85% | .86% | .85% |
| Net investment income (loss) | 1.94%I | 1.47% | 1.24% | 1.58% | 1.45% | 1.29% |
| Supplemental Data | ||||||
| Net assets, end of period (000 omitted) | $32,095 | $28,713 | $22,457 | $23,868 | $21,424 | $22,071 |
| Portfolio turnover rateJ | 40%I | 18% | 24% | 24% | 22% | 13% |
A Calculated based on average shares outstanding during the period.
B Total distributions of $.44 per share is comprised of distributions from net investment income of $.145 and distributions from net realized gain of $.298 per share.
C Total distributions of $.32 per share is comprised of distributions from net investment income of $.134 and distributions from net realized gain of $.183 per share.
D Total returns for periods of less than one year are not annualized.
E Total returns would have been lower if certain expenses had not been reduced during the applicable periods shown.
F Total returns do not include the effect of the sales charges.
G Fees and expenses of any underlying Fidelity Central Funds are not included in the Fund's expense ratio. The Fund indirectly bears its proportionate share of the expenses of any underlying Fidelity Central Funds. Based on their most recent shareholder report date, the expenses ranged from less than .005% to .07%.
H Expense ratios reflect operating expenses of the class. Expenses before reductions do not reflect amounts reimbursed by the investment adviser or reductions from brokerage service arrangements or reductions from other expense offset arrangements and do not represent the amount paid by the class during periods when reimbursements or reductions occur. Expenses net of fee waivers reflect expenses after reimbursement by the investment adviser but prior to reductions from brokerage service arrangements or other expense offset arrangements. Expenses net of all reductions represent the net expenses paid by the class.
I Annualized
J Amount does not include the portfolio activity of any underlying Fidelity Central Funds.
See accompanying notes which are an integral part of the financial statements.
Fidelity Asset Manager 30% Class M
| Six months ended (Unaudited) March 31, | Years endedSeptember 30, | |||||
| 2019 | 2018 | 2017 | 2016 | 2015 | 2014 | |
| Selected Per–Share Data | ||||||
| Net asset value, beginning of period | $11.13 | $11.10 | $10.61 | $10.18 | $10.70 | $10.42 |
| Income from Investment Operations | ||||||
| Net investment income (loss)A | .09 | .13 | .11 | .14 | .13 | .11 |
| Net realized and unrealized gain (loss) | (.03) | .21 | .50 | .59 | (.23) | .46 |
| Total from investment operations | .06 | .34 | .61 | .73 | (.10) | .57 |
| Distributions from net investment income | (.09) | (.13) | (.10) | (.14) | (.12) | (.10) |
| Distributions from net realized gain | (.18) | (.18) | (.02) | (.16) | (.30) | (.18) |
| Total distributions | (.27) | (.31) | (.12) | (.30) | (.42) | (.29)B |
| Net asset value, end of period | $10.92 | $11.13 | $11.10 | $10.61 | $10.18 | $10.70 |
| Total ReturnC,D,E | .70% | 3.08% | 5.81% | 7.33% | (1.02)% | 5.53% |
| Ratios to Average Net AssetsF,G | ||||||
| Expenses before reductions | 1.09%H | 1.10% | 1.11% | 1.11% | 1.12% | 1.13% |
| Expenses net of fee waivers, if any | 1.09%H | 1.09% | 1.11% | 1.11% | 1.12% | 1.13% |
| Expenses net of all reductions | 1.09%H | 1.09% | 1.11% | 1.11% | 1.12% | 1.13% |
| Net investment income (loss) | 1.67%H | 1.21% | .98% | 1.32% | 1.18% | 1.01% |
| Supplemental Data | ||||||
| Net assets, end of period (000 omitted) | $14,846 | $14,473 | $13,023 | $11,834 | $11,098 | $9,932 |
| Portfolio turnover rateI | 40%H | 18% | 24% | 24% | 22% | 13% |
A Calculated based on average shares outstanding during the period.
B Total distributions of $.29 per share is comprised of distributions from net investment income of $.103 and distributions from net realized gain of $.183 per share.
C Total returns for periods of less than one year are not annualized.
D Total returns would have been lower if certain expenses had not been reduced during the applicable periods shown.
E Total returns do not include the effect of the sales charges.
F Fees and expenses of any underlying Fidelity Central Funds are not included in the Fund's expense ratio. The Fund indirectly bears its proportionate share of the expenses of any underlying Fidelity Central Funds. Based on their most recent shareholder report date, the expenses ranged from less than .005% to .07%.
G Expense ratios reflect operating expenses of the class. Expenses before reductions do not reflect amounts reimbursed by the investment adviser or reductions from brokerage service arrangements or reductions from other expense offset arrangements and do not represent the amount paid by the class during periods when reimbursements or reductions occur. Expenses net of fee waivers reflect expenses after reimbursement by the investment adviser but prior to reductions from brokerage service arrangements or other expense offset arrangements. Expenses net of all reductions represent the net expenses paid by the class.
H Annualized
I Amount does not include the portfolio activity of any underlying Fidelity Central Funds.
See accompanying notes which are an integral part of the financial statements.
Fidelity Asset Manager 30% Class C
| Six months ended (Unaudited) March 31, | Years endedSeptember 30, | |||||
| 2019 | 2018 | 2017 | 2016 | 2015 | 2014 | |
| Selected Per–Share Data | ||||||
| Net asset value, beginning of period | $11.07 | $11.04 | $10.57 | $10.14 | $10.66 | $10.38 |
| Income from Investment Operations | ||||||
| Net investment income (loss)A | .06 | .08 | .05 | .08 | .07 | .06 |
| Net realized and unrealized gain (loss) | (.02) | .20 | .49 | .60 | (.22) | .46 |
| Total from investment operations | .04 | .28 | .54 | .68 | (.15) | .52 |
| Distributions from net investment income | (.07) | (.07) | (.05) | (.09) | (.07) | (.06) |
| Distributions from net realized gain | (.18) | (.18) | (.02) | (.16) | (.30) | (.18) |
| Total distributions | (.25) | (.25) | (.07) | (.25) | (.37) | (.24) |
| Net asset value, end of period | $10.86 | $11.07 | $11.04 | $10.57 | $10.14 | $10.66 |
| Total ReturnB,C,D | .45% | 2.59% | 5.16% | 6.85% | (1.51)% | 5.09% |
| Ratios to Average Net AssetsE,F | ||||||
| Expenses before reductions | 1.60%G | 1.61% | 1.61% | 1.61% | 1.62% | 1.62% |
| Expenses net of fee waivers, if any | 1.60%G | 1.61% | 1.61% | 1.61% | 1.62% | 1.62% |
| Expenses net of all reductions | 1.60%G | 1.61% | 1.61% | 1.61% | 1.61% | 1.61% |
| Net investment income (loss) | 1.16%G | .70% | .47% | .82% | .69% | .52% |
| Supplemental Data | ||||||
| Net assets, end of period (000 omitted) | $22,358 | $24,911 | $20,979 | $21,579 | $19,621 | $16,976 |
| Portfolio turnover rateH | 40%G | 18% | 24% | 24% | 22% | 13% |
A Calculated based on average shares outstanding during the period.
B Total returns for periods of less than one year are not annualized.
C Total returns would have been lower if certain expenses had not been reduced during the applicable periods shown.
D Total returns do not include the effect of the contingent deferred sales charge.
E Fees and expenses of any underlying Fidelity Central Funds are not included in the Fund's expense ratio. The Fund indirectly bears its proportionate share of the expenses of any underlying Fidelity Central Funds. Based on their most recent shareholder report date, the expenses ranged from less than .005% to .07%.
F Expense ratios reflect operating expenses of the class. Expenses before reductions do not reflect amounts reimbursed by the investment adviser or reductions from brokerage service arrangements or reductions from other expense offset arrangements and do not represent the amount paid by the class during periods when reimbursements or reductions occur. Expenses net of fee waivers reflect expenses after reimbursement by the investment adviser but prior to reductions from brokerage service arrangements or other expense offset arrangements. Expenses net of all reductions represent the net expenses paid by the class.
G Annualized
H Amount does not include the portfolio activity of any underlying Fidelity Central Funds.
See accompanying notes which are an integral part of the financial statements.
Fidelity Asset Manager 30%
| Six months ended (Unaudited) March 31, | Years endedSeptember 30, | |||||
| 2019 | 2018 | 2017 | 2016 | 2015 | 2014 | |
| Selected Per–Share Data | ||||||
| Net asset value, beginning of period | $11.15 | $11.11 | $10.63 | $10.20 | $10.71 | $10.43 |
| Income from Investment Operations | ||||||
| Net investment income (loss)A | .12 | .20 | .17 | .20 | .19 | .17 |
| Net realized and unrealized gain (loss) | (.03) | .21 | .49 | .59 | (.22) | .46 |
| Total from investment operations | .09 | .41 | .66 | .79 | (.03) | .63 |
| Distributions from net investment income | (.12) | (.19) | (.16) | (.20) | (.18) | (.17) |
| Distributions from net realized gain | (.18) | (.18) | (.02) | (.16) | (.30) | (.18) |
| Total distributions | (.31)B | (.37) | (.18) | (.36) | (.48) | (.35) |
| Net asset value, end of period | $10.93 | $11.15 | $11.11 | $10.63 | $10.20 | $10.71 |
| Total ReturnC,D | .92% | 3.75% | 6.32% | 7.94% | (.38)% | 6.19% |
| Ratios to Average Net AssetsE,F | ||||||
| Expenses before reductions | .53%G | .53% | .54% | .54% | .55% | .55% |
| Expenses net of fee waivers, if any | .53%G | .53% | .54% | .54% | .55% | .55% |
| Expenses net of all reductions | .52%G | .53% | .53% | .53% | .54% | .55% |
| Net investment income (loss) | 2.23%G | 1.78% | 1.55% | 1.90% | 1.76% | 1.59% |
| Supplemental Data | ||||||
| Net assets, end of period (000 omitted) | $1,512,309 | $1,480,983 | $1,139,197 | $937,285 | $820,206 | $757,908 |
| Portfolio turnover rateH | 40%G | 18% | 24% | 24% | 22% | 13% |
A Calculated based on average shares outstanding during the period.
B Total distributions of $.31 per share is comprised of distributions from net investment income of $.124 and distributions from net realized gain of $.182 per share.
C Total returns for periods of less than one year are not annualized.
D Total returns would have been lower if certain expenses had not been reduced during the applicable periods shown.
E Fees and expenses of any underlying Fidelity Central Funds are not included in the Fund's expense ratio. The Fund indirectly bears its proportionate share of the expenses of any underlying Fidelity Central Funds. Based on their most recent shareholder report date, the expenses ranged from less than .005% to .07%.
F Expense ratios reflect operating expenses of the class. Expenses before reductions do not reflect amounts reimbursed by the investment adviser or reductions from brokerage service arrangements or reductions from other expense offset arrangements and do not represent the amount paid by the class during periods when reimbursements or reductions occur. Expenses net of fee waivers reflect expenses after reimbursement by the investment adviser but prior to reductions from brokerage service arrangements or other expense offset arrangements. Expenses net of all reductions represent the net expenses paid by the class.
G Annualized
H Amount does not include the portfolio activity of any underlying Fidelity Central Funds.
See accompanying notes which are an integral part of the financial statements.
Fidelity Asset Manager 30% Class I
| Six months ended (Unaudited) March 31, | Years endedSeptember 30, | |||||
| 2019 | 2018 | 2017 | 2016 | 2015 | 2014 | |
| Selected Per–Share Data | ||||||
| Net asset value, beginning of period | $11.15 | $11.11 | $10.62 | $10.20 | $10.71 | $10.43 |
| Income from Investment Operations | ||||||
| Net investment income (loss)A | .12 | .19 | .16 | .19 | .18 | .16 |
| Net realized and unrealized gain (loss) | (.04) | .21 | .50 | .59 | (.22) | .47 |
| Total from investment operations | .08 | .40 | .66 | .78 | (.04) | .63 |
| Distributions from net investment income | (.12) | (.18) | (.15) | (.20) | (.17) | (.16) |
| Distributions from net realized gain | (.18) | (.18) | (.02) | (.16) | (.30) | (.18) |
| Total distributions | (.30) | (.36) | (.17) | (.36) | (.47) | (.35)B |
| Net asset value, end of period | $10.93 | $11.15 | $11.11 | $10.62 | $10.20 | $10.71 |
| Total ReturnC,D | .88% | 3.66% | 6.32% | 7.80% | (.46)% | 6.12% |
| Ratios to Average Net AssetsE,F | ||||||
| Expenses before reductions | .60%G | .61% | .62% | .60% | .61% | .62% |
| Expenses net of fee waivers, if any | .59%G | .61% | .62% | .60% | .61% | .62% |
| Expenses net of all reductions | .59%G | .61% | .62% | .60% | .61% | .62% |
| Net investment income (loss) | 2.17%G | 1.70% | 1.46% | 1.84% | 1.69% | 1.52% |
| Supplemental Data | ||||||
| Net assets, end of period (000 omitted) | $19,745 | $23,818 | $20,500 | $11,501 | $8,759 | $8,616 |
| Portfolio turnover rateH | 40%G | 18% | 24% | 24% | 22% | 13% |
A Calculated based on average shares outstanding during the period.
B Total distributions of $.35 per share is comprised of distributions from net investment income of $.163 and distributions from net realized gain of $.183 per share.
C Total returns for periods of less than one year are not annualized.
D Total returns would have been lower if certain expenses had not been reduced during the applicable periods shown.
E Fees and expenses of any underlying Fidelity Central Funds are not included in the Fund's expense ratio. The Fund indirectly bears its proportionate share of the expenses of any underlying Fidelity Central Funds. Based on their most recent shareholder report date, the expenses ranged from less than .005% to .07%.
F Expense ratios reflect operating expenses of the class. Expenses before reductions do not reflect amounts reimbursed by the investment adviser or reductions from brokerage service arrangements or reductions from other expense offset arrangements and do not represent the amount paid by the class during periods when reimbursements or reductions occur. Expenses net of fee waivers reflect expenses after reimbursement by the investment adviser but prior to reductions from brokerage service arrangements or other expense offset arrangements. Expenses net of all reductions represent the net expenses paid by the class.
G Annualized
H Amount does not include the portfolio activity of any underlying Fidelity Central Funds.
See accompanying notes which are an integral part of the financial statements.
Fidelity Asset Manager 30% Class Z
| Six months ended (Unaudited) March 31, | |
| 2019 A | |
| Selected Per–Share Data | |
| Net asset value, beginning of period | $11.14 |
| Income from Investment Operations | |
| Net investment income (loss)B | .12 |
| Net realized and unrealized gain (loss) | (.02) |
| Total from investment operations | .10 |
| Distributions from net investment income | (.13) |
| Distributions from net realized gain | (.18) |
| Total distributions | (.31) |
| Net asset value, end of period | $10.93 |
| Total ReturnC,D | 1.01% |
| Ratios to Average Net AssetsE,F | |
| Expenses before reductions | .50%G |
| Expenses net of fee waivers, if any | .50%G |
| Expenses net of all reductions | .50%G |
| Net investment income (loss) | 2.26%G |
| Supplemental Data | |
| Net assets, end of period (000 omitted) | $422 |
| Portfolio turnover rateH | 40%G |
A For the period October 2, 2018 (commencement of sale of shares) to March 31, 2019.
B Calculated based on average shares outstanding during the period.
C Total returns for periods of less than one year are not annualized.
D Total returns would have been lower if certain expenses had not been reduced during the applicable periods shown.
E Fees and expenses of any underlying Fidelity Central Funds are not included in the Fund's expense ratio. The Fund indirectly bears its proportionate share of the expenses of any underlying Fidelity Central Funds. Based on their most recent shareholder report date, the expenses ranged from less than .005% to .07%.
F Expense ratios reflect operating expenses of the class. Expenses before reductions do not reflect amounts reimbursed by the investment adviser or reductions from brokerage service arrangements or reductions from other expense offset arrangements and do not represent the amount paid by the class during periods when reimbursements or reductions occur. Expense ratios before reductions for start-up periods may not be representative of longer-term operating periods. Expenses net of fee waivers reflect expenses after reimbursement by the investment adviser but prior to reductions from brokerage service arrangements or other expense offset arrangements. Expenses net of all reductions represent the net expenses paid by the class.
G Annualized
H Amount does not include the portfolio activity of any underlying Fidelity Central Funds.
See accompanying notes which are an integral part of the financial statements.
Fidelity Asset Manager® 40%
Investment Summary (Unaudited)
The information in the following tables is based on the combined investments of the Fund and its pro-rata share of the investments of Fidelity's Central Funds, other than the Commodity Strategy and Money Market Central Funds.Top Five Bond Issuers as of March 31, 2019
| (with maturities greater than one year) | % of fund's net assets |
| U.S. Treasury Obligations | 15.4 |
| Fannie Mae | 4.1 |
| Ginnie Mae | 2.4 |
| Freddie Mac | 1.9 |
| Morgan Stanley | 0.8 |
| 24.6 |
Quality Diversification (% of fund's net assets)
| As of March 31, 2019 | ||
| U.S. Government and U.S. Government Agency Obligations | 23.8% | |
| AAA,AA,A | 3.0% | |
| BBB | 10.5% | |
| BB and Below | 5.2% | |
| Not Rated | 0.4% | |
| Equities* | 44.4% | |
| Short-Term Investments and Net Other Assets | 12.7% | |

* Includes investment in Fidelity® Commodity Strategy Central Fund of 0.5%
We have used ratings from Moody's Investors Service, Inc. Where Moody's® ratings are not available, we have used S&P® ratings. All ratings are as of the date indicated and do not reflect subsequent changes.
Top Five Stocks as of March 31, 2019
| % of fund's net assets | |
| Microsoft Corp. | 1.1 |
| Apple, Inc. | 1.1 |
| Amazon.com, Inc. | 0.7 |
| Alphabet, Inc. Class A | 0.6 |
| Roche Holding AG (participation certificate) | 0.4 |
| 3.9 |
Top Five Market Sectors as of March 31, 2019
| % of fund's net assets | |
| Financials | 21.0 |
| Information Technology | 6.7 |
| Health Care | 5.8 |
| Communication Services | 4.5 |
| Consumer Discretionary | 4.7 |
Asset Allocation (% of fund's net assets)
| As of March 31, 2019 | ||
| Stock Class and Equity Futures* | 44.5% | |
| Bond Class | 42.4% | |
| Short-Term Class | 13.1% | |

* Includes investment in Fidelity® Commodity Strategy Central Fund of 0.5%
Asset allocations in the pie charts reflect the categorization of assets as defined in the Fund's prospectus in effect as of the time periods indicated above. Percentages are adjusted for the effect of future contracts and swap contracts, if applicable.
At period end, foreign investments including the Fund's pro-rata share of the underlying Central Funds, other than the Commodity Strategy Central and Money Market Funds, was 15.8% of net assets.
Percentages in the above tables are adjusted for the effect of TBA Sale Commitments.
An unaudited holdings listing for the Fund, which presents direct holdings as well as the pro-rata share of any securities and other investments held indirectly through its investment in underlying Fidelity Central Funds, other than the Commodity Strategy and Money Market Central Funds, is available at fidelity.com and/or institutional.fidelity.com, as applicable.
Fidelity Asset Manager® 40%
Schedule of Investments March 31, 2019 (Unaudited)
Showing Percentage of Net Assets
| Equity Central Funds - 37.4% | |||
| Shares | Value | ||
| Fidelity Commodity Strategy Central Fund (a) | 1,614,263 | $8,006,747 | |
| Fidelity Communication Services Central Fund (a) | 195,040 | 38,095,288 | |
| Fidelity Consumer Discretionary Central Fund (a) | 145,037 | 47,562,104 | |
| Fidelity Consumer Staples Central Fund (a) | 155,516 | 30,334,963 | |
| Fidelity Emerging Markets Equity Central Fund (a) | 225,518 | 48,089,420 | |
| Fidelity Energy Central Fund (a) | 207,391 | 22,775,722 | |
| Fidelity Financials Central Fund (a) | 873,407 | 84,275,059 | |
| Fidelity Health Care Central Fund (a) | 161,763 | 69,360,745 | |
| Fidelity Industrials Central Fund (a) | 165,675 | 45,196,092 | |
| Fidelity Information Technology Central Fund (a) | 278,047 | 103,828,472 | |
| Fidelity International Equity Central Fund (a) | 1,496,427 | 113,623,728 | |
| Fidelity Materials Central Fund (a) | 60,449 | 12,139,468 | |
| Fidelity Real Estate Equity Central Fund (a) | 67,605 | 7,707,007 | |
| Fidelity Utilities Central Fund (a) | 83,407 | 15,580,350 | |
| TOTAL EQUITY CENTRAL FUNDS | |||
| (Cost $518,182,118) | 646,575,165 | ||
| Fixed-Income Central Funds - 43.6% | |||
| High Yield Fixed-Income Funds - 3.2% | |||
| Fidelity Emerging Markets Debt Central Fund (a) | 920,407 | 8,707,050 | |
| Fidelity Floating Rate Central Fund (a) | 168,727 | 17,075,146 | |
| Fidelity High Income Central Fund 1 (a) | 318,374 | 29,745,679 | |
| TOTAL HIGH YIELD FIXED-INCOME FUNDS | 55,527,875 | ||
| Investment Grade Fixed-Income Funds - 40.4% | |||
| Fidelity Inflation-Protected Bond Index Central Fund (a) | 694,148 | 69,352,305 | |
| Fidelity International Credit Central Fund (a) | 104,979 | 10,366,626 | |
| Fidelity Investment Grade Bond Central Fund (a) | 5,729,562 | 620,053,157 | |
| TOTAL INVESTMENT GRADE FIXED-INCOME FUNDS | 699,772,088 | ||
| TOTAL FIXED-INCOME CENTRAL FUNDS | |||
| (Cost $740,924,600) | 755,299,963 | ||
| Money Market Central Funds - 11.9% | |||
| Fidelity Cash Central Fund, 2.48% (b) | 58,182,808 | 58,194,445 | |
| Fidelity Money Market Central Fund, 2.68% (b) | 130,726,229 | 130,739,302 | |
| Fidelity Securities Lending Cash Central Fund 2.48% (b)(c) | 16,232,177 | 16,233,800 | |
| TOTAL MONEY MARKET CENTRAL FUNDS | |||
| (Cost $205,155,519) | 205,167,547 | ||
| Principal Amount | Value | ||
| U.S. Treasury Obligations - 0.2% | |||
| U.S. Treasury Bills, yield at date of purchase 2.37% to 2.42% 4/18/19 to 6/27/19 (d) | |||
| (Cost $2,892,098) | 2,900,000 | 2,892,150 | |
| Shares | Value | ||
| Investment Companies - 7.9% | |||
| iShares 20+ Year Treasury Bond ETF (e) | 213,661 | $27,015,297 | |
| iShares Core MSCI Emerging Markets ETF | 1,108,486 | 57,319,808 | |
| iShares MSCI EAFE Index ETF | 359,089 | 23,290,513 | |
| iShares MSCI Japan ETF | 548,201 | 29,997,559 | |
| TOTAL INVESTMENT COMPANIES | |||
| (Cost $133,450,151) | 137,623,177 | ||
| TOTAL INVESTMENT IN SECURITIES - 101.0% | |||
| (Cost $1,600,604,486) | 1,747,558,002 | ||
| NET OTHER ASSETS (LIABILITIES) - (1.0)% | (16,749,877) | ||
| NET ASSETS - 100% | $1,730,808,125 |
| Futures Contracts | |||||
| Number of contracts | Expiration Date | Notional Amount | Value | Unrealized Appreciation/(Depreciation) | |
| Sold | |||||
| Equity Index Contracts | |||||
| CME E-mini S&P 500 Index Contracts (United States) | 413 | June 2019 | $58,600,570 | $(1,606,924) | $(1,606,924) |
The notional amount of futures sold as a percentage of Net Assets is 3.4%
For the period, the average monthly notional amount at value for futures contracts in the aggregate was $40,825,400.
Security Type Abbreviations
ETF – Exchange-Traded Fund
Legend
(a) Affiliated fund that is generally available only to investment companies and other accounts managed by Fidelity Investments. A complete unaudited schedule of portfolio holdings for each Fidelity Central Fund is filed with the SEC for the first and third quarters of each fiscal year on Form N-PORT and is available upon request or at the SEC's website at www.sec.gov. An unaudited holdings listing for the Fund, which presents direct holdings as well as the pro-rata share of securities and other investments held indirectly through its investment in underlying non-money market Fidelity Central Funds, other than the Commodity Strategy Central Fund, is available at fidelity.com and/or institutional.fidelity.com, as applicable. In addition, each Fidelity Central Fund's financial statements are available on the SEC's website or upon request.
(b) Affiliated fund that is generally available only to investment companies and other accounts managed by Fidelity Investments. The rate quoted is the annualized seven-day yield of the fund at period end. A complete unaudited listing of the fund's holdings as of its most recent quarter end is available upon request. In addition, each Fidelity Central Fund's financial statements are available on the SEC's website or upon request.
(c) Investment made with cash collateral received from securities on loan.
(d) Security or a portion of the security was pledged to cover margin requirements for futures contracts. At period end, the value of securities pledged amounted to $2,892,150.
(e) Security or a portion of the security is on loan at period end.
Affiliated Central Funds
Information regarding fiscal year to date income earned by the Fund from investments in Fidelity Central Funds is as follows:
| Fund | Income earned |
| Fidelity Cash Central Fund | $868,417 |
| Fidelity Commodity Strategy Central Fund | 62,950 |
| Fidelity Communication Services Central Fund | 129,164 |
| Fidelity Consumer Discretionary Central Fund | 1,620,120 |
| Fidelity Consumer Staples Central Fund | 2,466,316 |
| Fidelity Emerging Markets Debt Central Fund | 257,131 |
| Fidelity Emerging Markets Equity Central Fund | 2,006,029 |
| Fidelity Energy Central Fund | 233,749 |
| Fidelity Financials Central Fund | 4,479,124 |
| Fidelity Floating Rate Central Fund | 494,667 |
| Fidelity Health Care Central Fund | 3,608,121 |
| Fidelity High Income Central Fund 1 | 910,672 |
| Fidelity Industrials Central Fund | 2,198,288 |
| Fidelity Inflation-Protected Bond Index Central Fund | 1,797,884 |
| Fidelity Information Technology Central Fund | 17,345,386 |
| Fidelity International Credit Central Fund | 367,270 |
| Fidelity International Equity Central Fund | 5,775,790 |
| Fidelity Investment Grade Bond Central Fund | 10,979,251 |
| Fidelity Materials Central Fund | 967,308 |
| Fidelity Money Market Central Fund | 1,637,770 |
| Fidelity Real Estate Equity Central Fund | 255,040 |
| Fidelity Securities Lending Cash Central Fund | 13,796 |
| Fidelity Utilities Central Fund | 1,273,324 |
| Total | $59,747,567 |
Amounts in the income column in the above table include any capital gain distributions from underlying funds, which are presented in the corresponding line-item in the Statement of Operations, if applicable.
Fiscal year to date information regarding the Fund’s investments in non-Money Market Central Funds, including the ownership percentage, is presented below.
| Affiliate | Value, beginning of period | Purchases(a) | Sales Proceeds(b) | Realized Gain (loss) | Change in Unrealized appreciation (depreciation) | Value, end of period | % ownership, end of period |
| Fidelity Commodity Strategy Central Fund | $3,502,529 | $5,328,418 | $276,067 | $(4,287) | $(543,846) | $8,006,747 | 3.1% |
| Fidelity Communication Services Central Fund | 9,460,525 | 27,131,094 | 733,918 | 11,675 | 2,225,912 | 38,095,288 | 2.4% |
| Fidelity Consumer Discretionary Central Fund | 53,679,862 | 5,190,841 | 8,034,468 | 38,752 | (3,312,883) | 47,562,104 | 2.5% |
| Fidelity Consumer Staples Central Fund | 28,483,320 | 3,951,772 | 1,180,492 | (18,982) | (900,655) | 30,334,963 | 2.4% |
| Fidelity Emerging Markets Debt Central Fund | 8,243,186 | 719,873 | 306,625 | (435) | 51,051 | 8,707,050 | 5.9% |
| Fidelity Emerging Markets Equity Central Fund | 26,834,776 | 23,649,845 | 2,267,399 | (36,726) | (91,076) | 48,089,420 | 4.5% |
| Fidelity Energy Central Fund | 27,725,615 | 1,526,867 | 1,041,381 | (81,880) | (5,353,499) | 22,775,722 | 2.4% |
| Fidelity Financials Central Fund | 86,171,172 | 8,909,699 | 4,140,142 | (216,007) | (6,449,663) | 84,275,059 | 2.6% |
| Fidelity Floating Rate Central Fund | 16,603,656 | 1,418,194 | 613,275 | (3,652) | (329,777) | 17,075,146 | 0.8% |
| Fidelity Health Care Central Fund | 74,267,165 | 7,184,919 | 4,319,598 | 43,147 | (7,814,888) | 69,360,745 | 2.4% |
| Fidelity High Income Central Fund 1 | 25,358,994 | 5,600,304 | 1,013,300 | (7,487) | (192,832) | 29,745,679 | 5.9% |
| Fidelity Industrials Central Fund | 48,886,065 | 4,597,479 | 2,942,523 | (246,732) | (5,098,197) | 45,196,092 | 2.5% |
| Fidelity Inflation-Protected Bond Index Central Fund | 66,469,796 | 5,579,152 | 2,592,782 | (19,863) | (83,998) | 69,352,305 | 5.9% |
| Fidelity Information Technology Central Fund | 127,792,913 | 27,159,152 | 23,533,661 | (2,369,546) | (25,220,386) | 103,828,472 | 2.4% |
| Fidelity International Credit Central Fund | 9,732,393 | 921,851 | 368,054 | (695) | 81,131 | 10,366,626 | 5.8% |
| Fidelity International Equity Central Fund | 116,158,802 | 14,148,564 | 5,611,795 | (85,498) | (10,986,345) | 113,623,728 | 4.6% |
| Fidelity Investment Grade Bond Central Fund | 618,689,316 | 58,460,141 | 73,673,097 | (1,145,277) | 17,722,074 | 620,053,157 | 8.0% |
| Fidelity Materials Central Fund | 12,798,774 | 1,671,961 | 476,324 | (29,961) | (1,824,982) | 12,139,468 | 2.5% |
| Fidelity Real Estate Equity Central Fund | 7,009,997 | 624,544 | 245,807 | 556 | 317,717 | 7,707,007 | 5.7% |
| Fidelity Utilities Central Fund | 14,587,978 | 2,035,638 | 890,119 | 2,842 | (155,989) | 15,580,350 | 2.5% |
| 1,382,456,834 | 205,810,308 | 134,260,827 | (4,170,056) | (47,961,131) | 1,401,875,128 |
(a) Includes the value of shares purchased through in-kind transactions, if applicable.
(b) Includes the value of shares redeemed through in-kind transactions, if applicable.
Investment Valuation
The following is a summary of the inputs used, as of March 31, 2019, involving the Fund's assets and liabilities carried at fair value. The inputs or methodology used for valuing securities may not be an indication of the risk associated with investing in those securities. For more information on valuation inputs, and their aggregation into the levels used below, please refer to the Investment Valuation section in the accompanying Notes to Financial Statements.
| Valuation Inputs at Reporting Date: | ||||
| Description | Total | Level 1 | Level 2 | Level 3 |
| Investments in Securities: | ||||
| Equity Central Funds | $646,575,165 | $646,575,165 | $-- | $-- |
| Fixed-Income Central Funds | 755,299,963 | 755,299,963 | -- | -- |
| Money Market Central Funds | 205,167,547 | 205,167,547 | -- | -- |
| Other Short-Term Investments | 2,892,150 | -- | 2,892,150 | -- |
| Investment Companies | 137,623,177 | 137,623,177 | -- | -- |
| Total Investments in Securities: | $1,747,558,002 | $1,744,665,852 | $2,892,150 | $-- |
| Derivative Instruments: | ||||
| Liabilities | ||||
| Futures Contracts | $(1,606,924) | $(1,606,924) | $-- | $-- |
| Total Liabilities | $(1,606,924) | $(1,606,924) | $-- | $-- |
| Total Derivative Instruments: | $(1,606,924) | $(1,606,924) | $-- | $-- |
Value of Derivative Instruments
The following table is a summary of the Fund's value of derivative instruments by primary risk exposure as of March 31, 2019. For additional information on derivative instruments, please refer to the Derivative Instruments section in the accompanying Notes to Financial Statements.
| Primary Risk Exposure / Derivative Type | Value | |
| Asset | Liability | |
| Equity Risk | ||
| Futures Contracts(a) | $0 | $(1,606,924) |
| Total Equity Risk | 0 | (1,606,924) |
| Total Value of Derivatives | $0 | $(1,606,924) |
(a) Reflects gross cumulative appreciation (depreciation) on futures contracts as presented in the Schedule of Investments. In the Statement of Assets and Liabilities, the period end daily variation margin is included in receivable or payable for daily variation margin on futures contracts, and the net cumulative appreciation (depreciation) is included in distributable earnings.
Other Information
Distribution of investments by country or territory of incorporation, as a percentage of Total Net Assets, is as follows (Unaudited):
| United States of America | 84.2% |
| United Kingdom | 2.2% |
| Japan | 1.3% |
| Cayman Islands | 1.0% |
| Netherlands | 1.0% |
| Canada | 1.0% |
| Others (Individually Less Than 1%) | 9.3% |
| 100.0% |
The information in the above table is based on the combined investments of the Fund and its pro-rata share of the investments of Fidelity's Central Funds, other than the Commodity Strategy and Money Market Central Funds.
See accompanying notes which are an integral part of the financial statements.
Fidelity Asset Manager® 40%
Financial Statements
Statement of Assets and Liabilities
| March 31, 2019 (Unaudited) | ||
| Assets | ||
| Investment in securities, at value (including securities loaned of $15,880,864) — See accompanying schedule: Unaffiliated issuers (cost $136,342,249) | $140,515,327 | |
| Fidelity Central Funds (cost $1,464,262,237) | 1,607,042,675 | |
| Total Investment in Securities (cost $1,600,604,486) | $1,747,558,002 | |
| Receivable for investments sold | 562,613 | |
| Receivable for fund shares sold | 1,288,699 | |
| Distributions receivable from Fidelity Central Funds | 142,472 | |
| Prepaid expenses | 1,186 | |
| Other receivables | 5,860 | |
| Total assets | 1,749,558,832 | |
| Liabilities | ||
| Payable for fund shares redeemed | $1,365,555 | |
| Accrued management fee | 577,574 | |
| Distribution and service plan fees payable | 34,482 | |
| Payable for daily variation margin on futures contracts | 346,920 | |
| Other affiliated payables | 157,696 | |
| Other payables and accrued expenses | 34,680 | |
| Collateral on securities loaned | 16,233,800 | |
| Total liabilities | 18,750,707 | |
| Net Assets | $1,730,808,125 | |
| Net Assets consist of: | ||
| Paid in capital | $1,603,987,062 | |
| Total distributable earnings (loss) | 126,821,063 | |
| Net Assets | $1,730,808,125 | |
| Net Asset Value and Maximum Offering Price | ||
| Class A: | ||
| Net Asset Value and redemption price per share ($39,578,923 ÷ 3,449,910 shares) | $11.47 | |
| Maximum offering price per share (100/94.25 of $11.47) | $12.17 | |
| Class M: | ||
| Net Asset Value and redemption price per share ($11,052,644 ÷ 965,082 shares) | $11.45 | |
| Maximum offering price per share (100/96.50 of $11.45) | $11.87 | |
| Class C: | ||
| Net Asset Value and offering price per share ($25,032,110 ÷ 2,193,826 shares)(a) | $11.41 | |
| Asset Manager 40%: | ||
| Net Asset Value, offering price and redemption price per share ($1,620,964,504 ÷ 141,309,370 shares) | $11.47 | |
| Class I: | ||
| Net Asset Value, offering price and redemption price per share ($32,681,199 ÷ 2,848,566 shares) | $11.47 | |
| Class Z: | ||
| Net Asset Value, offering price and redemption price per share ($1,498,745 ÷ 130,584 shares) | $11.48 |
(a) Redemption price per share is equal to net asset value less any applicable contingent deferred sales charge.
See accompanying notes which are an integral part of the financial statements.
Statement of Operations
| Six months ended March 31, 2019 (Unaudited) | ||
| Investment Income | ||
| Dividends | $1,383,091 | |
| Interest | 26,285 | |
| Income from Fidelity Central Funds | 19,192,109 | |
| Total income | 20,601,485 | |
| Expenses | ||
| Management fee | $3,332,502 | |
| Transfer agent fees | 650,408 | |
| Distribution and service plan fees | 200,647 | |
| Accounting and security lending fees | 277,634 | |
| Custodian fees and expenses | 1,391 | |
| Independent trustees' fees and expenses | 3,754 | |
| Registration fees | 76,395 | |
| Audit | 16,715 | |
| Legal | 1,415 | |
| Miscellaneous | 5,665 | |
| Total expenses before reductions | 4,566,526 | |
| Expense reductions | (32,830) | |
| Total expenses after reductions | 4,533,696 | |
| Net investment income (loss) | 16,067,789 | |
| Realized and Unrealized Gain (Loss) | ||
| Net realized gain (loss) on: | ||
| Investment securities: | ||
| Unaffiliated issuers | 461,099 | |
| Fidelity Central Funds | (4,168,840) | |
| Futures contracts | 2,952,026 | |
| Capital gain distributions from Fidelity Central Funds | 40,555,458 | |
| Total net realized gain (loss) | 39,799,743 | |
| Change in net unrealized appreciation (depreciation) on: | ||
| Investment securities: | ||
| Unaffiliated issuers | (2,129,898) | |
| Fidelity Central Funds | (47,960,739) | |
| Futures contracts | (432,061) | |
| Total change in net unrealized appreciation (depreciation) | (50,522,698) | |
| Net gain (loss) | (10,722,955) | |
| Net increase (decrease) in net assets resulting from operations | $5,344,834 |
See accompanying notes which are an integral part of the financial statements.
Statement of Changes in Net Assets
| Six months ended March 31, 2019 (Unaudited) | Year ended September 30, 2018 | |
| Increase (Decrease) in Net Assets | ||
| Operations | ||
| Net investment income (loss) | $16,067,789 | $26,893,714 |
| Net realized gain (loss) | 39,799,743 | 43,690,052 |
| Change in net unrealized appreciation (depreciation) | (50,522,698) | 3,388,740 |
| Net increase (decrease) in net assets resulting from operations | 5,344,834 | 73,972,506 |
| Distributions to shareholders | (56,797,807) | – |
| Distributions to shareholders from net investment income | – | (24,345,900) |
| Distributions to shareholders from net realized gain | – | (23,502,413) |
| Total distributions | (56,797,807) | (47,848,313) |
| Share transactions - net increase (decrease) | 99,640,852 | 220,737,989 |
| Total increase (decrease) in net assets | 48,187,879 | 246,862,182 |
| Net Assets | ||
| Beginning of period | 1,682,620,246 | 1,435,758,064 |
| End of period | $1,730,808,125 | $1,682,620,246 |
| Other Information | ||
| Undistributed net investment income end of period | $8,195,753 |
See accompanying notes which are an integral part of the financial statements.
Financial Highlights
Fidelity Asset Manager 40% Class A
| Six months ended (Unaudited) March 31, | Years endedSeptember 30, | |||||
| 2019 | 2018 | 2017 | 2016 | 2015 | 2014 | |
| Selected Per–Share Data | ||||||
| Net asset value, beginning of period | $11.87 | $11.67 | $10.95 | $10.39 | $10.96 | $10.66 |
| Income from Investment Operations | ||||||
| Net investment income (loss)A | .09 | .17 | .14 | .16 | .16 | .14 |
| Net realized and unrealized gain (loss) | (.11) | .36 | .73 | .70 | (.28) | .59 |
| Total from investment operations | (.02) | .53 | .87 | .86 | (.12) | .73 |
| Distributions from net investment income | (.12) | (.15) | (.13) | (.17) | (.14) | (.15) |
| Distributions from net realized gain | (.27) | (.18) | (.02) | (.13) | (.31) | (.28) |
| Total distributions | (.38)B | (.33) | (.15) | (.30) | (.45) | (.43) |
| Net asset value, end of period | $11.47 | $11.87 | $11.67 | $10.95 | $10.39 | $10.96 |
| Total ReturnC,D,E | .05% | 4.62% | 8.01% | 8.44% | (1.19)% | 6.98% |
| Ratios to Average Net AssetsF,G | ||||||
| Expenses before reductions | .83%H | .84% | .84% | .84% | .85% | .85% |
| Expenses net of fee waivers, if any | .83%H | .84% | .84% | .84% | .85% | .85% |
| Expenses net of all reductions | .83%H | .84% | .84% | .84% | .84% | .85% |
| Net investment income (loss) | 1.68%H | 1.41% | 1.21% | 1.53% | 1.44% | 1.31% |
| Supplemental Data | ||||||
| Net assets, end of period (000 omitted) | $39,579 | $38,073 | $36,200 | $40,046 | $30,959 | $25,419 |
| Portfolio turnover rateI | 41%H | 17% | 20% | 22% | 22% | 11% |
A Calculated based on average shares outstanding during the period.
B Total distributions of $.38 per share is comprised of distributions from net investment income of $.115 and distributions from net realized gain of $.266 per share.
C Total returns for periods of less than one year are not annualized.
D Total returns would have been lower if certain expenses had not been reduced during the applicable periods shown.
E Total returns do not include the effect of the sales charges.
F Fees and expenses of any underlying Fidelity Central Funds are not included in the Fund's expense ratio. The Fund indirectly bears its proportionate share of the expenses of any underlying Fidelity Central Funds. Based on their most recent shareholder report date, the expenses ranged from less than .005% to .07%.
G Expense ratios reflect operating expenses of the class. Expenses before reductions do not reflect amounts reimbursed by the investment adviser or reductions from brokerage service arrangements or reductions from other expense offset arrangements and do not represent the amount paid by the class during periods when reimbursements or reductions occur. Expenses net of fee waivers reflect expenses after reimbursement by the investment adviser but prior to reductions from brokerage service arrangements or other expense offset arrangements. Expenses net of all reductions represent the net expenses paid by the class.
H Annualized
I Amount does not include the portfolio activity of any underlying Fidelity Central Funds.
See accompanying notes which are an integral part of the financial statements.
Fidelity Asset Manager 40% Class M
| Six months ended (Unaudited) March 31, | Years endedSeptember 30, | |||||
| 2019 | 2018 | 2017 | 2016 | 2015 | 2014 | |
| Selected Per–Share Data | ||||||
| Net asset value, beginning of period | $11.85 | $11.65 | $10.93 | $10.37 | $10.94 | $10.64 |
| Income from Investment Operations | ||||||
| Net investment income (loss)A | .08 | .13 | .11 | .13 | .13 | .11 |
| Net realized and unrealized gain (loss) | (.12) | .37 | .73 | .70 | (.28) | .59 |
| Total from investment operations | (.04) | .50 | .84 | .83 | (.15) | .70 |
| Distributions from net investment income | (.10) | (.12) | (.10) | (.14) | (.11) | (.12) |
| Distributions from net realized gain | (.27) | (.18) | (.02) | (.13) | (.31) | (.28) |
| Total distributions | (.36)B | (.30) | (.12) | (.27) | (.42) | (.40) |
| Net asset value, end of period | $11.45 | $11.85 | $11.65 | $10.93 | $10.37 | $10.94 |
| Total ReturnC,D,E | (.11)% | 4.35% | 7.75% | 8.12% | (1.45)% | 6.72% |
| Ratios to Average Net AssetsF,G | ||||||
| Expenses before reductions | 1.10%H | 1.10% | 1.12% | 1.12% | 1.11% | 1.12% |
| Expenses net of fee waivers, if any | 1.09%H | 1.10% | 1.11% | 1.12% | 1.11% | 1.12% |
| Expenses net of all reductions | 1.09%H | 1.10% | 1.11% | 1.12% | 1.10% | 1.12% |
| Net investment income (loss) | 1.41%H | 1.14% | .94% | 1.25% | 1.18% | 1.04% |
| Supplemental Data | ||||||
| Net assets, end of period (000 omitted) | $11,053 | $12,318 | $11,665 | $10,297 | $9,309 | $8,295 |
| Portfolio turnover rateI | 41%H | 17% | 20% | 22% | 22% | 11% |
A Calculated based on average shares outstanding during the period.
B Total distributions of $.36 per share is comprised of distributions from net investment income of $.098 and distributions from net realized gain of $.266 per share.
C Total returns for periods of less than one year are not annualized.
D Total returns would have been lower if certain expenses had not been reduced during the applicable periods shown.
E Total returns do not include the effect of the sales charges.
F Fees and expenses of any underlying Fidelity Central Funds are not included in the Fund's expense ratio. The Fund indirectly bears its proportionate share of the expenses of any underlying Fidelity Central Funds. Based on their most recent shareholder report date, the expenses ranged from less than .005% to .07%.
G Expense ratios reflect operating expenses of the class. Expenses before reductions do not reflect amounts reimbursed by the investment adviser or reductions from brokerage service arrangements or reductions from other expense offset arrangements and do not represent the amount paid by the class during periods when reimbursements or reductions occur. Expenses net of fee waivers reflect expenses after reimbursement by the investment adviser but prior to reductions from brokerage service arrangements or other expense offset arrangements. Expenses net of all reductions represent the net expenses paid by the class.
H Annualized
I Amount does not include the portfolio activity of any underlying Fidelity Central Funds.
See accompanying notes which are an integral part of the financial statements.
Fidelity Asset Manager 40% Class C
| Six months ended (Unaudited) March 31, | Years endedSeptember 30, | |||||
| 2019 | 2018 | 2017 | 2016 | 2015 | 2014 | |
| Selected Per–Share Data | ||||||
| Net asset value, beginning of period | $11.80 | $11.61 | $10.90 | $10.34 | $10.91 | $10.62 |
| Income from Investment Operations | ||||||
| Net investment income (loss)A | .05 | .08 | .05 | .08 | .07 | .06 |
| Net realized and unrealized gain (loss) | (.10) | .35 | .73 | .70 | (.27) | .58 |
| Total from investment operations | (.05) | .43 | .78 | .78 | (.20) | .64 |
| Distributions from net investment income | (.07) | (.06) | (.05) | (.09) | (.06) | (.07) |
| Distributions from net realized gain | (.27) | (.18) | (.02) | (.13) | (.31) | (.28) |
| Total distributions | (.34) | (.24) | (.07) | (.22) | (.37) | (.35) |
| Net asset value, end of period | $11.41 | $11.80 | $11.61 | $10.90 | $10.34 | $10.91 |
| Total ReturnB,C,D | (.26)% | 3.77% | 7.16% | 7.62% | (1.94)% | 6.17% |
| Ratios to Average Net AssetsE,F | ||||||
| Expenses before reductions | 1.60%G | 1.60% | 1.61% | 1.61% | 1.62% | 1.62% |
| Expenses net of fee waivers, if any | 1.60%G | 1.60% | 1.61% | 1.61% | 1.62% | 1.62% |
| Expenses net of all reductions | 1.60%G | 1.60% | 1.61% | 1.61% | 1.62% | 1.62% |
| Net investment income (loss) | .91%G | .64% | .45% | .76% | .67% | .54% |
| Supplemental Data | ||||||
| Net assets, end of period (000 omitted) | $25,032 | $25,656 | $23,354 | $22,064 | $19,515 | $15,769 |
| Portfolio turnover rateH | 41%G | 17% | 20% | 22% | 22% | 11% |
A Calculated based on average shares outstanding during the period.
B Total returns for periods of less than one year are not annualized.
C Total returns would have been lower if certain expenses had not been reduced during the applicable periods shown.
D Total returns do not include the effect of the contingent deferred sales charge.
E Fees and expenses of any underlying Fidelity Central Funds are not included in the Fund's expense ratio. The Fund indirectly bears its proportionate share of the expenses of any underlying Fidelity Central Funds. Based on their most recent shareholder report date, the expenses ranged from less than .005% to .07%.
F Expense ratios reflect operating expenses of the class. Expenses before reductions do not reflect amounts reimbursed by the investment adviser or reductions from brokerage service arrangements or reductions from other expense offset arrangements and do not represent the amount paid by the class during periods when reimbursements or reductions occur. Expenses net of fee waivers reflect expenses after reimbursement by the investment adviser but prior to reductions from brokerage service arrangements or other expense offset arrangements. Expenses net of all reductions represent the net expenses paid by the class.
G Annualized
H Amount does not include the portfolio activity of any underlying Fidelity Central Funds.
See accompanying notes which are an integral part of the financial statements.
Fidelity Asset Manager 40%
| Six months ended (Unaudited) March 31, | Years endedSeptember 30, | |||||
| 2019 | 2018 | 2017 | 2016 | 2015 | 2014 | |
| Selected Per–Share Data | ||||||
| Net asset value, beginning of period | $11.87 | $11.67 | $10.95 | $10.39 | $10.96 | $10.66 |
| Income from Investment Operations | ||||||
| Net investment income (loss)A | .11 | .20 | .17 | .19 | .19 | .17 |
| Net realized and unrealized gain (loss) | (.11) | .37 | .73 | .70 | (.28) | .59 |
| Total from investment operations | – | .57 | .90 | .89 | (.09) | .76 |
| Distributions from net investment income | (.13) | (.19) | (.16) | (.20) | (.17) | (.18) |
| Distributions from net realized gain | (.27) | (.18) | (.02) | (.13) | (.31) | (.28) |
| Total distributions | (.40) | (.37) | (.18) | (.33) | (.48) | (.46) |
| Net asset value, end of period | $11.47 | $11.87 | $11.67 | $10.95 | $10.39 | $10.96 |
| Total ReturnB,C | .22% | 4.95% | 8.35% | 8.76% | (.90)% | 7.29% |
| Ratios to Average Net AssetsD,E | ||||||
| Expenses before reductions | .53%F | .53% | .54% | .54% | .55% | .56% |
| Expenses net of fee waivers, if any | .53%F | .53% | .54% | .54% | .55% | .56% |
| Expenses net of all reductions | .52%F | .53% | .53% | .54% | .54% | .56% |
| Net investment income (loss) | 1.98%F | 1.71% | 1.52% | 1.83% | 1.74% | 1.60% |
| Supplemental Data | ||||||
| Net assets, end of period (000 omitted) | $1,620,965 | $1,577,393 | $1,344,514 | $1,084,411 | $917,607 | $769,619 |
| Portfolio turnover rateG | 41%F | 17% | 20% | 22% | 22% | 11% |
A Calculated based on average shares outstanding during the period.
B Total returns for periods of less than one year are not annualized.
C Total returns would have been lower if certain expenses had not been reduced during the applicable periods shown.
D Fees and expenses of any underlying Fidelity Central Funds are not included in the Fund's expense ratio. The Fund indirectly bears its proportionate share of the expenses of any underlying Fidelity Central Funds. Based on their most recent shareholder report date, the expenses ranged from less than .005% to .07%.
E Expense ratios reflect operating expenses of the class. Expenses before reductions do not reflect amounts reimbursed by the investment adviser or reductions from brokerage service arrangements or reductions from other expense offset arrangements and do not represent the amount paid by the class during periods when reimbursements or reductions occur. Expenses net of fee waivers reflect expenses after reimbursement by the investment adviser but prior to reductions from brokerage service arrangements or other expense offset arrangements. Expenses net of all reductions represent the net expenses paid by the class.
F Annualized
G Amount does not include the portfolio activity of any underlying Fidelity Central Funds.
See accompanying notes which are an integral part of the financial statements.
Fidelity Asset Manager 40% Class I
| Six months ended (Unaudited) March 31, | Years endedSeptember 30, | |||||
| 2019 | 2018 | 2017 | 2016 | 2015 | 2014 | |
| Selected Per–Share Data | ||||||
| Net asset value, beginning of period | $11.87 | $11.67 | $10.95 | $10.39 | $10.96 | $10.66 |
| Income from Investment Operations | ||||||
| Net investment income (loss)A | .11 | .20 | .17 | .19 | .18 | .17 |
| Net realized and unrealized gain (loss) | (.11) | .36 | .73 | .69 | (.27) | .58 |
| Total from investment operations | – | .56 | .90 | .88 | (.09) | .75 |
| Distributions from net investment income | (.13) | (.18) | (.16) | (.19) | (.17) | (.18) |
| Distributions from net realized gain | (.27) | (.18) | (.02) | (.13) | (.31) | (.28) |
| Total distributions | (.40) | (.36) | (.18) | (.32) | (.48) | (.45)B |
| Net asset value, end of period | $11.47 | $11.87 | $11.67 | $10.95 | $10.39 | $10.96 |
| Total ReturnC,D | .20% | 4.91% | 8.32% | 8.67% | (.90)% | 7.25% |
| Ratios to Average Net AssetsE,F | ||||||
| Expenses before reductions | .56%G | .56% | .56% | .58% | .60% | .58% |
| Expenses net of fee waivers, if any | .56%G | .56% | .56% | .58% | .60% | .58% |
| Expenses net of all reductions | .56%G | .56% | .56% | .58% | .60% | .57% |
| Net investment income (loss) | 1.95%G | 1.68% | 1.49% | 1.79% | 1.69% | 1.59% |
| Supplemental Data | ||||||
| Net assets, end of period (000 omitted) | $32,681 | $29,180 | $20,025 | $15,525 | $20,038 | $4,256 |
| Portfolio turnover rateH | 41%G | 17% | 20% | 22% | 22% | 11% |
A Calculated based on average shares outstanding during the period.
B Total distributions of $.45 per share is comprised of distributions from net investment income of $.176 and distributions from net realized gain of $.276 per share.
C Total returns for periods of less than one year are not annualized.
D Total returns would have been lower if certain expenses had not been reduced during the applicable periods shown.
E Fees and expenses of any underlying Fidelity Central Funds are not included in the Fund's expense ratio. The Fund indirectly bears its proportionate share of the expenses of any underlying Fidelity Central Funds. Based on their most recent shareholder report date, the expenses ranged from less than .005% to .07%.
F Expense ratios reflect operating expenses of the class. Expenses before reductions do not reflect amounts reimbursed by the investment adviser or reductions from brokerage service arrangements or reductions from other expense offset arrangements and do not represent the amount paid by the class during periods when reimbursements or reductions occur. Expenses net of fee waivers reflect expenses after reimbursement by the investment adviser but prior to reductions from brokerage service arrangements or other expense offset arrangements. Expenses net of all reductions represent the net expenses paid by the class.
G Annualized
H Amount does not include the portfolio activity of any underlying Fidelity Central Funds.
See accompanying notes which are an integral part of the financial statements.
Fidelity Asset Manager 40% Class Z
| Six months ended (Unaudited) March 31, | |
| 2019 A | |
| Selected Per–Share Data | |
| Net asset value, beginning of period | $11.86 |
| Income from Investment Operations | |
| Net investment income (loss)B | .11 |
| Net realized and unrealized gain (loss) | (.09) |
| Total from investment operations | .02 |
| Distributions from net investment income | (.13) |
| Distributions from net realized gain | (.27) |
| Total distributions | (.40) |
| Net asset value, end of period | $11.48 |
| Total ReturnC,D | .39% |
| Ratios to Average Net AssetsE,F | |
| Expenses before reductions | .50%G |
| Expenses net of fee waivers, if any | .50%G |
| Expenses net of all reductions | .50%G |
| Net investment income (loss) | 2.01%G |
| Supplemental Data | |
| Net assets, end of period (000 omitted) | $1,499 |
| Portfolio turnover rateH | 41%G |
A For the period October 2, 2018 (commencement of sale of shares) to March 31, 2019.
B Calculated based on average shares outstanding during the period.
C Total returns for periods of less than one year are not annualized.
D Total returns would have been lower if certain expenses had not been reduced during the applicable periods shown.
E Fees and expenses of any underlying Fidelity Central Funds are not included in the Fund's expense ratio. The Fund indirectly bears its proportionate share of the expenses of any underlying Fidelity Central Funds. Based on their most recent shareholder report date, the expenses ranged from less than .005% to .07%.
F Expense ratios reflect operating expenses of the class. Expenses before reductions do not reflect amounts reimbursed by the investment adviser or reductions from brokerage service arrangements or reductions from other expense offset arrangements and do not represent the amount paid by the class during periods when reimbursements or reductions occur. Expense ratios before reductions for start-up periods may not be representative of longer-term operating periods. Expenses net of fee waivers reflect expenses after reimbursement by the investment adviser but prior to reductions from brokerage service arrangements or other expense offset arrangements. Expenses net of all reductions represent the net expenses paid by the class.
G Annualized
H Amount does not include the portfolio activity of any underlying Fidelity Central Funds.
See accompanying notes which are an integral part of the financial statements.
Fidelity Asset Manager® 50%
Investment Summary (Unaudited)
The information in the following tables is based on the combined investments of the Fund and its pro-rata share of the investments of Fidelity's Central Funds, other than the Commodity Strategy and Money Market Central Funds.Top Ten Stocks as of March 31, 2019
| % of fund's net assets | |
| Microsoft Corp. | 1.4 |
| Apple, Inc. | 1.4 |
| Amazon.com, Inc. | 0.9 |
| Alphabet, Inc. Class A | 0.8 |
| Roche Holding AG (participation certificate) | 0.5 |
| UnitedHealth Group, Inc. | 0.4 |
| Adobe, Inc. | 0.4 |
| The Boeing Co. | 0.4 |
| Becton, Dickinson & Co. | 0.4 |
| Facebook, Inc. Class A | 0.4 |
| 7.0 |
Top Five Market Sectors as of March 31, 2019
| % of fund's net assets | |
| Financials | 17.5 |
| Information Technology | 8.4 |
| Health Care | 7.0 |
| Consumer Discretionary | 5.6 |
| Communication Services | 5.2 |
Top Five Bond Issuers as of March 31, 2019
| (with maturities greater than one year) | % of fund's net assets |
| U.S. Treasury Obligations | 13.7 |
| Fannie Mae | 3.3 |
| Ginnie Mae | 2.0 |
| Freddie Mac | 1.6 |
| Morgan Stanley | 0.7 |
| 21.3 |
Quality Diversification (% of fund's net assets)
| As of March 31, 2019 | ||
| U.S. Government and U.S. Government Agency Obligations | 20.6% | |
| AAA,AA,A | 2.7% | |
| BBB | 9.0% | |
| BB and Below | 4.9% | |
| Not Rated | 0.4% | |
| Equities* | 54.8% | |
| Short-Term Investments and Net Other Assets | 7.6% | |
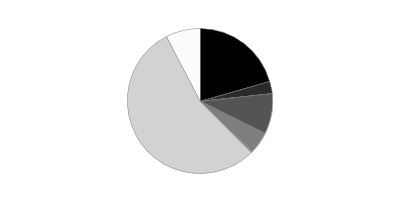
* Includes investment in Fidelity® Commodity Strategy Central Fund of 0.6%
We have used ratings from Moody's Investors Service, Inc. Where Moody's® ratings are not available, we have used S&P® ratings. All ratings are as of the date indicated and do not reflect subsequent changes.
Asset Allocation (% of fund's net assets)
| As of March 31, 2019 | ||
| Stock Class and Equity Futures* | 54.6% | |
| Bond Class | 37.4% | |
| Short-Term Class | 8.0% | |

* Includes investment in Fidelity® Commodity Strategy Central Fund of 0.6%
Asset allocations in the pie charts reflect the categorization of assets as defined in the Fund's prospectus in effect as of the time periods indicated above. Percentages are adjusted for the effect of future contracts and swap contracts, if applicable.
At period end, foreign investments including the Fund's pro-rata share of the underlying Central Funds, other than the Commodity Strategy Central and Money Market Funds, was 18.9% of net assets.
Percentages in the above tables are adjusted for the effect of TBA Sale Commitments.
An unaudited holdings listing for the Fund, which presents direct holdings as well as the pro-rata share of any securities and other investments held indirectly through its investment in underlying Fidelity Central Funds, other than the Commodity Strategy and Money Market Central Funds, is available at fidelity.com and/or institutional.fidelity.com, as applicable.
Fidelity Asset Manager® 50%
Schedule of Investments March 31, 2019 (Unaudited)
Showing Percentage of Net Assets
| Equity Central Funds - 47.2% | |||
| Shares | Value | ||
| Fidelity Commodity Strategy Central Fund (a) | 10,420,100 | $51,683,697 | |
| Fidelity Communication Services Central Fund (a) | 1,300,888 | 254,089,465 | |
| Fidelity Consumer Discretionary Central Fund (a) | 964,089 | 316,153,608 | |
| Fidelity Consumer Staples Central Fund (a) | 1,038,222 | 202,515,519 | |
| Fidelity Emerging Markets Equity Central Fund (a) | 1,469,474 | 313,350,740 | |
| Fidelity Energy Central Fund (a) | 1,384,822 | 152,081,103 | |
| Fidelity Financials Central Fund (a) | 5,824,394 | 561,995,744 | |
| Fidelity Health Care Central Fund (a) | 1,080,698 | 463,381,767 | |
| Fidelity Industrials Central Fund (a) | 1,102,476 | 300,755,346 | |
| Fidelity Information Technology Central Fund (a) | 1,855,476 | 692,871,692 | |
| Fidelity International Equity Central Fund (a) | 10,357,834 | 786,470,327 | |
| Fidelity Materials Central Fund (a) | 401,811 | 80,691,769 | |
| Fidelity Real Estate Equity Central Fund (a) | 365,372 | 41,652,444 | |
| Fidelity Utilities Central Fund (a) | 558,086 | 104,250,432 | |
| TOTAL EQUITY CENTRAL FUNDS | |||
| (Cost $2,873,589,037) | 4,321,943,653 | ||
| Fixed-Income Central Funds - 38.4% | |||
| High Yield Fixed-Income Funds - 3.2% | |||
| Fidelity Emerging Markets Debt Central Fund (a) | 4,754,116 | 44,973,939 | |
| Fidelity Floating Rate Central Fund (a) | 876,298 | 88,681,389 | |
| Fidelity High Income Central Fund 1 (a) | 1,701,367 | 158,958,734 | |
| TOTAL HIGH YIELD FIXED-INCOME FUNDS | 292,614,062 | ||
| Investment Grade Fixed-Income Funds - 35.2% | |||
| Fidelity Inflation-Protected Bond Index Central Fund (a) | 3,671,503 | 366,819,893 | |
| Fidelity International Credit Central Fund (a) | 557,839 | 55,086,567 | |
| Fidelity Investment Grade Bond Central Fund (a) | 25,882,492 | 2,801,003,260 | |
| TOTAL INVESTMENT GRADE FIXED-INCOME FUNDS | 3,222,909,720 | ||
| TOTAL FIXED-INCOME CENTRAL FUNDS | |||
| (Cost $3,324,661,577) | 3,515,523,782 | ||
| Money Market Central Funds - 5.9% | |||
| Fidelity Cash Central Fund, 2.48% (b) | 254,925,070 | 254,976,055 | |
| Fidelity Money Market Central Fund, 2.68% (b) | 271,936,662 | 271,963,855 | |
| Fidelity Securities Lending Cash Central Fund 2.48% (b)(c) | 9,641,086 | 9,642,050 | |
| TOTAL MONEY MARKET CENTRAL FUNDS | |||
| (Cost $536,562,164) | 536,581,960 | ||
| Principal Amount | Value | ||
| U.S. Treasury Obligations - 0.1% | |||
| U.S. Treasury Bills, yield at date of purchase 2.37% to 2.42% 4/18/19 to 6/27/19 (d) | |||
| (Cost $14,220,740) | 14,260,000 | 14,220,988 | |
| Shares | Value | ||
| Investment Companies - 8.5% | |||
| iShares 20+ Year Treasury Bond ETF (e) | 1,059,725 | $133,991,629 | |
| iShares Core MSCI Emerging Markets ETF | 6,272,213 | 324,336,133 | |
| iShares MSCI EAFE Index ETF | 2,463,935 | 159,810,824 | |
| iShares MSCI Japan ETF | 2,912,905 | 159,394,162 | |
| TOTAL INVESTMENT COMPANIES | |||
| (Cost $753,206,523) | 777,532,748 | ||
| TOTAL INVESTMENT IN SECURITIES - 100.1% | |||
| (Cost $7,502,240,041) | 9,165,803,131 | ||
| NET OTHER ASSETS (LIABILITIES) - (0.1)% | (12,555,932) | ||
| NET ASSETS - 100% | $9,153,247,199 |
| Futures Contracts | |||||
| Number of contracts | Expiration Date | Notional Amount | Value | Unrealized Appreciation/(Depreciation) | |
| Sold | |||||
| Equity Index Contracts | |||||
| CME E-mini S&P 500 Index Contracts (United States) | 2,241 | June 2019 | $317,975,490 | $(8,722,255) | $(8,722,255) |
The notional amount of futures sold as a percentage of Net Assets is 3.5%
Security Type Abbreviations
ETF – Exchange-Traded Fund
Legend
(a) Affiliated fund that is generally available only to investment companies and other accounts managed by Fidelity Investments. A complete unaudited schedule of portfolio holdings for each Fidelity Central Fund is filed with the SEC for the first and third quarters of each fiscal year on Form N-PORT and is available upon request or at the SEC's website at www.sec.gov. An unaudited holdings listing for the Fund, which presents direct holdings as well as the pro-rata share of securities and other investments held indirectly through its investment in underlying non-money market Fidelity Central Funds, other than the Commodity Strategy Central Fund, is available at fidelity.com and/or institutional.fidelity.com, as applicable. In addition, each Fidelity Central Fund's financial statements are available on the SEC's website or upon request.
(b) Affiliated fund that is generally available only to investment companies and other accounts managed by Fidelity Investments. The rate quoted is the annualized seven-day yield of the fund at period end. A complete unaudited listing of the fund's holdings as of its most recent quarter end is available upon request. In addition, each Fidelity Central Fund's financial statements are available on the SEC's website or upon request.
(c) Investment made with cash collateral received from securities on loan.
(d) Security or a portion of the security was pledged to cover margin requirements for futures contracts. At period end, the value of securities pledged amounted to $14,220,988.
(e) Security or a portion of the security is on loan at period end.
Affiliated Central Funds
Information regarding fiscal year to date income earned by the Fund from investments in Fidelity Central Funds is as follows:
| Fund | Income earned |
| Fidelity Cash Central Fund | $4,658,072 |
| Fidelity Commodity Strategy Central Fund | 415,507 |
| Fidelity Communication Services Central Fund | 884,369 |
| Fidelity Consumer Discretionary Central Fund | 11,041,039 |
| Fidelity Consumer Staples Central Fund | 16,886,681 |
| Fidelity Emerging Markets Debt Central Fund | 1,357,486 |
| Fidelity Emerging Markets Equity Central Fund | 15,252,514 |
| Fidelity Energy Central Fund | 1,590,688 |
| Fidelity Financials Central Fund | 30,629,117 |
| Fidelity Floating Rate Central Fund | 2,623,104 |
| Fidelity Health Care Central Fund | 24,699,811 |
| Fidelity High Income Central Fund 1 | 4,961,977 |
| Fidelity Industrials Central Fund | 14,997,652 |
| Fidelity Inflation-Protected Bond Index Central Fund | 9,848,782 |
| Fidelity Information Technology Central Fund | 118,496,519 |
| Fidelity International Credit Central Fund | 2,001,201 |
| Fidelity International Equity Central Fund | 41,431,309 |
| Fidelity Investment Grade Bond Central Fund | 50,537,581 |
| Fidelity Materials Central Fund | 6,607,950 |
| Fidelity Money Market Central Fund | 3,430,891 |
| Fidelity Real Estate Equity Central Fund | 1,415,038 |
| Fidelity Securities Lending Cash Central Fund | 68,666 |
| Fidelity Utilities Central Fund | 8,729,236 |
| Total | $372,565,190 |
Amounts in the income column in the above table include any capital gain distributions from underlying funds, which are presented in the corresponding line-item in the Statement of Operations, if applicable.
Fiscal year to date information regarding the Fund’s investments in non-Money Market Central Funds, including the ownership percentage, is presented below.
| Fund | Value, beginning of period | Purchases(a) | Sales Proceeds(b) | Realized Gain/Loss | Change in Unrealized appreciation (depreciation) | Value, end of period | % ownership, end of period |
| Fidelity Commodity Strategy Central Fund | $19,568,502 | $37,521,742 | $1,657,317 | $(74,147) | $(3,675,083) | $51,683,697 | 20.0% |
| Fidelity Communication Services Central Fund | 65,756,271 | 178,390,002 | 4,862,076 | 21,254 | 14,784,014 | 254,089,465 | 15.7% |
| Fidelity Consumer Discretionary Central Fund | 375,542,191 | 20,091,472 | 56,018,231 | 2,300,229 | (25,762,053) | 316,153,608 | 16.4% |
| Fidelity Consumer Staples Central Fund | 198,437,885 | 19,344,764 | 8,473,318 | (762,969) | (6,030,843) | 202,515,519 | 15.9% |
| Fidelity Emerging Markets Debt Central Fund | 44,440,007 | 1,952,686 | 1,655,393 | (32,126) | 268,765 | 44,973,939 | 30.7% |
| Fidelity Emerging Markets Equity Central Fund | 210,584,026 | 120,102,304 | 14,421,550 | (755,601) | (2,158,439) | 313,350,740 | 29.5% |
| Fidelity Energy Central Fund | 194,066,270 | 3,841,426 | 7,903,306 | (1,700,470) | (36,222,817) | 152,081,103 | 16.2% |
| Fidelity Financials Central Fund | 600,596,106 | 38,062,365 | 30,095,248 | (2,188,271) | (44,379,208) | 561,995,744 | 17.1% |
| Fidelity Floating Rate Central Fund | 89,995,019 | 3,815,540 | 3,310,807 | (15,806) | (1,802,557) | 88,681,389 | 4.3% |
| Fidelity Health Care Central Fund | 520,576,948 | 30,671,621 | 33,501,796 | 1,926,431 | (56,291,437) | 463,381,767 | 16.2% |
| Fidelity High Income Central Fund 1 | 141,009,521 | 24,677,124 | 5,471,995 | (28,165) | (1,227,751) | 158,958,734 | 31.5% |
| Fidelity Industrials Central Fund | 338,907,106 | 19,039,370 | 19,660,965 | (1,203,590) | (36,326,575) | 300,755,346 | 16.7% |
| Fidelity Inflation-Protected Bond Index Central Fund | 370,474,121 | 14,594,303 | 17,432,527 | (171,980) | (644,024) | 366,819,893 | 31.0% |
| Fidelity Information Technology Central Fund | 888,048,275 | 159,587,752 | 162,819,698 | (12,224,173) | (179,720,464) | 692,871,692 | 16.3% |
| Fidelity International Credit Central Fund | 53,970,376 | 2,716,541 | 1,986,436 | (20,249) | 406,335 | 55,086,567 | 30.6% |
| Fidelity International Equity Central Fund | 851,185,720 | 55,152,677 | 37,460,532 | (1,029,182) | (81,378,356) | 786,470,327 | 31.9% |
| Fidelity Investment Grade Bond Central Fund | 2,984,959,552 | 182,783,563 | 440,894,486 | (3,741,159) | 77,895,790 | 2,801,003,260 | 35.9% |
| Fidelity Materials Central Fund | 89,273,982 | 7,758,438 | 3,423,040 | (726,089) | (12,191,522) | 80,691,769 | 16.9% |
| Fidelity Real Estate Equity Central Fund | 39,408,807 | 1,892,434 | 1,324,794 | 708 | 1,675,289 | 41,652,444 | 30.9% |
| Fidelity Utilities Central Fund | 101,941,110 | 9,991,750 | 6,489,294 | 198,587 | (1,391,721) | 104,250,432 | 16.8% |
| Total | $8,178,741,795 | $931,987,874 | $858,862,809 | $(20,226,768) | $(394,172,657) | $7,837,467,435 |
(a) Includes the value of shares purchased through in-kind transactions, if applicable.
(b) Includes the value of shares redeemed through in-kind transactions, if applicable.
Investment Valuation
The following is a summary of the inputs used, as of March 31, 2019, involving the Fund's assets and liabilities carried at fair value. The inputs or methodology used for valuing securities may not be an indication of the risk associated with investing in those securities. For more information on valuation inputs, and their aggregation into the levels used below, please refer to the Investment Valuation section in the accompanying Notes to Financial Statements.
| Valuation Inputs at Reporting Date: | ||||
| Description | Total | Level 1 | Level 2 | Level 3 |
| Investments in Securities: | ||||
| Equity Central Funds | $4,321,943,653 | $4,321,943,653 | $-- | $-- |
| Fixed-Income Central Funds | 3,515,523,782 | 3,515,523,782 | -- | -- |
| Money Market Central Funds | 536,581,960 | 536,581,960 | -- | -- |
| Other Short-Term Investments | 14,220,988 | -- | 14,220,988 | -- |
| Investment Companies | 777,532,748 | 777,532,748 | -- | -- |
| Total Investments in Securities: | $9,165,803,131 | $9,151,582,143 | $14,220,988 | $-- |
| Derivative Instruments: | ||||
| Liabilities | ||||
| Futures Contracts | $(8,722,255) | $(8,722,255) | $-- | $-- |
| Total Liabilities | $(8,722,255) | $(8,722,255) | $-- | $-- |
| Total Derivative Instruments: | $(8,722,255) | $(8,722,255) | $-- | $-- |
Value of Derivative Instruments
The following table is a summary of the Fund's value of derivative instruments by primary risk exposure as of March 31, 2019. For additional information on derivative instruments, please refer to the Derivative Instruments section in the accompanying Notes to Financial Statements.
| Primary Risk Exposure / Derivative Type | Value | |
| Asset | Liability | |
| Equity Risk | ||
| Futures Contracts(a) | $0 | $(8,722,255) |
| Total Equity Risk | 0 | (8,722,255) |
| Total Value of Derivatives | $0 | $(8,722,255) |
(a) Reflects gross cumulative appreciation (depreciation) on futures contracts as presented in the Schedule of Investments. In the Statement of Assets and Liabilities, the period end daily variation margin is included in receivable or payable for daily variation margin on futures contracts, and the net cumulative appreciation (depreciation) is included in distributable earnings.
Other Information
Distribution of investments by country or territory of incorporation, as a percentage of Total Net Assets, is as follows (Unaudited):
| United States of America | 81.1% |
| United Kingdom | 2.7% |
| Japan | 1.7% |
| Canada | 1.3% |
| Cayman Islands | 1.1% |
| Netherlands | 1.1% |
| Switzerland | 1.1% |
| France | 1.0% |
| Others (Individually Less Than 1%) | 8.9% |
| 100.0% |
The information in the above table is based on the combined investments of the Fund and its pro-rata share of the investments of Fidelity's Central Funds, other than the Commodity Strategy and Money Market Central Funds.
See accompanying notes which are an integral part of the financial statements.
Fidelity Asset Manager® 50%
Financial Statements
Statement of Assets and Liabilities
| March 31, 2019 (Unaudited) | ||
| Assets | ||
| Investment in securities, at value (including securities loaned of $9,432,424) — See accompanying schedule: Unaffiliated issuers (cost $767,427,263) | $791,753,736 | |
| Fidelity Central Funds (cost $6,734,812,778) | 8,374,049,395 | |
| Total Investment in Securities (cost $7,502,240,041) | $9,165,803,131 | |
| Receivable for investments sold | 3,259,956 | |
| Receivable for fund shares sold | 4,916,627 | |
| Distributions receivable from Fidelity Central Funds | 669,968 | |
| Prepaid expenses | 6,686 | |
| Other receivables | 235,419 | |
| Total assets | 9,174,891,787 | |
| Liabilities | ||
| Payable for investments purchased | $914,437 | |
| Payable for fund shares redeemed | 4,159,886 | |
| Accrued management fee | 3,697,584 | |
| Distribution and service plan fees payable | 76,835 | |
| Payable for daily variation margin on futures contracts | 1,882,440 | |
| Other affiliated payables | 1,048,102 | |
| Other payables and accrued expenses | 223,254 | |
| Collateral on securities loaned | 9,642,050 | |
| Total liabilities | 21,644,588 | |
| Net Assets | $9,153,247,199 | |
| Net Assets consist of: | ||
| Paid in capital | $8,078,861,041 | |
| Total distributable earnings (loss) | 1,074,386,158 | |
| Net Assets | $9,153,247,199 | |
| Net Asset Value and Maximum Offering Price | ||
| Class A: | ||
| Net Asset Value and redemption price per share ($90,565,340 ÷ 5,125,377 shares) | $17.67 | |
| Maximum offering price per share (100/94.25 of $17.67) | $18.75 | |
| Class M: | ||
| Net Asset Value and redemption price per share ($41,497,893 ÷ 2,351,132 shares) | $17.65 | |
| Maximum offering price per share (100/96.50 of $17.65) | $18.29 | |
| Class C: | ||
| Net Asset Value and offering price per share ($47,121,596 ÷ 2,690,662 shares)(a) | $17.51 | |
| Asset Manager 50%: | ||
| Net Asset Value, offering price and redemption price per share ($8,903,154,338 ÷ 501,725,989 shares) | $17.75 | |
| Class I: | ||
| Net Asset Value, offering price and redemption price per share ($68,829,496 ÷ 3,886,075 shares) | $17.71 | |
| Class Z: | ||
| Net Asset Value, offering price and redemption price per share ($2,078,536 ÷ 117,384 shares) | $17.71 |
(a) Redemption price per share is equal to net asset value less any applicable contingent deferred sales charge.
See accompanying notes which are an integral part of the financial statements.
Statement of Operations
| Six months ended March 31, 2019 (Unaudited) | ||
| Investment Income | ||
| Dividends | $7,724,487 | |
| Interest | 135,427 | |
| Income from Fidelity Central Funds | 95,820,233 | |
| Total income | 103,680,147 | |
| Expenses | ||
| Management fee | $21,737,558 | |
| Transfer agent fees | 5,483,292 | |
| Distribution and service plan fees | 450,381 | |
| Accounting and security lending fees | 769,081 | |
| Custodian fees and expenses | 4,299 | |
| Independent trustees' fees and expenses | 20,527 | |
| Registration fees | 101,300 | |
| Audit | 16,714 | |
| Legal | 7,870 | |
| Miscellaneous | 31,101 | |
| Total expenses before reductions | 28,622,123 | |
| Expense reductions | (130,600) | |
| Total expenses after reductions | 28,491,523 | |
| Net investment income (loss) | 75,188,624 | |
| Realized and Unrealized Gain (Loss) | ||
| Net realized gain (loss) on: | ||
| Investment securities: | ||
| Unaffiliated issuers | 11,436,651 | |
| Fidelity Central Funds | (20,226,578) | |
| Futures contracts | 12,182,342 | |
| Capital gain distributions from Fidelity Central Funds | 276,744,957 | |
| Total net realized gain (loss) | 280,137,372 | |
| Change in net unrealized appreciation (depreciation) on: | ||
| Investment securities: | ||
| Unaffiliated issuers | (17,833,437) | |
| Fidelity Central Funds | (394,172,292) | |
| Futures contracts | (2,506,167) | |
| Total change in net unrealized appreciation (depreciation) | (414,511,896) | |
| Net gain (loss) | (134,374,524) | |
| Net increase (decrease) in net assets resulting from operations | $(59,185,900) |
See accompanying notes which are an integral part of the financial statements.
Statement of Changes in Net Assets
| Six months ended March 31, 2019 (Unaudited) | Year ended September 30, 2018 | |
| Increase (Decrease) in Net Assets | ||
| Operations | ||
| Net investment income (loss) | $75,188,624 | $139,733,527 |
| Net realized gain (loss) | 280,137,372 | 319,288,321 |
| Change in net unrealized appreciation (depreciation) | (414,511,896) | 65,731,437 |
| Net increase (decrease) in net assets resulting from operations | (59,185,900) | 524,753,285 |
| Distributions to shareholders | (373,277,172) | – |
| Distributions to shareholders from net investment income | – | (126,122,206) |
| Distributions to shareholders from net realized gain | – | (252,763,367) |
| Total distributions | (373,277,172) | (378,885,573) |
| Share transactions - net increase (decrease) | 190,184,705 | 728,976,453 |
| Total increase (decrease) in net assets | (242,278,367) | 874,844,165 |
| Net Assets | ||
| Beginning of period | 9,395,525,566 | 8,520,681,401 |
| End of period | $9,153,247,199 | $9,395,525,566 |
| Other Information | ||
| Undistributed net investment income end of period | $44,007,306 |
See accompanying notes which are an integral part of the financial statements.
Financial Highlights
Fidelity Asset Manager 50% Class A
| Six months ended (Unaudited) March 31, | Years endedSeptember 30, | |||||
| 2019 | 2018 | 2017 | 2016 | 2015 | 2014 | |
| Selected Per–Share Data | ||||||
| Net asset value, beginning of period | $18.58 | $18.29 | $16.91 | $16.33 | $17.99 | $17.78 |
| Income from Investment Operations | ||||||
| Net investment income (loss)A | .12 | .23 | .19 | .23 | .23 | .22 |
| Net realized and unrealized gain (loss) | (.31) | .80 | 1.46 | 1.21 | (.50) | 1.13 |
| Total from investment operations | (.19) | 1.03 | 1.65 | 1.44 | (.27) | 1.35 |
| Distributions from net investment income | (.17) | (.21) | (.18) | (.25) | (.22) | (.23) |
| Distributions from net realized gain | (.55) | (.53) | (.09) | (.62) | (1.17) | (.91) |
| Total distributions | (.72) | (.74) | (.27) | (.86)B | (1.39) | (1.14) |
| Net asset value, end of period | $17.67 | $18.58 | $18.29 | $16.91 | $16.33 | $17.99 |
| Total ReturnC,D,E | (.73)% | 5.74% | 9.90% | 9.19% | (1.70)% | 7.96% |
| Ratios to Average Net AssetsF,G | ||||||
| Expenses before reductions | .94%H | .94% | .96% | .96% | .96% | .95% |
| Expenses net of fee waivers, if any | .94%H | .94% | .96% | .96% | .96% | .95% |
| Expenses net of all reductions | .94%H | .94% | .95% | .96% | .95% | .95% |
| Net investment income (loss) | 1.39%H | 1.24% | 1.08% | 1.42% | 1.34% | 1.24% |
| Supplemental Data | ||||||
| Net assets, end of period (000 omitted) | $90,565 | $86,252 | $75,623 | $77,724 | $70,616 | $72,246 |
| Portfolio turnover rateI | 42%H | 15% | 20% | 19% | 17% | 10% |
A Calculated based on average shares outstanding during the period.
B Total distributions of $.86 per share is comprised of distributions from net investment income of $.247 and distributions from net realized gain of $.616 per share.
C Total returns for periods of less than one year are not annualized.
D Total returns would have been lower if certain expenses had not been reduced during the applicable periods shown.
E Total returns do not include the effect of the sales charges.
F Fees and expenses of any underlying Fidelity Central Funds are not included in the Fund's expense ratio. The Fund indirectly bears its proportionate share of the expenses of any underlying Fidelity Central Funds. Based on their most recent shareholder report date, the expenses ranged from less than .005% to .07%.
G Expense ratios reflect operating expenses of the class. Expenses before reductions do not reflect amounts reimbursed by the investment adviser or reductions from brokerage service arrangements or reductions from other expense offset arrangements and do not represent the amount paid by the class during periods when reimbursements or reductions occur. Expenses net of fee waivers reflect expenses after reimbursement by the investment adviser but prior to reductions from brokerage service arrangements or other expense offset arrangements. Expenses net of all reductions represent the net expenses paid by the class.
H Annualized
I Amount does not include the portfolio activity of any underlying Fidelity Central Funds.
See accompanying notes which are an integral part of the financial statements.
Fidelity Asset Manager 50% Class M
| Six months ended (Unaudited) March 31, | Years endedSeptember 30, | |||||
| 2019 | 2018 | 2017 | 2016 | 2015 | 2014 | |
| Selected Per–Share Data | ||||||
| Net asset value, beginning of period | $18.56 | $18.27 | $16.90 | $16.31 | $17.97 | $17.76 |
| Income from Investment Operations | ||||||
| Net investment income (loss)A | .10 | .18 | .14 | .19 | .19 | .17 |
| Net realized and unrealized gain (loss) | (.31) | .80 | 1.46 | 1.22 | (.51) | 1.14 |
| Total from investment operations | (.21) | .98 | 1.60 | 1.41 | (.32) | 1.31 |
| Distributions from net investment income | (.15) | (.16) | (.14) | (.20) | (.17) | (.19) |
| Distributions from net realized gain | (.55) | (.53) | (.09) | (.62) | (1.17) | (.91) |
| Total distributions | (.70) | (.69) | (.23) | (.82) | (1.34) | (1.10) |
| Net asset value, end of period | $17.65 | $18.56 | $18.27 | $16.90 | $16.31 | $17.97 |
| Total ReturnB,C,D | (.86)% | 5.48% | 9.57% | 8.97% | (1.98)% | 7.69% |
| Ratios to Average Net AssetsE,F | ||||||
| Expenses before reductions | 1.19%G | 1.19% | 1.21% | 1.22% | 1.22% | 1.22% |
| Expenses net of fee waivers, if any | 1.19%G | 1.19% | 1.21% | 1.22% | 1.22% | 1.22% |
| Expenses net of all reductions | 1.19%G | 1.19% | 1.21% | 1.22% | 1.22% | 1.22% |
| Net investment income (loss) | 1.15%G | .99% | .83% | 1.15% | 1.07% | .97% |
| Supplemental Data | ||||||
| Net assets, end of period (000 omitted) | $41,498 | $41,222 | $36,209 | $32,431 | $30,381 | $32,372 |
| Portfolio turnover rateH | 42%G | 15% | 20% | 19% | 17% | 10% |
A Calculated based on average shares outstanding during the period.
B Total returns for periods of less than one year are not annualized.
C Total returns would have been lower if certain expenses had not been reduced during the applicable periods shown.
D Total returns do not include the effect of the sales charges.
E Fees and expenses of any underlying Fidelity Central Funds are not included in the Fund's expense ratio. The Fund indirectly bears its proportionate share of the expenses of any underlying Fidelity Central Funds. Based on their most recent shareholder report date, the expenses ranged from less than .005% to .07%.
F Expense ratios reflect operating expenses of the class. Expenses before reductions do not reflect amounts reimbursed by the investment adviser or reductions from brokerage service arrangements or reductions from other expense offset arrangements and do not represent the amount paid by the class during periods when reimbursements or reductions occur. Expenses net of fee waivers reflect expenses after reimbursement by the investment adviser but prior to reductions from brokerage service arrangements or other expense offset arrangements. Expenses net of all reductions represent the net expenses paid by the class.
G Annualized
H Amount does not include the portfolio activity of any underlying Fidelity Central Funds.
See accompanying notes which are an integral part of the financial statements.
Fidelity Asset Manager 50% Class C
| Six months ended (Unaudited) March 31, | Years endedSeptember 30, | |||||
| 2019 | 2018 | 2017 | 2016 | 2015 | 2014 | |
| Selected Per–Share Data | ||||||
| Net asset value, beginning of period | $18.42 | $18.15 | $16.79 | $16.21 | $17.88 | $17.68 |
| Income from Investment Operations | ||||||
| Net investment income (loss)A | .06 | .09 | .05 | .11 | .10 | .08 |
| Net realized and unrealized gain (loss) | (.32) | .79 | 1.46 | 1.21 | (.52) | 1.13 |
| Total from investment operations | (.26) | .88 | 1.51 | 1.32 | (.42) | 1.21 |
| Distributions from net investment income | (.10) | (.08) | (.06) | (.12) | (.08) | (.10) |
| Distributions from net realized gain | (.55) | (.53) | (.09) | (.62) | (1.17) | (.91) |
| Total distributions | (.65) | (.61) | (.15) | (.74) | (1.25) | (1.01) |
| Net asset value, end of period | $17.51 | $18.42 | $18.15 | $16.79 | $16.21 | $17.88 |
| Total ReturnB,C,D | (1.12)% | 4.93% | 9.07% | 8.42% | (2.52)% | 7.16% |
| Ratios to Average Net AssetsE,F | ||||||
| Expenses before reductions | 1.70%G | 1.70% | 1.72% | 1.72% | 1.72% | 1.72% |
| Expenses net of fee waivers, if any | 1.70%G | 1.70% | 1.72% | 1.72% | 1.72% | 1.72% |
| Expenses net of all reductions | 1.69%G | 1.70% | 1.71% | 1.72% | 1.72% | 1.72% |
| Net investment income (loss) | .64%G | .49% | .32% | .66% | .57% | .47% |
| Supplemental Data | ||||||
| Net assets, end of period (000 omitted) | $47,122 | $51,337 | $41,900 | $42,706 | $42,095 | $38,792 |
| Portfolio turnover rateH | 42%G | 15% | 20% | 19% | 17% | 10% |
A Calculated based on average shares outstanding during the period.
B Total returns for periods of less than one year are not annualized.
C Total returns would have been lower if certain expenses had not been reduced during the applicable periods shown.
D Total returns do not include the effect of the contingent deferred sales charge.
E Fees and expenses of any underlying Fidelity Central Funds are not included in the Fund's expense ratio. The Fund indirectly bears its proportionate share of the expenses of any underlying Fidelity Central Funds. Based on their most recent shareholder report date, the expenses ranged from less than .005% to .07%.
F Expense ratios reflect operating expenses of the class. Expenses before reductions do not reflect amounts reimbursed by the investment adviser or reductions from brokerage service arrangements or reductions from other expense offset arrangements and do not represent the amount paid by the class during periods when reimbursements or reductions occur. Expenses net of fee waivers reflect expenses after reimbursement by the investment adviser but prior to reductions from brokerage service arrangements or other expense offset arrangements. Expenses net of all reductions represent the net expenses paid by the class.
G Annualized
H Amount does not include the portfolio activity of any underlying Fidelity Central Funds.
See accompanying notes which are an integral part of the financial statements.
Fidelity Asset Manager 50%
| Six months ended (Unaudited) March 31, | Years endedSeptember 30, | |||||
| 2019 | 2018 | 2017 | 2016 | 2015 | 2014 | |
| Selected Per–Share Data | ||||||
| Net asset value, beginning of period | $18.66 | $18.37 | $16.98 | $16.39 | $18.06 | $17.84 |
| Income from Investment Operations | ||||||
| Net investment income (loss)A | .15 | .29 | .24 | .28 | .29 | .28 |
| Net realized and unrealized gain (loss) | (.31) | .80 | 1.47 | 1.22 | (.52) | 1.14 |
| Total from investment operations | (.16) | 1.09 | 1.71 | 1.50 | (.23) | 1.42 |
| Distributions from net investment income | (.20) | (.26) | (.24) | (.30) | (.27) | (.29) |
| Distributions from net realized gain | (.55) | (.53) | (.09) | (.62) | (1.17) | (.91) |
| Total distributions | (.75) | (.80)B | (.32)C | (.91)D | (1.44) | (1.20) |
| Net asset value, end of period | $17.75 | $18.66 | $18.37 | $16.98 | $16.39 | $18.06 |
| Total ReturnE,F | (.56)% | 6.05% | 10.26% | 9.56% | (1.45)% | 8.33% |
| Ratios to Average Net AssetsG,H | ||||||
| Expenses before reductions | .63%I | .63% | .65% | .65% | .66% | .66% |
| Expenses net of fee waivers, if any | .63%I | .63% | .64% | .65% | .66% | .66% |
| Expenses net of all reductions | .63%I | .63% | .64% | .65% | .65% | .66% |
| Net investment income (loss) | 1.70%I | 1.55% | 1.39% | 1.72% | 1.63% | 1.53% |
| Supplemental Data | ||||||
| Net assets, end of period (000 omitted) | $8,903,154 | $9,140,811 | $8,324,452 | $7,566,062 | $7,504,374 | $7,956,041 |
| Portfolio turnover rateJ | 42%I | 15% | 20% | 19% | 17% | 10% |
A Calculated based on average shares outstanding during the period.
B Total distributions of $.80 per share is comprised of distributions from net investment income of $.263 and distributions from net realized gain of $.532 per share.
C Total distributions of $.32 per share is comprised of distributions from net investment income of $.237 and distributions from net realized gain of $.087 per share.
D Total distributions of $.91 per share is comprised of distributions from net investment income of $.297 and distributions from net realized gain of $.616 per share.
E Total returns for periods of less than one year are not annualized.
F Total returns would have been lower if certain expenses had not been reduced during the applicable periods shown.
G Fees and expenses of any underlying Fidelity Central Funds are not included in the Fund's expense ratio. The Fund indirectly bears its proportionate share of the expenses of any underlying Fidelity Central Funds. Based on their most recent shareholder report date, the expenses ranged from less than .005% to .07%.
H Expense ratios reflect operating expenses of the class. Expenses before reductions do not reflect amounts reimbursed by the investment adviser or reductions from brokerage service arrangements or reductions from other expense offset arrangements and do not represent the amount paid by the class during periods when reimbursements or reductions occur. Expenses net of fee waivers reflect expenses after reimbursement by the investment adviser but prior to reductions from brokerage service arrangements or other expense offset arrangements. Expenses net of all reductions represent the net expenses paid by the class.
I Annualized
J Amount does not include the portfolio activity of any underlying Fidelity Central Funds.
See accompanying notes which are an integral part of the financial statements.
Fidelity Asset Manager 50% Class I
| Six months ended (Unaudited) March 31, | Years endedSeptember 30, | |||||
| 2019 | 2018 | 2017 | 2016 | 2015 | 2014 | |
| Selected Per–Share Data | ||||||
| Net asset value, beginning of period | $18.62 | $18.33 | $16.95 | $16.36 | $18.03 | $17.81 |
| Income from Investment Operations | ||||||
| Net investment income (loss)A | .15 | .28 | .24 | .27 | .28 | .27 |
| Net realized and unrealized gain (loss) | (.31) | .80 | 1.46 | 1.23 | (.52) | 1.14 |
| Total from investment operations | (.16) | 1.08 | 1.70 | 1.50 | (.24) | 1.41 |
| Distributions from net investment income | (.19) | (.26) | (.23) | (.29) | (.26) | (.28) |
| Distributions from net realized gain | (.55) | (.53) | (.09) | (.62) | (1.17) | (.91) |
| Total distributions | (.75)B | (.79) | (.32) | (.91) | (1.43) | (1.19) |
| Net asset value, end of period | $17.71 | $18.62 | $18.33 | $16.95 | $16.36 | $18.03 |
| Total ReturnC,D | (.58)% | 6.02% | 10.17% | 9.53% | (1.50)% | 8.29% |
| Ratios to Average Net AssetsE,F | ||||||
| Expenses before reductions | .66%G | .67% | .68% | .70% | .70% | .71% |
| Expenses net of fee waivers, if any | .66%G | .67% | .68% | .70% | .70% | .71% |
| Expenses net of all reductions | .66%G | .67% | .68% | .70% | .69% | .71% |
| Net investment income (loss) | 1.67%G | 1.52% | 1.35% | 1.68% | 1.59% | 1.48% |
| Supplemental Data | ||||||
| Net assets, end of period (000 omitted) | $68,829 | $75,904 | $42,497 | $39,673 | $33,434 | $33,575 |
| Portfolio turnover rateH | 42%G | 15% | 20% | 19% | 17% | 10% |
A Calculated based on average shares outstanding during the period.
B Total distributions of $.75 per share is comprised of distributions from net investment income of $.194 and distributions from net realized gain of $.551 per share.
C Total returns for periods of less than one year are not annualized.
D Total returns would have been lower if certain expenses had not been reduced during the applicable periods shown.
E Fees and expenses of any underlying Fidelity Central Funds are not included in the Fund's expense ratio. The Fund indirectly bears its proportionate share of the expenses of any underlying Fidelity Central Funds. Based on their most recent shareholder report date, the expenses ranged from less than .005% to .07%.
F Expense ratios reflect operating expenses of the class. Expenses before reductions do not reflect amounts reimbursed by the investment adviser or reductions from brokerage service arrangements or reductions from other expense offset arrangements and do not represent the amount paid by the class during periods when reimbursements or reductions occur. Expenses net of fee waivers reflect expenses after reimbursement by the investment adviser but prior to reductions from brokerage service arrangements or other expense offset arrangements. Expenses net of all reductions represent the net expenses paid by the class.
G Annualized
H Amount does not include the portfolio activity of any underlying Fidelity Central Funds.
See accompanying notes which are an integral part of the financial statements.
Fidelity Asset Manager 50% Class Z
| Six months ended (Unaudited) March 31, | |
| 2019 A | |
| Selected Per–Share Data | |
| Net asset value, beginning of period | $18.59 |
| Income from Investment Operations | |
| Net investment income (loss)B | .15 |
| Net realized and unrealized gain (loss) | (.28) |
| Total from investment operations | (.13) |
| Distributions from net investment income | (.20) |
| Distributions from net realized gain | (.55) |
| Total distributions | (.75) |
| Net asset value, end of period | $17.71 |
| Total ReturnC,D | (.37)% |
| Ratios to Average Net AssetsE,F | |
| Expenses before reductions | .56%G |
| Expenses net of fee waivers, if any | .56%G |
| Expenses net of all reductions | .55%G |
| Net investment income (loss) | 1.78%G |
| Supplemental Data | |
| Net assets, end of period (000 omitted) | $2,079 |
| Portfolio turnover rateH | 42%G |
A For the period October 2, 2018 (commencement of sale of shares) to March 31, 2019.
B Calculated based on average shares outstanding during the period.
C Total returns for periods of less than one year are not annualized.
D Total returns would have been lower if certain expenses had not been reduced during the applicable periods shown.
E Fees and expenses of any underlying Fidelity Central Funds are not included in the Fund's expense ratio. The Fund indirectly bears its proportionate share of the expenses of any underlying Fidelity Central Funds. Based on their most recent shareholder report date, the expenses ranged from less than .005% to .07%.
F Expense ratios reflect operating expenses of the class. Expenses before reductions do not reflect amounts reimbursed by the investment adviser or reductions from brokerage service arrangements or reductions from other expense offset arrangements and do not represent the amount paid by the class during periods when reimbursements or reductions occur. Expense ratios before reductions for start-up periods may not be representative of longer-term operating periods. Expenses net of fee waivers reflect expenses after reimbursement by the investment adviser but prior to reductions from brokerage service arrangements or other expense offset arrangements. Expenses net of all reductions represent the net expenses paid by the class.
G Annualized
H Amount does not include the portfolio activity of any underlying Fidelity Central Funds.
See accompanying notes which are an integral part of the financial statements.
Fidelity Asset Manager® 60%
Investment Summary (Unaudited)
The information in the following tables is based on the combined investments of the Fund and its pro-rata share of the investments of Fidelity's Central Funds, other than the Commodity Strategy and Money Market Central Funds.Top Ten Stocks as of March 31, 2019
| % of fund's net assets | |
| Microsoft Corp. | 1.7 |
| Apple, Inc. | 1.7 |
| Amazon.com, Inc. | 1.0 |
| Alphabet, Inc. Class A | 0.9 |
| Roche Holding AG (participation certificate) | 0.5 |
| UnitedHealth Group, Inc. | 0.5 |
| Adobe, Inc. | 0.5 |
| The Boeing Co. | 0.5 |
| Becton, Dickinson & Co. | 0.5 |
| Facebook, Inc. Class A | 0.4 |
| 8.2 |
Top Five Market Sectors as of March 31, 2019
| % of fund's net assets | |
| Financials | 14.7 |
| Information Technology | 9.8 |
| Health Care | 7.9 |
| Consumer Discretionary | 6.8 |
| Industrials | 5.8 |
Quality Diversification (% of fund's net assets)
| As of March 31, 2019 | ||
| U.S. Government and U.S. Government Agency Obligations | 17.8% | |
| AAA,AA,A | 2.4% | |
| BBB | 7.4% | |
| BB and Below | 4.5% | |
| Not Rated | 0.3% | |
| Equities* | 64.9% | |
| Short-Term Investments and Net Other Assets | 2.7% | |

* Includes investment in Fidelity® Commodity Strategy Central Fund of 0.6%
We have used ratings from Moody's Investors Service, Inc. Where Moody's® ratings are not available, we have used S&P® ratings. All ratings are as of the date indicated and do not reflect subsequent changes.
Asset Allocation (% of fund's net assets)
| As of March 31, 2019 | ||
| Stock Class and Equity Futures* | 64.7% | |
| Bond Class | 32.2% | |
| Short-Term Class | 3.1% | |

* Includes investment in Fidelity® Commodity Strategy Central Fund of 0.6%
Asset allocations in the pie charts reflect the categorization of assets as defined in the Fund's prospectus in effect as of the time periods indicated above. Percentages are adjusted for the effect of future contracts and swap contracts, if applicable.
At period end, foreign investments including the Fund's pro-rata share of the underlying Central Funds, other than the Commodity Strategy Central and Money Market Funds, was 21.1% of net assets.
Percentages in the above tables are adjusted for the effect of TBA Sale Commitments.
An unaudited holdings listing for the Fund, which presents direct holdings as well as the pro-rata share of any securities and other investments held indirectly through its investment in underlying Fidelity Central Funds, other than the Commodity Strategy and Money Market Central Funds, is available at fidelity.com and/or institutional.fidelity.com, as applicable.
Fidelity Asset Manager® 60%
Schedule of Investments March 31, 2019 (Unaudited)
Showing Percentage of Net Assets
| Equity Central Funds - 56.3% | |||
| Shares | Value | ||
| Fidelity Commodity Strategy Central Fund (a) | 3,401,575 | $16,871,812 | |
| Fidelity Communication Services Central Fund (a) | 507,701 | 99,164,074 | |
| Fidelity Consumer Discretionary Central Fund (a) | 378,214 | 124,027,783 | |
| Fidelity Consumer Staples Central Fund (a) | 407,545 | 79,495,654 | |
| Fidelity Emerging Markets Equity Central Fund (a) | 588,165 | 125,420,347 | |
| Fidelity Energy Central Fund (a) | 537,435 | 59,021,091 | |
| Fidelity Financials Central Fund (a) | 2,282,727 | 220,260,301 | |
| Fidelity Health Care Central Fund (a) | 423,151 | 181,438,492 | |
| Fidelity Industrials Central Fund (a) | 432,486 | 117,982,253 | |
| Fidelity Information Technology Central Fund (a) | 726,213 | 271,182,402 | |
| Fidelity International Equity Central Fund (a) | 3,982,324 | 302,377,862 | |
| Fidelity Materials Central Fund (a) | 157,555 | 31,640,183 | |
| Fidelity Real Estate Equity Central Fund (a) | 123,833 | 14,116,971 | |
| Fidelity Utilities Central Fund (a) | 216,663 | 40,472,729 | |
| TOTAL EQUITY CENTRAL FUNDS | |||
| (Cost $1,382,303,613) | 1,683,471,954 | ||
| Fixed-Income Central Funds - 33.1% | |||
| High Yield Fixed-Income Funds - 3.2% | |||
| Fidelity Emerging Markets Debt Central Fund (a) | 1,539,883 | 14,567,293 | |
| Fidelity Floating Rate Central Fund (a) | 285,048 | 28,846,905 | |
| Fidelity High Income Central Fund 1 (a) | 560,202 | 52,339,643 | |
| TOTAL HIGH YIELD FIXED-INCOME FUNDS | 95,753,841 | ||
| Investment Grade Fixed-Income Funds - 29.9% | |||
| Fidelity Inflation-Protected Bond Index Central Fund (a) | 1,199,087 | 119,800,760 | |
| Fidelity International Credit Central Fund (a) | 187,714 | 18,536,747 | |
| Fidelity Investment Grade Bond Central Fund (a) | 6,982,319 | 755,626,563 | |
| TOTAL INVESTMENT GRADE FIXED-INCOME FUNDS | 893,964,070 | ||
| TOTAL FIXED-INCOME CENTRAL FUNDS | |||
| (Cost $968,810,033) | 989,717,911 | ||
| Money Market Central Funds - 1.9% | |||
| Fidelity Cash Central Fund, 2.48% (b) | 23,906,193 | 23,910,974 | |
| Fidelity Securities Lending Cash Central Fund 2.48% (b)(c) | 32,594,491 | 32,597,750 | |
| TOTAL MONEY MARKET CENTRAL FUNDS | |||
| (Cost $56,508,691) | 56,508,724 | ||
| Principal Amount | Value | ||
| U.S. Treasury Obligations - 0.2% | |||
| U.S. Treasury Bills, yield at date of purchase 2.37% to 2.42% 4/18/19 to 6/27/19 (d) | |||
| (Cost $4,718,284) | 4,730,000 | 4,718,322 | |
| Shares | Value | ||
| Investment Companies - 9.6% | |||
| iShares 20+ Year Treasury Bond ETF (e) | 346,396 | $43,798,310 | |
| iShares Core MSCI Emerging Markets ETF | 2,056,631 | 106,348,390 | |
| iShares MSCI EAFE Index ETF | 1,233,156 | 79,982,498 | |
| iShares MSCI Japan ETF | 1,061,344 | 58,076,744 | |
| TOTAL INVESTMENT COMPANIES | |||
| (Cost $278,504,110) | 288,205,942 | ||
| TOTAL INVESTMENT IN SECURITIES - 101.1% | |||
| (Cost $2,690,844,731) | 3,022,622,853 | ||
| NET OTHER ASSETS (LIABILITIES) - (1.1)% | (33,677,671) | ||
| NET ASSETS - 100% | $2,988,945,182 |
| Futures Contracts | |||||
| Number of contracts | Expiration Date | Notional Amount | Value | Unrealized Appreciation/(Depreciation) | |
| Sold | |||||
| Equity Index Contracts | |||||
| CME E-mini S&P 500 Index Contracts (United States) | 742 | June 2019 | $105,282,380 | $(3,018,369) | $(3,018,369) |
The notional amount of futures sold as a percentage of Net Assets is 3.5%
Security Type Abbreviations
ETF – Exchange-Traded Fund
Legend
(a) Affiliated fund that is generally available only to investment companies and other accounts managed by Fidelity Investments. A complete unaudited schedule of portfolio holdings for each Fidelity Central Fund is filed with the SEC for the first and third quarters of each fiscal year on Form N-PORT and is available upon request or at the SEC's website at www.sec.gov. An unaudited holdings listing for the Fund, which presents direct holdings as well as the pro-rata share of securities and other investments held indirectly through its investment in underlying non-money market Fidelity Central Funds, other than the Commodity Strategy Central Fund, is available at fidelity.com and/or institutional.fidelity.com, as applicable. In addition, each Fidelity Central Fund's financial statements are available on the SEC's website or upon request.
(b) Affiliated fund that is generally available only to investment companies and other accounts managed by Fidelity Investments. The rate quoted is the annualized seven-day yield of the fund at period end. A complete unaudited listing of the fund's holdings as of its most recent quarter end is available upon request. In addition, each Fidelity Central Fund's financial statements are available on the SEC's website or upon request.
(c) Investment made with cash collateral received from securities on loan.
(d) Security or a portion of the security was pledged to cover margin requirements for futures contracts. At period end, the value of securities pledged amounted to $4,718,322.
(e) Security or a portion of the security is on loan at period end.
Affiliated Central Funds
Information regarding fiscal year to date income earned by the Fund from investments in Fidelity Central Funds is as follows:
| Fund | Income earned |
| Fidelity Cash Central Fund | $1,241,837 |
| Fidelity Commodity Strategy Central Fund | 134,687 |
| Fidelity Communication Services Central Fund | 343,959 |
| Fidelity Consumer Discretionary Central Fund | 4,348,125 |
| Fidelity Consumer Staples Central Fund | 6,644,236 |
| Fidelity Emerging Markets Debt Central Fund | 435,441 |
| Fidelity Emerging Markets Equity Central Fund | 6,436,093 |
| Fidelity Energy Central Fund | 617,561 |
| Fidelity Financials Central Fund | 12,032,010 |
| Fidelity Floating Rate Central Fund | 847,484 |
| Fidelity Health Care Central Fund | 9,700,946 |
| Fidelity High Income Central Fund 1 | 1,623,878 |
| Fidelity Industrials Central Fund | 5,902,108 |
| Fidelity Inflation-Protected Bond Index Central Fund | 2,864,481 |
| Fidelity Information Technology Central Fund | 46,532,323 |
| Fidelity International Credit Central Fund | 667,571 |
| Fidelity International Equity Central Fund | 15,810,615 |
| Fidelity Investment Grade Bond Central Fund | 13,131,092 |
| Fidelity Materials Central Fund | 2,599,840 |
| Fidelity Real Estate Equity Central Fund | 475,489 |
| Fidelity Securities Lending Cash Central Fund | 12,693 |
| Fidelity Utilities Central Fund | 3,398,155 |
| Total | $135,800,624 |
Amounts in the income column in the above table include any capital gain distributions from underlying funds, which are presented in the corresponding line-item in the Statement of Operations, if applicable.
Fiscal year to date information regarding the Fund’s investments in non-Money Market Central Funds, including the ownership percentage, is presented below.
| Fund | Value, beginning of period | Purchases(a) | Sales Proceeds(b) | Realized Gain/Loss | Change in Unrealized appreciation (depreciation) | Value, end of period | % ownership, end of period |
| Fidelity Commodity Strategy Central Fund | $6,208,063 | $12,361,865 | $493,968 | $(11,294) | $(1,192,854) | $16,871,812 | 6.5% |
| Fidelity Communication Services Central Fund | 25,236,956 | 71,394,372 | 3,409,436 | 104,819 | 5,837,363 | 99,164,074 | 6.1% |
| Fidelity Consumer Discretionary Central Fund | 146,591,048 | 9,461,659 | 22,999,793 | 361,968 | (9,387,099) | 124,027,783 | 6.4% |
| Fidelity Consumer Staples Central Fund | 77,436,400 | 9,039,084 | 4,384,441 | (342,304) | (2,253,085) | 79,495,654 | 6.2% |
| Fidelity Emerging Markets Debt Central Fund | 14,038,818 | 907,069 | 464,821 | (4,109) | 90,336 | 14,567,293 | 9.9% |
| Fidelity Emerging Markets Equity Central Fund | 86,313,715 | 45,378,795 | 5,172,481 | (532,725) | (566,957) | 125,420,347 | 11.8% |
| Fidelity Energy Central Fund | 74,167,253 | 2,720,533 | 3,408,411 | (400,417) | (14,057,867) | 59,021,091 | 6.3% |
| Fidelity Financials Central Fund | 232,217,880 | 19,165,830 | 13,236,248 | (648,585) | (17,238,576) | 220,260,301 | 6.7% |
| Fidelity Floating Rate Central Fund | 28,561,552 | 1,789,195 | 929,646 | (4,642) | (569,554) | 28,846,905 | 1.4% |
| Fidelity Health Care Central Fund | 200,381,288 | 15,474,955 | 13,449,571 | 358,234 | (21,326,414) | 181,438,492 | 6.4% |
| Fidelity High Income Central Fund 1 | 45,397,134 | 8,864,798 | 1,553,267 | (10,058) | (358,964) | 52,339,643 | 10.4% |
| Fidelity Industrials Central Fund | 131,422,312 | 9,766,595 | 8,831,952 | (565,517) | (13,809,185) | 117,982,253 | 6.5% |
| Fidelity Inflation-Protected Bond Index Central Fund | 105,329,508 | 20,808,622 | 6,399,595 | (29,480) | 91,705 | 119,800,760 | 10.1% |
| Fidelity Information Technology Central Fund | 346,993,488 | 65,036,921 | 66,218,753 | (5,308,943) | (69,320,311) | 271,182,402 | 6.4% |
| Fidelity International Credit Central Fund | 17,721,958 | 1,233,021 | 558,230 | (1,971) | 141,969 | 18,536,747 | 10.3% |
| Fidelity International Equity Central Fund | 317,382,540 | 28,733,805 | 13,218,716 | (815,362) | (29,704,405) | 302,377,862 | 12.3% |
| Fidelity Investment Grade Bond Central Fund | 770,665,936 | 64,144,917 | 98,986,724 | (2,427,076) | 22,229,510 | 755,626,563 | 9.7% |
| Fidelity Materials Central Fund | 34,661,738 | 3,715,204 | 1,749,215 | (223,094) | (4,764,450) | 31,640,183 | 6.6% |
| Fidelity Real Estate Equity Central Fund | 13,057,670 | 852,280 | 371,979 | (1,547) | 580,547 | 14,116,971 | 10.5% |
| Fidelity Utilities Central Fund | 39,143,517 | 4,629,538 | 2,840,720 | 28,342 | (487,948) | 40,472,729 | 6.5% |
| Total | $2,712,928,774 | $395,479,058 | $268,677,967 | $(10,473,761) | $(156,066,239) | $2,673,189,865 |
(a) Includes the value of shares purchased through in-kind transactions, if applicable.
(b) Includes the value of shares redeemed through in-kind transactions, if applicable.
Investment Valuation
The following is a summary of the inputs used, as of March 31, 2019, involving the Fund's assets and liabilities carried at fair value. The inputs or methodology used for valuing securities may not be an indication of the risk associated with investing in those securities. For more information on valuation inputs, and their aggregation into the levels used below, please refer to the Investment Valuation section in the accompanying Notes to Financial Statements.
| Valuation Inputs at Reporting Date: | ||||
| Description | Total | Level 1 | Level 2 | Level 3 |
| Investments in Securities: | ||||
| Equity Central Funds | $1,683,471,954 | $1,683,471,954 | $-- | $-- |
| Fixed-Income Central Funds | 989,717,911 | 989,717,911 | -- | -- |
| Money Market Central Funds | 56,508,724 | 56,508,724 | -- | -- |
| Other Short-Term Investments | 4,718,322 | -- | 4,718,322 | -- |
| Investment Companies | 288,205,942 | 288,205,942 | -- | -- |
| Total Investments in Securities: | $3,022,622,853 | $3,017,904,531 | $4,718,322 | $-- |
| Derivative Instruments: | ||||
| Liabilities | ||||
| Futures Contracts | $(3,018,369) | $(3,018,369) | $-- | $-- |
| Total Liabilities | $(3,018,369) | $(3,018,369) | $-- | $-- |
| Total Derivative Instruments: | $(3,018,369) | $(3,018,369) | $-- | $-- |
Value of Derivative Instruments
The following table is a summary of the Fund's value of derivative instruments by primary risk exposure as of March 31, 2019. For additional information on derivative instruments, please refer to the Derivative Instruments section in the accompanying Notes to Financial Statements.
| Primary Risk Exposure / Derivative Type | Value | |
| Asset | Liability | |
| Equity Risk | ||
| Futures Contracts(a) | $0 | $(3,018,369) |
| Total Equity Risk | 0 | (3,018,369) |
| Total Value of Derivatives | $0 | $(3,018,369) |
(a) Reflects gross cumulative appreciation (depreciation) on futures contracts as presented in the Schedule of Investments. In the Statement of Assets and Liabilities, the period end daily variation margin is included in receivable or payable for daily variation margin on futures contracts, and the net cumulative appreciation (depreciation) is included in distributable earnings.
Other Information
Distribution of investments by country or territory of incorporation, as a percentage of Total Net Assets, is as follows (Unaudited):
| United States of America | 78.9% |
| United Kingdom | 2.8% |
| Japan | 2.0% |
| Cayman Islands | 1.3% |
| France | 1.3% |
| Canada | 1.3% |
| Switzerland | 1.2% |
| Netherlands | 1.2% |
| Germany | 1.0% |
| Others (Individually Less Than 1%) | 9.0% |
| 100.0% |
The information in the above table{s} is based on the combined investments of the Fund and its pro-rata share of the investments of Fidelity's Central Funds, other than the Commodity Strategy and Money Market Central Funds.
See accompanying notes which are an integral part of the financial statements.
Fidelity Asset Manager® 60%
Financial Statements
Statement of Assets and Liabilities
| March 31, 2019 (Unaudited) | ||
| Assets | ||
| Investment in securities, at value (including securities loaned of $31,926,100) — See accompanying schedule: Unaffiliated issuers (cost $283,222,394) | $292,924,264 | |
| Fidelity Central Funds (cost $2,407,622,337) | 2,729,698,589 | |
| Total Investment in Securities (cost $2,690,844,731) | $3,022,622,853 | |
| Receivable for investments sold | 1,203,367 | |
| Receivable for fund shares sold | 1,812,314 | |
| Dividends receivable | 43,158 | |
| Distributions receivable from Fidelity Central Funds | 94,639 | |
| Prepaid expenses | 2,133 | |
| Other receivables | 47,162 | |
| Total assets | 3,025,825,626 | |
| Liabilities | ||
| Payable for investments purchased | $759,170 | |
| Payable for fund shares redeemed | 1,023,512 | |
| Accrued management fee | 1,330,307 | |
| Distribution and service plan fees payable | 110,538 | |
| Payable for daily variation margin on futures contracts | 623,280 | |
| Other affiliated payables | 397,125 | |
| Other payables and accrued expenses | 38,762 | |
| Collateral on securities loaned | 32,597,750 | |
| Total liabilities | 36,880,444 | |
| Net Assets | $2,988,945,182 | |
| Net Assets consist of: | ||
| Paid in capital | $2,710,740,141 | |
| Total distributable earnings (loss) | 278,205,041 | |
| Net Assets | $2,988,945,182 | |
| Net Asset Value and Maximum Offering Price | ||
| Class A: | ||
| Net Asset Value and redemption price per share ($129,250,989 ÷ 10,580,545 shares) | $12.22 | |
| Maximum offering price per share (100/94.25 of $12.22) | $12.97 | |
| Class M: | ||
| Net Asset Value and redemption price per share ($52,404,891 ÷ 4,312,048 shares) | $12.15 | |
| Maximum offering price per share (100/96.50 of $12.15) | $12.59 | |
| Class C: | ||
| Net Asset Value and offering price per share ($70,989,664 ÷ 5,910,542 shares)(a) | $12.01 | |
| Asset Manager 60%: | ||
| Net Asset Value, offering price and redemption price per share ($2,677,390,380 ÷ 218,301,011 shares) | $12.26 | |
| Class I: | ||
| Net Asset Value, offering price and redemption price per share ($55,421,440 ÷ 4,514,968 shares) | $12.28 | |
| Class Z: | ||
| Net Asset Value, offering price and redemption price per share ($3,487,818 ÷ 284,377 shares) | $12.26 |
(a) Redemption price per share is equal to net asset value less any applicable contingent deferred sales charge.
See accompanying notes which are an integral part of the financial statements.
Statement of Operations
| Six months ended March 31, 2019 (Unaudited) | ||
| Investment Income | ||
| Dividends | $2,786,635 | |
| Interest | 41,431 | |
| Income from Fidelity Central Funds | 28,374,741 | |
| Total income | 31,202,807 | |
| Expenses | ||
| Management fee | $7,747,075 | |
| Transfer agent fees | 1,802,214 | |
| Distribution and service plan fees | 673,095 | |
| Accounting and security lending fees | 542,510 | |
| Custodian fees and expenses | 12,365 | |
| Independent trustees' fees and expenses | 6,609 | |
| Registration fees | 96,529 | |
| Audit | 32,672 | |
| Legal | 17,450 | |
| Miscellaneous | 10,143 | |
| Total expenses before reductions | 10,940,662 | |
| Expense reductions | (217,104) | |
| Total expenses after reductions | 10,723,558 | |
| Net investment income (loss) | 20,479,249 | |
| Realized and Unrealized Gain (Loss) | ||
| Net realized gain (loss) on: | ||
| Investment securities: | ||
| Unaffiliated issuers | 136,045 | |
| Fidelity Central Funds | (10,473,767) | |
| Foreign currency transactions | (4,826) | |
| Futures contracts | 2,454,127 | |
| Capital gain distributions from Fidelity Central Funds | 107,425,883 | |
| Total net realized gain (loss) | 99,537,462 | |
| Change in net unrealized appreciation (depreciation) on: | ||
| Investment securities: | ||
| Unaffiliated issuers | (1,542,409) | |
| Fidelity Central Funds | (156,066,234) | |
| Assets and liabilities in foreign currencies | 5,812 | |
| Futures contracts | (1,327,402) | |
| Total change in net unrealized appreciation (depreciation) | (158,930,233) | |
| Net gain (loss) | (59,392,771) | |
| Net increase (decrease) in net assets resulting from operations | $(38,913,522) |
See accompanying notes which are an integral part of the financial statements.
Statement of Changes in Net Assets
| Six months ended March 31, 2019 (Unaudited) | Year ended September 30, 2018 | |
| Increase (Decrease) in Net Assets | ||
| Operations | ||
| Net investment income (loss) | $20,479,249 | $34,831,760 |
| Net realized gain (loss) | 99,537,462 | 87,040,662 |
| Change in net unrealized appreciation (depreciation) | (158,930,233) | 46,471,730 |
| Net increase (decrease) in net assets resulting from operations | (38,913,522) | 168,344,152 |
| Distributions to shareholders | (115,058,433) | – |
| Distributions to shareholders from net investment income | – | (23,754,776) |
| Distributions to shareholders from net realized gain | – | (36,844,601) |
| Total distributions | (115,058,433) | (60,599,377) |
| Share transactions - net increase (decrease) | 127,000,258 | 943,430,967 |
| Total increase (decrease) in net assets | (26,971,697) | 1,051,175,742 |
| Net Assets | ||
| Beginning of period | 3,015,916,879 | 1,964,741,137 |
| End of period | $2,988,945,182 | $3,015,916,879 |
| Other Information | ||
| Undistributed net investment income end of period | $24,257,631 |
See accompanying notes which are an integral part of the financial statements.
Financial Highlights
Fidelity Asset Manager 60% Class A
| Six months ended (Unaudited) March 31, | Years endedSeptember 30, | |||||
| 2019 | 2018 | 2017 | 2016 | 2015 | 2014 | |
| Selected Per–Share Data | ||||||
| Net asset value, beginning of period | $12.92 | $12.42 | $11.24 | $10.60 | $11.53 | $11.17 |
| Income from Investment Operations | ||||||
| Net investment income (loss)A | .07 | .14 | .11 | .14 | .14 | .12 |
| Net realized and unrealized gain (loss) | (.30) | .69 | 1.21 | .90 | (.39) | .83 |
| Total from investment operations | (.23) | .83 | 1.32 | 1.04 | (.25) | .95 |
| Distributions from net investment income | (.15) | (.11) | (.12) | (.15) | (.12) | (.09) |
| Distributions from net realized gain | (.32) | (.22) | (.02) | (.25) | (.56) | (.50) |
| Total distributions | (.47) | (.33) | (.14) | (.40) | (.68) | (.59) |
| Net asset value, end of period | $12.22 | $12.92 | $12.42 | $11.24 | $10.60 | $11.53 |
| Total ReturnB,C,D | (1.47)% | 6.80% | 11.86% | 10.10% | (2.36)% | 8.87% |
| Ratios to Average Net AssetsE,F | ||||||
| Expenses before reductions | 1.02%G | 1.02% | 1.03% | 1.03% | 1.04% | 1.03% |
| Expenses net of fee waivers, if any | 1.01%G | 1.01% | 1.03% | 1.03% | 1.03% | 1.03% |
| Expenses net of all reductions | 1.01%G | 1.01% | 1.02% | 1.03% | 1.03% | 1.03% |
| Net investment income (loss) | 1.16%G | 1.12% | .98% | 1.30% | 1.20% | 1.08% |
| Supplemental Data | ||||||
| Net assets, end of period (000 omitted) | $129,251 | $130,729 | $59,049 | $59,027 | $53,879 | $53,382 |
| Portfolio turnover rateH | 40%G | 18%I | 18% | 21% | 22% | 11% |
A Calculated based on average shares outstanding during the period.
B Total returns for periods of less than one year are not annualized.
C Total returns would have been lower if certain expenses had not been reduced during the applicable periods shown.
D Total returns do not include the effect of the sales charges.
E Fees and expenses of any underlying Fidelity Central Funds are not included in the Fund's expense ratio. The Fund indirectly bears its proportionate share of the expenses of any underlying Fidelity Central Funds. Based on their most recent shareholder report date, the expenses ranged from less than .005% to .07%.
F Expense ratios reflect operating expenses of the class. Expenses before reductions do not reflect amounts reimbursed by the investment adviser or reductions from brokerage service arrangements or reductions from other expense offset arrangements and do not represent the amount paid by the class during periods when reimbursements or reductions occur. Expenses net of fee waivers reflect expenses after reimbursement by the investment adviser but prior to reductions from brokerage service arrangements or other expense offset arrangements. Expenses net of all reductions represent the net expenses paid by the class.
G Annualized
H Amount does not include the portfolio activity of any underlying Fidelity Central Funds.
I The portfolio turnover rate does not include the assets acquired in the merger.
See accompanying notes which are an integral part of the financial statements.
Fidelity Asset Manager 60% Class M
| Six months ended (Unaudited) March 31, | Years endedSeptember 30, | |||||
| 2019 | 2018 | 2017 | 2016 | 2015 | 2014 | |
| Selected Per–Share Data | ||||||
| Net asset value, beginning of period | $12.84 | $12.34 | $11.17 | $10.55 | $11.48 | $11.12 |
| Income from Investment Operations | ||||||
| Net investment income (loss)A | .05 | .11 | .09 | .11 | .11 | .09 |
| Net realized and unrealized gain (loss) | (.30) | .70 | 1.19 | .88 | (.39) | .84 |
| Total from investment operations | (.25) | .81 | 1.28 | .99 | (.28) | .93 |
| Distributions from net investment income | (.12) | (.08) | (.09) | (.13) | (.09) | (.07) |
| Distributions from net realized gain | (.32) | (.22) | (.02) | (.25) | (.56) | (.50) |
| Total distributions | (.44) | (.31)B | (.11) | (.37)C | (.65) | (.57) |
| Net asset value, end of period | $12.15 | $12.84 | $12.34 | $11.17 | $10.55 | $11.48 |
| Total ReturnD,E,F | (1.63)% | 6.60% | 11.58% | 9.68% | (2.63)% | 8.66% |
| Ratios to Average Net AssetsG,H | ||||||
| Expenses before reductions | 1.28%I | 1.28% | 1.28% | 1.29% | 1.29% | 1.30% |
| Expenses net of fee waivers, if any | 1.26%I | 1.26% | 1.28% | 1.29% | 1.29% | 1.30% |
| Expenses net of all reductions | 1.26%I | 1.26% | 1.27% | 1.28% | 1.28% | 1.30% |
| Net investment income (loss) | .92%I | .87% | .73% | 1.04% | .94% | .81% |
| Supplemental Data | ||||||
| Net assets, end of period (000 omitted) | $52,405 | $55,343 | $20,860 | $16,763 | $16,210 | $14,759 |
| Portfolio turnover rateJ | 40%I | 18%K | 18% | 21% | 22% | 11% |
A Calculated based on average shares outstanding during the period.
B Total distributions of $.31 per share is comprised of distributions from net investment income of $.082 and distributions from net realized gain of $.223 per share.
C Total distributions of $.37 per share is comprised of distributions from net investment income of $.127 and distributions from net realized gain of $.247 per share.
D Total returns for periods of less than one year are not annualized.
E Total returns would have been lower if certain expenses had not been reduced during the applicable periods shown.
F Total returns do not include the effect of the sales charges.
G Fees and expenses of any underlying Fidelity Central Funds are not included in the Fund's expense ratio. The Fund indirectly bears its proportionate share of the expenses of any underlying Fidelity Central Funds. Based on their most recent shareholder report date, the expenses ranged from less than .005% to .07%.
H Expense ratios reflect operating expenses of the class. Expenses before reductions do not reflect amounts reimbursed by the investment adviser or reductions from brokerage service arrangements or reductions from other expense offset arrangements and do not represent the amount paid by the class during periods when reimbursements or reductions occur. Expenses net of fee waivers reflect expenses after reimbursement by the investment adviser but prior to reductions from brokerage service arrangements or other expense offset arrangements. Expenses net of all reductions represent the net expenses paid by the class.
I Annualized
J Amount does not include the portfolio activity of any underlying Fidelity Central Funds.
K The portfolio turnover rate does not include the assets acquired in the merger.
See accompanying notes which are an integral part of the financial statements.
Fidelity Asset Manager 60% Class C
| Six months ended (Unaudited) March 31, | Years endedSeptember 30, | |||||
| 2019 | 2018 | 2017 | 2016 | 2015 | 2014 | |
| Selected Per–Share Data | ||||||
| Net asset value, beginning of period | $12.67 | $12.18 | $11.04 | $10.42 | $11.35 | $11.04 |
| Income from Investment Operations | ||||||
| Net investment income (loss)A | .02 | .05 | .03 | .06 | .05 | .04 |
| Net realized and unrealized gain (loss) | (.29) | .69 | 1.17 | .88 | (.38) | .81 |
| Total from investment operations | (.27) | .74 | 1.20 | .94 | (.33) | .85 |
| Distributions from net investment income | (.07) | (.02) | (.04) | (.08) | (.04) | (.04) |
| Distributions from net realized gain | (.32) | (.22) | (.02) | (.25) | (.56) | (.50) |
| Total distributions | (.39) | (.25)B | (.06) | (.32)C | (.60) | (.54) |
| Net asset value, end of period | $12.01 | $12.67 | $12.18 | $11.04 | $10.42 | $11.35 |
| Total ReturnD,E,F | (1.88)% | 6.09% | 10.94% | 9.27% | (3.08)% | 7.98% |
| Ratios to Average Net AssetsG,H | ||||||
| Expenses before reductions | 1.81%I | 1.79% | 1.78% | 1.78% | 1.80% | 1.80% |
| Expenses net of fee waivers, if any | 1.76%I | 1.76% | 1.78% | 1.78% | 1.79% | 1.80% |
| Expenses net of all reductions | 1.76%I | 1.76% | 1.78% | 1.78% | 1.79% | 1.80% |
| Net investment income (loss) | .41%I | .37% | .23% | .54% | .44% | .31% |
| Supplemental Data | ||||||
| Net assets, end of period (000 omitted) | $70,990 | $86,887 | $37,384 | $34,037 | $30,147 | $25,867 |
| Portfolio turnover rateJ | 40%I | 18%K | 18% | 21% | 22% | 11% |
A Calculated based on average shares outstanding during the period.
B Total distributions of $.25 per share is comprised of distributions from net investment income of $.022 and distributions from net realized gain of $.223 per share.
C Total distributions of $.32 per share is comprised of distributions from net investment income of $.076 and distributions from net realized gain of $.247 per share.
D Total returns for periods of less than one year are not annualized.
E Total returns would have been lower if certain expenses had not been reduced during the applicable periods shown.
F Total returns do not include the effect of the contingent deferred sales charge.
G Fees and expenses of any underlying Fidelity Central Funds are not included in the Fund's expense ratio. The Fund indirectly bears its proportionate share of the expenses of any underlying Fidelity Central Funds. Based on their most recent shareholder report date, the expenses ranged from less than .005% to .07%.
H Expense ratios reflect operating expenses of the class. Expenses before reductions do not reflect amounts reimbursed by the investment adviser or reductions from brokerage service arrangements or reductions from other expense offset arrangements and do not represent the amount paid by the class during periods when reimbursements or reductions occur. Expenses net of fee waivers reflect expenses after reimbursement by the investment adviser but prior to reductions from brokerage service arrangements or other expense offset arrangements. Expenses net of all reductions represent the net expenses paid by the class.
I Annualized
J Amount does not include the portfolio activity of any underlying Fidelity Central Funds.
K The portfolio turnover rate does not include the assets acquired in the merger.
See accompanying notes which are an integral part of the financial statements.
Fidelity Asset Manager 60%
| Six months ended (Unaudited) March 31, | Years endedSeptember 30, | |||||
| 2019 | 2018 | 2017 | 2016 | 2015 | 2014 | |
| Selected Per–Share Data | ||||||
| Net asset value, beginning of period | $12.98 | $12.47 | $11.29 | $10.66 | $11.59 | $11.22 |
| Income from Investment Operations | ||||||
| Net investment income (loss)A | .09 | .18 | .15 | .17 | .17 | .16 |
| Net realized and unrealized gain (loss) | (.31) | .70 | 1.21 | .90 | (.39) | .84 |
| Total from investment operations | (.22) | .88 | 1.36 | 1.07 | (.22) | 1.00 |
| Distributions from net investment income | (.18) | (.15) | (.15) | (.19) | (.16) | (.13) |
| Distributions from net realized gain | (.32) | (.22) | (.02) | (.25) | (.56) | (.50) |
| Total distributions | (.50) | (.37) | (.18)B | (.44) | (.71)C | (.63) |
| Net asset value, end of period | $12.26 | $12.98 | $12.47 | $11.29 | $10.66 | $11.59 |
| Total ReturnD,E | (1.34)% | 7.17% | 12.19% | 10.31% | (2.03)% | 9.26% |
| Ratios to Average Net AssetsF,G | ||||||
| Expenses before reductions | .71%H | .70% | .71% | .71% | .72% | .72% |
| Expenses net of fee waivers, if any | .69%H | .70% | .71% | .71% | .72% | .72% |
| Expenses net of all reductions | .69%H | .70% | .71% | .71% | .71% | .72% |
| Net investment income (loss) | 1.48%H | 1.44% | 1.30% | 1.61% | 1.51% | 1.39% |
| Supplemental Data | ||||||
| Net assets, end of period (000 omitted) | $2,677,390 | $2,679,353 | $1,821,025 | $1,426,502 | $1,275,181 | $1,187,056 |
| Portfolio turnover rateI | 40%H | 18%J | 18% | 21% | 22% | 11% |
A Calculated based on average shares outstanding during the period.
B Total distributions of $.18 per share is comprised of distributions from net investment income of $.153 and distributions from net realized gain of $.022 per share.
C Total distributions of $.71 per share is comprised of distributions from net investment income of $.155 and distributions from net realized gain of $.555 per share.
D Total returns for periods of less than one year are not annualized.
E Total returns would have been lower if certain expenses had not been reduced during the applicable periods shown.
F Fees and expenses of any underlying Fidelity Central Funds are not included in the Fund's expense ratio. The Fund indirectly bears its proportionate share of the expenses of any underlying Fidelity Central Funds. Based on their most recent shareholder report date, the expenses ranged from less than .005% to .07%.
G Expense ratios reflect operating expenses of the class. Expenses before reductions do not reflect amounts reimbursed by the investment adviser or reductions from brokerage service arrangements or reductions from other expense offset arrangements and do not represent the amount paid by the class during periods when reimbursements or reductions occur. Expenses net of fee waivers reflect expenses after reimbursement by the investment adviser but prior to reductions from brokerage service arrangements or other expense offset arrangements. Expenses net of all reductions represent the net expenses paid by the class.
H Annualized
I Amount does not include the portfolio activity of any underlying Fidelity Central Funds.
J The portfolio turnover rate does not include the assets acquired in the merger.
See accompanying notes which are an integral part of the financial statements.
Fidelity Asset Manager 60% Class I
| Six months ended (Unaudited) March 31, | Years endedSeptember 30, | |||||
| 2019 | 2018 | 2017 | 2016 | 2015 | 2014 | |
| Selected Per–Share Data | ||||||
| Net asset value, beginning of period | $12.99 | $12.48 | $11.30 | $10.66 | $11.59 | $11.22 |
| Income from Investment Operations | ||||||
| Net investment income (loss)A | .09 | .18 | .15 | .17 | .17 | .15 |
| Net realized and unrealized gain (loss) | (.31) | .70 | 1.20 | .90 | (.39) | .83 |
| Total from investment operations | (.22) | .88 | 1.35 | 1.07 | (.22) | .98 |
| Distributions from net investment income | (.17) | (.14) | (.15) | (.18) | (.15) | (.11) |
| Distributions from net realized gain | (.32) | (.22) | (.02) | (.25) | (.56) | (.50) |
| Total distributions | (.49) | (.37)B | (.17) | (.43) | (.71) | (.61) |
| Net asset value, end of period | $12.28 | $12.99 | $12.48 | $11.30 | $10.66 | $11.59 |
| Total ReturnC,D | (1.30)% | 7.12% | 12.16% | 10.37% | (2.08)% | 9.15% |
| Ratios to Average Net AssetsE,F | ||||||
| Expenses before reductions | .76%G | .75% | .75% | .75% | .76% | .78% |
| Expenses net of fee waivers, if any | .73%G | .74% | .74% | .74% | .76% | .78% |
| Expenses net of all reductions | .73%G | .74% | .74% | .74% | .75% | .78% |
| Net investment income (loss) | 1.44%G | 1.39% | 1.26% | 1.58% | 1.47% | 1.33% |
| Supplemental Data | ||||||
| Net assets, end of period (000 omitted) | $55,421 | $63,604 | $26,423 | $18,651 | $15,574 | $14,122 |
| Portfolio turnover rateH | 40%G | 18%I | 18% | 21% | 22% | 11% |
A Calculated based on average shares outstanding during the period.
B Total distributions of $.37 per share is comprised of distributions from net investment income of $.142 and distributions from net realized gain of $.223 per share.
C Total returns for periods of less than one year are not annualized.
D Total returns would have been lower if certain expenses had not been reduced during the applicable periods shown.
E Fees and expenses of any underlying Fidelity Central Funds are not included in the Fund's expense ratio. The Fund indirectly bears its proportionate share of the expenses of any underlying Fidelity Central Funds. Based on their most recent shareholder report date, the expenses ranged from less than .005% to .07%.
F Expense ratios reflect operating expenses of the class. Expenses before reductions do not reflect amounts reimbursed by the investment adviser or reductions from brokerage service arrangements or reductions from other expense offset arrangements and do not represent the amount paid by the class during periods when reimbursements or reductions occur. Expenses net of fee waivers reflect expenses after reimbursement by the investment adviser but prior to reductions from brokerage service arrangements or other expense offset arrangements. Expenses net of all reductions represent the net expenses paid by the class.
G Annualized
H Amount does not include the portfolio activity of any underlying Fidelity Central Funds.
I The portfolio turnover rate does not include the assets acquired in the merger.
See accompanying notes which are an integral part of the financial statements.
Fidelity Asset Manager 60% Class Z
| Six months ended (Unaudited) March 31, | |
| 2019 A | |
| Selected Per–Share Data | |
| Net asset value, beginning of period | $12.97 |
| Income from Investment Operations | |
| Net investment income (loss)B | .09 |
| Net realized and unrealized gain (loss) | (.29) |
| Total from investment operations | (.20) |
| Distributions from net investment income | (.19) |
| Distributions from net realized gain | (.32) |
| Total distributions | (.51) |
| Net asset value, end of period | $12.26 |
| Total ReturnC,D | (1.17)% |
| Ratios to Average Net AssetsE,F | |
| Expenses before reductions | .64%G |
| Expenses net of fee waivers, if any | .63%G |
| Expenses net of all reductions | .63%G |
| Net investment income (loss) | 1.54%G |
| Supplemental Data | |
| Net assets, end of period (000 omitted) | $3,488 |
| Portfolio turnover rateH | 40%G |
A For the period October 2, 2018 (commencement of sale of shares) to March 31, 2019.
B Calculated based on average shares outstanding during the period.
C Total returns for periods of less than one year are not annualized.
D Total returns would have been lower if certain expenses had not been reduced during the applicable periods shown.
E Fees and expenses of any underlying Fidelity Central Funds are not included in the Fund's expense ratio. The Fund indirectly bears its proportionate share of the expenses of any underlying Fidelity Central Funds. Based on their most recent shareholder report date, the expenses ranged from less than .005% to .07%.
F Expense ratios reflect operating expenses of the class. Expenses before reductions do not reflect amounts reimbursed by the investment adviser or reductions from brokerage service arrangements or reductions from other expense offset arrangements and do not represent the amount paid by the class during periods when reimbursements or reductions occur. Expense ratios before reductions for start-up periods may not be representative of longer-term operating periods. Expenses net of fee waivers reflect expenses after reimbursement by the investment adviser but prior to reductions from brokerage service arrangements or other expense offset arrangements. Expenses net of all reductions represent the net expenses paid by the class.
G Annualized
H Amount does not include the portfolio activity of any underlying Fidelity Central Funds.
See accompanying notes which are an integral part of the financial statements.
Fidelity Asset Manager® 70%
Investment Summary (Unaudited)
The information in the following tables is based on the combined investments of the Fund and its pro-rata share of the investments of Fidelity's Central Funds, other than the Commodity Strategy and Money Market Central Funds.Top Ten Stocks as of March 31, 2019
| % of fund's net assets | |
| Microsoft Corp. | 2.0 |
| Apple, Inc. | 2.0 |
| Amazon.com, Inc. | 1.2 |
| Alphabet, Inc. Class A | 1.1 |
| Roche Holdings AG (participation certificate) | 0.6 |
| UnitedHealth Group, Inc. | 0.6 |
| Adobe, Inc. | 0.5 |
| The Boeing Co. | 0.5 |
| Becton, Dickinson & Co. | 0.5 |
| AstraZeneca PLC (United Kingdom) | 0.5 |
| 9.5 |
Top Five Market Sectors as of March 31, 2019
| % of fund's net assets | |
| Financials | 14.8 |
| Information Technology | 11.0 |
| Health Care | 9.0 |
| Consumer Discretionary | 7.7 |
| Industrials | 6.7 |
Quality Diversification (% of fund's net assets)
| As of March 31, 2019 | ||
| U.S. Government and U.S. Government Agency Obligations | 12.4% | |
| AAA,AA,A | 1.5% | |
| BBB | 4.7% | |
| BB and Below | 3.8% | |
| Not Rated | 0.2% | |
| Equities* | 74.8% | |
| Short-Term Investments and Net Other Assets | 2.6% | |

* Includes investment in Fidelity® Commodity Strategy Central Fund of 0.7%
We have used ratings from Moody's Investors Service, Inc. Where Moody's® ratings are not available, we have used S&P® ratings. All ratings are as of the date indicated and do not reflect subsequent changes.
Asset Allocation (% of fund's net assets)
| As of March 31, 2019 | ||
| Stock Class and Equity Futures* | 74.7% | |
| Bond Class | 22.3% | |
| Short-Term Class | 3.0% | |

* Includes investment in Fidelity® Commodity Strategy Central Fund of 0.7%
Asset allocations in the pie charts reflect the categorization of assets as defined in the Fund's prospectus in effect as of the time periods indicated above. Percentages are adjusted for the effect of future contracts and swap contracts, if applicable.
At period end, foreign investments including the Fund's pro-rata share of the underlying Central Funds, other than the Commodity Strategy Central and Money Market Funds, was 23.8% of net assets.
Percentages in the above tables are adjusted for the effect of TBA Sale Commitments.
An unaudited holdings listing for the Fund, which presents direct holdings as well as the pro-rata share of any securities and other investments held indirectly through its investment in underlying Fidelity Central Funds, other than the Commodity Strategy and Money Market Central Funds, is available at fidelity.com and/or institutional.fidelity.com, as applicable.
Fidelity Asset Manager® 70%
Schedule of Investments March 31, 2019 (Unaudited)
Showing Percentage of Net Assets
| Equity Central Funds - 66.2% | |||
| Shares | Value | ||
| Fidelity Commodity Strategy Central Fund (a) | 7,013,945 | $34,789,166 | |
| Fidelity Communication Services Central Fund (a) | 1,031,318 | 201,437,069 | |
| Fidelity Consumer Discretionary Central Fund (a) | 768,477 | 252,006,514 | |
| Fidelity Consumer Staples Central Fund (a) | 824,857 | 160,896,611 | |
| Fidelity Emerging Markets Equity Central Fund (a) | 1,253,578 | 267,312,913 | |
| Fidelity Energy Central Fund (a) | 1,098,612 | 120,649,525 | |
| Fidelity Financials Central Fund (a) | 4,641,375 | 447,846,286 | |
| Fidelity Health Care Central Fund (a) | 860,136 | 368,809,185 | |
| Fidelity Industrials Central Fund (a) | 878,353 | 239,614,580 | |
| Fidelity Information Technology Central Fund (a) | 1,476,397 | 551,316,004 | |
| Fidelity International Equity Central Fund (a) | 8,468,832 | 643,038,445 | |
| Fidelity Materials Central Fund (a) | 315,875 | 63,434,003 | |
| Fidelity Real Estate Equity Central Fund (a) | 211,912 | 24,157,937 | |
| Fidelity Utilities Central Fund (a) | 441,696 | 82,508,845 | |
| TOTAL EQUITY CENTRAL FUNDS | |||
| (Cost $2,356,884,789) | 3,457,817,083 | ||
| Fixed-Income Central Funds - 22.9% | |||
| High Yield Fixed-Income Funds - 3.3% | |||
| Fidelity Emerging Markets Debt Central Fund (a) | 2,579,867 | 24,405,540 | |
| Fidelity Floating Rate Central Fund (a) | 488,803 | 49,466,822 | |
| Fidelity High Income Central Fund 1 (a) | 1,050,202 | 98,120,409 | |
| TOTAL HIGH YIELD FIXED-INCOME FUNDS | 171,992,771 | ||
| Investment Grade Fixed-Income Funds - 19.6% | |||
| Fidelity Inflation-Protected Bond Index Central Fund (a) | 2,096,818 | 209,493,045 | |
| Fidelity International Credit Central Fund (a) | 330,944 | 32,680,732 | |
| Fidelity Investment Grade Bond Central Fund (a) | 7,225,661 | 781,961,028 | |
| TOTAL INVESTMENT GRADE FIXED-INCOME FUNDS | 1,024,134,805 | ||
| TOTAL FIXED-INCOME CENTRAL FUNDS | |||
| (Cost $1,163,820,889) | 1,196,127,576 | ||
| Money Market Central Funds - 1.3% | |||
| Fidelity Cash Central Fund, 2.48% (b) | 34,486,529 | 34,493,427 | |
| Fidelity Money Market Central Fund, 2.68% (b) | 4,105,880 | 4,106,290 | |
| Fidelity Securities Lending Cash Central Fund 2.48% (b)(c) | 31,921,558 | 31,924,750 | |
| TOTAL MONEY MARKET CENTRAL FUNDS | |||
| (Cost $70,524,013) | 70,524,467 | ||
| Principal Amount | Value | ||
| U.S. Treasury Obligations - 0.2% | |||
| U.S. Treasury Bills, yield at date of purchase 2.37% to 2.39% 4/18/19 to 6/27/19 (d) | |||
| (Cost $8,174,322) | 8,190,000 | 8,174,263 | |
| Shares | Value | ||
| Investment Companies - 10.0% | |||
| iShares 20+ Year Treasury Bond ETF (e) | 606,497 | $76,685,481 | |
| iShares Core MSCI Emerging Markets ETF | 3,508,153 | 181,406,589 | |
| iShares MSCI EAFE Index ETF | 2,331,166 | 151,199,427 | |
| iShares MSCI Japan ETF | 2,049,375 | 112,141,800 | |
| TOTAL INVESTMENT COMPANIES | |||
| (Cost $501,034,168) | 521,433,297 | ||
| TOTAL INVESTMENT IN SECURITIES - 100.6% | |||
| (Cost $4,100,438,181) | 5,254,076,686 | ||
| NET OTHER ASSETS (LIABILITIES) - (0.6)% | (33,764,640) | ||
| NET ASSETS - 100% | $5,220,312,046 |
| Futures Contracts | |||||
| Number of contracts | Expiration Date | Notional Amount | Value | Unrealized Appreciation/(Depreciation) | |
| Sold | |||||
| Equity Index Contracts | |||||
| CME E-mini S&P 500 Index Contracts (United States) | 1,289 | June 2019 | $182,896,210 | $(5,535,889) | $(5,535,889) |
The notional amount of futures sold as a percentage of Net Assets is 3.5%
Security Type Abbreviations
ETF – Exchange-Traded Fund
Legend
(a) Affiliated fund that is generally available only to investment companies and other accounts managed by Fidelity Investments. A complete unaudited schedule of portfolio holdings for each Fidelity Central Fund is filed with the SEC for the first and third quarters of each fiscal year on Form N-PORT and is available upon request or at the SEC's website at www.sec.gov. An unaudited holdings listing for the Fund, which presents direct holdings as well as the pro-rata share of securities and other investments held indirectly through its investment in underlying non-money market Fidelity Central Funds, other than the Commodity Strategy Central Fund, is available at fidelity.com and/or institutional.fidelity.com, as applicable. In addition, each Fidelity Central Fund's financial statements are available on the SEC's website or upon request.
(b) Affiliated fund that is generally available only to investment companies and other accounts managed by Fidelity Investments. The rate quoted is the annualized seven-day yield of the fund at period end. A complete unaudited listing of the fund's holdings as of its most recent quarter end is available upon request. In addition, each Fidelity Central Fund's financial statements are available on the SEC's website or upon request.
(c) Investment made with cash collateral received from securities on loan.
(d) Security or a portion of the security was pledged to cover margin requirements for futures contracts. At period end, the value of securities pledged amounted to $8,174,623.
(e) Security or a portion of the security is on loan at period end.
Affiliated Central Funds
Information regarding fiscal year to date income earned by the Fund from investments in Fidelity Central Funds is as follows:
| Fund | Income earned |
| Fidelity Cash Central Fund | $2,097,853 |
| Fidelity Commodity Strategy Central Fund | 281,477 |
| Fidelity Communication Services Central Fund | 719,156 |
| Fidelity Consumer Discretionary Central Fund | 9,074,930 |
| Fidelity Consumer Staples Central Fund | 13,804,337 |
| Fidelity Emerging Markets Debt Central Fund | 740,108 |
| Fidelity Emerging Markets Equity Central Fund | 12,611,222 |
| Fidelity Energy Central Fund | 1,287,728 |
| Fidelity Financials Central Fund | 25,116,666 |
| Fidelity Floating Rate Central Fund | 1,468,519 |
| Fidelity Health Care Central Fund | 20,243,771 |
| Fidelity High Income Central Fund 1 | 3,061,013 |
| Fidelity Industrials Central Fund | 12,311,995 |
| Fidelity Inflation-Protected Bond Index Central Fund | 4,912,616 |
| Fidelity Information Technology Central Fund | 97,105,516 |
| Fidelity International Credit Central Fund | 1,191,333 |
| Fidelity International Equity Central Fund | 34,320,184 |
| Fidelity Investment Grade Bond Central Fund | 13,447,824 |
| Fidelity Materials Central Fund | 5,368,912 |
| Fidelity Money Market Central Fund | 52,363 |
| Fidelity Real Estate Equity Central Fund | 826,428 |
| Fidelity Securities Lending Cash Central Fund | 32,387 |
| Fidelity Utilities Central Fund | 7,102,413 |
| Total | $267,178,751 |
Amounts in the income column in the above table include any capital gain distributions from underlying funds, which are presented in the corresponding line-item in the Statement of Operations, if applicable.
Fiscal year to date information regarding the Fund’s investments in non-Money Market Central Funds, including the ownership percentage, is presented below.
| Fund | Value, beginning of period | Purchases(a) | Sales Proceeds(b) | Realized Gain/Loss | Change in Unrealized appreciation (depreciation) | Value, end of period | % ownership, end of period |
| Fidelity Commodity Strategy Central Fund | $11,109,600 | $27,348,294 | $1,094,087 | $(49,432) | $(2,525,209) | $34,789,166 | 13.5% |
| Fidelity Communication Services Central Fund | 53,100,575 | 145,534,666 | 9,186,957 | 337,454 | 11,651,331 | 201,437,069 | 12.4% |
| Fidelity Consumer Discretionary Central Fund | 305,835,749 | 17,003,003 | 51,415,716 | 5,726,651 | (25,143,173) | 252,006,514 | 13.1% |
| Fidelity Consumer Staples Central Fund | 161,273,817 | 15,516,176 | 10,109,828 | (854,422) | (4,929,132) | 160,896,611 | 12.6% |
| Fidelity Emerging Markets Debt Central Fund | 24,101,472 | 1,114,263 | 945,641 | 1,858 | 133,588 | 24,405,540 | 16.7% |
| Fidelity Emerging Markets Equity Central Fund | 170,926,385 | 109,924,262 | 11,497,696 | (1,138,941) | (901,097) | 267,312,913 | 25.2% |
| Fidelity Energy Central Fund | 157,433,278 | 2,842,059 | 8,796,733 | (800,113) | (30,028,966) | 120,649,525 | 12.8% |
| Fidelity Financials Central Fund | 487,907,530 | 30,239,906 | 32,250,956 | (2,063,346) | (35,986,848) | 447,846,286 | 13.6% |
| Fidelity Floating Rate Central Fund | 50,152,839 | 2,219,461 | 1,891,284 | (18,747) | (995,447) | 49,466,822 | 2.4% |
| Fidelity Health Care Central Fund | 425,031,712 | 24,396,642 | 35,922,641 | 3,435,410 | (48,131,938) | 368,809,185 | 12.9% |
| Fidelity High Income Central Fund 1 | 81,395,390 | 20,601,198 | 3,164,233 | (16,198) | (695,748) | 98,120,409 | 19.4% |
| Fidelity Industrials Central Fund | 273,287,926 | 15,085,622 | 18,245,335 | (1,030,589) | (29,483,044) | 239,614,580 | 13.3% |
| Fidelity Inflation-Protected Bond Index Central Fund | 181,866,950 | 37,826,692 | 10,374,982 | (46,264) | 220,649 | 209,493,045 | 17.7% |
| Fidelity Information Technology Central Fund | 727,665,877 | 126,912,970 | 145,638,941 | (6,594,574) | (151,029,328) | 551,316,004 | 12.9% |
| Fidelity International Credit Central Fund | 31,939,898 | 1,642,128 | 1,135,119 | (11,026) | 244,851 | 32,680,732 | 18.2% |
| Fidelity International Equity Central Fund | 695,253,200 | 46,652,353 | 31,182,095 | (281,822) | (67,403,191) | 643,038,445 | 26.1% |
| Fidelity Investment Grade Bond Central Fund | 872,914,296 | 76,417,143 | 186,916,084 | (699,423) | 20,245,096 | 781,961,028 | 10.0% |
| Fidelity Materials Central Fund | 72,029,991 | 6,364,064 | 4,530,071 | (821,992) | (9,607,989) | 63,434,003 | 13.3% |
| Fidelity Real Estate Equity Central Fund | 22,824,385 | 1,126,762 | 756,550 | 15,949 | 947,391 | 24,157,937 | 17.9% |
| Fidelity Utilities Central Fund | 82,470,426 | 7,988,041 | 6,881,911 | 289,094 | (1,356,805) | 82,508,845 | 13.3% |
| Total | $4,888,521,296 | $716,755,705 | $571,936,860 | $(4,620,473) | $(374,775,009) | $4,653,944,659 |
(a) Includes the value of shares purchased through in-kind transactions, if applicable.
(b) Includes the value of shares redeemed through in-kind transactions, if applicable.
Investment Valuation
The following is a summary of the inputs used, as of March 31, 2019, involving the Fund's assets and liabilities carried at fair value. The inputs or methodology used for valuing securities may not be an indication of the risk associated with investing in those securities. For more information on valuation inputs, and their aggregation into the levels used below, please refer to the Investment Valuation section in the accompanying Notes to Financial Statements.
| Valuation Inputs at Reporting Date: | ||||
| Description | Total | Level 1 | Level 2 | Level 3 |
| Investments in Securities: | ||||
| Equity Central Funds | $3,457,817,083 | $3,457,817,083 | $-- | $-- |
| Fixed-Income Central Funds | 1,196,127,576 | 1,196,127,576 | -- | -- |
| Money Market Central Funds | 70,524,467 | 70,524,467 | -- | -- |
| Other Short-Term Investments | 8,174,263 | -- | 8,174,263 | -- |
| Investment Companies | 521,433,297 | 521,433,297 | -- | -- |
| Total Investments in Securities: | $5,254,076,686 | $5,245,902,423 | $8,174,263 | $-- |
| Derivative Instruments: | ||||
| Liabilities | ||||
| Futures Contracts | $(5,535,889) | $(5,535,889) | $-- | $-- |
| Total Liabilities | $(5,535,889) | $(5,535,889) | $-- | $-- |
| Total Derivative Instruments: | $(5,535,889) | $(5,535,889) | $-- | $-- |
Value of Derivative Instruments
The following table is a summary of the Fund's value of derivative instruments by primary risk exposure as of March 31, 2019. For additional information on derivative instruments, please refer to the Derivative Instruments section in the accompanying Notes to Financial Statements.
| Primary Risk Exposure / Derivative Type | Value | |
| Asset | Liability | |
| Equity Risk | ||
| Futures Contracts(a) | $0 | $(5,535,889) |
| Total Equity Risk | 0 | (5,535,889) |
| Total Value of Derivatives | $0 | $(5,535,889) |
(a) Reflects gross cumulative appreciation (depreciation) on futures contracts as presented in the Schedule of Investments. In the Statement of Assets and Liabilities, the period end daily variation margin is included in receivable or payable for daily variation margin on futures contracts, and the net cumulative appreciation (depreciation) is included in distributable earnings.
Other Information
Distribution of investments by country or territory of incorporation, as a percentage of Total Net Assets, is as follows (Unaudited):
| United States of America | 76.2% |
| United Kingdom | 3.2% |
| Japan | 2.5% |
| Cayman Islands | 1.7% |
| France | 1.5% |
| Switzerland | 1.5% |
| Canada | 1.5% |
| Netherlands | 1.3% |
| Germany | 1.1% |
| Others (Individually Less Than 1%) | 9.5% |
| 100.0% |
The information in the above table is based on the combined investments of the Fund and its pro-rata share of the investments of Fidelity's Central Funds, other than the Commodity Strategy and Money Market Central Funds.
See accompanying notes which are an integral part of the financial statements.
Fidelity Asset Manager® 70%
Financial Statements
Statement of Assets and Liabilities
| March 31, 2019 (Unaudited) | ||
| Assets | ||
| Investment in securities, at value (including securities loaned of $31,230,680) — See accompanying schedule: Unaffiliated issuers (cost $509,208,490) | $529,607,560 | |
| Fidelity Central Funds (cost $3,591,229,691) | 4,724,469,126 | |
| Total Investment in Securities (cost $4,100,438,181) | $5,254,076,686 | |
| Receivable for investments sold | 2,105,389 | |
| Receivable for fund shares sold | 4,992,404 | |
| Distributions receivable from Fidelity Central Funds | 136,703 | |
| Prepaid expenses | 3,913 | |
| Other receivables | 62,259 | |
| Total assets | 5,261,377,354 | |
| Liabilities | ||
| Payable for investments purchased | $1,564,218 | |
| Payable for fund shares redeemed | 3,353,040 | |
| Accrued management fee | 2,328,550 | |
| Distribution and service plan fees payable | 100,265 | |
| Payable for daily variation margin on futures contracts | 1,082,760 | |
| Other affiliated payables | 644,347 | |
| Other payables and accrued expenses | 67,378 | |
| Collateral on securities loaned | 31,924,750 | |
| Total liabilities | 41,065,308 | |
| Net Assets | $5,220,312,046 | |
| Net Assets consist of: | ||
| Paid in capital | $4,352,316,263 | |
| Total distributable earnings (loss) | 867,995,783 | |
| Net Assets | $5,220,312,046 | |
| Net Asset Value and Maximum Offering Price | ||
| Class A: | ||
| Net Asset Value and redemption price per share ($162,054,740 ÷ 7,565,246 shares) | $21.42 | |
| Maximum offering price per share (100/94.25 of $21.42) | $22.73 | |
| Class M: | ||
| Net Asset Value and redemption price per share ($59,834,798 ÷ 2,791,883 shares) | $21.43 | |
| Maximum offering price per share (100/96.50 of $21.43) | $22.21 | |
| Class C: | ||
| Net Asset Value and offering price per share ($42,380,956 ÷ 1,986,844 shares)(a) | $21.33 | |
| Asset Manager 70%: | ||
| Net Asset Value, offering price and redemption price per share ($4,883,035,610 ÷ 227,706,139 shares) | $21.44 | |
| Class I: | ||
| Net Asset Value, offering price and redemption price per share ($70,823,145 ÷ 3,301,395 shares) | $21.45 | |
| Class Z: | ||
| Net Asset Value, offering price and redemption price per share ($2,182,797 ÷ 101,863 shares) | $21.43 |
(a) Redemption price per share is equal to net asset value less any applicable contingent deferred sales charge.
See accompanying notes which are an integral part of the financial statements.
Statement of Operations
| Six months ended March 31, 2019 (Unaudited) | ||
| Investment Income | ||
| Dividends | $5,253,614 | |
| Interest | 78,818 | |
| Income from Fidelity Central Funds | 44,175,125 | |
| Total income | 49,507,557 | |
| Expenses | ||
| Management fee | $13,653,114 | |
| Transfer agent fees | 3,147,621 | |
| Distribution and service plan fees | 609,849 | |
| Accounting and security lending fees | 686,098 | |
| Custodian fees and expenses | 3,101 | |
| Independent trustees' fees and expenses | 11,747 | |
| Registration fees | 78,831 | |
| Audit | 16,715 | |
| Legal | 5,024 | |
| Miscellaneous | 18,040 | |
| Total expenses before reductions | 18,230,140 | |
| Expense reductions | (79,701) | |
| Total expenses after reductions | 18,150,439 | |
| Net investment income (loss) | 31,357,118 | |
| Realized and Unrealized Gain (Loss) | ||
| Net realized gain (loss) on: | ||
| Investment securities: | ||
| Unaffiliated issuers | 2,159,703 | |
| Fidelity Central Funds | (4,620,390) | |
| Futures contracts | 3,320,623 | |
| Capital gain distributions from Fidelity Central Funds | 223,003,626 | |
| Total net realized gain (loss) | 223,863,562 | |
| Change in net unrealized appreciation (depreciation) on: | ||
| Investment securities: | ||
| Unaffiliated issuers | (5,444,508) | |
| Fidelity Central Funds | (374,774,940) | |
| Futures contracts | (2,284,298) | |
| Total change in net unrealized appreciation (depreciation) | (382,503,746) | |
| Net gain (loss) | (158,640,184) | |
| Net increase (decrease) in net assets resulting from operations | $(127,283,066) |
See accompanying notes which are an integral part of the financial statements.
Statement of Changes in Net Assets
| Six months ended March 31, 2019 (Unaudited) | Year ended September 30, 2018 | |
| Increase (Decrease) in Net Assets | ||
| Operations | ||
| Net investment income (loss) | $31,357,118 | $67,833,889 |
| Net realized gain (loss) | 223,863,562 | 262,073,124 |
| Change in net unrealized appreciation (depreciation) | (382,503,746) | 102,893,743 |
| Net increase (decrease) in net assets resulting from operations | (127,283,066) | 432,800,756 |
| Distributions to shareholders | (282,804,003) | – |
| Distributions to shareholders from net investment income | – | (57,952,371) |
| Distributions to shareholders from net realized gain | – | (140,405,094) |
| Total distributions | (282,804,003) | (198,357,465) |
| Share transactions - net increase (decrease) | 186,991,416 | 196,852,504 |
| Total increase (decrease) in net assets | (223,095,653) | 431,295,795 |
| Net Assets | ||
| Beginning of period | 5,443,407,699 | 5,012,111,904 |
| End of period | $5,220,312,046 | $5,443,407,699 |
| Other Information | ||
| Undistributed net investment income end of period | $43,827,955 |
See accompanying notes which are an integral part of the financial statements.
Financial Highlights
Fidelity Asset Manager 70% Class A
| Six months ended (Unaudited) March 31, | Years endedSeptember 30, | |||||
| 2019 | 2018 | 2017 | 2016 | 2015 | 2014 | |
| Selected Per–Share Data | ||||||
| Net asset value, beginning of period | $23.27 | $22.26 | $19.78 | $18.84 | $21.24 | $19.60 |
| Income from Investment Operations | ||||||
| Net investment income (loss)A | .10 | .23 | .19 | .22 | .22 | .21 |
| Net realized and unrealized gain (loss) | (.79) | 1.59 | 2.53 | 1.70 | (.80) | 1.67 |
| Total from investment operations | (.69) | 1.82 | 2.72 | 1.92 | (.58) | 1.88 |
| Distributions from net investment income | (.25) | (.19) | (.20) | (.25) | (.22) | (.16) |
| Distributions from net realized gain | (.91) | (.62) | (.04) | (.73) | (1.60) | (.07) |
| Total distributions | (1.16) | (.81) | (.24) | (.98) | (1.82) | (.24)B |
| Net asset value, end of period | $21.42 | $23.27 | $22.26 | $19.78 | $18.84 | $21.24 |
| Total ReturnC,D,E | (2.44)% | 8.31% | 13.89% | 10.57% | (2.96)% | 9.65% |
| Ratios to Average Net AssetsF,G | ||||||
| Expenses before reductions | 1.00%H | 1.00% | 1.02% | 1.02% | 1.03% | 1.03% |
| Expenses net of fee waivers, if any | 1.00%H | 1.00% | 1.01% | 1.02% | 1.03% | 1.03% |
| Expenses net of all reductions | 1.00%H | 1.00% | 1.01% | 1.02% | 1.02% | 1.03% |
| Net investment income (loss) | .96%H | .99% | .90% | 1.17% | 1.07% | 1.00% |
| Supplemental Data | ||||||
| Net assets, end of period (000 omitted) | $162,055 | $155,622 | $146,562 | $146,585 | $134,849 | $143,310 |
| Portfolio turnover rateI | 38%H | 21% | 19% | 21% | 20% | 13% |
A Calculated based on average shares outstanding during the period.
B Total distributions of $.24 per share is comprised of distributions from net investment income of $.161 and distributions from net realized gain of $.074 per share.
C Total returns for periods of less than one year are not annualized.
D Total returns would have been lower if certain expenses had not been reduced during the applicable periods shown.
E Total returns do not include the effect of the sales charges.
F Fees and expenses of any underlying Fidelity Central Funds are not included in the Fund's expense ratio. The Fund indirectly bears its proportionate share of the expenses of any underlying Fidelity Central Funds. Based on their most recent shareholder report date, the expenses ranged from less than .005% to .07%.
G Expense ratios reflect operating expenses of the class. Expenses before reductions do not reflect amounts reimbursed by the investment adviser or reductions from brokerage service arrangements or reductions from other expense offset arrangements and do not represent the amount paid by the class during periods when reimbursements or reductions occur. Expenses net of fee waivers reflect expenses after reimbursement by the investment adviser but prior to reductions from brokerage service arrangements or other expense offset arrangements. Expenses net of all reductions represent the net expenses paid by the class.
H Annualized
I Amount does not include the portfolio activity of any underlying Fidelity Central Funds.
See accompanying notes which are an integral part of the financial statements.
Fidelity Asset Manager 70% Class M
| Six months ended (Unaudited) March 31, | Years endedSeptember 30, | |||||
| 2019 | 2018 | 2017 | 2016 | 2015 | 2014 | |
| Selected Per–Share Data | ||||||
| Net asset value, beginning of period | $23.24 | $22.25 | $19.77 | $18.82 | $21.22 | $19.58 |
| Income from Investment Operations | ||||||
| Net investment income (loss)A | .08 | .17 | .13 | .17 | .17 | .15 |
| Net realized and unrealized gain (loss) | (.79) | 1.58 | 2.54 | 1.70 | (.80) | 1.67 |
| Total from investment operations | (.71) | 1.75 | 2.67 | 1.87 | (.63) | 1.82 |
| Distributions from net investment income | (.19) | (.14) | (.15) | (.20) | (.16) | (.11) |
| Distributions from net realized gain | (.91) | (.62) | (.04) | (.73) | (1.60) | (.07) |
| Total distributions | (1.10) | (.76) | (.19) | (.92)B | (1.77)C | (.18) |
| Net asset value, end of period | $21.43 | $23.24 | $22.25 | $19.77 | $18.82 | $21.22 |
| Total ReturnD,E,F | (2.55)% | 7.99% | 13.63% | 10.31% | (3.25)% | 9.38% |
| Ratios to Average Net AssetsG,H | ||||||
| Expenses before reductions | 1.25%I | 1.25% | 1.27% | 1.28% | 1.29% | 1.29% |
| Expenses net of fee waivers, if any | 1.25%I | 1.25% | 1.27% | 1.28% | 1.28% | 1.29% |
| Expenses net of all reductions | 1.24%I | 1.25% | 1.27% | 1.28% | 1.28% | 1.29% |
| Net investment income (loss) | .71%I | .74% | .64% | .91% | .81% | .74% |
| Supplemental Data | ||||||
| Net assets, end of period (000 omitted) | $59,835 | $61,587 | $53,245 | $48,149 | $46,685 | $49,337 |
| Portfolio turnover rateJ | 38%I | 21% | 19% | 21% | 20% | 13% |
A Calculated based on average shares outstanding during the period.
B Total distributions of $.92 per share is comprised of distributions from net investment income of $.195 and distributions from net realized gain of $.726 per share.
C Total distributions of $1.77 per share is comprised of distributions from net investment income of $.161 and distributions from net realized gain of $1.604 per share.
D Total returns for periods of less than one year are not annualized.
E Total returns would have been lower if certain expenses had not been reduced during the applicable periods shown.
F Total returns do not include the effect of the sales charges.
G Fees and expenses of any underlying Fidelity Central Funds are not included in the Fund's expense ratio. The Fund indirectly bears its proportionate share of the expenses of any underlying Fidelity Central Funds. Based on their most recent shareholder report date, the expenses ranged from less than .005% to .07%.
H Expense ratios reflect operating expenses of the class. Expenses before reductions do not reflect amounts reimbursed by the investment adviser or reductions from brokerage service arrangements or reductions from other expense offset arrangements and do not represent the amount paid by the class during periods when reimbursements or reductions occur. Expenses net of fee waivers reflect expenses after reimbursement by the investment adviser but prior to reductions from brokerage service arrangements or other expense offset arrangements. Expenses net of all reductions represent the net expenses paid by the class.
I Annualized
J Amount does not include the portfolio activity of any underlying Fidelity Central Funds.
See accompanying notes which are an integral part of the financial statements.
Fidelity Asset Manager 70% Class C
| Six months ended (Unaudited) March 31, | Years endedSeptember 30, | |||||
| 2019 | 2018 | 2017 | 2016 | 2015 | 2014 | |
| Selected Per–Share Data | ||||||
| Net asset value, beginning of period | $23.06 | $22.08 | $19.63 | $18.69 | $21.08 | $19.48 |
| Income from Investment Operations | ||||||
| Net investment income (loss)A | .02 | .05 | .03 | .08 | .06 | .05 |
| Net realized and unrealized gain (loss) | (.76) | 1.57 | 2.51 | 1.69 | (.78) | 1.66 |
| Total from investment operations | (.74) | 1.62 | 2.54 | 1.77 | (.72) | 1.71 |
| Distributions from net investment income | (.07) | (.03) | (.05) | (.10) | (.07) | (.04) |
| Distributions from net realized gain | (.91) | (.62) | (.04) | (.73) | (1.60) | (.07) |
| Total distributions | (.99)B | (.64)C | (.09) | (.83) | (1.67) | (.11) |
| Net asset value, end of period | $21.33 | $23.06 | $22.08 | $19.63 | $18.69 | $21.08 |
| Total ReturnD,E,F | (2.77)% | 7.46% | 13.00% | 9.78% | (3.69)% | 8.82% |
| Ratios to Average Net AssetsG,H | ||||||
| Expenses before reductions | 1.76%I | 1.75% | 1.77% | 1.78% | 1.79% | 1.79% |
| Expenses net of fee waivers, if any | 1.76%I | 1.75% | 1.77% | 1.78% | 1.78% | 1.79% |
| Expenses net of all reductions | 1.75%I | 1.75% | 1.77% | 1.78% | 1.78% | 1.78% |
| Net investment income (loss) | .20%I | .24% | .14% | .41% | .32% | .25% |
| Supplemental Data | ||||||
| Net assets, end of period (000 omitted) | $42,381 | $63,398 | $59,046 | $56,605 | $52,860 | $55,104 |
| Portfolio turnover rateJ | 38%I | 21% | 19% | 21% | 20% | 13% |
A Calculated based on average shares outstanding during the period.
B Total distributions of $.99 per share is comprised of distributions from net investment income of $.073 and distributions from net realized gain of $.914 per share.
C Total distributions of $.64 per share is comprised of distributions from net investment income of $.028 and distributions from net realized gain of $.615 per share.
D Total returns for periods of less than one year are not annualized.
E Total returns would have been lower if certain expenses had not been reduced during the applicable periods shown.
F Total returns do not include the effect of the contingent deferred sales charge.
G Fees and expenses of any underlying Fidelity Central Funds are not included in the Fund's expense ratio. The Fund indirectly bears its proportionate share of the expenses of any underlying Fidelity Central Funds. Based on their most recent shareholder report date, the expenses ranged from less than .005% to .07%.
H Expense ratios reflect operating expenses of the class. Expenses before reductions do not reflect amounts reimbursed by the investment adviser or reductions from brokerage service arrangements or reductions from other expense offset arrangements and do not represent the amount paid by the class during periods when reimbursements or reductions occur. Expenses net of fee waivers reflect expenses after reimbursement by the investment adviser but prior to reductions from brokerage service arrangements or other expense offset arrangements. Expenses net of all reductions represent the net expenses paid by the class.
I Annualized
J Amount does not include the portfolio activity of any underlying Fidelity Central Funds.
See accompanying notes which are an integral part of the financial statements.
Fidelity Asset Manager 70%
| Six months ended (Unaudited) March 31, | Years endedSeptember 30, | |||||
| 2019 | 2018 | 2017 | 2016 | 2015 | 2014 | |
| Selected Per–Share Data | ||||||
| Net asset value, beginning of period | $23.33 | $22.33 | $19.84 | $18.89 | $21.30 | $19.66 |
| Income from Investment Operations | ||||||
| Net investment income (loss)A | .13 | .30 | .25 | .28 | .28 | .27 |
| Net realized and unrealized gain (loss) | (.79) | 1.58 | 2.54 | 1.71 | (.80) | 1.67 |
| Total from investment operations | (.66) | 1.88 | 2.79 | 1.99 | (.52) | 1.94 |
| Distributions from net investment income | (.31) | (.26) | (.26) | (.31) | (.28) | (.23) |
| Distributions from net realized gain | (.91) | (.62) | (.04) | (.73) | (1.60) | (.07) |
| Total distributions | (1.23)B | (.88) | (.30) | (1.04) | (1.89)C | (.30) |
| Net asset value, end of period | $21.44 | $23.33 | $22.33 | $19.84 | $18.89 | $21.30 |
| Total ReturnD,E | (2.27)% | 8.57% | 14.25% | 10.97% | (2.69)% | 9.98% |
| Ratios to Average Net AssetsF,G | ||||||
| Expenses before reductions | .69%H | .69% | .71% | .72% | .72% | .73% |
| Expenses net of fee waivers, if any | .69%H | .69% | .71% | .71% | .72% | .73% |
| Expenses net of all reductions | .69%H | .69% | .70% | .71% | .71% | .72% |
| Net investment income (loss) | 1.27%H | 1.30% | 1.20% | 1.48% | 1.38% | 1.31% |
| Supplemental Data | ||||||
| Net assets, end of period (000 omitted) | $4,883,036 | $5,088,118 | $4,673,798 | $3,996,905 | $3,745,336 | $3,729,256 |
| Portfolio turnover rateI | 38%H | 21% | 19% | 21% | 20% | 13% |
A Calculated based on average shares outstanding during the period.
B Total distributions of $1.23 per share is comprised of distributions from net investment income of $.314 and distributions from net realized gain of $.914 per share.
C Total distributions of $1.89 per share is comprised of distributions from net investment income of $.282 and distributions from net realized gain of $1.604 per share.
D Total returns for periods of less than one year are not annualized.
E Total returns would have been lower if certain expenses had not been reduced during the applicable periods shown.
F Fees and expenses of any underlying Fidelity Central Funds are not included in the Fund's expense ratio. The Fund indirectly bears its proportionate share of the expenses of any underlying Fidelity Central Funds. Based on their most recent shareholder report date, the expenses ranged from less than .005% to .07%.
G Expense ratios reflect operating expenses of the class. Expenses before reductions do not reflect amounts reimbursed by the investment adviser or reductions from brokerage service arrangements or reductions from other expense offset arrangements and do not represent the amount paid by the class during periods when reimbursements or reductions occur. Expenses net of fee waivers reflect expenses after reimbursement by the investment adviser but prior to reductions from brokerage service arrangements or other expense offset arrangements. Expenses net of all reductions represent the net expenses paid by the class.
H Annualized
I Amount does not include the portfolio activity of any underlying Fidelity Central Funds.
See accompanying notes which are an integral part of the financial statements.
Fidelity Asset Manager 70% Class I
| Six months ended (Unaudited) March 31, | Years endedSeptember 30, | |||||
| 2019 | 2018 | 2017 | 2016 | 2015 | 2014 | |
| Selected Per–Share Data | ||||||
| Net asset value, beginning of period | $23.33 | $22.33 | $19.85 | $18.90 | $21.31 | $19.66 |
| Income from Investment Operations | ||||||
| Net investment income (loss)A | .13 | .29 | .24 | .28 | .27 | .26 |
| Net realized and unrealized gain (loss) | (.79) | 1.58 | 2.54 | 1.70 | (.80) | 1.68 |
| Total from investment operations | (.66) | 1.87 | 2.78 | 1.98 | (.53) | 1.94 |
| Distributions from net investment income | (.30) | (.25) | (.26) | (.30) | (.27) | (.22) |
| Distributions from net realized gain | (.91) | (.62) | (.04) | (.73) | (1.60) | (.07) |
| Total distributions | (1.22)B | (.87) | (.30) | (1.03) | (1.88)C | (.29) |
| Net asset value, end of period | $21.45 | $23.33 | $22.33 | $19.85 | $18.90 | $21.31 |
| Total ReturnD,E | (2.27)% | 8.53% | 14.22% | 10.92% | (2.73)% | 9.98% |
| Ratios to Average Net AssetsF,G | ||||||
| Expenses before reductions | .73%H | .72% | .74% | .74% | .76% | .77% |
| Expenses net of fee waivers, if any | .72%H | .72% | .74% | .74% | .76% | .77% |
| Expenses net of all reductions | .72%H | .72% | .73% | .74% | .75% | .77% |
| Net investment income (loss) | 1.23%H | 1.27% | 1.17% | 1.45% | 1.34% | 1.26% |
| Supplemental Data | ||||||
| Net assets, end of period (000 omitted) | $70,823 | $74,682 | $79,461 | $42,321 | $42,581 | $40,561 |
| Portfolio turnover rateI | 38%H | 21% | 19% | 21% | 20% | 13% |
A Calculated based on average shares outstanding during the period.
B Total distributions of $1.22 per share is comprised of distributions from net investment income of $.304 and distributions from net realized gain of $.914 per share.
C Total distributions of $1.88 per share is comprised of distributions from net investment income of $.273 and distributions from net realized gain of $1.604 per share.
D Total returns for periods of less than one year are not annualized.
E Total returns would have been lower if certain expenses had not been reduced during the applicable periods shown.
F Fees and expenses of any underlying Fidelity Central Funds are not included in the Fund's expense ratio. The Fund indirectly bears its proportionate share of the expenses of any underlying Fidelity Central Funds. Based on their most recent shareholder report date, the expenses ranged from less than .005% to .07%.
G Expense ratios reflect operating expenses of the class. Expenses before reductions do not reflect amounts reimbursed by the investment adviser or reductions from brokerage service arrangements or reductions from other expense offset arrangements and do not represent the amount paid by the class during periods when reimbursements or reductions occur. Expenses net of fee waivers reflect expenses after reimbursement by the investment adviser but prior to reductions from brokerage service arrangements or other expense offset arrangements. Expenses net of all reductions represent the net expenses paid by the class.
H Annualized
I Amount does not include the portfolio activity of any underlying Fidelity Central Funds.
See accompanying notes which are an integral part of the financial statements.
Fidelity Asset Manager 70% Class Z
| Six months ended (Unaudited) March 31, | |
| 2019 A | |
| Selected Per–Share Data | |
| Net asset value, beginning of period | $23.29 |
| Income from Investment Operations | |
| Net investment income (loss)B | .14 |
| Net realized and unrealized gain (loss) | (.75) |
| Total from investment operations | (.61) |
| Distributions from net investment income | (.34) |
| Distributions from net realized gain | (.91) |
| Total distributions | (1.25) |
| Net asset value, end of period | $21.43 |
| Total ReturnC,D | (2.02)% |
| Ratios to Average Net AssetsE,F | |
| Expenses before reductions | .62%G |
| Expenses net of fee waivers, if any | .62%G |
| Expenses net of all reductions | .61%G |
| Net investment income (loss) | 1.34%G |
| Supplemental Data | |
| Net assets, end of period (000 omitted) | $2,183 |
| Portfolio turnover rateH | 38%G |
A For the period October 2, 2018 (commencement of sale of shares) to March 31, 2019.
B Calculated based on average shares outstanding during the period.
C Total returns for periods of less than one year are not annualized.
D Total returns would have been lower if certain expenses had not been reduced during the applicable periods shown.
E Fees and expenses of any underlying Fidelity Central Funds are not included in the Fund's expense ratio. The Fund indirectly bears its proportionate share of the expenses of any underlying Fidelity Central Funds. Based on their most recent shareholder report date, the expenses ranged from less than .005% to .07%.
F Expense ratios reflect operating expenses of the class. Expenses before reductions do not reflect amounts reimbursed by the investment adviser or reductions from brokerage service arrangements or reductions from other expense offset arrangements and do not represent the amount paid by the class during periods when reimbursements or reductions occur. Expense ratios before reductions for start-up periods may not be representative of longer-term operating periods. Expenses net of fee waivers reflect expenses after reimbursement by the investment adviser but prior to reductions from brokerage service arrangements or other expense offset arrangements. Expenses net of all reductions represent the net expenses paid by the class.
G Annualized
H Amount does not include the portfolio activity of any underlying Fidelity Central Funds.
See accompanying notes which are an integral part of the financial statements.
Fidelity Asset Manager® 85%
Investment Summary (Unaudited)
The information in the following tables is based on the combined investments of the Fund and its pro-rata share of the investments of Fidelity's Central Funds, other than the Commodity Strategy and Money Market Central Funds.Top Ten Stocks as of March 31, 2019
| % of fund's net assets | |
| Microsoft Corp. | 2.3 |
| Apple, Inc. | 2.3 |
| Amazon.com, Inc. | 1.4 |
| Alphabet Inc. Class A | 1.2 |
| UnitedHealth Group, Inc. | 0.7 |
| Roche Holding AG (participation certificate) | 0.7 |
| Adobe, Inc. | 0.6 |
| The Boeing Co. | 0.6 |
| Becton, Dickinson & Co. | 0.6 |
| Facebook, Inc. Class A | 0.6 |
| 11.0 |
Top Five Market Sectors as of March 31, 2019
| % of fund's net assets | |
| Financials | 14.5 |
| Information Technology | 12.8 |
| Health Care | 9.8 |
| Consumer Discretionary | 8.5 |
| Industrials | 7.3 |
Quality Diversification (% of fund's net assets)
| As of March 31, 2019 | ||
| U.S. Government and U.S. Government Agency Obligations | 6.8% | |
| AAA,AA,A | 0.6% | |
| BBB | 1.9% | |
| BB and Below | 2.9% | |
| Not Rated | 0.1% | |
| Equities* | 83.2% | |
| Short-Term Investments and Net Other Assets | 4.5% | |

* Includes investment in Fidelity® Commodity Strategy Central Fund of 0.8%
We have used ratings from Moody's Investors Service, Inc. Where Moody's® ratings are not available, we have used S&P® ratings. All ratings are as of the date indicated and do not reflect subsequent changes.
Asset Allocation (% of fund's net assets)
| As of March 31, 2019 | ||
| Stock Class and Equity Futures* | 86.5% | |
| Bond Class | 12.0% | |
| Short-Term Class | 1.5% | |

* Includes investment in Fidelity® Commodity Strategy Central Fund of 0.8%
Asset allocations in the pie charts reflect the categorization of assets as defined in the Fund's prospectus in effect as of the time periods indicated above. Percentages are adjusted for the effect of future contracts and swap contracts, if applicable.
At period end, foreign investments including the Fund's pro-rata share of the underlying Central Funds, other than the Commodity Strategy Central and Money Market Funds, was 24.2% of net assets.
Percentages in the above tables are adjusted for the effect of TBA Sale Commitments.
An unaudited holdings listing for the Fund, which presents direct holdings as well as the pro-rata share of any securities and other investments held indirectly through its investment in underlying Fidelity Central Funds, other than the Commodity Strategy and Money Market Central Funds, is available at fidelity.com and/or institutional.fidelity.com, as applicable.
Fidelity Asset Manager® 85%
Schedule of Investments March 31, 2019 (Unaudited)
Showing Percentage of Net Assets
| Equity Central Funds - 74.9% | |||
| Shares | Value | ||
| Fidelity Commodity Strategy Central Fund (a) | 3,877,592 | $19,232,854 | |
| Fidelity Communication Services Central Fund (a) | 578,494 | 112,991,418 | |
| Fidelity Consumer Discretionary Central Fund (a) | 430,022 | 141,017,182 | |
| Fidelity Consumer Staples Central Fund (a) | 463,265 | 90,364,545 | |
| Fidelity Emerging Markets Equity Central Fund (a) | 748,871 | 159,689,169 | |
| Fidelity Energy Central Fund (a) | 613,855 | 67,413,583 | |
| Fidelity Financials Central Fund (a) | 2,603,215 | 251,184,234 | |
| Fidelity Health Care Central Fund (a) | 483,609 | 207,361,697 | |
| Fidelity Industrials Central Fund (a) | 490,013 | 133,675,450 | |
| Fidelity Information Technology Central Fund (a) | 828,900 | 309,527,701 | |
| Fidelity International Equity Central Fund (a) | 4,032,450 | 306,183,909 | |
| Fidelity Materials Central Fund (a) | 177,348 | 35,614,949 | |
| Fidelity Real Estate Equity Central Fund (a) | 105,469 | 12,023,490 | |
| Fidelity Utilities Central Fund (a) | 248,638 | 46,445,536 | |
| TOTAL EQUITY CENTRAL FUNDS | |||
| (Cost $1,389,284,896) | 1,892,725,717 | ||
| Fixed-Income Central Funds - 12.3% | |||
| High Yield Fixed-Income Funds - 3.0% | |||
| Fidelity Emerging Markets Debt Central Fund (a) | 1,270,975 | 12,023,426 | |
| Fidelity Floating Rate Central Fund (a) | 260,483 | 26,360,923 | |
| Fidelity High Income Central Fund 1 (a) | 405,576 | 37,892,935 | |
| TOTAL HIGH YIELD FIXED-INCOME FUNDS | 76,277,284 | ||
| Investment Grade Fixed-Income Funds - 9.3% | |||
| Fidelity Inflation-Protected Bond Index Central Fund (a) | 1,015,248 | 101,433,440 | |
| Fidelity International Credit Central Fund (a) | 160,847 | 15,883,668 | |
| Fidelity Investment Grade Bond Central Fund (a) | 1,085,668 | 117,491,032 | |
| TOTAL INVESTMENT GRADE FIXED-INCOME FUNDS | 234,808,140 | ||
| TOTAL FIXED-INCOME CENTRAL FUNDS | |||
| (Cost $307,741,101) | 311,085,424 | ||
| Money Market Central Funds - 5.1% | |||
| Fidelity Cash Central Fund, 2.48% (b) | 66,966,149 | 66,979,543 | |
| Fidelity Securities Lending Cash Central Fund 2.48% (b)(c) | 61,499,900 | 61,506,050 | |
| TOTAL MONEY MARKET CENTRAL FUNDS | |||
| (Cost $128,485,545) | 128,485,593 | ||
| Principal Amount | Value | ||
| U.S. Treasury Obligations - 0.2% | |||
| U.S. Treasury Bills, yield at date of purchase 2.37% to 2.4% 4/11/19 to 5/23/19 (d) | |||
| (Cost $5,049,597) | 5,060,000 | 5,049,661 | |
| Shares | Value | ||
| Investment Companies - 9.9% | |||
| iShares 20+ Year Treasury Bond ETF (e) | 292,663 | $37,004,310 | |
| iShares Core MSCI Emerging Markets ETF | 1,628,028 | 84,185,328 | |
| iShares MSCI EAFE Index ETF | 1,127,314 | 73,117,586 | |
| iShares MSCI Japan ETF (e) | 1,034,927 | 56,631,205 | |
| TOTAL INVESTMENT COMPANIES | |||
| (Cost $241,044,389) | 250,938,429 | ||
| TOTAL INVESTMENT IN SECURITIES - 102.4% | |||
| (Cost $2,071,605,528) | 2,588,284,824 | ||
| NET OTHER ASSETS (LIABILITIES) - (2.4)% | (61,632,401) | ||
| NET ASSETS - 100% | $2,526,652,423 |
| Futures Contracts | |||||
| Number of contracts | Expiration Date | Notional Amount | Value | Unrealized Appreciation/(Depreciation) | |
| Purchased | |||||
| Equity Index Contracts | |||||
| ICE E-mini MSCI EAFE Index Contracts (United States) | 874 | June 2019 | $81,561,680 | $1,486,824 | $1,486,824 |
| Sold | |||||
| Equity Index Contracts | |||||
| CME E-mini S&P 500 Index Contracts (United States) | 19 | June 2019 | 2,695,910 | (75,534) | (75,534) |
| TOTAL FUTURES CONTRACTS | $1,411,290 |
The notional amount of futures purchased as a percentage of Net Assets is 3.2%
The notional amount of futures sold as a percentage of Net Assets is 0.1%
Security Type Abbreviations
ETF – Exchange-Traded Fund
Legend
(a) Affiliated fund that is generally available only to investment companies and other accounts managed by Fidelity Investments. A complete unaudited schedule of portfolio holdings for each Fidelity Central Fund is filed with the SEC for the first and third quarters of each fiscal year on Form N-PORT and is available upon request or at the SEC's website at www.sec.gov. An unaudited holdings listing for the Fund, which presents direct holdings as well as the pro-rata share of securities and other investments held indirectly through its investment in underlying non-money market Fidelity Central Funds, other than the Commodity Strategy Central Fund, is available at fidelity.com and/or institutional.fidelity.com, as applicable. In addition, each Fidelity Central Fund's financial statements are available on the SEC's website or upon request.
(b) Affiliated fund that is generally available only to investment companies and other accounts managed by Fidelity Investments. The rate quoted is the annualized seven-day yield of the fund at period end. A complete unaudited listing of the fund's holdings as of its most recent quarter end is available upon request. In addition, each Fidelity Central Fund's financial statements are available on the SEC's website or upon request.
(c) Investment made with cash collateral received from securities on loan.
(d) Security or a portion of the security was pledged to cover margin requirements for futures contracts. At period end, the value of securities pledged amounted to $4,268,881.
(e) Security or a portion of the security is on loan at period end.
Affiliated Central Funds
Information regarding fiscal year to date income earned by the Fund from investments in Fidelity Central Funds is as follows:
| Fund | Income earned |
| Fidelity Cash Central Fund | $1,137,832 |
| Fidelity Commodity Strategy Central Fund | 153,805 |
| Fidelity Communication Services Central Fund | 420,524 |
| Fidelity Consumer Discretionary Central Fund | 5,312,583 |
| Fidelity Consumer Staples Central Fund | 8,099,355 |
| Fidelity Emerging Markets Debt Central Fund | 146,487 |
| Fidelity Emerging Markets Equity Central Fund | 7,437,033 |
| Fidelity Energy Central Fund | 739,503 |
| Fidelity Financials Central Fund | 14,699,215 |
| Fidelity Floating Rate Central Fund | 774,823 |
| Fidelity Health Care Central Fund | 11,865,889 |
| Fidelity High Income Central Fund 1 | 619,949 |
| Fidelity Industrials Central Fund | 7,187,059 |
| Fidelity Inflation-Protected Bond Index Central Fund | 2,054,820 |
| Fidelity Information Technology Central Fund | 56,946,608 |
| Fidelity International Credit Central Fund | 571,519 |
| Fidelity International Equity Central Fund | 16,024,746 |
| Fidelity Investment Grade Bond Central Fund | 1,930,992 |
| Fidelity Materials Central Fund | 3,161,354 |
| Fidelity Real Estate Equity Central Fund | 405,981 |
| Fidelity Securities Lending Cash Central Fund | 9,284 |
| Fidelity Utilities Central Fund | 4,165,222 |
| Total | $143,864,583 |
Amounts in the income column in the above table include any capital gain distributions from underlying funds, which are presented in the corresponding line-item in the Statement of Operations, if applicable.
Fiscal year to date information regarding the Fund’s investments in non-Money Market Central Funds, including the ownership percentage, is presented below.
| Fund | Value, beginning of period | Purchases(a) | Sales Proceeds(b) | Realized Gain/Loss | Change in Unrealized appreciation (depreciation) | Value, end of period | % ownership, end of period |
| Fidelity Commodity Strategy Central Fund | $5,254,334 | $16,086,482 | $678,729 | $(19,669) | $(1,409,564) | $19,232,854 | 7.5% |
| Fidelity Communication Services Central Fund | 31,246,126 | 86,496,862 | 11,365,674 | 66,829 | 6,547,275 | 112,991,418 | 7.0% |
| Fidelity Consumer Discretionary Central Fund | 179,272,265 | 11,248,352 | 37,519,605 | 540,451 | (12,524,281) | 141,017,182 | 7.3% |
| Fidelity Consumer Staples Central Fund | 94,149,069 | 10,776,230 | 10,696,048 | (1,272,259) | (2,592,447) | 90,364,545 | 7.1% |
| Fidelity Emerging Markets Debt Central Fund | 33,110 | 11,895,157 | 105,773 | (1,340) | 202,272 | 12,023,426 | 8.2% |
| Fidelity Emerging Markets Equity Central Fund | 100,814,435 | 66,351,671 | 6,407,107 | (354,245) | (715,585) | 159,689,169 | 15.0% |
| Fidelity Energy Central Fund | 91,590,211 | 3,092,281 | 9,006,842 | (1,646,622) | (16,615,445) | 67,413,583 | 7.2% |
| Fidelity Financials Central Fund | 284,577,379 | 22,656,266 | 33,359,635 | (2,935,956) | (19,753,820) | 251,184,234 | 7.7% |
| Fidelity Floating Rate Central Fund | 26,312,498 | 1,519,864 | 940,920 | (6,091) | (524,428) | 26,360,923 | 1.3% |
| Fidelity Health Care Central Fund | 247,033,881 | 18,309,125 | 31,470,995 | 609,284 | (27,119,598) | 207,361,697 | 7.3% |
| Fidelity High Income Central Fund 1 | -- | 37,761,623 | 558,074 | (5,549) | 694,935 | 37,892,935 | 7.5% |
| Fidelity Industrials Central Fund | 159,657,163 | 11,487,103 | 18,900,841 | (2,109,487) | (16,458,488) | 133,675,450 | 7.4% |
| Fidelity Inflation-Protected Bond Index Central Fund | 75,609,661 | 29,185,399 | 3,709,482 | (24,937) | 372,799 | 101,433,440 | 8.6% |
| Fidelity Information Technology Central Fund | 422,098,333 | 80,827,847 | 99,147,076 | (8,212,273) | (86,039,130) | 309,527,701 | 7.3% |
| Fidelity International Credit Central Fund | 15,311,785 | 1,018,585 | 564,632 | (4,036) | 121,966 | 15,883,668 | 8.8% |
| Fidelity International Equity Central Fund | 326,025,765 | 29,936,057 | 18,249,840 | (229,609) | (31,298,464) | 306,183,909 | 12.4% |
| Fidelity Investment Grade Bond Central Fund | 194,762,946 | 23,091,220 | 102,545,472 | (2,792,106) | 4,974,444 | 117,491,032 | 1.5% |
| Fidelity Materials Central Fund | 42,176,748 | 4,409,640 | 4,711,374 | (1,114,937) | (5,145,128) | 35,614,949 | 7.5% |
| Fidelity Real Estate Equity Central Fund | 11,209,439 | 704,281 | 376,679 | 829 | 485,620 | 12,023,490 | 8.9% |
| Fidelity Utilities Central Fund | 48,158,744 | 5,538,467 | 6,435,401 | (71,792) | (744,482) | 46,445,536 | 7.5% |
| Total | $2,355,293,892 | $472,392,512 | $396,750,199 | $(19,583,515) | $(207,541,549) | $2,203,811,141 |
(a) Includes the value of shares purchased through in-kind transactions, if applicable.
(b) Includes the value of shares redeemed through in-kind transactions, if applicable.
Investment Valuation
The following is a summary of the inputs used, as of March 31, 2019, involving the Fund's assets and liabilities carried at fair value. The inputs or methodology used for valuing securities may not be an indication of the risk associated with investing in those securities. For more information on valuation inputs, and their aggregation into the levels used below, please refer to the Investment Valuation section in the accompanying Notes to Financial Statements.
| Valuation Inputs at Reporting Date: | ||||
| Description | Total | Level 1 | Level 2 | Level 3 |
| Investments in Securities: | ||||
| Equity Central Funds | $1,892,725,717 | $1,892,725,717 | $-- | $-- |
| Fixed-Income Central Funds | 311,085,424 | 311,085,424 | -- | -- |
| Money Market Central Funds | 128,485,593 | 128,485,593 | -- | -- |
| Other Short-Term Investments | 5,049,661 | -- | 5,049,661 | -- |
| Investment Companies | 250,938,429 | 250,938,429 | -- | -- |
| Total Investments in Securities: | $2,588,284,824 | $2,583,235,163 | $5,049,661 | $-- |
| Derivative Instruments: | ||||
| Assets | ||||
| Futures Contracts | $1,486,824 | $1,486,824 | $-- | $-- |
| Total Assets | $1,486,824 | $1,486,824 | $-- | $-- |
| Liabilities | ||||
| Futures Contracts | $(75,534) | $(75,534) | $-- | $-- |
| Total Liabilities | $(75,534) | $(75,534) | $-- | $-- |
| Total Derivative Instruments: | $1,411,290 | $1,411,290 | $-- | $-- |
Value of Derivative Instruments
The following table is a summary of the Fund's value of derivative instruments by primary risk exposure as of March 31, 2019. For additional information on derivative instruments, please refer to the Derivative Instruments section in the accompanying Notes to Financial Statements.
| Primary Risk Exposure / Derivative Type | Value | |
| Asset | Liability | |
| Equity Risk | ||
| Futures Contracts(a) | $1,486,824 | $(75,534) |
| Total Equity Risk | 1,486,824 | (75,534) |
| Total Value of Derivatives | $1,486,824 | $(75,534) |
(a) Reflects gross cumulative appreciation (depreciation) on futures contracts as presented in the Schedule of Investments. In the Statement of Assets and Liabilities, the period end daily variation margin is included in receivable or payable for daily variation margin on futures contracts, and the net cumulative appreciation (depreciation) is included in distributable earnings.
Other Information
Distribution of investments by country or territory of incorporation, as a percentage of Total Net Assets, is as follows (Unaudited):
| United States of America | 75.8% |
| United Kingdom | 2.8% |
| Japan | 2.5% |
| Cayman Islands | 1.8% |
| Switzerland | 1.7% |
| France | 1.5% |
| Canada | 1.5% |
| Germany | 1.1% |
| Netherlands | 1.0% |
| Ireland | 1.0% |
| Others (Individually Less Than 1%) | 9.3% |
| 100.0% |
The information in the above table is based on the combined investments of the Fund and its pro-rata share of the investments of Fidelity's Central Funds, other than the Commodity Strategy and Money Market Central Funds.
See accompanying notes which are an integral part of the financial statements.
Fidelity Asset Manager® 85%
Financial Statements
Statement of Assets and Liabilities
| March 31, 2019 (Unaudited) | ||
| Assets | ||
| Investment in securities, at value (including securities loaned of $60,106,344) — See accompanying schedule: Unaffiliated issuers (cost $246,093,986) | $255,988,090 | |
| Fidelity Central Funds (cost $1,825,511,542) | 2,332,296,734 | |
| Total Investment in Securities (cost $2,071,605,528) | $2,588,284,824 | |
| Receivable for investments sold | 1,069,625 | |
| Receivable for fund shares sold | 1,908,338 | |
| Distributions receivable from Fidelity Central Funds | 171,569 | |
| Receivable for daily variation margin on futures contracts | 259,350 | |
| Prepaid expenses | 1,829 | |
| Other receivables | 9,080 | |
| Total assets | 2,591,704,615 | |
| Liabilities | ||
| Payable for investments purchased | $1,290,616 | |
| Payable for fund shares redeemed | 678,497 | |
| Accrued management fee | 1,124,263 | |
| Distribution and service plan fees payable | 74,803 | |
| Other affiliated payables | 343,075 | |
| Other payables and accrued expenses | 34,888 | |
| Collateral on securities loaned | 61,506,050 | |
| Total liabilities | 65,052,192 | |
| Net Assets | $2,526,652,423 | |
| Net Assets consist of: | ||
| Paid in capital | $2,108,841,049 | |
| Total distributable earnings (loss) | 417,811,374 | |
| Net Assets | $2,526,652,423 | |
| Net Asset Value and Maximum Offering Price | ||
| Class A: | ||
| Net Asset Value and redemption price per share ($118,338,235 ÷ 6,354,015 shares) | $18.62 | |
| Maximum offering price per share (100/94.25 of $18.62) | $19.76 | |
| Class M: | ||
| Net Asset Value and redemption price per share ($31,732,471 ÷ 1,713,321 shares) | $18.52 | |
| Maximum offering price per share (100/96.50 of $18.52) | $19.19 | |
| Class C: | ||
| Net Asset Value and offering price per share ($42,972,217 ÷ 2,345,168 shares)(a) | $18.32 | |
| Asset Manager 85%: | ||
| Net Asset Value, offering price and redemption price per share ($2,293,206,242 ÷ 122,048,309 shares) | $18.79 | |
| Class I: | ||
| Net Asset Value, offering price and redemption price per share ($39,133,979 ÷ 2,088,105 shares) | $18.74 | |
| Class Z: | ||
| Net Asset Value, offering price and redemption price per share ($1,269,279 ÷ 67,843 shares) | $18.71 |
(a) Redemption price per share is equal to net asset value less any applicable contingent deferred sales charge.
See accompanying notes which are an integral part of the financial statements.
Statement of Operations
| Six months ended March 31, 2019 (Unaudited) | ||
| Investment Income | ||
| Dividends | $2,632,919 | |
| Interest | 59,025 | |
| Income from Fidelity Central Funds | 17,754,500 | |
| Total income | 20,446,444 | |
| Expenses | ||
| Management fee | $6,526,781 | |
| Transfer agent fees | 1,664,751 | |
| Distribution and service plan fees | 437,421 | |
| Accounting and security lending fees | 361,710 | |
| Custodian fees and expenses | 2,305 | |
| Independent trustees' fees and expenses | 5,606 | |
| Registration fees | 80,136 | |
| Audit | 16,715 | |
| Legal | 2,159 | |
| Miscellaneous | 8,557 | |
| Total expenses before reductions | 9,106,141 | |
| Expense reductions | (44,912) | |
| Total expenses after reductions | 9,061,229 | |
| Net investment income (loss) | 11,385,215 | |
| Realized and Unrealized Gain (Loss) | ||
| Net realized gain (loss) on: | ||
| Investment securities: | ||
| Unaffiliated issuers | (2,165,495) | |
| Fidelity Central Funds | (19,583,562) | |
| Futures contracts | 1,091,907 | |
| Capital gain distributions from Fidelity Central Funds | 126,110,083 | |
| Total net realized gain (loss) | 105,452,933 | |
| Change in net unrealized appreciation (depreciation) on: | ||
| Investment securities: | ||
| Unaffiliated issuers | (3,097,231) | |
| Fidelity Central Funds | (207,541,501) | |
| Futures contracts | 1,584,794 | |
| Total change in net unrealized appreciation (depreciation) | (209,053,938) | |
| Net gain (loss) | (103,601,005) | |
| Net increase (decrease) in net assets resulting from operations | $(92,215,790) |
See accompanying notes which are an integral part of the financial statements.
Statement of Changes in Net Assets
| Six months ended March 31, 2019 (Unaudited) | Year ended September 30, 2018 | |
| Increase (Decrease) in Net Assets | ||
| Operations | ||
| Net investment income (loss) | $11,385,215 | $25,586,001 |
| Net realized gain (loss) | 105,452,933 | 124,346,021 |
| Change in net unrealized appreciation (depreciation) | (209,053,938) | 79,442,438 |
| Net increase (decrease) in net assets resulting from operations | (92,215,790) | 229,374,460 |
| Distributions to shareholders | (118,486,557) | – |
| Distributions to shareholders from net investment income | – | (20,443,842) |
| Distributions to shareholders from net realized gain | – | (50,072,977) |
| Total distributions | (118,486,557) | (70,516,819) |
| Share transactions - net increase (decrease) | 108,108,598 | 437,635,381 |
| Total increase (decrease) in net assets | (102,593,749) | 596,493,022 |
| Net Assets | ||
| Beginning of period | 2,629,246,172 | 2,032,753,150 |
| End of period | $2,526,652,423 | $2,629,246,172 |
| Other Information | ||
| Undistributed net investment income end of period | $16,436,696 |
See accompanying notes which are an integral part of the financial statements.
Financial Highlights
Fidelity Asset Manager 85% Class A
| Six months ended (Unaudited) March 31, | Years endedSeptember 30, | |||||
| 2019 | 2018 | 2017 | 2016 | 2015 | 2014 | |
| Selected Per–Share Data | ||||||
| Net asset value, beginning of period | $20.36 | $19.02 | $16.45 | $15.42 | $17.64 | $16.38 |
| Income from Investment Operations | ||||||
| Net investment income (loss)A | .06 | .16 | .13 | .14 | .14 | .16 |
| Net realized and unrealized gain (loss) | (.91) | 1.77 | 2.61 | 1.59 | (.77) | 1.64 |
| Total from investment operations | (.85) | 1.93 | 2.74 | 1.73 | (.63) | 1.80 |
| Distributions from net investment income | (.17) | (.14) | (.13) | (.17) | (.17) | (.11) |
| Distributions from net realized gain | (.72) | (.45) | (.05) | (.53) | (1.43) | (.42) |
| Total distributions | (.89) | (.59) | (.17)B | (.70) | (1.59)C | (.54)D |
| Net asset value, end of period | $18.62 | $20.36 | $19.02 | $16.45 | $15.42 | $17.64 |
| Total ReturnE,F,G | (3.63)% | 10.29% | 16.83% | 11.62% | (3.86)% | 11.24% |
| Ratios to Average Net AssetsH,I | ||||||
| Expenses before reductions | 1.02%J | 1.02% | 1.04% | 1.05% | 1.05% | 1.04% |
| Expenses net of fee waivers, if any | 1.02%J | 1.02% | 1.04% | 1.05% | 1.05% | 1.04% |
| Expenses net of all reductions | 1.01%J | 1.02% | 1.03% | 1.05% | 1.04% | 1.04% |
| Net investment income (loss) | .67%J | .80% | .74% | .90% | .85% | .92% |
| Supplemental Data | ||||||
| Net assets, end of period (000 omitted) | $118,338 | $115,447 | $92,868 | $78,147 | $66,006 | $66,659 |
| Portfolio turnover rateK | 51%J | 24% | 23% | 22% | 29% | 14% |
A Calculated based on average shares outstanding during the period.
B Total distributions of $.17 per share is comprised of distributions from net investment income of $.125 and distributions from net realized gain of $.047 per share.
C Total distributions of $1.59 per share is comprised of distributions from net investment income of $.167 and distributions from net realized gain of $1.427 per share.
D Total distributions of $.54 per share is comprised of distributions from net investment income of $.114 and distributions from net realized gain of $.423 per share.
E Total returns for periods of less than one year are not annualized.
F Total returns would have been lower if certain expenses had not been reduced during the applicable periods shown.
G Total returns do not include the effect of the sales charges.
H Fees and expenses of any underlying Fidelity Central Funds are not included in the Fund's expense ratio. The Fund indirectly bears its proportionate share of the expenses of any underlying Fidelity Central Funds. Based on their most recent shareholder report date, the expenses ranged from less than .005% to .07%.
I Expense ratios reflect operating expenses of the class. Expenses before reductions do not reflect amounts reimbursed by the investment adviser or reductions from brokerage service arrangements or reductions from other expense offset arrangements and do not represent the amount paid by the class during periods when reimbursements or reductions occur. Expenses net of fee waivers reflect expenses after reimbursement by the investment adviser but prior to reductions from brokerage service arrangements or other expense offset arrangements. Expenses net of all reductions represent the net expenses paid by the class.
J Annualized
K Amount does not include the portfolio activity of any underlying Fidelity Central Funds.
See accompanying notes which are an integral part of the financial statements.
Fidelity Asset Manager 85% Class M
| Six months ended (Unaudited) March 31, | Years endedSeptember 30, | |||||
| 2019 | 2018 | 2017 | 2016 | 2015 | 2014 | |
| Selected Per–Share Data | ||||||
| Net asset value, beginning of period | $20.22 | $18.91 | $16.34 | $15.32 | $17.56 | $16.32 |
| Income from Investment Operations | ||||||
| Net investment income (loss)A | .04 | .10 | .08 | .10 | .10 | .11 |
| Net realized and unrealized gain (loss) | (.90) | 1.75 | 2.61 | 1.58 | (.78) | 1.63 |
| Total from investment operations | (.86) | 1.85 | 2.69 | 1.68 | (.68) | 1.74 |
| Distributions from net investment income | (.13) | (.09) | (.07) | (.13) | (.13) | (.08) |
| Distributions from net realized gain | (.72) | (.45) | (.05) | (.53) | (1.43) | (.42) |
| Total distributions | (.84)B | (.54) | (.12) | (.66) | (1.56) | (.50) |
| Net asset value, end of period | $18.52 | $20.22 | $18.91 | $16.34 | $15.32 | $17.56 |
| Total ReturnC,D,E | (3.73)% | 9.94% | 16.54% | 11.31% | (4.21)% | 10.92% |
| Ratios to Average Net AssetsF,G | ||||||
| Expenses before reductions | 1.28%H | 1.29% | 1.31% | 1.32% | 1.33% | 1.33% |
| Expenses net of fee waivers, if any | 1.28%H | 1.29% | 1.31% | 1.32% | 1.33% | 1.33% |
| Expenses net of all reductions | 1.28%H | 1.29% | 1.31% | 1.32% | 1.32% | 1.33% |
| Net investment income (loss) | .41%H | .53% | .46% | .63% | .57% | .63% |
| Supplemental Data | ||||||
| Net assets, end of period (000 omitted) | $31,732 | $31,371 | $24,207 | $19,582 | $18,991 | $17,690 |
| Portfolio turnover rateI | 51%H | 24% | 23% | 22% | 29% | 14% |
A Calculated based on average shares outstanding during the period.
B Total distributions of $.84 per share is comprised of distributions from net investment income of $.126 and distributions from net realized gain of $.715 per share.
C Total returns for periods of less than one year are not annualized.
D Total returns would have been lower if certain expenses had not been reduced during the applicable periods shown.
E Total returns do not include the effect of the sales charges.
F Fees and expenses of any underlying Fidelity Central Funds are not included in the Fund's expense ratio. The Fund indirectly bears its proportionate share of the expenses of any underlying Fidelity Central Funds. Based on their most recent shareholder report date, the expenses ranged from less than .005% to .07%.
G Expense ratios reflect operating expenses of the class. Expenses before reductions do not reflect amounts reimbursed by the investment adviser or reductions from brokerage service arrangements or reductions from other expense offset arrangements and do not represent the amount paid by the class during periods when reimbursements or reductions occur. Expenses net of fee waivers reflect expenses after reimbursement by the investment adviser but prior to reductions from brokerage service arrangements or other expense offset arrangements. Expenses net of all reductions represent the net expenses paid by the class.
H Annualized
I Amount does not include the portfolio activity of any underlying Fidelity Central Funds.
See accompanying notes which are an integral part of the financial statements.
Fidelity Asset Manager 85% Class C
| Six months ended (Unaudited) March 31, | Years endedSeptember 30, | |||||
| 2019 | 2018 | 2017 | 2016 | 2015 | 2014 | |
| Selected Per–Share Data | ||||||
| Net asset value, beginning of period | $19.95 | $18.65 | $16.14 | $15.14 | $17.37 | $16.16 |
| Income from Investment Operations | ||||||
| Net investment income (loss)A | (.01) | .01 | –B | .02 | .02 | .03 |
| Net realized and unrealized gain (loss) | (.88) | 1.74 | 2.56 | 1.57 | (.76) | 1.61 |
| Total from investment operations | (.89) | 1.75 | 2.56 | 1.59 | (.74) | 1.64 |
| Distributions from net investment income | (.02) | –B | (.01) | (.06) | (.06) | (.01) |
| Distributions from net realized gain | (.72) | (.45) | (.05) | (.53) | (1.43) | (.42) |
| Total distributions | (.74) | (.45) | (.05)C | (.59) | (1.49) | (.43) |
| Net asset value, end of period | $18.32 | $19.95 | $18.65 | $16.14 | $15.14 | $17.37 |
| Total ReturnD,E,F | (4.02)% | 9.51% | 15.94% | 10.80% | (4.62)% | 10.37% |
| Ratios to Average Net AssetsG,H | ||||||
| Expenses before reductions | 1.77%I | 1.77% | 1.79% | 1.80% | 1.81% | 1.81% |
| Expenses net of fee waivers, if any | 1.77%I | 1.77% | 1.79% | 1.80% | 1.81% | 1.81% |
| Expenses net of all reductions | 1.77%I | 1.77% | 1.78% | 1.80% | 1.80% | 1.81% |
| Net investment income (loss) | (.08)%I | .05% | (.01)% | .15% | .10% | .15% |
| Supplemental Data | ||||||
| Net assets, end of period (000 omitted) | $42,972 | $50,588 | $44,313 | $38,916 | $34,590 | $30,717 |
| Portfolio turnover rateJ | 51%I | 24% | 23% | 22% | 29% | 14% |
A Calculated based on average shares outstanding during the period.
B Amount represents less than $.005 per share.
C Total distributions of $.05 per share is comprised of distributions from net investment income of $.007 and distributions from net realized gain of $.047 per share.
D Total returns for periods of less than one year are not annualized.
E Total returns would have been lower if certain expenses had not been reduced during the applicable periods shown.
F Total returns do not include the effect of the contingent deferred sales charge.
G Fees and expenses of any underlying Fidelity Central Funds are not included in the Fund's expense ratio. The Fund indirectly bears its proportionate share of the expenses of any underlying Fidelity Central Funds. Based on their most recent shareholder report date, the expenses ranged from less than .005% to .07%.
H Expense ratios reflect operating expenses of the class. Expenses before reductions do not reflect amounts reimbursed by the investment adviser or reductions from brokerage service arrangements or reductions from other expense offset arrangements and do not represent the amount paid by the class during periods when reimbursements or reductions occur. Expenses net of fee waivers reflect expenses after reimbursement by the investment adviser but prior to reductions from brokerage service arrangements or other expense offset arrangements. Expenses net of all reductions represent the net expenses paid by the class.
I Annualized
J Amount does not include the portfolio activity of any underlying Fidelity Central Funds.
See accompanying notes which are an integral part of the financial statements.
Fidelity Asset Manager 85%
| Six months ended (Unaudited) March 31, | Years endedSeptember 30, | |||||
| 2019 | 2018 | 2017 | 2016 | 2015 | 2014 | |
| Selected Per–Share Data | ||||||
| Net asset value, beginning of period | $20.56 | $19.20 | $16.60 | $15.56 | $17.79 | $16.52 |
| Income from Investment Operations | ||||||
| Net investment income (loss)A | .09 | .22 | .19 | .19 | .20 | .21 |
| Net realized and unrealized gain (loss) | (.92) | 1.78 | 2.63 | 1.60 | (.78) | 1.65 |
| Total from investment operations | (.83) | 2.00 | 2.82 | 1.79 | (.58) | 1.86 |
| Distributions from net investment income | (.23) | (.19) | (.17) | (.22) | (.23) | (.17) |
| Distributions from net realized gain | (.72) | (.45) | (.05) | (.53) | (1.43) | (.42) |
| Total distributions | (.94)B | (.64) | (.22) | (.75) | (1.65)C | (.59) |
| Net asset value, end of period | $18.79 | $20.56 | $19.20 | $16.60 | $15.56 | $17.79 |
| Total ReturnD,E | (3.44)% | 10.62% | 17.20% | 11.92% | (3.54)% | 11.54% |
| Ratios to Average Net AssetsF,G | ||||||
| Expenses before reductions | .71%H | .71% | .73% | .74% | .75% | .74% |
| Expenses net of fee waivers, if any | .71%H | .71% | .73% | .74% | .75% | .74% |
| Expenses net of all reductions | .71%H | .71% | .73% | .74% | .74% | .74% |
| Net investment income (loss) | .98%H | 1.11% | 1.05% | 1.21% | 1.16% | 1.21% |
| Supplemental Data | ||||||
| Net assets, end of period (000 omitted) | $2,293,206 | $2,377,705 | $1,832,601 | $1,454,033 | $1,350,006 | $1,433,196 |
| Portfolio turnover rateI | 51%H | 24% | 23% | 22% | 29% | 14% |
A Calculated based on average shares outstanding during the period.
B Total distributions of $.94 per share is comprised of distributions from net investment income of $.228 and distributions from net realized gain of $.715 per share.
C Total distributions of $1.65 per share is comprised of distributions from net investment income of $.225 and distributions from net realized gain of $1.427 per share.
D Total returns for periods of less than one year are not annualized.
E Total returns would have been lower if certain expenses had not been reduced during the applicable periods shown.
F Fees and expenses of any underlying Fidelity Central Funds are not included in the Fund's expense ratio. The Fund indirectly bears its proportionate share of the expenses of any underlying Fidelity Central Funds. Based on their most recent shareholder report date, the expenses ranged from less than .005% to .07%.
G Expense ratios reflect operating expenses of the class. Expenses before reductions do not reflect amounts reimbursed by the investment adviser or reductions from brokerage service arrangements or reductions from other expense offset arrangements and do not represent the amount paid by the class during periods when reimbursements or reductions occur. Expenses net of fee waivers reflect expenses after reimbursement by the investment adviser but prior to reductions from brokerage service arrangements or other expense offset arrangements. Expenses net of all reductions represent the net expenses paid by the class.
H Annualized
I Amount does not include the portfolio activity of any underlying Fidelity Central Funds.
See accompanying notes which are an integral part of the financial statements.
Fidelity Asset Manager 85% Class I
| Six months ended (Unaudited) March 31, | Years endedSeptember 30, | |||||
| 2019 | 2018 | 2017 | 2016 | 2015 | 2014 | |
| Selected Per–Share Data | ||||||
| Net asset value, beginning of period | $20.50 | $19.15 | $16.55 | $15.51 | $17.74 | $16.48 |
| Income from Investment Operations | ||||||
| Net investment income (loss)A | .09 | .21 | .18 | .19 | .19 | .21 |
| Net realized and unrealized gain (loss) | (.92) | 1.78 | 2.63 | 1.60 | (.76) | 1.64 |
| Total from investment operations | (.83) | 1.99 | 2.81 | 1.79 | (.57) | 1.85 |
| Distributions from net investment income | (.21) | (.19) | (.16) | (.21) | (.23) | (.16) |
| Distributions from net realized gain | (.72) | (.45) | (.05) | (.53) | (1.43) | (.42) |
| Total distributions | (.93) | (.64) | (.21) | (.75)B | (1.66) | (.59)C |
| Net asset value, end of period | $18.74 | $20.50 | $19.15 | $16.55 | $15.51 | $17.74 |
| Total ReturnD,E | (3.50)% | 10.58% | 17.16% | 11.93% | (3.52)% | 11.49% |
| Ratios to Average Net AssetsF,G | ||||||
| Expenses before reductions | .75%H | .75% | .76% | .75% | .76% | .76% |
| Expenses net of fee waivers, if any | .74%H | .75% | .76% | .75% | .76% | .76% |
| Expenses net of all reductions | .74%H | .75% | .75% | .75% | .75% | .76% |
| Net investment income (loss) | .95%H | 1.07% | 1.02% | 1.20% | 1.15% | 1.19% |
| Supplemental Data | ||||||
| Net assets, end of period (000 omitted) | $39,134 | $54,135 | $38,765 | $40,747 | $38,697 | $41,775 |
| Portfolio turnover rateI | 51%H | 24% | 23% | 22% | 29% | 14% |
A Calculated based on average shares outstanding during the period.
B Total distributions of $.75 per share is comprised of distributions from net investment income of $.214 and distributions from net realized gain of $.533 per share.
C Total distributions of $.59 per share is comprised of distributions from net investment income of $.162 and distributions from net realized gain of $.423 per share.
D Total returns for periods of less than one year are not annualized.
E Total returns would have been lower if certain expenses had not been reduced during the applicable periods shown.
F Fees and expenses of any underlying Fidelity Central Funds are not included in the Fund's expense ratio. The Fund indirectly bears its proportionate share of the expenses of any underlying Fidelity Central Funds. Based on their most recent shareholder report date, the expenses ranged from less than .005% to .07%.
G Expense ratios reflect operating expenses of the class. Expenses before reductions do not reflect amounts reimbursed by the investment adviser or reductions from brokerage service arrangements or reductions from other expense offset arrangements and do not represent the amount paid by the class during periods when reimbursements or reductions occur. Expenses net of fee waivers reflect expenses after reimbursement by the investment adviser but prior to reductions from brokerage service arrangements or other expense offset arrangements. Expenses net of all reductions represent the net expenses paid by the class.
H Annualized
I Amount does not include the portfolio activity of any underlying Fidelity Central Funds.
See accompanying notes which are an integral part of the financial statements.
Fidelity Asset Manager 85% Class Z
| Six months ended (Unaudited) March 31, | |
| 2019 A | |
| Selected Per–Share Data | |
| Net asset value, beginning of period | $20.45 |
| Income from Investment Operations | |
| Net investment income (loss)B | .10 |
| Net realized and unrealized gain (loss) | (.87) |
| Total from investment operations | (.77) |
| Distributions from net investment income | (.25) |
| Distributions from net realized gain | (.72) |
| Total distributions | (.97) |
| Net asset value, end of period | $18.71 |
| Total ReturnC,D | (3.18)% |
| Ratios to Average Net AssetsE,F | |
| Expenses before reductions | .62%G |
| Expenses net of fee waivers, if any | .62%G |
| Expenses net of all reductions | .62%G |
| Net investment income (loss) | 1.07%G |
| Supplemental Data | |
| Net assets, end of period (000 omitted) | $1,269 |
| Portfolio turnover rateH | 51%G |
A For the period October 2, 2018 (commencement of sale of shares) to March 31, 2019.
B Calculated based on average shares outstanding during the period.
C Total returns for periods of less than one year are not annualized.
D Total returns would have been lower if certain expenses had not been reduced during the applicable periods shown.
E Fees and expenses of any underlying Fidelity Central Funds are not included in the Fund's expense ratio. The Fund indirectly bears its proportionate share of the expenses of any underlying Fidelity Central Funds. Based on their most recent shareholder report date, the expenses ranged from less than .005% to .07%.
F Expense ratios reflect operating expenses of the class. Expenses before reductions do not reflect amounts reimbursed by the investment adviser or reductions from brokerage service arrangements or reductions from other expense offset arrangements and do not represent the amount paid by the class during periods when reimbursements or reductions occur. Expense ratios before reductions for start-up periods may not be representative of longer-term operating periods. Expenses net of fee waivers reflect expenses after reimbursement by the investment adviser but prior to reductions from brokerage service arrangements or other expense offset arrangements. Expenses net of all reductions represent the net expenses paid by the class.
G Annualized
H Amount does not include the portfolio activity of any underlying Fidelity Central Funds.
See accompanying notes which are an integral part of the financial statements.
Notes to Financial Statements (Unaudited)
For the period ended March 31, 2019
1. Organization.
Fidelity Asset Manager 20%, Fidelity Asset Manager 30%, Fidelity Asset Manager 40%, Fidelity Asset Manager 50%, Fidelity Asset Manager 60%, Fidelity Asset Manager 70% and Fidelity Asset Manager 85% (the Funds) are funds of Fidelity Charles Street Trust (the Trust). The Trust is registered under the Investment Company Act of 1940, as amended (the 1940 Act), as an open-end management investment company organized as a Massachusetts business trust. Each Fund is authorized to issue an unlimited number of shares. Each Fund offers Class A, Class M, Class C, Asset Manager, Class I and Class Z shares, each of which has equal rights as to assets and voting privileges. Each class has exclusive voting rights with respect to matters that affect that class. Each Fund commenced sale of Class Z shares on October 2, 2018. Effective March 1, 2019, Class C shares will automatically convert to Class A shares after a holding period of ten years from the initial date of purchase, with certain exceptions. Certain Underlying Funds incurred name changes since their most recent shareholder report. The names of the Underlying Funds are those in effect at period end.
2. Investments in Fidelity Central Funds.
The Funds invest in Fidelity Central Funds, which are open-end investment companies generally available only to other investment companies and accounts managed by the investment adviser and its affiliates. The Funds' Schedules of Investments list each of the Fidelity Central Funds held as of period end, as an investment of each Fund, but do not include the underlying holdings of each Fidelity Central Fund. As an Investing Fund, each Fund indirectly bears its proportionate share of the expenses of the underlying Fidelity Central Funds.
Based on its investment objective, each Fidelity Central Fund may invest or participate in various investment vehicles or strategies that are similar to those of each Fund. These strategies are consistent with the investment objectives of each Fund and may involve certain economic risks which may cause a decline in value of each of the Fidelity Central Funds and thus a decline in the value of each Fund. The following summarizes the Funds' investment in each Fidelity Central Fund.
| Fidelity Central Fund | Investment Manager | Investment Objective | Investment Practices | Expense Ratio(a) |
| Fidelity Commodity Strategy Central Fund | Geode Capital Management, LLC (Geode) | Seeks to provide investment returns that correspond to the performance of the commodities market. | Investment in commodity-related investments through a wholly-owned subsidiary organized under the laws of the Cayman Islands Futures | .02% |
| Fidelity Equity Central Funds | FMR Co., Inc. (FMRC) | Each fund seeks capital appreciation by investing primarily in common stocks, with a concentration in a particular industry. | Foreign Securities Restricted Securities | Less than .005% to .01% |
| Fidelity Emerging Markets Debt Central Fund | FMRC | Seeks high total return by normally investing in debt securities of issuers in emerging markets and other debt investments that are tied economically to emerging markets. | Delayed Delivery & When Issued Securities Foreign Securities Restricted Securities | .01% |
| Fidelity Emerging Markets Equity Central Fund | FMRC | Seeks capital appreciation by investing primarily in equity securities of issuers in emerging markets. | Foreign Securities Futures | .07% |
| Fidelity International Equity Central Fund | FMRC | Seeks capital appreciation by investing primarily in non-U.S. based common stocks, including securities of issuers located in emerging markets. | Foreign Securities Futures | .01% |
| Fidelity Floating Rate Central Fund | FMRC | Seeks a high level of income by normally investing in floating rate loans and other floating rate securities. | Loans & Direct Debt Instruments Restricted Securities | Less than .005% |
| Fidelity High Income Central Fund 1 | FMRC | Seeks a high level of income and may also seek capital appreciation by investing primarily in debt securities, preferred stocks, and convertible securities, with an emphasis on lower-quality debt securities. | Loans & Direct Debt Instruments Restricted Securities | Less than .005% |
| Fidelity Inflation-Protected Bond Index Central Fund | Fidelity Investment Money Management, Inc. (FIMM) | Seeks to provide investment results that correspond to the performance of the inflation-protected United States Treasury market, and may invest in derivatives. | Less than .005% | |
| Fidelity Investment Grade Bond Central Fund | FIMM | Seeks a high level of income by normally investing in investment–grade debt securities. | Delayed Delivery & When Issued Securities Repurchase Agreements Restricted Securities Swaps | Less than .005% |
| Fidelity International Credit Central Fund | FMRC | Seeks a high level of current income by normally investing in debt securities of foreign issuers, including debt securities of issuers located in emerging markets. Foreign currency exposure is hedged utilizing foreign currency contracts. | Foreign Securities Futures Restricted Securities Options Swaps Forward Foreign Currency Contracts | .01% |
| Fidelity Money Market Central Funds | FIMM | Each fund seeks to obtain a high level of current income consistent with the preservation of capital and liquidity. | Short-term Investments | Less than .005% |
(a) Expenses expressed as a percentage of average net assets and are as of each underlying Central Fund's most recent annual or semi-annual shareholder report.
An unaudited holdings listing for each Fund, which presents direct holdings as well as the pro-rata share of any securities and other investments held indirectly through each fund's investment in underlying Fidelity Central Funds, other than the Commodity Strategy and Money Market Central Funds, is available at fidelity.com and/or institutional.fidelity.com, as applicable. A complete unaudited list of holdings for each Fidelity Central Fund is available upon request or at the Securities and Exchange Commission (the SEC) website at www.sec.gov. In addition, the financial statements of the Fidelity Central Funds which contain the significant accounting policies (including investment valuation policies) of those funds are available on the SEC website or upon request.
3. Significant Accounting Policies.
Each Fund is an investment company and applies the accounting and reporting guidance of the Financial Accounting Standards Board (FASB) Accounting Standards Codification Topic 946 Financial Services – Investments Companies. The financial statements have been prepared in conformity with accounting principles generally accepted in the United States of America (GAAP), which require management to make certain estimates and assumptions at the date of the financial statements. Actual results could differ from those estimates. Subsequent events, if any, through the date that the financial statements were issued have been evaluated in the preparation of the financial statements. The following summarizes the significant accounting policies of the Funds:
Investment Valuation. Investments are valued as of 4:00 p.m. Eastern time on the last calendar day of the period. The Board of Trustees (the Board) has delegated the day to day responsibility for the valuation of each Fund's investments to the Fair Value Committee (the Committee) established by each Fund's investment adviser. In accordance with valuation policies and procedures approved by the Board, each Fund attempts to obtain prices from one or more third party pricing vendors or brokers to value its investments. When current market prices, quotations or currency exchange rates are not readily available or reliable, investments will be fair valued in good faith by the Committee, in accordance with procedures adopted by the Board. Factors used in determining fair value vary by investment type and may include market or investment specific events, changes in interest rates and credit quality. The frequency with which these procedures are used cannot be predicted and they may be utilized to a significant extent. The Committee oversees each Fund's valuation policies and procedures and reports to the Board on the Committee's activities and fair value determinations. The Board monitors the appropriateness of the procedures used in valuing each Fund's investments and ratifies the fair value determinations of the Committee. Each Fund categorizes the inputs to valuation techniques used to value its investments into a disclosure hierarchy consisting of three levels as shown below:
- Level 1 – quoted prices in active markets for identical investments
- Level 2 – other significant observable inputs (including quoted prices for similar investments, interest rates, prepayment speeds, etc.)
- Level 3 – unobservable inputs (including the Fund's own assumptions based on the best information available)
Valuation techniques used to value each Fund's investments by major category are as follows. Debt securities, including restricted securities, are valued based on evaluated prices received from third party pricing vendors or from brokers who make markets in such securities. U.S. government and government agency obligations are valued by pricing vendors who utilize matrix pricing which considers yield or price of bonds of comparable quality, coupon, maturity and type or by broker-supplied prices. When independent prices are unavailable or unreliable, debt securities may be valued utilizing pricing methodologies which consider similar factors that would be used by third party pricing vendors. Debt securities are generally categorized as Level 2 in the hierarchy but may be Level 3 depending on the circumstances.
Exchange-Traded Funds (ETFs) are valued at their last sale price or official closing price as reported by a third party pricing vendor on the primary market or exchange on which they are traded and are categorized as Level 1 in the hierarchy. In the event there were no sales during the day but the exchange reports a closing bid level, ETFs are valued at the closing bid and would be categorized as Level 1 in the hierarchy. In the event there was no closing bid, ETFs may be valued by another method that the Board believes reflects fair value in accordance with the Board's fair value pricing policies and may be categorized as Level 2 in the hierarchy.
Futures contracts are valued at the settlement price established each day by the board of trade or exchange on which they are traded and are categorized as Level 1 in the hierarchy. Investments in open-end mutual funds, including the Fidelity Central Funds, are valued at their closing net asset value (NAV) each business day and are categorized as Level 1 in the hierarchy.
Changes in valuation techniques may result in transfers in or out of an assigned level within the disclosure hierarchy. The aggregate value of investments by input level, as of March 31, 2019, is included at the end of each Fund's Schedule of Investments.
Foreign Currency. The Funds may use foreign currency contracts to facilitate transactions in foreign-denominated securities. Gains and losses from these transactions may arise from changes in the value of the foreign currency or if the counterparties do not perform under the contracts' terms.
Foreign-denominated assets, including investment securities, and liabilities are translated into U.S. dollars at the exchange rates at period end. Purchases and sales of investment securities, income and dividends received and expenses denominated in foreign currencies are translated into U.S. dollars at the exchange rate in effect on the transaction date.
The effects of exchange rate fluctuations on investments are included with the net realized and unrealized gain (loss) on investment securities. Other foreign currency transactions resulting in realized and unrealized gain (loss) are disclosed separately.
Investment Transactions and Income. For financial reporting purposes, the Funds' investment holdings and NAV include trades executed through the end of the last business day of the period. The NAV per share for processing shareholder transactions is calculated as of the close of business of the New York Stock Exchange (NYSE), normally 4:00 p.m. Eastern time and includes trades executed through the end of the prior business day. Gains and losses on securities sold are determined on the basis of identified cost and for certain Funds include proceeds received from litigation. Dividend income is recorded on the ex-dividend date, except for certain dividends from foreign securities where the ex-dividend date may have passed, which are recorded as soon as the Funds are informed of the ex-dividend date. Non-cash dividends included in dividend income, if any, are recorded at the fair market value of the securities received. Income and capital gain distributions from Fidelity Central Funds, if any, are recorded on the ex-dividend date. Certain distributions received by the Funds represent a return of capital or capital gain. The Funds determine the components of these distributions subsequent to the ex-dividend date, based upon receipt of tax filings or other correspondence relating to the underlying investment. These distributions are recorded as a reduction of cost of investments and/or as a realized gain. Interest income is accrued as earned and includes coupon interest and amortization of premium and accretion of discount on debt securities as applicable. Investment income is recorded net of foreign taxes withheld where recovery of such taxes is uncertain.
Class Allocations and Expenses. Investment income, realized and unrealized capital gains and losses, common expenses of each Fund, and certain fund-level expense reductions, if any, are allocated daily on a pro-rata basis to each class based on the relative net assets of each class to the total net assets of each Fund. Each class differs with respect to transfer agent and distribution and service plan fees incurred. Certain expense reductions may also differ by class. For the reporting period, the allocated portion of income and expenses to each class as a percent of its average net assets may vary due to the timing of recording these transactions in relation to fluctuating net assets of the classes. Expenses directly attributable to a fund are charged to that fund. Expenses attributable to more than one fund are allocated among the respective funds on the basis of relative net assets or other appropriate methods. Expense estimates are accrued in the period to which they relate and adjustments are made when actual amounts are known. Expenses included in the accompanying financial statements reflect the expenses of each Fund and do not include any expenses of the Fidelity Central Funds. Although not included in each Fund's expenses, each Fund indirectly bears its proportionate share of the Fidelity Central Funds' expenses through the impact of these expenses on each Fidelity Central Fund's NAV.
Deferred Trustee Compensation. Under a Deferred Compensation Plan (the Plan) certain Funds, certain independent Trustees have elected to defer receipt of a portion of their annual compensation. Deferred amounts are invested in a cross-section of Fidelity funds, are marked-to-market and remain in each Fund until distributed in accordance with the Plan. The investment of deferred amounts and the offsetting payable to the Trustees presented below are included in each accompanying Statement of Assets and Liabilities in other receivables and other payables and accrued expenses, respectively.
| Fidelity Asset Manager 50% | $203,374 |
| Fidelity Asset Manager 70% | $43,146 |
Income Tax Information and Distributions to Shareholders. Each year, each Fund intends to qualify as a regulated investment company under Subchapter M of the Internal Revenue Code, including distributing substantially all of its taxable income and realized gains. As a result, no provision for U.S. Federal income taxes is required. Each Fund files a U.S. federal tax return, in addition to state and local tax returns as required. Each Fund's federal income tax returns are subject to examination by the Internal Revenue Service (IRS) for a period of three fiscal years after they are filed. State and local tax returns may be subject to examination for an additional fiscal year depending on the jurisdiction. Foreign taxes are provided for based on each Fund's understanding of the tax rules and rates that exist in the foreign markets in which it invests.
Distributions are declared and recorded on the ex-dividend date. Income and capital gain distributions are declared separately for each class. Income and capital gain distributions are determined in accordance with income tax regulations, which may differ from GAAP.
Capital accounts within the financial statements are adjusted for permanent book-tax differences. These adjustments have no impact on net assets or the results of operations. Capital accounts are not adjusted for temporary book-tax differences which will reverse in a subsequent period.
Book-tax differences are primarily due to the short-term gain distributions from the Underlying Funds, futures contracts, foreign currency transactions, passive foreign investment companies (PFIC), market discount, partnerships (including allocations from Fidelity Central Funds), deferred trustees compensation and losses deferred due to wash sales.
As of period end, the cost and unrealized appreciation (depreciation) in securities, and derivatives if applicable, for federal income tax purposes were as follows for each Fund:
| Tax cost | Gross unrealized appreciation | Gross unrealized depreciation | Net unrealized appreciation (depreciation) | |
| Fidelity Asset Manager 20% | $4,874,196,661 | $186,986,593 | $(20,888,973) | $166,097,620 |
| Fidelity Asset Manager 30% | 1,573,429,587 | 66,684,067 | (13,601,954) | 53,082,113 |
| Fidelity Asset Manager 40% | 1,658,370,620 | 102,773,071 | (15,192,613) | 87,580,458 |
| Fidelity Asset Manager 50% | 8,339,038,225 | 880,122,797 | (62,080,146) | 818,042,651 |
| Fidelity Asset Manager 60% | 2,836,417,191 | 239,914,087 | (56,726,794) | 183,187,293 |
| Fidelity Asset Manager 70% | 4,578,109,993 | 699,353,348 | (28,922,544) | 670,430,804 |
| Fidelity Asset Manager 85% | 2,281,046,982 | 335,371,644 | (26,722,512) | 308,649,132 |
New Rule Issuance. During August 2018, the U.S. Securities and Exchange Commission issued Final Rule Release No. 33-10532, Disclosure Update and Simplification. This Final Rule includes amendments specific to registered investment companies that are intended to eliminate overlap in disclosure requirements between Regulation S-X and GAAP. In accordance with these amendments, certain line-items in the Funds' financial statements have been combined or removed for the current period as outlined in the table below.
| Financial Statement | Current Line-Item Presentation (As Applicable) | Prior Line-Item Presentation (As Applicable) |
| Statement of Assets and Liabilities | Total distributable earnings (loss) | Undistributed/Distributions in excess of/Accumulated net investment income (loss) Accumulated/Undistributed net realized gain (loss) Net unrealized appreciation (depreciation) |
| Statement of Changes in Net Assets | N/A - removed | Undistributed/Distributions in excess of/Accumulated net investment income (loss) end of period |
| Statement of Changes in Net Assets | Distributions to shareholders | Distributions to shareholders from net investment income Distributions to shareholders from net realized gain |
| Distributions to Shareholders Note to Financial Statements | Distributions to shareholders | Distributions to shareholders from net investment income Distributions to shareholders from net realized gain |
4. Derivative Instruments.
Risk Exposures and the Use of Derivative Instruments. The Funds' investment objective allows the Funds to enter into various types of derivative contracts, including futures contracts. Derivatives are investments whose value is primarily derived from underlying assets, indices or reference rates and may be transacted on an exchange or over-the-counter (OTC). Derivatives may involve a future commitment to buy or sell a specified asset based on specified terms, to exchange future cash flows at periodic intervals based on a notional principal amount, or for one party to make one or more payments upon the occurrence of specified events in exchange for periodic payments from the other party.
The Funds used derivatives to increase returns and to manage exposure to certain risks as defined below. The success of any strategy involving derivatives depends on analysis of numerous economic factors, and if the strategies for investment do not work as intended, the Funds may not achieve their objectives.
The Funds' use of derivatives increased or decreased their exposure to the following risk:
| Equity Risk | Equity risk relates to the fluctuations in the value of financial instruments as a result of changes in market prices (other than those arising from interest rate risk or foreign exchange risk), whether caused by factors specific to an individual investment, its issuer, or all factors affecting all instruments traded in a market or market segment. |
The Funds are also exposed to additional risks from investing in derivatives, such as liquidity risk and counterparty credit risk. Liquidity risk is the risk that the Funds will be unable to close out the derivative in the open market in a timely manner. Counterparty credit risk is the risk that the counterparty will not be able to fulfill its obligation to the Funds. Counterparty credit risk related to exchange-traded futures contracts may be mitigated by the protection provided by the exchange on which they trade.
Investing in derivatives may involve greater risks than investing in the underlying assets directly and, to varying degrees, may involve risk of loss in excess of any initial investment and collateral received and amounts recognized in the Statement of Assets and Liabilities. In addition, there may be the risk that the change in value of the derivative contract does not correspond to the change in value of the underlying instrument.
Futures Contracts. A futures contract is an agreement between two parties to buy or sell a specified underlying instrument for a fixed price at a specified future date. The Funds used futures contracts to manage their exposure to the stock market.
Upon entering into a futures contract, a fund is required to deposit either cash or securities (initial margin) with a clearing broker in an amount equal to a certain percentage of the face value of the contract. Futures contracts are marked-to-market daily and subsequent daily payments (variation margin) are made or received by a fund depending on the daily fluctuations in the value of the futures contracts and are recorded as unrealized appreciation or (depreciation). This receivable and/or payable, if any, is included in daily variation margin on futures contracts in the Statement of Assets and Liabilities. Realized gain or (loss) is recorded upon the expiration or closing of a futures contract. The net realized gain (loss) and change in net unrealized appreciation (depreciation) on futures contracts during the period is presented in the Statement of Operations.
Any open futures contracts at period end are presented in the Schedule of Investments under the caption "Futures Contracts". The notional amount at value reflects each contract's exposure to the underlying instrument or index at period end and is representative of volume of activity during the period except for Fidelity Asset Manager 20%, Fidelity Asset Manager 30% and Fidelity Asset Manager 40%. Securities deposited to meet initial margin requirements are identified in the Schedule of Investments.
5. Purchases and Sales of Investments
Purchases and sales of securities including the Equity and Fixed-Income Central Funds and in-kind transactions, other than short-term securities, are noted in the table below.
| Purchases ($) | Redemptions ($) | |
| Fidelity Asset Manager 20% | 743,303,149 | 752,388,533 |
| Fidelity Asset Manager 30% | 288,481,828 | 256,926,621 |
| Fidelity Asset Manager 40% | 364,511,513 | 295,741,891 |
| Fidelity Asset Manager 50% | 1,818,172,931 | 1,748,787,497 |
| Fidelity Asset Manager 60% | 732,096,855 | 556,985,513 |
| Fidelity Asset Manager 70% | 1,161,044,395 | 931,467,126 |
| Fidelity Asset Manager 85% | 710,209,100 | 599,215,539 |
6. Fees and Other Transactions with Affiliates.
Management Fee. Fidelity Management & Research Company (the investment adviser) and its affiliates provide the Funds with investment management related services for which the Funds pay a monthly management fee. The management fee is the sum of an individual fund fee rate and an annualized group fee rate. The individual fund fee rate is applied to each Fund's average net assets. The group fee rate is based upon the average net assets of all the mutual funds advised by the investment adviser, including any mutual funds previously advised by the investment adviser that are currently advised by Fidelity SelectCo, LLC, an affiliate of the investment adviser. The group fee rate decreases as assets under management increase and increases as assets under management decrease. For the reporting period, each Fund's annualized management fee rate expressed as a percentage of each Fund's average net assets was as follows:
| Individual Rate | Group Rate | Total | |
| Fidelity Asset Manager 20% | .30% | .11% | .41% |
| Fidelity Asset Manager 30% | .30% | .11% | .41% |
| Fidelity Asset Manager 40% | .30% | .11% | .41% |
| Fidelity Asset Manager 50% | .25% | .24% | .49% |
| Fidelity Asset Manager 60% | .30% | .24% | .54% |
| Fidelity Asset Manager 70% | .30% | .24% | .54% |
| Fidelity Asset Manager 85% | .30% | .24% | .54% |
The investment adviser pays a portion of the management fees received from the Fund to the Fidelity Central Funds' investment advisers, who are also affiliates, for managing the assets of the Fidelity Central Funds.
Distribution and Service Plan Fees. In accordance with Rule 12b-1 of the 1940 Act, each Fund has adopted separate Distribution and Service Plans for each class of shares. Certain classes pay Fidelity Distributors Corporation (FDC), an affiliate of the investment adviser, separate Distribution and Service Fees, each of which is based on an annual percentage of each class' average net assets. In addition, FDC may pay financial intermediaries for selling shares of each Fund and providing shareholder support services. For the period, the Distribution and Service Fee rates, total fees and amounts retained by FDC were as follows:
| Distribution Fee | Service Fee | Total Fees | Retained by FDC | |
| Fidelity Asset Manager 20% | ||||
| Class A | -% | .25% | $48,757 | $1,821 |
| Class M | .25% | .25% | 57,700 | 97 |
| Class C | .75% | .25% | 123,833 | 13,680 |
| $230,290 | $15,598 | |||
| Fidelity Asset Manager 30% | ||||
| Class A | -% | .25% | $36,275 | $680 |
| Class M | .25% | .25% | 34,855 | 22 |
| Class C | .75% | .25% | 115,751 | 22,795 |
| $186,881 | $23,497 | |||
| Fidelity Asset Manager 40% | ||||
| Class A | -% | .25% | $46,530 | $1,318 |
| Class M | .25% | .25% | 28,560 | – |
| Class C | .75% | .25% | 125,557 | 24,363 |
| $200,647 | $25,681 | |||
| Fidelity Asset Manager 50% | ||||
| Class A | -% | .25% | $104,154 | $3,308 |
| Class M | .25% | .25% | 99,486 | 505 |
| Class C | .75% | .25% | 246,741 | 63,025 |
| $450,381 | $66,838 | |||
| Fidelity Asset Manager 60% | ||||
| Class A | -% | .25% | $151,881 | $4,344 |
| Class M | .25% | .25% | 127,546 | 364 |
| Class C | .75% | .25% | 393,668 | 47,992 |
| $673,095 | $52,700 | |||
| Fidelity Asset Manager 70% | ||||
| Class A | -% | .25% | $181,178 | $2,552 |
| Class M | .25% | .25% | 142,418 | 1,334 |
| Class C | .75% | .25% | 286,253 | 39,481 |
| $609,849 | $43,367 | |||
| Fidelity Asset Manager 85% | ||||
| Class A | -% | .25% | $136,652 | $7,311 |
| Class M | .25% | .25% | 74,334 | 402 |
| Class C | .75% | .25% | 226,435 | 42,666 |
| $437,421 | $50,379 |
Sales Load. FDC may receive a front-end sales charge of up to 5.75% for selling Class A shares and 3.50% for selling Class M shares, some of which is paid to financial intermediaries for selling shares of each Fund. Depending on the holding period, FDC may receive contingent deferred sales charges levied on Class A, Class M and Class C redemptions. The deferred sales charges are 1.00% for Class C shares, 1.00% for certain purchases of Class A shares and .25% for certain purchases of Class M shares.
For the period, sales charge amounts retained by FDC were as follows:
| Retained by FDC | |
| Fidelity Asset Manager 20% | |
| Class A | $4,138 |
| Class M | 4,263 |
| Class C(a) | 618 |
| $9,019 | |
| Fidelity Asset Manager 30% | |
| Class A | $8,127 |
| Class M | 2,074 |
| Class C(a) | 2,953 |
| $13,154 | |
| Fidelity Asset Manager 40% | |
| Class A | $12,162 |
| Class M | 2,036 |
| Class C(a) | 1,536 |
| $15,734 | |
| Fidelity Asset Manager 50% | |
| Class A | $19,139 |
| Class M | 5,320 |
| Class C(a) | 7,370 |
| $31,829 | |
| Fidelity Asset Manager 60% | |
| Class A | $19,850 |
| Class M | 4,330 |
| Class C(a) | 4,378 |
| $28,558 | |
| Fidelity Asset Manager 70% | |
| Class A | $33,676 |
| Class M | 5,811 |
| Class C(a) | 3,568 |
| $43,055 | |
| Fidelity Asset Manager 85% | |
| Class A | $51,234 |
| Class M | 4,667 |
| Class C(a) | 2,412 |
| $58,313 |
(a) When Class C shares are initially sold, FDC pays commissions from its own resources to financial intermediaries through which the sales are made.
Transfer Agent Fees. Fidelity Investments Institutional Operations Company, Inc., (FIIOC), an affiliate of the investment adviser, is the transfer, dividend disbursing and shareholder servicing agent for each class of the Funds. FIIOC receives account fees and asset-based fees that vary according to the account size and type of account of the shareholders of the respective classes of each Fund, except for Class Z. FIIOC receives an asset-based fee of Class Z's average net assets. FIIOC pays for typesetting, printing and mailing of shareholder reports, except proxy statements. For the period, transfer agent fees for each class were as follows:
| Amount | % of Class-Level Average Net Assets(a) | |
| Fidelity Asset Manager 20% | ||
| Class A | $28,573 | .15 |
| Class M | 17,370 | .15 |
| Class C | 19,219 | .16 |
| Asset Manager 20% | 1,869,217 | .08 |
| Class I | 31,398 | .12 |
| Class Z | 360 | .05 |
| $1,966,137 | ||
| Fidelity Asset Manager 30% | ||
| Class A | $17,773 | .12 |
| Class M | 9,538 | .14 |
| Class C | 17,221 | .15 |
| Asset Manager 30% | 536,333 | .07 |
| Class I | 15,769 | .14 |
| Class Z | 80 | .05 |
| $596,714 | ||
| Fidelity Asset Manager 40% | ||
| Class A | $24,525 | .13 |
| Class M | 8,343 | .15 |
| Class C | 18,544 | .15 |
| Asset Manager 40% | 582,333 | .08 |
| Class I | 16,489 | .11 |
| Class Z | 174 | .05 |
| $650,408 | ||
| Fidelity Asset Manager 50% | ||
| Class A | $75,965 | .18 |
| Class M | 35,528 | .18 |
| Class C | 46,243 | .19 |
| Asset Manager 50% | 5,273,513 | .12 |
| Class I | 51,772 | .15 |
| Class Z | 271 | .05 |
| $5,483,292 | ||
| Fidelity Asset Manager 60% | ||
| Class A | $112,574 | .19 |
| Class M | 49,910 | .20 |
| Class C | 88,285 | .22 |
| Asset Manager 60% | 1,504,081 | .12 |
| Class I | 47,015 | .17 |
| Class Z | 349 | .05 |
| $1,802,214 | ||
| Fidelity Asset Manager 70% | ||
| Class A | $129,752 | .18 |
| Class M | 50,376 | .18 |
| Class C | 52,763 | .18 |
| Asset Manager 70% | 2,860,810 | .12 |
| Class I | 53,562 | .15 |
| Class Z | 358 | .05 |
| $3,147,621 | ||
| Fidelity Asset Manager 85% | ||
| Class A | $103,360 | .19 |
| Class M | 30,009 | .20 |
| Class C | 44,103 | .19 |
| Asset Manager 85% | 1,454,327 | .13 |
| Class I | 32,761 | .17 |
| Class Z | 191 | .05 |
| $1,664,751 |
(a) Annualized
Accounting and Security Lending Fees. Fidelity Service Company, Inc. (FSC), an affiliate of the investment adviser, maintains each Fund's accounting records. The accounting fee is based on the level of average net assets for each month. Under a separate contract, FSC administers the security lending program. The security lending fee is based on the number and duration of lending transactions. For the period, the fees were equivalent to the following annualized rates:
| % of Average Net Assets | |
| Fidelity Asset Manager 20% | .02 |
| Fidelity Asset Manager 30% | .03 |
| Fidelity Asset Manager 40% | .03 |
| Fidelity Asset Manager 50% | .02 |
| Fidelity Asset Manager 60% | .04 |
| Fidelity Asset Manager 70% | .03 |
| Fidelity Asset Manager 85% | .03 |
Brokerage Commissions. Certain Funds placed a portion of their portfolio transactions with brokerage firms which are affiliates of the investment adviser. Brokerage commissions are included in net realized gain (loss) and change in net unrealized appreciations (depreciation) in the Statement of Operations. The commissions paid to these affiliated firms were as follows:
| Amount | |
| Fidelity Asset Manager 20% | $3,628 |
| Fidelity Asset Manager 30% | 1,054 |
| Fidelity Asset Manager 40% | 1,197 |
| Fidelity Asset Manager 50% | 6,897 |
| Fidelity Asset Manager 60% | 2,375 |
| Fidelity Asset Manager 70% | 4,370 |
| Fidelity Asset Manager 85% | 2,051 |
Interfund Trades. The Funds may purchase from or sell securities to other Fidelity Funds under procedures adopted by the Board. The procedures have been designed to ensure these interfund trades are executed in accordance with Rule 17a-7 of the 1940 Act. Interfund trades are included within the respective purchases and sales amounts shown in the Purchases and Sales of Investments note.
Reallocation of Underlying Fund Investments. During the period, the investment adviser reallocated portions of investments of the Funds. This involved taxable redemptions of Fidelity Consumer Discretionary Central Fund and Fidelity Information Technology Central Fund for investments and a non-taxable exchange of those investments for shares of Fidelity Communication Services Central Fund. Net realized gain (loss) on redemptions from Fidelity Consumer Discretionary Central Fund and Fidelity Information Technology Central Fund in connection with the reallocation is included in the Statement of Operations as "Net realized gain (loss) on Fidelity Central Funds". Fidelity Communication Services Central Fund, Fidelity Consumer Discretionary Central Fund and Fidelity Information Technology Central Fund are affiliated investment companies managed by FMR.
Details of the transactions are presented in the accompanying table:
| Fund | Value of Investments Delivered – Consumer Discretionary Central Fund | Value of Investments Delivered – Information Technology Central Fund | Net Realized Gain (Loss) - Consumer Discretionary Central Fund | Net Realized Gain (Loss) - Information Technology Central Fund | Shares of Fidelity Communication Services Central Fund |
| Fidelity Asset Manager 20% | $8,287,816 | $22,064,168 | $143,269 | $(1,834,288) | 165,244 |
| Fidelity Asset Manager 30% | 4,191,630 | 11,133,993 | 40,707 | (1,174,655) | 83,437 |
| Fidelity Asset Manager 40% | 6,157,563 | 16,324,048 | 61,120 | (1,575,905) | 122,396 |
| Fidelity Asset Manager 50% | 42,393,850 | 112,638,454 | 2,128,212 | (7,094,704) | 844,035 |
| Fidelity Asset Manager 60% | 16,483,005 | 43,767,522 | 346,948 | (3,599,296) | 328,019 |
| Fidelity Asset Manager 70% | 34,458,735 | 91,443,178 | 4,889,713 | (3,189,830) | 685,442 |
| Fidelity Asset Manager 85% | 20,203,488 | 53,640,310 | 379,073 | (4,871,123) | 402,024 |
Prior Fiscal Year Reallocation of Underlying Fund Investments. During the prior period, the investment adviser reallocated investments of Fidelity Asset Manager 60%. This involved taxable redemptions of Fidelity Asset Manager 60%s' interest in Fidelity Stock Selector All Cap Fund in exchange for investments, valued at $23,473,658, and non-taxable exchanges of those investments for shares of Fidelity Cash Central Fund, Fidelity Communication Services Central Fund, Fidelity Consumer Discretionary Central Fund, Fidelity Consumer Staples Central Fund, Fidelity Energy Central Fund, Fidelity Financials Central Fund, Fidelity Health Care Central Fund, Fidelity Industrials Central Fund, Fidelity Information Technology Central Fund, Fidelity Materials Central Fund, Fidelity Communication Services Central Fund and Fidelity Utilities Central Fund. Fidelity Asset Manager 60% had a net realized gain of $1,029,488 on the redemption of Fidelity Stock Selector All Cap Fund.
Other. During the period, the investment adviser reimbursed Fidelity Asset Manager 60% for certain losses in the amount of $1,369.
7. Committed Line of Credit.
Certain Funds participate with other funds managed by the investment adviser or an affiliate in a $4.25 billion credit facility (the "line of credit") to be utilized for temporary or emergency purposes to fund shareholder redemptions or for other short-term liquidity purposes. The participating funds have agreed to pay commitment fees on their pro-rata portion of the line of credit, which are reflected in Miscellaneous expenses on the Statement of Operations, and are as follows:
| Fidelity Asset Manager 20% | $9,566 |
| Fidelity Asset Manager 30% | 3,003 |
| Fidelity Asset Manager 40% | 3,219 |
| Fidelity Asset Manager 50% | 17,636 |
| Fidelity Asset Manager 60% | 5,679 |
| Fidelity Asset Manager 70% | 10,131 |
| Fidelity Asset Manager 85% | 4,824 |
During the period, the Funds did not borrow on this line of credit.
8. Security Lending.
Certain Funds lend portfolio securities through a lending agent from time to time in order to earn additional income. For equity securities, a lending agent is used and may loan securities to certain qualified borrowers, including Fidelity Capital Markets (FCM), a broker-dealer affiliated with the Funds. On the settlement date of the loan, each applicable Fund receives collateral (in the form of U.S. Treasury obligations, letters of credit and/or cash) against the loaned securities and maintains collateral in an amount not less than 100% of the market value of the loaned securities during the period of the loan. The market value of the loaned securities is determined at the close of business of the Funds and any additional required collateral is delivered to the Funds on the next business day. The Funds or borrower may terminate the loan at any time, and if the borrower defaults on its obligation to return the securities loaned because of insolvency or other reasons, the Funds may apply collateral received from the borrower against the obligation. The Funds may experience delays and costs in recovering the securities loaned. Any cash collateral received is invested in the Fidelity Securities Lending Cash Central Fund. The value of loaned securities and cash collateral at period end are disclosed on each applicable Fund's Statement of Assets and Liabilities. Security lending income represents the income earned on investing cash collateral, less rebates paid to borrowers and any lending agent fees associated with the loan, plus any premium payments received for lending certain types of securities. Security lending income is presented on each applicable Fund's Statement of Operations as a component of income from Fidelity Central Funds. During the period, there were no securities loaned to FCM. Security lending activity was as follows:
| Total Security Lending Income | |
| Fidelity Asset Manager 20% | $44,286 |
| Fidelity Asset Manager 30% | $11,438 |
| Fidelity Asset Manager 40% | $13,796 |
| Fidelity Asset Manager 50% | $68,666 |
| Fidelity Asset Manager 60% | $12,693 |
| Fidelity Asset Manager 70% | $32,387 |
| Fidelity Asset Manager 85% | $9,284 |
9. Expense Reductions.
Commissions paid to certain brokers with whom the investment adviser, or its affiliates, places trades on behalf of certain Funds and certain Central Funds include an amount in addition to trade execution, which may be rebated back to the Funds to offset certain expenses. Through arrangements with each applicable Fund's custodian and each class' transfer agent, credits realized as a result of certain uninvested cash balances were used to reduce the Fund's expenses. All of the applicable expense reductions are noted in the table below.
| Brokerage Service credits | Custody credits | Transfer Agent credits | |
| Fidelity Asset Manager 20% | $42,711 | $5 | $– |
| Fidelity Asset Manager 30% | 13,573 | 450 | – |
| Fidelity Asset Manager 40% | 14,453 | 180 | – |
| Fidelity Asset Manager 50% | 78,857 | 287 | – |
| Fidelity Asset Manager 50% - Class C | – | – | 92 |
| Fidelity Asset Manager 50% - Asset Manager 50% | – | – | 2,872 |
| Fidelity Asset Manager 60% | 24,972 | – | – |
| Fidelity Asset Manager 60% - Class C | – | – | 320 |
| Fidelity Asset Manager 70% | 45,692 | 89 | – |
| Fidelity Asset Manager 70% - Class C | – | – | 316 |
| Fidelity Asset Manager 85% | 19,768 | 1,781 | – |
During the period the investment adviser reimbursed and/or waived a portion of fund-level operating expenses and a portion of class-level operating expenses as follows:
| Fund-Level Amount | |
| Fidelity Asset Manager 20% | $11,900 |
| Fidelity Asset Manager 30% | 3,748 |
| Fidelity Asset Manager 40% | 3,959 |
| Fidelity Asset Manager 50% | 34,254 |
| Fidelity Asset Manager 60% | 11,008 |
| Fidelity Asset Manager 70% | 19,366 |
| Fidelity Asset Manager 85% | 9,125 |
| Class-Level Amount | |
| Fidelity Asset Manager 20% | |
| Class A | $116 |
| Class M | 72 |
| Class C | 74 |
| Asset Manager 20% | 13,807 |
| Class I | 163 |
| Class Z | 6 |
| $14,238 | |
| Fidelity Asset Manager 30% | |
| Class A | $275 |
| Class M | 126 |
| Class C | 213 |
| Asset Manager 30% | 13,437 |
| Class I | 183 |
| Class Z | 4 |
| $14,238 | |
| Fidelity Asset Manager 40% | |
| Class A | $323 |
| Class M | 97 |
| Class C | 223 |
| Asset Manager 40% | 13,320 |
| Class I | 266 |
| Class Z | 9 |
| $14,238 | |
| Fidelity Asset Manager 50% | |
| Class A | $132 |
| Class M | 64 |
| Class C | 81 |
| Asset Manager 50% | 13,848 |
| Class I | 110 |
| Class Z | 3 |
| $14,238 | |
| Fidelity Asset Manager 60% | |
| Class A | $584 |
| Class M | 248 |
| Class C | 376 |
| Asset Manager 60% | 12,756 |
| Class I | 264 |
| Class Z | 10 |
| $14,238 | |
| Fidelity Asset Manager 70% | |
| Class A | $408 |
| Class M | 159 |
| Class C | 159 |
| Asset Manager 70% | 13,314 |
| Class I | 192 |
| Class Z | 6 |
| $14,238 | |
| Fidelity Asset Manager 85% | |
| Class A | $645 |
| Class M | 179 |
| Class C | 262 |
| Asset Manager 85% | 12,928 |
| Class I | 217 |
| Class Z | 7 |
| $14,238 |
In addition, during the period the investment advisor reimbursed and/or waived a portion of class-level operating expenses for Fidelity Asset Manager 60% as follows:
| Amount | |
| Class A | $6,913 |
| Class M | 6,280 |
| Class C | 18,191 |
| Asset Manager 60% | 129,169 |
| Class I | 6,013 |
10. Distributions to Shareholders.
Distributions to shareholders of each class were as follows:
| Six months ended March 31, 2019(a) | Year ended September 30, 2018 |
|
| Fidelity Asset Manager 20% | ||
| Distributions to shareholders | ||
| Class A | $1,141,978 | $– |
| Class M | 639,529 | – |
| Class C | 629,302 | – |
| Asset Manager 20% | 144,365,770 | – |
| Class I | 1,518,048 | – |
| Class Z | 46,673 | – |
| Total | $148,341,300 | $– |
| From net investment income | ||
| Class A | $– | $557,701 |
| Class M | – | 279,827 |
| Class C | – | 185,838 |
| Asset Manager 20% | – | 84,880,963 |
| Class I | – | 824,664 |
| Total | $– | $86,728,993 |
| From net realized gain | ||
| Class A | $– | $779,626 |
| Class M | – | 493,663 |
| Class C | – | 574,273 |
| Asset Manager 20% | – | 97,924,513 |
| Class I | – | 1,051,312 |
| Total | $– | $100,823,387 |
| Fidelity Asset Manager 30% | ||
| Distributions to shareholders | ||
| Class A | $758,786 | $– |
| Class M | 344,747 | – |
| Class C | 528,869 | – |
| Asset Manager 30% | 40,681,239 | – |
| Class I | 637,944 | – |
| Class Z | 9,528 | – |
| Total | $42,961,113 | $– |
| From net investment income | ||
| Class A | $– | $355,354 |
| Class M | – | 156,008 |
| Class C | – | 154,206 |
| Asset Manager 30% | – | 22,830,501 |
| Class I | – | 363,088 |
| Total | $– | $23,859,157 |
| From net realized gain | ||
| Class A | $– | $409,514 |
| Class M | – | 218,213 |
| Class C | – | 374,145 |
| Asset Manager 30% | – | 20,223,846 |
| Class I | – | 364,145 |
| Total | $– | $21,589,863 |
| Fidelity Asset Manager 40% | ||
| Distributions to shareholders | ||
| Class A | $1,226,682 | $– |
| Class M | 364,928 | – |
| Class C | 745,459 | – |
| Asset Manager 40% | 53,408,886 | – |
| Class I | 1,033,368 | – |
| Class Z | 18,484 | – |
| Total | $56,797,807 | $– |
| From net investment income | ||
| Class A | $– | $471,476 |
| Class M | – | 125,666 |
| Class C | – | 129,202 |
| Asset Manager 40% | – | 23,253,114 |
| Class I | – | 366,442 |
| Total | $– | $24,345,900 |
| From net realized gain | ||
| Class A | $– | $566,952 |
| Class M | – | 187,948 |
| Class C | – | 373,661 |
| Asset Manager 40% | – | 22,032,579 |
| Class I | – | 341,273 |
| Total | $– | $23,502,413 |
| Fidelity Asset Manager 50% | ||
| Distributions to shareholders | ||
| Class A | $3,354,558 | $– |
| Class M | 1,545,916 | – |
| Class C | 1,842,938 | – |
| Asset Manager 50% | 363,881,694 | – |
| Class I | 2,606,217 | – |
| Class Z | 45,849 | – |
| Total | $373,277,172 | $– |
| From net investment income | ||
| Class A | $– | $899,227 |
| Class M | – | 339,459 |
| Class C | – | 198,158 |
| Asset Manager 50% | – | 123,985,926 |
| Class I | – | 699,436 |
| Total | $– | $126,122,206 |
| From net realized gain | ||
| Class A | $– | $2,261,536 |
| Class M | – | 1,094,410 |
| Class C | – | 1,270,444 |
| Asset Manager 50% | – | 246,849,451 |
| Class I | – | 1,287,526 |
| Total | $– | $252,763,367 |
| Fidelity Asset Manager 60% | ||
| Distributions to shareholders | ||
| Class A | $4,620,358 | $– |
| Class M | 1,832,629 | – |
| Class C | 2,563,793 | – |
| Asset Manager 60% | 103,779,288 | – |
| Class I | 2,198,007 | – |
| Class Z | 64,358 | – |
| Total | $115,058,433 | $– |
| From net investment income | ||
| Class A | $– | $545,716 |
| Class M | – | 139,840 |
| Class C | – | 67,250 |
| Asset Manager 60% | – | 22,699,277 |
| Class I | – | 302,693 |
| Total | $– | $23,754,776 |
| From net realized gain | ||
| Class A | $– | $1,104,992 |
| Class M | – | 380,291 |
| Class C | – | 681,674 |
| Asset Manager 60% | – | 34,202,288 |
| Class I | – | 475,356 |
| Total | $– | $36,844,601 |
| Fidelity Asset Manager 70% | ||
| Distributions to shareholders | ||
| Class A | $7,809,044 | $– |
| Class M | 2,855,665 | – |
| Class C | 2,669,934 | – |
| Asset Manager 70% | 265,505,010 | – |
| Class I | 3,847,572 | – |
| Class Z | 116,778 | – |
| Total | $282,804,003 | $– |
| From net investment income | ||
| Class A | $– | $1,241,056 |
| Class M | – | 351,280 |
| Class C | – | 75,950 |
| Asset Manager 70% | – | 55,395,637 |
| Class I | – | 888,448 |
| Total | $– | $57,952,371 |
| From net realized gain | ||
| Class A | $– | $4,015,839 |
| Class M | – | 1,521,131 |
| Class C | – | 1,667,916 |
| Asset Manager 70% | – | 131,031,974 |
| Class I | – | 2,168,234 |
| Total | $– | $140,405,094 |
| Fidelity Asset Manager 85% | ||
| Distributions to shareholders | ||
| Class A | $5,200,134 | $– |
| Class M | 1,347,043 | – |
| Class C | 1,821,138 | – |
| Asset Manager 85% | 108,378,709 | – |
| Class I | 1,684,353 | – |
| Class Z | 55,180 | – |
| Total | $118,486,557 | $– |
| From net investment income | ||
| Class A | $– | $673,921 |
| Class M | – | 121,986 |
| Class C | – | 2,543 |
| Asset Manager 85% | – | 19,249,022 |
| Class I | – | 396,370 |
| Total | $– | $20,443,842 |
| From net realized gain | ||
| Class A | $– | $2,234,818 |
| Class M | – | 597,944 |
| Class C | – | 1,079,231 |
| Asset Manager 85% | – | 45,215,149 |
| Class I | – | 945,835 |
| Total | $– | $50,072,977 |
(a) Distributions for Class Z are for the period October 2, 2018 (commencement of sale of shares) to March 31, 2019.
11. Share Transactions.
Share transactions for each class were as follows and may contain automatic conversions between classes or exchanges between affiliated funds:
| Shares | Shares | Dollars | Dollars | |
| Six months ended March 31, 2019(a) | Year ended September 30, 2018 | Six months ended March 31, 2019(a) | Year ended September 30, 2018 | |
| Fidelity Asset Manager 20% | ||||
| Class A | ||||
| Shares sold | 660,423 | 505,884 | $8,603,036 | $6,772,848 |
| Reinvestment of distributions | 88,687 | 99,091 | 1,127,737 | 1,324,802 |
| Shares redeemed | (332,651) | (623,134) | (4,334,164) | (8,375,925) |
| Net increase (decrease) | 416,459 | (18,159) | $5,396,609 | $(278,275) |
| Class M | ||||
| Shares sold | 366,821 | 446,344 | $4,758,417 | $6,009,052 |
| Reinvestment of distributions | 50,411 | 57,952 | 639,490 | 773,445 |
| Shares redeemed | (167,981) | (510,377) | (2,185,385) | (6,849,158) |
| Net increase (decrease) | 249,251 | (6,081) | $3,212,522 | $(66,661) |
| Class C | ||||
| Shares sold | 267,740 | 373,368 | $3,452,433 | $4,979,751 |
| Reinvestment of distributions | 49,463 | 56,565 | 624,057 | 752,113 |
| Shares redeemed | (580,073) | (572,000) | (7,534,921) | (7,613,014) |
| Net increase (decrease) | (262,870) | (142,067) | $(3,458,431) | $(1,881,150) |
| Asset Manager 20% | ||||
| Shares sold | 36,912,353 | 57,784,729 | $480,623,503 | $777,681,921 |
| Reinvestment of distributions | 10,991,969 | 13,227,639 | 140,104,530 | 177,119,605 |
| Shares redeemed | (42,665,811) | (71,436,564) | (556,228,186) | (960,147,826) |
| Net increase (decrease) | 5,238,511 | (424,196) | $64,499,847 | $(5,346,300) |
| Class I | ||||
| Shares sold | 1,389,897 | 1,826,170 | $18,098,105 | $24,537,581 |
| Reinvestment of distributions | 113,344 | 122,856 | 1,443,611 | 1,643,815 |
| Shares redeemed | (697,700) | (2,022,771) | (9,124,228) | (27,262,357) |
| Net increase (decrease) | 805,541 | (73,745) | $10,417,488 | $(1,080,961) |
| Class Z | ||||
| Shares sold | 186,996 | – | $2,443,362 | $– |
| Reinvestment of distributions | 3,503 | – | 44,508 | – |
| Shares redeemed | (16,322) | – | (213,898) | – |
| Net increase (decrease) | 174,177 | – | $2,273,972 | $– |
| Fidelity Asset Manager 30% | ||||
| Class A | ||||
| Shares sold | 562,264 | 1,126,571 | $6,019,646 | $12,531,773 |
| Reinvestment of distributions | 71,446 | 68,985 | 745,387 | 763,328 |
| Shares redeemed | (274,261) | (641,581) | (2,949,144) | (7,118,517) |
| Net increase (decrease) | 359,449 | 553,975 | $3,815,889 | $6,176,584 |
| Class M | ||||
| Shares sold | 332,523 | 351,820 | $3,574,798 | $3,905,685 |
| Reinvestment of distributions | 33,072 | 33,836 | 344,521 | 374,018 |
| Shares redeemed | (306,073) | (259,115) | (3,290,202) | (2,874,044) |
| Net increase (decrease) | 59,522 | 126,541 | $629,117 | $1,405,659 |
| Class C | ||||
| Shares sold | 304,485 | 807,147 | $3,239,351 | $8,931,816 |
| Reinvestment of distributions | 50,948 | 48,021 | 526,848 | 528,342 |
| Shares redeemed | (546,309) | (505,372) | (5,826,168) | (5,572,836) |
| Net increase (decrease) | (190,876) | 349,796 | $(2,059,969) | $3,887,322 |
| Asset Manager 30% | ||||
| Shares sold | 19,865,755 | 54,804,477 | $213,159,286 | $609,493,754 |
| Reinvestment of distributions | 3,807,983 | 3,797,335 | 39,743,998 | 42,015,638 |
| Shares redeemed | (18,202,612) | (28,259,575) | (195,206,961) | (313,681,914) |
| Net increase (decrease) | 5,471,126 | 30,342,237 | $57,696,323 | $337,827,478 |
| Class I | ||||
| Shares sold | 500,466 | 1,484,878 | $5,321,379 | $16,479,743 |
| Reinvestment of distributions | 56,418 | 56,711 | 588,508 | 627,506 |
| Shares redeemed | (887,654) | (1,249,939) | (9,486,503) | (13,899,290) |
| Net increase (decrease) | (330,770) | 291,650 | $(3,576,616) | $3,207,959 |
| Class Z | ||||
| Shares sold | 54,248 | – | $586,324 | $– |
| Reinvestment of distributions | 893 | – | 9,293 | – |
| Shares redeemed | (16,577) | – | (177,528) | – |
| Net increase (decrease) | 38,564 | – | $418,089 | $– |
| Fidelity Asset Manager 40% | ||||
| Class A | ||||
| Shares sold | 500,003 | 880,673 | $5,632,438 | $10,373,863 |
| Reinvestment of distributions | 113,360 | 88,932 | 1,225,945 | 1,038,034 |
| Shares redeemed | (371,582) | (863,223) | (4,198,965) | (10,141,040) |
| Net increase (decrease) | 241,781 | 106,382 | $2,659,418 | $1,270,857 |
| Class M | ||||
| Shares sold | 97,567 | 292,310 | $1,094,097 | $3,437,201 |
| Reinvestment of distributions | 33,692 | 26,778 | 363,603 | 312,286 |
| Shares redeemed | (206,078) | (280,496) | (2,320,882) | (3,301,500) |
| Net increase (decrease) | (74,819) | 38,592 | $(863,182) | $447,987 |
| Class C | ||||
| Shares sold | 489,009 | 653,876 | $5,444,140 | $7,647,196 |
| Reinvestment of distributions | 69,365 | 42,489 | 744,222 | 494,372 |
| Shares redeemed | (538,066) | (534,308) | (6,054,493) | (6,247,978) |
| Net increase (decrease) | 20,308 | 162,057 | $133,869 | $1,893,590 |
| Asset Manager 40% | ||||
| Shares sold | 20,035,324 | 38,575,334 | $224,508,142 | $453,687,482 |
| Reinvestment of distributions | 4,822,877 | 3,807,876 | 52,184,852 | 44,412,987 |
| Shares redeemed | (16,461,270) | (24,658,282) | (184,809,171) | (289,713,503) |
| Net increase (decrease) | 8,396,931 | 17,724,928 | $91,883,823 | $208,386,966 |
| Class I | ||||
| Shares sold | 678,401 | 1,530,525 | $7,641,361 | $18,000,056 |
| Reinvestment of distributions | 90,154 | 57,375 | 974,730 | 669,253 |
| Shares redeemed | (378,449) | (844,872) | (4,251,700) | (9,930,720) |
| Net increase (decrease) | 390,106 | 743,028 | $4,364,391 | $8,738,589 |
| Class Z | ||||
| Shares sold | 173,206 | – | $1,941,986 | $– |
| Reinvestment of distributions | 1,224 | – | 13,151 | – |
| Shares redeemed | (43,846) | – | (492,604) | – |
| Net increase (decrease) | 130,584 | – | $1,462,533 | $– |
| Fidelity Asset Manager 50% | ||||
| Class A | ||||
| Shares sold | 814,377 | 1,146,120 | $14,173,077 | $21,057,916 |
| Reinvestment of distributions | 197,289 | 169,041 | 3,250,070 | 3,071,864 |
| Shares redeemed | (529,183) | (806,575) | (9,154,984) | (14,824,728) |
| Net increase (decrease) | 482,483 | 508,586 | $8,268,163 | $9,305,052 |
| Class M | ||||
| Shares sold | 351,108 | 557,672 | $6,098,101 | $10,265,163 |
| Reinvestment of distributions | 93,953 | 78,884 | 1,544,685 | 1,432,594 |
| Shares redeemed | (315,469) | (396,724) | (5,521,285) | (7,288,768) |
| Net increase (decrease) | 129,592 | 239,832 | $2,121,501 | $4,408,989 |
| Class C | ||||
| Shares sold | 632,611 | 1,015,038 | $10,853,236 | $18,488,385 |
| Reinvestment of distributions | 109,662 | 77,208 | 1,786,698 | 1,393,955 |
| Shares redeemed | (839,150) | (613,340) | (14,411,178) | (11,143,058) |
| Net increase (decrease) | (96,877) | 478,906 | $(1,771,244) | $8,739,282 |
| Asset Manager 50% | ||||
| Shares sold | 32,238,703 | 83,353,018 | $559,603,684 | $1,538,862,489 |
| Reinvestment of distributions | 21,322,538 | 19,729,969 | 353,149,326 | 359,754,574 |
| Shares redeemed | (41,825,436) | (66,347,048) | (729,659,807) | (1,224,405,900) |
| Net increase (decrease) | 11,735,805 | 36,735,939 | $183,093,203 | $674,211,163 |
| Class I | ||||
| Shares sold | 985,919 | 2,328,900 | $16,943,099 | $42,828,385 |
| Reinvestment of distributions | 139,751 | 99,153 | 2,312,188 | 1,805,013 |
| Shares redeemed | (1,316,000) | (669,663) | (22,821,047) | (12,321,431) |
| Net increase (decrease) | (190,330) | 1,758,390 | $(3,565,760) | $32,311,967 |
| Class Z | ||||
| Shares sold | 137,507 | – | $2,391,469 | $– |
| Reinvestment of distributions | 2,106 | – | 34,440 | – |
| Shares redeemed | (22,229) | – | (387,067) | – |
| Net increase (decrease) | 117,384 | – | $2,038,842 | $– |
| Fidelity Asset Manager 60% | ||||
| Class A | ||||
| Shares sold | 1,284,731 | 1,566,838 | $15,524,811 | $19,840,441 |
| Issued in exchange for the shares of Fidelity Global Balanced Fund | – | 3,323,365 | – | 41,608,523 |
| Issued in exchange for the shares of Fidelity Global Strategies Fund | – | 1,867,899 | – | 23,386,092 |
| Reinvestment of distributions | 411,701 | 131,843 | 4,590,464 | 1,646,723 |
| Shares redeemed | (1,236,344) | (1,525,577) | (14,770,827) | (19,314,959) |
| Net increase (decrease) | 460,088 | 5,364,368 | $5,344,448 | $67,166,820 |
| Class M | ||||
| Shares sold | 249,573 | 423,116 | $2,976,799 | $5,343,645 |
| Issued in exchange for the shares of Fidelity Global Balanced Fund | – | 1,174,749 | – | 14,637,372 |
| Issued in exchange for the shares of Global Strategies Fund | – | 1,532,212 | – | 19,091,363 |
| Reinvestment of distributions | 164,098 | 41,694 | 1,821,484 | 518,672 |
| Shares redeemed | (411,749) | (551,449) | (4,883,514) | (6,979,584) |
| Net increase (decrease) | 1,922 | 2,620,322 | $(85,231) | $32,611,468 |
| Class C | ||||
| Shares sold | 537,822 | 783,330 | $6,273,788 | $9,780,237 |
| Issued in exchange for the shares of Global Balanced Fund | – | 2,169,921 | – | 26,733,424 |
| Issued in exchange for the shares of Global Strategies Fund | – | 1,878,025 | – | 23,137,263 |
| Reinvestment of distributions | 231,597 | 60,789 | 2,542,936 | 748,924 |
| Shares redeemed | (1,717,862) | (1,101,549) | (20,278,057) | (13,732,417) |
| Net increase (decrease) | (948,443) | 3,790,516 | $(11,461,333) | $46,667,431 |
| Asset Manager 60% | ||||
| Shares sold | 24,351,288 | 51,736,768 | $291,039,628 | $658,548,793 |
| Issued in exchange for the shares of Global Balanced Fund | – | 29,966,477 | – | 376,678,615 |
| Issued in exchange for the shares of Global Strategies Fund | – | 5,885,052 | – | 73,975,105 |
| Reinvestment of distributions | 9,083,022 | 4,490,978 | 101,548,182 | 56,227,024 |
| Shares redeemed | (21,505,593) | (31,701,207) | (258,097,221) | (403,402,687) |
| Net increase (decrease) | 11,928,717 | 60,378,068 | $134,490,589 | $762,026,850 |
| Class I | ||||
| Shares sold | 791,291 | 1,136,223 | $9,578,158 | $14,501,152 |
| Issued in exchange for the shares of Global Balanced Fund | – | 822,927 | – | 10,352,425 |
| Issued in exchange for the shares of Global Strategies Fund | – | 1,803,511 | – | 22,688,171 |
| Reinvestment of distributions | 190,817 | 59,599 | 2,135,246 | 746,768 |
| Shares redeemed | (1,363,380) | (1,043,785) | (16,431,236) | (13,330,118) |
| Net increase (decrease) | (381,272) | 2,778,475 | $(4,717,832) | $34,958,398 |
| Class Z | ||||
| Shares sold | 291,195 | – | $3,513,867 | $– |
| Reinvestment of distributions | 5,016 | – | 56,082 | – |
| Shares redeemed | (11,834) | – | (140,332) | – |
| Net increase (decrease) | 284,377 | – | $3,429,617 | $– |
| Fidelity Asset Manager 70% | ||||
| Class A | ||||
| Shares sold | 1,158,248 | 1,072,815 | $24,483,792 | $24,393,399 |
| Reinvestment of distributions | 388,496 | 226,837 | 7,517,406 | 5,065,264 |
| Shares redeemed | (670,168) | (1,193,845) | (14,046,317) | (27,183,772) |
| Net increase (decrease) | 876,576 | 105,807 | $17,954,881 | $2,274,891 |
| Class M | ||||
| Shares sold | 292,268 | 454,790 | $6,160,108 | $10,365,200 |
| Reinvestment of distributions | 146,493 | 83,182 | 2,837,567 | 1,859,121 |
| Shares redeemed | (297,082) | (281,173) | (6,286,768) | (6,409,894) |
| Net increase (decrease) | 141,679 | 256,799 | $2,710,907 | $5,814,427 |
| Class C | ||||
| Shares sold | 189,182 | 480,535 | $3,921,025 | $10,867,133 |
| Reinvestment of distributions | 136,642 | 76,452 | 2,637,190 | 1,701,830 |
| Shares redeemed | (1,087,761) | (482,043) | (22,958,064) | (10,923,979) |
| Net increase (decrease) | (761,937) | 74,944 | $(16,399,849) | $1,644,984 |
| Asset Manager 70% | ||||
| Shares sold | 13,677,297 | 34,679,669 | $288,787,744 | $790,741,858 |
| Reinvestment of distributions | 13,471,969 | 8,199,184 | 260,682,604 | 183,169,767 |
| Shares redeemed | (17,502,266) | (34,158,241) | (370,704,294) | (778,465,644) |
| Net increase (decrease) | 9,647,000 | 8,720,612 | $178,766,054 | $195,445,981 |
| Class I | ||||
| Shares sold | 260,400 | 592,858 | $5,560,101 | $13,509,405 |
| Reinvestment of distributions | 193,412 | 134,131 | 3,744,456 | 2,997,831 |
| Shares redeemed | (352,965) | (1,085,477) | (7,536,663) | (24,835,015) |
| Net increase (decrease) | 100,847 | (358,488) | $1,767,894 | $(8,327,779) |
| Class Z | ||||
| Shares sold | 102,345 | – | $2,207,323 | $– |
| Reinvestment of distributions | 4,742 | – | 91,659 | – |
| Shares redeemed | (5,224) | – | (107,453) | – |
| Net increase (decrease) | 101,863 | – | $2,191,529 | $– |
| Fidelity Asset Manager 85% | ||||
| Class A | ||||
| Shares sold | 862,443 | 1,536,559 | $15,811,730 | $30,493,171 |
| Reinvestment of distributions | 312,790 | 149,653 | 5,176,673 | 2,894,292 |
| Shares redeemed | (491,139) | (898,527) | (8,975,042) | (17,732,464) |
| Net increase (decrease) | 684,094 | 787,685 | $12,013,361 | $15,654,999 |
| Class M | ||||
| Shares sold | 245,779 | 408,388 | $4,426,572 | $8,043,625 |
| Reinvestment of distributions | 81,489 | 37,234 | 1,342,127 | 716,755 |
| Shares redeemed | (165,118) | (174,891) | (2,988,006) | (3,429,871) |
| Net increase (decrease) | 162,150 | 270,731 | $2,780,693 | $5,330,509 |
| Class C | ||||
| Shares sold | 228,886 | 679,582 | $4,102,456 | $13,185,329 |
| Reinvestment of distributions | 110,675 | 56,215 | 1,805,116 | 1,070,898 |
| Shares redeemed | (530,733) | (575,122) | (9,582,937) | (11,170,395) |
| Net increase (decrease) | (191,172) | 160,675 | $(3,675,365) | $3,085,832 |
| Asset Manager 85% | ||||
| Shares sold | 10,220,635 | 34,356,371 | $186,983,348 | $685,028,247 |
| Reinvestment of distributions | 6,405,540 | 3,264,850 | 106,844,397 | 63,631,927 |
| Shares redeemed | (10,198,643) | (17,439,052) | (187,066,092) | (347,375,448) |
| Net increase (decrease) | 6,427,532 | 20,182,169 | $106,761,653 | $401,284,726 |
| Class I | ||||
| Shares sold | 440,437 | 1,125,223 | $7,925,449 | $22,457,259 |
| Reinvestment of distributions | 98,286 | 67,136 | 1,635,471 | 1,304,444 |
| Shares redeemed | (1,091,408) | (576,135) | (20,596,691) | (11,482,388) |
| Net increase (decrease) | (552,685) | 616,224 | $(11,035,771) | $12,279,315 |
| Class Z | ||||
| Shares sold | 77,579 | – | $1,439,153 | $– |
| Reinvestment of distributions | 1,771 | – | 29,410 | – |
| Shares redeemed | (11,507) | – | (204,536) | – |
| Net increase (decrease) | 67,843 | – | $1,264,027 | $– |
(a) Share transactions for Class Z are for the period October2, 2018 (commencement of sale of shares) to March 31, 2019.
12. Other.
The Funds' organizational documents provide former and current trustees and officers with a limited indemnification against liabilities arising in connection with the performance of their duties to the Funds. In the normal course of business, the Funds may also enter into contracts that provide general indemnifications. The Funds' maximum exposure under these arrangements is unknown as this would be dependent on future claims that may be made against the Funds. The risk of material loss from such claims is considered remote.
At the end of the period, a shareholder of record owned more than 25% of the total outstanding shares of the following Fund:
| Fund | % of shares held |
| Fidelity Asset Manager 60% | 28% |
| Fidelity Asset Manager 85% | 26% |
13. Prior Fiscal Year Merger Information.
On April 27, 2018, Fidelity Asset Manager 60% (the Fund) acquired all of the assets and assumed all of the liabilities of Fidelity Global Balanced Fund and Fidelity Global Strategies Fund ("Target Funds") pursuant to an Agreement and Plan of Reorganization (the Agreements) approved by the Board of Trustees ("the Board"). The acquisition was accomplished by an exchange of shares of the Fund for corresponding shares then outstanding of each Target Fund at their respective net asset value on the acquisition date. The reorganization provided shareholders of each Target Fund access to a larger portfolio with a similar investment objective. The reorganization qualified as a tax-free reorganization for federal income tax purposes with no gain or loss recognized to the funds or their shareholders. Fidelity Global Balanced Fund net assets of $470,010,359, including securities of $469,048,216 and unrealized appreciation of $2,799,938, and Fidelity Global Strategies Fund net assets of $162,277,994, including securities of $162,279,356 and unrealized appreciation of $1,167,869, were combined with the Fund's net assets of $2,278,829,037 for total net assets after the reorganization of $2,911,117,390.
Pro forma results of operations of the combined entity for the entire period ended September 30, 2018, as though the acquisitions had occurred as of the beginning of the year (rather than on the actual acquisition date), are as follows:
| Net Investment income (loss) | $ 39,979,460 |
| Total net realized gain (loss) | 180,297,674 |
| Total change in net unrealized appreciation (depreciation) | (11,472,894) |
| Net increase (decrease) in net assets resulting from operations | $208,804,240 |
Because the combined investment portfolios have been managed as a single portfolio since the acquisitions were completed, it is not practicable to separate the amounts of revenue and earnings of the Target Funds that has been included in the Fund's accompanying Statement of Operations since April 27, 2018.
Shareholder Expense Example
The Funds invest in Fidelity Central Funds, which are open-end investment companies with similar investment objectives to those of the Funds, available only to other mutual funds and accounts managed by Fidelity Management & Research Company (FMR) and its affiliates. In addition to the direct expenses incurred by the Funds presented in the table, as a shareholder of the underlying Fidelity Central Funds, the Funds also indirectly bear their proportionate share of the expenses of the underlying Fidelity Central Funds. These expenses are not included in the Funds' annualized expense ratio used to calculate either he actual or hypothetical expense estimates presented in the table but are summarized in a footnote to the table.
As a shareholder of a Fund, you incur two types of costs: (1) transaction costs, including sales charges (loads) on purchase payments or redemption proceeds, and (2) ongoing costs, including management fees, distribution and/or service (12b-1) fees and other Fund expenses. This Example is intended to help you understand your ongoing costs (in dollars) of investing in the Funds and to compare these costs with the ongoing costs of investing in other mutual funds.
The actual expense Example is based on an investment of $1,000 invested at the beginning of the period and held for the entire period (October 1, 2018 to March 31, 2019) for Class A, Class M, Class C, and Class I, and for the period (October 2, 2018 to March 31, 2019) for Class Z. The hypothetical expense Example is based on an investment of $1,000 invested for the one-half year period (October 1, 2018 to March 31, 2019).
Actual Expenses
The first line of the accompanying table for each Class of each fund provides information about actual account values and actual expenses. You may use the information in this line, together with the amount you invested, to estimate the expenses that you paid over the period. Simply divide your account value by $1,000.00 (for example, an $8,600 account value divided by $1,000.00 = 8.6), then multiply the result by the number in the first line for a Class of the fund under the heading entitled "Expenses Paid During Period" to estimate the expenses you paid on your account during this period.
Hypothetical Example for Comparison Purposes
The second line of the accompanying table for each Class of each fund provides information about hypothetical account values and hypothetical expenses based on a Class' actual expense ratio and an assumed rate of return of 5% per year before expenses, which is not the Class' actual return. The hypothetical account values and expenses may not be used to estimate the actual ending account balance or expenses you paid for the period. You may use this information to compare the ongoing costs of investing in the Fund and other funds. To do so, compare this 5% hypothetical example with the 5% hypothetical examples that appear in the shareholder reports of the other funds.
Please note that the expenses shown in the table are meant to highlight your ongoing costs only and do not reflect any transaction costs. Therefore, the second line of the table is useful in comparing ongoing costs only, and will not help you determine the relative total costs of owning different funds. In addition, if these transactional costs were included, your costs would have been higher.
| Annualized Expense Ratio-A | Beginning Account Value | Ending Account Value March 31, 2019 | Expenses Paid During Period |
|
| Fidelity Asset Manager 20% | ||||
| Class A | .83% | |||
| Actual | $1,000.00 | $1,014.00 | $4.17-B | |
| Hypothetical-C | $1,000.00 | $1,020.79 | $4.18-D | |
| Class M | 1.09% | |||
| Actual | $1,000.00 | $1,012.60 | $5.47-B | |
| Hypothetical-C | $1,000.00 | $1,019.50 | $5.49-D | |
| Class C | 1.59% | |||
| Actual | $1,000.00 | $1,010.10 | $7.97-B | |
| Hypothetical-C | $1,000.00 | $1,017.00 | $8.00-D | |
| Asset Manager 20% | .51% | |||
| Actual | $1,000.00 | $1,015.60 | $2.56-B | |
| Hypothetical-C | $1,000.00 | $1,022.39 | $2.57-D | |
| Class I | .56% | |||
| Actual | $1,000.00 | $1,015.30 | $2.81-B | |
| Hypothetical-C | $1,000.00 | $1,022.14 | $2.82-D | |
| Class Z | .48% | |||
| Actual | $1,000.00 | 1,016.60 | $2.40-B | |
| Hypothetical-C | $1,000.00 | 1,022.54 | $2.42-D | |
| Fidelity Asset Manager 30% | ||||
| Class A | .82% | |||
| Actual | $1,000.00 | $1,008.40 | $4.11-B | |
| Hypothetical-C | $1,000.00 | $1,020.84 | $4.13-D | |
| Class M | 1.09% | |||
| Actual | $1,000.00 | $1,007.00 | $5.45-B | |
| Hypothetical-C | $1,000.00 | $1,019.50 | $5.49-D | |
| Class C | 1.60% | |||
| Actual | $1,000.00 | $1,004.50 | $8.00-B | |
| Hypothetical-C | $1,000.00 | $1,016.95 | $8.05-D | |
| Asset Manager 30% | .53% | |||
| Actual | $1,000.00 | $1,009.20 | $2.65-B | |
| Hypothetical-C | $1,000.00 | $1,022.29 | $2.67-D | |
| Class I | .59% | |||
| Actual | $1,000.00 | $1,008.80 | $2.95-B | |
| Hypothetical-C | $1,000.00 | $1,021.99 | $2.97-D | |
| Class Z | .50% | |||
| Actual | $1,000.00 | $1,010.10 | $2.49-B | |
| Hypothetical-C | $1,000.00 | $1,022.44 | $2.52-D | |
| Fidelity Asset Manager 40% | ||||
| Class A | .83% | |||
| Actual | $1,000.00 | $1,000.50 | $4.14-B | |
| Hypothetical-C | $1,000.00 | $1,020.79 | $4.18-D | |
| Class M | 1.09% | |||
| Actual | $1,000.00 | $998.90 | $5.43-B | |
| Hypothetical-C | $1,000.00 | $1,019.50 | $5.49-D | |
| Class C | 1.60% | |||
| Actual | $1,000.00 | $997.40 | $7.97-B | |
| Hypothetical-C | $1,000.00 | $1,016.95 | $8.05-D | |
| Asset Manager 40% | .53% | |||
| Actual | $1,000.00 | $1,002.20 | $2.65-B | |
| Hypothetical-C | $1,000.00 | $1,022.29 | $2.67-D | |
| Class I | .56% | |||
| Actual | $1,000.00 | $1,002.00 | $2.80-B | |
| Hypothetical-C | $1,000.00 | $1,022.14 | $2.82-D | |
| Class Z | .50% | |||
| Actual | $1,000.00 | $1,003.90 | $2.48-B | |
| Hypothetical-C | $1,000.00 | $1,022.44 | $2.52-D | |
| Fidelity Asset Manager 50% | ||||
| Class A | .94% | |||
| Actual | $1,000.00 | $992.70 | $4.67-B | |
| Hypothetical-C | $1,000.00 | $1,020.24 | $4.73-D | |
| Class M | 1.19% | |||
| Actual | $1,000.00 | $991.40 | $5.91-B | |
| Hypothetical-C | $1,000.00 | $1,019.00 | $5.99-D | |
| Class C | 1.70% | |||
| Actual | $1,000.00 | $988.80 | $8.43-B | |
| Hypothetical-C | $1,000.00 | $1,016.45 | $8.55-D | |
| Asset Manager 50% | .63% | |||
| Actual | $1,000.00 | $994.40 | $3.13-B | |
| Hypothetical-C | $1,000.00 | $1,021.79 | $3.18-D | |
| Class I | .66% | |||
| Actual | $1,000.00 | $994.20 | $3.28-B | |
| Hypothetical-C | $1,000.00 | $1,021.64 | $3.33-D | |
| Class Z | .56% | |||
| Actual | $1,000.00 | $996.30 | $2.77-B | |
| Hypothetical-C | $1,000.00 | $1,022.14 | $2.82-D | |
| Fidelity Asset Manager 60% | ||||
| Class A | 1.01% | |||
| Actual | $1,000.00 | $985.30 | $5.00-B | |
| Hypothetical-C | $1,000.00 | $1,019.90 | $5.09-D | |
| Class M | 1.26% | |||
| Actual | $1,000.00 | $983.70 | $6.23-B | |
| Hypothetical-C | $1,000.00 | $1,018.65 | $6.34-D | |
| Class C | 1.76% | |||
| Actual | $1,000.00 | $981.20 | $8.69-B | |
| Hypothetical-C | $1,000.00 | $1,016.16 | $8.85-D | |
| Asset Manager 60% | .69% | |||
| Actual | $1,000.00 | $986.60 | $3.42-B | |
| Hypothetical-C | $1,000.00 | $1,021.49 | $3.48-D | |
| Class I | .73% | |||
| Actual | $1,000.00 | $987.00 | $3.62-B | |
| Hypothetical-C | $1,000.00 | $1,021.29 | $3.68-D | |
| Class Z | .63% | |||
| Actual | $1,000.00 | $988.30 | $3.11-B | |
| Hypothetical-C | $1,000.00 | $1,021.79 | $3.18 | |
| Fidelity Asset Manager 70% | ||||
| Class A | 1.00% | |||
| Actual | $1,000.00 | $975.60 | $4.93-B | |
| Hypothetical-C | $1,000.00 | $1,019.95 | $5.04-D | |
| Class M | 1.25% | |||
| Actual | $1,000.00 | $974.50 | $6.15-B | |
| Hypothetical-C | $1,000.00 | $1,018.70 | $6.29-D | |
| Class C | 1.76% | |||
| Actual | $1,000.00 | $972.30 | $8.65-B | |
| Hypothetical-C | $1,000.00 | $1,016.16 | $8.85-D | |
| Asset Manager 70% | .69% | |||
| Actual | $1,000.00 | $977.30 | $3.40-B | |
| Hypothetical-C | $1,000.00 | $1,021.49 | $3.48-D | |
| Class I | .72% | |||
| Actual | $1,000.00 | $977.30 | $3.55-B | |
| Hypothetical-C | $1,000.00 | $1,021.34 | $3.63-D | |
| Class Z | .62% | |||
| Actual | $1,000.00 | $979.80 | $3.04-B | |
| Hypothetical-C | $1,000.00 | $1,021.84 | $3.13-D | |
| Fidelity Asset Manager 85% | ||||
| Class A | 1.02% | |||
| Actual | $1,000.00 | $963.70 | $4.99-B | |
| Hypothetical-C | $1,000.00 | $1,019.85 | $5.14-D | |
| Class M | 1.28% | |||
| Actual | $1,000.00 | $962.70 | $6.26-B | |
| Hypothetical-C | $1,000.00 | $1,018.55 | $6.44-D | |
| Class C | 1.77% | |||
| Actual | $1,000.00 | $959.80 | $8.65-B | |
| Hypothetical-C | $1,000.00 | $1,016.11 | $8.90-D | |
| Asset Manager 85% | .71% | |||
| Actual | $1,000.00 | $965.60 | $3.48-B | |
| Hypothetical-C | $1,000.00 | $1,021.39 | $3.58-D | |
| Class I | .74% | |||
| Actual | $1,000.00 | $965.00 | $3.63-B | |
| Hypothetical-C | $1,000.00 | $1,021.24 | $3.73-D | |
| Class Z | .62% | |||
| Actual | $1,000.00 | $968.20 | $3.03-B | |
| Hypothetical-C | $1,000.00 | $1,021.84 | $3.13-D |
A Annualized expense ratio reflects expenses net of applicable fee waivers.
B Actual expenses are equal to each Class' annualized expense ratio, multiplied by the average account value over the period, multiplied by 182/365 (to reflect the period October 1, 2018 to March 31, 2019) for Class A, Class M, Class C and Class I and multiplied by 181/365 (to reflect the period October 2, 2018 to March 31, 2019) for Class Z. The fees and expenses of the underlying Fidelity Central Funds in which the Fund invests are not included in each Class' annualized expense ratio. In addition to the expenses noted above, the Fund also indirectly bears its proportional share of the expenses of the underlying Fidelity Central Funds. Annualized expenses of the underlying Fidelity Central Funds as of their most recent fiscal half year ranged from less than .005% to .07%.
C 5% return per year before expenses
D Hypothetical expenses are equal to each Class' annualized expense ratio, multiplied by the average account value over the period, multiplied by 182/365 (to reflect the one-half year period).
![]()
AR-SANN-0519
1.878280.111
Item 2.
Code of Ethics
Not applicable.
Item 3.
Audit Committee Financial Expert
Not applicable.
Item 4.
Principal Accountant Fees and Services
Not applicable.
Item 5.
Audit Committee of Listed Registrants
Not applicable.
Item 6.
Investments
(a)
Not applicable.
(b)
Not applicable
Item 7.
Disclosure of Proxy Voting Policies and Procedures for Closed-End Management Investment Companies
Not applicable.
Item 8.
Portfolio Managers of Closed-End Management Investment Companies
Not applicable.
Item 9.
Purchase of Equity Securities by Closed-End Management Investment Company and Affiliated Purchasers
Not applicable.
Item 10.
Submission of Matters to a Vote of Security Holders
There were no material changes to the procedures by which shareholders may recommend nominees to the Fidelity Charles Street Trust’s Board of Trustees.
Item 11.
Controls and Procedures
(a)(i) The President and Treasurer and the Chief Financial Officer have concluded that the Fidelity Charles Street Trust’s (the “Trust”) disclosure controls and procedures (as
defined in Rule 30a-3(c) under the Investment Company Act) provide reasonable assurances that material information relating to the Trust is made known to them by the appropriate persons, based on their evaluation of these controls and procedures as of a date within 90 days of the filing date of this report.
(a)(ii) There was no change in the Trust’s internal control over financial reporting (as defined in Rule 30a-3(d) under the Investment Company Act) that occurred during the period covered by this report that has materially affected, or is reasonably likely to materially affect, the Trust’s internal control over financial reporting.
Item 12.
Disclosure of Securities Lending Activities for Closed-End Management
Investment Companies
Not applicable.
Item 13.
Exhibits
(a) | (1) | Not applicable. |
(a) | (2) | Certification pursuant to Rule 30a-2(a) under the Investment Company Act of 1940 (17 CFR 270.30a-2(a)) is filed and attached hereto as Exhibit 99.CERT. |
(a) | (3) | Not applicable. |
(b) | Certification pursuant to Rule 30a-2(b) under the Investment Company Act of 1940 (17 CFR 270.30a-2(b)) is furnished and attached hereto as Exhibit 99.906CERT. |
SIGNATURES
Pursuant to the requirements of the Securities Exchange Act of 1934 and the Investment Company Act of 1940, the registrant has duly caused this report to be signed on its behalf by the undersigned, thereunto duly authorized.
Fidelity Charles Street Trust
By: | /s/Laura M. Del Prato |
Laura M. Del Prato | |
President and Treasurer | |
Date: | May 24, 2019 |
Pursuant to the requirements of the Securities Exchange Act of 1934 and the Investment Company Act of 1940, this report has been signed below by the following persons on behalf of the registrant and in the capacities and on the dates indicated.
By: | /s/Laura M. Del Prato |
Laura M. Del Prato | |
President and Treasurer | |
Date: | May 24, 2019 |
By: | /s/John J. Burke III |
John J. Burke III | |
Chief Financial Officer | |
Date: | May 24, 2019 |
Exhibit EX-99.CERT
I, Laura M. Del Prato, certify that:
1.
I have reviewed this report on Form N-CSR of Fidelity Charles Street Trust;
2.
Based on my knowledge, this report does not contain any untrue statement of a material fact or omit to state a material fact necessary to make the statements made, in light of the circumstances under which such statements were made, not misleading with respect to the period covered by this report;
3.
Based on my knowledge, the financial statements, and other financial information included in this report, fairly present in all material respects the financial condition, results of operations, changes in net assets, and cash flows (if the financial statements are required to include a statement of cash flows) of the registrant as of, and for, the periods presented in this report;
4.
The registrant's other certifying officer(s) and I are responsible for establishing and maintaining disclosure controls and procedures (as defined in Rule 30a-3(c) under the Investment Company Act of 1940) and internal control over financial reporting (as defined in Rule 30a-3(d) under the Investment Company Act of 1940) for the registrant and have:
a.
Designed such disclosure controls and procedures, or caused such disclosure controls and procedures to be designed under our supervision, to ensure that material information relating to the registrant, including its consolidated subsidiaries, is made known to us by others within those entities, particularly during the period in which this report is being prepared;
b.
Designed such internal control over financial reporting, or caused such internal control over financial reporting to be designed under our supervision, to provide reasonable assurance regarding the reliability of financial reporting and the preparation of financial statements for external purposes in accordance with generally accepted accounting principles;
c.
Evaluated the effectiveness of the registrant's disclosure controls and procedures and presented in this report our conclusions about the effectiveness of the disclosure controls and procedures, as of a date within 90 days prior to the filing date of this report based upon such evaluation; and
d.
Disclosed in this report any change in the registrant’s internal control over financial reporting that occurred during the period covered by this report that has materially affected, or is reasonably likely to materially affect, the registrant’s internal control over financial reporting; and
5.
The registrant's other certifying officer(s) and I have disclosed to the registrant's auditors and the audit committee of the registrant's board of directors (or persons performing the equivalent functions):
a.
All significant deficiencies and material weaknesses in the design or operation of internal control over financial reporting which are reasonably likely to adversely affect the registrant's ability to record, process, summarize, and report financial information; and
b.
Any fraud, whether or not material, that involves management or other employees who have a significant role in the registrant's internal control over financial reporting.
Date:
May 24, 2019
/s/Laura M. Del Prato |
Laura M. Del Prato |
President and Treasurer |
I, John J. Burke III, certify that:
1.
I have reviewed this report on Form N-CSR of Fidelity Charles Street Trust;
2.
Based on my knowledge, this report does not contain any untrue statement of a material fact or omit to state a material fact necessary to make the statements made, in light of the circumstances under which such statements were made, not misleading with respect to the period covered by this report;
3.
Based on my knowledge, the financial statements, and other financial information included in this report, fairly present in all material respects the financial condition, results of operations, changes in net assets, and cash flows (if the financial statements are required to include a statement of cash flows) of the registrant as of, and for, the periods presented in this report;
4.
The registrant's other certifying officer(s) and I are responsible for establishing and maintaining disclosure controls and procedures (as defined in Rule 30a-3(c) under the Investment Company Act of 1940) and internal control over financial reporting (as defined in Rule 30a-3(d) under the Investment Company Act of 1940) for the registrant and have:
a.
Designed such disclosure controls and procedures, or caused such disclosure controls and procedures to be designed under our supervision, to ensure that material information relating to the registrant, including its consolidated subsidiaries, is made known to us by others within those entities, particularly during the period in which this report is being prepared;
b.
Designed such internal control over financial reporting, or caused such internal control over financial reporting to be designed under our supervision, to provide reasonable assurance regarding the reliability of financial reporting and the preparation of financial statements for external purposes in accordance with generally accepted accounting principles;
c.
Evaluated the effectiveness of the registrant's disclosure controls and procedures and presented in this report our conclusions about the effectiveness of the disclosure controls and procedures, as of a date within 90 days prior to the filing date of this report based upon such evaluation; and
d.
Disclosed in this report any change in the registrant’s internal control over financial reporting that occurred during the period covered by this report that has materially affected, or is reasonably likely to materially affect, the registrant’s internal control over financial reporting; and
5.
The registrant's other certifying officer(s) and I have disclosed to the registrant's auditors and the audit committee of the registrant's board of directors (or persons performing the equivalent functions):
a.
All significant deficiencies and material weaknesses in the design or operation of internal control over financial reporting which are reasonably likely to adversely affect the registrant's ability to record, process, summarize, and report financial information; and
b.
Any fraud, whether or not material, that involves management or other employees who have a significant role in the registrant's internal control over financial reporting.
Date:
May 24, 2019
/s/John J. Burke III |
John J. Burke III |
Chief Financial Officer |
Exhibit EX-99.906CERT
Certification Pursuant to Section 906 of the Sarbanes-Oxley Act of 2002 (subsections (a) and (b) of section 1350, chapter 63 of title 18, United States Code)
In connection with the attached Report of Fidelity Charles Street Trust (the “Trust”) on Form N-CSR to be filed with the Securities and Exchange Commission (the “Report”), each of the undersigned officers of the Trust does hereby certify that, to the best of such officer’s knowledge:
1.
The Report fully complies with the requirements of 13(a) or 15(d) of the Securities Exchange Act of 1934; and
2.
The information contained in the Report fairly presents, in all material respects, the financial condition and results of operations of the Trust as of, and for, the periods presented in the Report.
Dated: May 24, 2019
/s/Laura M. Del Prato |
Laura M. Del Prato |
President and Treasurer |
Dated: May 24, 2019
/s/John J. Burke III |
John J. Burke III |
Chief Financial Officer |
A signed original of this written statement required by Section 906, or other document authenticating, acknowledging, or otherwise adopting the signature that appears in typed form within the electronic version of this written statement required by Section 906, has been provided to the Trust and will be retained by the Trust and furnished to the Securities and Exchange Commission or its staff upon request.
Serious News for Serious Traders! Try StreetInsider.com Premium Free!
You May Also Be Interested In
- US stock futures tread water with top tech earnings on tap
- Hawthorn Bancshares Announces Cash Dividend
- Autolomous and BioCentriq Partner to Speed Up Cell Therapy Delivery
Create E-mail Alert Related Categories
SEC FilingsSign up for StreetInsider Free!
Receive full access to all new and archived articles, unlimited portfolio tracking, e-mail alerts, custom newswires and RSS feeds - and more!
