

Form N-CSRS BERNSTEIN SANFORD C FUND For: Mar 31
 Tweet
Tweet Share
ShareTable of Contents
UNITED STATES
SECURITIES AND EXCHANGE COMMISSION
WASHINGTON, D.C. 20549
FORM N-CSR
CERTIFIED SHAREHOLDER REPORT OF REGISTERED
MANAGEMENT INVESTMENT COMPANIES
Investment Company Act file number: 811-21034
SANFORD C. BERNSTEIN FUND II, INC.
(Exact name of registrant as specified in charter)
1345 Avenue of the Americas, New York, New York 10105
(Address of principal executive offices) (Zip code)
Joseph J. Mantineo
AllianceBernstein L.P.
1345 Avenue of the Americas
New York, New York 10105
(Name and address of agent for service)
Registrant’s telephone number, including area code: (800) 221-5672
Date of fiscal year end: September 30, 2018
Date of reporting period: March 31, 2018
Table of Contents
ITEM 1. REPORTS TO STOCKHOLDERS.
Table of Contents
SANFORD C. BERNSTEIN FUND II, INC.
INTERMEDIATE DURATION INSTITUTIONAL PORTFOLIO
SEMI-ANNUAL REPORT
MARCH 31, 2018
Table of Contents
| 1 | ||||
| 3 | ||||
| 7 | ||||
| 8 | ||||
| 9 | ||||
| 29 | ||||
| 30 | ||||
| 31 | ||||
| 32 | ||||
| 33 | ||||
| 51 |
Before investing in the Sanford C. Bernstein Fund II, Inc., a prospective investor should consider carefully the portfolio’s investment objectives and policies, charges, expenses and risks. These and other matters of importance to prospective investors are contained in the portfolio’s prospectus, an additional copy of which may be obtained by visiting our website at www.Bernstein.com and clicking on “Investments”, then “Mutual Fund Information—Prospectuses, SAIs and Shareholder Reports” or by calling your financial advisor or by calling Bernstein’s mutual fund shareholder help line at 212.756.4097. Please read the prospectus carefully before investing.
For performance information current to the most recent month-end, please visit our website at www.Bernstein.com and click on “Investments”, then “Mutual Fund Information—Mutual Fund Performance at a Glance”.
This shareholder report must be preceded or accompanied by the Sanford C. Bernstein Fund II, Inc. prospectus for individuals who are not shareholders of the Fund.
You may obtain a description of the Fund’s proxy voting policies and procedures, and information regarding how the Fund voted proxies relating to portfolio securities during the most recent 12-month period ended June 30, without charge. Simply visit www.AllianceBernstein.com, or go to the Securities and Exchange Commission’s website at www.sec.gov, or call AllianceBernstein at 800.227.4618.
The Fund will file its complete schedule of portfolio holdings with the Commission for the first and third quarters of each fiscal year on Form N-Q. The Fund’s Form N-Q is available on the Commission’s website at www.sec.gov. The Fund’s Form N-Q may also be reviewed and copied at the Commission’s Public Reference Room in Washington, D.C.; information on the operation of the Public Reference Room may be obtained by calling 800.SEC.0330.
Investment Products Offered: · Are Not FDIC Insured · May Lose Value · Are Not Bank Guaranteed
Table of Contents
Portfolio Manager Commentary (Unaudited)
To Our Shareholders—May 15, 2018
On the following pages, you will find the 2018 semi-annual report for Sanford C. Bernstein Fund II, Inc.—Intermediate Duration Institutional Portfolio1 (the “Portfolio”). The semi-annual report covers the six- and 12-month periods ended March 31, 2018, and includes financial statements as well as notes to the financial statements, information about the recent performance of the Portfolio and a listing of the Portfolio’s holdings as of the period end.
Equity market returns decelerated during the six-month period ended March 31, 2018, as volatility resurfaced. Despite this, all regions of the world delivered positive returns for the period, with emerging-market equities remaining the top performer. Reflecting an increase in interest rates, both US taxable and tax-exempt bond returns were slightly negative.
Some slowing of stock returns seemed likely after a very strong 2017, when corporate earnings growth gained momentum and markets responded accordingly. Risk returned in 2018, with a correction in February interrupting the longest and calmest winning streak ever. Concerns about potentially rising inflation and interest rates, as well as risks around tariff wars, spurred heightened volatility, but we believe the global economy is strong enough that markets can withstand increased uncertainty.
Looking ahead, our return expectations remain below long-term averages. In our view, strong 2018 earnings growth has been largely priced in to stocks. We also anticipate that interest rates will climb gradually, potentially leading to subdued bond returns.
If you have any questions about your investments in the Portfolio, please contact your Bernstein Advisor by calling 212.756.4097, or visit www.Bernstein.com. As always, we are firmly dedicated to your investment success. Thank you for your continued interest in the Portfolio.
Sincerely,
Robert M. Keith
President and Chief Executive Officer
Sanford C. Bernstein Fund II, Inc.
| 1 | This performance discussion is intended as a general market commentary. |
Investment Objectives and Policies
The Portfolio seeks to provide safety of principal and a moderate to high rate of current income. The Portfolio seeks to maintain an average portfolio quality minimum of A, based on ratings given to the Portfolio’s securities by national rating agencies (or, if unrated, determined by AllianceBernstein L.P., the Portfolio’s investment adviser (the “Adviser”), to be of comparable quality). Many types of securities may be purchased by the Portfolio, including corporate bonds, notes, US government and agency securities, asset-backed securities, mortgage-related securities, bank loan debt, preferred stock and inflation-protected securities, as well as others. The Portfolio may also invest up to 25% of its total assets in fixed-income, non-US dollar denominated foreign securities, and may invest without limit in fixed-income, US dollar denominated foreign securities, in each case in developed- or emerging-market countries.
The Portfolio may use derivatives, such as options, futures contracts, forward contracts and swaps.
The Portfolio may invest up to 25% of its total assets in fixed-income securities rated below investment-grade (BB or below) by national rating agencies (commonly known as “junk bonds”). No more than 5% of the Portfolio’s total assets may be invested in fixed-income securities rated CCC by national rating agencies.
In managing the Portfolio, the Adviser may use interest rate forecasting to estimate the best level of interest rate risk at a given time. The Adviser may moderately shorten the average duration of the Portfolio when it expects interest rates to rise and modestly lengthen average duration when it anticipates that interest rates will fall.
The Portfolio seeks to maintain an effective duration of three to six years under normal market conditions. Duration is a measure that relates the expected price volatility of a security to changes in interest rates. The duration of a debt security is the weighted average term to maturity, expressed in years, of the present value of all future cash flows, including coupon payments and principal repayments.
(Portfolio Manager Commentary continued on next page)
| 2018 Semi-Annual Report | 1 |
Table of Contents
Portfolio Manager Commentary (continued)
The Adviser selects securities for purchase or sale based on its assessment of the securities’ risk and return characteristics as well as the securities’ impact on the overall risk and return characteristics of the Portfolio. In making this assessment, the Adviser takes into account various factors including the credit quality and sensitivity to interest rates of the securities under consideration and of the Portfolio’s other holdings.
The Portfolio may enter into foreign currency transactions on a spot (i.e., cash) basis or through the use of derivatives transactions, such as forward currency exchange contracts, currency futures and options thereon, and options on currencies. An appropriate hedge of currency exposure resulting from the Portfolio’s securities positions may not be available or cost effective, or the Adviser may determine not to hedge the positions, possibly even under market conditions where doing so could benefit the Portfolio.
| 2 | Sanford C. Bernstein Fund II, Inc. |
Table of Contents
Disclosures and Risks (Unaudited)
Benchmark Disclosures
None of the following indices or averages reflects fees and expenses associated with the active management of a mutual fund portfolio. The Bloomberg Barclays US Aggregate Bond Index represents the performance of securities within the US investment-grade fixed-rate bond market, with index components for government and corporate securities, mortgage pass-through securities, asset-backed securities and commercial mortgaged-backed securities. The Lipper Core Bond Funds Average is the equal-weighted average returns of the portfolios in the relevant Lipper Inc. category; the average portfolios in a category may differ in composition from the Portfolio. The Lipper Core Bond Funds Average contains portfolios that invest primarily in investment-grade debt issues (rated in the top four grades) with dollar-weighted average maturities of five to ten years. An investor cannot invest directly in an index or average, and their results are not indicative of the performance for any specific investment, including the Portfolio.
A Word About Risk
The share price of the Portfolio will fluctuate and you may lose money. There is no guarantee that the Portfolio will achieve its investment objective.
Interest Rate Risk: This is the risk that changes in interest rates will affect the value of the Portfolio’s investments in fixed-income debt securities such as bonds and notes. The Portfolio may be subject to a greater risk of rising interest rates due to the current period of historically low rates and the effect of potential government fiscal policy initiatives and Federal Reserve and other central bank monetary initiatives, as well as the market reaction to those initiatives. Increases in interest rates may cause the value of the Portfolio’s investments to decline and this decrease in value may not be offset by higher income from new investments. The Portfolio may experience increased interest rate risk to the extent it invests in fixed-income securities with longer maturities or durations. A general rise in interest rates may cause investors to move out of fixed-income securities on a large scale, which could adversely affect the price and liquidity of fixed-income securities and could also result in increased redemptions from funds, such as the Portfolio, that invest largely in fixed-income securities.
Credit Risk: This is the risk that the issuer or the guarantor of a debt security, or the counterparty to a derivatives or other contract, will be unable or unwilling to make timely principal and/or interest payments, or to otherwise honor its obligations. The issuer or guarantor may default, potentially causing a loss of the full principal amount of a security and accrued interest. The degree of risk for a particular security may be reflected in its credit rating. The credit rating of a fixed-income security may be downgraded after purchase, which may adversely affect the value of the security. Investments in fixed-income securities with lower ratings tend to have a higher probability that an issuer will default or fail to meet its payment obligations. At times when credit risk is perceived to be greater, credit “spreads” (i.e., the difference between the yields on lower quality securities and the yields on higher quality securities) may get larger or “widen”. As a result, the values of the lower quality securities may go down more and they may become harder to sell and less liquid.
Duration Risk: The duration of a fixed-income security may be shorter than or equal to full maturity of the fixed-income security. Fixed-income securities with longer durations have more interest rate risk and will decrease in price as interest rates rise. For example, a fixed-income security with a duration of three years would be expected to decrease in value by approximately 3% if interest rates increase by 1%. Securities that have final maturities longer than their durations may be affected by increased credit spreads to a far greater degree than their durations would suggest, because they are exposed to credit risk until final maturity.
Inflation Risk: This is the risk that the value of assets or income from investments will be less in the future as inflation decreases the value of money. As inflation increases, the value of the Portfolio’s assets can decline as can the value of the Portfolio’s distributions. This risk is significantly greater for fixed-income securities with longer maturities.
Inflation-Protected Securities Risk: The terms of inflation-protected securities provide for the coupon and/or maturity value to be adjusted based on changes in an inflation index. Decreases in the inflation rate or in investors’ expectations about inflation could cause these securities to underperform non-inflation-adjusted securities on a total-return basis. In addition, these securities may have limited liquidity in the secondary market.
Foreign (Non-US) Securities Risk: Investments in foreign securities entail significant risks in addition to those customarily associated with investing in US securities. These risks include risks related to adverse market, economic, political and regulatory factors and social instability, all of which could disrupt the financial markets in which the Portfolio invests and adversely affect the value of the Portfolio’s assets.
(Disclosures and Risks continued on next page)
| 2018 Semi-Annual Report | 3 |
Table of Contents
Disclosures and Risks (continued)
Emerging-Markets Securities Risk: The risks of investing in foreign (non-US) securities are heightened with respect to issuers in emerging-market countries, because the markets are less developed and less liquid and there may be a greater amount of economic, political and social uncertainty, and these risks are even more pronounced in “frontier” markets, which are investable markets with lower total market capitalization and liquidity than the more developed emerging markets. In addition, the value of the Portfolio’s investments may decline because of factors such as unfavorable or unsuccessful government actions and reduction of government or central bank support
Derivatives Risk: The Portfolio may use derivatives as direct investments to earn income, enhance return and broaden portfolio diversification, which entail greater risk than if used solely for hedging purposes. In addition to other risks such as the credit risk of the counterparty, derivatives involve the risk that changes in the value of the derivative may not correlate with relevant assets, rates or indices. Derivatives may be illiquid and difficult to price or unwind, and small changes may produce disproportionate losses for the Portfolio. Certain derivatives have the potential for unlimited loss, regardless of the size of the initial investment. Assets required to be set aside or posted to cover or secure derivatives positions may themselves go down in value, and these collateral and other requirements may limit investment flexibility. Some derivatives involve leverage, which can make the Portfolio more volatile and can compound other risks. Use of derivatives may have different tax consequences for the Portfolio than an investment in the underlying security, and such differences may affect the amount, timing and character of income distributed to shareholders. The US government and foreign governments are in the process of adopting and implementing regulations governing derivatives markets, including mandatory clearing of certain derivatives, margin, reporting and registration requirements. The ultimate impact of the regulations remains unclear. Additional regulation may make derivatives more costly, limit their availability or utility, otherwise adversely affect their performance, or disrupt markets.
Mortgage-Related Securities Risk: Mortgage-related securities represent interests in “pools” of mortgages, including consumer loans or receivables held in trust. Mortgage-related securities are subject to credit, interest rate, prepayment and extension risks. These securities also are subject to risk of default on the underlying mortgage, particularly during periods of economic downturn. Small movements in interest rates (both increases and decreases) may quickly and significantly reduce the value of certain mortgage-related securities.
Prepayment and Extension Risk: Prepayment risk is the risk that a loan, bond or other security might be called or otherwise converted, prepaid or redeemed before maturity. If this happens, particularly during a time of declining interest rates or credit spreads, the Portfolio will not benefit from the rise in market price that normally accompanies a decline in interest rates, and may not be able to invest the proceeds in securities providing as much income, resulting in a lower yield to the Portfolio. Conversely, extension risk is the risk that as interest rates rise or spreads widen, payments of securities may occur more slowly than anticipated by the market. If this happens, the values of these securities may go down because their interest rates are lower than current market rates and they remain outstanding longer than anticipated.
Subordination Risk: The Portfolio may invest in securities that are subordinated to more senior securities of an issuer, or which represent interests in pools of such subordinated securities. Subordinated securities will be disproportionately affected by a default or even a perceived decline in creditworthiness of the issuer. Subordinated securities are more likely to suffer a credit loss than non-subordinated securities of the same issuer, any loss incurred by the subordinated securities is likely to be proportionately greater, and any recovery of interest or principal may take more time.
Management Risk: The Portfolio is subject to management risk because it is an actively managed investment portfolio. The Adviser will apply its investment techniques and risk analyses in making investment decisions for the Portfolio, but these techniques, analyses and decisions may not work as intended or may not produce the desired results. In some cases, derivatives and other investment techniques may be unavailable or the Adviser may determine not to use them, possibly even under market conditions where their use could benefit the Portfolio. In addition, the Adviser may change the Portfolio’s investment strategies or policies from time to time. Those changes may not lead to the results intended by the Adviser and could have an adverse on effect the value or performance of the Portfolio.
Liquidity Risk: Liquidity risk exists when particular investments are difficult to purchase or sell, possibly preventing the Portfolio from selling out of these illiquid or relatively less liquid securities at an advantageous price. Over
(Disclosures and Risks continued on next page)
| 4 | Sanford C. Bernstein Fund II, Inc. |
Table of Contents
Disclosures and Risks (continued)
recent years, regulatory changes have led to reduced liquidity in the marketplace, and the capacity of dealers to make markets in fixed-income securities has been outpaced by the growth in the size of the fixed-income markets. Liquidity risk may be magnified in a rising interest rate environment, where the value and liquidity of fixed-income securities generally go down. Derivatives and securities involving substantial market and credit risk tend to involve greater liquidity risk. Illiquid securities and relatively less liquid securities may also be difficult to value.
Redemption Risk: The Portfolio may experience heavy redemptions that could cause the Portfolio to liquidate its assets at inopportune times or at a loss or depressed value, which could cause the value of your investment to decline. Redemption risk is heightened during periods of overall market turmoil.
Foreign Currency Risk: This is the risk that changes in foreign (non-US) currency exchange rates may negatively affect the value of the Portfolio’s investments or reduce the returns of the Portfolio. For example, the value of the Portfolio’s investments in foreign securities and foreign currency positions may decrease if the US dollar is strong (i.e., gaining value relative to other currencies) and other currencies are weak (i.e., losing value relative to the US dollar).
Actions by a Few Major Investors: In certain countries, volatility may be heightened by actions of a few major investors. For example, substantial increases or decreases in cash flows of mutual funds investing in these markets could significantly affect local securities prices and, therefore, share prices of the Portfolio.
Market Risk: The Portfolio is subject to market risk, which is the risk that bond prices in general may decline over short or extended periods. In the past decade, financial markets in the United States, Europe and elsewhere have experienced increased volatility, decreased liquidity and heightened uncertainty. These market conditions may recur from time to time and have an adverse impact on various securities markets. The US government and the Federal Reserve, as well as certain foreign governments and central banks, have taken steps to support financial markets. Other governments have tried to support markets by buying stocks and through other market interventions. Government intervention may not work as intended, particularly if the efforts are perceived by investors as being unlikely to achieve the desired results. The Federal Reserve has reduced its market support activities and has begun raising interest rates. Further Federal Reserve or other US or non-US governmental or central bank actions, including interest rate increases or decreases, could negatively affect financial markets generally, increase market volatility and reduce the value and liquidity of securities in which the Portfolio invests.
Current political uncertainty surrounding the European Union (“EU”) and its membership may increase market volatility. The United Kingdom has voted to withdraw from the EU, and one or more other countries may withdraw from the EU and/or abandon the Euro, the common currency of the EU. The financial instability of some countries in the EU, together with the risk of that financial instability impacting other more stable countries, may increase the risk of investing in companies in Europe and worldwide. In addition, policy and legislative changes in the United States and in other countries are affecting many aspects of financial regulation, and may in some instances contribute to decreased liquidity and increased volatility in the financial markets. The impact of these changes, and the practical implications for market participants, may not be fully known for some time.
Economies and financial markets throughout the world are becoming increasingly interconnected. Economic, financial or political events, trading and tariff arrangements, terrorism, natural disasters and other circumstances in one country or region could have profound impacts on global economies or markets. As a result, whether or not the Portfolio invests in securities of issuers located in or with significant exposure to countries experiencing economic and financial difficulties, the value and liquidity of the Portfolios’ investments may be negatively affected.
Lower-rated Securities Risk: Lower-rated securities, or junk bonds/high-yield securities, are subject to greater risk of loss of principal and interest and greater market risk than higher-rated securities. The capacity of issuers of lower-rated securities to pay interest and repay principal is more likely to weaken than is that of issuers of higher-rated securities in times of deteriorating economic conditions or rising interest rates.
Portfolio Turnover Risk: The Portfolio’s investment strategies may result in high portfolio turnover. The Portfolio generally buys portfolio securities with the intention of holding them for investment. However, when market conditions or other circumstances warrant, securities may be purchased and sold without regard to the length of time held. From time to time, the Portfolio may engage in active short-term trading to
(Disclosures and Risks continued on next page)
| 2018 Semi-Annual Report | 5 |
Table of Contents
Disclosures and Risks (continued)
seek short-term profits during periods of fluctuating interest rates or for other reasons. This trading may increase the Portfolio’s rate of turnover and the incidence of short-term capital gain taxable as ordinary income. A higher rate of portfolio turnover may increase transaction costs, which must be borne by the Portfolio and its shareholders.
These risks are discussed in further detail in the Portfolio’s prospectus.
An Important Note About Historical Performance
Except as noted, returns do not reflect the deduction of taxes that a shareholder would pay on portfolio distributions or the redemption of portfolio shares. All fees and expenses related to the operation of the Portfolio have been deducted.
The performance shown in this report represents past performance and does not guarantee future results. Performance information is as of the dates shown. Current performance may be lower or higher than the performance information shown. You may obtain performance information current to the most recent month-end by visiting www.Bernstein.com or by calling 212.756.4097. The investment return and principal value of an investment in the Portfolio will fluctuate, so that shares, when redeemed, may be worth more or less than their original cost.
Investors should consider the investment objectives, risks, charges and expenses of the Portfolio carefully before investing. For copies of our prospectus or summary prospectus, which contain this and other information, visit www.Bernstein.com, click on “Investments”, then “Mutual Fund Information—Prospectuses, SAIs and Shareholder Reports”, or call Bernstein’s mutual fund shareholder help line at 212.756.4097 or contact your Bernstein Advisor. Please read the prospectus and/or summary prospectus carefully before investing.
| 6 | Sanford C. Bernstein Fund II, Inc. |
Table of Contents
Historical Performance (Unaudited)
Intermediate Duration Institutional Portfolio vs. Its Benchmark and Lipper Average
| TOTAL RETURNS | AVERAGE ANNUAL TOTAL RETURNS |
|||||||||||||||||||||
| THROUGH MARCH 31, 2018 | PAST SIX MONTHS |
PAST 12 MONTHS |
PAST FIVE YEARS |
PAST 10 YEARS |
SINCE INCEPTION |
INCEPTION DATE | ||||||||||||||||
| Intermediate Duration Institutional Portfolio1 |
-0.76 | % | 1.71 | % | 2.37 | % | 4.44 | % | 4.62 | % | 5/17/2002 | |||||||||||
| Bloomberg Barclays US Aggregate Bond Index |
-1.08 | % | 1.20 | % | 1.82 | % | 3.63 | % | 4.34 | % | ||||||||||||
| Lipper Core Bond Funds Average |
-1.11 | % | 1.12 | % | 1.65 | % | 3.57 | % | ||||||||||||||
| 1 | There are no sales charges associated with an investment in the Portfolio. Total returns and average annual returns are therefore the same. |
The current prospectus table shows the total annual operating expense ratio for the Portfolio as 0.54%, gross of any fee waivers or expense reimbursements. Contractual fee waivers and/or expense reimbursements limit the annual operating expense ratio to 0.45%. These waivers/reimbursements may not be terminated before January 29, 2019, and may be extended by the Adviser for additional one-year terms. Absent reimbursements or waivers, performance would have been lower. The Financial Highlights section of this report sets forth expense ratio data for the current reporting period; the expense ratio shown above may differ from the expense ratio in the Financial Highlights section since they are based on different time periods.
| Growth of a $25,000 Investment in the Portfolio | ||||||||
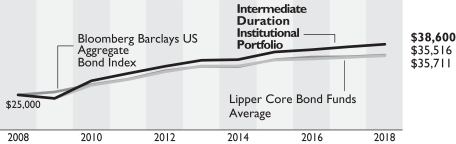
The chart illustrates the total value of an assumed $25,000 minimum investment as compared to the performance of the Portfolio’s benchmark and Lipper Average for the 10-year period ended March 31, 2018.
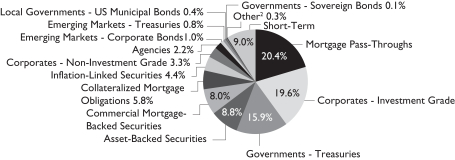
Portfolio Summary—March 31, 2018 (Unaudited)
| Security Type Breakdown1 | ||||||||
|
||||||||
| 1 | All data are as of March 31, 2018. The Portfolio’s security type breakdown is expressed as a percentage of total investments and may vary over time. The Portfolio also enters into derivative transactions, which may be used for hedging or investment purposes (see “Schedule of Investments” section of the report for additional details). |
| 2 | “Other” represents less than 0.1% in Common Stocks, Emerging Markets—Sovereigns and Quasi-Sovereigns. |
See Disclosures, Risks and Note about Historical Performance on pages 3-6.
| 2018 Semi-Annual Report | 7 |
Table of Contents
Expense Example—March 31, 2018 (Unaudited)
As a shareholder of the Fund, you incur various types of costs including management fees and other Fund expenses. This example is intended to help you understand your ongoing costs (in dollars) of investing in the Fund and to compare these costs with the ongoing costs of investing in other mutual funds. The example is based on an investment of $1,000 invested at the beginning of the period and held for the entire period as indicated below.
Actual Expenses—The first line of the table below provides information about actual account values and actual expenses. You may use the information in this line, together with the amount you invested, to estimate the expenses that you paid over the period. Simply divide your account value by $1,000 (for example, an $8,600 account value divided by $1,000 = 8.6), then multiply the result by the number in the first line under the heading entitled “Expenses Paid During Period” to estimate the expenses you paid on your account during this period.
Hypothetical Example for Comparison Purposes—The second line of the table below provides information about hypothetical account values and hypothetical expenses based on the Fund’s actual expense ratio and an assumed annual rate of return of 5% before expenses, which is not the Fund’s actual return. The hypothetical account values and expenses may not be used to estimate the actual ending account balance or expenses you paid for the period. You may use this information to compare the ongoing costs of investing in the Fund and other funds by comparing this 5% hypothetical example with the 5% hypothetical examples that appear in the shareholder reports of other funds. Please note that the expenses shown in the table are meant to highlight your ongoing costs only and do not reflect any transactional costs, such as sales charges (loads), or contingent deferred sales charges on redemptions. Therefore, the second line of the table is useful in comparing ongoing costs only, and will not help you determine the relative total costs of owning different funds. In addition, if these transactional costs were included, your costs would have been higher.
| BEGINNING ACCOUNT VALUE OCTOBER 1, 2017 |
ENDING ACCOUNT VALUE MARCH 31, 2018 |
EXPENSES PAID DURING PERIOD* |
ANNUALIZED EXPENSE RATIO* |
|||||||||||||
| SCB Intermediate Duration Institutional Portfolio |
||||||||||||||||
| Actual |
$ | 1,000 | $ | 992.40 | $ | 2.24 | 0.45 | % | ||||||||
| Hypothetical** |
$ | 1,000 | $ | 1,022.69 | $ | 2.27 | 0.45 | % | ||||||||
| * | Expenses are equal to the classes’ annualized expense ratios, multiplied by the average account value over the period, multiplied by 182/365 (to reflect the one-half year period). |
| ** | Assumes 5% annual return before expenses. |
| 8 | Sanford C. Bernstein Fund II, Inc. |
Table of Contents
Sanford C. Bernstein Fund II, Inc.
Schedule of Investments
Intermediate Duration Institutional Portfolio
March 31, 2018 (Unaudited)
| Principal Amount (000) | U.S. $ Value | |||||||||||
| MORTGAGE PASS-THROUGHS–22.0% | ||||||||||||
| Agency ARMs–0.0% | ||||||||||||
| Federal Home Loan Mortgage Corp. |
U.S.$ | 1 | $ | 577 | ||||||||
| Series 2007 |
1 | 1,362 | ||||||||||
| Federal National Mortgage Association |
2 | 2,338 | ||||||||||
| 3.579%, 3/01/37(a) |
2 | 2,356 | ||||||||||
|
|
|
|||||||||||
| 6,633 | ||||||||||||
|
|
|
|||||||||||
| Agency Fixed Rate 15-Year–1.8% | ||||||||||||
| Federal National Mortgage Association |
7,805 | 7,659,607 | ||||||||||
| Series 2017 |
4,743 | 4,654,036 | ||||||||||
|
|
|
|||||||||||
| 12,313,643 | ||||||||||||
|
|
|
|||||||||||
| Agency Fixed Rate 30-Year–20.2% | ||||||||||||
| Federal Home Loan Mortgage Corp. Gold |
53 | 58,294 | ||||||||||
| Series 2007 |
324 | 354,724 | ||||||||||
| Series 2016 |
3,045 | 3,152,890 | ||||||||||
| Series 2017 |
2,302 | 2,381,022 | ||||||||||
| Federal National Mortgage Association |
902 | 987,011 | ||||||||||
| Series 2004 |
820 | 897,097 | ||||||||||
| Series 2005 |
875 | 957,778 | ||||||||||
| Series 2006 |
179 | 195,421 | ||||||||||
| Series 2007 |
215 | 235,471 | ||||||||||
| Series 2008 |
1 | 1,341 | ||||||||||
| Series 2009 |
39 | 42,287 | ||||||||||
| Series 2010 |
1,372 | 1,421,660 | ||||||||||
| 5.00%, 6/01/40 |
36 | 39,309 | ||||||||||
| Series 2013 |
U.S.$ | 4,858 | $ | 5,028,398 | ||||||||
| Series 2015 |
5,115 | 5,007,971 | ||||||||||
| Series 2017 |
7,910 | 7,931,480 | ||||||||||
| Series 2018 |
48,540 | 48,668,731 | ||||||||||
| 4.00%, 4/01/48, TBA |
29,132 | 29,892,165 | ||||||||||
| 4.50%, 4/01/48, TBA |
27,130 | 28,405,956 | ||||||||||
| Government National Mortgage Association |
3,276 | 3,234,050 | ||||||||||
|
|
|
|||||||||||
| 138,893,056 | ||||||||||||
|
|
|
|||||||||||
| Other Agency Fixed Rate Programs–0.0% | ||||||||||||
| Federal National Mortgage Association |
123 | 133,492 | ||||||||||
|
|
|
|||||||||||
| Total Mortgage Pass-Throughs (cost $151,709,968) |
151,346,824 | |||||||||||
|
|
|
|||||||||||
| CORPORATES–INVESTMENT GRADE–21.2% | ||||||||||||
| Financial Institutions–11.4% | ||||||||||||
| Banking–9.5% | ||||||||||||
| ABN AMRO Bank NV |
269 | 275,685 | ||||||||||
| American Express Co. |
34 | 32,945 | ||||||||||
| Banco Santander SA |
1,200 | 1,194,876 | ||||||||||
| 5.179%, 11/19/25 |
800 | 834,648 | ||||||||||
| Bank of America Corp. |
1,810 | 1,771,194 | ||||||||||
| 3.824%, 1/20/28 |
1,835 | 1,816,852 | ||||||||||
| 4.20%, 8/26/24 |
56 | 56,762 | ||||||||||
| 5.00%, 5/13/21 |
10 | 10,533 | ||||||||||
| 5.875%, 1/05/21 |
35 | 37,536 | ||||||||||
| Series G |
905 | 878,547 | ||||||||||
| Bank of Tokyo-Mitsubishi UFJ Ltd. (The) |
700 | 689,269 | ||||||||||
| Banque Federative du Credit Mutuel SA |
705 | 696,131 | ||||||||||
| Barclays PLC |
200 | 192,944 | ||||||||||
| 4.375%, 1/12/26 |
200 | 201,012 | ||||||||||
| BB&T Corp. |
588 | 583,078 | ||||||||||
| BNP Paribas SA |
989 | 976,321 | ||||||||||
| 3.80%, 1/10/24(b) |
552 | 551,034 | ||||||||||
| Series E |
EUR | 476 | 599,833 | |||||||||
| 2018 Semi-Annual Report | 9 |
Table of Contents
Schedule of Investments (continued)
| Principal Amount (000) | U.S. $ Value | |||||||||||
| BPCE SA |
U.S.$ | 575 | $ | 565,587 | ||||||||
| 5.70%, 10/22/23(b) |
379 | 406,171 | ||||||||||
| Capital One Financial Corp. |
1,725 | 1,663,417 | ||||||||||
| 4.75%, 7/15/21 |
90 | 93,893 | ||||||||||
| Citigroup, Inc. |
2,105 | 2,054,817 | ||||||||||
| 3.875%, 3/26/25 |
1,575 | 1,556,163 | ||||||||||
| 3.887%, 1/10/28 |
500 | 496,695 | ||||||||||
| Citizens Bank NA/Providence RI |
500 | 492,005 | ||||||||||
| Commonwealth Bank of Australia/New York NY |
420 | 414,212 | ||||||||||
| Compass Bank |
1,785 | 1,732,467 | ||||||||||
| 5.50%, 4/01/20 |
1,537 | 1,595,990 | ||||||||||
| Cooperatieve Rabobank UA |
443 | 446,978 | ||||||||||
| 4.375%, 8/04/25 |
1,044 | 1,054,116 | ||||||||||
| 6.875%, 3/19/20(b) |
EUR | 100 | 138,533 | |||||||||
| Cooperatieve Rabobank UA/NY |
U.S.$ | 698 | 689,114 | |||||||||
| Credit Agricole SA/London |
600 | 595,188 | ||||||||||
| 3.375%, 1/10/22(b) |
680 | 675,315 | ||||||||||
| 4.125%, 1/10/27(b) |
402 | 401,373 | ||||||||||
| Credit Suisse Group Funding Guernsey Ltd. |
1,440 | 1,443,600 | ||||||||||
| 4.55%, 4/17/26 |
1,095 | 1,119,802 | ||||||||||
| Fifth Third Bancorp |
41 | 41,155 | ||||||||||
| Goldman Sachs Group, Inc. (The) |
1,483 | 1,431,125 | ||||||||||
| 3.75%, 5/22/25–2/25/26 |
731 | 722,217 | ||||||||||
| 3.85%, 7/08/24 |
2,115 | 2,124,602 | ||||||||||
| 5.75%, 1/24/22 |
510 | 551,570 | ||||||||||
| Series D |
1,203 | 1,274,506 | ||||||||||
| Series G |
130 | 135,218 | ||||||||||
| HSBC Bank USA, NA |
680 | 704,079 | ||||||||||
| HSBC Holdings PLC |
200 | 199,462 | ||||||||||
| 4.00%, 3/30/22 |
90 | 92,168 | ||||||||||
| 4.041%, 3/13/28 |
3,035 | 3,025,015 | ||||||||||
| 5.10%, 4/05/21 |
255 | 268,336 | ||||||||||
| HSBC USA, Inc. |
300 | 297,450 | ||||||||||
| JPMorgan Chase & Co. |
1,895 | 1,845,578 | ||||||||||
| 3.54%, 5/01/28 |
2,740 | 2,678,049 | ||||||||||
| 3.625%, 5/13/24 |
436 | 434,221 | ||||||||||
| 4.35%, 8/15/21 |
20 | 20,695 | ||||||||||
| 4.40%, 7/22/20 |
U.S.$ | 455 | $ | 468,777 | ||||||||
| 4.50%, 1/24/22 |
45 | 46,816 | ||||||||||
| 4.625%, 5/10/21 |
60 | 62,551 | ||||||||||
| KeyBank NA/Cleveland OH |
1,000 | 986,410 | ||||||||||
| Lloyds Banking Group PLC |
200 | 193,388 | ||||||||||
| 4.375%, 3/22/28 |
393 | 396,906 | ||||||||||
| 4.65%, 3/24/26 |
364 | 366,592 | ||||||||||
| Manufacturers & Traders Trust Co. |
1,000 | 985,600 | ||||||||||
| Mitsubishi UFJ Financial Group, Inc. |
286 | 286,420 | ||||||||||
| Morgan Stanley |
2,205 | 2,134,594 | ||||||||||
| 3.625%, 1/20/27 |
175 | 171,239 | ||||||||||
| 5.625%, 9/23/19 |
1,098 | 1,139,428 | ||||||||||
| 7.25%, 4/01/32 |
55 | 72,783 | ||||||||||
| Series F |
335 | 338,641 | ||||||||||
| Series G |
39 | 39,409 | ||||||||||
| 5.50%, 7/24/20–7/28/21 |
2,018 | 2,132,851 | ||||||||||
| 6.625%, 4/01/18 |
205 | 205,000 | ||||||||||
| Nationwide Building Society |
1,580 | 1,520,545 | ||||||||||
| PNC Bank NA |
250 | 247,868 | ||||||||||
| PNC Financial Services Group, Inc. (The) |
228 | 236,685 | ||||||||||
| Santander Holdings USA, Inc. |
1,525 | 1,510,177 | ||||||||||
| Santander Issuances SAU |
EUR | 400 | 536,151 | |||||||||
| Santander UK Group Holdings PLC |
U.S.$ | 1,448 | 1,420,169 | |||||||||
| State Street Corp. |
45 | 46,070 | ||||||||||
| UBS AG |
EUR | 135 | 182,727 | |||||||||
| UBS AG/Stamford CT |
U.S.$ | 1,584 | 1,778,753 | |||||||||
| UBS Group Funding Switzerland AG |
836 | 841,426 | ||||||||||
| US Bancorp |
723 | 738,357 | ||||||||||
| Wells Fargo & Co. |
1,445 | 1,421,085 | ||||||||||
|
|
|
|||||||||||
| 65,387,500 | ||||||||||||
|
|
|
|||||||||||
| Finance–0.3% | ||||||||||||
| GE Capital International Funding Co. Unlimited Co. |
200 | 195,496 | ||||||||||
| Synchrony Financial |
1,735 | 1,640,651 | ||||||||||
|
|
|
|||||||||||
| 1,836,147 | ||||||||||||
|
|
|
|||||||||||
| 10 | Sanford C. Bernstein Fund II, Inc. |
Table of Contents
| Principal Amount (000) | U.S. $ Value | |||||||||||
| Insurance–0.9% | ||||||||||||
| American International Group, Inc. |
U.S.$ | 792 | $ | 802,573 | ||||||||
| Anthem, Inc. |
33 | 32,633 | ||||||||||
| Coventry Health Care, Inc. |
165 | 174,887 | ||||||||||
| Guardian Life Insurance Co. of America (The) |
1,268 | 1,291,712 | ||||||||||
| Hartford Financial Services Group, Inc. (The) |
86 | 90,120 | ||||||||||
| Massachusetts Mutual Life Insurance Co. |
7 | 11,014 | ||||||||||
| MetLife Capital Trust IV |
970 | 1,228,136 | ||||||||||
| MetLife, Inc. |
75 | 74,175 | ||||||||||
| 4.75%, 2/08/21 |
350 | 364,798 | ||||||||||
| 10.75%, 8/01/39 |
25 | 39,475 | ||||||||||
| Nationwide Mutual Insurance Co. |
377 | 607,743 | ||||||||||
| New York Life Global Funding |
703 | 691,415 | ||||||||||
| Prudential Financial, Inc. |
86 | 89,126 | ||||||||||
| Reliance Standard Life Global Funding II |
80 | 79,761 | ||||||||||
| Swiss Re America Holding Corp. |
35 | 41,666 | ||||||||||
| XLIT Ltd. |
EUR | 415 | 513,813 | |||||||||
| 6.25%, 5/15/27 |
U.S.$ | 195 | 224,381 | |||||||||
|
|
|
|||||||||||
| 6,357,428 | ||||||||||||
|
|
|
|||||||||||
| REITS–0.7% | ||||||||||||
| American Tower Corp. |
30 | 31,280 | ||||||||||
| HCP, Inc. |
2 | 2,100 | ||||||||||
| Healthcare Trust of America Holdings LP |
205 | 200,660 | ||||||||||
| Host Hotels & Resorts LP |
48 | 47,407 | ||||||||||
| Trust F/1401 |
970 | 980,912 | ||||||||||
| Welltower, Inc. |
3,410 | 3,407,204 | ||||||||||
|
|
|
|||||||||||
| 4,669,563 | ||||||||||||
|
|
|
|||||||||||
| 78,250,638 | ||||||||||||
|
|
|
|||||||||||
| Industrial–9.3% | ||||||||||||
| Basic–0.9% | ||||||||||||
| Anglo American Capital PLC |
U.S.$ | 200 | $ | 199,734 | ||||||||
| Barrick North America Finance LLC |
15 | 15,576 | ||||||||||
| Dow Chemical Co. (The) |
15 | 14,738 | ||||||||||
| 4.125%, 11/15/21 |
30 | 30,870 | ||||||||||
| 4.375%, 11/15/42 |
87 | 86,883 | ||||||||||
| 7.375%, 11/01/29 |
220 | 286,961 | ||||||||||
| Eastman Chemical Co. |
496 | 501,421 | ||||||||||
| Glencore Funding LLC |
502 | 504,470 | ||||||||||
| LYB International Finance BV |
330 | 334,940 | ||||||||||
| LyondellBasell Industries NV |
996 | 1,093,777 | ||||||||||
| Minsur SA |
397 | 426,279 | ||||||||||
| Mosaic Co. (The) |
405 | 425,481 | ||||||||||
| Sociedad Quimica y Minera de Chile SA |
1,043 | 1,039,089 | ||||||||||
| Vale Overseas Ltd. |
900 | 1,058,580 | ||||||||||
| Yamana Gold, Inc. |
395 | 407,435 | ||||||||||
|
|
|
|||||||||||
| 6,426,234 | ||||||||||||
|
|
|
|||||||||||
| Capital Goods–0.2% | ||||||||||||
| Embraer Netherlands Finance BV |
1,025 | 1,083,015 | ||||||||||
| General Electric Co. |
372 | 368,261 | ||||||||||
|
|
|
|||||||||||
| 1,451,276 | ||||||||||||
|
|
|
|||||||||||
| Communications—Media–0.8% | ||||||||||||
| Charter Communications Operating LLC/Charter Communications Operating Capital |
470 | 479,367 | ||||||||||
| Comcast Corp. |
17 | 16,957 | ||||||||||
| 5.15%, 3/01/20 |
83 | 86,463 | ||||||||||
| Cox Communications, Inc. |
463 | 446,693 | ||||||||||
| Time Warner Cable LLC |
30 | 30,179 | ||||||||||
| 4.125%, 2/15/21 |
1,990 | 2,012,507 | ||||||||||
| 4.50%, 9/15/42 |
505 | 442,734 | ||||||||||
| 5.00%, 2/01/20 |
90 | 92,423 | ||||||||||
| Time Warner, Inc. |
80 | 79,841 | ||||||||||
| 2018 Semi-Annual Report | 11 |
Table of Contents
Schedule of Investments (continued)
| Principal Amount (000) | U.S. $ Value | |||||||||||
| 3.60%, 7/15/25 |
U.S.$ | 1,285 | $ | 1,249,919 | ||||||||
| 4.875%, 3/15/20 |
714 | 738,126 | ||||||||||
|
|
|
|||||||||||
| 5,675,209 | ||||||||||||
|
|
|
|||||||||||
| Communications—Telecommunications–1.2% | ||||||||||||
| AT&T Corp. |
53 | 70,866 | ||||||||||
| AT&T, Inc. |
2,860 | 2,757,326 | ||||||||||
| 3.60%, 2/17/23 |
105 | 105,503 | ||||||||||
| 3.90%, 8/14/27 |
140 | 140,811 | ||||||||||
| 4.125%, 2/17/26 |
2,087 | 2,099,960 | ||||||||||
| 5.15%, 2/14/50 |
700 | 706,300 | ||||||||||
| 7.00%, 10/01/25(b) |
135 | 159,801 | ||||||||||
| British Telecommunications PLC |
69 | 100,536 | ||||||||||
| Crown Castle Towers LLC |
543 | 562,206 | ||||||||||
| New Cingular Wireless Services, Inc. |
20 | 27,792 | ||||||||||
| Rogers Communications, Inc. |
CAD | 256 | 207,268 | |||||||||
| Sprint Spectrum Co. LLC/Sprint Spectrum Co. II LLC/Sprint Spectrum Co. III LLC |
U.S.$ | 1,380 | 1,385,547 | |||||||||
| Verizon Communications, Inc. |
90 | 99,496 | ||||||||||
| Vodafone Group PLC |
15 | 15,521 | ||||||||||
|
|
|
|||||||||||
| 8,438,933 | ||||||||||||
|
|
|
|||||||||||
| Consumer Cyclical—Automotive–1.2% | ||||||||||||
| Ford Motor Credit Co. LLC |
748 | 741,956 | ||||||||||
| 3.664%, 9/08/24 |
1,727 | 1,665,484 | ||||||||||
| 5.00%, 5/15/18 |
1,984 | 1,989,317 | ||||||||||
| 5.875%, 8/02/21 |
1,145 | 1,221,452 | ||||||||||
| General Motors Co. |
665 | 667,973 | ||||||||||
| General Motors Financial Co., Inc. |
1,411 | 1,412,679 | ||||||||||
| 3.25%, 5/15/18 |
91 | 91,067 | ||||||||||
| 4.00%, 1/15/25 |
374 | 369,639 | ||||||||||
| 4.30%, 7/13/25 |
275 | 275,239 | ||||||||||
|
|
|
|||||||||||
| 8,434,806 | ||||||||||||
|
|
|
|||||||||||
| Consumer Non-Cyclical–1.5% | ||||||||||||
| Ahold Finance USA LLC |
120 | 145,063 | ||||||||||
| Baxalta, Inc. |
15 | 14,964 | ||||||||||
| Becton Dickinson and Co. |
355 | 348,897 | ||||||||||
| Biogen, Inc. |
11 | 11,113 | ||||||||||
| 4.05%, 9/15/25 |
1,471 | 1,505,186 | ||||||||||
| Bunge Ltd. Finance Corp. |
U.S.$ | 93 | $ | 98,800 | ||||||||
| CVS Health Corp. |
830 | 836,856 | ||||||||||
| 4.30%, 3/25/28 |
830 | 834,499 | ||||||||||
| Kimberly-Clark Corp. |
35 | 35,948 | ||||||||||
| Medtronic, Inc. |
1,841 | 1,842,473 | ||||||||||
| Mylan NV |
EUR | 1,074 | 1,371,046 | |||||||||
| Reynolds American, Inc. |
U.S.$ | 300 | 322,023 | |||||||||
| Sigma Alimentos SA de CV |
221 | 212,989 | ||||||||||
| Tyson Foods, Inc. |
353 | 351,228 | ||||||||||
| 3.95%, 8/15/24 |
1,211 | 1,220,325 | ||||||||||
| 4.50%, 6/15/22 |
179 | 185,628 | ||||||||||
| Zimmer Biomet Holdings, Inc. |
694 | 686,755 | ||||||||||
| Zoetis, Inc. |
479 | 482,703 | ||||||||||
|
|
|
|||||||||||
| 10,506,496 | ||||||||||||
|
|
|
|||||||||||
| Energy–1.7% | ||||||||||||
| Anadarko Finance Co. |
20 | 25,522 | ||||||||||
| Apache Corp. |
20 | 20,217 | ||||||||||
| Cenovus Energy, Inc. |
77 | 74,187 | ||||||||||
| 5.70%, 10/15/19 |
332 | 343,388 | ||||||||||
| ConocoPhillips Holding Co. |
85 | 108,502 | ||||||||||
| Ecopetrol SA |
558 | 550,858 | ||||||||||
| Encana Corp. |
830 | 840,914 | ||||||||||
| Energy Transfer LP |
809 | 816,402 | ||||||||||
| Energy Transfer Partners LP |
100 | 97,844 | ||||||||||
| 4.65%, 6/01/21 |
324 | 333,182 | ||||||||||
| Energy Transfer Partners LP/Regency Energy Finance Corp. |
251 | 253,902 | ||||||||||
| Enterprise Products Operating LLC |
95 | 94,763 | ||||||||||
| 5.20%, 9/01/20 |
691 | 723,062 | ||||||||||
| Hess Corp. |
1,180 | 1,154,760 | ||||||||||
| Kinder Morgan Energy Partners LP |
218 | 217,457 | ||||||||||
| 4.15%, 3/01/22 |
260 | 264,248 | ||||||||||
| 6.85%, 2/15/20 |
18 | 19,127 | ||||||||||
| 12 | Sanford C. Bernstein Fund II, Inc. |
Table of Contents
| Principal Amount (000) | U.S. $ Value | |||||||||||
| Kinder Morgan, Inc./DE |
U.S.$ | 645 | $ | 670,355 | ||||||||
| Marathon Petroleum Corp. |
48 | 50,663 | ||||||||||
| Noble Energy, Inc. |
927 | 933,387 | ||||||||||
| 4.15%, 12/15/21 |
557 | 569,811 | ||||||||||
| Occidental Petroleum Corp. |
20 | 20,016 | ||||||||||
| Phillips 66 |
131 | 136,093 | ||||||||||
| Plains All American Pipeline LP/PAA Finance Corp. |
1,411 | 1,342,115 | ||||||||||
| Sabine Pass Liquefaction LLC |
811 | 842,159 | ||||||||||
| Spectra Energy Partners LP |
20 | 19,284 | ||||||||||
| 4.60%, 6/15/21 |
145 | 149,656 | ||||||||||
| TransCanada PipeLines Ltd. |
10 | 10,187 | ||||||||||
| Valero Energy Corp. |
6 | 6,361 | ||||||||||
| Williams Partners LP |
30 | 29,600 | ||||||||||
| 4.125%, 11/15/20 |
784 | 796,795 | ||||||||||
|
|
|
|||||||||||
| 11,514,817 | ||||||||||||
|
|
|
|||||||||||
| Other Industrial–0.2% | ||||||||||||
| Alfa SAB de CV |
915 | 951,028 | ||||||||||
|
|
|
|||||||||||
| Services–0.4% | ||||||||||||
| Expedia Group, Inc. |
1,225 | 1,138,417 | ||||||||||
| S&P Global, Inc. |
1,170 | 1,228,161 | ||||||||||
| Total System Services, Inc. |
21 | 20,979 | ||||||||||
|
|
|
|||||||||||
| 2,387,557 | ||||||||||||
|
|
|
|||||||||||
| Technology–1.1% | ||||||||||||
| Agilent Technologies, Inc. |
47 | 48,964 | ||||||||||
| Broadcom Corp./Broadcom Cayman Finance Ltd. |
309 | 304,028 | ||||||||||
| 3.875%, 1/15/27 |
671 | 652,990 | ||||||||||
| Dell International LLC/EMC Corp. |
1,560 | 1,653,351 | ||||||||||
| 6.02%, 6/15/26(b) |
246 | 264,785 | ||||||||||
| DXC Technology Co. |
35 | 43,183 | ||||||||||
| Fidelity National Information Services, Inc. |
2 | 2,136 | ||||||||||
| Hewlett Packard Enterprise Co. |
1,206 | 1,189,695 | ||||||||||
| 3.60%, 10/15/20 |
20 | 20,186 | ||||||||||
| HP, Inc. |
U.S.$ | 11 | $ | 11,159 | ||||||||
| KLA-Tencor Corp. |
1,265 | 1,320,015 | ||||||||||
| Lam Research Corp. |
566 | 559,474 | ||||||||||
| Motorola Solutions, Inc. |
107 | 105,463 | ||||||||||
| 7.50%, 5/15/25 |
46 | 54,736 | ||||||||||
| Seagate HDD Cayman |
687 | 669,275 | ||||||||||
| VMware, Inc. |
539 | 518,302 | ||||||||||
| Xerox Corp. |
22 | 21,749 | ||||||||||
|
|
|
|||||||||||
| 7,439,491 | ||||||||||||
|
|
|
|||||||||||
| Transportation—Services–0.1% | ||||||||||||
| Adani Ports & Special Economic Zone Ltd. |
925 | 922,687 | ||||||||||
|
|
|
|||||||||||
| 64,148,534 | ||||||||||||
|
|
|
|||||||||||
| Utility–0.5% | ||||||||||||
| Electric–0.5% | ||||||||||||
| Berkshire Hathaway Energy Co. |
108 | 137,986 | ||||||||||
| Duke Energy Carolinas LLC |
42 | 43,160 | ||||||||||
| Exelon Corp. |
30 | 29,736 | ||||||||||
| Exelon Generation Co. LLC |
919 | 916,169 | ||||||||||
| Israel Electric Corp., Ltd. |
1,117 | 1,163,076 | ||||||||||
| Pacific Gas & Electric Co. |
55 | 54,035 | ||||||||||
| 6.05%, 3/01/34 |
104 | 123,833 | ||||||||||
| Sempra Energy |
105 | 107,765 | ||||||||||
| TECO Finance, Inc. |
730 | 756,002 | ||||||||||
| Union Electric Co. |
30 | 30,963 | ||||||||||
| Wisconsin Electric Power Co. |
23 | 23,545 | ||||||||||
|
|
|
|||||||||||
| 3,386,270 | ||||||||||||
|
|
|
|||||||||||
| Natural Gas–0.0% | ||||||||||||
| NiSource, Inc. |
16 | 16,462 | ||||||||||
|
|
|
|||||||||||
| 3,402,732 | ||||||||||||
|
|
|
|||||||||||
| Total Corporates—Investment Grade (cost $145,550,772) |
145,801,904 | |||||||||||
|
|
|
|||||||||||
| 2018 Semi-Annual Report | 13 |
Table of Contents
Schedule of Investments (continued)
| Principal Amount (000) | U.S. $ Value | |||||||||||
| GOVERNMENTS—TREASURIES–17.2% | ||||||||||||
| Singapore–0.5% | ||||||||||||
| Singapore Government Bond |
SGD | 4,995 | $ | 3,790,911 | ||||||||
|
|
|
|||||||||||
| United States–16.7% | ||||||||||||
| U.S. Treasury Bonds |
U.S.$ | 187 | 160,997 | |||||||||
| 2.50%, 2/15/46–5/15/46 |
1,446 | 1,315,739 | ||||||||||
| 2.75%, 8/15/42–11/15/47 |
2,344 | 2,242,677 | ||||||||||
| 2.875%, 5/15/43–11/15/46 |
603 | 592,734 | ||||||||||
| 3.00%, 11/15/44–5/15/47 |
3,422 | 3,440,078 | ||||||||||
| 3.125%, 2/15/43-8/15/44 |
330 | 340,067 | ||||||||||
| 3.375%, 5/15/44 |
246 | 264,174 | ||||||||||
| 3.625%, 8/15/43–2/15/44 |
893 | 1,000,085 | ||||||||||
| 3.75%, 11/15/43 |
295 | 336,991 | ||||||||||
| 4.375%, 2/15/38 |
1,577 | 1,939,834 | ||||||||||
| 4.50%, 2/15/36 |
2,349 | 2,902,236 | ||||||||||
| 4.75%, 2/15/37 |
1,525 | 1,952,000 | ||||||||||
| 6.125%, 11/15/27 |
2,066 | 2,656,101 | ||||||||||
| 6.25%, 5/15/30 |
386 | 523,151 | ||||||||||
| 7.125%, 2/15/23 |
4,028 | 4,867,586 | ||||||||||
| 7.50%, 11/15/24 |
52 | 67,291 | ||||||||||
| U.S. Treasury Notes |
938 | 896,114 | ||||||||||
| 1.25%, 12/31/18 |
11,689 | 11,617,770 | ||||||||||
| 1.375%, 2/29/20–5/31/21 |
25,630 | 25,034,062 | ||||||||||
| 1.50%, 1/31/19–5/31/20 |
642 | 634,768 | ||||||||||
| 1.50%, 11/30/19(e) |
2,695 | 2,662,155 | ||||||||||
| 1.625%, 6/30/19–5/15/26 |
4,070 | 3,811,228 | ||||||||||
| 1.75%, 10/31/20–5/31/22 |
9,528 | 9,244,605 | ||||||||||
| 1.875%, 4/30/22–7/31/22 |
8,463 | 8,240,797 | ||||||||||
| 2.00%, 12/31/21–8/15/25 |
14,113 | 13,670,388 | ||||||||||
| 2.125%, 8/31/20–5/15/25 |
3,260 | 3,198,904 | ||||||||||
| 2.25%, 11/15/25–8/15/27 |
1,738 | 1,666,478 | ||||||||||
| 2.375%, 8/15/24–5/15/27 |
6,615 | 6,493,871 | ||||||||||
| 2.50%, 8/15/23 |
297 | 295,608 | ||||||||||
| 2.75%, 11/15/23–2/15/24 |
2,060 | 2,072,597 | ||||||||||
| 3.75%, 11/15/18 |
328 | 330,978 | ||||||||||
|
|
|
|||||||||||
| 114,472,064 | ||||||||||||
|
|
|
|||||||||||
| Total Governments—Treasuries (cost $120,400,577) |
118,262,975 | |||||||||||
|
|
|
|||||||||||
| ASSET-BACKED SECURITIES–9.5% | ||||||||||||
| Autos—Fixed Rate–5.3% | ||||||||||||
| Ally Auto Receivables Trust |
318 | 317,589 | ||||||||||
| Ally Master Owner Trust |
182 | 181,818 | ||||||||||
| Americredit Automobile Receivables Trust |
325 | 324,663 | ||||||||||
| AmeriCredit Automobile Receivables Trust |
U.S.$ | 740 | $ | 736,946 | ||||||||
| Avis Budget Rental Car Funding AESOP LLC |
2,535 | 2,538,045 | ||||||||||
| Series 2016-1A, Class A |
742 | 739,407 | ||||||||||
| Bank of The West Auto Trust |
144 | 144,143 | ||||||||||
| California Republic Auto Receivables Trust |
176 | 176,079 | ||||||||||
| CarMax Auto Owner Trust |
85 | 84,965 | ||||||||||
| Chrysler Capital Auto Receivables Trust |
172 | 171,572 | ||||||||||
| CPS Auto Receivables Trust |
142 | 141,427 | ||||||||||
| Series 2017-D, Class A |
1,591 | 1,583,712 | ||||||||||
| CPS Auto Trust |
318 | 317,254 | ||||||||||
| Drive Auto Receivables Trust |
160 | 159,558 | ||||||||||
| Series 2017-3, Class B |
1,730 | 1,721,669 | ||||||||||
| DT Auto Owner Trust |
365 | 363,877 | ||||||||||
| Series 2018-1A, Class A |
1,770 | 1,768,963 | ||||||||||
| Exeter Automobile Receivables Trust |
520 | 552,027 | ||||||||||
| Series 2016-3A, Class A |
169 | 167,897 | ||||||||||
| Series 2017-2A, Class A |
488 | 486,324 | ||||||||||
| Series 2017-3A, Class A |
1,465 | 1,457,268 | ||||||||||
| Fifth Third Auto Trust |
1,028 | 1,025,526 | ||||||||||
| First Investors Auto Owner Trust |
279 | 278,207 | ||||||||||
| Flagship Credit Auto Trust |
620 | 669,677 | ||||||||||
| 14 | Sanford C. Bernstein Fund II, Inc. |
Table of Contents
| Principal Amount (000) | U.S. $ Value | |||||||||||
| Series 2016-4, Class A2 |
U.S.$ | 635 | $ | 632,628 | ||||||||
| Series 2016-4, Class D |
570 | 572,326 | ||||||||||
| Series 2017-3, Class A |
770 | 764,878 | ||||||||||
| Series 2017-4, Class A |
705 | 699,495 | ||||||||||
| Ford Credit Auto Owner Trust |
2,407 | 2,393,527 | ||||||||||
| Series 2016-1, Class A |
1,232 | 1,211,682 | ||||||||||
| Ford Credit Floorplan Master Owner Trust |
1,755 | 1,733,119 | ||||||||||
| Series 2016-1, Class A1 |
55 | 54,557 | ||||||||||
| Series 2017-1, Class A1 |
1,275 | 1,255,831 | ||||||||||
| GM Financial Automobile Leasing Trust |
627 | 626,902 | ||||||||||
| GMF Floorplan Owner Revolving Trust |
1,078 | 1,076,717 | ||||||||||
| Harley-Davidson Motorcycle Trust |
304 | 303,146 | ||||||||||
| Series 2015-2, Class A3 |
32 | 31,495 | ||||||||||
| Hertz Vehicle Financing II LP |
669 | 668,654 | ||||||||||
| Series 2015-2A, Class A |
924 | 920,468 | ||||||||||
| Series 2015-2A, Class C |
600 | 598,698 | ||||||||||
| Series 2018-1A, Class A |
710 | 702,387 | ||||||||||
| Hertz Vehicle Financing LLC |
3,204 | 3,197,954 | ||||||||||
| Santander Drive Auto Receivables Trust |
678 | 676,695 | ||||||||||
| Westlake Automobile Receivables Trust |
44 | 44,186 | ||||||||||
| Series 2018-1A, Class A1 |
541 | 541,357 | ||||||||||
| Wheels SPV 2 LLC |
1,325 | 1,308,902 | ||||||||||
|
|
|
|||||||||||
| 36,124,217 | ||||||||||||
|
|
|
|||||||||||
| Other ABS—Fixed Rate–2.1% | ||||||||||||
| CLUB Credit Trust |
U.S.$ | 1,413 | $ | 1,409,590 | ||||||||
| CNH Equipment Trust |
648 | 647,036 | ||||||||||
| Series 2015-A, Class A4 |
1,217 | 1,210,968 | ||||||||||
| Marlette Funding Trust |
71 | 71,259 | ||||||||||
| Series 2017-1A, Class A |
321 | 320,768 | ||||||||||
| Series 2017-2A, Class A |
602 | 600,689 | ||||||||||
| Series 2017-3A, Class A |
482 | 480,305 | ||||||||||
| Series 2017-3A, Class B |
415 | 411,339 | ||||||||||
| Series 2018-1A, Class A |
1,404 | 1,402,362 | ||||||||||
| Prosper Marketplace Issuance Trust |
360 | 358,930 | ||||||||||
| SBA Tower Trust |
1,340 | 1,317,448 | ||||||||||
| SoFi Consumer Loan Program LLC |
349 | 349,195 | ||||||||||
| Series 2016-3, Class A |
446 | 445,048 | ||||||||||
| Series 2017-2, Class A |
591 | 592,169 | ||||||||||
| Series 2017-5, Class A2 |
1,475 | 1,452,730 | ||||||||||
| Series 2017-6, Class A2 |
1,380 | 1,364,752 | ||||||||||
| SoFi Consumer Loan Program Trust |
1,686 | 1,680,093 | ||||||||||
| Volvo Financial Equipment LLC |
12 | 12,375 | ||||||||||
|
|
|
|||||||||||
| 14,127,056 | ||||||||||||
|
|
|
|||||||||||
| Credit Cards—Fixed Rate–1.6% | ||||||||||||
| Barclays Dryrock Issuance Trust |
100 | 98,908 | ||||||||||
| Series 2015-2, Class A |
100 | 99,919 | ||||||||||
| Series 2015-4, Class A |
1,130 | 1,125,583 | ||||||||||
| Capital One Multi-Asset Execution Trust |
1,063 | 1,060,524 | ||||||||||
| 2018 Semi-Annual Report | 15 |
Table of Contents
Schedule of Investments (continued)
| Principal Amount (000) | U.S. $ Value | |||||||||||
| Chase Issuance Trust |
U.S.$ | 200 | $ | 193,990 | ||||||||
| GE Capital Credit Card Master Note Trust |
2,042 | 2,036,766 | ||||||||||
| Synchrony Credit Card Master Note Trust |
1,802 | 1,795,852 | ||||||||||
| Series 2016-1, Class A |
100 | 99,538 | ||||||||||
| World Financial Network Credit Card Master Trust |
1,398 | 1,392,228 | ||||||||||
| Series 2017-B, Class A |
1,300 | 1,286,626 | ||||||||||
| Series 2018-A, Class A |
2,100 |
|
2,098,275
|
| ||||||||
|
|
|
|||||||||||
| 11,288,209 | ||||||||||||
|
|
|
|||||||||||
| Autos—Floating Rate–0.3% | ||||||||||||
| BMW Floorplan Master Owner Trust |
1,949 | 1,951,102 | ||||||||||
|
|
|
|||||||||||
| Credit Cards—Floating Rate–0.2% | ||||||||||||
| World Financial Network Credit Card Master Trust |
1,375 | 1,375,198 | ||||||||||
|
|
|
|||||||||||
| Home Equity Loans—Floating Rate–0.0% | ||||||||||||
| Asset Backed Funding Certificates Trust |
158 | 158,702 | ||||||||||
| Wells Fargo Home Equity Trust Mortgage Pass-Through Certificates |
81 | 78,965 | ||||||||||
|
|
|
|||||||||||
| 237,667 | ||||||||||||
|
|
|
|||||||||||
| Home Equity Loans—Fixed Rate–0.0% | ||||||||||||
| Credit-Based Asset Servicing & Securitization LLC |
108 | 109,375 | ||||||||||
|
|
|
|||||||||||
| Total Asset-Backed Securities (cost $65,410,007) |
65,212,824 | |||||||||||
|
|
|
|||||||||||
| COMMERCIAL MORTGAGE-BACKED SECURITIES–8.6% | ||||||||||||
| Non-Agency Fixed Rate CMBS–7.0% | ||||||||||||
| BHMS Commercial Mortgage Trust |
U.S.$ | 1,705 | $ | 1,683,091 | ||||||||
| CCUBS Commercial Mortgage Trust |
2,005 | 1,988,949 | ||||||||||
| CFCRE Commercial Mortgage Trust |
2,808 | 2,742,088 | ||||||||||
| CGRBS Commercial Mortgage Trust |
2,495 | 2,500,892 | ||||||||||
| Citigroup Commercial Mortgage Trust |
1,468 | 1,443,381 | ||||||||||
| Series 2015-GC35, Class A4 |
630 | 642,877 | ||||||||||
| Series 2016-C1, Class A4 |
2,409 | 2,360,940 | ||||||||||
| Series 2016-GC36, Class A5 |
705 | 709,071 | ||||||||||
| Series 2018-B2, Class A4 |
1,200 | 1,242,456 | ||||||||||
| Commercial Mortgage Trust |
889 | 749,686 | ||||||||||
| Series 2013-CR6, Class A2 |
37 | 36,630 | ||||||||||
| Series 2013-SFS, Class A1 |
695 | 671,682 | ||||||||||
| Series 2014-UBS5, Class A4 |
1,925 | 1,978,110 | ||||||||||
| Series 2015-CR24, Class A5 |
730 | 741,251 | ||||||||||
| Series 2015-CR25, Class A4 |
200 | 203,254 | ||||||||||
| Series 2015-LC21, Class XA |
2,919 | 111,787 | ||||||||||
| Series 2015-PC1, Class A5 |
226 | 232,177 | ||||||||||
| CSAIL Commercial Mortgage Trust |
675 | 674,058 | ||||||||||
| Series 2015-C3, Class A4 |
1,165 | 1,177,904 | ||||||||||
| Series 2015-C4, Class A4 |
1,641 | 1,683,128 | ||||||||||
| GS Mortgage Securities Corp. II |
2,361 | 2,352,991 | ||||||||||
| GS Mortgage Securities Trust |
1,499 | 1,457,017 | ||||||||||
| Series 2013-GC16, Class A2 |
103 | 103,484 | ||||||||||
| 16 | Sanford C. Bernstein Fund II, Inc. |
Table of Contents
| Principal Amount (000) | U.S. $ Value | |||||||||||
| JP Morgan Chase Commercial Mortgage Securities Trust |
U.S.$ | 330 | $ | 331,957 | ||||||||
| Series 2011-C5, Class D |
224 | 219,917 | ||||||||||
| Series 2012-C6, Class E |
712 | 628,946 | ||||||||||
| JPMBB Commercial Mortgage Securities Trust |
472 | 424,608 | ||||||||||
| Series 2014-C22, Class XA |
6,485 | 285,416 | ||||||||||
| Series 2015-C30, Class A5 |
725 | 741,609 | ||||||||||
| Series 2015-C31, Class A3 |
1,903 | 1,939,369 | ||||||||||
| Series 2015-C32, Class C |
1,000 | 993,830 | ||||||||||
| LB-UBS Commercial Mortgage Trust |
421 | 333,383 | ||||||||||
| LSTAR Commercial Mortgage Trust |
86 | 85,395 | ||||||||||
| Series 2015-3, Class A2 |
961 | 952,277 | ||||||||||
| Series 2016-4, Class A2 |
1,099 | 1,065,745 | ||||||||||
| Morgan Stanley Bank of America Merrill Lynch Trust |
2,266 | 140,057 | ||||||||||
| Morgan Stanley Capital I Trust |
619 | 613,687 | ||||||||||
| Series 2016-UB12, Class A4 |
1,105 | 1,110,367 | ||||||||||
| UBS Commercial Mortgage Trust |
1,320 | 1,359,844 | ||||||||||
| UBS Commercial Mortgage Trust |
2,100 | 2,173,509 | ||||||||||
| UBS-Barclays Commercial Mortgage Trust |
2,348 | 2,317,013 | ||||||||||
| Wells Fargo Commercial Mortgage Trust |
|
|||||||||||
| Series 2014-LC16, Class XA |
3,917 | 195,836 | ||||||||||
| Series 2015-SG1, Class C |
975 | 947,401 | ||||||||||
| Series 2016-NXS6, Class C |
1,030 | 1,022,371 | ||||||||||
| WF-RBS Commercial Mortgage Trust |
|
|||||||||||
| Series 2013-C14, Class A5 |
U.S.$ | 1,419 | $ | 1,423,264 | ||||||||
| Series 2013-C15, Class A4 |
115 | 119,643 | ||||||||||
| Series 2014-C20, Class A2 |
1,201 | 1,203,312 | ||||||||||
|
|
|
|||||||||||
| 48,115,660 | ||||||||||||
|
|
|
|||||||||||
| Non-Agency Floating Rate CMBS–1.6% | ||||||||||||
| BAMLL Commercial Mortgage Securities Trust |
2,435 | 2,440,495 | ||||||||||
| BX Trust |
1,625 | 1,626,013 | ||||||||||
| Credit Suisse Mortgage Trust |
393 | 395,913 | ||||||||||
| Great Wolf Trust |
1,261 | 1,262,729 | ||||||||||
| H/2 Asset Funding NRE |
465 | 464,935 | ||||||||||
| JP Morgan Chase Commercial Mortgage Securities Trust |
1,379 | 1,375,183 | ||||||||||
| Morgan Stanley Capital I Trust |
|
|||||||||||
| Series 2015-XLF2, Class AFSA |
458 | 457,528 | ||||||||||
| Series 2015-XLF2, Class SNMA |
418 | 416,017 | ||||||||||
| RETL |
686 | 689,220 | ||||||||||
| Starwood Retail Property Trust |
1,935 | 1,934,544 | ||||||||||
|
|
|
|||||||||||
| 11,062,577 | ||||||||||||
|
|
|
|||||||||||
| Agency CMBS–0.0% | ||||||||||||
| Federal Home Loan Mortgage Corp. Multifamily |
|
|||||||||||
| Series K010, Class A1 |
10 | 9,771 | ||||||||||
| 2018 Semi-Annual Report | 17 |
Table of Contents
Schedule of Investments (continued)
| Principal Amount (000) | U.S. $ Value | |||||||||||
| Series K011, Class A1 |
U.S.$ | 22 | $ | 21,956 | ||||||||
| Series K021, Class A1 |
57 | 55,925 | ||||||||||
| Series K025, Class A1 |
89 | 87,122 | ||||||||||
| Federal Home Loan Mortgage Corp. Multifamily Structured Pass-Through Certificates |
78 | 78,912 | ||||||||||
|
|
|
|||||||||||
| 253,686 | ||||||||||||
|
|
|
|||||||||||
| Total Commercial Mortgage-Backed Securities |
|
59,431,923 | ||||||||||
|
|
|
|||||||||||
| COLLATERALIZED MORTGAGE OBLIGATIONS–6.3% | ||||||||||||
| Risk Share Floating Rate–4.1% | ||||||||||||
| Bellemeade Re II Ltd. |
308 | 314,077 | ||||||||||
| Federal Home Loan Mortgage Corp. Structured Agency Credit Risk Debt Notes |
2,254 | 2,507,643 | ||||||||||
| Series 2014-DN3, Class M3 |
748 | 816,006 | ||||||||||
| Series 2014-DN4, Class M3 |
253 | 282,481 | ||||||||||
| Series 2014-HQ3, Class M3 |
933 | 1,038,944 | ||||||||||
| Series 2015-DNA1, Class M3 |
305 | 339,848 | ||||||||||
| Series 2015-DNA2, Class M2 |
863 | 879,169 | ||||||||||
| Series 2015-HQ1, Class M3 |
250 | 269,865 | ||||||||||
| Series 2015-HQ2, Class M2 |
227 | 232,645 | ||||||||||
| Series 2015-HQA1, Class M2 |
758 | 772,967 | ||||||||||
| Series 2016-DNA1, Class M2 |
250 | 256,427 | ||||||||||
| Series 2016-DNA2, Class M3 |
U.S.$ | 1,000 | $ | 1,147,993 | ||||||||
| Series 2016-DNA4, Class M2 |
250 | 252,798 | ||||||||||
| Series 2016-HQA2, Class M2 |
250 | 255,219 | ||||||||||
| Series 2018-HQA1, Class M2 |
106 | 105,757 | ||||||||||
| Federal National Mortgage Association |
|
|||||||||||
| Series 2014-C03, Class 1M2 |
585 | 625,909 | ||||||||||
| Series 2014-C04, Class 2M2 |
398 | 447,226 | ||||||||||
| Series 2015-C01, Class 1M2 |
531 | 583,037 | ||||||||||
| Series 2015-C01, Class 2M2 |
560 | 608,274 | ||||||||||
| Series 2015-C02, Class 1M2 |
866 | 950,474 | ||||||||||
| Series 2015-C02, Class 2M2 |
565 | 609,566 | ||||||||||
| Series 2015-C03, Class 1M2 |
998 | 1,135,006 | ||||||||||
| Series 2015-C03, Class 2M2 |
1,041 | 1,163,659 | ||||||||||
| Series 2015-C04, Class 1M2 |
331 | 383,575 | ||||||||||
| Series 2015-C04, Class 2M2 |
1,007 | 1,134,098 | ||||||||||
| Series 2016-C01, Class 1M2 |
1,131 | 1,363,297 | ||||||||||
| Series 2016-C01, Class 2M2 |
849 | 1,018,954 | ||||||||||
| Series 2016-C02, Class 1M2 |
925 | 1,107,272 | ||||||||||
| Series 2016-C03, Class 2M2 |
2,103 | 2,466,816 | ||||||||||
| 18 | Sanford C. Bernstein Fund II, Inc. |
Table of Contents
| Principal Amount (000) | U.S. $ Value | |||||||||||
| Series 2016-C05, Class 2M2 |
U.S.$ | 2,105 | $ | 2,348,685 | ||||||||
| Series 2018-C01, Class 1M2 |
1,310 | 1,326,883 | ||||||||||
| JP Morgan Madison Avenue Securities Trust |
209 | 227,311 | ||||||||||
| Wells Fargo Credit Risk Transfer Securities Trust |
730 | 821,243 | ||||||||||
| Series 2015-WF1, Class 2M2 |
206 | 241,472 | ||||||||||
|
|
|
|||||||||||
| 28,034,596 | ||||||||||||
|
|
|
|||||||||||
| Agency Floating Rate–1.3% | ||||||||||||
| Federal Home Loan Mortgage Corp. REMICs |
4,182 | 705,670 | ||||||||||
| Series 4693, Class SL |
3,733 | 707,865 | ||||||||||
| Series 4727, Class SA |
2,901 | 545,199 | ||||||||||
| Federal National Mortgage Association REMICs |
2,055 | 388,824 | ||||||||||
| Series 2012-70, Class SA |
3,644 | 717,076 | ||||||||||
| Series 2016-106, Class ES |
3,992 | 697,364 | ||||||||||
| Series 2017-16, Class SG |
3,905 | 712,185 | ||||||||||
| Series 2017-73, Class SA |
4,316 | 856,137 | ||||||||||
| Series 2017-97, Class LS |
2,727 | 523,056 | ||||||||||
| Series 2017-97, Class SW |
3,047 | 575,367 | ||||||||||
| Government National Mortgage Association |
U.S.$ | 3,394 | $ | 593,125 | ||||||||
| Series 2017-43, Class ST |
4,865 | 793,637 | ||||||||||
| Series 2017-65, Class ST |
4,271 | 762,091 | ||||||||||
|
|
|
|||||||||||
| 8,577,596 | ||||||||||||
|
|
|
|||||||||||
| Non-Agency Fixed Rate–0.7% | ||||||||||||
| Alternative Loan Trust |
147 | 141,795 | ||||||||||
| Series 2005-57CB, Class 4A3 |
322 | 287,347 | ||||||||||
| Series 2006-24CB, Class A16 |
665 | 576,619 | ||||||||||
| Series 2006-28CB, Class A14 |
465 | 389,308 | ||||||||||
| Series 2006-J1, Class 1A13 |
376 | 342,784 | ||||||||||
| Chase Mortgage Finance Trust |
207 | 185,435 | ||||||||||
| Citigroup Mortgage Loan Trust, Inc. |
319 | 321,782 | ||||||||||
| Countrywide Home Loan Mortgage Pass-Through Trust |
348 | 297,921 | ||||||||||
| Series 2006-13, Class 1A19 |
156 | 132,255 | ||||||||||
| Credit Suisse Mortgage Trust |
643 | 524,213 | ||||||||||
| First Horizon Alternative Mortgage Securities Trust |
551 | 462,885 | ||||||||||
| JP Morgan Alternative Loan Trust |
231 | 206,856 | ||||||||||
| JP Morgan Mortgage Trust |
282 | 246,433 | ||||||||||
| RBSSP Resecuritization Trust |
913 | 801,783 | ||||||||||
| Residential Funding Mortgage Securities I Trust |
8 | 7,733 | ||||||||||
| 2018 Semi-Annual Report | 19 |
Table of Contents
Schedule of Investments (continued)
| Principal Amount (000) | U.S. $ Value | |||||||||||
| Wells Fargo Mortgage Backed Securities Trust |
U.S.$ | 147 | $ | 146,743 | ||||||||
|
|
|
|||||||||||
| 5,071,892 | ||||||||||||
|
|
|
|||||||||||
| Non-Agency Floating Rate–0.2% | ||||||||||||
| Deutsche Alt-A Securities Mortgage Loan Trust |
1,411 | 870,934 | ||||||||||
| HomeBanc Mortgage Trust |
494 | 438,387 | ||||||||||
|
|
|
|||||||||||
| 1,309,321 | ||||||||||||
|
|
|
|||||||||||
| Agency Fixed Rate–0.0% | ||||||||||||
| Federal National Mortgage Association Grantor Trust |
323 | 301,331 | ||||||||||
|
|
|
|||||||||||
| Total Collateralized Mortgage Obligations (cost $41,310,152) |
43,294,736 | |||||||||||
|
|
|
|||||||||||
| INFLATION-LINKED SECURITIES–4.8% | ||||||||||||
| Japan–0.9% | ||||||||||||
| Japanese Government CPI Linked Bond |
JPY | 641,181 | 6,409,341 | |||||||||
|
|
|
|||||||||||
| United States–3.9% | ||||||||||||
| U.S. Treasury Inflation Index |
U.S.$ | 16,198 | 16,174,856 | |||||||||
| 0.375%, 7/15/25 (TIPS) |
10,450 | 10,316,321 | ||||||||||
|
|
|
|||||||||||
| 26,491,177 | ||||||||||||
|
|
|
|||||||||||
| Total Inflation-Linked Securities (cost $32,805,393) |
32,900,518 | |||||||||||
|
|
|
|||||||||||
| CORPORATES—NON-INVESTMENT GRADE–3.6% | ||||||||||||
| Industrial–2.0% | ||||||||||||
| Basic–0.2% | ||||||||||||
| ArcelorMittal |
100 | 105,296 | ||||||||||
| NOVA Chemicals Corp. |
645 | 648,696 | ||||||||||
| SPCM SA |
533 | 517,959 | ||||||||||
|
|
|
|||||||||||
| 1,271,951 | ||||||||||||
|
|
|
|||||||||||
| Communications—Media–0.3% | ||||||||||||
| Altice France SA/France |
EUR | 274 | 343,465 | |||||||||
| CCO Holdings LLC/CCO Holdings Capital Corp. |
|
U.S.$ |
|
906 | 869,090 | |||||||
| CSC Holdings LLC |
U.S.$ | 235 | $ | 245,121 | ||||||||
| Ziggo Secured Finance BV |
262 | 246,125 | ||||||||||
|
|
|
|||||||||||
| 1,703,801 | ||||||||||||
|
|
|
|||||||||||
| Communications—Telecommunications–0.3% | ||||||||||||
| CenturyLink, Inc. |
136 | 137,002 | ||||||||||
| Sprint Capital Corp. |
1,825 | 1,885,170 | ||||||||||
|
|
|
|||||||||||
| 2,022,172 | ||||||||||||
|
|
|
|||||||||||
| Consumer Cyclical—Automotive–0.0% | ||||||||||||
| Adient Global Holdings Ltd. |
258 | 243,753 | ||||||||||
|
|
|
|||||||||||
| Consumer Cyclical—Other–0.3% | ||||||||||||
| International Game Technology PLC |
635 | 665,131 | ||||||||||
| 6.50%, 2/15/25(b) |
890 | 958,877 | ||||||||||
| KB Home |
571 | 576,396 | ||||||||||
| PulteGroup, Inc. |
100 | 97,546 | ||||||||||
|
|
|
|||||||||||
| 2,297,950 | ||||||||||||
|
|
|
|||||||||||
| Consumer Cyclical—Retailers–0.0% | ||||||||||||
| Group 1 Automotive, Inc. |
100 | 100,895 | ||||||||||
|
|
|
|||||||||||
| Consumer Non-Cyclical–0.1% | ||||||||||||
| HCA, Inc. |
111 | 107,196 | ||||||||||
| 5.25%, 6/15/26 |
20 | 20,249 | ||||||||||
| Valeant Pharmaceuticals International, Inc. |
715 | 614,414 | ||||||||||
|
|
|
|||||||||||
| 741,859 | ||||||||||||
|
|
|
|||||||||||
| Energy–0.6% | ||||||||||||
| Antero Resources Corp. |
185 | 186,695 | ||||||||||
| Diamond Offshore Drilling, Inc. |
664 | 474,096 | ||||||||||
| Nabors Industries, Inc. |
150 | 142,516 | ||||||||||
| 5.50%, 1/15/23 |
1,228 | 1,197,791 | ||||||||||
| PDC Energy, Inc. |
894 | 880,590 | ||||||||||
| QEP Resources, Inc. |
33 | 31,796 | ||||||||||
| SM Energy Co. |
76 | 75,682 | ||||||||||
| Sunoco LP/Sunoco Finance Corp. |
858 |
|
829,506 |
| ||||||||
|
|
|
|||||||||||
| 3,818,672 | ||||||||||||
|
|
|
|||||||||||
| 20 | Sanford C. Bernstein Fund II, Inc. |
Table of Contents
| Principal Amount (000) | U.S. $ Value | |||||||||||
| Technology–0.1% | ||||||||||||
| Western Digital Corp. |
U.S.$ | 928 | $ | 926,979 | ||||||||
|
|
|
|||||||||||
| Transportation—Services–0.1% | ||||||||||||
| Avis Budget Car Rental LLC/Avis Budget Finance, Inc. |
535 | 511,492 | ||||||||||
|
|
|
|||||||||||
| 13,639,524 | ||||||||||||
|
|
|
|||||||||||
| Financial Institutions–1.5% | ||||||||||||
| Banking–1.3% | ||||||||||||
| Banco Bilbao Vizcaya Argentaria SA |
800 | 777,440 | ||||||||||
| Bank of America Corp. |
1,028 | 1,034,785 | ||||||||||
| Barclays Bank PLC |
226 | 265,399 | ||||||||||
| CIT Group, Inc. |
703 | 718,810 | ||||||||||
| Citigroup, Inc. |
481 | 494,189 | ||||||||||
| Credit Suisse Group AG |
283 | 307,055 | ||||||||||
| Goldman Sachs Group, Inc. (The) |
908 | 881,078 | ||||||||||
| Intesa Sanpaolo SpA |
757 | 747,712 | ||||||||||
| 7.75%, 1/11/27(b)(c) |
EUR | 280 | 420,752 | |||||||||
| Series E |
231 | 305,969 | ||||||||||
| Royal Bank of Scotland Group PLC |
250 | 305,690 | ||||||||||
| 8.625%, 8/15/21(c) |
U.S.$ | 940 | 1,026,424 | |||||||||
| Series U |
800 | 809,224 | ||||||||||
| Standard Chartered PLC |
400 | 378,848 | ||||||||||
| 7.50%, 4/02/22(b)(c) |
453 | 479,047 | ||||||||||
| 7.75%, 4/02/23(b)(c) |
200 | 213,872 | ||||||||||
|
|
|
|||||||||||
| 9,166,294 | ||||||||||||
|
|
|
|||||||||||
| Finance–0.2% | ||||||||||||
| Navient Corp. |
935 | 971,437 | ||||||||||
| 7.25%, 1/25/22 |
134 | 141,879 | ||||||||||
|
|
|
|||||||||||
| 1,113,316 | ||||||||||||
|
|
|
|||||||||||
| 10,279,610 | ||||||||||||
|
|
|
|||||||||||
| Utility–0.1% | ||||||||||||
| Electric–0.1% | ||||||||||||
| AES Corp./VA |
U.S.$ | 684 | $ | 687,133 | ||||||||
|
|
|
|||||||||||
| Total Corporates—Non-Investment Grade (cost $24,765,982) |
24,606,267 | |||||||||||
|
|
|
|||||||||||
| AGENCIES–2.4% | ||||||||||||
| Agency Debentures–2.4% | ||||||||||||
| Federal National Mortgage Association |
355 | 461,248 | ||||||||||
| 6.625%, 11/15/30 |
260 | 355,782 | ||||||||||
| Residual Funding Corp. Principal Strip |
16,374 | 15,451,816 | ||||||||||
|
|
|
|||||||||||
| Total Agencies (cost $15,906,385) |
16,268,846 | |||||||||||
|
|
|
|||||||||||
| EMERGING MARKETS—CORPORATE BONDS–1.1% | ||||||||||||
| Industrial–1.0% | ||||||||||||
| Capital Goods–0.1% | ||||||||||||
| Odebrecht Finance Ltd. |
1,056 | 327,360 | ||||||||||
| 7.125%, 6/26/42(b) |
474 | 154,050 | ||||||||||
|
|
|
|||||||||||
| 481,410 | ||||||||||||
|
|
|
|||||||||||
| Communications—Telecommunications–0.1% | ||||||||||||
| MTN Mauritius Investment Ltd. |
636 | 642,360 | ||||||||||
|
|
|
|||||||||||
| Consumer Non-Cyclical–0.3% | ||||||||||||
| BRF GmbH |
389 | 336,485 | ||||||||||
| BRF SA |
370 | 338,420 | ||||||||||
| Marfrig Holdings Europe BV |
580 | 581,450 | ||||||||||
| Minerva Luxembourg SA |
309 | 295,095 | ||||||||||
| Teva Pharmaceutical Finance Netherlands III BV |
1,159 | 928,649 | ||||||||||
|
|
|
|||||||||||
| 2,480,099 | ||||||||||||
|
|
|
|||||||||||
| Energy–0.4% | ||||||||||||
| Petrobras Global Finance BV |
1,078 | 1,042,986 | ||||||||||
| 6.125%, 1/17/22 |
45 | 47,959 | ||||||||||
| 6.25%, 3/17/24 |
786 | 829,623 | ||||||||||
| Ultrapar International SA |
636 | 632,025 | ||||||||||
|
|
|
|||||||||||
| 2,552,593 | ||||||||||||
|
|
|
|||||||||||
| Transportation—Services–0.1% | ||||||||||||
| Rumo Luxembourg Sarl |
672 | 663,896 | ||||||||||
|
|
|
|||||||||||
| 6,820,358 | ||||||||||||
|
|
|
|||||||||||
| 2018 Semi-Annual Report | 21 |
Table of Contents
Schedule of Investments (continued)
| Principal Amount (000) | U.S. $ Value | |||||||||||
| Utility – 0.1% | ||||||||||||
| Electric–0.1% | ||||||||||||
| Genneia SA |
U.S.$ | 497 | $ | 534,096 | ||||||||
| Terraform Global Operating LLC |
286 | 288,091 | ||||||||||
|
|
|
|||||||||||
| 822,187 | ||||||||||||
|
|
|
|||||||||||
| Total Emerging Markets—Corporate Bonds (cost $8,581,390) |
7,642,545 | |||||||||||
|
|
|
|||||||||||
| EMERGING MARKETS—TREASURIES – 0.9% | ||||||||||||
| Argentina–0.1% | ||||||||||||
| Argentina POM Politica Monetaria |
ARS | 12,200 | 640,836 | |||||||||
|
|
|
|||||||||||
| Brazil–0.8% | ||||||||||||
| Brazil Notas do Tesouro Nacional |
BRL | 16,950 | 5,275,974 | |||||||||
|
|
|
|||||||||||
| Total Emerging Markets—Treasuries (cost $5,099,689) |
5,916,810 | |||||||||||
|
|
|
|||||||||||
| LOCAL GOVERNMENTS—US MUNICIPAL BONDS–0.5% | ||||||||||||
| United States–0.5% | ||||||||||||
| State of California |
U.S.$ | 2,040 | 3,106,573 | |||||||||
|
|
|
|||||||||||
| GOVERNMENTS—SOVEREIGN BONDS–0.1% | ||||||||||||
| Mexico–0.1% | ||||||||||||
| Mexico Government International Bond |
948 | 935,676 | ||||||||||
|
|
|
|||||||||||
| Poland–0.0% | ||||||||||||
| Republic of Poland Government International Bond |
10 | 10,465 | ||||||||||
|
|
|
|||||||||||
| Total Governments—Sovereign Bonds (cost $940,786) |
946,141 | |||||||||||
|
|
|
|||||||||||
| Shares | ||||||||||||
| COMMON STOCKS–0.1% | ||||||||||||
| Financials–0.1% | ||||||||||||
| Insurance–0.1% | ||||||||||||
| Mt. Logan Re Ltd. |
521 | 524,380 | ||||||||||
|
|
|
|||||||||||
| Principal Amount (000) | U.S. $ Value | |||||||||||
| QUASI-SOVEREIGNS–0.1% | ||||||||||||
| Quasi-Sovereign Bonds–0.1% | ||||||||||||
| Chile–0.1% | ||||||||||||
| Corp. Nacional del Cobre de Chile |
U.S.$ | 457 | $ | 443,825 | ||||||||
|
|
|
|||||||||||
| Mexico–0.0% | ||||||||||||
| Petroleos Mexicanos |
10 | 9,580 | ||||||||||
|
|
|
|||||||||||
| Total Quasi-Sovereigns (cost $ 458,840) |
453,405 | |||||||||||
|
|
|
|||||||||||
| EMERGING MARKETS—SOVEREIGNS–0.1% | ||||||||||||
| Egypt–0.1% | ||||||||||||
| Egypt Government International Bond |
405 | 419,681 | ||||||||||
|
|
|
|||||||||||
| SHORT-TERM INVESTMENTS–9.7% | ||||||||||||
| Governments—Treasuries–8.0% | ||||||||||||
| Japan–8.0% | ||||||||||||
| Japan Treasury Discount Bill |
JPY | 3,404,950 | 32,000,401 | |||||||||
| Series 743 |
2,464,650 | 23,178,743 | ||||||||||
|
|
|
|||||||||||
| Total Governments—Treasuries (cost $53,278,667) |
55,179,144 | |||||||||||
|
|
|
|||||||||||
| Commercial Paper–1.0% | ||||||||||||
| Bank of Tokyo-Mitsubishi UFJ/NY |
U.S.$ | 7,155 | 7,149,467 | |||||||||
|
|
|
|||||||||||
| Shares | ||||||||||||
| Investment Companies–0.7% | ||||||||||||
| AB Fixed Income Shares, Inc.—Government Money Market Portfolio—Class AB, 1.41%(k)(l)(m) |
4,606,353 | 4,606,353 | ||||||||||
|
|
|
|||||||||||
| Total Short-Term Investments (cost $65,034,487) |
66,934,964 | |||||||||||
|
|
|
|||||||||||
| Total Investments—108.2% (cost $741,824,631) |
743,071,316 | (n) | ||||||||||
| Other assets less liabilities—(8.2)% |
(56,040,931 | ) | ||||||||||
|
|
|
|||||||||||
| Net Assets—100.0% | $ | 687,030,385 | ||||||||||
|
|
|
|||||||||||
| 22 | Sanford C. Bernstein Fund II, Inc. |
Table of Contents
| FUTURES (see Note 3) | ||||||||||||||||||||||
| Description | Number of Contracts |
Expiration Month |
Notional (000) |
Original Value |
Value at March 31, 2018 |
Unrealized Appreciation/ (Depreciation) |
||||||||||||||||
| Purchased Contracts | ||||||||||||||||||||||
| U.S. T-Note 5 Yr (CBT) Futures |
725 | June 2018 | USD | 72,500 | $ | 82,803,061 | $ | 82,984,180 | $ | 181,119 | ||||||||||||
| U.S. Ultra Bond (CBT) Futures |
328 | June 2018 | USD | 32,800 | 51,084,067 | 52,633,750 | 1,549,683 | |||||||||||||||
| Sold Contracts | ||||||||||||||||||||||
| 10 Yr Mini Japan Government Bond Futures |
96 | June 2018 | JPY | 960,000 | 13,609,597 | 13,604,474 | 5,123 | |||||||||||||||
| Euro-BOBL Futures |
295 | June 2018 | EUR | 29,500 | 47,286,124 | 47,641,474 | (355,350 | ) | ||||||||||||||
| Japan 10 Yr Bond (OSE) Futures |
5 | June 2018 | JPY | 500,000 | 7,081,416 | 7,084,723 | (3,307 | ) | ||||||||||||||
| U.S. T-Note 10 Yr (CBT) Futures |
87 | June 2018 | USD | 8,700 | 10,459,191 | 10,539,234 | (80,043 | ) | ||||||||||||||
| U.S. T-Note 2 Yr (CBT) Futures |
101 | June 2018 | USD | 20,200 | 21,468,058 | 21,473,547 | (5,489 | ) | ||||||||||||||
|
|
|
|||||||||||||||||||||
| $ | 1,291,736 | |||||||||||||||||||||
|
|
|
|||||||||||||||||||||
| FORWARD CURRENCY EXCHANGE CONTRACTS (see Note 3) | ||||||||||||||||||||
| Counterparty | Contracts to Deliver (000) |
In Exchange For (000) |
Settlement Date |
Unrealized Appreciation/ (Depreciation) |
||||||||||||||||
| Australia and New Zealand Banking Group Ltd. |
NZD | 2,193 | USD | 1,585 | 6/07/18 | $ | 805 | |||||||||||||
| Barclays Bank PLC |
BRL | 2,088 | USD | 628 | 4/03/18 | (4,253 | ) | |||||||||||||
| Barclays Bank PLC |
USD | 632 | BRL | 2,088 | 4/03/18 | 297 | ||||||||||||||
| Barclays Bank PLC |
USD | 2,127 | RUB | 121,720 | 4/17/18 | (6,766 | ) | |||||||||||||
| Barclays Bank PLC |
BRL | 2,088 | USD | 630 | 5/03/18 | (543 | ) | |||||||||||||
| BNP Paribas SA |
GBP | 1,666 | USD | 2,372 | 4/13/18 | 32,979 | ||||||||||||||
| Citibank, NA |
JPY | 5,953,712 | USD | 56,114 | 4/16/18 | 118,466 | ||||||||||||||
| Citibank, NA |
JPY | 680,687 | USD | 6,429 | 4/26/18 | 23,083 | ||||||||||||||
| Citibank, NA |
USD | 1,904 | JPY | 206,430 | 4/26/18 | 38,551 | ||||||||||||||
| Citibank, NA |
USD | 2,164 | KRW | 2,314,044 | 4/26/18 | 15,350 | ||||||||||||||
| Citibank, NA |
USD | 2,920 | TWD | 84,334 | 6/07/18 | (3,494 | ) | |||||||||||||
| Credit Suisse International |
AUD | 3,513 | CAD | 3,489 | 6/07/18 | 13,016 | ||||||||||||||
| Goldman Sachs Bank USA |
USD | 2,753 | MYR | 10,800 | 7/12/18 | 39,638 | ||||||||||||||
| HSBC Bank USA |
BRL | 2,088 | USD | 643 | 4/03/18 | 10,202 | ||||||||||||||
| HSBC Bank USA |
USD | 628 | BRL | 2,088 | 4/03/18 | 4,253 | ||||||||||||||
| HSBC Bank USA |
CAD | 2,942 | USD | 2,371 | 4/12/18 | 86,947 | ||||||||||||||
| HSBC Bank USA |
USD | 1,418 | MXN | 26,673 | 4/20/18 | 45,798 | ||||||||||||||
| HSBC Bank USA |
JPY | 1,289,875 | USD | 11,854 | 4/26/18 | (284,160 | ) | |||||||||||||
| HSBC Bank USA |
USD | 1,742 | AUD | 2,214 | 6/07/18 | (41,422 | ) | |||||||||||||
| JPMorgan Chase Bank, NA |
CAD | 2,224 | USD | 1,723 | 4/12/18 | (3,484 | ) | |||||||||||||
| JPMorgan Chase Bank, NA |
GBP | 1,461 | USD | 2,080 | 4/13/18 | 30,287 | ||||||||||||||
| JPMorgan Chase Bank, NA |
SGD | 4,815 | USD | 3,649 | 5/17/18 | (26,634 | ) | |||||||||||||
| JPMorgan Chase Bank, NA |
EUR | 4,667 | USD | 5,793 | 5/30/18 | 27,937 | ||||||||||||||
| JPMorgan Chase Bank, NA |
AUD | 2,499 | USD | 1,933 | 6/07/18 | 14,040 | ||||||||||||||
| JPMorgan Chase Bank, NA |
TWD | 162,670 | USD | 5,603 | 6/07/18 | (22,495 | ) | |||||||||||||
| Morgan Stanley & Co., Inc. |
GBP | 2,303 | USD | 3,235 | 4/13/18 | 3,247 | ||||||||||||||
| Royal Bank of Scotland PLC |
CAD | 2,196 | USD | 1,712 | 4/12/18 | 7,556 | ||||||||||||||
| Royal Bank of Scotland PLC |
MXN | 26,264 | USD | 1,382 | 4/20/18 | (58,824 | ) | |||||||||||||
| Royal Bank of Scotland PLC |
USD | 10,570 | JPY | 1,158,904 | 4/26/18 | 335,100 | ||||||||||||||
| Standard Chartered Bank |
USD | 2,999 | GBP | 2,163 | 4/13/18 | 35,955 | ||||||||||||||
| 2018 Semi-Annual Report | 23 |
Table of Contents
Schedule of Investments (continued)
| Counterparty | Contracts to Deliver (000) |
In Exchange For (000) |
Settlement Date |
Unrealized Appreciation/ (Depreciation) |
||||||||||||||||
| Standard Chartered Bank |
USD | 1,396 | INR | 91,588 | 5/17/18 | $ | 4,426 | |||||||||||||
| State Street Bank & Trust Co. |
GBP | 125 | USD | 173 | 4/13/18 | (3,022 | ) | |||||||||||||
| State Street Bank & Trust Co. |
USD | 8 | EUR | 7 | 5/30/18 | 10 | ||||||||||||||
| State Street Bank & Trust Co. |
USD | 24 | EUR | 19 | 5/30/18 | (52 | ) | |||||||||||||
|
|
|
|||||||||||||||||||
| $ | 432,794 | |||||||||||||||||||
|
|
|
|||||||||||||||||||
| CENTRALLY CLEARED INTEREST RATE SWAPS (see Note 3) | ||||||||||||||||||||||||||||||
| Rate Type |
||||||||||||||||||||||||||||||
| Notional |
Termination Date |
Payments made by theFund |
Payments received by the Fund |
Payment Frequency Paid/Received |
Market Value |
Upfront Premiums Paid (Received) |
Unrealized Appreciation/ (Depreciation) |
|||||||||||||||||||||||
| SEK |
52,220 | 3/31/22 | 3 Month STIBOR | 0.341% | |
Quarterly/ Annual |
|
$ 41,886 | $ 24 | $ 41,862 | ||||||||||||||||||||
| NZD |
10,795 | 3/31/22 | 3 Month BKBM | 2.936% | |
Quarterly/ Semi- Annual |
|
208,421 | — | 208,421 | ||||||||||||||||||||
| USD |
10,420 | 9/22/26 | 1.558% | 3 Month LIBOR | |
Semi- Annual/ Quarterly |
977,549 | — | 977,549 | |||||||||||||||||||||
| USD |
1,670 | 11/08/26 | 1.657% | 3 Month LIBOR | |
Semi- Annual/ Quarterly |
135,138 | — | 135,138 | |||||||||||||||||||||
| USD |
1,140 | 4/26/27 | 2.287% | 3 Month LIBOR | |
Semi- Annual/ Quarterly |
39,041 | — | 39,041 | |||||||||||||||||||||
| USD |
3,200 | 3/28/28 | 2.920% | 3 Month LIBOR | |
Semi- Annual/ Quarterly |
(31,485) | — | (31,485) | |||||||||||||||||||||
|
|
|
|
|
|
|
|||||||||||||||||||||||||
| $ 1,370,550 | $ 24 | $ 1,370,526 | ||||||||||||||||||||||||||||
|
|
|
|
|
|
|
|||||||||||||||||||||||||
| CREDIT DEFAULT SWAPS (see Note 3) | ||||||||||||||||||||||||||
| Swap Counterparty & Referenced Obligation |
Fixed Rate (Pay) Receive |
Payment Frequency |
Implied Credit Spread at March 31, 2018 |
Notional Amount (000) |
Market Value |
Upfront Premiums Paid (Received) |
Unrealized Appreciation/ (Depreciation) |
|||||||||||||||||||
| Buy Contracts | ||||||||||||||||||||||||||
| Citibank, NA |
||||||||||||||||||||||||||
| Sprint Communications, Inc., |
(5.00 | )% | Quarterly | 0.71 | % | USD | 850 | $ | (45,574 | ) | $ | (12,707 | ) | $ | (32,867 | ) | ||||||||||
| Sprint Communications, Inc., |
(5.00 | ) | Quarterly | 0.71 | USD | 975 | (52,277 | ) | (15,114 | ) | (37,163 | ) | ||||||||||||||
| Citigroup Global Markets, Inc. |
||||||||||||||||||||||||||
| CDX-CMBX.NA.AAA |
(0.50 | ) | Monthly | 0.47 | USD | 38 | 16 | 483 | (467 | ) | ||||||||||||||||
| Credit Suisse International |
||||||||||||||||||||||||||
| CDX-CMBX.NA.AAA |
(0.50 | ) | Monthly | 0.47 | USD | 33 | 14 | 304 | (290 | ) | ||||||||||||||||
| 24 | Sanford C. Bernstein Fund II, Inc. |
Table of Contents
| Swap Counterparty & Referenced Obligation |
Fixed Rate (Pay) Receive |
Payment Frequency |
Implied Credit Spread at March 31, 2018 |
Notional Amount (000) |
Market Value |
Upfront Premiums Paid (Received) |
Unrealized Appreciation/ (Depreciation) |
|||||||||||||||||||
| CDX-CMBX.NA.AAA |
(0.50 | )% | Monthly | 0.47 | % | USD | 3,590 | $ | 1,496 | $ | 45,335 | $ | (43,839 | ) | ||||||||||||
| Deutsche Bank AG |
||||||||||||||||||||||||||
| CDX-CMBX.NA.AAA |
(0.50 | ) | Monthly | 0.47 | USD | 457 | 190 | 6,222 | (6,032 | ) | ||||||||||||||||
| CDX-CMBX.NA.AAA |
(0.50 | ) | Monthly | 0.47 | USD | 4,392 | 1,830 | 46,914 | (45,084 | ) | ||||||||||||||||
| CDX-CMBX.NA.AAA |
(0.50 | ) | Monthly | 0.47 | USD | 1,319 | 550 | 13,969 | (13,419 | ) | ||||||||||||||||
| Goldman Sachs International |
||||||||||||||||||||||||||
| CDX-CMBX.NA.AAA |
(0.50 | ) | Monthly | 0.47 | USD | 500 | 209 | 6,752 | (6,543 | ) | ||||||||||||||||
| CDX-CMBX.NA.AAA |
(0.50 | ) | Monthly | 0.47 | USD | 287 | 120 | 2,747 | (2,627 | ) | ||||||||||||||||
| Morgan Stanley Capital Services LLC |
||||||||||||||||||||||||||
| CDX-CMBX.NA.AAA |
(0.50 | ) | Monthly | 0.47 | USD | 538 | 225 | 7,072 | (6,847 | ) | ||||||||||||||||
| CDX-CMBX.NA.AAA |
(0.50 | ) | Monthly | 0.47 | USD | 1,077 | 449 | 14,156 | (13,707 | ) | ||||||||||||||||
| Sale Contracts | ||||||||||||||||||||||||||
| Citibank, NA |
||||||||||||||||||||||||||
| CDX-CMBX.NA.BBB- |
3.00 | Monthly | 7.20 | USD | 325 | (47,710 | ) | (45,883 | ) | (1,827 | ) | |||||||||||||||
| Citigroup Global Markets, Inc. |
||||||||||||||||||||||||||
| CDX-CMBX.NA.BBB- |
3.00 | Monthly | 7.20 | USD | 385 | (56,486 | ) | (59,661 | ) | 3,175 | ||||||||||||||||
| CDX-CMBX.NA.BBB- |
3.00 | Monthly | 7.20 | USD | 345 | (50,646 | ) | (47,577 | ) | (3,069 | ) | |||||||||||||||
| CDX-CMBX.NA.BBB- |
3.00 | Monthly | 7.20 | USD | 297 | (43,599 | ) | (47,409 | ) | 3,810 | ||||||||||||||||
| CDX-CMBX.NA.BBB- |
3.00 | Monthly | 7.20 | USD | 58 | (8,514 | ) | (9,714 | ) | 1,200 | ||||||||||||||||
| Credit Suisse International |
||||||||||||||||||||||||||
| CDX-CMBX.NA.BBB- |
3.00 | Monthly | 7.20 | USD | 417 | (61,181 | ) | (64,326 | ) | 3,145 | ||||||||||||||||
| CDX-CMBX.NA.BBB- |
3.00 | Monthly | 7.20 | USD | 914 | (134,175 | ) | (61,481 | ) | (72,694 | ) | |||||||||||||||
| CDX-CMBX.NA.BBB- |
3.00 | Monthly | 7.20 | USD | 1,600 | (234,880 | ) | (115,027 | ) | (119,853 | ) | |||||||||||||||
| CDX-CMBX.NA.BBB- |
3.00 | Monthly | 7.20 | USD | 251 | (36,847 | ) | (21,165 | ) | (15,682 | ) | |||||||||||||||
| CDX-CMBX.NA.BBB- |
3.00 | Monthly | 7.20 | USD | 324 | (47,563 | ) | (27,901 | ) | (19,662 | ) | |||||||||||||||
| CDX-CMBX.NA.BBB- |
3.00 | Monthly | 7.20 | USD | 629 | (92,338 | ) | (62,402 | ) | (29,936 | ) | |||||||||||||||
| CDX-CMBX.NA.BBB- |
3.00 | Monthly | 7.20 | USD | 388 | (56,959 | ) | (24,028 | ) | (32,931 | ) | |||||||||||||||
| CDX-CMBX.NA.BBB- |
3.00 | Monthly | 7.20 | USD | 1,127 | (165,444 | ) | (95,031 | ) | (70,413 | ) | |||||||||||||||
| Deutsche Bank AG |
| |||||||||||||||||||||||||
| CDX-CMBX.NA.A |
2.00 | Monthly | 3.17 | USD | 1,460 | (63,899 | ) | (29,697 | ) | (34,202 | ) | |||||||||||||||
| 2018 Semi-Annual Report | 25 |
Table of Contents
Schedule of Investments (continued)
| Swap Counterparty & Referenced Obligation |
Fixed Rate (Pay) Receive |
Payment Frequency |
Implied Credit Spread at March 31, 2018 |
Notional Amount (000) |
Market Value |
Upfront Premiums Paid (Received) |
Unrealized Appreciation/ (Depreciation) |
|||||||||||||||||||
| CDX-CMBX.NA.BBB- |
3.00 | % | Monthly | 7.20 | % | USD | 278 | $ | (40,810 | ) | $ | (36,425 | ) | $ | (4,385 | ) | ||||||||||
| CDX-CMBX.NA.BBB- |
3.00 | Monthly | 7.20 | USD | 610 | (89,548 | ) | (72,552 | ) | (16,996 | ) | |||||||||||||||
| CDX-CMBX.NA.BBB- |
3.00 | Monthly | 7.20 | USD | 610 | (89,548 | ) | (72,524 | ) | (17,024 | ) | |||||||||||||||
| CDX-CMBX.NA.BBB- |
3.00 | Monthly | 7.20 | USD | 457 | (67,088 | ) | (51,193 | ) | (15,895 | ) | |||||||||||||||
| CDX-CMBX.NA.BBB- |
3.00 | Monthly | 7.20 | USD | 896 | (131,533 | ) | (76,633 | ) | (54,900 | ) | |||||||||||||||
| CDX-CMBX.NA.BBB- |
3.00 | Monthly | 7.20 | USD | 45 | (6,606 | ) | (5,485 | ) | (1,121 | ) | |||||||||||||||
| Goldman Sachs International |
| |||||||||||||||||||||||||
| CDX-CMBX.NA.BBB- |
3.00 | Monthly | 7.20 | USD | 28 | (4,108 | ) | (4,422 | ) | 314 | ||||||||||||||||
| CDX-CMBX.NA.BBB- |
3.00 | Monthly | 7.20 | USD | 950 | (139,460 | ) | (75,517 | ) | (63,943 | ) | |||||||||||||||
| CDX-CMBX.NA.BBB- |
3.00 | Monthly | 7.20 | USD | 446 | (65,473 | ) | (63,115 | ) | (2,358 | ) | |||||||||||||||
| CDX-CMBX.NA.BBB- |
3.00 | Monthly | 7.20 | USD | 984 | (144,451 | ) | (117,811 | ) | (26,640 | ) | |||||||||||||||
| CDX-CMBX.NA.BBB- |
3.00 | Monthly | 7.20 | USD | 306 | (44,921 | ) | (33,899 | ) | (11,022 | ) | |||||||||||||||
| CDX-CMBX.NA.BBB- |
3.00 | Monthly | 7.20 | USD | 322 | (47,270 | ) | (54,724 | ) | 7,454 | ||||||||||||||||
| CDX-CMBX.NA.BBB- |
3.00 | Monthly | 7.20 | USD | 448 | (65,767 | ) | (77,234 | ) | 11,467 | ||||||||||||||||
| CDX-CMBX.NA.BBB- |
3.00 | Monthly | 7.20 | USD | 325 | (47,710 | ) | (51,948 | ) | 4,238 | ||||||||||||||||
| CDX-CMBX.NA.BBB- |
3.00 | Monthly | 7.20 | USD | 268 | (39,342 | ) | (24,080 | ) | (15,262 | ) | |||||||||||||||
| CDX-CMBX.NA.BBB- |
3.00 | Monthly | 7.20 | USD | 22 | (3,230 | ) | (2,050 | ) | (1,180 | ) | |||||||||||||||
| CDX-CMBX.NA.BBB- |
3.00 | Monthly | 7.20 | USD | 45 | (6,606 | ) | (4,271 | ) | (2,335 | ) | |||||||||||||||
| CDX-CMBX.NA.BBB- |
3.00 | Monthly | 7.20 | USD | 45 | (6,606 | ) | (4,622 | ) | (1,984 | ) | |||||||||||||||
| CDX-CMBX.NA.BBB- |
3.00 | Monthly | 7.20 | USD | 89 | (13,066 | ) | (9,991 | ) | (3,075 | ) | |||||||||||||||
| Morgan Stanley Capital Services LLC |
||||||||||||||||||||||||||
| CDX-CMBX.NA.BBB- |
3.00 | Monthly | 7.20 | USD | 369 | (54,169 | ) | (27,056 | ) | (27,113 | ) | |||||||||||||||
| CDX-CMBX.NA.BBB- |
3.00 | Monthly | 7.20 | USD | 1,200 | (176,160 | ) | (166,211 | ) | (9,949 | ) | |||||||||||||||
|
|
|
|
|
|
|
|||||||||||||||||||||
| $ | (2,476,465) | $ | (1,626,932) | $ | (849,533) | |||||||||||||||||||||
|
|
|
|
|
|
|
|||||||||||||||||||||
* Termination date
| 26 | Sanford C. Bernstein Fund II, Inc. |
Table of Contents
| VARIANCE SWAPS (see Note 3) | ||||||||||||||||||||||
| Swap Counterparty & |
Volatility Strike Price |
Payment Frequency |
Notional Amount (000) |
Market Value |
Upfront Premiums (Paid) Received |
Unrealized Appreciation/ (Depreciation) |
||||||||||||||||
| Buy Contracts | ||||||||||||||||||||||
| Deutsche Bank AG |
||||||||||||||||||||||
| AUD/JPY 1/14/20* |
11.12 | Maturity | AUD | 90 | $ | 147 | $ | -0- | $ | 147 | ||||||||||||
| AUD/JPY 3/03/20* |
12.75 | Maturity | AUD | 46 | (134 | ) | -0- | (134 | ) | |||||||||||||
| Goldman Sachs Bank USA |
||||||||||||||||||||||
| AUD/JPY 3/10/20* |
12.90 | Maturity | AUD | 21 | (71 | ) | -0- | (71 | ) | |||||||||||||
| AUD/JPY 3/11/20* |
12.80 | Maturity | AUD | 25 | (77 | ) | -0- | (77 | ) | |||||||||||||
|
|
|
|
|
|
|
|||||||||||||||||
| $ | (135) | $ | -0- | $ | (135) | |||||||||||||||||
|
|
|
|
|
|
|
|||||||||||||||||
* Termination date
| (a) | Floating Rate Security. Stated interest/floor/ceiling rate was in effect at March 31, 2018. |
| (b) | Security is exempt from registration under Rule 144A of the Securities Act of 1933. These securities are considered restricted, but liquid and may be resold in transactions exempt from registration, normally to qualified institutional buyers. At March 31, 2018, the aggregate market value of these securities amounted to $108,182,879 or 15.7% of net assets. |
| (c) | Securities are perpetual and, thus, do not have a predetermined maturity date. The date shown, if applicable, reflects the next call date. |
| (d) | Coupon rate adjusts periodically based upon a predetermined schedule. Stated interest rate in effect at March 31, 2018. |
| (e) | Position, or a portion thereof, has been segregated to collateralize OTC derivatives outstanding. |
| (f) | Security in which significant unobservable inputs (Level 3) were used in determining fair value. |
| (g) | IO—Interest Only. |
| (h) | Security is exempt from registration under Rule 144A of the Securities Act of 1933. These securities, which represent 0.31% of net assets as of March 31, 2018, are considered illiquid and restricted. Additional information regarding such securities follows: |
| 144A/Restricted & Illiquid Securities | Acquisition Date |
Cost | Market Value |
Percentage of Net Assets |
||||||||||
| Bellemeade Re II Ltd. |
3/26/18 | $ 308,356 | $ | 314,077 | 0.05 | % | ||||||||
| H/2 Asset Funding NRE |
3/24/18 | 464,935 | 464,935 | 0.07 | % | |||||||||
| JP Morgan Madison Avenue Securities Trust |
3/26/18 | 206,606 | 227,311 | 0.03 | % | |||||||||
| Wells Fargo Credit Risk Transfer Securities Trust |
3/26/18 | 729,500 | 821,243 | 0.12 | % | |||||||||
| Wells Fargo Credit Risk Transfer Securities Trust |
3/26/18 | 205,137 | 241,472 | 0.04 | % | |||||||||
| (i) | Inverse interest only security. |
| (j) | Restricted and illiquid security. |
| Restricted & Illiquid Securities | Acquisition Date |
Cost | Market Value |
Percentage of Net Assets |
||||||||||
| Mt. Logan Re Ltd. (Preference Shares) |
12/30/16 | $ 521,000 | $ | 524,380 | 0.08 | % | ||||||||
| (k) | Affiliated investments. |
| (l) | To obtain a copy of the fund’s shareholder report, please go to the Securities and Exchange Commission’s website at www.sec.gov, or call AB at (800) 227-4618. |
| (m) | The rate shown represents the 7-day yield as of period end. |
| (n) | On March 30, 2018, the Portfolio and U.S. stock exchanges were closed for business due to a U.S. holiday but the foreign markets remained open for trading. The Fund valued its foreign securities using the closing market prices from the respective foreign markets as of March 29, 2018 for financial reporting purposes. |
| 2018 Semi-Annual Report | 27 |
Table of Contents
Schedule of Investments (continued)
Currency Abbreviations:
ARS—Argentine Peso
AUD—Australian Dollar
BRL—Brazilian Real
CAD—Canadian Dollar
EUR—Euro
GBP—Great British Pound
INR—Indian Rupee
JPY—Japanese Yen
KRW—South Korean Won
MXN—Mexican Peso
MYR—Malaysian Ringgit
NZD—New Zealand Dollar
RUB—Russian Ruble
SEK—Swedish Krona
SGD—Singapore Dollar
TWD—New Taiwan Dollar
USD—United States Dollar
Glossary:
ABS—Asset-Backed Securities
ARMs—Adjustable Rate Mortgages
ARPP7DRR—Argentina Central Bank 7-Day Repo Reference Rate
BA—Banker’s Acceptance
BKBM—Bank Bill Benchmark (New Zealand)
BOBL—Bundesobligationen
CBT—Chicago Board of Trade
CDX-CMBX.NA—North American Commercial Mortgage-Backed Index
CMBS—Commercial Mortgage-Backed Securities
EURIBOR—Euro Interbank Offered Rate
LIBOR—London Interbank Offered Rates
OSE—Osaka Securities Exchange
REIT—Real Estate Investment Trust
REMICs—Real Estate Mortgage Investment Conduits
STIBOR—Stockholm Interbank Offered Rate
TBA—To Be Announced
TIPS—Treasury Inflation Protected Security
See notes to financial statements.
| 28 | Sanford C. Bernstein Fund II, Inc. |
Table of Contents
Statement of Assets and Liabilities—March 31, 2018 (Unaudited)
| INTERMEDIATE DURATION INSTITUTIONAL |
||||
| ASSETS | ||||
| Investments in securities, at value |
||||
| Unaffiliated issuers (cost $737,218,278) |
$ | 738,464,963 | ||
| Affiliated issuers (cost $4,606,353) |
4,606,353 | |||
| Foreign currencies, at value (cost $312,602) |
268,964 | |||
| Cash |
7,283 | |||
| Cash collateral due from broker |
2,300,323 | |||
| Receivables: |
||||
| Unaffiliated interest and dividends |
3,260,668 | |||
| Affiliated dividends |
3,924 | |||
| Investment securities sold |
42,235 | |||
| Variation margin on futures |
321,746 | |||
| Variation margin on centrally cleared swaps |
74,689 | |||
| Terminated centrally cleared interest rate swaps |
7,115 | |||
| Newly entered interest rate swaps |
11,953 | |||
| Unrealized appreciation of forward currency exchange contracts |
887,943 | |||
| Unrealized appreciation of credit default swaps |
34,803 | |||
| Unrealized appreciation on variance swaps |
147 | |||
| Upfront premiums paid on credit default swaps |
143,954 | |||
|
|
|
|||
| Total assets |
750,437,063 | |||
|
|
|
|||
| LIABILITIES | ||||
| Payables: |
| |||
| Dividends to shareholders |
579,694 | |||
| Investment securities purchased |
58,741,699 | |||
| Capital shares redeemed |
636,022 | |||
| Advisory fee |
223,668 | |||
| Administrative fee |
13,636 | |||
| Transfer Agent fee |
3,013 | |||
| Terminated centrally cleared interest rate swaps |
13,223 | |||
| Accrued expenses |
85,070 | |||
| Unrealized depreciation of credit default swaps |
884,336 | |||
| Unrealized depreciation of forward currency exchange contracts |
455,149 | |||
| Unrealized depreciation on variance swaps |
282 | |||
| Upfront premiums received on credit default swaps |
1,770,886 | |||
|
|
|
|||
| Total liabilities |
63,406,678 | |||
|
|
|
|||
| NET ASSETS |
$ | 687,030,385 | ||
|
|
|
|||
| SHARES OF CAPITAL STOCK OUTSTANDING |
46,455,725 | |||
|
|
|
|||
| NET ASSET VALUE, OFFERING AND REDEMPTION PRICE PER SHARE |
$ | 14.79 | ||
|
|
|
|||
| NET ASSETS CONSIST OF: | ||||
| Capital stock, at par* |
$ | 46,456 | ||
| Additional paid-in capital |
695,967,468 | |||
| Distributions in excess of net investment income |
(599,383 | ) | ||
| Accumulated net realized loss on investment and foreign currency transactions |
(11,876,536 | ) | ||
| Net unrealized appreciation/depreciation of: |
| |||
| Investments, futures and swap transactions |
3,059,279 | |||
| Foreign currency denominated assets and liabilities |
433,101 | |||
|
|
|
|||
| $ | 687,030,385 | |||
|
|
|
|||
* The Sanford C. Bernstein Fund II, Inc., has authorized 18 billion shares of common stock with par value of $.001 per share.
See Notes to Financial Statements.
| 2018 Semi-Annual Report | 29 |
Table of Contents
Statement of Operations—six months ended March 31, 2018 (Unaudited)
| INTERMEDIATE DURATION INSTITUTIONAL PORTFOLIO |
||||
| INVESTMENT INCOME | ||||
| Income: |
||||
| Interest |
$ | 9,191,606 | ||
| Dividends |
||||
| Unaffiliated issuers |
22,808 | |||
| Affiliated issuers |
45,322 | |||
| Other income |
683 | |||
|
|
|
|||
| Total income |
9,260,419 | |||
|
|
|
|||
| Expenses: |
||||
| Advisory fee (see Note 2A) |
1,688,453 | |||
| Custodian fee |
115,553 | |||
| Transfer Agent fee |
9,143 | |||
| Auditing and tax fees |
48,474 | |||
| Administrative |
28,805 | |||
| Registration fees |
16,344 | |||
| Legal fees |
14,425 | |||
| Directors’ fees and expenses |
14,198 | |||
| Printing fees |
13,888 | |||
| Miscellaneous |
20,618 | |||
|
|
|
|||
| Total expenses |
1,969,901 | |||
| Less: expenses waived and reimbursed by the Adviser (see Note 2A and 2C) |
(402,314 | ) | ||
|
|
|
|||
| Net expenses |
1,567,587 | |||
|
|
|
|||
| Net investment income |
7,692,832 | |||
|
|
|
|||
| REALIZED AND UNREALIZED GAIN (LOSS) ON INVESTMENT AND FOREIGN CURRENCY TRANSACTIONS | ||||
| Net realized gain (loss) on: |
||||
| Investment transactions |
(3,422,273 | ) | ||
| Forward currency exchange contracts |
(988,828 | ) | ||
| Futures |
(4,244,168 | ) | ||
| Swaps |
719,105 | |||
| Foreign currency transactions |
(1,687,522 | ) | ||
|
|
|
|||
| Net realized loss on investment and foreign currency transactions |
(9,623,686 | ) | ||
|
|
|
|||
| Net change in unrealized appreciation/depreciation of: |
||||
| Investments |
(6,759,685 | ) | ||
| Forward currency exchange contracts |
96,859 | |||
| Futures |
2,038,633 | |||
| Swaps |
652,901 | |||
| Foreign currency denominated assets and liabilities and other assets |
14,597 | |||
|
|
|
|||
| Net change in unrealized appreciation/depreciation of investments and foreign currency denominated assets and liabilities |
(3,956,695 | ) | ||
|
|
|
|||
| Net realized and unrealized loss on investment and foreign currency transactions |
(13,580,381 | ) | ||
|
|
|
|||
| Net decrease in net assets resulting from operations |
$ | (5,887,549 | ) | |
|
|
|
|||
See Notes to Financial Statements.
| 30 | Sanford C. Bernstein Fund II, Inc. |
Table of Contents
Statement of Changes in Net Assets
| INTERMEDIATE DURATION INSTITUTIONAL PORTFOLIO |
||||||||
| SIX
MONTHS ENDED 3/31/18 (UNAUDITED) |
YEAR ENDED 9/30/17 |
|||||||
| INCREASE (DECREASE) IN NET ASSETS FROM | ||||||||
| Operations: |
| |||||||
| Net investment income |
$ | 7,692,832 | $ | 15,541,669 | ||||
| Net realized loss on investment and foreign currency transactions |
(9,623,686 | ) | (1,595,005 | ) | ||||
| Net change in unrealized appreciation/depreciation of investments and foreign currency denominated assets and liabilities and other assets and liabilities |
(3,956,695 | ) | (9,635,189 | ) | ||||
| Contributions from affiliates (see Note 2A) |
0 | 2,527 | ||||||
|
|
|
|
|
|||||
| Net increase (decrease) in net assets resulting from operations |
(5,887,549 | ) | 4,314,002 | |||||
|
|
|
|
|
|||||
| Dividends and distributions to shareholders: |
| |||||||
| Dividends from net investment income |
(8,216,163 | ) | (16,706,088 | ) | ||||
| Distributions from net realized gain on investment transactions |
0 | (7,683,317 | ) | |||||
|
|
|
|
|
|||||
| Total dividends and distributions to shareholders |
(8,216,163 | ) | (24,389,405 | ) | ||||
|
|
|
|
|
|||||
| Capital-share transactions: |
| |||||||
| Net proceeds from sales of shares |
64,655,114 | 201,144,887 | ||||||
| Net proceeds from sales of shares issued to shareholders on reinvestment of dividends and distributions |
7,099,909 | 21,873,323 | ||||||
|
|
|
|
|
|||||
| Total proceeds from shares sold |
71,755,023 | 223,018,210 | ||||||
| Cost of shares redeemed |
(59,900,368 | ) | (148,094,385 | ) | ||||
|
|
|
|
|
|||||
| Net increase in net assets from capital-share transactions |
11,854,655 | 74,923,825 | ||||||
|
|
|
|
|
|||||
| Net increase (decrease) in net assets |
(2,249,057 | ) | 54,848,422 | |||||
| NET ASSETS: | ||||||||
| Beginning of period |
689,279,442 | 634,431,020 | ||||||
|
|
|
|
|
|||||
| End of period (a) |
$ | 687,030,385 | $ | 689,279,442 | ||||
|
|
|
|
|
|||||
| (a) Includes distributions in excess of net investment income of: |
$ | (599,383 | ) | $ | (76,052 | ) | ||
|
|
|
|
|
|||||
See Notes to Financial Statements.
| 2018 Semi-Annual Report | 31 |
Table of Contents
Selected per-share data and ratios for a share of capital stock outstanding for the Portfolio for each of the periods presented:
| INTERMEDIATE DURATION INSTITUTIONAL PORTFOLIO |
||||||||||||||||||||||||
| SIX
MONTHS ENDED 3/31/18 (UNAUDITED) |
YEAR ENDED 9/30/17 |
YEAR ENDED 9/30/16 |
YEAR ENDED 9/30/15 |
YEAR ENDED 9/30/14 |
YEAR ENDED 9/30/13 |
|||||||||||||||||||
| Net asset value, beginning of period |
$ | 15.08 | $ | 15.57 | $ | 15.29 | $ | 15.77 | $ | 15.52 | $ | 16.39 | ||||||||||||
|
|
|
|
|
|
|
|
|
|
|
|
|
|||||||||||||
| Income from investment operations |
| |||||||||||||||||||||||
| Investment income, net†‡ |
0.16 | 0.38 | 0.43 | 0.40 | 0.48 | 0.43 | ||||||||||||||||||
| Net realized and unrealized gain (loss) on investment and foreign currency transactions |
(0.28 | ) | (0.27 | ) | 0.52 | 0.00 | (a) | 0.31 | (0.70 | ) | ||||||||||||||
| Contributions from affiliates |
0 | 0.00 | (a) | 0.00 | 0 | 0 | 0 | |||||||||||||||||
|
|
|
|
|
|
|
|
|
|
|
|
|
|||||||||||||
| Total from investment operations |
(0.12 | ) | 0.11 | 0.95 | 0.40 | 0.79 | (0.27 | ) | ||||||||||||||||
|
|
|
|
|
|
|
|
|
|
|
|
|
|||||||||||||
| Less dividends and distributions: |
| |||||||||||||||||||||||
| Dividends from net investment income |
(0.17 | ) | (0.41 | ) | (0.52 | ) | (0.47 | ) | (0.45 | ) | (0.50 | ) | ||||||||||||
| Dividends from net realized gain on investment transactions |
0 | (0.19 | ) | (0.15 | ) | (0.41 | ) | (0.09 | ) | (0.10 | ) | |||||||||||||
|
|
|
|
|
|
|
|
|
|
|
|
|
|||||||||||||
| Total dividends and distributions |
(0.17 | ) | (0.60 | ) | (0.67 | ) | (0.88 | ) | (0.54 | ) | (0.60 | ) | ||||||||||||
|
|
|
|
|
|
|
|
|
|
|
|
|
|||||||||||||
| Net asset value, end of period |
$ | 14.79 | $ | 15.08 | $ | 15.57 | $ | 15.29 | $ | 15.77 | $ | 15.52 | ||||||||||||
|
|
|
|
|
|
|
|
|
|
|
|
|
|||||||||||||
| Total return (b) |
(0.76)% | 0.78% | 6.42% | 2.60% | 5.21% | (1.67)% | * | |||||||||||||||||
| RATIOS/SUPPLEMENTAL DATA | ||||||||||||||||||||||||
| Net assets, end of period (000 omitted) |
$ | 687,030 | $ | 689,279 | $ | 634,431 | $ | 614,965 | $ | 634,032 | $ | 732,790 | ||||||||||||
| Average net assets (000 omitted) |
$ | 697,599 | $ | 622,162 | $ | 617,969 | $ | 632,506 | $ | 707,180 | $ | 970,083 | ||||||||||||
| Ratio to average net assets of: |
| |||||||||||||||||||||||
| Expenses, net of waivers/reimbursements |
0.45% | ^ | 0.45% | 0.45% | 0.45% | + | 0.45% | 0.45% | ||||||||||||||||
| Expenses, before waiver/reimbursements |
0.56% | ^ | 0.59% | 0.59% | 0.58% | + | 0.58% | 0.55% | ||||||||||||||||
| Net investment income‡ |
2.20% | ^ | 2.50% | 2.79% | 2.61% | + | 3.08% | 2.67% | ||||||||||||||||
| Portfolio turnover rate |
110% | 229% | 146% | 266% | 260% | 193% | ||||||||||||||||||
| † | Based on average shares outstanding. |
| ‡ | Net of fees and expenses waived by the Adviser. |
| * | Includes the impact of proceeds received and credited to the Portfolio resulting from class action settlements, which enhanced the Portfolio’s performance for the year ended September 30, 2013 by .01%. |
| + | The ratio includes expenses attributable to costs of proxy solicitation. |
| ^ | Annualized. |
| (a) | Amount is less than $.005. |
| (b) | Total investment return is calculated assuming an initial investment made at the net asset value at the beginning of the period, reinvestment of all dividends and distributions at net asset value during the period, and redemption on the last day of the period. Total return does not reflect the deduction of taxes that a shareholder would pay on fund distributions or the redemption of fund shares. Total investment return calculated for a period of less than one year is not annualized. |
See Notes to Financial Statements.
| 32 | Sanford C. Bernstein Fund II, Inc. |
Table of Contents
| NOTE 1. | Organization and Significant Accounting Policies |
Sanford C. Bernstein Fund II, Inc. (the “Fund”) is a managed open-end registered investment company incorporated in Maryland on February 7, 2002. The Fund, currently comprises one portfolio, the Intermediate Duration Institutional Portfolio (the “Portfolio”). The financial statements have been prepared in conformity with U.S. generally accepted accounting principles (“U.S. GAAP”) which require management to make certain estimates and assumptions that affect the reported amounts of assets and liabilities in the financial statements and amounts of income and expenses during the reporting period. Actual results could differ from those estimates. The Portfolio is an investment company under U.S. GAAP and follows the accounting and reporting guidance applicable to investment companies. The following is a summary of significant accounting policies followed by the Portfolio.
| A. | Portfolio Valuation |
Portfolio securities are valued at their current market value determined on the basis of market quotations or, if market quotations are not readily available or are deemed unreliable, at “fair value” as determined in accordance with procedures established by and under the general supervision of the Fund’s Board of Directors (the “Board”).
In general, the market values of securities which are readily available and deemed reliable are determined as follows: securities listed on a national securities exchange (other than securities listed on the NASDAQ Stock Market, Inc. (“NASDAQ”)) or on a foreign securities exchange are valued at the last sale price at the close of the exchange or foreign securities exchange. If there has been no sale on such day, the securities are valued at the last traded price from the previous day. Securities listed on more than one exchange are valued by reference to the principal exchange on which the securities are traded; securities listed only on NASDAQ are valued in accordance with the NASDAQ Official Closing Price; listed or over the counter (“OTC”) market put or call options are valued at the mid level between the current bid and ask prices. If either a current bid or current ask price is unavailable, AllianceBernstein L.P. (the “Adviser”) will have discretion to determine the best valuation (e.g., last trade price in the case of listed options); open futures are valued using the closing settlement price or, in the absence of such a price, the most recent quoted bid price. If there are no quotations available for the day of valuation, the last available closing settlement price is used; U.S. Government securities and any other debt instruments having 60 days or less remaining until maturity are generally valued at market by an independent pricing vendor, if a market price is available. If a market price is not available, the securities are valued at amortized cost. This methodology is commonly used for short term securities that have an original maturity of 60 days or less, as well as short term securities that had an original term to maturity that exceeded 60 days. In instances when amortized cost is utilized, the Valuation Committee (the “Committee”) must reasonably conclude that the utilization of amortized cost is approximately the same as the fair value of the security. Such factors the Committee will consider include, but are not limited to, an impairment of the creditworthiness of the issuer or material changes in interest rates. Fixed-income securities, including mortgage-backed and asset-backed securities, may be valued on the basis of prices provided by a pricing service or at a price obtained from one or more of the major broker-dealers. In cases where broker-dealer quotes are obtained, the Adviser may establish procedures whereby changes in market yields or spreads are used to adjust, on a daily basis, a recently obtained quoted price on a security. Swaps and other derivatives are valued daily, primarily using independent pricing services, independent pricing models using market inputs, as well as third party broker-dealers or counterparties. Open end mutual funds are valued at the closing net asset value per share, while exchange traded funds are valued at the closing market price per share.
Securities for which market quotations are not readily available (including restricted securities) or are deemed unreliable are valued at fair value as deemed appropriate by the Adviser. Factors considered in making this determination may include, but are not limited to, information obtained by contacting the issuer, analysts, analysis of the issuer’s financial statements or other available documents. In addition, the Portfolio may use fair value pricing for securities primarily traded in non-U.S. markets because most foreign markets close well before the Portfolio values its securities at 4:00 p.m., Eastern Time. The earlier close of these foreign markets gives rise to the possibility that significant events, including broad market moves, may have occurred in the interim and may materially affect the value of those securities. To account for this, the Portfolio generally values many of its foreign equity securities using fair value prices based on third party vendor modeling tools to the extent available.
| B. | Fair Value Measurements |
In accordance with U.S. GAAP regarding fair value measurements, fair value is defined as the price that the Portfolio would receive to sell an asset or pay to transfer a liability in an orderly transaction between market participants at the
| 2018 Semi-Annual Report | 33 |
Table of Contents
Notes to Financial Statements (continued)
measurement date. U.S. GAAP establishes a framework for measuring fair value, and a three-level hierarchy for fair value measurements based upon the transparency of inputs to the valuation of an asset or liability (including those based on their market values as described in Note 1.A above). Inputs may be observable or unobservable and refer broadly to the assumptions that market participants would use in pricing the asset or liability. Observable inputs reflect the assumptions market participants would use in pricing the asset or liability based on market data obtained from sources independent of the Portfolio. Unobservable inputs reflect the Portfolio’s own assumptions about the assumptions that market participants would use in pricing the asset or liability based on the best information available in the circumstances. Each investment is assigned a level based upon the observability of the inputs which are significant to the overall valuation. The three-tier hierarchy of inputs is summarized below.
| • | Level 1—quoted prices in active markets for identical investments |
| • | Level 2—other significant observable inputs (including quoted prices for similar investments, interest rates, prepayment speeds, credit risk, etc.) |
| • | Level 3—significant unobservable inputs (including the Portfolio’s own assumptions in determining the fair value of investments) |
The fair value of debt instruments, such as bonds, and over-the-counter derivatives is generally based on market price quotations, recently executed market transactions (where observable) or industry recognized modeling techniques and are generally classified as Level 2. Pricing vendor inputs to Level 2 valuations may include quoted prices for similar investments in active markets, interest rate curves, coupon rates, currency rates, yield curves, option adjusted spreads, default rates, credit spreads and other unique security features in order to estimate the relevant cash flows which are then discounted to calculate fair values. If these inputs are unobservable and significant to the fair value, these investments will be classified as Level 3. In addition, non-agency rated investments are classified as Level 3.
Where readily available market prices or relevant bid prices are not available for certain equity investments, such investments may be valued based on similar publicly traded investments, movements in relevant indices since last available prices or based upon underlying company fundamentals and comparable company data (such as multiples to earnings or other multiples to equity). Where an investment is valued using an observable input, such as another publicly traded security, the investment will be classified as Level 2. If management determines that an adjustment is appropriate based on restrictions on resale, illiquidity or uncertainty, and such adjustment is a significant component of the valuation, the investment will be classified as Level 3. An investment will also be classified as Level 3 where management uses company fundamentals and other significant inputs to determine the valuation.
Valuations of mortgage-backed or other asset-backed securities, by pricing vendors, are based on both proprietary and industry recognized models and discounted cash flow techniques. Significant inputs to the valuation of these instruments are: the value of collateral, the rates and timing of delinquencies, the rates and timing of prepayments, and default and loss expectations, which are driven in part by housing prices for residential mortgages. Significant inputs are determined based on relative value analyses, which incorporate comparisons to instruments with similar collateral and risk profiles, including relevant indices. Mortgage and asset-backed securities for which management has collected current observable data through pricing services are generally categorized within Level 2. Those investments for which current observable data has not been provided are classified as Level 3.
Other fixed income investments, including non-U.S. government and corporate debt, are generally valued using quoted market prices, if available, which are typically impacted by current interest rates, maturity dates and any perceived credit risk of the issuer. Additionally, in the absence of quoted market prices, these inputs are used by pricing vendors to derive a valuation based upon industry or proprietary models which incorporate issuer specific data with relevant yield/spread comparisons with more widely quoted bonds with similar key characteristics. Those investments for which there are observable inputs are classified as Level 2. Where the inputs are not observable, the investments are classified as Level 3.
| 34 | Sanford C. Bernstein Fund II, Inc. |
Table of Contents
The following table summarizes the valuation of the Portfolio’s investments by the above fair value hierarchy levels as of March 31, 2018:
| INVESTMENTS IN SECURITIES: | LEVEL 1 | LEVEL 2 | LEVEL 3 | TOTAL | ||||||||||||
| Assets: |
||||||||||||||||
| Mortgage Pass-Throughs |
$ | 0 | $ | 151,346,824 | $ | 0 | $ | 151,346,824 | ||||||||
| Corporates—Investment Grade |
0 | 145,801,904 | 0 | 145,801,904 | ||||||||||||
| Governments—Treasuries |
0 | 118,262,975 | 0 | 118,262,975 | ||||||||||||
| Asset-Backed Securities |
0 | 52,609,105 | 12,603,719 | 65,212,824 | ||||||||||||
| Commercial Mortgage-Backed Securities |
0 | 47,691,285 | 11,740,638 | 59,431,923 | ||||||||||||
| Collateralized Mortgage Obligations |
0 | 42,993,405 | 301,331 | 43,294,736 | ||||||||||||
| Inflation-Linked Securities |
0 | 32,900,518 | 0 | 32,900,518 | ||||||||||||
| Corporates—Non-Investment Grade |
0 | 24,606,267 | 0 | 24,606,267 | ||||||||||||
| Agencies |
0 | 16,268,846 | 0 | 16,268,846 | ||||||||||||
| Emerging Markets—Corporate Bonds |
0 | 7,642,545 | 0 | 7,642,545 | ||||||||||||
| Emerging Markets—Treasuries |
0 | 5,916,810 | 0 | 5,916,810 | ||||||||||||
| Local Governments—US Municipal Bonds |
0 | 3,106,573 | 0 | 3,106,573 | ||||||||||||
| Governments—Sovereign Bonds |
0 | 946,141 | 0 | 946,141 | ||||||||||||
| Common Stocks |
0 | 0 | 524,380 | 524,380 | ||||||||||||
| Quasi-Sovereigns |
0 | 453,405 | 0 | 453,405 | ||||||||||||
| Emerging Markets—Sovereigns |
0 | 419,681 | 0 | 419,681 | ||||||||||||
| Short-Term Investments: |
||||||||||||||||
| Governments—Treasuries |
0 | 55,179,144 | 0 | 55,179,144 | ||||||||||||
| Commercial Paper |
0 | 7,149,467 | 0 | 7,149,467 | ||||||||||||
| Investment Companies |
4,606,353 | 0 | 0 | 4,606,353 | ||||||||||||
| Total Investments in Securities |
4,606,353 | 713,294,895 | 25,170,068 | 743,071,316 | ||||||||||||
| Other Financial Instruments(a): |
||||||||||||||||
| Assets: |
||||||||||||||||
| Futures |
1,735,925 | 0 | 0 | 1,735,925 | (b) | |||||||||||
| Forward Currency Exchange Contracts |
0 | 887,943 | 0 | 887,943 | ||||||||||||
| Centrally Cleared Interest Rate Swaps |
0 | 1,402,035 | 0 | 1,402,035 | (b) | |||||||||||
| Credit Default Swaps |
0 | 5,099 | 0 | 5,099 | ||||||||||||
| Variance Swaps |
0 | 147 | 0 | 147 | ||||||||||||
| Liabilities: |
||||||||||||||||
| Futures |
(444,189 | ) | 0 | 0 | (444,189 | )(b) | ||||||||||
| Forward Currency Exchange Contracts |
0 | (455,149 | ) | 0 | (455,149 | ) | ||||||||||
| Centrally Cleared Interest Rate Swaps |
0 | (31,485 | ) | 0 | (31,485 | )(b) | ||||||||||
| Credit Default Swaps |
0 | (2,481,564 | ) | 0 | (2,481,564 | ) | ||||||||||
| Variance Swaps |
0 | (282 | ) | 0 | (282 | ) | ||||||||||
| Total(c) |
$ | 5,898,089 | $ | 712,621,639 | $ | 25,170,068 | $ | 743,689,796 | ||||||||
| (a) | Other financial instruments are derivative instruments, such as futures, forwards and swaps, which are valued at the unrealized appreciation/(depreciation) on the instrument. Other financial instruments may also include swaps with upfront premiums and options written and swaptions written which are valued at market value. |
| (b) | Only variation margin receivable/(payable) at period end is reported within the statement of assets and liabilities. This amount reflects cumulative unrealized appreciation/(depreciation) on futures and centrally cleared swaps as reported in the schedule of investments. Centrally cleared swaps with upfront premiums are presented here at market value. |
| (c) | There were no transfers between Level 1 and Level 2 during the reporting period. |
| 2018 Semi-Annual Report | 35 |
Table of Contents
Notes to Financial Statements (continued)
The Portfolio recognizes all transfers between levels of the fair value hierarchy assuming the financial instruments were transferred at the beginning of the reporting period.
The following is a reconciliation of investments in which significant unobservable inputs (Level 3) were used in determining fair value.
| ASSET- BACKED SECURITIES |
COMMERCIAL MORTGAGE- BACKED SECURITIES |
COLLATERALIZED MORTGAGE OBLIGATIONS |
||||||||||
| Balance as of 9/30/17 |
$ | 9,189,972 | $ | 8,766,047 | $ | 300,892 | ||||||
| Accrued discounts/(premiums) |
530 | 2,683 | 0 | |||||||||
| Realized gain (loss) |
1,170 | (138,480 | ) | 0 | ||||||||
| Change in unrealized appreciation/depreciation |
(107,336 | ) | 9,495 | 439 | ||||||||
| Purchases/Payups |
5,710,686 | 4,597,871 | 0 | |||||||||
| Sales/Paydowns |
(2,191,303 | ) | (1,373,971 | ) | 0 | |||||||
| Transfers in to Level 3 |
0 | 0 | 0 | |||||||||
| Transfers out of Level 3 |
0 | (123,007 | ) | 0 | ||||||||
|
|
|
|
|
|
|
|||||||
| Balance as of 3/31/18 |
$ | 12,603,719 | $ | 11,740,638 | $ | 301,331 | ||||||
|
|
|
|
|
|
|
|||||||
| Net change in unrealized appreciation/depreciation from investments held as of 3/31/18 |
$ | (107,336 | ) | $ | (48,373 | ) | $ | 439 | ||||
| COMMON STOCKS |
TOTAL | |||||||||||
| Balance as of 9/30/17 |
$ | 540,659 | $ | 18,797,570 | ||||||||
| Accrued discounts/(premiums) |
0 | 3,213 | ||||||||||
| Realized gain (loss) |
0 | (137,310 | ) | |||||||||
| Change in unrealized appreciation/depreciation |
(16,279 | ) | (113,681 | ) | ||||||||
| Purchases/Payups |
0 | 10,308,557 | ||||||||||
| Sales/Paydowns |
0 | (3,565,274 | ) | |||||||||
| Transfers in to Level 3 |
0 | 0 | ||||||||||
| Transfers out of Level 3 |
0 | (123,007 | )(b) | |||||||||
|
|
|
|
|
|||||||||
| Balance as of 3/31/18 |
$ | 524,380 | $ | 25,170,068 | ||||||||
|
|
|
|
|
|||||||||
| Net change in unrealized appreciation/depreciation from investments held as of 3/31/18(a) |
$ | (16,279 | ) | $ | (171,549 | ) | ||||||
| (a) | The unrealized appreciation/depreciation is included in net change in unrealized appreciation/depreciation on investments and other financial instruments in the accompanying statement of operations. |
| (b) | There were de minimis transfers under 1% of net assets during the reporting period. |
The following presents information about significant unobservable inputs related to the Portfolio’s Level 3 investments at March 31, 2018. Securities priced by third party vendors and by brokers, which approximates fair value, are excluded from the following table:
| QUANTITATIVE INFORMATION ABOUT LEVEL 3 FAIR VALUE MEASUREMENTS | ||||||||||||||||
| FAIR VALUE AT 3/31/18 |
VALUATION TECHNIQUE |
UNOBSERVABLE INPUT |
INPUT | |||||||||||||
| Common Stocks | $ | 524,380 | Market Approach | NAV Equivalent | $1,006.49/N/A | |||||||||||
Generally, a change in the assumptions used in any input in isolation may be accompanied by a change in another input. Significant changes in any of the unobservable inputs may significantly impact the fair value measurement. Significant increases (decreases) in NAV equivalent in isolation would be expected to result in a significantly higher (lower) fair value measurement.
| 36 | Sanford C. Bernstein Fund II, Inc. |
Table of Contents
The Adviser established the Committee to oversee the pricing and valuation of all securities held in the Portfolio. The Committee operates under pricing and valuation policies and procedures established by the Adviser and approved by the Board, including pricing policies which set forth the mechanisms and processes to be employed on a daily basis to implement these policies and procedures. In particular, the pricing policies describe how to determine market quotations for securities and other instruments. The Committee’s responsibilities include: 1) fair value and liquidity determinations (and oversight of any third parties to whom any responsibility for fair value and liquidity determinations is delegated), and 2) regular monitoring of the Adviser’s pricing and valuation policies and procedures and modification or enhancement of these policies and procedures (or recommendation of the modification of these policies and procedures) as the Committee believes appropriate.
The Committee is also responsible for monitoring the implementation of the pricing policies by the Adviser’s Pricing Group (the “Pricing Group”) and any third party which performs certain pricing functions in accordance with the pricing policies. The Pricing Group is responsible for the oversight of the third party on a day-to-day basis. The Committee and the Pricing Group perform a series of activities to provide reasonable assurance of the accuracy of prices including: 1) periodic vendor due diligence meetings, review of methodologies, new developments and processes at vendors, 2) daily comparison of security valuation versus prior day for all securities that exceeded established thresholds, and 3) daily review of unpriced, stale, and variance reports with exceptions reviewed by senior management and the Committee.
In addition, several processes outside of the pricing process are used to monitor valuation issues including: 1) performance and performance attribution reports are monitored for anomalous impacts based upon benchmark performance, and 2) portfolio managers review all portfolios for performance and analytics (which are generated using the Adviser’s prices).
| C. | Foreign Currency Translation |
The accounting records of the Portfolio are maintained in U.S. dollars. Prices of securities and other assets and liabilities denominated in non-U.S. currencies are translated into U.S. dollars using the exchange rate at 4:00 p.m., Eastern Time. Amounts related to the purchases and sales of securities, investment income and expenses are translated at the rates of exchange prevailing on the respective dates of such transactions.
Net realized gain or loss on foreign currency transactions represents net foreign exchange gains or losses from the disposition of foreign currencies, currency gains or losses realized between the trade and settlement dates on security transactions and the difference between the amount of dividends, interest and foreign withholding taxes recorded on the Portfolio’s books and the U.S. dollar equivalent amount actually received or paid. Net unrealized currency gains and losses arising from valuing foreign currency denominated assets and liabilities, other than security investments, at the current exchange rate are reflected as part of unrealized appreciation/depreciation on foreign currencies.
The Portfolio does not isolate that portion of the results of operations arising as a result of changes in the foreign exchange rates from the changes in the market prices of securities held at period end. The Portfolio does isolate the effect of changes in foreign exchange rates from changes in market prices of debt securities sold during the year, as required by the Internal Revenue Code.
The Portfolio may invest in foreign securities and foreign currency transactions that may involve risks not associated with domestic investments as a result of the level of governmental supervision and regulation of foreign securities markets and the possibility of political or economic instability, among others.
| D. | Taxes |
The Portfolio intends to continue to comply with the requirements of Subchapter M of the Internal Revenue Code of 1986 as they apply to regulated investment companies. By so complying, the Portfolio will not be subject to federal and state income taxes to the extent that all of its income is distributed. The Portfolio may be subject to taxes imposed by countries in which it invests. Such taxes are generally based on income and/or capital gains earned or repatriated. Taxes are accrued and applied to net investment income, net realized gains and net unrealized appreciation/depreciation as such income and/or gains are earned based on management’s understanding of applicable local tax law.
| 2018 Semi-Annual Report | 37 |
Table of Contents
Notes to Financial Statements (continued)
In accordance with U.S. GAAP requirements regarding accounting for uncertainties in income taxes, management has analyzed the Portfolio’s tax positions taken or expected to be taken on federal and state income tax returns for all open tax years (the current and the prior three tax years) and has concluded that no provision for income tax is required in the Portfolio’s financial statements.
| E. | Security Transactions and Related Investment Income |
Security transactions are accounted for on the trade date (the date the buy or sell order is executed). Securities gains and losses are calculated on the identified cost basis. Interest income is recorded on the accrual basis and dividend income is recorded on the ex-dividend date or as soon as the Portfolio is informed of the dividend. The Portfolio amortizes premiums and accretes discounts as adjustments to interest income.
| F. | Securities Transactions on a When-Issued or Delayed-Delivery Basis |
The Portfolio may purchase securities on a when-issued basis or purchase or sell securities on a delayed-delivery basis. At the time the Portfolio commits to purchase a security on a when-issued or delayed-delivery basis, the Portfolio will record the transaction and use the security’s value in determining the Portfolio’s net asset value. At the time the Portfolio commits to sell a security on a delayed-delivery basis, the Portfolio will record the transaction and exclude the security’s value in determining the Portfolio’s net asset value.
| G. | Distribution of Income and Gains |
Net investment income of the Portfolio is declared and recorded as a dividend to shareholders daily and is payable to shareholders monthly.
Distributions of net realized gains, less any available loss carryforwards, if any, for the Portfolio will be paid to shareholders at least once a year, and recorded on the ex-dividend date.
Elements of realized gains and net investment income may be recorded in different accounting periods for financial reporting (book) and federal income tax (tax) purposes (temporary differences). To the extent that such distributions required for tax purposes exceed income and gains recorded for book purposes as a result of such temporary differences, “excess distributions” are reflected in the accompanying statement of assets and liabilities. To the extent distributions exceed income and gains for tax purposes, such distributions would be shown as “return of capital” on the statement of changes in net assets. Certain other differences—permanent differences—arise because treatment of elements of income and gains is different between book and tax accounting. Permanent differences are reclassified in the year they arise.
| H. | Repurchase Agreements |
It is the Portfolio’s policy that its custodian or designated subcustodian take control of securities as collateral under repurchase agreements and to determine on a daily basis that the value of such securities are sufficient to cover the value of the repurchase agreements. If the seller defaults and the value of the collateral declines or if bankruptcy proceedings are commenced with respect to the seller of the security, realization of collateral by the Portfolio may be delayed or limited.
| NOTE 2. | Investment Management and Transactions with Affiliated Persons |
| A. | Advisory Fee |
Under the advisory agreement between the Fund and Adviser, the Portfolio pays the Adviser an advisory fee at an annual rate of 0.45% of the first $2.5 billion, 0.40% of the next $2.5 billion, 0.35% of the next $3 billion and 0.30% in excess of $8 billion of the average daily net assets of the Portfolio. Prior to January 29, 2018, the advisory fee was 0.50% of the first $1 billion and 0.45% in excess of $1 billion of the Portfolio’s average daily net assets. Pursuant to an Expense Limitation Agreement, during the reporting period, the Adviser waived a portion of its advisory fee or reimbursed the Portfolio for a portion of its expenses to the extent necessary to limit the Portfolio’s expenses to 0.45% of the Portfolio’s average daily net assets. This waiver extends through January 29, 2019 and may be extended by the Adviser for additional one-year terms. For the six months ended March 31, 2018, the aggregate amount of such fee waiver was $393,820.
| 38 | Sanford C. Bernstein Fund II, Inc. |
Table of Contents
During the year ended September 30, 2017, the Adviser reimbursed the Portfolio $2,527 for trading losses incurred due to trade entry errors.
| B. | Distribution Arrangements |
Under the Distribution Agreement between the Fund, on behalf of the Portfolio, and Sanford C. Bernstein & Co., LLC (the “Distributor”), the Distributor agrees to act as agent to sell shares of the Portfolio. The Distributor receives no fee for this service, and furthermore agrees to pay all expenses arising from the performance of its obligations under this agreement. The Distributor is a wholly owned subsidiary of the Adviser.
| C. | Investments and other transactions with Affiliated Issuers |
The Portfolio may invest in AB Government Money Market Portfolio (the “Government Money Market Portfolio”) which has a contractual annual advisory fee rate of .20% of the portfolio’s average daily net assets and bears its own expenses. In connection with the investment by the Portfolio in the Government Money Market Portfolio, the Adviser has contractually agreed to waive its advisory fee from the Portfolio in an amount equal to the Portfolio’s pro rata share of the effective advisory fee of Government Money Market Portfolio, as borne indirectly by the Portfolio as an acquired fund fee and expense. For the six months ended March 31, 2018, such waiver amounted to $8,494. A summary of the Portfolio’s transactions in shares of the Government Money Market Portfolio for the six months ended March 31, 2018 is as follows:
|
MARKET VALUE 9/30/17 (000) |
PURCHASES AT COST (000) |
SALES PROCEEDS (000) |
MARKET VALUE 3/31/18 (000) |
DIVIDEND INCOME (000) |
||||||||||||||||
| $ | 5,582 | $ | 206,560 | $ | 207,536 | $ | 4,606 | $ | 45 | |||||||||||
Brokerage commissions paid on investment transactions for the six months ended March 31, 2018 amounted to $14,249, of which $0 and $0, respectively, was paid to Sanford C. Bernstein & Co., LLC and Sanford C. Bernstein & Co., Ltd., affiliates of the Adviser.
| NOTE 3. | Investment Security Transactions |
| A. | Purchases and Sales |
For the six months ended March 31, 2018, the Portfolio had purchases and sales transactions, excluding transactions in short-term instruments, as follows:
| PURCHASES | SALES | |||||||
| Investment securities (excluding U.S. government securities) |
$ | 93,389,323 | $ | 53,657,357 | ||||
| U.S. government securities |
704,978,387 | 664,466,918 | ||||||
The cost of investments for federal income tax purposes was substantially the same as the cost for financial reporting purposes. Accordingly, gross unrealized appreciation and unrealized depreciation are as follows:
| Gross unrealized appreciation |
$ | 14,423,120 | ||
| Gross unrealized depreciation |
(10,931,047 | ) | ||
|
|
|
|||
| Net unrealized Appreciation |
$ | 3,492,073 | ||
|
|
|
| B. | Derivative Financial Instruments |
The Portfolio may use derivatives in an effort to earn income and enhance returns, to replace more traditional direct investments, to obtain exposure to otherwise inaccessible markets (collectively, “investment purposes”), or to hedge or adjust the risk profile of its portfolio.
| 2018 Semi-Annual Report | 39 |
Table of Contents
Notes to Financial Statements (continued)
The principal types of derivatives utilized by the Portfolio, as well as the methods in which they may be used are:
| • | Futures |
The Portfolio may buy or sell futures for investment purposes or for the purpose of hedging its portfolio against adverse effects of potential movements in the market. The Portfolio bears the market risk that arises from changes in the value of these instruments and the imperfect correlation between movements in the price of the futures and movements in the price of the assets, reference rates or indices which they are designed to track. Among other things, the Portfolio may purchase or sell futures for foreign currencies or options thereon for non-hedging purposes as a means of making direct investment in foreign currencies, as described below under “Currency Transactions”.
At the time the Portfolio enters into futures, the Portfolio deposits and maintains as collateral an initial margin with the broker, as required by the exchange on which the transaction is effected. Such amount is shown as cash collateral due from broker on the statement of assets and liabilities. Pursuant to the contract, the Portfolio agrees to receive from or pay to the broker an amount of cash equal to the daily fluctuation in the value of the contract. Such receipts or payments are known as variation margin and are recorded by the Portfolio as unrealized gains or losses. Risks may arise from the potential inability of a counterparty to meet the terms of the contract. The credit/counterparty risk for exchange-traded futures is generally less than privately negotiated futures, since the clearinghouse, which is the issuer or counterparty to each exchange-traded future, has robust risk mitigation standards, including the requirement to provide initial and variation margin. When the contract is closed, the Portfolio records a realized gain or loss equal to the difference between the value of the contract at the time it was opened and the time it was closed.
Use of long futures subjects the Portfolio to risk of loss in excess of the amounts shown on the statement of assets and liabilities, up to the notional value of the futures. Use of short futures subjects the Portfolio to unlimited risk of loss. The Portfolio may enter into futures only on exchanges or boards of trade. The exchange or board of trade acts as the counterparty to each futures transactions; therefore, the Portfolio’s credit risk is subject to failure of the exchange or board of trade. Under some circumstances, futures exchanges may establish daily limits on the amount that the price of futures can vary from the previous day’s settlement price, which could effectively prevent liquidation of unfavorable positions.
During the six months ended March 31, 2018, the Portfolio held futures for hedging and non-hedging purposes.
| • | Forward Currency Exchange Contracts |
The Portfolio may enter into forward currency exchange contracts in order to hedge its exposure to changes in foreign currency exchange rates on its foreign portfolio holdings, to hedge certain firm purchase and sale commitments denominated in foreign currencies and for non-hedging purposes as a means of making direct investments in foreign currencies, as described below under “Currency Transactions”.
A forward currency exchange contract is a commitment to purchase or sell a foreign currency at a future date at a negotiated forward rate. The gain or loss arising from the difference between the original contract and the closing of such contract would be included in net realized gain or loss on foreign currency transactions. Fluctuations in the value of open forward currency exchange contracts are recorded for financial reporting purposes as unrealized appreciation and/or depreciation by the Portfolio. Risks may arise from the potential inability of a counterparty to meet the terms of a contract and from unanticipated movements in the value of a foreign currency relative to the U.S. dollar.
During the six months ended March 31, 2018, the Portfolio held forward currency exchange contracts for hedging and non-hedging purposes.
| • | Swaps |
The Portfolio may enter into swaps to hedge its exposure to interest rates, credit risk, or currencies. The Portfolio may also enter into swaps for non-hedging purposes as a means of gaining market exposures, including by making direct investments in foreign currencies, as described below under “Currency Transactions”. A swap is an agreement that obligates two parties to exchange a series of cash flows at specified intervals based upon or calculated by reference to changes in specified prices or rates for a specified amount of an underlying asset. The payment flows are usually netted against each other, with the difference being paid by one party to the other. In addition, collateral may be pledged or received by the Portfolio in accordance with the terms of the respective swaps to provide value and recourse to the Portfolio or its counterparties in the event of default, bankruptcy or insolvency by one of the parties to the swap.
| 40 | Sanford C. Bernstein Fund II, Inc. |
Table of Contents
Risks may arise as a result of the failure of the counterparty to the swap to comply with the terms of the swap. The loss incurred by the failure of a counterparty is generally limited to the net interim payment to be received by the Portfolio, and/or the termination value at the end of the contract. Therefore, the Portfolio considers the creditworthiness of each counterparty to a swap in evaluating potential counterparty risk. This risk is mitigated by having a netting arrangement between the Portfolio and the counterparty and by the posting of collateral by the counterparty to the Portfolio to cover the Portfolio’s exposure to the counterparty. Additionally, risks may arise from unanticipated movements in interest rates or in the value of the underlying securities. The Portfolio accrues for the interim payments on swaps on a daily basis, with the net amount recorded within unrealized appreciation/depreciation of swaps on the statement of assets and liabilities, where applicable. Once the interim payments are settled in cash, the net amount is recorded as realized gain/(loss) on swaps on the statement of operations, in addition to any realized gain/(loss) recorded upon the termination of swaps. Upfront premiums paid or received are recognized as cost or proceeds on the statement of assets and liabilities and are amortized on a straight line basis over the life of the contract. Amortized upfront premiums are included in net realized gain/(loss) from swaps on the statement of operations. Fluctuations in the value of swaps are recorded as a component of net change in unrealized appreciation/depreciation of swaps on the statement of operations.
Certain standardized swaps, including certain interest rate swaps and credit default swaps are subject to mandatory central clearing. Cleared swaps are transacted through futures commission merchants (“FCMs”) that are members of central clearinghouses, with the clearinghouse serving as central counterparty, similar to transactions in futures contracts. Centralized clearing will be required for additional categories of swaps on a phased-in basis based on requirements published by the Securities and Exchange Commission and Commodity Futures Trading Commission.
At the time the Portfolio enters into a centrally cleared swap, the Portfolio deposits and maintains as collateral an initial margin with the broker, as required by the clearinghouse on which the transaction is effected. Such amount is shown as cash collateral due from broker on the statement of assets and liabilities. Pursuant to the contract, the Portfolio agrees to receive from or pay to the broker an amount of cash equal to the daily fluctuation in the value of the contract. Such receipts or payments are known as variation margin and are recorded by the Portfolio as unrealized gains or losses. Risks may arise from the potential inability of a counterparty to meet the terms of the contract. The credit/counterparty risk for centrally cleared swaps is generally less than non-centrally cleared swaps, since the clearinghouse, which is the issuer or counterparty to each centrally cleared swap, has robust risk mitigation standards, including the requirement to provide initial and variation margin. When the contract is closed, the Portfolio records a realized gain or loss equal to the difference between the value of the contract at the time it was opened and the time it was closed.
Interest Rate Swaps:
The Portfolio is subject to interest rate risk exposure in the normal course of pursuing its investment objectives. Because the Portfolio holds fixed rate bonds, the value of these bonds may decrease if interest rates rise. To help hedge against this risk and to maintain its ability to generate income at prevailing market rates, the Portfolio may enter into interest rate swaps. Interest rate swaps are agreements between two parties to exchange cash flows based on a notional amount. The Portfolio may elect to pay a fixed rate and receive a floating rate, or, receive a fixed rate and pay a floating rate on a notional amount.
In addition, the Portfolio may also enter into interest rate swap transactions to preserve a return or spread on a particular investment or portion of its portfolio, or protecting against an increase in the price of securities the Portfolio anticipates purchasing at a later date. Interest rate swaps involve the exchange by a Portfolio with another party of their respective commitments to pay or receive interest (e.g., an exchange of floating rate payments for fixed rate payments) computed based on a contractually-based principal (or “notional”) amount. Interest rate swaps are entered into on a net basis (i.e., the two payment streams are netted out, with the Portfolio receiving or paying, as the case may be, only the net amount of the two payments).
During the six months ended March 31, 2018, the Portfolio held interest rate swaps for hedging and non-hedging purposes.
Credit Default Swaps:
The Portfolio may enter into credit default swaps, including to manage its exposure to the market or certain sectors of the market, to reduce its risk exposure to defaults by corporate and sovereign issuers held by the Portfolio, or to create exposure to corporate or sovereign issuers to which it is not otherwise exposed. The Portfolio may purchase credit
| 2018 Semi-Annual Report | 41 |
Table of Contents
Notes to Financial Statements (continued)
protection (“Buy Contract”) or provide credit protection (“Sale Contract”) on the referenced obligation of the credit default swap. During the term of the swap, the Portfolio receives/(pays) fixed payments from/(to) the respective counterparty, calculated at the agreed upon rate applied to the notional amount. If the Portfolio is a buyer/(seller) of protection and a credit event occurs, as defined under the terms of the swap, the Portfolio will either (i) receive from the seller/(pay to the buyer) of protection an amount equal to the notional amount of the swap (the “Maximum Payout Amount”) and deliver/(take delivery of) the referenced obligation or (ii) receive/(pay) a net settlement amount in the form of cash or securities equal to the notional amount of the swap less the recovery value of the referenced obligation.
In certain circumstances Maximum Payout Amounts may be partially offset by recovery values of the respective referenced obligations, upfront premium received upon entering into the agreement, or net amounts received from settlement of buy protection credit default swaps entered into by the Portfolio for the same reference obligation with the same counterparty. As of March 31, 2018, the Portfolio had no Buy Contracts outstanding with respect to the same referenced obligation and same counterparty for its Sale Contracts outstanding.
Credit default swaps may involve greater risks than if a Portfolio had invested in the referenced obligation directly. Credit default swaps are subject to general market risk, liquidity risk, counterparty risk and credit risk. If the Portfolio is a buyer of protection and no credit event occurs, it will lose the payments it made to its counterparty. If the Portfolio is a seller of protection and a credit event occurs, the value of the referenced obligation received by the Portfolio coupled with the periodic payments previously received, may be less than the Maximum Payout Amount it pays to the buyer, resulting in a net loss to the Portfolio.
Implied credit spreads over U.S. Treasuries of comparable maturity utilized in determining the market value of credit default swaps on issuers as of period end are disclosed in the schedule of investments. The implied spreads serve as an indicator of the current status of the payment/performance risk and typically reflect the likelihood of default by the issuer of the referenced obligation. The implied credit spread of a particular reference obligation also reflects the cost of buying/selling protection and may reflect upfront payments required to be made to enter into the agreement. Widening credit spreads typically represent a deterioration of the referenced obligation’s credit soundness and greater likelihood of default or other credit event occurring as defined under the terms of the agreement. A credit spread identified as “Defaulted” indicates a credit event has occurred for the referenced obligation.
During the six months ended March 31, 2018, the Portfolio held credit default swaps for hedging and non-hedging purposes.
Variance Swaps:
A Portfolio may enter into variance swaps to hedge equity market risk or adjust exposure to the equity markets. Variance swaps are contracts in which two parties agree to exchange cash payments based on the difference between the stated level of variance and the actual variance realized on underlying asset(s) or index(es). Actual “variance” as used here is defined as the sum of the square of the returns on the reference asset(s) or index(es) (which in effect is a measure of its “volatility”) over the length of the contract term. So the parties to a variance swap can be said to exchange actual volatility for a contractually stated rate of volatility.
During the six months ended March 31, 2018, the Portfolio held variance swaps for hedging purposes.
The Portfolio typically enters into International Swaps and Derivatives Association, Inc. Master Agreements (“ISDA Master Agreement”) with its OTC derivative contract counterparties in order to, among other things, reduce its credit risk to OTC counterparties. ISDA Master Agreements include provisions for general obligations, representations, collateral and events of default or termination. Under an ISDA Master Agreement, the Portfolio typically may offset with the OTC counterparty certain derivative financial instruments’ payables and/or receivables with collateral held and/or posted and create one single net payment (close-out netting) in the event of default or termination. In the event of a default by an OTC counterparty, the return of collateral with market value in excess of the Portfolio’s net liability, held by the defaulting party, may be delayed or denied.
The Portfolio’s ISDA Master Agreements may contain provisions for early termination of OTC derivative transactions in the event the net assets of the Portfolio decline below specific levels (“net asset contingent features”). If these levels are triggered, the Portfolio’s OTC counterparty has the right to terminate such transaction and require the Portfolio to pay or
| 42 | Sanford C. Bernstein Fund II, Inc. |
Table of Contents
receive a settlement amount in connection with the terminated transaction. For additional details, please refer to netting arrangements by the OTC counterparty table below.
During the six months ended March 31, 2018, the Portfolio had entered into the following derivatives:
| ASSET DERIVATIVES | LIABILITY DERIVATIVES | |||||||||||
| DERIVATIVE TYPE | STATEMENT OF ASSETS AND LIABILITIES LOCATION |
FAIR VALUE | STATEMENT OF ASSETS AND LIABILITIES LOCATION |
FAIR VALUE | ||||||||
| Interest rate contracts |
Receivable/Payable for variation margin on futures |
$ | 1,735,925 | * | Receivable/Payable for variation margin on futures |
$ | 444,189 | * | ||||
| Interest rate contracts |
Receivable/Payable for variation margin on centrally cleared swaps |
1,402,011 | * | Receivable/Payable for variation margin on centrally cleared swaps |
31,485 | * | ||||||
| Foreign currency contracts |
Unrealized appreciation on forward currency exchange contracts |
887,943 | Unrealized depreciation on forward currency exchange contracts |
455,149 | ||||||||
| Credit contracts |
Unrealized appreciation on credit default swaps |
34,803 | Unrealized depreciation on credit default swaps |
884,336 | ||||||||
| Equity contracts |
Unrealized appreciation on variance swaps |
147 | Unrealized depreciation on variance swaps |
282 | ||||||||
| Total |
$ | 4,060,829 | $ | 1,815,441 | ||||||||
| * | Only variation margin receivable/payable at period end is reported within the statement of assets and liabilities. |
This amount reflects cumulative unrealized appreciation/(depreciation) on futures and centrally cleared swaps as reported in the schedule of investments.
| DERIVATIVE TYPE | LOCATION OF GAIN OR
(LOSS) ON DERIVATIVES WITHIN STATEMENT OF OPERATIONS |
REALIZED GAIN OR (LOSS) ON DERIVATIVES |
CHANGE IN UNREALIZED APPRECIATION OR (DEPRECIATION) |
|||||||
| Interest rate contracts |
Net realized gain (loss) on futures; Net change in unrealized appreciation/depreciation of futures |
$ | (4,244,168 | ) | $ | 2,038,633 | ||||
| Foreign currency contracts |
Net realized gain (loss) on forward currency exchange contracts; Net change in unrealized appreciation/depreciation of forward currency exchange contracts |
(988,828 | ) | 96,859 | ||||||
| Interest rate contracts |
Net realized gain (loss) on swaps; Net change in unrealized appreciation/depreciation of swaps |
531,155 | 528,199 | |||||||
| Credit contracts |
Net realized gain (loss) on swaps; Net change in unrealized appreciation/depreciation of swaps |
187,950 | 124,837 | |||||||
| Equity contracts |
Net realized gain (loss) on swaps; Net change in unrealized appreciation/depreciation of swaps |
0 | (135 | ) | ||||||
| Total |
$ | (4,513,891 | ) | $ | 2,788,393 | |||||
| 2018 Semi-Annual Report | 43 |
Table of Contents
Notes to Financial Statements (continued)
The following table represents the average monthly volume of the Portfolio’s derivative transactions during the six months ended March 31, 2018:
| Futures: |
||||||||
| Average original value of buy contracts |
$ | 129,975,777 | ||||||
| Average original value of sale contracts |
$ | 77,930,741 | ||||||
| Forward Currency Exchange Contracts: |
||||||||
| Average principal amount of buy contracts |
$ | 24,003,198 | ||||||
| Average principal amount of sale contracts |
$ | 105,830,998 | ||||||
| Centrally Cleared Interest Rate Swaps: |
||||||||
| Average notional amount |
$ | 102,944,276 | ||||||
| Credit Default Swaps: |
||||||||
| Average notional amount of buy contracts |
$ | 14,056,000 | ||||||
| Average notional amount of sale contracts |
$ | 16,581,857 | ||||||
| Centrally Cleared Credit Default Swaps: |
||||||||
| Average notional amount of sale contracts |
$ | 3,540,000 | (a) | |||||
| Variance Swap |
||||||||
| Average notional amount |
$ | 1,083,475 | (b) | |||||
| (a) | Positions were open for one month during the period. |
| (b) | Positions were open for three months during the period. |
For financial reporting purposes, the Portfolio does not offset derivative assets and derivative liabilities that are subject to netting arrangements in the statement of assets and liabilities.
All OTC derivatives held at period end were subject to netting arrangements. The following table presents the Portfolio’s derivative assets and liabilities by OTC counterparty net of amounts available for offset under ISDA Master Agreements and net of the related collateral received/pledged by the Portfolio as of March 31, 2018. Exchange-traded derivatives and centrally cleared swaps are not subject to netting arrangements and as such are excluded from the table.
| COUNTERPARTY | DERIVATIVE ASSETS SUBJECT TO A MA |
DERIVATIVE AVAILABLE FOR OFFSET |
CASH COLLATERAL RECEIVED* |
SECURITY COLLATERAL RECEIVED* |
NET AMOUNT
OF DERIVATIVES ASSETS |
|||||||||||||||
| Australia and New Zealand Banking Group Ltd. |
$ | 805 | $ | 0 | $ | 0 | $ | 0 | $ | 805 | ||||||||||
| Barclays Bank PLC |
297 | (297 | ) | 0 | 0 | 0 | ||||||||||||||
| BNP Paribas SA |
32,979 | 0 | 0 | 0 | 32,979 | |||||||||||||||
| Citibank, NA |
195,450 | (149,055 | ) | 0 | 0 | 46,395 | ||||||||||||||
| Citigroup Global Markets, Inc. |
16 | (16 | ) | 0 | 0 | 0 | ||||||||||||||
| Credit Suisse International |
14,526 | (14,526 | ) | 0 | 0 | 0 | ||||||||||||||
| Deutsche Bank AG |
2,717 | (2,717 | ) | 0 | 0 | 0 | ||||||||||||||
| Goldman Sachs Bank USA/Goldman Sachs International |
39,967 | (39,967 | ) | 0 | 0 | 0 | ||||||||||||||
| HSBC Bank USA |
147,200 | (147,200 | ) | 0 | 0 | 0 | ||||||||||||||
| JPMorgan Chase Bank, NA |
72,264 | (52,613 | ) | 0 | 0 | 19,651 | ||||||||||||||
| Morgan Stanley & Co., Inc./Morgan Stanley Capital Services LLC |
3,921 | (3,921 | ) | 0 | 0 | 0 | ||||||||||||||
| 44 | Sanford C. Bernstein Fund II, Inc. |
Table of Contents
| COUNTERPARTY | DERIVATIVE ASSETS SUBJECT TO A MA |
DERIVATIVE AVAILABLE FOR OFFSET |
CASH COLLATERAL RECEIVED* |
SECURITY COLLATERAL RECEIVED* |
NET AMOUNT
OF DERIVATIVES ASSETS |
|||||||||||||||
| Royal Bank of Scotland PLC |
$ | 342,656 | $ | (58,824 | ) | $ | 0 | $ | 0 | $ | 283,832 | |||||||||
| Standard Chartered Bank |
40,381 | 0 | 0 | 0 | 40,381 | |||||||||||||||
| State Street Bank & Trust Co. |
10 | (10 | ) | 0 | 0 | 0 | ||||||||||||||
|
|
|
|
|
|
|
|
|
|
|
|||||||||||
| Total |
$ | 893,189 | $ | (469,146 | ) | $ | 0 | $ | 0 | $ | 424,043 | ^ | ||||||||
|
|
|
|
|
|
|
|
|
|
|
|||||||||||
| COUNTERPARTY | DERIVATIVE LIABILITIES SUBJECT TO A MA |
DERIVATIVE AVAILABLE FOR OFFSET |
CASH COLLATERAL PLEDGED* |
SECURITY COLLATERAL PLEDGED* |
NET AMOUNT
OF DERIVATIVES LIABILITIES |
|||||||||||||||
| Barclays Bank PLC |
$ | 11,562 | $ | (297 | ) | $ | 0 | $ | 0 | $ | 11,265 | |||||||||
| Citibank, NA |
149,055 | (149,055 | ) | 0 | 0 | 0 | ||||||||||||||
| Citigroup Global Markets, Inc. |
159,245 | (16 | ) | 0 | 0 | 159,229 | ||||||||||||||
| Credit Suisse International |
829,387 | (14,526 | ) | 0 | (808,129 | ) | 6,732 | |||||||||||||
| Deutsche Bank AG |
489,166 | (2,717 | ) | 0 | (402,534 | ) | 83,915 | |||||||||||||
| Goldman Sachs Bank USA/Goldman Sachs International |
628,158 | (39,967 | ) | 0 | (509,711 | ) | 78,480 | |||||||||||||
| HSBC Bank USA |
325,582 | (147,200 | ) | 0 | 0 | 178,382 | ||||||||||||||
| JPMorgan Chase Bank, NA |
52,613 | (52,613 | ) | 0 | 0 | 0 | ||||||||||||||
| Morgan Stanley & Co., Inc./Morgan Stanley Capital Services LLC |
230,329 | (3,921 | ) | 0 | (226,408 | ) | 0 | |||||||||||||
| Royal Bank of Scotland PLC |
58,824 | (58,824 | ) | 0 | 0 | 0 | ||||||||||||||
| State Street Bank & Trust Co. |
3,074 | (10 | ) | 0 | 0 | 3,064 | ||||||||||||||
|
|
|
|
|
|
|
|
|
|
|
|||||||||||
| Total |
$ | 2,936,995 | $ | (469,146 | ) | $ | 0 | $ | (1,946,782 | ) | $ | 521,067 | ^ | |||||||
|
|
|
|
|
|
|
|
|
|
|
|||||||||||
| * | The actual collateral received/pledged may be more than the amount reported due to over-collateralization. |
| ^ | Net amount represents the net receivable/payable that would be due from/to the counterparty in the event of default or termination. The net amount from OTC financial derivative instruments can only be netted across transactions governed under the same master agreement with the same counterparty. |
| C. | Currency Transactions |
The Portfolio may invest in non-U.S. Dollar-denominated securities on a currency hedged or unhedged basis. The Portfolio may seek investment opportunities by taking long or short positions in currencies through the use of currency-related derivatives, including forward currency exchange contracts, futures and options on futures, swaps, and other options. The Portfolio may enter into transactions for investment opportunities when it anticipates that a foreign currency will appreciate or depreciate in value but securities denominated in that currency are not held by the Portfolio and do not present attractive investment opportunities. Such transactions may also be used when the Adviser believes that it may be more efficient than a direct investment in a foreign currency-denominated security. The Portfolio may also conduct currency exchange contracts on a spot basis (i.e., for cash at the spot rate prevailing in the currency exchange market for buying or selling currencies).
| D. | TBA and Dollar Rolls |
The Portfolio may invest in TBA mortgage-backed securities. A TBA, or “To Be Announced”, trade represents a contract for the purchase or sale of mortgage-backed securities to be delivered at a future agree-upon date; however, the specific mortgage pool numbers or the number of pools that will be delivered to fulfill the trade obligation or terms of the contract are unknown at the time of the trade. Mortgage pools (including fixed-rate or variable-rate mortgages) guaranteed by the
| 2018 Semi-Annual Report | 45 |
Table of Contents
Notes to Financial Statements (continued)
Government National Mortgage Association, or GNMA, the Federal National Mortgage Association, or FNMA, or the Federal Home Loan Mortgage Corporation, or FHLMC, are subsequently allocated to the TBA transactions.
The Portfolio may enter into dollar rolls. Dollar rolls involve sales by the Portfolio of securities for delivery in the current month and the Portfolio simultaneously contracting to repurchase substantially similar (same type and coupon) securities on a specified future date. During the roll period, the Portfolio forgoes principal and interest paid on the securities. The Portfolio is compensated by the difference between the current sales price and the lower forward price for the future purchase (often referred to as the “drop”) as well as by the interest earned on the cash proceeds of the initial sale. Dollar rolls involve the risk that the market value of the securities the Portfolio is obligated to repurchase under the agreement may decline below the repurchase price. Dollar rolls are speculative techniques. For the six months ended March 31, 2018, the Portfolio earned drop income of $799,159 which is included in interest income in the accompanying statement of operations.
| E. | Reverse Repurchase Agreements |
The Portfolio may enter into reverse repurchase transactions (“RVP”) in accordance with the terms of a Master Repurchase Agreement (“MRA”), under which the Portfolio sells securities and agrees to repurchase them at a mutually agreed upon date and price. At the time the Portfolio enters into a reverse repurchase agreement, it will establish a segregated account with the custodian containing liquid assets having a value comparable to the repurchase price. Under the MRA and other Master Agreements, the Portfolio is permitted to offset payables and/or receivables with collateral held and/or posted to the counterparty and create one single net payment due to or from the Portfolio in the event of a default. In the event of a default by a MRA counterparty, the Portfolio may be considered an unsecured creditor with respect to any excess collateral (collateral with a market value in excess of the repurchase price) held by and/or posted to the counterparty, and as such the return of such excess collateral may be delayed or denied. For the six months ended March 31, 2018, the average amount of reverse repurchase agreements outstanding was $249,620 and the daily weighted average interest rate was (1.64)%. During the period, the Portfolio received net interest payment from counterparties.
For the six months ended March 31, 2018, the Portfolio had no transactions in reverse repurchase agreements outstanding.
| NOTE 4. | Distributions to Shareholders |
The tax character of distributions to be paid for the year ending September 30, 2018 will be determined at the end of the current fiscal year. The tax character of distributions paid during the fiscal years ended September 30, 2017 and September 30, 2016 were as follows:
| 2017 | 2016 | |||||||
| Distributions paid from: |
||||||||
| Ordinary income |
$ | 19,893,502 | $ | 22,149,684 | ||||
| Net long-term capital gains |
4,495,903 | 4,812,829 | ||||||
|
|
|
|
|
|||||
| Total distributions paid |
$ | 24,389,405 | $ | 26,962,513 | ||||
|
|
|
|
|
|||||
As of September 30, 2017, the components of accumulated earnings/(deficit) on a tax basis were as follows:
| Accumulated capital losses and other losses |
$ | (2,996,717 | )(a) | |||||
| Other losses |
(313,417 | )(b) | ||||||
| Unrealized appreciation/(depreciation) |
8,836,916 | (c) | ||||||
|
|
|
|
|
|||||
| Total accumulated earnings/(deficit) |
$ | 5,526,782 | (d) | |||||
|
|
|
|
|
| (a) | As of September 30, 2017, the Portfolio had a net capital loss carryforward of $2,949,703. As of September 30, 2017, the cumulative deferred loss on straddles was $47,014. |
| (b) | As of September 30, 2017, the Portfolio had a qualified late-year ordinary loss deferral of $313,417. |
| 46 | Sanford C. Bernstein Fund II, Inc. |
Table of Contents
| (c) | The differences between book-basis and tax-basis unrealized appreciation/(depreciation) are attributable primarily to the tax deferral of losses on wash sales, the tax treatment of swaps, passive foreign investment companies (PFICs) and Treasury inflation-protected securities, and the recognition for tax purposes of unrealized gains/losses on certain derivative instruments. |
| (d) | The difference between book-basis and tax-basis components of accumulated earnings/(deficit) is attributable primarily to dividends payable. |
For tax purposes, net realized capital losses may be carried over to offset future capital gains, if any. Funds are permitted to carry forward capital losses for an indefinite period, and such losses will retain their character as either short-term or long-term capital losses. As of September 30, 2017, the Portfolio had a net short-term capital loss carryforward of $2,949,703, which may be carried forward for an indefinite period.
| NOTE 5. | Risks Involved in Investing in the Portfolio |
Interest Rate Risk—This is the risk that changes in interest rates will affect the value of the Portfolio’s investments in fixed-income debt securities such as bonds and notes. The Portfolio may be subject to a greater risk of rising interest rates due to the current period of historically low rates and the effect of potential government fiscal policy initiatives and Federal Reserve and other central bank monetary initiatives, as well as the market reaction to those initiatives. Increases in interest rates may cause the value of the Portfolio’s investments to decline and this decrease in value may not be offset by higher income from new investments. The Portfolio may experience increased interest rate risk to the extent it invests in fixed-income securities with longer maturities or durations. A general rise in interest rates may cause investors to move out of fixed-income securities on a large scale, which could adversely affect the price and liquidity of fixed-income securities and could also result in increased redemptions from funds, such as the Portfolio, that invest largely in fixed-income securities.
Credit Risk—This is the risk that the issuer or the guarantor of a debt security, or the counterparty to a derivatives or other contract, will be unable or unwilling to make timely principal and/or interest payments, or to otherwise honor its obligations. The issuer or guarantor may default, potentially causing a loss of the full principal amount of a security and accrued interest. The degree of risk for a particular security may be reflected in its credit rating. The credit rating of a fixed-income security may be downgraded after purchase, which may adversely affect the value of the security. Investments in fixed-income securities with lower ratings tend to have a higher probability that an issuer will default or fail to meet its payment obligations. At times when credit risk is perceived to be greater, credit “spreads” (i.e., the difference between the yields on lower quality securities and the yields on higher quality securities) may get larger or “widen”. As a result, the values of the lower quality securities may go down more and they may become harder to sell and less liquid.
Duration Risk—The duration of a fixed-income security may be shorter than or equal to full maturity of a fixed-income security. Fixed-income securities with longer durations have more interest rate risk and will decrease in price as interest rates rise. For example, a fixed-income security with a duration of three years would be expected to decrease in value by approximately 3% if interest rates increase by 1%. Securities that have final maturities longer than their durations may be affected by increased credit spreads to a far greater degree than their durations would suggest, because they are exposed to credit risk until final maturity.
Inflation Risk—This is the risk that the value of assets or income from investments will be less in the future as inflation decreases the value of money. As inflation increases, the value of the Portfolio’s assets can decline as can the value of the Portfolio’s distributions. This risk is significantly greater for fixed-income securities with longer maturities.
Inflation-Protected Securities Risk—The terms of inflation-protected securities provide for the coupon and/or maturity value to be adjusted based on changes in an inflation index. Decreases in the inflation rate or in investors’ expectations about inflation could cause these securities to underperform non-inflation-adjusted securities on a total-return basis. In addition, these securities may have limited liquidity in the secondary market.
Foreign (Non-U.S.) Securities Risk—Investments in foreign securities entail significant risks in addition to those customarily associated with investing in U.S. securities. These risks include risks related to adverse market, economic, political and regulatory factors and social instability, all of which could disrupt the financial markets in which the Portfolio invests and adversely affect the value of the Portfolio’s assets.
| 2018 Semi-Annual Report | 47 |
Table of Contents
Notes to Financial Statements (continued)
Emerging Markets Securities Risk—The risks of investing in foreign (non-U.S.) securities are heightened with respect to issuers in emerging-market countries, because the markets are less developed and less liquid and there may be a greater amount of economic, political and social uncertainty, and these risks are even more pronounced in “frontier” markets, which are investable markets with lower total market capitalization and liquidity than the more developed emerging markets. In addition, the value of the Portfolio’s investments may decline because of factors such as unfavorable or unsuccessful government actions and reduction of government or central bank support.
Derivatives Risk—The Portfolio may use derivatives as direct investments to earn income, enhance return and broaden portfolio diversification, which entail greater risk than if used solely for hedging purposes. In addition to other risks such as the credit risk of the counterparty, derivatives involve the risk that changes in the value of the derivative may not correlate with relevant assets, rates or indices. Derivatives may be illiquid and difficult to price or unwind, and small changes may produce disproportionate losses for the Portfolio. Certain derivatives have the potential for unlimited loss, regardless of the size of the initial investment. Assets required to be set aside or posted to cover or secure derivatives positions may themselves go down in value, and these collateral and other requirements may limit investment flexibility. Some derivatives involve leverage, which can make the Portfolio more volatile and can compound other risks. Use of derivatives may have different tax consequences for the Portfolio than an investment in the underlying security, and such differences may affect the amount, timing and character of income distributed to shareholders. The U.S. Government and foreign governments are in the process of adopting and implementing regulations governing derivatives markets, including mandatory clearing of certain derivatives, margin, reporting and registration requirements. The ultimate impact of the regulations remains unclear. Additional regulation may make derivatives more costly, may limit their availability or utility, or otherwise adversely affect their performance, or may disrupt markets.
Mortgage-Related Securities Risk—Mortgage-related securities represent interests in “pools” of mortgages, including consumer loans or receivables held in trust. Mortgage-related securities are subject to credit, interest rate, prepayment and extension risks. These securities also are subject to risk of default on the underlying mortgage, particularly during periods of economic downturn. Small movements in interest rates (both increases and decreases) may quickly and significantly reduce the value of certain mortgage-related securities.
Prepayment and Extension Risk—Prepayment risk is the risk that a loan, bond or other security might be called or otherwise converted, prepaid or redeemed before maturity. If this happens, particularly during a time of declining interest rates or credit spreads, the Portfolio will not benefit from the rise in market price that normally accompanies a decline in interest rates, and may not be able to invest the proceeds in securities providing as much income, resulting in a lower yield to the Portfolio. Conversely, extension risk is the risk that as interest rates rise or spreads widen, payments of securities may occur more slowly than anticipated by the market. If this happens, the values of these securities may go down because their interest rates are lower than current market rates and they remain outstanding longer than anticipated.
Subordination Risk—The Portfolio may invest in securities that are subordinated to more senior securities of an issuer, or which represent interests in pools of such subordinated securities. Subordinated securities will be disproportionately affected by a default or even a perceived decline in creditworthiness of the issuer. Subordinated securities are more likely to suffer a credit loss than non-subordinated securities of the same issuer, any loss incurred by the subordinated securities is likely to be proportionately greater, and any recovery of interest or principal may take more time.
Management Risk—The Portfolio is subject to management risk because it is an actively managed investment portfolio. The Adviser will apply its investment techniques and risk analyses in making investment decisions for the Portfolio, but these techniques, analyses and decisions may not work as intended or may not produce the desired results. In some cases, derivatives and other investment techniques may be unavailable or the Adviser may determine not to use them, possibly even under market conditions where their use could benefit the Portfolio. In addition, the Adviser may change the Portfolio’s investment strategies or policies from time to time. Those changes may not lead to the results intended by the Adviser and could have an adverse effect on the value or performance of the Portfolio.
Liquidity Risk—Liquidity risk exists when particular investments are difficult to purchase or sell, possibly preventing the Portfolio from selling out of these illiquid or relatively less liquid securities at an advantageous price. Over recent years, regulatory changes have led to reduced liquidity in the marketplace, and the capacity of dealers to make markets in fixed-income securities has been outpaced by the growth in the size of the fixed-income markets. Liquidity risk may be magnified in a rising interest rate environment, where the value and liquidity of fixed-income securities generally go down. Derivatives and securities involving substantial market and credit risk tend to involve greater liquidity risk. Illiquid securities and relatively less liquid securities may also be difficult to value.
| 48 | Sanford C. Bernstein Fund II, Inc. |
Table of Contents
Redemption Risk—The Portfolio may experience heavy redemptions that could cause the Portfolio to liquidate its assets at inopportune times or at a loss or depressed value, which could cause the value of your investment to decline. Redemption risk is heightened during periods of overall market turmoil.
Foreign Currency Risk—This is the risk that changes in foreign (non-U.S.) currency exchange rates may negatively affect the value of the Portfolio’s investments or reduce the returns of the Portfolio. For example, the value of the Portfolio’s investments in foreign securities and foreign currency positions may decrease if the U.S. dollar is strong (i.e., gaining value relative to other currencies) and other currencies are weak (i.e., losing value relative to the U.S. dollar).
Actions by a Few Major Investors—In certain countries, volatility may be heightened by actions of a few major investors. For example, substantial increases or decreases in cash flows of mutual funds investing in these markets could significantly affect local stock prices and, therefore, share prices of the Portfolio.
Market Risk—The Portfolio is subject to market risk, which is the risk that stock and bond prices in general may decline over short or extended periods. In the past decade, financial markets in the United States, Europe and elsewhere have experienced increased volatility, decreased liquidity and heightened uncertainty. Recently, some securities markets, particularly in Europe and Asia, have been very volatile and have declined in value significantly. These market conditions may recur from time to time and have an adverse impact on various securities markets. The U.S. Government and the Federal Reserve, as well as certain foreign governments and central banks, have taken steps to support financial markets, including by keeping interest rates low. Other governments have tried to support markets by buying stocks and through other market interventions. Government intervention may not work as intended, particularly if the efforts are perceived by investors as being unlikely to achieve the desired results. The Federal Reserve has recently reduced its market support activities and has begun raising interest rates. Certain foreign central banks have implemented, and others have discussed implementing, so-called negative interest rates (e.g., charging depositors who keep their cash at a bank) to spur economic growth. Further Federal Reserve or other U.S. or non-U.S. governmental or central bank actions, including interest rate increases or decreases, could negatively affect financial markets generally, increase market volatility and reduce the value and liquidity of securities in which the Portfolio invest.
Current political uncertainty surrounding the European Union (“EU”) and its membership may increase market volatility. The United Kingdom (“UK”) has voted to withdraw from the EU, and one or more other countries may withdraw from the EU and/or abandon the Euro, the common currency of the EU. The financial instability of some countries in the EU, together with the risk of that financial instability impacting other more stable countries, may increase the risk of investing in companies in Europe and worldwide. In addition, policy and legislative changes in the United States and in other countries are affecting many aspects of financial regulation, and may in some instances contribute to decreased liquidity and increased volatility in the financial markets. The impact of these changes, and the practical implications for market participants, may not be fully known for some time.
Economies and financial markets throughout the world are becoming increasingly interconnected. Economic, financial or political events, trading and tariff arrangements, terrorism, natural disasters and other circumstances in one country or region could have profound impacts on global economies or markets. As a result, whether or not the Portfolio invests in securities of issuers located in or with significant exposure to countries experiencing economic and financial difficulties, the value and liquidity of the Portfolio’s investments may be negatively affected.
Lower-rated Securities Risk—Lower-rated securities, or junk bonds/high-yield securities, are subject to greater risk of loss of principal and interest and greater market risk than higher-rated securities. The capacity of issuers of lower-rated securities to pay interest and repay principal is more likely to weaken than is that of issuers of higher-rated securities in times of deteriorating economic conditions or rising interest rates.
Portfolio Turnover Risk—The Portfolio’s investment strategies may result in high portfolio turnover. The Portfolio generally buys portfolio securities with the intention of holding them for investment. However, when market conditions or other circumstances warrant, securities may be purchased and sold without regard to the length of time held. From time to time, the Portfolio may engage in active short-term trading to seek short-term profits during periods of fluctuating interest rates or for other reasons. This trading may increase the Portfolio’s rate of turnover and the incidence of short-term capital gain taxable as ordinary income. A higher rate of portfolio turnover may increase transaction costs, which must be borne by the Portfolio and its shareholders.
| 2018 Semi-Annual Report | 49 |
Table of Contents
Notes to Financial Statements (continued)
Indemnification Risk—In the ordinary course of business, the Portfolio enters into contracts that contain a variety of indemnifications. The Portfolio’s maximum exposure under these arrangements is unknown. However, the Portfolio has not had prior claims or losses pursuant to these indemnification provisions and expects the risk of loss thereunder to be remote. Therefore, the Portfolio has not accrued any liability in connection with these indemnification provisions.
| NOTE 6. | Capital-Share Transactions |
Share transactions for the six months ended March 31, 2018 and the year ended September 30, 2017, were as follows:
| INTERMEDIATE DURATION INSTITUTIONAL PORTFOLIO |
||||||||||||||||||||
| SHARES | AMOUNT | |||||||||||||||||||
| SIX MONTHS ENDED 3/31/18 (UNAUDITED) |
YEAR ENDED 9/30/17 |
SIX
MONTHS ENDED 3/31/18 (UNAUDITED) |
YEAR ENDED 9/30/17 |
|||||||||||||||||
| Shares sold |
4,317,117 | 13,343,677 | $ | 64,655,114 | $ | 201,144,887 | ||||||||||||||
| Shares issued to shareholders on reinvestment of dividends and distributions |
476,306 | 1,461,927 | 7,099,909 | 21,873,323 | ||||||||||||||||
| Shares redeemed |
(4,031,737 | ) | (9,863,615 | ) | (59,900,368 | ) | (148,094,385 | ) | ||||||||||||
|
|
|
|
|
|
|
|
|
|||||||||||||
| Net increase |
761,686 | 4,941,989 | $ | 11,854,655 | $ | 74,923,825 | ||||||||||||||
|
|
|
|
|
|
|
|
|
|||||||||||||
| NOTE 7. | Line of Credit |
A number of open-end mutual funds managed by the Adviser, including the Portfolio, participate in a $280 million revolving credit facility (the “Facility”) intended to provide short-term financing, if necessary, subject to certain restrictions in connection with abnormal redemption activity. Commitment fees related to the Facility are paid by the participating funds and are included in miscellaneous expenses in the statement of operations. The Portfolio did not utilize the Facility during the six months ended March 31, 2018.
| NOTE 8. | Recent Accounting Pronouncements |
In March 2017, the Financial Accounting Standards Board issued an Accounting Standards Update, ASU 2017-08, Receivables—Nonrefundable Fees and Other Costs (Subtopic 310-20), Premium Amortization on Purchased Callable Debt Securities (the “ASU”) which amends the amortization period for certain purchased callable debt securities held at a premium, shortening such period to the earliest call date. The ASU does not require any accounting change for debt securities held at a discount; the discount continues to be amortized to maturity. The ASU is effective for fiscal years, and interim periods within those fiscal years, beginning after December 15, 2018. At this time, management is evaluating the implications of these changes on the financial statements.
| NOTE 9. | Subsequent Events |
Management has evaluated subsequent events for possible recognition or disclosure in the financial statements through the date the financial statements are issued. Management has determined that there are no material events that would require disclosure in the Portfolio’s financial statements through this date.
| 50 | Sanford C. Bernstein Fund II, Inc. |
Table of Contents
Sanford C. Bernstein Fund II, Inc.
BOARD OF DIRECTORS
Marshall C. Turner, Jr.*
Chairman
Michael J. Downey*
Director
William H. Foulk, Jr.*
Director
Nancy P. Jacklin*
Director
Robert M. Keith
President and Chief Executive Officer
Carol C. McMullen*
Director
Garry L. Moody*
Director
Earl D. Weiner*
Director
OFFICERS
Michael Canter**
Vice President
Shawn E. Keegan**
Vice President
Douglas J. Peebles**
Vice President
Janaki Rao**
Vice President
Greg J. Wilensky**
Vice President
Emilie D. Wrapp
Secretary
Joseph J. Mantineo
Treasurer and Chief Financial Officer
Vincent S. Noto
Chief Compliance Officer
Stephen M. Woetzel
Controller
INDEPENDENT REGISTERED PUBLIC ACCOUNTING FIRM
Ernst & Young LLP
5 Times Square
New York, New York 10036
LEGAL COUNSEL
Willkie Farr & Gallagher LLP
787 Seventh Avenue
New York, New York 10019
CUSTODIAN AND ACCOUNTING AGENT
State Street Bank and Trust Company
State Street Corporation CCB/5
1 Iron Street
Boston, Massachusetts 02210
TRANSFER AGENT
DST Asset Manager Solutions
2000 Crown Colony Drive
Quincy, Massachusetts 02169
INVESTMENT ADVISER
AllianceBernstein L.P.
1345 Avenue of the Americas
New York, New York 10105
* Member of the Audit Committee, the Governance and Nominating Committee and the Independent Directors Committee.
** The day-to-day management of, and investment decisions for, Sanford C. Bernstein Fund II, Inc.’s portfolio are made by the U.S. Investment Grade: Core Fixed Income Team. Messrs. Canter, Keegan, Peebles, Rao and Wilensky are the investment professionals with the most significant responsibility for the day-to-day management of the Fund’s portfolio.
| 2018 Semi-Annual Report | 51 |
Table of Contents
Information Regarding the Review and Approval of the Fund’s Advisory Agreement
The disinterested directors (the “directors”) of Sanford C. Bernstein II, Inc. (the “Company”) unanimously approved the continuance of the Company’s Advisory Agreement with the Adviser, as proposed to be amended to effect a fee reduction (as so amended, the “Advisory Agreement”), in respect of Bernstein Intermediate Duration Institutional Portfolio (the “Fund”) at a meeting held on October 31-November 2, 2017 (the “Meeting”).
Prior to approval of the continuance of the Advisory Agreement, the directors had requested from the Adviser, and received and evaluated, extensive materials. They reviewed the proposed continuance of the Advisory Agreement with the Adviser and with experienced counsel who are independent of the Adviser, who advised on the relevant legal standards. The directors also reviewed an independent evaluation prepared by the Company’s Senior Officer (who is also the Company’s Independent Compliance Officer), who acted as their independent fee consultant, of the reasonableness of the proposed advisory fee, in which the Senior Officer concluded that the proposed contractual fee for the Fund was reasonable. The directors also discussed the proposed continuance in private sessions with counsel and the Company’s Senior Officer.
The directors considered their knowledge of the nature and quality of the services provided by the Adviser to the Fund gained from their experience as directors or trustees of most of the registered investment companies advised by the Adviser, their overall confidence in the Adviser’s integrity and competence they have gained from that experience, the Adviser’s initiative in identifying and raising potential issues with the directors and its responsiveness, frankness and attention to concerns raised by the directors in the past, including the Adviser’s willingness to consider and implement organizational and operational changes designed to improve investment results and the services provided to the AB Funds. The directors noted that they have four regular meetings each year, at each of which they review extensive materials and information from the Adviser, including information on the investment performance of the Fund.
The directors also considered all factors they believed relevant, including the specific matters discussed below. During the course of their deliberations, the directors evaluated, among other things, the reasonableness of the proposed advisory fee. The directors did not identify any particular information that was all-important or controlling, and different directors may have attributed different weights to the various factors. The directors determined that the selection of the Adviser to manage the Fund and the overall arrangements between the Fund and the Adviser, as provided in the Advisory Agreement, including the proposed advisory fee, were fair and reasonable in light of the services performed, expenses incurred and such other matters as the directors considered relevant in the exercise of their business judgment. The directors noted that the proposed lowering of the advisory fee would benefit the Fund and its shareholders. The directors noted that the Adviser was reducing fees for business reasons, and had assured them that there would be no diminution in the nature or quality of services to the Fund. The material factors and conclusions that formed the basis for the directors’ determinations included the following:
Nature, Extent and Quality of Services Provided
The directors considered the scope and quality of services provided by the Adviser under the Advisory Agreement, including the quality of the investment research capabilities of the Adviser and the other resources it has dedicated to performing services for the Fund. The directors noted that the Adviser from time to time reviews the Fund’s investment strategies and from time to time proposes changes intended to improve the Fund’s relative or absolute performance for the directors’ consideration. They also noted the professional experience and qualifications of the Fund’s portfolio management team and other senior personnel of the Adviser. The directors also considered that the Advisory Agreement provides that the Fund will reimburse the Adviser for the cost to it of providing certain clerical, accounting, administrative and other services to the Fund by employees of the Adviser or its affiliates. Requests for these reimbursements are made on a quarterly basis and subject to approval by the directors. Reimbursements, to the extent requested and paid, result in a higher rate of total compensation from the Fund to the Adviser than the fee rate stated in the Advisory Agreement. The directors noted that the methodology used to determine the reimbursement amounts had been reviewed by an independent consultant retained by the Company’s Senior Officer. The quality of administrative and other services, including the Adviser’s role in coordinating the activities of the Fund’s other service providers, also was considered. The directors concluded that, overall, they were satisfied with the nature, extent and quality of services provided to the Fund under the Advisory Agreement.
| 52 | Sanford C. Bernstein Fund II, Inc. |
Table of Contents
Costs of Services Provided and Profitability
The directors reviewed a schedule of the revenues and expenses and related notes indicating the profitability of the Fund to the Adviser for calendar years 2015 and 2016 that had been prepared with an expense allocation methodology arrived at in consultation with an independent consultant retained by the Company’s Senior Officer. The directors noted the assumptions and methods of allocation used by the Adviser in preparing fund-specific profitability data and understood that there are a number of potentially acceptable allocation methodologies for information of this type. The directors noted that the profitability information reflected all revenues and expenses of the Adviser’s relationship with the Fund and that the proposed reduction in the advisory fee rate would likely impact the Adviser’s profitability analysis in future years. The directors recognized that it is difficult to make comparisons of the profitability of the Advisory Agreement with the profitability of fund advisory contracts for unaffiliated funds because comparative information is not generally publicly available and is affected by numerous factors. The directors focused on the profitability of the Adviser’s relationship with the Fund before taxes. The directors concluded that the Adviser’s level of profitability from its relationship with the Fund was not unreasonable.
Fall-Out Benefits
The directors considered the other benefits to the Adviser and its affiliates from their relationships with the Fund. The directors noted that shares of the Fund are distributed exclusively through a subsidiary of the Adviser, and that such subsidiary receives fees from its clients in connection with its services. The directors recognized that the Adviser’s profitability would be somewhat lower without these benefits. The directors understood that the Adviser also might derive reputational and other benefits from its association with the Fund.
Investment Results
In addition to the information reviewed by the directors in connection with the meeting, the directors receive detailed performance information for the Fund at each regular Board meeting during the year.
At the Meeting, the directors reviewed performance information prepared by an analytical service that is not affiliated with the Adviser (the “15(c) service provider”), showing the performance of the Fund against a group of similar funds (“peer group”) and a larger group of similar funds (“peer universe”), each selected by the 15(c) service provider, and information prepared by the Adviser showing the Fund’s performance against a broad-based securities market index, in each case for the 1-, 3-, 5- and 10-year periods ended July 31, 2017 and (in the case of comparisons with the broad-based securities market index) for the period from inception. Based on their review, the directors concluded that the Fund’s investment performance was acceptable.
Advisory Fees and Other Expenses
The directors considered the proposed advisory fee rate paid by the Fund to the Adviser and information prepared by the 15(c) service provider concerning advisory fee rates paid by other funds in the same category as the Fund. The directors recognized that it is difficult to make comparisons of advisory fees because there are variations in the services that are included in the fees paid by other funds. The directors compared the Fund’s pro forma contractual effective advisory fee rate (reflecting a reduction in the advisory fee rate to take effect in January 2018) with a peer group median and took into account the impact on the advisory fee rate of the administrative expense reimbursement paid to the Adviser in the latest fiscal year.
The directors also considered the Adviser’s fee schedule for other clients pursuing a similar investment style. For this purpose, they reviewed the relevant advisory fee information from the Adviser’s Form ADV and the evaluation from the Company’s Senior Officer and noted the differences between the Fund’s fee schedule, on the one hand, and the Adviser’s institutional fee schedule and the schedule of fees charged by the Adviser to any offshore funds and any sub-advised funds, on the other. The directors noted that the Adviser may, in some cases, agree to fee rates with large institutional clients that are lower than those reviewed by the directors and that they had previously discussed with the Adviser its policies in respect of such arrangements. The directors also compared the advisory fee rate for the Fund with that for another AB Fund with a similar investment style.
| 2018 Semi-Annual Report | 53 |
Table of Contents
Information Regarding the Review and Approval of the Fund’s Advisory Agreement (continued)
The Adviser reviewed with the directors the significantly greater scope of the services it provides to the Fund relative to institutional, offshore fund and sub-advised fund clients. In this regard, the Adviser noted, among other things, that, compared to institutional and offshore accounts, the Fund (i) demands considerably more portfolio management, research and trading resources due to significantly higher daily cash flows; (ii) has more tax and regulatory restrictions; (iii) must prepare and distribute regulatory and other communications about fund operations; (iv) must service, and be marketed to, retail investors and financial intermediaries; and (v) requires a larger sales support infrastructure. In light of the substantial differences in services rendered by the Adviser to institutional, offshore fund and sub-advised fund clients as compared to funds such as the Fund, the directors considered these fee comparisons inapt and did not place significant weight on them in their deliberations.
The directors also considered the total expense ratio of the Fund in comparison to a peer group and a peer universe selected by the 15(c) service provider. The expense ratio of the Fund was based on the Fund’s latest fiscal year and the directors considered the effects of any fee waivers and/or expense reimbursements as a result of the Adviser’s expense cap. The directors noted that it was likely that the expense ratios of some of the other funds in the Fund’s category were lowered by waivers or reimbursements by those funds’ investment advisers, which in some cases might be voluntary or temporary. The directors view expense ratio information as relevant to their evaluation of the Adviser’s services because the Adviser is responsible for coordinating services provided to the Fund by others. Based on their review, the directors concluded that the Fund’s expense ratio was acceptable.
Economies of Scale
The directors noted that the proposed advisory fee schedule for the Fund contains breakpoints that reduce the Fund’s fee rate on assets above specified levels. The directors took into consideration prior presentations by an independent consultant on economies of scale in the mutual fund industry and for the AB Funds, and by the Adviser concerning certain of its views on economies of scale. The directors also had requested and received from the Adviser certain updates on economies of scale in advance of the Meeting. The directors believe that economies of scale may be realized (if at all) by the Adviser across a variety of products and services, and not only in respect of a single fund. The directors noted that there is no established methodology for setting breakpoints that give effect to the fund-specific services provided by a fund’s adviser and to the economies of scale that an adviser may realize in its overall mutual fund business or those components of it which directly or indirectly affect a fund’s operations. The directors observed that in the mutual fund industry as a whole, as well as among funds similar to the Fund, there is no uniformity or pattern in the fees and asset levels at which breakpoints (if any) apply. The directors also noted that the advisory agreements for many funds do not have breakpoints at all. Having taken these factors into account, the directors concluded that the Fund’s shareholders would benefit from a sharing of economies of scale in the event the Fund’s net assets exceed a breakpoint in the future.
| 54 | Sanford C. Bernstein Fund II, Inc. |
Table of Contents

Distributor
SANFORD C. BERNSTEIN FUND II, INC.
1345 AVENUE OF THE AMERICAS, NEW YORK, NY 10105
(212) 756-4097
SCBII-2038-0318
Table of Contents
ITEM 2. CODE OF ETHICS.
Not applicable when filing a semi-annual report to shareholders.
ITEM 3. AUDIT COMMITTEE FINANCIAL EXPERT.
Not applicable when filing a semi-annual report to shareholders.
ITEM 4. PRINCIPAL ACCOUNTANT FEES AND SERVICES.
Not applicable when filing a semi-annual report to shareholders.
ITEM 5. AUDIT COMMITTEE OF LISTED REGISTRANTS.
Not applicable to the registrant.
ITEM 6. SCHEDULE OF INVESTMENTS.
Please see Schedule of Investments contained in the Report to Shareholders included under Item 1 of this Form N-CSR.
ITEM 7. DISCLOSURE OF PROXY VOTING POLICIES AND PROCEDURES FOR CLOSED-END MANAGEMENT INVESTMENT COMPANIES.
Not applicable to the registrant.
ITEM 8. PORTFOLIO MANAGERS OF CLOSED-END MANAGEMENT INVESTMENT COMPANIES.
Not applicable to the registrant.
ITEM 9. PURCHASES OF EQUITY SECURITIES BY CLOSED-END MANAGEMENT INVESTMENT COMPANY AND AFFILIATED PURCHASERS.
Not applicable to the registrant.
ITEM 10. SUBMISSION OF MATTERS TO A VOTE OF SECURITY HOLDERS.
There have been no material changes to the procedures by which shareholders may recommend nominees to the Fund’s Board of Directors since the Fund last provided disclosure in response to this item.
Table of Contents
ITEM 11. CONTROLS AND PROCEDURES.
(a) The registrant’s principal executive officer and principal financial officer have concluded that the registrant’s disclosure controls and procedures (as defined in Rule 30a-2(c) under the Investment Company Act of 1940, as amended) are effective at the reasonable assurance level based on their evaluation of these controls and procedures as of a date within 90 days of the filing date of this document.
(b) There were no changes in the registrant’s internal controls over financial reporting that occurred during the second fiscal quarter of the period that has materially affected, or is reasonably likely to materially affect, the registrant’s internal control over financial reporting.
ITEM 12. EXHIBITS.
The following exhibits are attached to this Form N-CSR:
| EXHIBIT NO. |
DESCRIPTION OF EXHIBIT | |
| 12 (b) (1) | Certification of Principal Executive Officer Pursuant to Section 302 of the Sarbanes-Oxley Act of 2002 | |
| 12 (b) (2) | Certification of Principal Financial Officer Pursuant to Section 302 of the Sarbanes-Oxley Act of 2002 | |
| 12 (c) | Certification of Principal Executive Officer and Principal Financial Officer Pursuant to Section 906 of the Sarbanes-Oxley Act of 2002 | |
Table of Contents
SIGNATURES
Pursuant to the requirements of the Securities Exchange Act of 1934 and the Investment Company Act of 1940, the registrant has duly caused this report to be signed on its behalf by the undersigned, thereunto duly authorized.
(Registrant): Sanford C. Bernstein Fund II, Inc.
| By: | /s/ Robert M. Keith | |
| Robert M. Keith | ||
| President | ||
| Date: | May 25, 2018 | |
Pursuant to the requirements of the Securities Exchange Act of 1934 and the Investment Company Act of 1940, this report has been signed below by the following persons on behalf of the registrant and in the capacities and on the dates indicated.
| By: | /s/ Robert M. Keith | |
| Robert M. Keith | ||
| President | ||
| Date: | May 25, 2018 | |
| By: | /s/ Joseph J. Mantineo | |
| Joseph J. Mantineo | ||
| Treasurer and Chief Financial Officer | ||
| Date: | May 25, 2018 | |
Exhibit 12(b)(1)
CERTIFICATION OF PRINCIPAL EXECUTIVE OFFICER
I, Robert M. Keith, President of Sanford C. Bernstein Fund II, Inc., certify that:
1. I have reviewed this report on Form N-CSR of Sanford C. Bernstein Fund II, Inc.;
2. Based on my knowledge, this report does not contain any untrue statement of a material fact or omit to state a material fact necessary to make the statements made, in light of the circumstances under which such statements were made, not misleading with respect to the period covered by this report;
3. Based on my knowledge, the financial statements, and other financial information included in this report, fairly present in all material respects the financial condition, results of operations, changes in net assets, and cash flows (if the financial statements are required to include a statement of cash flows) of the registrant as of, and for, the periods presented in this report;
4. The registrant’s other certifying officers and I are responsible for establishing and maintaining disclosure controls and procedures (as defined in Rule 30a-3(c) under the Investment Company Act of 1940) and internal control over financial reporting (as defined in Rule 30a-3(d) under the Investment Company Act of 1940) for the registrant and have:
| a) | designed such disclosure controls and procedures to ensure that material information relating to the registrant, including its consolidated subsidiaries, is made known to us by others within those entities, particularly during the period in which this report is being prepared; |
| b) | designed such internal control over financial reporting to provide reasonable assurance regarding the reliability of financial reporting and the preparation of financial statements for external purposes in accordance with generally accepted accounting principles; |
| c) | evaluated the effectiveness of the registrant’s disclosure controls and procedures and presented in this report our conclusions about the effectiveness of the disclosure controls and procedures, as of a date within 90 days prior to the filing date of this report based on such evaluation; and |
| d) | disclosed in this report any change in the registrant’s internal control over financial reporting that occurred during the second fiscal quarter of the period covered by this report that has materially affected, or is reasonably likely to materially affect, the registrant’s internal control over financial reporting; and |
5. The registrant’s other certifying officers and I have disclosed to the registrant’s auditors and the audit committee of the registrant’s board of directors (or persons performing the equivalent functions):
a) all significant deficiencies and material weaknesses in the design or operation of internal control over financial reporting which are reasonably likely to adversely affect the registrant’s ability to record, process, summarize, and report financial information; and
b) any fraud, whether or not material, that involves management or other employees who have a significant role in the registrant’s internal control over financial reporting.
Date: May 25, 2018
| /s/ Robert M. Keith |
| Robert M. Keith |
| President |
Exhibit 12(b)(2)
CERTIFICATION OF PRINCIPAL FINANCIAL OFFICER
I, Joseph J. Mantineo, Treasurer and Chief Financial Officer of Sanford C. Bernstein Fund II, Inc., certify that:
1. I have reviewed this report on Form N-CSR of Sanford C. Bernstein Fund II, Inc.;
2. Based on my knowledge, this report does not contain any untrue statement of a material fact or omit to state a material fact necessary to make the statements made, in light of the circumstances under which such statements were made, not misleading with respect to the period covered by this report;
3. Based on my knowledge, the financial statements, and other financial information included in this report, fairly present in all material respects the financial condition, results of operations, changes in net assets, and cash flows (if the financial statements are required to include a statement of cash flows) of the registrant as of, and for, the periods presented in this report;
4. The registrant’s other certifying officers and I are responsible for establishing and maintaining disclosure controls and procedures (as defined in Rule 30a-3(c) under the Investment Company Act of 1940) and internal control over financial reporting (as defined in Rule 30a-3(d) under the Investment Company Act of 1940) for the registrant and have:
| a) | designed such disclosure controls and procedures to ensure that material information relating to the registrant, including its consolidated subsidiaries, is made known to us by others within those entities, particularly during the period in which this report is being prepared; |
| b) | designed such internal control over financial reporting to provide reasonable assurance regarding the reliability of financial reporting and the preparation of financial statements for external purposes in accordance with generally accepted accounting principles; |
| c) | evaluated the effectiveness of the registrant’s disclosure controls and procedures presented in this report our conclusions about the effectiveness of the disclosure controls and procedures, as of a date within 90 days prior to the filing date of this report based on such evaluation; and |
| d) | disclosed in this report any change in the registrant’s internal control over financial reporting that occurred during the second fiscal quarter of the period covered by this report that has materially affected, or is reasonably likely to materially affect, the registrant’s internal control over financial reporting; and |
5. The registrant’s other certifying officers and I have disclosed to the registrant’s auditors and the audit committee of the registrant’s board of directors (or persons performing the equivalent functions):
a) all significant deficiencies and material weaknesses in the design or operation of internal control over financial reporting which are reasonably likely to adversely affect the registrant’s ability to record, process, summarize, and report financial information; and
b) any fraud, whether or not material, that involves management or other employees who have a significant role in the registrant’s internal control over financial reporting.
Date: May 25, 2018
| /s/ Joseph J. Mantineo |
| Joseph J. Mantineo |
| Treasurer and Chief Financial Officer |
EXHIBIT 12(c)
CERTIFICATION PURSUANT TO SECTION 906 OF THE
SARBANES-OXLEY ACT
Pursuant to 18 U.S.C. 1350, each of the undersigned, being the Principal Executive Officer and Principal Financial Officer of Sanford C. Bernstein Fund II, Inc. (the “Registrant”), hereby certifies that the Registrant’s report on Form N-CSR for the period ended March 31, 2018 (the “Report”) fully complies with the requirements of Section 13(a) or 15(d) of the Securities Exchange Act of 1934 and that the information contained in the Report fairly presents, in all material respects, the financial condition and results of operations of the Registrant.
Date: May 25, 2018
| By: | /s/ Robert M. Keith | |
| Robert M. Keith | ||
| President | ||
| By: | /s/ Joseph J. Mantineo | |
| Joseph J. Mantineo | ||
| Treasurer and Chief Financial Officer | ||
This certification is being furnished solely pursuant to Section 906 of the Sarbanes-Oxley Act of 2002 and is not being filed as part of the Report or as a separate disclosure document.
A signed original of this written statement required by Section 906 has been provided to the Registrant and will be retained by the Registrant and furnished to the Securities and Exchange Commission or its staff upon request.
Serious News for Serious Traders! Try StreetInsider.com Premium Free!
You May Also Be Interested In
- Bernstein on Tesla: 'Widespread deployment of FSD is 5 - 10 years away'
- Bernstein SocGen Group Has 3 Problems with CNH Industrial NV (CNHI) CEO Change
- Adidas (ADDYY) stock rises after outlook boost
Create E-mail Alert Related Categories
SEC FilingsRelated Entities
Sanford C. BernsteinSign up for StreetInsider Free!
Receive full access to all new and archived articles, unlimited portfolio tracking, e-mail alerts, custom newswires and RSS feeds - and more!
