

Form N-CSRS ADVISORS SERIES TRUST For: Apr 30
 Tweet
Tweet Share
ShareUNITED STATES
SECURITIES AND EXCHANGE COMMISSION
Washington, D.C. 20549
SECURITIES AND EXCHANGE COMMISSION
Washington, D.C. 20549
FORM N-CSR
CERTIFIED SHAREHOLDER REPORT OF REGISTERED
MANAGEMENT INVESTMENT COMPANIES
Investment Company Act file number 811-07959
Advisors Series Trust
(Exact name of registrant as specified in charter)
(Exact name of registrant as specified in charter)
615 East Michigan Street
Milwaukee, Wisconsin 53202
(Address of principal executive offices) (Zip code)
(Address of principal executive offices) (Zip code)
Douglas G. Hess, President/Chief Executive Officer
Advisors Series Trust
c/o U.S. Bancorp Fund Services, LLC
777 East Wisconsin Avenue, 5th Floor
Milwaukee, Wisconsin 53202
(Name and address of agent for service)
(Name and address of agent for service)
(Registrant's telephone number, including area code): (414) 765-6872
Date of fiscal year end: October 31, 2018
Date of reporting period: April 30, 2018
Item 1. Reports to Stockholders.
HUBER CAPITAL EQUITY INCOME FUND
HUBER CAPITAL SMALL CAP VALUE FUND
HUBER CAPITAL DIVERSIFIED
LARGE CAP VALUE FUND
HUBER CAPITAL MID CAP VALUE FUND
Investor Class
Institutional Class
SEMI-ANNUAL REPORT
April 30, 2018
Huber Funds
TABLE OF CONTENTS
|
Letter to Shareholders
|
1
|
|
Expense Example
|
7
|
|
Sector Allocation of Portfolio Assets
|
10
|
|
Schedule of Investments
|
12
|
|
Statements of Assets And Liabilities
|
26
|
|
Statements of Operations
|
30
|
|
Statements of Changes in Net Assets
|
32
|
|
Financial Highlights
|
40
|
|
Notes to Financial Statements
|
48
|
|
Notice to Shareholders
|
62
|
|
Approval of Investment Advisory Agreement
|
63
|
|
Householding
|
71
|
|
Privacy Notice
|
72
|
May 31, 2018
Dear Shareholder:
The fiscal six-month period ended April 30, 2018, was dominated by large cap growth companies, as seen in outperformance of the Russell 1000® Growth Index. This is similar to 2017, however the last six months saw a rebound in commodity prices, making energy the strongest performing sector in both the Russell 1000® Value and Russell 2000® Value Indices, while technology led the Russell 1000® Growth Index. Despite growth outperforming, we continue to believe value will return to favor should commodity prices and equity valuations continue normalizing.
During the six-months ended April 30, 2018, the Huber Capital Equity Income Fund (“Equity Income Fund”) and Huber Capital Diversified Large Cap Value Fund (“Diversified Large Cap Value Fund”) both underperformed the Russell 1000® Value Index, their primary benchmark. The Huber Capital Small Cap Value Fund (“Small Cap Value Fund”) outperformed the Russell 2000® Value Index, the Fund’s primary benchmark. The Huber Capital Mid Cap Value Fund (“Mid Cap Value Fund”) outperformed the Russell Midcap® Value Index, its primary benchmark.
Equity Income Fund Review
For the fiscal six-month period ended April 30, 2018, the Equity Income Fund Investor Class and Institutional Class returned -0.19% and -0.05%, respectively, underperforming the 1.94% total return of the Russell 1000® Value Index and the 3.82% total return of the S&P 500® Index. The sectors that contributed most positively to the Fund’s performance relative to the benchmark Russell 1000® Value Index were technology, utilities and health care, while energy, producer durables and consumer discretionary were the largest detractors. On an individual stock basis, our best relative performers were Microsoft Corp. (“Microsoft”), Regal Entertainment Group – Class A (“Regal Entertainment”) and Voya Financial, Inc. (“Voya”), while our worst performers were KBR, Inc. (“KBR”), Philip Morris International, Inc. (“Philip Morris”) and Tupperware Brands Corporation (“Tupperware Brands”).
The Equity Income Fund was most positively impacted by its ownership of Microsoft, a company engaged in developing, licensing and supporting software products and services. Microsoft’s cloud service business executed well. In general, the company continued to transition from lower growth legacy desktop and Windows products into the high growth Intelligent Cloud segment, specifically their Azure product offering, which continued to grow rapidly and capture market share. The share price of Regal Entertainment, a position we initiated in the Fund during the latter half of 2017, benefitted from the company’s merger with Cineworld. We have since exited the position following its strong performance. Voya, a financial planning and insurance company,
1
demonstrated strong cash flow generation, which was deployed towards a new share repurchase program, a move viewed favorably by investors.
The Equity Income Fund was most negatively impacted by its ownership in KBR, a construction and engineering company. The share price declined despite strong earnings, as the company was required to contribute cash to a joint venture in order to fund completion of a power plant project. Its stock price also reacted negatively when the company announced they may issue equity to finance an acquisition. Philip Morris, a holding company engaged in tobacco and cigarette manufacturing, reported disappointing 1Q18 results that showed slowing growth of its key IQOS product in Japan. This caused investors to downgrade their assessment of the company’s future growth rate and therefore its valuation. We view the investor reaction as overly severe and view the shares attractively. Tupperware Brands, a global producer and marketer of kitchen storage containers, experienced share price weakness due to lower than expected organic growth rates.
Small Cap Value Fund Review
For the fiscal six-month period ended April 30, 2018, the Small Cap Value Fund Investor Class and Institutional Class returned 6.71% and 6.90%, respectively. The Fund outperformed the 0.94% total return of the Russell 2000® Value Index benchmark and the 3.27% total return of the Russell 2000® Index. Sectors that contributed most positively to the Fund’s performance relative to the benchmark Russell 2000® Value Index were technology, financial services and materials & processing, while the most notable detractors were consumer discretionary and producer durables. The most notable contributors to relative performance were Comtech Telecommunications Corp. (“Comtech”), Enova International Inc. (“Enova”) and Golar LNG Ltd. (“GLNG”). The Fund’s most notable detractors from relative performance were KBR, Tupperware Brands and Government Properties Income Trust.
The Fund was most positively impacted by its ownership of Comtech Telecommunications, a communications solutions provider for military and civilian applications. Comtech Telecommunications reported strong operating results and increased guidance after securing large contracts with the U.S. Army and a large domestic wireless carrier (Wireless E911). We believe the company’s outlook for future revenue and earnings growth remains positive on the heels of these new contract wins. The share price of Enova, a leading provider of online financial services to consumers and small businesses, increased after the company announced better than expected cost containment and loan originations. In addition to stronger business fundamentals, the regulatory environment appears to be improving, as certain aspects of Dodd-Frank appear likely to be overturned by Senate Bill 2155, creating a potential tailwind for Enova. Golar LNG Ltd., a master limited partnership that owns and operates Floating Storage Regasification Units (FSRU’s), LNG Carriers
2
(LNGC’s), and Floating Liquefaction Units (FLNG’s), had favorable performance due to their multiyear contracted backlog and soon to be completed dropdown of the Hilli Episeyo, an FLNG vessel.
The Fund was negatively impacted the most by its ownership in KBR and Tupperware Brands, both discussed earlier in this letter. Government Income Properties Trust, a real estate investment trust (“REIT”) which invests primarily in properties on long-term lease to government tenants, was impacted by rising rates which cause some REITs to underperform. The company generated an attractive dividend yield above 10%.
Diversified Large Cap Value Fund Review
For the fiscal six-month period ended April 30, 2018, the Diversified Large Cap Value Fund Investor Class and Institutional Class returned 0.40% and 0.55%, respectively, underperforming the 1.94% total return of the Russell 1000® Value Index, and underperforming the 3.82% total return of the broader S&P 500® Index. Sectors that contributed most positively to the Fund’s performance relative to the benchmark Russell 1000® Value Index were utilities, health care and technology, while energy, producer durables and consumer discretionary were the most notable detractors. Stocks that were most accretive to relative performance were Microsoft, JPMorgan Chase & Co. (“JPMorgan Chase”) and Bank of America Corp. (“Bank of America”). The most notable detractors were KBR, Phillip Morris and Arconic, Inc. (“Arconic”).
The Fund’s strongest positive contributor, Microsoft, was discussed earlier in this letter. JPMorgan Chase and Bank of America, multinational financial services companies, posted strong performance due to an improving regulatory environment and rising interest rates.
The Fund’s largest detractors, KBR and Phillip Morris, were discussed earlier in this letter. Arconic, a spin-off from Alcoa that is engaged in lightweight metals engineering and manufacturing, declined as operational issues at several facilities impacted profitability despite generally strong end-market demand. Although recent quarterly results were better than expected, the company lowered full-year guidance for earnings and free cash flow.
Mid Cap Value Fund Review
For the fiscal six-month period ended April 30, 2018, the Mid Cap Value Fund Investor Class and Institutional Class returned 7.66% and 7.82%, respectively, versus the 2.55% total return of the Russell Midcap® Value Index. The sectors that contributed most positively to the Fund’s performance relative to the benchmark Russell Midcap® Value Index were technology, materials & processing and financial services, while the sectors that detracted the most from relative performance were producer durables and consumer discretionary. Stocks that were most additive to relative performance were Comtech Telecommunications,
3
Enova International and HighPoint Resources Corp. (“HighPoint Resources”). Stocks that detracted the most from relative performance were KBR, Tupperware Brands and Government Properties Income Trust.
The Fund’s largest positive contributors, Comtech Telecommunications and Enova, were discussed earlier in this letter. HighPoint Resources, an exploration and production company focused on developing oil and natural gas assets in the U.S., benefited from completing the acquisition of Fifth Creek Energy during the period, which led to increased guidance for the year.
The Fund was negatively impacted the most by its ownership in KBR, Tupperware Brands and Government Properties Income Trust, all discussed earlier in this letter.
Outlook
Following a strong 2017, equities continued advancing in 2018, despite some downside volatility in February and March. In terms of style, growth outpaced value, yet we remain steadfast in the long-term outlook of our deep value philosophy. Though equity valuations appear stretched due to improving macroeconomic trends and earnings growth, we believe tailwinds for equities will continue in the near-term. Huber Capital Management is of the opinion that the end of the complacency cycle is near. It remains to be seen what the rest of the year will bring, as the anticipated rate hikes and trade-war discussions continue.
Huber Capital Management is optimistic with respect to its Funds. Despite a generally upward market over the past three years, which created a headwind for active managers, the team remains committed to Huber Capital’s philosophy and process, populating its Funds with companies we believe embody meaningful upside potential and tangible valuation support. It continues to be our view that a company’s valuation ultimately reverts to reflect its normalized cash generation capabilities and that investing in companies trading at a discount to normalized earnings should produce superior risk-adjusted returns over time.
Consistent with our value philosophy, we strive to generate outperformance through fundamental bottom-up investing, rather than betting on macroeconomic factors. In our view, benchmarks have become price momentum strategies, a trend exacerbated by the shift to passive investing, and index sector weights often fail to reflect factor weights in the broader economy. Furthermore, frequently used classification schema (i.e., GICS) may assign companies to sectors which, we believe, do not accurately reflect the company’s primary exposure. For this reason, although we maintain macroeconomic factor neutrality, we may at certain times appear over- or under-weight relative to the sector weights of the Funds’ corresponding benchmarks.
Currently, relative to the Russell 1000® Value Index, the Equity Income Fund is overweight producer durables and technology and underweight utilities, health
4
care, material & processing, financial services, energy, consumer discretionary and consumer staples. Relative to the Russell 2000® Value Index, the Small Cap Value Fund is overweight materials & processing, technology and energy and underweight consumer discretionary, health care, financial services, utilities and producer durables. Relative to the Russell 1000® Value Index, the Diversified Large Cap Value Fund is overweight producer durables, technology and consumer staples and underweight health care, financial services, utilities, materials & processing, energy and consumer discretionary. Relative to the Russell Midcap® Value Index, the Mid Cap Value Fund is overweight technology, energy, materials & processing, producer durables and financial services and underweight consumer discretionary, utilities, health care and consumer staples.
Thank you for your support and for entrusting us with your investment dollars. We continue to work hard to earn your trust and aim to meet your investment needs in the years to come.
Sincerely,
The Huber Capital Management Team
Past performance is not a guarantee of future results.
Mutual fund investing involves risk. Principal loss is possible. The Funds may invest in foreign securities which involve greater volatility and political, economic and currency risks and differences in accounting methods. The risks are greater for investments in emerging markets. Additionally, the Funds are subject to sector emphasis risk meaning that companies in the same or related businesses may comprise a significant portion of a Fund’s portfolio and adversely affect the value of the portfolio to a greater extent than if such business comprised a lesser portion of a portfolio. Investments in initial public offerings (“IPOs”) carry additional risk such as market and liquidity risk and can fluctuate considerably. When a Fund’s asset base is small, the impact of IPOs on the Fund’s performance could be magnified. Investments in smaller companies involve additional risks such as limited liquidity and greater volatility. Small- and medium-capitalization companies tend to have limited liquidity and greater price volatility than large-capitalization companies. Value stocks have a lower expected growth rate in earnings and sales, versus growth stocks.
Fund holdings and sector allocations are subject to change at any time and should not be considered a recommendation to buy or sell any security. Please see the schedule of investments in this report for complete Fund holdings.
Current and future portfolio holdings are subject to risk.
The information provided herein represents the opinion of Huber Capital Management, LLC and is not intended to be a forecast of future events, a guarantee of future results, nor investment advice.
The Russell 1000® Growth Index is an unmanaged market capitalization-weighted index of growth-oriented stocks of the largest U.S. domiciled companies that are included in the Russell 1000 Index. Growth-oriented stocks tend to have higher price-to-book ratios and higher forecasted growth values.
5
The S&P 500® Index, an unmanaged index, consists of 500 stocks chosen for market size, liquidity, and industry group representation. It is a market-value weighted index (stock price times number of shares outstanding), with each stock’s weight in the Index proportionate to its market value.
The Russell 1000® Value Index measures the performance of those Russell 1000® companies with lower price-to-book ratios and lower forecasted growth values.
The Russell 2000® Index, an unmanaged index, is comprised of the 2,000 smallest companies in the Russell 3000® Index.
The Russell 2000® Value Index measures the performance of those Russell 2000® companies with lower price-to-book ratios and lower forecasted growth values.
The Russell Midcap® Value Index, an unmanaged index, measures the performance of the mid-cap value segment of the U.S. equity universe. It is a market capitalization weighted index representing the smallest 800 companies of the Russell 1000® Index. It includes those Russell Midcap companies with lower price-to-book ratios and lower expected growth values.
The indexes do not reflect the payment of transaction costs, fees and expenses associated with an investment in the Funds. The Funds’ value disciplines may prevent or restrict investment in major stocks in the benchmark indices. It is not possible to invest directly in an index. The Funds’ returns may not correlate with the returns of their benchmark indexes.
Cash flow measures the cash generating capability of a company by adding non-cash charges (e.g., depreciation) and interest expense to pretax income.
Free cash flow is the cash that a company generates after paying its expenses and maintaining its current asset base, the remainder of which is then available to pursue further opportunities that enhance shareholder value. Free cash flow is calculated by adding non-cash charges (e.g. depreciation) to net income and subtracting maintenance capital expenditures.
Diversification does not assure a profit, nor does it protect against a loss in a declining market.
6
Huber Funds
EXPENSE EXAMPLE – April 30, 2018 (Unaudited)
As a shareholder of a mutual fund, you incur two types of costs: (1) transaction costs, including sales charges (loads) on purchase payments, redemption fees, and exchange fees, and (2) ongoing costs, including management fees, distribution and/or service fees, and other Fund expenses. These Examples are intended to help you understand your ongoing costs (in dollars) of investing in the Funds and to compare these costs with the ongoing costs of investing in other mutual funds. The Huber Capital Equity Income Fund (“Equity Income Fund”), Huber Capital Small Cap Value Fund (“Small Cap Value Fund”), Huber Capital Diversified Large Cap Value Fund (“Diversified Large Cap Value Fund”), and Huber Capital Mid Cap Value Fund (“Mid Cap Value Fund”) Examples are based on an investment of $1,000 invested at the beginning of the period and held for the entire period (11/1/17 – 4/30/18).
Actual Expenses
For each class of the Equity Income Fund, the Small Cap Value Fund, the Diversified Large Cap Value Fund and the Mid Cap Value Fund two lines are presented in the tables below – the first line for each class provides information about actual account values and actual expenses. Actual net expenses are limited to 1.39% for Investor Class shares and 0.99% for Institutional Class shares of the Equity Income Fund, 1.75% for Investor Class shares and 1.35% for Institutional Class shares of the Small Cap Value Fund, 1.15% for Investor Class shares and 0.75% for Institutional Class shares of the Diversified Large Cap Value Fund, and 1.40% for Investor Class shares and 1.10% for Institutional Class shares of the Mid Cap Value Fund per the operating expenses limitation agreement. In addition, you may be assessed a fee for outgoing wire transfers, returned checks, and stop payment orders at prevailing rates charged by U.S. Bancorp Fund Services, LLC, the Funds’ transfer agent. The Examples below include, but are not limited to, management fees, fund accounting, custody and transfer agent fees. You may use the information in this line, together with the amount you invested, to estimate the expenses that you paid over the period. Simply divide your account value by $1,000 (for example, an $8,600 account value divided by $1,000 = 8.6), then multiply the result by the number in the first line under the heading entitled “Expenses Paid During Period” for your Fund and class to estimate the expenses you paid on your account during this period.
7
Huber Funds
EXPENSE EXAMPLE – April 30, 2018 (Unaudited), Continued
Hypothetical Example for Comparison Purposes
For each class of each Fund, the second line for each class provides information about hypothetical account values and hypothetical expenses based on the respective Fund’s actual expense ratio and an assumed rate of return of 5% per year before expenses, which is not the Fund’s actual return. The hypothetical account values and expenses may not be used to estimate the actual ending account balance or expenses you paid for the period. You may use this information to compare the ongoing costs of investing in the Funds and other funds. To do so, compare this 5% hypothetical example with the 5% hypothetical examples that appear in the shareholder reports of the other funds. Please note that the expenses shown in the table are meant to highlight your ongoing costs only and do not reflect any transaction costs, such as sales charges (loads), redemption fees, or exchange fees. Therefore, the second line of the table is useful in comparing ongoing costs only, and will not help you determine the relative total costs of owning different funds. In addition, if these transaction costs were included, your costs would have been higher.
Equity Income Fund
|
Beginning
|
Ending
|
Expenses Paid
|
Annualized
|
|
|
Account Value
|
Account Value
|
During Period
|
Expense
|
|
|
11/1/17
|
4/30/18
|
11/1/17 – 4/30/18
|
Ratio*
|
|
|
Investor Class
|
||||
|
Actual
|
$1,000.00
|
$ 998.10
|
$6.74
|
1.36%
|
|
Hypothetical (5% return
|
||||
|
before expenses)
|
$1,000.00
|
$1,018.05
|
$6.81
|
1.36%
|
|
Institutional Class
|
||||
|
Actual
|
$1,000.00
|
$ 999.50
|
$4.91
|
0.99%
|
|
Hypothetical (5% return
|
||||
|
before expenses)
|
$1,000.00
|
$1,019.89
|
$4.96
|
0.99%
|
Small Cap Value Fund
|
Beginning
|
Ending
|
Expenses Paid
|
Annualized
|
|
|
Account Value
|
Account Value
|
During Period
|
Expense
|
|
|
11/1/17
|
4/30/18
|
11/1/17 – 4/30/18
|
Ratio*
|
|
|
Investor Class
|
||||
|
Actual
|
$1,000.00
|
$1,067.10
|
$8.71
|
1.70%
|
|
Hypothetical (5% return
|
||||
|
before expenses)
|
$1,000.00
|
$1,016.36
|
$8.50
|
1.70%
|
|
Institutional Class
|
||||
|
Actual
|
$1,000.00
|
$1,069.00
|
$6.93
|
1.35%
|
|
Hypothetical (5% return
|
||||
|
before expenses)
|
$1,000.00
|
$1,018.10
|
$6.76
|
1.35%
|
8
Huber Funds
EXPENSE EXAMPLE – April 30, 2018 (Unaudited), Continued
Diversified Large Cap Value Fund
|
Beginning
|
Ending
|
Expenses Paid
|
Annualized
|
|
|
Account Value
|
Account Value
|
During Period
|
Expense
|
|
|
11/1/17
|
4/30/18
|
11/1/17 – 4/30/18
|
Ratio*
|
|
|
Investor Class
|
||||
|
Actual
|
$1,000.00
|
$1,004.00
|
$4.97
|
1.00%
|
|
Hypothetical (5% return
|
||||
|
before expenses)
|
$1,000.00
|
$1,019.84
|
$5.01
|
1.00%
|
|
Institutional Class
|
||||
|
Actual
|
$1,000.00
|
$1,005.50
|
$3.73
|
0.75%
|
|
Hypothetical (5% return
|
||||
|
before expenses)
|
$1,000.00
|
$1,021.08
|
$3.76
|
0.75%
|
Mid Cap Value Fund
|
Beginning
|
Ending
|
Expenses Paid
|
Annualized
|
|
|
Account Value
|
Account Value
|
During Period
|
Expense
|
|
|
11/1/17
|
4/30/18
|
11/1/17 – 4/30/18
|
Ratio*
|
|
|
Investor Class
|
||||
|
Actual
|
$1,000.00
|
$1,076.60
|
$6.69
|
1.30%
|
|
Hypothetical (5% return
|
||||
|
before expenses)
|
$1,000.00
|
$1,018.35
|
$6.51
|
1.30%
|
|
Institutional Class
|
||||
|
Actual
|
$1,000.00
|
$1,078.20
|
$5.10
|
0.99%
|
|
Hypothetical (5% return
|
||||
|
before expenses)
|
$1,000.00
|
$1,019.89
|
$4.96
|
0.99%
|
|
*
|
Expenses are equal to the annualized expense ratio of each class, multiplied by the average account value over the period, multiplied by 181 (days in most recent fiscal half-year) / 365 days to reflect the one-half year expense.
|
9
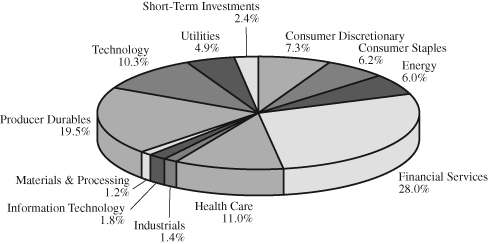
Huber Funds
SECTOR ALLOCATION OF PORTFOLIO ASSETS – April 30, 2018 (Unaudited)
HUBER CAPITAL EQUITY INCOME FUND
HUBER CAPITAL SMALL CAP VALUE FUND

Percentages represent market value as a percentage of total investments.
10
Huber Funds
SECTOR ALLOCATION OF PORTFOLIO ASSETS – April 30, 2018 (Unaudited)
HUBER CAPITAL DIVERSIFIED LARGE CAP VALUE FUND

HUBER CAPITAL MID CAP VALUE FUND

Percentages represent market value as a percentage of total investments.
11
Huber Capital Equity Income Fund
SCHEDULE OF INVESTMENTS at April 30, 2018 (Unaudited)
|
Shares
|
COMMON STOCKS - 97.97%
|
Value
|
|||||
|
Aerospace & Defense - 7.86%
|
|||||||
|
60,335
|
Arconic, Inc.
|
$
|
1,074,566
|
||||
|
15,800
|
Northrop Grumman Corp.
|
5,088,232
|
|||||
|
6,162,798
|
|||||||
|
Air Transport - 2.68%
|
|||||||
|
8,500
|
FedEx Corp.
|
2,101,200
|
|||||
|
Banks: Diversified - 4.47%
|
|||||||
|
39,600
|
SunTrust Banks, Inc.
|
2,645,280
|
|||||
|
16,500
|
Wells Fargo & Co.
|
857,340
|
|||||
|
3,502,620
|
|||||||
|
Chemicals: Diversified - 0.85%
|
|||||||
|
25,600
|
BASF SE - ADR
|
666,880
|
|||||
|
Computer Services, Software
|
|||||||
|
& Systems - 8.77%
|
|||||||
|
48,300
|
CA, Inc.
|
1,680,840
|
|||||
|
50,700
|
Microsoft Corp.
|
4,741,464
|
|||||
|
10,000
|
Oracle Corp.
|
456,700
|
|||||
|
6,879,004
|
|||||||
|
Computer Technology - 1.48%
|
|||||||
|
37,500
|
Hewlett Packard Enterprise Co.
|
639,375
|
|||||
|
24,300
|
HP, Inc.
|
522,207
|
|||||
|
1,161,582
|
|||||||
|
Diversified Financial Services - 14.68%
|
|||||||
|
113,600
|
Bank of America Corp.
|
3,398,912
|
|||||
|
56,000
|
Citigroup, Inc.
|
3,823,120
|
|||||
|
39,400
|
JPMorgan Chase & Co.
|
4,285,932
|
|||||
|
11,507,964
|
|||||||
|
Diversified Retail - 2.09%
|
|||||||
|
18,500
|
Wal-Mart Stores, Inc.
|
1,636,510
|
|||||
|
Electronic Components - 0.71%
|
|||||||
|
6,095
|
TE Connectivity Ltd.
|
559,216
|
|||||
|
Engineering & Contracting Services - 5.81%
|
|||||||
|
273,241
|
KBR, Inc.
|
4,560,392
|
|||||
|
Financial Data & Systems - 1.27%
|
|||||||
|
5,600
|
Mastercard, Inc. - Class A
|
998,312
|
|||||
The accompanying notes are an integral part of these financial statements.
12
Huber Capital Equity Income Fund
SCHEDULE OF INVESTMENTS at April 30, 2018 (Unaudited), Continued
|
Shares
|
Value
|
||||||
|
Foods - 2.90%
|
|||||||
|
22,100
|
ConAgra Foods, Inc.
|
$
|
819,247
|
||||
|
20,800
|
Tyson Foods, Inc. - Class A
|
1,458,080
|
|||||
|
2,277,327
|
|||||||
|
Homebuilding - 1.66%
|
|||||||
|
30,468
|
Lennar Corp. - Class B
|
1,300,679
|
|||||
|
Insurance Carriers - 1.29%
|
|||||||
|
11,900
|
Brighthouse Financial, Inc. (b)
|
604,282
|
|||||
|
7,400
|
XL Group Ltd. (a)
|
411,366
|
|||||
|
1,015,648
|
|||||||
|
Insurance: Life - 4.57%
|
|||||||
|
167,000
|
CNO Financial Group, Inc.
|
3,580,480
|
|||||
|
Insurance: Multi-Line - 3.13%
|
|||||||
|
14,200
|
American International Group, Inc.
|
795,200
|
|||||
|
31,704
|
Voya Financial, Inc.
|
1,659,705
|
|||||
|
2,454,905
|
|||||||
|
Media - 1.14%
|
|||||||
|
9,400
|
Time Warner, Inc.
|
891,120
|
|||||
|
Oil: Crude Producers - 0.87%
|
|||||||
|
229,300
|
Chesapeake Energy Corp. (b)
|
681,021
|
|||||
|
Oil: Integrated - 3.84%
|
|||||||
|
30,200
|
BP plc - ADR
|
1,346,618
|
|||||
|
23,834
|
Royal Dutch Shell plc - Class A - ADR
|
1,665,997
|
|||||
|
3,012,615
|
|||||||
|
Oil Well Equipment & Services - 1.30%
|
|||||||
|
180,000
|
Ensco plc - Class A
|
1,017,000
|
|||||
|
Pharmaceuticals - 11.05%
|
|||||||
|
2,900
|
Allergan plc (a)
|
445,585
|
|||||
|
39,000
|
Eli Lilly & Co.
|
3,161,730
|
|||||
|
41,700
|
Merck & Co., Inc.
|
2,454,879
|
|||||
|
71,100
|
Pfizer, Inc.
|
2,602,971
|
|||||
|
8,665,165
|
|||||||
|
Shipping - 4.59%
|
|||||||
|
153,980
|
Euronav SA (a)
|
1,254,937
|
|||||
|
116,912
|
Golar LNG Partners LP (a)
|
2,345,255
|
|||||
|
3,600,192
|
|||||||
The accompanying notes are an integral part of these financial statements.
13
Huber Capital Equity Income Fund
SCHEDULE OF INVESTMENTS at April 30, 2018 (Unaudited), Continued
|
Shares
|
Value
|
||||||
|
Specialty Retail - 2.45%
|
|||||||
|
10,400
|
Home Depot, Inc.
|
$
|
1,921,920
|
||||
|
Steel - 0.31%
|
|||||||
|
4,615
|
Carpenter Technology Corp.
|
245,795
|
|||||
|
Tobacco - 3.33%
|
|||||||
|
31,800
|
Philip Morris International, Inc.
|
2,607,600
|
|||||
|
Utilities: Electrical - 4.87%
|
|||||||
|
17,000
|
Entergy Corp.
|
1,387,030
|
|||||
|
61,300
|
Exelon Corp.
|
2,432,384
|
|||||
|
3,819,414
|
|||||||
|
TOTAL COMMON STOCKS
|
|||||||
|
(Cost $47,436,462)
|
76,827,359
|
||||||
|
SHORT-TERM INVESTMENTS - 2.38%
|
|||||||
|
933,015
|
Morgan Stanley Institutional Liquidity
|
||||||
|
Funds - Government Portfolio, 1.61% (c)
|
933,015
|
||||||
|
933,014
|
Morgan Stanley Institutional Liquidity
|
||||||
|
Funds - Treasury Portfolio, 1.59% (c)
|
933,014
|
||||||
|
TOTAL SHORT TERM INVESTMENTS
|
|||||||
|
(Cost $1,866,029)
|
1,866,029
|
||||||
|
TOTAL INVESTMENTS IN SECURITIES
|
|||||||
|
(Cost $49,302,491) - 100.35%
|
78,693,388
|
||||||
|
Liabilities in Excess of
|
|||||||
|
Other Assets - (0.35)%
|
(275,825
|
)
|
|||||
|
NET ASSETS - 100.00%
|
$
|
78,417,563
|
|||||
ADR – American Depository Receipt
|
(a)
|
Foreign issued security.
|
|
(b)
|
Non-income producing security.
|
|
(c)
|
Rate shown is the 7-day annualized yield as of April 30, 2018.
|
The accompanying notes are an integral part of these financial statements.
14
Huber Capital Small Cap Value Fund
SCHEDULE OF INVESTMENTS at April 30, 2018 (Unaudited)
|
Shares
|
COMMON STOCKS - 95.95%
|
Value
|
|||||
|
Aluminum - 2.17%
|
|||||||
|
16,646
|
Kaiser Aluminum Corp.
|
$
|
1,640,297
|
||||
|
Asset Management & Custodian - 9.35%
|
|||||||
|
77,700
|
BrightSphere Investment Group plc (a)
|
1,178,709
|
|||||
|
743,583
|
Uranium Participation Corp. (a) (b)
|
2,247,052
|
|||||
|
31,486
|
Virtus Investment Partners, Inc.
|
3,631,910
|
|||||
|
7,057,671
|
|||||||
|
Banks: Diversified - 12.49%
|
|||||||
|
55,236
|
Atlantic Capital Bancshares, Inc. (b)
|
1,066,055
|
|||||
|
1,527
|
C&F Financial Corp.
|
88,413
|
|||||
|
14,057
|
Capstar Financial Holdings, Inc. (b)
|
268,348
|
|||||
|
10,195
|
Carter Bank & Trust (b)
|
178,617
|
|||||
|
19,691
|
First Bancorp
|
751,212
|
|||||
|
8,477
|
First Citizens BancShares, Inc. - Class A
|
3,664,522
|
|||||
|
186,131
|
First Horizon National Corp.
|
3,406,197
|
|||||
|
9,423,364
|
|||||||
|
Chemicals: Specialty - 5.28%
|
|||||||
|
54,795
|
Innospec, Inc.
|
3,983,596
|
|||||
|
Commercial Vehicles & Parts - 0.94%
|
|||||||
|
28,552
|
Miller Industries, Inc.
|
706,662
|
|||||
|
Communications Equipment - 9.83%
|
|||||||
|
242,387
|
Comtech Telecommunications Corp.
|
7,414,618
|
|||||
|
Computer Services, Software
|
|||||||
|
& Systems - 3.23%
|
|||||||
|
28,400
|
Science Applications International Corp.
|
2,436,436
|
|||||
|
Consumer Lending - 6.66%
|
|||||||
|
90,207
|
Enova International, Inc. (b)
|
2,643,065
|
|||||
|
128,971
|
EZCORP, Inc. - Class A (b)
|
1,766,903
|
|||||
|
11,655
|
Nelnet, Inc. - Class A
|
615,500
|
|||||
|
5,025,468
|
|||||||
|
Containers & Packaging - 0.52%
|
|||||||
|
11,883
|
UFP Technologies, Inc. (b)
|
395,110
|
|||||
|
Diversified Manufacturing Operations - 1.42%
|
|||||||
|
52,358
|
Harsco Corp. (b)
|
1,070,721
|
|||||
|
Engineering & Contracting Services - 5.13%
|
|||||||
|
231,805
|
KBR, Inc.
|
3,868,826
|
|||||
The accompanying notes are an integral part of these financial statements.
15
Huber Capital Small Cap Value Fund
SCHEDULE OF INVESTMENTS at April 30, 2018 (Unaudited), Continued
|
Shares
|
Value
|
||||||
|
Equity REIT - Timber - 1.11%
|
|||||||
|
64,197
|
CatchMark Timber Trust, Inc. - Class A
|
$
|
837,129
|
||||
|
Health Care Equipment & Surplus - 1.37%
|
|||||||
|
15,951
|
CONMED Corp.
|
1,037,294
|
|||||
|
Health Care Facilities - 1.10%
|
|||||||
|
34,677
|
Tenet Healthcare Corp. (b)
|
830,167
|
|||||
|
Health Care Providers & Services - 0.04%
|
|||||||
|
1,800
|
Hanger, Inc. (b)
|
32,940
|
|||||
|
Homebuilding - 2.51%
|
|||||||
|
70,475
|
William Lyon Homes - Class A (b)
|
1,892,958
|
|||||
|
Insurance: Life - 3.84%
|
|||||||
|
135,287
|
CNO Financial Group, Inc.
|
2,900,554
|
|||||
|
Oil: Crude Producers - 4.17%
|
|||||||
|
126,100
|
Chesapeake Energy Corp. (b)
|
374,517
|
|||||
|
400,700
|
HighPoint Resources Corp. (b)
|
2,768,837
|
|||||
|
3,143,354
|
|||||||
|
Oil, Gas & Consumable Fuels - 2.05%
|
|||||||
|
86,594
|
Hoegh LNG Partners LP (a)
|
1,545,703
|
|||||
|
Oil Well Equipment & Services - 3.27%
|
|||||||
|
134,277
|
Ensco plc - Class A
|
758,665
|
|||||
|
83,700
|
Superior Energy Services, Inc. (b)
|
898,101
|
|||||
|
206,507
|
TETRA Technologies, Inc. (b)
|
811,573
|
|||||
|
2,468,339
|
|||||||
|
Paper - 1.40%
|
|||||||
|
30,662
|
Kapstone Paper and Packaging Corp.
|
1,055,386
|
|||||
|
Real Estate Investment
|
|||||||
|
Trusts (REITs) - 5.42%
|
|||||||
|
125,443
|
Government Properties Income Trust
|
1,566,783
|
|||||
|
63,908
|
Granite Real Estate Investment Trust (a)
|
2,525,005
|
|||||
|
4,091,788
|
|||||||
|
Restaurants - 1.45%
|
|||||||
|
31,642
|
Boston Pizza Royalties Income Fund (a)
|
494,857
|
|||||
|
55,574
|
Pizza Pizza Royalty Corp. (a)
|
598,612
|
|||||
|
1,093,469
|
|||||||
The accompanying notes are an integral part of these financial statements.
16
Huber Capital Small Cap Value Fund
SCHEDULE OF INVESTMENTS at April 30, 2018 (Unaudited), Continued
|
Shares
|
Value
|
||||||
|
Shipping - 4.73%
|
|||||||
|
68,986
|
Golar LNG Ltd. (a)
|
$
|
2,217,900
|
||||
|
1,173,569
|
Teekay Tankers Ltd. - Class A
|
1,349,604
|
|||||
|
3,567,504
|
|||||||
|
Steel - 1.23%
|
|||||||
|
17,446
|
Carpenter Technology Corp.
|
929,174
|
|||||
|
Telecommunications Equipment - 1.54%
|
|||||||
|
43,014
|
ARRIS International plc (a) (b)
|
1,161,378
|
|||||
|
Transportation Infrastructure - 0.23%
|
|||||||
|
17,501
|
Wesco Aircraft Holdings, Inc. (b)
|
176,760
|
|||||
|
Utilities: Electrical - 3.47%
|
|||||||
|
41,419
|
Great Plains Energy, Inc.
|
1,355,644
|
|||||
|
29,645
|
Portland General Electric Co.
|
1,259,319
|
|||||
|
2,614,963
|
|||||||
|
TOTAL COMMON STOCKS
|
|||||||
|
(Cost $52,401,337)
|
72,401,629
|
||||||
|
SHORT-TERM INVESTMENTS - 4.13%
|
|||||||
|
1,558,692
|
Morgan Stanley Institutional Liquidity
|
||||||
|
Funds - Government Portfolio, 1.61% (c)
|
1,558,692
|
||||||
|
1,558,692
|
Morgan Stanley Institutional Liquidity
|
||||||
|
Funds - Treasury Portfolio, 1.59% (c)
|
1,558,692
|
||||||
|
TOTAL SHORT-TERM INVESTMENTS
|
|||||||
|
(Cost $3,117,384)
|
3,117,384
|
||||||
|
TOTAL INVESTMENTS IN SECURITIES
|
|||||||
|
(Cost $55,518,721) - 100.08%
|
75,519,013
|
||||||
|
Liabilities in Excess of
|
|||||||
|
Other Assets - (0.08)%
|
(62,639
|
)
|
|||||
|
NET ASSETS - 100.00%
|
$
|
75,456,374
|
|||||
|
(a)
|
Foreign issued security.
|
|
(b)
|
Non-income producing security.
|
|
(c)
|
Rate shown is the 7-day annualized yield as of April 30, 2018.
|
The accompanying notes are an integral part of these financial statements.
17
Huber Capital Diversified Large Cap Value Fund
SCHEDULE OF INVESTMENTS at April 30, 2018 (Unaudited)
|
Shares
|
COMMON STOCKS - 93.39%
|
Value
|
|||||
|
Aerospace & Defense - 5.96%
|
|||||||
|
4,100
|
Arconic, Inc.
|
$
|
73,021
|
||||
|
700
|
Northrop Grumman Corp.
|
225,428
|
|||||
|
298,449
|
|||||||
|
Air Transport - 1.97%
|
|||||||
|
400
|
FedEx Corp.
|
98,880
|
|||||
|
Banks: Diversified - 4.14%
|
|||||||
|
2,200
|
Regions Financial Corp.
|
41,140
|
|||||
|
1,400
|
SunTrust Banks, Inc.
|
93,520
|
|||||
|
1,400
|
Wells Fargo & Co.
|
72,744
|
|||||
|
207,404
|
|||||||
|
Capital Markets - 0.48%
|
|||||||
|
100
|
Goldman Sachs Group Inc.
|
23,833
|
|||||
|
Chemicals: Diversified - 1.04%
|
|||||||
|
2,000
|
BASF SE - ADR
|
52,100
|
|||||
|
Computer Services, Software
|
|||||||
|
& Systems - 9.83%
|
|||||||
|
3,626
|
CA, Inc.
|
126,185
|
|||||
|
2,600
|
Microsoft Corp.
|
243,152
|
|||||
|
2,700
|
Oracle Corp.
|
123,309
|
|||||
|
492,646
|
|||||||
|
Computer Technology - 1.74%
|
|||||||
|
3,600
|
Hewlett Packard Enterprise Co.
|
61,380
|
|||||
|
1,200
|
HP, Inc.
|
25,788
|
|||||
|
87,168
|
|||||||
|
Consumer Lending - 0.52%
|
|||||||
|
1,000
|
Ally Financial, Inc.
|
26,100
|
|||||
|
Diversified Financial Services - 13.24%
|
|||||||
|
7,100
|
Bank of America Corp.
|
212,432
|
|||||
|
3,100
|
Citigroup, Inc.
|
211,637
|
|||||
|
2,200
|
JPMorgan Chase & Co.
|
239,316
|
|||||
|
663,385
|
|||||||
|
Diversified Retail - 2.65%
|
|||||||
|
1,500
|
Wal-Mart Stores, Inc.
|
132,690
|
|||||
|
Electronic Components - 0.55%
|
|||||||
|
300
|
TE Connectivity Ltd.
|
27,525
|
|||||
The accompanying notes are an integral part of these financial statements.
18
Huber Capital Diversified Large Cap Value Fund
SCHEDULE OF INVESTMENTS at April 30, 2018 (Unaudited), Continued
|
Shares
|
Value
|
||||||
|
Engineering & Contracting Services - 6.28%
|
|||||||
|
600
|
Fluor Corp.
|
$
|
35,370
|
||||
|
16,730
|
KBR, Inc.
|
279,224
|
|||||
|
314,594
|
|||||||
|
Financial Data & Systems - 1.96%
|
|||||||
|
550
|
Mastercard, Inc. - Class A
|
98,049
|
|||||
|
Foods - 3.23%
|
|||||||
|
1,400
|
ConAgra Foods, Inc.
|
51,898
|
|||||
|
500
|
Lamb Weston Holdings, Inc.
|
32,660
|
|||||
|
1,100
|
Tyson Foods, Inc. - Class A
|
77,110
|
|||||
|
161,668
|
|||||||
|
Homebuilding - 0.78%
|
|||||||
|
918
|
Lennar Corp. - Class B
|
39,189
|
|||||
|
Insurance Carriers - 1.87%
|
|||||||
|
600
|
Brighthouse Financial, Inc. (b)
|
30,468
|
|||||
|
1,135
|
XL Group Ltd. (a)
|
63,095
|
|||||
|
93,563
|
|||||||
|
Insurance: Life - 3.11%
|
|||||||
|
7,273
|
CNO Financial Group, Inc.
|
155,933
|
|||||
|
Insurance: Multi-Line - 1.82%
|
|||||||
|
600
|
American International Group, Inc.
|
33,600
|
|||||
|
1,100
|
Voya Financial, Inc.
|
57,585
|
|||||
|
91,185
|
|||||||
|
IT Services - 0.35%
|
|||||||
|
171
|
DXC Technology Co.
|
17,623
|
|||||
|
Media - 1.70%
|
|||||||
|
900
|
Time Warner, Inc.
|
85,320
|
|||||
|
Oil: Crude Producers - 0.59%
|
|||||||
|
10,000
|
Chesapeake Energy Corp. (b)
|
29,700
|
|||||
|
Oil, Gas & Consumable Fuels - 0.52%
|
|||||||
|
400
|
ConocoPhillips
|
26,200
|
|||||
|
Oil: Integrated - 4.06%
|
|||||||
|
1,900
|
BP plc - ADR
|
84,721
|
|||||
|
1,700
|
Royal Dutch Shell plc - Class A - ADR
|
118,830
|
|||||
|
203,551
|
|||||||
The accompanying notes are an integral part of these financial statements.
19
Huber Capital Diversified Large Cap Value Fund
SCHEDULE OF INVESTMENTS at April 30, 2018 (Unaudited), Continued
|
Shares
|
Value
|
||||||
|
Oil Well Equipment & Services - 1.49%
|
|||||||
|
13,185
|
Ensco plc - Class A
|
$
|
74,495
|
||||
|
Pharmaceuticals - 7.98%
|
|||||||
|
100
|
Allergan plc (a)
|
15,365
|
|||||
|
2,000
|
Eli Lilly & Co.
|
162,140
|
|||||
|
1,100
|
Merck & Co., Inc.
|
64,757
|
|||||
|
4,300
|
Pfizer, Inc.
|
157,423
|
|||||
|
399,685
|
|||||||
|
Scientific Instruments:
|
|||||||
|
Control & Filter - 0.53%
|
|||||||
|
600
|
Flowserve Corp.
|
26,646
|
|||||
|
Shipping - 3.09%
|
|||||||
|
6,200
|
Euronav SA (a)
|
50,530
|
|||||
|
5,200
|
Golar LNG Partners LP (a)
|
104,312
|
|||||
|
154,842
|
|||||||
|
Specialty Retail - 2.21%
|
|||||||
|
600
|
Home Depot, Inc.
|
110,880
|
|||||
|
Telecommunications Equipment - 0.43%
|
|||||||
|
800
|
ARRIS International plc (a) (b)
|
21,600
|
|||||
|
Tobacco - 3.11%
|
|||||||
|
1,900
|
Philip Morris International, Inc.
|
155,800
|
|||||
|
Utilities: Electrical - 5.29%
|
|||||||
|
400
|
American Electric Power Co., Inc.
|
27,992
|
|||||
|
900
|
Entergy Corp.
|
73,431
|
|||||
|
3,300
|
Exelon Corp.
|
130,944
|
|||||
|
200
|
NextEra Energy, Inc.
|
32,782
|
|||||
|
265,149
|
|||||||
|
Utilities: Telecommunications - 0.87%
|
|||||||
|
400
|
Verizon Communications, Inc.
|
19,740
|
|||||
|
800
|
Vodafone Group plc - ADR
|
23,528
|
|||||
|
43,268
|
|||||||
|
TOTAL COMMON STOCKS
|
|||||||
|
(Cost $3,331,821)
|
4,679,120
|
||||||
The accompanying notes are an integral part of these financial statements.
20
Huber Capital Diversified Large Cap Value Fund
SCHEDULE OF INVESTMENTS at April 30, 2018 (Unaudited), Continued
|
Shares
|
SHORT-TERM INVESTMENTS - 6.66%
|
Value
|
|||||
|
166,926
|
Morgan Stanley Institutional Liquidity
|
||||||
|
Funds - Government Portfolio, 1.61% (c)
|
$
|
166,926
|
|||||
|
166,927
|
Morgan Stanley Institutional Liquidity
|
||||||
|
Funds - Treasury Portfolio, 1.59% (c)
|
166,927
|
||||||
|
TOTAL SHORT TERM INVESTMENTS
|
|||||||
|
(Cost $333,853)
|
333,853
|
||||||
|
TOTAL INVESTMENTS IN SECURITIES
|
|||||||
|
(Cost $3,665,674) - 100.05%
|
5,012,973
|
||||||
|
Liabilities in Excess of
|
|||||||
|
Other Assets - (0.05)%
|
(2,371
|
)
|
|||||
|
NET ASSETS - 100.00%
|
$
|
5,010,602
|
|||||
ADR – American Depository Receipt
|
(a)
|
Foreign issued security.
|
|
(b)
|
Non-income producing security.
|
|
(c)
|
Rate shown is the 7-day annualized yield as of April 30, 2018.
|
The accompanying notes are an integral part of these financial statements.
21
Huber Capital Mid Cap Value Fund
SCHEDULE OF INVESTMENTS at April 30, 2018 (Unaudited)
|
Shares
|
COMMON STOCKS - 91.40%
|
Value
|
|||||
|
Aerospace & Defense - 1.31%
|
|||||||
|
1,400
|
Arconic, Inc.
|
$
|
24,934
|
||||
|
Aluminum - 1.55%
|
|||||||
|
300
|
Kaiser Aluminum Corp.
|
29,562
|
|||||
|
Asset Management & Custodian - 7.61%
|
|||||||
|
900
|
BrightSphere Investment Group plc (a)
|
13,653
|
|||||
|
16,800
|
Uranium Participation Corp. (a) (b)
|
50,768
|
|||||
|
700
|
Virtus Investment Partners, Inc.
|
80,745
|
|||||
|
145,166
|
|||||||
|
Banks: Diversified - 13.41%
|
|||||||
|
2,700
|
Atlantic Capital Bancshares, Inc. (b)
|
52,110
|
|||||
|
100
|
First Citizens BancShares, Inc. - Class A
|
43,229
|
|||||
|
3,900
|
First Horizon National Corp.
|
71,370
|
|||||
|
1,200
|
Regions Financial Corp.
|
22,440
|
|||||
|
1,000
|
SunTrust Banks, Inc.
|
66,800
|
|||||
|
255,949
|
|||||||
|
Chemicals: Specialty - 5.71%
|
|||||||
|
1,500
|
Innospec, Inc.
|
109,050
|
|||||
|
Communications Equipment - 8.52%
|
|||||||
|
5,316
|
Comtech Telecommunications Corp.
|
162,617
|
|||||
|
Computer Services, Software
|
|||||||
|
& Systems - 3.62%
|
|||||||
|
1,000
|
CA, Inc.
|
34,800
|
|||||
|
400
|
Science Applications International Corp.
|
34,316
|
|||||
|
69,116
|
|||||||
|
Computer Technology - 0.89%
|
|||||||
|
1,000
|
Hewlett Packard Enterprise Co.
|
17,050
|
|||||
|
Consumer Lending - 5.33%
|
|||||||
|
2,300
|
Enova International, Inc. (b)
|
67,390
|
|||||
|
2,500
|
EZCORP, Inc. - Class A (b)
|
34,250
|
|||||
|
101,640
|
|||||||
|
Diversified Manufacturing Operations - 1.29%
|
|||||||
|
1,200
|
Harsco Corp. (b)
|
24,540
|
|||||
|
Engineering & Contracting Services - 5.68%
|
|||||||
|
6,501
|
KBR, Inc.
|
108,502
|
|||||
The accompanying notes are an integral part of these financial statements.
22
Huber Capital Mid Cap Value Fund
SCHEDULE OF INVESTMENTS at April 30, 2018 (Unaudited), Continued
|
Shares
|
Value
|
||||||
|
Foods - 2.72%
|
|||||||
|
200
|
ConAgra Foods, Inc.
|
$
|
7,414
|
||||
|
466
|
Lamb Weston Holdings, Inc.
|
30,439
|
|||||
|
200
|
Tyson Foods, Inc. - Class A
|
14,020
|
|||||
|
51,873
|
|||||||
|
Health Care Equipment & Surplus - 1.02%
|
|||||||
|
300
|
CONMED Corp.
|
19,509
|
|||||
|
Health Care Facilities - 1.50%
|
|||||||
|
1,200
|
Tenet Healthcare Corp. (b)
|
28,728
|
|||||
|
Health Care Providers & Services - 0.04%
|
|||||||
|
38
|
Hanger, Inc. (b)
|
695
|
|||||
|
Homebuilding - 1.84%
|
|||||||
|
377
|
Lennar Corp. - Class B
|
16,094
|
|||||
|
710
|
William Lyon Homes - Class A (b)
|
19,071
|
|||||
|
35,165
|
|||||||
|
Insurance Carriers - 1.91%
|
|||||||
|
398
|
Brighthouse Financial, Inc. (b)
|
20,210
|
|||||
|
293
|
XL Group Ltd. (a)
|
16,288
|
|||||
|
36,498
|
|||||||
|
Insurance: Life - 2.20%
|
|||||||
|
1,960
|
CNO Financial Group, Inc.
|
42,022
|
|||||
|
Oil: Crude Producers - 5.02%
|
|||||||
|
7,100
|
Chesapeake Energy Corp. (b)
|
21,087
|
|||||
|
10,809
|
HighPoint Resources Corp. (b)
|
74,690
|
|||||
|
95,777
|
|||||||
|
Oil Well Equipment & Services - 3.92%
|
|||||||
|
5,200
|
Ensco plc - Class A
|
29,380
|
|||||
|
5,819
|
TETRA Technologies, Inc. (b)
|
22,869
|
|||||
|
2,100
|
Superior Energy Services, Inc. (b)
|
22,533
|
|||||
|
74,782
|
|||||||
|
Paper - 1.08%
|
|||||||
|
600
|
Kapstone Paper and Packaging Corp.
|
20,652
|
|||||
|
Real Estate Investment Trusts (REITs) - 4.65%
|
|||||||
|
3,000
|
Government Properties Income Trust
|
37,470
|
|||||
|
1,300
|
Granite Real Estate Investment Trust (a)
|
51,363
|
|||||
|
88,833
|
|||||||
The accompanying notes are an integral part of these financial statements.
23
Huber Capital Mid Cap Value Fund
SCHEDULE OF INVESTMENTS at April 30, 2018 (Unaudited), Continued
|
Shares
|
Value
|
||||||
|
Shipping - 7.17%
|
|||||||
|
1,000
|
Golar LNG Ltd. (a)
|
$
|
32,150
|
||||
|
3,000
|
Golar LNG Partners LP (a)
|
60,180
|
|||||
|
38,678
|
Teekay Tankers Ltd. - Class A
|
44,480
|
|||||
|
136,810
|
|||||||
|
Utilities: Electrical - 3.41%
|
|||||||
|
400
|
Entergy Corp.
|
32,636
|
|||||
|
600
|
Great Plains Energy, Inc.
|
19,638
|
|||||
|
300
|
Portland General Electric Co.
|
12,744
|
|||||
|
65,018
|
|||||||
|
TOTAL COMMON STOCKS
|
|||||||
|
(Cost $1,312,889)
|
1,744,488
|
||||||
|
SHORT-TERM INVESTMENTS - 8.43%
|
|||||||
|
80,430
|
Morgan Stanley Institutional Liquidity
|
||||||
|
Funds - Government Portfolio, 1.61% (c)
|
80,430
|
||||||
|
80,430
|
Morgan Stanley Institutional Liquidity
|
||||||
|
Funds - Treasury Portfolio, 1.59% (c)
|
80,430
|
||||||
|
TOTAL SHORT-TERM INVESTMENTS
|
|||||||
|
(Cost $160,860)
|
160,860
|
||||||
|
TOTAL INVESTMENTS IN SECURITIES
|
|||||||
|
(Cost $1,473,749) - 99.83%
|
1,905,348
|
||||||
|
Other Assets in Excess
|
|||||||
|
of Liabilities - 0.17%
|
3,253
|
||||||
|
NET ASSETS - 100.00%
|
$
|
1,908,601
|
|||||
|
(a)
|
Foreign issued security.
|
|
(b)
|
Non-income producing security.
|
|
(c)
|
Rate shown is the 7-day annualized yield as of April 30, 2018.
|
The accompanying notes are an integral part of these financial statements.
24
(This Page Intentionally Left Blank.)
25
Huber Funds
STATEMENTS OF ASSETS AND LIABILITIES at April 30, 2018 (Unaudited)
|
Huber Capital
|
Huber Capital
|
|||||||
|
Equity
|
Small Cap
|
|||||||
|
Income Fund
|
Value Fund
|
|||||||
|
ASSETS
|
||||||||
|
Investments in securities, at value
|
||||||||
|
(identified cost $49,302,491 and
|
||||||||
|
$55,518,721, respectively)
|
$
|
78,693,388
|
$
|
75,519,013
|
||||
|
Cash
|
—
|
2,410
|
||||||
|
Receivables
|
||||||||
|
Fund shares issued
|
—
|
317
|
||||||
|
Investment securities sold
|
—
|
70,931
|
||||||
|
Dividends and interest
|
15,187
|
117,255
|
||||||
|
Dividend tax reclaim
|
8,384
|
2,583
|
||||||
|
Prepaid expenses
|
22,687
|
24,046
|
||||||
|
Total assets
|
78,739,646
|
75,736,555
|
||||||
|
LIABILITIES
|
||||||||
|
Payables
|
||||||||
|
Investment securities purchased
|
199,624
|
69,248
|
||||||
|
Advisory fees
|
41,247
|
57,584
|
||||||
|
12b-1 distribution fees
|
17,039
|
54,329
|
||||||
|
Administration fees
|
12,389
|
17,335
|
||||||
|
Audit fees
|
10,617
|
10,617
|
||||||
|
Chief Compliance Officer fee
|
1,463
|
1,463
|
||||||
|
Custody fees
|
—
|
4,666
|
||||||
|
Fund accounting fees
|
8,844
|
9,284
|
||||||
|
Shareholder servicing fees
|
12,730
|
33,121
|
||||||
|
Transfer agent fees and expenses
|
11,783
|
14,824
|
||||||
|
Trustee fees and expenses
|
933
|
917
|
||||||
|
Accrued expenses
|
5,414
|
6,793
|
||||||
|
Total liabilities
|
322,083
|
280,181
|
||||||
|
NET ASSETS
|
$
|
78,417,563
|
$
|
75,456,374
|
||||
The accompanying notes are an integral part of these financial statements.
26
Huber Funds
STATEMENTS OF ASSETS AND LIABILITIES at April 30, 2018 (Unaudited), Continued
|
|
Huber Capital
|
Huber Capital
|
||||||
|
|
Equity
|
Small Cap
|
||||||
|
|
Income Fund
|
Value Fund
|
||||||
|
CALCULATION OF NET ASSET VALUE PER SHARE
|
||||||||
|
Investor Class
|
||||||||
|
Net assets applicable to shares outstanding
|
$
|
6,341,274
|
$
|
24,583,105
|
||||
|
Shares issued and outstanding [unlimited number
|
||||||||
|
of shares (par value $0.01) authorized]
|
405,804
|
1,355,164
|
||||||
|
Net asset value, offering and redemption
|
||||||||
|
price per share (Note 1)
|
$
|
15.63
|
$
|
18.14
|
||||
|
Institutional Class
|
||||||||
|
Net assets applicable to shares outstanding
|
$
|
72,076,289
|
$
|
50,873,269
|
||||
|
Shares issued and outstanding [unlimited number
|
||||||||
|
of shares (par value $0.01) authorized]
|
4,622,139
|
2,771,015
|
||||||
|
Net asset value, offering and redemption
|
||||||||
|
price per share (Note 1)
|
$
|
15.59
|
$
|
18.36
|
||||
|
COMPONENTS OF NET ASSETS
|
||||||||
|
Paid-in capital
|
$
|
54,199,970
|
$
|
60,524,381
|
||||
|
Undistributed net investment income
|
274,171
|
163,616
|
||||||
|
Accumulated net realized loss on investments
|
||||||||
|
and foreign currency
|
(5,447,475
|
)
|
(5,231,923
|
)
|
||||
|
Net unrealized appreciation on:
|
||||||||
|
Investments
|
29,390,897
|
20,000,292
|
||||||
|
Foreign currency
|
—
|
8
|
||||||
|
Net assets
|
$
|
78,417,563
|
$
|
75,456,374
|
||||
The accompanying notes are an integral part of these financial statements.
27
Huber Funds
STATEMENTS OF ASSETS AND LIABILITIES at April 30, 2018 (Unaudited)
|
Huber Capital
|
||||||||
|
Diversified
|
Huber Capital
|
|||||||
|
Large Cap
|
Mid Cap
|
|||||||
|
Value Fund
|
Value Fund
|
|||||||
|
ASSETS
|
||||||||
|
Investments in securities, at value
|
||||||||
|
(identified cost $3,665,674 and
|
||||||||
|
$1,473,749, respectively)
|
$
|
5,012,973
|
$
|
1,905,348
|
||||
|
Receivables
|
||||||||
|
Investment securities sold
|
—
|
2,394
|
||||||
|
Dividends and interest
|
2,125
|
2,567
|
||||||
|
Dividend tax reclaim
|
2,861
|
23
|
||||||
|
Due from Adviser (Note 4)
|
13,031
|
15,041
|
||||||
|
Prepaid expenses
|
23,194
|
25,323
|
||||||
|
Total assets
|
5,054,184
|
1,950,696
|
||||||
|
LIABILITIES
|
||||||||
|
Payables
|
||||||||
|
Investment securities purchased
|
—
|
3,559
|
||||||
|
12b-1 distribution fees
|
3,334
|
637
|
||||||
|
Administration fees
|
7,786
|
7,885
|
||||||
|
Audit fees
|
10,617
|
10,616
|
||||||
|
Chief Compliance Officer fee
|
1,463
|
1,463
|
||||||
|
Custody fees
|
1,623
|
3,148
|
||||||
|
Fund accounting fees
|
5,679
|
5,863
|
||||||
|
Shareholder servicing fees
|
4,375
|
774
|
||||||
|
Transfer agent fees and expenses
|
5,627
|
5,323
|
||||||
|
Trustee fees and expenses
|
863
|
873
|
||||||
|
Accrued expenses
|
2,215
|
1,954
|
||||||
|
Total liabilities
|
43,582
|
42,095
|
||||||
|
NET ASSETS
|
$
|
5,010,602
|
$
|
1,908,601
|
||||
The accompanying notes are an integral part of these financial statements.
28
Huber Funds
STATEMENTS OF ASSETS AND LIABILITIES at April 30, 2018 (Unaudited), Continued
|
|
Huber Capital
|
|||||||
|
|
Diversified
|
Huber Capital
|
||||||
|
|
Large Cap
|
Mid Cap
|
||||||
|
|
Value Fund
|
Value Fund
|
||||||
|
CALCULATION OF NET ASSET VALUE PER SHARE
|
||||||||
|
Investor Class
|
||||||||
|
Net assets applicable to shares outstanding
|
$
|
1,591,390
|
$
|
410,818
|
||||
|
Shares issued and outstanding [unlimited number
|
||||||||
|
of shares (par value $0.01) authorized]
|
111,075
|
31,579
|
||||||
|
Net asset value, offering and redemption
|
||||||||
|
price per share (Note 1)
|
$
|
14.33
|
$
|
13.01
|
||||
|
Institutional Class
|
||||||||
|
Net assets applicable to shares outstanding
|
$
|
3,419,212
|
$
|
1,497,783
|
||||
|
Shares issued and outstanding [unlimited number
|
||||||||
|
of shares (par value $0.01) authorized]
|
237,487
|
114,860
|
||||||
|
Net asset value, offering and redemption
|
||||||||
|
price per share (Note 1)
|
$
|
14.40
|
$
|
13.04
|
||||
|
COMPONENTS OF NET ASSETS
|
||||||||
|
Paid-in capital
|
$
|
3,849,775
|
$
|
1,488,103
|
||||
|
Undistributed net investment income
|
19,274
|
6,179
|
||||||
|
Accumulated net realized loss on investments
|
||||||||
|
and foreign currency
|
(205,746
|
)
|
(17,281
|
)
|
||||
|
Net unrealized appreciation on:
|
||||||||
|
Investments
|
1,347,299
|
431,599
|
||||||
|
Foreign currency
|
—
|
1
|
||||||
|
Net assets
|
$
|
5,010,602
|
$
|
1,908,601
|
||||
The accompanying notes are an integral part of these financial statements.
29
Huber Funds
STATEMENTS OF OPERATIONS For the Six Months Ended April 30, 2018 (Unaudited)
|
Huber Capital
|
Huber Capital
|
|||||||
|
Equity
|
Small Cap
|
|||||||
|
Income Fund
|
Value Fund
|
|||||||
|
INVESTMENT INCOME
|
||||||||
|
Dividends (net of foreign taxes and issuance fees withheld
|
||||||||
|
of $7,077 and $23,614, respectively)
|
$
|
837,504
|
$
|
799,704
|
||||
|
Interest
|
6,035
|
9,152
|
||||||
|
Total investment income
|
843,539
|
808,856
|
||||||
|
Expenses
|
||||||||
|
Advisory fees (Note 4)
|
386,834
|
445,907
|
||||||
|
Administration fees (Note 4)
|
43,815
|
42,636
|
||||||
|
Transfer agent fees and expenses (Note 4)
|
26,650
|
31,035
|
||||||
|
Fund accounting fees (Note 4)
|
22,313
|
22,419
|
||||||
|
Registration fees
|
15,401
|
14,279
|
||||||
|
Audit fees
|
10,617
|
10,617
|
||||||
|
Custody fees (Note 4)
|
9,002
|
9,293
|
||||||
|
12b-1 distribution fees – Investor Class (Note 6)
|
8,764
|
30,674
|
||||||
|
Trustee fees and expenses
|
6,582
|
6,593
|
||||||
|
Chief Compliance Officer fee (Note 4)
|
4,463
|
4,463
|
||||||
|
Shareholder servicing fees – Investor Class (Note 5)
|
4,219
|
12,339
|
||||||
|
Legal fees
|
3,816
|
3,805
|
||||||
|
Miscellaneous expense
|
3,031
|
4,333
|
||||||
|
Reports to shareholders
|
2,827
|
2,959
|
||||||
|
Insurance expense
|
1,513
|
1,636
|
||||||
|
Total expenses
|
549,847
|
642,988
|
||||||
|
Less: advisory fee waiver (Note 4)
|
(117,925
|
)
|
(82,826
|
)
|
||||
|
Net expenses
|
431,922
|
560,162
|
||||||
|
Net investment income
|
411,617
|
248,694
|
||||||
|
REALIZED AND UNREALIZED GAIN/(LOSS)
|
||||||||
|
ON INVESTMENTS, REDEMPTION IN-KIND
|
||||||||
|
AND FOREIGN CURRENCY
|
||||||||
|
Net realized gain/(loss) on:
|
||||||||
|
Investments
|
2,573,149
|
(794,700
|
)
|
|||||
|
Redemption in-kind
|
—
|
7,109,504
|
||||||
|
Foreign currency
|
—
|
59
|
||||||
|
Net change in unrealized appreciation/(depreciation) on:
|
||||||||
|
Investments
|
(2,703,193
|
)
|
(966,953
|
)
|
||||
|
Foreign currency
|
—
|
131
|
||||||
|
Net realized and unrealized gain/(loss) on investments,
|
||||||||
|
redemption in-kind and foreign currency
|
(130,044
|
)
|
5,348,041
|
|||||
|
Net Increase in Net Assets Resulting
|
||||||||
|
from Operations
|
$
|
281,573
|
$
|
5,596,735
|
||||
The accompanying notes are an integral part of these financial statements.
30
Huber Funds
STATEMENTS OF OPERATIONS For the Six Months Ended April 30, 2018 (Unaudited)
|
Huber Capital
|
||||||||
|
Diversified
|
Huber Capital
|
|||||||
|
Large Cap
|
Mid Cap
|
|||||||
|
Value Fund
|
Value Fund
|
|||||||
|
INVESTMENT INCOME
|
||||||||
|
Dividends (net of foreign taxes and issuance fees withheld
|
||||||||
|
of $496 and $208, respectively)
|
$
|
47,549
|
$
|
14,729
|
||||
|
Interest
|
2,045
|
338
|
||||||
|
Total investment income
|
49,594
|
15,067
|
||||||
|
Expenses
|
||||||||
|
Administration fees (Note 4)
|
21,321
|
21,288
|
||||||
|
Fund accounting fees (Note 4)
|
16,317
|
16,259
|
||||||
|
Transfer agent fees and expenses (Note 4)
|
15,731
|
15,454
|
||||||
|
Advisory fees (Note 4)
|
12,645
|
5,579
|
||||||
|
Audit fees
|
10,617
|
10,616
|
||||||
|
Registration fees
|
10,395
|
13,514
|
||||||
|
Trustee fees and expenses
|
6,278
|
6,278
|
||||||
|
Chief Compliance Officer fee (Note 4)
|
4,463
|
4,463
|
||||||
|
Legal fees
|
3,044
|
2,867
|
||||||
|
Custody fees (Note 4)
|
2,883
|
6,179
|
||||||
|
12b-1 distribution fees – Investor Class (Note 6)
|
2,021
|
331
|
||||||
|
Miscellaneous expense
|
1,838
|
1,476
|
||||||
|
Insurance expense
|
867
|
843
|
||||||
|
Reports to shareholders
|
535
|
473
|
||||||
|
Shareholder servicing fees – Institutional Class (Note 5)
|
—
|
8
|
||||||
|
Shareholder servicing fees – Investor Class (Note 5)
|
—
|
67
|
||||||
|
Total expenses
|
108,955
|
105,695
|
||||||
|
Less: advisory fee waiver and
|
||||||||
|
expenses reimbursed (Note 4)
|
(87,935
|
)
|
(96,807
|
)
|
||||
|
Net expenses
|
21,020
|
8,888
|
||||||
|
Net investment income
|
28,574
|
6,179
|
||||||
|
REALIZED AND UNREALIZED GAIN/(LOSS)
|
||||||||
|
ON INVESTMENTS AND FOREIGN CURRENCY
|
||||||||
|
Net realized gain on investments
|
117,135
|
38,336
|
||||||
|
Net change in unrealized appreciation/(depreciation) on:
|
||||||||
|
Investments
|
(121,364
|
)
|
82,963
|
|||||
|
Foreign currency
|
—
|
292
|
||||||
|
Net realized and unrealized gain/(loss)
|
||||||||
|
on investments and foreign currency
|
(4,229
|
)
|
121,591
|
|||||
|
Net Increase in Net Assets
|
||||||||
|
Resulting from Operations
|
$
|
24,345
|
$
|
127,770
|
||||
The accompanying notes are an integral part of these financial statements.
31
Huber Capital Equity Income Fund
STATEMENTS OF CHANGES IN NET ASSETS
|
Six Months Ended
|
||||||||
|
April 30, 2018
|
Year Ended
|
|||||||
|
(Unaudited)
|
October 31, 2017
|
|||||||
|
INCREASE/(DECREASE) IN NET ASSETS FROM:
|
||||||||
|
OPERATIONS
|
||||||||
|
Net investment income
|
$
|
411,617
|
$
|
1,357,870
|
||||
|
Net realized gain/(loss) on:
|
||||||||
|
Investments
|
2,573,149
|
920,657
|
||||||
|
Foreign currency
|
—
|
(380
|
)
|
|||||
|
Net change in unrealized appreciation/
|
||||||||
|
(depreciation) on investments
|
(2,703,193
|
)
|
17,649,106
|
|||||
|
Net increase in net assets
|
||||||||
|
resulting from operations
|
281,573
|
19,927,253
|
||||||
|
DISTRIBUTIONS TO SHAREHOLDERS
|
||||||||
|
From net investment income
|
||||||||
|
Investor Class
|
(47,690
|
)
|
(214,453
|
)
|
||||
|
Institutional Class
|
(1,097,683
|
)
|
(1,308,010
|
)
|
||||
|
Total distributions to shareholders
|
(1,145,373
|
)
|
(1,522,463
|
)
|
||||
|
CAPITAL SHARE TRANSACTIONS
|
||||||||
|
Net decrease in net assets derived from
|
||||||||
|
net change in outstanding shares (a)
|
(9,012,917
|
)
|
(21,005,471
|
)
|
||||
|
Total decrease in net assets
|
(9,876,717
|
)
|
(2,600,681
|
)
|
||||
|
NET ASSETS
|
||||||||
|
Beginning of period
|
88,294,280
|
90,894,961
|
||||||
|
End of period
|
$
|
78,417,563
|
$
|
88,294,280
|
||||
|
Undistributed net investment
|
||||||||
|
income at end of period
|
$
|
274,171
|
$
|
1,007,927
|
||||
The accompanying notes are an integral part of these financial statements.
32
Huber Capital Equity Income Fund
STATEMENTS OF CHANGES IN NET ASSETS, Continued
(a) A summary of share transactions is as follows:
|
Investor Class
|
||||||||||||||||
|
Six Months Ended
|
||||||||||||||||
|
April 30, 2018
|
Year Ended
|
|||||||||||||||
|
(Unaudited)
|
October 31, 2017
|
|||||||||||||||
|
Shares
|
Paid-in Capital
|
Shares
|
Paid-in Capital
|
|||||||||||||
|
Shares sold
|
4,412
|
$
|
71,303
|
43,291
|
$
|
609,837
|
||||||||||
|
Shares issued
|
||||||||||||||||
|
on reinvestments
|
||||||||||||||||
|
of distributions
|
2,835
|
46,129
|
15,207
|
210,777
|
||||||||||||
|
Shares redeemed**
|
(67,469
|
)
|
(1,101,953
|
)
|
(853,863
|
)
|
(12,616,919
|
)
|
||||||||
|
Net decrease
|
(60,222
|
)
|
$
|
(984,521
|
)
|
(795,365
|
)
|
$
|
(11,796,305
|
)
|
||||||
|
** Net of redemption
|
||||||||||||||||
|
fees of
|
$
|
3
|
$
|
20
|
||||||||||||
|
Institutional Class
|
||||||||||||||||
|
Six Months Ended
|
||||||||||||||||
|
April 30, 2018
|
Year Ended
|
|||||||||||||||
|
(Unaudited)
|
October 31, 2017
|
|||||||||||||||
|
Shares
|
Paid-in Capital
|
Shares
|
Paid-in Capital
|
|||||||||||||
|
Shares sold
|
8,345
|
$
|
137,405
|
121,143
|
$
|
1,829,646
|
||||||||||
|
Shares issued
|
||||||||||||||||
|
on reinvestments
|
||||||||||||||||
|
of distributions
|
66,594
|
1,080,164
|
92,670
|
1,285,327
|
||||||||||||
|
Shares redeemed
|
(571,403
|
)
|
(9,245,965
|
)
|
(856,172
|
)
|
(12,324,139
|
)
|
||||||||
|
Net decrease
|
(496,464
|
)
|
$
|
(8,028,396
|
)
|
(642,359
|
)
|
$
|
(9,209,166
|
)
|
||||||
The accompanying notes are an integral part of these financial statements.
33
Huber Capital Small Cap Value Fund
STATEMENTS OF CHANGES IN NET ASSETS
|
Six Months Ended
|
||||||||
|
April 30, 2018
|
Year Ended
|
|||||||
|
(Unaudited)
|
October 31, 2017
|
|||||||
|
INCREASE/(DECREASE) IN NET ASSETS FROM:
|
||||||||
|
OPERATIONS
|
||||||||
|
Net investment income
|
$
|
248,694
|
$
|
755,730
|
||||
|
Net realized gain/(loss) on:
|
||||||||
|
Investments
|
(794,700
|
)
|
(1,904,260
|
)
|
||||
|
Redemption in-kind
|
7,109,504
|
—
|
||||||
|
Foreign currency
|
59
|
525
|
||||||
|
Net change in unrealized
|
||||||||
|
appreciation/(depreciation) on:
|
||||||||
|
Investments
|
(966,953
|
)
|
22,728,148
|
|||||
|
Foreign currency
|
131
|
27
|
||||||
|
Net increase in net assets resulting
|
||||||||
|
from operations
|
5,596,735
|
21,580,170
|
||||||
|
DISTRIBUTIONS TO SHAREHOLDERS
|
||||||||
|
From net investment income
|
||||||||
|
Investor Class
|
(180,383
|
)
|
(324,439
|
)
|
||||
|
Institutional Class
|
(502,044
|
)
|
(1,147,740
|
)
|
||||
|
Total distributions to shareholders
|
(682,427
|
)
|
(1,472,179
|
)
|
||||
|
CAPITAL SHARE TRANSACTIONS
|
||||||||
|
Net decrease in net assets derived
|
||||||||
|
from net change in outstanding shares (a)
|
(20,764,137
|
)
|
(49,712,964
|
)
|
||||
|
Total decrease in net assets
|
(15,849,829
|
)
|
(29,604,973
|
)
|
||||
|
NET ASSETS
|
||||||||
|
Beginning of period
|
91,306,203
|
120,911,176
|
||||||
|
End of period
|
$
|
75,456,374
|
$
|
91,306,203
|
||||
|
Undistributed net investment
|
||||||||
|
income at end of period
|
$
|
163,616
|
$
|
597,349
|
||||
The accompanying notes are an integral part of these financial statements.
34
Huber Capital Small Cap Value Fund
STATEMENTS OF CHANGES IN NET ASSETS, Continued
(a) A summary of share transactions is as follows:
|
Investor Class
|
||||||||||||||||
|
Six Months Ended
|
||||||||||||||||
|
April 30, 2018
|
Year Ended
|
|||||||||||||||
|
(Unaudited)
|
October 31, 2017
|
|||||||||||||||
|
Shares
|
Paid-in Capital
|
Shares
|
Paid-in Capital
|
|||||||||||||
|
Shares sold
|
4,211
|
$
|
73,511
|
25,760
|
$
|
414,255
|
||||||||||
|
Shares issued
|
||||||||||||||||
|
on reinvestments
|
||||||||||||||||
|
of distributions
|
10,092
|
176,206
|
19,352
|
314,089
|
||||||||||||
|
Shares redeemed**
|
(127,283
|
)
|
(2,238,985
|
)
|
(380,221
|
)
|
(6,048,945
|
)
|
||||||||
|
Net decrease
|
(112,980
|
)
|
$
|
(1,989,268
|
)
|
(335,109
|
)
|
$
|
(5,320,601
|
)
|
||||||
|
** Net of redemption
|
||||||||||||||||
|
fees of
|
$
|
16
|
$
|
9
|
||||||||||||
|
Institutional Class
|
||||||||||||||||
|
Six Months Ended
|
||||||||||||||||
|
April 30, 2018
|
Year Ended
|
|||||||||||||||
|
(Unaudited)
|
October 31, 2017
|
|||||||||||||||
|
Shares
|
Paid-in Capital
|
Shares
|
Paid-in Capital
|
|||||||||||||
|
Shares sold
|
4,159
|
$
|
73,793
|
55,998
|
$
|
903,593
|
||||||||||
|
Shares issued
|
||||||||||||||||
|
on reinvestments
|
||||||||||||||||
|
of distributions
|
26,881
|
474,438
|
67,761
|
1,111,968
|
||||||||||||
|
Shares redeemed in
|
||||||||||||||||
|
connection with
|
||||||||||||||||
|
redemption in-kind
|
(1,034,230
|
)
|
(18,594,526
|
)
|
—
|
—
|
||||||||||
|
Shares redeemed**
|
(40,842
|
)
|
(728,574
|
)
|
(2,897,046
|
)
|
(46,407,924
|
)
|
||||||||
|
Net decrease
|
(1,044,032
|
)
|
$
|
(18,774,869
|
)
|
(2,773,287
|
)
|
$
|
(44,392,363
|
)
|
||||||
|
** Net of redemption
|
||||||||||||||||
|
fees of
|
$
|
—
|
$
|
64
|
||||||||||||
The accompanying notes are an integral part of these financial statements.
35
Huber Capital Diversified Large Cap Value Fund
STATEMENTS OF CHANGES IN NET ASSETS
|
Six Months Ended
|
||||||||
|
April 30, 2018
|
Year Ended
|
|||||||
|
(Unaudited)
|
October 31, 2017
|
|||||||
|
INCREASE/(DECREASE) IN NET ASSETS FROM:
|
||||||||
|
OPERATIONS
|
||||||||
|
Net investment income
|
$
|
28,574
|
$
|
98,382
|
||||
|
Net realized gain/(loss) on:
|
||||||||
|
Investments
|
117,135
|
437,131
|
||||||
|
Foreign currency
|
—
|
(21
|
)
|
|||||
|
Net change in unrealized
|
||||||||
|
appreciation/(depreciation) on investments
|
(121,364
|
)
|
848,461
|
|||||
|
Net increase in net assets resulting
|
||||||||
|
from operations
|
24,345
|
1,383,953
|
||||||
|
DISTRIBUTIONS TO SHAREHOLDERS
|
||||||||
|
From net investment income
|
||||||||
|
Investor Class
|
(23,393
|
)
|
(33,892
|
)
|
||||
|
Institutional Class
|
(55,526
|
)
|
(90,960
|
)
|
||||
|
Total distributions to shareholders
|
(78,919
|
)
|
(124,852
|
)
|
||||
|
CAPITAL SHARE TRANSACTIONS
|
||||||||
|
Net increase/(decrease) in net assets derived
|
||||||||
|
from net change in outstanding shares (a)
|
81,761
|
(3,062,131
|
)
|
|||||
|
Total increase/(decrease) in net assets
|
27,187
|
(1,803,030
|
)
|
|||||
|
NET ASSETS
|
||||||||
|
Beginning of period
|
4,983,415
|
6,786,445
|
||||||
|
End of period
|
$
|
5,010,602
|
$
|
4,983,415
|
||||
|
Undistributed net investment
|
||||||||
|
income at end of period
|
$
|
19,274
|
$
|
69,619
|
||||
The accompanying notes are an integral part of these financial statements.
36
Huber Capital Diversified Large Cap Value Fund
STATEMENTS OF CHANGES IN NET ASSETS, Continued
(a) A summary of share transactions is as follows:
|
Investor Class
|
||||||||||||||||
|
Six Months Ended
|
||||||||||||||||
|
April 30, 2018
|
Year Ended
|
|||||||||||||||
|
(Unaudited)
|
October 31, 2017
|
|||||||||||||||
|
Shares
|
Paid-in Capital
|
Shares
|
Paid-in Capital
|
|||||||||||||
|
Shares sold
|
539
|
$
|
7,971
|
3,886
|
$
|
50,252
|
||||||||||
|
Shares issued
|
||||||||||||||||
|
on reinvestments
|
||||||||||||||||
|
of distributions
|
1,582
|
23,393
|
2,711
|
33,891
|
||||||||||||
|
Shares redeemed
|
(346
|
)
|
(5,129
|
)
|
(70,935
|
)
|
(927,115
|
)
|
||||||||
|
Net increase/(decrease)
|
1,775
|
$
|
26,235
|
(64,338
|
)
|
$
|
(842,972
|
)
|
||||||||
|
Institutional Class
|
||||||||||||||||
|
Six Months Ended
|
||||||||||||||||
|
April 30, 2018
|
Year Ended
|
|||||||||||||||
|
(Unaudited)
|
October 31, 2017
|
|||||||||||||||
|
Shares
|
Paid-in Capital
|
Shares
|
Paid-in Capital
|
|||||||||||||
|
Shares issued
|
||||||||||||||||
|
on reinvestments
|
||||||||||||||||
|
of distributions
|
3,739
|
$
|
55,526
|
7,247
|
$
|
90,960
|
||||||||||
|
Shares redeemed
|
—
|
—
|
(175,949
|
)
|
(2,310,119
|
)
|
||||||||||
|
Net increase/(decrease)
|
3,739
|
$
|
55,526
|
(168,702
|
)
|
$
|
(2,219,159
|
)
|
||||||||
The accompanying notes are an integral part of these financial statements.
37
Huber Capital Mid Cap Value Fund
STATEMENTS OF CHANGES IN NET ASSETS
|
Six Months Ended
|
||||||||
|
April 30, 2018
|
Year Ended
|
|||||||
|
(Unaudited)
|
October 31, 2017
|
|||||||
|
INCREASE/(DECREASE) IN NET ASSETS FROM:
|
||||||||
|
OPERATIONS
|
||||||||
|
Net investment income
|
$
|
6,179
|
$
|
17,233
|
||||
|
Net realized gain/(loss) on:
|
||||||||
|
Investments
|
38,336
|
(31,426
|
)
|
|||||
|
Foreign currency
|
—
|
3
|
||||||
|
Net increase from payment by affiliate on
|
||||||||
|
the disposal of investments in violation
|
||||||||
|
of investment restrictions (Note 9)
|
—
|
94
|
||||||
|
Net change in unrealized
|
||||||||
|
appreciation/(depreciation) on:
|
||||||||
|
Investments
|
82,963
|
273,954
|
||||||
|
Foreign currency
|
292
|
(290
|
)
|
|||||
|
Net increase in net assets resulting
|
||||||||
|
from operations
|
127,770
|
259,568
|
||||||
|
DISTRIBUTIONS TO SHAREHOLDERS
|
||||||||
|
From net investment income
|
||||||||
|
Investor Class
|
(1,551
|
)
|
(1,677
|
)
|
||||
|
Institutional Class
|
(12,486
|
)
|
(14,112
|
)
|
||||
|
From net realized gain on investments
|
||||||||
|
Investor Class
|
—
|
(2,606
|
)
|
|||||
|
Institutional Class
|
—
|
(17,664
|
)
|
|||||
|
Total distributions to shareholders
|
(14,037
|
)
|
(36,059
|
)
|
||||
|
CAPITAL SHARE TRANSACTIONS
|
||||||||
|
Net increase in net assets derived
|
||||||||
|
from net change in outstanding shares (a)
|
175,717
|
65,413
|
||||||
|
Total increase in net assets
|
289,450
|
288,922
|
||||||
|
NET ASSETS
|
||||||||
|
Beginning of period
|
1,619,151
|
1,330,229
|
||||||
|
End of period
|
$
|
1,908,601
|
$
|
1,619,151
|
||||
|
Undistributed net investment
|
||||||||
|
income at end of period
|
$
|
6,179
|
$
|
14,037
|
||||
The accompanying notes are an integral part of these financial statements.
38
Huber Capital Mid Cap Value Fund
STATEMENTS OF CHANGES IN NET ASSETS, Continued
(a) A summary of share transactions is as follows:
|
Investor Class
|
||||||||||||||||
|
Six Months Ended
|
||||||||||||||||
|
April 30, 2018
|
Year Ended
|
|||||||||||||||
|
(Unaudited)
|
October 31, 2017
|
|||||||||||||||
|
Shares
|
Paid-in Capital
|
Shares
|
Paid-in Capital
|
|||||||||||||
|
Shares sold
|
12,543
|
$
|
161,862
|
11,629
|
$
|
135,921
|
||||||||||
|
Shares issued
|
||||||||||||||||
|
on reinvestments
|
||||||||||||||||
|
of distributions
|
124
|
1,551
|
375
|
4,283
|
||||||||||||
|
Shares redeemed
|
(15
|
)
|
(182
|
)
|
(9,466
|
)
|
(106,567
|
)
|
||||||||
|
Net increase
|
12,652
|
$
|
163,231
|
2,538
|
$
|
33,637
|
||||||||||
|
Institutional Class
|
||||||||||||||||
|
Six Months Ended
|
||||||||||||||||
|
April 30, 2018
|
Year Ended
|
|||||||||||||||
|
(Unaudited)
|
October 31, 2017
|
|||||||||||||||
|
Shares
|
Paid-in Capital
|
Shares
|
Paid-in Capital
|
|||||||||||||
|
Shares issued
|
||||||||||||||||
|
on reinvestments
|
||||||||||||||||
|
of distributions
|
993
|
$
|
12,486
|
2,781
|
$
|
31,776
|
||||||||||
|
Net increase
|
993
|
$
|
12,486
|
2,781
|
$
|
31,776
|
||||||||||
The accompanying notes are an integral part of these financial statements.
39
Huber Capital Equity Income Fund
FINANCIAL HIGHLIGHTS – For a share outstanding throughout each period
Investor Class
|
Six Months
|
||||||||||||||||||||||||
|
Ended
|
||||||||||||||||||||||||
|
April 30,
|
||||||||||||||||||||||||
|
2018
|
Year Ended October 31,
|
|||||||||||||||||||||||
|
(Unaudited)
|
2017
|
2016
|
2015
|
2014
|
2013
|
|||||||||||||||||||
|
Net asset value,
|
||||||||||||||||||||||||
|
beginning of period
|
$
|
15.76
|
$
|
12.90
|
$
|
13.09
|
$
|
14.10
|
$
|
13.16
|
$
|
10.18
|
||||||||||||
|
Income from
|
||||||||||||||||||||||||
|
investment operations:
|
||||||||||||||||||||||||
|
Net investment income^
|
0.05
|
0.17
|
0.17
|
0.12
|
0.22
|
0.12
|
||||||||||||||||||
|
Net realized and unrealized
|
||||||||||||||||||||||||
|
gain/(loss) on investments
|
||||||||||||||||||||||||
|
and foreign currency
|
||||||||||||||||||||||||
|
related transactions
|
(0.08
|
)
|
2.86
|
(0.23
|
)
|
(0.93
|
)
|
0.81
|
2.94
|
|||||||||||||||
|
Total from
|
||||||||||||||||||||||||
|
investment operations
|
(0.03
|
)
|
3.03
|
(0.06
|
)
|
(0.81
|
)
|
1.03
|
3.06
|
|||||||||||||||
|
Less distributions:
|
||||||||||||||||||||||||
|
From net investment income
|
(0.10
|
)
|
(0.17
|
)
|
(0.13
|
)
|
(0.20
|
)
|
(0.09
|
)
|
(0.08
|
)
|
||||||||||||
|
From net realized
|
||||||||||||||||||||||||
|
gain on investments
|
—
|
—
|
—
|
—
|
(0.01
|
)
|
—
|
|||||||||||||||||
|
Total distributions
|
(0.10
|
)
|
(0.17
|
)
|
(0.13
|
)
|
(0.20
|
)
|
(0.10
|
)
|
(0.08
|
)
|
||||||||||||
|
Redemption fees retained
|
0.00
|
^+ |
0.00
|
^+ |
0.00
|
^+ |
0.00
|
^+ |
0.01
|
^ |
0.00
|
^+ | ||||||||||||
|
Net asset value, end of period
|
$
|
15.63
|
$
|
15.76
|
$
|
12.90
|
$
|
13.09
|
$
|
14.10
|
$
|
13.16
|
||||||||||||
|
Total return
|
-0.19
|
%‡
|
23.71
|
%
|
-0.47
|
%
|
-5.73
|
%
|
7.95
|
%
|
30.30
|
%
|
||||||||||||
|
Ratios/supplemental data:
|
||||||||||||||||||||||||
|
Net assets, end
|
||||||||||||||||||||||||
|
of period (thousands)
|
$
|
6,341
|
$
|
7,346
|
$
|
16,277
|
$
|
22,167
|
$
|
30,765
|
$
|
10,276
|
||||||||||||
|
Ratio of expenses to
|
||||||||||||||||||||||||
|
average net assets:
|
||||||||||||||||||||||||
|
Before advisory fee waiver and
|
||||||||||||||||||||||||
|
expense reimbursement
|
1.64
|
%†
|
1.70
|
%
|
1.67
|
%
|
1.79
|
%
|
1.82
|
%
|
2.03
|
%
|
||||||||||||
|
After advisory fee waiver and
|
||||||||||||||||||||||||
|
expense reimbursement
|
1.36
|
%†
|
1.37
|
%
|
1.35
|
%~ |
1.43
|
%
|
1.49
|
%
|
1.40
|
%
|
||||||||||||
|
Ratio of net investment income
|
||||||||||||||||||||||||
|
to average net assets:
|
||||||||||||||||||||||||
|
Before advisory fee waiver and
|
||||||||||||||||||||||||
|
expense reimbursement
|
0.35
|
%†
|
0.85
|
%
|
1.02
|
%
|
0.54
|
%
|
1.24
|
%
|
0.44
|
%
|
||||||||||||
|
After advisory fee waiver and
|
||||||||||||||||||||||||
|
expense reimbursement
|
0.63
|
%†
|
1.18
|
%
|
1.34
|
%
|
0.90
|
%
|
1.57
|
%
|
1.07
|
%
|
||||||||||||
|
Portfolio turnover rate
|
9.32
|
%‡
|
20.49
|
%
|
15.56
|
%
|
15.44
|
%
|
28.70
|
%
|
29.36
|
%
|
||||||||||||
|
+
|
Less than $0.005.
|
|
^
|
Based on average shares outstanding.
|
|
~
|
Effective April 1, 2016, the Adviser reduced the expense cap to 1.39%.
|
|
†
|
Annualized.
|
|
‡
|
Not annualized.
|
The accompanying notes are an integral part of these financial statements.
40
Huber Capital Equity Income Fund
FINANCIAL HIGHLIGHTS – For a share outstanding throughout each period
Institutional Class
|
Six Months
|
||||||||||||||||||||||||
|
Ended
|
||||||||||||||||||||||||
|
April 30,
|
||||||||||||||||||||||||
|
2018
|
Year Ended October 31,
|
|||||||||||||||||||||||
|
(Unaudited)
|
2017
|
2016
|
2015
|
2014
|
2013
|
|||||||||||||||||||
|
Net asset value,
|
||||||||||||||||||||||||
|
beginning of period
|
$
|
15.81
|
$
|
12.95
|
$
|
13.15
|
$
|
14.18
|
$
|
13.21
|
$
|
10.20
|
||||||||||||
|
Income from
|
||||||||||||||||||||||||
|
investment operations:
|
||||||||||||||||||||||||
|
Net investment income^
|
0.08
|
0.22
|
0.21
|
0.18
|
0.28
|
0.16
|
||||||||||||||||||
|
Net realized and unrealized
|
||||||||||||||||||||||||
|
gain/(loss) on investments
|
||||||||||||||||||||||||
|
and foreign currency
|
||||||||||||||||||||||||
|
related transactions
|
(0.08
|
)
|
2.87
|
(0.22
|
)
|
(0.94
|
)
|
0.83
|
2.95
|
|||||||||||||||
|
Total from
|
||||||||||||||||||||||||
|
investment operations
|
0.00
|
3.09
|
(0.01
|
)
|
(0.76
|
)
|
1.11
|
3.11
|
||||||||||||||||
|
Less distributions:
|
||||||||||||||||||||||||
|
From net investment income
|
(0.22
|
)
|
(0.23
|
)
|
(0.19
|
)
|
(0.27
|
)
|
(0.13
|
)
|
(0.10
|
)
|
||||||||||||
|
From net realized
|
||||||||||||||||||||||||
|
gain on investments
|
—
|
—
|
—
|
—
|
(0.01
|
)
|
—
|
|||||||||||||||||
|
Total distributions
|
(0.22
|
)
|
(0.23
|
)
|
(0.19
|
)
|
(0.27
|
)
|
(0.14
|
)
|
(0.10
|
)
|
||||||||||||
|
Redemption fees retained
|
—
|
—
|
—
|
0.00
|
^+ |
0.00
|
^+ |
0.00
|
^+ | |||||||||||||||
|
Net asset value, end of period
|
$
|
15.59
|
$
|
15.81
|
$
|
12.95
|
$
|
13.15
|
$
|
14.18
|
$
|
13.21
|
||||||||||||
|
Total return
|
-0.05
|
%‡
|
24.10
|
%
|
-0.06
|
%
|
-5.31
|
%
|
8.47
|
%
|
30.73
|
%
|
||||||||||||
|
Ratios/supplemental data:
|
||||||||||||||||||||||||
|
Net assets, end
|
||||||||||||||||||||||||
|
of period (thousands)
|
$
|
72,077
|
$
|
80,948
|
$
|
74,618
|
$
|
81,746
|
$
|
116,368
|
$
|
46,752
|
||||||||||||
|
Ratio of expenses to
|
||||||||||||||||||||||||
|
average net assets:
|
||||||||||||||||||||||||
|
Before advisory fee waiver and
|
||||||||||||||||||||||||
|
expense reimbursement
|
1.27
|
%†
|
1.33
|
%
|
1.31
|
%
|
1.35
|
%
|
1.32
|
%
|
1.61
|
%
|
||||||||||||
|
After advisory fee waiver and
|
||||||||||||||||||||||||
|
expense reimbursement
|
0.99
|
%†
|
0.99
|
%
|
0.99
|
%
|
0.99
|
%
|
0.99
|
%
|
0.99
|
%
|
||||||||||||
|
Ratio of net investment income/
|
||||||||||||||||||||||||
|
(loss) to average net assets:
|
||||||||||||||||||||||||
|
Before advisory fee waiver and
|
||||||||||||||||||||||||
|
expense reimbursement
|
0.72
|
%†
|
1.18
|
%
|
1.36
|
%
|
1.00
|
%
|
1.64
|
%
|
0.72
|
%
|
||||||||||||
|
After advisory fee waiver and
|
||||||||||||||||||||||||
|
expense reimbursement
|
1.00
|
%†
|
1.52
|
%
|
1.68
|
%
|
1.36
|
%
|
1.97
|
%
|
1.34
|
%
|
||||||||||||
|
Portfolio turnover rate
|
9.32
|
%‡
|
20.49
|
%
|
15.56
|
%
|
15.44
|
%
|
28.70
|
%
|
29.36
|
%
|
||||||||||||
|
+
|
Less than $0.005.
|
|
^
|
Based on average shares outstanding.
|
|
†
|
Annualized.
|
|
‡
|
Not annualized.
|
The accompanying notes are an integral part of these financial statements.
41
Huber Capital Small Cap Value Fund
FINANCIAL HIGHLIGHTS – For a share outstanding throughout each period
Investor Class
|
Six Months
|
||||||||||||||||||||||||
|
Ended
|
||||||||||||||||||||||||
|
April 30,
|
||||||||||||||||||||||||
|
2018
|
Year Ended October 31,
|
|||||||||||||||||||||||
|
(Unaudited)
|
2017
|
2016
|
2015
|
2014
|
2013
|
|||||||||||||||||||
|
Net asset value,
|
||||||||||||||||||||||||
|
beginning of period
|
$
|
17.12
|
$
|
14.26
|
$
|
15.12
|
$
|
16.90
|
$
|
17.02
|
$
|
12.54
|
||||||||||||
|
Income from
|
||||||||||||||||||||||||
|
investment operations:
|
||||||||||||||||||||||||
|
Net investment income/(loss)^
|
0.04
|
0.09
|
0.11
|
0.03
|
(0.03
|
)
|
(0.06
|
)
|
||||||||||||||||
|
Net realized and unrealized
|
||||||||||||||||||||||||
|
gain/(loss) on investments
|
||||||||||||||||||||||||
|
and foreign currency
|
||||||||||||||||||||||||
|
related transactions
|
1.10
|
2.96
|
(0.88
|
)
|
(1.80
|
)
|
(0.09
|
)
|
4.57
|
|||||||||||||||
|
Total from
|
||||||||||||||||||||||||
|
investment operations
|
1.14
|
3.05
|
(0.77
|
)
|
(1.77
|
)
|
(0.12
|
)
|
4.51
|
|||||||||||||||
|
Less distributions:
|
||||||||||||||||||||||||
|
From net investment income
|
(0.12
|
)
|
(0.19
|
)
|
(0.09
|
)
|
—
|
—
|
(0.03
|
)
|
||||||||||||||
|
From net realized
|
||||||||||||||||||||||||
|
gain on investments
|
—
|
—
|
—
|
(0.01
|
)
|
—
|
(0.00
|
)+
|
||||||||||||||||
|
Total distributions
|
(0.12
|
)
|
(0.19
|
)
|
(0.09
|
)
|
(0.01
|
)
|
—
|
(0.03
|
)
|
|||||||||||||
|
Redemption fees retained
|
0.00
|
^+ |
0.00
|
^+ |
0.00
|
^+ |
0.00
|
^+ |
0.00
|
^+ |
0.00
|
^+ | ||||||||||||
|
Net asset value, end of period
|
$
|
18.14
|
$
|
17.12
|
$
|
14.26
|
$
|
15.12
|
$
|
16.90
|
$
|
17.02
|
||||||||||||
|
Total return
|
6.71
|
%‡
|
21.43
|
%
|
-5.13
|
%
|
-10.47
|
%
|
-0.71
|
%
|
36.07
|
%
|
||||||||||||
|
Ratios/supplemental data:
|
||||||||||||||||||||||||
|
Net assets, end
|
||||||||||||||||||||||||
|
of period (thousands)
|
$
|
24,583
|
$
|
25,129
|
$
|
25,720
|
$
|
57,543
|
$
|
125,084
|
$
|
142,171
|
||||||||||||
|
Ratio of expenses to
|
||||||||||||||||||||||||
|
average net assets:
|
||||||||||||||||||||||||
|
Before advisory fee waiver and
|
||||||||||||||||||||||||
|
expense reimbursement
|
1.93
|
%†
|
1.65
|
%
|
1.87
|
%
|
2.01
|
%
|
2.11
|
%
|
2.19
|
%
|
||||||||||||
|
After advisory fee waiver and
|
||||||||||||||||||||||||
|
expense reimbursement
|
1.70
|
%†
|
1.63
|
%
|
1.58
|
%~ |
1.77
|
%
|
1.85
|
%
|
1.85
|
%
|
||||||||||||
|
Ratio of net investment income/
|
||||||||||||||||||||||||
|
(loss) to average net assets:
|
||||||||||||||||||||||||
|
Before advisory fee waiver and
|
||||||||||||||||||||||||
|
expense reimbursement
|
0.17
|
%†
|
0.53
|
%
|
0.54
|
%
|
(0.03
|
%)
|
(0.41
|
%)
|
(0.70
|
%)
|
||||||||||||
|
After advisory fee waiver and
|
||||||||||||||||||||||||
|
expense reimbursement
|
0.40
|
%†
|
0.55
|
%
|
0.83
|
%
|
0.21
|
%
|
(0.15
|
%)
|
(0.36
|
%)
|
||||||||||||
|
Portfolio turnover rate
|
8.17
|
%‡
|
23.48
|
%
|
14.99
|
%
|
27.30
|
%
|
23.82
|
%
|
4.28
|
%
|
||||||||||||
|
+
|
Less than $0.005.
|
|
^
|
Based on average shares outstanding.
|
|
~
|
Effective April 1, 2016, the Adviser reduced the expense cap to 1.75%.
|
|
†
|
Annualized.
|
|
‡
|
Not annualized.
|
The accompanying notes are an integral part of these financial statements.
42
Huber Capital Small Cap Value Fund
FINANCIAL HIGHLIGHTS – For a share outstanding throughout each period
Institutional Class
|
Six Months
|
||||||||||||||||||||||||
|
Ended
|
||||||||||||||||||||||||
|
April 30,
|
||||||||||||||||||||||||
|
2018
|
Year Ended October 31,
|
|||||||||||||||||||||||
|
(Unaudited)
|
2017
|
2016
|
2015
|
2014
|
2013
|
|||||||||||||||||||
|
Net asset value,
|
||||||||||||||||||||||||
|
beginning of period
|
$
|
17.35
|
$
|
14.45
|
$
|
15.38
|
$
|
17.14
|
$
|
17.17
|
$
|
12.60
|
||||||||||||
|
Income from
|
||||||||||||||||||||||||
|
investment operations:
|
||||||||||||||||||||||||
|
Net investment income^
|
0.07
|
0.14
|
0.15
|
0.16
|
0.07
|
0.04
|
||||||||||||||||||
|
Net realized and unrealized
|
||||||||||||||||||||||||
|
gain/(loss) on investments
|
||||||||||||||||||||||||
|
and foreign currency
|
||||||||||||||||||||||||
|
related transactions
|
1.12
|
2.99
|
(0.91
|
)
|
(1.89
|
)
|
(0.10
|
)
|
4.56
|
|||||||||||||||
|
Total from
|
||||||||||||||||||||||||
|
investment operations
|
1.19
|
3.13
|
(0.76
|
)
|
(1.73
|
)
|
(0.03
|
)
|
4.60
|
|||||||||||||||
|
Less distributions:
|
||||||||||||||||||||||||
|
From net investment income
|
(0.18
|
)
|
(0.23
|
)
|
(0.17
|
)
|
(0.02
|
)
|
—
|
(0.03
|
)
|
|||||||||||||
|
From net realized
|
||||||||||||||||||||||||
|
gain on investments
|
—
|
—
|
—
|
(0.01
|
)
|
—
|
(0.00
|
)+
|
||||||||||||||||
|
Total distributions
|
(0.18
|
)
|
(0.23
|
)
|
(0.17
|
)
|
(0.03
|
)
|
—
|
(0.03
|
)
|
|||||||||||||
|
Redemption fees retained
|
—
|
0.00
|
^+ |
0.00
|
^+ |
0.00
|
^+ |
0.00
|
^+ |
0.00
|
^+ | |||||||||||||
|
Net asset value, end of period
|
$
|
18.36
|
$
|
17.35
|
$
|
14.45
|
$
|
15.38
|
$
|
17.14
|
$
|
17.17
|
||||||||||||
|
Total return
|
6.90
|
%‡
|
21.74
|
%
|
-4.94
|
%
|
-10.07
|
%
|
-0.17
|
%
|
36.65
|
%
|
||||||||||||
|
Ratios/supplemental data:
|
||||||||||||||||||||||||
|
Net assets, end
|
||||||||||||||||||||||||
|
of period (thousands)
|
$
|
50,873
|
$
|
66,177
|
$
|
95,191
|
$
|
159,213
|
$
|
200,819
|
$
|
146,443
|
||||||||||||
|
Ratio of expenses to average net assets:
|
||||||||||||||||||||||||
|
Before advisory fee waiver and
|
||||||||||||||||||||||||
|
expense reimbursement
|
1.56
|
%†
|
1.36
|
%
|
1.64
|
%
|
1.59
|
%
|
1.61
|
%
|
1.69
|
%
|
||||||||||||
|
After advisory fee waiver and
|
||||||||||||||||||||||||
|
expense reimbursement
|
1.35
|
%†
|
1.33
|
%
|
1.35
|
%
|
1.35
|
%
|
1.35
|
%
|
1.35
|
%
|
||||||||||||
|
Ratio of net investment income/
|
||||||||||||||||||||||||
|
(loss) to average net assets:
|
||||||||||||||||||||||||
|
Before advisory fee waiver and
|
||||||||||||||||||||||||
|
expense reimbursement
|
0.55
|
%†
|
0.81
|
%
|
0.79
|
%
|
0.75
|
%
|
0.14
|
%
|
(0.11
|
%)
|
||||||||||||
|
After advisory fee waiver and
|
||||||||||||||||||||||||
|
expense reimbursement
|
0.76
|
%†
|
0.84
|
%
|
1.08
|
%
|
0.99
|
%
|
0.40
|
%
|
0.23
|
%
|
||||||||||||
|
Portfolio turnover rate
|
8.17
|
%‡
|
23.48
|
%
|
14.99
|
%
|
27.30
|
%
|
23.82
|
%
|
4.28
|
%
|
||||||||||||
|
+
|
Less than $0.005.
|
|
^
|
Based on average shares outstanding.
|
|
†
|
Annualized.
|
|
‡
|
Not annualized.
|
The accompanying notes are an integral part of these financial statements.
43
Huber Capital Diversified Large Cap Value Fund
FINANCIAL HIGHLIGHTS – For a share outstanding throughout each period
Investor Class
|
Six Months
|
December 31,
|
|||||||||||||||||||||||
|
Ended
|
2012*
|
|
||||||||||||||||||||||
|
April 30,
|
through
|
|||||||||||||||||||||||
|
2018
|
Year Ended October 31,
|
October 31,
|
||||||||||||||||||||||
|
(Unaudited)
|
2017
|
2016
|
2015
|
2014
|
2013
|
|||||||||||||||||||
|
Net asset value,
|
||||||||||||||||||||||||
|
beginning of period
|
$
|
14.48
|
$
|
11.73
|
$
|
11.62
|
$
|
12.43
|
$
|
12.55
|
$
|
10.00
|
||||||||||||
|
Income from
|
||||||||||||||||||||||||
|
investment operations:
|
||||||||||||||||||||||||
|
Net investment income^
|
0.07
|
0.21
|
0.19
|
0.14
|
0.12
|
0.08
|
||||||||||||||||||
|
Net realized and unrealized
|
||||||||||||||||||||||||
|
gain/(loss) on investments
|
||||||||||||||||||||||||
|
and foreign currency
|
||||||||||||||||||||||||
|
related transactions
|
(0.01
|
)
|
2.74
|
0.06
|
(0.83
|
)
|
0.92
|
2.47
|
||||||||||||||||
|
Total from
|
||||||||||||||||||||||||
|
investment operations
|
0.06
|
2.95
|
0.25
|
(0.69
|
)
|
1.04
|
2.55
|
|||||||||||||||||
|
Less distributions:
|
||||||||||||||||||||||||
|
From net investment income
|
(0.21
|
)
|
(0.20
|
)
|
(0.14
|
)
|
(0.09
|
)
|
(0.14
|
)
|
—
|
|||||||||||||
|
From net realized
|
||||||||||||||||||||||||
|
gain on investments
|
—
|
—
|
—
|
(0.03
|
)
|
(1.02
|
)
|
—
|
||||||||||||||||
|
Total distributions
|
(0.21
|
)
|
(0.20
|
)
|
(0.14
|
)
|
(0.12
|
)
|
(1.16
|
)
|
—
|
|||||||||||||
|
Net asset value, end of period
|
$
|
14.33
|
$
|
14.48
|
$
|
11.73
|
$
|
11.62
|
$
|
12.43
|
$
|
12.55
|
||||||||||||
|
Total return
|
0.40
|
%‡
|
25.37
|
%
|
2.23
|
%
|
-5.56
|
%
|
8.75
|
%
|
25.50
|
%‡
|
||||||||||||
|
Ratios/supplemental data:
|
||||||||||||||||||||||||
|
Net assets, end
|
||||||||||||||||||||||||
|
of period (thousands)
|
$
|
1,592
|
$
|
1,582
|
$
|
2,037
|
$
|
2,215
|
$
|
2,593
|
$
|
89
|
||||||||||||
|
Ratio of expenses to
|
||||||||||||||||||||||||
|
average net assets:
|
||||||||||||||||||||||||
|
Before advisory fee waiver and
|
||||||||||||||||||||||||
|
expense reimbursement
|
4.45
|
%†
|
4.42
|
%
|
3.86
|
%
|
4.00
|
%
|
7.27
|
%
|
19.32
|
%†
|
||||||||||||
|
After advisory fee waiver and
|
||||||||||||||||||||||||
|
expense reimbursement
|
1.00
|
%†
|
0.89
|
%
|
1.00
|
%~ |
1.15
|
%
|
1.25
|
%
|
1.25
|
%†
|
||||||||||||
|
Ratio of net investment income/
|
||||||||||||||||||||||||
|
(loss) to average net assets:
|
||||||||||||||||||||||||
|
Before advisory fee waiver and
|
||||||||||||||||||||||||
|
expense reimbursement
|
(2.50
|
%)†
|
(1.90
|
%)
|
(1.17
|
%)
|
(1.65
|
%)
|
(5.05
|
%)
|
(17.18
|
%)†
|
||||||||||||
|
After advisory fee waiver and
|
||||||||||||||||||||||||
|
expense reimbursement
|
0.95
|
%†
|
1.63
|
%
|
1.69
|
%
|
1.20
|
%
|
0.97
|
%
|
0.89
|
%†
|
||||||||||||
|
Portfolio turnover rate
|
11.91
|
%‡
|
34.31
|
%
|
25.66
|
%
|
21.22
|
%
|
61.96
|
%
|
167.81
|
%‡
|
||||||||||||
|
*
|
Commencement of operations.
|
|
^
|
Based on average shares outstanding.
|
|
~
|
Effective April 1, 2016, the Adviser reduced the expense cap to 1.15%.
|
|
†
|
Annualized.
|
|
‡
|
Not annualized.
|
The accompanying notes are an integral part of these financial statements.
44
Huber Capital Diversified Large Cap Value Fund
FINANCIAL HIGHLIGHTS – For a share outstanding throughout each period
Institutional Class
|
Six Months
|
December 31,
|
|||||||||||||||||||||||
|
Ended
|
2012*
|
|
||||||||||||||||||||||
|
April 30,
|
through
|
|||||||||||||||||||||||
|
2018
|
Year Ended October 31,
|
October 31,
|
||||||||||||||||||||||
|
(Unaudited)
|
2017
|
2016
|
2015
|
2014
|
2013
|
|||||||||||||||||||
|
Net asset value,
|
||||||||||||||||||||||||
|
beginning of period
|
$
|
14.55
|
$
|
11.80
|
$
|
11.71
|
$
|
12.50
|
$
|
12.61
|
$
|
10.00
|
||||||||||||
|
Income from
|
||||||||||||||||||||||||
|
investment operations:
|
||||||||||||||||||||||||
|
Net investment income^
|
0.09
|
0.23
|
0.22
|
0.19
|
0.19
|
0.13
|
||||||||||||||||||
|
Net realized and unrealized
|
||||||||||||||||||||||||
|
gain/(loss) on investments
|
||||||||||||||||||||||||
|
and foreign currency
|
||||||||||||||||||||||||
|
related transactions
|
(0.01
|
)
|
2.75
|
0.06
|
(0.83
|
)
|
0.89
|
2.48
|
||||||||||||||||
|
Total from
|
||||||||||||||||||||||||
|
investment operations
|
0.08
|
2.98
|
0.28
|
(0.64
|
)
|
1.08
|
2.61
|
|||||||||||||||||
|
Less distributions:
|
||||||||||||||||||||||||
|
From net investment income
|
(0.23
|
)
|
(0.23
|
)
|
(0.19
|
)
|
(0.12
|
)
|
(0.17
|
)
|
—
|
|||||||||||||
|
From net realized
|
||||||||||||||||||||||||
|
gain on investments
|
—
|
—
|
—
|
(0.03
|
)
|
(1.02
|
)
|
—
|
||||||||||||||||
|
Total distributions
|
(0.23
|
)
|
(0.23
|
)
|
(0.19
|
)
|
(0.15
|
)
|
(1.19
|
)
|
—
|
|||||||||||||
|
Net asset value, end of period
|
$
|
14.40
|
$
|
14.55
|
$
|
11.80
|
$
|
11.71
|
$
|
12.50
|
$
|
12.61
|
||||||||||||
|
Total return
|
0.55
|
%‡
|
25.53
|
%
|
2.47
|
%
|
-5.14
|
%
|
9.12
|
%
|
26.10
|
%‡
|
||||||||||||
|
Ratios/supplemental data:
|
||||||||||||||||||||||||
|
Net assets, end
|
||||||||||||||||||||||||
|
of period (thousands)
|
$
|
3,419
|
$
|
3,401
|
$
|
4,749
|
$
|
4,634
|
$
|
4,882
|
$
|
1,273
|
||||||||||||
|
Ratio of expenses to
|
||||||||||||||||||||||||
|
average net assets:
|
||||||||||||||||||||||||
|
Before advisory fee waiver and
|
||||||||||||||||||||||||
|
expense reimbursement
|
4.20
|
%†
|
4.25
|
%
|
3.61
|
%
|
3.59
|
%
|
8.49
|
%
|
19.27
|
%†
|
||||||||||||
|
After advisory fee waiver and
|
||||||||||||||||||||||||
|
expense reimbursement
|
0.75
|
%†
|
0.75
|
%
|
0.75
|
%
|
0.75
|
%
|
0.75
|
%
|
0.75
|
%†
|
||||||||||||
|
Ratio of net investment income/
|
||||||||||||||||||||||||
|
(loss) to average net assets:
|
||||||||||||||||||||||||
|
Before advisory fee waiver and
|
||||||||||||||||||||||||
|
expense reimbursement
|
(2.25
|
%)†
|
(1.72
|
%)
|
(0.94
|
%)
|
(1.25
|
%)
|
(6.19
|
%)
|
(17.16
|
%)†
|
||||||||||||
|
After advisory fee waiver and
|
||||||||||||||||||||||||
|
expense reimbursement
|
1.20
|
%†
|
1.78
|
%
|
1.92
|
%
|
1.59
|
%
|
1.55
|
%
|
1.36
|
%†
|
||||||||||||
|
Portfolio turnover rate
|
11.91
|
%‡
|
34.31
|
%
|
25.66
|
%
|
21.22
|
%
|
61.96
|
%
|
167.81
|
%‡
|
||||||||||||
|
*
|
Commencement of operations.
|
|
^
|
Based on average shares outstanding.
|
|
†
|
Annualized.
|
|
‡
|
Not annualized.
|
The accompanying notes are an integral part of these financial statements.
45
Huber Capital Mid Cap Value Fund
FINANCIAL HIGHLIGHTS – For a share outstanding throughout each period
Investor Class
|
December 31,
|
||||||||||||
|
Six Months
|
2015*
|
|
||||||||||
|
Ended
|
Year Ended
|
through
|
||||||||||
|
April 30, 2018
|
October 31,
|
October 31,
|
||||||||||
|
(Unaudited)
|
2017
|
2016
|
||||||||||
|
Net asset value, beginning of period
|
$
|
12.16
|
$
|
10.41
|
$
|
10.00
|
||||||
|
Income from investment operations:
|
||||||||||||
|
Net investment income^
|
0.04
|
0.10
|
0.08
|
|||||||||
|
Net realized and unrealized
|
||||||||||||
|
gain on investments and foreign
|
||||||||||||
|
currency related transactions
|
0.89
|
1.91
|
0.33
|
|||||||||
|
Total from investment operations
|
0.93
|
2.01
|
0.41
|
|||||||||
|
Less distributions:
|
||||||||||||
|
From net investment income
|
(0.08
|
)
|
(0.10
|
)
|
—
|
|||||||
|
From net realized
|
||||||||||||
|
gain on investments
|
—
|
(0.16
|
)
|
—
|
||||||||
|
Total distributions
|
(0.08
|
)
|
(0.26
|
)
|
—
|
|||||||
|
Net asset value, end of period
|
$
|
13.01
|
$
|
12.16
|
$
|
10.41
|
||||||
|
Total return
|
7.66
|
%‡
|
19.49
|
%+
|
4.10
|
%‡
|
||||||
|
Ratios/supplemental data:
|
||||||||||||
|
Net assets, end of period (thousands)
|
$
|
411
|
$
|
230
|
$
|
170
|
||||||
|
Ratio of expenses to average net assets:
|
||||||||||||
|
Before advisory fee waiver and
|
||||||||||||
|
expense reimbursement
|
12.71
|
%†
|
13.89
|
%
|
16.98
|
%†
|
||||||
|
After advisory fee waiver and
|
||||||||||||
|
expense reimbursement
|
1.30
|
%†
|
1.27
|
%
|
1.32
|
%†~ | ||||||
|
Ratio of net investment income/(loss)
|
||||||||||||
|
to average net assets:
|
||||||||||||
|
Before advisory fee waiver and
|
||||||||||||
|
expense reimbursement
|
(10.84
|
)%†
|
(11.74
|
)%
|
(14.76
|
)%†
|
||||||
|
After advisory fee waiver and
|
||||||||||||
|
expense reimbursement
|
0.57
|
%†
|
0.88
|
%
|
0.90
|
%†
|
||||||
|
Portfolio turnover rate
|
21.87
|
%‡
|
95.79
|
%
|
79.44
|
%‡
|
||||||
|
*
|
Commencement of operations.
|
|
^
|
Based on average shares outstanding.
|
|
~
|
Effective April 1, 2016, the Adviser reduced the expense cap to 1.40%.
|
|
+
|
Includes increase from payments made by the Adviser and net gain realized of 0.00% related to the disposal of securities held in violation of an investment restriction. Refer to Note 9 for further details.
|
|
†
|
Annualized.
|
|
‡
|
Not annualized.
|
The accompanying notes are an integral part of these financial statements.
46
Huber Capital Mid Cap Value Fund
FINANCIAL HIGHLIGHTS – For a share outstanding throughout each period
Institutional Class
|
December 31,
|
||||||||||||
|
Six Months
|
2015*
|
|
||||||||||
|
Ended
|
Year Ended
|
through
|
||||||||||
|
April 30, 2018
|
October 31,
|
October 31,
|
||||||||||
|
(Unaudited)
|
2017
|
2016
|
||||||||||
|
Net asset value, beginning of period
|
$
|
12.20
|
$
|
10.44
|
$
|
10.00
|
||||||
|
Income from investment operations:
|
||||||||||||
|
Net investment income^
|
0.05
|
0.13
|
0.11
|
|||||||||
|
Net realized and unrealized
|
||||||||||||
|
gain on investments and foreign
|
||||||||||||
|
currency related transactions
|
0.90
|
1.92
|
0.33
|
|||||||||
|
Total from investment operations
|
0.95
|
2.05
|
0.44
|
|||||||||
|
Less distributions:
|
||||||||||||
|
From net investment income
|
(0.11
|
)
|
(0.13
|
)
|
—
|
|||||||
|
From net realized
|
||||||||||||
|
gain on investments
|
—
|
(0.16
|
)
|
—
|
||||||||
|
Total distributions
|
(0.11
|
)
|
(0.29
|
)
|
—
|
|||||||
|
Net asset value, end of period
|
$
|
13.04
|
$
|
12.20
|
$
|
10.44
|
||||||
|
Total return
|
7.82
|
%‡
|
19.78
|
%+
|
4.40
|
%‡
|
||||||
|
Ratios/supplemental data:
|
||||||||||||
|
Net assets, end of period (thousands)
|
$
|
1,498
|
$
|
1,389
|
$
|
1,160
|
||||||
|
Ratio of expenses to average net assets:
|
||||||||||||
|
Before advisory fee waiver and
|
||||||||||||
|
expense reimbursement
|
12.33
|
%†
|
13.77
|
%
|
17.67
|
%†
|
||||||
|
After advisory fee waiver and
|
||||||||||||
|
expense reimbursement
|
0.99
|
%†
|
1.00
|
%
|
1.04
|
%†
|
||||||
|
Ratio of net investment income/(loss)
|
||||||||||||
|
to average net assets:
|
||||||||||||
|
Before advisory fee waiver and
|
||||||||||||
|
expense reimbursement
|
(10.59
|
)%†
|
(11.62
|
)%
|
(15.31
|
)%†
|
||||||
|
After advisory fee waiver and
|
||||||||||||
|
expense reimbursement
|
0.75
|
%†
|
1.15
|
%
|
1.32
|
%†
|
||||||
|
Portfolio turnover rate
|
21.87
|
%‡
|
95.79
|
%
|
79.44
|
%‡
|
||||||
|
*
|
Commencement of operations.
|
|
^
|
Based on average shares outstanding.
|
|
+
|
Includes increase from payments made by the Adviser and net gain realized of 0.00% related to the disposal of securities held in violation of an investment restriction. Refer to Note 9 for further details.
|
|
†
|
Annualized.
|
|
‡
|
Not annualized.
|
The accompanying notes are an integral part of these financial statements.
47
Huber Funds
NOTES TO FINANCIAL STATEMENTS at April 30, 2018 (Unaudited)
NOTE 1 – ORGANIZATION
The Huber Capital Equity Income Fund, the Huber Capital Small Cap Value Fund, the Huber Capital Diversified Large Cap Value Fund, and the Huber Capital Mid Cap Value Fund (each a “Fund” and collectively, the “Funds”) are each a diversified series of Advisors Series Trust (the “Trust”), which is registered under the Investment Company Act of 1940, as amended, as an open-end management investment company. Each of the Funds has separate assets and liabilities and differing investment objectives. The investment objective of the Huber Capital Equity Income Fund (the “Equity Income Fund”), the Huber Capital Mid Cap Value Fund (the “Mid Cap Value Fund”), and the Huber Capital Diversified Large Cap Value Fund (the “Diversified Large Cap Value Fund”) is current income and capital appreciation. The investment objective of the Huber Capital Small Cap Value Fund (the “Small Cap Value Fund”) is capital appreciation. The Funds follow the investment company accounting and reporting guidance of the Financial Accounting Standards Board (“FASB”) Accounting Standard Codification Topic 946 “Financial Services – Investment Companies”.
The Investor Class of the Equity Income Fund and the Small Cap Value Fund commenced operations on June 29, 2007. As of October 25, 2011, the former Institutional shares were re-designated as Investor Class shares. The Equity Income Fund and the Small Cap Value Institutional Classes subsequently commenced operations on October 25, 2011. The Diversified Large Cap Value Fund commenced operations on December 31, 2012. The Mid Cap Value Fund commenced operations on December 31, 2015.
NOTE 2 – SIGNIFICANT ACCOUNTING POLICIES
The following is a summary of significant accounting policies consistently followed by the Funds in the preparation of their financial statements. These policies are in conformity with accounting principles generally accepted in the United States of America.
|
A.
|
Security Valuation: All investments in securities are recorded at their estimated fair value, as described in note 3.
|
|
|
B.
|
Federal Income Taxes: It is the Funds’ policy to comply with the requirements of Subchapter M of the Internal Revenue Code applicable to regulated investment companies and to distribute substantially all of its taxable income to shareholders. Therefore, no provision for Federal income taxes has been recorded.
|
|
|
The Funds recognize the tax benefits of uncertain tax positions only where the position is “more likely than not” to be sustained assuming examination by tax authorities. Management has analyzed the tax
|
48
Huber Funds
NOTES TO FINANCIAL STATEMENTS at April 30, 2018 (Unaudited), Continued
|
positions of the Equity Income Fund, the Small Cap Value Fund, and the Diversified Large Cap Value Fund, and has concluded that no liability for unrecognized tax benefits should be recorded related to uncertain tax positions taken on returns filed for open tax years 2015 – 2017, or expected to be taken in the Funds’ 2018 tax returns. Management has analyzed the Mid Cap Value Fund’s tax positions, and has concluded that no liability for unrecognized tax benefits should be recorded related to uncertain tax positions taken on returns filed for the open tax years 2016-2017, or expected to be taken in the Fund’s 2018 tax returns. The Funds identify their major tax jurisdictions as U.S. Federal and the state of Wisconsin; however the Funds are not aware of any tax positions for which it is reasonably possible that the total amounts of unrecognized tax benefits will change materially in the next twelve months.
|
||
|
C.
|
Securities Transactions, Income and Distributions: Security transactions are accounted for on the trade date. Realized gains and losses on securities sold are determined on the basis of identified cost. Interest income is recorded on an accrual basis. Dividend income and distributions to shareholders are recorded on the ex-dividend date. Withholding taxes on foreign dividends have been provided for in accordance with the Funds’ understanding of the applicable country’s tax rules and rates.
|
|
|
Investment income, expenses (other than those specific to the class of shares), and realized and unrealized gains and losses on investments are allocated to the separate classes of the Funds based upon their relative net assets on the date income is earned or expensed and realized and unrealized gains and losses are incurred.
|
||
|
Each Fund is charged for those expenses that are directly attributable to the Fund, such as investment advisory, custody and transfer agent fees. Expenses that are not attributable to a Fund are typically allocated among the Funds in proportion to their respective net assets. Common expenses of the Trust are typically allocated among funds in the Trust based on a fund’s respective net assets, or by other equitable means.
|
||
|
The Funds distribute substantially all net investment income, if any, annually and net realized capital gains, if any, annually. Distributions from net realized gains for book purposes may include short-term capital gains. All short-term capital gains are included in ordinary income for tax purposes.
|
||
|
The amount and character of income and net realized gains to be distributed are determined in accordance with Federal income tax rules and regulations which may differ from accounting principles generally accepted in the United States of America. To the extent these book/tax differences are permanent, such amounts are reclassified within the capital accounts based on their Federal tax treatment.
|
49
Huber Funds
NOTES TO FINANCIAL STATEMENTS at April 30, 2018 (Unaudited), Continued
|
D.
|
Reclassification of Capital Accounts: Accounting principles generally accepted in the United States of America require that certain components of net assets relating to permanent differences be reclassified between financial and tax reporting. These reclassifications have no effect on net assets or net asset value per share.
|
|
|
E.
|
Use of Estimates: The preparation of financial statements in conformity with accounting principles generally accepted in the United States of America requires management to make estimates and assumptions that affect the reported amounts of assets and liabilities and disclosure of contingent assets and liabilities at the date of the financial statements and the reported amounts of increases and decreases in net assets from operation during the reporting period. Actual results could differ from those estimates.
|
|
|
F.
|
Redemption Fees: The Funds charge a 1.00% redemption fee to shareholders who redeem shares held for 60 days or less. Such fees are retained by the Funds and accounted for as an addition to paid-in capital. The Equity Income Fund, the Small Cap Value Fund, the Diversified Large Cap Value Fund, and the Mid Cap Value Fund retained redemption fees of $3, $16, $0, and $0, respectively, during the six months ended April 30, 2018.
|
|
|
G.
|
REITs: The Funds have made certain investments in real estate investment trusts (“REITs”) which pay dividends to their shareholders based upon funds available from operations. It is quite common for these dividends to exceed the REIT’s taxable earnings and profits resulting in the excess portion of such dividends being designated as a return of capital. The Funds intend to include the gross dividends from such REITs in their annual distributions to its shareholders and, accordingly, a portion of the Funds’ distributions may also be designated as a return of capital.
|
|
|
H.
|
Foreign Securities: The Funds may invest in securities of foreign companies. Foreign economies may differ from the U.S. economy and individual foreign companies may differ from domestic companies in the same industry. Foreign companies or entities are frequently not subject to accounting and financial reporting standards applicable to domestic companies, and there may be less information available about foreign issuers. Securities of foreign issuers are generally less liquid and more volatile than those of comparable domestic issuers. There is frequently less government regulation of broker-dealers and issuers than in the United States. In addition, investments in foreign countries are subject to the possibility of expropriation, confiscatory taxation, political or social instability or diplomatic developments that could adversely affect the value of those investments.
|
50
Huber Funds
NOTES TO FINANCIAL STATEMENTS at April 30, 2018 (Unaudited), Continued
|
I.
|
Illiquid Securities: A security may be considered illiquid if it lacks a readily available market. Securities are generally considered liquid if they can be sold or disposed of in the ordinary course of business within seven days at approximately the price at which the security is valued by a Fund. Illiquid securities may be valued under methods approved by the Funds’ Board of Trustees as reflecting fair value. Each Fund intends to hold no more than 15% of its net assets in illiquid securities. At April 30, 2018, the Funds had no investments in illiquid securities.
|
|
|
J.
|
Events Subsequent to the Fiscal Period End: In preparing the financial statements as of April 30, 2018, management considered the impact of subsequent events for potential recognition or disclosure in the financial statements.
|
NOTE 3 – SECURITIES VALUATION
The Funds have adopted authoritative fair value accounting standards which establish an authoritative definition of fair value and set out a hierarchy for measuring fair value. These standards require additional disclosures about the various inputs and valuation techniques used to develop the measurements of fair value, a discussion in changes in valuation techniques and related inputs during the period and expanded disclosure of valuation levels for major security types. These inputs are summarized in the three broad levels listed below:
|
Level 1 –
|
Unadjusted quoted prices in active markets for identical assets or liabilities that the Funds have the ability to access.
|
|
|
Level 2 –
|
Observable inputs other than quoted prices included in level 1 that are observable for the asset or liability, either directly or indirectly. These inputs may include quoted prices for identical instrument on an inactive market, prices for similar instruments, interest rates, prepayment speed, credit risk, yield curves, default rates, and similar data.
|
|
|
Level 3 –
|
Unobservable inputs for the asset or liability, to the extent relevant observable inputs are not available, representing the Fund’s own assumptions about the assumptions a market participant would use in valuing the asset or liability, and would be based on the best information available.
|
Following is a description of the valuation techniques applied to the Funds’ major categories of assets and liabilities measured at fair value on a recurring basis.
Equity Securities – The Funds’ investments are carried at fair value. Securities that are primarily traded on a national securities exchange shall be valued at the last sale price on the exchange on which they are primarily traded on the day of
51
Huber Funds
NOTES TO FINANCIAL STATEMENTS at April 30, 2018 (Unaudited), Continued
valuation or, if there has been no sale on such day, at the mean between the bid and asked prices. Securities primarily traded in the NASDAQ Global Market System for which market quotations are readily available shall be valued using the NASDAQ Official Closing Price (“NOCP”). If the NOCP is not available, such securities shall be valued at the last sale price on the day of valuation, or if there has been no sale on such day, at the mean between the bid and asked prices. Over-the-counter securities which are not traded in the NASDAQ Global Market System shall be valued at the most recent sales price. The values for foreign securities are reported in local currency and converted to U.S. dollars using currency exchange rates. Exchange rates are provided daily by a recognized independent pricing agent. Investments in open-end mutual funds are valued at their net asset value per share. To the extent, these securities are actively traded and valuation adjustments are not applied, they are categorized in level 1 of the fair value hierarchy.
Short-Term Securities – Short-term debt securities, including those securities having a maturity of 60 days or less, are valued at the evaluated mean between the bid and asked prices. To the extent the inputs are observable and timely, these securities would be classified in level 2 of the fair value hierarchy.
The Board of Trustees (“Board”) has delegated day-to-day valuation issues to a Valuation Committee of the Trust which is comprised of representatives from U.S. Bancorp Fund Services, LLC, the Funds’ administrator. The function of the Valuation Committee is to value securities where current and reliable market quotations are not readily available or the closing price does not represent fair value by following procedures approved by the Board. These procedures consider many factors, including the type of security, size of holding, trading volume and news events. All actions taken by the Valuation Committee are subsequently reviewed and ratified by the Board. Depending on the relative significance of the valuation inputs, fair valued securities may be classified in either level 2 or level 3 of the fair value hierarchy.
52
Huber Funds
NOTES TO FINANCIAL STATEMENTS at April 30, 2018 (Unaudited), Continued
The inputs or methodology used for valuing securities are not an indication of the risk associated with investing in those securities. The following is a summary of the inputs used to value the Funds’ securities as of April 30, 2018:
|
Equity Income Fund
|
|||||||||||||||||
|
Level 1
|
Level 2
|
Level 3
|
Total
|
||||||||||||||
|
Common Stocks
|
|||||||||||||||||
|
Consumer Discretionary
|
$
|
5,750,230
|
$
|
—
|
$
|
—
|
$
|
5,750,230
|
|||||||||
|
Consumer Staples
|
4,884,927
|
—
|
—
|
4,884,927
|
|||||||||||||
|
Energy
|
4,710,636
|
—
|
—
|
4,710,636
|
|||||||||||||
|
Financial Services
|
22,061,616
|
—
|
—
|
22,061,616
|
|||||||||||||
|
Health Care
|
8,665,165
|
—
|
—
|
8,665,165
|
|||||||||||||
|
Industrials
|
1,074,566
|
—
|
—
|
1,074,566
|
|||||||||||||
|
Information Technology
|
1,455,012
|
—
|
—
|
1,455,012
|
|||||||||||||
|
Materials & Processing
|
912,675
|
—
|
—
|
912,675
|
|||||||||||||
|
Producer Durables
|
15,350,016
|
—
|
—
|
15,350,016
|
|||||||||||||
|
Technology
|
8,143,102
|
—
|
—
|
8,143,102
|
|||||||||||||
|
Utilities
|
3,819,414
|
—
|
—
|
3,819,414
|
|||||||||||||
|
Total Common Stocks
|
76,827,359
|
—
|
—
|
76,827,359
|
|||||||||||||
|
Short-Term Investments
|
1,866,029
|
—
|
—
|
1,866,029
|
|||||||||||||
|
Total Investments
|
|||||||||||||||||
|
in Securities
|
$
|
78,693,388
|
$
|
—
|
$
|
—
|
$
|
78,693,388
|
|||||||||
|
Small Cap Value Fund
|
|||||||||||||||||
|
Level 1
|
Level 2
|
Level 3
|
Total
|
||||||||||||||
|
Common Stocks
|
|||||||||||||||||
|
Consumer Discretionary
|
$
|
2,986,429
|
$
|
—
|
$
|
—
|
$
|
2,986,429
|
|||||||||
|
Energy
|
9,375,295
|
—
|
—
|
9,375,295
|
|||||||||||||
|
Financial Services
|
29,335,973
|
—
|
—
|
29,335,973
|
|||||||||||||
|
Health Care
|
1,900,401
|
—
|
—
|
1,900,401
|
|||||||||||||
|
Industrials
|
176,760
|
—
|
—
|
176,760
|
|||||||||||||
|
Information Technology
|
7,414,618
|
—
|
—
|
7,414,618
|
|||||||||||||
|
Materials & Processing
|
8,003,563
|
—
|
—
|
8,003,563
|
|||||||||||||
|
Producer Durables
|
6,995,813
|
—
|
—
|
6,995,813
|
|||||||||||||
|
Technology
|
3,597,814
|
—
|
—
|
3,597,814
|
|||||||||||||
|
Utilities
|
2,614,963
|
—
|
—
|
2,614,963
|
|||||||||||||
|
Total Common Stocks
|
72,401,629
|
—
|
—
|
72,401,629
|
|||||||||||||
|
Short-Term Investments
|
3,117,384
|
—
|
—
|
3,117,384
|
|||||||||||||
|
Total Investments
|
|||||||||||||||||
|
in Securities
|
$
|
75,519,013
|
$
|
—
|
$
|
—
|
$
|
75,519,013
|
|||||||||
53
Huber Funds
NOTES TO FINANCIAL STATEMENTS at April 30, 2018 (Unaudited), Continued
|
Diversified Large Cap Value Fund
|
|||||||||||||||||
|
Level 1
|
Level 2
|
Level 3
|
Total
|
||||||||||||||
|
Common Stocks
|
|||||||||||||||||
|
Consumer Discretionary
|
$
|
368,080
|
$
|
—
|
$
|
—
|
$
|
368,080
|
|||||||||
|
Consumer Staples
|
317,468
|
—
|
—
|
317,468
|
|||||||||||||
|
Energy
|
333,946
|
—
|
—
|
333,946
|
|||||||||||||
|
Financial Services
|
1,359,451
|
—
|
—
|
1,359,451
|
|||||||||||||
|
Health Care
|
399,685
|
—
|
—
|
399,685
|
|||||||||||||
|
Industrials
|
73,021
|
—
|
—
|
73,021
|
|||||||||||||
|
Information Technology
|
17,623
|
—
|
—
|
17,623
|
|||||||||||||
|
Materials & Processing
|
52,100
|
—
|
—
|
52,100
|
|||||||||||||
|
Producer Durables
|
820,390
|
—
|
—
|
820,390
|
|||||||||||||
|
Technology
|
628,939
|
—
|
—
|
628,939
|
|||||||||||||
|
Utilities
|
308,417
|
—
|
—
|
308,417
|
|||||||||||||
|
Total Common Stocks
|
4,679,120
|
—
|
—
|
4,679,120
|
|||||||||||||
|
Short-Term Investments
|
333,853
|
—
|
—
|
333,853
|
|||||||||||||
|
Total Investments
|
|||||||||||||||||
|
in Securities
|
$
|
5,012,973
|
$
|
—
|
$
|
—
|
$
|
5,012,973
|
|||||||||
|
Mid Cap Value Fund
|
|||||||||||||||||
|
Level 1
|
Level 2
|
Level 3
|
Total
|
||||||||||||||
|
Common Stocks
|
|||||||||||||||||
|
Consumer Discretionary
|
$
|
35,165
|
$
|
—
|
$
|
—
|
$
|
35,165
|
|||||||||
|
Consumer Staples
|
51,873
|
—
|
—
|
51,873
|
|||||||||||||
|
Energy
|
307,369
|
—
|
—
|
307,369
|
|||||||||||||
|
Financial Services
|
581,276
|
—
|
—
|
581,276
|
|||||||||||||
|
Health Care
|
48,932
|
—
|
—
|
48,932
|
|||||||||||||
|
Industrials
|
157,976
|
—
|
—
|
157,976
|
|||||||||||||
|
Information Technology
|
248,782
|
—
|
—
|
248,782
|
|||||||||||||
|
Materials & Processing
|
159,264
|
—
|
—
|
159,264
|
|||||||||||||
|
Real Estate
|
88,833
|
—
|
—
|
88,833
|
|||||||||||||
|
Utilities
|
65,018
|
—
|
—
|
65,018
|
|||||||||||||
|
Total Common Stocks
|
1,744,488
|
—
|
—
|
1,744,488
|
|||||||||||||
|
Short-Term Investments
|
160,860
|
—
|
—
|
160,860
|
|||||||||||||
|
Total Investments
|
|||||||||||||||||
|
in Securities
|
$
|
1,905,348
|
$
|
—
|
$
|
—
|
$
|
1,905,348
|
|||||||||
Refer to the Funds’ schedule of investments for a detailed break-out of common stocks by industry classification. Transfers between levels are recognized at April 30, 2018, the end of the reporting period. The Funds recognized no transfers to/from level 1 or level 2. There were no level 3 securities held in the Funds during the six months ended April 30, 2018.
54
Huber Funds
NOTES TO FINANCIAL STATEMENTS at April 30, 2018 (Unaudited), Continued
NOTE 4 – INVESTMENT ADVISORY FEE AND OTHER TRANSACTIONS WITH AFFILIATES
The Funds have an investment advisory agreement with Huber Capital Management, LLC (the “Adviser”) pursuant to which the Adviser is responsible for providing investment management services to the Funds. The Adviser furnished all investment advice, office space and facilities, and provides most of the personnel needed by the Funds. As compensation for its services, the Adviser is entitled to a fee, computed daily and payable monthly. The Equity Income Fund pays fees calculated at an annual rate of 0.99% based upon the Fund’s average daily net assets for the first $10 billion, 0.75% based upon the Fund’s average daily net assets for the next $10 billion, and 0.50% based upon the Fund’s average daily net assets in excess of $20 billion. For the period February 28, 2018 through February 27, 2019, the Adviser has agreed to voluntarily reduce the Equity Income Fund’s contractual management fee from 0.99% to 0.75%. The Small Cap Value Fund pays fees calculated at an annual rate of 1.35% based upon the Fund’s average daily net assets for the first $5 billion and 1.00% based upon the Fund’s average daily net assets in excess of $5 billion. For the period February 28, 2018 through February 27, 2019, the Adviser has agreed to voluntarily reduce the Small Cap Value Fund’s contractual management fee from 1.35% to 0.99%. The Diversified Large Cap Value Fund pays fees calculated at an annual rate of 0.75% based upon the Fund’s average daily net assets for the first $10 billion and 0.50% based upon the Fund’s average daily net assets in excess of $10 billion. For the period February 28, 2018 through February 27, 2019, the Adviser has agreed to voluntarily reduce the Diversified Large Cap Value Fund’s contractual management fee from 0.75% to 0.00%. The Mid Cap Value Fund pays fees calculated at an annual rate of 1.00% based upon the Fund’s average daily net assets. For the period February 28, 2018 through February 27, 2019, the Adviser has agreed to voluntarily reduce the Mid Cap Value Fund’s contractual management fee from 1.00% to 0.00%. For the six months ended April 30, 2018, the Equity Income Fund, the Small Cap Value Fund, the Diversified Large Cap Value Fund, and the Mid Cap Value Fund incurred $386,834, $445,907, $21,321, and $21,288, respectively, in investment advisory fees.
The Funds are responsible for their own operating expenses. The Adviser has agreed to reduce fees payable to it by the Funds and to pay Fund operating expenses to the extent necessary to limit the Fund’s aggregate annual operating expenses as follows:
|
Investor
|
Institutional
|
||
|
Class
|
Class
|
||
|
Huber Capital Equity Income Fund
|
1.39%
|
0.99%
|
|
|
Huber Capital Small Cap Value Fund
|
1.75%
|
1.35%
|
|
|
Huber Capital Diversified Large Cap Value Fund
|
1.15%
|
0.75%
|
|
|
Huber Capital Mid Cap Value Fund
|
1.40%
|
1.10%
|
|
|
Percent of average daily net assets of the Funds.
|
55
Huber Funds
NOTES TO FINANCIAL STATEMENTS at April 30, 2018 (Unaudited), Continued
Any such reduction made by the Adviser in its fees or payment of expenses which are the Funds’ obligation are subject to reimbursement by the Funds to the Adviser, if so requested by the Adviser, in any subsequent month in the three year period from the date of the management fee reduction and expense payment if the aggregate amount actually paid by the Funds toward the operating expenses for such fiscal year (taking into account the reimbursement) will not cause the Fund to exceed the lesser of: (1) the expense limitation in place at the time of the management fee reduction and expense payment; or (2) the expense limitation in place at the time of the reimbursement. Any such reimbursement is also contingent upon Board of Trustees review and approval at the time the reimbursement is made. Such reimbursement may not be paid prior to the Fund’s payment of current ordinary operating expenses. For the six months ended April 30, 2018, the Adviser reduced its fees and absorbed Fund expenses in the amount of $117,925 for the Equity Income Fund, $82,826 for the Small Cap Value Fund, $87,935 for the Diversified Large Cap Value Fund, and $96,807 for the Mid Cap Value Fund.
No amounts were reimbursed to the Adviser. Cumulative expenses subject to recapture pursuant to the aforementioned conditions and the year of expiration are as follows:
|
Diversified
|
|||||||||||||||||
|
Equity
|
Small Cap
|
Large Cap
|
Mid Cap
|
||||||||||||||
|
Expiration
|
Income Fund
|
Value Fund
|
Value Fund
|
Value Fund
|
|||||||||||||
|
10/31/18
|
$
|
437,811
|
$
|
656,781
|
$
|
204,855
|
$
|
—
|
|||||||||
|
10/31/19
|
303,526
|
430,061
|
189,156
|
169,269
|
|||||||||||||
|
10/31/20
|
312,041
|
27,460
|
199,514
|
198,425
|
|||||||||||||
|
11/20 – 4/21
|
117,925
|
82,826
|
87,935
|
96,807
|
|||||||||||||
|
$
|
1,171,303
|
$
|
1,197,128
|
$
|
681,460
|
$
|
464,501
|
||||||||||
U.S. Bancorp Fund Services, LLC (the “Administrator”) acts as the Funds’ Administrator under an Administration Agreement. The Administrator prepares various federal and state regulatory filings, reports and returns for the Funds; prepares reports and materials to be supplied to the Trustees; monitors the activities of the Funds’ custodian, transfer agent and accountants; coordinates the preparation and payment of the Funds’ expenses and reviews the Funds’ expense accruals. U.S. Bancorp Fund Services, LLC also serves as the fund accountant and transfer agent to the Funds. U.S. Bank N.A., an affiliate of U.S. Bancorp Fund Services, serves as the Funds’ custodian.
56
Huber Funds
NOTES TO FINANCIAL STATEMENTS at April 30, 2018 (Unaudited), Continued
For the six months ended April 30, 2018, the Funds incurred the following expenses for administration, fund accounting, transfer agency, custody, and Chief Compliance Officer fees:
|
|
Diversified
|
|||||||||||||||
|
|
Equity
|
Small Cap
|
Large Cap
|
Mid Cap
|
||||||||||||
|
|
Income Fund
|
Value Fund
|
Value Fund
|
Value Fund
|
||||||||||||
|
Administration
|
$
|
43,815
|
$
|
42,636
|
$
|
21,321
|
$
|
21,288
|
||||||||
|
Fund Accounting
|
22,313
|
22,419
|
16,317
|
16,259
|
||||||||||||
|
Transfer Agency (excludes
|
||||||||||||||||
|
out-of-pocket expenses)
|
18,653
|
22,940
|
15,338
|
15,282
|
||||||||||||
|
Custody
|
9,002
|
9,293
|
2,883
|
6,179
|
||||||||||||
|
Chief Compliance Officer
|
4,463
|
4,463
|
4,463
|
4,463
|
||||||||||||
At April 30, 2018, the Funds had payables due to USBFS for administration, fund accounting, transfer agency and Chief Compliance Officer fees and to U.S. Bank, N.A. for custody fees in the following amounts:
|
|
Diversified
|
|||||||||||||||
|
|
Equity
|
Small Cap
|
Large Cap
|
Mid Cap
|
||||||||||||
|
|
Income Fund
|
Value Fund
|
Value Fund
|
Value Fund
|
||||||||||||
|
Administration
|
$
|
12,389
|
$
|
17,335
|
$
|
7,786
|
$
|
7,885
|
||||||||
|
Fund Accounting
|
8,844
|
9,284
|
5,679
|
5,863
|
||||||||||||
|
Transfer Agency (excludes
|
||||||||||||||||
|
out-of-pocket)
|
8,488
|
9,875
|
5,369
|
5,239
|
||||||||||||
|
Custody
|
—
|
4,666
|
1,623
|
3,148
|
||||||||||||
|
Chief Compliance Officer
|
1,463
|
1,463
|
1,463
|
1,463
|
||||||||||||
Quasar Distributors, LLC (the “Distributor”) acts as the Funds’ principal underwriter in a continuous public offering of the Funds’ shares. The Distributor is an affiliate of the Administrator.
Certain officers of the Fund are employees of USBFS. The Trust’s Chief Compliance Officer is also an employee of USBFS. A Trustee of the Trust was previously considered an Interested Trustee and an affiliate of USBFS and U.S. Bank N.A. Effective January 1, 2018, this same Trustee became an Independent Trustee.
NOTE 5 – SHAREHOLDER SERVICING FEE
The Funds have entered into a shareholder servicing agreement (the “Agreement”) with the Adviser, under which the Investor Class of the Funds may pay servicing fees at an annual rate of up to 0.15% of the average daily net assets of each Investor Class and at an annual rate of up to 0.10% of the average daily net assets of the Institutional Class of the Mid Cap Value Fund. Payments to the Adviser under the Agreement may reimburse the Adviser for payments it makes to selected brokers, dealers and administrators which have entered into service
57
Huber Funds
NOTES TO FINANCIAL STATEMENTS at April 30, 2018 (Unaudited), Continued
agreements with the Adviser for services provided to shareholders of the Funds. The services provided by such intermediaries are primarily designed to assist shareholders of the Funds and include the furnishing of office space and equipment, telephone facilities, personnel and assistance to the Funds in servicing such shareholders. Services provided by such intermediaries also include the provision of support services to the Funds and include establishing and maintaining shareholders’ accounts and record processing, purchase and redemption transactions, answering routine client inquiries regarding the Funds, and providing such other personal services to shareholders as the Funds may reasonably request. For the six months ended April 30, 2018, the Equity Income Fund Investor Class, Small Cap Value Fund Investor Class, Mid Cap Value Fund Investor Class, and the Mid Cap Value Fund Institutional Class incurred shareholder servicing fees of $4,219, $12,339, $67 and $8 under the Agreement, respectively.
NOTE 6 – 12B-1 DISTRIBUTION AGREEMENT AND PLAN
The Funds have adopted a Distribution Plan pursuant to Rule 12b-1 (the “Plan”). The Plan permits the Funds to pay Quasar Distributors, LLC (the “Distributor”) for distribution and related expenses at an annual rate of up to 0.25% of each Fund’s Investor Class’ average daily net assets. The expenses covered by the Plan may include the cost of preparing and distributing prospectuses and other sales material, advertising and public relations expenses, payments to financial intermediaries and compensation of personnel involved in selling shares of the Funds. Payments made pursuant to the Plan will represent reimbursement for specific expenses incurred in connection with the promotion and distribution of shares. For the six months ended April 30, 2018, the Equity Income Fund Investor Class, Small Cap Value Fund Investor Class, Diversified Large Cap Value Fund Investor Class, and Mid Cap Value Investor Class paid the Distributor $8,764, $30,674, $2,021, and $331, respectively.
NOTE 7 – PURCHASES AND SALES OF SECURITIES
For the six months ended April 30, 2018, the cost of purchases and the proceeds from sales of securities (excluding short-term securities) were as follows:
|
|
Diversified
|
|||||||||||||||
|
|
Equity
|
Small Cap
|
Large Cap
|
Mid Cap
|
||||||||||||
|
|
Income Fund
|
Value Fund
|
Value Fund
|
Value Fund
|
||||||||||||
|
Purchases
|
$
|
7,841,392
|
$
|
6,346,008
|
$
|
573,944
|
$
|
465,093
|
||||||||
|
Sales
|
19,064,930
|
28,501,616
|
*
|
795,223
|
364,782
|
|||||||||||
* Sales transactions include securities redeemed in-kind of $18,137,193.
58
Huber Funds
NOTES TO FINANCIAL STATEMENTS at April 30, 2018 (Unaudited), Continued
NOTE 8 – INCOME TAXES AND DISTRIBUTIONS TO SHAREHOLDERS
The tax character of distributions paid during the six months ended April 30, 2018 and the year ended October 31, 2017 was as follows:
|
|
Equity Income Fund
|
|
|
|
Six Months Ended
|
Year Ended
|
|
|
April 30, 2018
|
October 31, 2017
|
|
Ordinary income
|
$1,145,373
|
$1,522,463
|
|
|
Small Cap Value Fund
|
|
|
|
Six Months Ended
|
Year Ended
|
|
|
April 30, 2018
|
October 31, 2017
|
|
Ordinary income
|
$682,427
|
$1,472,179
|
|
|
Diversified Large Cap Value Fund
|
|
|
|
Six Months Ended
|
Year Ended
|
|
|
April 30, 2018
|
October 31, 2017
|
|
Ordinary income
|
$78,919
|
$124,852
|
|
|
Mid Cap Value Fund
|
|
|
|
Six Months Ended
|
Year Ended
|
|
|
April 30, 2018
|
October 31, 2017
|
|
Ordinary income
|
$14,037
|
$35,471
|
|
Long-term capital gains
|
—
|
588
|
As of October 31, 2017, the Funds’ most recently completed fiscal year end, the components of accumulated earnings/(losses) on a tax basis were as follows:
|
|
Equity
|
Small Cap
|
||||||
|
|
Income Fund
|
Value Fund
|
||||||
|
Cost of investments for tax purposes (a)
|
$
|
56,586,686
|
$
|
70,544,325
|
||||
|
Gross tax unrealized appreciation
|
33,502,074
|
30,054,101
|
||||||
|
Gross tax unrealized depreciation
|
(1,750,767
|
)
|
(9,542,032
|
)
|
||||
|
Net tax unrealized appreciation
|
31,751,307
|
20,512,069
|
||||||
|
Undistributed ordinary income
|
1,007,927
|
597,349
|
||||||
|
Undistributed long-term capital gain
|
—
|
—
|
||||||
|
Total distributable earnings
|
1,007,927
|
597,349
|
||||||
|
Other accumulated gains/(losses)
|
(7,677,841
|
)
|
(11,091,733
|
)
|
||||
|
Total accumulated earnings
|
$
|
25,081,393
|
$
|
10,017,685
|
||||
59
Huber Funds
NOTES TO FINANCIAL STATEMENTS at April 30, 2018 (Unaudited), Continued
|
|
Diversified
|
|||||||
|
|
Large Cap
|
Mid Cap
|
||||||
|
|
Value Fund
|
Value Fund
|
||||||
|
Cost of investments for tax purposes (a)
|
$
|
3,537,771
|
$
|
1,261,029
|
||||
|
Gross tax unrealized appreciation
|
1,474,362
|
392,767
|
||||||
|
Gross tax unrealized depreciation
|
(55,935
|
)
|
(60,293
|
)
|
||||
|
Net tax unrealized appreciation
|
1,418,427
|
331,844
|
||||||
|
Undistributed ordinary income
|
69,619
|
14,037
|
||||||
|
Undistributed long-term capital gain
|
—
|
—
|
||||||
|
Total distributable earnings
|
69,619
|
14,037
|
||||||
|
Other accumulated gains/(losses)
|
(272,645
|
)
|
(39,116
|
)
|
||||
|
Total accumulated earnings
|
$
|
1,215,401
|
$
|
306,765
|
||||
(a) The difference between book-basis and tax-basis cost is attributable primarily to the tax deferral of losses on wash sales.
At October 31, 2017, the Funds had capital loss carryforwards as follows:
|
|
Capital Loss Carryforwards
|
|||||||
|
|
Short-Term
|
Long-Term
|
||||||
|
Equity Income Fund
|
$
|
592,325
|
$
|
7,085,516
|
||||
|
Small Cap Value Fund
|
4,603,666
|
6,487,944
|
||||||
|
Diversified Large Cap Value Fund
|
130,638
|
142,007
|
||||||
|
Mid Cap Value Fund
|
—
|
38,825
|
||||||
These capital losses may be carried forward indefinitely to offset future gains.
NOTE 9 – ADVISOR REIMBURSEMENT FOR LOSS
On March 28, 2017, the Mid Cap Value Fund received a reimbursement of $94 from the Adviser related to net losses incurred on the disposal of investments that were purchased in violation of the Fund’s investment restrictions during the year ended October 31, 2017. The net reimbursement comprises the “net increase from payment by affiliate on the disposal of investments in violation of investment restrictions” in the statement of changes in net assets.
NOTE 10 – PRINCIPAL RISKS
Below is a summary of some, but not all, of the principal risks of investing in the Funds, each of which may adversely affect a Fund’s net asset value and total return. The Funds’ most recent prospectus provides further descriptions of each Fund’s investment objective, principal investment strategies and principal risks.
|
•
|
Foreign Securities and Emerging Markets Risk – Investments in foreign securities and emerging markets are subject to special risks. Foreign securities can be more volatile than domestic (U.S.) securities. Securities
|
60
Huber Funds
NOTES TO FINANCIAL STATEMENTS at April 30, 2018 (Unaudited), Continued
|
markets of other countries are generally smaller than U.S. securities markets. Many foreign securities may be less liquid and more volatile than U.S. securities, which could affect each Fund’s investments. In addition, the Funds may invest in emerging markets which are more volatile than the markets of developed countries.
|
||
|
•
|
Initial Public Offering (“IPO”) Risk – The risk exists that the market value of IPO shares will fluctuate considerably due to factors such as the absence of a prior public market, unseasoned trading, the small number of shares available for trading and limited information about the issuer. The purchase of IPO shares may involve high transaction costs. IPO shares are subject to market risk and liquidity risk. When an asset base is small, a significant portion of the Fund’s performance could be attributable to investments in IPOs, because such investments would have a magnified impact on the Fund. As the Fund’s assets grow, the effect of the Fund’s investments in IPOs on the Fund’s performance probably will decline, which could reduce the Fund’s performance.
|
|
|
•
|
Value Style Investing Risk – The value investing style may over time go in and out of favor. At times when the value investing style is out of favor, the Funds may underperform other funds that use different investing styles.
|
|
|
•
|
Sector Emphasis Risk – Securities of companies in the same or related businesses, if comprising a significant portion of each Fund’s portfolio, could react in some circumstances negatively to market conditions, interest rates and economic, regulatory or financial developments and adversely affect the value of the portfolio to a greater extent than if such business comprised a lesser portion of the Fund’s portfolio.
|
|
|
•
|
Small Companies Risk (Small Cap Value Fund only) – Investing in securities of small-sized companies may involve greater volatility than investing in larger and more established companies because companies with small market capitalizations can be subject to more abrupt or erratic share price changes than larger, more established companies.
|
|
|
•
|
Mid Cap Company Risk (Mid Cap Value Fund only) – A mid cap company may be more vulnerable to adverse business or economic events than stocks of larger companies. These stocks present greater risks than securities of larger, more diversified companies.
|
61
Huber Funds
NOTICE TO SHAREHOLDERS at April 30, 2018 (Unaudited)
How to Obtain a Copy of the Funds’ Proxy Voting Policies
A description of the policies and procedures that the Funds use to determine how to vote proxies relating to portfolio securities is available without charge upon request by calling 1-888-482-3726 (888-HUBERCM) or on the U.S. Securities and Exchange Commission’s (“SEC”) website at http://www.sec.gov.
How to Obtain a Copy of the Funds’ Proxy Voting Records for the 12-Month Period Ended June 30
Information regarding how the Funds voted proxies relating to portfolio securities during the most recent period ended June 30 is available without charge, upon request, by calling 1-888-482-3726 (888-HUBERCM). Furthermore, you can obtain the Funds’ proxy voting records on the SEC’s website at http://www.sec.gov.
Quarterly Filings on Form N-Q
The Funds file their complete schedule of portfolio holdings with the SEC for the first and third quarters of each fiscal year on Form N-Q. The Funds’ Form N-Q is available on the SEC’s website at http://www.sec.gov. The Funds’ Form N-Q may be reviewed and copied at the SEC’s Public Reference Room in Washington, DC and information on the operation of the Public Reference Room may be obtained by calling 1-202-551-8090. Information included in the Funds’ Form N-Q is also available by calling 1-888-482-3726 (888-HUBERCM).
62
Huber Funds
APPROVAL OF INVESTMENT ADVISORY AGREEMENT (Unaudited)
Huber Capital Equity Income Fund
Huber Capital Small Cap Value Fund
Huber Capital Diversified Large Cap Value Fund
Huber Capital Mid Cap Value Fund
At a meeting held on December 6-7, 2017, the Board (which is comprised of five persons, four of whom are Independent Trustees as defined under the Investment Company Act of 1940, as amended), considered and approved, for another annual term, the continuance of the investment advisory agreement (the “Advisory Agreement”) between Advisors Series Trust (the “Trust”) and Huber Capital Management, LLC (the “Adviser”) on behalf of the Huber Capital Equity Income Fund (the “Equity Income Fund”), Huber Capital Small Cap Value Fund (the “Small Cap Value Fund”), Huber Capital Diversified Large Cap Value Fund (the “Diversified Large Cap Value Fund”) and Huber Capital Mid Cap Value Fund (the “Mid Cap Fund”) (collectively, the “Funds”). At this meeting, and at a prior meeting held on October 17-18, 2017, the Board received and reviewed substantial information regarding the Funds, the Adviser and the services provided by the Adviser to the Funds under the Advisory Agreement. This information, together with the information provided to the Board throughout the course of the year, formed the primary (but not exclusive) basis for the Board’s determination. Below is a summary of the factors considered by the Board and the conclusions that formed the basis for the Board’s approval of the continuance of the Advisory Agreement:
|
1.
|
THE NATURE, EXTENT AND QUALITY OF THE SERVICES PROVIDED AND TO BE PROVIDED BY THE ADVISER UNDER THE ADVISORY AGREEMENT. The Board considered the nature, extent and quality of the Adviser’s overall services provided to the Funds as well as its specific responsibilities in all aspects of day-to-day investment management of the Funds. The Board considered the qualifications, experience and responsibilities of the portfolio manager, as well as the responsibilities of other key personnel of the Adviser involved in the day-to-day activities of the Funds. The Board also considered the resources and compliance structure of the Adviser, including information regarding its compliance program, its chief compliance officer and the Adviser’s compliance record, as well as the Adviser’s cybersecurity program and business continuity plan. The Board also considered the prior relationship between the Adviser and the Trust, as well as the Board’s knowledge of the Adviser’s operations, and noted that during the course of the prior year they had met with the Adviser in person to discuss the Funds’ performance and investment outlook as well as various marketing and compliance topics, including the Adviser’s risk management process. The Board concluded that the Adviser
|
63
Huber Funds
APPROVAL OF INVESTMENT ADVISORY AGREEMENT (Unaudited), Continued
|
had the quality and depth of personnel, resources, investment methods and compliance policies and procedures essential to performing its duties under the Advisory Agreement and that the nature, overall quality and extent of such management services are satisfactory.
|
||
|
2.
|
THE FUNDS’ HISTORICAL PERFORMANCE AND THE OVERALL PERFORMANCE OF THE ADVISER. In assessing the quality of the portfolio management delivered by the Adviser, the Board reviewed the short-term and long-term performance of the Funds as of June 30, 2017 on both an absolute basis and in comparison to its peer funds utilizing Lipper and Morningstar classifications and appropriate securities benchmarks. While the Board considered both short-term and long-term performance, it placed greater emphasis on longer term performance. The Board noted that the Mid Cap Value Fund was new, with less than two years of performance. The Board also took into account that each Fund’s track record is measured as of a specific date, and that track records can vary as of different measurement dates. Therefore, in reviewing a Fund that is currently underperforming, the Trustees also considered the broader perspective of the Fund’s performance over varying time periods, the market conditions experienced during the periods under review, as well as the outlook for the Fund going forward in light of expected market conditions. When reviewing performance against the comparative peer group universe, the Board took into account that the investment objectives and strategies of the Funds, as well as each Fund’s level of risk tolerance, may differ significantly from funds in the peer universe. The Trustees also discussed with the Adviser and considered that certain periods of underperformance may be transitory while other periods of underperformance may be reflective of broader issues that may warrant consideration of corrective action. The Board therefore took into account the Adviser’s views as to the reasons for each Fund’s relative performance against peers and benchmarks over various time periods and its future outlook for each Fund. In considering each Fund’s performance, the Trustees placed greater emphasis on performance against peers as opposed to the unmanaged benchmark indices.
|
|
|
Equity Income Fund: The Board noted that the Fund’s performance, with regard to its Lipper comparative universe, was above the peer group median for the one-year and ten-year periods and below its peer group median for the three-year and five-year periods.
|
||
|
The Board noted that the Fund’s performance, with regard to its Morningstar comparative universe, was above its peer group median for
|
64
Huber Funds
APPROVAL OF INVESTMENT ADVISORY AGREEMENT (Unaudited), Continued
|
the one-year period and below its peer group median for the three-year, five-year and ten-year periods.
|
||
|
The Board reviewed the performance of the Fund against broad-based securities market benchmarks.
|
||
|
The Board also considered any differences in performance between the Adviser’s similarly managed accounts and the performance of the Fund, noting the Adviser’s explanation for the differences, including that the Fund is managed for tax efficiency while similarly managed accounts are not, differences in cash flow and client-specific restrictions.
|
||
|
Small Cap Value Fund: The Board noted that the Fund’s performance, with regard to its Lipper comparative universe, was above its peer group median for the one-year period and below its peer group median for the three-year, five-year and ten-year periods.
|
||
|
The Board noted that the Fund’s performance, with regard to its Morningstar comparative universe, above its peer group median for the one-year period and was below its peer group median for the three-year, five-year and ten-year periods.
|
||
|
The Board reviewed the performance of the Fund against broad-based securities market benchmarks.
|
||
|
The Board also considered any differences in performance between the Adviser’s similarly managed accounts and the performance of the Fund, noting the Adviser’s explanation for the differences, including that the Fund is managed for tax efficiency while similarly managed accounts are not, differences in cash flow and client-specific restrictions.
|
||
|
Diversified Large Cap Value Fund: The Board noted that the Fund’s performance, with regard to its Lipper comparative universe, was above its peer group median for the one-year period and below its peer group median for the three-year and since inception periods.
|
||
|
The Board reviewed the performance of the Fund against broad-based securities market benchmarks.
|
||
|
The Board noted that the Fund’s performance, with regard to its Morningstar comparative universe, was above its peer group median for the one-year period and below its peer group median for the three-year and since inception periods.
|
||
|
The Board also considered any differences in performance between similarly managed accounts and the performance of the Fund, noting the Adviser’s explanation for the differences, including that the Fund is
|
65
Huber Funds
APPROVAL OF INVESTMENT ADVISORY AGREEMENT (Unaudited), Continued
|
managed for tax efficiency while similarly managed accounts are not, differences in cash flow and client-specific restrictions.
|
||
|
Mid Cap Value Fund: The Board noted that the Fund’s performance, with regard to its Lipper comparative universe, was above its peer group median for the one-year period and below its peer group median for the since inception period.
|
||
|
The Board noted that the Fund’s performance, with regard to its Morningstar comparative universe, was above its peer group median for the one-year period and below its peer group median for the since inception period.
|
||
|
The Board also reviewed the performance of the Fund against broad-based securities market benchmarks.
|
||
|
The Board noted that the Adviser represented it does not have any similarly managed accounts to the Fund.
|
||
|
3.
|
THE COSTS OF THE SERVICES TO BE PROVIDED BY THE ADVISER AND THE STRUCTURE OF THE ADVISER’S FEE UNDER THE ADVISORY AGREEMENT. In considering the advisory fee and total fees and expenses of each of the Funds, the Board reviewed comparisons to the peer funds and the Adviser’s similarly managed separate accounts for other types of clients, as well as all expense waivers and reimbursements. When reviewing fees charged to other similarly managed accounts, the Board took into account the type of account and the differences in the management of that account that might be germane to the difference, if any, in the fees charged to such accounts. The Board found that the fees charged to the Funds were generally higher than the fees charged by the Adviser to its similarly managed separate account clients due to the nature of the separate account clients and the greater costs to the Adviser of managing the Funds.
|
|
|
Equity Income Fund: The Board noted that the Adviser had contractually agreed to maintain an annual expense ratio for the Fund of 1.39% for Investor Class shares and 0.99% for Institutional Class shares (the “Expense Caps”). The Board noted that the Fund’s total expense ratio for Investor Class shares was above the peer group median and average, as well as above the peer group median and average when the Fund’s peer group was adjusted to include only funds with similar asset sizes. The Board also noted that the total expense ratio for Institutional Class shares was above the peer group median but below the peer group average and below the peer group median and average when the Fund’s peer group was adjusted to include only funds with similar asset sizes. The Board noted that the contractual advisory fee was significantly above the peer group median and average, as well as above the peer group median and average when the Fund’s peer group was
|
66
Huber Funds
APPROVAL OF INVESTMENT ADVISORY AGREEMENT (Unaudited), Continued
|
adjusted to include only funds with similar asset sizes. The Board also considered that after advisory fee waivers and the reimbursement of Fund expenses necessary to maintain the Expense Caps, the net advisory fee received by the Adviser from the Fund during the most recent fiscal period was slightly above the peer group median and average, as well as slightly below the peer group median and average when the Fund’s peer group was adjusted to include only funds with similar asset sizes. The Board also took into consideration the services the Adviser provides to its institutional separate account clients, comparing the fees charged for those management services to the management fees charged to the Fund. The Board found that the contractual management fees charged to the Fund were above the fees charged to its institutional separate account clients except at very high asset levels, noting the Adviser represented that there are higher costs associated with managing the Fund and that the minimum investment amount for the separate account clients is much higher than that of the Fund. As a result, the Board noted that the Fund’s expenses and contractual advisory fee were generally above the range of its peer group but that they were not unreasonable.
|
||
|
Small Cap Value Fund: The Board noted that the Adviser had contractually agreed to maintain Expense Caps for the Fund of 1.75% for Investor Class shares and 1.35% for Institutional Class shares. The Board noted that the Fund’s total expense ratio for Investor Class shares was above the peer group median and average, as well as above the peer group median and average when the Fund’s peer group was adjusted to include only funds with similar asset sizes. The Board also noted that the total expense ratio for Institutional Class shares was above the peer group median and peer group average. The Board noted that the Fund’s total expense ratio for the Institutional Class when the Fund’s peer group was adjusted to include only funds with similar asset sizes was equal to the peer group median and below the peer group average. The Board noted that the Adviser had agreed to voluntarily reduce its contractual management fee from 1.35% to 0.98% from December 1, 2016 through December 1, 2017. The Board also noted that the contractual advisory fee and voluntary advisory fee were both above the peer group median and average, as well as above the peer group median and average when the Fund’s peer group was adjusted to include only funds with similar asset
|
67
Huber Funds
APPROVAL OF INVESTMENT ADVISORY AGREEMENT (Unaudited), Continued
|
sizes. The Board also considered that after advisory fee waivers and the reimbursement of Fund expenses necessary to maintain the Expense Caps, the advisory fees from the Fund during the most recent fiscal period were above the peer group median and average, as well as above the peer group median and average when the Fund’s peer group was adjusted to include only funds with similar asset sizes. The Board also took into consideration the services the Adviser provides to its institutional separate account clients, comparing the fees charged for those management services to the management fees charged to the Fund. The Board found that the management fees charged to the Fund were above the fees charged to its institutional separate account clients except at very high asset levels, noting the Adviser represented that there are higher costs associated with managing the Fund. The Board noted that the Adviser was considering implementing another voluntary fee waiver and that the Fund’s expenses and contractual advisory fee were generally above the range of its peer group but that they were not unreasonable.
|
||
|
Diversified Large Cap Value Fund: The Board noted that the Adviser had contractually agreed to maintain Expense Caps for the Fund of 1.15% for Investor Class shares and 0.75% for Institutional Class shares. The Board noted that the Fund’s total expense ratio for Investor Class shares was above the peer group median and average. The Board also noted that the Fund’s total expense ratio for Investor Class shares when the Fund’s peer group was adjusted to include only funds with similar asset sizes was above the peer group median and below the peer group average. The Board noted that the total expense ratio for Institutional Class shares was below the peer group median and average, as well as below the peer group median and average when the Fund’s peer group was adjusted to include only funds with similar asset sizes. The Board also noted that the contractual advisory fee was above the peer group median and average. The Board noted that the contractual advisory fee when the Fund’s peer group was adjusted to include only funds with similar asset sizes was above the peer group median and average. The Board also considered that after advisory fee waivers and the reimbursement of Fund expenses necessary to maintain the Expense Caps, the Adviser did not receive any advisory fees from the Fund during the most recent fiscal period. The Board also took into consideration the services the Adviser provides to its institutional separate account clients, comparing the fees charged for those management services to the management fees charged to the Fund. The Board found that the management fees charged to the Fund were above the fees charged to its institutional separate account clients except at very high
|
68
Huber Funds
APPROVAL OF INVESTMENT ADVISORY AGREEMENT (Unaudited), Continued
|
asset levels, noting the Adviser represented that there are higher costs associated with managing the Fund. As a result, the Board noted that the Fund’s expenses and contractual advisory fee were not outside the range of its peer group.
|
||
|
Mid Cap Value Fund: The Board noted that the Adviser had contractually agreed to maintain Expense Caps for the Fund of 1.40% for Investor Class shares and 1.10% for Institutional Class shares. The Board noted that the Fund’s total expense ratio for Investor Class shares was above the peer group median and average. The Board also noted that the Fund’s total expense ratio for Investor Class shares when the Fund’s peer group was adjusted to include only funds with similar asset sizes was above the peer group median and average. The Board noted that the total expense ratio for Institutional Class shares was equal to the peer group median and below the average, as well as below the peer group median and average when the Fund’s peer group was adjusted to include only funds with similar asset sizes. The Board also noted that the contractual advisory fee was above the peer group median and average. The Board noted that the contractual advisory fee when the Fund’s peer group was adjusted to include only funds with similar asset sizes was above the peer group median and above the peer group average. The Board also considered that after advisory fee waivers and the reimbursement of Fund expenses necessary to maintain the Expense Caps, the Adviser did not receive any advisory fees from the Fund during the most recent fiscal period. The Board noted that the Adviser represented it does not have any similarly managed accounts to the Fund. As a result, the Board noted that the Fund’s expenses and contractual advisory fee were not outside the range of its peer group.
|
||
|
4.
|
ECONOMIES OF SCALE. The Board also considered whether economies of scale were being realized by the Adviser that should be shared with shareholders, noting that the Advisory Agreement provides for breakpoints when the Funds reach certain asset levels (beginning at $10 billion for the Equity Income Fund, $5 billion for the Small Cap Value Fund and $10 billion for the Diversified Large Cap Value Fund). The Board noted that these breakpoint levels were significantly above current asset levels and that they would continue to review economies of scale at asset levels that were significantly below these breakpoint levels. The Board also noted that the Mid Cap Value Fund does not have advisory fee breakpoints. The Board noted that the Adviser has contractually agreed to reduce its advisory fees or reimburse Fund expenses so that the Funds do not exceed the specified Expense Caps and also considered that each
|
69
Huber Funds
APPROVAL OF INVESTMENT ADVISORY AGREEMENT (Unaudited), Continued
|
Fund’s advisory fees contained breakpoints at very high asset levels. The Board noted that since the Adviser continued to waive all or a portion of its advisory fee to maintain the expense caps, at current asset levels, it did not appear that there were additional significant economies of scale being realized by the Adviser that should be shared with shareholders. As a result, the Board concluded that it would continue to monitor economies of scale in the future as circumstances changed and assuming asset levels continue to increase. The Board noted that the current breakpoint schedules in the Advisory Agreement may be adjusted if additional significant economies of scale are realized as Fund assets grow such that their economies may be shared with shareholders at lower asset levels than currently provided in the Advisory Agreement.
|
||
|
5.
|
THE PROFITS TO BE REALIZED BY THE ADVISER AND ITS AFFILIATES FROM THEIR RELATIONSHIP WITH THE FUNDS. The Board reviewed the Adviser’s financial information and took into account both the direct benefits and the indirect benefits to the Adviser from advising the Funds. The Board considered the profitability to the Adviser from its relationship with the Funds and considered any additional benefits, including benefits received in the form of Rule 12b-1 fees received by the Adviser, “soft dollars” benefits that may be received by the Adviser in exchange for Fund brokerage, and shareholder servicing plan fees received by the Adviser. The Board also reviewed information from the Adviser indicating that clients do not invest in the Funds through separately managed accounts, and as a result the Adviser was not receiving additional fall-out benefits from any such relationships. After such review, the Board determined that the profitability to the Adviser with respect to the Advisory Agreement was not excessive, and that the Adviser had maintained sufficient resources and profit levels to support the services it provides to the Funds.
|
No single factor was determinative of the Board’s decision to approve the continuance of the Advisory Agreement for the Equity Income Fund, Small Cap Value Fund, Diversified Large Cap Value Fund and Mid Cap Value Fund, but rather the Board based its determination on the total combination of information available to them. Based on a consideration of all the factors in their totality, the Board determined that the advisory arrangements with the Adviser, including the advisory fees, were fair and reasonable. The Board therefore determined that the continuance of the Advisory Agreement for the Funds would be in the best interests of the Funds and their shareholders.
70
Huber Funds
HOUSEHOLDING (Unaudited)
In an effort to decrease costs, the Funds intend to reduce the number of duplicate prospectuses, annual and semi-annual reports, proxy statements and other similar documents you receive by sending only one copy of each to those addresses shared by two or more accounts and to shareholders the Transfer Agent reasonably believes are from the same family or household. Once implemented, if you would like to discontinue householding for your accounts, please call toll-free at 1-888-482-3726 (888-HUBERCM) to request individual copies of these documents. Once the Transfer Agent receives notice to stop householding, the Transfer Agent will begin sending individual copies thirty days after receiving your request. This policy does not apply to account statements.
71
Huber Funds
PRIVACY NOTICE
The Funds collect non-public information about you from the following sources:
• Information we receive about you on applications or other forms;
• Information you give us orally; and/or
• Information about your transactions with us or others.
We do not disclose any non-public personal information about our customers or former customers without the customer’s authorization, except as permitted by law or in response to inquiries from governmental authorities. We may share information with affiliated and unaffiliated third parties with whom we have contracts for servicing the Funds. We will provide unaffiliated third parties with only the information necessary to carry out their assigned responsibilities. We maintain physical, electronic and procedural safeguards to guard your non-public personal information and require third parties to treat your personal information with the same high degree of confidentiality.
In the event that you hold shares of the Funds through a financial intermediary, including, but not limited to, a broker-dealer, bank, or trust company, the privacy policy of your financial intermediary would govern how your non-public personal information would be shared by those entities with unaffiliated third parties.
72
(This Page Intentionally Left Blank.)
Investment Adviser
Huber Capital Management, LLC
2321 Rosecrans Ave., Suite 3245
El Segundo, California 90245
Independent Registered Public Accounting Firm
Tait, Weller & Baker LLP
1818 Market Street, Suite 2400
Philadelphia, Pennsylvania 19103
Legal Counsel
Schiff Hardin LLP
666 Fifth Avenue, Suite 1700
New York, New York 10103
Custodian
U.S. Bank N.A.
1555 North River Center Drive, Suite 302
Milwaukee, Wisconsin 53212
Transfer Agent, Fund Accountant and Fund Administrator
U.S. Bancorp Fund Services, LLC
615 East Michigan Street
Milwaukee, Wisconsin 53202
1-888-482-3726 (888-HUBERCM)
Distributor
Quasar Distributors, LLC
777 East Wisconsin Avenue, 6th Floor
Milwaukee, Wisconsin 53202
This report is intended for shareholders of the Huber Funds and may not be used as sales literature unless preceded or accompanied by a current prospectus. For a current prospectus, please call 1-888-482-3726 (888-HUBERCM). Statements and other information herein are dated and are subject to change.
Item 2. Code of Ethics.
Not applicable for semi-annual reports.
Item 3. Audit Committee Financial Expert.
Not applicable for semi-annual reports.
Item 4. Principal Accountant Fees and Services.
Not applicable for semi-annual reports.
Item 5. Audit Committee of Listed Registrants.
(a) Not applicable to registrants who are not listed issuers (as defined in Rule 10A-3 under the Securities Exchange Act of 1934).
(b) Not Applicable
Item 6. Investments.
|
(a)
|
Schedule of Investments is included as part of the report to shareholders filed under Item 1 of this Form.
|
(b) Not Applicable.
Item 7. Disclosure of Proxy Voting Policies and Procedures for Closed-End Management Investment Companies.
Not applicable to open-end investment companies.
Item 8. Portfolio Managers of Closed-End Management Investment Companies.
Not applicable to open-end investment companies.
Item 9. Purchases of Equity Securities by Closed‑End Management Investment Company and Affiliated Purchasers.
Not applicable to open-end investment companies.
Item 10. Submission of Matters to a Vote of Security Holders.
There have been no material changes to the procedures by which shareholders may recommend nominees to the Registrant’s Board of Trustees.
Item 11. Controls and Procedures.
|
(a)
|
The Registrant’s President/Chief Executive Officer/Principal Executive Officer and Treasurer/Principal Financial Officer have reviewed the Registrant's disclosure controls and procedures (as defined in Rule 30a-3(c) under the Investment Company Act of 1940, as amended, (the “Act”)) as of a date within 90 days of the filing of this report, as required by Rule 30a-3(b) under the Act and Rules 13a-15(b) or 15d‑15(b) under the Securities Exchange Act of 1934. Based on their review, such officers have concluded that the disclosure controls and procedures are effective in ensuring that information required to be disclosed in this report is appropriately recorded, processed, summarized and reported and made known to them by others within the Registrant and by the Registrant’s service provider.
|
|
(b)
|
There were no changes in the Registrant's internal control over financial reporting (as defined in Rule 30a-3(d) under the Act) that occurred during the second fiscal quarter of the period covered by this report that has materially affected, or is reasonably likely to materially affect, the Registrant's internal control over financial reporting.
|
Item 12. Disclosure of Securities Lending Activities for Closed-End Management Investment Companies.
Not applicable to open-end investment companies.
Item 13. Exhibits.
|
(a)
|
(1) Any code of ethics or amendment thereto, that is subject of the disclosure required by Item 2, to the extent that the registrant intends to satisfy Item 2 requirements through filing an exhibit. Not applicable.
|
(2) A separate certification for each principal executive officer and principal financial officer pursuant to Section 302 of the Sarbanes-Oxley Act of 2002. Filed herewith.
(3) Any written solicitation to purchase securities under Rule 23c‑1 under the Act sent or given during the period covered by the report by or on behalf of the registrant to 10 or more persons. Not applicable to open-end investment companies.
(4) Change in the registrant’s independent public accountant. There was no change in the registrant’s independent public accountant for the period covered by this report.
|
(b)
|
Certification pursuant to Section 906 of the Sarbanes‑Oxley Act of 2002. Furnished herewith.
|
SIGNATURES
Pursuant to the requirements of the Securities Exchange Act of 1934 and the Investment Company Act of 1940, the registrant has duly caused this report to be signed on its behalf by the undersigned, thereunto duly authorized.
(Registrant) Advisors Series Trust
By (Signature and Title)* /s/ Douglas G. Hess
Douglas G. Hess, President/Chief Executive Officer/
Principal Executive Officer
Date 7/3/18
Pursuant to the requirements of the Securities Exchange Act of 1934 and the Investment Company Act of 1940, this report has been signed below by the following persons on behalf of the registrant and in the capacities and on the dates indicated.
By (Signature and Title)* /s/ Douglas G. Hess
Douglas G. Hess, President/Chief Executive Officer/Principal Executive Officer
Date 7/3/18
By (Signature and Title)* /s/ Cheryl L. King
Cheryl L. King, Treasurer/Principal Financial Officer
Date 7/3/18
* Print the name and title of each signing officer under his or her signature.
CERTIFICATIONS
I, Douglas G. Hess, certify that:
|
1.
|
I have reviewed this report on Form N-CSR of Advisors Series Trust;
|
|
2.
|
Based on my knowledge, this report does not contain any untrue statement of a material fact or omit to state a material fact necessary to make the statements made, in light of the circumstances under which such statements were made, not misleading with respect to the period covered by this report;
|
|
3.
|
Based on my knowledge, the financial statements, and other financial information included in this report, fairly present in all material respects the financial condition, results of operations, changes in net assets, and cash flows (if the financial statements are required to include a statement of cash flows) of the registrant as of, and for, the periods presented in this report;
|
|
4.
|
The registrant’s other certifying officer(s) and I are responsible for establishing and maintaining disclosure controls and procedures (as defined in Rule 30a-3(c) under the Investment Company Act of 1940) and internal control over financial reporting (as defined in Rule 30a-3(d) under the Investment Company Act of 1940) for the registrant and have:
|
|
(a)
|
Designed such disclosure controls and procedures, or caused such disclosure controls and procedures to be designed under our supervision, to ensure that material information relating to the registrant, including its consolidated subsidiaries, is made known to us by others within those entities, particularly during the period in which this report is being prepared;
|
|
(b)
|
Designed such internal control over financial reporting, or caused such internal control over financial reporting to be designed under our supervision, to provide reasonable assurance regarding the reliability of financial reporting and the preparation of financial statements for external purposes in accordance with generally accepted accounting principles;
|
|
(c)
|
Evaluated the effectiveness of the registrant's disclosure controls and procedures and presented in this report our conclusions about the effectiveness of the disclosure controls and procedures, as of a date within 90 days prior to the filing date of this report based on such evaluation; and
|
|
(d)
|
Disclosed in this report any change in the registrant’s internal control over financial reporting that occurred during the second fiscal quarter of the period covered by this report that has materially affected, or is reasonably likely to materially affect, the registrant’s internal control over financial reporting; and
|
|
5.
|
The registrant’s other certifying officer(s) and I have disclosed to the registrant’s auditors and the audit committee of the registrant’s board of directors (or persons performing the equivalent functions):
|
|
(a)
|
All significant deficiencies and material weaknesses in the design or operation of internal control over financial reporting which are reasonably likely to adversely affect the registrant’s ability to record, process, summarize, and report financial information; and
|
|
(b)
|
Any fraud, whether or not material, that involves management or other employees who have a significant role in the registrant’s internal control over financial reporting.
|
|
Date: 7/3/18
|
/s/ Douglas G. Hess
Douglas G. Hess President/Chief Executive Officer/Principal Executive Officer |
CERTIFICATIONS
I, Cheryl L. King, certify that:
|
1.
|
I have reviewed this report on Form N-CSR of Advisors Series Trust;
|
|
2.
|
Based on my knowledge, this report does not contain any untrue statement of a material fact or omit to state a material fact necessary to make the statements made, in light of the circumstances under which such statements were made, not misleading with respect to the period covered by this report;
|
|
3.
|
Based on my knowledge, the financial statements, and other financial information included in this report, fairly present in all material respects the financial condition, results of operations, changes in net assets, and cash flows (if the financial statements are required to include a statement of cash flows) of the registrant as of, and for, the periods presented in this report;
|
|
4.
|
The registrant’s other certifying officer(s) and I are responsible for establishing and maintaining disclosure controls and procedures (as defined in Rule 30a-3(c) under the Investment Company Act of 1940) and internal control over financial reporting (as defined in Rule 30a-3(d) under the Investment Company Act of 1940) for the registrant and have:
|
|
(a)
|
Designed such disclosure controls and procedures, or caused such disclosure controls and procedures to be designed under our supervision, to ensure that material information relating to the registrant, including its consolidated subsidiaries, is made known to us by others within those entities, particularly during the period in which this report is being prepared;
|
|
(b)
|
Designed such internal control over financial reporting, or caused such internal control over financial reporting to be designed under our supervision, to provide reasonable assurance regarding the reliability of financial reporting and the preparation of financial statements for external purposes in accordance with generally accepted accounting principles;
|
|
(c)
|
Evaluated the effectiveness of the registrant’s disclosure controls and procedures and presented in this report our conclusions about the effectiveness of the disclosure controls and procedures, as of a date within 90 days prior to the filing date of this report based on such evaluation; and
|
|
(d)
|
Disclosed in this report any change in the registrant’s internal control over financial reporting that occurred during the second fiscal quarter of the period covered by this report that has materially affected, or is reasonably likely to materially affect, the registrant’s internal control over financial reporting; and
|
|
5.
|
The registrant’s other certifying officer(s) and I have disclosed to the registrant’s auditors and the audit committee of the registrant’s board of directors (or persons performing the equivalent functions):
|
|
(a)
|
All significant deficiencies and material weaknesses in the design or operation of internal control over financial reporting which are reasonably likely to adversely affect the registrant’s ability to record, process, summarize, and report financial information; and
|
|
(b)
|
Any fraud, whether or not material, that involves management or other employees who have a significant role in the registrant’s internal control over financial reporting.
|
|
Date: 7/3/18
|
/s/ Cheryl L. King
Cheryl L. King Treasurer/Principal Financial Officer
|
Certification Pursuant to Section 906 of the Sarbanes-Oxley Act
Pursuant to Section 906 of the Sarbanes-Oxley Act of 2002, each of the undersigned officers of the Advisors Series Trust, does hereby certify, to such officer’s knowledge, that the report on Form N-CSR of the Advisors Series Trust for the semi-annual period ended April 30, 2018 fully complies with the requirements of Section 13(a) or 15(d) of the Securities Exchange Act of 1934, as applicable, and that the information contained in the Form N-CSR fairly presents, in all material respects, the financial condition and results of operations of the Advisors Series Trust for the stated period.
|
/s/ Douglas G. Hess
Douglas G. Hess
President/Chief Executive Officer/Principal Executive Officer, Advisors Series Trust
|
/s/ Cheryl L. King
Cheryl L. King
Treasurer/Principal Financial Officer, Advisors Series Trust
|
|
Dated: 7/3/18
|
Dated: 7/3/18
|
This statement accompanies this report on Form N-CSR pursuant to Section 906 of the Sarbanes-Oxley Act of 2002 and shall not be deemed as filed by Advisors Series Trust for purposes of Section 18 of the Securities Exchange Act of 1934.
Serious News for Serious Traders! Try StreetInsider.com Premium Free!
You May Also Be Interested In
- Gorman-Rupp Reports First Quarter 2024 Financial Results
- WEX Inc. Reports First Quarter 2024 Financial Results
- First Citizens BancShares Declares Dividends
Create E-mail Alert Related Categories
SEC FilingsSign up for StreetInsider Free!
Receive full access to all new and archived articles, unlimited portfolio tracking, e-mail alerts, custom newswires and RSS feeds - and more!
