

Form N-CSR UNIFIED SERIES TRUST For: Mar 31
 Tweet
Tweet Share
Shareunited
states
securities and exchange commission
washington, d.c. 20549
form n-csr
certified shareholder report of registered management
investment companies
| Investment Company Act file number | 811-21237 |
| Unified Series Trust |
| (Exact name of registrant as specified in charter) |
225 Pictoria Drive, Suite 450
Cincinnati, OH 45246
(Address of principal executive offices)
(Zip code)
Zachary P. Richmond
Ultimus Asset Services, LLC
225 Pictoria Drive. Suite 450
Cincinnati, OH 45246
(Name and address of agent for service)
| Registrant's telephone number, including area code: | 513-587-3400 |
| Date of fiscal year end: | 03/31 | |
| Date of reporting period: | 03/31/19 |
Form N-CSR is to be used by management investment companies to file reports with the Commission not later than 10 days after the transmission to stockholders of any report that is required to be transmitted to stockholders under Rule 30e-1 under the Investment Company Act of 1940 (17 CFR 270.30e-1). The Commission may use the information provided on Form N-CSR in its regulatory, disclosure review, inspection and policymaking roles.
A registrant is required to disclose the information specified by Form N-CSR, and the Commission will make this information public. A registrant is not required to respond to the collection of information contained in Form N-CSR unless the Form displays a currently valid Office of Management and Budget ("OMB") control number. Please direct comments concerning the accuracy of the information collection burden estimate and any suggestions for reducing the burden to Secretary, Securities and Exchange Commission, 450 Fifth Street, NW, Washington, DC 20549-0609. The OMB has reviewed this collection of information under the clearance requirements of 44 U.S.C. § 3507.
Item 1. Reports to Stockholders.

DEAN FUNDS
Dean Small Cap Value Fund
Dean Mid Cap Value Fund
Annual Report
March 31, 2019
Beginning on January 1, 2021, as permitted by regulations adopted by the Securities and Exchange Commission, paper copies of the Fund’s shareholder reports like this one will no longer be sent by mail, unless you specifically request paper copies of the reports from the Fund or from your financial intermediary such as a broker-dealer or bank. Instead, the reports will be made available on a website, and you will be notified by mail each time a report is posted and provided with a website link to access the report.
If you already elected to receive shareholder reports electronically, you will not be affected by this change and you need not take any action. You may elect to receive shareholder reports and other communications from the Fund electronically by contacting the Fund at (888) 899-8343 or, if you own these shares through a financial intermediary, you may contact your financial intermediary.
You may elect to receive all future reports in paper free of charge. You can inform the Fund that you wish to continue receiving paper copies of your shareholder reports by contacting the Fund at (888) 899-8343. If you own shares through a financial intermediary, you may contact your financial intermediary or follow instructions included with this document to elect to continue to receive paper copies of your shareholder reports. Your election to receive reports in paper will apply to all funds held with the fund complex or at your financial intermediary.
DEAN SMALL CAP VALUE FUND
MANAGEMENT’S DISCUSSION OF FUND PERFORMANCE
(Unaudited)
The Dean Small Cap Value Fund returned -0.08% net of fees for the twelve months ended March 31, 2019, compared with a 0.17% return for the benchmark Russell 2000 Value Index and a 2.05% return for the broader Russell 2000 Index.
Macro Factors Impacting Performance
For the second fiscal year in a row, growth stocks outperformed value stocks. This was a headwind for the portfolio as it is currently positioned with a greater bias toward value stocks relative to the benchmark. The portfolio underperformed its benchmark, the Russell 2000 Value Index, for the fiscal year due to this value bias and the stronger performance of high price momentum ( stocks with high valuations and high volatility) during the first half of the fiscal year.
In contrast, during the second half of the fiscal year the portfolio benefited from high price momentum stocks underperforming low price momentum stocks. All of the underperformance of momentum stocks originated from these last two quarters of the fiscal year when stock market volatility increased dramatically. Since we are price disciplined value investors, the small cap portfolio typically performs better when stocks with high price momentum begin to struggle, and this often coincides with periods of heightened stock market volatility. As this type of dynamic occurred during the last two quarters of the fiscal year, the portfolio outperformed its benchmark during this period.
Sector Performance (best/worst relative to benchmark)
The best performing sector relative to the benchmark for the twelve-month period was Materials. The outperformance versus the benchmark was due to strong stock selection. Most of the portfolio’s stocks in the Materials sector have more defensive end markets, where a slowing economy would not impact earnings as much as many of the benchmark’s more economically sensitive Materials stocks. For example, the portfolio has a heavy weighting in the Containers & Packaging industry, where the end markets are mostly Consumer Staples companies, and this gives the packaging stocks in the portfolio more of a Consumer Staples type of profile. This predictability of the portfolio’s companies’ end markets helped the portfolio’s Materials stocks hold up better than the benchmark’s Materials stocks as the stock market selloff took hold in the fiscal third quarter.
1
DEAN SMALL CAP VALUE FUND
MANAGEMENT’S DISCUSSION OF FUND PERFORMANCE
(Unaudited) – (continued)
The second best performing sector relative to the benchmark was Consumer Staples. The outperformance versus the benchmark was a result of the portfolio’s overweight stance as well as better than benchmark stock selection. Consumer Staples stocks were poor performers in the Fund’s fiscal second quarter. We took advantage of the relative weakness and added three new Consumer Staples holdings in that quarter. The opportunistic purchases we made benefited the portfolio in both the fiscal third and fiscal fourth quarters, as Consumer Staples held up better than the overall market. Nearly all of the portfolio’s weight in the sector was housed in the Food Products industry, which was the best performing industry within the Consumer Staples sector for the fiscal year.
The worst performing sector relative to the benchmark for the last twelve months was Consumer Discretionary. The underperformance versus the benchmark stemmed from both being underweight as well as from below benchmark stock selection. The portfolio was overweight the Auto Components and Automobiles industries at a time when stocks related to the auto cycle were some of the hardest hit stocks in the market, as global growth concerns intensified throughout the year. While valuations are extremely low in the auto space, investors are currently more focused on the potential for negative estimate revisions rather than low valuations. We tried to take advantage of the wholesale selloff in just about anything auto related by swapping out of existing portfolio positions into new holdings that we believe are higher quality companies, while continuing to maintain exposure to the attractively valued auto related space.
The second worst performing sector relative to the benchmark was Information Technology. The underperformance relative to the benchmark stemmed predominantly from worse than benchmark stock selection. Portfolio companies in the Electronic Equipment, Instruments, and Components industry missed earnings estimates during the year, leading to sharp stock price declines. While at the same time, the portfolio companies in the IT Services industry that are slow, but steady growers did not keep pace with the benchmark’s IT Services holdings this year. The combination of these two situations led to the below benchmark stock selection.
Individual Securities Performance (best/worst absolute contributors)
The largest contributing company in the fiscal year was NorthWestern Corp. (NWE). NWE provides electricity and natural gas services in the Upper Midwest and Northwest of the U.S. It serves customers in the states of Montana, South Dakota, and Nebraska. Utilities were the best performing sector in the fiscal year, and NWE benefited from the rising tide. Being somewhat more defensive in nature, NWE
2
DEAN SMALL CAP VALUE FUND
MANAGEMENT’S DISCUSSION OF FUND PERFORMANCE
(Unaudited) – (continued)
outperformed the benchmark Utilities stocks when stock market volatility increased in the last two fiscal quarters. The portfolio continues to hold a sizeable position in NWE.
The second largest contributing stock was Americold Realty Trust (COLD). COLD is a Real Estate Investment Trust (REIT) that is the world’s largest refrigerated warehousing and cold storage logistics provider, where it has an approximately 20% U.S. market share and an approximately 5% global market share. The industry fundamentals for cold storage are currently favorable, as demand is robust, while supply remains restrained. This backdrop helped COLD to report better than expected earnings as a result of better than expected pricing and margins. After a strong upward move in price, we exited the portfolio’s COLD position as a result of it reaching our estimate of private market value.
The largest detracting stock in the period was Deluxe Corp. (DLX). DLX is the largest check printer in the U.S. As written check volume is in secular decline, DLX has been attempting to use the strong cash flows from its checks business to transition itself into a provider of customer life-cycle management solutions to small businesses and financial institutions. Consequently, in addition to offering check and financial form printing services, it also offers logo and web design, hosting and web services, search engine optimization, marketing programs, and digital and physical printing services, amongst other products and services. In a period when small business optimism neared all-time highs and the economy was growing robustly, DLX continued to struggle to reach our estimate of normalized earnings power. It might be entering businesses where much more focused competition exits, and DLX is lacking any real competitive advantage in our opinion. We were increasingly losing confidence in our estimate of normalized earnings power for DLX, and as such, we exited the portfolio’s DLX position while harvesting a tax loss.
The second largest detracting stock was Tenneco, Inc. (TEN). TEN designs and manufactures emission control and ride control products and systems for the automotive original equipment market and aftermarket. Its products include shocks and struts, shock absorbers, mufflers, performance exhaust products, as well as noise, vibration, and harshness control components. TEN disappointed the market, as it reported slightly lower than expected earnings on lower than expected margins due to higher input costs. It also added a dose of uncertainty around its stock price by announcing the large acquisition of Federal-Mogul’s Motorparts and Powertrain businesses from Carl Icahn for $5.4 billion. TEN intends to combine Federal-Mogul’s Motorparts business with TEN’s Ride Performance business and Federal-Mogul’s
3
DEAN SMALL CAP VALUE FUND
MANAGEMENT’S DISCUSSION OF FUND PERFORMANCE
(Unaudited) – (continued)
Powertrain business with TEN’s Clean Air business, creating two independent publicly traded companies. We felt that the debt from this transaction combined with the execution risk, all during a worldwide auto sales slowdown, widened the range of outcomes for TEN beyond our comfort level. Thus, we exited the portfolio’s TEN position while harvesting a tax loss.
Current Positioning and Opportunities
The portfolio’s largest overweight sectors relative to the benchmark are currently in the Consumer Staples and Materials sectors. The largest underweight sectors relative to the benchmark are currently in the Real Estate and Information Technology sectors. Throughout the most recent quarter, we added the most weight to the Consumer Discretionary and Health Care sectors, while reducing the most weight in the Industrials and Information Technology sectors. As always, these relative weights are a residual of our bottom up opportunities and not based on a top down macro call on the market or economy.
We remain focused on the fundamentals of the companies we own and the price we are paying for those fundamentals. We are confident that a steadfast application of our proven and disciplined process should produce favorable results over time.
Thank you for your continued confidence in Dean.
4
DEAN SMALL CAP VALUE FUND
Performance Summary (Unaudited)
Average Annual Total Returns* (for the periods ended March 31, 2019) |
|||||
1 Year |
5 Year |
10 Year |
|||
Dean Small Cap Value Fund |
(0.08)% |
5.54% |
15.87% |
||
Russell 2000 Value Index** |
0.17% |
5.59% |
14.12% |
||
Russell 2000 Index** |
2.05% |
7.05% |
15.36% |
||
Total annual operating expenses, as disclosed in the Dean Small Cap Value Fund (the “Fund”) prospectus dated July 29, 2018, were 1.18% of the Fund’s average daily net assets. Additional information pertaining to the expense ratios as of March 31, 2019 can be found in the financial highlights. |
The performance quoted represents past performance, which does not guarantee future results. The investment return and principal value of an investment will fluctuate so that an investor’s shares, when redeemed, may be worth more or less than their original cost. The returns shown do not reflect deduction of taxes that a shareholder would pay on Fund distributions or the redemption of Fund shares. Current performance may be lower or higher than the performance quoted. The Fund’s investment objectives, risks, charges and expenses must be considered carefully before investing. Performance data current to the most recent month end may be obtained by calling 1-888-899-8343.
|
* |
Return figures reflect any change in price per share and assume the reinvestment of all distributions. |
|
** |
The Russell 2000 and Russell 2000 Value Indices are unmanaged indices that assume reinvestment of all distributions and exclude the effect of taxes and fees. The indices are widely recognized unmanaged indices of equity prices and are representative of a broader market and range of securities than are found in the Fund’s portfolio. An individual cannot invest directly in an index or, the indicies. However, an individual may be able to invest in exchange traded funds or other investment vehicles that attempt to track the performance of an index. |
You should consider the Fund’s investment objectives, risks, charges and expenses carefully before you invest. The Fund’s prospectus contains important information about the Fund’s investment objectives, potential risks, management fees, charges and expenses, and other information and should be read carefully before investing. You may obtain a current copy of the Fund’s prospectus or performance data current to the most recent month by calling 1-888-899-8343.
The Fund is distributed by Unified Financial Securities, LLC, member FINRA/SIPC.
5
DEAN SMALL CAP VALUE FUND
Performance Summary (Unaudited) – (continued)

This graph shows the value of a hypothetical initial investment of $10,000 in the Fund, the Russell 2000 Index and the Russell 2000 Value Index on March 31, 2009 and held through March 31, 2019.
The Russell 2000 Index and the Russell 2000 Value Index are widely recognized unmanaged indices of common stock prices and are representative of a broader market and range of securities than are found in the Fund’s portfolio. Individuals cannot invest directly in the indices; however, an individual may invest in exchange traded funds or other investment vehicles that attempt to track the performance of an index. Index returns do not include expenses, which have been deducted from the Fund’s return. These performance figures include the change in value of the stocks in the indices plus the reinvestment of dividends and are not annualized. The returns shown do not reflect deduction of taxes that a shareholder would pay on Fund distributions or the redemption of Fund shares. THE FUND’S RETURN REPRESENTS PAST PERFORMANCE AND DOES NOT GUARANTEE OR PREDICT FUTURE RESULTS. Investment returns and principal values will fluctuate so that an investor’s shares, when redeemed, may be worth more or less than their original cost. Current performance may be lower or higher than the performance data
6
DEAN SMALL CAP VALUE FUND
Performance Summary (Unaudited) – (continued)
quoted. For more information on the Dean Small Cap Value Fund, and to obtain performance data current to the most recent month-end, or to request a prospectus, please call 1-888-899-8343.
You should consider the Fund’s investment objectives, risks, charges and expenses carefully before you invest. The Fund’s prospectus contains important information about the Fund’s investment objectives, potential risks, management fees, charges and expenses, and other information and should be read carefully before investing. You may obtain a current copy of the Fund’s prospectus or performance data current to the most recent month by calling 1-888-899-8343.
The Fund is distributed by Unified Financial Securities, LLC, member FINRA/SIPC.
7
DEAN MID CAP VALUE FUND
MANAGEMENT’S DISCUSSION OF FUND PERFORMANCE
(Unaudited)
The Dean Mid Cap Value Fund returned 3.10% net of fees for the twelve months ended March 31, 2019, compared with a 2.89% return for the benchmark Russell Midcap Value Index and a 6.47% return for the broader Russell Midcap Index.
Macro Factors Impacting Performance
Macro factors netted to a neutral impact for the fiscal year. On the positive side, quality factors such as lower earnings variability, higher profits and lower debt leverage outperformed relative to the benchmark. Stocks with quality attributes are core to our process. Offsetting the positive contribution from quality factors, the portfolio’s underweight to dividend yield and to stocks with high trading turnover generated a negative contribution.
Sector Performance (best/worst relative to benchmark)
The best performing sector relative to the benchmark for the year was Industrials. The outperformance versus the benchmark was due to strong stock selection. The portfolio’s holdings were positively impacted by being exposed to more favorable end markets and less impact from global sales, which were impacted by global trade concerns and slow international economies. For instance, Comfort Systems USA (FIX) sales are based in the United States and focused on systems for commercial office buildings, where demand remains favorable. With a strong backlog and lack of exposure to global trade concerns, the stock outperformed for the period held. Another example is Republic Services (RSG). The company provides non-hazardous solid waste collection and disposal services in the United States. The company’s earnings are generated in the United States and, due to the nature of its business, have a narrower range of outcomes, providing an attractive risk profile in times of uncertainty. Kansas City Southern (KSU) was another key driver of performance. The company is a railroad with a large portion of revenue generated on routes between Mexico and the United States. In the Fund’s fiscal second quarter, the stock benefited from a trade resolution between the United States, Canada and Mexico to replace NAFTA. As carload volumes continue to improve, the company has embarked on a cost cutting initiative to improve operating profit margins, which are below peers’.
Utilities was the portfolio’s second-best performing sector relative to the benchmark. Positive stock selection drove the outperformance for the year. All five of the portfolio’s regulated utility holdings outperformed the benchmark sector returns for the year. The portfolio also benefited from not owning PG&E (PCG), which is a sizeable weight in the benchmark. PCG was down over 50% as California wildfire
8
DEAN MID CAP VALUE FUND
MANAGEMENT’S DISCUSSION OF FUND PERFORMANCE
(Unaudited) – (continued)
liabilities may push the company into financial distress. Due to the sectors’ defensive characteristics and moderating interest rates late in the year, Utilities significantly outperformed the Russell Midcap Value Index. The portfolio’s modest underweight was a slight offset to performance for the period.
The worst performing sector relative to the benchmark for the last twelve months was REITs. The underperformance versus the benchmark was driven by the sector allocation. REITs are the portfolio’s largest underweight sector and REITs were the top performing sector for the year, up over 18%. Because of their higher than average dividend yield, REITs often trade similar to a bond, with stock prices rising as interest rates decline and vice versa. The dividend income characteristic also makes the sector attractive in periods of uncertainty. The large market declines in the fiscal third quarter and the Federal Reserve reducing the likelihood of interest rate increases in 2019 fueled significant outperformance of the sector.
Energy was the second-worst performing sector relative to the benchmark. The underperformance relative to the benchmark was a result of stock selection. The majority of the portfolio’s holdings are exploration and production companies operating in the Permian Basin in West Texas. While the basin’s economics are superior, the area has been plagued with infrastructure and asset issues over the past 12-24 months. While the Permian is one of the lowest cost, fastest growing basins in the continental U.S., the area is a victim of its own success. Due to a limited amount of take-away pipeline capacity for its gas & oil, price differentials relative to spot prices widened dramatically to cover more expensive transportation options. The companies realized prices were 20-25% below the spot price, an issue specific to this region. Most recently, concern has risen that drilling wells close together is damaging existing wells and reducing economic returns. Thus, the stocks have been re-rated lower as the prospective drilling potential is lower than originally believed. Portfolio holdings Concho Resources (CXO), Diamondback Energy (FANG) and Centennial Resource Development (CDEV) operate in the Permian Basin.
Individual Securities Performance (best/worst absolute contributors)
Keysight Technologies (KEYS) was the best contributing stock for the year. Keysight is an electronic measurement company, focusing on wireless, modular, and software solutions. The company delivers solutions in wireless communications, aerospace and defense and semiconductor markets. Keysight derives just over 60% of its revenue internationally, with the remaining portion from the Americas. The company beat and raised guidance several times throughout the year on continued strong order growth
9
DEAN MID CAP VALUE FUND
MANAGEMENT’S DISCUSSION OF FUND PERFORMANCE
(Unaudited) – (continued)
in automotive, energy and electrical end markets. Key drivers of future growth are 5G Broadband, connected cars and aerospace and defense spending. We sold shares on price strength but continue to hold a position in the stock.
Synopsys (SNPS) was the second largest contributing stock. Synopsys is a leading provider of electronic design automation (EDA) tools and services. These service and tools aid technology companies in designing, testing and manufacturing applications that speed the time to market and reduce costs. Synopsys continues to see strong end market demand, with electronics growth continuing to accelerate new semiconductor technologies being brought to market, such as artificial intelligence, auto integration and 5G. The company generates 80% of its revenue on annual technology license subscriptions, creating a relatively smooth and predictable revenue stream. The company continues to deliver consistent performance and growth on the back of the strength in the Semiconductor industry. We continue to hold our position in Synopsis.
The largest detractor to absolute performance was Conagra Brands (CAG). Conagra is a packaged foods manufacturer with its largest focus on frozen foods and snacks, with additional products in the refrigerated and center of the store categories. While the company has a large stable of brand names, some of the more popular brands include Birds Eye, Duncan Hines, Healthy Choice, Marie Callender’s and Slim Jim. Over the past 3 years, Conagra has gone through a significant portfolio transition, selling its private-label business to TreeHouse Foods, divesting its commercial business and spinning off Lamb Weston, its frozen potato food service unit. In October, Conagra closed on a transformational acquisition, buying Pinnacle Foods, another packaged food company with significant exposure to frozen foods. The strategy was to expand the product portfolio and extract significant cost savings with branded products that help offset industry pricing pressures. When the company reported earnings in December, they disclosed previously unknown issues within the Pinnacle brands business, including distribution losses in Birds Eye and accelerating losses in Duncan Hines and Wish Bone brands. The issues forced the company to lower expectations and the timeframe for synergies. We exited the stock and will revisit the thesis and company fundamentals in the future as there is additional clarity on the issues at hand.
Conduent (CNDT) was the second worst contributing stock. Conduent is a business process service company specializing in transaction intensive processing, analytics and automation. In the fiscal fourth quarter, the company lowered guidance based on several factors, including an increase in a Texas litigation reserve, slippage of deals into future quarters (increasing sales cycle) and a significant decline in new business bookings of approximately 20%. An attractive aspect of the company had been its
10
DEAN MID CAP VALUE FUND
MANAGEMENT’S DISCUSSION OF FUND PERFORMANCE
(Unaudited) – (continued)
historical 99% renewal rate with existing customers. In the fiscal fourth quarter, the renewal rate dropped to 91%, calling into question the company’s competitive position. Due to the increased uncertainty relative to our normal earnings power, the stock was exited.
Current Positioning and Opportunities
The portfolio’s largest overweight sectors relative to the benchmark are in the Industrials and Consumer Staples sectors. The largest underweight sectors relative to the benchmark are in the Real Estate and Utility sectors.
Currently, stocks with consistent earnings growth and/or defensive characteristics continue to be favored by the market. With the economy presumably in the late stages of a bull market and showing signs of slowing, stocks with a wider range of outcomes, either from cyclicality of their end markets or execution issues with their strategies, have underperformed. Using our valuations based on normal earnings power, many stocks with a wider range of outcomes appear a more favorable risk/reward. However, we do acknowledge, regardless of valuation, that cyclical areas of the market will likely underperform if the economy falls into a recession. Therefore, we are focusing on the highest quality companies in these markets and attempting to manage our risk through each individual stock’s percentage of the portfolio. If the central bank were to change the stance on interest rates from their current rate pause to monetary easing, this would be beneficial to many of the holdings recently added.
11
DEAN MID CAP VALUE FUND
Performance Summary (Unaudited)
Average Annual Total Returns* (for the periods ended March 31, 2019) |
|||||
1 Year |
5 Year |
10 Year |
|||
Dean Mid Cap Value Fund |
3.10% |
7.50% |
13.25% |
||
Russell Midcap Value Index** |
2.89% |
7.22% |
16.39% |
||
Russell Midcap Index** |
6.47% |
8.81% |
16.88% |
||
Effective March 31, 2011, the Fund changed its investment strategies from Large Cap Value to Mid Cap Value and also changed its benchmarks from the Russell 1000 Value Index to the Russell Midcap Value and Russell Midcap Indices. Performance prior to March 31, 2011 reflects the Fund’s Large Cap Value investment strategies and, as a result, the Fund’s 10-year return may vary substantially from those of the Midcap indices.
Total annual operating expenses, as disclosed in the Dean Mid Cap Value Fund (the “Fund”) prospectus dated July 29, 2018, were 1.53% of the Fund’s average daily net assets (1.10% after fee waivers/expense reimbursements by Dean Investment Associates, LLC (the “Adviser”)). The Adviser contractually has agreed to waive its management fee and/or reimburse expenses so that total annual Fund operating expenses (excluding portfolio transaction and other investment-related costs (including brokerage fees and commissions); taxes; borrowing costs (such as interest and dividend expenses on securities sold short); acquired fund fees and expenses; fees and expenses associated with investments in other collective investment vehicles or derivative instruments (including, for example, option and swap fees and expenses); any amounts payable pursuant to a distribution or service plan adopted in accordance with Rule 12b-1 under the Investment Company Act of 1940; expenses incurred in connection with any merger or reorganization; extraordinary expenses (such as litigation expenses, indemnification of Trust officers and Trustees and contractual indemnification of Fund service providers) do not exceed 1.10% of the Fund’s average daily net assets through July 31, 2019. Each waiver/expense payment by the Adviser is subject to recoupment by the Adviser from the Fund in the three years following the date the particular waiver/expense payment occurred, but only if such recoupment can be achieved without exceeding the annual expense limitation in effect at the time of the waiver/expense payment and any expense limitation in effect at the time of recoupment. This expense limitation agreement may not be terminated prior to July 31, 2019, except by the Board of Trustees. Additional information pertaining to the expense ratios as of March 31, 2019 can be found in the financial highlights. |
The performance quoted represents past performance, which does not guarantee future results. The investment return and principal value of an investment will fluctuate so that an investor’s shares, when redeemed, may be worth more or less than their original cost. The returns shown do not reflect deduction of taxes that a shareholder would pay on the Fund’s distributions or the redemption of Fund shares. Current performance of the Fund may be lower or higher than the performance quoted. The Fund’s investment objectives, risks, charges and expenses must be considered carefully before investing. Performance data current to the most recent month end may be obtained by calling 1-888-899-8343.
12
DEAN MID CAP VALUE FUND
Performance Summary (Unaudited) – (continued)
|
* |
Return figures reflect any change in price per share and assume the reinvestment of all distributions. Average annual total returns set forth above include all waivers of fees for various periods since inception. Without such fee waivers, the total returns would have been lower. |
|
** |
The Russell Midcap and Russell Midcap Value Indices are unmanaged indices that assume reinvestment of all distributions and exclude the effect of taxes and fees. The indices are widely recognized unmanaged indices of equity prices and are representative of a broader market and range of securities than are found in the Fund’s portfolio. An individual cannot invest directly in an index. However, an individual may be able to invest in exchange traded funds or other investment vehicles that attempt to track the performance of an index. |
You should consider the Fund’s investment objectives, risks, charges and expenses carefully before you invest. The Fund’s prospectus contains important information about the Fund’s investment objectives, potential risks, management fees, charges and expenses, and other information and should be read carefully before investing. You may obtain a current copy of the Fund’s prospectus or performance data current to the most recent month by calling 1-888-899-8343.
The Fund is distributed by Unified Financial Securities, LLC, member FINRA/SIPC.
13
DEAN MID CAP VALUE FUND
Performance Summary (Unaudited) – (continued)

This graph shows the value of a hypothetical initial investment of $10,000 in the Fund, the Russell Midcap Index and the Russell Midcap Value Index on March 31, 2009 and held through March 31, 2019.
The Russell Midcap Index and the Russell Midcap Value Index are widely recognized unmanaged indices of common stock prices and are representative of a broader market and range of securities than are found in the Fund’s portfolio. Individuals cannot invest directly in the indices; however, an individual may invest in exchange traded funds or other investment vehicles that attempt to track the performance of an index. Index returns do not include expenses, which have been deducted from the Fund’s return. These performance figures include the change in value of the stocks in the indices plus the reinvestment of dividends and are not annualized. The returns shown do not reflect deduction of taxes that a shareholder would pay on Fund distributions or the redemption of Fund shares. THE FUND’S RETURN REPRESENTS PAST PERFORMANCE AND DOES NOT GUARANTEE OR PREDICT FUTURE RESULTS. Investment returns and principal values will fluctuate so that an investor’s shares, when redeemed, may be worth more or less than their original cost. Current performance may be lower or higher than the performance data
14
DEAN MID CAP VALUE FUND
Performance Summary (Unaudited) – (continued)
quoted. For more information on the Dean Mid Cap Value Fund, and to obtain performance data current to the most recent month-end, or to request a prospectus, please call 1-888-899-8343.
You should consider the Fund’s investment objectives, risks, charges and expenses carefully before you invest. The Fund’s prospectus contains important information about the Fund’s investment objectives, potential risks, management fees, charges and expenses, and other information and should be read carefully before investing. You may obtain a current copy of the Fund’s prospectus or performance data current to the most recent month by calling 1-888-899-8343.
The Fund is distributed by Unified Financial Securities, LLC, member FINRA/SIPC.
15
DEAN SMALL CAP VALUE FUND HOLDINGS (Unaudited)

|
1 |
As a percent of total net assets. |
The investment objective of the Dean Small Cap Value Fund is long-term capital appreciation and, secondarily, dividend income. Portfolio holdings are subject to change.
16
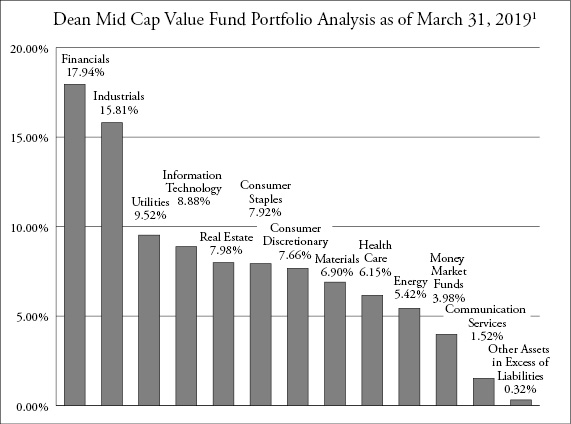
DEAN MID CAP VALUE FUND HOLDINGS (Unaudited)
|
1 |
As a percent of total net assets. |
The investment objective of the Dean Mid Cap Value Fund is long-term capital appreciation and, secondarily, dividend income. Portfolio holdings are subject to change.
Portfolio Holdings (Unaudited)
The Funds file their complete schedule of portfolio holdings with the Securities and Exchange Commission (“SEC”) for the first and third quarters of each fiscal year within sixty days after the end of the period. The Funds’ portfolio holdings are available at the SEC’s website at www.sec.gov.
17
DEAN SMALL CAP VALUE FUND
SCHEDULE OF INVESTMENTS
March 31, 2019
COMMON STOCKS — 95.80% |
Shares |
Fair Value |
||||||
Consumer Discretionary — 9.00% |
||||||||
Big Lots, Inc. |
108,323 | $ | 4,118,440 | |||||
La-Z-Boy, Inc. |
46,000 | 1,517,540 | ||||||
Penske Automotive Group, Inc. |
131,695 | 5,880,182 | ||||||
Red Robin Gourmet Burgers, Inc.(a) |
147,720 | 4,255,813 | ||||||
Thor Industries, Inc. |
94,005 | 5,863,092 | ||||||
Tupperware Brands Corporation |
187,195 | 4,788,448 | ||||||
Visteon Corporation(a) |
36,665 | 2,469,388 | ||||||
| 28,892,903 | ||||||||
Consumer Staples — 10.31% |
||||||||
Andersons, Inc. (The) |
135,775 | 4,376,028 | ||||||
Cal-Maine Foods, Inc. |
112,330 | 5,013,288 | ||||||
Darling Ingredients, Inc.(a) |
183,480 | 3,972,342 | ||||||
Fresh Del Monte Produce, Inc. |
156,325 | 4,225,465 | ||||||
Hostess Brands, Inc.(a) |
424,004 | 5,300,050 | ||||||
John B. Sanfilippo & Son, Inc. |
34,647 | 2,490,080 | ||||||
Sanderson Farms, Inc. |
31,980 | 4,216,243 | ||||||
TreeHouse Foods, Inc.(a) |
54,535 | 3,520,234 | ||||||
| 33,113,730 | ||||||||
Energy — 3.93% |
||||||||
RPC, Inc. |
580,345 | 6,621,736 | ||||||
SRC Energy, Inc.(a) |
1,174,808 | 6,015,017 | ||||||
| 12,636,753 | ||||||||
Financials — 26.94% |
||||||||
Bank of Hawaii Corporation |
70,930 | 5,594,249 | ||||||
Bryn Mawr Bank Corporation |
129,752 | 4,687,940 | ||||||
Cadence Bancorporation |
306,570 | 5,686,874 | ||||||
CenterState Banks Corporation |
126,965 | 3,023,037 | ||||||
Chemical Financial Corporation |
161,445 | 6,645,076 | ||||||
First Financial Bancorp |
306,792 | 7,381,415 | ||||||
First Merchants Corporation |
101,737 | 3,749,008 | ||||||
Granite Point Mortgage Trust, Inc. |
169,165 | 3,141,394 | ||||||
Horace Mann Educators Corporation |
64,030 | 2,254,496 | ||||||
LegacyTexas Financial Group, Inc. |
61,805 | 2,310,889 | ||||||
MFA Financial, Inc. |
1,036,420 | 7,534,773 | ||||||
Northwest Bancshares, Inc. |
384,550 | 6,525,813 | ||||||
ProAssurance Corporation |
161,150 | 5,577,402 | ||||||
Renasant Corporation |
178,142 | 6,030,107 | ||||||
UMB Financial Corporation |
101,870 | 6,523,755 | ||||||
See accompanying notes which are an integral part of these financial statements.
18
DEAN SMALL CAP VALUE FUND
SCHEDULE OF INVESTMENTS – (continued)
March 31, 2019
COMMON STOCKS — 95.80% - continued |
Shares |
Fair Value |
||||||
Financials — 26.94% - continued |
||||||||
Washington Federal, Inc. |
132,810 | $ | 3,836,881 | |||||
White Mountains Insurance Group Ltd. |
6,500 | 6,015,620 | ||||||
| 86,518,729 | ||||||||
Health Care — 3.97% |
||||||||
Magellan Health, Inc.(a) |
88,886 | 5,859,365 | ||||||
MEDNAX, Inc.(a) |
176,810 | 4,803,928 | ||||||
Select Medical Holdings Corporation(a) |
148,090 | 2,086,588 | ||||||
| 12,749,881 | ||||||||
Industrials — 16.21% |
||||||||
Argan, Inc. |
101,870 | 5,088,407 | ||||||
Astec Industries, Inc. |
110,550 | 4,174,368 | ||||||
Encore Wire Corporation |
40,445 | 2,314,263 | ||||||
EnPro Industries, Inc. |
56,460 | 3,638,847 | ||||||
Forward Air Corporation |
25,150 | 1,627,960 | ||||||
Greenbrier Companies, Inc. (The) |
159,815 | 5,150,837 | ||||||
Heartland Express, Inc. |
224,510 | 4,328,553 | ||||||
Knoll, Inc. |
287,800 | 5,442,298 | ||||||
Primoris Services Corporation |
283,941 | 5,871,900 | ||||||
Regal Beloit Corporation |
70,705 | 5,788,618 | ||||||
Valmont Industries, Inc. |
23,780 | 3,093,778 | ||||||
WESCO International, Inc.(a) |
104,615 | 5,545,641 | ||||||
| 52,065,470 | ||||||||
Information Technology — 6.10% |
||||||||
CSG Systems International, Inc. |
77,681 | 3,285,906 | ||||||
InterDigital, Inc. |
94,150 | 6,212,017 | ||||||
MTS Systems Corporation |
108,339 | 5,900,142 | ||||||
Plexus Corporation(a) |
42,665 | 2,600,432 | ||||||
Tech Data Corporation(a) |
15,580 | 1,595,548 | ||||||
| 19,594,045 | ||||||||
Materials — 9.84% |
||||||||
AdvanSix, Inc.(a) |
57,130 | 1,632,204 | ||||||
Alamos Gold, Inc., Class A |
854,169 | 4,339,179 | ||||||
Commercial Metals Company |
348,935 | 5,959,809 | ||||||
Graphic Packaging Holding Company |
380,985 | 4,811,841 | ||||||
Innospec, Inc. |
30,665 | 2,555,928 | ||||||
Silgan Holdings, Inc. |
252,335 | 7,476,686 | ||||||
Valvoline, Inc. |
259,975 | 4,825,136 | ||||||
| 31,600,783 | ||||||||
See accompanying notes which are an integral part of these financial statements.
19
DEAN SMALL CAP VALUE FUND
SCHEDULE OF INVESTMENTS – (continued)
March 31, 2019
COMMON STOCKS — 95.80% - continued |
Shares |
Fair Value |
||||||
Real Estate — 6.51% |
||||||||
Columbia Property Trust, Inc. |
260,570 | $ | 5,865,431 | |||||
Corepoint Lodging, Inc. |
293,625 | 3,279,791 | ||||||
Equity Commonwealth |
223,250 | 7,298,042 | ||||||
Sabra Health Care REIT, Inc. |
229,555 | 4,469,436 | ||||||
| 20,912,700 | ||||||||
Utilities — 2.99% |
||||||||
NorthWestern Corporation |
79,980 | 5,631,392 | ||||||
Portland General Electric Company |
76,570 | 3,969,389 | ||||||
| 9,600,781 | ||||||||
Total Common Stocks (Cost $306,736,427) |
307,685,775 | |||||||
MONEY MARKET FUNDS — 4.92% |
||||||||
Fidelity Investments Money Market Government Portfolio, Institutional Class, 2.35%(b) |
15,806,810 | 15,806,810 | ||||||
Total Money Market Funds (Cost $15,806,810) |
15,806,810 | |||||||
Total Investments — 100.72% (Cost $322,543,237) |
323,492,585 | |||||||
Liabilities in Excess of Other Assets — (0.72)% |
(2,314,761 | ) | ||||||
NET ASSETS — 100.00% |
$ | 321,177,824 | ||||||
|
(a) |
Non-income producing security. |
|
(b) |
Rate disclosed is the seven day effective yield as of March 31, 2019. |
The sectors shown on the schedule of investments are based on the Global Industry Classification Standard, or GICS® (“GICS”). The GICS was developed by and/or is the exclusive property of MSCI, Inc. and Standard & Poor’s Financial Services LLC (“S&P”). GICS is a service mark of MSCI, Inc. and S&P and has been licensed for use by Ultimus Fund Solutions, LLC.
See accompanying notes which are an integral part of these financial statements.
20
DEAN MID CAP VALUE FUND
SCHEDULE OF INVESTMENTS
March 31, 2019
COMMON STOCKS — 95.70% |
Shares |
Fair Value |
||||||
Communication Services — 1.52% |
||||||||
Interpublic Group of Companies, Inc. (The) |
30,340 | $ | 637,443 | |||||
Consumer Discretionary — 7.66% |
||||||||
Aptiv plc |
8,180 | 650,228 | ||||||
Aramark |
19,781 | 584,529 | ||||||
Cracker Barrel Old Country Store, Inc. |
3,650 | 589,876 | ||||||
Genuine Parts Company |
6,518 | 730,212 | ||||||
Gildan Activewear, Inc. |
18,184 | 654,078 | ||||||
| 3,208,923 | ||||||||
Consumer Staples — 7.92% |
||||||||
Casey's General Stores, Inc. |
4,595 | 591,698 | ||||||
Clorox Company (The) |
3,911 | 627,559 | ||||||
Ingredion, Inc. |
6,681 | 632,624 | ||||||
J.M. Smucker Company (The) |
6,909 | 804,899 | ||||||
US Foods Holding Corporation(a) |
18,901 | 659,834 | ||||||
| 3,316,614 | ||||||||
Energy — 5.42% |
||||||||
Concho Resources, Inc. |
5,638 | 625,592 | ||||||
Diamondback Energy, Inc. |
6,756 | 685,937 | ||||||
Noble Energy, Inc. |
25,973 | 642,312 | ||||||
TechnipFMC plc |
13,492 | 317,332 | ||||||
| 2,271,173 | ||||||||
Financials — 17.94% |
||||||||
Ameriprise Financial, Inc. |
4,856 | 622,053 | ||||||
Blackstone Mortgage Trust, Inc., Class A |
18,967 | 655,500 | ||||||
Brown & Brown, Inc. |
20,857 | 615,490 | ||||||
Commerce Bancshares, Inc. |
11,040 | 640,982 | ||||||
Hanover Insurance Group, Inc. (The) |
5,247 | 599,050 | ||||||
M&T Bank Corporation |
3,943 | 619,130 | ||||||
Northern Trust Corporation |
6,550 | 592,186 | ||||||
Regions Financial Corporation |
45,266 | 640,514 | ||||||
Reinsurance Group of America, Inc. |
4,302 | 610,798 | ||||||
Torchmark Corporation |
8,250 | 676,088 | ||||||
UMB Financial Corporation |
8,994 | 575,976 | ||||||
W.R. Berkley Corporation |
7,886 | 668,102 | ||||||
| 7,515,869 | ||||||||
See accompanying notes which are an integral part of these financial statements.
21
DEAN MID CAP VALUE FUND
SCHEDULE OF INVESTMENTS – (continued)
March 31, 2019
COMMON STOCKS — 95.70% - continued |
Shares |
Fair Value |
||||||
Health Care — 6.15% |
||||||||
Catalent, Inc.(a) |
9,809 | $ | 398,147 | |||||
Quest Diagnostics, Inc. |
6,746 | 606,600 | ||||||
Universal Health Services, Inc., Class B |
5,996 | 802,086 | ||||||
Zimmer Biomet Holdings, Inc. |
6,029 | 769,903 | ||||||
| 2,576,736 | ||||||||
Industrials — 15.81% |
||||||||
Curtiss-Wright Corporation |
5,019 | 568,853 | ||||||
Hubbell, Inc. |
6,518 | 768,994 | ||||||
ITT, Inc. |
11,764 | 682,313 | ||||||
Kansas City Southern |
6,192 | 718,148 | ||||||
KAR Auction Services, Inc. |
12,710 | 652,150 | ||||||
Masco Corporation |
17,467 | 686,628 | ||||||
Parker-Hannifin Corporation |
3,454 | 592,775 | ||||||
Republic Services, Inc. |
9,288 | 746,570 | ||||||
Snap-on, Inc. |
3,683 | 576,463 | ||||||
Xylem, Inc. |
7,984 | 631,055 | ||||||
| 6,623,949 | ||||||||
Information Technology — 8.88% |
||||||||
Amdocs Ltd. |
11,015 | 596,022 | ||||||
Keysight Technologies, Inc.(a) |
8,962 | 781,486 | ||||||
KLA-Tencor Corporation |
6,322 | 754,910 | ||||||
NetApp, Inc. |
7,658 | 531,006 | ||||||
Synopsys, Inc.(a) |
9,157 | 1,054,428 | ||||||
| 3,717,852 | ||||||||
Materials — 6.90% |
||||||||
Alcoa Corporation(a) |
7,104 | 200,049 | ||||||
Eastman Chemical Company |
8,147 | 618,194 | ||||||
International Flavors & Fragrances, Inc. |
5,149 | 663,140 | ||||||
Sealed Air Corporation |
16,066 | 739,999 | ||||||
Sonoco Products Company |
10,852 | 667,724 | ||||||
| 2,889,106 | ||||||||
Real Estate — 7.98% |
||||||||
Equity LifeStyle Properties, Inc. |
7,658 | 875,309 | ||||||
Essex Property Trust, Inc. |
3,096 | 895,487 | ||||||
Healthcare Trust of America, Inc., Class A |
27,179 | 777,048 | ||||||
Vornado Realty Trust |
11,764 | 793,364 | ||||||
| 3,341,208 | ||||||||
See accompanying notes which are an integral part of these financial statements.
22
DEAN MID CAP VALUE FUND
SCHEDULE OF INVESTMENTS – (continued)
March 31, 2019
COMMON STOCKS — 95.70% - continued |
Shares |
Fair Value |
||||||
Utilities — 9.52% |
||||||||
Ameren Corporation |
11,048 | $ | 812,580 | |||||
Atmos Energy Corporation |
7,332 | 754,683 | ||||||
CMS Energy Corporation |
14,632 | 812,661 | ||||||
Pinnacle West Capital Corporation |
8,734 | 834,796 | ||||||
Xcel Energy, Inc. |
13,752 | 773,000 | ||||||
| 3,987,720 | ||||||||
Total Common Stocks (Cost $33,893,789) |
40,086,593 | |||||||
MONEY MARKET FUNDS — 3.98% |
||||||||
Fidelity Investments Money Market Government Portfolio, Institutional Class, 2.35%(b) |
1,666,736 | 1,666,736 | ||||||
Total Money Market Funds (Cost $1,666,736) |
1,666,736 | |||||||
Total Investments — 99.68% (Cost $35,560,525) |
41,753,329 | |||||||
Other Assets in Excess of Liabilities — 0.32% |
135,641 | |||||||
NET ASSETS — 100.00% |
$ | 41,888,970 | ||||||
|
(a) |
Non-income producing security. |
|
(b) |
Rate disclosed is the seven day effective yield as of March 31, 2019. |
The sectors shown on the schedule of investments are based on the Global Industry Classification Standard, or GICS® (“GICS”). The GICS was developed by and/or is the exclusive property of MSCI, Inc. and Standard & Poor’s Financial Services LLC (“S&P”). GICS is a service mark of MSCI, Inc. and S&P and has been licensed for use by Ultimus Fund Solutions, LLC.
See accompanying notes which are an integral part of these financial statements.
23
DEAN FUNDS
STATEMENTS OF ASSETS AND LIABILITIES
March 31, 2019
Dean Small Cap |
Dean Mid Cap |
|||||||
Assets |
||||||||
Investments in securities at value (cost $322,543,237 and $35,560,525) |
$ | 323,492,585 | $ | 41,753,329 | ||||
Cash |
7,208 | 3,916 | ||||||
Receivable for fund shares sold |
289,039 | 79,172 | ||||||
Dividends receivable |
640,095 | 79,402 | ||||||
Prepaid expenses |
37,850 | 20,128 | ||||||
Total Assets |
324,466,777 | 41,935,947 | ||||||
Liabilities |
||||||||
Payable for investments purchased |
2,774,886 | — | ||||||
Payable for fund shares redeemed |
165,862 | — | ||||||
Payable to Adviser |
245,792 | 21,945 | ||||||
Payable to Administrator |
32,455 | 2,868 | ||||||
Other accrued expenses |
69,958 | 22,164 | ||||||
Total Liabilities |
3,288,953 | 46,977 | ||||||
Net Assets |
$ | 321,177,824 | $ | 41,888,970 | ||||
Net Assets consist of: |
||||||||
Paid-in capital |
$ | 320,323,543 | $ | 35,121,781 | ||||
Accumulated earnings |
854,281 | 6,767,189 | ||||||
Net Assets |
$ | 321,177,824 | $ | 41,888,970 | ||||
Shares outstanding (unlimited number of shares authorized, no par value) |
22,628,946 | 2,112,435 | ||||||
Net asset value, offering and redemption price per share |
$ | 14.19 | $ | 19.83 | ||||
See accompanying notes which are an integral part of these financial statements.
24
DEAN FUNDS
STATEMENTS OF OPERATIONS
For the year ended March 31, 2019
Dean Small Cap |
Dean Mid Cap |
|||||||
Investment Income |
||||||||
Dividend income (net of foreign taxes withheld of $1,272 and $1,727) |
$ | 7,518,389 | $ | 848,578 | ||||
Total investment income |
7,518,389 | 848,578 | ||||||
Expenses |
||||||||
Adviser |
3,122,044 | 331,269 | ||||||
Administration |
163,967 | 22,170 | ||||||
Transfer agent |
125,101 | 12,000 | ||||||
Fund accounting |
104,713 | 20,069 | ||||||
Report printing |
60,000 | 3,780 | ||||||
Custodian |
48,238 | 9,343 | ||||||
Registration |
36,137 | 27,033 | ||||||
Legal |
18,089 | 18,089 | ||||||
Audit and tax |
17,200 | 17,200 | ||||||
Trustee |
12,563 | 12,563 | ||||||
Insurance |
9,572 | 4,260 | ||||||
Chief Compliance Officer |
8,512 | 8,563 | ||||||
Pricing |
1,964 | 1,765 | ||||||
Miscellaneous |
169,680 | 27,308 | ||||||
Total expenses |
3,897,780 | 515,412 | ||||||
Fees waived by Adviser |
— | (85,295 | ) | |||||
Fees reduced by Administrator |
— | (25,000 | ) | |||||
Net operating expenses |
3,897,780 | 405,117 | ||||||
Net investment income |
3,620,609 | 443,461 | ||||||
Net Realized and Change in Unrealized Gain (Loss) on Investments |
||||||||
Net realized gain (loss) on investment securities transactions |
(954,748 | ) | 372,179 | |||||
Net change in unrealized appreciation (depreciation) of investment securities |
(5,534,954 | ) | 449,340 | |||||
Net realized and change in unrealized gain (loss) on investments |
(6,489,702 | ) | 821,519 | |||||
Net increase (decrease) in net assets resulting from operations |
$ | (2,869,093 | ) | $ | 1,264,980 | |||
See accompanying notes which are an integral part of these financial statements.
25
DEAN FUNDS
STATEMENTS OF CHANGES IN NET ASSETS
Dean Small Cap Value Fund |
Dean Mid Cap Value Fund |
|||||||||||||||
For the Year |
For the Year |
For the Year |
For the Year |
|||||||||||||
Increase (Decrease) in Net Assets due to: |
||||||||||||||||
Operations |
||||||||||||||||
Net investment income |
$ | 3,620,609 | $ | 3,089,757 | $ | 443,461 | $ | 148,184 | ||||||||
Net realized gain (loss) on investment securities transactions |
(954,748 | ) | 11,451,243 | 372,179 | 1,189,549 | |||||||||||
Net change in unrealized appreciation (depreciation) of investment securities |
(5,534,954 | ) | (11,522,605 | ) | 449,340 | 794,112 | ||||||||||
Net increase (decrease) in net assets resulting from operations |
(2,869,093 | ) | 3,018,395 | 1,264,980 | 2,131,845 | |||||||||||
Distributions to Shareholders From: |
||||||||||||||||
Earnings |
(9,984,457 | ) | (47,881,637 | ) | (1,171,674 | ) | (839,312 | ) | ||||||||
Total distributions |
(9,984,457 | ) | (47,881,637 | ) | (1,171,674 | ) | (839,312 | ) | ||||||||
Capital Transactions |
||||||||||||||||
Proceeds from shares sold |
128,051,056 | 191,223,325 | 8,892,396 | 7,875,636 | ||||||||||||
Reinvestment of distributions |
9,477,489 | 44,400,524 | 1,152,532 | 829,980 | ||||||||||||
Amount paid for shares redeemed |
(153,679,579 | ) | (125,141,608 | ) | (2,342,190 | ) | (2,037,300 | ) | ||||||||
Net increase (decrease) in net assets resulting from capital transactions |
(16,151,034 | ) | 110,482,241 | 7,702,738 | 6,668,316 | |||||||||||
Total Increase (Decrease) in Net Assets |
(29,004,584 | ) | 65,618,999 | 7,796,044 | 7,960,849 | |||||||||||
Net Assets |
||||||||||||||||
Beginning of year |
350,182,408 | 284,563,409 | 34,092,926 | 26,132,077 | ||||||||||||
End of year |
$ | 321,177,824 | $ | 350,182,408 | $ | 41,888,970 | $ | 34,092,926 | ||||||||
Share Transactions |
||||||||||||||||
Shares sold |
8,821,738 | 11,890,066 | 453,935 | 396,936 | ||||||||||||
Shares issued in reinvestment of distributions |
707,804 | 2,987,922 | 61,765 | 40,966 | ||||||||||||
Shares redeemed |
(10,839,550 | ) | (7,636,262 | ) | (118,970 | ) | (103,724 | ) | ||||||||
Net increase (decrease) in shares outstanding |
(1,310,008 | ) | 7,241,726 | 396,730 | 334,178 | |||||||||||
|
(a) |
For the year ended March 31, 2018, distributions from earnings consisted of $2,018,303 from net investment income and $45,863,334 from net realized gains. As of March 31, 2018, accumulated undistributed net investment income was $3,455,348. |
|
(b) |
For the year ended March 31, 2018, distributions from earnings consisted of $167,587 from net investment income and $671,725 from net realized gains. As of March 31, 2018, accumulated undistributed net investment income was $69,300. |
See accompanying notes which are an integral part of these financial statements.
26
DEAN SMALL CAP VALUE FUND
FINANCIAL HIGHLIGHTS
(For a share outstanding during each year)
For the Years ended |
||||||||||||||||||||
March 31, |
March 31, |
March 31, |
March 31, |
March 31, |
||||||||||||||||
Selected Per Share Data: |
||||||||||||||||||||
Net asset value, beginning of year |
$ | 14.63 | $ | 17.04 | $ | 14.32 | $ | 15.71 | $ | 15.96 | ||||||||||
Investment operations: |
||||||||||||||||||||
Net investment income |
0.15 | 0.12 | 0.19 | 0.11 | 0.07 | |||||||||||||||
Net realized and unrealized gain (loss) |
(0.18 | ) | 0.19 | (a) | 3.20 | (0.60 | ) | 1.00 | ||||||||||||
Total from investment operations |
(0.03 | ) | 0.31 | 3.39 | (0.49 | ) | 1.07 | |||||||||||||
Less distributions to shareholders from: |
||||||||||||||||||||
Net investment income |
(0.20 | ) | (0.11 | ) | (0.18 | ) | (0.03 | ) | (0.09 | ) | ||||||||||
Net realized gains |
(0.21 | ) | (2.61 | ) | (0.49 | ) | (0.87 | ) | (1.23 | ) | ||||||||||
Total distributions |
(0.41 | ) | (2.72 | ) | (0.67 | ) | (0.90 | ) | (1.32 | ) | ||||||||||
Net asset value, end of year |
$ | 14.19 | $ | 14.63 | $ | 17.04 | $ | 14.32 | $ | 15.71 | ||||||||||
Total Return(b) |
(0.08 | )% | 1.59 | % | 23.67 | % | (2.73 | )% | 7.25 | % | ||||||||||
Ratios and Supplemental Data: |
||||||||||||||||||||
Net assets, end of year (000 omitted) |
$ | 321,178 | $ | 350,182 | $ | 284,563 | $ | 198,450 | $ | 142,872 | ||||||||||
Ratio of net expenses to average net assets |
1.12 | % | 1.18 | % | 1.15 | % | 1.25 | % | 1.25 | % | ||||||||||
Ratio of expenses to average net assets before waiver or recoupment |
1.12 | % | 1.18 | % | 1.15 | % | 1.20 | % | 1.22 | % | ||||||||||
Ratio of net investment income to average net assets |
1.04 | % | 0.97 | % | 1.36 | % | 0.96 | % | 0.41 | % | ||||||||||
Portfolio turnover rate |
120 | % | 165 | % | 154 | % | 148 | % | 128 | % | ||||||||||
|
(a) |
The amount shown for a share outstanding throughout the period does not accord with the change in aggregate gains and losses in the portfolio of securities during the period because of the timing of sales and purchases of fund shares in relation to fluctuating market values during the period. |
|
(b) |
Total return represents the rate that the investor would have earned or lost on an investment in the Fund, assuming reinvestment of distributions. |
See accompanying notes which are an integral part of these financial statements.
27
DEAN MID CAP VALUE FUND
FINANCIAL HIGHLIGHTS
(For a share outstanding during each year)
For the Years ended |
||||||||||||||||||||
March 31, |
March 31, |
March 31, |
March 31, |
March 31, |
||||||||||||||||
Selected Per Share Data: |
||||||||||||||||||||
Net asset value, beginning of year |
$ | 19.87 | $ | 18.92 | $ | 16.15 | $ | 15.83 | $ | 14.82 | ||||||||||
Investment operations: |
||||||||||||||||||||
Net investment income |
0.22 | 0.08 | 0.12 | 0.03 | 0.11 | |||||||||||||||
Net realized and unrealized gain |
0.36 | 1.40 | 2.73 | 0.31 | 1.00 | |||||||||||||||
Total from investment operations |
0.58 | 1.48 | 2.85 | 0.34 | 1.11 | |||||||||||||||
Less distributions to shareholders from: |
||||||||||||||||||||
Net investment income |
(0.16 | ) | (0.10 | ) | (0.08 | ) | (0.02 | ) | (0.10 | ) | ||||||||||
Net realized gains |
(0.46 | ) | (0.43 | ) | — | — | — | |||||||||||||
Total distributions |
(0.62 | ) | (0.53 | ) | (0.08 | ) | (0.02 | ) | (0.10 | ) | ||||||||||
Net asset value, end of year |
$ | 19.83 | $ | 19.87 | $ | 18.92 | $ | 16.15 | $ | 15.83 | ||||||||||
Total Return(a) |
3.10 | % | 7.79 | % | 17.65 | % | 2.17 | % | 7.50 | % | ||||||||||
Ratios and Supplemental Data: |
||||||||||||||||||||
Net assets, end of year (000 omitted) |
$ | 41,889 | $ | 34,093 | $ | 26,132 | $ | 17,313 | $ | 16,437 | ||||||||||
Ratio of net expenses to average net assets |
1.10 | % | 1.10 | % | 1.10 | % | 1.50 | % | 1.50 | % | ||||||||||
Ratio of expenses to average net assets before waiver or recoupment |
1.40 | % | 1.53 | % | 1.76 | % | 1.91 | % | 1.88 | % | ||||||||||
Ratio of net investment income to average net assets |
1.20 | % | 0.49 | % | 0.75 | % | 0.23 | % | 0.66 | % | ||||||||||
Portfolio turnover rate |
46 | % | 52 | % | 57 | % | 39 | % | 52 | % | ||||||||||
|
(a) |
Total return represents the rate that the investor would have earned or lost on an investment in the Fund, assuming reinvestment of distributions. |
See accompanying notes which are an integral part of these financial statements.
28
DEAN FUNDS
NOTES TO THE FINANCIAL STATEMENTS
March 31, 2019
NOTE 1. ORGANIZATION
The Dean Small Cap Value Fund (the “Small Cap Fund”) and the Dean Mid Cap Value Fund (the “Mid Cap Fund”) (each a “Fund” and, collectively the “Funds”) were organized as diversified series of Unified Series Trust (the “Trust”) on November 13, 2006. The Trust is an open-end investment company established under the laws of Ohio by an Agreement and Declaration of Trust dated October 17, 2002 (the “Trust Agreement”). The Trust Agreement permits the Board of Trustees (the “Board”) to issue an unlimited number of shares of beneficial interest of separate series. The Funds are each a series of the Trust currently authorized by the Board. The investment adviser to each Fund is Dean Investment Associates, LLC (“Dean Investment Associates” or “Adviser”). In addition, the Adviser has retained Dean Capital Management, LLC (“DCM” or “Sub-Adviser”) to serve as sub-adviser to the Funds. DCM is an affiliate of the Adviser. The investment objective of each Fund is long-term capital appreciation and, secondarily, dividend income.
NOTE 2. SIGNIFICANT ACCOUNTING POLICIES
The Funds are investment companies and follow accounting and reporting guidance under Financial Accounting Standards Board (“FASB”) Accounting Standards Codification (“ASC”) Topic 946, “Financial Services-Investment Companies”. The following is a summary of significant accounting policies followed by the Funds in the preparation of their financial statements. These policies are in conformity with accounting principles generally accepted in the United States of America (“GAAP”).
Estimates – The preparation of financial statements in conformity with GAAP requires management to make estimates and assumptions that affect the reported amounts of assets and liabilities and disclosure of contingent assets and liabilities at the date of the financial statements and the reported amounts of increases and decreases in net assets from operations during the reporting period. Actual results could differ from those estimates.
Federal Income Taxes – The Funds make no provision for federal income or excise tax. The Funds have qualified and intend to qualify each year as regulated investment companies (“RIC”) under subchapter M of the Internal Revenue Code of 1986, as amended, by complying with the requirements applicable to RICs and by distributing substantially all of their taxable income. The Funds also intend to distribute sufficient
29
DEAN FUNDS
NOTES TO THE FINANCIAL STATEMENTS – (continued)
March 31, 2019
NOTE 2. SIGNIFICANT ACCOUNTING POLICIES – continued
net investment income and net capital gains, if any, so that they will not be subject to excise tax on undistributed income and gains. If the required amount of net investment income is not distributed, the Funds could incur a tax expense.
As of and during the fiscal year ended March 31, 2019, the Funds did not have a liability for any unrecognized tax benefits. The Funds recognize interest and penalties, if any, related to unrecognized tax benefits as income tax expense in the Statement of Operations when incurred. During the period, the Funds did not incur any interest or penalties. Management of the Funds has reviewed tax positions taken in tax years that remain subject to examination by all major tax jurisdictions, including federal (i.e., the previous three tax year ends and the interim tax period since then, as applicable) and has concluded that no provision for unrecognized tax benefits or expenses is required in these financial statements and does not expect this to change over the next twelve months.
Expenses – Expenses incurred by the Trust that do not relate to a specific fund of the Trust are allocated to the individual funds based on each Fund’s relative net assets or other appropriate basis (as determined by the Board).
Security Transactions and Related Income – The Funds follow industry practice and record security transactions on the trade date for financial reporting purposes. The specific identification method is used for determining gains or losses for financial statements and income tax purposes. Dividend income is recorded on the ex-dividend date and interest income is recorded on an accrual basis. Distributions received from investments in real estate investment trusts (“REITs”) that represent a return of capital or capital gain are recorded as a reduction of the cost of investment or as a realized gain, respectively. The calendar year-end amounts of ordinary income, capital gains, and return of capital included in distributions received from the Funds’ investments in REITs are reported to the Funds after the end of the calendar year; accordingly, the Funds estimate these amounts for accounting purposes until the characterization of REIT distributions is reported. Estimates are based on the most recent REIT distributions information available. Withholding taxes on foreign dividends and related reclaims have been provided for in accordance with the Funds’ understanding of the applicable country’s tax rules and rates.
30
DEAN FUNDS
NOTES TO THE FINANCIAL STATEMENTS – (continued)
March 31, 2019
NOTE 2. SIGNIFICANT ACCOUNTING POLICIES – continued
Dividends and Distributions – Each Fund intends to distribute substantially all of its net investment income and net realized long-term and short-term capital gains, if any, at least annually. Distributions to shareholders, which are determined in accordance with income tax regulations, are recorded on the ex-dividend date. The treatment for financial reporting purposes of distributions made to shareholders during the year from net investment income or net realized capital gains may differ from the ultimate treatment for federal income tax purposes. These differences are caused primarily by differences in the timing of the recognition of certain components of income, expense or realized capital gain for federal income tax purposes. Where such differences are permanent in nature; they are reclassified in the components of net assets based on their ultimate characterization for federal income tax purposes. Any such reclassifications will have no effect on net assets, results of operations, or net asset values per share of the Funds.
For the fiscal year ended March 31, 2019, the Funds made the following reclassifications to increase (decrease) the components of net assets:
Paid-in Capital |
Accumulated |
|||||||
Small Cap Fund |
$ | (1 | ) | $ | 1 | |||
Mid Cap Fund |
14,064 | (14,064 | ) | |||||
NOTE 3. SECURITIES VALUATION AND FAIR VALUE MEASUREMENTS
Fair value is defined as the price that each Fund would receive upon selling an investment in an orderly transaction to an independent buyer in the principal or most advantageous market of the investment. GAAP establishes a three-tier hierarchy to maximize the use of observable market data and minimize the use of unobservable inputs and to establish classification of fair value measurements for disclosure purposes.
Inputs refer broadly to the assumptions that market participants would use in pricing the asset or liability, including assumptions about risk, for example, the risk inherent in a particular valuation technique used to measure fair value including such a pricing model and/or the risk inherent in the inputs to the valuation technique. Inputs may be observable or unobservable. Observable inputs are inputs that reflect the assumptions market participants would use in pricing the asset or liability developed based on
31
DEAN FUNDS
NOTES TO THE FINANCIAL STATEMENTS – (continued)
March 31, 2019
NOTE 3. SECURITIES VALUATION AND FAIR VALUE MEASUREMENTS – continued
market data obtained from sources independent of the reporting entity. Unobservable inputs are inputs that reflect the reporting entity’s own assumptions about the assumptions market participants would use in pricing the asset or liability developed based on the best information available in the circumstances.
Various inputs are used in determining the value of each Fund’s investments. These inputs are summarized in the three broad levels listed below.
|
● |
Level 1 – unadjusted quoted prices in active markets for identical investments and/or registered investment companies where the value per share is determined and published and is the basis for current transactions for identical assets or liabilities at the valuation date |
|
● |
Level 2 – other significant observable inputs (including, but not limited to, quoted prices for an identical security in an inactive market, quoted prices for similar securities, interest rates, prepayment speeds, credit risk, etc.) |
|
● |
Level 3 – significant unobservable inputs (including each Fund’s own assumptions in determining fair value of investments based on the best information available) |
The inputs used to measure fair value may fall into different levels of the fair value hierarchy. In such cases, for disclosure purposes, the level in the fair value hierarchy within which the fair value measurement falls in its entirety, is determined based on the lowest level input that is significant to the fair value measurement in its entirety.
Equity securities that are traded on any stock exchange are generally valued at the last quoted sale price on the security’s primary exchange. Lacking a last sale price, an exchange-traded security is generally valued at its last bid price. Securities traded in the NASDAQ over-the-counter market are generally valued at the NASDAQ Official Closing Price. When using the market quotations and when the market is considered active, the security is classified as a Level 1 security. In the event that market quotations are not readily available or are considered unreliable due to market or other events, each Fund values its securities and other assets at fair value in accordance with policies established by and under the general supervision of the Board. Under these policies, the securities will be classified as Level 2 or 3 within the fair value hierarchy, depending on the inputs used.
32
DEAN FUNDS
NOTES TO THE FINANCIAL STATEMENTS – (continued)
March 31, 2019
NOTE 3. SECURITIES VALUATION AND FAIR VALUE MEASUREMENTS – continued
Investments in mutual funds, including money market mutual funds, are generally priced at the ending net asset value (“NAV”) provided by the service agent of the mutual funds. These securities are categorized as Level 1 securities.
In accordance with the Trust’s valuation policies, the Adviser and/or Sub-Adviser is required to consider all appropriate factors relevant to the value of securities for which it has determined other pricing sources are not available or reliable, as described above. No single standard exists for determining fair value, because fair value depends upon the circumstances of each individual case. As a general principle, the current fair value of an issue of securities being valued by Adviser and/or Sub-Adviser would be the amount that the Funds might reasonably expect to receive for them upon their current sale. Methods that are in accordance with this principle may, for example, be based on (i) a multiple of earnings; (ii) a discount from market prices of a similar freely traded security (including a derivative security or a basket of securities traded on other markets, exchanges or among dealers); or (iii) yield to maturity with respect to debt issues, or a combination of these and other methods. Fair value pricing is permitted if, in the Adviser or Sub-Adviser’s opinion, the validity of market quotations appears to be questionable based on factors such as evidence of a thin market in the security based on a small number of quotations, a significant event occurs after the close of a market but before a Fund’s NAV calculation that may affect a security’s value, or the Adviser or Sub-Adviser is aware of any other data that calls into question the reliability of market quotations.
The following is a summary of the inputs used at March 31, 2019 in valuing the Funds’ investments:
Valuation Inputs |
||||||||||||||||
Level 1 |
Level 2 |
Level 3 |
Total |
|||||||||||||
Small Cap Fund |
||||||||||||||||
Assets |
||||||||||||||||
Common Stocks(a) |
$ | 307,685,775 | $ | — | $ | — | $ | 307,685,775 | ||||||||
Money Market Funds |
15,806,810 | — | — | 15,806,810 | ||||||||||||
Total |
$ | 323,492,585 | $ | — | $ | — | $ | 323,492,585 | ||||||||
33
DEAN FUNDS
NOTES TO THE FINANCIAL STATEMENTS – (continued)
March 31, 2019
NOTE 3. SECURITIES VALUATION AND FAIR VALUE MEASUREMENTS – continued
Valuation Inputs |
||||||||||||||||
Level 1 |
Level 2 |
Level 3 |
Total |
|||||||||||||
Mid Cap Fund |
||||||||||||||||
Assets |
||||||||||||||||
Common Stocks(a) |
$ | 40,086,593 | $ | — | $ | — | $ | 40,086,593 | ||||||||
Money Market Funds |
1,666,736 | — | — | 1,666,736 | ||||||||||||
Total |
$ | 41,753,329 | $ | — | $ | — | $ | 41,753,329 | ||||||||
|
(a) |
Refer to the schedule of investments for sector classifications. |
The Funds did not hold any assets at any time during the reporting period in which significant unobservable inputs were used in determining fair value; therefore, no reconciliation of Level 3 securities is included for this reporting period.
NOTE 4. FEES AND OTHER TRANSACTIONS WITH AFFILIATES
Each Fund’s investments are managed by the Adviser pursuant to the terms of an advisory agreement with the Trust. The Adviser has hired the Sub-Adviser to manage the Funds’ assets on a day-to-day basis. The Sub-Adviser is paid by the Adviser. In accordance with the advisory agreement for each Fund, the Adviser is entitled to an investment advisory fee, computed and accrued daily and paid monthly, at an annual rate of 0.90% of the average daily net assets of each Fund. For the fiscal year ended March 31, 2019, the Adviser earned fees, before the waiver described below, of $3,122,044 and $331,269 from the Small Cap Fund and the Mid Cap Fund, respectively. At March 31, 2019, the Adviser was owed $245,792 from the Small Cap Fund and $21,945 from the Mid Cap Fund.
The Adviser contractually agreed to waive its management fee and/or to reimburse certain Fund operating expenses, but only to the extent necessary so that total annual operating expenses, excluding portfolio transaction and other investment-related costs (including brokerage fees and commissions); taxes; borrowing costs (such as interest and dividend expenses on securities sold short); acquired fund fees and expenses; fees and expenses associated with investments in other collective investment vehicles or derivative instruments (including for example option and swap fees and expenses); any amounts payable pursuant to a distribution or service plan adopted in accordance with Rule 12b-1 under the Investment Company Act of 1940; expenses incurred
34
DEAN FUNDS
NOTES TO THE FINANCIAL STATEMENTS – (continued)
March 31, 2019
NOTE 4. FEES AND OTHER TRANSACTIONS WITH AFFILIATES – continued
in connection with any merger or reorganization; extraordinary expenses (such as litigation expenses, indemnification of Trust officers and Trustees and contractual indemnification of Fund service providers, and other expenses that the Trustees agree have not been incurred in the ordinary course of the Funds’ business), do not exceed 1.25% of the Small Cap Fund’s average daily net assets and 1.10% of the Mid Cap Fund’s average daily net assets. The contractual agreement with respect to each Fund is in place through July 31, 2019. For the fiscal year ended March 31, 2019, the Adviser waived fees of $85,295 for the Mid Cap Fund.
Each waiver/expense payment by the Adviser is subject to recoupment by the Adviser from the Fund in the three years following the date the particular waiver/expense payment occurred, but only if such recoupment can be achieved without exceeding the annual expense limitation in effect at the time of the waiver/expense payment and any expense limitation in effect at the time of recoupment. As of March 31, 2019 the Adviser may seek repayment of investment advisory fees waived and expense reimbursements in the amount of $93,585, $93,991 and $85,295, pursuant to the aforementioned conditions, from the Mid Cap Fund no later than March 31, 2020, 2021 and 2022, respectively.
Ultimus Fund Solutions, LLC (the “Administrator”), provides the Funds with administration, fund accounting and transfer agent services, including all regulatory reporting. For the fiscal year ended March 31, 2019, fees for administration, transfer agent, and fund accounting services, and the amounts due to the Administrator at March 31, 2019 were as follows:
Small Cap Fund |
Mid Cap Fund |
|||||||
Administration |
$ | 163,967 | $ | 22,170 | ||||
Fund accounting |
104,713 | 20,069 | ||||||
Transfer agent |
125,101 | 12,000 | ||||||
Payable to Administrator |
32,455 | 2,868 | ||||||
During the fiscal year ended March 31, 2019, Ultimus agreed to discount the overall fees for the Mid Cap Fund in the amount of $25,000.
35
DEAN FUNDS
NOTES TO THE FINANCIAL STATEMENTS – (continued)
March 31, 2019
NOTE 4. FEES AND OTHER TRANSACTIONS WITH AFFILIATES – continued
The Board supervises the business activities of the Trust. Each Trustee serves as a trustee until termination of the Trust unless the Trustee dies, resigns, retires, or is removed. All of the Trustees are “Independent Trustees,’ which means that they are not “interested persons” as defined in the Investment Company Act of 1940, as amended (the “1940 Act”). Each Trustee of the Trust receives annual compensation of $2,070 per Fund from the Trust, except that the Independent Chairman of the Board, the Chairman of the Audit & Governance Committee and the Chairman of the Pricing, Valuation & Liquidity Committee each receives annual compensation of $2,520 per Fund from the Trust. Prior to January 1, 2019, these fees were $1,850 and $2,300 for non-chairmen and chairmen, respectively. Trustees also receive $1,000 for attending each special in-person meeting. In addition, the Trust reimburses Trustees for out-of-pocket expenses incurred in conjunction with attendance at meetings.
Certain officers of the Trust are employees of Ultimus Fund Solutions, LLC or Unified Financial Securities, LLC (the “Distributor”). The Distributor acts as the principal distributor of the Funds’ shares. Both the Administrator and the Distributor operate as wholly owned subsidiaries of Ultimus Fund Solutions, LLC. An officer of the Trust is an officer of the Distributor and such person may be deemed to be an affiliate of the Distributor. Officers, other than the Chief Compliance Officer, who is not an employee of the Administrator or the Distributor, are not paid by the Trust for services to the Funds.
NOTE 5. INVESTMENT TRANCSACTIONS
For the fiscal year ended March 31, 2019, purchases and sales of investment securities, other than short-term investments and short-term U.S. government obligations, were as follows:
Small Cap Fund |
Mid Cap Fund |
|||||||
Purchases |
$ | 395,255,279 | $ | 22,713,174 | ||||
Sales |
413,685,119 | 16,265,114 | ||||||
There were no purchases or sales of long-term U.S. government obligations during the fiscal year ended March 31, 2019.
36
DEAN FUNDS
NOTES TO THE FINANCIAL STATEMENTS – (continued)
March 31, 2019
NOTE 6. FEDERAL TAX INFORMATION
As of March 31, 2019, the unrealized appreciation (depreciation) of investments for tax purposes was as follows:
Small Cap Fund |
Mid Cap Fund |
|||||||
Gross unrealized appreciation |
$ | 5,786,796 | $ | 6,638,606 | ||||
Gross unrealized depreciation |
(12,439,039 | ) | (446,215 | ) | ||||
Net unrealized appreciation (depreciation) |
$ | (6,652,243 | ) | $ | 6,192,391 | |||
Tax cost |
$ | 330,144,828 | $ | 35,560,938 | ||||
The tax character of distributions paid during the fiscal year ended March 31, 2019 was as follows:
Small Cap Fund |
Mid Cap Fund |
|||||||
Distributions paid from: |
||||||||
Ordinary income |
$ | 6,060,609 | $ | 295,836 | ||||
Long-term capital gains |
3,923,848 | 875,838 | ||||||
Total distributions paid |
$ | 9,984,457 | $ | 1,171,674 | ||||
The tax character of distributions paid during the fiscal year ended March 31, 2018 was as follows:
Small Cap Fund |
Mid Cap Fund |
|||||||
Distributions paid from: |
||||||||
Ordinary income |
$ | 28,046,024 | $ | 167,587 | ||||
Long-term capital gains |
19,835,613 | 671,725 | ||||||
Total distributions paid |
$ | 47,881,637 | $ | 839,312 | ||||
37
DEAN FUNDS
NOTES TO THE FINANCIAL STATEMENTS – (continued)
March 31, 2019
NOTE 6. FEDERAL TAX INFORMATION – continued
As of March 31, 2019, the components of distributable earnings (accumulated losses) on a tax basis are as follows:
Small Cap Fund |
Mid Cap Fund |
|||||||
Undistributed ordinary income |
$ | 4,623,889 | $ | 212,588 | ||||
Undistributed long term capital gains |
2,882,635 | 362,210 | ||||||
Unrealized appreciation (depreciation) |
(6,652,243 | ) | 6,192,391 | |||||
Total accumulated earnings |
$ | 854,281 | $ | 6,767,189 | ||||
The difference between book basis and tax basis of unrealized appreciation (depreciation) is primarily attributable to the tax deferral of losses on wash sales.
NOTE 7. SECTOR RISK
If a Fund has significant investments in the securities of issuers within a particular sector, any development affecting that sector will have a greater impact on the value of the net assets of the Fund than would be the case if the Fund did not have significant investments in that sector. In addition, this may increase the risk of loss in the Fund and increase the volatility of the Fund’s NAV per share. For instance, economic or market factors, regulatory changes or other developments may negatively impact all companies in a particular sector, and therefore the value of the Fund’s portfolio will be adversely affected. As of March 31 2019, the Small Cap Fund had 26.94% of the value of its net assets invested in stocks within the Financials sector.
NOTE 8. COMMITMENTS AND CONTINGENCIES
The Funds indemnify their officers and trustees for certain liabilities that may arise from the performance of their duties to the Funds. Additionally, in the normal course of business, the Funds entered into contracts that contain a variety of representations and warranties which provide general indemnifications. The Funds’ maximum exposure under these arrangements is unknown, as this would involve future claims that may be made against the Funds that have not yet occurred.
38
DEAN FUNDS
NOTES TO THE FINANCIAL STATEMENTS – (continued)
March 31, 2019
NOTE 9. RECENT ACCOUNTING PRONOUNCEMENT
In August 2018, the FASB issued Accounting Standards Update (“ASU”) 2018-13, which changes the fair value measurement disclosure requirements of FASB ASC Topic 820, Fair Value Measurement. The update to Topic 820 includes new, eliminated, and modified disclosure requirements. ASU 2018-13 is effective for fiscal years beginning after December 15, 2019, including interim periods, although early adoption is permitted. Management has evaluated the implications of certain provisions of ASU 2018-13 and has determined to early adopt all aspects related to the removal and modification of certain fair value measurement disclosures under the ASU effective immediately.
NOTE 10. SUBSEQUENT EVENTS
Management has evaluated events or transactions that may have occurred since March 31, 2019, that would merit recognition or disclosure in the financial statements. There were no items requiring adjustment of the financial statements or additional disclosure.
39
REPORT OF INDEPENDENT REGISTERED PUBLIC
ACCOUNTING FIRM
To the Shareholders of Dean Funds and
Board of Trustees of Unified Series Trust
Opinion on the Financial Statements
We have audited the accompanying statements of assets and liabilities, including the schedules of investments, of Dean Funds comprising Dean Small Cap Value Fund and Dean Mid Cap Value Fund (the “Funds”), each a series of Unified Series Trust, as of March 31, 2019, and the related statements of operations for the year then ended, the statements of changes in net assets for each of the two years in the period then ended, including the related notes, and the financial highlights for each of the five years in the period then ended (collectively referred to as the “financial statements”). In our opinion, the financial statements present fairly, in all material respects, the financial position of each of the Funds as of March 31, 2019, the results of their operations for the year then ended, the changes in their net assets for each of the two years in the period then ended, and the financial highlights for each of the five years in the period then ended, in conformity with accounting principles generally accepted in the United States of America.
Basis for Opinion
These financial statements are the responsibility of the Funds’ management. Our responsibility is to express an opinion on the Funds’ financial statements based on our audits. We are a public accounting firm registered with the Public Company Accounting Oversight Board (United States) (“PCAOB”) and are required to be independent with respect to the Funds in accordance with the U.S. federal securities laws and the applicable rules and regulations of the Securities and Exchange Commission and the PCAOB.
We conducted our audits in accordance with the standards of the PCAOB. Those standards require that we plan and perform the audit to obtain reasonable assurance about whether the financial statements are free of material misstatement, whether due to error or fraud.
Our audits included performing procedures to assess the risks of material misstatement of the financial statements, whether due to error or fraud, and performing procedures that respond to those risks. Such procedures included examining, on a test basis, evidence regarding the amounts and disclosures in the financial statements. Our procedures included confirmation of securities owned as of March 31, 2019, by correspondence with the custodian and brokers or by other appropriate auditing procedures where replies from brokers were not received. Our audits also included evaluating the accounting principles used and significant estimates made by management, as well as evaluating the overall presentation of the financial statements. We believe that our audits provide a reasonable basis for our opinion.
We have served as the Funds’ auditor since 2007.
COHEN & COMPANY, LTD.
Cleveland, Ohio
May 23, 2019
40
SUMMARY OF FUND EXPENSES (Unaudited)
As a shareholder of a Fund, you incur ongoing costs, including management fees and other Fund expenses. This example is intended to help you understand your ongoing costs (in dollars) of investing in each Fund and to compare these costs with the ongoing costs of investing in other mutual funds.
The Example is based on an investment of $1,000 invested at the beginning and held for the six month period, October 1, 2018 to March 31, 2019.
Actual Expenses
The first line of the table below provides information about actual account values and actual expenses. You may use the information in this line, together with the amount you invested, to estimate the expenses that you paid over the period. Simply divide your account value by $1,000 (for example, an $8,600 account value divided by $1,000 = 8.60), then multiply the result by the number in the first line under the heading entitled “Expenses Paid During Period” to estimate the expenses you paid on your account during this period.
Hypothetical Example for Comparison Purposes
The second line of the table below provides information about hypothetical account values and hypothetical expenses based on each Fund’s actual expense ratio and an assumed rate of return of 5% per year before expenses, which is not each Fund’s actual return. The hypothetical account values and expenses may not be used to estimate the actual ending account balance or expenses you paid for the period. You may use this information to compare the ongoing costs of investing in each Fund and other funds. To do so, compare this 5% hypothetical example with the 5% hypothetical examples that appear in the shareholder reports of other funds.
Please note that the expenses shown in the table are meant to highlight your ongoing costs only and do not reflect any transactional costs. Therefore, the “Hypothetical” lines of the table are useful in comparing ongoing costs only, and will not help you determine the relative total costs of owning different funds.
41
SUMMARY OF FUND EXPENSES (Unaudited) – (continued)
Beginning |
Ending |
Expenses |
Annualized |
|
Dean Small Cap Value Fund |
||||
Actual |
$ 1,000.00 |
$ 966.20 |
$ 5.53 |
1.13% |
Hypothetical (b) |
$ 1,000.00 |
$ 1,019.31 |
$ 5.68 |
1.13% |
Dean Mid Cap Value Fund |
||||
Actual |
$ 1,000.00 |
$ 968.10 |
$ 5.40 |
1.10% |
Hypothetical (b) |
$ 1,000.00 |
$ 1,019.45 |
$ 5.54 |
1.10% |
|
(a) |
Expenses are equal to the Funds’ annualized expense ratios, multiplied by the average account value over the period, multiplied by 182/365 (to reflect the one-half year period). |
|
(b) |
Hypothetical assumes 5% annual return before expenses. |
42
OTHER FEDERAL INCOME TAX INFORMATION (Unaudited)
The Form 1099-DIV you receive in January 2020 will show the tax status of all distributions paid to your account in calendar year 2019. Shareholders are advised to consult their own tax adviser with respect to the tax consequences of their investment in the Fund. As required by the Internal Revenue Code and/or regulations, shareholders must be notified regarding the status of qualified dividend income for individuals and the dividends received deduction for corporations.
Qualified Dividend Income: For the year ended March 31, 2019, the Mid Cap Fund designates 100.00% and the Small Cap Fund designates 91.41%, or up to the maximum amount of such dividends allowable pursuant to the Internal Revenue Code, as qualified dividend income eligible for the reduced tax rate of 15%.
Dividends Received Deduction. Corporate shareholders are generally entitled to take the dividends received deduction on the portion of each Fund’s dividend distribution that qualifies under tax law. For the Mid Cap Fund and Small Cap Fund calendar year 2019 ordinary income dividends, 100.00% and 94.26% qualify for the corporate dividends received deduction, respectively.
For the year ended March 31, 2019, the Mid Cap Fund and Small Cap Fund designated $885,566 and $3,923,848, respectively, as long-term capital gain distributions.
43
TRUSTEES AND OFFICERS (Unaudited)
GENERAL QUALIFICATIONS. The Board supervises the business activities of the Trust. Each Trustee serves as a trustee until termination of the Trust unless the Trustee dies, resigns, retires, or is removed. All of the Trustees are “Independent Trustees,” which means that they are not “interested persons” (as defined in the 1940 Act) of the Trust or any adviser, sub-adviser or distributor of the Trust.
The following table provides information regarding the Independent Trustees.
Name, Address*, |
Principal Occupation During Past 5 Years and |
Kenneth G.Y. Grant (1949) |
Current: Executive Vice President (EVP), Benefit Plans Administrative Services, Inc., provider of retirement benefit plans administration (2019 – present). EVP, Advisors Charitable Gift Fund (2003 - present), a Donor Advised Fund. Chair, Investment Committees of Massachusetts Council of Churches (2011 – present) and Presbytery of Boston (2015- present). Minister Member, Presbytery of Boston, Presbyterian Church (USA) (1975 – present).
Previous: Director, Northeast Retirement Services (NRS) LLC, a transfer agent and fund administrator; and Director, Global Trust Company (GTC), a non-depository trust company sponsoring private investment product (2003 – 2019). EVP, NRS (2003 – 2019); GTC, EVP (2008 – 2019); EVP, Savings Banks Retirement Association (2003 – 2019), provider of qualified retirement benefit plans. Director, Lift Up Africa (2008-2018). |
Daniel J. Condon (1950) |
Previous: Executive Advisor of Standard Steel LLC, a Railway manufacturing supply company, Jan. 2016-Dec. 2016; Chief Executive Officer of Standard Steel LLC, Aug. 2011- Dec. 2015;Director of Standard Steel Holdings Co., which owns Standard Steel LLC, Aug. 2011- Dec. 2016; President and CEO of International Crankshaft Inc., an automotive supply manufacturing company, 2004 to Aug. 2011; Director of International Crankshaft Inc., 2004 to Dec. 2016; Chairman of SMI Crankshaft, an automotive and truck supply company from July 2010 to Aug. 2011. |
44
TRUSTEES AND OFFICERS (Unaudited) – (continued)
Name, Address*, |
Principal Occupation During Past 5 Years and |
Gary E. Hippenstiel (1947) |
Current: President and founder of Hippenstiel Investment Counsel LLC, a registered investment adviser, since November 2008.
Previous: Chairman of investment committee for the Diana Davis Spencer Foundation from October 2011 to May 2014; Chairman and Founder, Constitution Education Foundation from February 2011 to December 2016. |
Nancy V. Kelly (1955) |
Previous: Executive Vice President of Huntington National Bank, one of the Trust’s custodians (2001-2017). |
Stephen A. Little (1946) |
Current: President and founder of The Rose, Inc., a registered investment adviser, since April 1993.
Previous: Chairman, Unified Series Trust, December 2004 to December 2016. |
Ronald C. Tritschler (1952) |
Current: Chief Executive Officer, Director and Legal Counsel of The Webb Companies, a national real estate company, since 2001; Director of First State Bank of the Southeast, Inc., a full-service bank, since 1998; Director of Lexington Chamber of Commerce since January 2017.
Previous: Chairman of The Lexington Convention and Visitors’ Bureau 2011 to 2018. |
|
* |
The business address for each Trustee is 225 Pictoria Drive, Suite 450, Cincinnati, Ohio 45246. |
|
** |
As of the date of this Report, the Trust consists of, and each Trustee oversees, 16 series. |
45
TRUSTEES AND OFFICERS (Unaudited) – (continued)
The following table provides information regarding certain Officers of the Trust.
Name, Address*, |
Principal Occupation During Past 5 Years and |
David R. Carson (1958) |
Current: Vice President and Director of Client Strategies of Ultimus Fund Solutions, LLC since 2013; President, Ultimus Managers Trust (“UMT”) since October 2013.
Previous: Vice President, UMT (April 2013 to October 2013); Chief Compliance Officer, The Huntington Funds (2005 to 2013), Huntington Strategy Shares (2012 to 2013), and Huntington Asset Advisors (2013); Vice President, Huntington National Bank (2001 to 2013); CCO, FSI LBAR Fund (2013 to 2016). |
Zachary P. Richmond (1980) |
Current: Vice President, Director of Financial Administration for Ultimus Fund Solutions, LLC since February 2019; Treasurer and Chief Financial Officer of Capitol Series Trust since August 2014; Treasurer and Chief Financial Officer of Commonwealth International Series Trust since September 2015; Treasurer of Oak Associates Funds since April 2019; Treasurer of Centaur Mutual Funds Trust since April 2019.
Previous: Assistant Vice President, Associate Director of Financial Administration for Ultimus Fund Solutions, LLC (December 2015 to February 2019); Manager, Fund Administration, Huntington Asset Services, Inc. (January 2011 to December 2015). |
Elisabeth Dahl (1962) |
Current: Attorney, Ultimus Fund Solutions, LLC since March 2016.
Previous: Assistant Secretary, Unified Series Trust (2016-2017); Attorney, Cincinnati, OH (May 2009 to March 2016). |
46
TRUSTEES AND OFFICERS (Unaudited) – (continued)
Name, Address*, |
Principal Occupation During Past 5 Years and |
Stephen Preston (1966) |
Current: Vice President and Chief Compliance Officer, Ultimus Fund Solutions, LLC and Ultimus Fund Distributors, LLC, since June 2011 and CCO of Unified Financial Securities, LLC, since May 2017. |
Lynn E. Wood (1946) |
Current: Managing Member, Buttonwood Compliance Partners, LLC, since May 2013; Chief Compliance Officer of Unified Series Trust, since October 2004. |
|
* |
The business address for each officer is 225 Pictoria Drive, Suite 450, Cincinnati, Ohio 45246. |
47
MANAGEMENT AGREEMENT RENEWALS (Unaudited)
The Dean Mid Cap Value Fund (the “Mid Cap Fund”) and the Dean Small Cap Value Fund (the “Small Cap Fund”) (together the “Funds” and each, a “Fund”) are series of Unified Series Trust (the “Trust”). The Trust’s Board of Trustees (the “Board”) oversees the management of the Funds and, as required by law, has considered the approval of the continuance of the Funds’ management agreements with its investment adviser, Dean Investment Associates, LLC (“DIA”) and the sub-advisory agreement between DIA and Dean Capital Management, LLC (“DCM”).
The Board, with the assistance of the Board’s Advisory Contract Renewal Committee (the “Committee”), requested and evaluated all information that the Trustees deemed reasonably necessary under the circumstances in connection with the approval of the continuance of the management agreements and the sub-advisory agreement.
The Committee convened on November 6, 2018 via teleconference to review and discuss materials compiled by Ultimus Fund Solutions, LLC, the Trust’s administrator, with regard to the management agreements between the Trust and DIA, and the sub-advisory agreement between DIA and DCM. At the Trustees’ quarterly meeting held in November 2018, a sub-committee of the Board interviewed certain executives of DIA, including DIA’s Chief Compliance Officer, its President and its Chief Operating Officer. The Trustees, including the Trustees who are not “interested persons” (as that term is defined in the Investment Company Act of 1940) of the Trust, DIA or DCM (the “Independent Trustees”), approved the continuance of the management agreements between the Trust and DIA, and the sub-advisory agreement between DIA and DCM, for an additional year. The Trustees’ approval of the continuance of the Fund’s management agreements was based on a consideration of all the information provided to the Trustees, and was not the result of any single factor. Some of the factors that figured particularly in the Trustees’ deliberations are described below, although individual Trustees may have evaluated this information differently, ascribing different weights to various factors.
|
(i) |
The Nature, Extent, and Quality of Services. The Trustees reviewed and considered information regarding the nature, extent, and quality of services that DIA and DCM provide to the Funds, which include, but are not limited to, providing a continuous investment program for the Funds, adhering to the Funds’ investment restrictions, complying with the Trust’s policies and procedures, and voting proxies on behalf of the Funds. The Trustees considered the qualifications and experience of DCM’s portfolio managers who are responsible for the day-to-day management of the Funds’ portfolios, as well as the qualifications and experience of the other individuals at DIA and DCM who provide services to the Funds. The Trustees also reviewed the services provided by DIA in its |
48
MANAGEMENT AGREEMENT RENEWALS (Unaudited) – (continued)
oversight of DCM, noting that the two investment advisers are affiliated. The Trustees concluded that they were satisfied with the nature, extent, and quality of investment management services provided by DIA and DCM to the Funds.
|
(ii) |
Fund Performance. The Trustees next reviewed and discussed the Funds’ performance for periods ended September 30, 2018. The Trustees observed that the Small Cap Fund had underperformed its primary benchmark, the Russell 2000 Value Index, as well as the average return of its Morningstar Small-Cap Value category, for the year-to-date, one-year, three-year and five-year periods, but that it had slightly outperformed both its primary benchmark and its category over the ten-year period. The Trustees considered DIA’s and DCM’s explanation that the Small Cap Fund’s underperformance was primarily due to the momentum market (noting that its relative performance in October had improved markedly as the market turned down) and that the portfolio managers were early in taking a defensive posture. The Trustees observed that the Mid Cap Fund had outperformed its primary benchmark, the Russell Midcap Value Index, over the year-to-date, one-year and three-year periods, but that it had underperformed over the five- and ten-year periods. The Trustees noted that the Mid Cap Fund had outperformed its Morningstar Mid-Cap Value category over the year-to-date, one-year, three-year and five-year periods, but that it underperformed over the ten-year period. The Trustees also noted that the Funds performed within a few basis points of DIA’s separately managed accounts that have similar investment strategies. The Trustees considered the Funds’ performance to be satisfactory. |
|
(iii) |
Fee Rate and Profitability. The Trustees reviewed a fee and expense comparison for similarly-sized funds in the Small Cap Fund’s Morningstar Small-Cap category, which indicated that the Fund’s gross management fee and net expenses are higher than the average and median for that group of funds. The Trustees reviewed a fee and expense comparison for similarly-sized funds in the Mid Cap Fund’s Morningstar Mid-Cap Value category, which indicated that the Fund’s gross management fee and net expenses are higher than the average and median for that group of funds. The Trustees noted that that the management fee for the both Funds is lower than or equal to the management fee for DIA’s separately managed accounts for investments of up to $10 million. The Trustees further noted that DIA had continued its expense limitation agreement for each Fund through July 31, 2019. |
The Trustees also considered profitability analyses prepared by DIA and DCM for their management of each Fund, which indicated that, before the deduction of marketing expenses, DIA is earning a profit as a result of managing both the Mid Cap Fund and Small Cap Fund, but that after deduction of marketing expenses DIA is not earning a profit as a result of managing either Fund. The Trustees considered
49
MANAGEMENT AGREEMENT RENEWALS (Unaudited) – (continued)
that DCM is earning a profit both before and after deduction of marketing expenses as a result of managing the Small Cap Fund, but that it was not earning a profit either before or after deduction of marketing expenses as a result of managing the Mid Cap Fund. The Trustees determined that these profits for DIA and DCM were not excessive, based in part on their review of comparative profitability information from a Management Practice Inc. survey on the profitability of publicly-held investment advisers to mutual funds.
The Trustees also considered other potential benefits that DIA or DCM may receive in connection with its management of the Funds, including third-party research obtained by soft dollars, which may be used to benefit the Funds along with DIA’s and DCM’s other advisory clients. After considering the above information, the Trustees concluded that the current advisory fees for the Funds represent reasonable compensation in light of the nature and quality of DIA’s and DCM’s services to the Funds, the fees paid by competitive mutual funds, and the profitability of DIA’s and DCM’s services to the Funds.
|
(iv) |
Economies of Scale. In determining the reasonableness of the management fee for each Fund, the Trustees also considered the extent to which DIA and DCM will realize economies of scale as the Fund grows larger. The Trustees determined that, in light of the size of the Funds and DIA’s and DCM’s levels of profitability in managing the Funds, it does not appear that DIA or DCM is realizing benefits from economies of scale in managing the Funds to such an extent that the management fees for the Funds should be reduced or that breakpoints in the advisory fee should be implemented at this time. |
50
This page intentionally left blank.
This page intentionally left blank.
OTHER INFORMATION
The Funds’ Statement of Additional Information (“SAI”) includes additional information about the trustees and is available without charge, upon request. You may call toll-free at (888) 899-8343 to request a copy of the SAI or to make shareholder inquiries.
PROXY VOTING
A description of the policies and procedures that the Funds use to determine how to vote proxies relating to portfolio securities and information regarding how the Funds voted those proxies during the most recent twelve month period ended June 30 are available without charge upon request by: (1) calling the Funds at (888) 899-8343 and (2) from Fund documents filed with the Securities and Exchange Commission (“SEC”) on the SEC’s website at www.sec.gov.
TRUSTEES Kenneth G.Y. Grant, Chairman Daniel J. Condon Gary E. Hippenstiel Nancy V. Kelly Stephen A. Little Ronald C. Tritschler
OFFICERS David R. Carson, President Zachary P. Richmond, Treasurer and Chief Financial Officer Lynn E. Wood, Chief Compliance Officer
INVESTMENT ADVISER Dean Investment Associates LLC 3500 Pentagon Blvd., Suite 200 Beavercreek, Ohio. 45431
DISTRIBUTOR Unified Financial Securities, LLC 9465 Counselors Row, Suite 200 Indianapolis, IN 46240 |
INDEPENDENT REGISTERED PUBLIC ACCOUNTING FIRM Cohen & Company, Ltd. 1350 Euclid Avenue, Suite 800 Cleveland, OH 44115
LEGAL COUNSEL Thompson Hine LLP 312 Walnut Street, 14th Floor Cincinnati, OH 45202
CUSTODIAN Huntington National Bank 41 South High Street Columbus, OH 43215
ADMINISTRATOR, TRANSFER AGENT AND FUND ACCOUNTANT Ultimus Fund Solutions, LLC 225 Pictoria Drive, Suite 450 Cincinnati, OH 45246 |
This report is intended only for the information of shareholders or those who have received the Funds’ prospectus, which contains information about the Funds’ management fee and expenses. Please read the prospectus carefully before investing.
Distributed by Unified Financial Securities, LLC
Member FINRA/SIPC
PRIVACY POLICY
The following is a description of the Funds’ policies regarding disclosure of nonpublic personal information that you provide to the Funds or that the Funds collect from other sources. In the event that you hold shares of the Funds through a broker-dealer or other financial intermediary, the privacy policy of your financial intermediary would govern how your nonpublic personal information would be shared with nonaffiliated third parties.
Categories of Information the Funds Collects. The Funds collect the following nonpublic personal information about you:
|
● |
Information the Funds receive from you on applications or other forms, correspondence, or conversations (such as your name, address, phone number, social security number, and date of birth); and |
|
● |
Information about your transactions with the Funds, their affiliates, or others (such as your account number and balance, payment history, cost basis information, and other financial information). |
Categories of Information the Funds Disclose. The Funds do not disclose any nonpublic personal information about its current or former shareholders to unaffiliated third parties, except as required or permitted by law. The Funds are permitted by law to disclose all of the information they collect, as described above, to service providers (such as the Funds’ custodian, administrator, transfer agent, accountant and legal counsel) to process your transactions and otherwise provide services to you.
Confidentiality and Security. The Funds restrict access to your nonpublic personal information to those persons who require such information to provide products or services to you. The Funds maintain physical, electronic, and procedural safeguards that comply with federal standards to guard your nonpublic personal information.
Disposal of Information. The Funds, through their transfer agent, have taken steps to reasonably ensure that the privacy of your nonpublic personal information is maintained at all times, including in connection with the disposal of information that is no longer required to be maintained by the Funds. Such steps shall include, whenever possible, shredding paper documents and records prior to disposal, requiring off-site storage vendors to shred documents maintained in such locations prior to disposal, and erasing and/or obliterating any data contained on electronic media in such a manner that the information can no longer be read or reconstructed.
Item 2. Code of Ethics.
As of the end of the period covered by this report, the registrant has adopted a code of ethics that applies to the registrant’s principal executive officer, principal financial officer, principal accounting officer or controller, or persons performing similar functions, regardless of whether these individuals are employed by the registrant or a third party. Pursuant to Item 12(a)(1), a copy of registrant’s code of ethics is filed as an exhibit to this Form N-CSR. During the period covered by this report, the code of ethics has not been amended, and the registrant has not granted any waivers, including implicit waivers, from the provisions of the code of ethics.
Item 3. Audit Committee Financial Expert.
(a) The registrant’s board of trustees has determined that the registrant does not have an audit committee financial expert. The committee members and the full Board considered a possibility of adding a member that would qualify as an expert. The audit committee determined that, although none of its members meet the technical definition of an audit committee expert, the committee has sufficient financial expertise to adequately perform its duties under the Audit Committee Charter without the addition of a qualified expert.
Item 4. Principal Accountant Fees and Services.
| (a) | Audit Fees |
| The Dean Funds: | FY 2019 | $26,000 | ||
| FY 2018 | $26,000 |
| (b) | Audit-Related Fees |
| The Dean Funds: | FY 2019 | $0 | ||
| FY 2018 | $0 |
| (c) | Tax Fees |
| The Dean Funds: | FY 2019 | $6,000 | ||
| FY 2018 | $6,000 |
Nature of the fees: Preparation of the 1120 RIC and Excise review
| (d) | All Other Fees |
| The Dean Funds: | FY 2019 | $0 | ||
| FY 2018 | $0 |
| (e) | (1) | Audit Committee’s Pre-Approval Policies |
The Audit Committee Charter requires the Audit Committee to be responsible for the selection, retention or termination of auditors and, in connection therewith, to (i) evaluate the proposed fees and other compensation, if any, to be paid to the auditors, (ii) evaluate the independence of the auditors, (iii) pre-approve all audit services and, when appropriate, any non-audit services provided by the independent auditors to the Trust, (iv) pre-approve, when appropriate, any non-audit services provided by the independent auditors to the Trust's investment adviser, or any entity controlling, controlled by, or under common control with the investment adviser and that provides ongoing services to the Trust if the engagement relates directly to the operations and financial reporting of the Trust, and (v) receive the auditors’ specific representations as to their independence;
| (2) | All of the services described in paragraphs (b) through (d) of Item 4 were pre-approved by the Audit Committee. |
(f) During audit of registrant's financial statements for the most recent fiscal year, less than 50 percent of the hours expended on the principal accountant's engagement were attributed to work performed by persons other than the principal accountant's full-time, permanent employees.
(g) The aggregate non-audit fees billed by the registrant's accountant for services rendered to the registrant, and rendered to the registrant's investment adviser (not including any sub-adviser whose role is primarily portfolio management and is subcontracted with or overseen by another investment adviser), and any entity controlling, controlled by, or under common control with the adviser that provides ongoing services to the registrant:
| Registrant | Adviser | |
| FY 2019 | $0 | $0 |
| FY 2018 | $0 | $0 |
(h) Not applicable. The auditor performed no services for the registrant’s investment adviser or any entity controlling, controlled by, or under common control with the investment adviser that provides ongoing services to the registrant.
Item 5. Audit Committee of Listed Companies. NOT APPLICABLE – applies to listed companies only
Item 6. Schedule of Investments. Schedule filed with Item 1.
Item 7. Disclosure of Proxy Voting Policies and Procedures for Closed-End Management Investment Companies. NOT APPLICABLE – applies to closed-end funds only
Item 8. Portfolio Managers of Closed-End Investment Companies. NOT APPLICABLE – applies to closed-end funds only
Item 9. Purchases of Equity Securities by Closed-End Management Investment Company and Affiliated Purchasers. NOT APPLICABLE – applies to closed-end funds only
Item 10. Submission of Matters to a Vote of Security Holders.
The registrant has not adopted procedures by which shareholders may recommend nominees to the registrant’s board of trustees.
Item 11. Controls and Procedures.
(a) Based on their evaluation of the registrant’s disclosure controls and procedures (as defined in Rule 30a-3(c) under the Investment Company Act of 1940, as amended (the “Act”)) as of a date within 90 days of the filing date of this report, the registrant’s principal executive officer and principal financial officer have concluded that such disclosure controls and procedures are reasonably designed and are operating effectively to ensure that material information relating to the registrant is made known to them by others within those entities, particularly during the period in which this report is being prepared, and that the information required in filings on Form N-CSR is recorded, processed, summarized, and reported on a timely basis.
(b) There were no significant changes in the registrant’s internal control over financial reporting that occurred during the registrant’s second fiscal quarter of the period covered by this report that have materially affected, or are reasonably likely to materially affect, the registrant’s internal control over financial reporting.
Item 12. Disclosure of Securities Lending Activities for Closed-End Investment Companies.
Not Applicable.
Item 13. Exhibits.
| (a) | (1) | Code is filed herewith |
| (2) | Certifications by the registrant's principal executive officer and principal financial officer, pursuant to Section 302 of the Sarbanes- Oxley Act of 2002 and required by Rule 30a-2under the Investment Company Act of 1940 are filed herewith. |
| (3) | Not Applicable |
| (b) | Certification pursuant to 18 U.S.C. Section 1350, as adopted pursuant to Section 906 of the Sarbanes-Oxley Act of 2002 is filed herewith. |
SIGNATURES
Pursuant to the requirements of the Securities Exchange Act of 1934 and the Investment Company Act of 1940, the registrant has duly caused this report to be signed on its behalf by the undersigned, thereunto duly authorized.
| (Registrant) | Unified Series Trust | |
| By | /s/ David R. Carson | |
| David R. Carson, President | ||
| Date | 5/28/2019 |
Pursuant to the requirements of the Securities Exchange Act of 1934 and the Investment Company Act of 1940, this report has been signed below by the following persons on behalf of the registrant and in the capacities and on the dates indicated.
| By | /s/ David R. Carson | |
| David R. Carson, President | ||
| Date | 5/28/2019 | |
| By | /s/ Zachary P. Richmond | |
| Zachary P. Richmond, Treasurer | ||
| Date | 5/28/2019 |
UNIFIED SERIES TRUST
CODE OF ETHICS FOR PRINCIPAL EXECUTIVE AND SENIOR FINANCIAL OFFICERS
| I. | Covered Officers/Purpose of the Code |
This code of ethics (this “Code”) applies to the persons acting as principal executive officer, principal financial officer and principal accounting officer or controller of Unified Series Trust (the “Trust”), as set forth on Exhibit A and amended from time to time (collectively, the “Covered Officers”) for the purpose of promoting:
| • | honest and ethical conduct, including the ethical handling of actual or apparent conflicts of interest between personal and professional relationships; |
| • | full, fair, accurate, timely and understandable disclosure in reports and documents that the Trust files with, or submits to, the Securities and Exchange Commission (“SEC”) and in other public communications made by each series of the Trust; |
| • | compliance with applicable laws and governmental rules and regulations; |
| • | the prompt internal reporting of violations of this Code to an appropriate person or persons identified in this Code; and |
| • | accountability for adherence to this Code. |
Each Covered Officer should adhere to a high standard of business ethics and should be sensitive to situations that may give rise to actual as well as apparent conflicts of interest.
| II. | Covered Officers Should Handle Ethically Actual and Apparent Conflicts of Interest |
Overview. A “conflict of interest” occurs when a Covered Officer’s private interests interfere with the interests of, or the Covered Officer’s service to, the Trust. For example, a conflict of interest would arise if a Covered Officer, or a member of the Covered Officer’s family, receives improper personal benefits as a result of the Covered Officer’s position with the Trust.
Certain conflicts of interest arise out of the relationships between Covered Officers and the Trust and already are subject to conflict of interest provisions in the Investment Company Act of 1940, as amended (“Investment Company Act”) and the Investment Advisers Act of 1940, as amended (“Advisers Act”). For example, Covered Officers may not individually engage in certain transactions (such as the purchase or sale of securities or other property) with any series of the Trust because of their status as “affiliated persons” of the Trust. This Code does not, and is not intended to, repeat or replace any compliance programs and procedures of the Trust or any investment adviser to any series of the Trust designed to prevent, or identify and correct, violations of the Investment Company Act and the Advisers Act.
Although typically not presenting an opportunity for improper personal benefit, conflicts arise from, or as a result of, the contractual relationship between the Trust and the Trust’s administrator or its principal underwriter of which a Covered Officer is also an officer or employee. As a result, this Code recognizes that Covered Officers will, in the normal course of their duties, whether formally for the Trust or any service provider or affiliate of the Trust, be involved in establishing policies and implementing decisions that will have different effects on these entities and the Trust. The participation of the Covered Officers in such activities is inherent in the contractual relationship between the Trust and its service providers and affiliates and is consistent with the performance by the Covered Officers of their duties as officers of the Trust. Thus, if performed in conformity with the provisions of the Investment Company Act, such activities will be deemed to have been handled ethically. In addition, it is recognized by the Board of Trustees (“Board”) that the Covered Officers may also be officers or employees of one or more investment companies covered by other codes.
Other conflicts of interest are covered by this Code, even if such conflicts of interest are not subject to provisions in the Investment Company Act and the Advisers Act. The following list provides examples of conflicts of interest under this Code, but Covered Officers should keep in mind that these examples are not exhaustive. The overarching principle is that the personal interest of a Covered Officer should not be placed improperly before the interests of the Trust.
Each Covered Officer must:
| • | not use personal influence or personal relationships improperly to influence investment decisions or financial reporting by any series of the Trust whereby the Covered Officer would benefit personally to the detriment of the series; |
| • | not cause the Trust or any series to take action, or fail to take action, for the individual personal benefit of the Covered Officer rather than the benefit of the Trust; |
| • | not use material non-public knowledge of portfolio transactions made or contemplated for any series of the Trust to trade personally or cause others to trade personally in contemplation of the market effect of such transactions; |
| • | report at least annually any affiliations or other relationships related to conflicts of interest that the Trustees and Officers Questionnaire covers. |
There are some conflict of interest situations that should always be discussed with the Chief Compliance Officer of the Trust or Counsel to the Trust, if material. Examples of these include:
| • | service as a director on the board of any public company; |
| • | the receipt of any non-nominal gifts; |
| • | the receipt of any entertainment from any company with which the Trust has current or prospective business dealings unless such entertainment is business-related, reasonable in cost, appropriate as to time and place, and not so frequent as to raise any questions of impropriety; |
| • | any ownership interest in, or any consulting or employment relationship with, any of the Trust’s service providers, other than its principal underwriter, transfer agent, administrator or any affiliated person thereof; and |
| • | a direct or indirect financial interest in commissions, transaction charges, soft dollar credits or spreads paid by any series of the Trust for effecting portfolio transactions or for selling or redeeming shares other than an interest arising from the Covered Officer’s employment, such as compensation or equity ownership. |
| III. | Disclosure and Compliance |
| • | Each Covered Officer shall become familiar with the disclosure requirements generally applicable to the Trust. |
| • | Each Covered Officer should not knowingly misrepresent, or cause others to misrepresent, facts about the Trust to others, whether within or outside the Trust, including to the Trust’s directors and auditors, and to governmental regulators and self-regulatory organizations. |
| • | Each Covered Officer should, to the extent appropriate within the Covered Officer’s area of responsibility, consult with other officers and employees of the investment advisers to each series of the Trust and the Trust’s administrator with the goal of promoting full, fair, accurate, timely and understandable disclosure in the reports and documents that each series of the Trust files with, or submits to, the SEC and in other public communications made by the series. |
| • | It is the responsibility of each Covered Officer to promote Trust compliance with the standards and restrictions imposed by applicable laws, rules and regulations. |
| IV. | Reporting and Accountability |
Each Covered Officer must:
| • | upon adoption of this Code (or thereafter as applicable, upon becoming a Covered Officer), affirm in writing to the Board that the Covered Officer has received, read, and understands this Code; |
| • | annually thereafter affirm to the Board that the Covered Officer has complied with the requirements of this Code; |
| • | not retaliate against any other Covered Officer or any employee of the Trust or their affiliated persons for reports of potential violations that are made in good faith; and |
| • | notify the Chief Compliance Officer promptly if the Covered Officer knows of any violation of this Code. Failure to do so is itself a violation of this Code. |
The Chief Compliance Officer is responsible for applying this Code to specific situations in which questions are presented under it and has the authority to interpret this Code in any particular situation. However, any approvals or waivers sought by a Covered Officer will be considered by the Audit Committee of the Board (the “Committee”), which will make recommendations to the Board.
The Trust will follow these procedures in investigating and enforcing this Code:
| • | the Chief Compliance Officer for the Trust will take all appropriate action to investigate any potential violations reported to the Compliance Officer; |
| • | the Chief Compliance Officer will review with the outside legal counsel to the Trust the findings and conclusions of such investigation; |
| • | if, after such investigation and review, the Chief Compliance Officer believes that no violation has occurred, the Chief Compliance Officer is not required to take any further action; |
| • | any matter that the Chief Compliance Officer believes is a violation will be reported to the Committee; |
| • | if the Committee concurs that a violation has occurred, it will inform and make a recommendation to the Board, which will consider appropriate action, which may include review of, and appropriate modifications to, applicable policies and procedures (including changes to this Code); notification of the violation to appropriate personnel of the investment adviser or the administrator or its board; or a recommendation to take disciplinary action against the Covered Officer, which may include, without limitation, dismissal; |
| • | the Board will be responsible for granting waivers, as appropriate; and |
| • | any changes to or waivers of this Code will, to the extent required, be disclosed as provided by SEC rules, currently on Form N-CSR. |
| V. | Other Policies and Procedures |
This Code shall be the sole code of ethics adopted by the Trust for purposes of Section 406 of the Sarbanes-Oxley Act and the rules and forms applicable to registered investment companies thereunder. The codes of ethics adopted by the Trust and its affiliates under Rule 17j-1 under the Investment Company Act are separate requirements applying to the Covered Officers and others, and are not part of this Code.
| VI. | Amendments |
Any amendments to this Code, other than amendments to Exhibit A, must be approved or ratified by a majority vote of the Board, including a majority of trustees of the Trust who are not “interested persons” of the Trust as defined in Section 2(a)(19) of the Investment Company Act.
| VII. | Confidentiality |
To the extent possible, all records, reports and other information prepared, maintained or acquired pursuant to this Code will be treated as confidential and shall be maintained and protected accordingly. Except as otherwise required by law or regulation or this Code, such matters shall not be disclosed to anyone other than the Board, it being understood that it may be necessary or advisable, that certain matters be disclosed to third parties (e.g., to the board of directors or officers of the investment adviser to an applicable series or the Trust’s administrator).
| VIII. | Internal Use |
This Code is intended solely for the internal use by the Trust and does not constitute an admission, by or on behalf of the Trust, as to any fact, circumstance, or legal conclusion.
Adopted and Approved August 14, 2006.
Updated February 2008 and February 13, 2017
EXHIBIT A
Persons Covered by this Code of Ethics
(Updated February 13, 2017)
David R. Carson, President of the Trust
Zachary Richmond, Treasurer and Principal Financial Officer of the Trust
Exhibit 99.CERT
SECTION 302 CERTIFICATIONS
CERTIFICATION OF PRESIDENT
CERTIFICATIONS
I, David R. Carson, certify that:
| 1. | I have reviewed this report on Form N-CSR of Unified Series Trust; |
| 2. | Based on my knowledge, this report does not contain any untrue statement of a material fact or omit to state a material fact necessary to make the statements made, in light of the circumstances under which such statements were made, not misleading with respect to the period covered by this report; |
| 3. | Based on my knowledge, the financial statements, and other financial information included in this report, fairly present in all material respects the financial condition, results of operations, changes in net assets, and cash flows (if the financial statements are required to include a statement of cash flows) of the registrant as of, and for, the periods presented in this report; |
| 4. | The registrant's other certifying officer(s) and I are responsible for establishing and maintaining disclosure controls and procedures (as defined in Rule 30a-3(c) under the Investment Company Act of 1940) and internal control over financial reporting (as defined in Rule 30a-3(d) under the Investment Company Act of 1940) for the registrant and have: |
| a) | designed such disclosure controls and procedures, or caused such disclosure controls and procedures to be designed under our supervision, to ensure that material information relating to the registrant, including its consolidated subsidiaries, is made known to us by others within those entities, particularly during the period in which this report is being prepared; |
| b) | designed such internal control over financial reporting, or caused such internal control over financial reporting to be designed under our supervision, to provide reasonable assurance regarding the reliability of financial reporting and the preparation of financial statements for external purposes in accordance with generally accepted accounting principles; |
| c) | evaluated the effectiveness of the registrant's disclosure controls and procedures and presented in this report our conclusions about the effectiveness of the disclosure controls and procedures, as of a date within 90 days prior to the filing date of this report based on such evaluation; and |
| d) | disclosed in this report any change in the registrant’s internal control over financial reporting that occurred during the registrant’s second fiscal quarter of the period covered by this report that has materially affected, or is reasonably likely to materially affect, the registrant’s internal control over financial reporting; and |
| 5. | The registrant's other certifying officer(s) and I have disclosed to the registrant's auditors and the audit committee of the registrant's board of directors (or persons performing the equivalent functions): |
| a) | all significant deficiencies and material weaknesses in the design or operation of internal control over financial reporting which are reasonably likely to adversely affect the registrant's ability to record, process, summarize, and report financial information; and |
| b) | any fraud, whether or not material, that involves management or other employees who have a significant role in the registrant's internal control over financial reporting. |
| Date: | 5/28/2019 | /s/ David R. Carson | ||
| David R. Carson | ||||
| President |
SECTION 302 CERTIFICATIONS
CERTIFICATION OF CHIEF FINANCIAL OFFICER
CERTIFICATIONS
I, Zachary P. Richmond, certify that:
| 1. | I have reviewed this report on Form N-CSR of Unified Series Trust; |
| 2. | Based on my knowledge, this report does not contain any untrue statement of a material fact or omit to state a material fact necessary to make the statements made, in light of the circumstances under which such statements were made, not misleading with respect to the period covered by this report; |
| 3. | Based on my knowledge, the financial statements, and other financial information included in this report, fairly present in all material respects the financial condition, results of operations, changes in net assets, and cash flows (if the financial statements are required to include a statement of cash flows) of the registrant as of, and for, the periods presented in this report; |
| 4. | The registrant's other certifying officer(s) and I are responsible for establishing and maintaining disclosure controls and procedures (as defined in Rule 30a-3(c) under the Investment Company Act of 1940) and internal control over financial reporting (as defined in Rule 30a-3(d) under the Investment Company Act of 1940) for the registrant and have: |
| a) | designed such disclosure controls and procedures, or caused such disclosure controls and procedures to be designed under our supervision, to ensure that material information relating to the registrant, including its consolidated subsidiaries, is made known to us by others within those entities, particularly during the period in which this report is being prepared; |
| b) | designed such internal control over financial reporting, or caused such internal control over financial reporting to be designed under our supervision, to provide reasonable assurance regarding the reliability of financial reporting and the preparation of financial statements for external purposes in accordance with generally accepted accounting principles; |
| c) | evaluated the effectiveness of the registrant's disclosure controls and procedures and presented in this report our conclusions about the effectiveness of the disclosure controls and procedures, as of a date within 90 days prior to the filing date of this report based on such evaluation; and |
| d) | disclosed in this report any change in the registrant’s internal control over financial reporting that occurred during the registrant’s second fiscal quarter of the period covered by this report that has materially affected, or is reasonably likely to materially affect, the registrant’s internal control over financial reporting; and |
| 5. | The registrant's other certifying officer(s) and I have disclosed to the registrant's auditors and the audit committee of the registrant's board of directors (or persons performing the equivalent functions): |
| a) | all significant deficiencies and material weaknesses in the design or operation of internal control over financial reporting which are reasonably likely to adversely affect the registrant's ability to record, process, summarize, and report financial information; and |
| b) | any fraud, whether or not material, that involves management or other employees who have a significant role in the registrant's internal control over financial reporting. |
| Date | 5/28/2019 | /s/ Zachary P. Richmond | ||
| Zachary P. Richmond | ||||
| Treasurer |
EX-99.906CERT
certification of president and Treasurer pursuant to 18 U.S.C. section 1350, as adopted pursuant to section 906 of the sarbanes oxley act of 2002
David R. Carson, President, and Zachary P. Richmond, Treasurer of Unified Series Trust (the “Registrant”), each certify to the best of his or her knowledge that:
| 1. | The Registrant’s periodic report on Form N-CSR for the period ended March 31, 2019 (the “Form N-CSR”) fully complies with the requirements of Sections 15(d) of the Securities Exchange Act of 1934, as amended; and |
| 2. | The information contained in the Form N-CSR fairly presents, in all material respects, the financial condition and results of operations of the Registrant. |
| President | Treasurer | ||||
| Unified Series Trust | Unified Series Trust | ||||
| /s/ David R. Carson | /s/ Zachary P. Richmond | ||||
| David R. Carson | Zachary P. Richmond | ||||
| Date: | 5/28/2019 | Date: | 5/28/2019 | ||
A signed original of this written statement required by Section 906 of the Sarbanes-Oxley Act of 2002 has been provided to Unified Series Trust and will be retained by Unified Series Trust and furnished to the Securities and Exchange Commission (the “Commission”) or its staff upon request.
This certification is being furnished to the Commission solely pursuant to 18 U.S.C. § 1350 and is not being filed as part of the Form N-CSR filed with the Commission.
Serious News for Serious Traders! Try StreetInsider.com Premium Free!
You May Also Be Interested In
- Neo-Concept International Group Holdings Limited Announced Closing of Initial Public Offering
- Alexander’s Announces First Quarter Earnings Release Date and Vornado Realty Trust Quarterly Conference Call
- Clariane: First Quarter 2024 Revenue
Create E-mail Alert Related Categories
SEC FilingsSign up for StreetInsider Free!
Receive full access to all new and archived articles, unlimited portfolio tracking, e-mail alerts, custom newswires and RSS feeds - and more!
