

Form N-CSR Trust for Advised Portfo For: Dec 31
 Tweet
Tweet Share
Share
UNITED STATES
SECURITIES AND EXCHANGE COMMISSION
Washington, D.C. 20549
FORM N-CSR
CERTIFIED SHAREHOLDER REPORT OF REGISTERED
MANAGEMENT INVESTMENT COMPANIES
|
Investment Company Act file number |
811-21422 | |||||||
|
| ||||||||
|
Trust for Advised Portfolios | ||||||||
|
(Exact name of registrant as specified in charter) | ||||||||
|
| ||||||||
|
615 East Michigan Street Milwaukee, Wisconsin |
|
53202 | ||||||
|
(Address of principal executive offices) |
|
(Zip code) | ||||||
|
| ||||||||
|
Christopher E. Kashmerick Trust for Advised Portfolios 2020 East Financial Way, Suite 100 Glendora, CA 91741 | ||||||||
|
(Name and address of agent for service) | ||||||||
|
| ||||||||
|
Registrant’s telephone number, including area code: |
(626) 914-7385 |
| ||||||
|
| ||||||||
|
Date of fiscal year end: |
December 31 |
| ||||||
|
| ||||||||
|
Date of reporting period: |
December 31, 2018 |
| ||||||
Item 1. Reports to Stockholders.
Annual Report
December 31, 2018

1919 FINANCIAL SERVICES FUND
1919 MARYLAND TAX-FREE INCOME FUND
1919 SOCIALLY RESPONSIVE BALANCED FUND
Beginning on January 1, 2021, as permitted by regulations adopted by the U.S. Securities and Exchange Commission, paper copies of the Funds' shareholder reports will no longer be sent by mail, unless you specifically request paper copies of the reports from a Fund or from your financial intermediary, such as a broker-dealer or bank. Instead, the reports will be made available on the Funds' website, www.1919funds.com, and you will be notified by mail each time a report is posted and provided with a website link to access the report.
If you already elected to receive shareholder reports electronically, you will not be affected by this change and you need not take any action. You may elect to receive shareholder reports and other communications from the Funds electronically by contacting your financial intermediary, such as a broker-dealer or bank, or, if you are a direct investor, by calling the Fund toll-free at 1-844-828-1919.
You may elect to receive all future reports in paper free of charge. If you invest through a financial intermediary, you can contact your financial intermediary to request that you continue to receive paper copies of your shareholder reports. If you invest directly with the Funds, you can call the Funds toll-free at 1-844-828-1919 to let the Funds know you wish to continue receiving paper copies of your shareholder reports. Your election to receive reports in paper will apply to all Funds held in your account if you invest through your financial intermediary.
Table of Contents
|
1919 Financial Services Fund |
|||||||
|
Letter to shareholders |
1 |
||||||
|
Fund performance |
4 |
||||||
|
Fund expenses |
6 |
||||||
|
Fund at a glance |
7 |
||||||
|
Schedule of investments |
8 |
||||||
|
Statement of assets and liabilities |
11 |
||||||
|
Statement of operations |
12 |
||||||
|
Statements of changes in net assets |
13 |
||||||
|
Financial highlights |
14 |
||||||
|
1919 Maryland Tax-Free Income Fund |
|||||||
|
Letter to shareholders |
17 |
||||||
|
Fund performance |
21 |
||||||
|
Fund expenses |
23 |
||||||
|
Fund at a glance |
24 |
||||||
|
Schedule of investments |
25 |
||||||
|
Statement of assets and liabilities |
28 |
||||||
|
Statement of operations |
29 |
||||||
|
Statements of changes in net assets |
30 |
||||||
|
Financial highlights |
31 |
||||||
|
1919 Socially Responsive Balanced Fund |
|||||||
|
Letter to shareholders |
34 |
||||||
|
Fund performance |
37 |
||||||
|
Fund expenses |
39 |
||||||
|
Fund at a glance |
40 |
||||||
|
Schedule of investments |
41 |
||||||
|
Statement of assets and liabilities |
47 |
||||||
|
Statement of operations |
48 |
||||||
|
Statements of changes in net assets |
49 |
||||||
|
Financial highlights |
50 |
||||||
|
Notes to financial statements |
54 |
||||||
|
Report of independent registered public accounting firm |
67 |
||||||
|
Other information |
69 |
||||||
|
Approval of investment advisory agreement |
71 | ||||||
|
Trustee and officer information |
74 | ||||||
|
Privacy notice |
77 | ||||||
|
Directory of funds' service providers |
Back Cover |
||||||
1919 Funds 2018 Annual Report
1919 Financial Services Fund
Letter to shareholders (unaudited)
Dear Shareholder,
2018 started out strong following the Tax Cut and Jobs Act of 2017 and was proceeded by accelerating GDP growth throughout the year. However, as the year progressed, investors became increasingly pessimistic about prospects for global growth amidst a backdrop of Federal Reserve interest rate increases and trade tensions. The declines were most prevalent in the fourth quarter, as the S&P 500 Index dropped 13.5%. Financials were not immune as the S&P 500 Financials Index were down 13%. Small-Cap financials were hit harder during the quarter, down 16.8% as measured by the Russell 2000 Index of Financial stocks.
Looking forward, aided by a healthy U.S. consumer and strong corporate balance sheets, we expect solid earnings growth for Financials as we move through 2019. For example, the earnings growth for the S&P Financial Index in 2019, per financial data research firm FactSet, is 9.1% compared with 6.5% for the S&P 500 at the date of this writing. We also believe valuations will be a growth catalyst for Financials in 2019. For example, again as of this writing, large-cap and mid-cap banks are trading at a significant discount to the historical 20-year averages, but in our view are better regulated, capitalized and managed than before the Great Recession.
For the twelve months ended December 31, 2018, the 1919 Financial Services Fund Class I returned -14.72%. The Fund's unmanaged benchmarks, the S&P 500 Index and S&P 500 Financials Index, returned -4.38% and -13.03% respectively. The Lipper Financial Services Fund Category average returned -15.41% over the same time frame.
How did we respond to these changing market conditions?
The changes to the Fund's investments were stock specific rather than reacting to the overall market conditions. We added to a number of small-cap and large-cap banks, Financial Technology, and Insurance stocks especially during periods of market weakness. We pared back or sold a few positions with weaker fundamentals or those that were viewed as more fully valued.
1919 Funds 2018 Annual Report
1
1919 Financial Services Fund
Letter to shareholders (unaudited) (cont'd)
What were the leading contributors to performance?
Our selection of Financial Technology and Property and Casualty Insurance contributed the most to performance. The top five performing stocks were i3 Verticals Inc., Visa, Inc., Verisk Analytics Inc., First Connecticut Bancorp, Inc., and CoBiz Financial Inc. The first three of these companies benefitted from reporting solid revenue and EPS growth while the last two appreciated following announcements they were being acquired by other banks.
What were the leading detractors to performance?
The five stocks that performed the worst were Affiliated Managers Group, Inc., Bank OZK, Texas Capital Bancshares, Inc., First Western Financial, Inc., and Cadence Bancorporation Class A. The smaller and mid cap regional banks underperformed primarily in the fourth quarter as recessionary fears surfaced.
Thank you for your investment in 1919 Financial Services Fund. As always we appreciate that you have chosen us to manage your assets and we remain focused on achieving the Fund's investment goals.
Sincerely,

Christopher J. Perry, CFA
Portfolio Manager
1919 Investment Counsel, LLC

Lee Robertson, CFA
Portfolio Manager
1919 Investment Counsel, LLC

Charlie King, CFA
Portfolio Manager
1919 Investment Counsel, LLC
S&P 500 Index — The S&P 500 Index is a broad based unmanaged index of 500 stocks, which is widely recognized as representative of the equity market in general.
S&P 500 Financials Index — The S&P 500 Financials Index comprises those companies included in the S&P 500 that are classified as members of the Global Industry Classification Standard financials sector.
Lipper Financial Services Fund Category — Funds invest primarily in equity securities of companies engaged in providing financial services, including but not limited to banks, finance companies, insurance companies, and securities/brokerage firms.
Russell 2000 Index of Financial Stocks — Represents those financial companies who are included in the Russell 2000 index, which is an index measuring the performance of approximately 2,000 small-cap companies in the Russell 3000 Index, which is made up of 3,000 of the biggest U.S. stocks.
1919 Funds 2018 Annual Report
2
Past performance is not a guarantee of future results.
Earnings growth is not representative of the Fund's future performance.
Opinions expressed herein are as of 12/31/18 and are subject to change at any time, are not a guaranteed and should not be considered investment advice.
Fund holdings and sector allocations are subject to change and are not a recommendation to buy or sell any security. Please refer to the Schedule of Investments for a complete list of Fund holdings.
This report has been prepared for shareholders and may be distributed to other if preceded or accompanied by a current prospectus.
Mutual fund investing involves risk. Principal loss is possible. The Fund may invest in small and medium-capitalization companies which tend to have limited liquidity and greater price volatility than larger-capitalization companies. The Fund may invest in foreign and emerging market securities which will involve greater volatility and political, economic and currency risks and differences in accounting methods. The risks are particularly significant for funds that invest in emerging markets. The Fund may make short sales of securities, which involves the risk that losses may exceed the original amount invested.
1919 Funds are distributed by Quasar Distributors, LLC.
1919 Funds 2018 Annual Report
3
Fund performance (unaudited)
Value of $10,000 Investment

This chart illustrates the performance of a hypothetical $10,000 investment in the Fund's Class A shares over ten years. Assumes the deduction of the maximum initial sales charge of 5.75% at the time of investment and the reinvestment of dividends and capital gains, but does not reflect the effect of any other applicable sales charge or redemption fees. This chart does not imply any future performance. The performance of the Fund's other classes may be greater or less than the Class A shares' performance indicated on this chart, depending on whether greater or lesser sales charges and fees were incurred by shareholders investing in the other classes.
1919 Funds 2018 Annual Report
4
Total Returns* as of December 31, 2018
|
1 Year |
5 Year |
10 Year |
|||||||||||||
|
1919 Financial Services Fund Class A |
|||||||||||||||
|
With Sales Charges† |
|||||||||||||||
|
Class A |
-19.82 |
% |
5.61 |
% |
10.24 |
% |
|||||||||
|
Class C |
-16.40 |
6.13 |
10.12 |
||||||||||||
|
Without Sales Charges |
|||||||||||||||
|
Class A |
-14.93 |
6.87 |
10.90 |
||||||||||||
|
Class C |
-15.57 |
6.13 |
10.12 |
||||||||||||
|
Class I |
-14.72 |
7.23 |
11.23 |
||||||||||||
|
S&P 500 Index(i) |
-4.38 |
8.49 |
13.12 |
||||||||||||
|
S&P Financials Index(ii) |
-13.03 |
8.16 |
10.91 |
||||||||||||
* Returns over one year are annualized.
† Class A Shares have a maximum initial sales charge of 5.75% and Class C Shares have a contingent deferred sales charge (CDSC) of 1.00% for shares redeemed within one year of purchase.
As of the Fund's current prospectus dated April 30, 2018, the total annual operating expense ratios for Class A, Class C and Class I were 1.37%, 2.08% and 1.11%, respectively. The total net annual operating expense ratio for Class I was 1.10%(iii). Actual expenses may be higher. For example, expenses may be higher than those shown if average net assets decrease. Net assets are more likely to decrease, and Fund expense ratios are more likely to increase when markets are volatile.
All figures represent past performance and are not a guarantee of future results. Investment return and principal value of an investment will fluctuate so that an investor's shares, when redeemed, may be worth more or less than their original cost. Fund returns assume the reinvestment of all distributions, at net asset value and the deduction of all Fund expenses. Total returns do not reflect the deduction of taxes that a shareholder would pay on Fund distributions or the redemption of Fund shares. Performance figures may reflect fee waivers and/or expense reimbursements. In the absence of fee waivers and/or expense reimbursements, the total return would have been lower. Current performance of the Fund may be lower or higher than the performance quoted. Performance data current to the most recent month end may be obtained by calling 1-844-828-1919.
As of November 7, 2014, the Fund assumed the performance, financial and other historic information of the Legg Mason Investment Counsel Financial Services Fund. Fund holdings and sector allocations are subject to change at any time and should not be considered a recommendation to buy or sell any security. Please refer to the Schedule of Investments in this report for a complete list of Fund holdings.
(i) The S&P 500 Index is an unmanaged index of 500 stocks and is generally representative of the performance of larger companies in the U.S.
(ii) The S&P 500 Financials Index is a capitalization-weighted index representing nine financial groups and fifty-three financial companies, calculated monthly with dividends reinvested at month-end.
(iii) The Advisor has contractually agreed to waive fees and reimburse operating expenses through April 30, 2020
The Indices are unmanaged and are not subject to the same management and trading expenses as a mutual fund. Please note that an investor cannot invest directly in an index.
1919 Funds 2018 Annual Report
5
Fund expenses (unaudited)
Example
As a shareholder of the Fund, you may incur two types of costs: (1) transaction costs, including front-end and back-end sales charges (loads) on purchase payments; and (2) ongoing costs, including management fees; service and/or distribution (12b-1) fees; and other Fund expenses. This example is intended to help you understand your ongoing costs (in dollars) of investing in the Fund and to compare these costs with the ongoing costs of investing in other mutual funds.
This example is based on an investment of $1,000 invested on July 1, 2018 and held for the six months ended December 31, 2018. The hypothetical example is based on a six-month period ended December 31, 2018.
Actual expenses
The table below titled "Based on Actual Total Return" provides information about actual account values and actual expenses. You may use the information provided in this table, together with the amount you invested, to estimate the expenses that you paid over the period. To estimate the expenses you paid on your account, divide your ending account value by $1,000 (for example, an $8,600 ending account value divided by $1,000 = 8.6), then multiply the
result by the number under the heading entitled "Expenses Paid During the Period".
Hypothetical example for comparison purposes
The table below titled "Based on Hypothetical Total Return" provides information about hypothetical account values and hypothetical expenses based on the actual expense ratio and an assumed rate of return of 5.00% per year before expenses, which is not the Fund's actual return. The hypothetical account values and expenses may not be used to estimate the actual ending account balance or expenses you paid for the period. You may use the information provided in this table to compare the ongoing costs of investing in the Fund and other funds. To do so, compare the 5.00% hypothetical example relating to the Fund with the 5.00% hypothetical examples that appear in the shareholder reports of the other funds.
Please note that the expenses shown in the table below are meant to highlight your ongoing costs only and do not reflect any transactional costs. Therefore, the table is useful in comparing ongoing costs only, and will not help you determine the relative total costs of owning different funds. In addition, if these transaction costs were included, your costs would have been higher.
Based on actual total return1
|
Actual Total Return2 |
Beginning Account Value |
Ending Account Value |
Annualized Expense Ratio |
Expenses Paid During the Period3 |
|||||||||||||||||||
|
Class A |
-17.22 |
% |
$ |
1,000.00 |
$ |
827.80 |
1.35 |
% |
$ |
6.22 |
|||||||||||||
|
Class C |
-17.54 |
1,000.00 |
824.60 |
2.06 |
9.47 |
||||||||||||||||||
|
Class I |
-17.13 |
1,000.00 |
828.70 |
1.05 |
4.84 |
||||||||||||||||||
Based on hypothetical total return1
|
Hypothetical Annualized Total Return |
Beginning Account Value |
Ending Account Value |
Annualized Expense Ratio |
Expenses Paid During the Period3 |
|||||||||||||||||||
|
Class A |
5.00 |
% |
$ |
1,000.00 |
$ |
1,018.40 |
1.35 |
% |
$ |
6.87 |
|||||||||||||
|
Class C |
5.00 |
1000.00 |
1,014.82 |
2.06 |
10.46 |
||||||||||||||||||
|
Class I |
5.00 |
1000.00 |
1,019.91 |
1.05 |
5.35 |
||||||||||||||||||
1 For the six months ended December 31, 2018.
2 Assumes the reinvestment of all distributions at net asset value and does not reflect the deduction of the applicable sales charge with respect to Class A shares or the applicable contingent deferred sales charge ("CDSC") with respect to Class C shares. Total return is not annualized, as it may not be representative of the total return for the year. Performance figures may reflect fee waivers and/or expense reimbursements. In the absence of fee waivers and/or expense reimbursements, the total return would have been lower.
3 Expenses (net of fee waivers and/or expense reimbursements) are equal to each class' annualized expense ratio multiplied by the average account value over the period, multiplied by the number of days in the most recent fiscal half-year (184), then divided by 365.
1919 Funds 2018 Annual Report
6
Fund at a glance (unaudited)
Investment breakdown (%) as a percent of total investments

1919 Funds 2018 Annual Report
7
Schedule of investments
December 31, 2018
1919 Financial Services Fund
|
Security |
Shares |
Value |
|||||||||
|
Common Stocks — 98.5% |
|||||||||||
|
Capital Markets — 2.8% |
|||||||||||
|
Affiliated Managers Group Inc. |
14,392 |
$ |
1,402,357 |
||||||||
|
Ameriprise Financial Inc. |
38,425 |
4,010,417 |
|||||||||
|
CME Group Inc. |
4,000 |
752,480 |
|||||||||
|
Total Capital Markets |
6,165,254 |
||||||||||
|
Commercial Banks — 54.0% |
|||||||||||
|
Bank of America Corp. |
278,000 |
6,849,920 |
|||||||||
|
Bank of the Ozarks Inc. |
65,698 |
1,499,885 |
|||||||||
|
Banner Corp. |
80,142 |
4,285,994 |
|||||||||
|
Berkshire Hills Bancorp Inc. |
104,500 |
2,818,365 |
|||||||||
|
BOK Financial Corp. |
36,314 |
2,662,906 |
|||||||||
|
Bryn Mawr Bank Corp. |
70,000 |
2,408,000 |
|||||||||
|
Cadence BanCorp |
160,000 |
2,684,800 |
|||||||||
|
Centerstate Banks Inc. |
221,300 |
4,656,152 |
|||||||||
|
Coastal Financial Corp/WA |
70,000 |
1,066,100 |
* |
||||||||
|
Columbia Banking System Inc. |
131,805 |
4,783,203 |
|||||||||
|
Comerica Inc. |
40,000 |
2,747,600 |
|||||||||
|
Farmers & Merchants Bank of Long Beach |
200 |
1,540,000 |
|||||||||
|
First Financial Bancorp |
57,000 |
1,352,040 |
|||||||||
|
First Foundation Inc. |
163,000 |
2,096,180 |
* |
||||||||
|
First Merchants Corp. |
28,000 |
959,560 |
|||||||||
|
First Western Financial Inc. |
110,000 |
1,288,100 |
* |
||||||||
|
Franklin Financial Network Inc. |
45,000 |
1,186,650 |
* |
||||||||
|
Heritage Financial Corp. |
133,000 |
3,952,760 |
|||||||||
|
JPMorgan Chase & Co. |
97,310 |
9,499,402 |
|||||||||
|
Level One Bancorp Inc. |
80,000 |
1,794,400 |
|||||||||
|
MB Financial Inc. |
94,000 |
3,725,220 |
|||||||||
|
National Commerce Corp. |
30,000 |
1,080,000 |
* |
||||||||
|
Northrim Bancorp Inc. |
39,100 |
1,285,217 |
|||||||||
|
Pacific City Financial Corp. |
115,000 |
1,799,750 |
|||||||||
|
Pacific Premier Bancorp Inc. |
65,263 |
1,665,512 |
* |
||||||||
|
People's Utah Bancorp |
102,000 |
3,075,300 |
|||||||||
|
PNC Financial Services Group Inc. |
29,000 |
3,390,390 |
|||||||||
|
QCR Holdings Inc. |
126,500 |
4,059,385 |
|||||||||
|
SmartFinancial Inc. |
50,000 |
913,500 |
* |
||||||||
|
Sterling Bancorp |
268,200 |
4,427,982 |
|||||||||
|
SunTrust Banks Inc. |
69,000 |
3,480,360 |
|||||||||
| SVB Financial Group |
26,000 |
4,937,920 |
* |
||||||||
|
TCF Financial Corp. |
110,000 |
2,143,900 |
|||||||||
1919 Funds 2018 Annual Report
8
1919 Financial Services Fund
|
Security |
Shares |
Value |
|||||||||
|
Commercial Banks — continued |
|||||||||||
|
Texas Capital Bancshares Inc. |
100,000 |
$ |
5,109,000 |
* |
|||||||
|
Towne Bank/Portsmouth VA |
48,812 |
1,169,058 |
|||||||||
|
U.S. Bancorp |
60,500 |
2,764,850 |
|||||||||
|
Univest Corp. of Pennsylvania |
55,126 |
1,189,068 |
|||||||||
|
Webster Financial Corp. |
93,895 |
4,628,085 |
|||||||||
|
Western Alliance Bancorp |
116,000 |
4,580,840 |
* |
||||||||
|
Wintrust Financial Corp. |
70,000 |
4,654,300 |
|||||||||
|
Total Commercial Banks |
120,211,654 |
||||||||||
|
Consumer Finance — 2.2% |
|||||||||||
|
Discover Financial Services |
84,000 |
4,954,320 |
|||||||||
|
Total Consumer Finance |
4,954,320 |
||||||||||
|
Diversified Financial Services — 6.3% |
|||||||||||
|
Charles Schwab Corp. |
96,000 |
3,986,880 |
|||||||||
|
Intercontinental Exchange Inc. |
90,500 |
6,817,365 |
|||||||||
|
Voya Financial Inc. |
78,000 |
3,130,920 |
|||||||||
|
Total Diversified Financial Services |
13,935,165 |
||||||||||
|
Insurance — 11.8% |
|||||||||||
|
American Financial Group Inc. |
44,650 |
4,042,164 |
|||||||||
|
Brown & Brown Inc. |
134,000 |
3,693,040 |
|||||||||
|
Chubb Limited |
52,500 |
6,781,950 |
|||||||||
|
Hanover Insurance Group Inc. |
40,000 |
4,670,800 |
|||||||||
|
Marsh & McLennan Cos Inc. |
68,000 |
5,423,000 |
|||||||||
|
RenaissanceRe Holdings Ltd |
13,000 |
1,738,100 |
|||||||||
|
Total Insurance |
26,349,054 |
||||||||||
|
IT Services — 11.8% |
|||||||||||
|
Black Knight Inc. |
67,000 |
3,019,020 |
* |
||||||||
|
Fidelity National Information Services Inc. |
27,000 |
2,768,850 |
|||||||||
|
Fiserv Inc. |
43,680 |
3,210,043 |
* |
||||||||
|
Global Payments Inc. |
45,699 |
4,712,938 |
|||||||||
|
I3 Verticals Inc. |
110,480 |
2,662,568 |
* |
||||||||
|
Visa Inc., Class A Shares |
54,400 |
7,177,536 |
|||||||||
|
Worldpay Inc. |
35,000 |
2,675,050 |
* |
||||||||
|
Total IT Services |
26,226,005 |
||||||||||
|
Professional Services — 0.8% |
|||||||||||
|
Verisk Analytics Inc., Class A Shares |
15,500 |
1,690,120 |
* |
||||||||
|
Total Professional Services |
1,690,120 |
||||||||||
|
Real Estate Investment Trust (REITs) — 4.1% |
|||||||||||
|
Crown Castle International Corp. |
49,000 |
5,322,870 |
|||||||||
|
Simon Property Group LP |
23,500 |
3,947,765 |
|||||||||
|
Total Real Estate Investment Trust (REITs) |
9,270,635 |
||||||||||
1919 Funds 2018 Annual Report
9
Schedule of investments (cont'd)
December 31, 2018
1919 Financial Services Fund
|
Security |
Shares |
Value |
|||||||||||||
|
Thrifts & Mortgage Finance — 4.7% |
|||||||||||||||
|
Bridgewater Bancshares Inc. |
165,000 |
$ |
1,740,750 |
* |
|||||||||||
|
FS Bancorp Inc. |
17,000 |
728,960 |
|||||||||||||
|
Merchants Bancorp/IN |
90,000 |
1,796,400 |
|||||||||||||
|
Riverview Bancorp Inc. |
125,000 |
910,000 |
|||||||||||||
|
Territorial Bancorp Inc. |
65,000 |
1,688,700 |
|||||||||||||
|
WSFS Financial Corp. |
92,803 |
3,518,162 |
|||||||||||||
|
Total Thrifts & Mortgage Finance |
10,382,972 |
||||||||||||||
|
Total Common Stocks (Cost — $172,993,465) |
219,185,179 |
||||||||||||||
|
Rate |
|||||||||||||||
|
Short-Term Investment — 1.8% |
|||||||||||||||
|
Fidelity Investments Money Market — Government Portfolio — Class I |
2.250 |
% |
4,082,804 |
4,082,804 |
(a) |
||||||||||
|
Total Short-Term Investment (Cost — $4,082,804) |
4,082,804 |
||||||||||||||
|
Total Investments — 100.3% (Cost — $177,076,269) |
223,267,983 |
||||||||||||||
|
Liabilities in Excess of Other Assets — (0.3)% |
(758,541 |
) |
|||||||||||||
|
Total Net Assets — 100.0% |
$ |
222,509,442 |
|||||||||||||
Notes:
* Non-income producing security
(a) The rate reported is the annualized seven-day yield at period end.
The Accompanying Notes are an Integral Part of these Financial Statements.
1919 Funds 2018 Annual Report
10
1919 Financial Services Fund
Statement of assets and liabilities
December 31, 2018
|
Assets: |
|||||||
|
Investments in securities at value (cost $177,076,269) |
$ |
223,267,983 |
|||||
|
Cash |
8,580 |
||||||
|
Foreign currency at value (cost $17,785) |
17,091 |
||||||
|
Receivable for Fund shares sold |
724,705 |
||||||
|
Dividends and interest receivable |
145,130 |
||||||
|
Prepaid expenses |
27,946 |
||||||
|
Total Assets |
224,191,435 |
||||||
|
Liabilities: |
|||||||
|
Payable for Fund shares repurchased |
975,448 |
||||||
|
Advisory fees payable |
161,539 |
||||||
|
Distribution fees payable |
375,796 |
||||||
|
Accrued other expenses |
169,210 |
||||||
|
Total Liabilities |
1,681,993 |
||||||
|
Net Assets |
$ |
222,509,442 |
|||||
|
Components of Net Assets: |
|||||||
|
Paid-in capital |
$ |
176,307,111 |
|||||
|
Total distributable earnings |
46,202,331 |
||||||
|
Net Assets |
$ |
222,509,442 |
|||||
|
Class A: |
|||||||
|
Net Assets |
$ |
71,081,807 |
|||||
|
Shares Issued and Outstanding |
3,122,122 |
||||||
|
Net Asset Value and Redemption Price |
$ |
22.77 |
|||||
|
Maximum Public Offering Price (based on maximum initial sales charge of 5.75%) |
$ |
24.16 |
|||||
|
Class C: |
|||||||
|
Net Assets |
$ |
46,763,494 |
|||||
|
Shares Issued and Outstanding |
2,239,176 |
||||||
|
Net Asset Value, Redemption Price* and Offering Price Per Share |
$ |
20.88 |
|||||
|
Class I: |
|||||||
|
Net Assets |
$ |
104,664,141 |
|||||
|
Shares Issued and Outstanding |
4,554,058 |
||||||
|
Net Asset Value, Redemption Price and Offering Price Per Share |
$ |
22.98 |
|||||
* Redemption price per share of Class C shares is NAV reduced by a 1.00% CDSC if shares are redeemed within one year of purchase. (See Note 3).
The Accompanying Notes are an Integral Part of these Financial Statements.
1919 Funds 2018 Annual Report
11
1919 Financial Services Fund
Statement of operations
For the Year Ended December 31, 2018
|
Investment Income: |
|||||||
|
Dividend income |
$ |
4,197,702 |
|||||
|
Investment interest income |
99,870 |
||||||
|
Total Investment Income |
4,297,572 |
||||||
|
Expenses: |
|||||||
|
Advisory fees (Note 3) |
2,238,471 |
||||||
|
Distribution fees (Note 6) |
854,403 |
||||||
|
Transfer agent fees and expenses (Note 3 & Note 6) |
393,119 |
||||||
|
Administration and fund accounting fees (Note 3) |
159,084 |
||||||
|
Shareholder reporting fees |
56,783 |
||||||
|
Registration fees |
53,374 |
||||||
|
Custody fees (Note 3) |
25,980 |
||||||
|
Audit fees |
15,000 |
||||||
|
Legal fees |
13,075 |
||||||
|
Trustees' fees (Note 3) |
11,796 |
||||||
|
Miscellaneous |
9,495 |
||||||
|
Compliance fees (Note 3) |
6,287 |
||||||
|
Insurance fees |
5,195 |
||||||
|
Total Expenses |
3,842,062 |
||||||
|
Net investment Income |
455,510 |
||||||
|
Realized and Unrealized Gain (Loss) on Investments and Foreign Currency |
|||||||
|
Net realized gain on investments |
3,607,323 |
||||||
|
Net change in unrealized appreciation/depreciation on: |
|||||||
|
Investments |
(47,289,426 |
) |
|||||
|
Foreign currency |
(1,471 |
) |
|||||
|
Translation of assets and liabilities denominated in foreign currency |
(1,062 |
) |
|||||
|
Net Change in Unrealized Appreciation/Depreciation |
(47,291,959 |
) |
|||||
|
Net Realized and Unrealized Loss on Investments |
(43,684,636 |
) |
|||||
|
Net Decrease in Net Assets Resulting from Operations |
$ |
(43,229,126 |
) |
||||
The Accompanying Notes are an Integral Part of these Financial Statements.
1919 Funds 2018 Annual Report
12
1919 Financial Services Fund
Statements of changes in net assets
|
For the year ended December 31, |
2018 |
2017 |
|||||||||
|
Increase (Decrease) in Net Assets from: Operations: |
|||||||||||
|
Net investment income |
$ |
455,510 |
$ |
183,450 |
|||||||
|
Net realized gain (loss) |
3,607,323 |
(62,823 |
) |
||||||||
|
Net change in unrealized appreciation/depreciation |
(47,291,959 |
) |
29,421,001 |
||||||||
|
Net Increase (Decrease) in Net Assets Resulting From Operations |
(43,229,126 |
) |
29,541,628 |
||||||||
|
Distributions to Shareholders: |
|||||||||||
|
Class A |
(1,185,165 |
) |
— |
||||||||
|
Class C |
(822,722 |
) |
— |
||||||||
|
Class I |
(2,040,861 |
) |
(151,413 |
) |
|||||||
|
Total Distributions to Shareholders |
(4,048,748 |
) |
(151,413 |
)* |
|||||||
|
Capital Transactions: |
|||||||||||
|
Net proceeds from shares sold |
138,066,099 |
104,206,746 |
|||||||||
|
Reinvestment of distributions |
3,778,413 |
143,794 |
|||||||||
|
Cost of shares repurchased |
(125,012,334 |
) |
(53,007,703 |
) |
|||||||
|
Net Increase in Net Assets From Capital Transactions |
16,832,178 |
51,342,837 |
|||||||||
|
Total Increase (Decrease) in Net Assets |
(30,445,696 |
) |
80,733,052 |
||||||||
|
Net Assets: |
|||||||||||
|
Beginning of year |
252,955,138 |
172,222,086 |
|||||||||
|
End of year |
$ |
222,509,442 |
$ |
252,955,138 |
** |
||||||
* Distribution is from net investment income.
** Includes undistributed net investment income of $6,843.
The Accompanying Notes are an Integral Part of these Financial Statements.
1919 Funds 2018 Annual Report
13
1919 Financial Services Fund
Financial highlights
For a share of beneficial interest outstanding through each period ended December 31, unless otherwise noted:
|
Class A Shares |
2018 |
2017 |
2016 |
2015 |
20141 |
20142 |
|||||||||||||||||||||
|
Net asset value, beginning of period |
$ |
27.16 |
$ |
23.69 |
$ |
19.28 |
$ |
19.40 |
$ |
18.63 |
$ |
15.13 |
|||||||||||||||
|
Income from investment operations: |
|||||||||||||||||||||||||||
|
Net investment income3 |
0.05 |
0.04 |
0.08 |
0.11 |
0.06 |
0.05 |
|||||||||||||||||||||
|
Net realized and unrealized gain (loss) on investments |
(4.08 |
) |
3.43 |
5.02 |
1.17 |
1.21 |
3.47 |
||||||||||||||||||||
|
Total income (loss) from investment operations |
(4.03 |
) |
3.47 |
5.10 |
1.28 |
1.27 |
3.52 |
||||||||||||||||||||
|
Less distributions: |
|||||||||||||||||||||||||||
|
From net investment income |
(0.01 |
) |
— |
(0.06 |
) |
(0.09 |
) |
(0.07 |
) |
(0.02 |
) |
||||||||||||||||
|
From net realized gain on investments |
(0.35 |
) |
— |
(0.63 |
) |
(1.31 |
) |
(0.43 |
) |
— |
|||||||||||||||||
|
Total distributions |
(0.36 |
) |
0.00 |
(0.69 |
) |
(1.40 |
) |
(0.50 |
) |
(0.02 |
) |
||||||||||||||||
|
Net asset value, end of period |
$ |
22.77 |
$ |
27.16 |
$ |
23.69 |
$ |
19.28 |
$ |
19.40 |
$ |
18.63 |
|||||||||||||||
|
Total return4 |
-14.93 |
% |
14.65 |
% |
26.46 |
% |
6.53 |
% |
6.81 |
%5 |
23.26 |
% |
|||||||||||||||
|
Supplemental data and ratios: |
|||||||||||||||||||||||||||
|
Net assets, end of period (in thousands) |
$ |
71,082 |
$ |
118,310 |
$ |
92,948 |
$ |
70,630 |
$ |
64,795 |
$ |
77,220 |
|||||||||||||||
|
Ratios to average net assets Gross expenses |
1.33 |
% |
1.37 |
% |
1.46 |
% |
1.45 |
% |
1.44 |
%6 |
1.46 |
% |
|||||||||||||||
|
Net expenses8 |
1.33 |
1.37 |
1.469 |
1.45 |
1.446,7,9 |
1.467 |
|||||||||||||||||||||
|
Net investment income |
0.19 |
0.16 |
0.43 |
0.54 |
0.446 |
0.27 |
|||||||||||||||||||||
|
Portfolio turnover rate |
18 |
% |
4 |
% |
8 |
% |
20 |
% |
11 |
%5 |
14 |
% |
|||||||||||||||
1 For the period ended April 1, 2014 through December 31, 2014. See Note 1.
2 For the year ended March 31.
3 Per share amounts have been calculated using the average shares method.
4 Performance figures, exclusive of sales charges, may reflect compensating balance arrangements, fee waivers and/or expense reimbursements. In the absence of compensating balance arrangements, fee waivers and/or expense reimbursements, the total return would have been lower. Past performance is no guarantee of future results.
5 Not annualized.
6 Annualized.
7 The impact of compensating balance arrangements, if any, was less than 0.01%.
8 Effective April 30, 2017, the advisor agreed to limit the ratio of expenses, other than brokerage, interest, taxes, extraordinary expenses and acquired fund fees and expenses, to 1.50% of the average net assets of Class A shares. This expense limitation arrangement cannot be terminated prior to April 30, 2020 without the Board of Trustees' consent. Prior to April 30, 2017, this limitation was 1.46%. See Note 3.
9 Reflects fee waivers and/or expense reimbursements.
The Accompanying Notes are an Integral Part of these Financial Statements.
1919 Funds 2018 Annual Report
14
For a share of beneficial interest outstanding through each period ended December 31, unless otherwise noted:
|
Class C Shares |
2018 |
2017 |
2016 |
2015 |
20141 |
20142 |
|||||||||||||||||||||
|
Net asset value, beginning of period |
$ |
25.12 |
$ |
22.07 |
$ |
18.06 |
$ |
18.30 |
$ |
17.63 |
$ |
14.40 |
|||||||||||||||
|
Income from investment operations: |
|||||||||||||||||||||||||||
|
Net investment loss3 |
(0.13 |
) |
(0.13 |
) |
(0.04 |
) |
(0.03 |
) |
(0.03 |
) |
(0.06 |
) |
|||||||||||||||
|
Net realized and unrealized gain (loss) on investments |
(3.76 |
) |
3.18 |
4.68 |
1.10 |
1.14 |
3.29 |
||||||||||||||||||||
|
Total income (loss) from investment operations |
(3.89 |
) |
3.05 |
4.64 |
1.07 |
1.11 |
3.23 |
||||||||||||||||||||
|
Less distributions: |
|||||||||||||||||||||||||||
|
From net investment income |
— |
— |
— |
— |
(0.01 |
) |
— |
||||||||||||||||||||
|
From net realized gain on investments |
(0.35 |
) |
— |
(0.63 |
) |
(1.31 |
) |
(0.43 |
) |
— |
|||||||||||||||||
|
Total distributions |
(0.35 |
) |
0.00 |
(0.63 |
) |
(1.31 |
) |
(0.44 |
) |
0.00 |
|||||||||||||||||
|
Net asset value, end of period |
$ |
20.88 |
$ |
25.12 |
$ |
22.07 |
$ |
18.06 |
$ |
18.30 |
$ |
17.63 |
|||||||||||||||
|
Total return4 |
-15.57 |
% |
13.82 |
% |
25.67 |
% |
5.77 |
% |
6.28 |
%5 |
22.43 |
% |
|||||||||||||||
|
Supplemental data and ratios: |
|||||||||||||||||||||||||||
|
Net assets, end of period (in thousands) |
$ |
46,763 |
$ |
53,667 |
$ |
37,271 |
$ |
26,919 |
$ |
25,498 |
$ |
26,484 |
|||||||||||||||
|
Ratios to average net assets Gross expenses |
2.05 |
% |
2.08 |
% |
2.19 |
% |
2.22 |
% |
2.14 |
%8 |
2.13 |
% |
|||||||||||||||
|
Net expenses7 |
2.05 |
2.08 |
2.139 |
2.139 |
2.116,8,9 |
2.136 |
|||||||||||||||||||||
|
Net investment loss |
(0.52 |
) |
(0.55 |
) |
(0.24 |
) |
(0.15 |
) |
(0.20 |
)8 |
(0.40 |
) |
|||||||||||||||
|
Portfolio turnover rate |
18 |
% |
4 |
% |
8 |
% |
20 |
% |
11 |
%5 |
14 |
% |
|||||||||||||||
1 For the period ended April 1, 2014 through December 31, 2014. See Note 1.
2 For the year ended March 31.
3 Per share amounts have been calculated using the average shares method.
4 Performance figures, exclusive of CDSC, may reflect compensating balance arrangements, fee waivers and/or expense reimbursements. In the absence of compensating balance arrangements, fee waivers and/or expense reimbursements, the total return would have been lower. Past performance is no guarantee of future results.
5 Not annualized.
6 The impact of compensating balance arrangements, if any, was less than 0.01%.
7 Effective April 30, 2017, the advisor agreed to limit the ratio of expenses, other than brokerage, interest, taxes, extraordinary expenses and acquired fund fees and expenses, to 2.25% of the average net assets of Class C shares. This expense limitation arrangement cannot be terminated prior to April 30, 2020 without the Board of Trustees' consent. Prior to April 30, 2017, this limitation was 2.13%. See Note 3.
8 Annualized.
9 Reflects fee waivers and/or expense reimbursements.
The Accompanying Notes are an Integral Part of these Financial Statements.
1919 Funds 2018 Annual Report
15
1919 Financial Services Fund
Financial highlights (cont'd)
For a share of beneficial interest outstanding through each period ended December 31, unless otherwise noted:
|
Class I Shares |
2018 |
2017 |
2016 |
2015 |
20141 |
20142 |
|||||||||||||||||||||
|
Net asset value, beginning of period |
$ |
27.41 |
$ |
23.90 |
$ |
19.42 |
$ |
19.50 |
$ |
18.71 |
$ |
15.17 |
|||||||||||||||
|
Income from investment operations: |
|||||||||||||||||||||||||||
|
Net investment income3 |
0.14 |
0.11 |
0.17 |
0.19 |
0.12 |
0.12 |
|||||||||||||||||||||
|
Net realized and unrealized gain (loss) on investments |
(4.14 |
) |
3.45 |
5.08 |
1.18 |
1.21 |
3.49 |
||||||||||||||||||||
|
Total income (loss) from investment operations |
(4.00 |
) |
3.56 |
5.25 |
1.37 |
1.33 |
3.61 |
||||||||||||||||||||
|
Less distributions: |
|||||||||||||||||||||||||||
|
From net investment income |
(0.08 |
) |
(0.05 |
) |
(0.14 |
) |
(0.14 |
) |
(0.11 |
) |
(0.07 |
) |
|||||||||||||||
|
From net realized gain on investments |
(0.35 |
) |
— |
(0.63 |
) |
(1.31 |
) |
(0.43 |
) |
— |
|||||||||||||||||
|
Total distributions |
(0.43 |
) |
(0.05 |
) |
(0.77 |
) |
(1.45 |
) |
(0.54 |
) |
(0.07 |
) |
|||||||||||||||
|
Net asset value, end of period |
$ |
22.98 |
$ |
27.41 |
$ |
23.90 |
$ |
19.42 |
$ |
19.50 |
$ |
18.71 |
|||||||||||||||
|
Total return4 |
-14.72 |
% |
14.95 |
%5 |
27.01 |
% |
6.93 |
% |
7.10 |
%6 |
23.75 |
% |
|||||||||||||||
|
Supplemental data and ratios: |
|||||||||||||||||||||||||||
|
Net assets, end of period (in thousands) |
$ |
104,664 |
$ |
80,979 |
$ |
42,003 |
$ |
24,432 |
$ |
24,873 |
$ |
25,360 |
|||||||||||||||
|
Ratios to average net assets Gross expenses |
1.06 |
% |
1.11 |
% |
1.18 |
% |
1.20 |
% |
1.10 |
%9 |
1.05 |
% |
|||||||||||||||
|
Net expenses8 |
1.06 |
1.1010 |
1.0510 |
1.0510 |
1.067,9,10 |
1.057 |
|||||||||||||||||||||
|
Net investment income |
0.49 |
0.44 |
0.84 |
0.93 |
0.849 |
0.68 |
|||||||||||||||||||||
|
Portfolio turnover rate |
18 |
% |
4 |
% |
8 |
% |
20 |
% |
11 |
%6 |
14 |
% |
|||||||||||||||
1 For the period ended April 1, 2014 through December 31, 2014. See Note 1.
2 For the year ended March 31.
3 Per share amounts have been calculated using the average shares method.
4 Performance figures may reflect compensating balance arrangements, fee waivers and/or expense reimbursements. In the absence of compensating balance arrangements, fee waivers and/or expense reimbursements, the total return would have been lower. Past performance is no guarantee of future results.
5 Total return reflects adjustments to conform to generally accounting principles.
6 Not Annualized.
7 The impact of compensating balance arrangements, if any, was less than 0.01%.
8 Effective April 30, 2017, the advisor agreed to limit the ratio of expenses, other than brokerage, interest, taxes, extraordinary expenses and acquired fund fees and expenses, to 1.25% of the average net assets of Class I shares. See Note 3. This expense limitation arrangement cannot be terminated prior to April 30, 2020 without the Board of Trustees' consent. Prior to April 30, 2017, this limitation was 1.05%.
9 Annualized.
10 Reflects fee waivers and/or expense reimbursements.
The Accompanying Notes are an Integral Part of these Financial Statements.
1919 Funds 2018 Annual Report
16
1919 Maryland Tax-Free Income Fund
Letter to shareholders (unaudited)
Dear Shareholder,
Municipal bonds provided sanctuary from the late-year chaos within the financial markets, serving the role of safe-haven along with Treasury bonds for beleaguered investors. The Bloomberg Barclays Municipal Bond Index, the 1919 Maryland Tax-Free Fund's primary benchmark and a proxy for the entire municipal market, returned a sturdy 1.69% during the volatile fourth quarter. The flight-to-quality rally pushed the index into the black for the year, as calendar year returns were 1.28%. Performance for the 1919 Maryland Tax-Free Fund were competitive versus the broad benchmark's returns, as the I-shares posted a gain of 1.26% for the year ending December 31, 2018. In addition, our continued defensive posture and commitment to a short-duration portfolio served shareholders well versus other Maryland-specific funds. The 1919 Fund outperformed its Lipper peer group by 43 basis points over the past twelve months, finishing 7th out of 22 Maryland funds within its universe. As of 12/31/18, Class I shares had an Overall Morningstar Rating of 5 stars among 139 U.S. Municipal Single State Intermediate Funds based upon risk-adjusted returns derived from a weighted average of the performance figures associated with 3-, 5- and 10-year (if applicable) Morningstar Ratings metrics.
The path of Treasury yields usually sets the course for other investment grade fixed income securities, municipal bonds included. Therefore, it is not unexpected that municipal yields moved higher in 2018 despite the strong rally late in the year. The Federal Reserve, now chaired by Trump nominee Jerome Powell, maintained the strategy of previous Fed Chairman Janet Yellen by raising overnight interest rates once a quarter, which pressured short maturity yields higher. Concurrently, the Committee remained committed to reducing the amount of longer maturity Treasury bonds the Fed owned on its balance sheet. These bonds were bought during the credit crisis in an attempt to keep borrowing costs low and stimulate the economy. Not surprisingly, the Fed's reduced demand for these securities forced longer maturity yields higher as well.
However, within the backdrop of higher Treasury yields, municipal bonds actually benefitted from a healthy technical environment. Despite passage of a tax cut that on the surface should reduce the value of a tax-free income stream, demand for
1919 Funds 2018 Annual Report
17
1919 Maryland Tax-Free Income Fund
Letter to shareholders (unaudited) (cont'd)
tax-free income remained resilient for most of the year. We believe the limitation of the deductibility of state and local taxes (i.e. SALT) for high income residents played a role in this demand dynamic, creating the possibility of a higher tax bill despite lower marginal tax rates. Traditional and dependable tax havens such as municipal bonds were beneficiaries as wealthy tax payers await the result of this April's tax season before deciding how to navigate the current ambiguity of the law. We expect investors' worries will prove valid, particularly within wealthy, high-tax states such as Maryland, where the new $10,000 limit on SALT deductions in most cases will be reached quickly, resulting in a higher tax bill despite cosmetically lower marginal tax rates. Maryland tax-free bonds should benefit accordingly.
As demand remains firm, we are somewhat optimistic that the supply of newly issued bonds will rebound versus the pace seen in 2018. Nationally, according to The Bond Buyer, municipal issuance was down 24.4% versus the prior year, with Maryland showing an even steeper 48% drop in the volume of tax-free bonds sold. Much of the volume shortfall arose from municipalities being prohibited by the Tax Reform Act from selling new bonds to advance-refund outstanding, higher-yielding debt. This popular refunding technique made up nearly half of new issuance during the historically low interest rate environment of the past few years, so its absence skews the yearly comparison. In addition, the 2017 supply data was bloated as a record amount of bonds were sold in December of 2017 prior to the uncertainties of the new tax laws effective in 2018. However, looking deeper into the makeup of the 2018 supply picture, "new money"
issuance used for capital expenditures surprisingly was a touch higher. We expect that trend will continue, primarily because we are optimistic that a bipartisan infrastructure bill seems one of the few items likely to pass within the divided government following the mid-term elections.
As we head into what we believe is a more balanced technical backdrop with supply better aligned with demand, we will continue to extend maturities where appropriate to take advantage of the higher, more attractive interest rate environment. While it is possible that yields move higher from here, it seems the Federal Reserve's previous tightening moves successfully cooled the prospects for an overheating in the economy, and more importantly eased expectations for future inflation. The prevailing volatility within other risk-based assets, primarily equities, should likewise buoy the prospects of conservative, high-quality assets such as tax-free bonds. While we forecast the economy to slow from the sturdy pace of mid-2018, we do not forecast a recession this year, so credit trends within the municipal space should remain healthy. That being said, we will employ our credit resources to manage risk accordingly, particularly with regards to specific pension problems, as well as isolated pockets of weakness should property values and subsequent property tax revenues suffer as an unintended and unwelcomed consequence of the SALT deduction limitation.
Sincerely,

R. Scott Pierce, CFA
Portfolio Manager
1919 Investment Counsel, LLC
1919 Funds 2018 Annual Report
18
Basis point is a unit equal to 1/100th of 1% and is used to denote the change in a financial instrument.
Bloomberg Barclays Municipal Bond Index is an unmanaged index that is considered representative of the broad market for investment grade, tax-exempt bonds with a maturity of at least one year. One cannot invest in an index.
Duration is a measure of the sensitivity of the price, the value of principal, of a fixed-income investment to a change in interest rates and is expressed as a number of years.
Investment grade is a rating that indicates that a municipal or corporate bond has a relatively low risk of default.
The Morningstar RatingTM for funds, or "star rating", is calculated for managed products (including mutual funds, variable annuity and variable life subaccounts, exchange-traded funds, closed-end funds, and separate accounts) with at least a three-year history without adjustment for sales load. Exchange-traded funds and open-ended mutual funds are considered a single population for comparative purposes. It is calculated based on a Morningstar Risk-Adjusted Return measure that accounts for variation in a managed product's monthly excess performance, placing more emphasis on downward variations and rewarding consistent performance. The top 10% of products in each product category receive 5 stars, the next 22.5% receive 4 stars, the next 35% receive 3 stars, the next 22.5% receive 2 stars, and the bottom 10% receive 1 star. The Overall Morningstar RatingTM for a managed product is derived from a weighted average of the performance figures
associated with its three-, five-, and 10-year (if applicable) Morningstar RatingTM metrics. The weights are: 100% three-year rating for 36-59 months of total returns, 60% five-year rating/40% three-year rating for 60-119 months of total returns, and 50% 10-year rating/30% five-year rating/20% three-year rating for 120 or more months of total returns. While the 10-year overall star rating formula seems to give the most weight to the 10-year period, the most recent three-year period actually has the greatest impact because it is included in all three rating periods. Class I shares of the Fund were rated against 139, 137, and 116 U.S. Municipal Single State Intermediate Funds over the 3-, 5- and 10-year periods, respectively. With respect to these funds, Class I shares of the Fund received Morningstar Ratings of 4, 4, and 5 as of December 31, 2018. Ratings shown are for the highest and lowest rated share classes only, when available. Other share classes have different expense structures and performance characteristics. Classes have a common portfolio. ©2019 Morningstar Inc. All Rights Reserved. The information contained herein (1) is proprietary to Morningstar (2) may not be copied or distributed and (3) is not warranted to be accurate, complete or timely. Neither Morningstar nor its content providers are responsible for any damages or losses arising from any use of this information. Past performance is no guarantee of future results.
Opinions expressed herein are as of 12/31/18 and are subject to change at any time, are not a guaranteed and should not be considered investment advice.
1919 Funds 2018 Annual Report
19
1919 Maryland Tax-Free Income Fund
Letter to shareholders (unaudited) (cont'd)
Fund holdings and sector allocations are subject to change and are not a recommendation to buy or sell any security. Please refer to the Schedule of Investments for a complete list of Fund holdings.
This report has been prepared for shareholders and may be distributed to others if preceded or accompanied by a current prospectus.
Mutual fund investing involves risk; Principal loss is possible. Bonds are subject to a variety of risks, including interest rate, credit and inflation risks. As interest rates rise, bond prices fall, reducing the value of a fixed-income investment. Municipal securities purchased by the Fund may be adversely affected by changes in the financial condition of municipal issuers and insurers, regulatory and political developments, uncertainties and public perceptions, and other factors. The Fund is non-diversified, meaning it concentrates its assets in fewer individual holdings than a diversified fund, specifically in the State of Maryland issues. The Fund is susceptible to adverse economic, political, tax, or regulatory changes specific to Maryland, which may magnify other risks and make the Fund more volatile than a municipal bond fund that invests in more than one state. Income from tax-exempt funds may become subject to state and local taxes and a portion of income may be subject to the Federal Alternative minimum tax for certain investors. Please see the Fund's prospectus for a more complete discussion of these and other risks, and the Fund's investment strategies.
Nothing contained in this communication constitutes tax or investment advice.
Investors must consult their tax advisor for advice and information concerning their particular situation.
1919 Funds are distributed by Quasar Distributors, LLC.
1919 Funds 2018 Annual Report
20
Fund performance (unaudited)
Value of $10,000 Investment

This chart illustrates the performance of a hypothetical $10,000 investment in the Fund's Class A shares over ten years. Assumes the deduction of the maximum initial sales charge of 4.25% at the time of investment and the reinvestment of dividends and capital gains, but does not reflect the effect of any other applicable sales charge or redemption fees. This chart does not imply any future performance. The performance of the Fund's other classes may be greater or less than the Class A shares' performance indicated on this chart, depending on whether greater or lesser sales charges and fees were incurred by shareholders investing in the other classes.
1919 Funds 2018 Annual Report
21
Fund performance (unaudited) (cont'd)
Total Returns* as of December 31, 2018
|
1 Year |
5 Year |
10 Year |
Since Inception** |
||||||||||||||||
|
1919 Maryland Tax-Free Income Fund |
|||||||||||||||||||
|
With Sales Charges† |
|||||||||||||||||||
|
Class A |
-3.25 |
% |
1.49 |
% |
3.58 |
% |
N/A |
||||||||||||
|
Class C |
-0.49 |
1.81 |
N/A |
2.82 |
% |
||||||||||||||
|
Without Sales Charges |
|||||||||||||||||||
|
Class A |
1.04 |
2.37 |
4.03 |
N/A |
|||||||||||||||
|
Class C |
0.49 |
1.81 |
N/A |
2.82 |
|||||||||||||||
|
Class I |
1.26 |
2.52 |
N/A |
N/A |
|||||||||||||||
|
Bloomberg Barclays Municipal Bond Index(i) |
1.28 |
3.82 |
4.85 |
4.41 |
|||||||||||||||
* Returns over one year are annualized.
** The Inception date for Class C was February 5, 2009.
† Class A Shares have a maximum initial sales charge of 4.25% and Class C Shares have a contingent deferred sales charge (CDSC) of 1.00% for shares redeemed within one year of purchase.
As of the Fund's current prospectus dated April 30, 2018, the total gross annual operating expense ratios for Class A, Class C and Class I were 0.97%, 1.54% and 0.88%, respectively. The total net annual operating expense ratios for Class A, Class C and Class I were 0.75%(ii), 1.30%(ii) and 0.60%(ii), respectively. Actual expenses may be higher. For example, expenses may be higher than those shown if average net assets decrease. Net assets are more likely to decrease and Fund expense ratios are more likely to increase when markets are volatile.
All figures represent past performance and are not a guarantee of future results. Investment return and principal value of an investment will fluctuate so that an investor's shares, when redeemed, may be worth more or less than their original cost. Fund returns assume the reinvestment of all distributions, at net asset value and the deduction of all Fund expenses. Total returns do not reflect the deduction of taxes that a shareholder would pay on Fund distributions or the redemption of Fund shares. Performance figures may reflect fee waivers and/or expense reimbursements. In the absence of fee waivers and/or expense reimbursements, the total return would have been lower. Current performance of the Fund may be lower or higher than the performance quoted. Performance data current to the most recent month end may be obtained by calling 1-844-828-1919.
As of November 7, 2014, the Fund assumed the performance, financial and other historic information of the Legg Mason Investment Counsel Maryland Tax-Free Income Trust. Fund holdings and sector allocations are subject to change at any time and should not be considered a recommendation to buy or sell any security. Please refer to the Schedule of Investments in this report for a complete list of Fund holdings.
(i) The Bloomberg Barclays Municipal Bond Index is a market value weighted index of investment grade municipal bonds with maturities of one year or more. The Index was previously named the Barclays Municipal Bond Index.
(ii) The Advisor has contractually agreed to waive fees and reimburse operating expenses through April 30, 2020.
The Indices are unmanaged and are not subject to the same management and trading expenses as a mutual fund. Please note that an investor cannot invest directly in an index.
1919 Funds 2018 Annual Report
22
Fund expenses (unaudited)
Example
As a shareholder of the Fund, you may incur two types of costs: (1) transaction costs, including front-end and back-end sales charges (loads) on purchase payments; and (2) ongoing costs, including management fees; service and/or distribution (12b-1) fees; and other Fund expenses. This example is intended to help you understand your ongoing costs (in dollars) of investing in the Fund and to compare these costs with the ongoing costs of investing in other mutual funds.
This example is based on an investment of $1,000 invested on July 1, 2018 and held for the six months ended December 31, 2018. The hypothetical example is based on a six-month period ended December 31, 2018.
Actual expenses
The table below titled "Based on Actual Total Return" provides information about actual account values and actual expenses. You may use the information provided in this table, together with the amount you invested, to estimate the expenses that you paid over the period. To estimate the expenses you paid on your account, divide your ending account value by $1,000 (for example, an $8,600 ending account value divided by $1,000 = 8.6), then multiply the
result by the number under the heading entitled "Expenses Paid During the Period".
Hypothetical example for comparison purposes
The table below titled "Based on Hypothetical Total Return" provides information about hypothetical account values and hypothetical expenses based on the actual expense ratio and an assumed rate of return of 5.00% per year before expenses, which is not the Fund's actual return. The hypothetical account values and expenses may not be used to estimate the actual ending account balance or expenses you paid for the period. You may use the information provided in this table to compare the ongoing costs of investing in the Fund and other funds. To do so, compare the 5.00% hypothetical example relating to the Fund with the 5.00% hypothetical examples that appear in the shareholder reports of the other funds.
Please note that the expenses shown in the table below are meant to highlight your ongoing costs only and do not reflect any transactional costs. Therefore, the table is useful in comparing ongoing costs only, and will not help you determine the relative total costs of owning different funds. In addition, if these transaction costs were included, your costs would have been higher.
Based on actual total return1
|
Actual Total Return2 |
Beginning Account Value |
Ending Account Value |
Annualized Expense Ratio |
Expenses Paid During the Period3 |
|||||||||||||||||||
|
Class A |
1.16 |
% |
$ |
1,000.00 |
$ |
1,011.60 |
0.75 |
% |
$ |
3.80 |
|||||||||||||
|
Class C |
0.88 |
1,000.00 |
1,008.80 |
1.30 |
6.58 |
||||||||||||||||||
|
Class I |
1.23 |
1,000.00 |
1,012.30 |
0.60 |
3.04 |
||||||||||||||||||
Based on hypothetical total return1
|
Hypothetical Annualized Total Return |
Beginning Account Value |
Ending Account Value |
Annualized Expense Ratio |
Expenses Paid During the Period3 |
|||||||||||||||||||
|
Class A |
5.00 |
% |
$ |
1,000.00 |
$ |
1,021.42 |
0.75 |
% |
$ |
3.82 |
|||||||||||||
|
Class C |
5.00 |
1,000.00 |
1,018.65 |
1.30 |
6.61 |
||||||||||||||||||
|
Class I |
5.00 |
1,000.00 |
1,022.18 |
0.60 |
3.06 |
||||||||||||||||||
1 The six months ended December 31, 2018.
2 Assumes the reinvestment of all distributions at net asset value and does not reflect the deduction of the applicable sales charge with respect to Class A shares or the applicable contingent deferred sales charge ("CDSC") with respect to Class C shares. Total return is not annualized, as it may not be representative of the total return for the year. Performance figures may reflect compensating balance arrangements, fee waivers and/or expense reimbursements. In the absence of fee waivers and/or expense reimbursements, the total return would have been lower.
3 Expenses (net of fee waivers and/or expense reimbursements) are equal to each class' annualized expense ratio multiplied by the average account value over the period, multiplied by the number of days in the most recent fiscal half-year (184), then divided by 365.
1919 Funds 2018 Annual Report
23
Fund at a glance (unaudited)
Investment breakdown (%) as a percent of total investments

1919 Funds 2018 Annual Report
24
Schedule of investments
December 31, 2018
1919 Maryland Tax-Free Income Fund
|
Rate |
Maturity Date |
Face Amount |
Value |
||||||||||||||||
|
Municipal Bonds — 99.1% |
|||||||||||||||||||
|
Education — 16.6% |
|||||||||||||||||||
|
Maryland Stadium Authority |
5.000 |
% |
5/1/42 |
$ |
2,000,000 |
$ |
2,258,980 |
||||||||||||
|
Maryland State EDC, Student Housing Revenue Bonds: |
|||||||||||||||||||
|
Frostburg State University Project |
4.000 |
% |
10/1/19 |
500,000 |
505,925 |
||||||||||||||
|
Frostburg State University Project |
4.000 |
% |
10/1/20 |
500,000 |
512,625 |
||||||||||||||
|
Maryland Economic Development Corp. |
5.000 |
% |
7/1/36 |
250,000 |
271,795 |
||||||||||||||
|
Salisbury University Project |
5.000 |
% |
6/1/27 |
455,000 |
483,615 |
||||||||||||||
|
Senior Morgan State University Project |
5.000 |
% |
7/1/27 |
1,870,000 |
1,964,641 |
||||||||||||||
|
University of Maryland, College Park Projects |
5.000 |
% |
7/1/31 |
500,000 |
536,325 |
||||||||||||||
|
Maryland State Health & Higher EFA Revenue Bonds: |
|||||||||||||||||||
|
College of Notre Dame of Maryland |
4.000 |
% |
10/1/25 |
1,645,000 |
1,685,960 |
||||||||||||||
|
Good Samaritan Hospital of Maryland |
1.300 |
% |
4/1/35 |
3,400,000 |
3,400,000 |
(c) |
|||||||||||||
|
Johns Hopkins University |
5.000 |
% |
7/1/21 |
2,000,000 |
2,153,400 |
||||||||||||||
|
Maryland Institute College of Art |
4.000 |
% |
6/1/42 |
250,000 |
248,487 |
||||||||||||||
|
Total Education |
14,021,753 |
||||||||||||||||||
|
Health Care — 20.7% |
|||||||||||||||||||
|
County of Baltimore, MD, Oak Crest Village Inc. |
5.000 |
% |
1/1/30 |
495,000 |
555,717 |
||||||||||||||
|
County of Prince George's, MD, COPS |
3.000 |
% |
10/1/31 |
2,500,000 |
2,471,175 |
||||||||||||||
|
Maryland State Health & Higher EFA Revenue Bonds: |
|||||||||||||||||||
|
Adventist Rehabilitation Hospital |
5.500 |
% |
1/1/27 |
1,250,000 |
1,473,575 |
||||||||||||||
|
Anne Arundel Health System |
1.270 |
% |
7/1/43 |
600,000 |
600,000 |
(c) |
|||||||||||||
|
Carroll Hospital Center Inc. |
5.000 |
% |
7/1/21 |
1,005,000 |
1,081,058 |
||||||||||||||
|
Greater Baltimore Medical Center Inc. |
1.520 |
% |
7/1/25 |
800,000 |
800,000 |
(c) |
|||||||||||||
|
Helix Health Issue, AMBAC |
5.250 |
% |
8/15/38 |
3,000,000 |
3,557,220 |
||||||||||||||
|
James Lawrence Kernan Hospital |
5.000 |
% |
7/1/34 |
50,000 |
50,578 |
||||||||||||||
|
James Lawrence Kernan Hospital |
1.000 |
% |
7/1/41 |
600,000 |
600,000 |
(c) |
|||||||||||||
|
MedStar Health Obligated Group |
5.000 |
% |
5/15/42 |
2,000,000 |
2,194,580 |
||||||||||||||
|
Refunding, Mercy Ridge |
4.750 |
% |
7/1/34 |
3,200,000 |
3,203,296 |
||||||||||||||
|
The Johns Hopkins Hospital Issue |
7.000 |
% |
7/1/19 |
890,000 |
880,887 |
(a) |
|||||||||||||
|
Total Health Care |
17,468,086 |
||||||||||||||||||
|
Housing — 8.9% |
|||||||||||||||||||
|
Maryland Community Development Administration Local Government Infrastructure |
4.000 |
% |
6/1/47 |
1,000,000 |
1,017,960 |
||||||||||||||
|
Maryland State Community Development Administration, Department of Housing and Community Development: |
|||||||||||||||||||
|
Bolton North LP |
3.350 |
% |
9/15/34 |
1,000,000 |
981,960 |
||||||||||||||
|
Local Government Infrastructure, Senior Lien |
4.000 |
% |
6/1/30 |
4,485,000 |
4,527,204 |
||||||||||||||
|
Local Government Infrastructure, Subordinate Lien |
4.000 |
% |
6/1/30 |
1,000,000 |
1,015,080 |
||||||||||||||
|
Total Housing |
7,542,204 |
||||||||||||||||||
|
Industrial Revenue — 0.7% |
|||||||||||||||||||
|
Maryland EDC, EDR, Lutheran World Relief Inc. and Immigration and Refugee Service |
5.250 |
% |
4/1/29 |
565,000 |
566,435 |
||||||||||||||
|
Total Industrial Revenue |
566,435 |
||||||||||||||||||
1919 Funds 2018 Annual Report
25
Schedule of investments (cont'd)
December 31, 2018
1919 Maryland Tax-Free Income Fund
|
Rate |
Maturity Date |
Face Amount |
Value |
||||||||||||||||
|
Leasing — 1.3% |
|||||||||||||||||||
|
Montgomery County, MD, Lease Revenue, Metrorail Garage Project |
5.000 |
% |
6/1/24 |
$ |
1,000,000 |
$ |
1,071,230 |
||||||||||||
|
Total Leasing |
1,071,230 |
||||||||||||||||||
|
Local General Obligation — 14.3% |
|||||||||||||||||||
|
Anne Arundel County, Maryland, GO Bonds, Water & Sewer |
4.000 |
% |
4/1/27 |
1,150,000 |
1,230,040 |
||||||||||||||
|
Baltimore County, Maryland, GO Bonds |
4.000 |
% |
8/1/23 |
1,270,000 |
1,309,446 |
||||||||||||||
|
County of Baltimore, Maryland |
5.000 |
% |
3/1/30 |
1,000,000 |
1,188,370 |
||||||||||||||
|
County of Montgomery, Maryland |
0.980 |
% |
11/1/37 |
2,600,000 |
2,600,000 |
(c) |
|||||||||||||
|
Howard County, Maryland, GO Bonds, Consolidated Public Improvement Project and Refunding Bonds |
5.000 |
% |
8/15/19 |
1,000,000 |
1,019,950 |
||||||||||||||
|
Howard County, Maryland, GO Bonds, Consolidated Public Improvement Project and Refunding Bonds |
3.000 |
% |
2/15/29 |
3,000,000 |
3,020,790 |
||||||||||||||
|
State of Maryland |
4.000 |
% |
8/1/29 |
500,000 |
532,465 |
||||||||||||||
|
State of Maryland |
5.000 |
% |
3/15/31 |
1,000,000 |
1,185,910 |
||||||||||||||
|
Total Local General Obligation |
12,086,971 |
||||||||||||||||||
|
Pre-Refunded/Escrowed to Maturity (b) — 16.1% |
|||||||||||||||||||
|
City of Baltimore, Maryland, Mayor and City Council of Baltimore, Project and Refunding Revenue Bonds, Water Projects |
5.000 |
% |
7/1/24 |
3,800,000 |
4,237,228 |
||||||||||||||
|
Maryland State Department of Transportation, Consolidated Transportation Revenue Bonds |
5.000 |
% |
2/15/25 |
5,000,000 |
5,330,750 |
||||||||||||||
|
Maryland State Health & Higher EFA Revenue Bonds: |
|||||||||||||||||||
|
Anne Arundel Health System |
6.750 |
% |
7/1/29 |
2,000,000 |
2,048,220 |
||||||||||||||
|
James Lawrence Kernan Hospital |
5.000 |
% |
7/1/34 |
950,000 |
965,039 |
||||||||||||||
|
University of Maryland Medical System |
5.125 |
% |
7/1/39 |
1,000,000 |
1,016,440 |
||||||||||||||
|
Puerto Rico Sales Tax Financing Corp., Sales Tax Revenue |
5.500 |
% |
8/1/28 |
15,000 |
15,317 |
||||||||||||||
|
Total Pre-Refunded/Escrowed to Maturity |
13,612,994 |
||||||||||||||||||
|
Special Tax Obligation — 3.7% |
|||||||||||||||||||
|
Frederick County, MD, Special Obligation, Urbana Community Development |
5.000 |
% |
7/1/30 |
3,000,000 |
3,134,580 |
||||||||||||||
|
Total Special Tax Obligation |
3,134,580 |
||||||||||||||||||
|
Transportation — 6.3% |
|||||||||||||||||||
|
Maryland State Department of Transportation, Consolidated Transportation Revenue Bonds |
4.000 |
% |
5/1/30 |
3,000,000 |
3,324,840 |
||||||||||||||
|
Maryland State Transportation Authority Transportation Facilities Project Revenue |
3.000 |
% |
7/1/31 |
2,000,000 |
1,979,400 |
||||||||||||||
|
Total Transportation |
5,304,240 |
||||||||||||||||||
|
Water & Sewer — 10.5% |
|||||||||||||||||||
|
City of Baltimore, Maryland, Mayor and City Council of Baltimore, Project and Refunding Revenue Bonds: |
|||||||||||||||||||
|
Wastewater Projects, FGIC |
5.000 |
% |
7/1/22 |
1,170,000 |
1,244,084 |
||||||||||||||
|
Water Projects, FGIC |
5.000 |
% |
7/1/24 |
1,160,000 |
1,230,215 |
||||||||||||||
1919 Funds 2018 Annual Report
26
1919 Maryland Tax-Free Income Fund
|
Rate |
Maturity Date |
Face Amount |
Value |
||||||||||||||||
|
Water & Sewer — continued |
|||||||||||||||||||
|
Washington Suburban Sanitary District, Maryland, Montgomery and Prince George's Counties, Water Supply Refunding Bonds |
6.000 |
% |
6/1/19 |
$ |
3,665,000 |
$ |
3,729,651 |
||||||||||||
|
Washington Suburban Sanitary District, Maryland, Montgomery and Prince George's Counties, Water Supply Refunding Bonds |
1.260 |
% |
6/1/23 |
1,500,000 |
1,500,000 |
(c) |
|||||||||||||
|
Washington Suburban Sanitary District, Maryland, Montgomery and Prince George's Counties, Water Supply Refunding Bonds |
5.000 |
% |
6/1/37 |
1,000,000 |
1,146,290 |
||||||||||||||
|
Total Water & Sewer |
8,850,240 |
||||||||||||||||||
|
Total Municipal Bonds — 99.1% (Cost — $80,425,682) |
83,658,733 |
||||||||||||||||||
|
Other Assets in Excess of Liabilities — 0.9% |
727,369 |
||||||||||||||||||
|
Total Net Assets — 100.0% |
$ |
84,386,102 |
|||||||||||||||||
(a) Zero coupon bond. Rate shown is effective yield of the position.
(b) Pre-Refunded bonds are escrowed with U.S. government obligations and/or U.S. government agency securities and are considered by the manager to be triple-A rated even if issuer has not applied for new ratings.
(c) Variable rate security. Rate is determined on a periodic basis by Remarketing Agents to make a market for the bonds. Interest rate disclosed is rate at period end.
Abbreviations used in this schedule:
AMBAC — American Municipal Bond Assurance Corporation — Insured Bonds
COPS — Community Oriented Policing Services
EDC — Economic Development Corporation
EDR — Economic Development Revenue
EFA — Educational Facilities Authority
FGIC — Financial Guaranty Insurance Company — Insured Bonds
GO — General Obligation
Ratings table* (unaudited)
|
Standard & Poor's/Moody's/Fitch** |
|||||||
|
AAA/Aaa |
38.0 |
% |
|||||
|
AA/Aa |
34.7 |
% |
|||||
|
A |
17.4 |
% |
|||||
|
BBB/Baa |
9.9 |
% |
|||||
|
100.0 |
% |
||||||
* As a percentage of total investments.
** The ratings shown are based on each portfolio security's rating as determined by Standard & Poor's, Moody's or Fitch, each a Nationally Recognized Statistical Rating Organization ("NRSRO"). These ratings are the opinions of the NRSRO and are not measures of quality or guarantees of performance. Securities may be rated by other NRSROs, and these ratings may be higher or lower. In the event that a security is rated by multiple NRSROs and receives different ratings, the Fund will treat the security as being rated in the highest rating category received from a NRSRO.
The Accompanying Notes are an Integral Part of these Financial Statements.
1919 Funds 2018 Annual Report
27
1919 Maryland Tax-Free Income Fund
Statement of assets and liabilities
December 31, 2018
|
Assets: |
|||||||
|
Investments in securities at value (cost $80,425,682) |
$ |
83,658,733 |
|||||
|
Receivable for Fund shares sold |
275,218 |
||||||
|
Interest receivable |
1,097,761 |
||||||
|
Prepaid expenses |
19,066 |
||||||
|
Total Assets |
85,050,778 |
||||||
|
Liabilities: |
|||||||
|
Payable for Fund shares repurchased |
506,149 |
||||||
|
Payable to custodian |
19,798 |
||||||
|
Distributions to shareholders |
22,341 |
||||||
|
Advisory fees payable |
18,509 |
||||||
|
Distribution fees payable |
21,079 |
||||||
|
Accrued other expenses |
76,800 |
||||||
|
Total Liabilities |
664,676 |
||||||
|
Net Assets |
$ |
84,386,102 |
|||||
|
Components of Net Assets: |
|||||||
|
Paid-in capital |
$ |
83,817,110 |
|||||
|
Total distributable earnings |
568,992 |
||||||
|
Net Assets |
$ |
84,386,102 |
|||||
|
Class A: |
|||||||
|
Net Assets |
$ |
55,709,510 |
|||||
|
Shares Issued and Outstanding |
3,631,269 |
||||||
|
Net Asset Value and Redemption Price |
$ |
15.34 |
|||||
|
Maximum Public Offering Price (based on maximum initial sales charge of 4.25%) |
$ |
16.02 |
|||||
|
Class C: |
|||||||
|
Net Assets |
$ |
14,420,551 |
|||||
|
Shares Issued and Outstanding |
939,965 |
||||||
|
Net Asset Value, Redemption Price* and Offering Price Per Share |
$ |
15.34 |
|||||
|
Class I: |
|||||||
|
Net Assets |
$ |
14,256,041 |
|||||
|
Shares Issued and Outstanding |
928,843 |
||||||
|
Net Asset Value, Redemption Price and Offering Price Per Share |
$ |
15.35 |
|||||
* Redemption price per share of Class C shares is NAV reduced by a 1.00% CDSC if shares are redeemed within one year of purchase (See Note 3).
The Accompanying Notes are an Integral Part of these Financial Statements.
1919 Funds 2018 Annual Report
28
1919 Maryland Tax-Free Income Fund
Statement of operations
For the Year Ended December 31, 2018
|
Investment Income: |
|||||||
|
Interest Income |
$ |
3,351,382 |
|||||
|
Expenses: |
|||||||
|
Advisory fees (Note 3) |
502,561 |
||||||
|
Distribution fees (Note 6) |
203,475 |
||||||
|
Transfer agent fees and expenses (Note 3 & Note 6) |
112,658 |
||||||
|
Administration and fund accounting fees (Note 3) |
83,240 |
||||||
|
Registration fees |
36,258 |
||||||
|
Audit fees |
19,999 |
||||||
|
Legal fees |
13,075 |
||||||
|
Trustees' fees (Note 3) |
11,796 |
||||||
|
Shareholder reporting fees |
8,804 |
||||||
|
Miscellaneous |
8,705 |
||||||
|
Compliance fees (Note 3) |
6,456 |
||||||
|
Custody fees (Note 3) |
6,073 |
||||||
|
Insurance fees |
3,499 |
||||||
|
Total Expenses |
1,016,599 |
||||||
|
Expenses waived by the Adviser (Note 3) |
(264,876 |
) |
|||||
|
Net Expenses |
751,723 |
||||||
|
Net Investment Income |
2,599,659 |
||||||
|
Realized and Unrealized Loss on Investments |
|||||||
|
Net Realized Loss on Investments |
(113,540 |
) |
|||||
|
Net Change in Unrealized Appreciation/Depreciation on Investments |
(1,688,664 |
) |
|||||
|
Net Realized and Unrealized Loss on Investments |
(1,802,204 |
) |
|||||
|
Net Increase in Net Assets Resulting from Operations |
$ |
797,455 |
|||||
The Accompanying Notes are an Integral Part of these Financial Statements.
1919 Funds 2018 Annual Report
29
1919 Maryland Tax-Free Income Fund
Statements of changes in net assets
|
For the year ended December 31, |
2018 |
2017 |
|||||||||
|
Increase (Decrease) in Net Assets from: Operations: |
|||||||||||
|
Net investment income |
$ |
2,599,659 |
$ |
3,244,717 |
|||||||
|
Net realized loss on investments |
(113,540 |
) |
(2,454,303 |
) |
|||||||
|
Net change in unrealized appreciation/depreciation on investments |
(1,688,664 |
) |
714,049 |
||||||||
|
Net Increase in Net Assets Resulting From Operations |
797,455 |
1,504,463 |
|||||||||
|
Distributions to Shareholders: |
|||||||||||
|
Class A |
(1,789,526 |
) |
(2,283,135 |
) |
|||||||
|
Class C |
(377,370 |
) |
(459,972 |
) |
|||||||
|
Class I |
(432,763 |
) |
(501,610 |
) |
|||||||
|
Total Distributions to Shareholders |
(2,599,659 |
) |
(3,244,717 |
)* |
|||||||
|
Capital Transactions: |
|||||||||||
|
Net proceeds from shares sold |
9,831,149 |
10,499,705 |
|||||||||
|
Reinvestment of distributions |
2,318,081 |
2,852,289 |
|||||||||
|
Cost of shares repurchased |
(28,001,996 |
) |
(35,485,458 |
) |
|||||||
|
Net Decrease in Net Assets From Capital Transactions |
(15,852,766 |
) |
(22,133,464 |
) |
|||||||
|
Total Decrease in Net Assets |
(17,654,970 |
) |
(23,873,718 |
) |
|||||||
|
Net Assets: |
|||||||||||
|
Beginning of year |
102,041,072 |
125,914,790 |
|||||||||
|
End of year |
$ |
84,386,102 |
$ |
102,041,072 |
** |
||||||
* Distribution was from net investment income for all classes.
** Includes undistributed net investment income of $24,555.
The Accompanying Notes are an Integral Part of these Financial Statements.
1919 Funds 2018 Annual Report
30
1919 Maryland Tax-Free Income Fund
Financial highlights
For a share of beneficial interest outstanding through each period ended December 31, unless otherwise noted:
|
Class A Shares |
2018 |
2017 |
2016 |
2015 |
20141 |
20142 |
|||||||||||||||||||||
|
Net asset value, beginning of period |
$ |
15.63 |
$ |
15.86 |
$ |
16.15 |
$ |
16.45 |
$ |
16.31 |
$ |
17.07 |
|||||||||||||||
|
Income (loss) from investment operations: |
|||||||||||||||||||||||||||
|
Net investment income3 |
0.45 |
0.44 |
0.55 |
0.61 |
0.46 |
0.59 |
|||||||||||||||||||||
|
Net realized and unrealized gain (loss) on investments |
(0.29 |
) |
(0.23 |
) |
(0.29 |
) |
(0.30 |
) |
0.14 |
(0.76 |
) |
||||||||||||||||
|
Total income (loss) from investment operations |
0.16 |
0.21 |
0.26 |
0.31 |
0.60 |
(0.17 |
) |
||||||||||||||||||||
|
Less distributions: |
|||||||||||||||||||||||||||
|
From net investment income |
(0.45 |
) |
(0.44 |
) |
(0.55 |
) |
(0.61 |
) |
(0.46 |
) |
(0.59 |
) |
|||||||||||||||
|
Total distributions |
(0.45 |
) |
(0.44 |
) |
(0.55 |
) |
(0.61 |
) |
(0.46 |
) |
(0.59 |
) |
|||||||||||||||
|
Net asset value, end of period |
$ |
15.34 |
$ |
15.63 |
$ |
15.86 |
$ |
16.15 |
$ |
16.45 |
$ |
16.31 |
|||||||||||||||
|
Total return4 |
1.04 |
% |
1.34 |
% |
1.59 |
% |
1.89 |
% |
3.74 |
%5 |
-0.94 |
% |
|||||||||||||||
|
Supplemental data and ratios: |
|||||||||||||||||||||||||||
|
Net assets, end of period (in thousands) |
$ |
55,710 |
$ |
69,068 |
$ |
88,823 |
$ |
93,064 |
$ |
103,501 |
$ |
117,797 |
|||||||||||||||
|
Ratios to average net assets Gross expenses |
1.04 |
% |
0.97 |
% |
0.95 |
% |
0.93 |
% |
0.91 |
%6 |
0.83 |
% |
|||||||||||||||
|
Net expenses7 |
0.75 |
0.75 |
0.75 |
0.75 |
0.756,8 |
0.648 |
|||||||||||||||||||||
|
Net investment income |
2.92 |
2.80 |
3.39 |
3.73 |
3.756 |
3.59 |
|||||||||||||||||||||
|
Portfolio turnover rate |
43 |
% |
23 |
% |
25 |
% |
5 |
% |
1 |
%5 |
8 |
% |
|||||||||||||||
1 For the period ended April 1, 2014 through December 31, 2014. See Note 1.
2 For the year ended March 31.
3 Per share amounts have been calculated using the average shares method.
4 Performance figures, exclusive of sales charges, may reflect compensating balance arrangements, fee waivers and/or expense reimbursements. In the absence of compensating balance arrangements, fee waivers and/or expense reimbursements, the total return would have been lower. Past performance is no guarantee of future results.
5 Not Annualized.
6 Annualized.
7 The advisor agreed to limit the ratio of expenses, other than brokerage, interest, taxes, extraordinary expenses and acquired fund fees and expenses, to 0.75% of the average net assets of Class A shares. This expense limitation arrangement cannot be terminated prior to April 30, 2020 without the Board of Trustees' consent. See Note 3.
8 The impact of compensating balance arrangements, if any, was less than 0.01%.
The Accompanying Notes are an Integral Part of these Financial Statements.
1919 Funds 2018 Annual Report
31
1919 Maryland Tax-Free Income Fund
Financial highlights (cont'd)
For a share of beneficial interest outstanding through each period ended December 31, unless otherwise noted:
|
Class C Shares |
2018 |
2017 |
2016 |
2015 |
20141 |
20142 |
|||||||||||||||||||||
|
Net asset value, beginning of period |
$ |
15.63 |
$ |
15.86 |
$ |
16.15 |
$ |
16.45 |
$ |
16.31 |
$ |
17.07 |
|||||||||||||||
|
Income (loss) from investment operations: |
|||||||||||||||||||||||||||
|
Net investment income3 |
0.36 |
0.35 |
0.46 |
0.52 |
0.39 |
0.49 |
|||||||||||||||||||||
|
Net realized and unrealized gain (loss) on investments |
(0.29 |
) |
(0.23 |
) |
(0.29 |
) |
(0.30 |
) |
0.14 |
(0.76 |
) |
||||||||||||||||
|
Total income (loss) from investment operations |
0.07 |
0.12 |
0.17 |
0.22 |
0.53 |
(0.27 |
) |
||||||||||||||||||||
|
Less distributions: |
|||||||||||||||||||||||||||
|
From net investment income |
(0.36 |
) |
(0.35 |
) |
(0.46 |
) |
(0.52 |
) |
(0.39 |
) |
(0.49 |
) |
|||||||||||||||
|
Total distributions |
(0.36 |
) |
(0.35 |
) |
(0.46 |
) |
(0.52 |
) |
(0.39 |
) |
(0.49 |
||||||||||||||||
|
Net asset value, end of period |
$ |
15.34 |
$ |
15.63 |
$ |
15.86 |
$ |
16.15 |
$ |
16.45 |
$ |
16.31 |
|||||||||||||||
|
Total return4 |
0.49 |
% |
0.78 |
% |
1.03 |
% |
1.34 |
% |
3.31 |
%5 |
-1.53 |
% |
|||||||||||||||
|
Supplemental data and ratios: |
|||||||||||||||||||||||||||
|
Net assets, end of period (in thousands) |
$ |
14,421 |
$ |
17,562 |
$ |
21,243 |
$ |
22,144 |
$ |
26,904 |
$ |
28,678 |
|||||||||||||||
|
Ratios to average net assets Gross expenses |
1.59 |
% |
1.54 |
% |
1.52 |
% |
1.52 |
% |
1.48 |
%6 |
1.44 |
% |
|||||||||||||||
|
Net expenses7 |
1.30 |
1.30 |
1.30 |
1.30 |
1.306,8 |
1.248 |
|||||||||||||||||||||
|
Net investment income |
2.37 |
2.25 |
2.84 |
3.18 |
3.206 |
2.99 |
|||||||||||||||||||||
|
Portfolio turnover rate |
43 |
% |
23 |
% |
25 |
% |
5 |
% |
1 |
%5 |
8 |
% |
|||||||||||||||
1 For the period ended April 1, 2014 through December 31, 2014. See Note 1.
2 For the year ended March 31.
3 Per share amounts have been calculated using the average shares method.
4 Performance figures, exclusive of sales charges, may reflect compensating balance arrangements, fee waivers and/or expense reimbursements. In the absence of compensating balance arrangements, fee waivers and/or expense reimbursements, the total return would have been lower. Past performance is no guarantee of future results.
5 Not Annualized.
6 Annualized.
7 The advisor agreed to limit the ratio of expenses, other than brokerage, interest, taxes, extraordinary expenses and acquired fund fees and expenses, to 1.30% of the average net assets of Class C shares. This expense limitation arrangement cannot be terminated prior to April 30, 2020 without the Board of Trustees' consent. See Note 3.
8 The impact of compensating balance arrangements, if any, was less than 0.01%.
The Accompanying Notes are an Integral Part of these Financial Statements.
1919 Funds 2018 Annual Report
32
For a share of beneficial interest outstanding through each period ended December 31, unless otherwise noted:
|
Class I Shares |
2018 |
2017 |
2016 |
2015 |
20141 |
20142 |
|||||||||||||||||||||
|
Net asset value, beginning of period |
$ |
15.63 |
$ |
15.87 |
$ |
16.16 |
$ |
16.45 |
$ |
16.31 |
$ |
17.08 |
|||||||||||||||
|
Income (loss) from investment operations: |
|||||||||||||||||||||||||||
|
Net investment income3 |
0.47 |
0.46 |
0.57 |
0.63 |
0.48 |
0.62 |
|||||||||||||||||||||
|
Net realized and unrealized gain (loss) on investments |
(0.28 |
) |
(0.24 |
) |
(0.29 |
) |
(0.29 |
) |
(0.14 |
) |
(0.77 |
) |
|||||||||||||||
|
Total income (loss) from investment operations |
0.19 |
0.22 |
0.28 |
0.34 |
0.62 |
(0.15 |
) |
||||||||||||||||||||
|
Less distributions: |
|||||||||||||||||||||||||||
|
From net investment income |
(0.47 |
) |
(0.46 |
) |
(0.57 |
) |
(0.63 |
) |
(0.48 |
) |
(0.62 |
) |
|||||||||||||||
|
Total distributions |
(0.47 |
) |
(0.46 |
) |
(0.57 |
) |
(0.63 |
) |
(0.48 |
) |
(0.62 |
) |
|||||||||||||||
|
Net asset value, end of period |
$ |
15.35 |
$ |
15.63 |
$ |
15.87 |
$ |
16.16 |
$ |
16.45 |
$ |
16.31 |
|||||||||||||||
|
Total return4 |
1.26 |
% |
1.43 |
% |
1.74 |
% |
2.12 |
% |
3.85 |
%5 |
-0.85 |
% |
|||||||||||||||
|
Supplemental data and ratios: |
|||||||||||||||||||||||||||
|
Net assets, end of period (in thousands) |
$ |
14,256 |
$ |
15,411 |
$ |
15,849 |
$ |
16,713 |
$ |
20,693 |
$ |
17,624 |
|||||||||||||||
|
Ratios to average net assets Gross expenses |
0.90 |
% |
0.88 |
% |
0.89 |
% |
0.89 |
% |
0.83 |
%6 |
0.92 |
% |
|||||||||||||||
|
Net expenses7 |
0.60 |
0.60 |
0.60 |
0.60 |
0.606,8 |
0.488 |
|||||||||||||||||||||
|
Net investment income |
3.06 |
2.94 |
3.54 |
3.87 |
3.906 |
3.74 |
|||||||||||||||||||||
|
Portfolio turnover rate |
43 |
% |
23 |
% |
25 |
% |
5 |
% |
1 |
%5 |
8 |
% |
|||||||||||||||
1 For the period ended April 1, 2014 through December 31, 2014. See Note 1.
2 For the year ended March 31.
3 Per share amounts have been calculated using the average shares method.
4 Performance figures, exclusive of sales charges, may reflect compensating balance arrangements, fee waivers and/or expense reimbursements. In the absence of compensating balance arrangements, fee waivers and/or expense reimbursements, the total return would have been lower. Past performance is no guarantee of future results.
5 Not Annualized.
6 Annualized.
7 The advisor agreed to limit the ratio of expenses, other than brokerage, interest, taxes, extraordinary expenses and acquired fund fees and expenses, to 0.60% of the average net assets of Class I shares. This expense limitation arrangement cannot be terminated prior to April 30, 2020 without the Board of Trustees' consent. See Note 3.
8 The impact of compensating balance arrangements, if any, was less than 0.01%.
The Accompanying Notes are an Integral Part of these Financial Statements.
1919 Funds 2018 Annual Report
33
1919 Socially Responsive Balanced Fund
Letter to shareholders (unaudited)
Dear Shareholder,
We are pleased to bring you the annual report on the 1919 Socially Responsive Balanced Fund ("the Fund") through December 31, 2018.
Throughout the year, the Fund took a variety of measures to respond to changing market conditions. During the first half of the year, we increased exposure to the Health Care, Consumer Discretionary, and Materials sectors and decreased exposure to the Industrials and Financials sectors. During the second half of the year, we added to the Communication Services exposure while reducing exposure to the Information Technology sector.
Throughout the year, we maintained an overweight in the Health Care, Financials, Industrials, and Information Technology sectors and an underweight in the Energy, Real estate, Telecommunications and Utilities sectors.
In the fixed-income portion of the Fund, we purchased Treasuries, Agencies and Corporates including five green bonds with varying maturities. Going forward, we believe the curve could remain relatively flat until inflation becomes a greater concern. Given that the Fed appears to have paused in their rate hiking cycle and the economic data is not flashing yellow for rampant inflation, we anticipate buying along the curve where we see opportunities.
In the equity portion of the Fund, our stock selection in the Information Technology, Industrials, Consumer Staples, Energy, Materials, and Health Care sectors contributed to relative performance in 2018. In terms of sector positioning, our overweighting in the Health Care sector and underweighting in the Energy and Materials sectors also enhanced results. On an individual stock basis, the largest contributors to performance for the year were Boston Scientific, Adobe, salesforce.com, Amazon.com, and Intuit.
The leading contributor to performance in the fixed-income portion of the Fund was our exposure to longer dated Agencies. The other significant contributor to performance was a shorter duration of 4.30 relative to the benchmark duration of 5.87. On an individual security basis, the largest contributors to return were International Bank for Reconstruction and Development (Green Bond) 3.125% 11/20/25, U.S. Treasury 7.5% 11/15/24, Boston
1919 Funds 2018 Annual Report
34
Properties LP (Green Bond) 4.5% 12/1/28, FNMA 6.25% 5/15/29, and U.S. Treasury 7.625% 11/15/22.
In the equity portion of the Fund, our stock selection in the Financials, Communication Services, and Consumer Discretionary sectors detracted from relative results for the year. In terms of sector positioning, our overweighting in the Industrials and Financials sector detracted from performance. On an individual stock basis, the largest detractors from performance were Invesco, Celgene, Texas Capital Bancshares, Citizens Financial Group, and BorgWarner.
In the fixed-income portion of the Fund, the leading detractor to performance was our overweight to the corporate sector, more specifically to longer-dated securities. On an individual security basis, the largest detractors from performance were Comcast Corporation 5.65% 6/15/35, Ford Motor Company 4.346% 12/8/26, Microsoft Corporation 4.2% 11/3/35, Gilead Sciences, Inc. 4.6% 9/1/35 and Bank of America Corporation 4.813% 11/25/27.
Thank you for your investment in the 1919 Socially Responsive Balanced Fund. As always, we appreciate that you have chosen us to manage your assets and we remain focused on achieving the Fund's investment and social goals.
Sincerely,

Ronald T. Bates
Portfolio Manager (Equity Portion)
1919 Investment Counsel, LLC

Aimee M. Eudy
Portfolio Manager (Fixed-Income Portion)
1919 Investment Counsel, LLC
Duration is a commonly used measure of the potential volatility of the price of a debt security, or the aggregate market value of a portfolio of debt securities, prior to maturity. Securities with a longer duration generally have more volatile prices than securities of a comparable quality with a shorter duration.
Past performance is not a guarantee of future results.
Opinions expressed herein are as of 12/31/18 and are subject to change at any time, are not a guaranteed and should not be considered investment advice.
Fund holdings and sector allocations are subject to change and are not a recommendation to buy or sell any security. Please refer to the Schedule of Investments for a complete list of Fund holdings.
Mutual fund investing involves risk. Principal loss is possible. The Fund's social policy may cause it to make or avoid investments for social reasons when it is otherwise disadvantageous to do so. The Fund may invest in foreign and emerging market securities which will involve greater volatility and political, economic and currency risks and differences in accounting methods. The risks are particularly significant for funds that invest in emerging markets. The Fund may make short sales of securities, which involves
1919 Funds 2018 Annual Report
35
1919 Socially Responsive Balanced Fund
Letter to shareholders (unaudited) (cont'd)
the risk that losses may exceed the original amount invested. Fixed income securities involve interest rate, credit, inflation and reinvestment risks; and possible loss of principal. As interest rates rise, the value of fixed income securities falls. The Fund may focus its investments in certain regions or industries, increasing its vulnerability to market volatility. The manager's investment style may become out of favor and/or the manager's selection process may prove incorrect; which may have a negative impact on the Fund's performance.
1919 Funds are distributed by Quasar Distributors, LLC.
1919 Funds 2018 Annual Report
36
Fund performance (unaudited)
Value of $10,000 Investment
(Assumes reinvestment of dividends and capital gains)
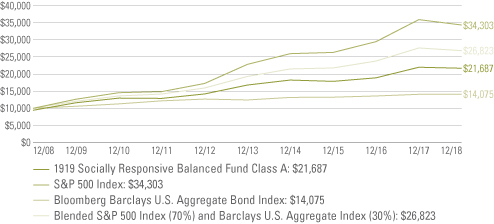
This chart illustrates the performance of a hypothetical $10,000 investment in the Fund's Class A shares over ten years. Assumes the deduction of the maximum initial sales charge of 5.75% at the time of investment and the reinvestment of dividends and capital gains, but does not reflect the effect of any other applicable sales charge or redemption fees. This chart does not imply any future performance. The performance of the Fund's other classes may be greater or less than the Class A shares' performance indicated on this chart, depending on whether greater or lesser sales charges and fees were incurred by shareholders investing in the other classes.
1919 Funds 2018 Annual Report
37
Fund performance (unaudited) (cont'd)
Total Returns* as of December 31, 2018
|
1 Year |
5 Year |
10 Year |
|||||||||||||
|
1919 Socially Responsive Balanced Fund |
|||||||||||||||
|
With Sales Charges† |
|||||||||||||||
|
Class A |
-6.98 |
% |
4.02 |
% |
8.05 |
% |
|||||||||
|
Class B |
-6.63 |
4.31 |
7.72 |
||||||||||||
|
Class C |
-2.87 |
4.51 |
7.96 |
||||||||||||
|
Without Sales Charges |
|||||||||||||||
|
Class A |
-1.31 |
5.26 |
8.69 |
||||||||||||
|
Class B |
-2.02 |
4.31 |
7.72 |
||||||||||||
|
Class C |
-1.95 |
4.51 |
7.96 |
||||||||||||
|
Class I |
-1.00 |
5.54 |
8.99 |
||||||||||||
|
S&P 500 Index(i) |
-4.38 |
8.49 |
13.12 |
||||||||||||
|
Bloomberg Barclays U.S. Aggregate Index(ii) |
0.01 |
2.52 |
3.48 |
||||||||||||
|
Blended S&P 500 Index (70%) and Barclays U.S. Aggregate Index (30%)(iii) |
-2.82 |
6.82 |
10.37 |
||||||||||||
* Returns over one year are annualized.
† Class A Shares have a maximum initial sales charge of 5.75%. Class B Shares have a Contingent Deferred Sales Charges (CDSC) of 5.00%, which applies if redemption occurs within 12 months from purchase payment. The CDSC declines by 1.00% per year until no CDSC is incurred. Class C Shares have a CDSC of 1.00% for shares redeemed within one year of purchase.
As of the Fund's current prospectus dated April 30, 2018, the total gross annual operating expense ratios for Class A, Class B, Class C and Class I were 1.33%, 2.90%, 2.02% and 1.02%, respectively. The total net annual operating expense ratios for Class A, Class B, Class C and Class I were 1.27%(iv), 2.17%(iv), 2.00%(iv) and 1.01%(iv), respectively. Actual expenses may be higher. For example, expenses may be higher than those shown if average net assets decrease. Net assets are more likely to decrease and Fund expense ratios are more likely to increase when markets are volatile.
All figures represent past performance and are not a guarantee of future results. Investment return and principal value of an investment will fluctuate so that an investor's shares, when redeemed, may be worth more or less than their original cost. Fund returns assume the reinvestment of all distributions, at net asset value and the deduction of all Fund expenses. Total returns do not reflect the deduction of taxes that a shareholder would pay on Fund distributions or the redemption of Fund shares. Performance figures may reflect fee waivers and/or expense reimbursements. In the absence of fee waivers and/or expense reimbursements, the total return would have been lower. Current performance of the Fund may be lower or higher than the performance quoted. Performance data current to the most recent month end may be obtained by calling 1-844-828-1919.
As of November 7, 2014, the Fund assumed the performance, financial and other historic information of the Legg Mason Investment Counsel Social Awareness Fund. Fund holdings and sector allocations are subject to change at any time and should not be considered a recommendation to buy or sell any security. Please refer to the Schedule of Investments in this report for a complete list of Fund holdings.
(i) The S&P 500 Index is an unmanaged index of 500 stocks and is generally representative of the performance of larger companies in the U.S.
(ii) The Bloomberg Barclays U.S. Aggregate Bond Index is a broad-based bond index comprised of government, corporate, mortgage and asset-backed issues, rated investment grade or higher, and having at least one year to maturity. The Index was previously named the Barclays Aggregate Bond Index.
(iii) The Blended S&P 500 Index (70%) and Bloomberg Barclays U.S. Aggregate Index (30%) has been prepared to parallel the targeted allocation of investments between equity and fixed-income securities. It consists of 70% of the performance of the S&P 500 Index and 30% of the Bloomberg Barclays U.S. Aggregate Index.
(iv) The Advisor has contractually agreed to waive fees and reimburse operating expenses through April 30, 2020.
The Indices are unmanaged and are not subject to the same management and trading expenses as a mutual fund. Please note that an investor cannot invest directly in an index.
1919 Funds 2018 Annual Report
38
Fund expenses (unaudited)
Example
As a shareholder of the Fund, you may incur two types of costs: (1) transaction costs, including front-end and back-end sales charges (loads) on purchase payments; and (2) ongoing costs, including management fees; service and/or distribution (12b-1) fees; and other Fund expenses. This example is intended to help you understand your ongoing costs (in dollars) of investing in the Fund and to compare these costs with the ongoing costs of investing in other mutual funds.
This example is based on an investment of $1,000 invested on July 1, 2018 and held for the six months ended December 31, 2018. The hypothetical example is based on a six-month period ended December 31, 2018.
Actual expenses
The table below titled "Based on Actual Total Return" provides information about actual account values and actual expenses. You may use the information provided in this table, together with the amount you invested, to estimate the expenses that you paid over the period. To estimate the expenses you paid on your account, divide your ending account value by $1,000 (for example, an $8,600 ending account value divided by $1,000 = 8.6), then multiply the
result by the number under the heading entitled "Expenses Paid During the Period".
Hypothetical example for comparison purposes
The table below titled "Based on Hypothetical Total Return" provides information about hypothetical account values and hypothetical expenses based on the actual expense ratio and an assumed rate of return of 5.00% per year before expenses, which is not the Fund's actual return. The hypothetical account values and expenses may not be used to estimate the actual ending account balance or expenses you paid for the period. You may use the information provided in this table to compare the ongoing costs of investing in the Fund and other funds. To do so, compare the 5.00% hypothetical example relating to the Fund with the 5.00% hypothetical examples that appear in the shareholder reports of the other funds.
Please note that the expenses shown in the table below are meant to highlight your ongoing costs only and do not reflect any transactional costs. Therefore, the table is useful in comparing ongoing costs only, and will not help you determine the relative total costs of owning different funds. In addition, if these transaction costs were included, your costs would have been higher.
Based on actual total return1
|
Actual Total Return2 |
Beginning Account Value |
Ending Account Value |
Annualized Expense Ratio |
Expenses Paid During the Period3 |
|||||||||||||||||||
|
Class A |
-4.26 |
% |
$ |
1,000.00 |
$ |
957.40 |
1.25 |
% |
$ |
6.17 |
|||||||||||||
|
Class B |
-4.59 |
1,000.00 |
954.10 |
2.00 |
9.85 |
||||||||||||||||||
|
Class C |
-4.58 |
1,000.00 |
954.20 |
1.97 |
9.70 |
||||||||||||||||||
|
Class I |
-4.09 |
1,000.00 |
959.10 |
0.95 |
4.69 |
||||||||||||||||||
Based on hypothetical total return1
|
Hypothetical Annualized Total Return |
Beginning Account Value |
Ending Account Value |
Annualized Expense Ratio |
Expenses Paid During the Period3 |
|||||||||||||||||||
|
Class A |
5.00 |
% |
$ |
1,000.00 |
$ |
1,018.90 |
1.25 |
% |
$ |
6.36 |
|||||||||||||
|
Class B |
5.00 |
1,000.00 |
1,015.12 |
2.00 |
10.16 |
||||||||||||||||||
|
Class C |
5.00 |
1,000.00 |
1,015.27 |
1.97 |
10.01 |
||||||||||||||||||
|
Class I |
5.00 |
1,000.00 |
1,020.42 |
0.95 |
4.84 |
||||||||||||||||||
1 For the six months ended December 31, 2018.
2 Assumes the reinvestment of all distributions at net asset value and does not reflect the deduction of the applicable sales charge with respect to Class A shares or the applicable contingent deferred sales charge ("CDSC") with respect to Class B and Class C shares. Total return is not annualized, as it may not be representative of the total return for the year. Performance figures may reflect fee waivers and/or expense reimbursements. In the absence of fee waivers and/or expense reimbursements, the total return would have been lower.
3 Expenses (net of compensating balance arrangements, fee waivers and/or expense reimbursements) are equal to each class' annualized expense ratio multiplied by the average account value over the period, multiplied by the number of days in the most recent fiscal half-year (184), then divided by 365.
1919 Funds 2018 Annual Report
39
Fund at a glance (unaudited)
Investment breakdown (%) as a percent of total investments

1919 Funds 2018 Annual Report
40
Schedule of investments
December 31, 2018
1919 Socially Responsive Balanced Fund
|
Security |
Shares |
Value |
|||||||||
|
Common Stocks — 64.3% |
|||||||||||
|
Communication Services — 0.8% |
|||||||||||
|
Walt Disney Co/The |
9,000 |
$ |
986,850 |
||||||||
|
Total Communication Services |
986,850 |
||||||||||
|
Consumer Discretionary — 8.1% |
|||||||||||
|
Amazon.com Inc. |
2,100 |
3,154,137 |
* |
||||||||
|
BorgWarner Inc. |
43,880 |
1,524,391 |
|||||||||
|
Home Depot Inc/The |
13,825 |
2,375,411 |
|||||||||
|
Royal Caribbean Cruises Ltd. |
18,650 |
1,823,784 |
|||||||||
|
TJX Cos Inc. |
40,655 |
1,818,905 |
|||||||||
|
Total Consumer Discretionary |
10,696,628 |
||||||||||
|
Consumer Staples — 6.0% |
|||||||||||
|
Costco Wholesale Corp. |
11,440 |
2,330,442 |
|||||||||
|
CVS Health Corp. |
22,000 |
1,441,440 |
|||||||||
|
Estee Lauder Cos. Inc., Class A Shares |
18,890 |
2,457,589 |
|||||||||
|
PepsiCo Inc. |
15,310 |
1,691,449 |
|||||||||
|
Total Consumer Staples |
7,920,920 |
||||||||||
|
Financials — 9.3% |
|||||||||||
|
Citizens Financial Group Inc. |
53,410 |
1,587,879 |
|||||||||
|
CME Group Inc. |
11,435 |
2,151,152 |
|||||||||
|
Discover Financial Services |
31,060 |
1,831,919 |
|||||||||
|
Invesco Ltd. |
39,695 |
664,495 |
|||||||||
|
JPMorgan Chase & Co. |
28,855 |
2,816,825 |
|||||||||
|
Prologis Inc. |
22,800 |
1,338,816 |
|||||||||
|
Simon Property Group LP |
4,805 |
807,192 |
|||||||||
|
Texas Capital Bancshares Inc. |
20,195 |
1,031,762 |
* |
||||||||
|
Total Financials |
12,230,040 |
||||||||||
|
Health Care — 10.0% |
|||||||||||
|
Boston Scientific Corp. |
78,340 |
2,768,536 |
* |
||||||||
|
Celgene Corp. |
20,110 |
1,288,850 |
* |
||||||||
|
Chubb Limited |
15,085 |
1,948,680 |
|||||||||
|
Teleflex Inc. |
7,255 |
1,875,273 |
|||||||||
|
Thermo Fisher Scientific Inc. |
9,370 |
2,096,912 |
|||||||||
|
UnitedHealth Group Inc. |
12,500 |
3,114,000 |
|||||||||
|
Total Health Care |
13,092,251 |
||||||||||
|
Industrials — 10.1% |
|||||||||||
|
Bloom Energy Corp., Class A Shares |
23,035 |
229,889 |
* |
||||||||
|
Cintas Corp. |
13,625 |
2,288,864 |
|||||||||
|
Danaher Corp. |
19,945 |
2,056,728 |
|||||||||
|
Eaton Corp. PLC |
26,905 |
1,847,297 |
|||||||||
|
HD Supply Holdings Inc. |
37,380 |
1,402,498 |
* |
||||||||
|
Illinois Tool Works Inc. |
12,770 |
1,617,831 |
|||||||||
1919 Funds 2018 Annual Report
41
Schedule of investments (cont'd)
December 31, 2018
1919 Socially Responsive Balanced Fund
|
Security |
Shares |
Value |
|||||||||||||||||
|
Industrials — continued |
|||||||||||||||||||
|
Union Pacific Corp. |
13,525 |
$ |
1,869,561 |
||||||||||||||||
|
Xylem Inc/NY |
30,555 |
2,038,630 |
|||||||||||||||||
|
Total Industrials |
13,351,298 |
||||||||||||||||||
|
Information Technology — 17.9% |
|||||||||||||||||||
|
Adobe Systems Inc. |
8,745 |
1,978,469 |
* |
||||||||||||||||
|
Alphabet Inc., Class A Shares |
3,200 |
3,343,872 |
* |
||||||||||||||||
|
Analog Devices Inc. |
14,000 |
1,201,620 |
|||||||||||||||||
|
Apple Inc. |
18,485 |
2,915,824 |
|||||||||||||||||
|
Broadcom Inc. |
5,470 |
1,390,912 |
|||||||||||||||||
|
Cognex Corp. |
25,330 |
979,511 |
|||||||||||||||||
|
Facebook Inc. |
12,820 |
1,680,574 |
* |
||||||||||||||||
|
Intuit Inc. |
7,575 |
1,491,139 |
|||||||||||||||||
|
Microsoft Corp. |
22,400 |
2,275,168 |
|||||||||||||||||
|
PayPal Holdings Inc. |
23,450 |
1,971,910 |
* |
||||||||||||||||
|
Salesforce.com Inc. |
14,690 |
2,012,089 |
* |
||||||||||||||||
|
Visa Inc., Class A Shares |
17,385 |
2,293,777 |
|||||||||||||||||
|
Total Information Technology |
23,534,865 |
||||||||||||||||||
|
Telecommunication Services — 0.5% |
|||||||||||||||||||
|
AT&T Inc. |
24,320 |
694,093 |
|||||||||||||||||
|
Total Telecommunication Services |
694,093 |
||||||||||||||||||
|
Utilities — 1.6% |
|||||||||||||||||||
|
American Water Works Co. Inc. |
23,390 |
2,123,110 |
|||||||||||||||||
|
Total Utilities |
2,123,110 |
||||||||||||||||||
|
Total Common Stocks (Cost — $61,392,213) |
84,630,055 |
||||||||||||||||||
|
Rate |
Maturity Date |
Face Amount |
|||||||||||||||||
|
Collateralized Mortgage Obligations — 0.2% |
|||||||||||||||||||
|
Federal Home Loan Mortgage Corp. (FHLMC), 4003 WV |
3.500 |
% |
4/15/22 |
$ |
145,252 |
145,121 |
|||||||||||||
|
Federal Home Loan Mortgage Corp. (FHLMC), 3835 BA |
4.000 |
% |
8/15/38 |
67,938 |
68,804 |
||||||||||||||
|
Federal National Mortgage Association (FNMA), 2001-53 CY |
4.000 |
% |
6/25/41 |
60,152 |
62,399 |
||||||||||||||
|
Total Collateralized Mortgage Obligations (Cost — $278,482) |
276,324 |
||||||||||||||||||
|
Corporate Bonds — 16.6% |
|||||||||||||||||||
|
Consumer Discretionary — 1.9% |
|||||||||||||||||||
|
Cintas Corp No 2 |
2.900 |
% |
4/1/22 |
325,000 |
319,930 |
||||||||||||||
|
Comcast Corp. |
3.375 |
% |
2/15/25 |
210,000 |
205,849 |
||||||||||||||
|
Comcast Corp. |
5.650 |
% |
6/15/35 |
600,000 |
658,849 |
||||||||||||||
|
Ford Motor Co. |
4.346 |
% |
12/8/26 |
490,000 |
437,206 |
||||||||||||||
|
Ford Motor Credit Co LLC |
8.125 |
% |
1/15/20 |
610,000 |
633,445 |
||||||||||||||
|
Starbucks Corp. |
2.450 |
% |
6/15/26 |
250,000 |
225,293 |
||||||||||||||
|
Total Consumer Discretionary |
2,480,572 |
||||||||||||||||||
1919 Funds 2018 Annual Report
42
1919 Socially Responsive Balanced Fund
|
Security |
Rate |
Maturity Date |
Face Amount |
Value |
|||||||||||||||
|
Consumer Staples — 0.7% |
|||||||||||||||||||
|
CVS Health Corp. |
3.875 |
% |
7/20/25 |
$ |
260,000 |
$ |
253,732 |
||||||||||||
|
CVS Health Corp. |
4.780 |
% |
3/25/38 |
345,000 |
331,618 |
||||||||||||||
|
PepsiCo Inc. |
3.100 |
% |
7/17/22 |
390,000 |
390,356 |
||||||||||||||
|
Total Consumer Staples |
975,706 |
||||||||||||||||||
|
Financials — 7.5% |
|||||||||||||||||||
|
Aflac Inc. |
4.000 |
% |
2/15/22 |
400,000 |
408,359 |
||||||||||||||
|
American Express Credit Corp. (3M US LIBOR + 0.43%) |
3.168 |
% |
3/3/20 |
405,000 |
404,467 |
(a) |
|||||||||||||
|
Bank of America Corp. (effective 5/17/2021, 3M US LIBOR + 0.63%) |
3.499 |
% |
5/17/22 |
410,000 |
410,200 |
(b) |
|||||||||||||
|
Bank of America Corp. (effective 1/23/2025, 3M US LIBOR + 0.81%) |
3.366 |
% |
1/23/26 |
550,000 |
526,276 |
(b) |
|||||||||||||
|
Bank of America Corp. |
4.183 |
% |
11/25/27 |
525,000 |
505,536 |
||||||||||||||
|
BlackRock Inc. |
4.250 |
% |
5/24/21 |
400,000 |
411,926 |
||||||||||||||
|
Boston Properties LP |
4.500 |
% |
12/1/28 |
535,000 |
548,077 |
||||||||||||||
|
Citigroup Inc. |
5.500 |
% |
9/13/25 |
325,000 |
341,528 |
||||||||||||||
|
Cooperatieve Centrale Raiffeisen-Boerenleenbank BA (Rabobank) |
4.500 |
% |
1/11/21 |
1,000,000 |
1,023,834 |
||||||||||||||
|
Goldman Sachs Group Inc. |
3.500 |
% |
11/16/26 |
330,000 |
305,113 |
||||||||||||||
|
Intercontinental Exchange Inc. |
3.750 |
% |
12/1/25 |
500,000 |
503,051 |
||||||||||||||
|
JPMorgan Chase & Co. |
4.250 |
% |
10/15/20 |
515,000 |
524,415 |
||||||||||||||
|
JPMorgan Chase & Co. (3M US LIBOR + 1.10%) |
3.866 |
% |
6/7/21 |
515,000 |
518,697 |
(a) |
|||||||||||||
|
Morgan Stanley |
5.000 |
% |
11/24/25 |
220,000 |
224,652 |
||||||||||||||
|
Simon Property Group LP |
4.125 |
% |
12/1/21 |
350,000 |
358,418 |
||||||||||||||
|
Simon Property Group LP |
3.375 |
% |
12/1/27 |
510,000 |
488,614 |
||||||||||||||
|
State Street Corp. |
3.700 |
% |
11/20/23 |
370,000 |
374,043 |
||||||||||||||
|
TD Ameritrade Holding Corp. |
2.950 |
% |
4/1/22 |
325,000 |
321,662 |
||||||||||||||
|
Toronto-Dominion Bank |
1.450 |
% |
8/13/19 |
715,000 |
708,684 |
||||||||||||||
|
Toronto-Dominion Bank |
1.850 |
% |
9/11/20 |
575,000 |
564,620 |
||||||||||||||
|
Westpac Banking Corp. |
4.875 |
% |
11/19/19 |
335,000 |
340,239 |
||||||||||||||
|
Total Financials |
9,812,411 |
||||||||||||||||||
|
Health Care — 1.6% |
|||||||||||||||||||
|
Celgene Corp. |
3.900 |
% |
2/20/28 |
365,000 |
343,007 |
||||||||||||||
|
Express Scripts Holding Co. |
3.050 |
% |
11/30/22 |
600,000 |
581,209 |
||||||||||||||
|
Gilead Sciences Inc. |
4.500 |
% |
4/1/21 |
400,000 |
411,813 |
||||||||||||||
|
Gilead Sciences Inc. |
4.600 |
% |
9/1/35 |
320,000 |
323,636 |
||||||||||||||
|
Medtronic Inc. |
4.125 |
% |
3/15/21 |
500,000 |
510,638 |
||||||||||||||
|
Total Health Care |
2,170,303 |
||||||||||||||||||
|
Information Technology — 2.1% |
|||||||||||||||||||
|
Apple Inc. |
2.850 |
% |
2/23/23 |
575,000 |
568,281 |
||||||||||||||
|
Microsoft Corp. |
4.200 |
% |
11/3/35 |
565,000 |
586,755 |
||||||||||||||
|
QUALCOMM Inc. |
2.250 |
% |
5/20/20 |
415,000 |
409,314 |
||||||||||||||
|
QUALCOMM Inc. (3M US LIBOR + 0.73%) |
3.250 |
% |
1/30/23 |
340,000 |
338,273 |
(a) |
|||||||||||||
1919 Funds 2018 Annual Report
43
Schedule of investments (cont'd)
December 31, 2018
1919 Socially Responsive Balanced Fund
|
Security |
Rate |
Maturity Date |
Face Amount |
Value |
|||||||||||||||
|
Information Technology — continued |
|||||||||||||||||||
|
QUALCOMM Inc. |
3.450 |
% |
5/20/25 |
$ |
500,000 |
$ |
481,474 |
||||||||||||
|
Texas Instruments Inc. |
1.650 |
% |
8/3/19 |
400,000 |
396,805 |
||||||||||||||
|
Total Information Technology |
2,780,902 |
||||||||||||||||||
|
Telecommunication Services — 1.1% |
|||||||||||||||||||
|
AT&T Inc. |
4.450 |
% |
4/1/24 |
425,000 |
432,533 |
||||||||||||||
|
Verizon Communications Inc. |
4.329 |
% |
9/21/28 |
327,000 |
328,991 |
||||||||||||||
|
Verizon Communications Inc. |
4.500 |
% |
8/10/33 |
350,000 |
346,396 |
||||||||||||||
|
Verizon Communications Inc. |
5.250 |
% |
3/16/37 |
335,000 |
349,989 |
||||||||||||||
|
Total Telecommunication Services |
1,457,909 |
||||||||||||||||||
|
Utilities — 1.7% |
|||||||||||||||||||
|
DTE Electric Co. |
4.050 |
% |
5/15/48 |
380,000 |
377,505 |
||||||||||||||
|
Duke Energy Carolinas LLC |
3.350 |
% |
5/15/22 |
955,000 |
964,363 |
||||||||||||||
|
Georgia Power Co. |
3.250 |
% |
4/1/26 |
345,000 |
322,923 |
||||||||||||||
|
Southern Power Co. |
1.950 |
% |
12/15/19 |
545,000 |
536,902 |
||||||||||||||
|
Total Utilities |
2,201,693 |
||||||||||||||||||
|
Total Corporate Bonds (Cost — $22,099,735) |
21,879,496 |
||||||||||||||||||
|
Foreign Government Agency Issues — 2.0% |
|||||||||||||||||||
|
International Bank for Reconstruction & Development |
3.125 |
% |
11/20/25 |
930,000 |
958,304 |
||||||||||||||
|
International Finance Corp. |
1.750 |
% |
3/30/20 |
850,000 |
840,860 |
||||||||||||||
|
International Finance Corp. |
2.000 |
% |
10/24/22 |
785,000 |
767,763 |
||||||||||||||
|
Total Foreign Government Agency Issues (Cost — $2,556,953) |
2,566,927 |
||||||||||||||||||
|
Mortgage Backed Securities — 0.6% |
|||||||||||||||||||
|
Federal Home Loan Mortgage Corporation (FHLMC) |
|||||||||||||||||||
|
Gold Pool E01603 |
5.000 |
% |
3/1/19 |
2,429 |
2,456 |
||||||||||||||
|
Gold Pool G18082 |
5.000 |
% |
11/1/20 |
17,213 |
17,577 |
||||||||||||||
|
Gold Pool G12379 |
4.500 |
% |
6/1/21 |
18,153 |
18,504 |
||||||||||||||
|
Gold Pool J04311 |
6.000 |
% |
2/1/22 |
19,694 |
20,132 |
||||||||||||||
|
Gold Pool C91417 |
3.500 |
% |
1/1/32 |
126,550 |
128,893 |
||||||||||||||
|
Gold Pool A35826 |
5.000 |
% |
7/1/35 |
43,361 |
45,427 |
||||||||||||||
|
Gold Pool G08112 |
6.000 |
% |
2/1/36 |
86,280 |
94,258 |
||||||||||||||
|
Gold Pool G02564 |
6.500 |
% |
1/1/37 |
45,437 |
53,472 |
||||||||||||||
|
Gold Pool G08179 |
5.500 |
% |
2/1/37 |
33,475 |
36,095 |
||||||||||||||
|
Gold Pool A65694 |
6.000 |
% |
9/1/37 |
38,920 |
42,494 |
||||||||||||||
|
Federal National Mortgage Association (FNMA) |
|||||||||||||||||||
|
Pool 490446 |
6.500 |
% |
3/1/29 |
15 |
16 |
||||||||||||||
|
Pool 808156 |
4.500 |
% |
2/1/35 |
9,720 |
10,068 |
||||||||||||||
|
Pool 891596 |
5.500 |
% |
6/1/36 |
987 |
1,063 |
||||||||||||||
|
Pool 190375 |
5.500 |
% |
11/1/36 |
5,646 |
6,081 |
||||||||||||||
|
Pool 916386 |
6.000 |
% |
5/1/37 |
40,321 |
43,941 |
||||||||||||||
|
Pool 946594 |
6.000 |
% |
9/1/37 |
35,990 |
39,211 |
||||||||||||||
1919 Funds 2018 Annual Report
44
1919 Socially Responsive Balanced Fund
|
Security |
Rate |
Maturity Date |
Face Amount |
Value |
|||||||||||||||
|
Mortgage Backed Securities — continued |
|||||||||||||||||||
|
General National Mortgage Association (GNMA) |
|||||||||||||||||||
|
Gold Pool 550763X |
5.000 |
% |
12/15/35 |
$ |
147,894 |
$ |
156,829 |
||||||||||||
|
Gold Pool 003922M |
7.000 |
% |
11/20/36 |
21,631 |
25,109 |
||||||||||||||
|
Total Mortgage Backed Securities (Cost — $692,063) |
741,626 |
||||||||||||||||||
|
U.S. Government & Agency Obligations — 9.1% |
|||||||||||||||||||
|
Federal Home Loan Bank (FHLB) |
5.500 |
% |
7/15/36 |
125,000 |
161,013 |
||||||||||||||
|
Federal Home Loan Mortgage Corp (FHLMC) |
3.750 |
% |
3/27/19 |
375,000 |
376,165 |
||||||||||||||
|
Federal Home Loan Mortgage Corp (FHLMC) |
1.250 |
% |
10/2/19 |
245,000 |
242,486 |
||||||||||||||
|
Federal Home Loan Mortgage Corp (FHLMC) |
6.750 |
% |
9/15/29 |
115,000 |
153,662 |
||||||||||||||
|
Federal Home Loan Mortgage Corp (FHLMC) |
6.250 |
% |
7/15/32 |
380,000 |
508,141 |
||||||||||||||
|
Federal National Mortgage Association (FNMA) |
1.250 |
% |
5/6/21 |
520,000 |
505,109 |
||||||||||||||
|
Federal National Mortgage Association (FNMA) |
6.250 |
% |
5/15/29 |
435,000 |
558,502 |
||||||||||||||
|
Federal National Mortgage Association (FNMA) |
6.625 |
% |
11/15/30 |
303,000 |
406,686 |
||||||||||||||
|
United States Treasury Bonds |
7.875 |
% |
2/15/21 |
800,000 |
888,516 |
||||||||||||||
|
United States Treasury Bonds |
8.000 |
% |
11/15/21 |
250,000 |
287,993 |
||||||||||||||
|
United States Treasury Bonds |
7.250 |
% |
8/15/22 |
780,000 |
907,832 |
||||||||||||||
|
United States Treasury Bonds |
7.625 |
% |
11/15/22 |
850,000 |
1,009,823 |
||||||||||||||
|
United States Treasury Bonds |
7.125 |
% |
2/15/23 |
325,000 |
383,417 |
||||||||||||||
|
United States Treasury Bonds |
6.250 |
% |
8/15/23 |
550,000 |
639,214 |
||||||||||||||
|
United States Treasury Bonds |
7.500 |
% |
11/15/24 |
1,105,000 |
1,401,019 |
||||||||||||||
|
United States Treasury Bonds |
7.625 |
% |
2/15/25 |
390,000 |
501,074 |
||||||||||||||
|
United States Treasury Bonds |
6.875 |
% |
8/15/25 |
100,000 |
125,982 |
||||||||||||||
|
United States Treasury Bonds |
6.750 |
% |
8/15/26 |
90,000 |
115,740 |
||||||||||||||
|
United States Treasury Bonds |
6.500 |
% |
11/15/26 |
135,000 |
172,099 |
||||||||||||||
|
United States Treasury Bonds |
6.125 |
% |
11/15/27 |
215,000 |
273,248 |
||||||||||||||
|
United States Treasury Bonds |
5.500 |
% |
8/15/28 |
60,000 |
74,140 |
||||||||||||||
|
United States Treasury Bonds |
3.500 |
% |
2/15/39 |
573,000 |
627,043 |
||||||||||||||
|
United States Treasury Bonds |
4.375 |
% |
11/15/39 |
204,000 |
250,223 |
||||||||||||||
|
United States Treasury Notes |
3.625 |
% |
2/15/20 |
625,000 |
631,860 |
||||||||||||||
|
United States Treasury Notes |
2.625 |
% |
8/15/20 |
900,000 |
901,477 |
||||||||||||||
|
Total U.S. Government & Agency Obligations (Cost — $11,935,442) |
12,102,464 |
||||||||||||||||||
|
Shares |
|||||||||||||||||||
|
Short-Term Investment — 7.2% |
|||||||||||||||||||
|
Fidelity Investments Money Market — Government Portfolio — Class I |
2.250 |
% |
9,455,872 |
9,455,872 |
(c) |
||||||||||||||
|
Total Short-Term Investment (Cost — $9,455,872) |
9,455,872 |
||||||||||||||||||
|
Total Investments — 100.0% (Cost — $108,410,760) |
131,652,764 |
||||||||||||||||||
|
Liabilities in Excess of Other Assets — (0.0)% |
(31,368 |
) |
|||||||||||||||||
|
Total Net Assets — 100.0% |
$ |
131,621,396 |
|||||||||||||||||
1919 Funds 2018 Annual Report
45
Schedule of investments (cont'd)
December 31, 2018
1919 Socially Responsive Balanced Fund
Notes:
* Non-income producing security.
(a) Variable rate security. Reference rate and spread are included in the description.
(b) Fixed to floating rate. Effective date of change and formula disclosed.
(c) The rate is the annualized seven-day yield at period end.
The Accompanying Notes are an Integral Part of these Financial Statements.
1919 Funds 2018 Annual Report
46
1919 Socially Responsive Balanced Fund
Statement of assets and liabilities
December 31, 2018
|
Assets: |
|||||||
|
Investments in securities at value (cost $108,410,760) |
$ |
131,652,764 |
|||||
|
Receivable for Fund shares sold |
721,463 |
||||||
|
Dividends and interest receivable |
484,178 |
||||||
|
Prepaid expenses |
29,761 |
||||||
|
Total Assets |
132,888,166 |
||||||
|
Liabilities: |
|||||||
|
Payable for Fund shares repurchased |
1,028,133 |
||||||
|
Advisory fees payable |
68,435 |
||||||
|
Distribution fees payable |
56,399 |
||||||
|
Accrued other expenses |
113,803 |
||||||
|
Total Liabilities |
1,266,770 |
||||||
|
Net Assets |
$ |
131,621,396 |
|||||
|
Components of Net Assets: |
|||||||
|
Paid-in capital |
$ |
108,129,677 |
|||||
|
Total distributable earnings |
23,491,719 |
||||||
|
Net Assets |
$ |
131,621,396 |
|||||
|
Class A: |
|||||||
|
Net Assets |
$ |
100,583,783 |
|||||
|
Issued and Outstanding |
6,061,118 |
||||||
|
Net Asset Value and Redemption Price |
$ |
16.59 |
|||||
|
Maximum Public Offering Price (based on maximum initial sales charge of 5.75%) |
$ |
17.60 |
|||||
|
Class B:^ |
|||||||
|
Net Assets |
$ |
278,802 |
|||||
|
Issued and Outstanding |
17,318 |
||||||
|
Net Asset Value, Redemption Price* and Offering Price Per Share |
$ |
16.10 |
|||||
|
Class C: |
|||||||
|
Net Assets |
$ |
12,732,049 |
|||||
|
Issued and Outstanding |
761,257 |
||||||
|
Net Asset Value, Redemption Price* and Offering Price Per Share |
$ |
16.73 |
|||||
|
Class I: |
|||||||
|
Net Assets |
$ |
18,026,762 |
|||||
|
Issued and Outstanding |
1,087,791 |
||||||
|
Net Asset Value, Redemption Price and Offering Price Per Share |
$ |
16.57 |
|||||
^ Class B Shares are no longer offered for purchase by new or existing shareholders. Class B shares continue to be available for dividend reinvestment.
* Redemption price per share is NAV of Class B and C shares reduced by a CDSC of up to 5.00% and 1.00%, respectively, contingent upon timing of redemption (See Note 3).
The Accompanying Notes are an Integral Part of these Financial Statements.
1919 Funds 2018 Annual Report
47
1919 Socially Responsive Balanced Fund
Statement of operations
For the Year Ended December 31, 2018
|
Investment Income: |
|||||||
|
Dividend income |
$ |
1,227,926 |
|||||
|
Interest income |
1,194,038 |
||||||
|
Total Investment Income |
2,421,964 |
||||||
|
Expenses: |
|||||||
|
Advisory fees (Note 3) |
849,877 |
||||||
|
Distribution fees (Note 6) |
393,323 |
||||||
|
Transfer agent fees and expenses (Note 3 & Note 6) |
263,333 |
||||||
|
Administration and fund accounting fees (Note 3) |
104,879 |
||||||
|
Registration fees |
53,936 |
||||||
|
Shareholder reporting fees |
18,402 |
||||||
|
Audit fees |
16,999 |
||||||
|
Legal fees |
13,075 |
||||||
|
Trustees' fees (Note 3) |
11,796 |
||||||
|
Miscellaneous |
9,505 |
||||||
|
Custody fees (Note 3) |
8,576 |
||||||
|
Compliance fees (Note 3) |
6,286 |
||||||
|
Insurance fees |
3,774 |
||||||
|
Total Expenses |
1,753,761 |
||||||
|
Expenses waived by the Adviser (Note 3) |
(41,658 |
) |
|||||
|
Net Expenses |
1,712,103 |
||||||
|
Net Investment Income |
709,861 |
||||||
|
Realized and Unrealized Gain (Loss) on Investments |
|||||||
|
Net Realized Gain on Investments |
5,507,004 |
||||||
|
Net Change in Unrealized Appreciation/Depreciation on Investments |
(8,331,093 |
) |
|||||
|
Net Realized and Unrealized Loss on Investments |
(2,824,089 |
) |
|||||
|
Net Decrease in Net Assets Resulting from Operations |
$ |
(2,114,228 |
) |
||||
The Accompanying Notes are an Integral Part of these Financial Statements.
1919 Funds 2018 Annual Report
48
1919 Socially Responsive Balanced Fund
Statements of changes in net assets
|
For the year ended December 31, |
2018 |
2017 |
|||||||||
|
Increase (Decrease) in Net Assets from: Operations: |
|||||||||||
|
Net investment income |
$ |
709,861 |
$ |
668,018 |
|||||||
|
Net realized gain on investments |
5,507,004 |
8,766,646 |
|||||||||
|
Net change in unrealized appreciation/depreciation on investments |
(8,331,093 |
) |
8,837,646 |
||||||||
|
Net Increase (Decrease) in Net Assets Resulting from Operations |
(2,114,228 |
) |
18,272,310 |
||||||||
|
Distributions to Shareholders: |
|||||||||||
|
Class A |
(6,659,683 |
) |
(6,195,276 |
) |
|||||||
|
Class B |
(17,650 |
) |
(43,607 |
) |
|||||||
|
Class C |
(729,567 |
) |
(639,153 |
) |
|||||||
|
Class I |
(1,245,184 |
) |
(531,577 |
) |
|||||||
|
Total Distributions to Shareholders |
(8,652,084 |
) |
(7,409,613 |
)* |
|||||||
|
Capital Transactions: |
|||||||||||
|
Net proceeds from shares sold |
27,863,173 |
11,849,243 |
|||||||||
|
Reinvestment of distributions |
8,268,323 |
7,084,727 |
|||||||||
|
Cost of shares repurchased |
(21,849,964 |
) |
(18,614,137 |
) |
|||||||
|
Net Increase in Net Assets From Capital Transactions |
14,281,532 |
319,833 |
|||||||||
|
Total Increase in Net Assets |
3,515,220 |
11,182,530 |
|||||||||
|
Net Assets: |
|||||||||||
|
Beginning of year |
128,106,176 |
116,923,646 |
|||||||||
|
End of year |
$ |
131,621,396 |
$ |
128,106,176 |
** |
||||||
* Includes distributions from net investment income for Class A, Class C and Class I of $590,745, $3,443 and $63,453, and distributions from net realized gains for Class A, Class B, Class C and Class I of $5,604,531, $43,607, $635,710 and $468,124, respectively.
** Includes distributions in excess of net investment income of $(14,322).
The Accompanying Notes are an Integral Part of these Financial Statements.
1919 Funds 2018 Annual Report
49
1919 Socially Responsive Balanced Fund
Financial highlights
For a share of beneficial interest outstanding through each period ended December 31, unless otherwise noted:
|
Class A Shares |
2018 |
2017 |
2016 |
2015 |
20141 |
20142 |
|||||||||||||||||||||
|
Net asset value, beginning of period |
$ |
17.94 |
$ |
16.39 |
$ |
16.65 |
$ |
18.49 |
$ |
19.17 |
$ |
18.54 |
|||||||||||||||
|
Income (loss) from investment operations: |
|||||||||||||||||||||||||||
|
Net investment income3 |
0.10 |
0.11 |
0.11 |
0.12 |
0.12 |
0.11 |
|||||||||||||||||||||
|
Net realized and unrealized gain (loss) on investments |
(0.28 |
) |
2.55 |
0.85 |
(0.50 |
) |
2.00 |
2.15 |
|||||||||||||||||||
|
Total income (loss) from Investment operations |
(0.18 |
) |
2.66 |
0.96 |
(0.38 |
) |
2.12 |
2.26 |
|||||||||||||||||||
|
Less distributions: |
|||||||||||||||||||||||||||
|
From net investment income |
(0.10 |
) |
(0.10 |
) |
(0.11 |
) |
(0.13 |
) |
(0.12 |
) |
(0.12 |
) |
|||||||||||||||
|
From net realized gain on investments |
(1.07 |
) |
(1.01 |
) |
(1.11 |
) |
(1.33 |
) |
(2.68 |
) |
(1.51 |
) |
|||||||||||||||
|
Total distributions |
(1.17 |
) |
(1.11 |
) |
(1.22 |
) |
(1.46 |
) |
(2.80 |
) |
(1.63 |
) |
|||||||||||||||
|
Net asset value, end of period |
$ |
16.59 |
$ |
17.94 |
$ |
16.39 |
$ |
16.65 |
$ |
18.49 |
$ |
19.17 |
|||||||||||||||
|
Total return4 |
-1.31 |
% |
16.36 |
% |
5.76 |
% |
-2.08 |
% |
10.98 |
%5 |
12.31 |
% |
|||||||||||||||
|
Supplemental data and ratios: |
|||||||||||||||||||||||||||
|
Net assets, end of period (in thousands) |
$ |
100,584 |
$ |
106,418 |
$ |
97,110 |
$ |
102,033 |
$ |
114,507 |
$ |
121,901 |
|||||||||||||||
|
Ratios to average net assets Gross expenses |
1.28 |
% |
1.32 |
% |
1.36 |
% |
1.21 |
% |
1.23 |
%6 |
1.27 |
% |
|||||||||||||||
|
Net expenses7 |
1.25 |
1.26 |
1.27 |
1.21 |
1.236,8 |
1.278 |
|||||||||||||||||||||
|
Net investment income |
0.55 |
0.62 |
0.66 |
0.65 |
0.546 |
0.59 |
|||||||||||||||||||||
|
Portfolio turnover rate |
13 |
% |
30 |
% |
32 |
% |
26 |
% |
23 |
%5 |
22 |
% |
|||||||||||||||
1 For the period ended February 1, 2014 through December 31, 2014. See Note 1.
2 For the year ended January 31.
3 Per share amounts have been calculated using the average shares method.
4 Performance figures, exclusive of sales charges, may reflect compensating balance arrangements, fee waivers and/or expense reimbursements. In the absence of compensating balance arrangements, fee waivers and/or expense reimbursements, the total return would have been lower. Past performance is no guarantee of future results.
5 Not Annualized
6 Annualized.
7 Effective April 30, 2017, the advisor agreed to limit the ratio of expenses, other than brokerage, interest, taxes, extraordinary expenses and acquired fund fees and expenses, to 1.25% of the average net assets of Class A shares. This expense limitation arrangement cannot be terminated prior to April 30, 2020 without the Board of Trustees' consent. Prior to April 30, 2017, this limitation was 1.27%. See Note 3.
8 The impact of compensating balance arrangements, if any, was less than 0.01%.
The Accompanying Notes are an Integral Part of these Financial Statements.
1919 Funds 2018 Annual Report
50
For a share of beneficial interest outstanding through each period ended December 31, unless otherwise noted:
|
Class B Shares |
2018 |
2017 |
2016 |
2015 |
20141 |
20142 |
|||||||||||||||||||||
|
Net asset value, beginning of period |
$ |
17.48 |
$ |
16.04 |
$ |
16.40 |
$ |
18.23 |
$ |
19.03 |
$ |
18.51 |
|||||||||||||||
|
Income (loss) from investment operations: |
|||||||||||||||||||||||||||
|
Net investment income (loss)3 |
(0.04 |
) |
(0.04 |
) |
(0.08 |
) |
0.004 |
(0.12 |
) |
(0.10 |
) |
||||||||||||||||
|
Net realized and unrealized gain (loss) on investments |
(0.27 |
) |
2.49 |
0.83 |
(0.48 |
) |
2.00 |
2.13 |
|||||||||||||||||||
|
Total income (loss) from investment operations |
(0.31 |
) |
2.45 |
0.75 |
(0.48 |
) |
1.88 |
2.03 |
|||||||||||||||||||
|
Less distributions: |
|||||||||||||||||||||||||||
|
From net investment income |
— |
— |
— |
(0.02 |
) |
(0.00 |
)4 |
— |
|||||||||||||||||||
|
From net realized gain on investments |
(1.07 |
) |
(1.01 |
) |
(1.11 |
) |
(1.33 |
) |
(2.68 |
) |
(1.51 |
) |
|||||||||||||||
|
Total distributions |
(1.07 |
) |
(1.01 |
) |
(1.11 |
) |
(1.35 |
) |
(2.68 |
) |
(1.51 |
) |
|||||||||||||||
|
Net asset value, end of period |
$ |
16.10 |
$ |
17.48 |
$ |
16.04 |
$ |
16.40 |
$ |
18.23 |
$ |
19.03 |
|||||||||||||||
|
Total return5 |
-2.02 |
% |
15.33 |
% |
4.55 |
% |
-2.69 |
% |
9.84 |
%6 |
11.03 |
% |
|||||||||||||||
|
Supplemental data and ratios: |
|||||||||||||||||||||||||||
|
Net assets, end of period (in thousands) |
$ |
279 |
$ |
740 |
$ |
1,494 |
$ |
2,468 |
$ |
3,942 |
$ |
6,433 |
|||||||||||||||
|
Ratios to average net assets Gross expenses |
3.01 |
% |
2.89 |
% |
2.61 |
% |
1.83 |
% |
2.43 |
%7 |
2.39 |
% |
|||||||||||||||
|
Net expenses8 |
2.00 |
2.16 |
2.39 |
1.83 |
2.437,9 |
2.399 |
|||||||||||||||||||||
|
Net investment income (loss) |
(0.24 |
) |
(0.26 |
) |
(0.45 |
) |
0.02 |
(0.66 |
)7 |
(0.53 |
) |
||||||||||||||||
|
Portfolio turnover rate |
13 |
% |
30 |
% |
32 |
% |
26 |
% |
23 |
%6 |
22 |
% |
|||||||||||||||
1 For the period ended February 1, 2014 through December 31, 2014. See Note 1.
2 For the year ended January 31.
3 Per share amounts have been calculated using the average shares method.
4 Amount represents less than $0.01 per share.
5 Performance figures, exclusive of CDSC, may reflect compensating balance arrangements, fee waivers and/or expense reimbursements. In the absence of compensating balance arrangements, fee waivers and/or expense reimbursements, the total return would have been lower. Past performance is no guarantee of future results.
6 Not Annualized
7 Annualized
8 Effective April 30, 2017, the advisor agreed to limit the ratio of expenses, other than brokerage, interest, taxes, extraordinary expenses and acquired fund fees and expenses, to 2.00% of the average net assets of Class B shares. This expense limitation arrangement cannot be terminated prior to April 30, 2020 without the Board of Trustees' consent. Prior to April 30, 2017, this limitation was 2.39%. See Note 3.
9 The impact of compensating balance arrangements, if any, was less than 0.01%.
The Accompanying Notes are an Integral Part of these Financial Statements.
1919 Funds 2018 Annual Report
51
1919 Socially Responsive Balanced Fund
Financial highlights (cont'd)
For a share of beneficial interest outstanding through each period ended December 31, unless otherwise noted:
|
Class C Shares |
2018 |
2017 |
2016 |
2015 |
20141 |
20142 |
|||||||||||||||||||||
|
Net asset value, beginning of period |
$ |
18.11 |
$ |
16.57 |
$ |
16.83 |
$ |
18.69 |
$ |
19.36 |
$ |
18.73 |
|||||||||||||||
|
Income (loss) from investment operations: |
|||||||||||||||||||||||||||
|
Net investment loss3 |
(0.03 |
) |
(0.02 |
) |
(0.01 |
) |
(0.02 |
) |
(0.03 |
) |
(0.02 |
) |
|||||||||||||||
|
Net realized and unrealized gain (loss) on investments |
(0.28 |
) |
2.58 |
0.86 |
(0.51 |
) |
2.05 |
2.16 |
|||||||||||||||||||
|
Total income (loss) from investment operations |
(0.31 |
) |
2.56 |
0.85 |
(0.53 |
) |
2.02 |
2.14 |
|||||||||||||||||||
|
Less distributions: |
|||||||||||||||||||||||||||
|
From net investment income |
— |
(0.01 |
) |
— |
(0.00 |
)4 |
(0.01 |
) |
(0.00 |
)4 |
|||||||||||||||||
|
From net realized gain on investments |
(1.07 |
) |
(1.01 |
) |
(1.11 |
) |
(1.33 |
) |
(2.68 |
) |
(1.51 |
) |
|||||||||||||||
|
Total distributions |
(1.07 |
) |
(1.02 |
) |
(1.11 |
) |
(1.33 |
) |
(2.69 |
) |
(1.51 |
) |
|||||||||||||||
|
Net asset value, end of period |
$ |
16.73 |
$ |
18.11 |
$ |
16.57 |
$ |
16.83 |
$ |
18.69 |
$ |
19.36 |
|||||||||||||||
|
Total return5 |
-1.95 |
% |
15.47 |
% |
5.02 |
% |
-2.82 |
% |
10.30 |
%6 |
11.51 |
% |
|||||||||||||||
|
Supplemental data and ratios: |
|||||||||||||||||||||||||||
|
Net assets, end of period (in thousands) |
$ |
12,732 |
$ |
11,982 |
$ |
12,359 |
$ |
13,458 |
$ |
14,952 |
$ |
12,122 |
|||||||||||||||
|
Ratios to average net assets Gross expenses |
1.97 |
% |
2.01 |
% |
2.04 |
% |
2.01 |
% |
1.93 |
%7 |
1.98 |
% |
|||||||||||||||
|
Net expenses9 |
1.97 |
1.99 |
1.98 |
1.98 |
1.927,8 |
1.988 |
|||||||||||||||||||||
|
Net investment loss |
(0.17 |
) |
(0.12 |
) |
(0.05 |
) |
(0.11 |
) |
(0.15 |
)7 |
(0.12 |
) |
|||||||||||||||
|
Portfolio turnover rate |
13 |
% |
30 |
% |
32 |
% |
26 |
% |
23 |
%6 |
22 |
% |
|||||||||||||||
1 For the period ended February 1, 2014 through December 31, 2014. See Note 1.
2 For the year ended January 31.
3 Per share amounts have been calculated using the average shares method.
4 Amount represents less than $0.01 per share.
5 Performance figures, exclusive of CDSC, may reflect compensating balance arrangements, fee waivers and/or expense reimbursements. In the absence of compensating balance arrangements, fee waivers and/or expense reimbursements, the total return would have been lower. Past performance is no guarantee of future results.
6 Not Annualized.
7 Annualized.
8 The impact of compensating balance arrangements, if any, was less than 0.01%.
9 Effective April 30, 2017, the advisor agreed to limit the ratio of expenses, other than brokerage, interest, taxes, extraordinary expenses and acquired fund fees and expenses, to 2.00% of the average net assets of Class C shares. This expense limitation arrangement cannot be terminated prior to April 30, 2020 without the Board of Trustees' consent. Prior to April 30, 2017, this limitation was 1.98%. See Note 3.
The Accompanying Notes are an Integral Part of these Financial Statements.
1919 Funds 2018 Annual Report
52
For a share of beneficial interest outstanding through each period ended December 31, unless otherwise noted:
|
Class I Shares |
2018 |
2017 |
2016 |
2015 |
20141 |
20142 |
|||||||||||||||||||||
|
Net asset value, beginning of period |
$ |
17.91 |
$ |
16.36 |
$ |
16.63 |
$ |
18.47 |
$ |
19.15 |
$ |
18.54 |
|||||||||||||||
|
Income (loss) from investment operations: |
|||||||||||||||||||||||||||
|
Net investment income3 |
0.16 |
0.15 |
0.16 |
0.16 |
0.18 |
0.17 |
|||||||||||||||||||||
|
Net realized and unrealized gain (loss) on investments |
(0.29 |
) |
2.56 |
0.84 |
(0.50 |
) |
1.99 |
2.14 |
|||||||||||||||||||
|
Total income (loss) from investment operations |
(0.13 |
) |
2.71 |
1.00 |
(0.34 |
) |
2.17 |
2.31 |
|||||||||||||||||||
|
Less distributions: |
|||||||||||||||||||||||||||
|
From net investment income |
(0.14 |
) |
(0.15 |
) |
(0.16 |
) |
(0.17 |
) |
(0.17 |
) |
(0.19 |
) |
|||||||||||||||
|
From net realized gain on investments |
(1.07 |
) |
(1.01 |
) |
(1.11 |
) |
(1.33 |
) |
(2.68 |
) |
(1.51 |
) |
|||||||||||||||
|
Total distributions |
(1.21 |
) |
(1.16 |
) |
(1.27 |
) |
(1.50 |
) |
(2.85 |
) |
(1.70 |
) |
|||||||||||||||
|
Net asset value, end of period |
$ |
16.57 |
$ |
17.91 |
$ |
16.36 |
$ |
16.63 |
$ |
18.47 |
$ |
19.15 |
|||||||||||||||
|
Total return4 |
-1.00 |
% |
16.71 |
% |
6.02 |
% |
-1.89 |
% |
11.31 |
%5 |
12.61 |
% |
|||||||||||||||
|
Supplemental data and ratios: |
|||||||||||||||||||||||||||
|
Net assets, end of period (in thousands) |
$ |
18,027 |
$ |
8,965 |
$ |
5,961 |
$ |
5,207 |
$ |
4,002 |
$ |
4,588 |
|||||||||||||||
|
Ratios to average net assets Gross expenses |
0.96 |
% |
1.01 |
% |
1.06 |
% |
1.06 |
% |
1.02 |
%6 |
1.07 |
% |
|||||||||||||||
|
Net expenses8 |
0.96 |
1.00 |
1.00 |
1.00 |
0.976,7 |
1.007 |
|||||||||||||||||||||
|
Net investment income |
0.89 |
0.86 |
1.00 |
0.87 |
0.816 |
0.85 |
|||||||||||||||||||||
|
Portfolio turnover rate |
13 |
% |
30 |
% |
32 |
% |
26 |
% |
23 |
%5 |
22 |
% |
|||||||||||||||
1 For the period ended January 31, 2014 through December 31, 2014. See Note 1.
2 For the year ended January 31.
3 Per share amounts have been calculated using the average shares method.
4 Performance figures may reflect compensating balance arrangements, fee waivers and/or expense reimbursements. In the absence of compensating balance arrangements, fee waivers and/or expense reimbursements, the total return would have been lower. Past performance is no guarantee of future results.
5 Not Annualized.
6 Annualized.
7 The impact of compensating balance arrangements, if any, was less than 0.01%.
8 The advisor agreed to limit the ratio of expenses, other than brokerage, interest, taxes, extraordinary expenses and acquired fund fees and expenses, to 1.00% of the average net assets of Class I shares. This expense limitation arrangement cannot be terminated prior to April 30, 2020 without the Board of Trustees' consent. See Note 3.
The Accompanying Notes are an Integral Part of these Financial Statements.
1919 Funds 2018 Annual Report
53
Notes to financial statements
Note 1. Organization
The 1919 Financial Services Fund (the "Financial Services Fund"), 1919 Maryland Tax-Free Income Fund (the "Maryland Fund") and 1919 Socially Responsive Balanced Fund (the "Socially Responsive Fund", each a Fund and together, the "Funds") are separate series of the Trust for Advised Portfolios (the "Trust"), a Delaware Statutory Trust registered under the Investment Company Act of 1940, as amended (the "1940 Act") as an open-end investment management company. The Financial Services Fund and Maryland Tax-Free Fund are registered as non-diversified investment series; the Socially Responsive Fund is registered as a diversified series.
The Funds were converted to the Trust on November 10, 2014, and were previously organized in the Legg Mason Partners Equity Trust as the Legg Mason Investment Counsel ("LMIC") Financial Services Fund and LMIC Social Awareness Fund, and in the Legg Mason Tax-Free Income Fund as the LMIC Maryland Tax-Free Income Trust (the "Predecessor Funds"). Concurrent with the reorganization into the Trust, the Board of Trustees (the "Board") of the Trust elected to change the fiscal year end for each of the Funds to December 31.
The Financial Services Fund seeks long-term capital appreciation by investing primarily in common stocks. The Maryland Fund seeks a high level of current income exempt from federal and Maryland state and local income taxes, consistent with prudent investment risk and preservation of capital. The Socially Responsive Fund seeks to provide high total return consisting of capital appreciation and current income.
Note 2. Significant accounting policies
The following is a summary of significant accounting policies consistently followed by the Funds in the preparation of their financial statements. These policies are in conformity with accounting principles generally accepted in the United States of America ("U.S. GAAP") for investment companies. The Funds are each considered an investment company under U.S. GAAP and follow the accounting and reporting guidance applicable to investment companies in the Financial Accounting Standards Board Accounting Standards Codification Topic 946. The presentation of financial statements in conformity with U.S. GAAP requires management to make estimates and assumptions that affect the reported amounts of assets and liabilities and disclosure of contingent assets and liabilities at the date of the financial statements and the reported amounts of income and expenses. Actual results may differ from those estimates.
(a) Securities valuation. Investments in securities traded on a national securities exchange are valued at the last reported sales price on the exchange on which the security is principally traded. Securities traded on the NASDAQ exchanges are valued at the NASDAQ Official Closing Price ("NOCP"). Exchange-traded securities for which no sale was reported and NASDAQ securities for which there is no NOCP are valued at the mean of the most recent quoted bid and ask prices. Unlisted securities held by the Funds are valued at the last sale price in the over-the-counter ("OTC") market. If there is no trading on a particular day, the mean between the last quoted bid and ask price is used.
1919 Funds 2018 Annual Report
54
Long-term fixed income securities are valued using prices provided by an independent pricing service approved by the Board. Pricing services may use various valuation methodologies, including matrix pricing and other analytical models as well as market transactions and dealer quotations. Securities for which market quotations are not readily available are valued at their estimated fair value as determined in good faith by 1919 Investment Counsel, LLC (the "Adviser") under procedures established by and under the general supervision and responsibility of the Board.
Various inputs are used in determining the value of the Funds' investments. These inputs are summarized into three broad levels and described below:
• Level 1 — quoted prices in active markets for identical investments
• Level 2 — other significant observable inputs (including quoted prices for similar investments, interest rates, prepayment speeds, credit risk, etc.).
• Level 3 — significant unobservable inputs, including the Fund's own assumptions in determining the fair value of investments.
The inputs or methodologies used for valuing securities are not necessarily an indication of the risk associated with investing in those securities. The following is a summary of the inputs used in valuing the Funds' assets carried at value:
FINANCIAL SERVICES FUND
|
Description |
Level 1 |
Level 2 |
Level 3 |
Total |
|||||||||||||||
|
Long-term investments*: |
|||||||||||||||||||
|
Common Stocks |
$ |
219,185,179 |
$ |
— |
$ |
— |
$ |
219,185,179 |
|||||||||||
| Total long-term investments |
219,185,179 |
— |
— |
219,185,179 |
|||||||||||||||
| Short-term investment |
4,082,804 |
— |
— |
4,082,804 |
|||||||||||||||
|
Total investments |
$ |
223,267,983 |
$ |
— |
$ |
— |
$ |
223,267,983 |
|||||||||||
MARYLAND FUND
|
Description |
Level 1 |
Level 2 |
Level 3 |
Total |
|||||||||||||||
|
Long-term investments*: |
|||||||||||||||||||
|
Municipal Bonds |
$ |
— |
$ |
83,658,733 |
$ |
— |
$ |
83,658,733 |
|||||||||||
|
Total investments |
$ |
— |
$ |
83,658,733 |
$ |
— |
$ |
83,658,733 |
|||||||||||
SOCIALLY RESPONSIVE BALANCED FUND
|
Description |
Level 1 |
Level 2 |
Level 3 |
Total |
|||||||||||||||
|
Long-term investments* |
|||||||||||||||||||
|
Common Stocks |
$ |
84,630,055 |
$ |
— |
$ |
— |
$ |
84,630,055 |
|||||||||||
|
Collateralized Mortgage Obligations |
— |
276,324 |
— |
276,324 |
|||||||||||||||
|
Corporate Bonds |
— |
21,879,496 |
— |
21,879,496 |
|||||||||||||||
|
Foreign Government Agency Issues |
— |
2,566,927 |
— |
2,566,927 |
|||||||||||||||
|
Mortgage Backed Securities |
— |
741,626 |
— |
741,626 |
|||||||||||||||
|
U.S. Government & Agency Obligations |
— |
12,102,464 |
— |
12,102,464 |
|||||||||||||||
| Total long-term investments |
84,630,055 |
37,566,837 |
— |
122,196,892 |
|||||||||||||||
| Short-term investment |
9,455,872 |
— |
— |
9,455,872 |
|||||||||||||||
|
Total investments |
$ |
94,085,927 |
$ |
37,566,837 |
$ |
— |
$ |
131,652,764 |
|||||||||||
* See Schedule of Investments for additional detailed categorizations.
1919 Funds 2018 Annual Report
55
Notes to financial statements (cont'd)
(b) Foreign currency translation. Investment securities and other assets and liabilities in foreign currencies are translated into U.S. dollar amounts based upon prevailing exchange rates on the date of valuation. Purchases and sales of investment securities and income and expense items denominated in foreign currencies are translated into U.S. dollar amounts based upon prevailing exchange rates on the respective dates of such transactions.
The Funds do not isolate that portion of the results of operations resulting from fluctuations in foreign exchange rates on investments from the fluctuations arising from changes in market prices of securities held. Such fluctuations are included with the net realized and unrealized gain or loss on investments.
Net realized foreign exchange gains or losses arise from sales of foreign currencies, including gains and losses on forward foreign currency contracts, currency gains or losses realized between the trade and settlement dates on securities transactions, and the difference between the amounts of dividends, interest, and foreign withholding taxes recorded on the Funds' books and the U.S. dollar equivalent of the amounts actually received or paid. Net unrealized foreign exchange gains and losses arise from changes in the values of assets and liabilities, other than investments in securities, on the date of valuation, resulting from changes in exchange rates.
Foreign security and currency transactions may involve certain considerations and risks not typically associated with those of U.S. dollar denominated transactions as a result of, among other factors, the possibility of lower levels of governmental supervision and regulation of foreign securities markets and the possibility of political or economic instability. As of December 31, 2018 the Financial Services Fund held foreign currency.
(c) REIT distribution. The character of distributions received from Real Estate Investment Trusts (''REITs'') held by the Financial Services Fund and Socially Responsive Fund are generally comprised of net investment income, capital gains, and return of capital. It is the policy of the Funds to estimate the character of distributions received from underlying REITs based on historical data provided by the REITs. After each calendar year end, REITs report the actual tax character of these distributions. Differences between the estimated and actual amounts reported by the REITs are reflected in the Funds' records in the year in which they are reported by the REITs by adjusting related investment cost basis, capital gains and income, as necessary.
(d) Concentration risk. The Financial Services Fund normally invests at least 80% of its assets in financial services related investments. As a result of this investment policy, an investment in the Fund may be subject to greater risk and market fluctuation than an investment in a fund that invests in securities representing a broader range of investment alternatives.
1919 Funds 2018 Annual Report
56
The Maryland Fund invests substantially all of its assets in securities issued by or on behalf of the State of Maryland, its political subdivisions, municipalities, agencies, instrumentalities, and public authorities. Changes in economic conditions in, or governmental policies of, the State of Maryland could have a significant impact on the performance of the Fund.
The Maryland Fund may focus a significant amount of its investments in a single sector of the municipal securities market. In doing so, the Fund is more susceptible to factors adversely affecting that sector than a fund not following that practice.
The Maryland Fund may invest a significant portion of assets in securities issued by local governments or public authorities that are rated according to their particular creditworthiness, which may vary significantly from the state's general obligations. The value of the Fund's shares will be more susceptible to being materially impacted by a single economic, political or regulatory event affecting those issuers or their securities than shares of a diversified fund.
(e) Foreign investment risk. The Financial Services Fund's investments in foreign securities may involve risks not present in domestic investments. Since securities may be denominated in foreign currencies, may require settlement in foreign currencies or pay interest or dividends in foreign currencies, changes in the relationship of these foreign currencies to the U.S. dollar can significantly affect the value of the investments and earnings of the Fund. Foreign investments may also subject the Fund to foreign government exchange restrictions, expropriation, taxation or other political, social or economic developments, all of which affect the market and/or credit risk of the investments.
(f) Security transactions and investment income. Security transactions are accounted for on a trade date basis. Interest income, adjusted for amortization of premium and accretion of discount, is recorded on the accrual basis. Dividend income is recorded on the ex-dividend date. The cost of investments sold is determined by use of the specific identification method. To the extent any issuer defaults or a credit event occurs that impacts the issuer, the Maryland Fund and Socially Responsive Fund may halt any additional interest income accruals and consider the realizability of interest accrued up to the date of default or credit event.
(g) Distribution to shareholders. The Financial Services Fund makes distributions from net investment income, if any, at least annually. The Maryland Fund declares income distributions each business day to shareholders of record, which are paid monthly. The Maryland Fund intends to satisfy conditions that will enable interest from municipal securities, which is exempt from federal and certain state income taxes, to retain such tax-exempt status when distributed to the shareholders of the Fund. The Socially Responsive Fund makes distributions from net investment income on a quarterly basis. Distributions of net realized gains, if any, are declared at least annually for each of the Funds (these are taxable for shareholders of the Maryland Fund). Distributions to shareholders of the Funds are recorded on the ex-dividend date and are determined in accordance with income tax regulations, which may differ from GAAP.
1919 Funds 2018 Annual Report
57
Notes to financial statements (cont'd)
(h) Indemnifications. In the normal course of business, the Funds enter into contracts that contain a variety of representations, which provide general indemnifications. The Funds' maximum exposure under these arrangements are unknown as this would involve future claims that may be made against the Funds that have not yet occurred. However, based on experience, the Funds expect the risk of loss to be remote.
(i) Share class accounting. Investment income, common expenses and realized/unrealized gains (losses) on investments are allocated to the various classes of the Funds on the basis of daily net assets of each class. Fees relating to a specific class are charged directly to that share class.
(j) Compensating balance arrangements. The Predecessor Funds had an arrangement with their custodian bank whereby a portion of the custodian's fees were paid indirectly by credits earned by the Predecessor Funds' cash on deposit with the bank.
(k) Federal and other taxes. It is the Funds' policy to comply with the federal income and excise tax requirements of the Internal Revenue Code of 1986 (the "Code"), as amended, applicable to regulated investment companies. Accordingly, the Funds intend to distribute their taxable income and net realized gains, if any, to shareholders in accordance with timing requirements imposed by the Code. Therefore, no federal or state income tax provision is required in the Funds' financial statements.
Management has analyzed the Funds' tax positions taken on income tax returns for all open tax years (prior three fiscal years) and has concluded that as of December 31, 2018, no provision for income tax is required in the Funds' financial statements. The Funds' federal and state income and federal excise tax returns for tax years for which the applicable statutes of limitations have not expired are subject to examination by the Internal Revenue Service and state departments of revenue. The Funds have no examination in progress and are not aware of any tax positions for which it is reasonably possible that the total amounts of unrecognized tax benefits will significantly change in the next twelve months.
Under the applicable foreign tax laws, a withholding tax may be imposed on interest, dividends and capital gains at various rates.
Note 3. Investment management agreement and other transactions with affiliates
The Trust has an agreement with the Adviser to furnish investment advisory services to the Funds.
Under the terms of this agreement, the Funds pay an investment management fee, calculated daily and paid monthly for each Fund as follows:
|
Fund |
Annual Rate |
||||||
|
Financial Services Fund |
0.80% on average net assets |
||||||
|
Maryland Fund |
0.55% on average net assets |
||||||
|
Socially Responsive Fund |
0.65% on average net assets up to $100 million 0.61% on next $100 million 0.51% on next $100 million 0.46% thereafter |
||||||
1919 Funds 2018 Annual Report
58
Effective April 30, 2017, the Adviser has contractually agreed through April 30, 2020 to reduce fees and pay expenses (other than interest, commissions, taxes, acquired fund fees and expenses, and extraordinary expenses) so that total annual operating expenses do not exceed the levels set forth below.
|
Fund |
Class A |
Class B |
Class C |
Class I |
|||||||||||||||
|
Financial Services Fund |
1.50 |
% |
N/A |
2.25 |
% |
1.25 |
% |
||||||||||||
|
Maryland Fund |
0.75 |
% |
N/A |
1.30 |
% |
0.60 |
% |
||||||||||||
|
Socially Responsive Fund |
1.25 |
% |
2.00 |
% |
2.00 |
% |
1.00 |
% |
|||||||||||
The arrangements may be terminated or amended at any time after April 30, 2019 by the Board upon 60 days' notice to the Adviser or by the Adviser with consent of the Board. These arrangements, however, may be modified by the Adviser to decrease total annual operating expenses at any time. From November 10, 2014 to April 29, 2017, a similar agreement was in place with limits as follows:
|
Fund |
Class A |
Class B |
Class C |
Class I |
|||||||||||||||
|
Financial Services |
1.46 |
% |
N/A |
2.13 |
% |
1.05 |
% |
||||||||||||
|
Maryland Tax-Free Income Fund |
0.75 |
% |
N/A |
1.30 |
% |
0.60 |
% |
||||||||||||
|
Socially Responsive Balanced Fund |
1.27 |
% |
2.39 |
% |
1.98 |
% |
1.00 |
% |
|||||||||||
Prior to November 10, 2014 the Predecessor Funds for the Financial Services Fund and the Maryland Fund had similar agreements to the current limitations.
The Adviser is permitted to recapture amounts waived and/or reimbursed to a class within a rolling 36 month period from the month the Adviser earned the fee or incurred the expense if the class' total annual operating expenses have fallen to a level below the limits described above. Any such recoupment is contingent upon the subsequent review and approval of the recouped amounts by the Board. The amounts waived are detailed on each Fund's Statement of Operations.
At December 31, 2018, the amounts waived by the Adviser and the eligible recapture periods are as follows:
|
December 31, |
Financial Services Fund |
Maryland Fund |
Socially Responsive Fund |
||||||||||||
| 2019: |
$ |
— |
$ |
279,808 |
$ |
— |
|||||||||
| 2020: |
4,332 |
279,382 |
79,732 |
||||||||||||
| 2021: |
— |
264,876 |
41,658 |
||||||||||||
|
Total |
4,332 |
824,066 |
121,390 |
||||||||||||
U.S. Bancorp Fund Services, LLC, doing business as U.S. Bank Global Fund Services ("Fund Services"), serves as the Funds' administrator and transfer agent. The officers of the Trust are employees of Fund Services. U.S. Bank serves as the Funds' custodian and provides compliance services to the Funds. Quasar Distributors, LLC ("Quasar" or the "Distributor"), an affiliate of Fund Services, acts as the Funds' distributor and principal underwriter. For
1919 Funds 2018 Annual Report
59
Notes to financial statements (cont'd)
the year ended, December 31, 2018, the Funds incurred the following expenses for administration & fund accounting, custody, transfer agent and compliance fees:
|
1919 Financial Services |
1919 Maryland Tax-Free Income Fund |
1919 Socially Responsive Balanced Fund |
|||||||||||||
|
Administration & fund accounting |
$ |
159,084 |
$ |
83,240 |
$ |
104,879 |
|||||||||
|
Custody |
25,980 |
6,073 |
8,576 |
||||||||||||
|
Transfer Agency* |
176,268 |
64,967 |
103,137 |
||||||||||||
|
Compliance |
6,287 |
6,456 |
6,286 |
||||||||||||
* Statement of operations includes combined service fees paid to various intermediaries as detailed on Note 6.
At December 31, 2018, the Funds had payables due to Fund Services and its affiliates for administration & fund accounting, custody, transfer agent and compliance fees to U.S. Bank in the following amounts:
|
1919 Financial Services |
1919 Maryland Tax-Free Income Fund |
1919 Socially Responsive Balanced Fund |
|||||||||||||
|
Administration & fund accounting |
$ |
37,404 |
$ |
20,925 |
$ |
26,966 |
|||||||||
|
Custody |
6,766 |
1,312 |
2,145 |
||||||||||||
|
Transfer Agency |
46,908 |
16,413 |
26,719 |
||||||||||||
|
Compliance |
1,518 |
1,554 |
1,518 |
||||||||||||
The above payable amounts are included in Accrued other expenses in the Statement of assets and liabilities.
The Independent Trustees were paid $35,388 for their services and reimbursement of travel expenses during the year ended December 31, 2018. The Funds pay no compensation to the Interested Trustee or officers of the Trust.
There is a maximum initial sales charge of 5.75% for Class A shares of the Financial Services Fund and Socially Responsive Fund; the maximum initial sales charge for Class A shares of the Maryland Fund is 4.25%. There is a contingent deferred sales charge ("CDSC") of 1.00% on Class C shares for the Funds, which applies if redemption occurs within 12 months from purchase. Class B shares of the Socially Responsive Fund have a CDSC if redeemed within five years of purchase, initially at 5.00% and declining 1.00% annually until the five-year period is complete. In certain cases, Class A shares have a 1.00% CDSC, which applies if redemption occurs within 18 months from purchase payment. This CDSC only applies to those purchases of Class A shares, which, when combined with other purchases in the Funds, equal or exceed $1,000,000 in the aggregate. These purchases do not incur an initial sales charge.
For Class A shares sold by the Distributor, the Distributor will receive the sales charge imposed on purchases of Class A shares (or any contingent deferred sales charge paid on redemptions) and will retain the full amount of such sales charge.
1919 Funds 2018 Annual Report
60
For the year ended December 31, 2018, Quasar, did not retain sales charges on sales of the Class A shares of the Financial Services Fund, Maryland Fund, and Socially Responsive Fund. In addition, for the year ended December 31, 2018, CDSCs paid to Quasar were:
|
CDSCs |
Class A |
Class B |
Class C |
||||||||||||
|
Financial Services Fund |
N/A |
N/A |
$ |
3,340 |
|||||||||||
|
Maryland Fund |
N/A |
N/A |
$ |
132 |
|||||||||||
|
Socially Responsive Fund |
N/A |
$ |
87 |
$ |
182 |
||||||||||
Note 4. Investments transactions
During the year ended December 31, 2018 the aggregate cost of purchases and proceeds from sales of investments (excluding short-term investments) and U.S Government & Agency Obligations were as follow:
FINANCIAL SERVICES FUND
|
Investments |
U.S. Government & Agency Obligations |
||||||||||
|
Purchases |
$ |
64,320,377 |
— |
||||||||
|
Sales |
$ |
47,808,244 |
— |
||||||||
MARYLAND FUND
|
Investments |
U.S. Government & Agency Obligations |
||||||||||
|
Purchases |
$ |
38,938,160 |
— |
||||||||
|
Sales |
$ |
54,660,234 |
— |
||||||||
SOCIALLY RESPONSIVE FUND
|
Investments |
U.S. Government & Agency Obligations |
||||||||||
|
Purchases |
$ |
19,194,579 |
$ |
3,806,169 |
|||||||
|
Sales |
$ |
16,933,497 |
$ |
29,422 |
|||||||
Note 5. Income tax information and distributions to shareholders
At December 31, 2018, the components of distributable earnings for federal income tax purposes were as follows:
|
Financial Services Fund |
Maryland Fund |
Socially Responsive Fund |
|||||||||||||
|
Cost of Investments for tax purposes |
$ |
177,094,054 |
$ |
80,425,682 |
$ |
108,497,787 |
|||||||||
|
Gross tax unrealized appreciation |
62,679,746 |
3,390,704 |
28,945,932 |
||||||||||||
|
Gross tax unrealized depreciation |
(16,488,726 |
) |
(157,653 |
) |
(5,790,955 |
) |
|||||||||
|
Net tax unrealized appreciation on investment |
46,191,020 |
3,233,051 |
23,154,977 |
||||||||||||
|
Undistributed ordinary income |
105,155 |
— |
170,846 |
||||||||||||
|
Undistributed tax-exempt income |
— |
110,568 |
— |
||||||||||||
|
Undistributed long-term capital gains |
— |
— |
192,008 |
||||||||||||
1919 Funds 2018 Annual Report
61
Notes to financial statements (cont'd)
|
Financial Services Fund |
Maryland Fund |
Socially Responsive Fund |
|||||||||||||
|
Capital loss carryforwards |
$ |
— |
$ |
(2,688,614 |
) |
$ |
— |
||||||||
|
Other book/tax temporary differences* |
(93,844 |
) |
(86,013 |
) |
(26,112 |
) |
|||||||||
|
Total distributable earnings |
$ |
46,202,331 |
$ |
568,992 |
$ |
23,491,719 |
|||||||||
* Other book/tax differences are attributable primarily to post-October losses and timing of the deductibility of various expenses.
The tax character of distributions paid during the fiscal years ended December 31, 2018 and December 31, 2017, for each Fund was as follows:
FINANCIAL SERVICES FUND
|
Year Ended December 31, 2018 |
Year Ended December 31, 2017 |
||||||||||
|
Distribution Paid From: |
|||||||||||
|
Ordinary Income |
$ |
395,890 |
$ |
151,413 |
|||||||
|
Net Long Term Capital Gains |
3,652,858 |
— |
|||||||||
|
Total |
$ |
4,048,748 |
$ |
151,413 |
|||||||
MARYLAND FUND
|
Year Ended December 31, 2018 |
Year Ended December 31, 2017 |
||||||||||
|
Distribution Paid From: |
|||||||||||
|
Tax Exempt Income |
$ |
2,568,497 |
$ |
3,210,908 |
|||||||
|
Ordinary Income |
37,123 |
46,651 |
|||||||||
|
Total |
$ |
2,605,620 |
$ |
3,257,559 |
|||||||
SOCIALLY RESPONSIVE FUND
|
Year Ended December 31, 2018 |
Year Ended December 31, 2017 |
||||||||||
|
Distribution Paid From: |
|||||||||||
|
Ordinary Income |
$ |
1,068,859 |
$ |
935,160 |
|||||||
|
Net Long Term Capital Gains |
7,583,225 |
6,474,453 |
|||||||||
|
Total |
$ |
8,652,084 |
$ |
7,409,613 |
|||||||
As of December 31, 2018, the Funds have capital loss carry forward amounts ("CLCFs") as summarized in the following table. Under the provision of the Regulated Investment Company Modernization Act of 2010, CLCFs can be carried forward indefinitely, and applied to offset future capital gains. CLCFs are applied consistent with the character in which they originated as a new loss on the first day of the immediately succeeding tax year.
The Funds are required, in order to meet certain excise tax requirements, to measure and distribute annually, net capital gains realized during the twelve month period ending October 31. In connection with this requirement, the Funds are permitted, for tax purposes, to defer in to their next fiscal year any net capital losses incurred from November 1
1919 Funds 2018 Annual Report
62
through the end of the fiscal year. As of December 31, 2018, the Funds deferred, on a tax basis, post-October losses as shown in the table below:
|
Financial Services Fund |
Maryland Fund |
Socially Responsive Fund |
|||||||||||||
| Capital Loss Carryovers — Short-Term |
— |
$ |
121,823 |
— |
|||||||||||
|
Capital Loss Carryovers — Long-Term |
— |
2,566,791 |
— |
||||||||||||
|
Post-October Losses |
$ |
54,490 |
— |
— |
|||||||||||
Note 6. Class specific expenses
The Funds have each adopted a Rule 12b-1 distribution plan, under which the Funds pay a service fee with respect to their Class A, Class B (as applicable), and Class C shares as reflected in the table below. The Funds pay a distribution fee with respect to Class B (as applicable) and Class C shares as reflected in the table below. Service and distribution fees are accrued daily and paid monthly.
|
Fund |
Class A |
Class B Service |
Class B Distribution |
Class C Service |
Class C Distribution |
||||||||||||||||||
|
Financial Services Fund |
0.25 |
% |
N/A |
N/A |
0.25 |
% |
0.75 |
% |
|||||||||||||||
|
Maryland Fund |
0.15 |
% |
N/A |
N/A |
0.25 |
% |
0.45 |
% |
|||||||||||||||
|
Socially Responsive Fund |
0.25 |
% |
0.25 |
% |
0.75 |
% |
0.25 |
% |
0.75 |
% |
|||||||||||||
For the year ended December 31, 2018, class specific expenses were as follows:
FINANCIAL SERVICES FUND
|
December 31, 2018 |
|||||||||||
|
Distribution Fees |
Transfer Agent Fees |
||||||||||
|
Class A |
$ |
267,458 |
$ |
104,524 |
|||||||
|
Class C |
586,945 |
37,801 |
|||||||||
|
Class I |
— |
74,526 |
|||||||||
|
Total |
$ |
854,403 |
$ |
216,851 |
|||||||
MARYLAND FUND
|
December 31, 2018 |
|||||||||||
|
Distribution Fees |
Transfer Agent Fees |
||||||||||
|
Class A |
$ |
91,956 |
$ |
31,466 |
|||||||
|
Class C |
111,519 |
7,927 |
|||||||||
|
Class I |
— |
8,298 |
|||||||||
|
Total |
$ |
203,475 |
$ |
47,691 |
|||||||
SOCIALLY RESPONSIVE FUND
|
December 31, 2018 |
|||||||||||
|
Distribution Fees |
Transfer Agent Fees |
||||||||||
|
Class A |
$ |
267,040 |
$ |
140,309 |
|||||||
|
Class B |
4,233 |
4,701 |
|||||||||
|
Class C |
122,050 |
8,497 |
|||||||||
|
Class I |
— |
6,689 |
|||||||||
|
Total |
$ |
393,323 |
$ |
160,196 |
|||||||
1919 Funds 2018 Annual Report
63
Notes to financial statements (cont'd)
Note 7. Shares of beneficial interest
At December 31, 2018, the Funds had an unlimited number of shares of beneficial interest with no par value per share. The Funds have the ability to issue multiple classes of shares. Each class of shares represents an identical interest and has the same rights, except that each class bears certain direct expenses, including those specifically related to the distribution of its shares. Transactions in shares of each class were as follows:
FINANCIAL SERVICES FUND
|
Year Ended December 31, 2018 |
Year Ended December 31, 2017 |
||||||||||||||||||
|
Shares |
Amount |
Shares |
Amount |
||||||||||||||||
|
Class A |
|||||||||||||||||||
|
Shares sold |
1,204,691 |
$ |
33,653,057 |
1,625,579 |
$ |
40,295,543 |
|||||||||||||
|
Shares issued on reinvestment |
43,417 |
1,060,235 |
— |
— |
|||||||||||||||
|
Shares repurchased |
(2,482,597 |
) |
(68,618,028 |
) |
(1,192,439 |
) |
(29,611,108 |
) |
|||||||||||
|
Net increase (decrease) |
(1,234,489 |
) |
$ |
(33,904,736 |
) |
433,140 |
$ |
10,684,435 |
|||||||||||
|
Class C |
|||||||||||||||||||
|
Shares sold |
554,877 |
$ |
14,301,161 |
756,538 |
$ |
17,422,594 |
|||||||||||||
|
Shares issued on reinvestment |
35,179 |
788,369 |
— |
— |
|||||||||||||||
|
Shares repurchased |
(487,641 |
) |
(11,853,646 |
) |
(308,914 |
) |
(7,095,658 |
) |
|||||||||||
|
Net increase |
102,415 |
$ |
3,235,884 |
447,624 |
$ |
10,326,936 |
|||||||||||||
|
Class I |
|||||||||||||||||||
|
Shares sold |
3,190,096 |
$ |
90,111,881 |
1,848,267 |
$ |
46,488,609 |
|||||||||||||
|
Shares issued on reinvestment |
78,320 |
1,929,809 |
5,240 |
143,794 |
|||||||||||||||
|
Shares repurchased |
(1,668,197 |
) |
(44,540,660 |
) |
(657,323 |
) |
(16,300,937 |
) |
|||||||||||
|
Net increase |
1,600,219 |
$ |
47,501,030 |
1,196,184 |
$ |
30,331,466 |
|||||||||||||
MARYLAND FUND
|
Year Ended December 31, 2018 |
Year Ended December 31, 2017 |
||||||||||||||||||
|
Shares |
Amount |
Shares |
Amount |
||||||||||||||||
|
Class A |
|||||||||||||||||||
|
Shares sold |
252,410 |
$ |
3,873,870 |
168,981 |
$ |
2,671,965 |
|||||||||||||
|
Shares issued on reinvestment |
104,798 |
1,610,078 |
128,679 |
2,031,224 |
|||||||||||||||
|
Shares repurchased |
(1,145,495 |
) |
(17,623,310 |
) |
(1,477,260 |
) |
(23,281,365 |
) |
|||||||||||
|
Net decrease |
(788,287 |
) |
$ |
(12,139,362 |
) |
(1,179,600 |
) |
$ |
(18,578,176 |
) |
|||||||||
|
Class C |
|||||||||||||||||||
|
Shares sold |
54,491 |
$ |
837,419 |
88,298 |
$ |
1,393,475 |
|||||||||||||
|
Shares issued on reinvestment |
20,352 |
312,668 |
24,405 |
385,287 |
|||||||||||||||
|
Shares repurchased |
(258,645 |
) |
(3,970,111 |
) |
(328,023 |
) |
(5,158,414 |
) |
|||||||||||
|
Net decrease |
(183,802 |
) |
$ |
(2,820,024 |
) |
(215,320 |
) |
$ |
(3,379,652 |
) |
|||||||||
|
Class I |
|||||||||||||||||||
|
Shares sold |
333,945 |
$ |
5,119,860 |
407,095 |
$ |
6,434,265 |
|||||||||||||
|
Shares issued on reinvestment |
25,732 |
395,335 |
27,606 |
435,778 |
|||||||||||||||
|
Shares repurchased |
(416,611 |
) |
(6,408,575 |
) |
(447,659 |
) |
(7,045,679 |
) |
|||||||||||
|
Net decrease |
(56,934 |
) |
$ |
(893,380 |
) |
(12,958 |
) |
$ |
(175,636 |
) |
|||||||||
1919 Funds 2018 Annual Report
64
SOCIALLY RESPONSIVE FUND
|
Year Ended December 31, 2018 |
Year Ended December 31, 2017 |
||||||||||||||||||
|
Shares |
Amount |
Shares |
Amount |
||||||||||||||||
|
Class A |
|||||||||||||||||||
|
Shares sold |
541,398 |
$ |
9,935,852 |
387,939 |
$ |
6,837,863 |
|||||||||||||
|
Shares issued on reinvestment |
370,926 |
6,457,115 |
340,707 |
6,054,106 |
|||||||||||||||
|
Shares repurchased |
(783,107 |
) |
(14,312,444 |
) |
(721,406 |
) |
(12,659,503 |
) |
|||||||||||
|
Net increase |
129,217 |
$ |
2,080,523 |
7,240 |
$ |
232,466 |
|||||||||||||
|
Class B |
|||||||||||||||||||
|
Shares sold |
— |
$ |
— |
138 |
$ |
2,397 |
|||||||||||||
|
Shares issued on reinvestment |
1,032 |
17,375 |
2,353 |
40,847 |
|||||||||||||||
|
Shares repurchased |
(26,072 |
) |
(468,001 |
) |
(53,308 |
) |
(910,851 |
) |
|||||||||||
|
Net decrease |
(25,040 |
) |
$ |
(450,626 |
) |
(50,817 |
) |
$ |
(867,607 |
) |
|||||||||
|
Class C |
|||||||||||||||||||
|
Shares sold |
183,404 |
$ |
3,317,639 |
56,030 |
$ |
999,757 |
|||||||||||||
|
Shares issued on reinvestment |
34,531 |
603,608 |
29,463 |
529,898 |
|||||||||||||||
|
Shares repurchased |
(118,224 |
) |
(2,175,643 |
) |
(169,841 |
) |
(2,951,968 |
) |
|||||||||||
|
Net increase (decrease) |
99,711 |
$ |
1,745,604 |
(84,348 |
) |
$ |
(1,422,313 |
) |
|||||||||||
|
Class I |
|||||||||||||||||||
|
Shares sold |
794,071 |
$ |
14,609,682 |
230,132 |
$ |
4,009,226 |
|||||||||||||
|
Shares issued on reinvestment |
68,480 |
1,190,225 |
25,920 |
459,876 |
|||||||||||||||
|
Shares repurchased |
(275,413 |
) |
(4,893,876 |
) |
(119,641 |
) |
(2,091,815 |
) |
|||||||||||
|
Net increase |
587,138 |
$ |
10,906,031 |
136,411 |
$ |
2,377,287 |
|||||||||||||
Note 8. Subsequent events
In preparing these financial statements, the Funds have evaluated events and transactions for potential recognition or disclosure through the date the financial statements were available to be issued. Subsequent to the period end, the Maryland Fund has made the following distributions per share:
|
Record Date |
Payable Date |
Class A |
Class C |
Class I |
|||||||||||||||
|
Daily |
1/31/2019 |
$ |
0.036828 |
$ |
0.029660 |
$ |
0.038800 |
||||||||||||
The Funds have determined that there were no other subsequent events that would need to be disclosed in the financial statements.
Note 9. New accounting pronouncements
In August 2018, FASB issued ASU 2018-13, Fair Value Measurement (Topic 820): Disclosure Framework — Changes to the Disclosure Requirements for Fair Value Measurement ("ASU 2018-13"). The primary focus of ASU 2018-13 is to improve the effectiveness of the disclosure requirements for fair value measurements. The changes affect all companies that are required to include fair value measurement disclosures. In general,
1919 Funds 2018 Annual Report
65
Notes to financial statements (cont'd)
the amendments in ASU 2018-13 are effective for all entities for fiscal years and interim periods within those fiscal years, beginning after December 15, 2019. An entity is permitted to early adopt the removed or modified disclosures upon the issuance of ASU 2018-13 and may delay adoption of the additional disclosures, which are required for public companies only, until their effective date. The Fund has adopted all applicable provisions of ASU 2018-13.
1919 Funds 2018 Annual Report
66
Report of independent registered public accounting firm
To the Board of Trustees of Trust for Advised Portfolios
and the Shareholders of 1919 Financial Services Fund,
1919 Maryland Tax-Free Income Fund, and
1919 Socially Responsive Balanced Fund
Opinion on the Financial Statements
We have audited the accompanying statements of assets and liabilities of 1919 Financial Services Fund, 1919 Maryland Tax-Free Income Fund, and 1919 Socially Responsive Balanced Fund, each a series of shares of beneficial interest in Trust for Advised Portfolios (the "Funds"), including the schedules of investments, as of December 31, 2018, and the related statements of operations for the year then ended, the statements of changes in net assets for each of the years in the two-year period then ended and the financial highlights for each of the years or periods as noted in the table below, and the related notes (collectively referred to as the "financial statements"). In our opinion, the financial statements present fairly, in all material respects, the financial position of the Funds as of December 31, 2018, and the results of their operations for the year then ended, the changes in their net assets for each of the years in the two-year period then ended and their financial highlights for each of the years or periods in the five-year period then ended, in conformity with accounting principles generally accepted in the United States of America. The financial highlights for the year ended March 31, 2014 of the 1919 Financial Services Fund were audited by other auditors whose report dated May 14, 2014, expressed an unqualified opinion on such financial highlights. The financial highlights for the year ended March 31, 2014 of the 1919 Maryland Tax-Free Income Fund were audited by other auditors whose report dated May 15, 2014, expressed an unqualified opinion on such financial highlights. The financial highlights for the year ended January 31, 2014 of the 1919 Socially Responsive Balanced Fund were audited by other auditors whose report dated March 18, 2014, expressed an unqualified opinion on such financial highlights.
|
Financial Highlights |
|||||||
|
1919 Financial Services Fund |
For the period April 1, 2014 to December 31, 2014 and each of the years in the four-year period ended December 31, 2018 |
||||||
|
1919 Maryland Tax-Free Income Fund |
For the period April 1, 2014 to December 31, 2014 and each of the years in the four-year period ended December 31, 2018 |
||||||
|
1919 Socially Responsive Balanced Fund |
For the period February 1, 2014 to December 31, 2014 and each of the years in the four-year period ended December 31, 2018 |
||||||
1919 Funds 2018 Annual Report
67
Report of independent registered public accounting firm (cont'd)
Basis for Opinion
These financial statements are the responsibility of the Funds' management. Our responsibility is to express an opinion on the Funds' financial statements based on our audits. We are a public accounting firm registered with the Public Company Accounting Oversight Board (United States) ("PCAOB") and are required to be independent with respect to the Funds in accordance with the U.S. federal securities law and the applicable rules and regulations of the Securities and Exchange Commission and the PCAOB.
We conducted our audits in accordance with the standards of the PCAOB. Those standards require that we plan and perform the audits to obtain reasonable assurance about whether the financial statements are free of material misstatement, whether due to error or fraud. The Funds are not required to have, nor were we engaged to perform, an audit of their internal control over financial reporting. As part of our audits we are required to obtain an understanding of internal control over financial reporting but not for the purpose of expressing an opinion on the effectiveness of the Funds' internal control over financial reporting. Accordingly, we express no such opinion.
Our audits included performing procedures to assess the risk of material misstatement of the financial statements, whether due to error or fraud, and performing procedures that respond to those risks. Such procedures included examining, on a test basis, evidence regarding the amounts and disclosures in the financial statements. Our procedures included confirmation of securities owned as of December 31, 2018 by correspondence with the custodian. Our audits also included evaluating the accounting principles used and significant estimates made by management, as well as evaluating the overall presentation of the financial statements. We believe that our audits provide a reasonable basis for our opinion.

BBD, LLP
We have served as the auditor of one or more of the Funds in the Trust for Advised Portfolios since 2014.
Philadelphia, Pennsylvania
February 28, 2019
1919 Funds 2018 Annual Report
68
1919 Funds
Other information (unaudited)
December 31, 2018
Proxy Voting
The Funds' proxy voting guidelines and a record of the Predecessor Funds' proxy votes for the 12 months ended June 30, 2018 are available without charge, upon request, by calling 1-844-828-1919 and on the Securities and Exchange Commission's website at www.sec.gov.
Quarterly Holdings
The Funds file their complete schedule of portfolio holdings with the SEC for the first and third quarters of each fiscal year on Form N-Q. The Funds' Forms N-Q are available on the EDGAR database on the Securities and Exchange Commission's website at www.sec.gov. These Forms may also be reviewed and copied at the Securities and Exchange Commission's Public Reference Room in Washington, D.C. Information about the operation of the Public Reference Room may be obtained by calling 1-800-SEC-0330.
Tax Information
The percentage of the ordinary income distributions paid monthly by the Maryland Tax-Free Income Fund for the year ended December 31, 2018 qualifying as tax-exempt interest dividends for Federal income tax purposes is 98.57%.
Certain dividends paid by the Funds may be subject to a maximum tax rate of 15%, as provided for by the Jobs and Growth Tax Relief Reconciliation Act of 2003. The percentage of dividends declared from ordinary income for the year ended December 31, 2018, designated as qualified dividend/net interest income for the Funds is as follows:
|
Percentage |
|||||||
|
1919 Financial Services Fund |
100.00 |
% |
|||||
|
1919 Socially Responsive Balanced Fund |
86.71 |
||||||
100% of the ordinary income distributions paid monthly by the 1919 Maryland Tax-Free Income Fund for the year ended December 31, 2018, are Qualified Net Investment Income.
For corporate shareholders, the percentage of ordinary income distributions qualifying for the corporate dividends received deduction for the year ended December 31, 2018, is as follows:
|
Percentage |
|||||||
|
1919 Financial Services Fund |
100.00 |
% |
|||||
|
1919 Maryland Tax-Free Income Fund |
— |
||||||
|
1919 Socially Responsive Balanced Fund |
86.53 |
||||||
1919 Funds 2018 Annual Report
69
1919 Funds
Other information (unaudited) (cont'd)
December 31, 2018
The percentage of taxable ordinary income distributions that are designated as short-term capital gain distributions under Internal Revenue Section 871 (k)(2)(C) for the period ended December 31, 2018, by Funds is as follows:
|
Percentage |
|||||||
|
1919 Financial Services Fund |
— |
% |
|||||
|
1919 Maryland Tax-Free Income Fund |
— |
||||||
|
1919 Socially Responsive Balanced Fund |
39.64 |
||||||
1919 Funds 2018 Annual Report
70
Approval of investment advisory agreement for
1919 Financial Services Fund
1919 Maryland Tax-Free Income Fund
1919 Socially Responsive Balanced Fund (unaudited)
At a meeting held on August 21 and 22, 2018, the Board of Trustees (the "Board") of Trust for Advised Portfolios (the "Trust"), including all Trustees who are not "interested persons" of the Trust, as that term is defined in the Investment Company Act of 1940, as amended, considered and approved the continuance of the investment advisory agreement ("Advisory Agreement") with 1919 Investment Counsel, LLC ("1919" or the "Adviser"), for the 1919 Financial Services Fund (the "Financial Services Fund"), 1919 Maryland Tax-Free Income Fund (the "Maryland Fund"), and 1919 Socially Responsive Balanced Fund (the "Socially Responsive Fund", each a "Fund" and together, the "Funds"). Ahead of the August meeting, the Board received and reviewed substantial information regarding the Funds, the Adviser and the services provided by the Adviser to the Funds under the Advisory Agreement. This information formed the primary (but not exclusive) basis for the Board's determinations. Below is a summary of the factors considered by the Board and the conclusions that formed the basis for the Board's approval of the renewal of the Advisory Agreement:
In considering the continuance of the Advisory Agreement, the Board considered the following factors and made the following determinations. In its deliberations, the Board did not identify any single factor or piece of information as all important, controlling, or determinative of its decision, and each Trustee may have attributed different weights to the various factors and information.
• In considering the nature, extent and quality of the services provided by the Adviser, the Trustees considered the Adviser's specific responsibilities in all aspects of the day-to-day management of the Funds as well as the qualifications, experience and responsibilities of the portfolio managers and other key personnel involved in the day-to-day activities of the Funds. The Board also considered the resources and compliance structure of 1919, including information regarding its compliance program, chief compliance officer and compliance record, and its disaster recovery/business continuity plan. The Board also considered the prior relationship between 1919 and the Trust, as well as the Board's knowledge of the Adviser's operations, and noted that during the course of the prior year it had met with the Adviser in person to discuss fund performance and investment outlook, as well as various marketing and compliance topics, including the Adviser's risk management process. The Board concluded that 1919 had sufficient quality and depth of personnel, resources, investment methods and compliance policies and procedures essential to performing its duties under the Advisory Agreement and that, in the Board's view, the nature, overall quality, and extent of the management services provided were and would continue to be satisfactory and reliable.
1919 Funds 2018 Annual Report
71
Approval of investment advisory agreement for
1919 Financial Services Fund
1919 Maryland Tax-Free Income Fund
1919 Socially Responsive Balanced Fund (unaudited) (cont'd)
• In assessing the quality of the portfolio management delivered by the Adviser, the Board reviewed the performance of the Fund on both an absolute basis and in comparison to its peer group and relevant benchmark indexes.
o For the Financial Services Fund, the Board considered that, on an annualized basis over various periods of time, the Fund had outperformed relative to its peer group median/average as of June 30, 2018, and the S&P 500 as of March 31, 2018, but lagged relative to the S&P Financial Index. The Board noted that the Fund had achieved more than ten calendar years of performance results.
o For the Maryland Fund, the Board considered that on an annualized basis over various periods of time since inception, the Fund had performed slightly below its peer group median/average for the 1, 3, and 5 year periods as of June 30, 2018, but had outperformed for the year-to-date and 10 year periods. The Board also considered that the Fund underperformed its benchmark index as of March 31, 2018. The Board took into account that both the peer group and the benchmark index covered states other than Maryland and, therefore, the Board also reviewed performance information for the Maryland Fund against four competitors in the Maryland municipal bond fund space over various periods of time. The Board considered that on an annualized basis, the Fund had performed mostly in line relative to its Maryland-specific peer group over various periods of time. The Board noted that the Fund had achieved more than ten calendar years of performance results.
o For the Socially Responsive Fund, the Board considered that on an annualized basis over various periods of time, the Fund outperformed its peer group median/average as of June 30, 2018, other than for the 10-year period, but lagged relative to its benchmark index as of March 31, 2018 for all periods except for the one-year period during which it outperformed the index. The Board noted that the Fund had achieved more than ten calendar years of performance results.
• The Trustees also reviewed the cost of the Adviser's services, and the structure and level of advisory fees payable by the Funds, including a comparison of those fees to fees charged by a peer group of funds. The Board noted that the Adviser had contractually agreed to maintain annual expense caps for each of the Funds' classes.
o For the Financial Services Fund, the Board noted that the Fund's advisory fee and net expense ratio were in line with its peer group median and average. After reviewing the materials that were provided, the Trustees concluded that the fees to be received by 1919 were fair and reasonable.
1919 Funds 2018 Annual Report
72
o For the Maryland Fund, the Board noted that the Fund's advisory fee was higher, and the net expense ratio was slightly lower, than its peer group median and average. The Board took into account that the peer group included single state municipal bond funds other than Maryland and, therefore, also reviewed advisory and net expense ratio information for the Fund against four competitors in the Maryland municipal bond fund space.
o For the Socially Responsive Fund, the Board considered that the Fund's advisory fee was lower than both the peer group median and average. The Board noted that the Fund's net expense ratio was somewhat higher than its peer group median and average.
• After reviewing the materials that were provided, the Trustees concluded that the fees to be received by 1919 were fair and reasonable.
• The Trustees considered 1919's assertion that, based on the asset size of the Financial Services Fund and the Maryland Fund, economies of scale had not yet been achieved.
• The Trustees considered that, in addition to 1919's commitment to maintain its cap on the Socially Responsive Fund's expense ratio, 1919's advisory fee schedule includes breakpoints, which allow for economies of scale to be shared through reductions in the advisory fee as Fund assets grow.
• The Trustees considered the profitability of 1919 from managing the Funds. In assessing 1919's profitability, the Trustees reviewed 1919's financial information that was provided in the materials and took into account both the direct and indirect benefits to 1919 from managing the Funds. The Trustees concluded that 1919's profits from managing the Funds were not excessive and, after a review of the relevant financial information, 1919 appeared to have adequate capitalization and/or would maintain adequate profit levels to support the Funds.
1919 Funds 2018 Annual Report
73
Trustee and officer information (unaudited)
December 31, 2018
Independent Trustees4:
|
John Chrystal |
|||||||
|
615 E. Michigan Street |
|||||||
|
Milwaukee, WI 53202 |
|||||||
|
Year of birth |
1958 |
||||||
|
Position(s) held with Trust |
Trustee |
||||||
|
Term of office1 and length of time served |
Since 2011 |
||||||
|
Principal occupation(s) during past 5 years |
Private Investor. Previously Founder and Managing Partner of Bent Gate Advisors, LLC, a consulting firm that provided strategic advice and assistance to financial institutions. Previously a Partner at DiMaio Ahmad Capital, an investment management firm. |
||||||
|
Number of portfolios in fund complex2 overseen by Trustee |
4 |
||||||
|
Other Directorships3 held during past 5 years by Trustee |
The Bancorp, Inc. (2013 to present), Javelin Mortgage Investments, Inc. (2012 – 2016) |
||||||
|
Albert J. DiUlio, S.J. |
|||||||
|
615 E. Michigan Street |
|||||||
|
Milwaukee, WI 53202 |
|||||||
|
Year of birth |
1943 |
||||||
|
Position(s) held with Trust |
Trustee |
||||||
|
Term of office1 and length of time served |
Since 2011 |
||||||
|
Principal occupation(s) during past 5 years |
Treasurer, Midwest Province and Wisconsin Province of The Society of Jesus (2014 to present); President, Vatican Observatory Foundation (2011 – 2014). Previously, served five years as Secretary for Finance and Higher Education USA Jesuit Conference, followed by a one year Sabbatical. |
||||||
|
Number of portfolios in fund complex2 overseen by Trustee |
4 |
||||||
|
Other Directorships3 held during past 5 years by Trustee |
None |
||||||
|
Harry E. Resis |
|||||||
|
615 E. Michigan Street |
|||||||
|
Milwaukee, WI 53202 |
|||||||
|
Year of birth |
1945 |
||||||
|
Position(s) held with Trust |
Trustee |
||||||
|
Term of office1 and length of time served |
Since 2012 |
||||||
|
Principal occupation(s) during past 5 years |
Private investor. Previously served as Director of US Fixed Income for Henderson Global Investors. |
||||||
|
Number of portfolios in fund complex2 overseen by Trustee |
4 |
||||||
|
Other Directorships3 held during past 5 years by Trustee |
None |
||||||
1919 Funds 2018 Annual Report
74
Interested Trustee5:
|
Christopher E. Kashmerick |
|||||||
|
615 E. Michigan Street |
|||||||
|
Milwaukee, WI 53202 |
|||||||
|
Year of birth |
1974 |
||||||
|
Position(s) held with Trust |
Trustee, Chairman, President and Principal Executive Officer |
||||||
|
Term of office1 and length of time served |
Trustee since 2018; Chairman since 2018; President and Principal Executive Officer since 2014 |
||||||
|
Principal occupation(s) during past 5 years |
Senior Vice President, U.S. Bancorp Fund Services, LLC (2011 – present) |
||||||
Officers:
|
Steven J. Jensen |
|||||||
|
615 E. Michigan Street |
|||||||
|
Milwaukee, WI 53202 |
|||||||
|
Year of birth |
1957 |
||||||
|
Position(s) held with Trust |
Vice President, Chief Compliance Officer and AML Officer |
||||||
|
Term of office1 and length of time served |
Since 2014 |
||||||
|
Principal occupation(s) during past 5 years |
Senior Vice President, U.S. Bancorp Fund Services, LLC (2011 to present) |
||||||
|
Russell B. Simon |
|||||||
|
615 E. Michigan Street |
|||||||
|
Milwaukee, WI 53202 |
|||||||
|
Year of birth |
1980 |
||||||
|
Position(s) held with Trust |
Treasurer and Principal Financial Officer |
||||||
|
Term of office1 and length of time served |
Since 2014 |
||||||
|
Principal occupation(s) during past 5 years |
Vice President, U.S. Bancorp Fund Services, LLC (2011 – present) |
||||||
|
Eric W. Pinciss, Esq. |
|||||||
|
615 E. Michigan Street |
|||||||
|
Milwaukee, WI 53202 |
|||||||
|
Year of birth |
1975 |
||||||
|
Position(s) held with Trust |
Secretary |
||||||
|
Term of office1 and length of time served |
Since 2015 |
||||||
|
Principal occupation(s) during past 5 years |
Vice President, U.S. Bancorp Fund Services, LLC (2012 to present) |
||||||
1 Each Trustee serves an indefinite term until the election of a successor. Each officer serves an indefinite term until the election of a successor.
1919 Funds 2018 Annual Report
75
Trustee and officer information (unaudited) (cont'd)
December 31, 2018
2 The Trust is comprised of numerous series managed by unaffiliated investment advisers. The term "Fund Complex" applies only to the Fund. The Fund does not hold itself out as related to any other series within the Trust for purposes of investment and investor services, nor does it share the same investment advisor with any other series.
3 "Other Directorships Held" includes only directorships of companies required to register or file reports with the SEC under the Securities Exchange Act of 1934, as amended, (that is, "public companies") or other investment companies registered under the 1940 Act.
4 The Trustees of the Trust who are not "interested persons" of the Trust as defined under the 1940 Act ("Independent Trustees").
5 Mr. Kashmerick is an "interested person" of the Trust as defined by the 1940 Act. Mr. Kashmerick is an interested Trustee of the Trust by virtue of the fact that he is an interested person of Quasar Distributors, LLC, the Funds' distributor.
1919 Funds 2018 Annual Report
76
Privacy Notice
The 1919 Funds collect non-public information about you from the following sources:
Information we receive about you on applications or other forms;
Information you give us orally; and/or
Information about your transactions with us or others
We do not disclose any non-public personal information about our customers or former customers without the customer's authorization, except as permitted by law or in response to inquiries from governmental authorities. We may share information with affiliated and unaffiliated third parties with whom we have contracts for servicing a Fund. We will provide unaffiliated third parties with only the information necessary to carry out their assigned responsibilities. We maintain physical, electronic and procedural safeguards to guard your personal information and require third parties to treat your personal information with the same high degree of confidentiality.
In the event that you hold shares of a Fund through a financial intermediary, including, but not limited to, a broker-dealer, bank, or trust company, the privacy policy of your financial intermediary would govern how your non-public personal information would be shared with unaffiliated third parties.
1919 Funds 2018 Annual Report
77
Investment adviser
1919 Investment Counsel, LLC
One South Street, Suite 2500
Baltimore, MD 21202
Distributor
Quasar Distributors, LLC
615 East Michigan Street
Milwaukee, Wisconsin 53202
Custodian
U.S. Bank National Association
Custody Operations
1555 North River Center Drive, Suite 302
Milwaukee, Wisconsin 53212
Transfer agent, fund accountant and fund administrator
U.S. Bancorp Fund Services, LLC
615 East Michigan Street
Milwaukee, Wisconsin 53202
Independent registered public accounting firm
BBD, LLP
1835 Market Street, 3rd Floor
Philadelphia, PA 19103
Legal counsel
Morgan, Lewis & Bockius LLP
1111 Pennsylvania Ave, NW
Washington, DC 20004
This report has been prepared for shareholders and may be distributed to others only if preceded or accompanied by a current prospectus.
Annual Report
December 31, 2018

1919 VARIABLE SOCIALLY RESPONSIVE BALANCED FUND
Table of Contents
|
Letter to Shareholders |
II |
||||||
|
Fund performance |
1 |
||||||
|
Fund expenses |
3 |
||||||
|
Fund at a glance |
4 |
||||||
|
Schedule of investments |
5 |
||||||
|
Statement of assets and liabilities |
10 |
||||||
|
Statement of operations |
11 |
||||||
|
Statements of changes in net assets |
12 |
||||||
|
Financial highlights |
13 |
||||||
|
Notes to financial statements |
14 |
||||||
|
Report of independent registered public accounting firm |
21 |
||||||
|
Other information |
23 |
||||||
|
Approval of investment |
|||||||
|
advisory agreement |
24 |
||||||
|
Trustee and officer information |
26 |
||||||
|
Privacy notice |
29 |
||||||
|
Directory of funds' service providers |
Back Cover |
||||||
Letter to Shareholders
Dear Shareholder,
We are pleased to bring you the annual report on the 1919 Variable Socially Responsive Balanced Fund ("the Fund") through December 31, 2018.
Throughout the year, the Fund took a variety of measures to respond to changing market conditions. During the first half of the year we increased exposure to the Health Care, Consumer Discretionary, and Materials sectors and decreased exposure to the Industrials and Financials sectors. During the second half of the year we added to the Communication Services exposure while reducing exposure to the Information Technology sector.
Throughout the year, we maintained an overweight in the Health Care, Financials, Industrials, and Information Technology sectors and an underweight in the Energy, Real estate, Telecommunications and Utilities sectors.
In the fixed-income portion of the Fund, we purchased Treasuries, Agencies and Corporates including five green bonds with varying maturities. Going forward, we believe the curve could remain relatively flat until inflation becomes a greater concern. Given that the Fed is on hold for the time being and economic data does not appear to be flashing yellow for rampant inflation, we anticipate buying along the curve where we see opportunities.
In the equity portion of the Fund, our stock selection in the Information Technology, Industrials, Consumer Staples, Energy, Materials, and Health Care sectors contributed to relative performance in 2018. In terms of sector positioning, our overweighting in the Health Care sector and underweighting in the Energy and Materials sectors also enhanced results. On an individual stock basis, the largest contributors to performance for the year were Boston Scientific Corp., Adobe Systems Inc., Salesforce.com Inc., Amazon.com Inc., and Intuit Inc.
The leading contributor to performance in the fixed-income portion of the Fund was our exposure to longer dated Agencies. The other significant contributor to performance was a shorter duration of 4.80 relative to the Fund's fixed income benchmark, the Bloomberg Barclays U.S. Aggregate Index, which had a duration of 5.87. On an individual security basis, the largest contributors to return were International Bank for
1919 Variable Socially Responsive Balanced Fund 2018 Annual Report
ii
Reconstruction and Development (Green Bond) 3.125% 11/20/25, United States Treasury Bonds 7.5% 11/15/24, Boston Properties LP (Green Bond) 4.5% 12/1/28, FNMA 6.25% 5/15/29, and United States Treasury Bonds 7.625% 11/15/22.
In the equity portion of the Fund, our stock selection in the Financials, Communication Services, and Consumer Discretionary sectors detracted from relative results for the year. In terms of sector positioning, our overweighting in the Industrials and Financials sector detracted from performance. On an individual stock basis, the largest detractors from performance were Invesco Ltd., Celgene Corp., Texas Capital Bancshares Inc., Citizens Financial Group Inc., and BorgWarner Inc.
In the fixed-income portion of the Fund, the leading detractor to performance was our overweight to the corporate sector, more specifically to longer-dated securities. On an individual security basis, the largest detractors from performance were Comcast Corp. 5.65% 6/15/35, Ford Motor Co. 4.346% 12/8/26, Microsoft Corp. 4.2% 11/3/35, Gilead Sciences Inc. 4.6% 9/1/35 and Bank of America Corp. 4.813% 11/25/27.
Thank you for your investment in the 1919 Variable Socially Responsive Balanced Fund. As always, we appreciate that you have chosen us to manage your assets and we remain focused on achieving the Fund's investment and social goals.
Sincerely,

Ronald T. Bates
Portfolio Manager (Equity Portion)
1919 Investment Counsel, LLC

Aimee M. Eudy
Portfolio Manager (Fixed-Income Portion)
1919 Investment Counsel, LLC
Bloomberg Barclays U.S. Aggregate Index — a broad-based bond index comprised of government, corporate, mortgage and asset-backed issues, rated investment grade or higher, and having at least one year to maturity.
Past performance is not a guarantee of future results.
Opinions expressed herein are as of December 31, 2018 and are subject to change at any time, are not a guaranteed and should not be considered investment advice.
Fund holdings and sector allocations are subject to change and are not a recommendation to buy or sell any security. Please refer to the Schedule of Investments for a complete list of Fund holdings.
It is not possible to invest in an index.
This report has been prepared for shareholders and may be distributed to other if preceded or accompanied by a current prospectus.
Mutual fund investing involves risk. Principal loss is possible. In addition
1919 Variable Socially Responsive Balanced Fund 2018 Annual Report
iii
Letter to Shareholders (cont'd)
to normal risks associated with investing, narrowly focused investments typically exhibit higher volatility. The financial services sector may be subject to greater governmental regulation, competitive pressures and rapid technological change and obsolescence, which may have a materially adverse effect on the sector. Additionally, a Fund's performance will be influenced by political, social and economic factors affecting any investments in companies in foreign countries. The securities of small and mid-sized companies tend to be more volatile than those of larger companies. A Fund's use of derivatives, such as options and futures, which can be illiquid, may disproportionately increase losses, and have a potentially large impact on Fund performance. Bonds are subject to a variety of risks, including interest rate, credit and inflation risks. As interest rates rise, bond prices fall, reducing the value of a fixed-income investment. Municipal securities purchased by a Fund may be adversely affected by changes in the financial condition of municipal issuers and insurers, regulatory and political developments, uncertainties and public perceptions, and other factors. Also, if a Fund uses a social awareness criterion, there may be a smaller universe of investments. Please see the Fund's prospectus for a more complete discussion of applicable risks, and the Fund's investment strategies.
1919 Funds are distributed by Quasar Distributors, LLC.
1919 Variable Socially Responsive Balanced Fund 2018 Annual Report
iv
Fund performance (unaudited)
Hypothetical comparison of Change in Value of $10,000

This chart illustrates the performance of a hypothetical $10,000 investment made in the Fund over ten years. Assumes reinvestment of dividends and capital gains. This chart does not imply any future performance.
Total Returns as of December 31, 2018
|
1 Year |
5 Years* |
10 Years* |
|||||||||||||
|
1919 Variable Socially Responsive Balanced Fund |
-0.94 |
% |
5.71 |
% |
9.10 |
% |
|||||||||
|
S&P 500 Index(i) |
-4.38 |
8.49 |
13.12 |
||||||||||||
|
Bloomberg Barclays U.S. Aggregate Index(ii) |
0.01 |
2.52 |
3.48 |
||||||||||||
|
Blended S&P 500 Index (70%) Barclays U.S. Aggregate Index (30%)(iii) |
-2.82 |
6.82 |
10.37 |
||||||||||||
* Average annualized returns
As of the Fund's current prospectus dated April 30, 2018, the gross total and net annual operating expense ratios were 1.29% and 0.89%(iv), respectively. Actual expenses may be higher. For example, expenses may be higher than those shown if average net assets decrease. Net assets are more likely to decrease and Fund expense ratios are more likely to increase when markets are volatile.
All figures represent past performance and are not a guarantee of future results. Investment return and principal value of an investment will fluctuate so that an investor's shares, when redeemed, may be worth more or less than their original cost. Fund returns assume the reinvestment of all distributions, at net asset value and the deduction of all Fund expenses. The returns shown do not reflect expenses associated with separate accounts such as administrative fees, account charges and surrender charges, which, if reflected, would reduce the total returns. Performance figures may reflect compensating balance arrangements, fee waivers and/or expense reimbursements. In the absence of compensating balance arrangements, fee waivers and/or expense reimbursements, the total return would have been lower. Current performance of the Fund may be lower or higher than the performance quoted. Performance data current to the most recent month end may be obtained by calling 1-844-828-1919.
As of November 7, 2014, the Fund assumed the performance, financial and other historic information of the Legg Mason Investment Counsel Variable Social Awareness Portfolio.
Fund holdings and sector allocations are subject to change at any time and should not be considered a recommendation to buy or sell any security. Please refer to the Schedule of Investments in this report for a complete list of Fund holdings.
1919 Variable Socially Responsive Balanced Fund 2018 Annual Report
1
Fund performance (unaudited) (cont'd)
(i) The S&P 500 Index is an unmanaged index of 500 stocks and is generally representative of the performance of larger companies in the U.S.
(ii) The Bloomberg Barclays U.S. Aggregate Index is a broad-based bond index comprised of government, corporate, mortgage and asset-backed issues, rated investment grade or higher, and having at least one year to maturity.
(iii) The Blended S&P 500 Index (70%) and Barclays U.S. Aggregate Index (30%) has been prepared to parallel the targeted allocation of investments between equity and fixed-income securities. It consists of 70% of the performance of the S&P 500 Index and 30% of the Barclays U.S. Aggregate Index.
(iv) The Advisor has contractually agreed to waive fees and reimburse operating expenses through April 30, 2019.
The Indices are unmanaged and are not subject to the same management and trading expenses as a mutual fund. Please note that an investor cannot invest directly in an index.
1919 Variable Socially Responsive Balanced Fund 2018 Annual Report
2
Fund expenses (unaudited)
Example
As a shareholder of the Fund, you may incur two types of costs: (1) transaction costs, and (2) ongoing costs, including management fees; and other Fund expenses. This example is intended to help you understand your ongoing costs (in dollars) of investing in the Fund and to compare these costs with the ongoing costs of investing in other mutual funds.
This example is based on an investment of $1,000 invested on July 1, 2018 and held for the six months ended December 31, 2018.
Actual expenses
The table below titled "Based on Actual Total Return" provides information about actual account values and actual expenses. You may use the information provided in this table, together with the amount you invested, to estimate the expenses that you paid over the period. To estimate the expenses you paid on your account, divide your ending account value by $1,000 (for example, an $8,600 ending account value divided by $1,000 = 8.6), then multiply the result by the number under the heading entitled "Expenses Paid During the Period".
Hypothetical example for comparison purposes
The table below titled "Based on Hypothetical Total Return" provides information about hypothetical account values and hypothetical expenses based on the actual expense ratio and an assumed rate of return of 5.00% per year before expenses, which is not the Fund's actual return. The hypothetical account values and expenses may not be used to estimate the actual ending account balance or expenses you paid for the period. You may use the information provided in this table to compare the ongoing costs of investing in the Fund and other funds. To do so, compare the 5.00% hypothetical example relating to the Fund with the 5.00% hypothetical examples that appear in the shareholder reports of the other funds.
Please note that the expenses shown in the table below are meant to highlight your ongoing costs only and do not reflect any transactional costs. Therefore, the table is useful in comparing ongoing costs only, and will not help you determine the relative total costs of owning different funds. In addition, if these transaction costs were included, your costs would have been higher.
Based on actual total return1
|
Actual Total Return2 |
Beginning Account Value |
Ending Account Value |
Annualized Expense Ratio |
Expenses Paid During the Period3 |
|||||||||||||||
| -4.37 |
% |
$ |
1,000.00 |
$ |
956.30 |
0.89 |
% |
$ |
4.39 |
||||||||||
Based on hypothetical total return1
|
Hypothetical Annualized Total Return |
Beginning Account Value |
Ending Account Value |
Annualized Expense Ratio |
Expenses Paid During the Period3 |
|||||||||||||||
| 2.52 |
% |
$ |
1,000.00 |
$ |
1,020.72 |
0.89 |
% |
$ |
4.53 |
||||||||||
1 For the six months ended December 31, 2018.
2 Assumes the reinvestment of all distributions, including returns of capital, if any, at net asset value. Total return is not annualized, as it may not be representative of the total return for the year. Total returns do not reflect expenses associated with separate accounts such as administrative fees, account charges and surrender charges, which, if reflected, would reduce the total returns. Performance figures may reflect compensating balance arrangements, fee waivers and/or expense reimbursements. In the absence of compensating balance arrangements, fee waivers and/or expense reimbursements, the total return would have been lower. Past performance is no guarantee of future results.
3 Expenses (net of compensating balance arrangements, fee waivers and/or expense reimbursements) are equal to the Fund's annualized expense ratio multiplied by the average account value over the period, multiplied by the number of days in the most recent fiscal half-year (184), then divided by 365
1919 Variable Socially Responsive Balanced Fund 2018 Annual Report
3
Fund at a glance† (unaudited)
Investment breakdown (%) as a percent of total investments

† The bar graph above represents the composition of the Fund's investments as of December 31, 2018 and December 31, 2017. The Fund is actively managed. As a result, the composition of the Fund's investments is subject to change at any time.
1919 Variable Socially Responsive Balanced Fund 2018 Annual Report
4
Schedule of investments
December 31, 2018
1919 Variable Socially Responsive Balanced Fund
|
Security |
Shares |
Value |
|||||||||
|
Common Stocks — 66.8% |
|||||||||||
|
Communication Services — 0.8% |
|||||||||||
|
Walt Disney Co/The |
2,510 |
$ |
275,221 |
||||||||
|
Total Communication Services |
275,221 |
||||||||||
|
Consumer Discretionary — 8.4% |
|||||||||||
|
Amazon.com Inc. |
585 |
878,652 |
* |
||||||||
|
BorgWarner Inc. |
12,270 |
426,260 |
|||||||||
|
Home Depot Inc/The |
3,540 |
608,243 |
|||||||||
|
Royal Caribbean Cruises Ltd. |
5,235 |
511,931 |
|||||||||
|
TJX Cos Inc. |
11,500 |
514,510 |
|||||||||
|
Total Consumer Discretionary |
2,939,596 |
||||||||||
|
Consumer Staples — 6.5% |
|||||||||||
|
Costco Wholesale Corp. |
3,205 |
652,891 |
|||||||||
|
CVS Health Corp. |
6,500 |
425,880 |
|||||||||
|
Estee Lauder Cos. Inc., Class A Shares |
5,400 |
702,540 |
|||||||||
|
PepsiCo Inc. |
4,425 |
488,874 |
|||||||||
|
Total Consumer Staples |
2,270,185 |
||||||||||
|
Financials — 9.7% |
|||||||||||
|
Citizens Financial Group Inc. |
15,155 |
450,558 |
|||||||||
|
CME Group Inc. |
3,190 |
600,103 |
|||||||||
|
Discover Financial Services |
8,730 |
514,895 |
|||||||||
|
Invesco Ltd. |
11,070 |
185,312 |
|||||||||
|
JPMorgan Chase & Co. |
8,110 |
791,698 |
|||||||||
|
Prologis Inc. |
6,475 |
380,212 |
|||||||||
|
Simon Property Group LP |
1,345 |
225,947 |
|||||||||
|
Texas Capital Bancshares Inc. |
5,255 |
268,478 |
* |
||||||||
|
Total Financials |
3,417,203 |
||||||||||
|
Health Care — 10.2% |
|||||||||||
|
Boston Scientific Corp. |
21,430 |
757,336 |
* |
||||||||
|
Celgene Corp. |
5,235 |
335,511 |
* |
||||||||
|
Chubb Limited |
4,240 |
547,723 |
|||||||||
|
Teleflex Inc. |
2,020 |
522,130 |
|||||||||
|
Thermo Fisher Scientific Inc. |
2,550 |
570,664 |
|||||||||
|
UnitedHealth Group Inc. |
3,415 |
850,745 |
|||||||||
|
Total Health Care |
3,584,109 |
||||||||||
|
Industrials — 10.5% |
|||||||||||
|
Bloom Energy Corp. |
6,945 |
69,311 |
* |
||||||||
|
Cintas Corp. |
3,740 |
628,283 |
|||||||||
|
Danaher Corp. |
5,345 |
551,176 |
|||||||||
|
Eaton Corp. PLC |
7,060 |
484,740 |
|||||||||
1919 Variable Socially Responsive Balanced Fund 2018 Annual Report
5
Schedule of investments (cont'd)
December 31, 2018
1919 Variable Socially Responsive Balanced Fund
|
Security |
Shares |
Value |
|||||||||||||||||
|
Industrials — continued |
|||||||||||||||||||
|
HD Supply Holdings Inc. |
11,025 |
$ |
413,658 |
* |
|||||||||||||||
|
Illinois Tool Works Inc. |
3,770 |
477,621 |
|||||||||||||||||
|
Union Pacific Corp. |
3,740 |
516,980 |
|||||||||||||||||
|
Xylem Inc/NY |
8,265 |
551,441 |
|||||||||||||||||
|
Total Industrials |
3,693,210 |
||||||||||||||||||
|
Information Technology — 18.5% |
|||||||||||||||||||
|
Adobe Systems Inc. |
2,440 |
552,025 |
* |
||||||||||||||||
|
Alphabet Inc., Class A Shares |
900 |
940,464 |
* |
||||||||||||||||
|
Analog Devices Inc. |
3,775 |
324,008 |
|||||||||||||||||
|
Apple Inc. |
5,155 |
813,150 |
|||||||||||||||||
|
Broadcom Inc. |
1,350 |
343,278 |
|||||||||||||||||
|
Cognex Corp. |
6,685 |
258,509 |
|||||||||||||||||
|
Facebook Inc. |
3,630 |
475,857 |
* |
||||||||||||||||
|
Intuit Inc. |
2,115 |
416,338 |
|||||||||||||||||
|
Microsoft Corp. |
6,255 |
635,320 |
|||||||||||||||||
|
PayPal Holdings Inc. |
6,580 |
553,312 |
* |
||||||||||||||||
|
Salesforce.com Inc. |
4,110 |
562,947 |
* |
||||||||||||||||
|
Visa Inc., Class A Shares |
4,850 |
639,909 |
|||||||||||||||||
|
Total Information Technology |
6,515,117 |
||||||||||||||||||
|
Telecommunication Services — 0.6% |
|||||||||||||||||||
|
AT&T Inc. |
6,995 |
199,637 |
|||||||||||||||||
|
Total Telecommunication Services |
199,637 |
||||||||||||||||||
|
Utilities — 1.6% |
|||||||||||||||||||
|
American Water Works Co. Inc. |
6,345 |
575,936 |
|||||||||||||||||
|
Total Utilities |
575,936 |
||||||||||||||||||
|
Total Common Stocks (Cost — $16,755,166) |
23,470,214 |
||||||||||||||||||
|
Rate |
Maturity Date |
Face Amount |
|||||||||||||||||
|
Collateralized Mortgage Obligations — 0.1% |
|||||||||||||||||||
|
Federal Home Loan Mortgage Corp. (FHLMC), 3835 BA |
4.000 |
% |
8/15/38 |
$ |
20,381 |
20,641 |
|||||||||||||
|
Federal National Mortgage Association (FNMA), 2001-53 CY |
4.000 |
% |
6/25/41 |
8,271 |
8,580 |
||||||||||||||
|
Total Collateralized Mortgage Obligations (Cost — $29,540) |
29,221 |
||||||||||||||||||
|
Corporate Bonds — 19.0% |
|||||||||||||||||||
|
Consumer Discretionary — 2.1% |
|||||||||||||||||||
|
Cintas Corp No 2 |
2.900 |
% |
4/1/22 |
100,000 |
98,440 |
||||||||||||||
|
Comcast Corp. |
3.375 |
% |
2/15/25 |
70,000 |
68,616 |
||||||||||||||
|
Comcast Corp. |
5.650 |
% |
6/15/35 |
200,000 |
219,617 |
||||||||||||||
1919 Variable Socially Responsive Balanced Fund 2018 Annual Report
6
1919 Variable Socially Responsive Balanced Fund
|
Security |
Rate |
Maturity Date |
Face Amount |
Value |
|||||||||||||||
|
Consumer Discretionary — continued |
|||||||||||||||||||
|
Ford Motor Co. |
4.346 |
% |
12/8/26 |
$ |
145,000 |
$ |
129,377 |
||||||||||||
|
Ford Motor Credit Co LLC |
8.125 |
% |
1/15/20 |
195,000 |
202,495 |
||||||||||||||
|
Total Consumer Discretionary |
718,545 |
||||||||||||||||||
|
Consumer Staples — 0.9% |
|||||||||||||||||||
|
CVS Health Corp. |
3.875 |
% |
7/20/25 |
95,000 |
92,710 |
||||||||||||||
|
CVS Health Corp. |
4.780 |
% |
3/25/38 |
105,000 |
100,927 |
||||||||||||||
|
PepsiCo Inc. |
3.100 |
% |
7/17/22 |
135,000 |
135,123 |
||||||||||||||
|
Total Consumer Staples |
328,760 |
||||||||||||||||||
|
Financials — 8.0% |
|||||||||||||||||||
|
Aflac Inc. |
4.000 |
% |
2/15/22 |
130,000 |
132,717 |
||||||||||||||
|
American Express Credit Corp. |
2.200 |
% |
3/3/20 |
125,000 |
123,677 |
||||||||||||||
|
Bank of America Corp. (effective 5/17/2021, 3M US LIBOR + 0.63%) |
3.499 |
% |
5/17/22 |
130,000 |
130,064 |
(b) |
|||||||||||||
|
Bank of America Corp. (effective 1/23/2025, 3M US LIBOR + 0.81%) |
3.366 |
% |
1/23/26 |
160,000 |
153,099 |
(b) |
|||||||||||||
|
Bank of America Corp. |
4.183 |
% |
11/25/27 |
165,000 |
158,883 |
||||||||||||||
|
BlackRock Inc. |
4.250 |
% |
5/24/21 |
125,000 |
128,727 |
||||||||||||||
|
Boston Properties LP |
4.500 |
% |
12/1/28 |
155,000 |
158,789 |
||||||||||||||
|
Citigroup Inc. |
5.500 |
% |
9/13/25 |
110,000 |
115,594 |
||||||||||||||
|
Cooperatieve Centrale Raiffeisen-Boerenleenbank BA (Rabobank) |
4.500 |
% |
1/11/21 |
150,000 |
153,575 |
||||||||||||||
|
Intercontinental Exchange Inc. |
3.750 |
% |
12/1/25 |
75,000 |
75,458 |
||||||||||||||
|
JPMorgan Chase & Co. |
4.250 |
% |
10/15/20 |
195,000 |
198,565 |
||||||||||||||
|
JPMorgan Chase & Co. (3M US LIBOR + 1.10%) |
3.866 |
% |
6/7/21 |
160,000 |
161,148 |
(a) |
|||||||||||||
|
Morgan Stanley |
5.000 |
% |
11/24/25 |
70,000 |
71,480 |
||||||||||||||
|
Simon Property Group LP |
4.125 |
% |
12/1/21 |
110,000 |
112,646 |
||||||||||||||
|
Simon Property Group LP |
3.375 |
% |
12/1/27 |
155,000 |
148,500 |
||||||||||||||
|
State Street Corp. |
3.700 |
% |
11/20/23 |
120,000 |
121,311 |
||||||||||||||
|
TD Ameritrade Holding Corp. |
2.950 |
% |
4/1/22 |
125,000 |
123,716 |
||||||||||||||
|
Toronto-Dominion Bank |
1.450 |
% |
8/13/19 |
220,000 |
218,056 |
||||||||||||||
|
Toronto-Dominion Bank |
1.850 |
% |
9/11/20 |
200,000 |
196,390 |
||||||||||||||
|
Westpac Banking Corp. |
4.875 |
% |
11/19/19 |
110,000 |
111,720 |
||||||||||||||
|
Total Financials |
2,794,115 |
||||||||||||||||||
|
Health Care — 2.0% |
|||||||||||||||||||
|
Celgene Corp. |
3.900 |
% |
2/20/28 |
105,000 |
98,673 |
||||||||||||||
|
Express Scripts Holding Co. |
3.050 |
% |
11/30/22 |
185,000 |
179,206 |
||||||||||||||
|
Gilead Sciences Inc. |
4.500 |
% |
4/1/21 |
125,000 |
128,692 |
||||||||||||||
|
Gilead Sciences Inc. |
4.600 |
% |
9/1/35 |
100,000 |
101,136 |
||||||||||||||
|
Medtronic Inc. |
4.125 |
% |
3/15/21 |
200,000 |
204,255 |
||||||||||||||
|
Total Health Care |
711,962 |
||||||||||||||||||
1919 Variable Socially Responsive Balanced Fund 2018 Annual Report
7
Schedule of investments (cont'd)
December 31, 2018
1919 Variable Socially Responsive Balanced Fund
|
Security |
Rate |
Maturity Date |
Face Amount |
Value |
|||||||||||||||
|
Information Technology — 2.6% |
|||||||||||||||||||
|
Apple Inc. |
2.850 |
% |
2/23/23 |
$ |
185,000 |
$ |
182,838 |
||||||||||||
|
Microsoft Corp. |
4.200 |
% |
11/3/35 |
175,000 |
181,738 |
||||||||||||||
|
QUALCOMM Inc. |
2.250 |
% |
5/20/20 |
135,000 |
133,151 |
||||||||||||||
|
QUALCOMM Inc. (3M US LIBOR + 0.73%) |
3.250 |
% |
1/30/23 |
110,000 |
109,441 |
(a) |
|||||||||||||
|
QUALCOMM Inc. |
3.450 |
% |
5/20/25 |
175,000 |
168,516 |
||||||||||||||
|
Texas Instruments Inc. |
1.650 |
% |
8/3/19 |
150,000 |
148,802 |
||||||||||||||
|
Total Information Technology |
924,486 |
||||||||||||||||||
|
Telecommunication Services — 1.4% |
|||||||||||||||||||
|
AT&T Inc. |
4.450 |
% |
4/1/24 |
150,000 |
152,659 |
||||||||||||||
|
Verizon Communications Inc. |
4.329 |
% |
9/21/28 |
104,000 |
104,633 |
||||||||||||||
|
Verizon Communications Inc. |
4.500 |
% |
8/10/33 |
110,000 |
108,867 |
||||||||||||||
|
Verizon Communications Inc. |
5.250 |
% |
3/16/37 |
105,000 |
109,698 |
||||||||||||||
|
Total Telecommunication Services |
475,857 |
||||||||||||||||||
|
Utilities — 2.0% |
|||||||||||||||||||
|
DTE Electric Co. |
4.050 |
% |
5/15/48 |
120,000 |
119,212 |
||||||||||||||
|
Duke Energy Carolinas LLC |
3.350 |
% |
5/15/22 |
275,000 |
277,696 |
||||||||||||||
|
Georgia Power Co. |
3.250 |
% |
4/1/26 |
100,000 |
93,601 |
||||||||||||||
|
Southern Power Co. |
1.950 |
% |
12/15/19 |
220,000 |
216,731 |
||||||||||||||
|
Total Utilities |
707,240 |
||||||||||||||||||
|
Total Corporate Bonds (Cost — $6,716,863) |
6,660,965 |
||||||||||||||||||
|
Foreign Government Agency Issues — 2.3% |
|||||||||||||||||||
|
International Bank for Reconstruction & Development |
3.125 |
% |
11/20/25 |
270,000 |
278,217 |
||||||||||||||
|
International Finance Corp. |
1.750 |
% |
3/30/20 |
270,000 |
267,097 |
||||||||||||||
|
International Finance Corp. |
2.000 |
% |
10/24/22 |
255,000 |
249,401 |
||||||||||||||
|
Total Foreign Government Agency Issues (Cost — $792,564) |
794,715 |
||||||||||||||||||
|
Mortgage Backed Securities — 0.5% |
|||||||||||||||||||
|
Federal Home Loan Mortgage Corporation (FHLMC) |
|||||||||||||||||||
|
Gold Pool C91417 |
3.500 |
% |
1/1/32 |
44,665 |
45,492 |
||||||||||||||
|
Gold Pool A35826 |
5.000 |
% |
7/1/35 |
18,892 |
19,792 |
||||||||||||||
|
Gold Pool A49479 |
5.000 |
% |
6/1/36 |
23,066 |
24,496 |
||||||||||||||
|
Gold Pool A65694 |
6.000 |
% |
9/1/37 |
26,275 |
28,688 |
||||||||||||||
|
Federal National Mortgage Association (FNMA) |
|||||||||||||||||||
|
Pool 896885 |
6.000 |
% |
6/1/22 |
2,384 |
2,423 |
||||||||||||||
|
Pool 995262 |
5.500 |
% |
1/1/24 |
14,247 |
14,804 |
||||||||||||||
|
Pool 891596 |
5.500 |
% |
6/1/36 |
24,687 |
26,568 |
||||||||||||||
|
Pool 900936 |
6.500 |
% |
2/1/37 |
2,823 |
3,032 |
||||||||||||||
|
Pool 946594 |
6.000 |
% |
9/1/37 |
22,053 |
24,027 |
||||||||||||||
|
Total Mortgage Backed Securities (Cost — $178,550) |
189,322 |
||||||||||||||||||
1919 Variable Socially Responsive Balanced Fund 2018 Annual Report
8
1919 Variable Socially Responsive Balanced Fund
|
Security |
Rate |
Maturity Date |
Face Amount |
Value |
|||||||||||||||
|
U.S. Government & Agency Obligations — 10.3% |
|||||||||||||||||||
|
Federal Home Loan Bank (FHLB) |
5.500 |
% |
7/15/36 |
$ |
40,000 |
$ |
51,524 |
||||||||||||
|
Federal Home Loan Mortgage Corp (FHLMC) |
3.750 |
% |
3/27/19 |
120,000 |
120,373 |
||||||||||||||
|
Federal Home Loan Mortgage Corp (FHLMC) |
1.250 |
% |
10/2/19 |
75,000 |
74,231 |
||||||||||||||
|
Federal Home Loan Mortgage Corp (FHLMC) |
6.750 |
% |
9/15/29 |
35,000 |
46,767 |
||||||||||||||
|
Federal Home Loan Mortgage Corp (FHLMC) |
6.250 |
% |
7/15/32 |
70,000 |
93,605 |
||||||||||||||
|
Federal National Mortgage Association (FNMA) |
1.250 |
% |
5/6/21 |
165,000 |
160,275 |
||||||||||||||
|
Federal National Mortgage Association (FNMA) |
6.250 |
% |
5/15/29 |
110,000 |
141,230 |
||||||||||||||
|
Federal National Mortgage Association (FNMA) |
6.625 |
% |
11/15/30 |
365,000 |
489,902 |
||||||||||||||
|
United States Treasury Bonds |
7.875 |
% |
2/15/21 |
250,000 |
277,661 |
||||||||||||||
|
United States Treasury Bonds |
8.000 |
% |
11/15/21 |
75,000 |
86,398 |
||||||||||||||
|
United States Treasury Bonds |
7.250 |
% |
8/15/22 |
400,000 |
465,555 |
||||||||||||||
|
United States Treasury Bonds |
7.625 |
% |
11/15/22 |
250,000 |
297,007 |
||||||||||||||
|
United States Treasury Bonds |
6.250 |
% |
8/15/23 |
90,000 |
104,599 |
||||||||||||||
|
United States Treasury Bonds |
7.500 |
% |
11/15/24 |
265,000 |
335,991 |
||||||||||||||
|
United States Treasury Bonds |
6.875 |
% |
8/15/25 |
50,000 |
62,991 |
||||||||||||||
|
United States Treasury Bonds |
6.750 |
% |
8/15/26 |
30,000 |
38,580 |
||||||||||||||
|
United States Treasury Bonds |
5.500 |
% |
8/15/28 |
10,000 |
12,356 |
||||||||||||||
|
United States Treasury Bonds |
3.500 |
% |
2/15/39 |
131,000 |
143,355 |
||||||||||||||
|
United States Treasury Bonds |
4.375 |
% |
11/15/39 |
242,000 |
296,833 |
||||||||||||||
|
United States Treasury Notes |
3.625 |
% |
2/15/20 |
125,000 |
126,372 |
||||||||||||||
|
United States Treasury Notes |
2.625 |
% |
8/15/20 |
200,000 |
200,328 |
||||||||||||||
|
Total U.S. Government & Agency Obligations (Cost — $3,479,976) |
3,625,933 |
||||||||||||||||||
|
Shares |
|||||||||||||||||||
|
Short-Term Investment — 0.8% |
|||||||||||||||||||
|
Fidelity Institutional Money Market - Government Portfolio - Class I |
2.250 |
% |
286,293 |
286,293 |
(c) |
||||||||||||||
|
Total Short-Term Investment (Cost — $286,293) |
286,293 |
||||||||||||||||||
|
Total Investments — 99.8% (Cost — $28,238,952) |
35,056,663 |
||||||||||||||||||
|
Other Assets in Excess of Liabilities — 0.2% |
54,207 |
||||||||||||||||||
|
Total Net Assets — 100.0% |
$ |
35,110,870 |
|||||||||||||||||
Notes:
* Non-income producing security.
(a) Variable rate security. Reference rate and spread are included in the description.
(b) Fixed to floating rate. Effective date of change and formula disclosed.
(c) The rate is the annualized seven-day yield at period end.
The Accompanying Notes are an Integral Part of these Financial Statements.
1919 Variable Socially Responsive Balanced Fund 2018 Annual Report
9
Statement of assets and liabilities
December 31, 2018
|
Assets: |
|||||||
|
Investments in securities at value (cost $28,238,952) |
$ |
35,056,663 |
|||||
|
Dividends and interest receivable |
137,586 |
||||||
|
Prepaid expenses |
465 |
||||||
|
Total Assets |
35,194,714 |
||||||
|
Liabilities: |
|||||||
|
Payable for Fund shares repurchased |
2,682 |
||||||
|
Advisory fees payable |
2,833 |
||||||
|
Accrued other expenses |
78,329 |
||||||
|
Total Liabilities |
83,844 |
||||||
|
Net Assets |
$ |
35,110,870 |
|||||
|
Components of Net Assets: |
|||||||
|
Paid-in capital |
$ |
28,159,119 |
|||||
|
Total distributable earnings |
6,951,751 |
||||||
|
Net Assets |
$ |
35,110,870 |
|||||
|
Total Fund: |
|||||||
|
Net Assets |
$ |
35,110,870 |
|||||
|
Shares Issued and Outstanding (unlimited shares authorized, no par value) |
1,401,086 |
||||||
|
Net Asset Value, Redemption Price and Offering Price Per Share |
$ |
25.06 |
|||||
The Accompanying Notes are an Integral Part of these Financial Statements.
1919 Variable Socially Responsive Balanced Fund 2018 Annual Report
10
Statement of operations
For the Year Ended December 31, 2018
|
Investment Income: |
|||||||
|
Dividend income (Net of foreign tax of $1,061) |
$ |
377,077 |
|||||
|
Interest income |
343,046 |
||||||
|
Total Investment Income |
720,123 |
||||||
|
Expenses: |
|||||||
|
Advisory fees (Note 3) |
253,504 |
||||||
|
Transfer agent fees and expenses (Note 3) |
95,845 |
||||||
|
Administration and fund accounting fees (Note 3) |
75,482 |
||||||
|
Shareholder reporting fees |
18,989 |
||||||
|
Audit fees |
17,000 |
||||||
|
Legal fees |
12,677 |
||||||
|
Trustees' fees (Note 3) |
11,796 |
||||||
|
Miscellaneous |
7,467 |
||||||
|
Compliance fees (Note 3) |
6,287 |
||||||
|
Custody fees (Note 3) |
4,000 |
||||||
|
Insurance fees |
2,810 |
||||||
|
Total Expenses |
505,857 |
||||||
|
Expenses waived by the Adviser (Note 3) |
(158,752 |
) |
|||||
|
Net Expenses |
347,105 |
||||||
|
Net Investment Income |
373,018 |
||||||
|
Realized and Unrealized Gain/Loss on Investments |
|||||||
|
Net realized gain on investments |
2,363,352 |
||||||
|
Net change in unrealized appreciation/depreciation on investments |
(2,925,786 |
) |
|||||
|
Net Realized and Unrealized Loss on Investments |
(562,434 |
) |
|||||
|
Net Decrease in Net Assets Resulting from Operations |
$ |
(189,416 |
) |
||||
The Accompanying Notes are an Integral Part of these Financial Statements.
1919 Variable Socially Responsive Balanced Fund 2018 Annual Report
11
Statements of changes in net assets
|
For the year ended December 31, |
2018 |
2017 |
|||||||||
|
Increase (Decrease) in Net Assets from: |
|||||||||||
|
Operations: |
|||||||||||
|
Net investment income |
$ |
373,018 |
$ |
403,317 |
|||||||
|
Net realized gain on investments |
2,363,352 |
3,161,021 |
|||||||||
|
Net change in unrealized appreciation/depreciation on investments |
(2,925,786 |
) |
2,426,294 |
||||||||
|
Net Increase/Decrease in Net Assets Resulting from Operations |
(189,416 |
) |
5,990,632 |
||||||||
|
Distributions to Shareholders |
(3,452,501) |
(3,107,005)* |
|||||||||
|
Capital Transactions: |
|||||||||||
|
Net proceeds from shares sold |
414,318 |
219,372 |
|||||||||
|
Reinvestment of distributions |
3,452,501 |
3,107,005 |
|||||||||
|
Cost of shares repurchased |
(4,469,550 |
) |
(4,741,200 |
) |
|||||||
|
Net Decrease in Net Assets from Capital Transactions |
(602,731 |
) |
(1,414,823 |
) |
|||||||
|
Total Increase (Decrease) in Net Assets |
(4,244,648 |
) |
1,468,804 |
||||||||
|
Net Assets: |
|||||||||||
|
Beginning of year |
39,355,518 |
37,886,714 |
|||||||||
|
End of year |
$ |
35,110,870 |
$ |
39,355,518 |
** |
||||||
|
Capital Share Transactions: |
|||||||||||
|
Shares sold |
14,027 |
8,123 |
|||||||||
|
Shares reinvested |
131,725 |
112,573 |
|||||||||
|
Shares repurchased |
(156,394 |
) |
(169,972 |
) |
|||||||
|
Net Decrease in Shares Outstanding |
(10,642 |
) |
(49,276 |
) |
|||||||
* Includes distributions from net investment income of $397,638 and distributions from net realized gains of $2,709,367.
** Includes undistributed net investment income of $49,905.
The Accompanying Notes are an Integral Part of these Financial Statements.
1919 Variable Socially Responsive Balanced Fund 2018 Annual Report
12
Financial highlights
For a share of beneficial interest outstanding throughout each year ended December 31,
|
2018 |
2017 |
2016 |
2015 |
2014 |
|||||||||||||||||||
|
Net asset value, beginning of year |
$ |
27.88 |
$ |
25.93 |
$ |
26.29 |
$ |
29.76 |
$ |
30.96 |
|||||||||||||
|
Income (loss) from investment operations: |
|||||||||||||||||||||||
|
Net investment income1 |
0.28 |
0.29 |
0.28 |
0.29 |
0.27 |
||||||||||||||||||
|
Net realized and unrealized gain (loss) on investments |
(0.42 |
) |
4.03 |
1.36 |
(0.78 |
) |
2.64 |
||||||||||||||||
|
Total income (loss) from investment operations |
(0.14 |
) |
4.32 |
1.64 |
(0.49 |
) |
2.91 |
||||||||||||||||
|
Less distributions: |
|||||||||||||||||||||||
|
From net investment income |
(0.30 |
) |
(0.30 |
) |
(0.26 |
) |
(0.39 |
) |
(0.28 |
) |
|||||||||||||
|
From net realized gain on investments |
(2.38 |
) |
(2.07 |
) |
(1.74 |
) |
(2.59 |
) |
(3.83 |
) |
|||||||||||||
|
Total distributions |
(2.68 |
) |
(2.37 |
) |
(2.00 |
) |
(2.98 |
) |
(4.11 |
) |
|||||||||||||
|
Net asset value, end of year |
$ |
25.06 |
$ |
27.88 |
$ |
25.93 |
$ |
26.29 |
$ |
29.76 |
|||||||||||||
|
Total return2 |
(0.94 |
)% |
16.74 |
% |
6.23 |
% |
(1.71 |
)% |
9.30 |
% |
|||||||||||||
|
Supplemental data and ratios: |
|||||||||||||||||||||||
|
Net assets, end of year (in thousands) |
$ |
35,111 |
$ |
39,356 |
$ |
37,887 |
$ |
40,309 |
$ |
47,456 |
|||||||||||||
|
Ratios to average net assets |
|||||||||||||||||||||||
|
Gross expenses |
1.30 |
% |
1.29 |
% |
1.28 |
% |
1.23 |
% |
0.94 |
% |
|||||||||||||
|
Net expenses3 |
0.895 |
0.895 |
0.895 |
0.895 |
0.924,5 |
||||||||||||||||||
|
Net investment income |
0.96 |
1.04 |
1.04 |
0.99 |
0.85 |
||||||||||||||||||
|
Portfolio turnover rate |
19 |
% |
26 |
% |
31 |
% |
27 |
% |
26 |
% |
|||||||||||||
1 Per share amounts have been calculated using the average shares method.
2 Performance figures may reflect compensating balance arrangements, fee waivers and/or expense reimbursements. In the absence of compensating balance arrangements, fee waivers and/or expense reimbursements, the total return would have been lower. Total returns do not reflect expenses associated with separate accounts such as administrative fees, account charges and surrender charges which, if reflected, would reduce the total return for all periods shown. Past performance is no guarantee of future results.
3 The Adviser has agreed to limit expenses, other than brokerage, interest, taxes, extraordinary expenses and acquired fund fees and expenses, to no more than 0.89% of the Fund's average net assets. This expense limitation arrangement cannot be terminated prior to April 30, 2020 without the Board of Trustees' consent.
4 The impact of compensating balance arrangements, if any, was less than 0.01%.
5 Reflects fee waivers and/or expense reimbursements.
The Accompanying Notes are an Integral Part of these Financial Statements.
1919 Variable Socially Responsive Balanced Fund 2018 Annual Report
13
Notes to financial statements
Note 1. Organization
1919 Variable Socially Responsive Balanced Fund (the "Fund") is a diversified series of Trust for Advised Portfolios (the "Trust"). The Trust, a Delaware Statutory Trust, is registered under the Investment Company Act of 1940, as amended (the "1940 Act") as an open-end investment management company. The Fund was converted to the Trust on November 10, 2014, and was previously organized under the Legg Mason Partners Variable Equity Trust as the Legg Mason Investment Counsel Variable Social Awareness Portfolio (the "Predecessor Fund").
Shares of the Fund may only be purchased or redeemed through variable annuity contracts and variable life insurance policies offered by the separate accounts of participating insurance companies or through eligible pension or other qualified plans.
The Fund seeks capital appreciation and retention of net investment income.
Note 2. Significant accounting policies
The following is a summary of significant accounting policies consistently followed by the Fund in the preparation of its financial statements. These policies are in conformity with accounting principles generally accepted in the United States of America ("GAAP") for investment companies. The Fund is considered an investment company under U.S. GAAP and follows the accounting and reporting guidance applicable to investment companies in the Financial Accounting Standards Board Accounting Standards Codification Topic 946. The presentation of financial statements in conformity with GAAP requires management to make estimates and assumptions that affect the reported amounts of assets and liabilities and disclosure of contingent assets and liabilities at the date of the financial statements and the reported amounts of income and expenses during the period. Actual results may differ from those estimates.
(a) Securities valuation. Investments in securities traded on a national securities exchange are valued at the last reported sales price on the exchange on which the security is principally traded. Securities traded on the NASDAQ exchanges are valued at the NASDAQ Official Closing Price ("NOCP"). Exchange-traded securities for which no sale was reported and NASDAQ securities for which there is no NOCP are valued at the mean of the most recent quoted bid and ask prices. Unlisted securities held by the Fund are valued at the last sale price in the over-the-counter ("OTC") market. If there is no trading on a particular day, the mean between the last quoted bid and ask price is used.
Long-term fixed income securities are valued using prices provided by an independent pricing service approved by the Board of Trustees. Pricing services may use various valuation methodologies, including matrix pricing and other analytical models as well as market transactions and dealer quotations. Securities for which market quotations are not readily available are valued at their estimated fair value as determined in good faith by 1919 Investment Counsel, LLC (the "Adviser" or "1919") under procedures established by and under the general supervision and responsibility of the Trust's Board of Trustees.
1919 Variable Socially Responsive Balanced Fund 2018 Annual Report
14
Various inputs are used in determining the value of the Fund's investments. These inputs are summarized into three broad levels and described below:
• Level 1 — quoted prices in active markets for identical investments
• Level 2 — other significant observable inputs (including quoted prices for similar investments, interest rates, prepayment speeds, credit risk, etc.).
• Level 3 — significant unobservable inputs, including the Fund's own assumptions in determining the fair value of investments.
The inputs or methodologies used for valuing securities are not necessarily an indication of the risk associated with investing in those securities. The following is a summary of the inputs used in valuing the Fund's assets carried at value:
ASSETS
|
Description |
Quoted Prices (Level 1) |
Other Significant Observable Inputs (Level 2) |
Significant Unobservable Inputs (Level 3) |
Total |
|||||||||||||||
|
Long-term investments* |
|||||||||||||||||||
|
Common Stocks |
$ |
23,470,214 |
$ |
— |
$ |
— |
$ |
23,470,214 |
|||||||||||
|
Collateralized Mortgage Obligations |
— |
29,221 |
— |
29,221 |
|||||||||||||||
|
Corporate Bonds |
— |
6,660,965 |
— |
6,660,965 |
|||||||||||||||
|
Foreign Government Agency Issues |
— |
794,715 |
— |
794,715 |
|||||||||||||||
|
Mortgage Backed Securities |
— |
189,322 |
— |
189,322 |
|||||||||||||||
|
U.S. Government & Agency Obligations |
— |
3,625,933 |
— |
3,625,933 |
|||||||||||||||
|
Total long-term investments |
$ |
23,470,214 |
$ |
11,300,156 |
$ |
— |
$ |
34,770,370 |
|||||||||||
|
Short-term investment |
$ |
286,293 |
$ |
— |
$ |
— |
$ |
286,293 |
|||||||||||
|
Total investments |
$ |
23,756,507 |
$ |
11,300,156 |
$ |
— |
$ |
35,056,663 |
|||||||||||
* See Schedule of Investments for additional detailed categorizations.
(b) Foreign currency translation. Investment securities and other assets and liabilities denominated in foreign currencies are translated into U.S. dollar amounts based upon prevailing exchange rates on the date of valuation. Purchases and sales of investment securities and income and expense items denominated in foreign currencies are translated into U.S. dollar amounts based upon prevailing exchange rates on the respective dates of such transactions.
The Fund does not isolate that portion of the results of operations resulting from fluctuations in foreign exchange rates on investments from the fluctuations arising from changes in market prices of securities held. Such fluctuations are included with the net realized and unrealized gain or loss on investments.
Net realized foreign exchange gains or losses arise from sales of foreign currencies, including gains and losses on forward foreign currency contracts, currency gains or losses realized between the trade and settlement dates on securities transactions, and the difference between the amounts of dividends, interest, and foreign withholding taxes recorded
1919 Variable Socially Responsive Balanced Fund 2018 Annual Report
15
Notes to financial statements (cont'd)
on the Fund's books and the U.S. dollar equivalent of the amounts actually received or paid. Net unrealized foreign exchange gains and losses arise from changes in the values of assets and liabilities, other than investments in securities, on the date of valuation, resulting from changes in exchange rates.
Foreign security and currency transactions may involve certain considerations and risks not typically associated with those of U.S. dollar denominated transactions as a result of, among other factors, the possibility of lower levels of governmental supervision and regulation of foreign securities markets and the possibility of political or economic instability.
(c) Foreign investment risk. The Fund's investments in foreign securities may involve risks not present in domestic investments. Since securities may be denominated in foreign currencies, may require settlement in foreign currencies or pay interest or dividends in foreign currencies, changes in the relationship of these foreign currencies to the U.S. dollar can significantly affect the value of the investments and earnings of the Fund. Foreign investments may also subject the Fund to foreign government exchange restrictions, expropriation, taxation or other political, social or economic developments, all of which affect the market and/or credit risk of the investments.
(d) Credit and market risk. Investments in securities that are collateralized by residential real estate mortgages are subject to certain credit and liquidity risks. When market conditions result in an increase in default rates of the underlying mortgages and the foreclosure values of underlying real estate properties are materially below the outstanding amount of these underlying mortgages, collection of the full amount of accrued interest and principal on these investments may be doubtful. Such market conditions may significantly impair the value and liquidity of these investments and may result in a lack of correlation between their credit ratings and values.
(e) Security transactions and investment income. Security transactions are accounted for on a trade date basis. Interest income, adjusted for amortization of premium and accretion of discount, is recorded on the accrual basis. Dividend income is recorded on the ex-dividend date. Foreign dividend income is recorded on the ex-dividend date or as soon as practicable after the Fund determines the existence of a dividend declaration after exercising reasonable due diligence. The cost of investments sold is determined by use of the specific identification method. To the extent any issuer defaults or a credit event occurs that impacts the issuer, the Fund may halt any additional interest income accruals and consider the realizability of interest accrued up to the date of default or credit event.
(f) Distribution to shareholders. Distributions from net investment income and distributions of net realized gains, if any, are declared at least annually. Distributions to shareholders of the Fund are recorded on the ex-dividend date and are determined in accordance with income tax regulations, which may differ from GAAP.
1919 Variable Socially Responsive Balanced Fund 2018 Annual Report
16
(g) REIT distributions. The character of distributions received from Real Estate Investment Trusts (''REITs'') held by the Fund is generally comprised of net investment income, capital gains, and return of capital. It is the policy of the Fund to estimate the character of distributions received from underlying REITs based on historical data provided by the REITs. After each calendar year end, REITs report the actual tax character of these distributions. Differences between the estimated and actual amounts reported by the REITs are reflected in the Fund's records in the year in which they are reported by the REITs by adjusting related investment cost basis, capital gains and income, as necessary.
(h) Compensating balance arrangements. The Predecessor Fund had an arrangement with its custodian bank whereby a portion of the custodian's fees were paid indirectly by credits earned on the Fund's cash on deposit with the bank.
(i) Federal and other taxes. It is the Fund's policy to comply with the federal income and excise tax requirements of the Internal Revenue Code of 1986 (the "Code"), as amended, applicable to regulated investment companies. Accordingly, the Fund intends to distribute its taxable income and net realized gains, if any, to shareholders in accordance with timing requirements imposed by the Code. Therefore, no federal or state income tax provision is required in the Fund's financial statements.
Management has analyzed the Fund's tax positions taken on income tax returns for all open tax years (prior three fiscal years) and has concluded that as of December 31, 2018, no provision for income tax is required in the Fund's financial statements. The Fund's federal and state income and federal excise tax returns for tax years for which the applicable statutes of limitations have not expired are subject to examination by the Internal Revenue Service and state departments of revenue. The Fund has no examination in progress and is not aware of any tax position for which it is reasonably possible that the total amount of unrecognized tax benefits will significantly change in the next twelve months.
Under the applicable foreign tax laws, a withholding tax may be imposed on interest, dividends and capital gains at various rates.
Note 3. Investment management agreement and other transactions with affiliates
The Trust has an agreement with the Adviser to furnish investment advisory services to the Fund. Under the terms of this agreement, the Fund pays an investment management fee, calculated daily and paid monthly, in accordance with the following breakpoint schedule:
|
Average Daily Net Assets |
Annual Rate |
||||||
|
First $100 million |
0.65 |
% |
|||||
|
Next $100 million |
0.61 |
||||||
|
Next $100 million |
0.51 |
||||||
|
Over $300 million |
0.46 |
||||||
1919 Variable Socially Responsive Balanced Fund 2018 Annual Report
17
Notes to financial statements (cont'd)
The Adviser has agreed to waive fees and reimburse operating expenses (other than interest, brokerage, taxes, extraordinary expenses and acquired fund fees and expenses) so that total annual operating expenses do not exceed 0.89% (the "expense cap"). This expense limitation arrangement cannot be terminated prior to April 30, 2020, without the Board of Trustees' consent. Prior to the conversion, the Predecessor Fund limited its operating expenses to 1.00% of average net assets.
Effective April 30, 2017, the Adviser is permitted to recapture amounts waived or reimbursed to the Fund over a rolling three year period, provided that the total operating expenses of the Fund, including the recoupment, do not exceed the lesser of the established cap on expenses for that year or the cap in place when the waiver is incurred.
At December 31, 2018, the amounts waived by the Adviser and the eligible recapture periods are as follows:
|
December 31, |
|||||||
| 2020: |
$ |
155,665 |
|||||
| 2021: |
158,752 |
||||||
|
Total |
314,417 |
||||||
U.S. Bancorp Fund Services, LLC ("USBFS") serves as the Fund's administrator and transfer agent. The officers of the Trust are employees of USBFS. U.S. Bank serves as the Fund's custodian. Quasar Distributors, LLC, an affiliate of USBFS, acts as the Fund's distributor and principal underwriter. For the year ended, December 31, 2018, the Fund incurred the following expenses for administration & fund accounting, transfer agent, compliance and custody fees:
|
Administration & fund accounting |
$ |
75,482 |
|||||
|
Transfer Agency |
$ |
36,219 |
|||||
|
Compliance |
$ |
6,287 |
|||||
|
Custody |
$ |
4,000 |
|||||
At December 31, 2018, the Fund had payables due to USBFS for administration & fund accounting, transfer agent, compliance and custody fees in the following amounts:
|
Administration & fund accounting |
$ |
19,806 |
|||||
|
Transfer Agency |
$ |
9,249 |
|||||
|
Compliance |
$ |
1,518 |
|||||
|
Custody |
$ |
1,001 |
|||||
The above payable amounts are included in Accrued other expenses in the Statement of assets and liabilities.
The Independent Trustees were paid $11,796 for their services and reimbursement of travel expenses during the year ended December 31, 2018. The Fund pays no compensation to the Interested Trustee or officers of the Trust.
1919 Variable Socially Responsive Balanced Fund 2018 Annual Report
18
Note 4. Investment transactions
During the year ended December, 2018, the aggregate cost of purchases and proceeds from sales of investments (excluding short-term investments) and U.S Government & Agency Obligations were as follow:
|
Investments |
U.S. Government & Agency Obligations |
||||||||||
|
Purchases |
$ |
6,490,825 |
$ |
774,528 |
|||||||
|
Sales |
9,667,570 |
150,000 |
|||||||||
Note 5. Income tax information and distributions to shareholders
At December 31, 2018, the components of distributable accumulated earnings (deficit) on a tax basis were as follows:
|
Cost of Investments for tax purposes |
$ |
28,256,185 |
|||||
|
Gross tax unrealized appreciation |
8,411,377 |
||||||
|
Gross tax unrealized depreciation |
(1,610,899 |
) |
|||||
|
Net tax unrealized appreciation on investments |
6,800,478 |
||||||
|
Undistributed ordinary income |
79,812 |
||||||
|
Undistributed long-term capital gains |
101,583 |
||||||
|
Other accumulated earnings |
(30,122 |
) |
|||||
|
Total distributable earnings |
$ |
6,951,751 |
|||||
As of December 31, 2018, the Fund has no capital loss carryforward balance.
The tax character of distributions paid during the fiscal years ended December 31, 2018 and December 31, 2017, was as follows:
|
Year Ended December 31, 2018 |
Year Ended December 31, 2017 |
||||||||||
|
Distribution Paid From: |
|||||||||||
|
Ordinary Income |
$ |
621,768 |
$ |
667,432 |
|||||||
|
Net Long Term Capital Gains |
2,830,733 |
2,439,573 |
|||||||||
Note 6. Subsequent events
In preparing these financial statements, the Fund has evaluated events and transactions for potential recognition or disclosure through the date the financial statements were available to be issued. The Fund has determined that there were no subsequent events that would need to be disclosed in the Fund's financial statements.
Note 7. New accounting pronouncements
In August 2018, FASB issued ASU 2018-13, Fair Value Measurement (Topic 820): Disclosure Framework — Changes to the Disclosure Requirements for Fair Value Measurement ("ASU 2018-13"). The primary focus of ASU 2018-13 is to improve the effectiveness of the disclosure requirements for fair value measurements. The changes
1919 Variable Socially Responsive Balanced Fund 2018 Annual Report
19
Notes to financial statements (cont'd)
affect all companies that are required to include fair value measurement disclosures. In general, the amendments in ASU 2018-13 are effective for all entities for fiscal years and interim periods within those fiscal years, beginning after December 15, 2019. An entity is permitted to early adopt the removed or modified disclosures upon the issuance of ASU 2018-13 and may delay adoption of the additional disclosures, which are required for public companies only, until their effective date. The Fund has adopted all applicable provisions of ASU 2018-13.
1919 Variable Socially Responsive Balanced Fund 2018 Annual Report
20
Report of independent registered public accounting firm
To the Board of Trustees of Trust for Advised Portfolios
and the Shareholders of 1919 Variable Socially Responsive Balanced Fund
Opinion on the Financial Statements
We have audited the accompanying statement of assets and liabilities of 1919 Variable Socially Responsive Balanced Fund, a series of shares of beneficial interest in Trust for Advised Portfolios (the "Fund"), including the schedule of investments, as of December 31, 2018, and the related statement of operations for the year then ended, the statements of changes in net assets for each of the years in the two-year period then ended and the financial highlights for each of the years in the five-year period then ended, and the related notes (collectively referred to as the "financial statements"). In our opinion, the financial statements present fairly, in all material respects, the financial position of the Fund as of December 31, 2018, and the results of its operations for the year then ended, the changes in its net assets for each of the years in the two-year period then ended and its financial highlights for each of the years in the five-year period then ended, in conformity with accounting principles generally accepted in the United States of America.
Basis for Opinion
These financial statements are the responsibility of the Fund's management. Our responsibility is to express an opinion on the Fund's financial statements based on our audits. We are a public accounting firm registered with the Public Company Accounting Oversight Board (United States) ("PCAOB") and are required to be independent with respect to the Fund in accordance with the U.S. federal securities law and the applicable rules and regulations of the Securities and Exchange Commission and the PCAOB.
We conducted our audits in accordance with the standards of the PCAOB. Those standards require that we plan and perform the audits to obtain reasonable assurance about whether the financial statements are free of material misstatement, whether due to error or fraud. The Fund is not required to have, nor were we engaged to perform, an audit of its internal control over financial reporting. As part of our audits we are required to obtain an understanding of internal control over financial reporting but not for the purpose of expressing an opinion on the effectiveness of the Fund's internal control over financial reporting. Accordingly, we express no such opinion.
Our audits included performing procedures to assess the risk of material misstatement of the financial statements, whether due to error or fraud, and performing procedures that respond to those risks. Such procedures include examining, on a test basis, evidence regarding the amounts and disclosures in the financial statements. Our procedures included confirmation of securities owned as of December 31, 2018 by correspondence with the custodian. Our audits also included evaluating the accounting principles used and
1919 Variable Socially Responsive Balanced Fund 2018 Annual Report
21
Report of independent registered public accounting firm (cont'd)
significant estimates made by management, as well as evaluating the overall presentation of the financial statements. We believe that our audits provide a reasonable basis for our opinion.

BBD, LLP
We have served as the auditor of one or more of the Funds in Trust for Advised Portfolios since 2014.
Philadelphia, Pennsylvania
February 18, 2019
1919 Variable Socially Responsive Balanced Fund 2018 Annual Report
22
Other information (unaudited)
December 31, 2018
Proxy Voting
The Fund's proxy voting guidelines and a record of the Predecessor Fund's proxy votes for the 12 months ended June 30, 2018 are available without charge, upon request, by calling 1-844-828-1919 and on the Securities and Exchange Commission's website at www.sec.gov.
Quarterly Holdings
The Fund files its complete schedule of portfolio holdings with the SEC for the first and third quarters of each fiscal year on Form N-Q. The Fund's Forms N-Q are available on the EDGAR database on the Securities and Exchange Commission's website at www.sec.gov. These Forms may also be reviewed and copied at the Securities and Exchange Commission's Public Reference Room in Washington, D.C. Information about the operation of the Public Reference Room may be obtained by calling 1-800-SEC-0330.
Tax Information
The percentage of taxable ordinary income distributions that are designated as short-term capital gain distributions under Internal Revenue Section 871 (k)(2)(C) for the period ended December 31, 2018 was 38.89%.
For the year ended December 31, 2018, certain dividends paid by the Fund may be subject to a maximum tax rate of 15%, as provided for by the Jobs and Growth Tax Relief Reconciliation Act of 2003. The percentage of dividends declared from ordinary income designated as qualified dividend income was 52.48%.
For corporate shareholders, the percent of ordinary income distributions qualifying for the corporate dividends received deduction for the year ended December 31, 2018, was 50.76%.
1919 Variable Socially Responsive Balanced Fund 2018 Annual Report
23
Approval of investment advisory agreement for the
1919 Variable Socially Responsive Balanced Fund
(unaudited)
At a meeting held on August 21 and 22, 2018, the Board of Trustees (the "Board") of Trust for Advised Portfolios (the "Trust"), including all Trustees who are not "interested persons" of the Trust, as that term is defined in the Investment Company Act of 1940, as amended, considered and approved the continuance of the investment advisory agreement ("Advisory Agreement") with 1919 Investment Counsel, LLC ("1919" or the "Adviser"), for the 1919 Variable Socially Responsive Balanced Fund (the "Fund"). Ahead of the August meeting, the Board received and reviewed substantial information regarding the Fund, the Adviser and the services provided by the Adviser to the Fund under the Advisory Agreement. This information formed the primary (but not exclusive) basis for the Board's determinations. Below is a summary of the factors considered by the Board and the conclusions that formed the basis for the Board's approval of the continuance of the Advisory Agreement:
In considering the continuance of the Advisory Agreement, the Board considered the following factors and made the following determinations. In its deliberations, the Board did not identify any single factor or piece of information as all important, controlling, or determinative of its decision, and each Trustee may have attributed different weights to the various factors and information.
• In considering the nature, extent and quality of the services provided by the Adviser, the Trustees considered the Adviser's specific responsibilities in all aspects of the day-to-day management of the Fund as well as the qualifications, experience and responsibilities of the portfolio managers and other key personnel involved in the day-to-day activities of the Fund. The Board also considered the resources and compliance structure of 1919, including information regarding its compliance program, chief compliance officer, and compliance record, and its disaster recovery/business continuity plan. The Board also considered the prior relationship between 1919 and the Trust, as well as the Board's knowledge of the Adviser's operations, and noted that during the course of the prior year it had met with the Adviser in person to discuss fund performance and investment outlook, as well as various marketing and compliance topics, including the Adviser's risk management process. The Board concluded that 1919 had sufficient quality and depth of personnel, resources, investment methods and compliance policies and procedures essential to performing its duties under the Advisory Agreement and that, in the Board's view, the nature, overall quality, and extent of the management services provided were and would continue to be satisfactory and reliable.
• In assessing the quality of the portfolio management delivered by the Adviser, the Board reviewed the performance of the Fund on both an absolute basis and in comparison to its peer group and relevant benchmark index. The Board considered that, on an annualized basis over various periods of time, the Fund outperformed its peer group median/average as of June 30, 2018, other than for the 10-year period, but lagged
1919 Variable Socially Responsive Balanced Fund 2018 Annual Report
24
relative to its benchmark index as of March 31, 2018, for all periods except the one-year period during which it outperformed the index. The Board noted that the Fund had achieved more than ten calendar years of performance results.
• The Trustees also reviewed the cost of the Adviser's services, and the structure and level of advisory fees payable by the Fund, including a comparison of those fees to fees charged by a peer group of funds. The Board noted that the Adviser had contractually agreed to maintain an annual expense cap for the Fund. The Board noted that the Fund's advisory fee was lower than its peer group median and average and that the Fund's net expense ratio was higher than its peer group median and average. After reviewing the materials that were provided, the Trustees concluded that the fees to be received by 1919 were fair and reasonable.
• The Trustees considered 1919's assertion that, based on the asset size of the Fund, economies of scale had not yet been achieved. The Trustees concluded that they will have the opportunity to periodically reexamine whether economies of scale have been achieved.
• The Trustees considered the profitability of 1919 from managing the Fund. In assessing 1919's profitability, the Trustees reviewed 1919's financial information that was provided in the materials and took into account both the direct and indirect benefits to 1919 from managing the Fund. The Trustees concluded that 1919's profits from managing the Fund were not excessive and, after a review of the relevant financial information, 1919 appeared to have adequate capitalization and/or would maintain adequate profit levels to support the Fund.
1919 Variable Socially Responsive Balanced Fund 2018 Annual Report
25
Trustee and officer information (unaudited)
December 31, 2018
Independent Trustees4:
|
John Chrystal |
|||||||
|
615 E. Michigan Street |
|||||||
|
Milwaukee, WI 53202 |
|||||||
|
Year of birth |
1958 |
||||||
|
Position(s) held with Trust |
Trustee |
||||||
|
Term of office1 and length of time served |
Since 2011 |
||||||
|
Principal occupation(s) during past 5 years |
Private investor. Previously served as Founder and Managing Partner of Bent Gate Advisors, LLC, a consulting firm that provided strategic advice and assistance to financial institutions (2009 – 2013). Previously a Partner at DiMaio Ahmad Capital, an investment management firm. |
||||||
|
Number of portfolios in fund complex2 overseen by Trustee |
4 |
||||||
|
Other Directorships held during past 5 years by Trustee3 |
|||||||
|
Albert J. DiUlio, S.J. |
|||||||
|
615 E. Michigan Street |
|||||||
|
Milwaukee, WI 53202 |
|||||||
|
Year of birth |
1943 |
||||||
|
Position(s) held with Trust |
Trustee |
||||||
|
Term of office1 and length of time served |
Since 2011 |
||||||
|
Principal occupation(s) during past 5 years |
Treasurer, Midwest Province and Wisconsin Province of The Society of Jesus (2014 to present); President, Vatican Observatory Foundation (2011 – 2014). Previously, served five years as Secretary for Finance and Higher Education USA Jesuit Conference, followed by a one year Sabbatical. |
||||||
|
Number of portfolios in fund complex2 overseen by Trustee |
4 |
||||||
|
Other Directorships held during past 5 years by Trustee3 |
None |
||||||
|
Harry E. Resis |
|||||||
|
615 E. Michigan Street |
|||||||
|
Milwaukee, WI 53202 |
|||||||
|
Year of birth |
1945 |
||||||
|
Position(s) held with Trust |
Trustee |
||||||
|
Term of office1 and length of time served |
Since 2012 |
||||||
|
Principal occupation(s) during past 5 years |
Private investor. Previously served as Director of US Fixed Income for Henderson Global Investors. |
||||||
|
Number of portfolios in fund complex2 overseen by Trustee |
4 |
||||||
|
Other Directorships held during past 5 years by Trustee3 |
None |
||||||
1919 Variable Socially Responsive Balanced Fund 2018 Annual Report
26
Interested Trustee5:
|
Christopher E. Kashmerick |
|||||||
|
615 E. Michigan Street |
|||||||
|
Milwaukee, WI 53202 |
|||||||
|
Year of birth |
1974 |
||||||
|
Position(s) held with Trust |
Trustee, Chairman, President and Principal Executive Officer |
||||||
|
Term of office1 and length of time served |
Trustee since 2018; Chairman since 2018; President and Principal Executive Officer since 2014. |
||||||
|
Principal occupation(s) during past 5 years |
Senior Vice President, U.S. Bancorp Fund Services, LLC (2011 – present) |
||||||
Officers:
|
Steven J. Jensen |
|||||||
|
615 E. Michigan Street |
|||||||
|
Milwaukee, WI 53202 |
|||||||
|
Year of birth |
1957 |
||||||
|
Position(s) held with Trust |
Vice President, Chief Compliance Officer and AML Officer |
||||||
|
Term of office1 and length of time served |
Since 2014 |
||||||
|
Principal occupation(s) during past 5 years |
Senior Vice President, U.S. Bancorp Fund Services, LLC (2011 to present) |
||||||
|
Russell B. Simon |
|||||||
|
615 E. Michigan Street |
|||||||
|
Milwaukee, WI 53202 |
|||||||
|
Year of birth |
1980 |
||||||
|
Position(s) held with Trust |
Treasurer and Principal Financial Officer |
||||||
|
Term of office1 and length of time served |
Since 2014 |
||||||
|
Principal occupation(s) during past 5 years |
Vice President, U.S. Bancorp Fund Services, LLC (2011 – present) |
||||||
|
Eric W. Pinciss, Esq. |
|||||||
|
615 E. Michigan Street |
|||||||
|
Milwaukee, WI 53202 |
|||||||
|
Year of birth |
1975 |
||||||
|
Position(s) held with Trust |
Secretary |
||||||
|
Term of office1 and length of time served |
Since 2015 |
||||||
|
Principal occupation(s) during past 5 years |
Vice President, U.S. Bancorp Fund Services, LLC (2012 – present) |
||||||
1 Each Trustee serves an indefinite term until the election of a successor. Each officer serves an indefinite term until the election of a successor.
1919 Variable Socially Responsive Balanced Fund 2018 Annual Report
27
Trustee and officer information (unaudited) (cont'd)
December 31, 2018
2 The Trust is comprised of numerous series managed by unaffiliated investment advisers. The term "Fund Complex" applies to 1919 Variable Socially Responsive Balanced Fund (offered in a separate Prospectus and SAI) (together the "1919 Funds"). The 1919 Funds do not hold themselves out as related to any other series within the Trust for purposes of investment and investor services, nor do they share the same investment advisor with any other series.
3 "Other Directorships Held" includes only directorships of companies required to register or file reports with the SEC under the Securities Exchange Act of 1934, as amended, (that is, "public companies") or other investment companies registered under the 1940 Act.
4 The Trustees of the Trust who are not "interested persons" of the Trust as defined under the 1940 Act ("Independent Trustees").
5 Mr. Kashmerick is an "interested person" of the Trust as defined by the 1940 Act. Mr. Kashmerick is an interested Trustee of the Trust by virtue of the fact that he is an interested person of Quasar Distributors, LLC, the Fund's distributor.
The Fund's Statement of Additional Information ("SAI") includes information about the Funds' Trustees and is available without charge, upon request, by calling (844) 886-9704.
1919 Variable Socially Responsive Balanced Fund 2018 Annual Report
28
Privacy notice
The 1919 Funds collect non-public information about you from the following sources:
Information we receive about you on applications or other forms;
Information you give us orally; and/or
Information about your transactions with us or others
We do not disclose any non-public personal information about our customers or former customers without the customer's authorization, except as permitted by law or in response to inquiries from governmental authorities. We may share information with affiliated and unaffiliated third parties with whom we have contracts for servicing a Fund. We will provide unaffiliated third parties with only the information necessary to carry out their assigned responsibilities. We maintain physical, electronic and procedural safeguards to guard your personal information and require third parties to treat your personal information with the same high degree of confidentiality.
In the event that you hold shares of a Fund through a financial intermediary, including, but not limited to, a broker-dealer, bank, or trust company, the privacy policy of your financial intermediary would govern how your non-public personal information would be shared with unaffiliated third parties.
1919 Variable Socially Responsive Balanced Fund 2018 Annual Report
29
(This page intentionally left blank.)
(This page intentionally left blank.)
1919
Variable Socially Responsive Balanced Fund
Investment adviser
1919 Investment Counsel, LLC
One South Street, Suite 2500
Baltimore, MD 21202
Distributor
Quasar Distributors, LLC
615 East Michigan Street
Milwaukee, Wisconsin 53202
Custodian
U.S. Bank National Association
Custody Operations
1555 North River Center Drive, Suite 302
Milwaukee, Wisconsin 53212
Transfer agent, fund accountant and fund administrator
U.S. Bancorp Fund Services, LLC
615 East Michigan Street
Milwaukee, Wisconsin 53202
Independent registered public accounting firm
BBD, LLP
1835 Market Street, 3rd Floor
Philadelphia, PA 19103
Legal counsel
Morgan, Lewis & Bockius LLP
1111 Pennsylvania Ave. NW
Washington, DC 20004
This report has been prepared for shareholders and may be distributed to others only if preceded or accompanied by a current prospectus.
Item 2. Code of Ethics.
The registrant has adopted a code of ethics that applies to the registrant’s principal executive officer and principal financial officer. The registrant has not made any substantive amendments to its code of ethics during the period covered by this report. The registrant has not granted any waivers from any provisions of the code of ethics during the period covered by this report.
A copy of the registrant’s Code of Ethics is filed herewith.
Item 3. Audit Committee Financial Expert.
The registrant’s Board of Trustees has determined that there is at least one audit committee financial expert serving on its audit committee. John Chrystal, Albert J. DiUlio and Harry E. Resis are the “audit committee financial experts” and are considered to be “independent” as each term is defined in Item 3 of Form N-CSR.
Item 4. Principal Accountant Fees and Services.
The registrant has engaged its principal accountant to perform audit services, audit-related services, tax services and other services during the past fiscal year. “Audit services” refer to performing an audit of the registrant’s annual financial statements or services that are normally provided by the accountant in connection with statutory and regulatory filings or engagements for those fiscal years. “Audit-related services” refer to the assurance and related services by the principal accountant that are reasonably related to the performance of the audit. “Tax services” refer to professional services rendered by the principal accountant for tax compliance, tax advice, and tax planning. There were no “other services” provided by the principal accountant. The following table details the aggregate fees billed or expected to be billed for each of the last two fiscal years for audit fees, audit-related fees, tax fees and other fees by the principal accountant.
1919 Financial Services Fund
|
|
|
FYE 12/31/2018 |
|
FYE 12/31/2017 |
| ||
|
Audit Fees |
|
$ |
12,400 |
|
$ |
12,400 |
|
|
Audit-Related Fees |
|
N/A |
|
N/A |
| ||
|
Tax Fees |
|
$ |
3,100 |
|
$ |
3,100 |
|
|
All Other Fees |
|
N/A |
|
N/A |
| ||
1919 Maryland Tax-Free Income Fund
|
|
|
FYE 12/31/2018 |
|
FYE 12/31/2017 |
| ||
|
Audit Fees |
|
$ |
17,500 |
|
$ |
17,500 |
|
|
Audit-Related Fees |
|
N/A |
|
N/A |
| ||
|
Tax Fees |
|
$ |
3,100 |
|
$ |
3,100 |
|
|
All Other Fees |
|
N/A |
|
N/A |
| ||
1919 Socially Responsive Balanced Fund
|
|
|
FYE 12/31/2018 |
|
FYE 12/31/2017 |
| ||
|
Audit Fees |
|
$ |
14,400 |
|
$ |
14,400 |
|
|
Audit-Related Fees |
|
N/A |
|
N/A |
| ||
|
Tax Fees |
|
$ |
3,100 |
|
$ |
3,100 |
|
|
All Other Fees |
|
N/A |
|
N/A |
| ||
1919 Variable Socially Responsive Balanced Fund
|
|
|
FYE 12/31/2018 |
|
FYE 12/31/2017 |
| ||
|
Audit Fees |
|
$ |
14,400 |
|
$ |
14,400 |
|
|
Audit-Related Fees |
|
N/A |
|
N/A |
| ||
|
Tax Fees |
|
$ |
3,100 |
|
$ |
3,100 |
|
|
All Other Fees |
|
N/A |
|
N/A |
| ||
The audit committee has adopted pre-approval policies and procedures that require the audit committee to pre-approve all audit and non-audit services of the registrant, including services provided to any entity affiliated with the registrant.
The percentage of fees billed by the principal accountant applicable to non-audit services pursuant to waiver of pre-approval requirement were as follows:
1919 Financial Services Fund
|
|
|
FYE 12/31/2018 |
|
FYE 12/31/2017 |
|
|
Audit-Related Fees |
|
0 |
% |
0 |
% |
|
Tax Fees |
|
0 |
% |
0 |
% |
|
All Other Fees |
|
0 |
% |
0 |
% |
1919 Maryland Tax-Free Income Fund
|
|
|
FYE 12/31/2018 |
|
FYE 12/31/2017 |
|
|
Audit-Related Fees |
|
0 |
% |
0 |
% |
|
Tax Fees |
|
0 |
% |
0 |
% |
|
All Other Fees |
|
0 |
% |
0 |
% |
1919 Socially Responsive Balanced Fund
|
|
|
FYE 12/31/2018 |
|
FYE 12/31/2017 |
|
|
Audit-Related Fees |
|
0 |
% |
0 |
% |
|
Tax Fees |
|
0 |
% |
0 |
% |
|
All Other Fees |
|
0 |
% |
0 |
% |
1919 Variable Socially Responsive Balanced Fund
|
|
|
FYE 12/31/2018 |
|
FYE 12/31/2017 |
|
|
Audit-Related Fees |
|
0 |
% |
0 |
% |
|
Tax Fees |
|
0 |
% |
0 |
% |
|
All Other Fees |
|
0 |
% |
0 |
% |
All of the principal accountant’s hours spent on auditing the registrant’s financial statements were attributed to work performed by full-time permanent employees of the principal accountant.
The following table indicates the non-audit fees billed or expected to be billed by the registrant’s accountant for services to the registrant and to the registrant’s investment adviser (and any other controlling entity, etc.—not sub-adviser) for the last two years. The audit committee of the board of trustees/directors has considered whether the provision of non-audit services that were rendered to the registrant’s investment adviser is compatible with maintaining the principal accountant’s independence and has concluded that the provision of such non-audit services by the accountant has not compromised the accountant’s independence.
1919 Financial Services Fund
|
Non-Audit Related Fees |
|
FYE 12/31/2018 |
|
FYE 12/31/2017 |
| ||
|
Registrant |
|
$ |
3,100 |
|
$ |
3,100 |
|
|
Registrant’s Investment Adviser |
|
N/A |
|
N/A |
| ||
1919 Maryland Tax-Free Income Fund
|
Non-Audit Related Fees |
|
FYE 12/31/2018 |
|
FYE 12/31/2017 |
| ||
|
Registrant |
|
$ |
3,100 |
|
$ |
3,100 |
|
|
Registrant’s Investment Adviser |
|
N/A |
|
N/A |
| ||
1919 Socially Responsive Balanced Fund
|
Non-Audit Related Fees |
|
FYE 12/31/2018 |
|
FYE 12/31/2017 |
| ||
|
Registrant |
|
$ |
3,100 |
|
$ |
3,100 |
|
|
Registrant’s Investment Adviser |
|
N/A |
|
N/A |
| ||
1919 Variable Socially Responsive Balanced Fund
|
Non-Audit Related Fees |
|
FYE 12/31/2018 |
|
FYE 12/31/2017 |
| ||
|
Registrant |
|
$ |
3,100 |
|
$ |
3,100 |
|
|
Registrant’s Investment Adviser |
|
N/A |
|
N/A |
| ||
Item 5. Audit Committee of Listed Registrants.
Not applicable to registrants who are not listed issuers (as defined in Rule 10A-3 under the Securities Exchange Act of 1934).
Item 6. Investments.
Schedule of Investments is included as part of the report to shareholders filed under Item 1 of this Form
Item 7. Disclosure of Proxy Voting Policies and Procedures for Closed-End Management Investment Companies.
Not applicable to open-end investment companies.
Item 8. Portfolio Managers of Closed-End Management Investment Companies.
Not applicable to open-end investment companies.
Item 9. Purchases of Equity Securities by Closed-End Management Investment Company and Affiliated Purchasers.
Not applicable to open-end investment companies.
Item 10. Submission of Matters to a Vote of Security Holders.
There have been no material changes to the procedures by which shareholders may recommend nominees to the registrant’s Board of Trustees.
Item 11. Controls and Procedures.
(a) The Registrant’s President and Treasurer have reviewed the Registrant’s disclosure controls and procedures (as defined in Rule 30a-3(c) under the Investment Company Act of 1940 (the “Act”)) as of a date within 90 days of the filing of this report, as required by Rule 30a-3(b) under the Act and Rules 13a-15(b) or 15d-15(b) under the Securities Exchange Act of 1934. Based on their review, such officers have concluded that the disclosure controls and procedures are effective in ensuring that information required to be disclosed in this report is appropriately recorded, processed, summarized and reported and made known to them by others within the Registrant and by the Registrant’s service provider.
(b) There were no changes in the Registrant’s internal control over financial reporting (as defined in Rule 30a-3(d) under the Act) that occurred during the second fiscal quarter of the period covered by this report that has materially affected, or is reasonably likely to materially affect, the Registrant’s internal control over financial reporting.
Item 12. Disclosure of Securities Lending Activities for Closed-End Management Investment Companies
Not applicable to open-end investment companies.
Item 13. Exhibits.
(a) (1) Any code of ethics or amendment thereto, that is the subject of the disclosure required by Item 2, to the extent that the registrant intends to satisfy Item 2 requirements through filing an exhibit. Filed herewith.
(2) Certification for each principal executive and principal financial officer pursuant to Section 302 of the Sarbanes-Oxley Act of 2002. Filed herewith.
(3) Any written solicitation to purchase securities under Rule 23c-1 under the Act sent or given during the period covered by the report by or on behalf of the registrant to 10 or more persons. Not applicable to open-end investment companies.
(4) Change in the registrant’s independent public accountant. There was no change in the registrant’s independent public accountant for the period covered by this report.
(b) Certifications pursuant to Section 906 of the Sarbanes-Oxley Act of 2002. Furnished herewith.
SIGNATURES
Pursuant to the requirements of the Securities Exchange Act of 1934 and the Investment Company Act of 1940, the registrant has duly caused this report to be signed on its behalf by the undersigned, thereunto duly authorized.
Trust for Advised Portfolios
|
|
|
|
|
By |
/s/ Christopher E. Kashmerick |
|
|
|
Christopher E. Kashmerick, President |
|
|
|
|
|
|
Date |
3/7/19 |
|
Pursuant to the requirements of the Securities Exchange Act of 1934 and the Investment Company Act of 1940, this report has been signed below by the following persons on behalf of the registrant and in the capacities and on the dates indicated.
|
By |
/s/ Christopher E. Kashmerick |
|
|
|
Christopher E. Kashmerick, President |
|
|
|
|
|
|
|
|
|
|
Date |
3/7/19 |
|
|
|
|
|
|
|
|
|
|
By |
/s/ Russell B. Simon |
|
|
|
Russell B. Simon, Treasurer |
|
|
|
|
|
|
|
|
|
|
Date |
3/7/19 |
|
TRUST FOR ADVISED PORTFOLIOS
Code of Ethics
For Principal Executive Officer & Principal Financial Officer
This Code of Ethics is designed to comply with Section 406 of the Sarbanes-Oxley Act of 2002 and the rules promulgated by the Securities and Exchange Commission (the “SEC”) thereunder. This Code of Ethics is in addition to, not in replacement of, the Trust for Advised Portfolios (the “Trust”) Code of Ethics for access persons (the “Investment Company Code of Ethics”), adopted pursuant to Rule 17j-1 under the Investment Company Act of 1940, as amended (the “Investment Company Act”). The persons covered by this Code of Ethics may also be subject to the Investment Company Code of Ethics.
The Trust requires its Principal Executive Officer, Principal Financial Officer, or other Trust officers performing similar functions (the “Principal Officers”), to maintain the highest ethical and legal standards while performing their duties and responsibilities to the Trust and each of its series (each a “Fund,” collectively the “Funds”), with particular emphasis on those duties that relate to the preparation and reporting of the financial information of the Funds. The following principles and responsibilities shall govern the professional conduct of the Principal Officers:
1. HONEST AND ETHICAL CONDUCT.
The Principal Officers shall act with honesty and integrity, avoiding actual or apparent conflicts of interest in personal and professional relationships, and shall report any material transaction or relationship that reasonably could be expected to give rise to such conflict between their interests and those of a Fund to the Audit Committee, the full Board of Trustees of the Trust, and, in addition, to any other appropriate person or entity that may reasonably be expected to deal with any conflict of interest in timely and expeditious manner.
The Principal Officers shall act in good faith, responsibly, with due care, competence and diligence, without misrepresenting material facts or allowing their independent judgment to be subordinated or compromised.
2. FINANCIAL RECORDS AND REPORTING
The Principal Officers shall provide full, fair, accurate, timely and understandable disclosure in the reports and/or other documents to be filed with or submitted to the SEC or other applicable body by a Fund, or that is otherwise publicly disclosed or communicated. The Principal Officers shall comply with applicable rules and regulations of federal, state, and local governments, and other appropriate private and public regulatory agencies.
The Principal Officers shall respect the confidentiality of information acquired in the course of their work and shall not disclose such information except when authorized or legally obligated to disclose. The Principal Officers will not use confidential information acquired in the course of their duties as Principal Officers.
The Principal Officers shall share knowledge and maintain skills important and relevant to the Trust’s needs; shall proactively promote ethical behavior of the Trust’s employees and as a partner with industry peers and associates; and shall maintain control over and responsibly manage assets and resources employed or entrusted to them by the Trust.
3. COMPLIANCE WITH LAWS, RULES AND REGULATIONS
The Principal Officers shall establish and maintain mechanisms to oversee the compliance of the Funds with applicable federal, state or local law, regulation or administrative rule, and to identify, report and correct in a swift and certain manner, any detected deviations from applicable federal, state or local law regulation or rule.
4. COMPLIANCE WITH THIS CODE OF ETHICS
The Principal Officers shall promptly report any violations of this Code of Ethics to the Audit Committee as well as the full Board of Trustees of the Trust and shall be held accountable for strict adherence to this Code of Ethics. A proven failure to uphold the standards stated herein shall be grounds for such sanctions as shall be reasonably imposed by the Board of Trustees of the Trust.
5. AMENDMENT AND WAIVER
This Code of Ethics may only be amended or modified by approval of the Board of Trustees. Any substantive amendment that is not technical or administrative in nature or any material waiver, implicit or otherwise, of any provision of this Code of Ethics, shall be communicated publicly in accordance with Item 2 of Form N-CSR under the Investment Company Act.
Adopted by the Board of Trustees on February 14, 2014
EX.99.CERT
CERTIFICATIONS
I, Christopher E. Kashmerick, certify that:
1. I have reviewed this report on Form N-CSR of Trust for Advised Portfolios;
2. Based on my knowledge, this report does not contain any untrue statement of a material fact or omit to state a material fact necessary to make the statements made, in light of the circumstances under which such statements were made, not misleading with respect to the period covered by this report;
3. Based on my knowledge, the financial statements, and other financial information included in this report, fairly present in all material respects the financial condition, results of operations, changes in net assets, and cash flows (if the financial statements are required to include a statement of cash flows) of the registrant as of, and for, the periods presented in this report;
4. The registrant’s other certifying officer(s) and I are responsible for establishing and maintaining disclosure controls and procedures (as defined in Rule 30a-3(c) under the Investment Company Act of 1940) and internal control over financial reporting (as defined in Rule 30a-3(d) under the Investment Company Act of 1940) for the registrant and have:
(a) Designed such disclosure controls and procedures, or caused such disclosure controls and procedures to be designed under our supervision, to ensure that material information relating to the registrant, including its consolidated subsidiaries, is made known to us by others within those entities, particularly during the period in which this report is being prepared;
(b) Designed such internal control over financial reporting, or caused such internal control over financial reporting to be designed under our supervision, to provide reasonable assurance regarding the reliability of financial reporting and the preparation of financial statements for external purposes in accordance with generally accepted accounting principles;
(c) Evaluated the effectiveness of the registrant’s disclosure controls and procedures and presented in this report our conclusions about the effectiveness of the disclosure controls and procedures, as of a date within 90 days prior to the filing date of this report based on such evaluation; and
(d) Disclosed in this report any change in the registrant’s internal control over financial reporting that occurred during the second fiscal quarter of the period covered by this report that has materially affected, or is reasonably likely to materially affect, the registrant’s internal control over financial reporting; and
5. The registrant’s other certifying officer(s) and I have disclosed to the registrant’s auditors and the audit committee of the registrant’s board of directors (or persons performing the equivalent functions):
(a) All significant deficiencies and material weaknesses in the design or operation of internal control over financial reporting which are reasonably likely to adversely affect the registrant’s ability to record, process, summarize, and report financial information; and
(b) Any fraud, whether or not material, that involves management or other employees who have a significant role in the registrant’s internal control over financial reporting.
|
Date: |
3/7/19 |
|
/s/ Christopher E. Kashmerick |
|
|
|
|
Christopher E. Kashmerick, President |
CERTIFICATIONS
I, Russell B. Simon, certify that:
1. I have reviewed this report on Form N-CSR of Trust for Advised Portfolios;
2. Based on my knowledge, this report does not contain any untrue statement of a material fact or omit to state a material fact necessary to make the statements made, in light of the circumstances under which such statements were made, not misleading with respect to the period covered by this report;
3. Based on my knowledge, the financial statements, and other financial information included in this report, fairly present in all material respects the financial condition, results of operations, changes in net assets, and cash flows (if the financial statements are required to include a statement of cash flows) of the registrant as of, and for, the periods presented in this report;
4. The registrant’s other certifying officer(s) and I are responsible for establishing and maintaining disclosure controls and procedures (as defined in Rule 30a-3(c) under the Investment Company Act of 1940) and internal control over financial reporting (as defined in Rule 30a-3(d) under the Investment Company Act of 1940) for the registrant and have:
(a) Designed such disclosure controls and procedures, or caused such disclosure controls and procedures to be designed under our supervision, to ensure that material information relating to the registrant, including its consolidated subsidiaries, is made known to us by others within those entities, particularly during the period in which this report is being prepared;
(b) Designed such internal control over financial reporting, or caused such internal control over financial reporting to be designed under our supervision, to provide reasonable assurance regarding the reliability of financial reporting and the preparation of financial statements for external purposes in accordance with generally accepted accounting principles;
(c) Evaluated the effectiveness of the registrant’s disclosure controls and procedures and presented in this report our conclusions about the effectiveness of the disclosure controls and procedures, as of a date within 90 days prior to the filing date of this report based on such evaluation; and
(d) Disclosed in this report any change in the registrant’s internal control over financial reporting that occurred during the second fiscal quarter of the period covered by this report that has materially affected, or is reasonably likely to materially affect, the registrant’s internal control over financial reporting; and
5. The registrant’s other certifying officer(s) and I have disclosed to the registrant’s auditors and the audit committee of the registrant’s board of directors (or persons performing the equivalent functions):
(a) All significant deficiencies and material weaknesses in the design or operation of internal control over financial reporting which are reasonably likely to adversely affect the registrant’s ability to record, process, summarize, and report financial information; and
(b) Any fraud, whether or not material, that involves management or other employees who have a significant role in the registrant’s internal control over financial reporting.
|
Date: |
3/7/19 |
|
/s/ Russell B. Simon |
|
|
|
|
Russell B. Simon, Treasurer |
EX.99.906CERT
Certification Pursuant to Section 906 of the Sarbanes-Oxley Act
Pursuant to Section 906 of the Sarbanes-Oxley Act of 2002, each of the undersigned officers of the Trust for Advised Portfolios, does hereby certify, to such officer’s knowledge, that the report on Form N-CSR of the Trust for Advised Portfolios for the year ended, December 31, 2018 fully complies with the requirements of Section 13(a) or 15(d) of the Securities Exchange Act of 1934, as applicable, and that the information contained in the Form N-CSR fairly presents, in all material respects, the financial condition and results of operations of the Trust for Advised Portfolios for the stated period.
|
/s/ Christopher E. Kashmerick |
|
/s/ Russell B. Simon | ||
|
Christopher E. Kashmerick, President |
|
Russell B. Simon, Treasurer | ||
|
|
|
| ||
|
|
|
|
|
|
|
Dated: |
3/7/19 |
|
Dated: |
3/7/19 |
This statement accompanies this report on Form N-CSR pursuant to Section 906 of the Sarbanes-Oxley Act of 2002 and shall not be deemed as filed by Trust for Advised Portfolios for purposes of Section 18 of the Securities Exchange Act of 1934.
Serious News for Serious Traders! Try StreetInsider.com Premium Free!
You May Also Be Interested In
- Ameristar Windows: Pioneering Accountability in American Manufacturing
- ROSEN, RECOGNIZED INVESTOR COUNSEL, Encourages Compass Minerals International, Inc. Investors to Inquire About Securities Class Action Investigation – CMP
- ADASTRA HOLDINGS REPORTS FY2023 RESULTS; MARKING THIRD CONSECUTIVE YEAROF RECORD REVENUE
Create E-mail Alert Related Categories
SEC FilingsSign up for StreetInsider Free!
Receive full access to all new and archived articles, unlimited portfolio tracking, e-mail alerts, custom newswires and RSS feeds - and more!
