

Form N-CSR Trust for Advised Portfo For: Jun 30
 Tweet
Tweet Share
ShareSECURITIES AND EXCHANGE COMMISSION
Washington, D.C. 20549
(Address of principal executive offices) (Zip code)
(Name and address of agent for service)
ZEVENBERGEN GROWTH FUND
INVESTOR CLASS (ZVNBX)
INSTITUTIONAL CLASS (ZVNIX)
ZEVENBERGEN GENEA FUND
INVESTOR CLASS (ZVGNX)
INSTITUTIONAL CLASS (ZVGIX)
|
|
ANNUAL REPORT TO SHAREHOLDERS
JUNE 30, 2021
TABLE OF CONTENTS
|
1 |
|
|
5 |
|
|
|
|
|
7 |
|
|
8 |
|
|
10 |
|
|
11 |
|
|
12 |
|
|
13 |
|
|
|
|
|
15 |
|
|
16 |
|
|
18 |
|
|
19 |
|
|
20 |
|
|
21 |
|
|
23 |
|
|
30 |
|
|
32 |
|
|
33 |
|
|
35 |
|
|
37 |

For the twelve months ending June 30, 2021 (Unaudited)
Dear Fellow Shareholders,
It’s not hyperbole to say that the world was changed in many ways by the events of 2020. Stepping back, one of the bigger epiphanies for the last year (and likely a lasting impact of the crisis) is the remarkable acceleration of the digital transformation. Equity returns in Q3 2020 saw shares of large cap technology companies surge, generating bubble comparisons, driving index gains and confounding many with the sheer velocity and strength of the rally. At the outset of Q4 2020, equities retreated, as global COVID-19 cases climbed, and lack of stimulus progress weakened investor enthusiasm. The brief pullback reversed on promising vaccine news, providing light at the end of the pandemic tunnel. After posting several false starts over recent years, value indices topped growth beginning in Q4 2020, as optimism increased regarding the “re-opening” and an economy potentially reclaiming strength. After rewarding high growth again to start the 2021 calendar year, equity markets swung aggressively toward cyclical and value-based strategies beginning in mid-February of 2021.
Continuing to invest in companies benefiting from the significant changes underway in how we live, work and play, the Zevenbergen Funds posted strong relative performance for the fiscal year. The Zevenbergen Growth Fund Investor Share Class (ZVNBX) returned 47.2% and the Zevenbergen Genea Fund Investor Share Class (ZVGNX) increased 69.3%, both exceeding the 43.0% gain of the Funds’ benchmark, the Russell 3000® Growth Index.
Zevenbergen Growth Fund:
Fund performance benefited from investments in consumer discretionary (electric transportation, advertising technology) and technology (graphics processors). Performance detractors included health care (biotechnology) and technology (insurance & analytics software).
Contributors:
Tesla, Inc. (TSLA):
Founder-led technology company helping accelerate the world’s transition efforts to sustainable energy. We believe the future of transportation is electric, and Tesla continues to demonstrate industry leading technology and demand. Strong fundamental results despite continued challenging industry supply chain dynamics supported price appreciation and led to S&P 500 inclusion late in 2020. Additional product expansions, progress on Gigafactories Shanghai, Berlin and Austin, battery investments, and full-self driving deployments point to a company committed to driving innovation in large addressable markets.
NVIDIA Corporation (NVDA):
Founder-led manufacturer of high-powered graphics processing chips. Demand for energy efficient, high-performance devices among gamers, remote workers, digital creators, and cryptocurrency miners continues to support growth. Laptop and desktop upgrades and deferred enterprise spending have been catalysts for Gaming segment wins, while data center processor sales have been propelled by hyperscale customers shifting workloads to the cloud and building artificial intelligence infrastructure. The company recently completed its acquisition of Mellanox Technologies, Ltd. (supplier of end-to-end high-speed networking equipment), expanding its ability to serve global enterprise customers with complex data science and storage needs.
The Trade Desk, Inc. (TTD):
Founder-led advertising technology platform company benefitting from the ongoing shift of advertising budgets from offline to online channels. Advertisers continue to be attracted to Trade Desk’s transparent, data-driven alternative to the dominant search and social media companies. The accelerating adoption of streaming video has definitively changed the advertising landscape and Trade Desk’s leadership in Connected TV and a redesigned software platform should enable the company to capitalize on the opportunity.
Detractors:
BioMarin Pharmaceutical Inc. (BMRN):
Leading biotech company with established products and a pipeline focused on discovering, researching, and commercializing first-to-market treatments for life-threatening rare diseases and medical conditions. Management and investors were surprised and disappointed by new guidance from the FDA which included a request for additional data on the company’s most meaningful pipeline product; potentially delaying approval and commercial launch by two years. The position was sold due to the increasingly binary nature of clinical trial outcomes and lack of transparency around the ultimate timeline for approval.
Alteryx, Inc. (AYX):
Founder-led analytics software provider cited elongated sales cycles, smaller than average deal sizes, and “less favorable” business trends as reasons for tepid Q3 2020 results and full year 2020 guidance. The company struggled to onboard new sales hires amid COVID-19 lockdowns and experienced sales and marketing productivity declines, as prospective customers focused on operational continuity projects, not data science initiatives. Given management’s belief that soft performance will likely continue until 2021, the position was sold for better growth alternatives.
EverQuote, Inc. (EVER):
Founder-led digital insurance marketplace positioned to capture share of growing insurance carrier sales and online spending. The announced acquisition of a direct-to-consumer health insurance agency overshadowed positive fundamental results and guidance in Q3 2020, as investors contemplated the business and financial model implications. The sudden and unfortunate passing of the company’s Co-Founder/CEO in late November 2020 led to further uncertainty and the position was sold for higher conviction holdings.
Zevenbergen Genea Fund:
Similar to the Growth Fund, the Genea Fund benefited from strong fundamental growth in innovative, technology-driven companies. Tesla, Inc. was also a top contributor for the period, in addition to investments in industrials (financial technology) and real estate. Alteryx, Inc. and EverQuote, Inc. were also detractors to performance as well as financials (cryptocurrency trading).
Contributors:
Please see Growth Fund commentary for discussion on Tesla, Inc.
Zillow Group, Inc. (ZG):
Founder-led real estate information and services provider, giving consumers transparency and tools to buy, rent, and sell homes. Extended work-from-home mandates led many individuals to re-evaluate their living situations. For large swaths of the American population, the home is no longer just a place to eat and sleep, but where one works, lives, learns, and plays. This shift in utility, along with favorable mortgage rates, contributed to record traffic on Zillow’s website and mobile app. After an operational pause early in 2020, Zillow resumed its Offers business (home buying program), which adds a fast-growing revenue source and allows it to participate in multiple areas of a real estate transaction.
Square, Inc. (SQ):
Founder-led commerce and consumer finance platform, empowering economic participation for entrepreneurs and individuals. In response to the difficult retail environment, Square supported its merchant customers through contactless functionality, such as curbside pickup and online shopping, while reinvigorated mainstream interest in Bitcoin led to strong engagement for Cash App. Longer term, additional investments in Cash App, omnichannel solutions and international markets could help Square become the preferred financial platform for individuals and sellers in the digital age.
Detractors:
Please see Growth Fund commentary for discussions on Alteryx, Inc., and EverQuote, Inc.
Coinbase Global, Inc. (COIN):
Founder-led financial technology company operating the largest U.S. platform for cryptocurrency trading and custody. Cryptocurrencies (or crypto, for short) are digital mediums of exchange and stores of value secured by complex cryptography (encoded data) offering security, anonymity and independence from central authorities to transaction participants. Earning transaction and subscription fees, Coinbase serves as a trusted digital asset service provider (zero reported security breaches since 2012 founding) and provides equity investors exposure to the rapidly evolving, yet relatively nascent, crypto industry. Following the company’s April 2021 direct public listing, shares reflected volatility in underlying crypto prices.
Manager Perspective:
Given the stellar gains in U.S. stocks over the twelve months ended June 30, 2021, investors with a cynical view have been trying in vain to predict when stock prices would start falling in earnest. While there is no perfect historical comparison that can be used as a road map for future market performance, we are reminded of a lesson learned from the pandemic: the world is rapidly changing. The continuous evolution and widespread adoption of technology are helping a multitude of industries, allowing users and enterprises to connect, create and achieve more than what was previously thought possible. We believe this is the key to future resilience and growth, and the bigger risk may be overestimating the significance of negatives and underestimating the magnitude of positives.
In health and prosperity.
Zevenbergen Capital Investments Portfolio Management Team
 |
|
|
Brooke de Boutray, CFA, CIC |
|

|
|
|
Joe Dennison, CFA |
|

|
|
|
Leslie Tubbs, CFA, CIC |
|

|
|
|
Anthony Zackery, CFA |
|
 |
|
|
Nancy Zevenbergen, CFA, CIC |
|
Past performance is no guarantee of future results.
Opinions expressed are subject to change at any time, are not guaranteed and should not be considered investment advice.
Fund holdings and sector allocations are subject to change and are not recommendations to buy or sell any security. Please refer to the Schedule of Investments in this report for a complete list of fund holdings.
Russell 3000® Growth Index: A market capitalization weighted index based on the Russell 3000® Index. The Russell 3000® Growth Index includes companies that display signs of above average growth. The Index is used to provide a gauge of the performance of growth stocks in the U.S. One cannot invest directly in an index.
Mutual fund investing involves risk, including the loss of principal. The Funds invest in foreign securities which involve greater volatility and political, economic and currency risks and differences in accounting methods. Non-diversified funds may hold a significant percentage of their assets in the securities of fewer companies and therefore events affecting those companies have a greater impact on the funds than on a diversified fund. If the Funds invest in a few sectors they may have increased exposure to price movements of those sectors. Small and medium capitalization companies tend to have limited liquidity and greater price volatility than large capitalization companies.
Performance Summary
June 30, 2021 (Unaudited)
Comparison of a Hypothetical $50,000 Investment
in the Zevenbergen Growth Fund - Institutional Class
and Russell 3000® Growth Index

Investment Returns
For the Periods Ended June 30, 2021
|
|
One Year |
|
Three Year* |
|
Five Year* |
|
Since Inception* |
|
Zevenbergen Growth Fund ** |
|
|
|
|
|
|
|
|
Investor Class |
47.22% |
|
37.84% |
|
36.42% |
|
28.29% |
|
Institutional Class |
47.63%*** |
|
38.20% |
|
36.78% |
|
28.62% |
|
Russell 3000® Growth Index |
42.99% |
|
24.47% |
|
23.31% |
|
20.74% |
|
* |
Annualized. |
|
** |
Inception date on August 31, 2015. |
| *** | Returns are based on unadjusted net asset values and differ from returns shown in Financial Highlights which include adjustments in accordance with GAAP. |
Zevenbergen Genea Fund
Performance Summary
June 30, 2021 (Unaudited)
Comparison of a Hypothetical $50,000 Investment
in the Zevenbergen Genea Fund - Institutional Class
and Russell 3000® Growth Index

Investment Returns
For the Periods Ended June 30, 2021
|
|
One Year |
|
Three Year* |
|
Five Year* |
|
Since Inception* |
|
Zevenbergen Genea Fund ** |
|
|
|
|
|
|
|
|
Investor Class |
69.27%*** |
|
39.68% |
|
43.20% |
|
34.61% |
|
Institutional Class |
69.80%*** |
|
40.01% |
|
43.59% |
|
34.95% |
|
Russell 3000® Growth Index |
42.99% |
|
24.47% |
|
23.31% |
|
20.74% |
| |
* |
Annualized. |
| |
** |
Inception date on August 31, 2015. |
| *** | Returns are based on unadjusted net asset values and differ from returns shown in Financial Highlights which include adjustments in accordance with GAAP. |
Allocation of Portfolio Holdings
(Calculated as a percentage of Total Investments)
June 30, 2021 (Unaudited)

|
* |
Short-Term Investments consist of amounts held in money market funds. The Fund strategy does not seek to hold large cash balances (more than 5% of total investments), and any significant cash holdings are typically due to trade settlement timing. |
Zevenbergen Growth Fund
Schedule of Investments
As of June 30, 2021
|
Number of Shares |
|
|
|
|
Value |
|
||
|
|
|
|
COMMON STOCKS ― 98.7% |
|
|
|
|
|
|
|
|
|
CONSUMER DISCRETIONARY ― 35.6% |
|
|
|
|
|
|
16,675 |
|
|
Airbnb, Inc. (a) |
|
|
$ |
2,553,610 |
|
|
1,200 |
|
|
Amazon.com, Inc. (a) |
|
|
|
4,128,192 |
|
|
25,485 |
|
|
Chegg, Inc. (a) |
|
|
|
2,118,058 |
|
|
28,000 |
|
|
Chewy, Inc. (a) |
|
|
|
2,231,880 |
|
|
16,500 |
|
|
Coursera, Inc. (a) |
|
|
|
652,740 |
|
|
4,030 |
|
|
MercadoLibre, Inc. (a) |
|
|
|
6,277,894 |
|
|
5,500 |
|
|
Netflix, Inc. (a) |
|
|
|
2,905,155 |
|
|
24,700 |
|
|
Peloton Interactive, Inc. (a) |
|
|
|
3,063,294 |
|
|
13,200 |
|
|
Tesla, Inc. (a) |
|
|
|
8,972,040 |
|
|
91,000 |
|
|
The Trade Desk, Inc. (a) |
|
|
|
7,039,760 |
|
|
73,575 |
|
|
Uber Technologies, Inc. (a) |
|
|
|
3,687,579 |
|
|
|
|
|
|
|
|
|
43,630,202 |
|
|
|
|
|
FINANCIALS ― 3.8% |
|
|
|
|
|
|
3,950 |
|
|
Coinbase Global, Inc. (a) |
|
|
|
1,000,535 |
|
|
9,975 |
|
|
Goosehead Insurance, Inc. |
|
|
|
1,269,817 |
|
|
10,250 |
|
|
Lemonade, Inc. (a) |
|
|
|
1,121,453 |
|
|
11,500 |
|
|
Silvergate Capital Corporation (a) |
|
|
|
1,303,180 |
|
|
|
|
|
|
|
|
|
4,694,985 |
|
|
|
|
|
HEALTH CARE ― 13.4% |
|
|
|
|
|
|
23,350 |
|
|
Adaptive Biotechnologies Corporation (a) |
|
|
|
954,081 |
|
|
12,000 |
|
|
Castle Biosciences, Inc. (a) |
|
|
|
879,960 |
|
|
48,850 |
|
|
Exact Sciences Corporation (a) |
|
|
|
6,072,543 |
|
|
35,000 |
|
|
GoodRx Holdings, Inc. (a) |
|
|
|
1,260,350 |
|
|
7,225 |
|
|
Seagen Inc. (a) |
|
|
|
1,140,683 |
|
|
25,325 |
|
|
Teladoc Health, Inc. (a) |
|
|
|
4,211,294 |
|
|
6,050 |
|
|
Veeva Systems Inc. (a) |
|
|
|
1,881,248 |
|
|
|
|
|
|
|
|
|
16,400,159 |
|
|
|
|
|
INDUSTRIALS ― 7.6% |
|
|
|
|
|
|
22,600 |
|
|
Desktop Metal, Inc. (a) |
|
|
|
259,900 |
|
|
14,300 |
|
|
PayPal Holdings, Inc. (a) |
|
|
|
4,168,164 |
|
|
19,775 |
|
|
Square, Inc. (a) |
|
|
|
4,821,145 |
|
|
|
|
|
|
|
|
|
9,249,209 |
|
The accompanying notes are an integral part of these financial statements.
Zevenbergen Growth Fund
Schedule of Investments (Continued)
As of June 30, 2021
|
Number of Shares |
|
|
|
|
Value |
|
||
|
|
|
|
REAL ESTATE ― 3.6% |
|
|
|
|
|
|
36,200 |
|
|
Zillow Group, Inc. Class C (a) |
|
|
$ |
4,424,364 |
|
|
|
|
|
|
|
|
|
|
|
|
|
|
|
TECHNOLOGY ― 33.5% |
|
|
|
|
|
|
2,315 |
|
|
Coupa Software Incorporated (a) |
|
|
|
606,785 |
|
|
4,450 |
|
|
Fiverr International Ltd. ― ADR (a) |
|
|
|
1,079,081 |
|
|
13,900 |
|
|
Global-e Online Ltd. ― ADR (a) |
|
|
|
793,412 |
|
|
8,000 |
|
|
NVIDIA Corporation |
|
|
|
6,400,800 |
|
|
17,275 |
|
|
Okta, Inc. (a) |
|
|
|
4,226,847 |
|
|
4,200 |
|
|
Sea Limited ― ADR (a) |
|
|
|
1,153,320 |
|
|
5,300 |
|
|
ServiceNow, Inc. (a) |
|
|
|
2,912,615 |
|
|
5,650 |
|
|
Shopify Inc. ― ADR (a) |
|
|
|
8,254,537 |
|
|
57,625 |
|
|
Snap Inc. (a) |
|
|
|
3,926,567 |
|
|
8,500 |
|
|
Snowflake Inc. (a) |
|
|
|
2,055,300 |
|
|
22,150 |
|
|
Sprout Social, Inc. (a) |
|
|
|
1,980,653 |
|
|
3,350 |
|
|
Twilio Inc. (a) |
|
|
|
1,320,436 |
|
|
8,500 |
|
|
UiPath, Inc. (a) |
|
|
|
577,405 |
|
|
24,400 |
|
|
Unity Software Inc. (a) |
|
|
|
2,679,852 |
|
|
7,800 |
|
|
Zoom Video Communications, Inc. (a) |
|
|
|
3,018,834 |
|
|
|
|
|
|
|
|
|
40,986,444 |
|
|
|
|
|
TELECOMMUNICATIONS ― 1.2% |
|
|
|
|
|
|
46,050 |
|
|
fuboTV Inc. (a) |
|
|
|
1,478,665 |
|
|
|
|
|
|
|
|
|
|
|
|
|
|
|
|
|
|
|
|
|
|
|
|
|
TOTAL COMMON STOCKS |
|
|
|
|
|
|
|
|
|
(Cost $71,455,954) |
|
|
$ |
120,864,028 |
|
|
|
|
|
|
|
|
|
|
|
|
|
|
|
SHORT-TERM INVESTMENTS ― 0.9% |
|
|
|
|
|
|
1,081,861 |
|
|
First American U.S. Treasury Money Market Fund, Class Z, 0.06%(b) |
|
|
|
1,081,861 |
|
|
|
|
|
TOTAL SHORT-TERM INVESTMENTS (Cost $1,081,861) |
|
|
$ |
1,081,861 |
|
|
|
|
|
|
|
|
|
|
|
|
|
|
|
TOTAL INVESTMENTS ― 99.6% (Cost $72,537,815) |
|
|
|
121,945,889 |
|
|
|
|
|
Other Assets in Excess of Liabilities ― 0.4% |
|
|
|
478,778 |
|
|
|
|
|
TOTAL NET ASSETS ― 100.0% |
|
|
$ |
122,424,667 |
|
| ADR: | American Depository Receipt. |
| (a): | Non Income Producing. |
| (b): | Variable rate security. The rate disclosed is the annualized seven-day effective yield as of June 30, 2021. |
The accompanying notes are an integral part of these financial statements.
Zevenbergen Growth Fund
Statement of Assets and Liabilities
June 30, 2021
|
Assets |
|
|
|
|
|
Investments in securities, at value (cost $72,537,815) |
|
$ |
121,945,889 |
|
|
Dividend and interest receivable |
|
|
1,281 |
|
|
Receivable for Fund shares sold |
|
|
1,252,021 |
|
|
Receivable for investments sold |
|
|
1,407,052 |
|
|
Prepaid expenses |
|
|
22,777 |
|
|
Total Assets |
|
|
124,629,020 |
|
|
|
|
|
|
|
|
Liabilities |
|
|
|
|
|
Payable for Fund shares redeemed |
|
|
10,572 |
|
|
Payable for securities purchased |
|
|
1,950,232 |
|
|
Payable to Adviser |
|
|
136,234 |
|
|
Shareholder Service Fees |
|
|
23,256 |
|
|
Distribution fees - Investor Class |
|
|
13,710 |
|
|
Accrued other expenses and other liabilities |
|
|
70,349 |
|
|
Total Liabilities |
|
|
2,204,353 |
|
|
|
|
|
|
|
|
Net Assets |
|
$ |
122,424,667 |
|
|
|
|
|
|
|
|
Components of Net Assets |
|
|
|
|
|
Paid-in capital |
|
$ |
71,722,395 |
|
|
Total distributable earnings |
|
|
50,702,272 |
|
|
Net Assets |
|
$ |
122,424,667 |
|
|
|
|
|
|
|
|
Investor Class: |
|
|
|
|
|
Net assets |
|
$ |
40,471,655 |
|
|
Shares outstanding (unlimited number of shares authorized, no par value) |
|
|
946,910 |
|
|
Net asset value, offering and redemption price per share * |
|
$ |
42.74 |
|
|
|
|
|
|
|
|
Institutional Class: |
|
|
|
|
|
Net assets |
|
$ |
81,953,012 |
|
|
Shares outstanding (unlimited number of shares authorized, no par value) |
|
|
1,888,696 |
|
|
Net asset value, offering and redemption price per share * |
|
$ |
43.39 |
|
* Shares redeemed or exchanged within 90 days of purchase are charged a 1.00% redemption fee (Note 9).
The accompanying notes are an integral part of these financial statements.
Zevenbergen Growth Fund
Statement of Operations
For the Year Ended June 30, 2021
|
Investment Income |
|
|
|
|
|
Dividends and interest income |
|
$ |
52,462 |
|
|
|
|
|
|
|
|
Expenses |
|
|
|
|
|
Advisory fees |
|
|
806,382 |
|
|
Administration fees (Note 3) |
|
|
124,117 |
|
|
Shareholder servicing fees (Note 6) |
|
|
119,656 |
|
|
Distribution fees - Investor Class |
|
|
94,289 |
|
|
Transfer agent fees and expenses (Note 3) |
|
|
55,450 |
|
|
Registration fees |
|
|
37,624 |
|
|
Legal fees |
|
|
29,310 |
|
|
Custody fees (Note 3) |
|
|
17,863 |
|
|
Trustees’ fees |
|
|
17,548 |
|
|
Audit fees |
|
|
15,695 |
|
|
Compliance fees (Note 3) |
|
|
12,680 |
|
|
Shareholder reporting fees |
|
|
5,205 |
|
|
Miscellaneous expenses |
|
|
4,758 |
|
|
Insurance fees |
|
|
2,919 |
|
|
Total expenses |
|
|
1,343,496 |
|
|
Expenses waived by the Adviser (Note 3) |
|
|
(222,372 |
) |
|
Net Expenses |
|
|
1,121,124 |
|
|
|
|
|
|
|
|
Net Investment Loss |
|
|
(1,068,662 |
) |
|
|
|
|
|
|
|
Realized and Unrealized Gain on Investments |
|
|
|
|
|
Net realized gain on investments |
|
|
2,557,399 |
|
|
Change in unrealized appreciation on investments |
|
|
26,632,067 |
|
|
Net Realized and Unrealized Gain on Investments |
|
|
29,189,466 |
|
|
|
|
|
|
|
|
Net Increase in Net Assets from Operations |
|
$ |
28,120,804 |
|
The accompanying notes are an integral part of these financial statements.
| Zevenbergen Growth Fund |
| Statements of Changes in Net Assets |
| Operations | For the Year Ended June 30, 2021 |
For the Year Ended June 30, 2020 |
||||||
| Net investment loss | $ | (1,068,662 | ) | $ | (272,739 | ) | ||
| Net realized gain (loss) on investments | 2,557,399 | (499,239 | ) | |||||
| Net change in unrealized appreciation on investments | 26,632,067 | 15,723,445 | ||||||
| Net Increase in Net Assets from Operations | 28,120,804 | 14,951,467 | ||||||
| Distributions to shareholders from | ||||||||
| Net realized gain on investments | ||||||||
| Investor Class | (28,529 | ) | — | |||||
| Institutional Class | (44,887 | ) | — | |||||
| Total distributions to shareholders | (73,416 | ) | — | |||||
| Capital Transactions | ||||||||
| Proceeds from shares sold | ||||||||
| Investor Class | 43,165,174 | 13,574,932 | ||||||
| Institutional Class | 52,153,468 | 15,697,643 | ||||||
| Proceeds from shares reinvested | ||||||||
| Investor Class | 28,457 | — | ||||||
| Institutional Class | 44,273 | — | ||||||
| Cost of shares redeemed | ||||||||
| Investor Class | (30,756,770 | ) | (3,969,298 | ) | ||||
| Institutional Class | (26,179,707 | ) | (3,633,206 | ) | ||||
| Redemption fees | ||||||||
| Investor Class | 49,185 | 7,748 | ||||||
| Institutional Class | 80,175 | 17,169 | ||||||
| Net Increase in Net Assets from Capital Share Transactions | 38,584,255 | 21,694,988 | ||||||
| Total Increase in Net Assets | 66,631,643 | 36,646,455 | ||||||
| Net Assets | ||||||||
| Beginning of year | 55,793,024 | 19,146,569 | ||||||
| End of year | $ | 122,424,667 | $ | 55,793,024 | ||||
| Capital Shares Transactions | ||||||||
| Investor Class | ||||||||
| Shares sold | 1,100,673 | 601,012 | ||||||
| Shares reinvested | 631 | — | ||||||
| Shares redeemed | (790,935 | ) | (199,182 | ) | ||||
| Net increase in shares outstanding | 310,369 | 401,830 | ||||||
| Institutional Class | ||||||||
| Shares sold | 1,321,445 | 672,998 | ||||||
| Shares reinvested | 968 | — | ||||||
| Shares redeemed | (702,266 | ) | (169,981 | ) | ||||
| Net increase in shares outstanding | 620,147 | 503,017 | ||||||
The accompanying notes are an integral part of these financial statements.
| Zevenbergen Growth Fund |
| Financial Highlights |
| Investor Class |
For a Capital Share Outstanding Throughout Each Year Presented:
| For the Year Ended June 30, 2021 |
For the Year Ended June 30, 2020 |
For the Year Ended June 30, 2019 |
For the Year Ended June 30, 2018 |
For the Year Ended June 30, 2017 |
||||||||||||||||
| Net Asset Value, Beginning of Year | $ | 29.05 | $ | 19.00 | $ | 16.33 | $ | 12.27 | $ | 9.05 | ||||||||||
| Gain (Loss) from Investment Operations: | ||||||||||||||||||||
| Net investment loss (1) | (0.49 | ) | (0.27 | ) | (0.20 | ) | (0.17 | ) | (0.13 | ) | ||||||||||
| Net realized and unrealized gain on investments | 14.16 | 10.30 | 2.85 | 4.22 | 3.35 | |||||||||||||||
| Total Gain from Investment Operations | 13.67 | 10.03 | 2.65 | 4.05 | 3.22 | |||||||||||||||
| Less Distributions: | (0.03 | ) | — | — | — | — | ||||||||||||||
| Redemption Fee Proceeds (1) | 0.05 | 0.02 | 0.02 | 0.01 | — | |||||||||||||||
| Net Asset Value, End of Year | $ | 42.74 | $ | 29.05 | $ | 19.00 | $ | 16.33 | $ | 12.27 | ||||||||||
| Total Return | 47.22 | % | 52.89 | % | 16.35 | % | 33.09 | % | 35.58 | % | ||||||||||
| Supplemental Data and Ratios: | ||||||||||||||||||||
| Net assets, end of year (in thousands) | $ | 40,472 | $ | 18,492 | $ | 4,460 | $ | 1,292 | $ | 194 | ||||||||||
| Ratio of expenses to average net assets | ||||||||||||||||||||
| Before fees waived and reimbursed by the Adviser | 1.52 | % | 2.14 | % | 2.78 | % | 3.63 | % | 5.89 | % | ||||||||||
| After fees waived and reimbursed by the Adviser | 1.30 | % | 1.30 | % | 1.30 | % | 1.30 | % | 1.30 | % | ||||||||||
| Ratio of net investment loss to average net assets | ||||||||||||||||||||
| Before fees waived and reimbursed by the Adviser | -1.47 | % | -2.12 | % | -2.69 | % | -3.53 | % | -5.76 | % | ||||||||||
| After fees waived and reimbursed by the Adviser | -1.25 | % | -1.28 | % | -1.21 | % | -1.20 | % | -1.17 | % | ||||||||||
| Portfolio turnover rate (2) | 43.12 | % | 38.74 | % | 28.68 | % | 31.12 | % | 25.90 | % | ||||||||||
| (1) | Per share amounts have been calculated using the average shares method |
| (2) | Portfolio turnover rate is calculated for the Fund without distinguishing between classes. |
The accompanying notes are an integral part of these financial statements.
| Zevenbergen Growth Fund |
| Financial Highlights |
| Institutional Class |
For a Capital Share Outstanding Throughout Each Year Presented:
| For the Year Ended June 30, 2021 |
For the Year Ended June 30, 2020 |
For the Year Ended June 30, 2019 |
For the Year Ended June 30, 2018 |
For the Year Ended June 30, 2017 |
||||||||||||||||
| Net Asset Value, Beginning of Year | $ | 29.40 | $ | 19.18 | $ | 16.45 | $ | 12.33 | $ | 9.07 | ||||||||||
| Gain (Loss) from Investment Operations: | ||||||||||||||||||||
| Net investment loss (1) | (0.37 | ) | (0.20 | ) | (0.15 | ) | (0.13 | ) | (0.09 | ) | ||||||||||
| Net realized and unrealized gain on investments | 14.34 | 10.40 | 2.87 | 4.24 | 3.35 | |||||||||||||||
| Total Gain from Investment Operations | 13.97 | 10.20 | 2.72 | 4.11 | 3.26 | |||||||||||||||
| Less Distributions: | (0.03 | ) | — | — | — | — | ||||||||||||||
| Redemption Fee Proceeds (1) | 0.05 | 0.02 | 0.01 | 0.01 | — | * |
||||||||||||||
| Net Asset Value, End of Year | $ | 43.39 | $ | 29.40 | $ | 19.18 | $ | 16.45 | $ | 12.33 | ||||||||||
| Total Return | 47.68 | % | 53.28 | % | 16.60 | % | 33.41 | % | 35.94 | % | ||||||||||
| Supplemental Data and Ratios: | ||||||||||||||||||||
| Net assets, end of year (in thousands) | $ | 81,953 | $ | 37,302 | $ | 14,686 | $ | 10,970 | $ | 6,427 | ||||||||||
| Ratio of expenses to average net assets | ||||||||||||||||||||
| Before fees waived and reimbursed by the Adviser | 1.22 | % | 1.90 | % | 2.52 | % | 3.55 | % | 5.86 | % | ||||||||||
| After fees waived and reimbursed by the Adviser | 1.00 | % | 1.00 | % | 1.00 | % | 1.00 | % | 1.00 | % | ||||||||||
| Ratio of net investment loss to average net assets | ||||||||||||||||||||
| Before fees waived and reimbursed by the Adviser | -1.17 | % | -1.88 | % | -2.43 | % | -3.45 | % | -5.72 | % | ||||||||||
| After fees waived and reimbursed by the Adviser | -0.95 | % | -0.98 | % | -0.91 | % | -0.90 | % | -0.87 | % | ||||||||||
| Portfolio turnover rate (2) | 43.12 | % | 38.74 | % | 28.68 | % | 31.12 | % | 25.90 | % | ||||||||||
| * | Less than $0.01 per share |
| (1) | Per share amounts have been calculated using the average shares method |
| (2) | Portfolio turnover rate is calculated for the Fund without distinguishing between classes. |
The accompanying notes are an integral part of these financial statements.
| Zevenbergen Genea Fund |
| Allocation of Portfolio Holdings |
| (Calculated as a percentage of Total Investments) |
| June 30, 2021 (Unaudited) |
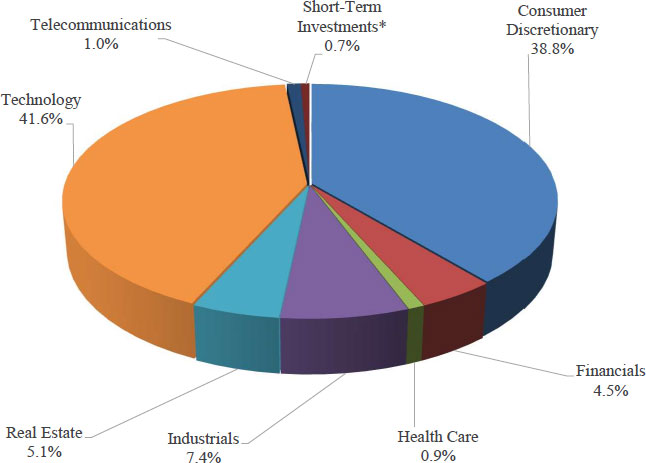
| * | Short-Term Investments consist of amounts held in money market funds. The Fund strategy does not seek to hold large cash balances (more than 5% of total investments), and any significant cash holdings are typically due to trade settlement timing. |
| Zevenbergen Genea Fund |
| Schedule of Investments |
| As of June 30, 2021 |
| Number of | ||||||||
| Shares | Value | |||||||
| COMMON STOCKS ― 99.3% | ||||||||
| CONSUMER DISCRETIONARY ― 38.8% | ||||||||
| 31,202 | Airbnb, Inc. (a) | $ | 4,778,274 | |||||
| 2,520 | Amazon.com, Inc. (a) | 8,669,203 | ||||||
| 65,850 | Chegg, Inc. (a) | 5,472,793 | ||||||
| 55,500 | Chewy, Inc. (a) | 4,423,905 | ||||||
| 37,100 | Coursera, Inc. (a) | 1,467,676 | ||||||
| 7,575 | MercadoLibre, Inc. (a) | 11,800,259 | ||||||
| 8,500 | Netflix, Inc. (a) | 4,489,785 | ||||||
| 57,250 | Peloton Interactive, Inc. (a) | 7,100,145 | ||||||
| 42,425 | Poshmark, Inc. (a) | 2,025,370 | ||||||
| 26,205 | Tesla, Inc. (a) | 17,811,539 | ||||||
| 176,400 | The Trade Desk, Inc. (a) | 13,646,304 | ||||||
| 139,400 | Uber Technologies, Inc. (a) | 6,986,728 | ||||||
| 88,671,981 | ||||||||
| FINANCIALS ― 4.5% | ||||||||
| 12,000 | Coinbase Global, Inc. (a) | 3,039,600 | ||||||
| 45,815 | Lemonade, Inc. (a) | 5,012,619 | ||||||
| 18,900 | Silvergate Capital Corporation (a) | 2,141,748 | ||||||
| 10,193,967 | ||||||||
| HEALTH CARE ― 0.9% | ||||||||
| 65,500 | Green Thumb Industries Inc. ― ADR (a) | 2,161,500 | ||||||
| INDUSTRIALS ― 7.4% | ||||||||
| 19,830 | Axon Enterprise, Inc. (a) | 3,505,944 | ||||||
| 21,600 | Bill.com Holdings, Inc. (a) | 3,956,688 | ||||||
| 38,300 | Square, Inc. (a) | 9,337,540 | ||||||
| 16,800,172 | ||||||||
| REAL ESTATE ― 5.1% | ||||||||
| 94,615 | Zillow Group, Inc. Class C (a) | 11,563,845 | ||||||
| TECHNOLOGY ― 41.6% | ||||||||
| 39,900 | Bumble Inc. (a) | 2,298,240 | ||||||
| 9,830 | Coupa Software Incorporated (a) | 2,576,541 | ||||||
| 10,860 | Datadog, Inc. (a) | 1,130,309 | ||||||
| 39,750 | Global-e Online Ltd. ― ADR (a) | 2,268,930 | ||||||
| 17,240 | MongoDB, Inc. (a) | 6,232,605 | ||||||
| 14,525 | NVIDIA Corporation | 11,621,452 | ||||||
| 24,575 | Okta, Inc. (a) | 6,013,011 | ||||||
| 47,591 | Olo Inc. (a) | 1,779,427 | ||||||
The accompanying notes are an integral part of these financial statements.
| Zevenbergen Genea Fund |
| Schedule of Investments (Continued) |
| As of June 30, 2021 |
| Number of | ||||||||
| Shares | Value | |||||||
| TECHNOLOGY ― 41.6% (Continued) | ||||||||
| 82,030 | Pinterest, Inc. (a) | $ | 6,476,269 | |||||
| 9,500 | Shopify Inc. (a) | 13,879,310 | ||||||
| 123,800 | Snap Inc. (a) | 8,435,732 | ||||||
| 23,800 | Snowflake Inc. (a) | 5,754,840 | ||||||
| 42,540 | Sprout Social, Inc. (a) | 3,803,927 | ||||||
| 19,350 | Twilio Inc. (a) | 7,626,996 | ||||||
| 24,300 | UiPath, Inc. (a) | 1,650,699 | ||||||
| 46,000 | Unity Software Inc. (a) | 5,052,180 | ||||||
| 21,000 | Zoom Video Communications, Inc. (a) | 8,127,630 | ||||||
| 94,728,098 | ||||||||
| TELECOMMUNICATIONS ― 1.0% | ||||||||
| 74,100 | fuboTV Inc. (a) | 2,379,352 | ||||||
| TOTAL COMMON STOCKS | ||||||||
| (Cost $152,428,981) | $ | 226,498,915 | ||||||
| SHORT-TERM INVESTMENTS ― 0.7% | ||||||||
| 1,496,779 | First American U.S. Treasury Money Market Fund, Class Z, 0.06%(b) | 1,496,779 | ||||||
| TOTAL SHORT-TERM INVESTMENTS (Cost $1,496,779) | $ | 1,496,779 | ||||||
| TOTAL INVESTMENTS ― 100.0% (Cost $153,925,760) | 227,995,694 | |||||||
| Liabilities in Excess of Other Assets ― 0.0% | (98,064 | ) | ||||||
| TOTAL NET ASSETS ― 100.0% | $ | 227,897,630 | ||||||
| ADR: | American Depository Receipt. |
| (a): | Non Income Producing. |
| (b): | Variable rate security. The rate disclosed is the annualized seven-day effective yield as of June 30, 2021. |
The accompanying notes are an integral part of these financial statements.
|
Zevenbergen Genea Fund |
|
June 30, 2021 |
|
Assets |
|
|
|
|
|
Investments in securities, at value (cost $153,925,760) |
|
$ |
227,995,694 |
|
|
Receivable for Fund shares sold |
|
|
671,952 |
|
|
Receivable for investments sold |
|
|
1,312,329 |
|
|
Dividends and Interest receivable |
|
|
2,277 |
|
|
Prepaid expenses |
|
|
35,214 |
|
|
Total Assets |
|
|
230,017,466 |
|
|
|
|
|
|
|
|
Liabilities |
|
|
|
|
|
Payable for Fund shares redeemed |
|
|
89,639 |
|
|
Payable for securities purchased |
|
|
1,495,736 |
|
|
Payable to Adviser |
|
|
350,932 |
|
|
Shareholder Service Fees |
|
|
51,535 |
|
|
Distribution fees - Investor Class |
|
|
56,691 |
|
|
Accrued other expenses and other liabilities |
|
|
75,303 |
|
|
Total Liabilities |
|
|
2,119,836 |
|
|
|
|
|
|
|
|
Net Assets |
|
$ |
227,897,630 |
|
|
|
|
|
|
|
|
Components of Net Assets |
|
|
|
|
|
Paid-in capital |
|
$ |
158,434,120 |
|
|
Total distributable earnings |
|
|
69,463,510 |
|
|
Net Assets |
|
$ |
227,897,630 |
|
|
|
|
|
|
|
|
Investor Class: |
|
|
|
|
|
Net assets |
|
$ |
120,715,711 |
|
|
Shares outstanding (unlimited number of shares authorized, no par value) |
|
|
2,140,332 |
|
|
Net asset value, offering and redemption price per share * |
|
$ |
56.40 |
|
|
|
|
|
|
|
|
Institutional Class: |
|
|
|
|
|
Net assets |
|
$ |
107,181,919 |
|
|
Shares outstanding (unlimited number of shares authorized, no par value) |
|
|
1,872,478 |
|
|
Net asset value, offering and redemption price per share * |
|
$ |
57.24 |
|
* Shares redeemed or exchanged within 90 days of purchase are charged a 1.00% redemption fee (Note 9).
The accompanying notes are an integral part of these financial statements.
|
Zevenbergen Genea Fund |
|
For the Year Ended June 30, 2021 |
|
Investment Income |
|
|
|
|
|
Dividends and interest income |
|
$ |
8,832 |
|
|
|
|
|
|
|
|
Expenses |
|
|
|
|
|
Advisory fees |
|
|
1,359,261 |
|
|
Distribution fees - Investor Class |
|
|
218,645 |
|
|
Shareholder servicing fees (Note 6) |
|
|
200,677 |
|
|
Administration fees (Note 3) |
|
|
119,624 |
|
|
Transfer agent fees and expenses (Note 3) |
|
|
61,075 |
|
|
Registration fees |
|
|
42,620 |
|
|
Legal fees |
|
|
32,289 |
|
|
Trustees’ fees |
|
|
16,956 |
|
|
Custody fees (Note 3) |
|
|
16,176 |
|
|
Audit fees |
|
|
15,695 |
|
|
Compliance fees (Note 3) |
|
|
11,683 |
|
|
Shareholder reporting fees |
|
|
9,125 |
|
|
Miscellaneous expenses |
|
|
6,846 |
|
|
Insurance fees |
|
|
3,196 |
|
|
Total expenses |
|
|
2,113,868 |
|
|
Expenses waived by the Adviser (Note 3) |
|
|
(178,337 |
) |
|
|
|
|
||
|
Net Expenses |
|
|
1,935,531 |
|
|
|
|
|
|
|
|
Net Investment Loss |
|
|
(1,926,699 |
) |
|
|
|
|
|
|
|
Realized and Unrealized Gain on Investments |
|
|
|
|
|
Net realized gain on investments |
|
|
229,375 |
|
|
Change in unrealized appreciation on investments |
|
|
45,466,313 |
|
|
Net Realized and Unrealized Gain on Investments |
|
|
45,695,688 |
|
|
|
|
|
|
|
|
Net Increase in Net Assets from Operations |
|
$ |
43,768,989 |
|
The accompanying notes are an integral part of these financial statements.
|
Zevenbergen Genea Fund |
|
|
|
For the Year |
|
|
For the Year |
|
||
|
Operations |
|
June 30, 2021 |
|
|
June 30, 2020 |
|
||
|
Net investment loss |
|
$ |
(1,926,699 |
) |
|
$ |
(503,696 |
) |
|
Net realized gain (loss) on investments |
|
|
229,375 |
|
|
|
(2,559,382 |
) |
|
Net change in unrealized appreciation on investments |
|
|
45,466,313 |
|
|
|
17,999,600 |
|
|
Net Increase in Net Assets from Operations |
|
|
43,768,989 |
|
|
|
14,936,522 |
|
|
|
|
|
|
|
|
|
|
|
|
Capital Transactions |
|
|
|
|
|
|
|
|
|
Proceeds from shares sold |
|
|
|
|
|
|
|
|
|
Investor Class |
|
|
123,929,435 |
|
|
|
13,742,698 |
|
|
Institutional Class |
|
|
93,591,974 |
|
|
|
6,071,493 |
|
|
Cost of shares redeemed |
|
|
|
|
|
|
|
|
|
Investor Class |
|
|
(61,416,630 |
) |
|
|
(17,810,000 |
) |
|
Institutional Class |
|
|
(30,234,551 |
) |
|
|
(4,320,587 |
) |
|
Redemption fees |
|
|
|
|
|
|
|
|
|
Investor Class |
|
|
176,080 |
|
|
|
12,696 |
|
|
Institutional Class |
|
|
140,670 |
|
|
|
10,340 |
|
|
Net Increase/(Decrease) in Net Assets from Capital Share Transactions |
|
|
126,186,978 |
|
|
|
(2,293,360 |
) |
|
|
|
|
|
|
||||
|
Total Increase in Net Assets |
|
|
169,955,967 |
|
|
|
12,643,162 |
|
|
|
|
|
|
|
|
|
|
|
|
Net Assets |
|
|
|
|
|
|
|
|
|
Beginning of year |
|
|
57,941,663 |
|
|
|
45,298,501 |
|
|
End of year |
|
$ |
227,897,630 |
|
|
$ |
57,941,663 |
|
|
|
|
|
|
|
|
|
|
|
|
Capital Shares Transactions |
|
|
|
|
|
|
|
|
|
Investor Class |
|
|
|
|
|
|
|
|
|
Shares sold |
|
|
2,373,277 |
|
|
|
544,623 |
|
|
Shares reinvested |
|
|
— |
|
|
|
— |
|
|
Shares redeemed |
|
|
(1,215,594 |
) |
|
|
(815,815 |
) |
|
Net increase/(decrease) in shares outstanding |
|
|
1,157,683 |
|
|
|
(271,192 |
) |
|
|
|
|
|
|
|
|
|
|
|
Institutional Class |
|
|
|
|
|
|
|
|
|
Shares sold |
|
|
1,715,120 |
|
|
|
248,310 |
|
|
Shares reinvested |
|
|
— |
|
|
|
— |
|
|
Shares redeemed |
|
|
(588,952 |
) |
|
|
(201,126 |
) |
|
Net increase in shares outstanding |
|
|
1,126,168 |
|
|
|
47,184 |
|
The accompanying notes are an integral part of these financial statements.
For a Capital Share Outstanding Throughout Each Year Presented:
|
|
|
For the Year |
|
|
For the Year |
|
|
For the Year |
|
|
For the Year |
|
|
For the Year |
|
|||||
|
Net Asset Value, Beginning of Year |
|
$ |
33.34 |
|
|
$ |
23.12 |
|
|
$ |
20.77 |
|
|
$ |
14.20 |
|
|
$ |
9.40 |
|
|
Gain (Loss) from Investment Operations: |
|
|
|
|
|
|
|
|
|
|
|
|
|
|
|
|
|
|
|
|
|
Net investment loss (1) |
|
|
(0.69 |
) |
|
|
(0.32 |
) |
|
|
(0.29 |
) |
|
|
(0.23 |
) |
|
|
(0.16 |
) |
|
Net realized and unrealized gain on investments |
|
|
23.65 |
|
|
|
10.53 |
|
|
|
2.68 |
|
|
|
6.79 |
|
|
|
4.96 |
|
|
Total Gain from Investment Operations |
|
|
22.96 |
|
|
|
10.21 |
|
|
|
2.39 |
|
|
|
6.56 |
|
|
|
4.80 |
|
|
|
|
|
|
|
|
|
|
|
|
|
|
|
|
|
|
|
|
|
|
|
|
Less Distributions: |
|
|
— |
|
|
|
— |
|
|
|
(0.06 |
) |
|
|
— |
|
|
|
— |
|
|
|
|
|
|
|
|
|
|
|
|
|
|
|
|
|
|
|
|
|
|
|
|
Redemption Fee Proceeds (1) |
|
|
0.10 |
|
|
|
0.01 |
|
|
|
0.02 |
|
|
|
0.01 |
|
|
|
— |
* |
|
|
|
|
|
|
|
|
|
|
|
|
|
|
|
|
|
|
|
|
|
|
|
Net Asset Value, End of Year |
|
$ |
56.40 |
|
|
$ |
33.34 |
|
|
$ |
23.12 |
|
|
$ |
20.77 |
|
|
$ |
14.20 |
|
|
|
|
|
|
|
|
|
|
|
|
|
|
|
|
|
|
|
|
|
|
|
|
Total Return |
|
|
69.17 |
% |
|
|
44.20 |
% |
|
|
11.72 |
% |
|
|
46.27 |
% |
|
|
51.06 |
% |
|
|
|
|
|
|
|
|
|
|
|
|
|
|
|
|
|
|
|
|
|
|
|
Supplemental Data and Ratios: |
|
|
|
|
|
|
|
|
|
|
|
|
|
|
|
|
|
|
|
|
|
Net assets, end of year (in thousands) |
|
$ |
120,716 |
|
|
$ |
32,763 |
|
|
$ |
28,986 |
|
|
$ |
12,633 |
|
|
$ |
2,074 |
|
|
Ratio of expenses to average net assets |
|
|
|
|
|
|
|
|
|
|
|
|
|
|
|
|
|
|
|
|
|
Before fees waived and reimbursed by the Adviser |
|
|
1.48 |
% |
|
|
1.98 |
% |
|
|
2.09 |
% |
|
|
3.35 |
% |
|
|
7.96 |
% |
|
After fees waived and reimbursed by the Adviser |
|
|
1.37 |
% |
|
|
1.40 |
% |
|
|
1.40 |
% |
|
|
1.40 |
% |
|
|
1.40 |
% |
|
Ratio of net investment loss to average net assets |
|
|
|
|
|
|
|
|
|
|
|
|
|
|
|
|
|
|
|
|
|
Before fees waived and reimbursed by the Adviser |
|
|
-1.47 |
% |
|
|
-1.96 |
% |
|
|
-2.04 |
% |
|
|
-3.27 |
% |
|
|
-7.89 |
% |
|
After fees waived and reimbursed by the Adviser |
|
|
-1.36 |
% |
|
|
-1.38 |
% |
|
|
-1.35 |
% |
|
|
-1.32 |
% |
|
|
-1.33 |
% |
|
Portfolio turnover rate (2) |
|
|
32.40 |
% |
|
|
61.63 |
% |
|
|
35.25 |
% |
|
|
22.35 |
% |
|
|
67.59 |
% |
|
* |
Less than $0.01 per share |
|
(1) |
Per share amounts have been calculated using the average shares method |
|
(2) |
Portfolio turnover rate is calculated for the Fund without distinguishing between classes. |
The accompanying notes are an integral part of these financial statements.
|
Zevenbergen Genea Fund |
For a Capital Share Outstanding Throughout Each Year Presented:
|
|
|
For the Year |
|
|
For the Year |
|
|
For the Year |
|
|
For the Year |
|
|
For the Year |
|
|||||
|
Net Asset Value, Beginning of Year |
|
$ |
33.74 |
|
|
$ |
23.33 |
|
|
$ |
20.93 |
|
|
$ |
14.30 |
|
|
$ |
9.41 |
|
|
|
|
|
|
|
|
|
|
|
|
|
|
|
|
|
|
|
|
|
|
|
|
Gain (Loss) from Investment Operations: |
|
|
|
|
|
|
|
|
|
|
|
|
|
|
|
|
|
|
|
|
|
Net investment loss (1) |
|
|
(0.54 |
) |
|
|
(0.25 |
) |
|
|
(0.22 |
) |
|
|
(0.18 |
) |
|
|
(0.12 |
) |
|
Net realized and unrealized gain on investments |
|
|
23.94 |
|
|
|
10.65 |
|
|
|
2.66 |
|
|
|
6.80 |
|
|
|
4.99 |
|
|
Total Gain from Investment Operations |
|
|
23.40 |
|
|
|
10.40 |
|
|
|
2.44 |
|
|
|
6.62 |
|
|
|
4.87 |
|
|
|
|
|
|
|
|
|
|
|
|
|
|
|
|
|
|
|
|
|
|
|
|
Less Distributions: |
|
|
— |
|
|
|
— |
|
|
|
(0.06 |
) |
|
|
— |
|
|
|
— |
|
|
|
|
|
|
|
|
|
|
|
|
|
|
|
|
|
|
|
|
|
|
|
|
Redemption Fee Proceeds (1) |
|
|
0.10 |
|
|
|
0.01 |
|
|
|
0.02 |
|
|
|
0.01 |
|
|
|
0.02 |
|
|
|
|
|
|
|
|
|
|
|
|
|
||||||||||
|
Net Asset Value, End of Year |
|
$ |
57.24 |
|
|
$ |
33.74 |
|
|
$ |
23.33 |
|
|
$ |
20.93 |
|
|
$ |
14.30 |
|
|
|
|
|
|
|
|
|
|
|
|
|
|
|
|
|
|
|
|
|
|
|
|
Total Return |
|
|
69.65 |
% |
|
|
44.62 |
% |
|
|
11.87 |
% |
|
|
46.36 |
% |
|
|
51.97 |
% |
|
|
|
|
|
|
|
|
|
|
|
|
|
|
|
|
|
|
|
|
|
|
|
Supplemental Data and Ratios: |
|
|
|
|
|
|
|
|
|
|
|
|
|
|
|
|
|
|
|
|
|
Net assets, end of year (in thousands) |
|
$ |
107,182 |
|
|
$ |
25,179 |
|
|
$ |
16,312 |
|
|
$ |
9,073 |
|
|
$ |
3,669 |
|
|
Ratio of expenses to average net assets |
|
|
|
|
|
|
|
|
|
|
|
|
|
|
|
|
|
|
|
|
|
Before fees waived and reimbursed by the Adviser |
|
|
1.18 |
% |
|
|
1.70 |
% |
|
|
1.80 |
% |
|
|
3.21 |
% |
|
|
8.08 |
% |
|
After fees waived and reimbursed by the Adviser |
|
|
1.07 |
% |
|
|
1.10 |
% |
|
|
1.10 |
% |
|
|
1.10 |
% |
|
|
1.10 |
% |
|
Ratio of net investment loss to average net assets |
|
|
|
|
|
|
|
|
|
|
|
|
|
|
|
|
|
|
|
|
|
Before fees waived and reimbursed by the Adviser |
|
|
-1.17 |
% |
|
|
-1.68 |
% |
|
|
-1.75 |
% |
|
|
-3.14 |
% |
|
|
-8.02 |
% |
|
After fees waived and reimbursed by the Adviser |
|
|
-1.06 |
% |
|
|
-1.08 |
% |
|
|
-1.05 |
% |
|
|
-1.03 |
% |
|
|
-1.04 |
% |
|
Portfolio turnover rate (2) |
|
|
32.40 |
% |
|
|
61.63 |
% |
|
|
35.25 |
% |
|
|
22.35 |
% |
|
|
67.59 |
% |
|
(1) |
Per share amounts have been calculated using the average shares method |
|
(2) |
Portfolio turnover rate is calculated for the Fund without distinguishing between classes. |
The accompanying notes are an integral part of these financial statements.
Zevenbergen Funds
Notes to the Financial Statements
June 30, 2021
NOTE 1 – ORGANIZATION
Zevenbergen Growth Fund (the “Growth Fund”) and Zevenbergen Genea Fund (the “Genea Fund”; each a “Fund” collectively the “Funds”) are non-diversified series of Trust for Advised Portfolios (the “Trust”). The Trust, a Delaware Statutory Trust, is registered under the Investment Company Act of 1940, as amended (the “1940 Act”) as an open-end management investment company. Zevenbergen Capital Investments LLC (the “Adviser”) serves as the investment manager to the Funds. The inception date of the Funds was August 31, 2015. The Funds’ investment objective is long-term capital appreciation.
Growth Fund and Genea Fund, each, currently offer two classes of shares, Institutional Class and Investor Class. Each share class represents an equal interest in the Fund, except the difference of class specific expenses, which reflects the difference in the range of services provided to each class. Income, expenses (other than class specific), and realized and unrealized gains and losses on investments are allocated daily to each class based on relative net assets.
NOTE 2 – SIGNIFICANT ACCOUNTING POLICIES
The following is a summary of significant accounting policies consistently followed by the Funds in preparation of their financial statements. These policies are in conformity with accounting principles generally accepted in the United States of America (“U.S. GAAP”) for investment companies. Each Fund is considered an investment company under U.S. GAAP and follows the accounting and reporting guidance applicable to investment companies in the Financial Accounting Standards Board Accounting Standards Codification Topic 946. The presentation of financial statements in conformity with U.S. GAAP requires management to make estimates and assumptions that affect the reported amounts of assets and liabilities and disclosure of contingent assets and liabilities at the date of the financial statements and the reported amounts of income and expenses during the period. Actual results may differ from those estimates.
A. Securities Valuation
The Funds follow a fair value hierarchy that distinguishes between market data obtained from independent sources (observable inputs) and the Funds’ own market assumptions (unobservable inputs). The inputs or methodology used in determining the value of each Fund’s investments are not necessarily an indication of the risk associated with investing in those securities.
Various inputs are used in determining the value of the Funds’ investments. These inputs are summarized into three broad categories as defined below:
Level 1 - Quoted prices in active markets for identical securities. An active market for a security is a market in which transactions occur with sufficient frequency and volume to provide pricing information on an ongoing basis. A quoted price in an active market provides the most reliable evidence of fair value.
Level 2 - Observable inputs other than quoted prices included in Level 1 that are observable for the asset or liability either directly or indirectly. These inputs may include quoted prices for the identical instrument on an inactive market, prices for similar instruments, interest rates, prepayment speeds, credit risk, yield curves, default rates, and similar data.
Level 3 - Significant unobservable inputs, including the Funds’ own assumptions in determining fair value of investments.
Equity securities that are traded on a national securities exchange are stated at the last reported sales price on the day of valuation. To the extent these securities are actively traded and valuation adjustments are not applied, they are categorized as Level 1 of the fair value hierarchy.
Short-term investments classified as money market instruments are valued at NAV. These investments are categorized as Level 1 of the fair value hierarchy.
Zevenbergen Funds
Notes to the Financial Statements (Continued)
June 30, 2021
NOTE 2 – SIGNIFICANT ACCOUNTING POLICIES (Continued)
The inputs or methodology used for valuing securities are not necessarily an indication of the risk associated with investing in those securities. The following is a summary of the fair values of the Funds’ investments in each category investment type as of June 30, 2021:
Growth Fund
|
Description |
|
Level 1 |
|
|
Level 2 |
|
|
Level 3 |
|
|
Total |
|
||||
|
Assets |
|
|
|
|
|
|
|
|
|
|
|
|
|
|
|
|
|
Common Stocks |
|
$ |
120,864,028 |
|
|
$ |
— |
|
|
$ |
— |
|
|
$ |
120,864,028 |
|
|
Short-Term Investments |
|
|
1,081,861 |
|
|
|
— |
|
|
|
— |
|
|
|
1,081,861 |
|
|
Total Assets |
|
$ |
121,945,889 |
|
|
$ |
— |
|
|
$ |
— |
|
|
$ |
121,945,889 |
|
|
|
|
|
|
|
|
|
|
|
|
|
|
|
|
|
|
|
Genea Fund
|
|
|
|
|
|
|
|
|
|
|
|
|
|
|
|
|
|
|
Description |
|
|
Level 1 |
|
|
|
Level 2 |
|
|
|
Level 3 |
|
|
|
Total |
|
|
Assets |
|
|
|
|
|
|
|
|
|
|
|
|
|
|
|
|
|
Common Stocks |
$ |
226,498,915 |
|
|
$ |
— |
|
|
$ |
— |
|
|
$ |
226,498,915 |
|
|
|
Short-Term Investments |
|
|
1,496,779 |
|
|
|
— |
|
|
|
— |
|
|
|
1,496,779 |
|
|
Total Assets |
|
$ |
227,995,694 |
|
|
$ |
— |
|
|
$ |
— |
|
|
$ |
227,995,694 |
|
Please refer to the Schedule of Investments for further classification.
B. Security Transactions, Investment Income and Distributions
The Funds record security transactions based on trade date. Realized gains and losses on sales of securities are calculated by comparing the original cost of the specifically identified security lot sold with the net sales proceeds. Dividend income is recognized on the ex-dividend date, and interest income is recognized on an accrual basis. Withholding taxes on foreign dividends have been provided for in accordance with the Trust’s understanding of the applicable country’s tax rules and rates.
C. Federal Income Taxes
The Funds have elected to be taxed as Regulated Investment Companies (“RIC”) under the U.S. Internal Revenue Code of 1986, as amended, and intend to maintain this qualification and to distribute substantially all of their net taxable income to their shareholders. Therefore, no provision is made for federal income taxes. Due to the timing of dividend distributions (if any) and the differences in accounting for income and realized gains and losses for financial statement and federal income tax purposes, the fiscal year in which amounts are distributed may differ from the year in which the income and realized gains and losses are recorded by the Funds.
Management of the Funds is required to analyze all open tax years, as defined by IRS statute of limitations for all major jurisdictions, including federal tax authorities and certain state tax authorities. As of and during the period ended June 30, 2021, the Funds did not have a liability for any unrecognized tax benefits. Generally, tax authorities can examine tax returns filed for the preceding three years. The Funds are not aware of any tax positions for which it is reasonably possible that the total amounts of unrecognized tax benefits will significantly change in the next twelve months.
Zevenbergen Funds
Notes to the Financial Statements (Continued)
June 30, 2021
NOTE 3 – INVESTMENT MANAGEMENT AGREEMENT AND OTHER RELATED PARTY TRANSACTIONS
The Trust entered into an agreement for the Adviser to furnish investment advisory services to the Funds. Under the terms of this agreement, Growth Fund and Genea Fund will pay the Adviser a monthly fee based on each Fund’s average daily net assets at the annual rate of 0.80%.
Effective April 1, 2021, the advisory fee of the Zevenbergen Genea Fund decreased from 0.90% to 0.80%, and the limits on total annual fund operating expenses decreased from 1.25% to 1.15% for the Fund’s Investor Class and from 1.00% to 0.90% for the Fund’s Institutional Class shares as detailed in the following section.
The Adviser has contractually agreed to waive its management fee and/or reimburse each Fund’s operating expenses (excluding shareholder servicing fees, any front-end or contingent deferred loads, taxes, leverage interest, brokerage commissions, acquired fund fees and expenses, merger or reorganization-related expenses, portfolio transaction expenses, interest expense and dividends paid on short sales, and extraordinary expenses) to ensure they do not exceed, on an annual basis, the expense limitations, expressed as a percentage rate of the average daily net assets of each Fund, listed below. Waivers or reimbursements are calculated daily and settled monthly or quarterly in conjunction with each Fund’s payment of advisory fees.
|
Fund |
Investor Class |
Institutional Class |
|
Growth Fund |
1.15% |
0.90% |
|
Genea Fund |
1.15% |
0.90% |
See Note 6 – Shareholder Servicing Plan for shareholder servicing fees charged in addition to fees outlined in this table.
The Adviser is permitted to recapture amounts waived and/or reimbursed to a class within three years if the class’s total annual operating expenses have fallen to a level below the expense limitation (“expense cap”) in effect at the time the fees were earned or the expenses incurred. However, in no case will the Adviser recapture any amount that would result, on any particular business day of the Funds, in the class’s total annual operating expenses exceeding the expense cap or any other lower limit then in effect.
At June 30, 2021, the expenses reimbursed and contractual fees waived by the Adviser and subject to potential recapture by period were as follows:
|
Fiscal Year waived/reimbursed |
|
Growth Fund |
|
|
Genea Fund |
|
|
Expiration |
|
|||
|
FYE June 30, 2019 |
|
$ |
227,826 |
|
|
$ |
224,757 |
|
|
|
June 30, 2022 |
|
|
FYE June 30, 2020 |
|
|
230,107 |
|
|
|
236,776 |
|
|
|
June 30, 2023 |
|
|
FYE June 30, 2021 |
|
|
222,372 |
|
|
|
178,337 |
|
|
|
June 30, 2024 |
|
|
|
|
$ |
680,305 |
|
|
$ |
639,870 |
|
|
|
|
|
U.S. Bancorp Fund Services, LLC, doing business as U.S. Bank Global Fund Services (“Fund Services”), serves as the Funds’ administrator, fund accountant, and transfer agent. The officers of the Trust are employees of Fund Services. U.S. Bank serves as the Funds’ custodian and provides compliance services to the Funds. For the year ended June 30, 2021, the Funds incurred the following expenses for administration and fund accounting, custody, transfer agent and compliance fees:
|
|
|
Growth Fund |
|
|
Genea Fund |
|
||
|
Administration |
|
$ |
124,117 |
|
|
$ |
119,624 |
|
|
Custody |
|
|
17,863 |
|
|
|
16,176 |
|
|
Transfer Agency |
|
|
55,450 |
|
|
|
61,075 |
|
|
Chief Compliance Officer |
|
|
12,680 |
|
|
|
11,683 |
|
Zevenbergen Funds
Notes to the Financial Statements (Continued)
June 30, 2021
At June 30, 2021, the Funds had payables due to Fund Services and its affiliates for administration and fund accounting, custody, transfer agent and compliance fees in the following amounts:
|
|
|
Growth Fund |
|
|
Genea Fund |
|
||
|
Administration |
|
$ |
24,110 |
|
|
$ |
21,187 |
|
|
Custody |
|
|
5,521 |
|
|
|
2,878 |
|
|
Transfer Agency |
|
|
13,925 |
|
|
|
15,672 |
|
|
Chief Compliance Officer |
|
|
3,204 |
|
|
|
3,219 |
|
The above payable amounts are included in the Accrued other expenses and other liabilities line item in the Statement of Assets and Liabilities.
The Independent Trustees were paid $34,504 for their services to the Funds during the year ended June 30, 2021. No compensation is paid directly by the Funds to the Interested Trustee or officers of the Trust.
NOTE 4 – INVESTMENT TRANSACTIONS
Purchases and sales of investment securities (excluding short-term investments) for each Fund for the year ended June 30, 2021, were as follows:
|
Growth Fund |
|
|
|
|
|
Purchases |
|
$ |
79,037,774 |
|
|
Sales |
|
$ |
42,899,999 |
|
|
|
|
|
|
|
|
Genea Fund |
|
|
|
|
|
Purchases |
|
$ |
173,288,076 |
|
|
Sales |
|
$ |
50,112,496 |
|
NOTE 5 – FEDERAL INCOME TAX INFORMATION
At June 30, 2021, the components of distributable earnings for income tax purposes were as follows:
|
|
|
Growth Fund |
|
|
Genea Fund |
|
||
|
|
|
|
|
|
|
|
|
|
|
Cost of investments |
|
$ |
72,558,536 |
|
|
$ |
154,258,793 |
|
|
Gross unrealized appreciation |
|
|
52,666,310 |
|
|
|
83,885,935 |
|
|
Gross unrealized depreciation |
|
|
(3,278,957 |
) |
|
|
(10,149,034 |
) |
|
Net unrealized appreciation on investments |
|
|
49,387,353 |
|
|
|
73,736,901 |
|
|
|
|
|
|
|
|
|
|
|
|
Undistributed ordinary income |
|
|
— |
|
|
|
— |
|
|
Undistributed long-term capital gains |
|
|
1,961,571 |
|
|
|
— |
|
|
Accumulated earnings |
|
|
1,961,571 |
|
|
|
— |
|
|
|
|
|
|
|
|
|
|
|
|
Capital loss carryforwards |
|
|
— |
|
|
|
(3,090,082 |
) |
|
Other book/tax temporary differences |
|
|
(646,652 |
) |
|
|
(1,183,309 |
) |
|
Total distributable earnings |
|
$ |
50,702,272 |
|
|
$ |
69,463,510 |
|
The difference between book basis and tax basis unrealized appreciation/(depreciation) is attributable in part to the tax deferral of losses on wash sales.
Zevenbergen Funds
Notes to the Financial Statements (Continued)
June 30, 2021
GAAP requires that certain components of net assets be reclassified between financial and tax reporting. These reclassifications have no effect on net assets or net asset value per share. For the year ended June 30, 2021, permanent differences, due to net operating losses, in book and tax accounting have been reclassified to capital and distributable earnings as follows:
| Distributable Earnings | Paid In Capital | |||||||
| Growth Fund | $ | 586,334 | $ | (586,334 | ) | |||
| Genea Fund | $ | 875,671 | $ | (875,671 | ) | |||
The following table summarizes the characteristics of distributions paid during the year ended June 30, 2021:
| Short-Term | Long-Term | Total | ||||||||||
| Capital Gains | Capital Gains | Distributions Paid | ||||||||||
| Growth Fund | $ | — | $ | 73,416 | $ | 73,416 | ||||||
| Genea Fund | $ | — | $ | — | $ | — | ||||||
No distributions were paid by the Growth Fund or Genea Fund during the year ended June 30, 2020.
The following capital loss carryovers were utilized during the year ended June 30, 2021:
| Growth Fund: | $ 523,514 |
| Genea Fund: | $ 241,399 |
The Funds are required, in order to meet certain excise tax requirements, to measure and distribute annually, net capital gains realized during the twelve month period ending October 31. In connection with this requirement, the Funds are permitted, for tax purposes, to defer into their next fiscal year any net capital losses incurred from November 1 through the end of the fiscal year. Late year losses incurred after December 31 within the fiscal year are deemed to arise on the first business day of the following fiscal year for tax purposes. At June 30, 2021, the Funds deferred the following, on a tax basis, losses:
|
|
|
Late Year Loss |
|
Post October Loss |
||||
|
Growth Fund |
|
$ |
(646,652 |
) |
|
$ |
— |
|
|
Genea Fund |
|
$ |
(1,183,309 |
) |
|
$ |
— |
|
At June 30, 2021, the Funds had capital loss carryforwards, which reduce the Funds’ taxable income arising from future net realized gains on investments, if any, to the extent permitted by the Internal Revenue Code, and thus will reduce the amount of distributions to shareholders which would otherwise be necessary to relieve the Funds of any liability for federal tax. Pursuant to the Internal Revenue Code, the character of such capital loss carryforwards is as follows:
|
Capital Loss Carryforwards Not Subject to Expiration |
||||||||||||
|
Short-Term |
Long-Term |
Total |
||||||||||
| Growth Fund | $ | — | $ | — | $ | — | ||||||
| Genea Fund | $ | (3,090,082 | ) | $ | — | $ | (3,090,082 | ) | ||||
Zevenbergen Funds
Notes to the Financial Statements (Continued)
June 30, 2021
NOTE 6 – SHAREHOLDER SERVICING PLAN
The Trust, on behalf of the Funds, has adopted a Shareholder Servicing Plan to pay a fee at an annual rate on average daily net assets as follows:
|
Fund |
|
Investor Class |
|
Institutional Class |
||||
|
Growth Fund |
|
|
0.15 |
% |
|
|
0.10 |
% |
|
Genea Fund |
|
|
0.15 |
% |
|
|
0.10 |
% |
The Shareholder Servicing Plan authorizes payment of a shareholder servicing fee to the financial intermediaries and other service providers who provide administrative and support services to Fund shareholders.
For the year ended June 30, 2021, class specific Shareholder Servicing fees were as follows:
|
Fund |
|
Investor Class |
|
|
Institutional Class |
|
||
|
Growth Fund |
|
$ |
56,573 |
|
|
$ |
63,083 |
|
|
Genea Fund |
|
|
131,187 |
|
|
|
69,490 |
|
NOTE 7 – DISTRIBUTION PLAN
The Trust, on behalf of the Funds, has adopted a Distribution Plan (the “Plan”) pursuant to Rule 12b-1 under the 1940 Act that allows each Fund to pay distribution fees for the sale and distribution of its Investor Class shares. The Plan provides for the payment of distribution fees at the annual rate of up to 0.25% of average daily net assets of the Investor Class shares. For the year ended June 30, 2021, distribution fees incurred are disclosed on the Statement of Operations.
NOTE 8 – COMMITMENTS AND CONTINGENCIES
In the normal course of business, each Fund enters into contracts that provide general indemnifications by each Fund to the counterparty to the contract. Each Fund’s maximum exposure under these arrangements is dependent on future claims that may be made against each Fund and, therefore, cannot be estimated; however, based on experience, the risk of loss from such claims is considered remote.
NOTE 9 – REDEMPTION FEES
Each Fund charges a 1.00% redemption fee on the redemption of Investor Class and Institutional Class shares held for 90 days or less. This fee (which is paid into the Fund) is imposed in order to help offset the transaction costs and administrative expenses associated with the activities of short-term “market timers” that engage in the frequent purchase and sale of Fund shares. The fee is accounted for as an addition to paid-in capital. Each Fund reserves the right to modify the terms of or terminate the fee at any time. There are limited exceptions to the imposition of the redemption fee. Please refer to Statements of Changes in Net Assets for fees recognized.
NOTE 10 – SUBSEQUENT EVENTS
In preparing these financial statements, the Funds have evaluated events and transactions for potential recognition or disclosure through the date the financial statements were available to be issued. The Funds have determined that there were no subsequent events that would need to be disclosed in the Funds’ financial statements.
Zevenbergen Funds
Notes to the Financial Statements (Continued)
June 30, 2021
NOTE 11 – COVID-19 RISK
The global outbreak of COVID-19 (commonly referred to as “coronavirus”) has disrupted economic markets and the prolonged economic impact is uncertain. The ultimate economic fallout from the pandemic, and the long-term impact on economies, markets, industries and individual issuers, are not known. The operational and financial performance of the issuers of securities in which the Funds invest depend on future developments, including the duration and spread of the outbreak, and such uncertainty may in turn adversely affect the value and liquidity of the Funds’ investments, impair the Funds’ ability to satisfy redemption requests, and negatively impact the Funds’ performance.

REPORT OF INDEPENDENT REGISTERED PUBLIC ACCOUNTING FIRM
To the Board of Trustees of Trust for Advised Portfolios
and the Shareholders of Zevenbergen Growth Fund and Zevenbergen Genea Fund
Opinion on the Financial Statements
We have audited the accompanying statements of assets and liabilities of Zevenbergen Growth Fund and Zevenbergen Genea Fund, each a series of shares of beneficial interest in Trust for Advised Portfolios (the “Funds”), including the schedules of investments, as of June 30, 2021, and the related statements of operations for the year then ended, the statements of changes in net assets for each of the years in the two-year period then ended, the financial highlights for each of the years in the five-year period then ended, and the related notes (collectively referred to as the “financial statements”). In our opinion, the financial statements present fairly, in all material respects, the financial position of the Funds as of June 30, 2021, and the results of their operations for the year then ended, the changes in their net assets for each of the years in the two-year period then ended and their financial highlights for each of the years in the five-year period then ended, in conformity with accounting principles generally accepted in the United States of America.
Basis for Opinion
These financial statements are the responsibility of the Funds’ management. Our responsibility is to express an opinion on the Funds’ financial statements based on our audits. We are a public accounting firm registered with the Public Company Accounting Oversight Board (United States) (“PCAOB”) and are required to be independent with respect to the Funds in accordance with the U.S. federal securities law and the applicable rules and regulations of the Securities and Exchange Commission and the PCAOB.
We conducted our audits in accordance with the standards of the PCAOB. Those standards require that we plan and perform the audits to obtain reasonable assurance about whether the financial statements are free of material misstatement, whether due to error or fraud. The Funds are not required to have, nor were we engaged to perform, an audit of their internal control over financial reporting. As part of our audits we are required to obtain an understanding of internal control over financial reporting but not for the purpose of expressing an opinion on the effectiveness of the Funds’ internal control over financial reporting. Accordingly, we express no such opinion.
Our audits included performing procedures to assess the risk of material misstatement of the financial statements, whether due to error or fraud, and performing procedures that respond to those risks. Such procedures included examining, on a test basis, evidence regarding the amounts and disclosures in the financial statements. Our procedures included confirmation of securities owned as of June 30, 2021 by correspondence with the custodian, brokers, or by other appropriate auditing procedures where replies from brokers were not received. Our audits also included evaluating the accounting principles used and significant estimates made by management, as well as evaluating the overall presentation of the financial statements. We believe that our audits provide a reasonable basis for our opinion.
|
|

BBD, LLP
We have served as the auditor of one or more of the Funds in the Trust for Advised Portfolios since 2010.
Philadelphia, Pennsylvania
August 26, 2021
|
Zevenbergen Funds |
|
June 30, 2021 (Unaudited) |
As a shareholder of the Funds, you incur two types of costs: (1) transaction costs, including redemption fees; and (2) ongoing costs, including management fees and other Fund expenses. This Example is intended to help you understand your ongoing costs (in dollars) of investing in the Funds and to compare these costs with the ongoing costs of investing in other mutual funds.
The Example is based on an investment of $1,000 invested at the beginning of the six month period and held for the entire six month period from January 1, 2021 to June 30, 2021 (the “six month period”).
Actual Expenses
The “Actual Fund Return” lines in the table below provide information about actual account values and actual expenses. You may use the information in these lines, together with the amount you invested, to estimate the expenses you paid over the six month period. Simply divide your account value by $1,000 (for example, an $8,600 account value divided by $1,000 equals 8.6), then multiply the result by the number in the corresponding line under the heading entitled “Expenses Paid During the Six Month Period” to estimate the expenses you paid on your account during the six month period.
Hypothetical Example for Comparison Purposes
The information in the table with the lines titled “Hypothetical 5% Return” provides information about hypothetical account values and hypothetical expenses based on the Funds’ actual expense ratios and an assumed rate of return of 5% per year before expenses, which is not the Funds’ actual returns. The hypothetical account values and expenses may not be used to estimate the actual ending account balance or expenses you paid for the six month period. You may use this information to compare the ongoing costs of investing in the Funds and other funds. To do so, compare this 5% hypothetical example with the 5% hypothetical examples that appear in the shareholder reports of the other funds.
Please note that the expenses shown in the table are meant to highlight your ongoing costs only and do not reflect any transaction costs, such as redemption fees. Therefore, the information in the lines titled “Hypothetical 5% Return” is useful in comparing ongoing costs only, and will not help you determine the relative total costs of owning different funds. In addition, if transactional costs were included, your costs would have been higher.
|
Expenses Paid During the Six Month Period |
||||
|
|
Beginning |
Ending |
Annualized |
Expenses Paid |
|
Growth Fund |
|
|
|
|
|
Investor Class |
|
|
|
|
|
Actual Fund Return |
$1,000.00 |
$1,000.70 |
1.30% |
$6.45 |
|
Hypothetical 5% Return |
$1,000.00 |
$1,018.35 |
1.30% |
$6.51 |
|
Institutional Class |
|
|
|
|
|
Actual Fund Return |
$1,000.00 |
$1,002.10 |
1.00% |
$4.96 |
|
Hypothetical 5% Return |
$1,000.00 |
$1,019.84 |
1.00% |
$5.01 |
|
Genea Fund |
|
|
|
|
|
Investor Class |
|
|
|
|
|
Actual Fund Return |
$1,000.00 |
$1,038.10 |
1.30% |
$6.57 |
|
Hypothetical 5% Return |
$1,000.00 |
$1,018.35 |
1.30% |
$6.51 |
|
Institutional Class |
|
|
|
|
|
Actual Fund Return |
$1,000.00 |
$1,039.80 |
1.00% |
$5.06 |
|
Hypothetical 5% Return |
$1,000.00 |
$1,019.84 |
1.00% |
$5.01 |
|
(1) |
Expenses are equal to each of the Funds’ annualized expense ratio as indicated, multiplied by the average account value over the six month period, multiplied by 181/365 (to reflect the “six month period”) |
|
Zevenbergen Funds |
|
Additional Information
|
Form N-Q
The Funds file a complete schedule of portfolio holdings with the U.S. Securities and Exchange Commission (the “SEC”) for the first and third quarters of each fiscal year on Form N-Q or Part F of Form N-PORT (beginning with filings after March 31, 2020). The Funds’ Forms N-Q or Part F of Form N-PORT are available on the SEC’s website at www.sec.gov and may be reviewed and copied at the SEC’s Public Reference Room in Washington, D.C. Information on the operation of the Public Reference Room may be obtained by calling 1-800- SEC-0330.
Proxy Voting
You may obtain a description of the Funds’ proxy voting policy and voting records, without charge, upon request by contacting the Funds directly at 1-844-986-2746 or on the EDGAR Database on the SEC’s website at www.sec.gov. The Funds file their proxy voting records annually as of June 30, with the SEC on Form N-PX. The Funds’ Form N-PX is available without charge by visiting the SEC’s website at www.sec.gov and may be reviewed and copied at the SEC’s Public Reference Room in Washington D.C. You may obtain information on the operation of the Public Reference Room by calling 1-800-SEC-0330.
Tax Information
For the fiscal year ended June 30, 2021, certain dividends paid by the Funds may be subject to a maximum tax rate of 23.8%, as provided for by the Jobs and Growth Tax Relief Reconciliation Act of 2003. The percentage of dividends declared from ordinary income designated as qualified dividend income was as follows:
|
Growth Fund |
0.00% |
|
Genea Fund |
0.00% |
For corporate shareholders, the percent of ordinary income distributions qualifying for the corporate dividends received deduction for the fiscal year ended June 30, 2021, was as follows:
|
Growth Fund |
0.00% |
|
Genea Fund |
0.00% |
The percentage of taxable ordinary income distributions that are designated as short-term capital gain distributions under Internal Revenue Section 871 (k)(2)(C) for each Fund were as follows:
|
Growth Fund |
0.00% |
|
Genea Fund |
0.00% |
|
Zevenbergen Funds |
|
Additional Information (Continued) June 30, 2021 (Unaudited)
|
Statement Regarding Liquidity Risk Management Program
Each Fund has adopted a liquidity risk management program. The Funds’ Board has designated a Liquidity Risk Committee (“Committee”) of the Adviser to serve as the administrator of the program. The Committee conducts the day-to-day operation of the program pursuant to policies and procedures administered by the Committee.
Under the program, the Committee manages each Fund’s liquidity risk, which is the risk that a Fund could not meet shareholder redemption requests without significant dilution of remaining shareholders’ interests in a Fund. This risk is managed by monitoring the degree of liquidity of each Fund’s investments, limiting the amount of each Fund’s illiquid investments, and utilizing various risk management tools and facilities available to each Fund for meeting shareholder redemptions, among other means.
The Funds’ Board reviewed a report prepared by the Committee regarding the operation and effectiveness of the program for the period January 1, 2020 through December 31, 2020. No liquidity events impacting either of the Funds were noted in the report. In addition, the Committee provided its assessment that the program had been effective in managing each Fund’s liquidity risk.
|
Trustees and Officer Information (Unaudited) |
|
|
|
Name, Address |
Position(s) |
Term of |
Principal Occupation(s) |
Number of |
Other |
|
Independent Trustees(4) |
|
|
|
|
|
|
John Chrystal |
Trustee |
Since 2011 |
Insurance Acquisition Corp., Director (February 2019 – present); Founder and Managing Partner of Bent Gate Advisors, LLC, a consulting firm that provided strategic advice and assistance to financial institutions (2009 – 2012) |
2 |
The Bancorp, Inc. (2013 to present), Javelin Mortgage Investments, Inc. (2012 – 2016) |
|
Harry E. Resis |
Trustee |
Since 2012 |
Private investor. Previously served as Director of US Fixed Income for Henderson Global Investors |
2 |
None |
|
Brian S. Ferrie |
Trustee |
Since 2020 |
Chief Compliance Officer, Treasurer, The Jensen Quality Growth Fund (2004 to 2020); Treasurer, Jensen Investment Management (2003 to 2020) |
2 |
None |
|
Wan-Chong Kung |
Trustee |
Since 2020 |
Senior Fund Manager, Nuveen Asset Management (FAF Advisors/First American Funds) (2011 to 2019) |
2 |
None |
|
Interested Trustee(5) |
|
|
|
|
|
|
Christopher E. Kashmerick |
Trustee, Chairman, President and Principal Executive Officer |
Trustee since 2018, Chairman, President and Principal Executive Officer since 2014 |
Senior Vice President, U.S. Bancorp Fund Services, LLC (2011 to present) |
2 |
None |
|
Zevenbergen Funds |
|
Trustees and Officer Information (Unaudited) (Continued) |
|
|
|
Name, Address and Age |
Position(s) Held |
Term of Office(1) and |
Principal Occupation(s) |
|
Officers |
|
|
|
|
Steven J. Jensen |
Vice President, |
Since 2014 |
Senior Vice President, U.S. Bancorp Fund Services, LLC (2011 to present) |
|
Russell B. Simon |
Treasurer and |
Since 2014 |
Vice President, U.S. Bancorp Fund Services, LLC (2011 to present) |
|
Scott A. Resnick |
Secretary |
Since 2019 |
Assistant Vice President, U.S. Bancorp Fund Services, LLC (2018 – present); Associate, Legal & Compliance, PIMCO (2012–2018) |
|
(1) |
Each Trustee serves an indefinite term; however, under the terms of the Board’s retirement policy, a Trustee shall retire at the end of the calendar year in which he or she reaches the age of 75 (this policy does not apply to any Trustee serving at the time the policy was adopted). Each officer serves an indefinite term until the election of a successor. |
|
(2) |
The Trust is comprised of numerous series managed by unaffiliated investment advisers. The term “Fund Complex” applies only to the Funds. The Funds do not hold themselves out as related to any other series within the Trust for purposes of investment and investor services, nor do they share the same investment advisor with any other series. |
|
(3) |
“Other Directorships Held” includes only directorships of companies required to register or file reports with the SEC under the Securities Exchange Act of 1934, as amended, (that is, “public companies”) or other investment companies registered under the 1940 Act. |
|
(4) |
The Trustees of the Trust who are not “interested persons” of the Trust as defined under the 1940 Act (“Independent Trustees”). |
|
(5) |
Mr. Kashmerick is an “interested person” of the Trust as defined by the 1940 Act. Mr. Kashmerick is an interested Trustee of the Trust by virtue of the fact that he is an interested person of U.S. Bancorp Fund Services, LLC, the Funds’ administrator, fund accountant, and transfer agent. |
The Funds’ Statement of Additional Information (“SAI”) includes information about the Funds’ Trustees and is available without charge, upon request, by calling 1-844-986-2746.
The Funds collect non-public information about you from the following sources:
● Information we receive about you on applications or other forms;
● Information you give us orally; and/or
● Information about your transactions with us or others.
We do not disclose any non-public personal information about our customers or former customers without the customer’s authorization, except as permitted by law or in response to inquiries from governmental authorities. We may share information with affiliated and unaffiliated third parties with whom we have contracts for servicing the Funds. We will provide unaffiliated third parties with only the information necessary to carry out their assigned responsibilities. We maintain physical, electronic and procedural safeguards to guard your non-public personal information and require third parties to treat your personal information with the same high degree of confidentiality.
In the event that you hold shares of the Funds through a financial intermediary, including, but not limited to, a broker-dealer, bank, or trust company, the privacy policy of your financial intermediary would govern how your non-public personal information would be shared by those entities with unaffiliated third parties.
Investment Adviser
Zevenbergen Capital Investments LLC
601 Union Street, Suite 4600
Seattle, Washington 98101
Distributor
Quasar Distributors, LLC
111 East Kilbourn Ave. Suite 2200
Milwaukee, Wisconsin 53202
Custodian
U.S. Bank National Association
Custody Operations
1555 North River Center Drive, Suite 302
Milwaukee, Wisconsin 53212
Transfer Agent, Fund Accountant and Fund Administrator
U.S. Bancorp Fund Services, LLC
615 East Michigan Street
Milwaukee, Wisconsin 53202
Independent Registered Public Accounting Firm
BBD, LLP
1835 Market Street, 3rd Floor
Philadelphia, Pennsylvania 19103
Legal Counsel
Morgan, Lewis & Bockius LLP
1111 Pennsylvania Avenue, NW
Washington, DC 20004
This report has been prepared for shareholders and may be distributed to others only if preceded or accompanied by a current prospectus.
|
(b)
|
Not applicable.
|
|
(1)
|
File: A copy of the registrant’s Code of Ethics is filed herewith.
|
(Brian Ferrie) is an “audit committee financial experts” and are considered to be “independent” as each term is defined in Item 3 of Form N‑CSR.
|
FYE 06/30/2021
|
FYE 06/30/2020
|
|
|
( a ) Audit Fees
|
$13,400
|
$13,400
|
|
( b ) Audit-Related Fees
|
None
|
None
|
|
( c ) Tax Fees
|
$2,100
|
$2,100
|
|
( d ) All Other Fees
|
None
|
None
|
|
FYE 06/30/2021
|
FYE 06/30/2020
|
|
|
( a ) Audit Fees
|
$13,400
|
$13,400
|
|
( b ) Audit-Related Fees
|
None
|
None
|
|
( c ) Tax Fees
|
$2,100
|
$2,100
|
|
( d ) All Other Fees
|
None
|
None
|
|
FYE 06/31/2021
|
FYE 06/31/2020
|
|
|
Audit-Related Fees
|
0%
|
0%
|
|
Tax Fees
|
0%
|
0%
|
|
All Other Fees
|
0%
|
0%
|
|
FYE 06/31/2021
|
FYE 06/31/2020
|
|
|
Audit-Related Fees
|
0%
|
0%
|
|
Tax Fees
|
0%
|
0%
|
|
All Other Fees
|
0%
|
0%
|
|
Non-Audit Related Fees
|
FYE 06/30/2021
|
FYE 06/3/2020
|
|
Registrant
|
N/A
|
N/A
|
|
Registrant’s Investment Adviser
|
N/A
|
N/A
|
|
Non-Audit Related Fees
|
FYE 06/30/2021
|
FYE 06/3/2020
|
|
Registrant
|
N/A
|
N/A
|
|
Registrant’s Investment Adviser
|
N/A
|
N/A
|
|
(a)
|
Schedule of Investments is included as part of the report to shareholders filed under Item 1 of this Form.
|
|
(b)
|
Not Applicable
|
|
(a)
|
The Registrant’s President and Treasurer have reviewed the Registrant's disclosure controls and procedures (as defined in Rule 30a-3(c) under the Investment Company Act of 1940 (the “Act”)) as of a date within 90 days of the filing of
this report, as required by Rule 30a-3(b) under the Act and Rules 13a-15(b) or 15d 15(b) under the Securities Exchange Act of 1934. Based on their review, such officers have concluded that the disclosure controls and procedures are
effective in ensuring that information required to be disclosed in this report is appropriately recorded, processed, summarized and reported and made known to them by others within the Registrant and by the Registrant’s service provider.
|
|
(b)
|
There were no changes in the Registrant's internal control over financial reporting (as defined in Rule 30a-3(d) under the Act) that occurred during the period covered by this report that have materially affected, or are reasonably
likely to materially affect, the Registrant's internal control over financial reporting.
|
|
1.
|
HONEST AND ETHICAL CONDUCT.
|
|
2.
|
FINANCIAL RECORDS AND REPORTING
|
|
3.
|
COMPLIANCE WITH LAWS, RULES AND REGULATIONS
|
|
4.
|
COMPLIANCE WITH THIS CODE OF ETHICS
|
|
5.
|
AMENDMENT AND WAIVER
|
| 1. |
I have reviewed this report on Form N-CSR of Trust for Advised Portfolios;
|
| 2. |
Based on my knowledge, this report does not contain any untrue statement of a material fact or omit to state a material fact necessary to make the statements made, in light of the circumstances under which such statements were made, not
misleading with respect to the period covered by this report;
|
| 3. |
Based on my knowledge, the financial statements, and other financial information included in this report, fairly present in all material respects the financial condition, results of operations, changes in net assets, and cash flows (if
the financial statements are required to include a statement of cash flows) of the registrant as of, and for, the periods presented in this report;
|
| 4. |
The registrant’s other certifying officer(s) and I are responsible for establishing and maintaining disclosure controls and procedures (as defined in Rule 30a-3(c) under the Investment Company Act of 1940) and internal control over
financial reporting (as defined in Rule 30a-3(d) under the Investment Company Act of 1940) for the registrant and have:
|
| (a) |
Designed such disclosure controls and procedures, or caused such disclosure controls and procedures to be designed under our supervision, to ensure that material information relating to the registrant, including its consolidated
subsidiaries, is made known to us by others within those entities, particularly during the period in which this report is being prepared;
|
| (b) |
Designed such internal control over financial reporting, or caused such internal control over financial reporting to be designed under our supervision, to provide reasonable assurance regarding the reliability of financial reporting and
the preparation of financial statements for external purposes in accordance with generally accepted accounting principles;
|
| (c) |
Evaluated the effectiveness of the registrant's disclosure controls and procedures and presented in this report our conclusions about the effectiveness of the disclosure controls and procedures, as of a date within 90 days prior to the
filing date of this report based on such evaluation; and
|
| (d) |
Disclosed in this report any change in the registrant’s internal control over financial reporting that occurred during the period covered by this report that has materially affected, or is reasonably likely to materially affect, the
registrant’s internal control over financial reporting; and
|
| 5. |
The registrant’s other certifying officer(s) and I have disclosed to the registrant’s auditors and the audit committee of the registrant’s board of directors (or persons performing the equivalent functions):
|
| (a) |
All significant deficiencies and material weaknesses in the design or operation of internal control over financial reporting which are reasonably likely to adversely affect the registrant’s ability to record, process, summarize, and
report financial information; and
|
| (b) |
Any fraud, whether or not material, that involves management or other employees who have a significant role in the registrant’s internal control over financial reporting.
|
|
Date: September 3, 2021
|
/s/ Christopher E. Kashmerick
Christopher E. Kashmerick, President
|
| 1. |
I have reviewed this report on Form N-CSR of Trust for Advised Portfolios;
|
| 2. |
Based on my knowledge, this report does not contain any untrue statement of a material fact or omit to state a material fact necessary to make the statements made, in light of the circumstances under which such statements were made, not
misleading with respect to the period covered by this report;
|
| 3. |
Based on my knowledge, the financial statements, and other financial information included in this report, fairly present in all material respects the financial condition, results of operations, changes in net assets, and cash flows (if
the financial statements are required to include a statement of cash flows) of the registrant as of, and for, the periods presented in this report;
|
| 4. |
The registrant’s other certifying officer(s) and I are responsible for establishing and maintaining disclosure controls and procedures (as defined in Rule 30a-3(c) under the Investment Company Act of 1940) and internal control over
financial reporting (as defined in Rule 30a-3(d) under the Investment Company Act of 1940) for the registrant and have:
|
| (a) |
Designed such disclosure controls and procedures, or caused such disclosure controls and procedures to be designed under our supervision, to ensure that material information relating to the registrant, including its consolidated
subsidiaries, is made known to us by others within those entities, particularly during the period in which this report is being prepared;
|
| (b) |
Designed such internal control over financial reporting, or caused such internal control over financial reporting to be designed under our supervision, to provide reasonable assurance regarding the reliability of financial reporting and
the preparation of financial statements for external purposes in accordance with generally accepted accounting principles;
|
| (c) |
Evaluated the effectiveness of the registrant’s disclosure controls and procedures and presented in this report our conclusions about the effectiveness of the disclosure controls and procedures, as of a date within 90 days prior to the
filing date of this report based on such evaluation; and
|
| (d) |
Disclosed in this report any change in the registrant’s internal control over financial reporting that occurred during the period covered by this report that has materially affected, or is reasonably likely to materially affect, the
registrant’s internal control over financial reporting; and
|
| 5. |
The registrant’s other certifying officer(s) and I have disclosed to the registrant’s auditors and the audit committee of the registrant’s board of directors (or persons performing the equivalent functions):
|
| (a) |
All significant deficiencies and material weaknesses in the design or operation of internal control over financial reporting which are reasonably likely to adversely affect the registrant’s ability to record, process, summarize, and
report financial information; and
|
| (b) |
Any fraud, whether or not material, that involves management or other employees who have a significant role in the registrant’s internal control over financial reporting.
|
|
Date: September 3, 2021
|
/s/ Russell B. Simon
Russell B. Simon, Treasurer
|
|
/s/ Christopher E. Kashmerick
Christopher E. Kashmerick
President, Trust for Advised Portfolios
|
/s/ Russell B. Simon
Russell B. Simon
Treasurer, Trust for Advised Portfolios
|
|
Dated: September 3, 2021
|
Dated: September 3, 2021
|
Serious News for Serious Traders! Try StreetInsider.com Premium Free!
You May Also Be Interested In
- Partner base continues to grow: Greenman Energy opts for battery-buffered fast chargers from ADS-TEC Energy
- Dassault Aviation: The Rafale enters service in the Croatian Air Force
- Hyatt to Present at Upcoming Investor Conferences
Create E-mail Alert Related Categories
SEC FilingsSign up for StreetInsider Free!
Receive full access to all new and archived articles, unlimited portfolio tracking, e-mail alerts, custom newswires and RSS feeds - and more!
