

Form N-CSR PRUDENTIAL JENNISON NATU For: Oct 31
 Tweet
Tweet Share
ShareUNITED STATES
SECURITIES AND EXCHANGE COMMISSION
Washington, D.C. 20549
FORM N-CSR
CERTIFIED SHAREHOLDER REPORT OF REGISTERED MANAGEMENT INVESTMENT
COMPANIES
| Investment Company Act file number: | 811- 05206 | |
| Exact name of registrant as specified in charter: | Prudential Jennison Natural Resources Fund, Inc. | |
| Address of principal executive offices: | 655 Broad Street, 17th Floor Newark, New Jersey 07102 | |
| Name and address of agent for service: | Andrew R. French 655 Broad Street, 17th Floor Newark, New Jersey 07102 | |
| Registrant’s telephone number, including area code: | 800-225-1852 | |
| Date of fiscal year end: | 10/31/2019 | |
| Date of reporting period: | 10/31/2019 | |
Item 1 – Reports to Stockholders

PGIM JENNISON NATURAL RESOURCES FUND
ANNUAL REPORT
OCTOBER 31, 2019
COMING SOON: PAPERLESS SHAREHOLDER REPORTS
Beginning on January 1, 2021, as permitted by regulations adopted by the Securities and Exchange Commission, paper copies of the Fund’s annual and semiannual shareholder reports will no longer be sent by mail, unless you specifically request paper copies of the reports. Instead, the reports will be made available on the Fund’s website (pgiminvestments.com), and you will be notified by mail each time a report is posted and provided with a website link to access the report.
If you already elected to receive shareholder reports electronically, you will not be affected by this change and you need not take any action. You may elect to receive shareholder reports and other communications from the Fund electronically anytime by contacting your financial intermediary (such as a broker-dealer or bank) or, if you are a direct investor, by calling 1-800-225-1852 or by sending an email request to PGIM Investments at [email protected].
You may elect to receive all future reports in paper free of charge. If you invest through a financial intermediary, you can contact your financial intermediary or follow instructions included with this notice to elect to continue to receive paper copies of your shareholder reports. If you invest directly with the Fund, you can call 1-800-225-1852 or send an email request to [email protected] to let the Fund know you wish to continue receiving paper copies of your shareholder reports. Your election to receive reports in paper will apply to all funds held in your account if you invest through your financial intermediary or all funds held with the fund complex if you invest directly with the Fund.

To enroll in e-delivery, go to pgiminvestments.com/edelivery
| Objective: Long-term growth of capital |
Highlights (unaudited)
| • | Holdings among gold producers were among the main contributors to the Fund’s absolute and relative performance over the reporting period. Positions within diversified metals & mining also helped, along with silver producers. |
| • | Gold miners benefited over the period, as the combination of trade uncertainty, volatility, and investors’ increased appetite for safe-haven assets helped boost gold prices. |
| • | The Fund’s investments in oil & gas exploration & production, as well as oil & gas equipment & services, were among the primary detractors from the Fund’s performance during the period. |
| • | In energy, specifically within oil & gas exploration & production, holdings in Concho Resources, WPX Energy, and EOG Resources underperformed. |
This report is not authorized for distribution to prospective investors unless preceded or accompanied by a current prospectus.
The views expressed in this report and information about the Fund’s portfolio holdings are for the period covered by this report and are subject to change thereafter.
Mutual funds are distributed by Prudential Investment Management Services LLC, member SIPC. Jennison Associates LLC is a registered investment adviser. Both are Prudential Financial companies. © 2019 Prudential Financial, Inc. and its related entities. Jennison Associates, Jennison, PGIM, and the PGIM logo are service marks of Prudential Financial, Inc. and its related entities, registered in many jurisdictions worldwide.
| 2 | Visit our website at pgiminvestments.com |
| 5 | ||||
| 6 | ||||
| 7 | ||||
| 10 | ||||
| 14 | ||||
| 17 | ||||
| PGIM Jennison Natural Resources Fund | 3 |
This Page Intentionally Left Blank

Dear Shareholder:
We hope you find the annual report for the PGIM Jennison Natural Resources Fund informative and useful. The report covers performance for the 12-month period that ended October 31, 2019.
While the US economy remained healthy, with rising corporate profits and strong job growth, the Federal Reserve cut interest rates three times in the latter half of the period. The cuts were a proactive attempt by the Fed to
extend the longest domestic economic expansion on record as growth in many regions weakened. China in particular showed signs of slowing amid trade tensions with the US, and turmoil in the United Kingdom continued as it negotiates an exit from the European Union.
The interest-rate cuts helped boost the performance of stocks globally. For the period overall, large-cap US equities along with stocks in developed and emerging foreign markets all rose by double digits. Small-cap US stocks posted a single-digit gain. This positive performance came despite significant volatility early in the period. Equities plunged at the end of 2018 on concerns about China’s economy, a potential global trade war, higher interest rates, and worries that profit growth might slow. Stocks reversed course early in 2019, rising sharply after the Fed moderated its position on additional rate hikes for the remainder of the year.
The overall US bond market posted strong returns during the period on a significant rally in interest rates that saw the 10-year US Treasury yield decline from over 3% to under 2%. Investment-grade corporate bonds led the way with a double-digit gain, while corporate high yield and municipal bonds each had a return in the high single digits. Globally, bonds in developed markets delivered strong returns, and emerging markets debt rose by double digits.
Regarding your investments with PGIM, we believe it is important to maintain a diversified portfolio of funds consistent with your tolerance for risk, time horizon, and financial goals. Your financial advisor can help you create a diversified investment plan that may include funds covering all the basic asset classes and that reflects your personal investor profile and risk tolerance. However, diversification and asset allocation strategies do not assure a profit or protect against loss in declining markets.
At PGIM Investments, we consider it a great privilege and responsibility to help investors participate in opportunities across global markets while meeting their toughest investment challenges. PGIM is a top-10 global investment manager with more than $1 trillion in assets under management. This scale and investment expertise allow us to deliver actively managed funds and strategies to meet the needs of investors around the globe.
Thank you for choosing our family of funds.
Sincerely,

Stuart S. Parker, President
PGIM Jennison Natural Resources Fund
December 16, 2019
| PGIM Jennison Natural Resources Fund | 5 |
Your Fund’s Performance (unaudited)
Performance data quoted represents past performance. Past performance does not guarantee future results. The investment return and principal value of an investment will fluctuate, so that an investor’s shares, when redeemed, may be worth more or less than their original cost. Current performance may be lower or higher than the past performance data quoted. An investor may obtain performance data as of the most recent month-end by visiting our website at pgiminvestments.com or by calling (800) 225-1852.
| Average Annual Total Returns as of 10/31/19 (with sales charges) |
||||||||||||||
| One Year (%) | Five Years (%) | Ten Years (%) | Since Inception (%) | |||||||||||
| Class A | –15.87 | –9.26 | –3.40 | — | ||||||||||
| Class B | –16.07 | –9.12 | –3.57 | — | ||||||||||
| Class C | –12.39 | –8.85 | –3.52 | — | ||||||||||
| Class R | –11.18 | –8.43 | –3.06 | — | ||||||||||
| Class Z | –10.61 | –7.92 | –2.54 | — | ||||||||||
| Class R6 | –10.54 | –7.79 | N/A | –6.33 (12/27/10) | ||||||||||
| Lipper Global Natural Resources Index |
|
|||||||||||||
| –10.76 | –4.83 | –0.91 | — | |||||||||||
| S&P 500 Index | ||||||||||||||
| 14.31 | 10.77 | 13.69 | — | |||||||||||
| MSCI World Net Dividends (ND) Index |
|
|||||||||||||
| 12.69 | 7.58 | 9.48 | — | |||||||||||
| Average Annual Total Returns as of 10/31/19 (without sales charges) |
||||||||||||||
| One Year (%) | Five Years (%) | Ten Years (%) | Since Inception (%) | |||||||||||
| Class A | –10.97 | –8.23 | –2.85 | — | ||||||||||
| Class B | –11.69 | –8.94 | –3.57 | — | ||||||||||
| Class C | –11.51 | –8.85 | –3.52 | — | ||||||||||
| Class R | –11.18 | –8.43 | –3.06 | — | ||||||||||
| Class Z | –10.61 | –7.92 | –2.54 | — | ||||||||||
| Class R6 | –10.54 | –7.79 | N/A | –6.33 (12/27/10) | ||||||||||
| Lipper Global Natural Resources Index | ||||||||||||||
| –10.76 | –4.83 | –0.91 | — | |||||||||||
| S&P 500 Index | ||||||||||||||
| 14.31 | 10.77 | 13.69 | — | |||||||||||
| MSCI World Net Dividends (ND) Index | ||||||||||||||
| 12.69 | 7.58 | 9.48 | — | |||||||||||
| 6 | Visit our website at pgiminvestments.com |
Growth of a $10,000 Investment (unaudited)
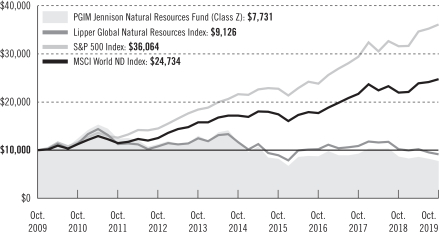
The graph compares a $10,000 investment in the Fund’s Class Z shares with a similar investment in the Lipper Global Natural Resources Index, MSCI World ND Index, and the S&P 500 Index by portraying the initial account values at the beginning of the 10-year period for Class Z shares (October 31, 2009) and the account values at the end of the current fiscal year (October 31, 2019) as measured on a quarterly basis. For purposes of the graph, and unless otherwise indicated, it has been assumed that (a) all recurring fees (including management fees) were deducted; and (b) all dividends and distributions were reinvested. The line graph provides information for Class Z shares only. As indicated in the tables provided earlier, performance for other share classes will vary due to the differing charges and expenses applicable to each share class (as indicated in the following paragraphs). Without waiver of fees and/or expense reimbursements, if any, the Fund’s returns would have been lower.
Past performance does not predict future performance. Total returns and the ending account values in the graph include changes in share price and reinvestment of dividends and capital gains distributions in a hypothetical investment for the periods shown. The Fund’s total returns do not reflect the deduction of income taxes on an individual’s investment. Taxes may reduce your actual investment returns on income or gains paid by the Fund or any gains you may realize if you sell your shares.
Source: PGIM Investments LLC and Lipper Inc.
Since Inception returns are provided for any share class with less than 10 fiscal years of returns. Since Inception returns for the Indexes are measured from the closest month-end to the class’ inception date.
| PGIM Jennison Natural Resources Fund | 7 |
Your Fund’s Performance (continued)
The returns in the tables do not reflect the deduction of taxes that a shareholder would pay on Fund distributions or following the redemption of Fund shares. The average annual total returns take into account applicable sales charges, which are described for each share class in the table below.
| Class A | Class B* | Class C | Class R | Class Z | Class R6 | |||||||
| Maximum initial sales charge | 5.50% of the public offering price | None | None | None | None | None | ||||||
| Contingent deferred sales charge (CDSC) (as a percentage of the lower of the original purchase price or the net asset value at redemption) | 1.00% on sales of $1 million or more made within 12 months of purchase | 5.00% (Yr. 1) 4.00% (Yr. 2) 3.00% (Yr. 3) 2.00% (Yr. 4) 1.00% (Yr. 5) 1.00% (Yr. 6) 0.00% (Yr. 7) | 1.00% on sales made within 12 months of purchase | None | None | None | ||||||
| Annual distribution and service (12b-1) fees (shown as a percentage of average daily net assets) | 0.30% | 1.00% | 1.00% | 0.75% (0.50% currently) | None | None | ||||||
*Class B shares are closed to all purchase activity and no additional Class B shares may be purchased or acquired except by exchange from Class B shares of another Fund or through dividend or capital gains reinvestment.
Benchmark Definitions
Lipper Global Natural Resources Index—The Lipper Global Natural Resources Index (Lipper Index) is an unmanaged index which tracks the performance of the 10 largest global natural resources mutual funds. The average annual total return for the Lipper Index measured from the month-end closest to the inception date of the Fund’s Class R6 shares is –3.75%.
S&P 500 Index—The S&P 500 Index is an unmanaged index of over 500 stocks of large US public companies. It gives a broad look at how stock prices in the United States have performed. The average annual total return for the S&P 500 Index measured from the month-end closest to the inception date of the Fund’s Class R6 shares is 12.81%.
MSCI World Net Dividends Index—The Morgan Stanley Capital International World Net Dividends Index (MSCI World ND Index) is an unmanaged free float-adjusted market capitalization-weighted index that is designed to measure the equity market performance of developed markets. The MSCI World ND Index is unmanaged and the total return includes the reinvestment of all dividends. The ND version of the MSCI World Index reflects the impact of the maximum withholding taxes on reinvested dividends. The average annual total return for the MSCI World ND Index measured from the month-end closest to the inception date of the Fund’s Class R6 shares is 8.70%.
| 8 | Visit our website at pgiminvestments.com |
Investors cannot invest directly in an index or average. The returns for the Indexes would be lower if they included the effects of sales charges, operating expenses of a mutual fund, or taxes.
Presentation of Fund Holdings as of 10/31/19
| Ten Largest Holdings | Line of Business | Country | % of Net Assets | |||
| Agnico Eagle Mines Ltd. | Gold | Canada | 3.7% | |||
| Valero Energy Corp. | Oil & Gas Refining & Marketing | United States | 3.7% | |||
| Anglo American PLC | Diversified Metals & Mining | South Africa | 3.4% | |||
| Barrick Gold Corp. | Gold | Canada | 3.4% | |||
| BP PLC | Integrated Oil & Gas | United Kingdom | 3.0% | |||
| Suncor Energy, Inc. | Integrated Oil & Gas | Canada | 2.9% | |||
| Cheniere Energy, Inc. | Oil & Gas Storage & Transportation | United States | 2.9% | |||
| Diamondback Energy, Inc. | Oil & Gas Exploration & Production | United States | 2.8% | |||
| Lundin Mining Corp. | Copper | Chile | 2.7% | |||
| WPX Energy, Inc. | Oil & Gas Exploration & Production | United States | 2.5% | |||
For a complete list of holdings, please refer to the Schedule of Investments section of this report. Holdings reflect only long-term Investments.
| PGIM Jennison Natural Resources Fund | 9 |
Strategy and Performance Overview (unaudited)
How did the Fund perform?
The PGIM Jennison Natural Resources Fund’s Class Z shares returned -10.61% in the 12-month reporting period that ended October 31, 2019, outperforming the -10.76% return of the Lipper Global Natural Resources Index (the Index).
What was the market environment?
| • | Equity markets were highly volatile during the reporting period. Initially, global economic growth was accelerating; US employment was strengthening; and lower US corporate tax rates were helping to boost wages and capital spending. Given the constructive macroeconomic landscape, investors overlooked uncertainty created by White House trade and other policy initiatives. |
| • | An abrupt sell-off in late 2018 reflected mounting investor concerns about the rising risk of a major trade war with China, the pace of US economic growth, decelerating expansion in non-US economies, US interest rate increases and their effect on US growth, the state of US alliances with other major trading partners, and discord and uncertainty about domestic policy. |
| • | US equity markets rebounded early in 2019 as the Federal Reserve signaled a pause in federal funds rate hikes, but they fell again as the period ended on a re-escalation of trade tension. |
| • | West Texas intermediate (WTI) crude oil and natural gas prices were volatile over the period, declining 20.04% and 21.21%, respectively. The declines came despite September’s drone attacks on key oil facilities in Saudi Arabia that effectively shut down 5.7 million barrels of oil production per day, representing about 5% of the world’s oil supply. Although the news caused oil prices to surge over $5 per barrel, demand fears soon overwhelmed investors’ concerns and sent prices back to pre-attack levels. Natural gas liquids (NGLs) prices such as ethane and propane both dropped over 40% over the period. |
| • | US and China trade issues negatively affected prices for industrial metals, sending zinc, aluminum, steel, and copper down. However, prices gained 44% for nickel, more than 20% for silver and gold, and over 65% for palladium over the period. |
What worked?
| • | Holdings among gold producers were among the main contributors to the Fund’s absolute and relative performance over the reporting period. Positions within diversified metals & mining also helped along with silver producers, which contributed to a lesser extent. |
| • | In materials, specifically within metals & mining: |
| • | Gold miners benefited over the period, as the combination of trade uncertainty, volatility, and investors’ increased appetite for safe-haven assets helped boost gold |
| 10 | Visit our website at pgiminvestments.com |
| prices over 20%. As a result, shares of gold miners Agnico Eagle Mines Ltd., Barrick Gold Corp., and Alacer Gold Corp. all performed well. The metal’s price also was buoyed by central bank buying from Russia, China, and other countries, along with a strong Indian wedding season in the first three months of 2019 that contributed to the outperformance. In addition, industry consolidation helped specific stocks such as Barrick Gold, which acquired Randgold Resources during the period. The combined firm has greater liquidity, a diversified asset base, and an increased production base. Meanwhile, Agnico Eagle Mines outperformed toward the end of the period after its earnings results for the third quarter of 2019 beat consensus estimates and the company raised its dividend by 40%. Agnico generated $100 million in free cash flow during the period, the company’s first free cash flow since embarking on its growth plan in 2017. This trend likely will accelerate as capital expenditures (capex) are set to decline after the firm finished its last project during the third quarter. |
What didn’t work?
| • | The Fund’s investments in oil & gas exploration & production (E&P), as well as oil & gas equipment & services, were among the primary detractors from the Fund’s performance during the reporting period. Oil & gas drilling companies also hurt performance, as the capex budgets and activity levels of these companies were reined in by E&P firms. |
| • | In energy, specifically within oil & gas exploration & production names: |
| • | Shares of Concho Resources Inc. declined during the period amid negative investor sentiment, macroeconomic concerns that could impact demand, and falling commodity prices. Management credibility also took a hit after the company lowered production guidance, deferring well completions into 2020 in order to prioritize capital efficiency. In addition, the company maintained its capex after stating earlier in the period that it would hit capex targets and raise production guidance. The market reacted negatively to the news and the stock price dropped as it became clear that the 2020 inflection in free cash flow would not materialize to the extent management expected. However, at the end of September 2019, the company announced it divested some non-core assets for $925 million and initiated a $1.5 billion stock buyback program, which Jennison viewed as positive developments. |
| • | WPX Energy Inc. underperformed as investors became concerned that slowing global growth would negatively impact energy demand and result in a slowdown in activity for oil & gas E&Ps, such as WPX. In addition, falling WTI crude oil prices, along with sluggish natural gas and NGLs prices, also hampered WPX’s shares. Jennison believes the company’s management team should continue to differentiate itself and could be a relative outperformer versus its energy peers. |
| PGIM Jennison Natural Resources Fund | 11 |
Strategy and Performance Overview (continued)
| • | Shares of EOG Resources Inc. also lagged due to falling oil prices, geopolitical risks, and supply/demand challenges. Additionally, the company missed fourth-quarter 2018 earnings estimates. The company’s oil growth figures also came in below already low expectations, which disappointed investors and weighed on EOG’s share price. |
Current outlook
| • | Portfolio positioning is not a direct expression of Jennison’s view on commodity prices. Jennison positions the strategy not to be dependent on a sharp upturn in crude oil prices, remaining focused on longer-term opportunities and not tactical short-term ones. |
| • | Energy equities reflect skepticism of oil-price sustainability above $55 per barrel and, consequently, investors’ failure to appreciate producers’ more constructive cash-flow and free-cash-flow profile with realized oil prices approaching $60 per barrel. Fundamentally, an oil-market rebalancing was completed by mid-2018, as demand met relatively high expectations and reflected a strong global economy. On the supply front, surging US growth was modestly offset by international production declines resulting from capital flight. In late 2018, however, increased supply from the Organization of Petroleum Exporting Countries (OPEC) and the US, along with global economic weakness, combined to depress oil prices. |
| • | Looking forward, absent any trade war and/or further Iranian import sanctions waivers, demand strength—at least relative to low expectations—in combination with OPEC constraint and international production declines should help accelerate the bottoming and subsequent rebounding of oil prices. This upside would stem from a lack of surplus capacity from some of the world’s largest oil-producing countries. |
| • | Capex fell significantly in the third quarter of 2019, and should remain at this lower level through the end of this year, given the continued slowdown of programs built for last year’s higher oil prices. As a result, Jennison believes that higher-quality producers with respectable growth should begin to realize free cash flow when the price of a barrel of oil approaches the mid-$50 range. Looking ahead into 2020, Jennison expects that compression of multiples and more sustainable dividends should highlight value in the energy sector. |
| • | In industrial metals, emerging economies—especially China—continue to influence demand, and thus are a dominant force in determining prices. Consistent with concerns about China’s slowing economic growth and trade negotiations, recent manufacturing data both from the US and globally has generally been poor. Jennison continues to expect Chinese government policy to ultimately conform to the country’s wider economic goals via various forms of stimulus. If so, Jennison believes most commodities—especially copper—should find support, particularly if electric vehicles (EVs) maintain traction. Since many of the easily exploited sources of industrial metals |
| 12 | Visit our website at pgiminvestments.com |
| having long been tapped, the Fund’s investments focus on the producers with the largest and most productive reserves and, in many cases, strong free-cash-flow profiles. EVs and natural resources like lithium, cobalt, copper, and zinc should support demand for some of these metals. |
| • | Only a handful of gold companies can meaningfully increase production while constraining costs, or even keep production flat at improving costs and ore grades. As such, the Fund is focused on large-to-midsize gold producers that can either meaningfully increase or widen margins with cost constraint. Conversely, Jennison eliminated companies during the period that appeared most susceptible to development risk and margin compression as input costs rise and bullion prices fall. |
| • | Jennison modestly lowered the Fund’s positions in the chemicals industry during the period for valuation and company-specific reasons, as well as due to the slowing global economy. Warranting some participation, the chemicals industry adds important diversification as a hedge against the risk that oil-price stability may be eroded should various OPEC/non-OPEC countries, namely Saudi Arabia and Russia, add production volume over and above US shale oil production. |
The percentage points shown in the tables below identify each security’s positive or negative contribution to the Fund’s return, which is the sum of all contributions by individual holdings during the Fund’s reporting period.
| Top Contributors (%) | Top Detractors (%) | |||||
| Agnico Eagle Mines | 1.64 | Concho Resources | –1.86 | |||
| Barrick Gold | 0.89 | WPX Energy | –1.22 | |||
| Alacer Gold | 0.77 | EOG Resources | –1.15 | |||
| Anglo American | 0.67 | Range Resources | –1.02 | |||
| Anadarko Petroleum | 0.67 | Schlumberger | –0.81 | |||
| PGIM Jennison Natural Resources Fund | 13 |
As a shareholder of the Fund, you incur two types of costs: (1) transaction costs, including sales charges (loads) on purchase payments and redemptions, as applicable, and (2) ongoing costs, including management fees, distribution and/or service (12b-1) fees, and other Fund expenses, as applicable. This example is intended to help you understand your ongoing costs (in dollars) of investing in the Fund and to compare these costs with the ongoing costs of investing in other mutual funds.
The example is based on an investment of $1,000 held through the six-month period ended October 31, 2019. The example is for illustrative purposes only; you should consult the Prospectus for information on initial and subsequent minimum investment requirements.
Actual Expenses
The first line for each share class in the table on the following page provides information about actual account values and actual expenses. You may use the information on this line, together with the amount you invested, to estimate the expenses that you paid over the period. Simply divide your account value by $1,000 (for example, an $8,600 account value ÷ $1,000 = 8.6), then multiply the result by the number on the first line under the heading “Expenses Paid During the Six-Month Period” to estimate the expenses you paid on your account during this period.
Hypothetical Example for Comparison Purposes
The second line for each share class in the table on the following page provides information about hypothetical account values and hypothetical expenses based on the Fund’s actual expense ratio and an assumed rate of return of 5% per year before expenses, which is not the Fund’s actual return. The hypothetical account values and expenses may not be used to estimate the actual ending account balance or expenses you paid for the period. You may use this information to compare the ongoing costs of investing in the Fund and other funds. To do so, compare this 5% hypothetical example with the 5% hypothetical examples that appear in the shareholder reports of the other funds.
The Fund’s transfer agent may charge additional fees to holders of certain accounts that are not included in the expenses shown in the table on the following page. These fees apply to individual retirement accounts (IRAs) and Section 403(b) accounts. As of the close of the six-month period covered by the table, IRA fees included an annual maintenance fee of $15 per account (subject to a maximum annual maintenance fee of $25 for all accounts held by the same shareholder). Section 403(b) accounts are charged an annual $25 fiduciary maintenance fee. Some of the fees may vary in amount, or may be waived, based on your total account balance or the number of PGIM funds, including the Fund, that you own. You should consider the additional fees that were charged to your Fund account over the six-month period when you estimate the total ongoing expenses paid over the
| 14 | Visit our website at pgiminvestments.com |
period and the impact of these fees on your ending account value, as these additional expenses are not reflected in the information provided in the expense table. Additional fees have the effect of reducing investment returns.
Please note that the expenses shown in the table are meant to highlight your ongoing costs only and do not reflect any transactional costs such as sales charges (loads). Therefore, the second line for each share class in the table is useful in comparing ongoing costs only and will not help you determine the relative total costs of owning different funds. In addition, if these transactional costs were included, your costs would have been higher.
|
PGIM Resources Fund |
Beginning Account Value May 1, 2019 |
Ending Account Value October 31, 2019 |
Annualized Expense Ratio Based on the Six-Month Period |
Expenses Paid During the Six-Month Period* |
||||||||||||||
| Class A | Actual | $ | 1,000.00 | $ | 893.80 | 1.35 | % | $ | 6.44 | |||||||||
| Hypothetical | $ | 1,000.00 | $ | 1,018.40 | 1.35 | % | $ | 6.87 | ||||||||||
| Class B | Actual | $ | 1,000.00 | $ | 890.10 | 2.19 | % | $ | 10.43 | |||||||||
| Hypothetical | $ | 1,000.00 | $ | 1,014.17 | 2.19 | % | $ | 11.12 | ||||||||||
| Class C | Actual | $ | 1,000.00 | $ | 891.30 | 1.96 | % | $ | 9.34 | |||||||||
| Hypothetical | $ | 1,000.00 | $ | 1,015.32 | 1.96 | % | $ | 9.96 | ||||||||||
| Class R | Actual | $ | 1,000.00 | $ | 892.90 | 1.58 | % | $ | 7.54 | |||||||||
| Hypothetical | $ | 1,000.00 | $ | 1,017.24 | 1.58 | % | $ | 8.03 | ||||||||||
| Class Z | Actual | $ | 1,000.00 | $ | 895.80 | 0.89 | % | $ | 4.25 | |||||||||
| Hypothetical | $ | 1,000.00 | $ | 1,020.72 | 0.89 | % | $ | 4.53 | ||||||||||
| Class R6 | Actual | $ | 1,000.00 | $ | 895.80 | 0.89 | % | $ | 4.25 | |||||||||
| Hypothetical | $ | 1,000.00 | $ | 1,020.72 | 0.89 | % | $ | 4.53 | ||||||||||
*Fund expenses (net of fee waivers or subsidies, if any) for each share class are equal to the annualized expense ratio for each share class (provided in the table), multiplied by the average account value over the period, multiplied by the 184 days in the six-month period ended October 31, 2019, and divided by the 365 days in the Fund’s fiscal year ended October 31, 2019 (to reflect the six-month period). Expenses presented in the table include the expenses of any underlying portfolios in which the Fund may invest.
| PGIM Jennison Natural Resources Fund | 15 |
Schedule of Investments
as of October 31, 2019
| Description | Shares | Value | ||||||
| LONG-TERM INVESTMENTS 98.2% |
||||||||
| COMMON STOCKS |
||||||||
| Aluminum 1.3% |
||||||||
| Constellium SE* |
636,850 | $ | 8,489,210 | |||||
| Copper 8.3% |
||||||||
| ERO Copper Corp. (Canada)*(a) |
656,814 | 8,208,305 | ||||||
| First Quantum Minerals Ltd. (Zambia) |
906,766 | 7,662,520 | ||||||
| Freeport-McMoRan, Inc. |
377,185 | 3,703,957 | ||||||
| Lundin Mining Corp. (Chile) |
3,581,678 | 18,083,789 | ||||||
| OZ Minerals Ltd. (Australia) |
651,702 | 4,520,702 | ||||||
| Southern Copper Corp. (Peru) |
363,878 | 12,946,779 | ||||||
|
|
|
|||||||
| 55,126,052 | ||||||||
| Diversified Metals & Mining 6.5% |
||||||||
| Anglo American PLC (South Africa) |
866,662 | 22,318,947 | ||||||
| BHP Group Ltd. (Australia), ADR(a) |
339,499 | 16,604,896 | ||||||
| Teck Resources Ltd. (Canada) (Class B Stock) |
249,946 | 3,956,645 | ||||||
|
|
|
|||||||
| 42,880,488 | ||||||||
| Electric Utilities 0.3% |
||||||||
| Orsted A/S (Denmark), ADR |
70,647 | 2,088,325 | ||||||
| Electrical Components & Equipment 2.5% |
||||||||
| GrafTech International Ltd.(a) |
660,844 | 7,982,995 | ||||||
| Sunrun, Inc.*(a) |
563,285 | 8,753,449 | ||||||
|
|
|
|||||||
| 16,736,444 | ||||||||
| Fertilizers & Agricultural Chemicals 4.3% |
||||||||
| CF Industries Holdings, Inc. |
93,551 | 4,242,538 | ||||||
| FMC Corp. |
134,416 | 12,299,064 | ||||||
| Nutrien Ltd. (Canada) |
254,215 | 12,148,935 | ||||||
|
|
|
|||||||
| 28,690,537 | ||||||||
| Gold 10.5% |
||||||||
| Agnico Eagle Mines Ltd. (Canada)(a) |
398,587 | 24,501,143 | ||||||
| Alacer Gold Corp.* |
1,175,147 | 5,817,294 | ||||||
| Algold Resources Ltd. (Canada)* |
4,379 | 416 | ||||||
| Axmin, Inc. (Canada)* |
666,158 | 192,195 | ||||||
See Notes to Financial Statements.
| PGIM Jennison Natural Resources Fund | 17 |
Schedule of Investments (continued)
as of October 31, 2019
| Description | Shares | Value | ||||||
| COMMON STOCKS (Continued) |
||||||||
| Gold (cont’d.) |
||||||||
| Barrick Gold Corp. (Canada) |
1,283,651 | $ | 22,284,181 | |||||
| Newmont Goldcorp Corp. |
417,619 | 16,592,003 | ||||||
|
|
|
|||||||
| 69,387,232 | ||||||||
| Heavy Electrical Equipment 0.5% |
||||||||
| TPI Composites, Inc.*(a) |
159,049 | 3,265,276 | ||||||
| Industrial Gases 1.5% |
||||||||
| Linde PLC (United Kingdom) |
50,399 | 9,996,642 | ||||||
| Industrial Machinery 0.9% |
||||||||
| Chart Industries, Inc.* |
103,569 | 6,072,250 | ||||||
| Integrated Oil & Gas 14.3% |
||||||||
| BP PLC (United Kingdom), ADR |
529,533 | 20,074,596 | ||||||
| Chevron Corp. |
113,317 | 13,160,636 | ||||||
| Equinor ASA (Norway), ADR(a) |
607,305 | 11,241,216 | ||||||
| Royal Dutch Shell PLC (Netherlands) (Class A Stock) |
568,386 | 16,437,871 | ||||||
| Suncor Energy, Inc. (Canada) |
654,669 | 19,437,123 | ||||||
| TOTAL SA (France), ADR(a) |
271,472 | 14,287,571 | ||||||
|
|
|
|||||||
| 94,639,013 | ||||||||
| Multi-Utilities 1.1% |
||||||||
| RWE AG (Germany) |
246,574 | 7,514,020 | ||||||
| Oil & Gas Equipment & Services 8.1% |
||||||||
| Baker Hughes Co. |
384,200 | 8,221,880 | ||||||
| Cactus, Inc. (Class A Stock)* |
262,010 | 7,786,937 | ||||||
| Dril-Quip, Inc.* |
70,344 | 2,885,511 | ||||||
| National Energy Services Reunited Corp.*(a) |
634,556 | 4,384,782 | ||||||
| ProPetro Holding Corp.* |
352,247 | 2,729,914 | ||||||
| Schlumberger Ltd. |
324,049 | 10,593,162 | ||||||
| TechnipFMC PLC (United Kingdom) |
838,868 | 16,550,866 | ||||||
|
|
|
|||||||
| 53,153,052 | ||||||||
| Oil & Gas Exploration & Production 18.8% |
||||||||
| Brigham Minerals, Inc. (Class A Stock)(a) |
209,210 | 3,993,819 | ||||||
| Concho Resources, Inc. |
137,815 | 9,305,269 | ||||||
| ConocoPhillips |
224,270 | 12,379,704 | ||||||
| Diamondback Energy, Inc. |
215,548 | 18,485,397 | ||||||
| EOG Resources, Inc. |
190,029 | 13,170,910 | ||||||
See Notes to Financial Statements.
| 18 |
| Description | Shares | Value | ||||||
| COMMON STOCKS (Continued) |
||||||||
| Oil & Gas Exploration & Production (cont’d.) |
||||||||
| Kosmos Energy Ltd. (Ghana) |
1,542,157 | $ | 9,561,373 | |||||
| Lundin Petroleum AB (Sweden) |
222,196 | 7,344,244 | ||||||
| Noble Energy, Inc. |
702,174 | 13,523,871 | ||||||
| Parsley Energy, Inc. (Class A Stock) |
918,410 | 14,520,062 | ||||||
| Pioneer Natural Resources Co. |
41,051 | 5,050,094 | ||||||
| Sintana Energy, Inc. (Canada)* |
637,992 | 58,127 | ||||||
| Sintana Energy, Inc. (Canada), Reg D* |
1,304,999 | 118,898 | ||||||
| WPX Energy, Inc.* |
1,673,426 | 16,700,791 | ||||||
|
|
|
|||||||
| 124,212,559 | ||||||||
| Oil & Gas Refining & Marketing 5.8% |
||||||||
| Marathon Petroleum Corp. |
220,648 | 14,110,439 | ||||||
| Valero Energy Corp. |
250,215 | 24,265,851 | ||||||
|
|
|
|||||||
| 38,376,290 | ||||||||
| Oil & Gas Storage & Transportation 7.6% |
||||||||
| Cheniere Energy, Inc.* |
305,803 | 18,822,175 | ||||||
| Kinder Morgan, Inc. |
794,266 | 15,869,435 | ||||||
| Targa Resources Corp. |
393,721 | 15,307,872 | ||||||
|
|
|
|||||||
| 49,999,482 | ||||||||
| Precious Metals & Minerals 0.6% |
||||||||
| Osisko Mining, Inc. (Canada)*(a) |
1,853,044 | 3,925,285 | ||||||
| Sedibelo Platinum Mines Ltd. (South Africa) Private Placement |
523,100 | — | ||||||
|
|
|
|||||||
| 3,925,285 | ||||||||
| Renewable Electricity 2.2% |
||||||||
| NextEra Energy Partners LP |
202,247 | 10,658,417 | ||||||
| Sunnova Energy International, Inc.*(a) |
362,555 | 3,850,334 | ||||||
|
|
|
|||||||
| 14,508,751 | ||||||||
| Semiconductors 1.2% |
||||||||
| First Solar, Inc.*(a) |
147,903 | 7,659,896 | ||||||
| Silver 0.9% |
||||||||
| Wheaton Precious Metals Corp. (Canada)(a) |
203,241 | 5,704,975 | ||||||
See Notes to Financial Statements.
| PGIM Jennison Natural Resources Fund | 19 |
Schedule of Investments (continued)
as of October 31, 2019
| Description | Shares | Value | ||||||
| COMMON STOCKS (Continued) |
||||||||
| Specialized REITs 1.0% |
||||||||
| Weyerhaeuser Co., REIT |
231,946 | $ | 6,775,143 | |||||
|
|
|
|||||||
| TOTAL LONG-TERM INVESTMENTS |
649,200,922 | |||||||
|
|
|
|||||||
| SHORT-TERM INVESTMENTS 8.3% |
| |||||||
| AFFILIATED MUTUAL FUNDS |
||||||||
| PGIM Core Ultra Short Bond Fund(w) |
13,019,841 | 13,019,841 | ||||||
| PGIM Institutional Money Market Fund |
41,532,482 | 41,540,789 | ||||||
|
|
|
|||||||
| TOTAL SHORT-TERM INVESTMENTS |
54,560,630 | |||||||
|
|
|
|||||||
| TOTAL INVESTMENTS 106.5% |
703,761,552 | |||||||
| Liabilities in excess of other assets (6.5)% |
(43,036,403 | ) | ||||||
|
|
|
|||||||
| NET ASSETS 100.0% |
$ | 660,725,149 | ||||||
|
|
|
|||||||
Below is a list of the abbreviation(s) used in the annual report:
ADR—American Depositary Receipt
LIBOR—London Interbank Offered Rate
Reg D—Security was purchased pursuant to Regulation D under the Securities Act of 1933, providing exemption from the registration requirements. Unless otherwise noted, Regulation D securities are deemed to be liquid.
REITs—Real Estate Investment Trust
| * | Non-income producing security. |
| ^ | Indicates a Level 3 security. The aggregate value of Level 3 securities is $0 and 0.0% of net assets. |
| (a) | All or a portion of security is on loan. The aggregate market value of such securities, including those sold and pending settlement, is $39,754,087; cash collateral of $41,461,120 (included in liabilities) was received with which the Fund purchased highly liquid short-term investments. |
| (b) | Represents security purchased with cash collateral received for securities on loan and includes dividend reinvestment. |
| (f) | Indicates a restricted security; the aggregate original cost of such securities is $4,469,143. The aggregate value of $0 is 0.0% of net assets. |
| (w) | PGIM Investments LLC, the manager of the Fund, also serves as manager of the PGIM Core Ultra Short Bond Fund and PGIM Institutional Money Market Fund. |
Fair Value Measurements:
Various inputs are used in determining the value of the Fund’s investments. These inputs are summarized in the three broad levels listed below.
Level 1—unadjusted quoted prices generally in active markets for identical securities.
See Notes to Financial Statements.
| 20 |
Level 2—quoted prices for similar securities, interest rates and yield curves, prepayment speeds, foreign currency exchange rates and other observable inputs.
Level 3—unobservable inputs for securities valued in accordance with Board approved fair valuation procedures.
The following is a summary of the inputs used as of October 31, 2019 in valuing such portfolio securities:
| Level 1 | Level 2 | Level 3 | ||||||||||
| Investments in Securities |
||||||||||||
| Assets |
||||||||||||
| Common Stocks |
||||||||||||
| Aluminum |
$ | 8,489,210 | $ | — | $ | — | ||||||
| Copper |
50,605,350 | 4,520,702 | — | |||||||||
| Diversified Metals & Mining |
20,561,541 | 22,318,947 | — | |||||||||
| Electric Utilities |
2,088,325 | — | — | |||||||||
| Electrical Components & Equipment |
16,736,444 | — | — | |||||||||
| Fertilizers & Agricultural Chemicals |
28,690,537 | — | — | |||||||||
| Gold |
69,195,037 | 192,195 | — | |||||||||
| Heavy Electrical Equipment |
3,265,276 | — | — | |||||||||
| Industrial Gases |
9,996,642 | — | — | |||||||||
| Industrial Machinery |
6,072,250 | — | — | |||||||||
| Integrated Oil & Gas |
78,201,142 | 16,437,871 | — | |||||||||
| Multi-Utilities |
— | 7,514,020 | — | |||||||||
| Oil & Gas Equipment & Services |
53,153,052 | — | — | |||||||||
| Oil & Gas Exploration & Production |
116,868,315 | 7,344,244 | — | |||||||||
| Oil & Gas Refining & Marketing |
38,376,290 | — | — | |||||||||
| Oil & Gas Storage & Transportation |
49,999,482 | — | — | |||||||||
| Precious Metals & Minerals |
3,925,285 | — | — | |||||||||
| Renewable Electricity |
14,508,751 | — | — | |||||||||
| Semiconductors |
7,659,896 | — | — | |||||||||
| Silver |
5,704,975 | — | — | |||||||||
| Specialized REITs |
6,775,143 | — | — | |||||||||
| Affiliated Mutual Funds |
54,560,630 | — | — | |||||||||
|
|
|
|
|
|
|
|||||||
| Total |
$ | 645,433,573 | $ | 58,327,979 | $ | — | ||||||
|
|
|
|
|
|
|
|||||||
Country Allocation:
The country allocation of portfolio holdings and liabilities in excess of other assets shown as a percentage of net assets as of October 31, 2019 were as follows (unaudited):
| United States (including 6.3% of collateral for securities on loan) |
61.6 | % | ||
| Canada |
15.1 | |||
| United Kingdom |
7.0 | |||
| South Africa |
3.4 | |||
| Australia |
3.2 | |||
| Chile |
2.7 | |||
| Netherlands |
2.5 | |||
| France |
2.2 | |||
| Peru |
1.9 | |||
| Norway |
1.7 | % | ||
| Ghana |
1.5 | |||
| Zambia |
1.2 | |||
| Germany |
1.1 |
See Notes to Financial Statements.
| PGIM Jennison Natural Resources Fund | 21 |
Schedule of Investments (continued)
as of October 31, 2019
| Country Allocation (continued): |
||||
| Sweden |
1.1 | % | ||
| Denmark |
0.3 | |||
|
|
|
|||
| 106.5 | ||||
| Liabilities in excess of other assets |
(6.5 | ) | ||
|
|
|
|||
| 100.0 | % | |||
|
|
|
|||
Financial Instruments/Transactions—Summary of Offsetting and Netting Arrangements:
The Fund entered into financial instruments/transactions during the reporting period that are either offset in accordance with current requirements or are subject to enforceable master netting arrangements or similar agreements that permit offsetting. The information about offsetting and related netting arrangements for financial instruments/transactions where the legal right to set-off exists is presented in the summary below.
Offsetting of financial instrument/transaction assets and liabilities:
| Description |
Gross Market Value of Recognized Assets/(Liabilities) |
Collateral Pledged/(Received)(1) |
Net Amount | |||||||||
| Securities on Loan |
$ | 39,754,087 | $ | (39,754,087 | ) | $ | — | |||||
|
|
|
|||||||||||
| (1) | Collateral amount disclosed by the Fund is limited to the market value of financial instruments/transactions. |
See Notes to Financial Statements.
| 22 |
Statement of Assets and Liabilities
as of October 31, 2019
| Assets |
||||
| Investments at value, including securities on loan of $39,754,087: |
||||
| Unaffiliated investments (cost $577,816,172) |
$ | 649,200,922 | ||
| Affiliated investments (cost $54,552,840) |
54,560,630 | |||
| Receivable for Fund shares sold |
924,914 | |||
| Dividends receivable |
666,929 | |||
| Tax reclaim receivable |
223,884 | |||
| Prepaid expenses and other assets |
42,950 | |||
|
|
|
|||
| Total Assets |
705,620,229 | |||
|
|
|
|||
| Liabilities |
||||
| Payable to broker for collateral for securities on loan |
41,461,120 | |||
| Payable for Fund shares reacquired |
2,542,300 | |||
| Management fee payable |
421,687 | |||
| Accrued expenses and other liabilities |
296,259 | |||
| Distribution fee payable |
115,132 | |||
| Affiliated transfer agent fee payable |
58,582 | |||
|
|
|
|||
| Total Liabilities |
44,895,080 | |||
|
|
|
|||
| Net Assets |
$ | 660,725,149 | ||
|
|
|
|||
| Net assets were comprised of: |
||||
| Common stock, at par |
$ | 224,504 | ||
| Paid-in capital in excess of par |
1,221,148,373 | |||
| Total distributable earnings (loss) |
(560,647,728 | ) | ||
|
|
|
|||
| Net assets, October 31, 2019 |
$ | 660,725,149 | ||
|
|
|
|||
See Notes to Financial Statements.
| PGIM Jennison Natural Resources Fund | 23 |
Statement of Assets and Liabilities
as of October 31, 2019
| Class A |
||||
| Net asset value and redemption price per share, |
$ | 29.28 | ||
| Maximum sales charge (5.50% of offering price) |
1.70 | |||
|
|
|
|||
| Maximum offering price to public |
$ | 30.98 | ||
|
|
|
|||
| Class B |
||||
| Net asset value, offering price and redemption price per share, |
||||
| ($2,193,075 ÷ 94,016 shares of common stock issued and outstanding) |
$ | 23.33 | ||
|
|
|
|||
| Class C |
||||
| Net asset value, offering price and redemption price per share, |
||||
| ($39,853,225 ÷ 1,705,496 shares of common stock issued and outstanding) |
$ | 23.37 | ||
|
|
|
|||
| Class R |
||||
| Net asset value, offering price and redemption price per share, |
||||
| ($25,050,336 ÷ 871,345 shares of common stock issued and outstanding) |
$ | 28.75 | ||
|
|
|
|||
| Class Z |
||||
| Net asset value, offering price and redemption price per share, |
||||
| ($296,535,353 ÷ 9,683,691 shares of common stock issued and outstanding) |
$ | 30.62 | ||
|
|
|
|||
| Class R6 |
||||
| Net asset value, offering price and redemption price per share, |
||||
| ($29,607,383 ÷ 959,683 shares of common stock issued and outstanding) |
$ | 30.85 | ||
|
|
|
|||
See Notes to Financial Statements.
| 24 |
Statement of Operations
Year Ended October 31, 2019
| Net Investment Income (Loss) |
||||
| Income |
||||
| Unaffiliated dividend income (net of $773,350 foreign withholding tax) |
$ | 22,855,275 | ||
| Affiliated dividend income |
591,008 | |||
| Income from securities lending, net (including affiliated income of $116,303) |
201,489 | |||
|
|
|
|||
| Total income |
23,647,772 | |||
|
|
|
|||
| Expenses |
||||
| Management fee |
6,384,747 | |||
| Distribution fee(a) |
1,898,878 | |||
| Transfer agent’s fees and expenses (including affiliated expense of $370,699)(a) |
1,451,324 | |||
| Shareholders’ reports |
157,330 | |||
| Custodian and accounting fees |
126,059 | |||
| Registration fees(a) |
106,569 | |||
| Directors’ fees |
26,360 | |||
| Legal fees and expenses |
25,495 | |||
| Audit fee |
24,596 | |||
| Miscellaneous |
47,553 | |||
|
|
|
|||
| Total expenses |
10,248,911 | |||
| Less: Fee waiver and/or expense reimbursement(a) |
(38,306 | ) | ||
| Distribution fee waiver(a) |
(77,006 | ) | ||
|
|
|
|||
| Net expenses |
10,133,599 | |||
|
|
|
|||
| Net investment income (loss) |
13,514,173 | |||
|
|
|
|||
| Realized And Unrealized Gain (Loss) On Investment And Foreign Currency Transactions |
||||
| Net realized gain (loss) on: |
||||
| Investment transactions (including affiliated of $10,720) |
(48,476,430 | ) | ||
| Foreign currency transactions |
(136,055 | ) | ||
|
|
|
|||
| (48,612,485 | ) | |||
|
|
|
|||
| Net change in unrealized appreciation (depreciation) on: |
||||
| Investments (including affiliated of $1,932) |
(67,582,969 | ) | ||
| Foreign currencies |
50 | |||
|
|
|
|||
| (67,582,919 | ) | |||
|
|
|
|||
| Net gain (loss) on investment and foreign currency transactions |
(116,195,404 | ) | ||
|
|
|
|||
| Net Increase (Decrease) In Net Assets Resulting From Operations |
$ | (102,681,231 | ) | |
|
|
|
|||
| (a) | Class specific expenses and waivers were as follows: |
| Class A | Class B | Class C | Class R | Class Z | Class R6 | |||||||||||||||||||
| Distribution fee |
906,899 | 36,950 | 724,012 | 231,017 | — | — | ||||||||||||||||||
| Transfer agent’s fees and expenses |
739,836 | 38,034 | 126,074 | 75,827 | 468,223 | 3,330 | ||||||||||||||||||
| Registration fees |
17,344 | 14,824 | 15,110 | 14,872 | 23,208 | 21,211 | ||||||||||||||||||
| Fee waiver and/or expense reimbursement |
— | (38,306 | ) | — | — | — | — | |||||||||||||||||
| Distribution fee waiver |
— | — | — | (77,006 | ) | — | — | |||||||||||||||||
See Notes to Financial Statements.
| PGIM Jennison Natural Resources Fund | 25 |
Statements of Changes in Net Assets
| Year Ended October 31, | ||||||||
| 2019 | 2018 | |||||||
| Increase (Decrease) in Net Assets |
||||||||
| Operations |
||||||||
| Net investment income (loss) |
$ | 13,514,173 | $ | 12,322,555 | ||||
| Net realized gain (loss) on investment and foreign currency transactions |
(48,612,485 | ) | 76,698,003 | |||||
| Net change in unrealized appreciation (depreciation) on investments and foreign currencies |
(67,582,919 | ) | (157,069,520 | ) | ||||
|
|
|
|
|
|||||
| Net increase (decrease) in net assets resulting from operations |
(102,681,231 | ) | (68,048,962 | ) | ||||
|
|
|
|
|
|||||
| Dividends and Distributions |
||||||||
| Distributions from distributable earnings |
||||||||
| Class A |
(4,465,964 | ) | — | |||||
| Class B |
(37,837 | ) | — | |||||
| Class C |
(1,126,678 | ) | — | |||||
| Class R |
(370,166 | ) | — | |||||
| Class Z |
(8,822,129 | ) | — | |||||
| Class R6 |
(878,853 | ) | — | |||||
|
|
|
|
|
|||||
| (15,701,627 | ) | — | ||||||
|
|
|
|
|
|||||
| Fund share transactions (Net of share conversions) |
||||||||
| Net proceeds from shares sold |
151,089,563 | 221,593,821 | ||||||
| Net asset value of shares issued in reinvestment of dividends and distributions |
13,689,597 | — | ||||||
| Cost of shares reacquired |
(482,228,804 | ) | (592,547,512 | ) | ||||
|
|
|
|
|
|||||
| Net increase (decrease) in net assets from Fund share transactions |
(317,449,644 | ) | (370,953,691 | ) | ||||
|
|
|
|
|
|||||
| Total increase (decrease) |
(435,832,502 | ) | (439,002,653 | ) | ||||
| Net Assets: |
||||||||
| Beginning of year |
1,096,557,651 | 1,535,560,304 | ||||||
|
|
|
|
|
|||||
| End of year |
$ | 660,725,149 | $ | 1,096,557,651 | ||||
|
|
|
|
|
|||||
See Notes to Financial Statements.
| 26 |
Notes to Financial Statements
Prudential Jennison Natural Resources Fund, Inc. (the “Company”) is registered under the Investment Company Act of 1940, as amended (“1940 Act”), as an open-end management investment company for purposes of the 1940 Act. PGIM Jennison Natural Resources Fund (the “Fund”) is the only series in the Company. The Fund is a non-diversified fund for the purpose of the 1940 Act.
The investment objective of the Fund is long-term growth of capital.
1. Accounting Policies
The Fund follows the investment company accounting and reporting guidance of the Financial Accounting Standards Board (“FASB”) Accounting Standard Codification (“ASC”) Topic 946 Financial Services—Investment Companies. The following accounting policies conform to U.S. generally accepted accounting principles. The Fund consistently follows such policies in the preparation of its financial statements.
Securities Valuation: The Fund holds securities and other assets and liabilities that are fair valued at the close of each day (generally, 4:00 PM Eastern time) the New York Stock Exchange (“NYSE”) is open for trading. Fair value is the price that would be received to sell an asset or paid to transfer a liability in an orderly transaction between market participants on the measurement date. The Company’s Board of Directors (the “Board”) has adopted valuation procedures for security valuation under which fair valuation responsibilities have been delegated to PGIM Investments LLC (“PGIM Investments” or the “Manager”). Pursuant to the Board’s delegation, the Manager has established a Valuation Committee responsible for supervising the fair valuation of portfolio securities and other assets and liabilities. The valuation procedures permit the Fund to utilize independent pricing vendor services, quotations from market makers, and alternative valuation methods when market quotations are either not readily available or not deemed representative of fair value. A record of the Valuation Committee’s actions is subject to the Board’s review, approval, and ratification at its next regularly scheduled quarterly meeting.
For the fiscal reporting year-end, securities and other assets and liabilities were fair valued at the close of the last U.S. business day. Trading in certain foreign securities may occur when the NYSE is closed (including weekends and holidays). Because such foreign securities trade in markets that are open on weekends and U.S. holidays, the values of some of the Fund’s foreign investments may change on days when investors cannot purchase or redeem Fund shares.
Various inputs determine how the Fund’s investments are valued, all of which are categorized according to the three broad levels (Level 1, 2, or 3) detailed in the Schedule of
| PGIM Jennison Natural Resources Fund | 27 |
Notes to Financial Statements (continued)
Investments and referred to herein as the “fair value hierarchy” in accordance with FASB ASC Topic 820—Fair Value Measurements and Disclosures.
Common and preferred stocks, exchange-traded funds, and derivative instruments, such as futures or options, that are traded on a national securities exchange are valued at the last sale price as of the close of trading on the applicable exchange where the security principally trades. Securities traded via NASDAQ are valued at the NASDAQ official closing price. To the extent these securities are valued at the last sale price or NASDAQ official closing price, they are classified as Level 1 in the fair value hierarchy. In the event that no sale or official closing price on valuation date exists, these securities are generally valued at the mean between the last reported bid and ask prices, or at the last bid price in the absence of an ask price. These securities are classified as Level 2 in the fair value hierarchy.
Foreign equities traded on foreign securities exchanges are generally valued using pricing vendor services that provide model prices derived using adjustment factors based on information such as local closing price, relevant general and sector indices, currency fluctuations, depositary receipts, and futures, as applicable. Securities valued using such model prices are classified as Level 2 in the fair value hierarchy. The models generate an evaluated adjustment factor for each security, which is applied to the local closing price to adjust it for post closing market movements up to the time the Fund is valued. Utilizing that evaluated adjustment factor, the vendor provides an evaluated price for each security. If the vendor does not provide an evaluated price, securities are valued in accordance with exchange-traded common and preferred stock valuation policies discussed above.
Investments in open-end, non-exchange-traded mutual funds are valued at their net asset values as of the close of the NYSE on the date of valuation. These securities are classified as Level 1 in the fair value hierarchy since they may be purchased or sold at their net asset values on the date of valuation.
Securities and other assets that cannot be priced according to the methods described above are valued based on pricing methodologies approved by the Board. In the event that unobservable inputs are used when determining such valuations, the securities will be classified as Level 3 in the fair value hierarchy.
When determining the fair value of securities, some of the factors influencing the valuation include: the nature of any restrictions on disposition of the securities; assessment of the general liquidity of the securities; the issuer’s financial condition and the markets in which it does business; the cost of the investment; the size of the holding and the capitalization of the issuer; the prices of any recent transactions or bids/offers for such securities or any comparable securities; any available analyst media or other reports or information deemed reliable by the Manager regarding the issuer or the markets or industry in which it operates.
| 28 |
Using fair value to price securities may result in a value that is different from a security’s most recent closing price and from the price used by other unaffiliated mutual funds to calculate their net asset values.
Illiquid Securities: Pursuant to Rule 22e-4 under the 1940 Act, the Fund has adopted a Board approved Liquidity Risk Management Program (“LRMP”) that requires, among other things, that the Fund limit its illiquid investments that are assets to no more than 15% of net assets. Illiquid securities are those that, because of the absence of a readily available market or due to legal or contractual restrictions on resale, may not reasonably be expected to be sold or disposed of in current market conditions in seven calendar days or less without the sale or disposition significantly changing the market value of the investment. The Fund may find it difficult to sell illiquid securities at the time considered most advantageous by its subadviser and may incur transaction costs that would not be incurred in the sale of securities that were freely marketable.
Restricted Securities: Securities acquired in unregistered, private sales from the issuing company or from an affiliate of the issuer are considered restricted as to disposition under federal securities law (“restricted securities”). Such restricted securities are valued pursuant to the valuation procedures noted above. Restricted securities that would otherwise be considered illiquid investments pursuant to the Fund’s LRMP because of legal restrictions on resale to the general public may be traded among qualified institutional buyers under Rule 144A of the Securities Act of 1933. Therefore, these Rule 144A securities, as well as commercial paper that is sold in private placements under Section 4(2) of the Securities Act of 1933, may be classified higher than “illiquid” under the LRMP (i.e. “moderately liquid” or “less liquid” investments). However, the liquidity of the Fund’s investments in restricted securities could be impaired if trading does not develop or declines.
Foreign Currency Translation: The books and records of the Fund are maintained in U.S. dollars. Foreign currency amounts are translated into U.S. dollars on the following basis:
(i) market value of investment securities, other assets and liabilities—at the current rates of exchange;
(ii) purchases and sales of investment securities, income and expenses—at the rates of exchange prevailing on the respective dates of such transactions.
Although the net assets of the Fund are presented at the foreign exchange rates and market values at the close of the period, the Fund does not generally isolate that portion of the results of operations arising as a result of changes in the foreign exchange rates from the fluctuations arising from changes in the market prices of long-term portfolio securities held at the end of the period. Similarly, the Fund does not isolate the effect of changes in foreign exchange rates from the fluctuations arising from changes in the market prices of long-term portfolio securities sold during the period. Accordingly, holding period realized foreign currency gains (losses) are included in the reported net realized gains (losses) on investment transactions.
| PGIM Jennison Natural Resources Fund | 29 |
Notes to Financial Statements (continued)
Net realized gains (losses) on foreign currency transactions represent net foreign exchange gains (losses) from the disposition of holdings of foreign currencies, currency gains (losses) realized between the trade and settlement dates on forward currency transactions, and the difference between the amounts of interest, dividends and foreign withholding taxes recorded on the Fund’s books and the U.S. dollar equivalent amounts actually received or paid. Net unrealized currency gains (losses) arise from valuing foreign currency denominated assets and liabilities (other than investments) at period end exchange rates.
Master Netting Arrangements: The Fund is subject to various Master Agreements, or netting arrangements, with select counterparties. These are agreements which a subadviser may have negotiated and entered into on behalf of all or a portion of the Fund. A master netting arrangement between the Fund and the counterparty permits the Fund to offset amounts payable by the Fund to the same counterparty against amounts to be received; and by the receipt of collateral from the counterparty by the Fund to cover the Fund’s exposure to the counterparty. However, there is no assurance that such mitigating factors are easily enforceable. In addition to master netting arrangements, the right to set-off exists when all the conditions are met such that each of the parties owes the other determinable amounts, the reporting party has the right to set-off the amount owed with the amount owed by the other party, the reporting party intends to set-off and the right of set-off is enforceable by law. During the reporting period, there was no intention to settle on a net basis and all amounts are presented on a gross basis on the Statement of Assets and Liabilities.
Securities Lending: The Fund lends its portfolio securities to banks and broker-dealers. The loans are secured by collateral at least equal to the market value of the securities loaned. Collateral pledged by each borrower is invested in an affiliated money market fund and is marked to market daily, based on the previous day’s market value, such that the value of the collateral exceeds the value of the loaned securities. In the event of significant appreciation in value of securities on loan on the last business day of the reporting period, the financial statements may reflect a collateral value that is less than the market value of the loaned securities. Such shortfall is remedied as described above. Loans are subject to termination at the option of the borrower or the Fund. Upon termination of the loan, the borrower will return to the Fund securities identical to the loaned securities. Should the borrower of the securities fail financially, the Fund has the right to repurchase the securities in the open market using the collateral.
The Fund recognizes income, net of any rebate and securities lending agent fees, for lending its securities in the form of fees or interest on the investment of any cash received as collateral. The borrower receives all interest and dividends from the securities loaned and such payments are passed back to the lender in amounts equivalent thereto. The Fund also continues to recognize any unrealized gain (loss) in the market price of the securities loaned and on the change in the value of the collateral invested that may occur during the term of
| 30 |
the loan. In addition, realized gain (loss) is recognized on changes in the value of the collateral invested upon liquidation of the collateral. Net earnings from securities lending are disclosed on the Statement of Operations as “Income from securities lending, net”.
Securities Transactions and Net Investment Income: Securities transactions are recorded on the trade date. Realized gains (losses) from investment and currency transactions are calculated on the specific identification method. Dividend income is recorded on the ex-date, or for certain foreign securities, when the Fund becomes aware of such dividends. Expenses are recorded on an accrual basis, which may require the use of certain estimates by management that may differ from actual. Net investment income or loss (other than class specific expenses and waivers, which are allocated as noted below) and unrealized and realized gains (losses) are allocated daily to each class of shares based upon the relative proportion of adjusted net assets of each class at the beginning of the day. Class specific expenses and waivers, where applicable, are charged to the respective share classes. Class specific expenses include distribution fees and distribution fee waivers, shareholder servicing fees, transfer agent’s fees and expenses, registration fees and fee waivers and/or expense reimbursements, as applicable.
Taxes: It is the Fund’s policy to continue to meet the requirements of the Internal Revenue Code applicable to regulated investment companies and to distribute all of its taxable net investment income and capital gains, if any, to its shareholders. Therefore, no federal income tax provision is required. Withholding taxes on foreign dividends, interest and capital gains, if any, are recorded, net of reclaimable amounts, at the time the related income is earned.
Dividends and Distributions: The Fund expects to pay dividends from net investment income and distributions from net realized capital gains, if any, annually. Dividends and distributions to shareholders, which are determined in accordance with federal income tax regulations and which may differ from generally accepted accounting principles, are recorded on the ex-date. Permanent book/tax differences relating to income and gain (loss) are reclassified between total distributable earnings (loss) and paid-in capital in excess of par, as appropriate.
Estimates: The preparation of financial statements requires management to make estimates and assumptions that affect the reported amounts and disclosures in the financial statements. Actual results could differ from those estimates.
2. Agreements
The Fund has a management agreement with the Manager. Pursuant to this agreement, the Manager has responsibility for all investment advisory services and supervises the subadviser’s performance of such services. In addition, under the management agreement, the Manager provides all of the administrative functions necessary for the organization, operation and management of the Fund. The Manager administers the corporate affairs of the Fund and, in connection therewith, furnishes the Fund with office facilities, together with
| PGIM Jennison Natural Resources Fund | 31 |
Notes to Financial Statements (continued)
those ordinary clerical and bookkeeping services which are not being furnished by the Fund’s custodian and the Fund’s transfer agent. The Manager is also responsible for the staffing and management of dedicated groups of legal, marketing, compliance and related personnel necessary for the operation of the Fund. The legal, marketing, compliance and related personnel are also responsible for the management and oversight of the various service providers to the Fund, including, but not limited to, the custodian, transfer agent, and accounting agent.
The Manager has entered into a subadvisory agreement with Jennison Associates LLC (“Jennison”). The subadvisory agreement provides that Jennison will furnish investment advisory services in connection with the management of the Fund. In connection therewith, Jennison is obligated to keep certain books and records of the Fund. The Manager pays for the services of Jennison, the cost of compensation of officers of the Fund, occupancy and certain clerical and bookkeeping costs of the Fund. The Fund bears all other costs and expenses.
The management fee paid to the Manager is accrued daily and payable monthly at an annual rate of 0.75% of the Fund’s average daily net assets up to $1 billion and 0.70% of the average daily net assets in excess of $1 billion. The effective management fee rate before any waivers and/or expense reimbursements was 0.75% for the year ended October 31, 2019.
The Manager has contractually agreed, through February 28, 2021, to limit transfer agency, shareholder servicing, sub-transfer agency, and blue sky fees, as applicable, to the extent that such fees cause the total annual operating expenses to exceed 2.19% of average daily net assets for Class B shares. This contractual waiver excludes interest, brokerage, taxes (such as income and foreign withholding taxes, stamp duty and deferred tax expenses), acquired fund fees and expenses, extraordinary expenses, and certain other Fund expenses such as dividend and interest expense and broker charges on short sales. Where applicable, the Manager agrees to waive management fees or shared operating expenses on any share class to the same extent that it waives similar expenses on any other share class. In addition, total annual operating expenses for Class R6 shares will not exceed total anuual operating expenses for Class Z shares. Fees and/or expenses waived and/or reimbursed by the Manager may be recouped by the Manager within the same fiscal year during which such waiver and/or reimbursement is made if such recoupment can be realized without exceeding the expense limit in effect at the time of the recoupment for that fiscal year.
The Fund has a distribution agreement with Prudential Investment Management Services LLC (“PIMS”), which acts as the distributor of the Class A, Class B, Class C, Class R, Class Z and Class R6 shares of the Fund. The Fund compensates PIMS for distributing and servicing the Fund’s Class A, Class B, Class C and Class R shares, pursuant
| 32 |
to the plans of distribution (the “Distribution Plans”), regardless of expenses actually incurred by PIMS. The distribution fees are accrued daily and payable monthly. No distribution or service fees are paid to PIMS as distributor of the Class Z and Class R6 shares of the Fund.
Pursuant to the Distribution Plans, the Fund compensates PIMS for distribution related activities at an annual rate of up to 0.30%, 1%, 1% and 0.75% of the average daily net assets of the Class A, Class B, Class C and Class R shares, respectively. PIMS has contractually agreed through February 28, 2021 to limit such fees to 0.50% of the average daily net assets of Class R shares.
For the year ended October 31, 2019, PIMS received $135,616 in front-end sales charges resulting from sales of Class A shares. Additionally, for the year ended October 31, 2019, PIMS received $34, $3,124 and $3,076 in contingent deferred sales charges imposed upon redemptions by certain Class A, Class B and Class C shareholders, respectively. From these fees, PIMS paid such sales charges to broker-dealers, who in turn paid commissions to salespersons and incurred other distribution costs.
PGIM Investments, PIMS and Jennison are indirect, wholly-owned subsidiaries of Prudential Financial, Inc. (“Prudential”).
3. Other Transactions with Affiliates
Prudential Mutual Fund Services LLC (“PMFS”), an affiliate of PGIM Investments and an indirect, wholly-owned subsidiary of Prudential, serves as the Company’s transfer agent. Transfer agent’s fees and expenses in the Statement of Operations include certain out-of-pocket expenses paid to non-affiliates, where applicable.
The Fund may invest its overnight sweep cash in the PGIM Core Ultra Short Bond Fund (the “Core Fund”), and its securities lending cash collateral in the PGIM Institutional Money Market Fund (the “Money Market Fund”), each a series of Prudential Investment Portfolios 2, registered under the 1940 Act and managed by PGIM Investments. Through the Fund’s investments in the mentioned underlying funds, PGIM Investments and/or its affiliates are paid fees or reimbursed for providing their services. In addition to the realized and unrealized gains on investments in the Core Fund and Money Market Fund, earnings from such investments are disclosed on the Statement of Operations as “Affiliated dividend income” and “Income from securities lending, net”, respectively.
The Fund may enter into certain securities purchase or sale transactions under Board approved Rule 17a-7 procedures. Rule 17a-7 is an exemptive rule under the 1940 Act, that subject to certain conditions, permits purchase and sale transactions among affiliated investment companies, or between an investment company and a person that is affiliated solely by reason of having a common (or affiliated) investment adviser, common directors, and/or common officers. Pursuant to the Rule 17a-7 procedures and consistent with guidance issued by the SEC, the Company’s Chief Compliance Officer (“CCO”) prepares a
| PGIM Jennison Natural Resources Fund | 33 |
Notes to Financial Statements (continued)
quarterly summary of all such transactions for submission to the Board, together with the CCO’s written representation that all such 17a-7 transactions were effected in accordance with the Fund’s Rule 17a-7 procedures. For the year ended October 31, 2019, no 17a-7 transactions were entered into by the Fund.
4. Portfolio Securities
The aggregate cost of purchases and proceeds from sales of portfolio securities (excluding short-term investments and U.S. Government securities) for the year ended October 31, 2019, were $322,492,258 and $609,970,935, respectively.
A summary of the cost of purchases and proceeds from sales of shares of affiliated investments for the year ended October 31, 2019, is presented as follows:
| Value, |
Cost of Purchases |
Proceeds from Sales |
Change in Unrealized Gain (Loss) |
Realized Gain (Loss) |
Value, End of Year |
Shares, End of Year |
Income | |||||||||||||||||||||
| PGIM Core Ultra Short Bond Fund* |
||||||||||||||||||||||||||||
| $55,848,316 | $ | 331,382,852 | $ | 374,211,327 | $ | — | $ | — | $ | 13,019,841 | 13,019,841 | $ | 591,008 | |||||||||||||||
| PGIM Institutional Money Market Fund* |
||||||||||||||||||||||||||||
| 137,567,052 | 789,120,434 | 885,159,349 | 1,932 | 10,720 | 41,540,789 | 41,532,482 | 116,303 | ** | ||||||||||||||||||||
|
|
|
|
|
|
|
|
|
|
|
|
|
|
||||||||||||||||
| $193,415,368 | $ | 1,120,503,286 | $ | 1,259,370,676 | $ | 1,932 | $ | 10,720 | $ | 54,560,630 | $ | 707,311 | ||||||||||||||||
|
|
|
|
|
|
|
|
|
|
|
|
|
|
||||||||||||||||
| * | The Fund did not have any capital gain distributions during the reporting period. |
| ** | This amount is included in “Income from securities lending, net” on the Statement of Operations. |
5. Distributions and Tax Information
Distributions to shareholders, which are determined in accordance with federal income tax regulations and which may differ from generally accepted accounting principles, are recorded on the ex-date.
For the year ended October 31, 2019, the tax character of dividends paid by the Fund was $15,701,627 of ordinary income. For the year ended October 31, 2018, there were no distributions paid by the Fund.
As of October 31, 2019, the accumulated undistributed earnings on a tax basis was $13,364,828 of ordinary income.
| 34 |
The United States federal income tax basis of the Fund’s investments and the net unrealized appreciation as of October 31, 2019 were as follows:
| Tax Basis |
Gross |
Gross |
Net | |||
| $645,000,604 | $147,202,323 | $(88,441,375) | $58,760,948 |
The difference between book basis and tax basis of investments was primarily attributable to deferred losses on wash sales and other book to tax adjustments.
For federal income tax purposes, the Fund had a capital loss carryforward as of October 31, 2019 of approximately $632,774,000 which can be carried forward for an unlimited period. No capital gains distributions are expected to be paid to shareholders until net gains have been realized in excess of such losses.
The Manager has analyzed the Fund’s tax positions taken on federal, state and local income tax returns for all open tax years and has concluded that no provision for income tax is required in the Fund’s financial statements for the current reporting period. Since tax authorities can examine previously filed tax returns, the Fund’s U.S. federal and state tax returns for each of the four fiscal years up to the most recent fiscal year ended October 31, 2019 are subject to such review.
6. Capital and Ownership
The Fund offers Class A, Class B, Class C, Class R, Class Z and Class R6 shares. Class A shares are sold with a maximum front-end sales charge of 5.50%. Investors who purchase $1 million or more of Class A shares and sell these shares within 12 months of purchase are subject to a contingent deferred sales charge (“CDSC”) of 1%, although they are not subject to an initial sales charge. The Class A CDSC is waived for certain retirement and/or benefit plans. A special exchange privilege is also available for shareholders who qualified to purchase Class A shares at net asset value. Class B shares are sold with a CDSC which declines from 5% to zero depending on the period of time the shares are held. Class B shares will automatically convert to Class A shares on a monthly basis approximately seven years after purchase. Class B shares are closed to new purchases. Class C shares are sold with a CDSC of 1% on sales made within 12 months of purchase. Class C shares will automatically convert to Class A shares on a monthly basis approximately 10 years after purchase. Class R, Class Z and Class R6 shares are not subject to any sales or redemption charges and are available exclusively for sale to a limited group of investors.
Under certain circumstances, an exchange may be made from specified share classes of the Fund to one or more other share classes of the Fund as presented in the table of transactions in shares of common stock.
There are 500 million shares of common stock, $0.01 par value per share, authorized and divided into seven classes, designated Class A, Class B, Class C, Class R, Class Z, Class R6
| PGIM Jennison Natural Resources Fund | 35 |
Notes to Financial Statements (continued)
and Class T common stock, each of which consists of 50 million, 10 million, 50 million, 50 million, 145 million, 105 million and 90 million authorized shares, respectively. The Fund currently does not have any Class T shares outstanding.
As of October 31, 2019, Prudential, through its affiliated entities, including affiliated funds (if applicable), owned 78,106 Class R shares and 62,237 Class R6 shares of the Fund. At reporting period end, four shareholders of record, each holding greater than 5% of the Fund, held 49% of the Fund’s outstanding shares.
Transactions in shares of common stock were as follows:
| Class A |
Shares | Amount | ||||||
| Year ended October 31, 2019: |
||||||||
| Shares sold |
952,248 | $ | 29,010,796 | |||||
| Shares issued in reinvestment of dividends and distributions |
138,139 | 4,152,472 | ||||||
| Shares reacquired |
(3,553,397 | ) | (108,834,519 | ) | ||||
|
|
|
|
|
|||||
| Net increase (decrease) in shares outstanding before conversion |
(2,463,010 | ) | (75,671,251 | ) | ||||
| Shares issued upon conversion from other share class(es) |
1,394,220 | 45,268,422 | ||||||
| Shares reacquired upon conversion into other share class(es) |
(129,799 | ) | (3,979,685 | ) | ||||
|
|
|
|
|
|||||
| Net increase (decrease) in shares outstanding |
(1,198,589 | ) | $ | (34,382,514 | ) | |||
|
|
|
|
|
|||||
| Year ended October 31, 2018: |
||||||||
| Shares sold |
1,345,265 | $ | 51,953,748 | |||||
| Shares reacquired |
(4,426,909 | ) | (168,305,176 | ) | ||||
|
|
|
|
|
|||||
| Net increase (decrease) in shares outstanding before conversion |
(3,081,644 | ) | (116,351,428 | ) | ||||
| Shares issued upon conversion from other share class(es) |
267,565 | 10,294,141 | ||||||
| Shares reacquired upon conversion into other share class(es) |
(597,045 | ) | (23,054,953 | ) | ||||
|
|
|
|
|
|||||
| Net increase (decrease) in shares outstanding |
(3,411,124 | ) | $ | (129,112,240 | ) | |||
|
|
|
|
|
|||||
| Class B |
||||||||
| Year ended October 31, 2019: |
||||||||
| Shares sold |
4,476 | $ | 115,720 | |||||
| Shares issued in reinvestment of dividends and distributions |
1,463 | 35,304 | ||||||
| Shares reacquired |
(40,001 | ) | (992,780 | ) | ||||
|
|
|
|
|
|||||
| Net increase (decrease) in shares outstanding before conversion |
(34,062 | ) | (841,756 | ) | ||||
| Shares reacquired upon conversion into other share class(es) |
(82,893 | ) | (2,029,005 | ) | ||||
|
|
|
|
|
|||||
| Net increase (decrease) in shares outstanding |
(116,955 | ) | $ | (2,870,761 | ) | |||
|
|
|
|
|
|||||
| Year ended October 31, 2018: |
||||||||
| Shares sold |
6,321 | $ | 201,978 | |||||
| Shares reacquired |
(93,447 | ) | (2,845,262 | ) | ||||
|
|
|
|
|
|||||
| Net increase (decrease) in shares outstanding before conversion |
(87,126 | ) | (2,643,284 | ) | ||||
| Shares reacquired upon conversion into other share class(es) |
(171,604 | ) | (5,235,189 | ) | ||||
|
|
|
|
|
|||||
| Net increase (decrease) in shares outstanding |
(258,730 | ) | $ | (7,878,473 | ) | |||
|
|
|
|
|
|||||
| 36 |
| Class C |
Shares | Amount | ||||||
| Year ended October 31, 2019: |
||||||||
| Shares sold |
133,673 | $ | 3,217,563 | |||||
| Shares issued in reinvestment of dividends and distributions |
42,436 | 1,023,560 | ||||||
| Shares reacquired |
(1,041,419 | ) | (25,357,578 | ) | ||||
|
|
|
|
|
|||||
| Net increase (decrease) in shares outstanding before conversion |
(865,310 | ) | (21,116,455 | ) | ||||
| Shares reacquired upon conversion into other share class(es) |
(1,661,793 | ) | (43,338,291 | ) | ||||
|
|
|
|
|
|||||
| Net increase (decrease) in shares outstanding |
(2,527,103 | ) | $ | (64,454,746 | ) | |||
|
|
|
|
|
|||||
| Year ended October 31, 2018: |
||||||||
| Shares sold |
200,426 | $ | 6,234,225 | |||||
| Shares reacquired |
(1,442,104 | ) | (44,065,974 | ) | ||||
|
|
|
|
|
|||||
| Net increase (decrease) in shares outstanding before conversion |
(1,241,678 | ) | (37,831,749 | ) | ||||
| Shares reacquired upon conversion into other share class(es) |
(276,328 | ) | (8,481,057 | ) | ||||
|
|
|
|
|
|||||
| Net increase (decrease) in shares outstanding |
(1,518,006 | ) | $ | (46,312,806 | ) | |||
|
|
|
|
|
|||||
| Class R |
||||||||
| Year ended October 31, 2019: |
||||||||
| Shares sold |
325,894 | $ | 9,781,619 | |||||
| Shares issued in reinvestment of dividends and distributions |
11,367 | 336,244 | ||||||
| Shares reacquired |
(549,366 | ) | (16,657,292 | ) | ||||
|
|
|
|
|
|||||
| Net increase (decrease) in shares outstanding before conversion |
(212,105 | ) | (6,539,429 | ) | ||||
| Shares issued upon conversion from other share class(es) |
106 | 3,360 | ||||||
|
|
|
|
|
|||||
| Net increase (decrease) in shares outstanding |
(211,999 | ) | $ | (6,536,069 | ) | |||
|
|
|
|
|
|||||
| Year ended October 31, 2018: |
||||||||
| Shares sold |
268,037 | $ | 10,147,700 | |||||
| Shares reacquired |
(590,252 | ) | (22,222,126 | ) | ||||
|
|
|
|
|
|||||
| Net increase (decrease) in shares outstanding before conversion |
(322,215 | ) | (12,074,426 | ) | ||||
| Shares issued upon conversion from other share class(es) |
209 | 8,042 | ||||||
| Shares reacquired upon conversion into other share class(es) |
(1,122 | ) | (42,322 | ) | ||||
|
|
|
|
|
|||||
| Net increase (decrease) in shares outstanding |
(323,128 | ) | $ | (12,108,706 | ) | |||
|
|
|
|
|
|||||
| Class Z |
||||||||
| Year ended October 31, 2019: |
||||||||
| Shares sold |
3,065,434 | $ | 95,441,203 | |||||
| Shares issued in reinvestment of dividends and distributions |
231,976 | 7,263,164 | ||||||
| Shares reacquired |
(9,404,117 | ) | (300,138,227 | ) | ||||
|
|
|
|
|
|||||
| Net increase (decrease) in shares outstanding before conversion |
(6,106,707 | ) | (197,433,860 | ) | ||||
| Shares issued upon conversion from other share class(es) |
203,266 | 6,537,344 | ||||||
| Shares reacquired upon conversion into other share class(es) |
(78,684 | ) | (2,523,046 | ) | ||||
|
|
|
|
|
|||||
| Net increase (decrease) in shares outstanding |
(5,982,125 | ) | $ | (193,419,562 | ) | |||
|
|
|
|
|
|||||
| Year ended October 31, 2018: |
||||||||
| Shares sold |
3,359,353 | $ | 135,010,580 | |||||
| Shares reacquired |
(7,831,685 | ) | (309,860,904 | ) | ||||
|
|
|
|
|
|||||
| Net increase (decrease) in shares outstanding before conversion |
(4,472,332 | ) | (174,850,324 | ) | ||||
| Shares issued upon conversion from other share class(es) |
729,179 | 29,295,309 | ||||||
| Shares reacquired upon conversion into other share class(es) |
(333,461 | ) | (13,915,960 | ) | ||||
|
|
|
|
|
|||||
| Net increase (decrease) in shares outstanding |
(4,076,614 | ) | $ | (159,470,975 | ) | |||
|
|
|
|
|
|||||
| PGIM Jennison Natural Resources Fund | 37 |
Notes to Financial Statements (continued)
| Class R6 |
Shares | Amount | ||||||
| Year ended October 31, 2019: |
||||||||
| Shares sold |
415,189 | $ | 13,522,662 | |||||
| Shares issued in reinvestment of dividends and distributions |
27,874 | 878,853 | ||||||
| Shares reacquired |
(937,002 | ) | (30,248,408 | ) | ||||
|
|
|
|
|
|||||
| Net increase (decrease) in shares outstanding before conversion |
(493,939 | ) | (15,846,893 | ) | ||||
| Shares issued upon conversion from other share class(es) |
2,039 | 67,684 | ||||||
| Shares reacquired upon conversion into other share class(es) |
(202 | ) | (6,783 | ) | ||||
|
|
|
|
|
|||||
| Net increase (decrease) in shares outstanding |
(492,102 | ) | $ | (15,785,992 | ) | |||
|
|
|
|
|
|||||
| Year ended October 31, 2018: |
||||||||
| Shares sold |
450,691 | $ | 18,045,590 | |||||
| Shares reacquired |
(1,142,923 | ) | (45,248,070 | ) | ||||
|
|
|
|
|
|||||
| Net increase (decrease) in shares outstanding before conversion |
(692,232 | ) | (27,202,480 | ) | ||||
| Shares issued upon conversion from other share class(es) |
263,151 | 11,131,989 | ||||||
|
|
|
|
|
|||||
| Net increase (decrease) in shares outstanding |
(429,081 | ) | $ | (16,070,491 | ) | |||
|
|
|
|
|
|||||
7. Borrowings
The Fund along with other affiliated registered investment companies (the “Funds”), is a party to a Syndicated Credit Agreement (“SCA”) with a group of banks. The purpose of the SCA is to provide an alternative source of temporary funding for capital share redemptions. The table below provides details of the current SCA in effect at the reporting period-end as well as the prior SCA.
| Current SCA | Prior SCA | |||
| Term of Commitment | 10/3/2019 – 10/1/2020 | 10/4/2018 – 10/2/2019 | ||
| Total Commitment | $ 900 million | $ 900 million | ||
| Annualized Commitment Fee on the Unused Portion of the SCA | 0.15% | 0.15% | ||
| Annualized Interest Rate on Borrowings | 1.20% plus the higher of (1) the effective federal funds rate, (2) the one-month LIBOR rate or (3) zero percent | 1.25% plus the higher of (1) the effective federal funds rate, (2) the one-month LIBOR rate or (3) zero percent |
Certain affiliated registered investment companies that are parties to the SCA include portfolios that are subject to a predetermined mathematical formula used to manage certain benefit guarantees offered under variable annuity contracts. The formula may result in large scale asset flows into and out of these portfolios. Consequently, these portfolios may be more likely to utilize the SCA for purposes of funding redemptions. It may be possible for those portfolios to fully exhaust the committed amount of the SCA, thereby requiring the Manager to allocate available funding per a Board-approved methodology designed to treat the Funds in the SCA equitably.
| 38 |
The Fund utilized the SCA during the year ended October 31, 2019. The average daily balance for the 8 days that the Fund had loans outstanding during the period was approximately $5,629,500, borrowed at a weighted average interest rate of 3.72%. The maximum loan outstanding amount during the period was $18,612,000. At October 31, 2019, the Fund did not have an outstanding loan amount.
8. Risks of Investing in the Fund
The Fund’s risks include, but are not limited to, some or all of the risks discussed below:
Equity and Equity-Related Securities Risks: The value of a particular security could go down and you could lose money. In addition to an individual security losing value, the value of the equity markets or a sector in which the Fund invests could go down. The Fund’s holdings can vary significantly from broad market indexes and the performance of the Fund can deviate from the performance of these indexes. Different parts of a market can react differently to adverse issuer, market, regulatory, political and economic developments.
Foreign Securities Risk: The Fund’s investments in securities of foreign issuers or issuers with significant exposure to foreign markets involve additional risk. Foreign countries in which the Fund may invest may have markets that are less liquid, less regulated and more volatile than US markets. The value of the Fund’s investments may decline because of factors affecting the particular issuer as well as foreign markets and issuers generally, such as unfavorable government actions, and political or financial instability.
Market and Credit Risk: Securities markets may be volatile and the market prices of the Fund’s securities may decline. Securities fluctuate in price based on changes in an issuer’s financial condition and overall market and economic conditions. If the market prices of the securities owned by the Fund fall, the value of an investment in the Fund will decline. Additionally, the Fund may also be exposed to credit risk in the event that an issuer or guarantor fails to perform or that an institution or entity with which the Fund has unsettled or open transactions defaults.
Non-diversification Risk: A non-diversified Fund may invest a greater percentage of its assets in the securities of a single company or industry than a diversified fund. Investing in a non-diversified fund involves greater risk than investing in a diversified fund because a loss resulting from the decline in value of any one security may represent a greater portion of the total assets of a non-diversified fund.
9. Recent Accounting Pronouncements and Reporting Updates
In August 2018, the FASB issued Accounting Standards Update (“ASU”) No. 2018-13, which changes certain fair value measurement disclosure requirements. The new ASU, in addition to other modifications and additions, removes the requirement to disclose the amount and reasons for transfers between Level 1 and Level 2 of the fair value hierarchy, and the Fund’s policy for the timing of transfers between levels. The amendments are
| PGIM Jennison Natural Resources Fund | 39 |
Notes to Financial Statements (continued)
effective for financial statements issued for fiscal years beginning after December 15, 2019, and interim periods within those fiscal years. The Manager has evaluated the implications of certain provisions of the ASU and has determined to early adopt aspects related to the removal and modification of certain fair value measurement disclosures under the ASU effective immediately. The Manager continues to evaluate certain other provisions of the ASU and does not expect a material impact to financial statement disclosures.
| 40 |
Financial Highlights
| Class A Shares | ||||||||||||||||||||
| Year Ended October 31, |
||||||||||||||||||||
| 2019 | 2018 | 2017 | 2016 | 2015 | ||||||||||||||||
| Per Share Operating Performance(a): | ||||||||||||||||||||
| Net Asset Value, Beginning of Year | $33.37 | $35.98 | $34.20 | $32.50 | $46.17 | |||||||||||||||
| Income (loss) from investment operations: | ||||||||||||||||||||
| Net investment income (loss) | 0.43 | 0.28 | 0.12 | 0.02 | 0.11 | |||||||||||||||
| Net realized and unrealized gain (loss) on investment and foreign currency transactions | (4.08 | ) | (2.89 | ) | 1.97 | 1.80 | (13.78 | ) | ||||||||||||
| Total from investment operations | (3.65 | ) | (2.61 | ) | 2.09 | 1.82 | (13.67 | ) | ||||||||||||
| Less Dividends and Distributions: | ||||||||||||||||||||
| Dividends from net investment income | (0.44 | ) | - | (0.31 | ) | (0.12 | ) | - | ||||||||||||
| Net asset value, end of year | $29.28 | $33.37 | $35.98 | $34.20 | $32.50 | |||||||||||||||
| Total Return(b): | (10.97)% | (7.25)% | 6.05% | 5.60% | (29.61)% | |||||||||||||||
| Ratios/Supplemental Data: | ||||||||||||||||||||
| Net assets, end of year (000) | $267,486 | $344,851 | $494,574 | $606,462 | $844,746 | |||||||||||||||
| Average net assets (000) | $302,294 | $456,839 | $562,687 | $707,741 | $1,049,852 | |||||||||||||||
| Ratios to average net assets(c)(d): | ||||||||||||||||||||
| Expenses after waivers and/or expense reimbursement | 1.35% | 1.24% | 1.22% | 1.25% | 1.22% | |||||||||||||||
| Expenses before waivers and/or expense reimbursement | 1.35% | 1.24% | 1.22% | 1.25% | 1.22% | |||||||||||||||
| Net investment income (loss) | 1.41% | 0.73% | 0.34% | 0.07% | 0.29% | |||||||||||||||
| Portfolio turnover rate(e) | 39% | 27% | 32% | 28% | 35% | |||||||||||||||
| (a) | Calculated based on average shares outstanding during the year. |
| (b) | Total return does not consider the effects of sales loads. Total return is calculated assuming a purchase of a share on the first day and a sale on the last day of each year reported and includes reinvestment of dividends and distributions, if any. Total returns may reflect adjustments to conform to generally accepted accounting principles. |
| (c) | Effective November 1, 2017, class specific expenses include transfer agent fees and expenses and registration fees, which are charged to their respective share class. |
| (d) | Does not include expenses of the underlying funds in which the Fund invests. |
| (e) | The Fund’s portfolio turnover rate is calculated in accordance with regulatory requirements, without regard to transactions involving short-term investments and certain derivatives. If such transactions were included, the Fund’s portfolio turnover rate may be higher. |
See Notes to Financial Statements.
| PGIM Jennison Natural Resources Fund | 41 |
Financial Highlights (continued)
| Class B Shares | ||||||||||||||||||||
| Year Ended October 31, | ||||||||||||||||||||
| 2019 | 2018 | 2017 | 2016 | 2015 | ||||||||||||||||
| Per Share Operating Performance(a): | ||||||||||||||||||||
| Net Asset Value, Beginning of Year | $26.63 | $28.98 | $27.79 | $26.53 | $37.95 | |||||||||||||||
| Income (loss) from investment operations: | ||||||||||||||||||||
| Net investment income (loss) | 0.16 | - | (b) | (0.11 | ) | (0.16 | ) | (0.13 | ) | |||||||||||
| Net realized and unrealized gain (loss) on investment and foreign currency transactions | (3.27 | ) | (2.35 | ) | 1.61 | 1.44 | (11.29 | ) | ||||||||||||
| Total from investment operations | (3.11 | ) | (2.35 | ) | 1.50 | 1.28 | (11.42 | ) | ||||||||||||
| Less Dividends and Distributions: | ||||||||||||||||||||
| Dividends from net investment income | (0.19 | ) | - | (0.31 | ) | (0.02 | ) | - | ||||||||||||
| Net asset value, end of year | $23.33 | $26.63 | $28.98 | $27.79 | $26.53 | |||||||||||||||
| Total Return(c): | (11.69)% | (8.11)% | 5.32% | 4.82% | (30.09)% | |||||||||||||||
| Ratios/Supplemental Data: | ||||||||||||||||||||
| Net assets, end of year (000) | $2,193 | $5,617 | $13,613 | $23,687 | $36,198 | |||||||||||||||
| Average net assets (000) | $3,695 | $10,001 | $18,557 | $27,807 | $54,812 | |||||||||||||||
| Ratios to average net assets(d)(e): | ||||||||||||||||||||
| Expenses after waivers and/or expense reimbursement | 2.19% | 2.19% | 1.92% | 1.95% | 1.92% | |||||||||||||||
| Expenses before waivers and/or expense reimbursement | 3.23% | 2.39% | 1.92% | 1.95% | 1.92% | |||||||||||||||
| Net investment income (loss) | 0.63% | (0.01)% | (0.36)% | (0.61)% | (0.41)% | |||||||||||||||
| Portfolio turnover rate(f) | 39% | 27% | 32% | 28% | 35% | |||||||||||||||
| (a) | Calculated based on average shares outstanding during the year. |
| (b) | Less than $0.005 per share. |
| (c) | Total return does not consider the effects of sales loads. Total return is calculated assuming a purchase of a share on the first day and a sale on the last day of each year reported and includes reinvestment of dividends and distributions, if any. Total returns may reflect adjustments to conform to generally accepted accounting principles. |
| (d) | Effective November 1, 2017, class specific expenses include transfer agent fees and expenses and registration fees, which are charged to their respective share class. |
| (e) | Does not include expenses of the underlying funds in which the Fund invests. |
| (f) | The Fund’s portfolio turnover rate is calculated in accordance with regulatory requirements, without regard to transactions involving short-term investments and certain derivatives. If such transactions were included, the Fund’s portfolio turnover rate may be higher. |
See Notes to Financial Statements.
| 42 |
| Class C Shares | ||||||||||||||||||||
| Year Ended October 31, |
||||||||||||||||||||
| 2019 | 2018 | 2017 | 2016 | 2015 | ||||||||||||||||
| Per Share Operating Performance(a): | ||||||||||||||||||||
| Net Asset Value, Beginning of Year | $26.71 | $28.99 | $27.80 | $26.53 | $37.96 | |||||||||||||||
| Income (loss) from investment operations: | ||||||||||||||||||||
| Net investment income (loss) | 0.20 | 0.03 | (0.11 | ) | (0.16 | ) | (0.13 | ) | ||||||||||||
| Net realized and unrealized gain (loss) on investment and foreign currency transactions | (3.27 | ) | (2.31 | ) | 1.61 | 1.45 | (11.30 | ) | ||||||||||||
| Total from investment operations | (3.07 | ) | (2.28 | ) | 1.50 | 1.29 | (11.43 | ) | ||||||||||||
| Less Dividends and Distributions: | ||||||||||||||||||||
| Dividends from net investment income | (0.27 | ) | - | (0.31 | ) | (0.02 | ) | - | ||||||||||||
| Net asset value, end of year | $23.37 | $26.71 | $28.99 | $27.80 | $26.53 | |||||||||||||||
| Total Return(b): | (11.51)% | (7.86)% | 5.32% | 4.86% | (30.11)% | |||||||||||||||
| Ratios/Supplemental Data: | ||||||||||||||||||||
| Net assets, end of year (000) | $39,853 | $113,063 | $166,711 | $234,821 | $272,169 | |||||||||||||||
| Average net assets (000) | $72,400 | $150,802 | $203,277 | $236,425 | $347,186 | |||||||||||||||
| Ratios to average net assets(c)(d): | ||||||||||||||||||||
| Expenses after waivers and/or expense reimbursement | 1.99% | 1.90% | 1.92% | 1.95% | 1.92% | |||||||||||||||
| Expenses before waivers and/or expense reimbursement | 1.99% | 1.90% | 1.92% | 1.95% | 1.92% | |||||||||||||||
| Net investment income (loss) | 0.82% | 0.08% | (0.37)% | (0.64)% | (0.41)% | |||||||||||||||
| Portfolio turnover rate(e) | 39% | 27% | 32% | 28% | 35% | |||||||||||||||
| (a) | Calculated based on average shares outstanding during the year. |
| (b) | Total return does not consider the effects of sales loads. Total return is calculated assuming a purchase of a share on the first day and a sale on the last day of each year reported and includes reinvestment of dividends and distributions, if any. Total returns may reflect adjustments to conform to generally accepted accounting principles. |
| (c) | Effective November 1, 2017, class specific expenses include transfer agent fees and expenses and registration fees, which are charged to their respective share class. |
| (d) | Does not include expenses of the underlying funds in which the Fund invests. |
| (e) | The Fund’s portfolio turnover rate is calculated in accordance with regulatory requirements, without regard to transactions involving short-term investments and certain derivatives. If such transactions were included, the Fund’s portfolio turnover rate may be higher. |
See Notes to Financial Statements.
| PGIM Jennison Natural Resources Fund | 43 |
Financial Highlights (continued)
| Class R Shares | ||||||||||||||||||||
| Year Ended October 31, | ||||||||||||||||||||
| 2019 | 2018 | 2017 | 2016 | 2015 | ||||||||||||||||
| Per Share Operating Performance(a): | ||||||||||||||||||||
| Net Asset Value, Beginning of Year | $32.75 | $35.40 | $33.73 | $32.05 | $45.62 | |||||||||||||||
| Income (loss) from investment operations: | ||||||||||||||||||||
| Net investment income (loss) | 0.36 | 0.18 | 0.05 | (0.05 | ) | 0.04 | ||||||||||||||
| Net realized and unrealized gain (loss) on investment and foreign currency transactions | (4.01 | ) | (2.83 | ) | 1.93 | 1.78 | (13.61 | ) | ||||||||||||
| Total from investment operations | (3.65 | ) | (2.65 | ) | 1.98 | 1.73 | (13.57 | ) | ||||||||||||
| Less Dividends and Distributions: | ||||||||||||||||||||
| Dividends from net investment income | (0.35 | ) | - | (0.31 | ) | (0.05 | ) | - | ||||||||||||
| Net asset value, end of year | $28.75 | $32.75 | $35.40 | $33.73 | $32.05 | |||||||||||||||
| Total Return(b): | (11.18)% | (7.49)% | 5.81% | 5.39% | (29.75)% | |||||||||||||||
| Ratios/Supplemental Data: | ||||||||||||||||||||
| Net assets, end of year (000) | $25,050 | $35,482 | $49,793 | $59,729 | $56,596 | |||||||||||||||
| Average net assets (000) | $30,801 | $45,875 | $56,984 | $56,621 | $65,555 | |||||||||||||||
| Ratios to average net assets(c)(d): | ||||||||||||||||||||
| Expenses after waivers and/or expense reimbursement | 1.59% | 1.50% | 1.42% | 1.45% | 1.42% | |||||||||||||||
| Expenses before waivers and/or expense reimbursement | 1.84% | 1.75% | 1.67% | 1.70% | 1.67% | |||||||||||||||
| Net investment income (loss) | 1.18% | 0.48% | 0.14% | (0.15)% | 0.10% | |||||||||||||||
| Portfolio turnover rate(e) | 39% | 27% | 32% | 28% | 35% | |||||||||||||||
| (a) | Calculated based on average shares outstanding during the year. |
| (b) | Total return is calculated assuming a purchase of a share on the first day and a sale on the last day of each year reported and includes reinvestment of dividends and distributions, if any. Total returns may reflect adjustments to conform to generally accepted accounting principles. |
| (c) | Effective November 1, 2017, class specific expenses include transfer agent fees and expenses and registration fees, which are charged to their respective share class. |
| (d) | Does not include expenses of the underlying funds in which the Fund invests. |
| (e) | The Fund’s portfolio turnover rate is calculated in accordance with regulatory requirements, without regard to transactions involving short-term investments and certain derivatives. If such transactions were included, the Fund’s portfolio turnover rate may be higher. |
See Notes to Financial Statements.
| 44 |
| Class Z Shares | ||||||||||||||||||||
| Year Ended October 31, |
||||||||||||||||||||
| 2019 | 2018 | 2017 | 2016 | 2015 | ||||||||||||||||
| Per Share Operating Performance(a): | ||||||||||||||||||||
| Net Asset Value, Beginning of Year | $34.88 | $37.48 | $35.58 | $33.82 | $47.90 | |||||||||||||||
| Income (loss) from investment operations: | ||||||||||||||||||||
| Net investment income (loss) | 0.60 | 0.44 | 0.24 | 0.12 | 0.24 | |||||||||||||||
| Net realized and unrealized gain (loss) on investment and foreign currency transactions | (4.28 | ) | (3.04 | ) | 2.05 | 1.87 | (14.32 | ) | ||||||||||||
| Total from investment operations | (3.68 | ) | (2.60 | ) | 2.29 | 1.99 | (14.08 | ) | ||||||||||||
| Less Dividends and Distributions: | ||||||||||||||||||||
| Dividends from net investment income | (0.58 | ) | - | (0.39 | ) | (0.23 | ) | - | ||||||||||||
| Net asset value, end of year | $30.62 | $34.88 | $37.48 | $35.58 | $33.82 | |||||||||||||||
| Total Return(b): | (10.61)% | (6.94)% | 6.38% | 5.90% | (29.39)% | |||||||||||||||
| Ratios/Supplemental Data: | ||||||||||||||||||||
| Net assets, end of year (000) | $296,535 | $546,496 | $739,898 | $809,852 | $1,028,166 | |||||||||||||||
| Average net assets (000) | $401,185 | $717,400 | $803,996 | $834,087 | $1,325,084 | |||||||||||||||
| Ratios to average net assets(c)(d): | ||||||||||||||||||||
| Expenses after waivers and/or expense reimbursement | 0.92% | 0.87% | 0.92% | 0.95% | 0.92% | |||||||||||||||
| Expenses before waivers and/or expense reimbursement | 0.92% | 0.87% | 0.92% | 0.95% | 0.92% | |||||||||||||||
| Net investment income (loss) | 1.87% | 1.10% | 0.64% | 0.37% | 0.60% | |||||||||||||||
| Portfolio turnover rate(e) | 39% | 27% | 32% | 28% | 35% | |||||||||||||||
| (a) | Calculated based on average shares outstanding during the year. |
| (b) | Total return is calculated assuming a purchase of a share on the first day and a sale on the last day of each year reported and includes reinvestment of dividends and distributions, if any. Total returns may reflect adjustments to conform to generally accepted accounting principles. |
| (c) | Effective November 1, 2017, class specific expenses include transfer agent fees and expenses and registration fees, which are charged to their respective share class. |
| (d) | Does not include expenses of the underlying funds in which the Fund invests. |
| (e) | The Fund’s portfolio turnover rate is calculated in accordance with regulatory requirements, without regard to transactions involving short-term investments and certain derivatives. If such transactions were included, the Fund’s portfolio turnover rate may be higher. |
See Notes to Financial Statements.
| PGIM Jennison Natural Resources Fund | 45 |
Financial Highlights (continued)
| Class R6 Shares | ||||||||||||||||||||
| Year Ended October 31, | ||||||||||||||||||||
| 2019 | 2018 | 2017 | 2016 | 2015 | ||||||||||||||||
| Per Share Operating Performance(a): | ||||||||||||||||||||
| Net Asset Value, Beginning of Year | $35.16 | $37.73 | $35.83 | $34.04 | $48.14 | |||||||||||||||
| Income (loss) from investment operations: | ||||||||||||||||||||
| Net investment income (loss) | 0.63 | 0.47 | 0.27 | 0.19 | 0.30 | |||||||||||||||
| Net realized and unrealized gain (loss) on investment and foreign currency transactions | (4.32 | ) | (3.04 | ) | 2.08 | 1.89 | (14.40 | ) | ||||||||||||
| Total from investment operations | (3.69 | ) | (2.57 | ) | 2.35 | 2.08 | (14.10 | ) | ||||||||||||
| Less Dividends and Distributions: | ||||||||||||||||||||
| Dividends from net investment income | (0.62 | ) | - | (0.45 | ) | (0.29 | ) | - | ||||||||||||
| Net asset value, end of year | $30.85 | $35.16 | $37.73 | $35.83 | $34.04 | |||||||||||||||
| Total Return(b): | (10.54)% | (6.81)% | 6.51% | 6.15% | (29.29)% | |||||||||||||||
| Ratios/Supplemental Data: | ||||||||||||||||||||
| Net assets, end of year (000) | $29,607 | $51,048 | $70,972 | $109,742 | $189,234 | |||||||||||||||
| Average net assets (000) | $40,924 | $63,591 | $95,866 | $126,781 | $202,883 | |||||||||||||||
| Ratios to average net assets(c)(d): | ||||||||||||||||||||
| Expenses after waivers and/or expense reimbursement | 0.86% | 0.78% | 0.76% | 0.77% | 0.76% | |||||||||||||||
| Expenses before waivers and/or expense reimbursement | 0.86% | 0.78% | 0.76% | 0.77% | 0.76% | |||||||||||||||
| Net investment income (loss) | 1.93% | 1.18% | 0.71% | 0.57% | 0.77% | |||||||||||||||
| Portfolio turnover rate(e) | 39% | 27% | 32% | 28% | 35% | |||||||||||||||
| (a) | Calculated based on average shares outstanding during the year. |
| (b) | Total return is calculated assuming a purchase of a share on the first day and a sale on the last day of each year reported and includes reinvestment of dividends and distributions, if any. Total returns may reflect adjustments to conform to generally accepted accounting principles. |
| (c) | Effective November 1, 2017, class specific expenses include transfer agent fees and expenses and registration fees, which are charged to their respective share class. |
| (d) | Does not include expenses of the underlying funds in which the Fund invests. |
| (e) | The Fund’s portfolio turnover rate is calculated in accordance with regulatory requirements, without regard to transactions involving short-term investments and certain derivatives. If such transactions were included, the Fund’s portfolio turnover rate may be higher. |
See Notes to Financial Statements.
| 46 |
Report of Independent Registered Public
Accounting Firm
To the Shareholders of PGIM Jennison Natural Resources Fund and Board of Directors
Prudential Jennison Natural Resources Fund, Inc.:
Opinion on the Financial Statements
We have audited the accompanying statement of assets and liabilities of PGIM Jennison Natural Resources Fund, a series of Prudential Jennison Natural Resources Fund, Inc., (the Fund), including the schedule of investments, as of October 31, 2019, the related statement of operations for the year then ended, the statements of changes in net assets for each of the years in the two-year period ended October 31, 2019, and the related notes (collectively, the financial statements) and the financial highlights for the years indicated therein. In our opinion, the financial statements and financial highlights present fairly, in all material respects, the financial position of the Fund as of October 31, 2019, the results of its operations for the year then ended, the changes in its net assets for each of the years in the two-year period ended October 31, 2019, and the financial highlights for the years indicated therein, in conformity with U.S. generally accepted accounting principles.
Basis for Opinion
These financial statements and financial highlights are the responsibility of the Fund’s management. Our responsibility is to express an opinion on these financial statements and financial highlights based on our audits. We are a public accounting firm registered with the Public Company Accounting Oversight Board (United States) (PCAOB) and are required to be independent with respect to the Fund in accordance with the U.S. federal securities laws and the applicable rules and regulations of the Securities and Exchange Commission and the PCAOB.
We conducted our audits in accordance with the standards of the PCAOB. Those standards require that we plan and perform the audit to obtain reasonable assurance about whether the financial statements and financial highlights are free of material misstatement, whether due to error or fraud. Our audits included performing procedures to assess the risks of material misstatement of the financial statements and financial highlights, whether due to error or fraud, and performing procedures that respond to those risks. Such procedures included examining, on a test basis, evidence regarding the amounts and disclosures in the financial statements and financial highlights. Such procedures also included confirmation of securities owned as of October 31, 2019, by correspondence with the custodian, transfer agent, and brokers, or by other appropriate auditing procedures when replies were not received. Our audits also included evaluating the accounting principles used and significant estimates made by management, as well as evaluating the overall presentation of the financial statements and financial highlights. We believe that our audits provide a reasonable basis for our opinion.

We have served as the auditor of one or more PGIM and/or Prudential Retail investment companies since 2003.
New York, New York
December 19, 2019
| PGIM Jennison Natural Resources Fund | 47 |
Federal Income Tax Information (unaudited)
For the year ended October 31, 2019, the Fund reports the maximum amount allowable under Section 854 of the Internal Revenue Code, but not less than, the following percentages of the ordinary income dividends paid as 1) qualified dividend income (QDI); and 2) eligible for corporate dividends received deduction (DRD):
| QDI | DRD | |||||||
| PGIM Jennison Natural Resources Fund |
100.00 | % | 99.98 | % | ||||
In January 2020, you will be advised on IRS Form 1099-DIV or substitute 1099-DIV, as to the federal tax status of dividends and distributions received by you in calendar year 2019.
| 48 | PGIM Jennison Natural Resources Fund |
INFORMATION ABOUT BOARD MEMBERS AND OFFICERS (unaudited)
Information about Board Members and Officers of the Fund is set forth below. Board Members who are not deemed to be “interested persons” of the Fund, as defined in the 1940 Act, are referred to as “Independent Board Members.” Board Members who are deemed to be “interested persons” of the Fund are referred to as “Interested Board Members.” The Board Members are responsible for the overall supervision of the operations of the Fund and perform the various duties imposed on the directors of investment companies by the 1940 Act. The Board in turn elects the Officers, who are responsible for administering the day-to-day operations of the Fund.
| Independent Board Members | ||||||
| Name Date of Birth Position(s) Portfolios Overseen |
Principal Occupation(s) During Past Five Years |
Other Directorships Held During Past Five Years |
Length of Board Service | |||
| Ellen S. Alberding 3/11/58 Board Member Portfolios Overseen: 96 |
President and Board Member, The Joyce Foundation (charitable foundation) (since 2002); Vice Chair, City Colleges of Chicago (community college system) (2011-2015); Trustee, National Park Foundation (charitable foundation for national park system) (2009-2018); Trustee, Economic Club of Chicago (since 2009); Trustee, Loyola University (since 2018). | None. | Since September 2013 | |||
| Kevin J. Bannon 7/13/52 Board Member Portfolios Overseen: 96 |
Retired; Managing Director (April 2008-May 2015) and Chief Investment Officer (October 2008-November 2013) of Highmount Capital LLC (registered investment adviser); formerly Executive Vice President and Chief Investment Officer (April 1993-August 2007) of Bank of New York Company; President (May 2003-May 2007) of BNY Hamilton Family of Mutual Funds. | Director of Urstadt Biddle Properties (equity real estate investment trust) (since September 2008). | Since July 2008 | |||
PGIM Jennison Natural Resources Fund
| Independent Board Members | ||||||
| Name Date of Birth Position(s) Portfolios Overseen |
Principal Occupation(s) During Past Five Years |
Other Directorships Held During Past Five Years |
Length of Board Service | |||
| Linda W. Bynoe 7/9/52 Board Member Portfolios Overseen: 96 |
President and Chief Executive Officer (since March 1995) and formerly Chief Operating Officer (December 1989-February 1995) of Telemat Ltd. (management consulting); formerly Vice President (January 1985-June 1989) at Morgan Stanley & Co. (broker-dealer). | Director of Anixter International, Inc. (communication products distributor) (since January 2006); Director of Northern Trust Corporation (financial services) (since April 2006); Trustee of Equity Residential (residential real estate) (since December 2009). | Since March 2005 | |||
| Barry H. Evans 11/2/60 Board Member Portfolios Overseen: 95 |
Retired; formerly President (2005 – 2016), Global Chief Operating Officer (2014– 2016), Chief Investment Officer – Global Head of Fixed Income (1998-2014), and various portfolio manager roles (1986-2006), Manulife Asset Management U.S. | Formerly Director, Manulife Trust Company (2011-2018); formerly Director, Manulife Asset Management Limited (2015-2017); formerly Chairman of the Board of Directors of Manulife Asset Management U.S. (2005-2016); formerly Chairman of the Board, Declaration Investment Management and Research (2008-2016). | Since September 2017 | |||
| Keith F. Hartstein 10/13/56 Board Member & Independent Chair Portfolios Overseen: 96 |
Retired; Member (since November 2014) of the Governing Council of the Independent Directors Council (organization of independent mutual fund directors); formerly President and Chief Executive Officer (2005-2012), Senior Vice President (2004-2005), Senior Vice President of Sales and Marketing (1997-2004), and various executive management positions (1990-1997), John Hancock Funds, LLC (asset management); Chairman, Investment Company Institute’s Sales Force Marketing Committee (2003-2008). | None. | Since September 2013 | |||
Visit our website at pgiminvestments.com
| Independent Board Members | ||||||
| Name Date of Birth Position(s) Portfolios Overseen |
Principal Occupation(s) During Past Five Years |
Other Directorships Held During Past Five Years |
Length of Board Service | |||
| Laurie Simon Hodrick 9/29/62 Board Member Portfolios Overseen: 95 |
A. Barton Hepburn Professor Emerita of Economics in the Faculty of Business, Columbia Business School (since 2018); Visiting Professor of Law, Stanford Law School (since 2015); Visiting Fellow at the Hoover Institution, Stanford University (since 2015); Sole Member, ReidCourt LLC (since 2008) (a consulting firm); formerly A. Barton Hepburn Professor of Economics in the Faculty of Business, Columbia Business School (1996-2017); formerly Managing Director, Global Head of Alternative Investment Strategies, Deutsche Bank (2006-2008). | Independent Director, Synnex Corporation (since April 2019) (information technology); Independent Director, Kabbage, Inc. (since July 2018) (financial services); Independent Director, Corporate Capital Trust (2017-2018) (a business development company). | Since September 2017 | |||
| Michael S. Hyland, CFA 10/4/45 Board Member Portfolios Overseen: 96 |
Retired (since February 2005); formerly Senior Managing Director (July 2001-February 2005) of Bear Stearns & Co, Inc.; Global Partner, INVESCO (1999-2001); Managing Director and President of Salomon Brothers Asset Management (1989-1999). | None. | Since July 2008 | |||
| Brian K. Reid 9/22/61 Board Member Portfolios Overseen: 95 |
Retired; formerly Chief Economist for the Investment Company Institute (ICI) (2005-2017); formerly Senior Economist and Director of Industry and Financial Analysis at the ICI (1998-2004); formerly Senior Economist, Industry and Financial Analysis at the ICI (1996-1998); formerly Staff Economist at the Federal Reserve Board (1989-1996); Director, ICI Mutual Insurance Company (2012-2017). | None. | Since March 2018 | |||
PGIM Jennison Natural Resources Fund
| Independent Board Members | ||||||
| Name Date of Birth Position(s) Portfolios Overseen |
Principal Occupation(s) During Past Five Years |
Other Directorships Held During Past Five Years |
Length of Board Service | |||
| Grace C. Torres 6/28/59 Board Member Portfolios Overseen: 95 |
Retired; formerly Treasurer and Principal Financial and Accounting Officer of the PGIM Funds, Target Funds, Advanced Series Trust, Prudential Variable Contract Accounts and The Prudential Series Fund (1998-June 2014); Assistant Treasurer (March 1999-June 2014) and Senior Vice President (September 1999-June 2014) of PGIM Investments LLC; Assistant Treasurer (May 2003-June 2014) and Vice President (June 2005-June 2014) of AST Investment Services, Inc.; Senior Vice President and Assistant Treasurer (May 2003-June 2014) of Prudential Annuities Advisory Services, Inc. | Formerly Director (July 2015-January 2018) of Sun Bancorp, Inc. N.A. and Sun National Bank; Director (since January 2018) of OceanFirst Financial Corp. and OceanFirst Bank. | Since November 2014 | |||
| Interested Board Members | ||||||
| Name Date of Birth Position(s) Portfolios Overseen |
Principal Occupation(s) During Past Five Years |
Other Directorships Held During Past Five Years |
Length of Board Service | |||
| Stuart S. Parker 10/5/62 Board Member & President Portfolios Overseen: 96 |
President of PGIM Investments LLC (formerly known as Prudential Investments LLC) (since January 2012); Executive Vice President of Prudential Investment Management Services LLC (since December 2012); formerly Executive Vice President of Jennison Associates LLC and Head of Retail Distribution of PGIM Investments LLC (June 2005-December 2011). | None. | Since January 2012 | |||
Visit our website at pgiminvestments.com
| Interested Board Members | ||||||
| Name Date of Birth Position(s) Portfolios Overseen |
Principal Occupation(s) During Past Five Years |
Other Directorships Held During Past Five Years |
Length of Board Service | |||
| Scott E. Benjamin 5/21/73 Board Member & Vice President Portfolios Overseen:96 |
Executive Vice President (since June 2009) of PGIM Investments LLC; Executive Vice President (June 2009-June 2012) and Vice President (since June 2012) of Prudential Investment Management Services LLC; Executive Vice President (since September 2009) of AST Investment Services, Inc.; Senior Vice President of Product Development and Marketing, PGIM Investments (since February 2006); formerly Vice President of Product Development and Product Management, PGIM Investments LLC (2003-2006). | None. | Since March 2010 | |||
| Fund Officers(a) | ||||
| Name Date of Birth Fund Position |
Principal Occupation(s) During Past Five Years | Length of Service as Fund Officer | ||
| Raymond A. O’Hara 9/11/55 Chief Legal Officer |
Vice President and Corporate Counsel (since July 2010) of Prudential Insurance Company of America (Prudential); Vice President (March 2011-Present) of Pruco Life Insurance Company and Pruco Life Insurance Company of New Jersey; Vice President and Corporate Counsel (March 2011-Present) of Prudential Annuities Life Assurance Corporation; Chief Legal Officer of PGIM Investments LLC (since June 2012); Chief Legal Officer of Prudential Mutual Fund Services LLC (since June 2012) and Corporate Counsel of AST Investment Services, Inc. (since June 2012); formerly Assistant Vice President and Corporate Counsel (September 2008-July 2010) of The Hartford Financial Services Group, Inc.; formerly Associate (September 1980-December 1987) and Partner (January 1988–August 2008) of Blazzard & Hasenauer, P.C. (formerly, Blazzard, Grodd & Hasenauer, P.C.). | Since June 2012 | ||
PGIM Jennison Natural Resources Fund
| Fund Officers(a) | ||||
| Name Date of Birth Fund Position |
Principal Occupation(s) During Past Five Years | Length of Service as Fund Officer | ||
| Dino Capasso 8/19/74 Chief Compliance Officer |
Chief Compliance Officer (July 2019-Present) of PGIM Investments LLC; Chief Compliance Officer (July 2019-Present) of the PGIM Funds, Target Funds, Advanced Series Trust, The Prudential Series Fund, Prudential’s Gibraltar Fund, Inc., PGIM Global High Yield Fund, Inc., and PGIM High Yield Bond Fund, Inc.; Vice President and Deputy Chief Compliance Officer (June 2017-2019) of PGIM Investments LLC; formerly, Senior Vice President and Senior Counsel (January 2016-June 2017), and Vice President and Counsel (February 2012-December 2015) of Pacific Investment Management Company LLC. | Since March 2018 | ||
| Andrew R. French 12/22/62 Secretary |
Vice President of PGIM Investments LLC (December 2018-Present); formerly Vice President and Corporate Counsel (February 2010-December 2018) of Prudential; formerly Director and Corporate Counsel (2006-2010) of Prudential; Vice President and Assistant Secretary (since January 2007) of PGIM Investments LLC; Vice President and Assistant Secretary (since January 2007) of Prudential Mutual Fund Services LLC. | Since October 2006 | ||
| Jonathan D. Shain 8/9/58 Assistant Secretary |
Vice President and Corporate Counsel (since August 1998) of Prudential; Vice President and Assistant Secretary (since May 2001) of PGIM Investments LLC; Vice President and Assistant Secretary (since February 2001) of Prudential Mutual Fund Services LLC; formerly Vice President and Assistant Secretary (May 2003-June 2005) of AST Investment Services, Inc. | Since May 2005 | ||
| Claudia DiGiacomo 10/14/74 Assistant Secretary |
Vice President and Corporate Counsel (since January 2005) of Prudential; Vice President and Assistant Secretary of PGIM Investments LLC (since December 2005); formerly Associate at Sidley Austin Brown & Wood LLP (1999-2004). | Since December 2005 | ||
| Diana N. Huffman 4/14/82 Assistant Secretary |
Vice President and Corporate Counsel (since September 2015) of Prudential; formerly Associate at Willkie Farr & Gallagher LLP (2009-2015). | Since March 2019 | ||
| Kelly A. Coyne 8/8/68 Assistant Secretary |
Director, Investment Operations of Prudential Mutual Fund Services LLC (since 2010). | Since March 2015 | ||
| Christian J. Kelly 5/5/75 Treasurer and Principal Financial and Accounting Officer |
Vice President, Head of Fund Administration of PGIM Investments LLC (since November 2018); formerly, Director of Fund Administration of Lord Abbett & Co. LLC (2009-2018), Treasurer and Principal Accounting Officer of the Lord Abbett Family of Funds (2017-2018); Director of Accounting, Avenue Capital Group (2008-2009); Senior Manager, Investment Management Practice of Deloitte & Touche LLP (1998-2007). | Since January 2019 | ||
Visit our website at pgiminvestments.com
| Fund Officers(a) | ||||
| Name Date of Birth Fund Position |
Principal Occupation(s) During Past Five Years | Length of Service as Fund Officer | ||
| Lana Lomuti 6/7/67 Assistant Treasurer |
Vice President (since 2007) and Director (2005-2007), within PGIM Investments Fund Administration; formerly Assistant Treasurer (December 2007-February 2014) of The Greater China Fund, Inc. | Since April 2014 | ||
| Russ Shupak 10/08/73 Assistant Treasurer |
Vice President (since 2017) and Director (2013-2017), within PGIM Investments Fund Administration. | Since October 2019 | ||
| Deborah Conway 3/26/69 Assistant Treasurer |
Vice President (since 2017) and Director (2007-2017), within PGIM Investments Fund Administration. | Since October 2019 | ||
| Elyse M. McLaughlin 1/20/74 Assistant Treasurer |
Vice President (since 2017) and Director (2011-2017), within PGIM Investments Fund Administration. | Since October 2019 | ||
| Charles H. Smith 1/11/73 Anti-Money Laundering Compliance Officer |
Vice President, Corporate Compliance, Anti-Money Laundering Unit (since January 2015) of Prudential; committee member of the American Council of Life Insurers Anti-Money Laundering and Critical Infrastructure Committee (since January 2016); formerly Global Head of Economic Sanctions Compliance at AIG Property Casualty (February 2007-December 2014); Assistant Attorney General at the New York State Attorney General’s Office, Division of Public Advocacy. (August 1998-January 2007). | Since January 2017 | ||
(a) Excludes Mr. Parker and Mr. Benjamin, interested Board Members who also serve as President and Vice President, respectively.
Explanatory Notes to Tables:
| ∎ | Board Members are deemed to be “Interested,” as defined in the 1940 Act, by reason of their affiliation with PGIM Investments LLC and/or an affiliate of PGIM Investments LLC. |
| ∎ | Unless otherwise noted, the address of all Board Members and Officers is c/o PGIM Investments LLC, 655 Broad Street, Newark, New Jersey 07102-4410. |
| ∎ | There is no set term of office for Board Members or Officers. The Board Members have adopted a retirement policy, which calls for the retirement of Board Members on December 31 of the year in which they reach the age of 75. |
| ∎ | “Other Directorships Held” includes only directorships of companies required to register or file reports with the SEC under the 1934 Act (that is, “public companies”) or other investment companies registered under the 1940 Act. |
| ∎ | “Portfolios Overseen” includes all investment companies managed by PGIM Investments LLC. The investment companies for which PGIM Investments LLC serves as manager include the PGIM Funds, The Prudential Variable Contract Accounts, PGIM ETF Trust, PGIM High Yield Bond Fund, Inc., PGIM Global High Yield Fund, Inc., The Prudential Series Fund, Prudential’s Gibraltar Fund, Inc. and the Advanced Series Trust. |
PGIM Jennison Natural Resources Fund
Approval of Advisory Agreements (unaudited)
The Fund’s Board of Directors
The Board of Directors (the “Board”) of PGIM Jennison Natural Resources Fund (the “Fund”)1 consists of eleven individuals, nine of whom are not “interested persons” of the Fund, as defined in the Investment Company Act of 1940, as amended (the “1940 Act”) (the “Independent Directors”). 2 The Board is responsible for the oversight of the Fund and its operations, and performs the various duties imposed on the directors of investment companies by the 1940 Act. The Independent Directors have retained independent legal counsel to assist them in connection with their duties. The Chair of the Board is an Independent Director. The Board has established four standing committees: the Audit Committee, the Nominating and Governance Committee, and two Investment Committees. Each committee is chaired by, and composed of, Independent Directors.
Annual Approval of the Fund’s Advisory Agreements
As required under the 1940 Act, the Board determines annually whether to renew the Fund’s management agreement with PGIM Investments LLC (“PGIM Investments”) and the Fund’s subadvisory agreement with Jennison Associates LLC (“Jennison”). In considering the renewal of the agreements, the Board, including all of the Independent Directors, met on May 30, 2019 and on June 11-13, 2019 and approved the renewal of the agreements through July 31, 2020, after concluding that the renewal of the agreements was in the best interests of the Fund and its shareholders.
In advance of the meetings, the Board requested and received materials relating to the agreements, and had the opportunity to ask questions and request further information in connection with its consideration. Among other things, the Board considered comparative fee information from PGIM Investments and Jennison. Also, the Board considered comparisons with other mutual funds in relevant Peer Universes and Peer Groups, as is further discussed below.
In approving the agreements, the Board, including the Independent Directors advised by independent legal counsel, considered the factors it deemed relevant, including the nature, quality and extent of services provided by PGIM Investments and the subadviser, the performance of the Fund, the profitability of PGIM Investments and its affiliates, expenses and fees, and the potential for economies of scale that may be shared with the Fund and its shareholders as the Fund’s assets grow. In their deliberations, the Directors did not identify any single factor which alone was responsible for the Board’s decision to approve the agreements with respect to the Fund. In connection with its deliberations, the Board
| 1 | PGIM Jennison Natural Resources Fund is the sole series of Prudential Jennison Natural Resources Fund, Inc. |
| 2 | Grace C. Torres was an Interested Director of the Fund at the time the Board considered and approved the renewal of the Fund’s advisory agreements, but has since become an Independent Director of the Fund. |
| PGIM Jennison Natural Resources Fund | ||
Approval of Advisory Agreements (continued)
considered information provided by PGIM Investments throughout the year at regular Board meetings, presentations from portfolio managers and other information, as well as information furnished at or in advance of the meetings on May 30, 2019 and on June 11-13, 2019.
The Directors determined that the overall arrangements between the Fund and PGIM Investments, which serves as the Fund’s investment manager pursuant to a management agreement, and between PGIM Investments and Jennison, which serves as the Fund’s subadviser pursuant to the terms of a subadvisory agreement with PGIM Investments, are in the best interests of the Fund and its shareholders in light of the services performed, fees charged and such other matters as the Directors considered relevant in the exercise of their business judgment.
The material factors and conclusions that formed the basis for the Directors’ reaching their determinations to approve the continuance of the agreements are separately discussed below.
Nature, Quality and Extent of Services
The Board received and considered information regarding the nature, quality and extent of services provided to the Fund by PGIM Investments and Jennison. The Board noted that Jennison is affiliated with PGIM Investments. The Board considered the services provided by PGIM Investments, including but not limited to the oversight of the subadviser for the Fund, as well as the provision of fund recordkeeping, compliance and other services to the Fund, and PGIM Investments’ role as administrator for the Fund’s liquidity risk management program. With respect to PGIM Investments’ oversight of the subadviser, the Board noted that PGIM Investments’ Strategic Investment Research Group (“SIRG”), which is a business unit of PGIM Investments, is responsible for monitoring and reporting to PGIM Investments’ senior management on the performance and operations of the subadviser. The Board also considered that PGIM Investments pays the salaries of all of the officers and interested Directors of the Fund who are part of Fund management. The Board also considered the investment subadvisory services provided by Jennison, including investment research and security selection, as well as adherence to the Fund’s investment restrictions and compliance with applicable Fund policies and procedures. The Board considered PGIM Investments’ evaluation of the subadviser, as well as PGIM Investments’ recommendation, based on its review of the subadviser, to renew the subadvisory agreement.
The Board considered the qualifications, backgrounds and responsibilities of PGIM Investments’ senior management responsible for the oversight of the Fund and Jennison, and also considered the qualifications, backgrounds and responsibilities of Jennison’s portfolio managers who are responsible for the day-to-day management of the Fund’s portfolio. The Board was provided with information pertaining to PGIM Investments’ and Jennison’s organizational structure, senior management, investment operations, and other
| Visit our website at pgiminvestments.com |
relevant information pertaining to both PGIM Investments and Jennison. The Board also noted that it received favorable compliance reports from the Fund’s Chief Compliance Officer (“CCO”) as to both PGIM Investments and Jennison.
The Board concluded that it was satisfied with the nature, extent and quality of the investment management services provided by PGIM Investments and the subadvisory services provided to the Fund by Jennison, and that there was a reasonable basis on which to conclude that the Fund benefits from the services provided by PGIM Investments and Jennison under the management and subadvisory agreements.
Costs of Services and Profits Realized by PGIM Investments
The Board was provided with information on the profitability of PGIM Investments and its affiliates in serving as the Fund’s investment manager. The Board discussed with PGIM Investments the methodology utilized in assembling the information regarding profitability and considered its reasonableness. The Board recognized that it is difficult to make comparisons of profitability from fund management contracts because comparative information is not generally publicly available and is affected by numerous factors, including the structure of the particular adviser, the types of funds it manages, its business mix, numerous assumptions regarding allocations and the adviser’s capital structure and cost of capital. Taking these factors into account, the Board concluded that the profitability of PGIM Investments and its affiliates in relation to the services rendered was not unreasonable.
Economies of Scale
The Board received and discussed information concerning economies of scale that PGIM Investments may realize as the Fund’s assets grow beyond current levels. The Board noted that the management fee schedule for the Fund includes breakpoints, which have the effect of decreasing the fee rate as assets increase. During the course of time, the Board has considered information regarding the launch date of the Fund, the management fees of the Fund compared to those of similarly managed funds and PGIM Investments’ investment in the Fund over time. The Board noted that economies of scale can be shared with the Fund in other ways, including low management fees from inception, additional technological and personnel investments to enhance shareholder services, and maintaining existing expense structures in the face of a rising cost environment. The Board also considered PGIM Investments’ assertion that it continually evaluates the management fee schedule of the Fund and the potential to share economies of scale through breakpoints or fee waivers as asset levels increase.
The Board recognized the inherent limitations of any analysis of economies of scale, stemming largely from the Board’s understanding that most of PGIM Investments’ costs are not specific to individual funds, but rather are incurred across a variety of products and services.
| PGIM Jennison Natural Resources Fund | ||
Approval of Advisory Agreements (continued)
Other Benefits to PGIM Investments and Jennison
The Board considered potential ancillary benefits that might be received by PGIM Investments, Jennison and their affiliates as a result of their relationship with the Fund. The Board concluded that potential benefits to be derived by PGIM Investments included transfer agency fees received by the Fund’s transfer agent (which is affiliated with PGIM Investments), and benefits to its reputation as well as other intangible benefits resulting from PGIM Investments’ association with the Fund. The Board concluded that the potential benefits to be derived by Jennison included its ability to use soft dollar credits, as well as the potential benefits consistent with those generally resulting from an increase in assets under management, specifically, potential access to additional research resources and benefits to its reputation. The Board concluded that the benefits derived by PGIM Investments and Jennison were consistent with the types of benefits generally derived by investment managers and subadvisers to mutual funds.
Performance of the Fund / Fees and Expenses
The Board considered certain additional factors and made related conclusions relating to the historical performance of the Fund for the one-, three-, five- and ten-year periods ended December 31, 2018
The Board also considered the Fund’s actual management fee, as well as the Fund’s net total expense ratio, for the fiscal year ended October 31, 2018. The Board considered the management fee for the Fund as compared to the management fee charged by PGIM Investments to other funds and the fee charged by other advisers to comparable mutual funds in a Peer Group. The actual management fee represents the fee rate actually paid by Fund shareholders and includes any fee waivers or reimbursements. The net total expense ratio for the Fund represents the actual expense ratio incurred by Fund shareholders.
The mutual funds included in the Peer Universe, which was used to consider performance, and the Peer Group, which was used to consider fees and expenses, were objectively determined by Broadridge, an independent provider of mutual fund data. In certain circumstances, PGIM Investments also provided supplemental Peer Universe or Peer Group information for reasons addressed with the Board. The comparisons placed the Fund in various quartiles over various periods, with the first quartile being the best 25% of the mutual funds (for performance, the best performing mutual funds and, for expenses, the lowest cost mutual funds).
The section below summarizes key factors considered by the Board and the Board’s conclusions regarding the Fund’s performance, fees and overall expenses. The table sets forth net performance comparisons (which reflect the impact on performance of fund
| Visit our website at pgiminvestments.com |
expenses, or any subsidies, expense caps or waivers that may be applicable) with the Peer Universe, actual management fees with the Peer Group (which reflect the impact of any subsidies or fee waivers), and net total expenses with the Peer Group, each of which were key factors considered by the Board.
| Net Performance | 1 Year | 3 Years | 5 Years | 10 Years | ||||
| 4th Quartile |
2nd Quartile | 4th Quartile | 2nd Quartile | |||||
| Actual Management Fees: 3rd Quartile | ||||||||
| Net Total Expenses: 1st Quartile | ||||||||
| • | The Board noted that the Fund underperformed its benchmark index over all periods. |
| • | The Board considered PGIM Investments’ assertion that the Fund’s underperformance largely occurred during the fourth quarter of 2018, when commodity prices, including the price of oil, fell, and reflected the Fund’s focus on exploration and production companies, which are negatively impacted by falling commodity prices. |
| • | In this regard, the Board noted that during 2016 and mid-2017 to mid-2018, when oil prices rose, the Fund outperformed its benchmark index and ranked in either the first or second quartile of its Peer Universe. |
| • | The Board further considered that during the first quarter of 2019, when oil prices rose, the Fund outperformed its benchmark index and Peer Universe. The Board and PGIM Investments agreed to retain the Fund’s existing contractual expense cap, which (exclusive of certain fees and expenses) caps transfer agency, shareholder servicing, sub-transfer agency and blue sky fees to the extent that such fees cause total annual fund operating expenses to exceed 2.19% for Class B shares through February 29, 2020. |
| • | In addition, PGIM Investments will waive management fees or shared operating expenses on any share class to the same extent that it waives such expenses on any other share class, and has agreed that total annual fund operating expenses for Class R6 shares will not exceed total annual fund operating expenses for Class Z shares. |
| • | The Board concluded that, in light of the above, it would be in the best interests of the Fund and its shareholders to renew the agreements. |
| • | The Board concluded that the management fees (including subadvisory fees) and total expenses were reasonable in light of the services provided. |
* * *
After full consideration of these factors, the Board concluded that approval of the agreements was in the best interests of the Fund and its shareholders.
| PGIM Jennison Natural Resources Fund | ||
Supplement dated December 18, 2019
to the Currently Effective Summary Prospectus, Prospectus
and Statement of Additional Information of the Funds Listed Below
This supplement should be read in conjunction with your Summary Prospectus, Statutory Prospectus and Statement of Additional Information, be retained for future reference and is in addition to any existing Fund supplements.
The Board of Directors/Trustees for each Fund listed below has approved the conversion of all issued and outstanding Class B shares of the Funds to Class A shares of the same Fund, effective on or about June 26, 2020.
As a result, effective on or about the close of business on June 26, 2020, all of the issued and outstanding Class B shares of a Fund will be converted into Class A shares of that Fund with the same relative aggregate net asset value as the Class B shares held immediately prior to the conversion. Class A shares currently have lower total expense ratios, and equal or lower distribution fees and shareholder servicing fees payable under the Fund’s 12b-1 plan than Class B shares. No sales load, fee, or other charge will be imposed on the conversion of these shares. Class A shares are not subject to the contingent deferred sales charge (if any) currently charged on the redemption of Class B shares. Please refer to your Fund’s Prospectus for more information regarding Class A shares. The conversion is not expected to be a taxable event for federal income tax purposes and should not result in recognition of gain or loss by converting shareholders.
LR1263
The Prudential Investment Portfolios, Inc.
PGIM Balanced Fund
PGIM Jennison Focused Value Fund
PGIM Jennison Growth Fund
Prudential Investment Portfolios 3
PGIM Jennison Focused Growth Fund
PGIM QMA Large-Cap Value Fund
PGIM Real Assets Fund
Prudential Investment Portfolios 4
PGIM Muni High Income Fund
Prudential Investment Portfolios 5
PGIM Jennison Diversified Growth Fund
Prudential Investment Portfolios 6
PGIM California Muni Income Fund
Prudential Investment Portfolios 7
PGIM Jennison Value Fund
Prudential Investment Portfolios 9
PGIM QMA Large-Cap Core Equity Fund
Prudential Investment Portfolios, Inc. 10
PGIM Jennison Global Equity Income Fund
PGIM QMA Mid-Cap Value Fund
Prudential Investment Portfolios 12
PGIM Global Real Estate Fund
PGIM US Real Estate Fund
Prudential Investment Portfolios, Inc. 14
PGIM Government Income Fund
Prudential Investment Portfolios, Inc. 15
PGIM High Yield Fund
Prudential Investment Portfolios 16
PGIM Income Builder Fund
Prudential Investment Portfolios, Inc. 17
PGIM Total Return Bond Fund
Prudential Investment Portfolios 18
PGIM Jennison 20/20 Focus Fund
Prudential Global Total Return Fund, Inc.
PGIM Global Total Return Fund
Prudential Jennison Blend Fund, Inc.
PGIM Jennison Blend Fund
Prudential Jennison Mid-Cap Growth Fund, Inc.
PGIM Jennison Mid-Cap Growth Fund
Prudential Jennison Natural Resources Fund, Inc.
PGIM Jennison Natural Resources Fund
Prudential Jennison Small Company Fund, Inc.
PGIM Jennison Small Company Fund
Prudential Government Money Market Fund, Inc.
PGIM Government Money Market Fund
Prudential National Muni Fund, Inc.
PGIM National Muni Fund
Prudential Sector Funds, Inc.
PGIM Jennison Financial Services Fund
PGIM Jennison Health Sciences Fund
PGIM Jennison Utility Fund
Prudential Short-Term Corporate Bond Fund, Inc.
PGIM Short-Term Corporate Bond Fund
Prudential World Fund, Inc.
PGIM QMA International Equity Fund
| ∎ TELEPHONE | ∎ WEBSITE | |||
| 655 Broad Street |
(800) 225-1852 |
pgiminvestments.com | ||
| PROXY VOTING |
| The Board of Directors of the Fund has delegated to the Fund’s subadviser the responsibility for voting any proxies and maintaining proxy recordkeeping with respect to the Fund. A description of these proxy voting policies and procedures is available without charge, upon request, by calling (800) 225-1852. Information regarding how the Fund voted proxies relating to portfolio securities during the most recent 12-month period ended June 30 is available on the Fund’s website and on the Securities and Exchange Commission’s website. |
| DIRECTORS |
| Ellen S. Alberding • Kevin J. Bannon • Scott E. Benjamin • Linda W. Bynoe • Barry H. Evans • Keith F. Hartstein • Laurie Simon Hodrick • Michael S. Hyland • Stuart S. Parker • Brian K. Reid • Grace C. Torres |
| OFFICERS |
| Stuart S. Parker, President • Scott E. Benjamin, Vice President • Christian J. Kelly, Treasurer and Principal Financial and Accounting Officer • Raymond A. O’Hara, Chief Legal Officer • Dino Capasso, Chief Compliance Officer • Charles H. Smith, Anti-Money Laundering Compliance Officer • Andrew R. French, Secretary • Jonathan D. Shain, Assistant Secretary • Claudia DiGiacomo, Assistant Secretary • Diana N. Huffman, Assistant Secretary • Kelly A. Coyne, Assistant Secretary • Lana Lomuti, Assistant Treasurer • Russ Shupak, Assistant Treasurer • Elyse McLaughlin, Assistant Treasurer • Deborah Conway, Assistant Treasurer |
| MANAGER | PGIM Investments LLC | 655 Broad Street Newark, NJ 07102 | ||
|
| ||||
| SUBADVISER | Jennison Associates LLC | 466 Lexington Avenue New York, NY 10017 | ||
|
| ||||
| DISTRIBUTOR | Prudential Investment Management Services LLC | 655 Broad Street Newark, NJ 07102 | ||
|
| ||||
| CUSTODIAN | The Bank of New York Mellon | 240 Greenwich Street New York, NY 10286 | ||
|
| ||||
| TRANSFER AGENT | Prudential Mutual Fund Services LLC | PO Box 9658 Providence, RI 02940 | ||
|
| ||||
| INDEPENDENT REGISTERED PUBLIC ACCOUNTING FIRM |
KPMG LLP | 345 Park Avenue New York, NY 10154 | ||
|
| ||||
| FUND COUNSEL | Willkie Farr & Gallagher LLP | 787 Seventh Avenue New York, NY 10019 | ||
|
| ||||
| An investor should consider the investment objectives, risks, charges, and expenses of the Fund carefully before investing. The prospectus and summary prospectus contain this and other information about the Fund. An investor may obtain the prospectus and summary prospectus by visiting our website at pgiminvestments.com or by calling (800) 225-1852. The prospectus and summary prospectus should be read carefully before investing. |
| E-DELIVERY |
| To receive your mutual fund documents online, go to pgiminvestments.com/edelivery and enroll. Instead of receiving printed documents by mail, you will receive notification via email when new materials are available. You can cancel your enrollment or change your email address at any time by visiting the website address above. |
| SHAREHOLDER COMMUNICATIONS WITH DIRECTORS |
| Shareholders can communicate directly with the Board of Directors by writing to the Chair of the Board, PGIM Jennison Natural Resources Fund, PGIM Investments, Attn: Board of Directors, 655 Broad Street, Newark, NJ 07102. Shareholders can communicate directly with an individual Director by writing to the same address. Communications are not screened before being delivered to the addressee. |
| AVAILABILITY OF PORTFOLIO HOLDINGS |
| The Fund files its complete schedule of portfolio holdings with the Securities and Exchange Commission on Form N-PORT. The Fund’s Form N-PORT filings are available on the Commission’s website at sec.gov. Form N-PORT is filed with the Commission quarterly, and each Fund’s full portfolio holdings as of the first and third fiscal quarter-ends (as of the third month of the Fund’s fiscal quarter for reporting periods on or after September 30, 2019) will be made publicly available 60 days after the end of each quarter at sec.gov. |
| The Fund’s Statement of Additional Information contains additional information about the Fund’s Directors and is available without charge, upon request, by calling (800) 225-1852. |
Mutual Funds:
| ARE NOT INSURED BY THE FDIC OR ANY FEDERAL GOVERNMENT AGENCY |
MAY LOSE VALUE | ARE NOT A DEPOSIT OF OR GUARANTEED BY ANY BANK OR ANY BANK AFFILIATE |
PGIM JENNISON NATURAL RESOURCES FUND
| SHARE CLASS | A | B | C | R | Z | R6 | ||||||
| NASDAQ | PGNAX | PRGNX | PNRCX | JNRRX | PNRZX | PJNQX | ||||||
| CUSIP | 74441K107 | 74441K206 | 74441K305 | 74441K404 | 74441K503 | 74441K602 |
MF135E
Item 2 – Code of Ethics — See Exhibit (a)
As of the end of the period covered by this report, the registrant has adopted a code of ethics (the “Section 406 Standards for Investment Companies – Ethical Standards for Principal Executive and Financial Officers”) that applies to the registrant’s Principal Executive Officer and Principal Financial Officer; the registrant’s Principal Financial Officer also serves as the Principal Accounting Officer.
The registrant hereby undertakes to provide any person, without charge, upon request, a copy of the code of ethics. To request a copy of the code of ethics, contact the registrant 800-225-1852, and ask for a copy of the Section 406 Standards for Investment Companies - Ethical Standards for Principal Executive and Financial Officers.
Item 3 – Audit Committee Financial Expert –
The registrant’s Board has determined that Mr. Kevin J. Bannon, member of the Board’s Audit Committee is an “audit committee financial expert,” and that he is “independent,” for purposes of this Item.
Item 4 – Principal Accountant Fees and Services – (a) Audit Fees
For the fiscal years ended October 31, 2019 and October 31, 2018, KPMG LLP (“KPMG”), the Registrant’s principal accountant, billed the Registrant $24,596 and $24,352 respectively, for professional services rendered for the audit of the Registrant’s annual financial statements or services that are normally provided in connection with statutory and regulatory filings.
(b) Audit-Related Fees
For the fiscal year ended October 31, 2019, fees of $1,418 were billed to the Registrant for services rendered by KPMG in connection with an accounting system conversion and were paid by The Bank of New York Mellon. For the fiscal year ended October 31, 2018, there are no fees to report.
(c) Tax Fees
For the fiscal years ended October 31, 2019 and October 31, 2018: none.
(d) All Other Fees
For the fiscal years ended October 31, 2019 and October 31, 2018: none.
(e) (1) Audit Committee Pre-Approval Policies and Procedures
THE PGIM MUTUAL FUNDS
AUDIT COMMITTEE POLICY
on
Pre-Approval of Services Provided by the Independent
Accountants
The Audit Committee of each PGIM Mutual Fund is charged with the responsibility to monitor the independence of the Fund’s independent accountants. As part of this responsibility, the Audit Committee must pre-approve the independent
accounting firm’s engagement to render audit and/or permissible non-audit services, as required by law. In evaluating a proposed engagement of the independent accountants, the Audit Committee will assess the effect that the engagement might reasonably be expected to have on the accountant’s independence. The Committee’s evaluation will be based on:
| • | a review of the nature of the professional services expected to be provided, |
| • | a review of the safeguards put into place by the accounting firm to safeguard independence, and |
| • | periodic meetings with the accounting firm. |
Policy for Audit and Non-Audit Services Provided to the Funds
On an annual basis, the scope of audits for each Fund, audit fees and expenses, and audit-related and non-audit services (and fees proposed in respect thereof) proposed to be performed by the Fund’s independent accountants will be presented by the Treasurer and the independent accountants to the Audit Committee for review and, as appropriate, approval prior to the initiation of such services.
Such presentation shall be accompanied by confirmation by both the Treasurer and the independent accountants that the proposed non-audit services will not adversely affect the independence of the independent accountants. Such proposed non-audit services shall be described in sufficient detail to enable the Audit Committee to assess the appropriateness of such services and fees, and the compatibility of the provision of such services with the auditor’s independence. The Committee shall receive periodic reports on the progress of the audit and other services which are approved by the Committee or by the Committee Chair pursuant to authority delegated in this Policy.
The categories of services enumerated under “Audit Services”, “Audit-related Services”, and “Tax Services” are intended to provide guidance to the Treasurer and the independent accountants as to those categories of services which the Committee believes are generally consistent with the independence of the independent accountants and which the Committee (or the Committee Chair) would expect upon the presentation of specific proposals to pre-approve. The enumerated categories are not intended as an exclusive list of audit, audit-related or tax services, which the Committee (or the Committee Chair) would consider for pre-approval.
Audit Services
The following categories of audit services are considered to be consistent with the role of the Fund’s independent accountants:
| • | Annual Fund financial statement audits |
| • | Seed audits (related to new product filings, as required) |
| • | SEC and regulatory filings and consents |
Audit-related Services
The following categories of audit-related services are considered to be consistent with the role of the Fund’s independent accountants:
| • | Accounting consultations |
| • | Fund merger support services |
| • | Agreed Upon Procedure Reports |
| • | Attestation Reports |
| • | Other Internal Control Reports |
Individual audit-related services that fall within one of these categories (except for fund merger support services) and are not presented to the Audit Committee as part of the annual pre-approval process are subject to an authorized pre-approval by the Audit Committee so long as the estimated fee for those services does not exceed $30,000. Any services provided under such pre-approval will be reported to the Audit Committee at its next regular meeting. Should the amount of such services exceed $30,000 any additional fees will be subject to pre-approval by the Committee Chair (or any other Committee member on whom this responsibility has been delegated). Fees related to fund merger support services are subject to a separate authorized pre-approval by the Audit Committee with fees determined on a per occurrence and merger complexity basis.
Tax Services
The following categories of tax services are considered to be consistent with the role of the Fund’s independent accountants:
| • | Tax compliance services related to the filing or amendment of the following: |
| • | Federal, state and local income tax compliance; and, |
| • | Sales and use tax compliance |
| • | Timely RIC qualification reviews |
| • | Tax distribution analysis and planning |
| • | Tax authority examination services |
| • | Tax appeals support services |
| • | Accounting methods studies |
| • | Fund merger support services |
| • | Tax consulting services and related projects |
Individual tax services that fall within one of these categories and are not presented to the Audit Committee as part of the annual pre-approval process are subject to an authorized pre-approval by the Audit Committee so long as the estimated fee for those services does not exceed $30,000. Any services provided under such pre-approval will be reported to the Audit Committee at its next regular meeting. Should the amount of such services exceed $30,000 any additional fees will be subject to pre-approval by the Committee Chair (or any other Committee member on whom this responsibility has been delegated).
Other Non-Audit Services
Certain non-audit services that the independent accountants are legally permitted to render will be subject to pre-approval by the Committee or by one or more Committee members to whom the Committee has delegated this authority and who will report to the full Committee any pre-approval decisions made pursuant to this Policy. Non-audit services presented for pre-approval pursuant to this paragraph will be accompanied by a confirmation from both the Treasurer and the independent accountants that the proposed services will not adversely affect the independence of the independent accountants.
Proscribed Services
The Fund’s independent accountants will not render services in the following categories of non-audit services:
| • | Bookkeeping or other services related to the accounting records or financial statements of the Fund |
| • | Financial information systems design and implementation |
| • | Appraisal or valuation services, fairness opinions, or contribution-in-kind reports |
| • | Actuarial services |
| • | Internal audit outsourcing services |
| • | Management functions or human resources |
| • | Broker or dealer, investment adviser, or investment banking services |
| • | Legal services and expert services unrelated to the audit |
| • | Any other service that the Public Company Accounting Oversight Board determines, by regulation, is impermissible. |
Pre-approval of Non-Audit Services Provided to Other Entities Within the PGIM Fund Complex
Certain non-audit services provided to PGIM Investments LLC or any of its affiliates that also provide ongoing services to the PGIM Mutual Funds will be subject to pre-approval by the Audit Committee. The only non-audit services provided to these entities that will require pre-approval are those related directly to the operations and financial reporting of the Funds. Individual projects that are not presented to the Audit Committee as part of the annual pre-approval process will be subject to pre-approval by the Committee Chair (or any other Committee member on whom this responsibility has been delegated) so long as the estimated fee for those services does not exceed $30,000. Services presented for pre-approval pursuant to this paragraph
will be accompanied by a confirmation from both the Treasurer and the independent accountants that the proposed services will not adversely affect the independence of the independent accountants.
Although the Audit Committee will not pre-approve all services provided to PGIM Investments LLC and its affiliates, the Committee will receive an annual report from the Fund’s independent accounting firm showing the aggregate fees for all services provided to PGIM Investments and its affiliates.
| (e) (2) | Percentage of services referred to in 4(b) – 4(d) that were approved by the audit committee – For the fiscal year ended October 31, 2019, 100% of the services referred to in Item 4(b) was approved by the audit committee. For the fiscal year ended October 31, 2018: none. |
(f) Percentage of hours expended attributable to work performed by other than full time employees of principal accountant if greater than 50%.
The percentage of hours expended on the principal accountant’s engagement to audit the registrant’s financial statements for the most recent fiscal year that were attributed to work performed by persons other than the principal accountant’s full-time, permanent employees was 0%.
(g) Non-Audit Fees
The aggregate non-audit fees billed by KPMG for services rendered to the registrant’s investment adviser and any entity controlling, controlled by, or under common control with the investment adviser that provides ongoing services to the registrant for the fiscal years ended October 31, 2019 and October 31, 2018 was $0 and $0, respectively.
(h) Principal Accountant’s Independence
Not applicable as KPMG has not provided non-audit services to the registrant’s investment adviser and any entity controlling, controlled by, or under common control with the investment adviser that provides ongoing services to the registrant that were not pre-approved pursuant to Rule 2-01(c)(7)(ii) of Regulation S-X.
Item 5 – Audit Committee of Listed Registrants –
The registrant has a separately designated standing audit committee (the “Audit Committee”) established in accordance with Section 3(a)(58)(A) of the Securities Exchange Act of 1934. The members of the Audit Committee are Kevin J. Bannon (chair), Laurie Simon Hodrick, Michael S. Hyland, CFA, Brian K. Reid, and Keith F. Hartstein (ex-officio).
Item 6 – Schedule of Investments – The schedule is included as part of the report to shareholders filed under Item 1 of this Form.
Item 7 – Disclosure of Proxy Voting Policies and Procedures for Closed-End Management Investment Companies – Not applicable.
Item 8 – Portfolio Managers of Closed-End Management Investment Companies – Not applicable.
| Item 9 – | Purchases of Equity Securities by Closed-End Management Investment Company and Affiliated Purchasers – Not applicable. |
Item 10 – Submission of Matters to a Vote of Security Holders – There have been no material changes to these procedures.
Item 11 – Controls and Procedures
| (a) | It is the conclusion of the registrant’s principal executive officer and principal financial officer that the effectiveness of the registrant’s current disclosure controls and procedures (such disclosure controls and procedures having been evaluated within 90 days of the date of this filing) provide reasonable assurance that |
| the information required to be disclosed by the registrant has been recorded, processed, summarized and reported within the time period specified in the Commission’s rules and forms and that the information required to be disclosed by the registrant has been accumulated and communicated to the registrant’s principal executive officer and principal financial officer in order to allow timely decisions regarding required disclosure. |
| (b) | There has been no significant change in the registrant’s internal control over financial reporting that occurred during the registrant’s most recent fiscal quarter of the period covered by this report that has materially affected, or is likely to materially affect, the registrant’s internal control over financial reporting. |
Item 12 – Controls and Procedures - Disclosure of Securities Lending Activities for Closed-End Management Investment Companies – Not applicable.
Item 13 – Exhibits
| (a) (1) | Code of Ethics – Attached hereto as Exhibit EX-99.CODE-ETH |
| (2) | Certifications pursuant to Section 302 of the Sarbanes-Oxley Act – Attached hereto as Exhibit EX-99.CERT. |
| (3) | Any written solicitation to purchase securities under Rule 23c-1. – Not applicable. |
| (b) | Certifications pursuant to Section 906 of the Sarbanes-Oxley Act – Attached hereto as Exhibit EX-99.906CERT. |
SIGNATURES
Pursuant to the requirements of the Securities Exchange Act of 1934 and the Investment Company Act of 1940, the registrant has duly caused this report to be signed on its behalf by the undersigned, thereunto duly authorized.
| Registrant: | Prudential Jennison Natural Resources Fund, Inc. | |
| By: | /s/ Andrew R. French | |
| Andrew R. French | ||
| Secretary | ||
| Date: | December 19, 2019 | |
Pursuant to the requirements of the Securities Exchange Act of 1934 and the Investment Company Act of 1940, this report has been signed below by the following persons on behalf of the registrant and in the capacities and on the dates indicated.
| By: | /s/ Stuart S. Parker | |
| Stuart S. Parker | ||
| President and Principal Executive Officer | ||
| Date: | December 19, 2019 | |
| By: | /s/ Christian J. Kelly | |
| Christian J. Kelly | ||
| Treasurer and Principal Financial and Accounting Officer | ||
| Date: | December 19, 2019 | |
CODE OF ETHICS FOR PRINCIPAL EXECUTIVE AND
PRINCIPAL FINANCIAL OFFICERS
| I. | Covered Officers/Purpose of the Code |
This code of ethics (the “Code”) is established for the funds listed on Attachment A hereto (each a Fund” and together the “Funds”) pursuant to Section 406 of the Sarbanes-Oxley Act and the rules adopted thereunder by the Securities and Exchange Commission (“SEC”). The Code applies to each Fund’s Principal Executive Officer, Principal Financial Officer and Principal Accounting Officer or Controller, or senior officers performing similar functions (the “Covered Officers” each of whom are set forth in Exhibit B) for the purpose of promoting:
| • | honest and ethical conduct, including the ethical handling of actual or apparent conflicts of interest between personal and professional relationships; |
| • | full, fair, accurate, timely and understandable disclosure in reports and documents that a registrant files with, or submits to, the SEC and in other public communications made by a Fund; |
| • | compliance with applicable governmental laws, rules and regulations; |
| • | the prompt internal reporting of violations of the Code to an appropriate person or persons identified in the Code; and |
| • | accountability for adherence to the Code. |
Each Covered Officer should adhere to a high standard of business ethics and should be sensitive to situations that may give rise to actual as well as apparent conflicts of interest.
| II. | Conflicts of Interest |
A “conflict of interest” occurs when a Covered Officer’s private interest interferes with the interests of, or his service to, a Fund. For example, a conflict of interest would arise if a Covered Officer, or a member of his family, receives improper personal benefits as a result of his position with a Fund.
Certain conflicts of interest arise out of the relationships between Covered Officers and a Fund and already are subject to conflict of interest provisions in the Investment Company Act of 1940, as amended (the “1940 Act”) and the Investment Advisers Act of 1940, as amended (the “Advisers Act”). For example, Covered Officers may not individually engage in certain transactions (such as the purchase or sale of securities or other property) with a Fund because of their status as “affiliated persons” of the Fund. A Fund’s and its investment adviser’s compliance programs and procedures are designed to prevent, or identify and correct, violations of these provisions. This Code does not, and is not intended to, repeat or replace these programs and procedures, and such conflicts fall outside of the parameters of this Code.
Although typically not presenting an opportunity for improper personal benefit, conflicts arise from, or as a result of, the contractual relationships between a Fund and the Fund’s investment adviser, principal underwriter, administrator, or other service providers to the Fund (together “Service Providers”), of which the Covered Officers may also be principals or employees. As a result, this Code recognizes that the Covered Officers will, in the normal course of their duties (whether formally for a Fund or for a Service Provider, or for both), be involved in establishing policies and implementing decisions that will have different effects on such Service Providers and a Fund. The participation of the Covered Officers in such activities is inherent in the contractual relationships between a Fund and its Service Providers and is consistent with the performance by the Covered Officers of their duties as officers of the Fund. Thus, if performed in conformity with the provisions of the 1940 Act and the Advisers Act, such activities will be deemed to have been handled ethically. In addition, it is recognized by the Funds’ Board of Directors/Trustees (“Boards”) that the Covered Officers may also be officers or employees of one or more other investment companies covered by this or other codes.
Other conflicts of interest are covered by the Code, even if such conflicts of interest are not subject to provisions in the 1940 Act and the Advisers Act. The following list provides examples of conflicts of interest under the Code, but Covered Officers should keep in mind that these examples are not exhaustive. The overarching principle is that the personal interest of a Covered Officer should not be placed improperly before the interest of a Fund.
Each Covered Officer must:
| • | not use his personal influence or personal relationships improperly to influence investment decisions or |
| financial reporting by a Fund whereby the Covered Officer would benefit personally to the detriment of the Fund; |
| • | not cause a Fund to take action, or fail to take action, for the individual personal benefit of the Covered Officer rather than the benefit the Fund; and |
| • | not retaliate against any other Covered Officer or any employee of a Fund or its affiliated persons for reports of potential violations that are made in good faith. |
There are some actual or potential conflict of interest situations that should always be brought to the attention of, and discussed with, the Funds’ Chief Legal Officer or other senior legal officer, if material. Examples of these include:
| • | service as a director on the board of any public or private company; |
| • | the receipt of any non-nominal gifts; |
| • | the receipt of any entertainment from any company with which a Fund has current or prospective business dealings unless such entertainment is business-related, reasonable in cost, appropriate as to time and place, and not so frequent as to raise any question of impropriety; |
| • | any ownership interest in (other than insubstantial interests in publicly traded entities), or any consulting or employment relationship with, any of a Fund’s Service Providers, other than its investment adviser, principal underwriter, administrator or any affiliated person thereof; and |
| • | a direct or indirect financial interest in commissions, transaction charges or spreads paid by a Fund for effecting portfolio transactions or for selling or redeeming shares other than an interest arising from the Covered Officer’s employment, such as compensation or equity ownership. |
| III. | Disclosure and Compliance |
Each Covered Officer:
| • | should familiarize himself with the disclosure requirements generally applicable to the Funds; |
| • | should not knowingly misrepresent, or cause others to misrepresent, facts about a Fund to others, whether within or outside the Fund, including to the Fund’s Board of Directors/Trustees and its auditors, and to governmental regulators and self-regulatory organizations; |
| • | should, to the extent appropriate within his area of responsibility, consult with other officers and employees of a Fund and its Service Providers with the goal of promoting full, fair, accurate, timely and understandable disclosure in the reports and documents the Fund files with, or submits to, the SEC and in other public communications made by the Fund; and |
| • | is responsible to promote compliance with the standards and restrictions imposed by applicable laws, rules and regulations. |
| IV. | Reporting and Accountability |
Each Covered Officer must:
| • | upon adoption of the Code (or thereafter as applicable, upon becoming a Covered Officer), affirm in writing to the Board of Directors/Trustees that he has received, read, and understands the Code; |
| • | annually thereafter affirm to the Board of Directors/Trustees that he has complied with the requirements of the Code; and |
| • | notify the Funds’ Chief Legal Officer promptly if he knows of any violation of this Code. Failure to do so is itself a violation of this Code. |
The Funds’ Chief Legal Officer is responsible for applying this Code to specific situations in which questions are presented under it and has the authority to interpret this Code in any particular situation. In such situations, the Chief Legal Officer is authorized to consult, as appropriate, with counsel to the Funds, counsel to the Independent Directors/Trustees, a Board Committee comprised of Independent Directors/Trustees, or the full Board.
The Funds will follow the following procedures in investigating and enforcing this Code:
| • | the Funds Chief Legal Officer will take all appropriate action to investigate any potential violations reported to her; |
| • | if, after such investigation, the Chief Legal Officer believes that no violation has occurred, the Chief Legal Officer is not required to take any further action; |
| • | any matter that the Chief Legal Officer believes is a violation or that the Chief Legal Officer believes should be reviewed by a Fund’s Board or Board Committee comprised of Independent Directors/Trustees will be reported to the Fund’s Board or Board Committee comprised of Independent Directors/Trustees; |
| • | based upon its review of any matter referred to it, a Fund’s Board or Board Committee comprised of Independent Directors/Trustees shall determine whether or not a violation has occurred, whether a grant of waiver is appropriate or whether some other action should be taken. Based upon its determination, the Fund’s Board or Board Committee comprised of Independent Directors/Trustees may take such action as it deems appropriate, which may include without limitation: modifications of applicable policies and procedures; notification to appropriate personnel of the Fund’s investment adviser, principal underwriter or administrator, or their boards; notification to other Funds for which the Covered Officer serves as a Covered Officer; or recommendation to dismiss the Covered Officer; and |
| • | any changes to or waivers of this Code will, to the extent required, be disclosed as provided by SEC rules. |
| V. | Other Policies and Procedures |
This Code shall be the sole code of ethics adopted by the Funds for purposes of Section 406 of the Sarbanes-Oxley Act and the rules and forms applicable to registered investment companies thereunder. Insofar as other policies or procedures of a Fund or its Service Providers govern or purport to govern the behavior or activities of the Covered Officers who are subject to this Code, they are superseded by this Code to the extent that they overlap or conflict with the provisions of this Code. The Funds’ and their investment adviser’s and principal underwriter’s code of ethics under Rule 17j-1 under the 1940 Act are separate requirements applying to the Covered Officers and others, and are not part of this Code.
| VI. | Amendments |
Any amendments to this Code, other than amendments to Exhibit A, must be approved or ratified by a majority vote of the Board, including a majority of Independent Directors/Trustees.
| VII. | Confidentiality |
All reports and records prepared or maintained pursuant to this Code will be considered confidential and shall be maintained and protected accordingly. Except as otherwise required by law or this Code, such matters shall not be disclosed to anyone other than the Fund Board of Directors/Trustees, counsel to the Fund, and counsel to the Fund Independent Directors/Trustees.
| VIII. | Internal Use |
The Code is intended solely for the internal use by the Funds and does not constitute an admission, by or on behalf of a Fund, as to any fact, circumstance, or legal conclusion.
| IX. | Recordkeeping |
A Fund shall keep the information disclosed about waivers and amendments under the Code for the period of time as specified in the rules adopted pursuant to Section 406 of the Sarbanes-Oxley Act, and furnish such information to the SEC or its staff upon request.
Adopted and approved as of September 3, 2003.
EXHIBIT A
Funds Covered by this Code of Ethics
PGIM Funds
Target Mutual Funds
The Prudential Variable Contract Account – 2
The Prudential Variable Contract Account – 10
Advanced Series Trust
Prudential’s Gibraltar Fund, Inc.
The Prudential Series Fund
PGIM High Yield Bond Fund, Inc.
PGIM Global High Yield Fund, Inc.
PGIM ETF Trust
EXHIBIT B
Persons Covered by this Code of Ethics
Stuart S. Parker – President and Chief Executive Officer of the PGIM Funds, PGIM ETF Trust, the Target Mutual Funds, PGIM High Yield Bond Fund, Inc., PGIM Global High Yield Fund, Inc. and The Prudential Variable Contract Accounts – 2 and -10.
Timothy S. Cronin – President and Chief Executive Officer of Advanced Series Trust, Prudential’s Gibraltar Fund, Inc. and The Prudential Series Fund.
Christian J. Kelly – Treasurer and Chief Financial Officer for the PGIM Funds, PGIM ETF Trust, the Target Mutual Funds, PGIM High Yield Bond Fund, Inc., PGIM Global High Yield Fund, Inc., The Prudential Variable Contract Accounts – 2 and -10, Advanced Series Trust, Prudential’s Gibraltar Fund, Inc. and The Prudential Series Fund.
Item 13
Prudential Jennison Natural Resources Fund, Inc.
Annual period ending 10/31/19
File No. 811-05206
CERTIFICATIONS
I, Stuart S. Parker, certify that:
| 1. | I have reviewed this report on Form N-CSR of the above named Fund(s); |
| 2. | Based on my knowledge, this report does not contain any untrue statement of a material fact or omit to state a material fact necessary to make the statements made, in light of the circumstances under which such statements were made, not misleading with respect to the period covered by this report; |
| 3. | Based on my knowledge, the financial statements, and other financial information included in this report, fairly present in all material respects the financial condition, results of operations, changes in net assets, and cash flows (if the financial statements are required to include a statement of cash flows) of the registrant as of, and for, the periods presented in this report. |
| 4. | The registrant’s other certifying officer(s) and I are responsible for establishing and maintaining disclosure controls and procedures (as defined in Rule 30a-3(c) under the Investment Company Act of 1940) and internal control over financial reporting (as defined in Rule 30a-3(d) under the Investment Company Act of 1940) for the registrant and have: |
| a) | Designed such disclosure controls and procedures, or caused such disclosure controls and procedures to be designed under our supervision, to ensure that material information relating to the registrant, including its consolidated subsidiaries, is made known to us by others within those entities, particularly during the period in which this report is being prepared; |
| b) | Designed such internal control over financial reporting, or caused such internal control over financial reporting to be designed under our supervision, to provide reasonable assurance regarding the reliability of financial reporting and the preparation of financial statements for external purposes in accordance with generally accepted accounting principles; |
| c) | Evaluated the effectiveness of the registrant’s disclosure controls and procedures and presented in this report our conclusions about the effectiveness of the disclosure controls and procedures, as of a date within 90 days prior to the filing date of this report based on such evaluation; and; |
| d) | Disclosed in this report any change in the registrant’s internal control over financial reporting that occurred during the period covered by this report that has materially affected, or is reasonably likely to materially affect, the registrant’s internal control over financial reporting; and |
1
| 5. | The registrant’s other certifying officer(s) and I have disclosed to the registrant’s auditors and the audit committee of the registrant’s board of directors (or persons performing the equivalent functions): |
| a) | All significant deficiencies and material weaknesses in the design or operation of internal controls which are reasonably likely to adversely affect the registrant’s ability to record, process, summarize, and report financial information; and |
| b) | Any fraud, whether or not material, that involves management or other employees who have a significant role in the registrant’s internal control over financial reporting. |
December 19, 2019
| /s/ Stuart S. Parker | ||
| Stuart S. Parker | ||
| President and Principal Executive Officer |
2
Item 13
Prudential Jennison Natural Resources Fund, Inc.
Annual period ending 10/31/19
File No. 811-05206
CERTIFICATIONS
I, Christian J. Kelly, certify that:
| 1. | I have reviewed this report on Form N-CSR of the above named Fund(s); |
| 2. | Based on my knowledge, this report does not contain any untrue statement of a material fact or omit to state a material fact necessary to make the statements made, in light of the circumstances under which such statements were made, not misleading with respect to the period covered by this report; |
| 3. | Based on my knowledge, the financial statements, and other financial information included in this report, fairly present in all material respects the financial condition, results of operations, changes in net assets, and cash flows (if the financial statements are required to include a statement of cash flows) of the registrant as of, and for, the periods presented in this report. |
| 4. | The registrant’s other certifying officer(s) and I are responsible for establishing and maintaining disclosure controls and procedures (as defined in Rule 30a-3(c) under the Investment Company Act of 1940) and internal control over financial reporting (as defined in Rule 30a-3(d) under the Investment Company Act of 1940) for the registrant and have: |
| a) | Designed such disclosure controls and procedures, or caused such disclosure controls and procedures to be designed under our supervision, to ensure that material information relating to the registrant, including its consolidated subsidiaries, is made known to us by others within those entities, particularly during the period in which this report is being prepared; |
| b) | Designed such internal control over financial reporting, or caused such internal control over financial reporting to be designed under our supervision, to provide reasonable assurance regarding the reliability of financial reporting and the preparation of financial statements for external purposes in accordance with generally accepted accounting principles; |
| c) | Evaluated the effectiveness of the registrant’s disclosure controls and procedures and presented in this report our conclusions about the effectiveness of the disclosure controls and procedures, as of a date within 90 days prior to the filing date of this report based on such evaluation; and; |
| d) | Disclosed in this report any change in the registrant’s internal control over financial reporting that occurred during the period covered by this report that has materially affected, or is reasonably likely to materially affect, the registrant’s internal control over financial reporting; and |
3
| 5. | The registrant’s other certifying officer(s) and I have disclosed to the registrant’s auditors and the audit committee of the registrant’s board of directors (or persons performing the equivalent functions): |
| a) | All significant deficiencies and material weaknesses in the design or operation of internal controls which are reasonably likely to adversely affect the registrant’s ability to record, process, summarize, and report financial information; and |
| b) | Any fraud, whether or not material, that involves management or other employees who have a significant role in the registrant’s internal control over financial reporting. |
December 19, 2019
| /s/ Christian J. Kelly | ||
| Christian J. Kelly | ||
| Treasurer and Principal Financial and Accounting Officer |
4
Certification Pursuant to 18 U.S.C. Section 1350
As Adopted Pursuant to
Section 906 of the Sarbanes-Oxley Act of 2002
| Name of Issuer: |
Prudential Jennison Natural Resources Fund, Inc. |
In connection with the Report on Form N-CSR of the above-named issuer that is accompanied by this certification, the undersigned hereby certifies, to his or her knowledge, that:
| 1. | The Report fully complies with the requirements of Section 13(a) or 15(d) of the Securities Exchange Act of 1934; and |
| 2. | The information contained in the Report fairly presents, in all material respects, the financial condition and results of operations of the Issuer. |
| December 19, 2019 | ||
| /s/ Stuart S. Parker | ||
| Stuart S. Parker | ||
| President and Principal Executive Officer | ||
| December 19, 2019 | ||
| /s/ Christian J. Kelly | ||
| Christian J. Kelly | ||
| Treasurer and Principal Financial and Accounting Officer | ||
Serious News for Serious Traders! Try StreetInsider.com Premium Free!
You May Also Be Interested In
- Gold Terra Announces Closing of $2.5 Million Private Placement, With Eric Sprott as a Lead Investor
- Lion Group Holding Announced Receipt of Nasdaq Listing Delinquency Notice
- East West Bancorp to Attend the Wells Fargo 2024 Financial Services Investor Conference
Create E-mail Alert Related Categories
SEC FilingsSign up for StreetInsider Free!
Receive full access to all new and archived articles, unlimited portfolio tracking, e-mail alerts, custom newswires and RSS feeds - and more!
